MAAP #144: The Amazon & Climate Change: Carbon Sink vs Carbon Source

Base Map. Forest Carbon Flux across the Amazon, 2001-2020. Data: Harris et al 2021. Analysis: Amazon Conservation/MAAP.

A pair of recent scientific studies revealed that parts of the Amazon now emit more carbon into the atmosphere than they absorb (Gatti et al 2021, Harris et al 2021).

Here, we dig deeper and highlight the key finding: the Brazilian Amazon has become a net carbon source over the past 20 years, whereas the total Amazon is still a net carbon sink.

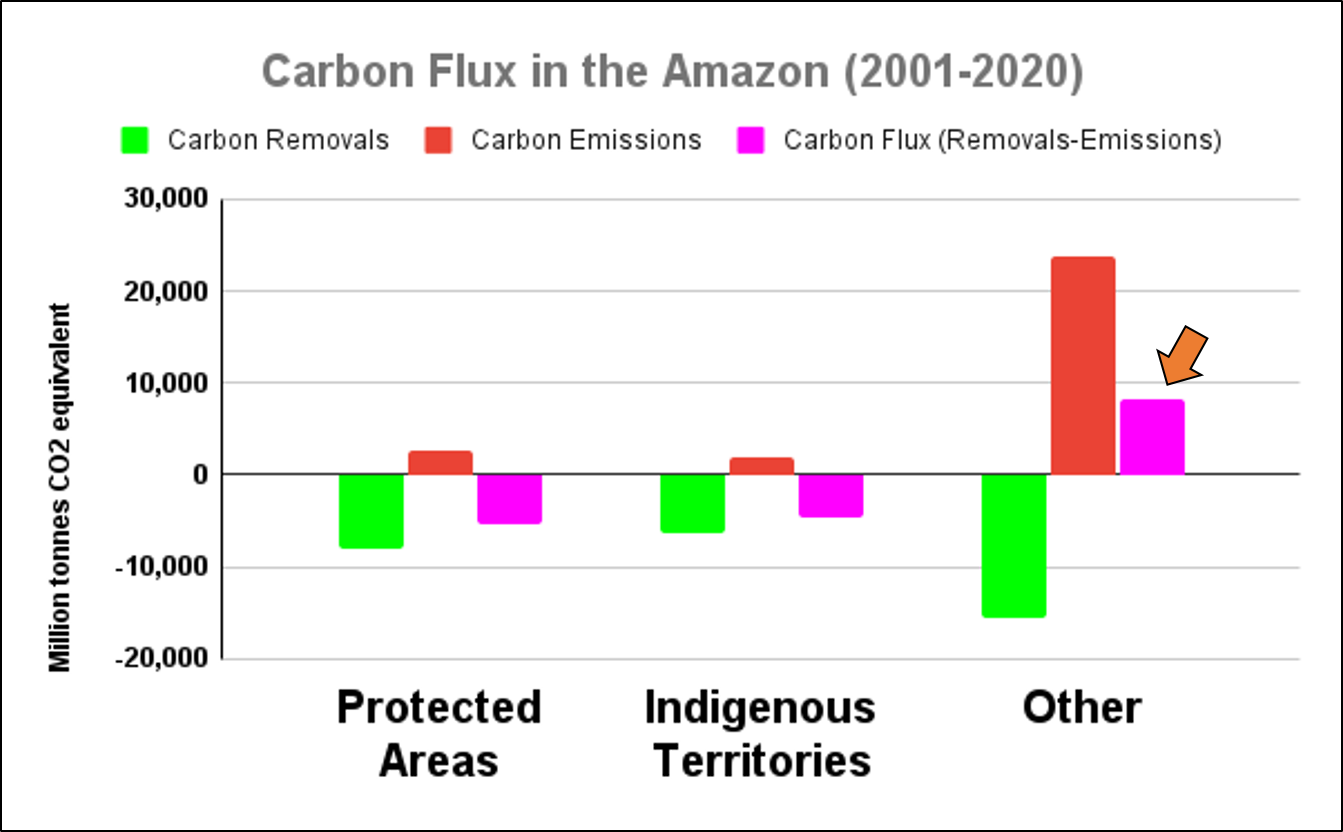
We also show that protected areas and indigenous territories are crucial carbon sinks, showing once again their importance and effectiveness for overall conservation across the Amazon (MAAP #141).

One of the noted studies (Harris et al 2021) presented a new global monitoring system for forest carbon flux based on satellite data.

Here, we independently analyze this data with a focus on the Amazon.*

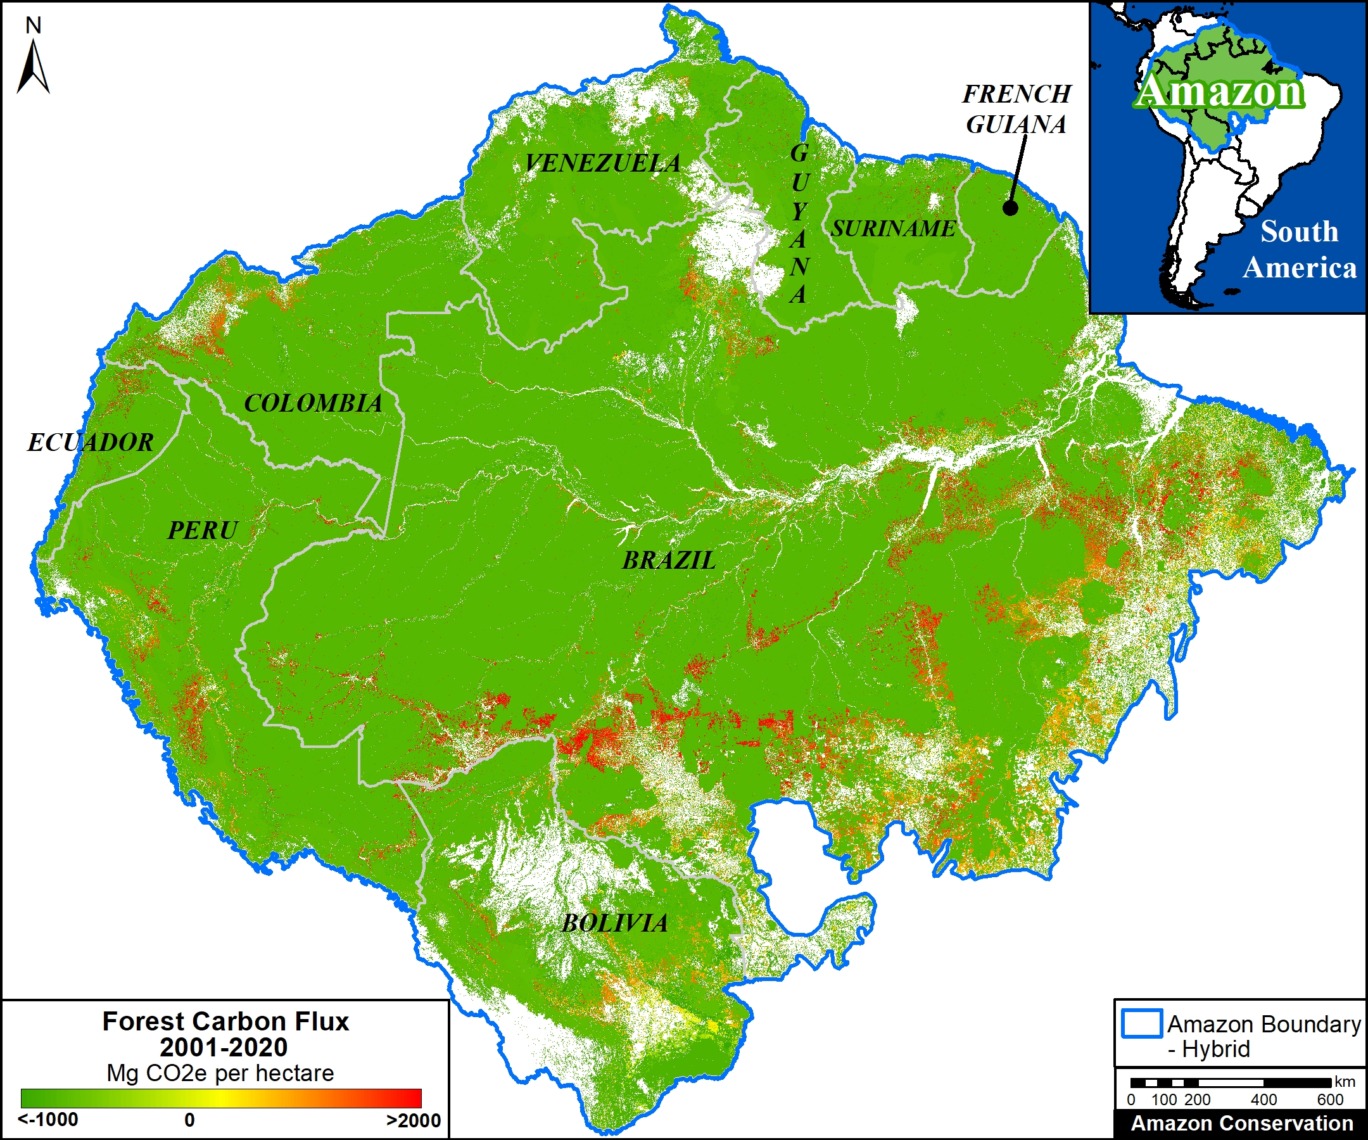
The flux is the crucial difference between forest carbon emissions (such as deforestation) and removals from the atmosphere (such as intact forests and regrowth).

A negative flux indicates that removals exceed emissions and the area is a carbon sink, thus buffering climate change. The Base Map illustrates these sinks in green.

A positive flux indicates that emissions exceed removals and the area has become a carbon source, thus exacerbating climate change. The Base Map illustrates these sources in red.

Below, we illustrate the carbon flux results and then zoom in on some of the key carbon sinks (such as protected areas and indigenous territories) and carbon sources (high deforestation areas) across the Amazon.

Amazon Carbon Flux

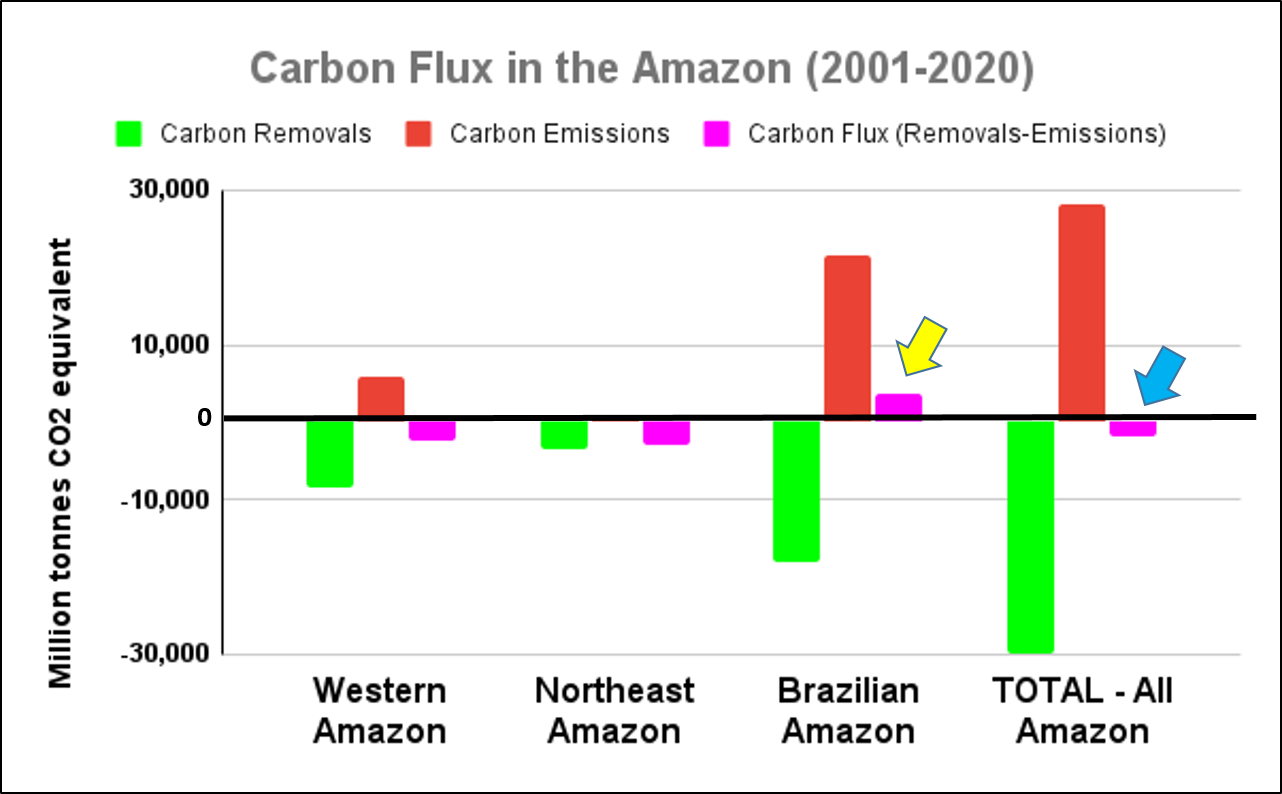
The two graphs below show levels of carbon removals in green and carbon emissions in red across the western Amazon (Bolivia, Colombia, Ecuador, and Peru), northeastern Amazon (French Guiana, Guyana, Suriname, and Venezuela), Brazilian Amazon, and total Amazon. The resulting carbon flux is highlighted in pink.

The arrows highlight three critical results:

  • The Brazilian Amazon has become a net carbon source (positive flux indicated by yellow arrow in Graph 1). That is, emissions now exceed removals (3,600 million tonnes of carbon dioxide equivalent over the past 20 years), exacerbating climate change.
    l
  • The total Amazon is still a net carbon sink (negative flux indicated by blue arrow in Graph 1). That is, removals still exceed emissions (-1,700 million tonnes of carbon dioxide equivalent over the past 20 years), helping mitigate climate change, mainly thanks to the role of the western and northeastern Amazon.
    j
  • Protected areas and indigenous territories are effective carbon sinks, while other areas outside these key designations are the major carbon source (positive flux indicated by orange arrow in Graph 2).
Graph 1. Carbon Flux in the Amazon, 2001-20. Data: Harris et al 2021. Analysis: Amazon Conservation/MAAP.
Graph 2. Carbon Flux in the Amazon, 2001-20. Data: Harris et al 2021. Analysis: Amazon Conservation/MAAP.

Key Amazon Carbon Sinks: Protected Areas & Indigenous Territories

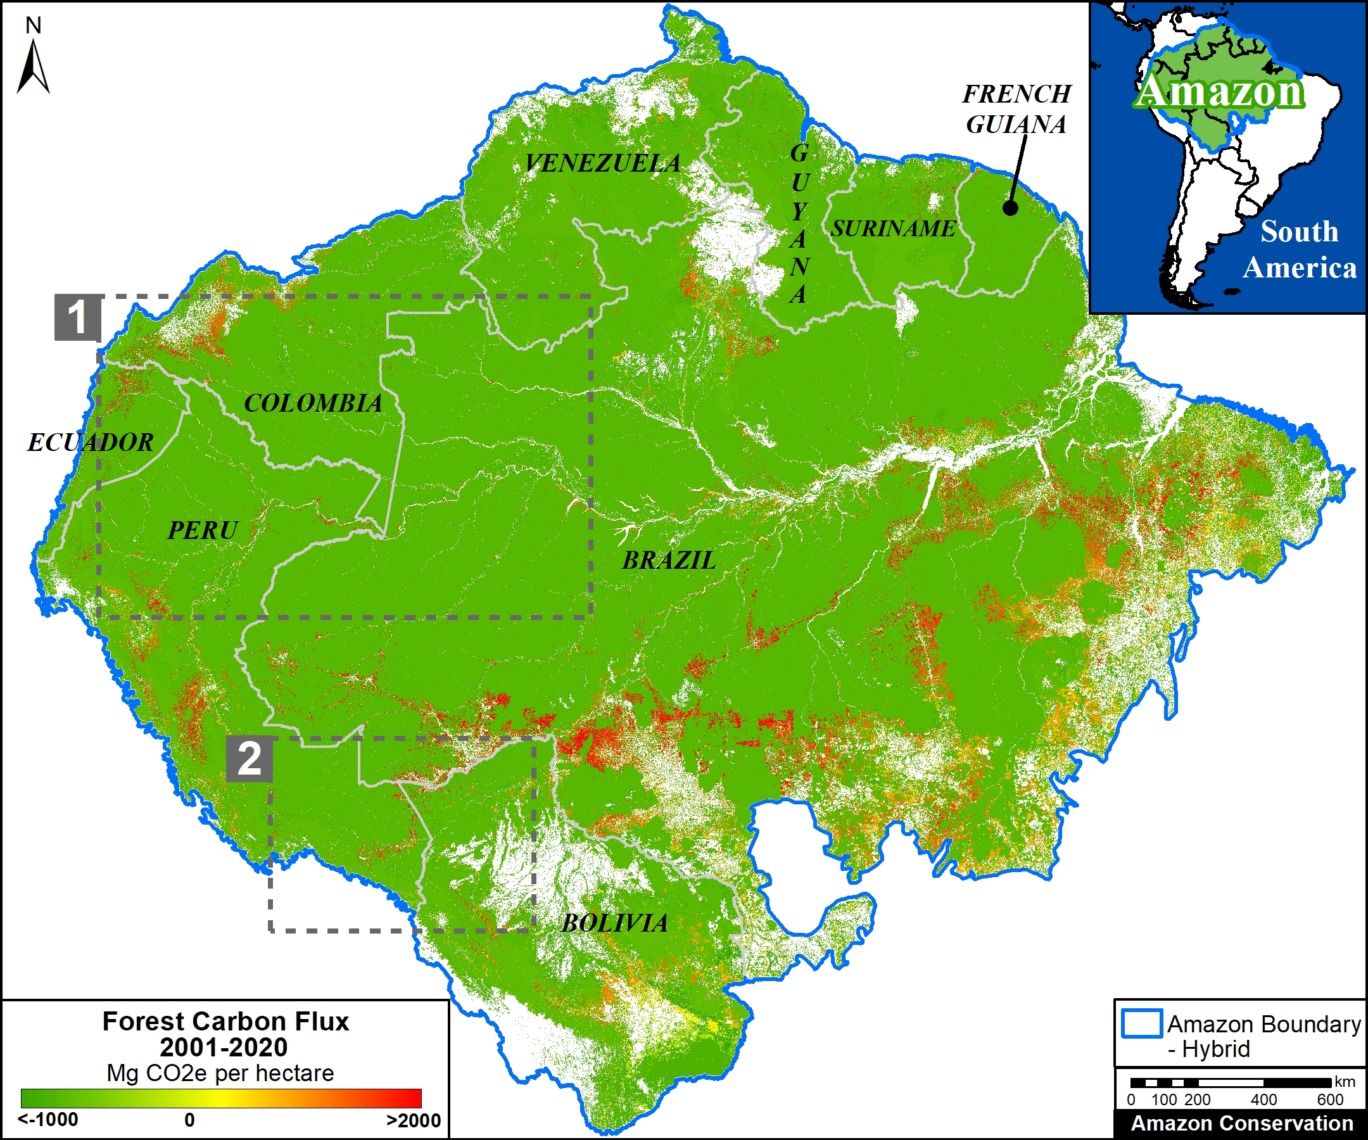
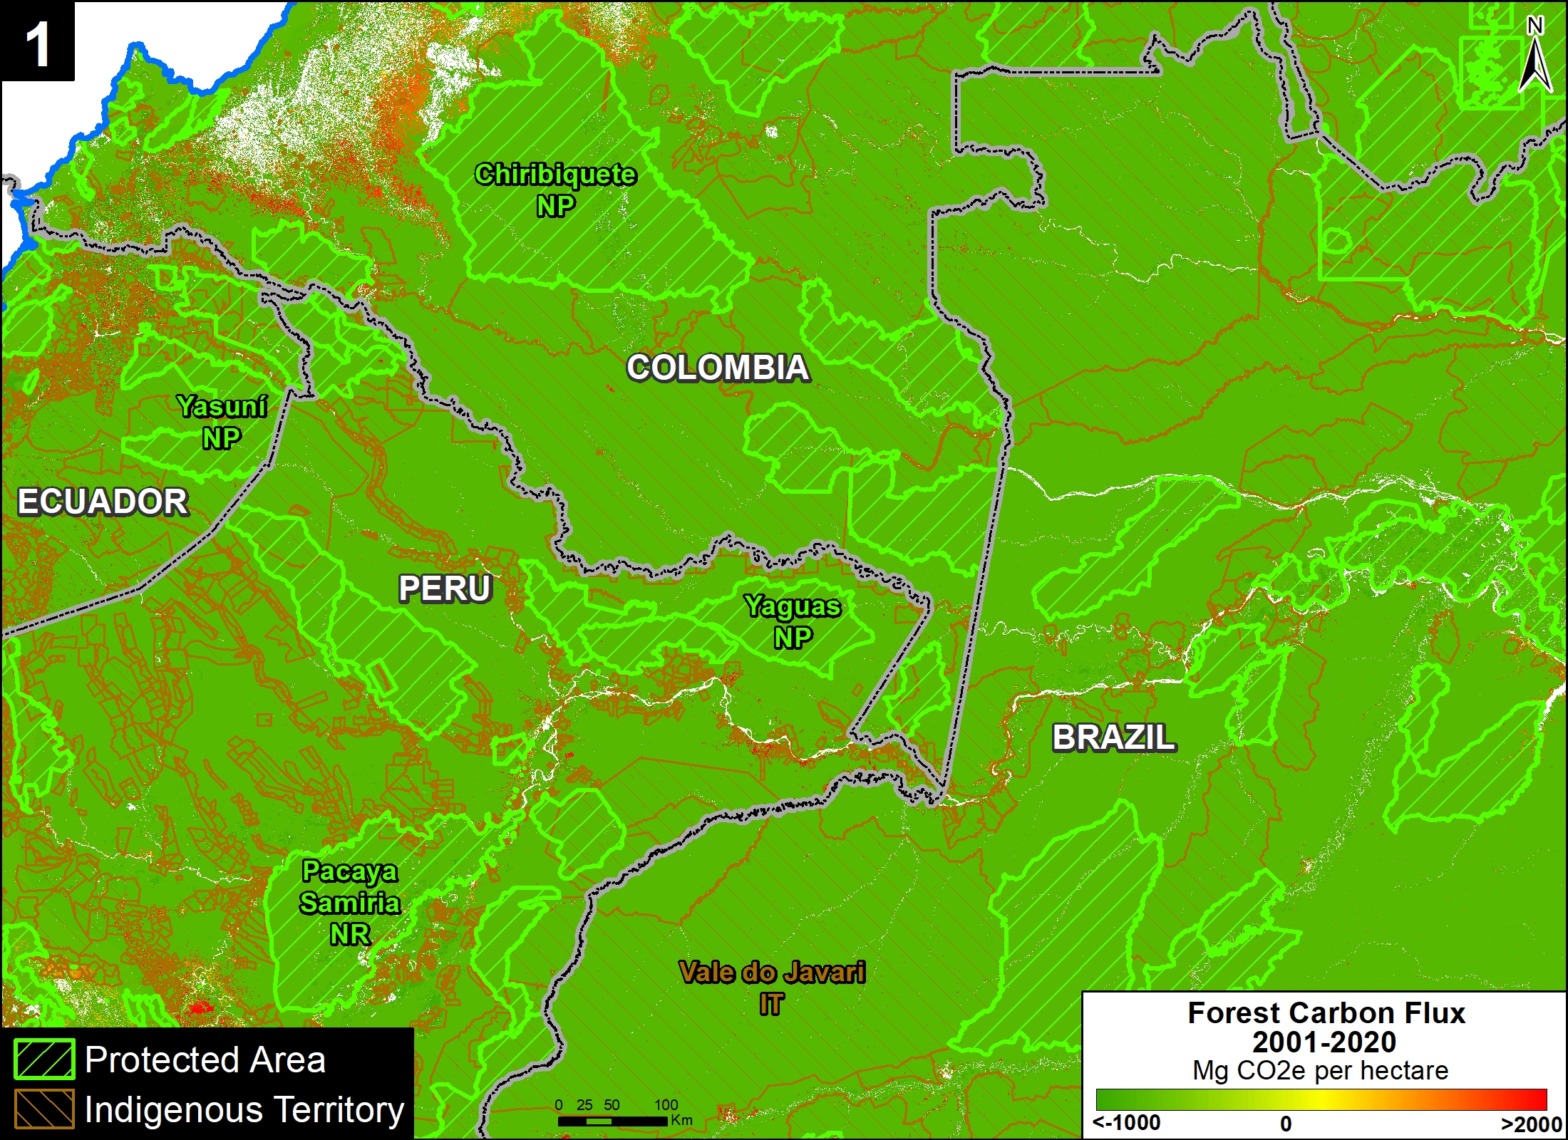
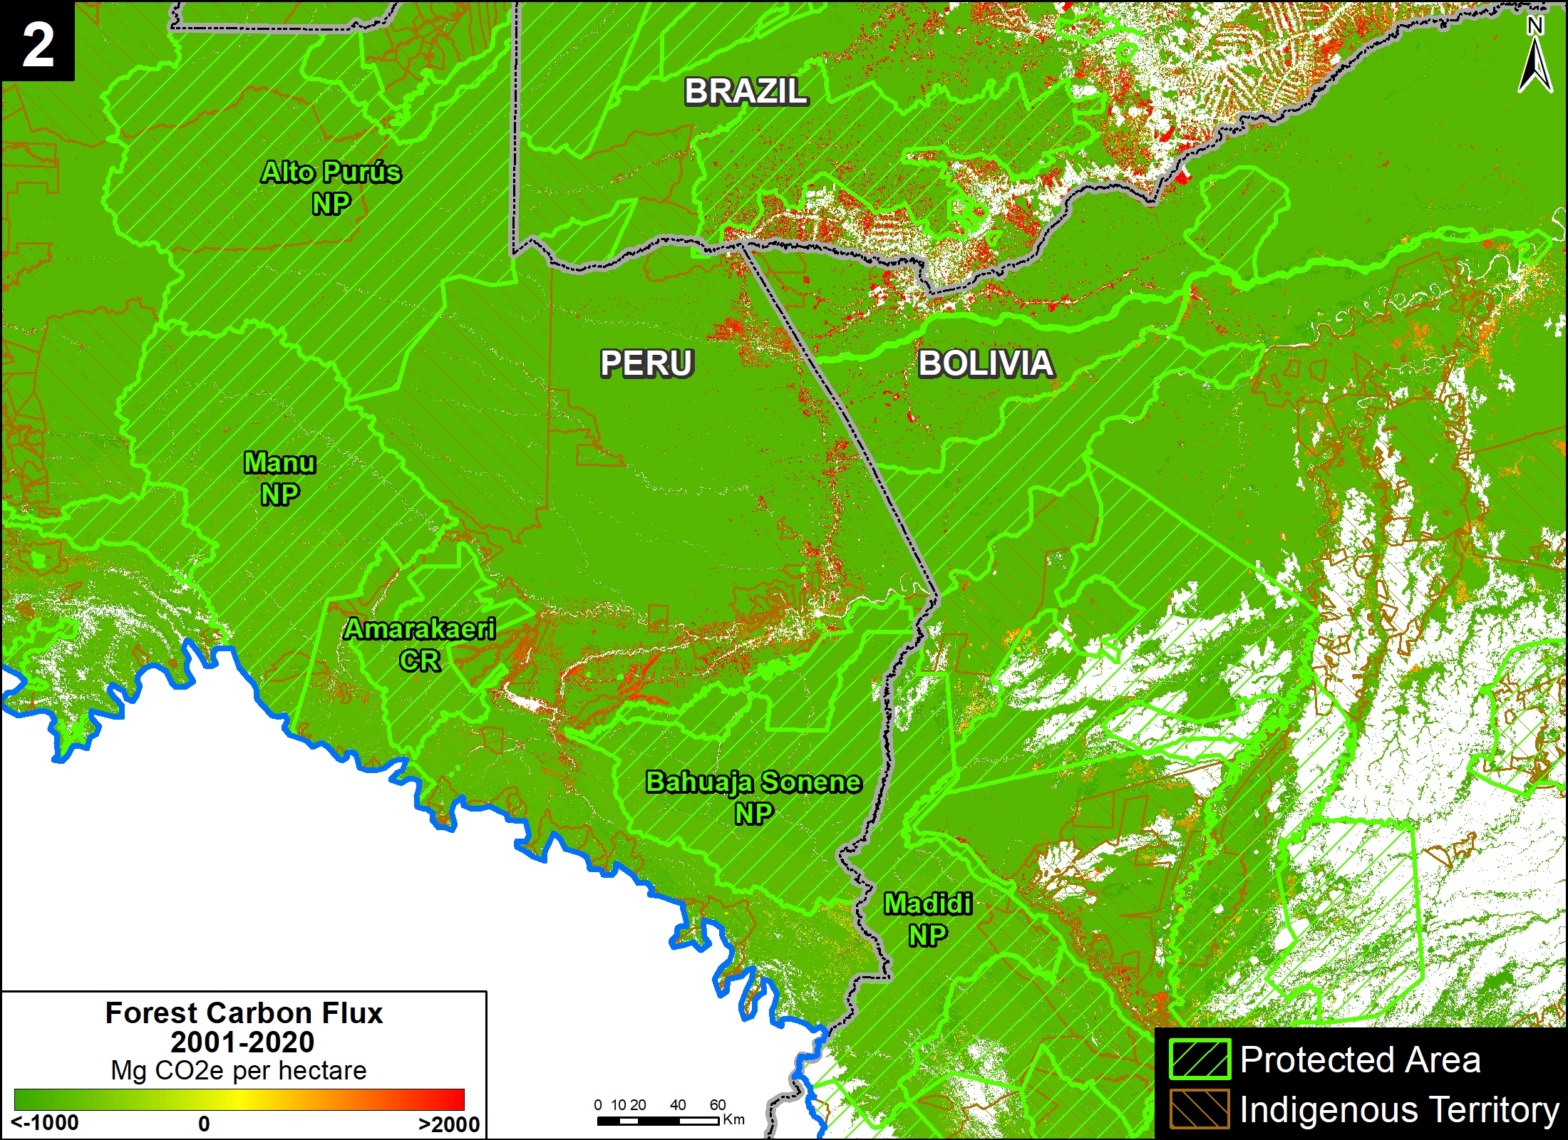
Zooms 1 and 2 show two major carbon sinks in the western Amazon.

Zoom 1 focuses in on the northwestern Amazon, stretching across four countries (Brazil, Peru, Colombia, and Ecuador). This region includes large protected areas (such as Yasuni National Park in Ecuador, Chiribiquete National Park in Colombia, and Yaguas National Park in Peru) and indigenous territories (such as Vale do Javari in Brazil).

Zoom 2 focuses in on the southwestern Amazon, stretching across three countries (Brazil, Peru, and Bolivia). This region also includes large protected areas (such as Alto Purus, Manu, and Bahuaja Sonene National Parks in Peru and Madidi National Park in Bolivia).

Base Map: Amazon carbon sinks, indicated by insets 1 and 2. Data: Harris et al 2021.


Key Amazon Carbon Sources: High Deforestation Areas

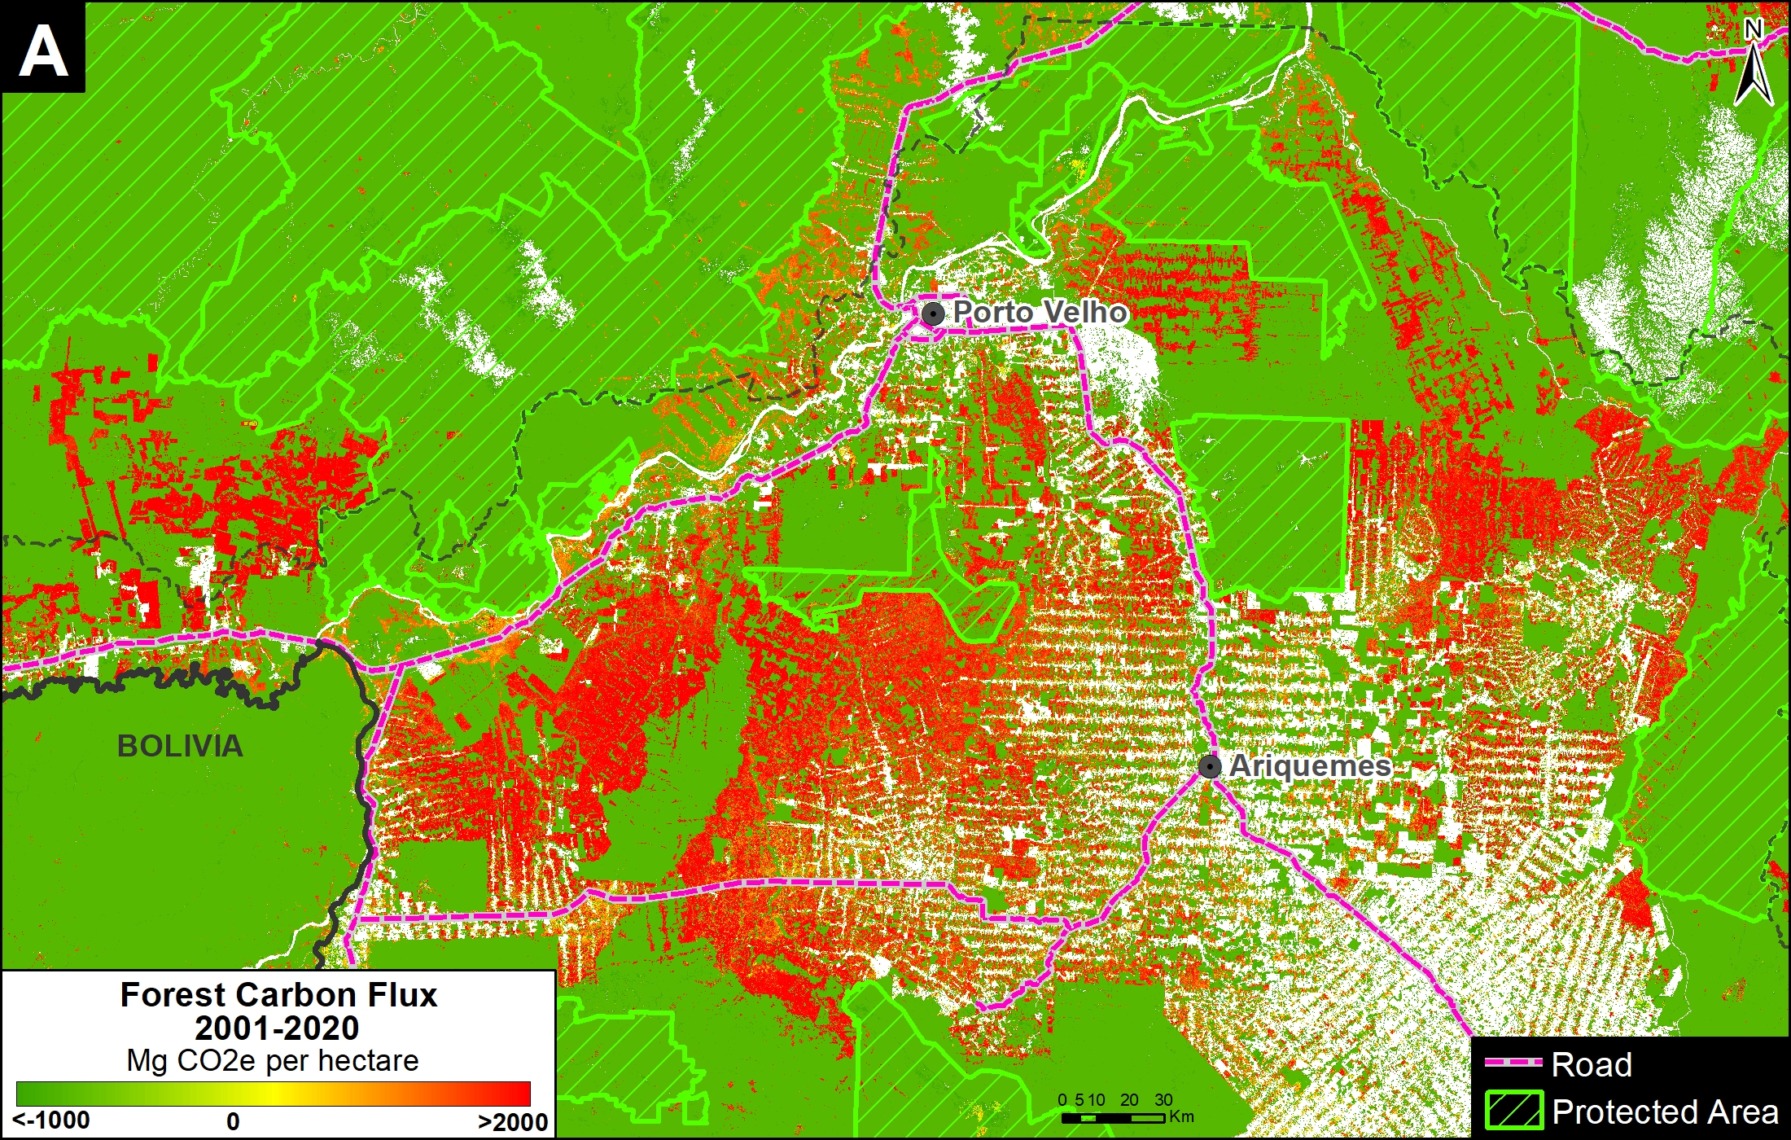
Zooms A-H show eight major carbon sources in the western Amazon.

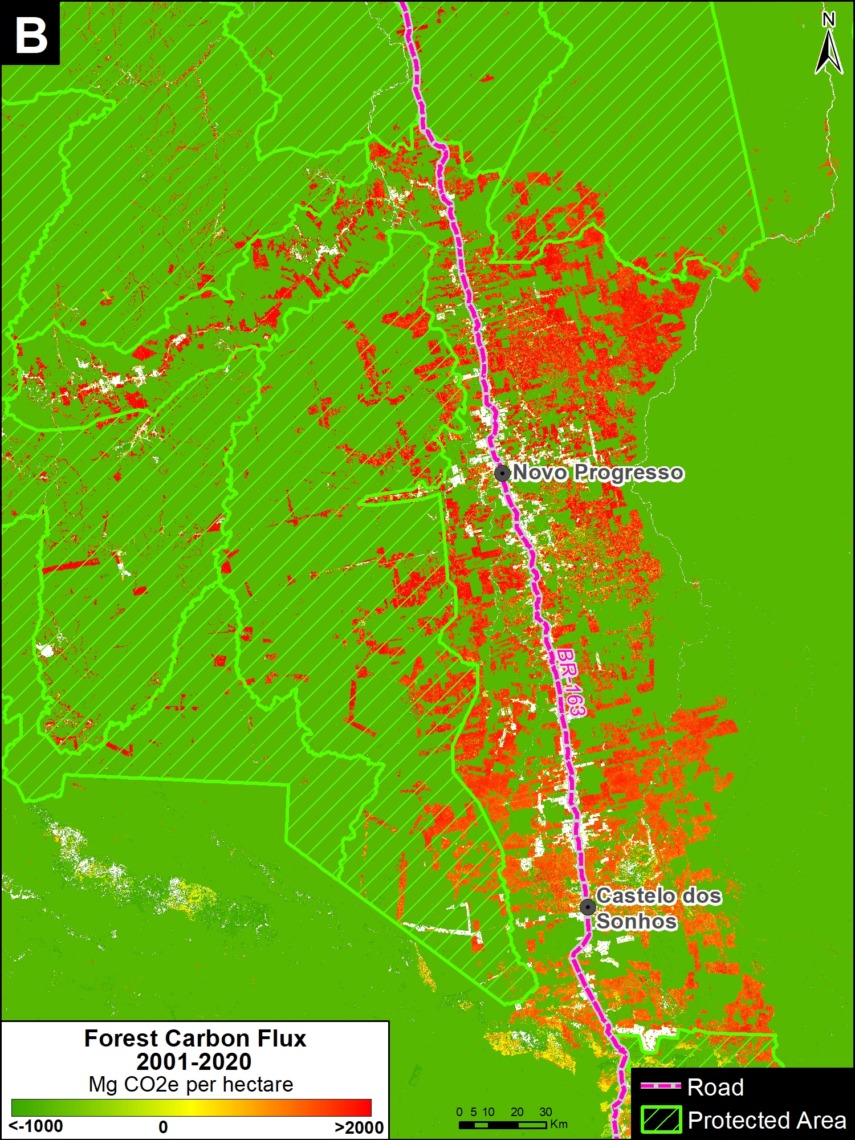
Zooms A and B show two of the major deforestation fronts in the Brazilian Amazon. Zoom A shows the massive deforestation around the city of Porto Velho, in the state of Rondônia and near the border with the state of Amazonas. Zoom B shows the massive deforestation along the BR-163 highway in the state of Pará.

Base Map: Amazon carbon sources, indicated by letters A-G. Data: Harris et al 2021.

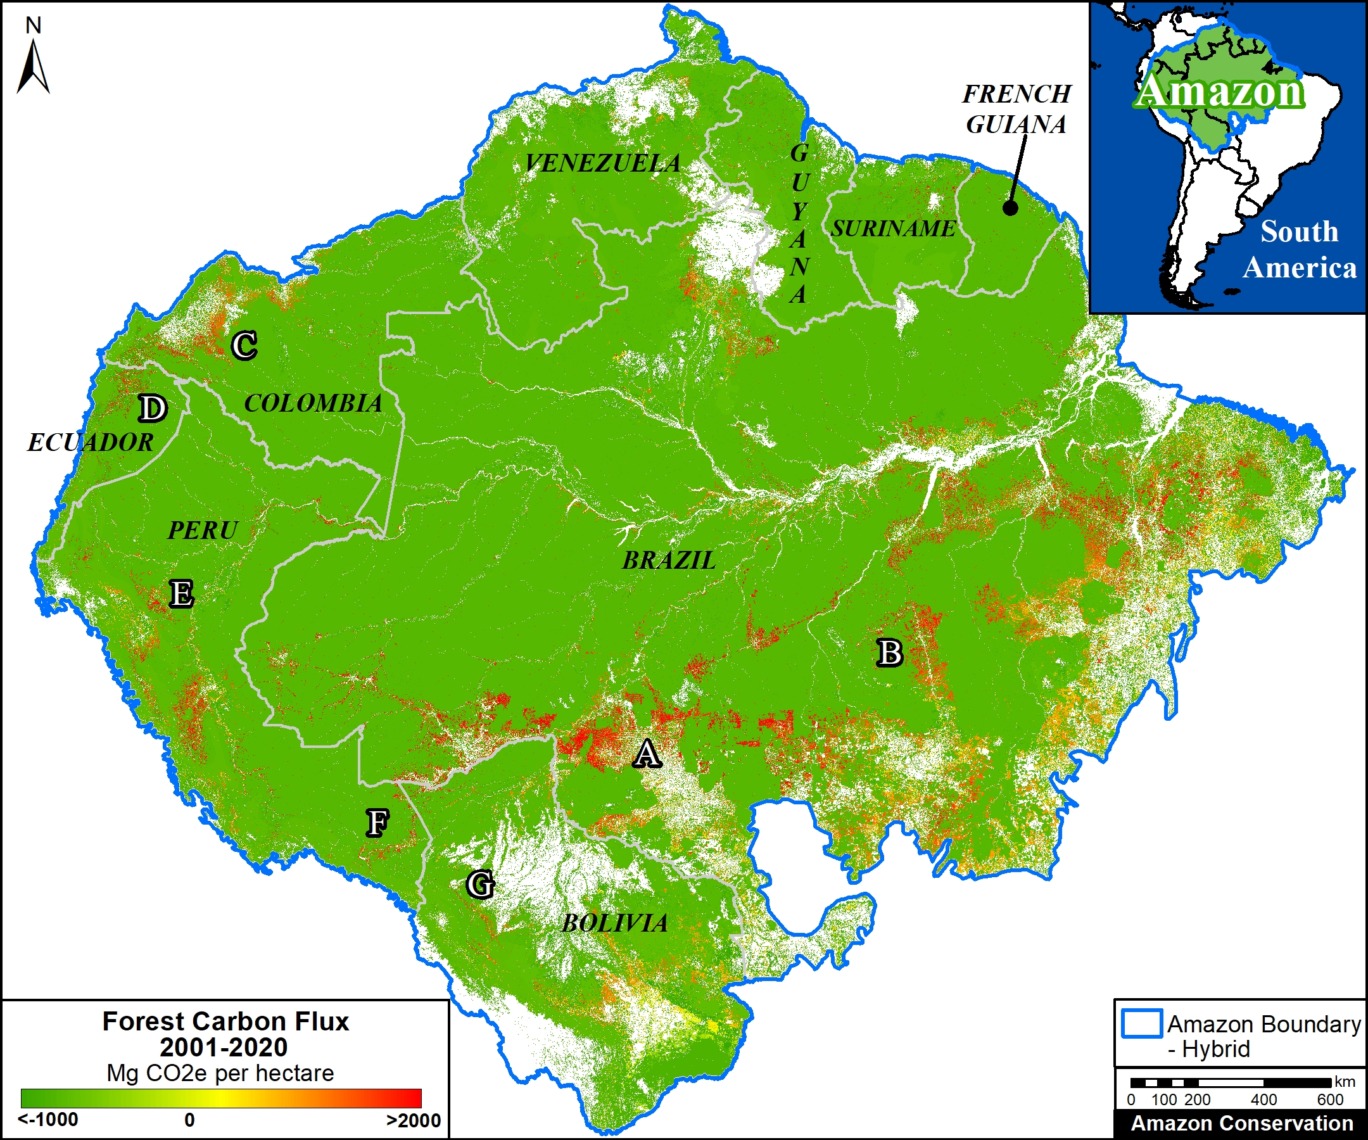
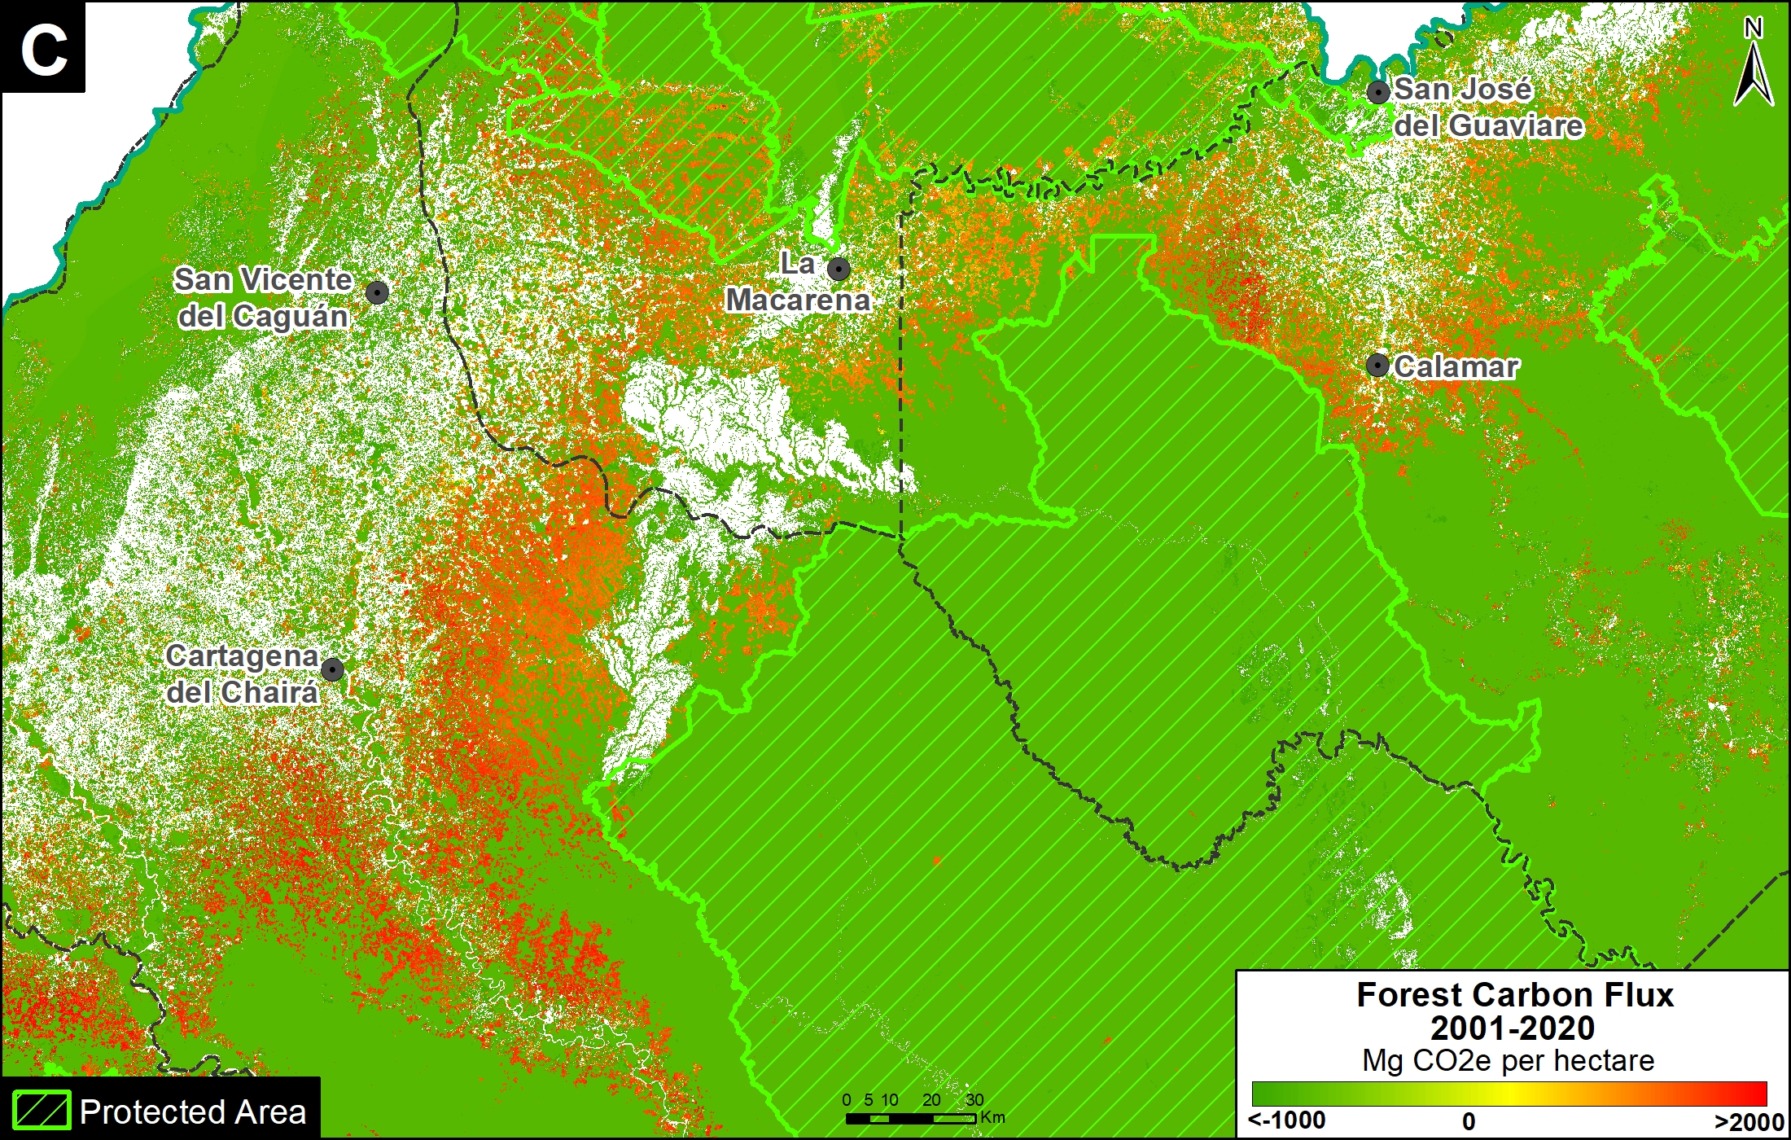
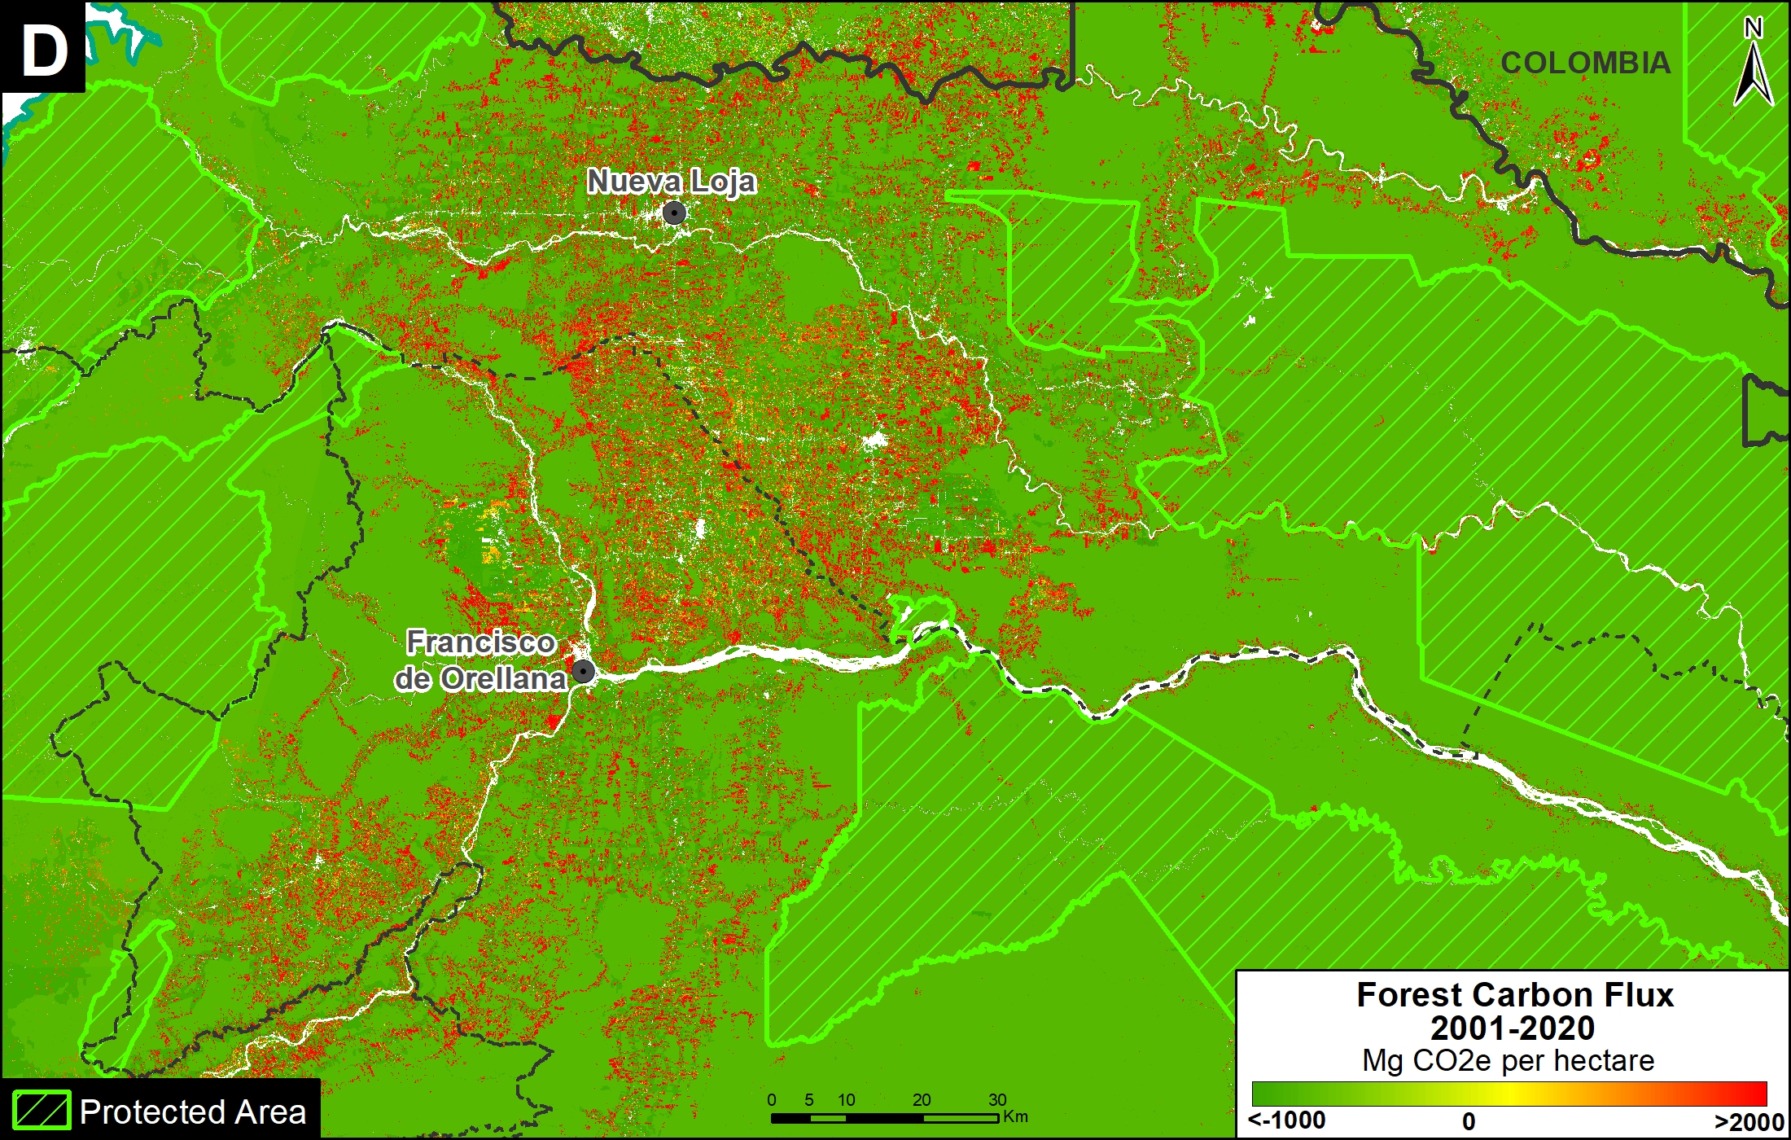
Moving to the western Amazon, Zoom C shows the arc of deforestation in the northwestern Colombian Amazon and Zoom D shows the major deforestation front in the northern Ecuadorian Amazon.

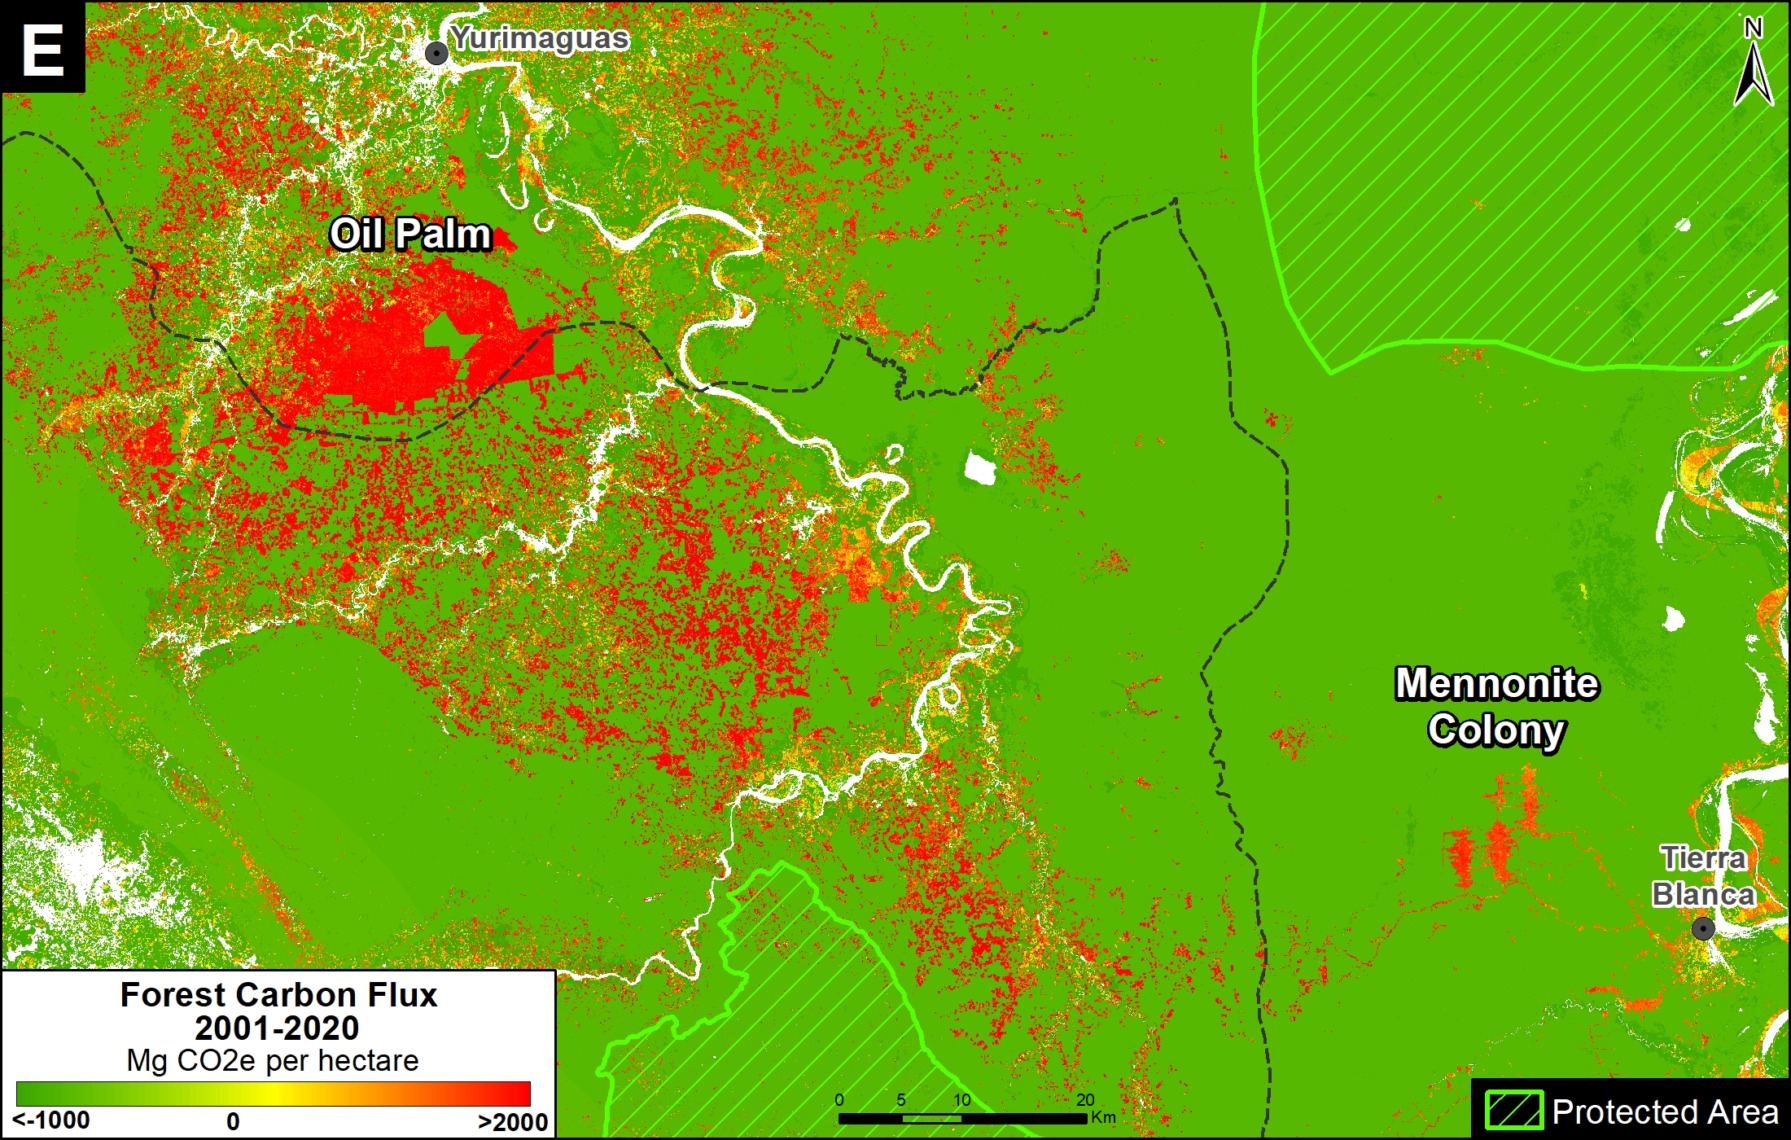
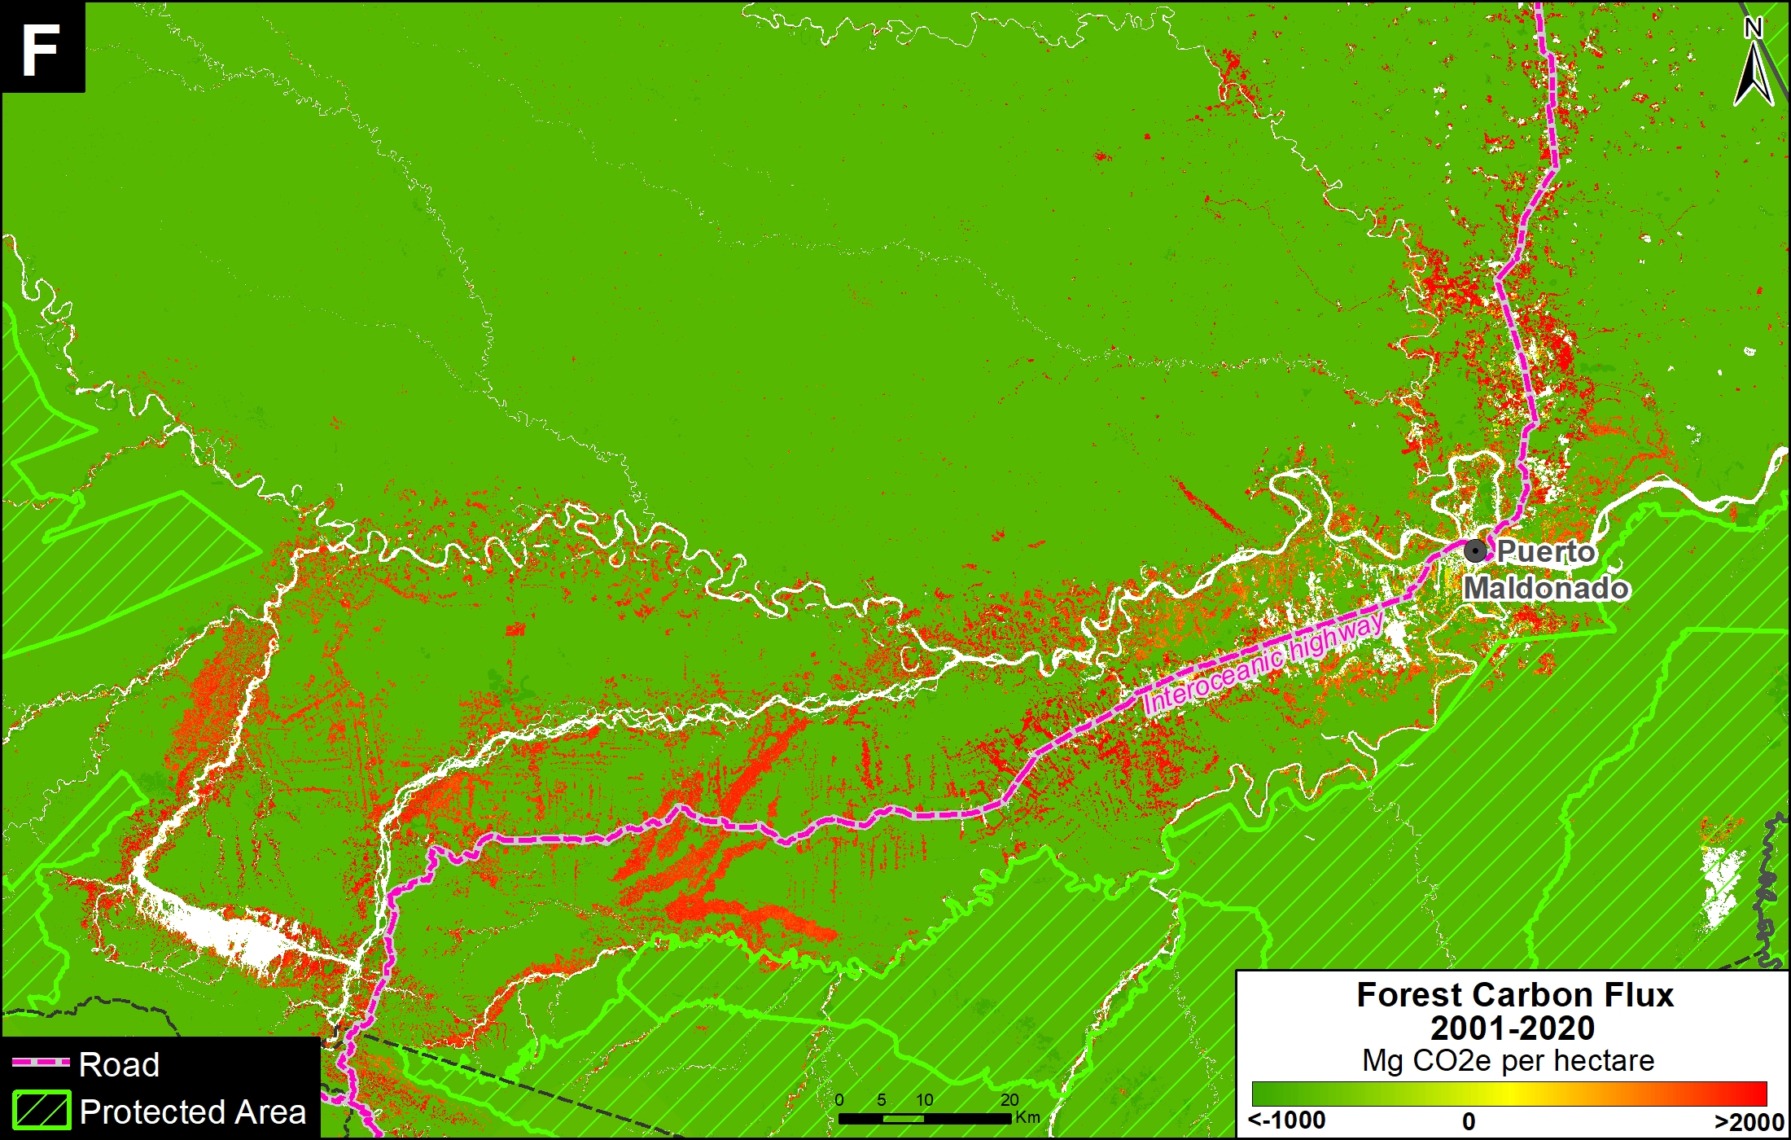
Zooms E and F show two of the major deforestation fronts in the Peruvian Amazon. Zoom E shows large-scale deforestation from oil palm plantations and a new Mennonite colony in the north. Zoom F shows the major deforestation front in the south, along the Interoceanic Highway, surrounded by gold mining and small-scale agriculture.


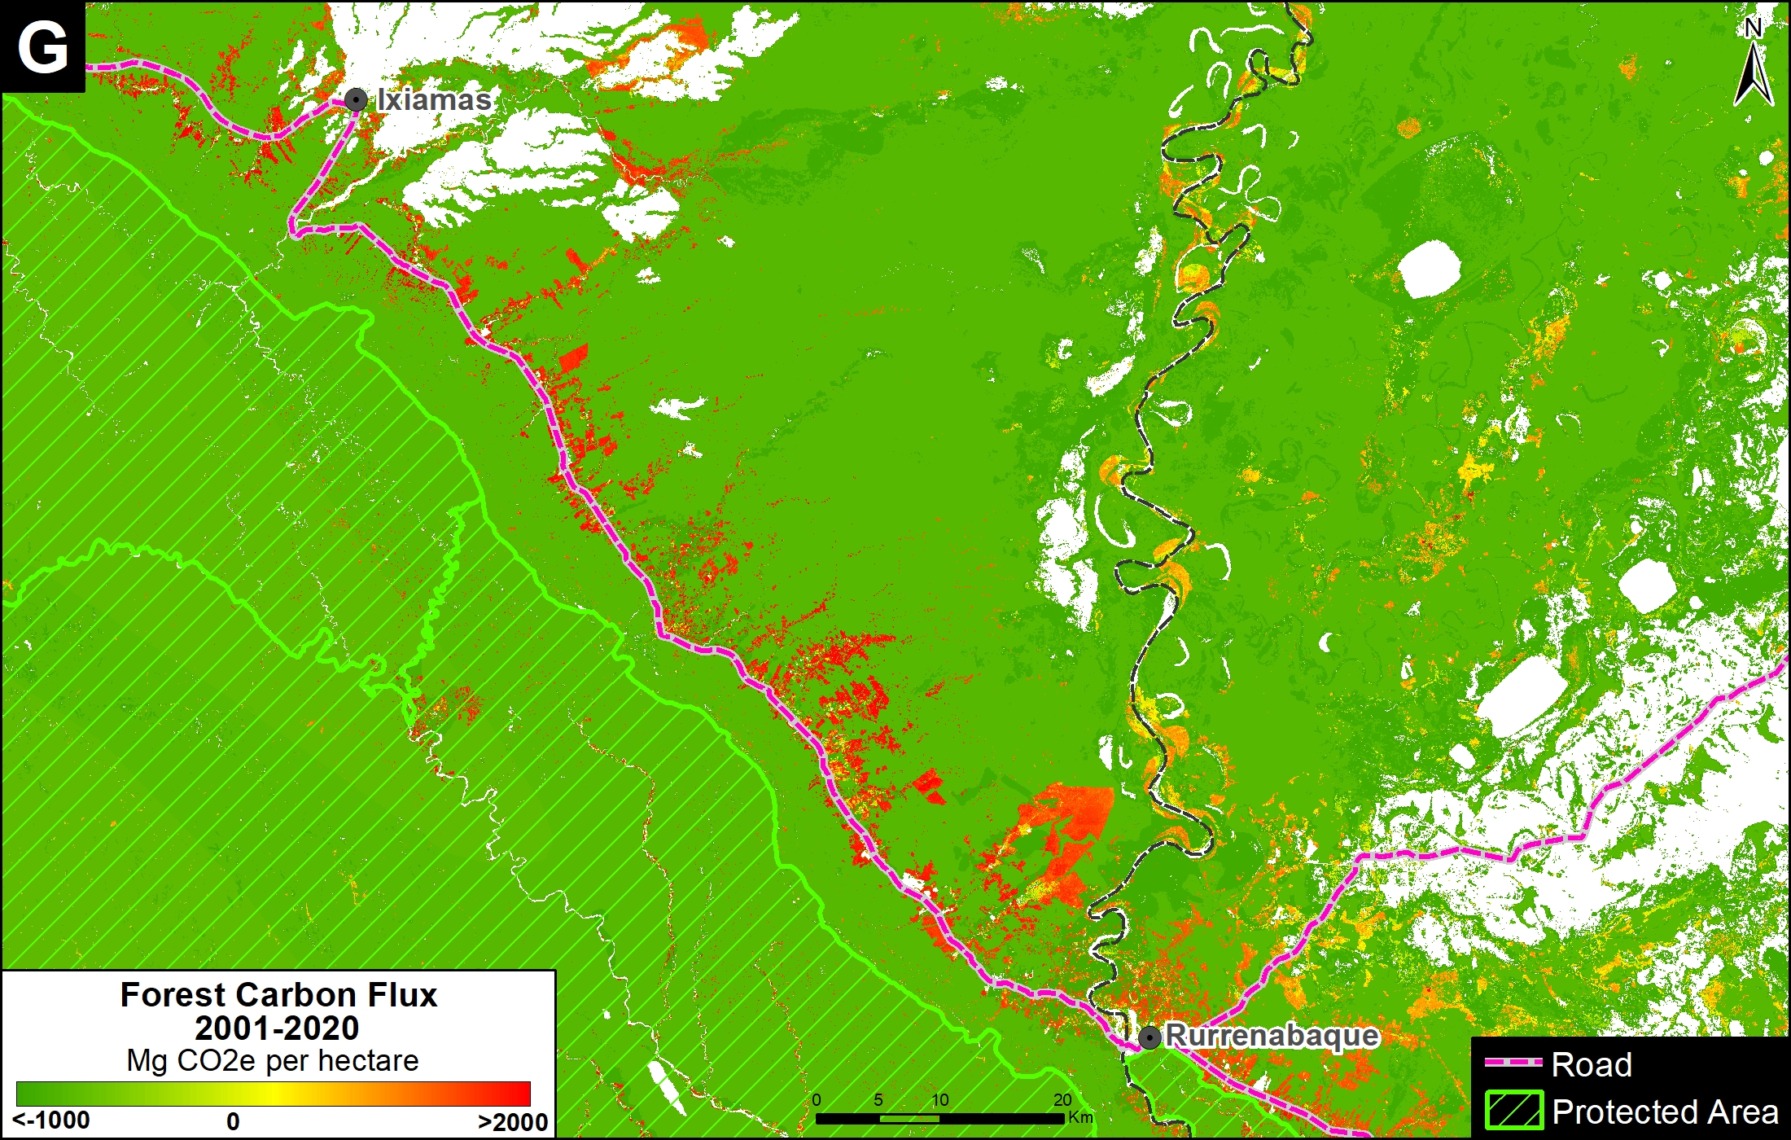
Finally, Zoom G shows the deforestation along the road connecting Rurrenabaque and Ixiamas, including the new large-scale sugar cane plantation.


*Methodology & Notes

Base Map, Figure 1, and Zoom maps are based on 30-meter, satellite-based data obtained from Harris et al (2021). Our geographic range included nine countries and consists of a combination of the Amazon biogeographic limit (as defined by RAISG) plus the Amazon watershed limit in Bolivia. See Base Map above for delineation of this hybrid Amazon limit, designed for maximum inclusion.

References

Gatti, LV et al (2021) Amazonia as a carbon source linked to deforestation and climate change. Nature 595, 388–393.

Harris NL et al (2021) Global maps of twenty-first century forest carbon fluxes. Nature Climate Change 11, 234-240.

Acknowledgements

We thank M. Silman (Wake Forest University), D. Gibbs (WRI), M.E. Gutierrez (ACCA), D. Larrea (ACEAA), J. Beavers (ACA), and A. Folhadella (ACA) for their helpful comments on this report.

This work was supported by the Norwegian Agency for Development Cooperation (NORAD), and International Conservation Fund of Canada (ICFC).

Citation

Finer M, Mamani N (2021) The Amazon & Climate Change: Carbon Sink vs Carbon Source. MAAP: 144.

Amazon Fire Tracker 2021: August update

Major fire burning recently deforested area in the Brazilian Amazon (#17, Mato Grosso). Data: MAAP, Planet.

Following the intense Amazon fire seasons of both 2019 and 2020, we are closely tracking 2021 with  our unique real-time Amazon fire monitoring app.*

We have documented 246 major fires across the Amazon thus far this year, as of August 1 (see Base Map below).

The vast majority have been in the Brazilian Amazon (75%), followed by Bolivia, Peru, and Colombia.

Our key findings include:

  • In the Brazilian Amazon, the majority (67%) of major fires have burned recently deforested areas. Thus, the critical pattern is Deforestation followed by Fire, as many major fires are actually burning the remains of freshly cut areas. These fires have burned over 44,000 hectares (109,000 acres), highlighting the current high deforestation in Brazil.
    k
  • We have also documented a number of major fires in the natural grasslands embedded in the eastern Brazilian Amazon. Most of these fires have occurred in Indigenous Territories, such as Xingu andKayapó.
    l
  • The Brazilian government issued a ban on unauthorized outdoor fires on June 27, thus we assume that most of the 160 major fires following that date have been illegal.
    k
  • In the Bolivian Amazon, we have detected 35 major fires, mostly in the departments of Beni and Santa Cruz. In Beni, these fires have impacted 19,000 hectares (48,000 acres) of natural savanna ecosystems.
    k
  • In the Peruvian Amazon, most of the major fires have been in the higher elevation grasslands, impacting over 2,600 hectares (6,500 acres) in the upper reaches of the watershed.
    j
  • In the Colombian Amazon, we detected several major fires during that region’s peak season of February-March.

Below, we present our updated major Amazon fires Base Map, along with more detailed information for the Brazilian Amazon.

*In a new and unique approach, the app combines data from both the atmosphere (aerosol emissions in smoke) and the ground (heat anomaly alerts) to quickly and precisely detect major Amazon fires (see App Background below).

Base Map: Major Amazon Fires 2021

The Base Map shows the location of this year’s major fires (orange dots), as visualized in the app’s “Major Amazon Fires 2021” layer. Of the 209 major fires in the Amazon this year, the vast majority have been in Brazil (75%), followed by Bolivia (14%), Peru (9%), and Colombia (2%).

Base Map. “Major Amazon Fires 2021” layer, as visualized in the app. Data: MAAP, Amazon Conservation.


Fires in the Brazilian Amazon

Major fire burning recently deforested area in the Brazilian Amazon. Data: MAAP, Planet.

In the Brazilian Amazon, we have documented 184 major fires thus far in 2021.

This marks an increase from the start of the intense 2020 fire season, when we had detected 87 major fires by this same date (we ultimately documented over 2,250 major fires by the end of the year).

As noted above, the majority (67%) of major fires have burned recently deforested areas (that is, areas where the forest was previously cleared between 2017 and 2021 prior to burning). These fires have burned over 44,000 hectares (109,000 acres), highlighting the current high deforestation in Brazil.

Most of the remaining fires have occurred in either natural savannah grasslands (impacting 35,000 ha) or older croplands. Many of the grassland fires have occurred in Indigenous Territories, such as Xingu and Kayapó.

It is worth highlighting that we have also documented the first several “Forest Fires” of the season, defined here as human-caused fires in standing forest. The impact of these fires has been relatively small so far (400 hectares), but this number is expected to spike as the dry season intensifies in August and September.

The Brazilian government issued a ban on unauthorized outdoor fires on June 27, thus we assume that most of the 160 major fires following that date have been illegal.

The state of Mato Grosso has had the most major fires (43%), followed by Amazonas (29%), Pará (14%), Rondônia (12%), and Acre (2%).

*App Background

We launched a new and improved version of the Amazon real-time fire monitoring app in May 2021. The app is hosted by Google Earth Engine and updated every day by the organization Conservación Amazónica, based in Peru.

The app displays aerosol emissions as detected by the European Space Agency’s Sentinel-5 satellite. Elevated aerosol levels indicate the burning of large amounts of biomass, defined here as a “major fire”. In a novel approach, the app combines data from the atmosphere (aerosol emissions in smoke) and the ground (heat anomaly alerts) to effectively detect and visualize major Amazon fires.

When fires burn, they emit gases and aerosols. A new satellite (Sentinel-5P from the European Space Agency) detects these aerosol emissions (aerosol definition: Suspension of fine solid particles or liquid droplets in air or another gas). Thus, the major feature of the app is detecting elevated aerosol emissions which in turn indicate the burning of large amounts of biomass. For example, the app distinguishes small fires clearing old fields (and burning little biomass) from larger fires burning recently deforested areas or standing forest (and burning lots of biomass). The spatial resolution of the aerosol data is 7.5 sq km. The high values in the aerosol indices (AI) may also be due to other reasons such as emissions of volcanic ash or desert dust so it is important to cross reference elevated emissions with heat data and optical imagery.

We define “major fire” as one showing elevated aerosol emission levels on the app, thus indicating the burning of elevated levels of biomass. This typically translates to an aerosol index of >1 (or cyan-green to red on the app). To identify the exact source of the elevated emissions, we reduce the intensity of aerosol data in order to see the underlying terrestrial heat-based fire alerts. Typically for major fires, there is a large cluster of alerts. The major fires are then confirmed, and burn areas estimated, using high-resolution satellite imagery from Planet Explorer.

We define burning “recently deforested areas” as any forested area cleared since 2017 and subsequently burned in 2021.

Since the data updates daily and is not impacted by clouds, real-time monitoring really is possible. Our goal is to upload each day’s new image in the late afternoon/early evening.

Acknowledgements

The app was developed and updated daily by Conservación Amazónica (ACCA). The data analysis is led by Amazon Conservation in collaboration with SERVIR Amazonia.

The Amazon Fire Tracker series is supported by NORAD (Norwegian Agency for Development Cooperation) and ICFC (International Conservation Fund of Canada).

Citation

Finer M, Costa H, Villa L (2021) Amazon Fire Tracker 2021: August Update. MAAP 2021, #3.