MAAP #111: Fires in the Bolivian Amazon – Using Google Earth Engine to Monitor

Recent fire in the dry forests of the the Bolivian Amazon. Data: Planet.

We begin a new series on how to harness the power of the cloud to improve real-time monitoring in the Amazon and beyond.

As the amount of data from satellite images has skyrocketed, so have the challenges of research teams to fully utilize this abundant and heavy (in  terms of terabytes) information.

In response, tech companies such as Google, Amazon, and Microsoft have been offering their powerful computer power, via the internet (cloud), to help process, analyze, display, and store big data.

Here, we feature Google Earth Engine, which is designed for the free processing of geospatial information (including satellite imagery) and publishing results on web applications.

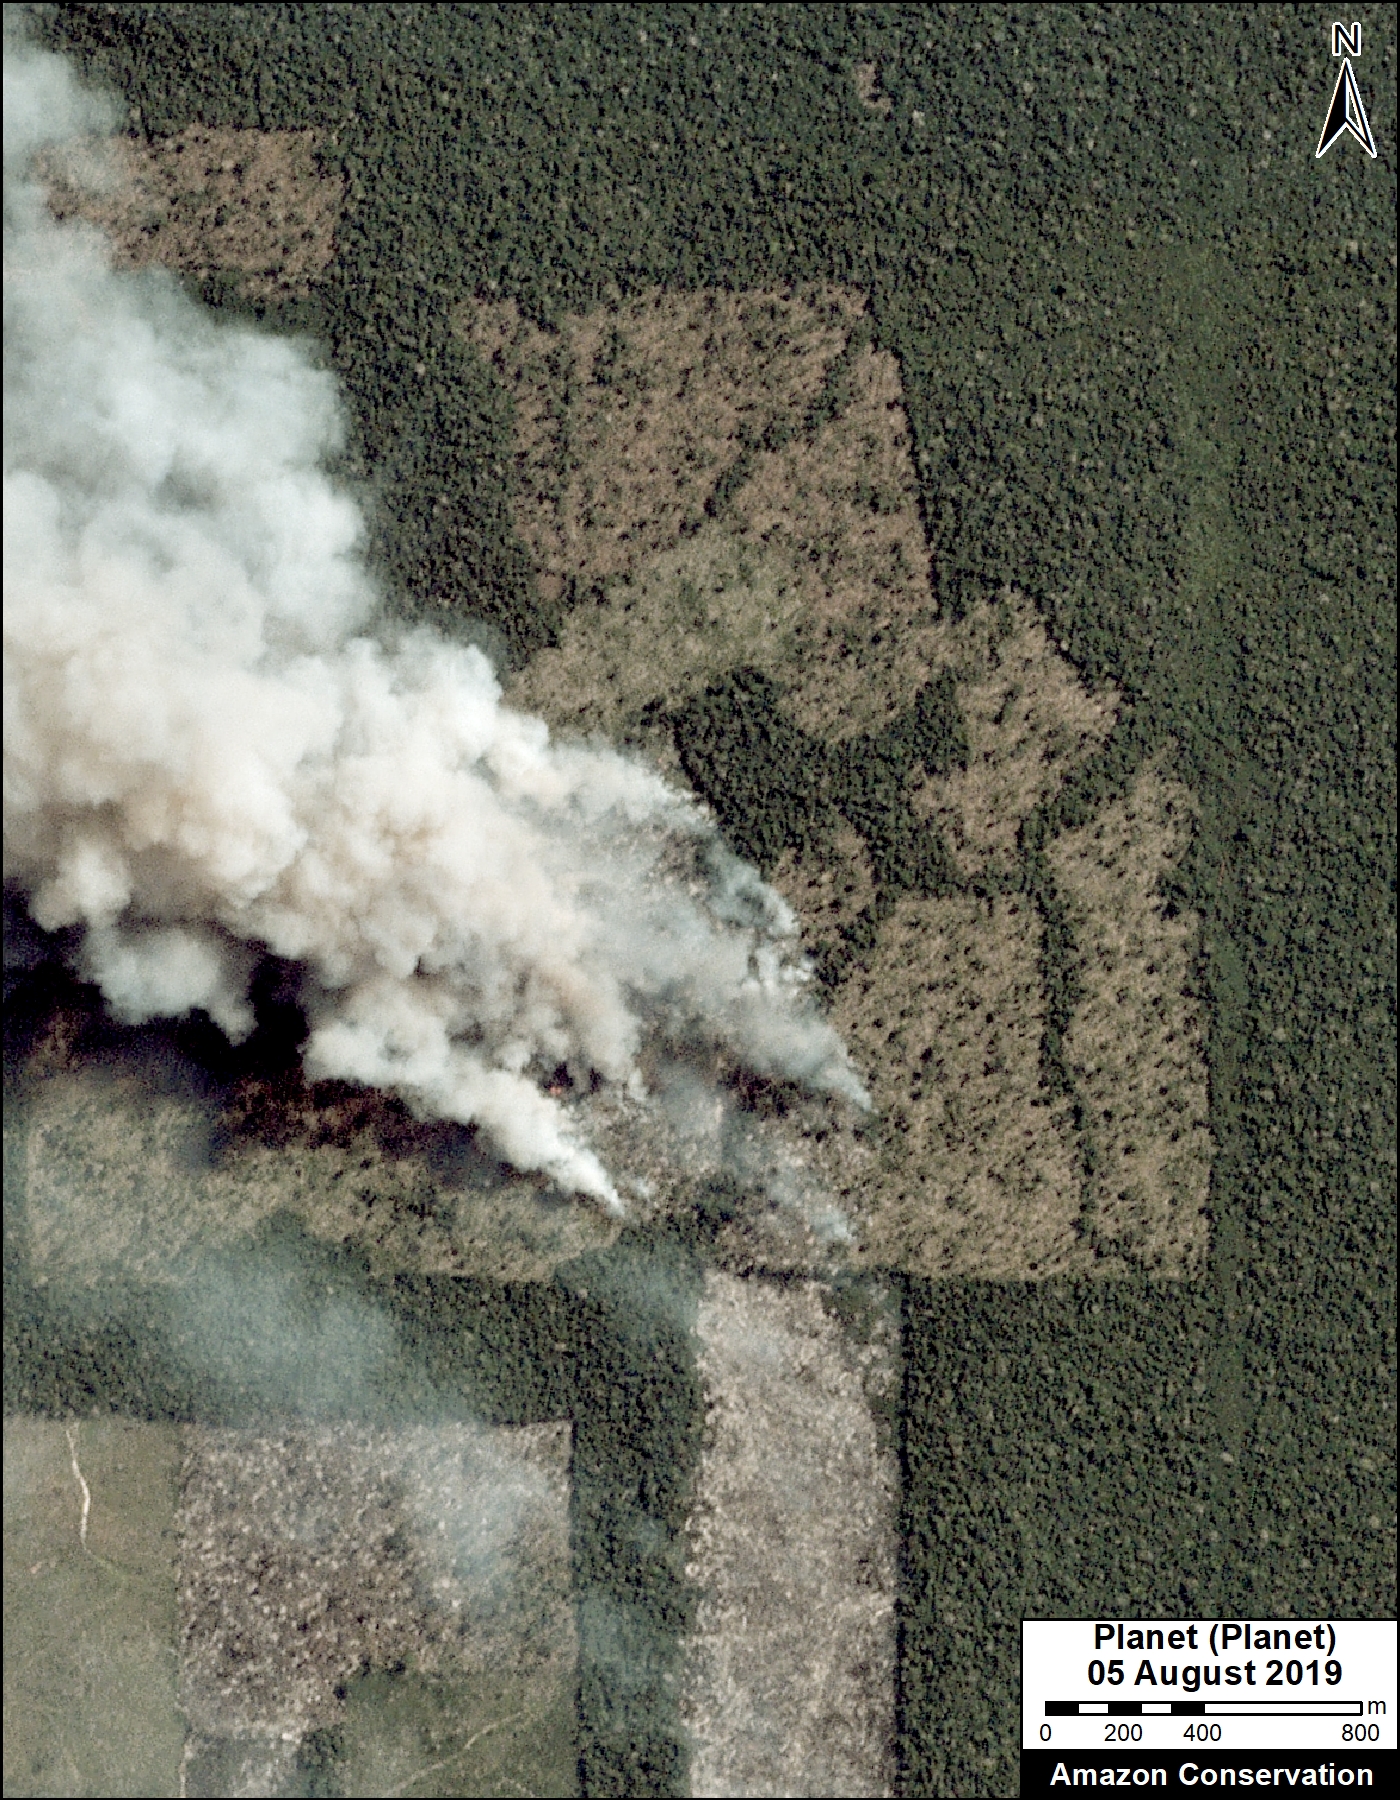
In our first example, we show the power of Google Earth Engine to help with fire monitoring in the Bolivian Amazon. As noted in our previous reports, the 2019 fire season in Bolivia has been intense, with numerous major fires in the Amazonian dry forests and savannas.

There is currently an urgent need for real-time monitoring of active fires to assist ongoing fire management efforts at the national level. In response, we developed the application described below.


The App “Amazon Fires – Bolivia

Screen shot of the “Amazon Fires – Bolivia” app.

We developed the application “Amazon Fires – Bolivia that allows users to easily access and analyze an archive of recent satellite images of the Bolivian Amazon fires in near real-time.

Specifically, the user can compare aerosol data (from the satellite Sentinel-5P), with recent imagery from five different satellites (Terra, Aqua, Suomi, Sentinel-2, and Sentinel-1 radar).

We recommend viewing the aerosol data on the left panel and most recent imagery on the right panel.

Aeresol data (Ultraviolet Aerosol Index) does a strikingly good job of accurately and precisely highlighting the location of active fires because it is showing the actual emissions (pollutants) from the fires (as opposed to the commonly used fire alert data which detect general temperature anomalies, not actual fires). It is important to note that it can be calculated in the presence of clouds so that daily, global coverage is possible. This app represents one of the first major uses of the aerosol data from Sentinel-5P to detect fires in real-time.

Reds indicate the highest levels of aeresol (and likely the largest fires), followed by orange, yellow, green, light blue, purple, dark blue, and black.

Note that if you zoom out, the aerosol data also covers much of the Brazilian Amazon.

Currently, new images are automatically included in the app when they are added to the Google Earth Engine dataset (typically with a delay of one or two days), but during critical times we will manually upload new imagery daily.

Our hope is that relevant actors, including government and fire-fighting crews, can use this real-time information to better address the fires.

Link to the App “Amazon Fires – Bolivia”:
https://luciovilla.users.earthengine.app/view/monitoring-amazon-fires

Imagery Guide

The app shows images in natural color. As a guide, below we show a series of natural color images in relation to “false color” infrared images, which better highlight burn scars (black) in relation to the vegetation (red).

Guide 1. Data: Planet.
Guide 2. Data: Planet.
Guide 3. Data: Planet.

Acknowledgements

We thank D. Larrea (ACEAA), M. Terán (ACEAA), C. de Ugarte (ACEAA), and A. Condor (ACCA) for helpful comments to earlier versions of this report.

The development of this application was made possible thanks to the support provided by the Google Earth Engine team, with the support of SilvaCarbon (technical advisory program that provides spaces for countries to learn about new tools) and the SERVIR Amazonia program.

This work was supported by the following major funders: MacArthur Foundation, International Conservation Fund of Canada (ICFC), Metabolic Studio, and Global Forest Watch Small Grants Fund (WRI).

Citation

Villa L, Finer M (2019) Fires in the Bolivian Amazon – Using Google Earth Engine to Monitor. MAAP: 111.

MAAP #110: Major Finding – Many Brazilian Amazon Fires follow 2019 Deforestation

2019 fire in the Brazilian Amazon (Rondônia) that followed 2019 deforestation. Data: Planet.

In MAAP #109 we reported a major finding critical to understanding this year’s fires in the Brazilian Amazon: many of the 2019 fires followed 2019 deforestation events.

Here, we present our more comprehensive estimate: 125,000 hectares (310,000 acres) deforested in 2019 and then later burned in 2019 (July-September). This is equivalent to 172,000 soccer fields.*

Thus, the issue is both deforestation AND fire; the fires are often a lagging indicator of recent agricultural deforestation.

This key finding flips the widely reported assumption that the fires are burning intact rainforests for crops and cattle.

Instead, we find it’s the other way around, the forests were cut and then burned, presumably to enrich the soils. It is “slash and burn” agriculture, not “burn and slash.”

The policy implications are important: national and international focus needs to be on minimizing new deforestation, in addition to fire prevention and management.

This breakthrough data is based on our analysis of an extensive satellite imagery archive, allowing us to visually confirm areas that were deforested in 2019 and later burned in 2019 (see Methodology).

Below we present a new series of 7 striking timelapse videos that vividly show examples of 2019 deforestation followed by fires (See Base Map below for exact zoom locations).

Timelapse Videos: 2019 Deforestation followed by Fires

Video 1 shows the deforestation of 845 hectares (2,090 acres) in Mato Grosso state in early 2019, followed by fires starting in July. Planet link.


Video 2 shows the deforestation of 910 hectares (2,250 acres) in Amazonas state in early 2019, followed by fires in August. Planet link.


Video 3 shows the deforestation of 650 hectares (1,600 acres) in Rondônia state in early 2019, followed by fire starting in X. Planet link.


Video 4 shows the deforestation of 1,760 hectares (4,350 acres) in Mato Grosso state in early 2019, followed by fires in August. Planet link.


Video 5 shows the deforestation of 350 hectares (865 acres) in Amazonas state in early 2019, followed by fires in August. Planet link.


Video 6 shows the deforestation of 4,275 hectares (10,550 acres) in Pará state in early 2019, followed by fires in August. Planet link.


Video 7 shows the large-scale deforestation of 1,450 hectares (3,600 acres) in Amazonas state between April and August, followed by fire in September. Note this is the same area shown as Zoom A in MAAP #109 for the scenario (Deforestation-No Fire) but it just now was burned. Planet link.

*Notes

It is important to emphasize that we documented this deforestation followed by fire in the moist Amazon rainforest areas of Amazonas (39,100 ha), Rondônia (21,100 ha), Pará (48,704), and Mato Grosso (16,420 ha) states.

In MAAP #109 we reported that another concerning source of many fires is the burning of savannah areas around the rainforest, for example in Mato Grosso.

We continue to monitor for the emergence of uncontained forest fires as the dry season continues.

Methodology

We prioritized areas highlighted in orange in the Base Map presented in MAAP #109. These orange areas indicate the overlap of 2019 forest loss alerts (GLAD alerts from the University of Maryland) and 2019 fire alerts (from NASA’s MODIS satellite sensor).

For the major orange areas in Rondônia, Amazonas, Mato Grosso, Acre, and Pará, we conducted a visual analysis using the satellite company Planet’s online portal, which includes an extensive archive of Planet, RapidEye, Sentinel-2, and Landsat data. Using the archive, we identified areas that we visually confirmed a) were deforested in 2019 and b) were later burned in 2019 between July and September. We then used the area measure tool to estimate the size of these areas, which ranged from large plantations ( ~1,000 hectares) to many smaller areas scattered across the focal landscape.

The data is updated  through mid September 2019.

The Base Map in the Annex indicates the location of the areas featured in the timelapse zooms.

Annex: Base Map

The numbers (1-7) correspond to the location of the areas in the videos above.

Base Map. 2019 deforestation and fire hotspots in the Brazilian Amazon. Data: UMD/GLAD, NASA (MODIS), PRODES

Coordinates:
Video 1. Mato Grosso (11.64° S, 54.77° W)
Video 2. Amazonas (9.07° S, 67.54° W)
Video 3. Rondônia (8.61° S, 63.01° W)
Video 4. Mato Grosso (9.91° S, 60.33° W)
Video 5. Amazonas (6.60° S, 60.10° W)
Video 6. Pará (5.87° S, 53.55° W)
Video 7. Amazonas (8.94° S, 65.91° W)

Acknowledgements

We thank T. Souto (ACA) and A. Folhadella (ACA) for helpful comments to earlier versions of this report.

This work was supported by the following major funders: MacArthur Foundation, International Conservation Fund of Canada (ICFC), Metabolic Studio, and Global Forest Watch Small Grants Fund (WRI).

Citation

Finer M, Mamani N (2019) MAAP #110: Major Finding – Many Brazilian Amazon Fires follow 2019 Deforestation. MAAP: 110.

MAAP #109: Fires and Deforestation in the Brazilian Amazon, 2019

Base Map. 2019 deforestation and fire hotspots in the Brazilian Amazon. Data: UMD/GLAD, NASA (MODIS), PRODES

The fires in the Brazilian Amazon have been the subject of intense global attention over the past month.

As part of our ongoing coverage, we go a step further and analyze the relationship between fire and deforestation in 2019.

First, we present the first known Base Map showing both 2019 deforestation and fire hotspots, and, importantly, the areas of overlap. The letters correspond to Zooms below.

Second, we present a series of 16 high-resolution timelapse videos (Zooms A-K), courtesy of the satellite company Planet. They show five scenarios that we have documented thus far in 2019:

  1. Deforestation (No Fire)
  2. Deforestation (Followed by Fire)
  3. Agriculture Fire
  4. Savanna Fire
  5. Forest Fire

The key finding is that Deforestation (Followed by Fire) is critically important to understandng this year’s fire season (see Zooms B-E).

We documented numerous cases of 2019 deforestation events followed by intense fires, covering at least 52,500 hectares (130,000 acres) and counting. That is equivalent to 72,000 soccer fields.

The other common scenario is Agriculture Fire in areas cleared prior to 2019, but close to surrounding forest (see Zooms F and G).

We are also now seeing more examples of Savanna Fire in grassland areas among the rainforest. These fires can be large — we show a 24,000 hectare burn (60,000 acres) in Kayapó indigenous territory (see Zoom H).

We did not observe major Forest Fires in the moist Brazilian Amazon during August, but we did document such fires in early March in Roraima state. As the dry season continues into September and October, however, forest fires become a greater risk.

1. Deforestation (No Fire)

Zoom A shows the large-scale deforestation of 1,450 hectares (3,600 acres) in Amazonas state between April and August 2019. The deforestation seems to be for agricultural purposes and shows no signs of fire.

Zoom A. Deforestation (no Fire). Data: Planet, ESA.

2. Deforestation (Followed by Fire)

The key finding of this analysis was the widespread scenario of major deforestation events followed by intense fires. This (and not Forest Fire) likely explains why many fires were quite smoky. Below we show four examples from the Amazonian states of Rondônia (Zooms B and C), Amazonas (Zoom D), and Pará (Zoom E). In these four examples, we directly measured 8,500 hectares (21,000 acres) that were deforested and then burned in 2019.

Zoom B. Deforestation (Followed by Fire) in Rondônia. Data: Planet, ESA.

Zoom C. Deforestation (Followed by Fire) in Rondônia. Data: Planet, ESA.

Zoom D. Deforestation (Followed by Fire) in Amazonas. Data: Planet, ESA.

Zoom E. Deforestation (Followed by Fire) in Pará. Data: Planet, ESA.

3. Agriculture Fire

Zooms F and G show the other widespread scenario of fires clearing agriculture areas. In most cases, the fires seem contained to the agriculture area, but we have found examples of burning surrounding forest (but not turning into runaway forest fires). As the dry season continues, however, there is an elevated risk of agricultural fires escaping into the surrounding forest and causing larger fires.

Zoom F. Agriculture fire. Data: Planet, ESA.

Zoom G. Agriculture fire. Data: Planet, ESA.

4. Savanna Fire

We have recently been detecting fires burning through drier ecosystems, such as savannas, located in pockets among the moist rainforest. Zooms H and I show savanna fires in Kayapó and Munduruku indigenous territories, respectively. These savanna fires can burn large areas, for example more than 24,000 hectares (60,000 acres) in Kayapó territory , and 700 hectares  (1,700 acres) in Munduruku territory.

Zoom H. Savanna fire in Kayapó indigenous territory. Data: Planet, ESA.

Zoom I. Savanna fire in Munduruku indigenous territory. Data: Planet, ESA.

5. Forest Fire

During August we have not documented large forest fires in the moist forests of the western Brazilian Amazon, our main focal area. Forest fires may be more common in the eastern Brazilian Amazon, especially as we get deeper into the burning season. For example, Zoom J shows some recent fires in the ridges of Kayapó indigenous territory that have burned around 930 hectares (2,300 acres).

Zoom J. Forest fire in the ridges of Kayapó indigenous territory. Data: Planet, ESA.

It is important to note that we have not yet documented any large, runaway fires through the moist forests of the Brazilian Amazon that seem to be the media and public perception of the situation. The large fires we have seen are in the dry and scrub forests of the Brazilian and Bolivian Amazon (see MAAP #108). Interestingly however, there were major forest fires earlier in the year (early March) in northern Brazil (Roraima state). Zoom I shows an example of these fires near Yanomami indigenous territory.

Zoom K. Forest fire in early March 2019 in Roraima state. Data: Planet, ESA.

Methods

We created two “hotspots” layers, one for deforestation and the other for fires, by conducting a kernel density analysis. This type of analysis calculates the magnitude per unit area of a particular phenomenon, in this case forest loss alerts (proxy for deforestation) and temperature anomaly/fire alerts.

We used GLAD alert forest loss data (30 meter resolution) from the University of Maryland and available on Global Forest Watch. Data thru August 2019.

We used NASA’s Fire Information for Resource Management System (FIRMS) MODIS-based fire alert data (1 km resolution). Data thru August 2019.

We conducted the analysis using the Kernel Density tool from Spatial Analyst Tool Box of ArcGIS, using the following parameters:

Search Radius: 15000 layer units (meters)
Kernel Density Function: Quartic kernel function
Cell Size in the map: 200 x 200 meters (4 hectares)
Everything else was left to the default setting.

For the Base Map, we used the following concentration percentages: Medium: 10%-25%; High: 26%-50%; Very High: >50%. We then combined all three categories into one color (yellow for deforestation and red for fire). Orange indicates areas where both layers overlap. As background layer, we also included pre-2019 deforestation data from Brazil’s PRODES system.

Acknowledgements

We thank G. Hyman (SIG), A. Flores (NASA-SERVIR), and A. Folhadella (ACA) for helpful comments to earlier versions of this report.

This work was supported by the following major funders: MacArthur Foundation, International Conservation Fund of Canada (ICFC), Metabolic Studio, and Global Forest Watch Small Grants Fund (WRI).

Citation

Finer M, Mamani N (2019) Fires and Deforestation in the Brazilian Amazon, 2019. MAAP: 109.