MAAP #220: Carbon across the Amazon (part 3): Key Cases of Carbon Loss & Gain

Graph 1. The Amazon biome functions as a narrow carbon sink from 2013 to 2022. Data: Planet, ACA/MAAP.

In part 1 of this series (MAAP #215), we introduced a critical new dataset (Planet’s Forest Carbon Diligence) with wall-to-wall estimates for aboveground carbon at an unprecedented 30-meter resolution between 2013 and 2022. This data uniquely merges machine learning, satellite imagery, airborne lasers, and a global biomass dataset from GEDI, a NASA mission.

In part 2 (MAAP #217), we highlighted which parts of the Amazon are currently home to the highest (peak) aboveground carbon levels and the importance of protecting these high-integrity forests (see Annex 1).

Here, in part 3, we focus on aboveground carbon loss and gain across the Amazon over the 10 years for which we have data (2013-22; see Base Map below).

The Amazon loses carbon to the atmosphere due to deforestation, logging, human-caused fires, and natural disturbances, while it gains carbon from forest regeneration and old-growth forests continuing to sequester atmospheric carbon.4

Overall, we find that the Amazon still narrowly functions as a carbon sink (meaning the carbon gain is greater than the loss) during this period, gaining 64.7 million metric tons of aboveground carbon between 2013 and 2022 (see Graph 1).

This finding underscores the importance of both primary and secondary forests in countering widespread deforestation. Moreover, it highlights the critical potential of primary forests to continue accumulating carbon if left undisturbed.

This gain, however, is quite small relative to the total 56.8 billion metric tons of aboveground carbon contained in the Amazon biome (that is, a gain of just +0.1%), reinforcing concerns that the Amazon could flip to a carbon source in the coming years (with carbon loss becoming greater than its gain) due to increasing deforestation, degradation, and fires.1  See Annex 2 for more details, including how the Amazon became a carbon sink following the 2015 drought, but since rebounded.

The countries with the largest carbon gain are 1) Brazil, 2) Colombia, 3) Suriname, 4) Guyana, and 5) French Guiana. In contrast, the countries with the greatest carbon loss are 1) Bolivia, 2) Venezuela, 3) Peru, and 4) Ecuador.

Zooming in to the site level yields additional insights. For example, we can now estimate the carbon loss from major deforestation events across the Amazon from 2013 to 2022. On the flip side, we can also calculate the carbon gain from both secondary and primary forests.

Areas with carbon gain in intact areas indicate excellent candidates for the High Integrity Forest (HIFOR) initiative, a new financing instrument uniquely focused on maintaining intact tropical forests.2 Importantly, a HIFOR unit represents a hectare of high-integrity tropical forest within a high-integrity landscape that has been “well-conserved” for over a decade.Intact areas with carbon gain between 2013-22 may indicate decadally “well-conserved” areas that can be overlapped with areas of high ecological integrity.

Below, we illustrate these findings with a series of novel maps zooming in on emblematic cases of large carbon loss and gain across the Amazon from 2013 – 2022. These cases include forest loss driven by agriculture, gold mining, and roads, as well as forest gain in remote primary forests.

Base Map – Amazon Carbon Loss & Gain (2013-2022)

The Base Map shows wall-to-wall estimates of aboveground carbon loss and gain across the Amazon between 2013 and 2022.

Carbon loss is indicated by yellow to red, indicating low to high carbon loss. Carbon gain is indicated by light to dark green, indicating low to high carbon gains.

Below, we present a series of notable cases of high carbon loss and gain indicated in Insets A-I.
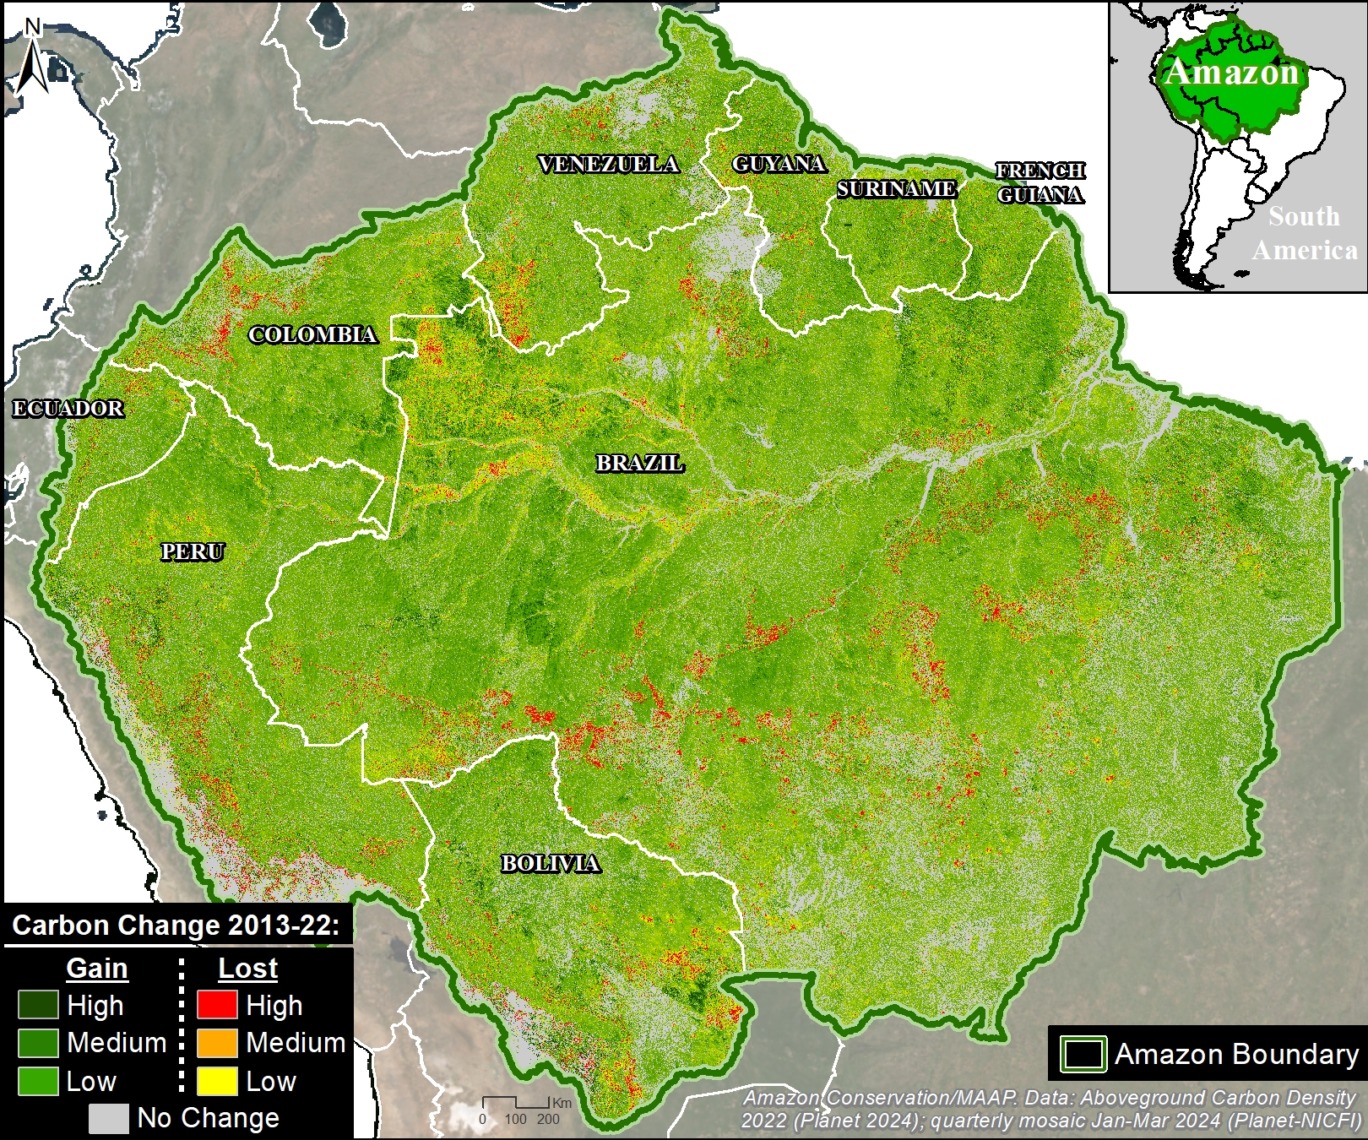
Base Map. Areas of major carbon loss and gain across the Amazon between 2013 and 2022. Source: Amazon Conservation/MAAP, Planet.

Emblematic Cases of Carbon Loss & Gain

Figure 1 highlights emblematic cases of carbon loss (Insets A-F in red) and carbon gain (Insets G-I in green). Below we highlight a series of emblematic cases.
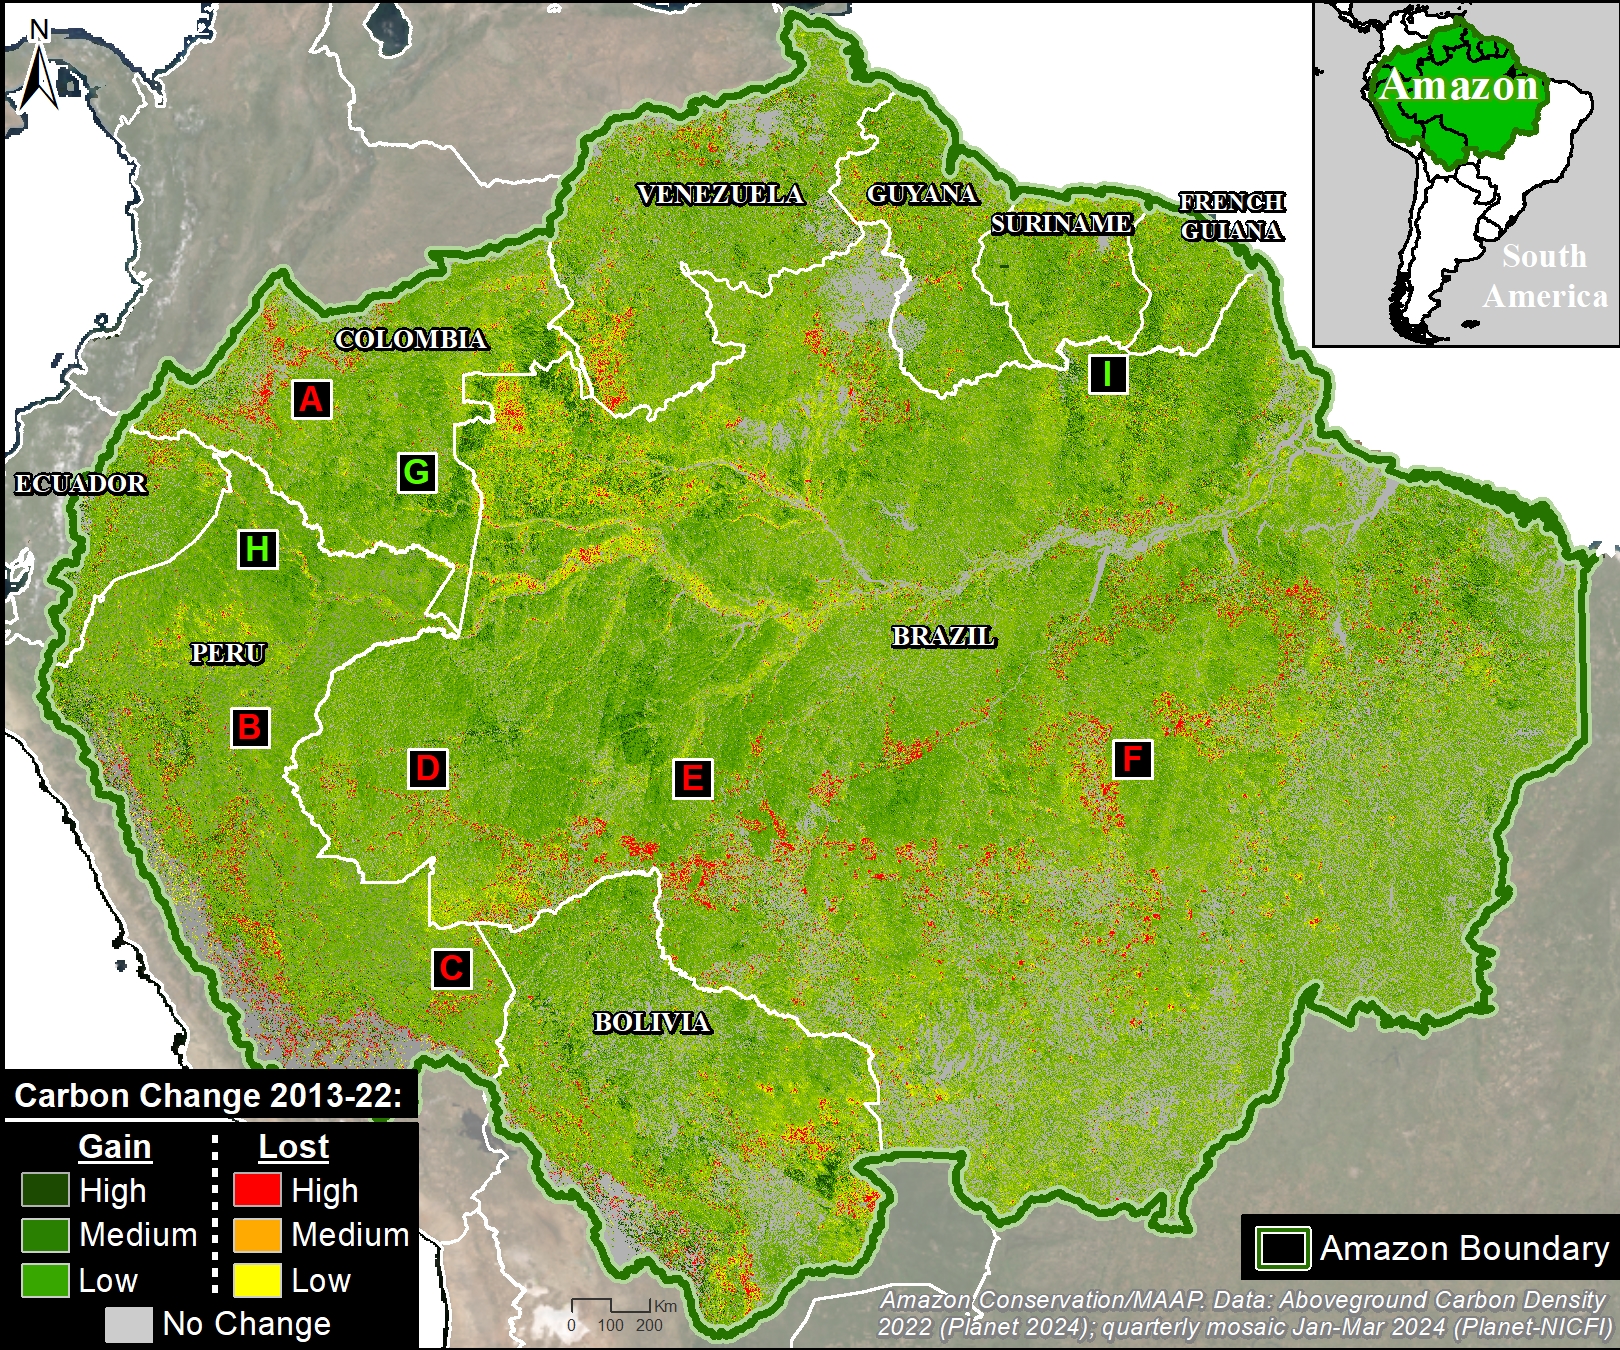
Figure 1. Emblematic cases of carbon loss and gain across the Amazon. Source: Amazon Conservation/MAAP, Planet.

Carbon Loss

We can now estimate the carbon loss from major deforestation events across the Amazon during the past ten years, directly from a single dataset. These cases include forest loss from agriculture, gold mining, and roads. Note that the presented values represent just the carbon loss featured in the selected area.

A. Colombia – Arc of Deforestation
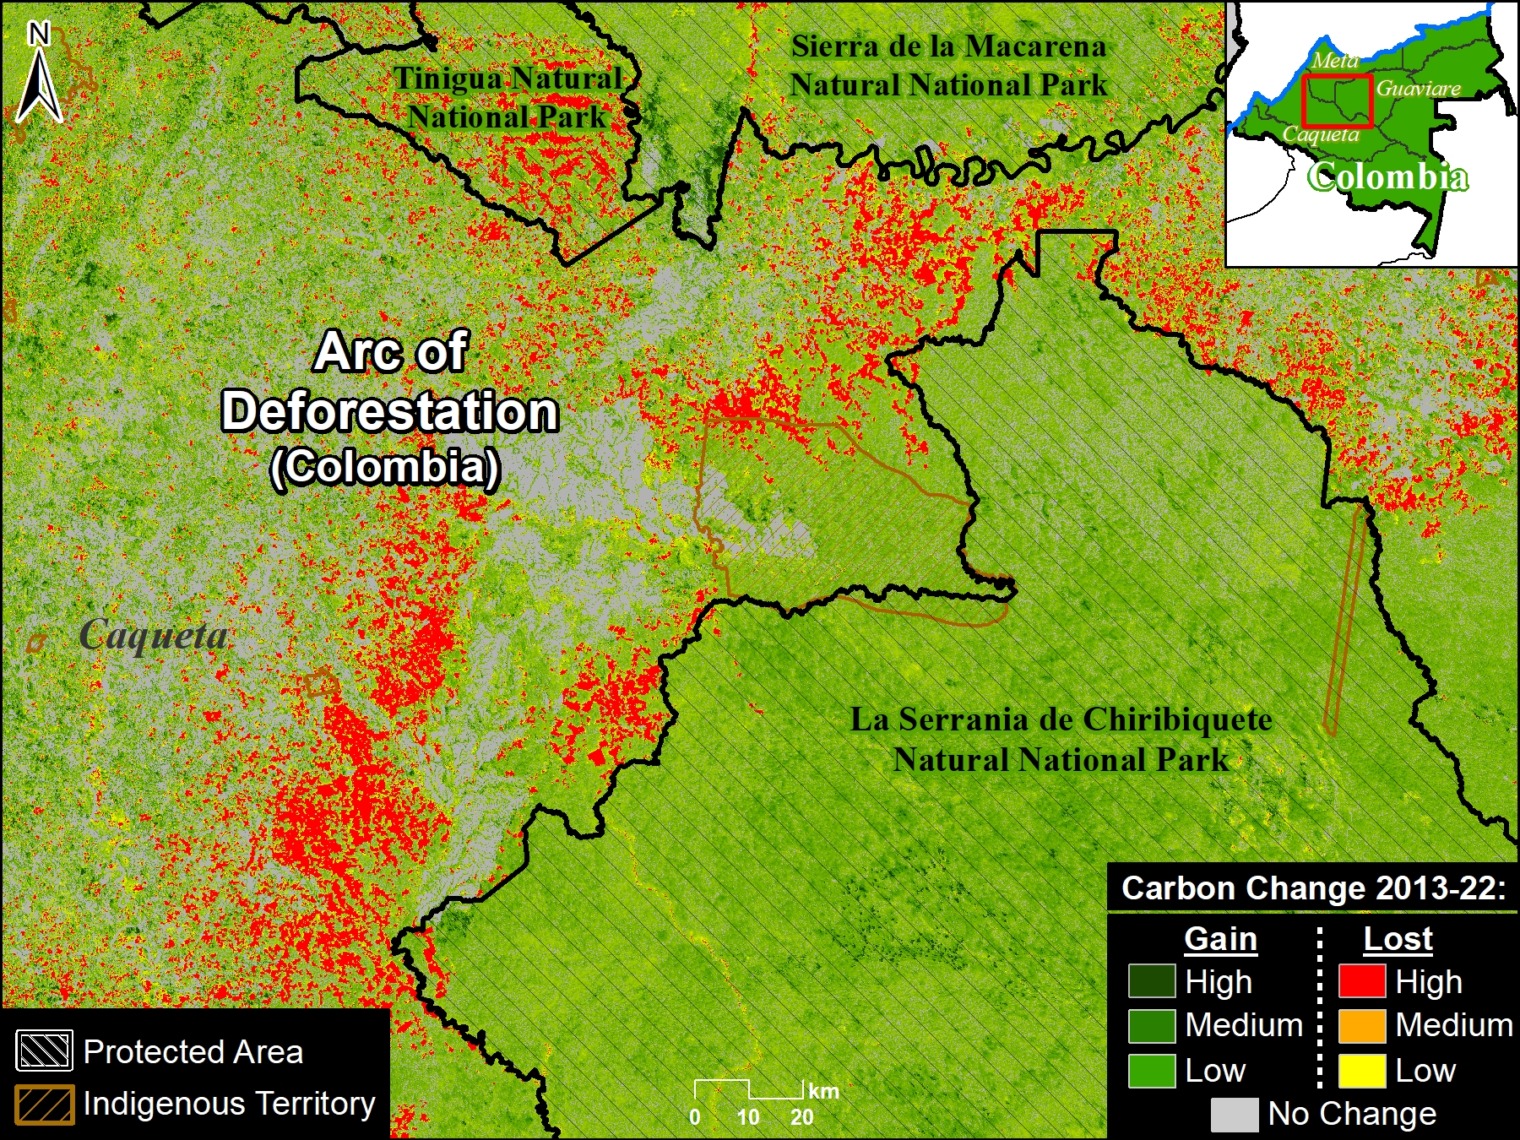
Figure 1A. Carbon loss in the Colombian Amazon’s arc of deforestation. Source: Amazon Conservation/MAAP, Planet.

Figure 1A shows the extensive carbon emissions (39.5 million metric tons) associated with the major deforestation within and surrounding protected areas and Indigenous territories in the Colombian Amazon‘s arc of deforestation.

The carbon loss within the protected areas and Indigenous territories is likely from illegal deforestation.

See MAAP #211 for more details.


B. Peru – Mennonite Colonies
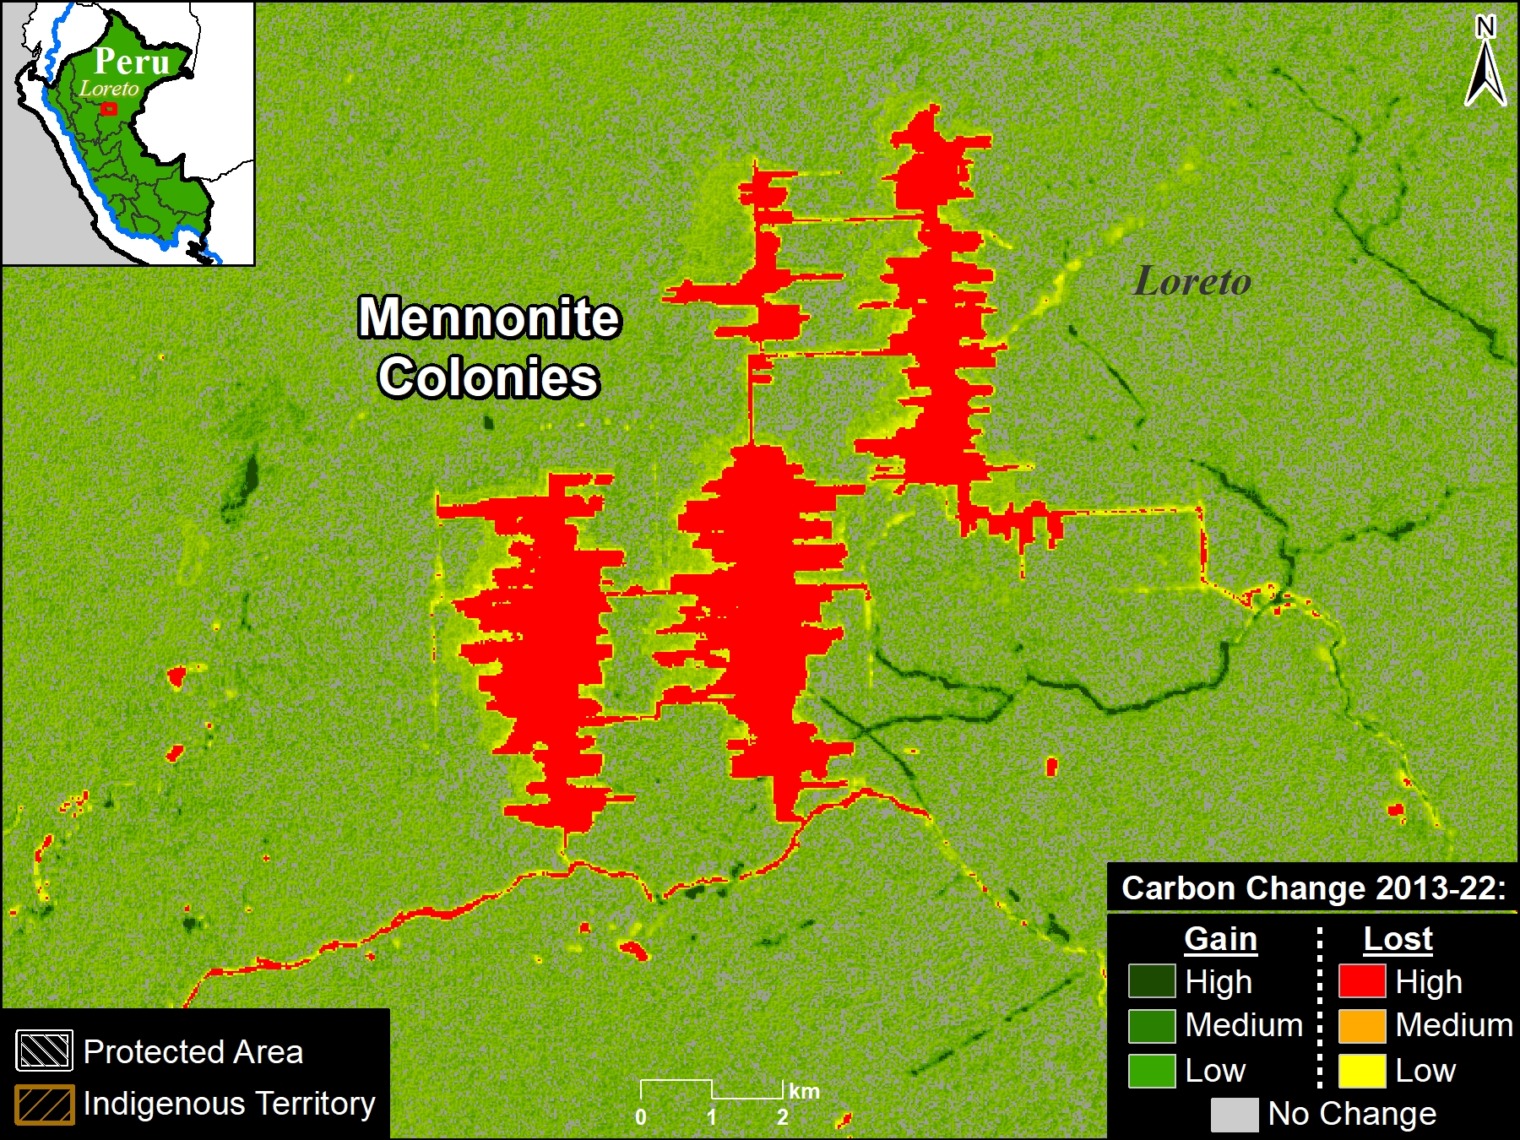
Figure 1B. Carbon loss by new Mennonite colonies in the Peruvian Amazon. Source: Amazon Conservation/MAAP, Planet.

Figure 1B shows the carbon emissions of 224,300 metric tons associated with the recent deforestation carried out by new Mennonite colonies arriving in the central Peruvian Amazon starting in 2017.

See MAAP #188 for more details, including information regarding the legality of  the deforestation causing the carbon loss.


C. Peru – Gold Mining
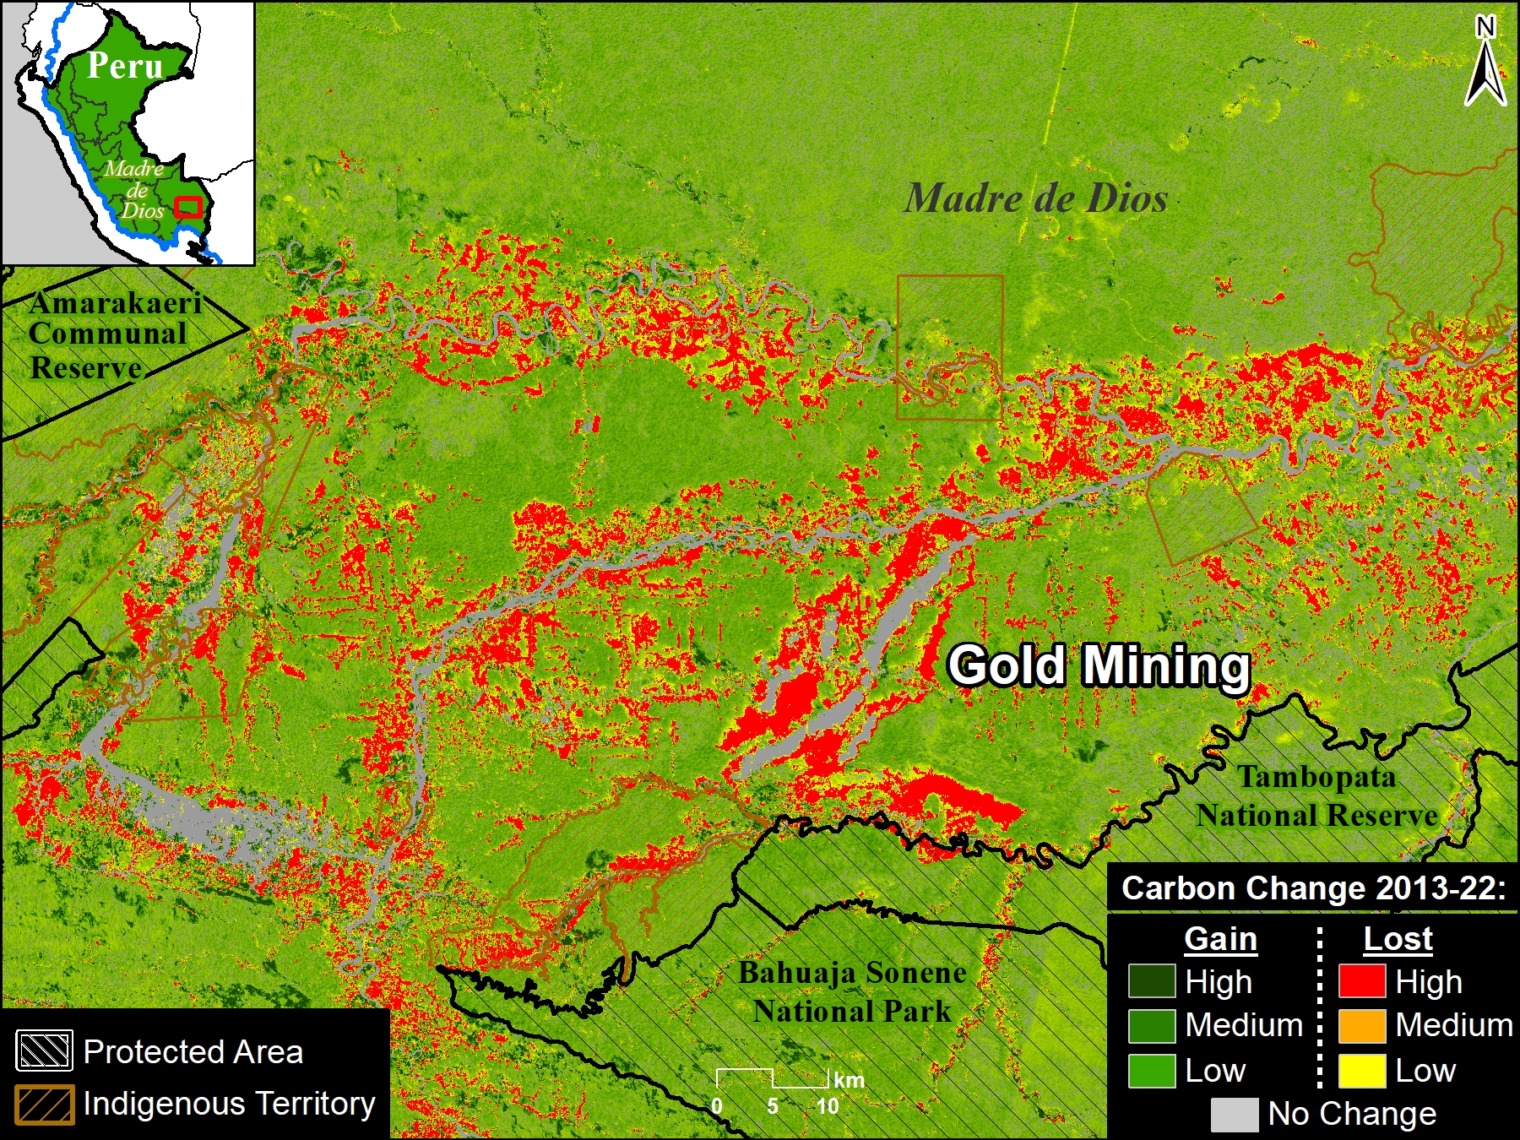
Figure 1C. Carbon loss associated with gold mining deforestation in  southern Peruvian Amazon. Source: ACA/MAAP, Planet.

Figure 1C shows the extensive carbon emissions (11.3 million metric tons) associated with gold mining deforestation in the southern Peruvian Amazon.

Most of the carbon loss within the protected areas (and their buffer zones) and Indigenous territories is likely from illegal deforestation.

See MAAP #208 for more information, including details regarding the legality of the deforestation causing the carbon loss.


D. Brazil – Road BR-364

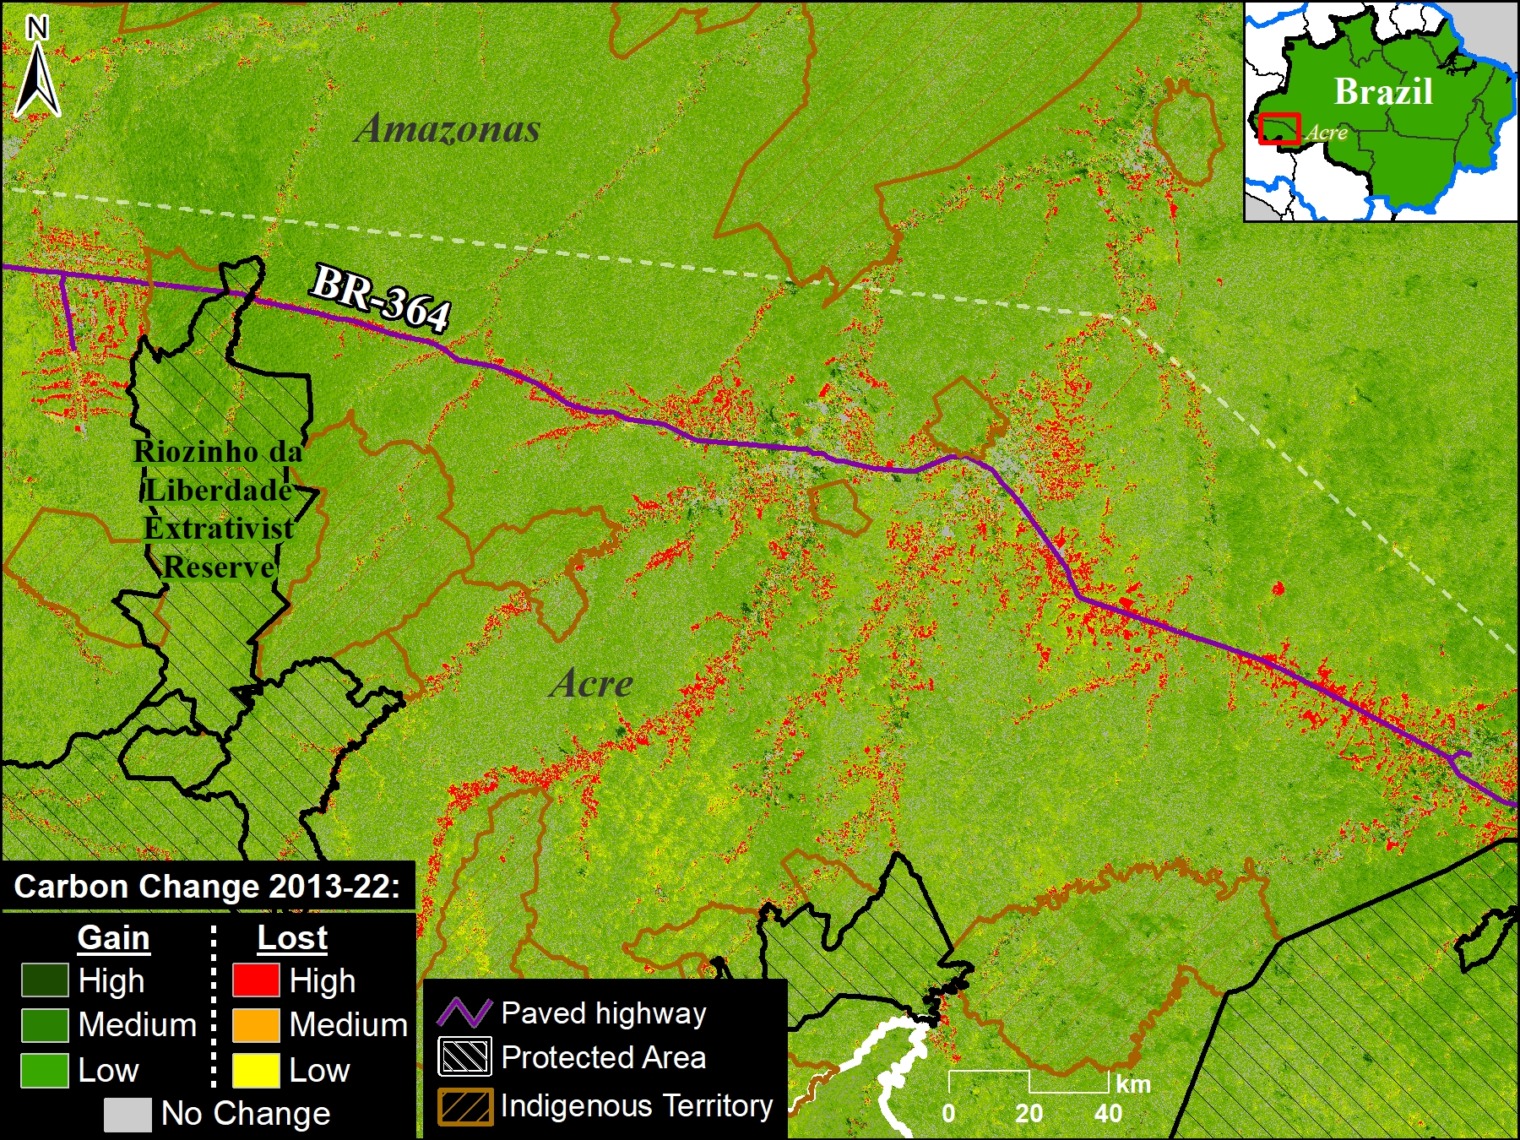
Figure 1D. Carbon loss along BR-364 in the southwest Brazilian Amazon. Source: ACA/MAAP, Planet.

Figure 1D shows the carbon emissions along road BR-364 that crosses the state of Acre in the southwest Brazilian Amazon.

This road was opened in the 1960s and paved in the 1980s.


E. Brazil – Road BR-319
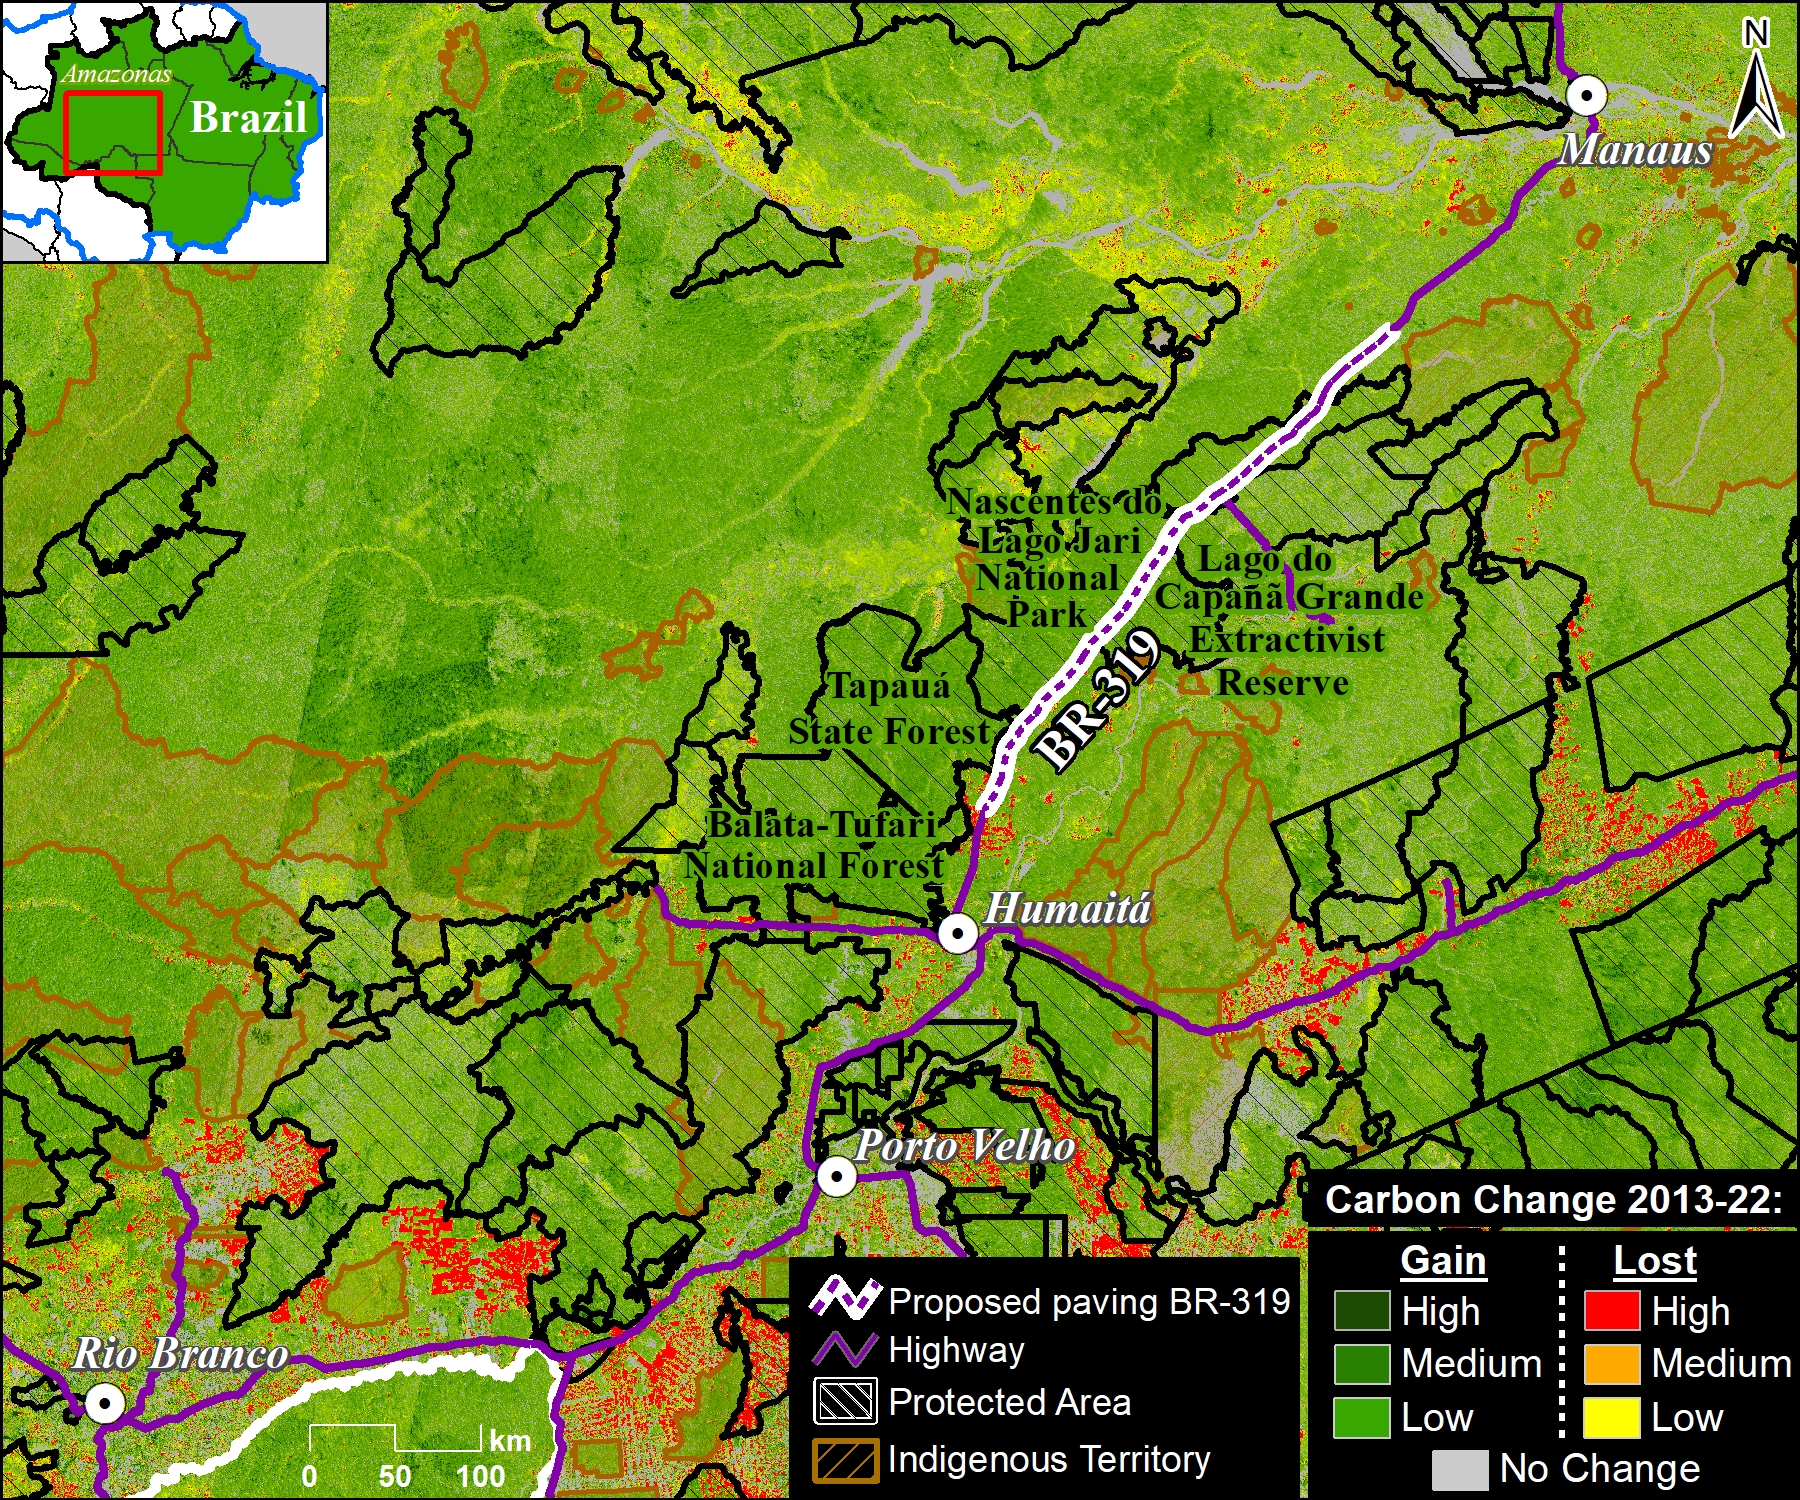
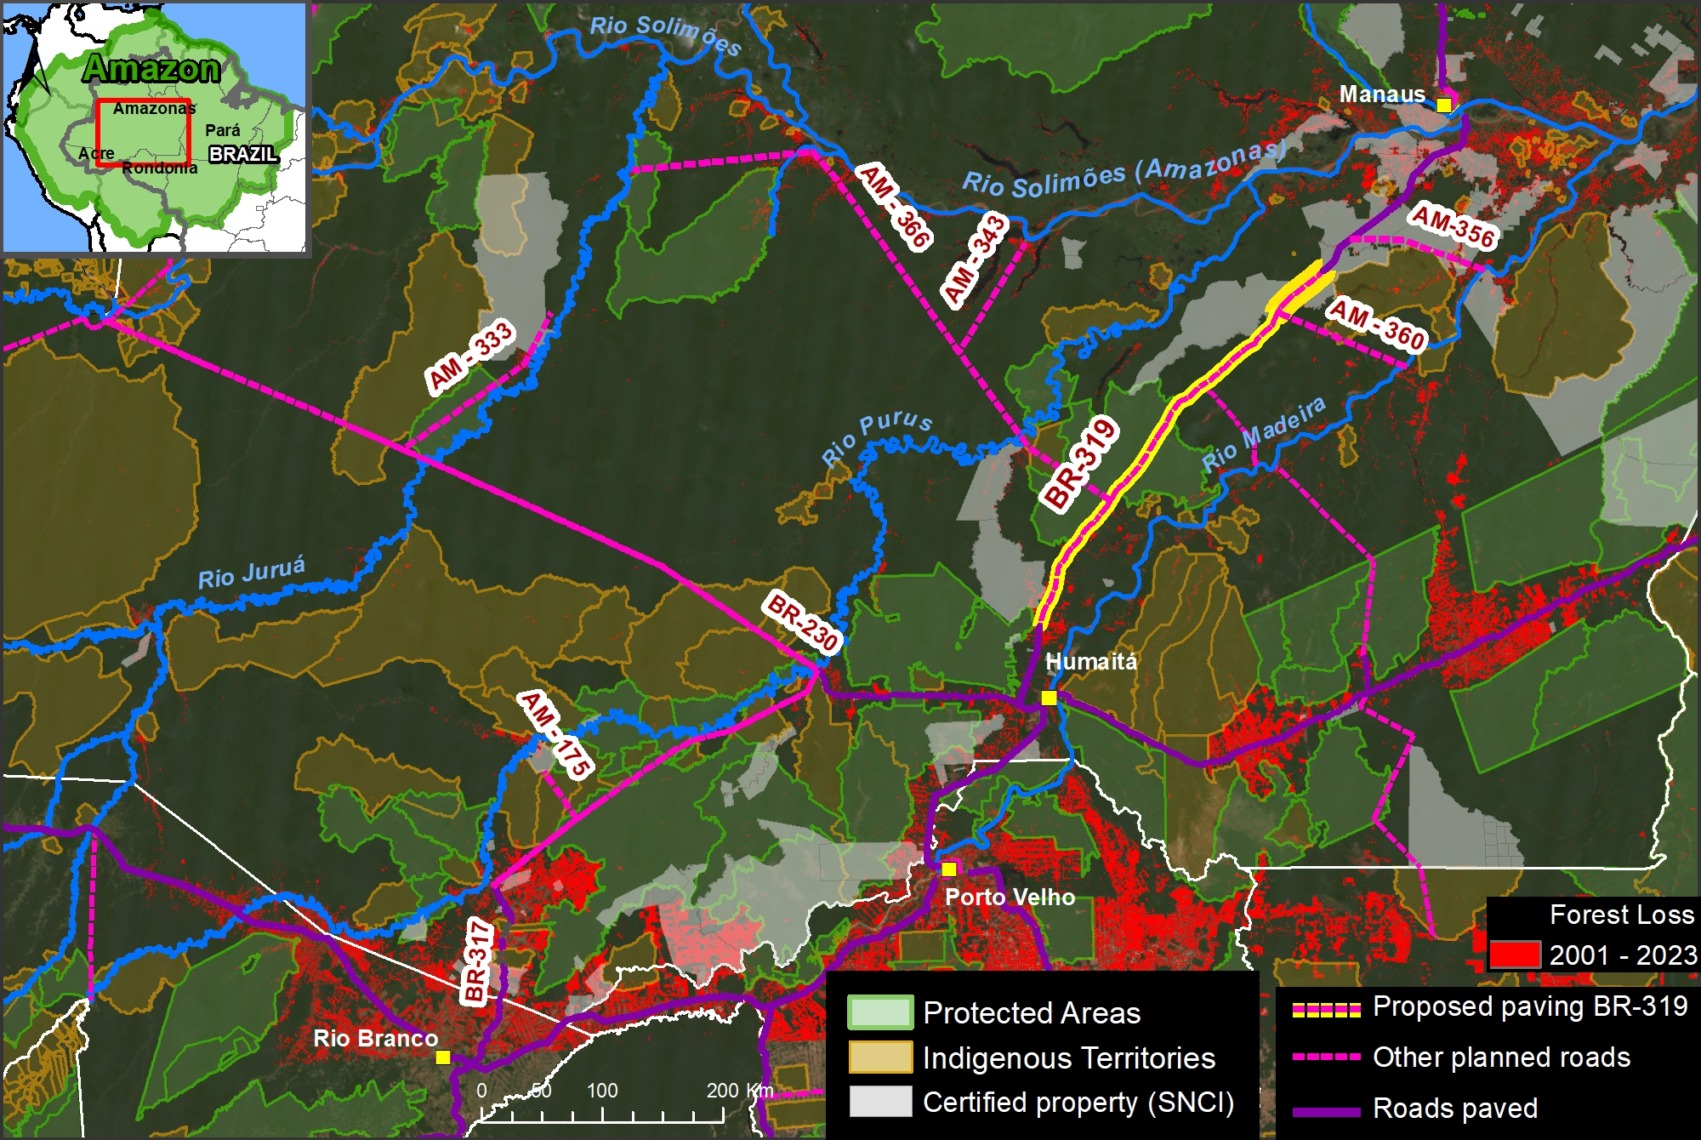
Figure 1E. Carbon loss along paved roads. Source: ACA/MAAP, Planet.

Figure 1E shows a controversial road paving project that would effectively link the arc of deforestation to the south with more intact forests to the north in Amazonas and Roraima states.

Note that the current carbon loss is concentrated along the paved roads.

The paving of road BR-319 has recently caused headlines as President Luiz Inácio Lula da Silva recently authorized the paving of 20 km of the road and plans to bid for an additional 32 km (thus, paving of 52 km in total).

Modeling studies predict extensive new deforestation from this road construction, and thus additional associated carbon loss.


F. Brazil – Road BR-163

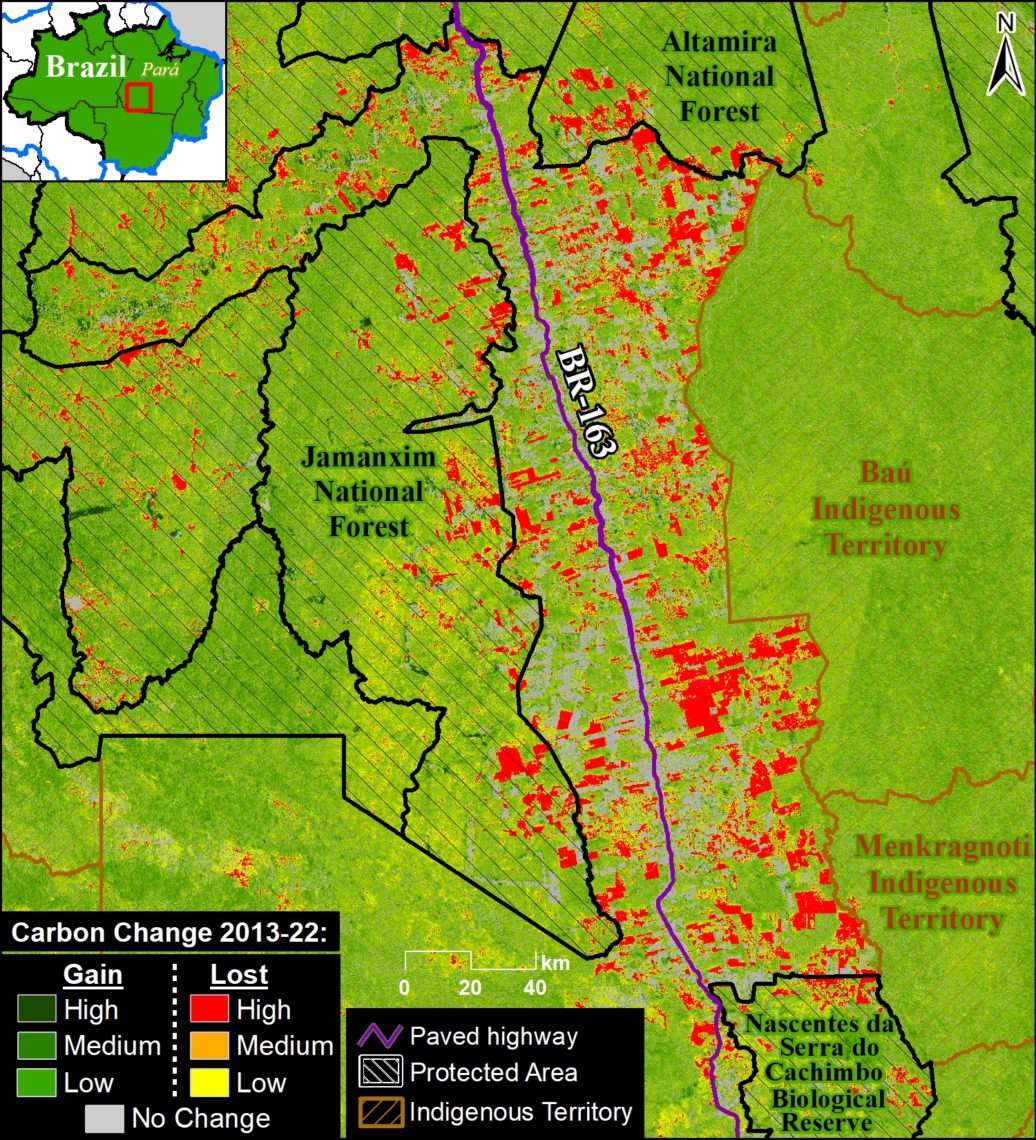
Figure 1F. Carbon loss along BR-163 in the eastern Brazilian Amazon. Source: ACA/MAAP, Planet.

Figure 1F shows the extensive carbon emissions (71.4 million metric tons) along a recently paved stretch of road BR-163 which crosses the state of Pará in the eastern Brazilian Amazon.

Importantly, this stretch of road has been presented as a case study of what may happen along road BR-319 if it is paved.


Carbon Gain

We can also calculate the carbon gain from both secondary and primary forests. These cases include forest gain from remote primary forests that may be good candidates for the HIFOR initiative.
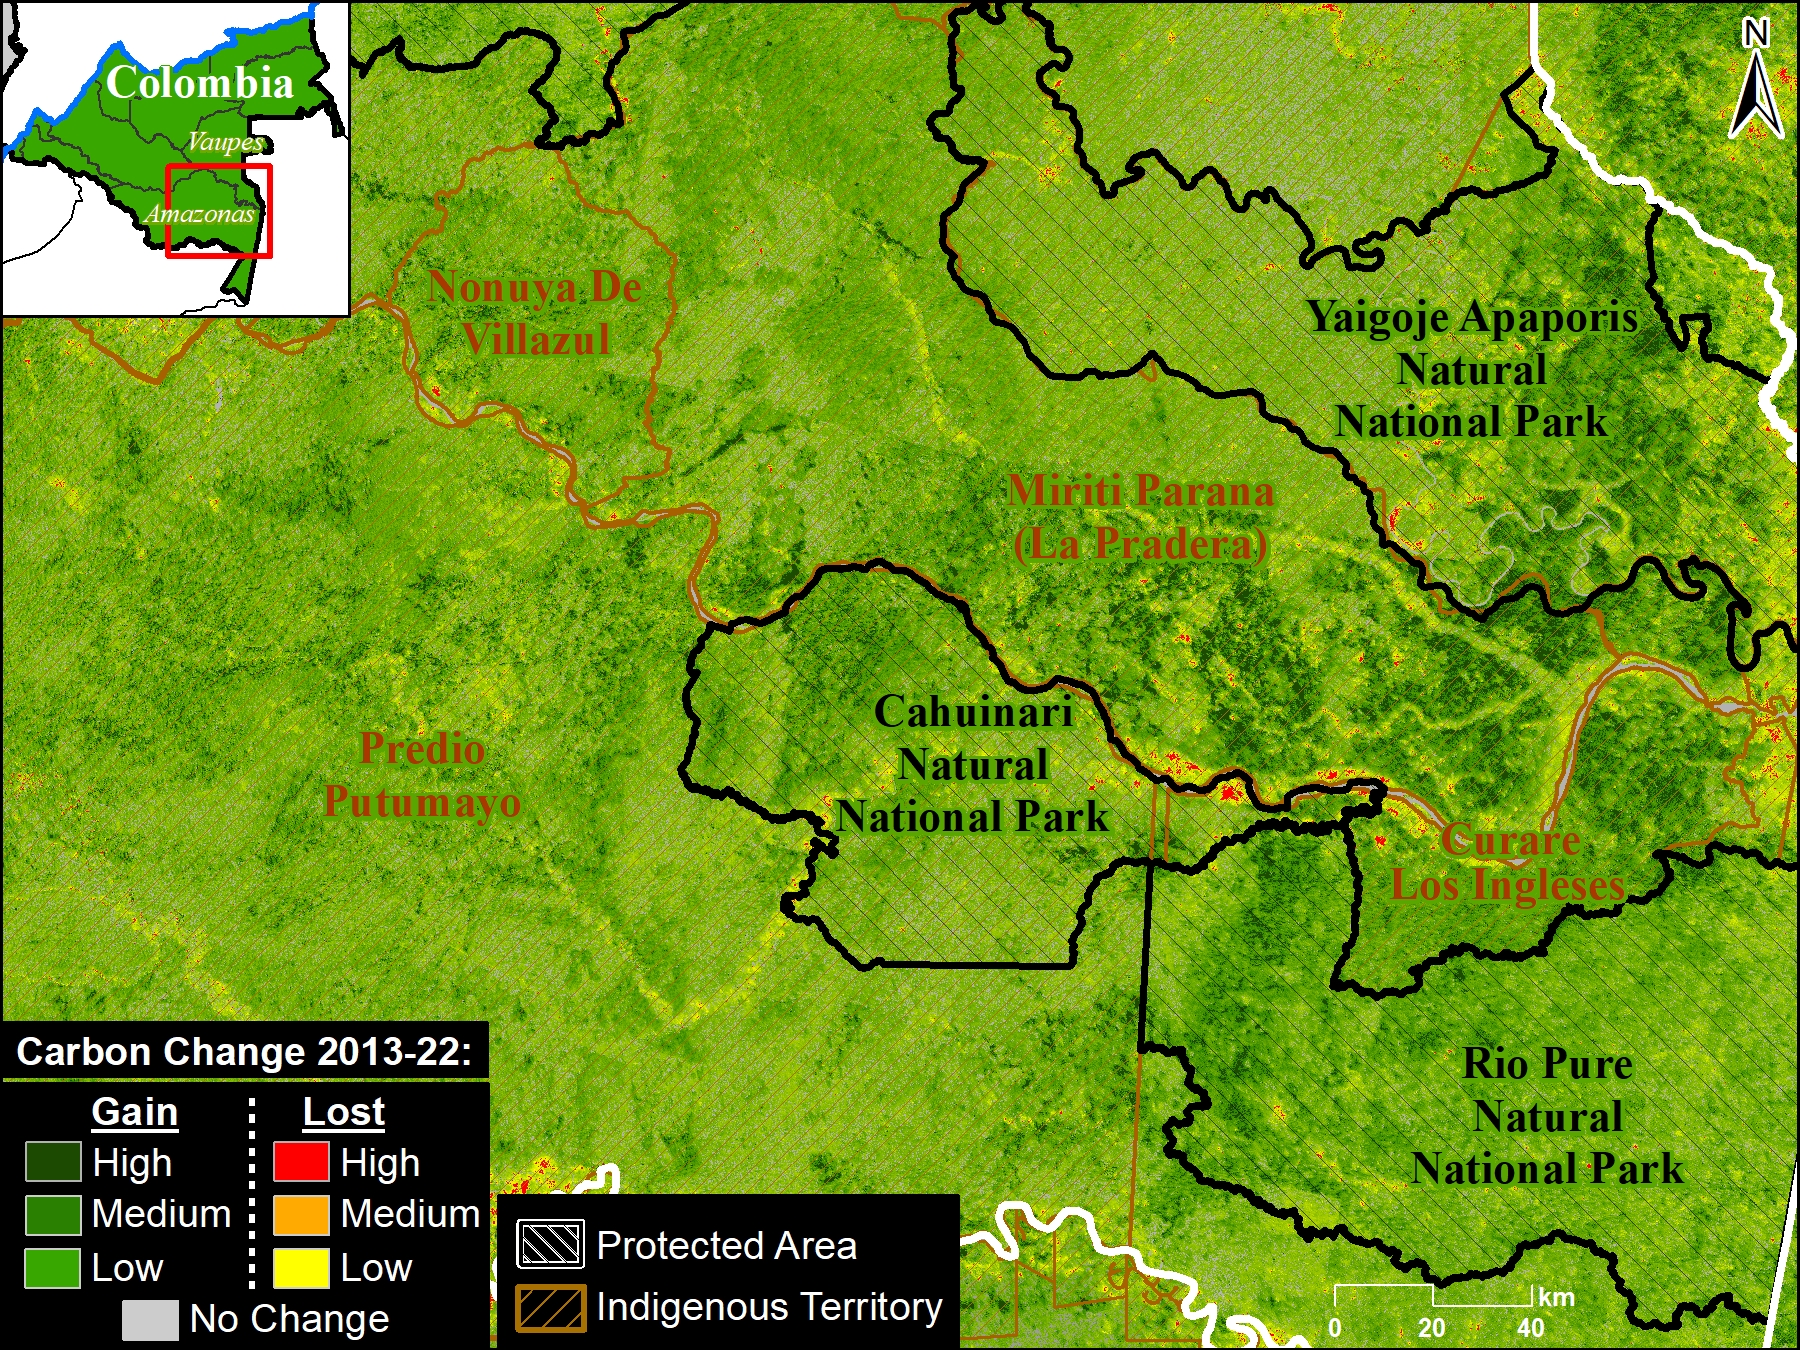
Figure 1G. Carbon gains in the southeast Colombian Amazon. Source: ACA/MAAP, Planet.

G. Southeast Colombia

Figure 1G shows the carbon gain of over 52.5 million metric tons in the remote southeast Colombian Amazon.

This area is anchored by three national parks and several large indigenous territories.
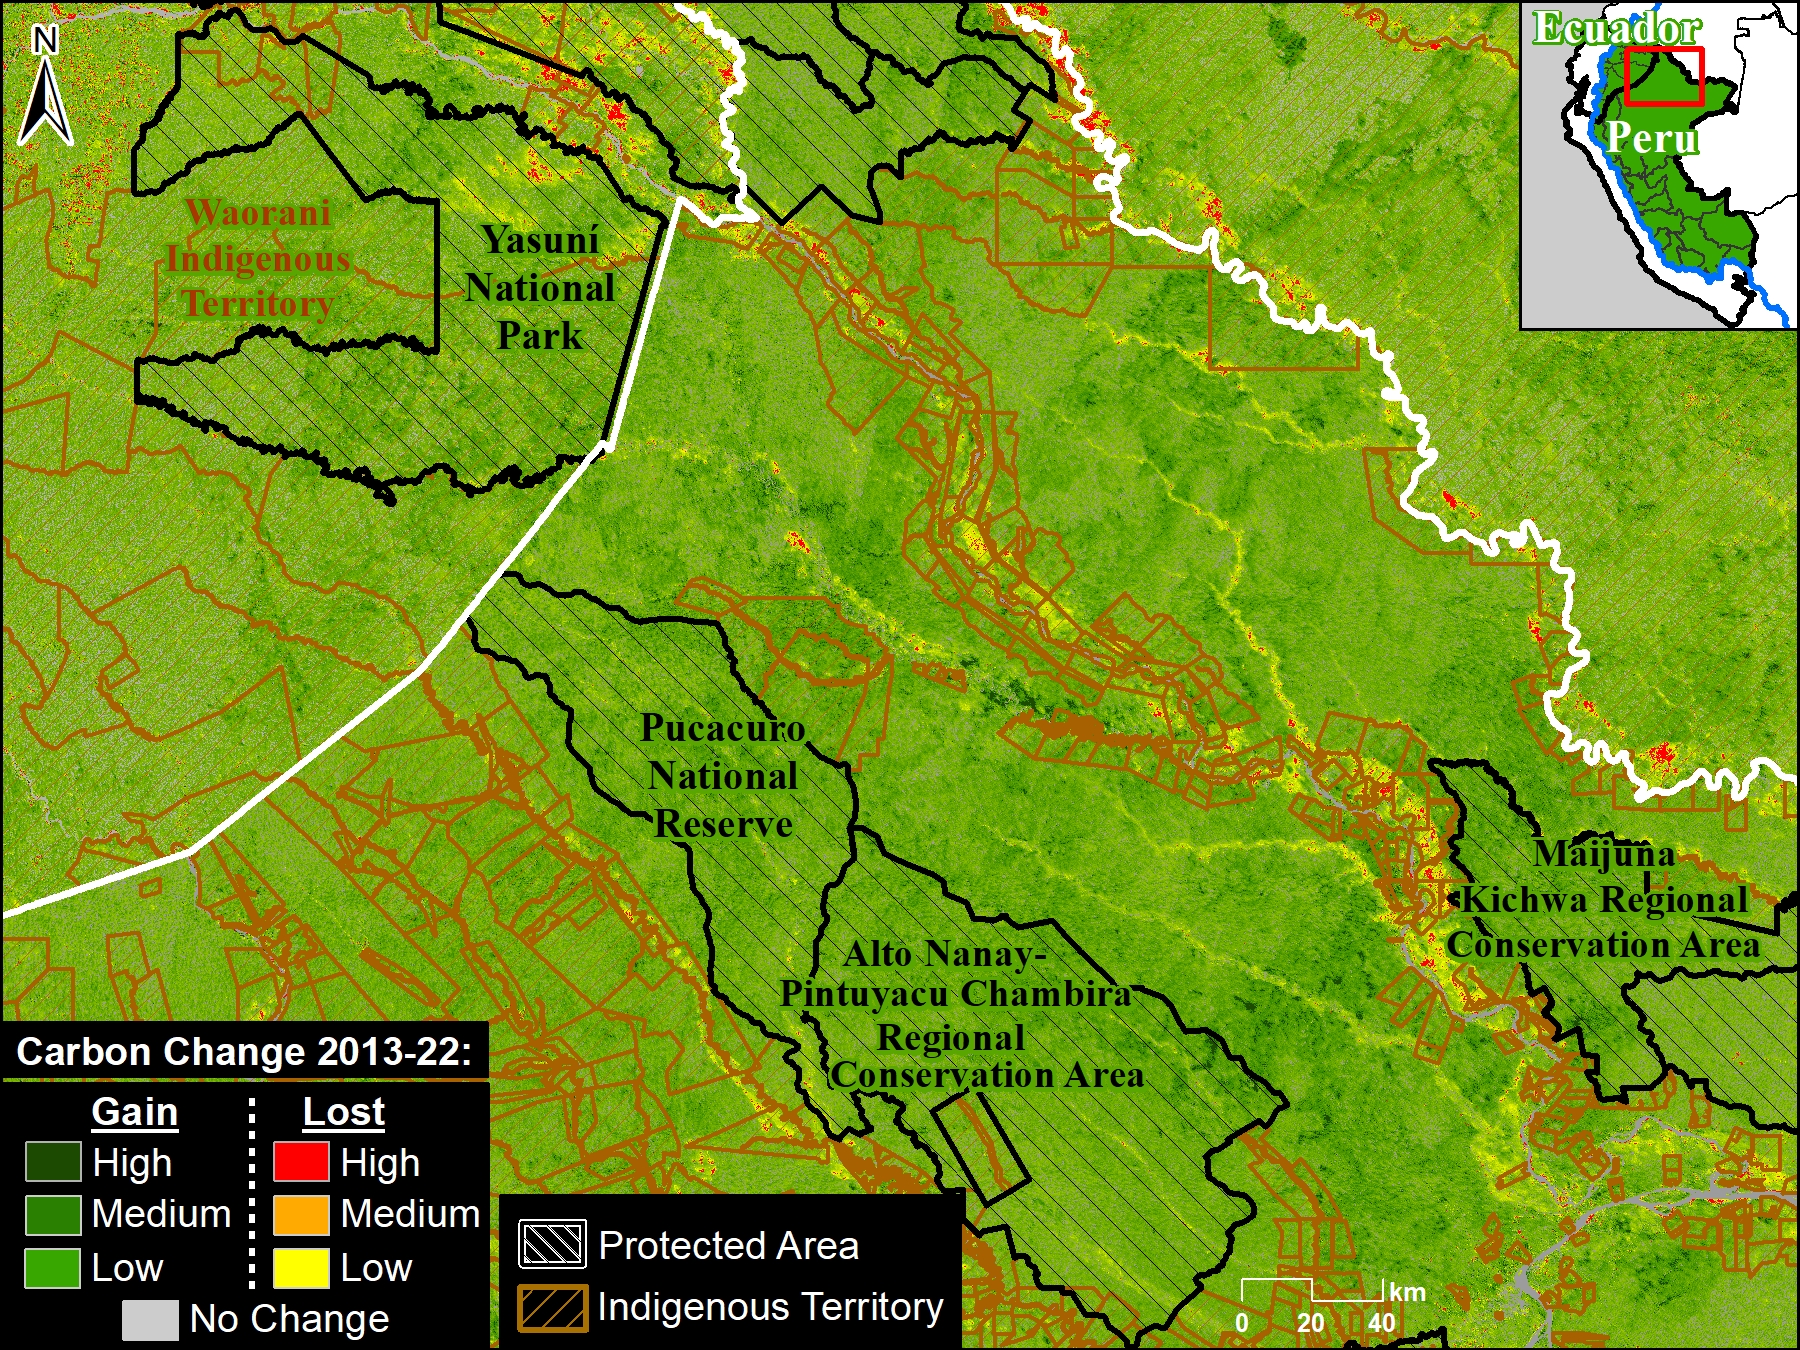


Figure 1H. Carbon gains along the border of eastern Ecuador and northern Peru. Source: ACA/MAAP, Planet.

H. Ecuador – Peru border

Figure 1H shows the carbon gain of nearly 40 million metric tons along the border in eastern Ecuador and northern Peru.

Note this area is anchored by numerous protected areas, including Yasuni National Park in Ecuador and Pucacuro National Reserve in Peru, and Indigenous territories.
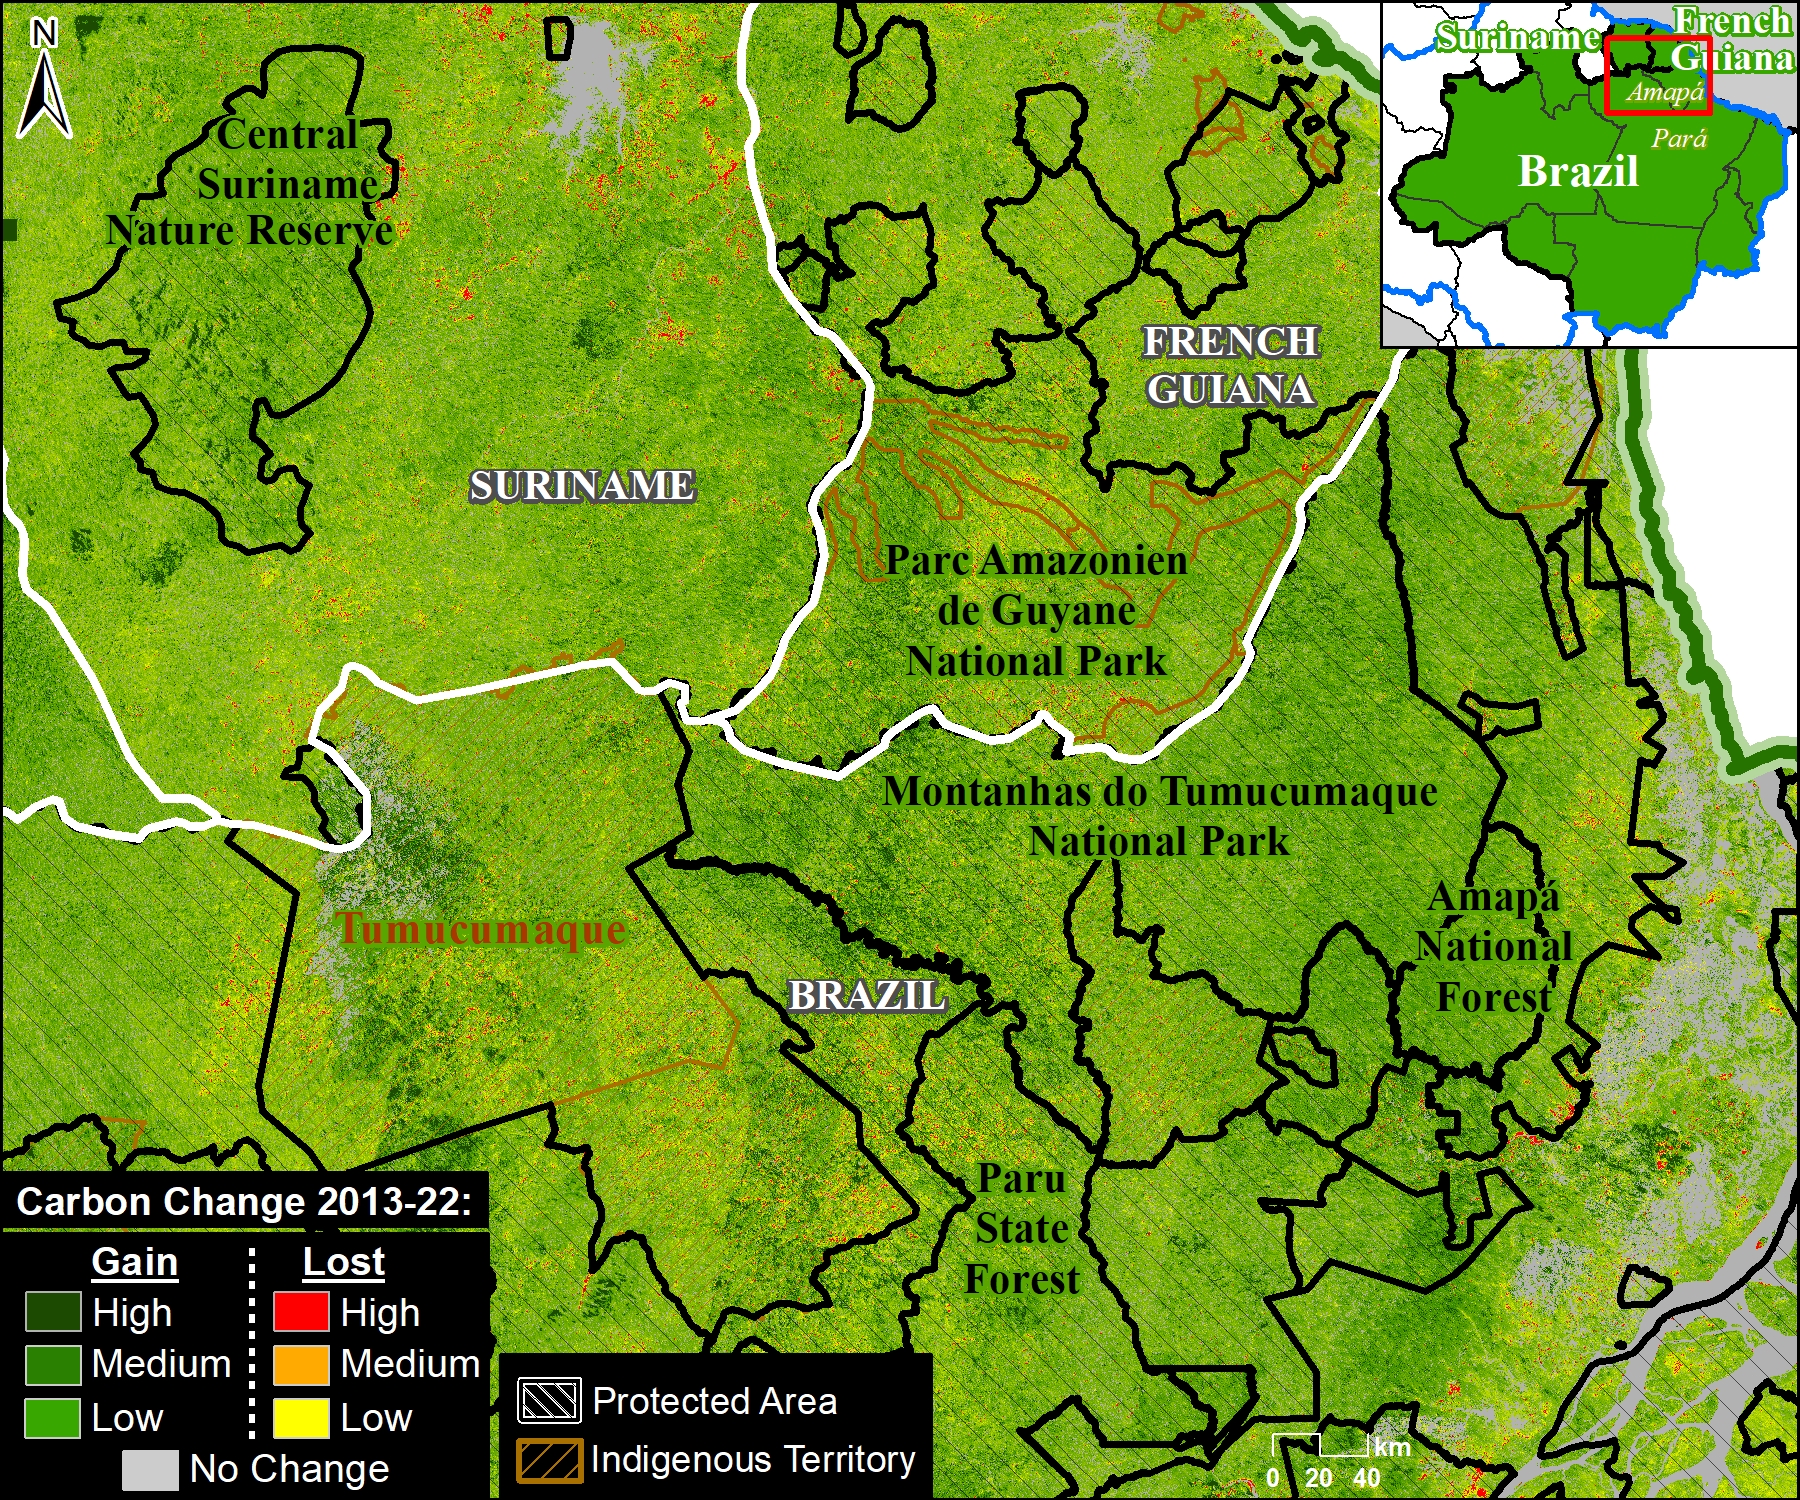


Figure 1I. Carbon gains in the tri-border region of the northeast Amazon. Source: ACA/MAAP, Planet.

I. Northeast Amazon

Figure 1I shows the carbon gain of 164.7 million metric tons in the tri-border region of the northeast Amazon (northern Brazil, French Guiana, and Suriname).

For example, note the carbon gains in Montanhas do Tumucumaque National Park and Tumucumaque Indigenous territory in northeast Brazil.

Also note that this was an Amazonian “peak carbon area,” as described in MAAP #217.


Annex 1
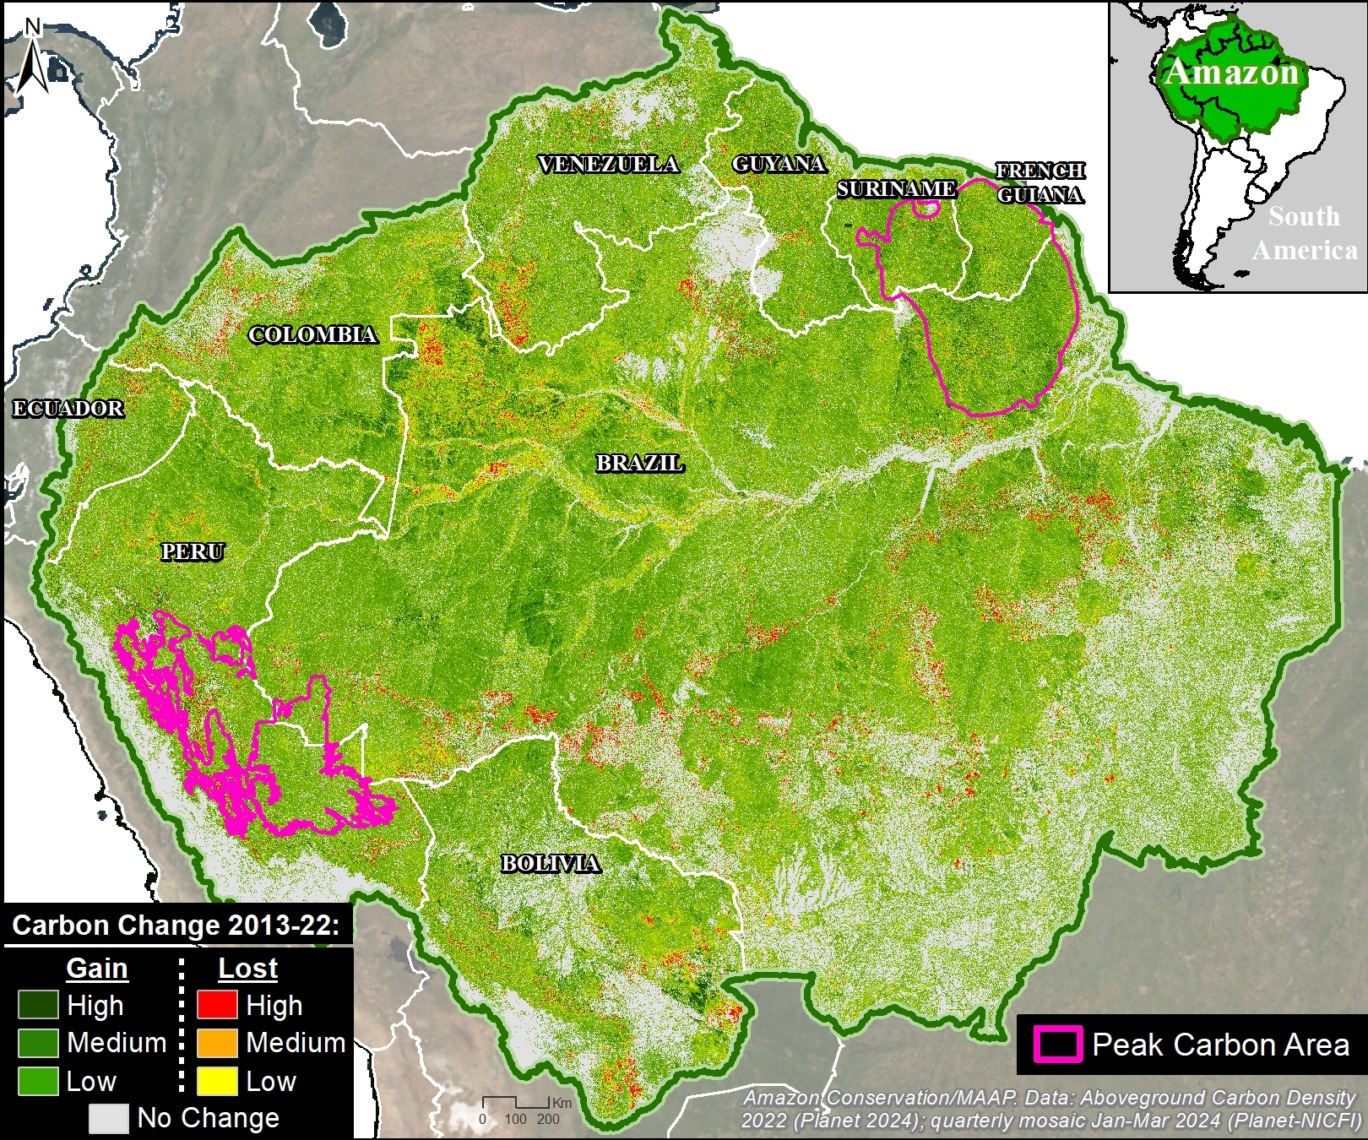
Annex 1. Peak carbon areas in relation to the carbon loss and gain data. Source: Amazon Conservation/MAAP, Planet.

In part 2 of this series (MAAP #217), we highlighted which parts of the Amazon are currently home to the highest (peak) aboveground carbon levels.

Annex 1 shows these peak carbon areas in relation to the carbon loss and gain data presented above.

Note that both peak carbon areas (southeast and northeast Amazon) are largely characterized by carbon gain.


Annex 2
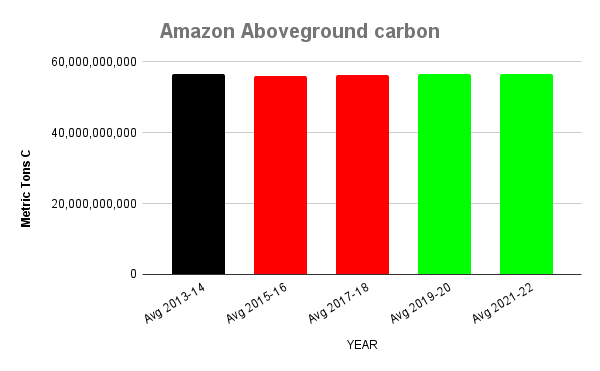
Annex 2. Amazon biome functions as a narrow carbon sink from 2013 to 2022, but became a source in between. Data: Planet, ACA/MAAP.

Annex 2 shows all ten years of aboveground carbon data grouped by two-year intervals (thus, it is an extension of Graph 1 above, adding data for the intermediate years).

In this context, black indicates our baseline of 2013-14, red indicates a decrease from the baseline (carbon source), and green indicates an increase from the baseline (carbon sink).

Importantly, there was a decrease in aboveground carbon from 2015-18, which likely reflects the severe droughts of 2015 and 2016 and subsequent severe fire seasons of 2016 and 2017. Aboveground carbon rebounded from 2019-22.

This trend supports the hypothesis that the Amazon biome is teetering on being an aboveground carbon source vs sink.

It also raises the possibility that the Amazon may return to being a carbon source following the intense drought and fires of 2024.

.

.

Notes

1 In part 1 of this series (MAAP #215), we found the Amazon “is still functioning as a critical carbon sink”. As pointed out in a companion blog by Planet, however, the net carbon sink of +64 million metric tons is quite small relative to the total estimate of 56.8 billion metric tons of aboveground carbon across the Amazon. That is a net positive change of just +0.1%. As the blog notes, that’s a “very small buffer” and there’s “reason to worry that the biome could flip from sink to source with ongoing deforestation.”

2 High Integrity Forest (HIFOR) units are a new, non-offset asset that recognizes and rewards the essential climate services and biodiversity conservation that intact tropical forests provide, including ongoing net removal of CO2 from the atmosphere. HIFOR rewards the climate services that intact tropical forests provide, including ongoing net carbon removal from the atmosphere, and complements existing instruments to reduce emissions from deforestation and degradation (REDD+) by focusing on tropical forests that are largely undegraded. A HIFOR unit represents a hectare of well-conserved, high-integrity tropical forest where ‘well-conserved’ means that high ecological integrity is maintained over a decade of monitoring as part of equitable, effective management of a site and ‘high ecological integrity’ means a score of >9.6 on the Forest Landscape Integrity Index. For more information see https://www.wcs.org/our-work/climate-change/forests-and-climate-change/hifor

3 Two additional important references regarding HIFOR methodology and application:

High Integrity Forest Investment Initiative, Methodology for HIFOR units, April 2024. Downloaded from https://www.wcs.org/our-work/climate-change/forests-and-climate-change/hifor

Forest Landscape Integrity Index metric used by HIFOR: www.forestintegrity.com

4 In Planet’s Forest Carbon Diligence product, carbon loss and gain are detected via changes in canopy cover and canopy height during the given periods (in this case, 2013 vs 2022).

Acknowledgments

Through a generous sharing agreement with the satellite company Planet, we have been granted access to this data across the entire Amazon biome for the analysis presented in this series.

We also thank D. Zarin (WCS) for helpful comments regarding the implications of our findings for the HIFOR initiative.

Citation

Finer M, Mamani N, Anderson C, Rosenthal A (2024) Carbon across the Amazon (part 3): Key Cases of Carbon Loss & Gain. MAAP: 220.
MAAP #217: Carbon across the Amazon (part 2): Peak Carbon Areas

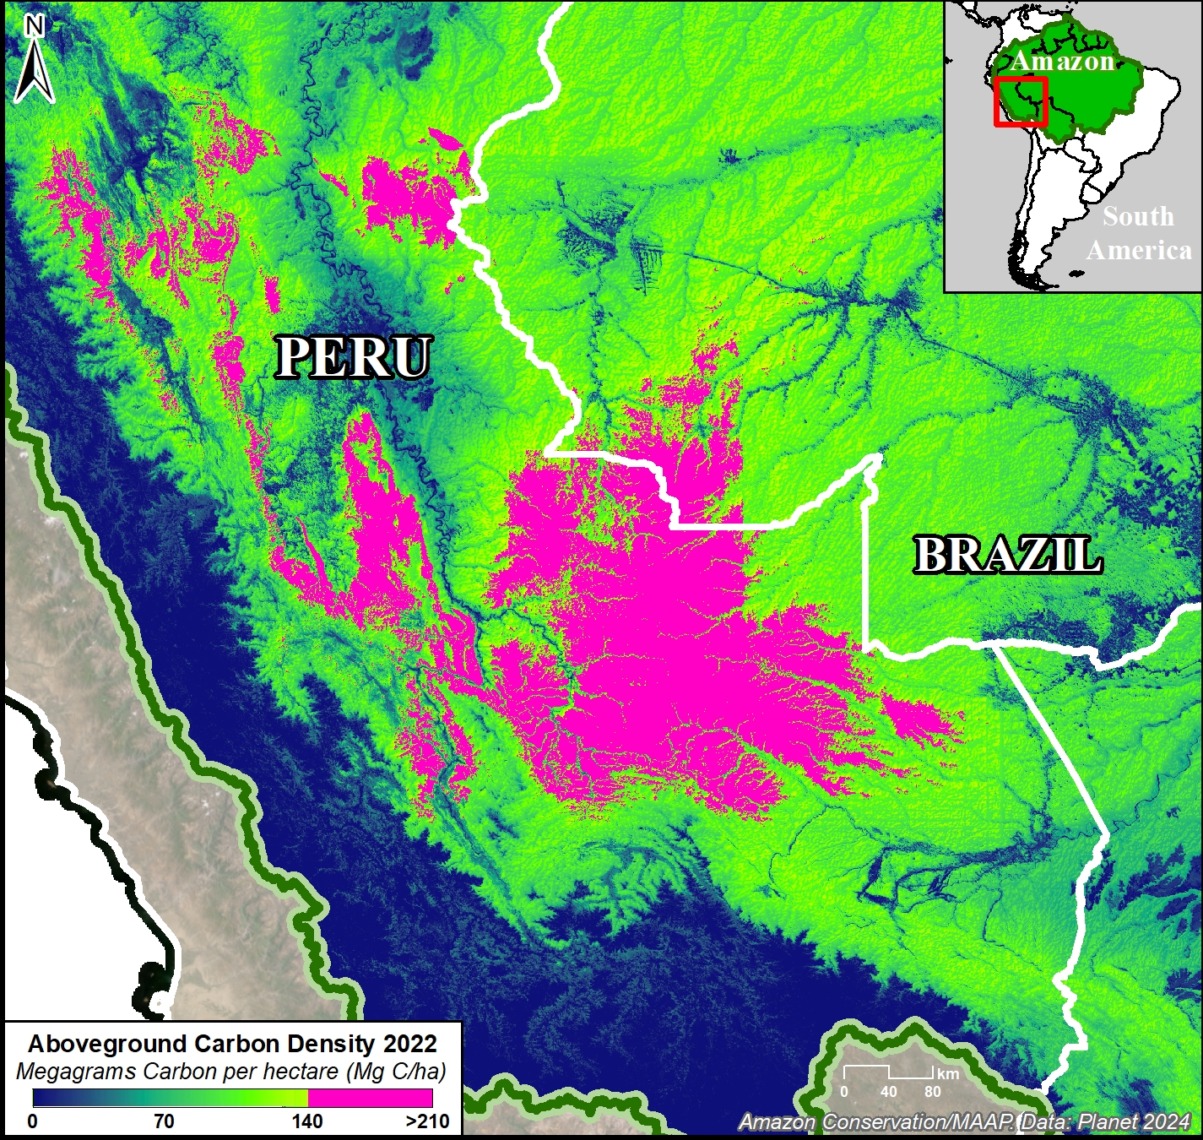
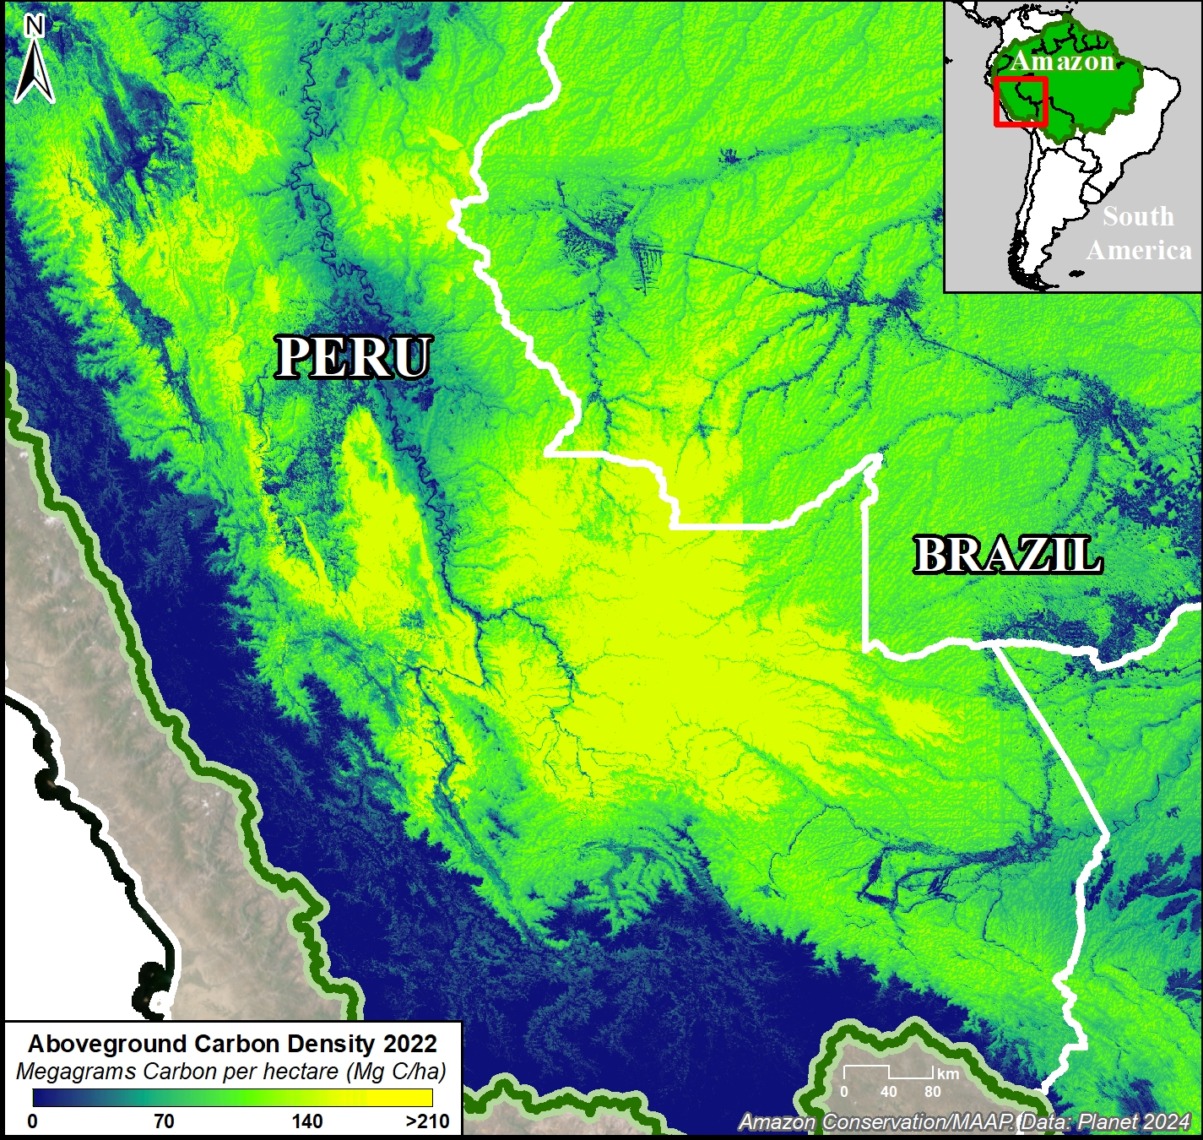
Figure 1. Example of peak carbon areas in southern Peru and adjacent western Brazil. Data: Planet.

In part 1 of this series (MAAP #215), we introduced a critical new resource (Planet Forest Carbon Diligence) that provides wall-to-wall estimates for aboveground carbon density at an unprecedented 30-meter resolution. This data uniquely merges machine learning, satellite imagery, airborne lasers, and a global biomass dataset from GEDI, a NASA mission.4

In that report, we showed that the Amazon contains 56.8 billion metric tons of aboveground carbon (as of 2022), and described key patterns across all nine countries of the Amazon biome over the past decade.

Here, in part 2, we focus on the peak carbon areas of the Amazon that are home to the highest aboveground carbon levels.

These peak carbon areas correspond to the upper one-third of aboveground carbon density levels (>140 metric tons per hectare).1

They likely have experienced minimal degradation (such as selective logging, fire, and edge/fragmentation effects)2 and are thus a good proxy for high-integrity forests.

Figure 1 shows an important example of peak carbon areas in southern Peru and adjacent western Brazil.

The peak carbon areas are often found in the remote primary forests of protected areas and Indigenous territories, but some are located in forestry concessions (specifically, logging concessions) or undesignated lands (also referred to as undesignated public forests).

Our goal in this report is to leverage unprecedented aboveground carbon data to reinforce the importance of these designated areas and draw attention to the remaining undesignated lands.

For example, peak carbon areas would be excellent candidates for the High Integrity Forest (HIFOR) initiative, a new financing instrument that uniquely focuses on maintaining intact tropical forests.3 HIFOR rewards the climate services that intact tropical forests provide, including ongoing net carbon removal from the atmosphere, and complements existing instruments to reduce emissions from deforestation and degradation (REDD+) by focusing on tropical forests that are largely undegraded.

Below, we detail the major findings and then zoom in on the peak carbon areas in the northeast and southwest Amazon.

Peak Carbon Areas in the Amazon   

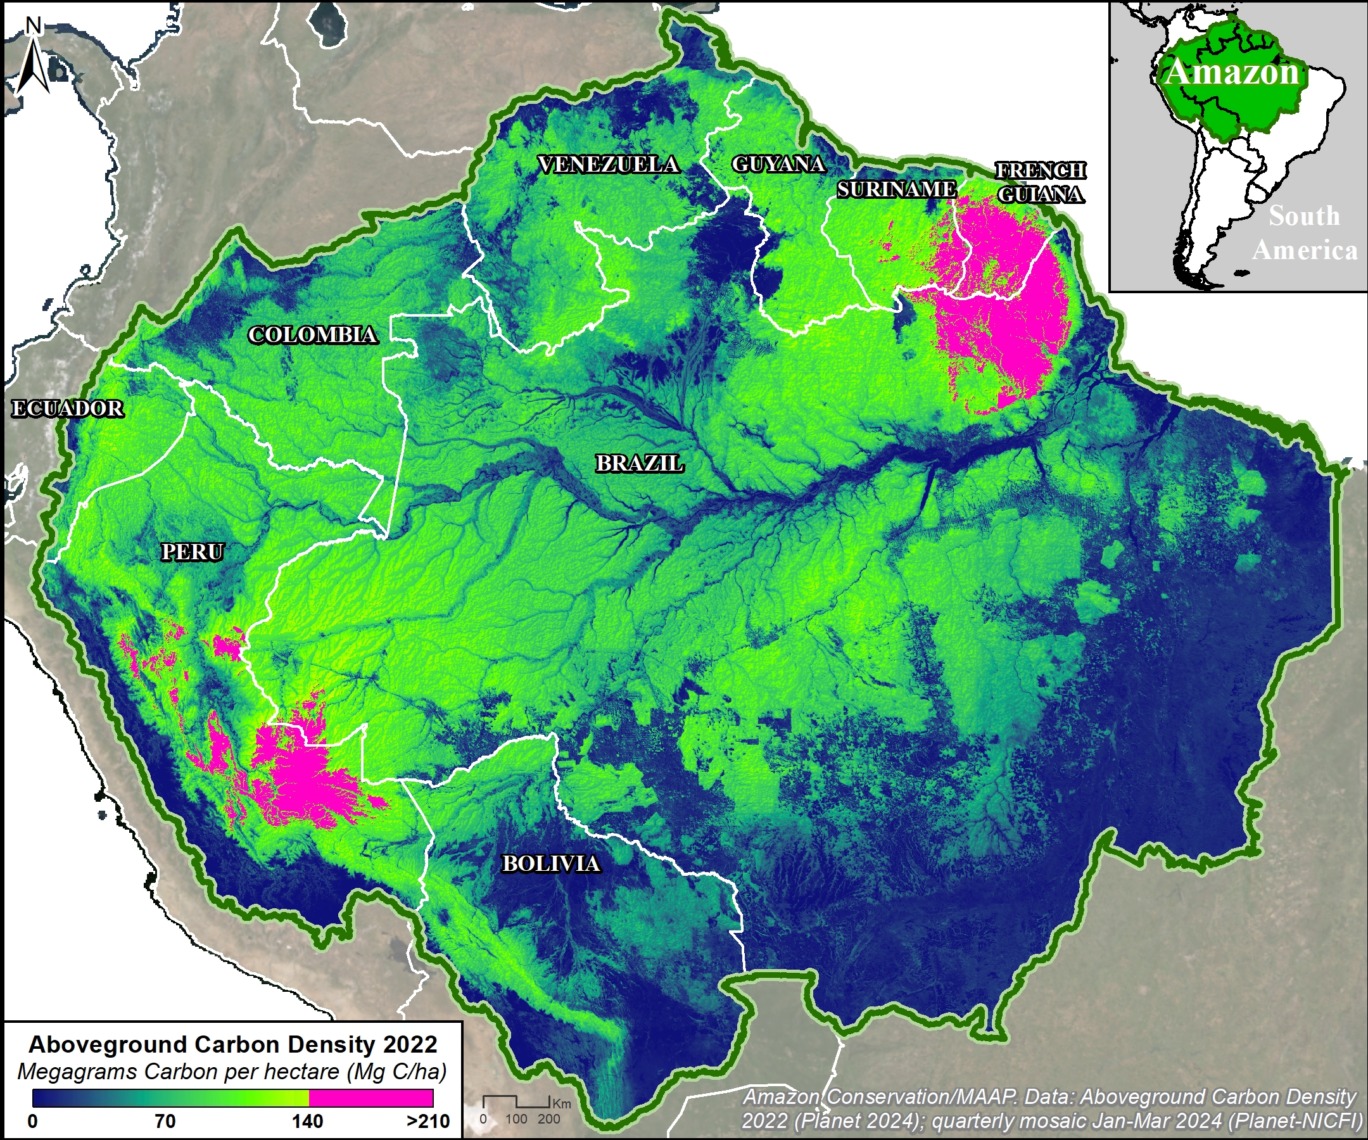
The Base Map below illustrates our major findings.

The peak carbon areas (>140 metric tons per hectare; indicated in pink) are concentrated in the southwest and northeast Amazon, covering 27.8 million hectares (11 million ha in the southwest and 16.8 million ha in the northeast).
k

Base Map. Planet Forest Carbon Diligence across the Amazon biome for the year 2022. Data: Planet.

In the southwest Amazon, peak carbon levels are found in southern & central Peru, and adjacent western Brazil.

In the northeast Amazon, peak carbon levels are found in northeast Brazil, much of French Guiana, and parts of Suriname.

By country, Brazil and Peru have the largest area of peak carbon (10.9 million and 10.1 million hectares respectively), followed by French Guiana (4.7 million ha), and Suriname (2.1 million ha).

Protected areas and Indigenous territories cover much (61%) of the peak carbon area (16.9 million hectares).

The remaining 39% remains unprotected, and arguably threatened, in undesignated lands (9.4 million hectares) and forestry concessions (1.5 million ha), respectively.

In addition, high carbon areas (>70 metric tons per hectare; indicated by the greenish-yellow coloration in the Base Map) are found in all nine countries of the Amazon biome, notably Colombia, Ecuador, Bolivia, Venezuela, and Guyana.

Southwest Amazon

­Southern Peru

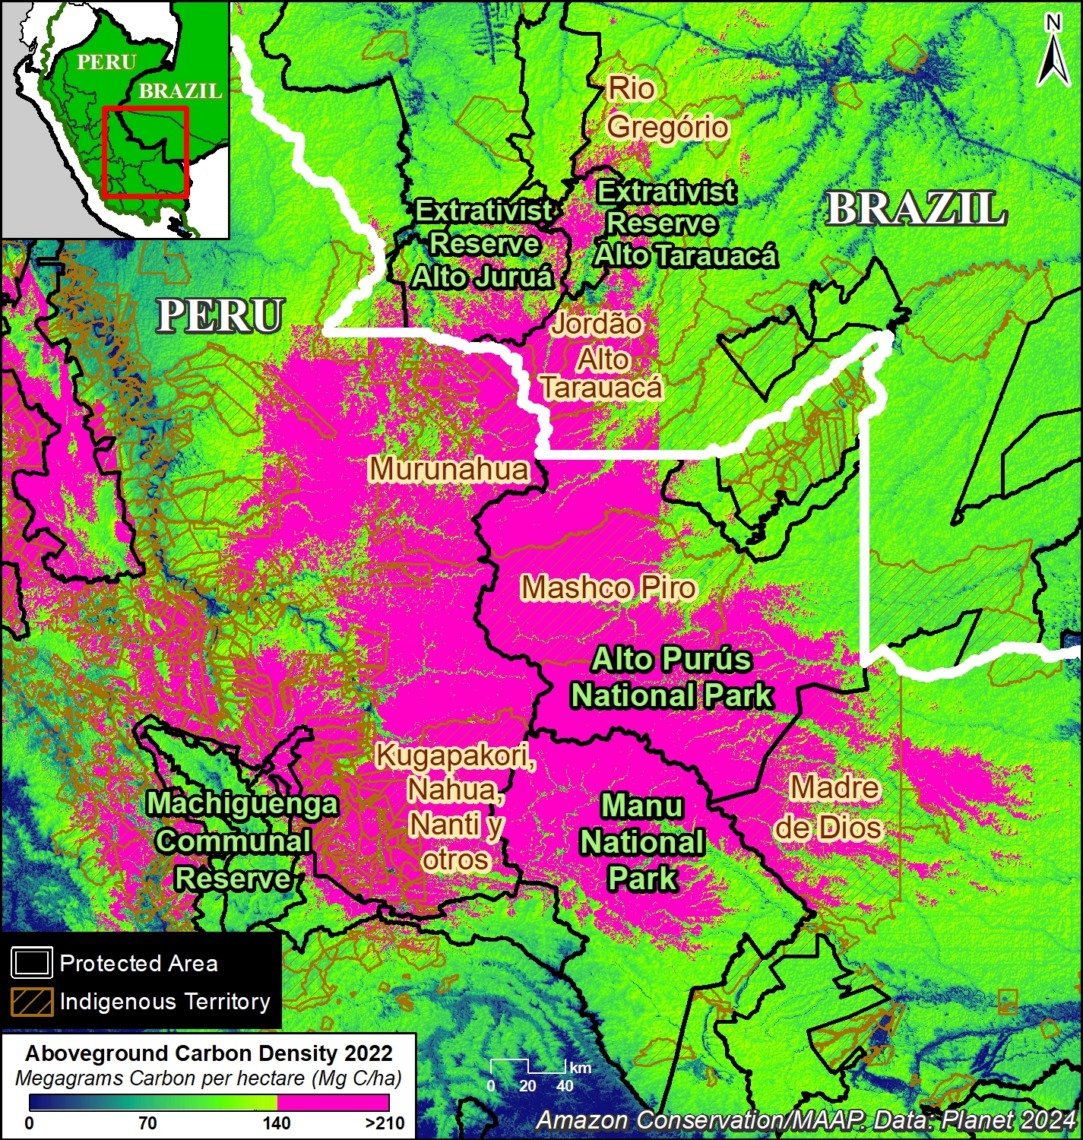
Figure 2a. Peak carbon area in the southern Peruvian Amazon. Data: Planet, SERNANP, RAISG.

Figure 2a zooms in on the peak carbon area covering 7.9 million hectares in southern Peru (regions of Madre de Dios, Cusco, and Ucayali) and adjacent southwest Brazil (Acre).

Several protected areas (such as Manu and Alto Purús National Parks, and Machiguenga Communal Reserve) anchor this area.

It is also home to numerous Indigenous territories (such as Mashco Piro, Madre de Dios, and Kugapakori, Nahua, Nanti & Others Indigenous Reserves).


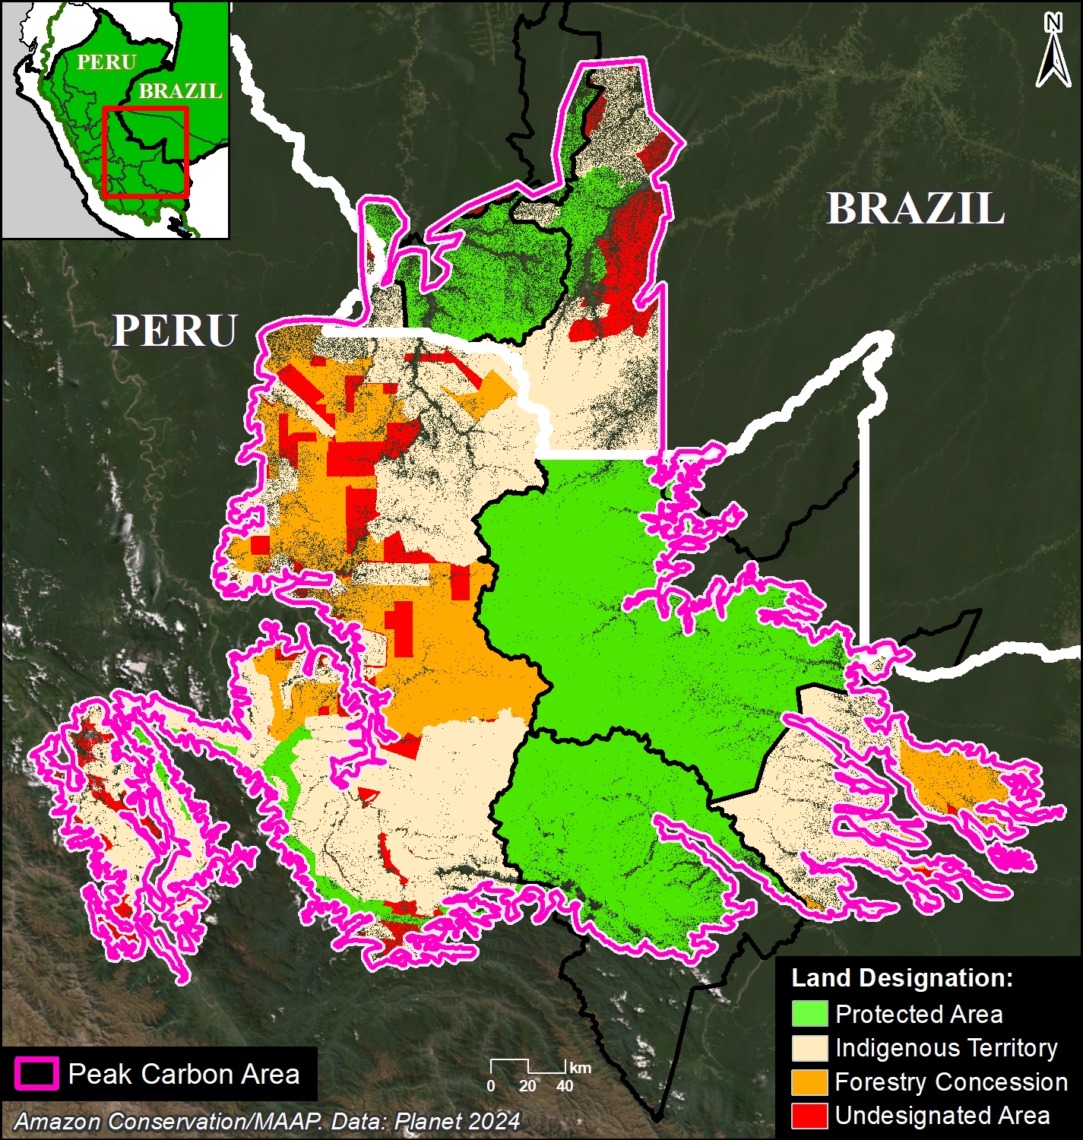
Figure 2b highlights the major land designations within the peak carbon area of southern Peru.

Figure 2b. Peak carbon areas (outlined in pink), categorized by land designation in southern Peru and adjacent western Brazil. Data: Planet, NICFI, SERNANP, SERFOR, RAISG.

Protected areas and Indigenous territories cover 77% of this area (green and brown, respectively).

The remaining 23% could be considered threatened, as they are located in forestry concessions or undesignated lands (orange and red, respectively). Thus, these areas are ideal candidates for increased protection to maintain their peak carbon levels.


Central Peru

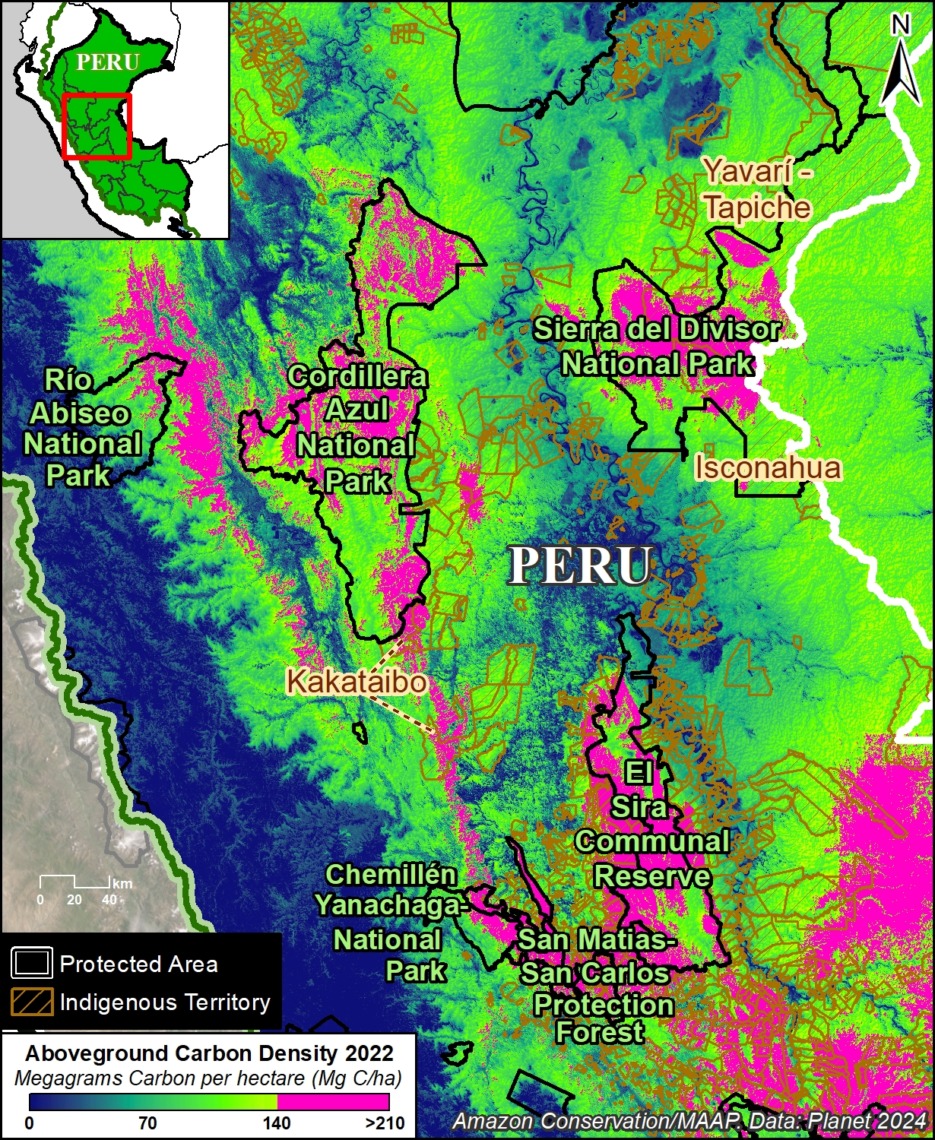
Figure 3a. Peak carbon area in the central Peruvian Amazon. Data: Planet, SERNANP, RAISG.

Figure 3a zooms in on the peak carbon area in the central Peruvian Amazon, which covers 3.1 million hectares in the regions of Ucayali, Loreto, Huánuco, Pasco, and San Martin.

Several protected areas (including Sierra del Divisor, Cordillera Azul, Rio Abiseo, and Yanachaga–Chemillén National Parks, and El Sira Communal Reserve) anchor this area.

It is also home to numerous Indigenous territories (such as Kakataibo, Isconahua, and Yavarí Tapiche Indigenous Reserves).


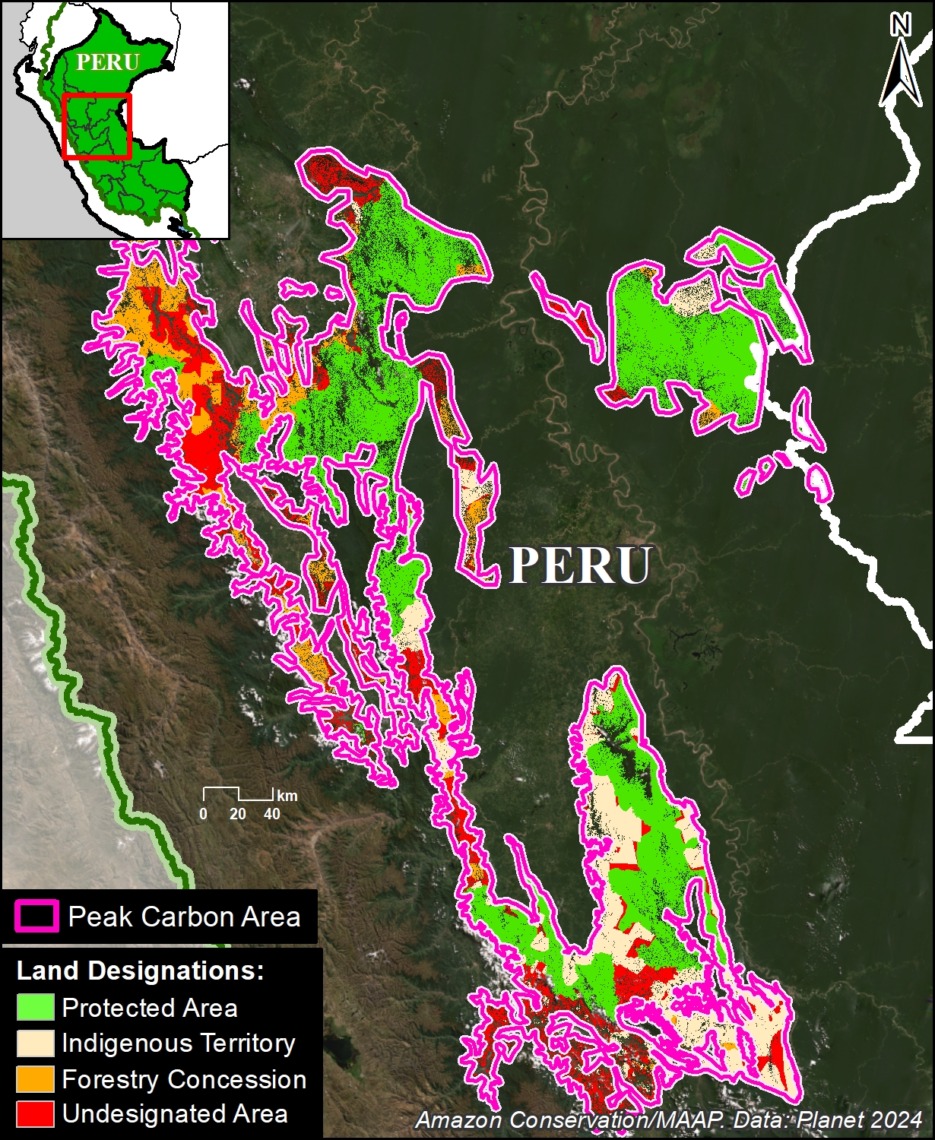
Figure 3b. Peak carbon areas (outlined in pink), categorized by land designation in central Peru. Data: Planet, NICFI, SERNANP, SERFOR, RAISG.

Figure 3b highlights the major land designations within the peak carbon area of central Peru.

Protected areas and Indigenous territories cover 69% of this area (green and brown, respectively).

The remaining 31% could be considered threatened, as they are located in forestry concessions or undesignated lands (orange and red, respectively), and are ideal candidates for increased protection.


Northeast Amazon

Figure 4a. Peak carbon area in the tri-border region of the northeast Amazon. Data: Planet, RAISG.

Figure 4a zooms in on the peak carbon area in the tri-border region of the northeast Amazon, which covers 16.8 million hectares in northern Brazil, French Guiana, and Suriname.

Several protected areas (including Montanhas do Tumucumaque National Park in northeast Brazil, Amazonien de Guyane National Park in French Guiana, and Central Suriname Nature Reserve) anchor this area.

It is also home to numerous Indigenous territories (such as Tumucumaque, Rio Paru de Este, and Wayãpi in northeast Brazil).


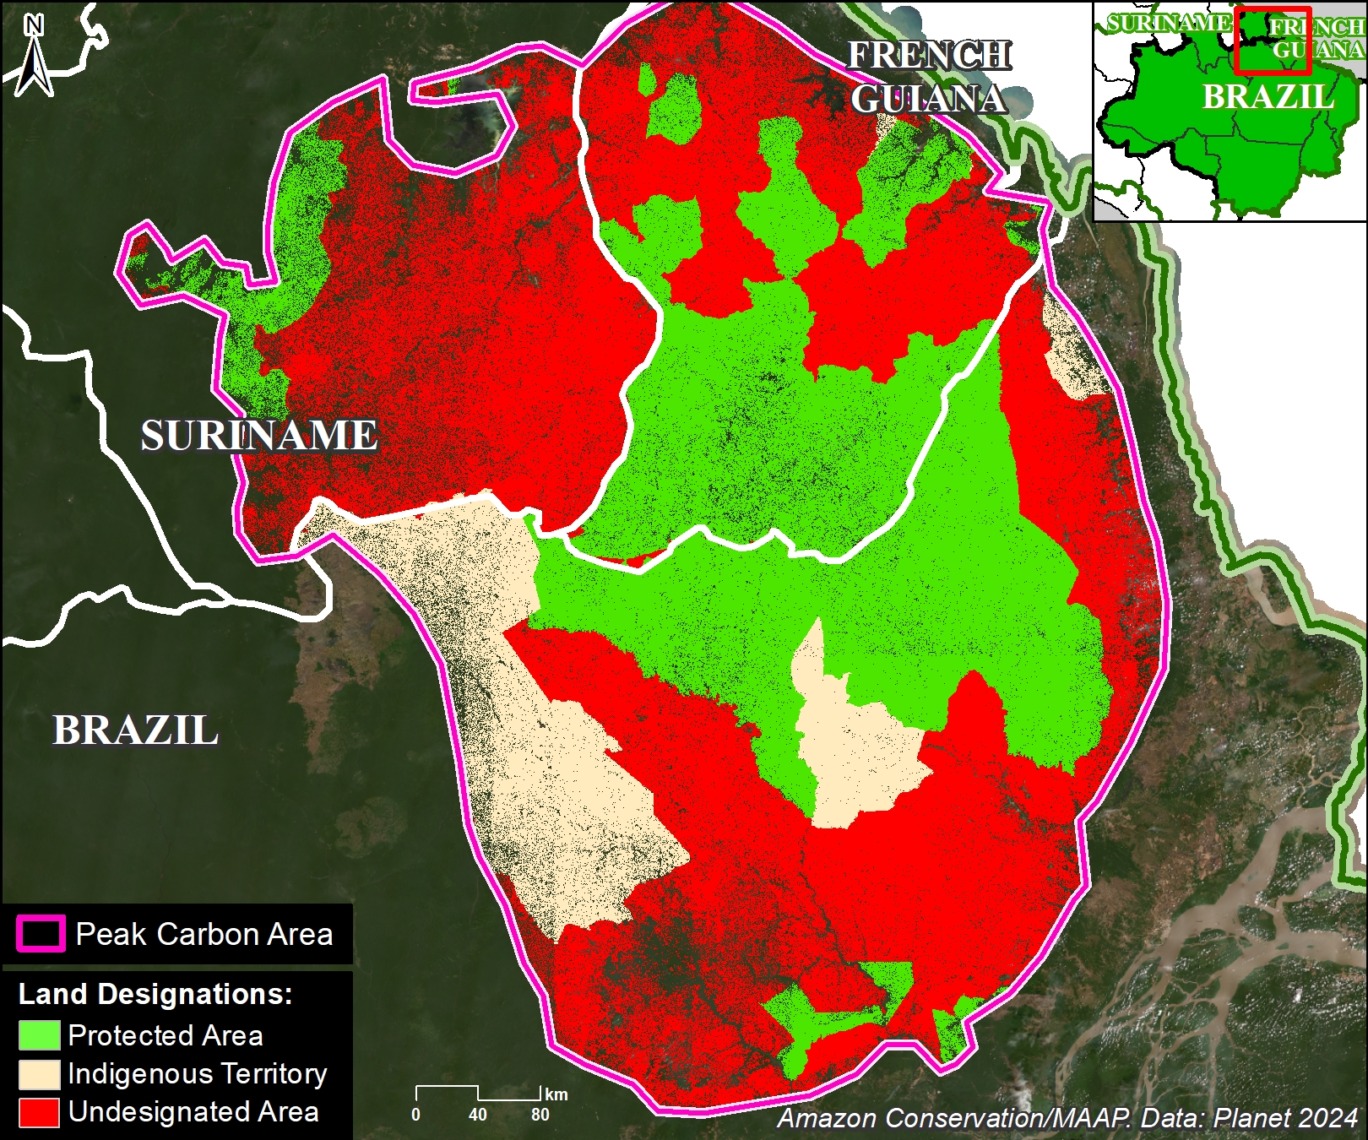
Figure 4b. Peak carbon areas (outlined in pink), categorized by land designation in northeast Amazon. Data: Planet, NICFI, RAISG.

Figure 4b highlights the major land designations within the peak carbon area of the northeast Amazon.

Protected areas and Indigenous territories cover just over half (51%) of this area (green and brown, respectively).

The remaining 49% could be considered threatened, as they are located in undesignated lands, and are ideal candidates for increased protection.


Notes

1 We selected this value (upper 33%) to capture the highest aboveground carbon areas and include a range of high carbon areas. Additional analyses could target different values, such as the highest 10% or 20% of aboveground carbon.

2  A recent paper documented a strong relationship between selective logging and aboveground carbon loss (Csillik et al. 2024, PNAS). The link between forest edges and carbon is presented in Silva Junior et al, Science Advances.

3 High Integrity Forest (HIFOR) units are a new tradable asset that recognizes and rewards the essential climate services and biodiversity conservation that intact tropical forests provide, including ongoing net removal of CO2 from the atmosphere. For more information see https://www.wcs.org/our-work/climate-change/forests-and-climate-change/hifor

4 For more information, see the “What is Forest Carbon Diligence?” section in this recent blog from Planet.

Citation

Finer M, Mamani N, Anderson C, Rosenthal A (2024) Carbon across the Amazon (part 2): Peak Carbon Areas. MAAP #217.

MAAP #220: Carbon across the Amazon (part 3): Key Cases of Carbon Loss & Gain _alt

In part 1 of this series (MAAP #215), we introduced a critical new dataset (Planet’s Forest Carbon Diligence product) that provides wall-to-wall estimates for aboveground carbon at an unprecedented 30-meter resolution. This data uniquely merges machine learning, satellite imagery, airborne lasers, and a global biomass dataset from GEDI, a NASA mission.

In part 2 (MAAP #217), we highlighted which parts of the Amazon are currently home to the highest (peak) carbon levels.

Here in part 3, we focus on aboveground carbon loss and gain, presenting a novel Base Map that shows wall-to-wall estimates across the Amazon between 2013 and 2022.

Overall, we find that the Amazon still narrowly functions as an overall carbon sink, gaining 64.7 million metric tons of aboveground carbon between 2013 and 2022.1

The countries with the most carbon gain are 1) Brazil, 2) Colombia, 3) Suriname, 4) Guyana, and 5) French Guiana. In contrast, the countries with the most carbon loss are 1) Bolivia, 2) Venezuela, 3) Peru, and 4) Ecuador.

Zooming in to the site level yields additional important findings.

For example, areas with the highest carbon loss highlight emblematic deforestation cases across the Amazon during the past ten years (Figure 1).

On the flip side, areas with the highest carbon gain indicate excellent candidates for the High Integrity Forest (HIFOR) initiative, a new financing instrument that uniquely focuses on maintaining intact tropical forests.2 Importantly, a HIFOR unit represents a hectare of high integrity tropical forest that has been ‘well-conserved’ over a decade.3

Below, we further illustrate these findings with a series of zooms of emblematic cases of high carbon loss and gain across the Amazon over the past 10 years.

Figure 1. Example of major deforestation event resulting in high carbon emissions…


Base Map – Amazon Carbon Loss & Gain (2013-2022)

Base Map. Major areas of carbon loss and gain across the Amazon between 2013 and 2022.

The Base Map shows wall-to-wall estimates of aboveground carbon loss and gain across the Amazon between 2013 and 2022.

Carbon loss is indicated by yellow to red, indicating low to high carbon loss.

Note the extensive carbon loss across the arc of deforestation in Brazil, the soy plantation region in southern Bolivia, the gold mining region in southern Peru, and the other arc of deforestation in Colombia (see Insets A-E).

We also note that the areas of high carbon loss in the remote border area between Brazil, Colombia, and Venezuela appear to be from natural causes, according to an additional review of satellite imagery.

Carbon gain is indicated by light to dark green, indicating low to high carbon gains.

Note that much of the Amazon functions as a carbon sink, with especially high carbon gain along the Ecuador-northern Peru border, eastern Colombia, western Brazil, and the northeast corner (Brazil, Guyana, Suriname, and French Guiana) (See Insets F-J).

Below, we present a series of zooms of the specific cases of high carbon loss and gain indicated in Insets A-J.

Emblematic Cases of Carbon Loss

Below we show a series…

A. Colombia National Parks (combine Tinigua, Macarena, north Chiribiquete)

B. Menonites Peru (just Vanderland area, not Chipiar)

C. Mining southern Peru

D – F. Best examples across Brazil

G. Suriname mining

Key Examples of Carbon Gain

Annex

In part 2 of this series (MAAP #217), we highlighted which parts of the Amazon are currently home to the highest (peak) aboveground carbon levels. Annex 1 shows these peak carbon areas in relation to the carbon loss and gain data presented above. Note that both peak carbon areas (southeast and northeast Amazon) are largely characterized by carbon gain.

Notes

1 In part 1 of this series (MAAP #215), we found the Amazon “is still functioning as a critical carbon sink”. As pointed out in a companion blog by Planet, however, the net carbon sink +64 million metric tons is quite small relative to the total estimate of 56.8 billion metric tons of aboveground carbon across the Amazon. That is a net positive change of just +0.1%. As the blog notes, that’s a “very small buffer” and there’s “reason to worry that the biome could flip from sink to source with ongoing deforestation.”

2 High Integrity Forest (HIFOR) units are a new tradable asset that recognizes and rewards the essential climate services and biodiversity conservation that intact tropical forests provide, including ongoing net removal of CO2 from the atmosphere. HIFOR rewards the climate services that intact tropical forests provide, including ongoing net carbon removal from the atmosphere, and complements existing instruments to reduce emissions from deforestation and degradation (REDD+) by focusing on tropical forests that are largely undegraded. For more information see https://www.wcs.org/our-work/climate-change/forests-and-climate-change/hifor

3 High Integrity Forest Investment Initiative, Methodology for HIFOR units, April 2024. Downloaded from https://www.wcs.org/our-work/climate-change/forests-and-climate-change/hifor

Citation

Finer M, Mamani N, Anderson C, Rosenthal A (2024) Carbon across the Amazon (part 3): Key Cases of Carbon Loss & Gain. MAAP: 220.
MAAP #219: Illegal mining expansion in the Ecuadorian Amazon (Punino area)

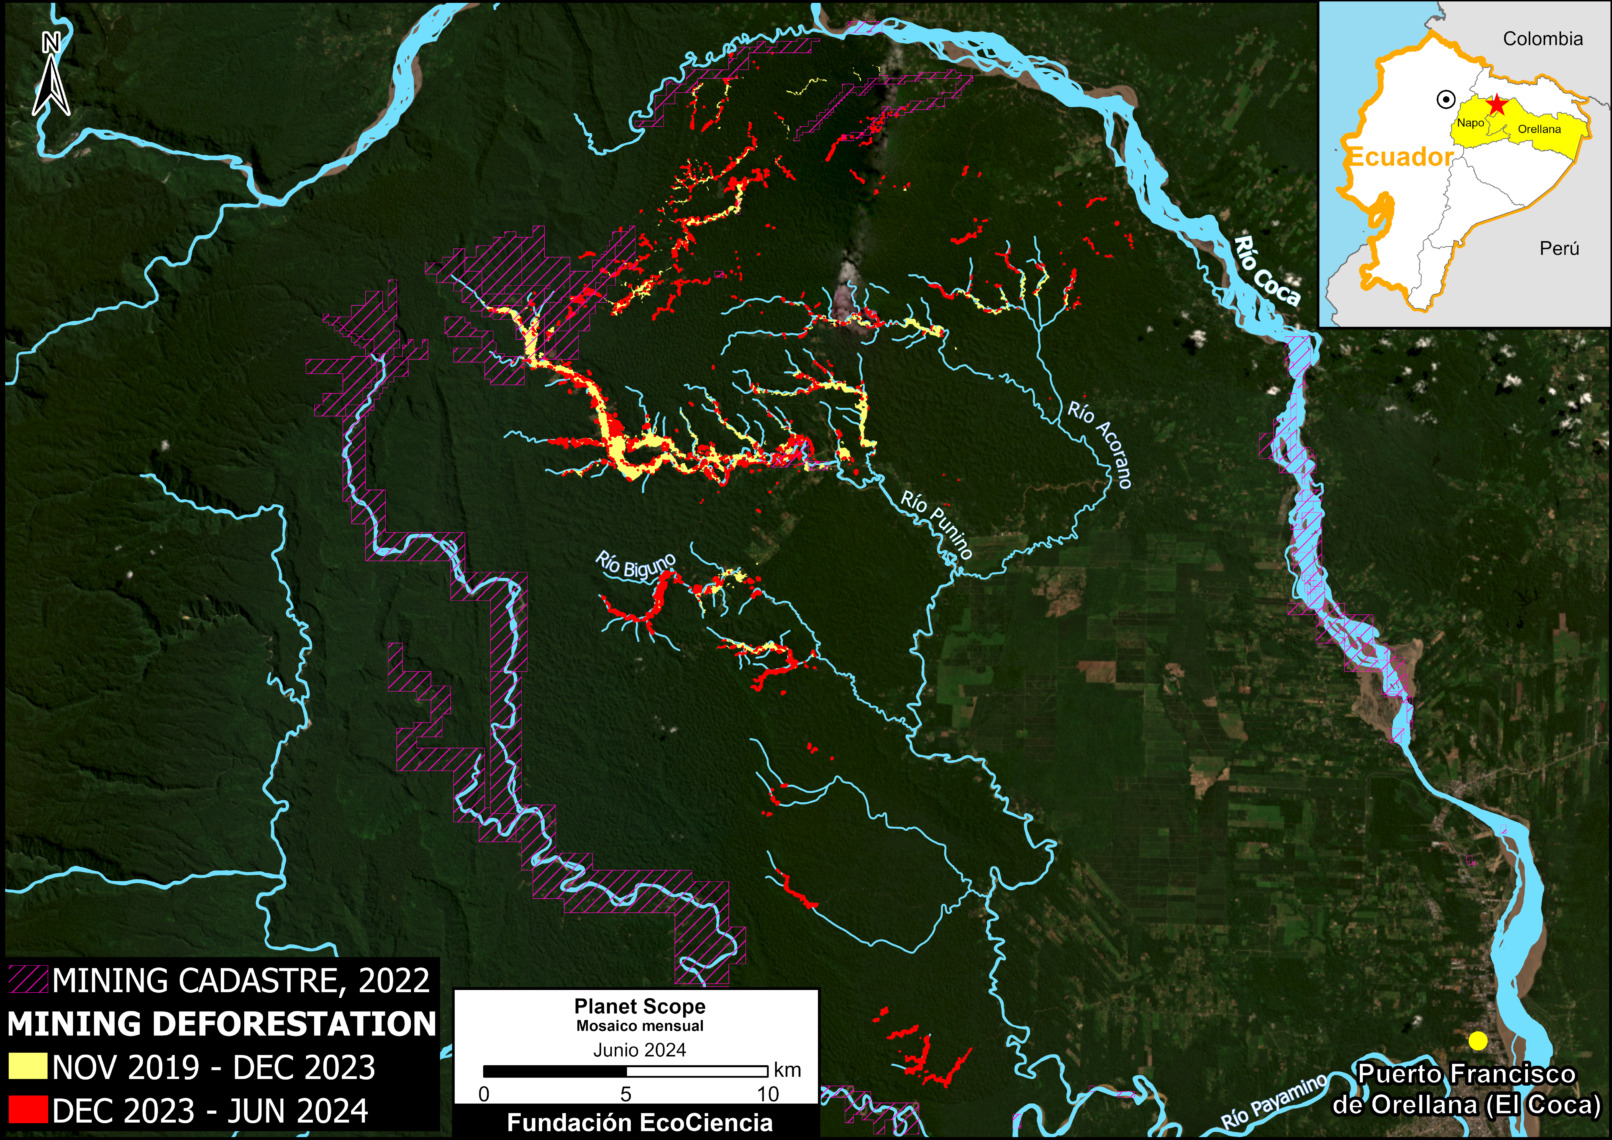
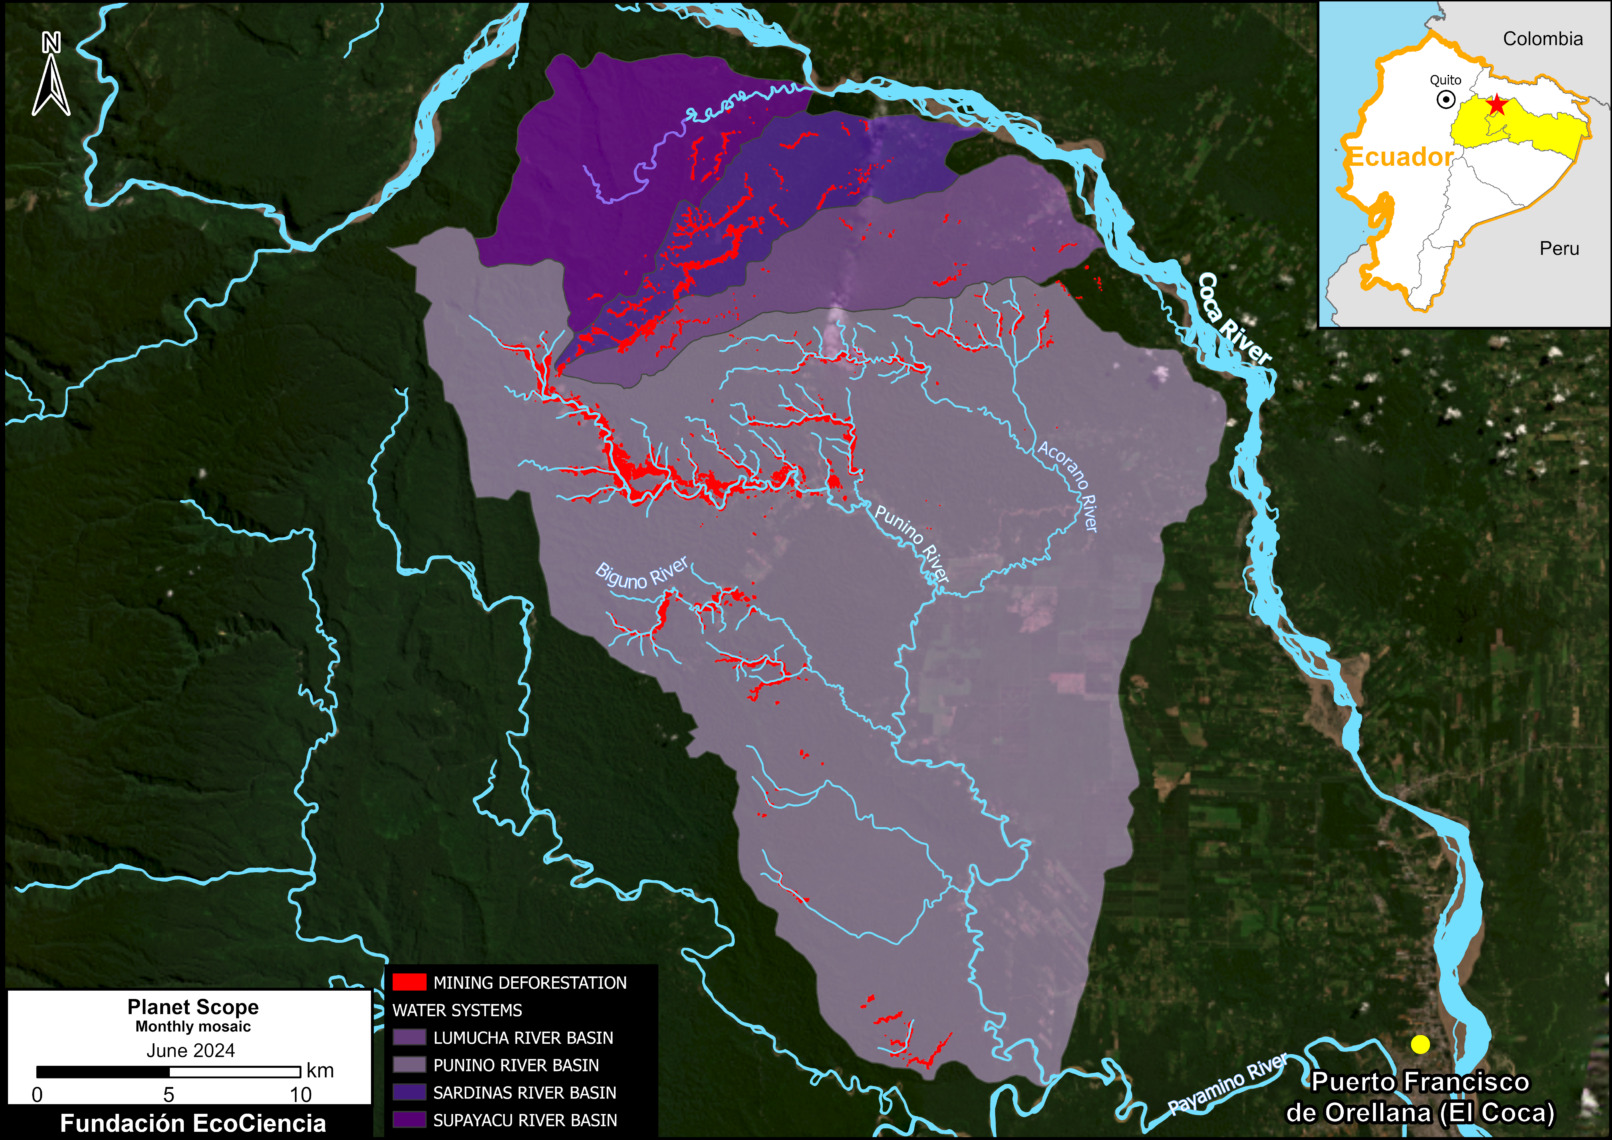
Base Map. Mining deforestation in the heart of the Ecuadorian Amazon (Punino area). Data: ARCERNNR 2022, Planet-NICFI, EcoCiencia.

In a series of previous reports, we warned about the emergence and expansion of illegal mining deforestation in the heart of the Ecuadorian Amazon, in the area surrounding the ​​Punino River, located between the provinces of Napo and Orellana (MAAP #182, MAAP #151).

In the most recent report, we informed that this mining impact had reached 1,000 hectares (MAAP #206).

Here, we provide an update on the growing mining activity in and around the Punino River basin during the first half of 2024.

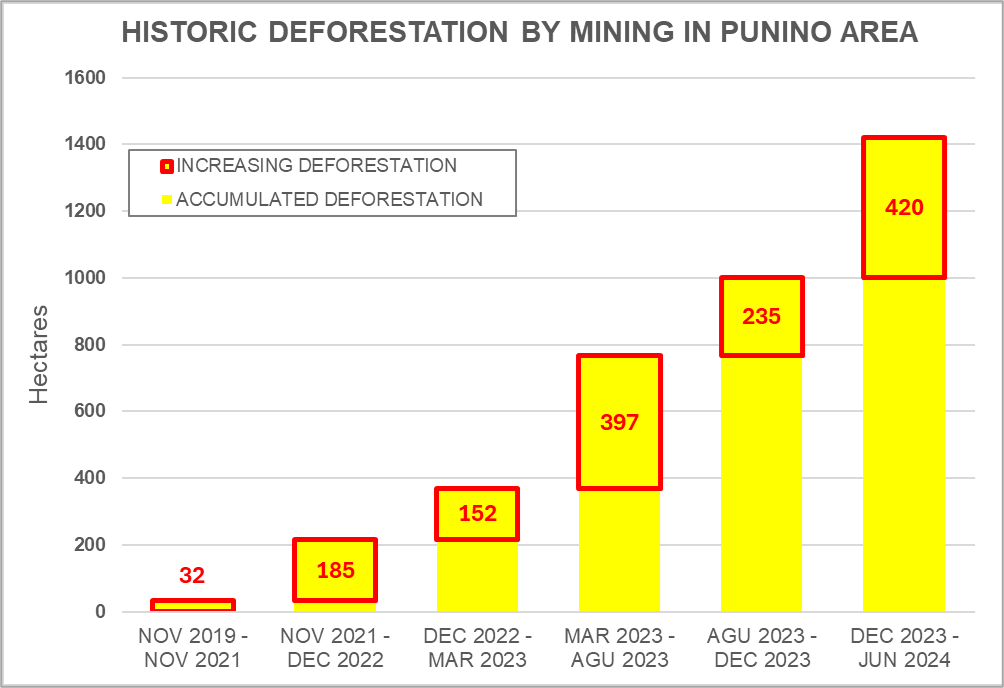
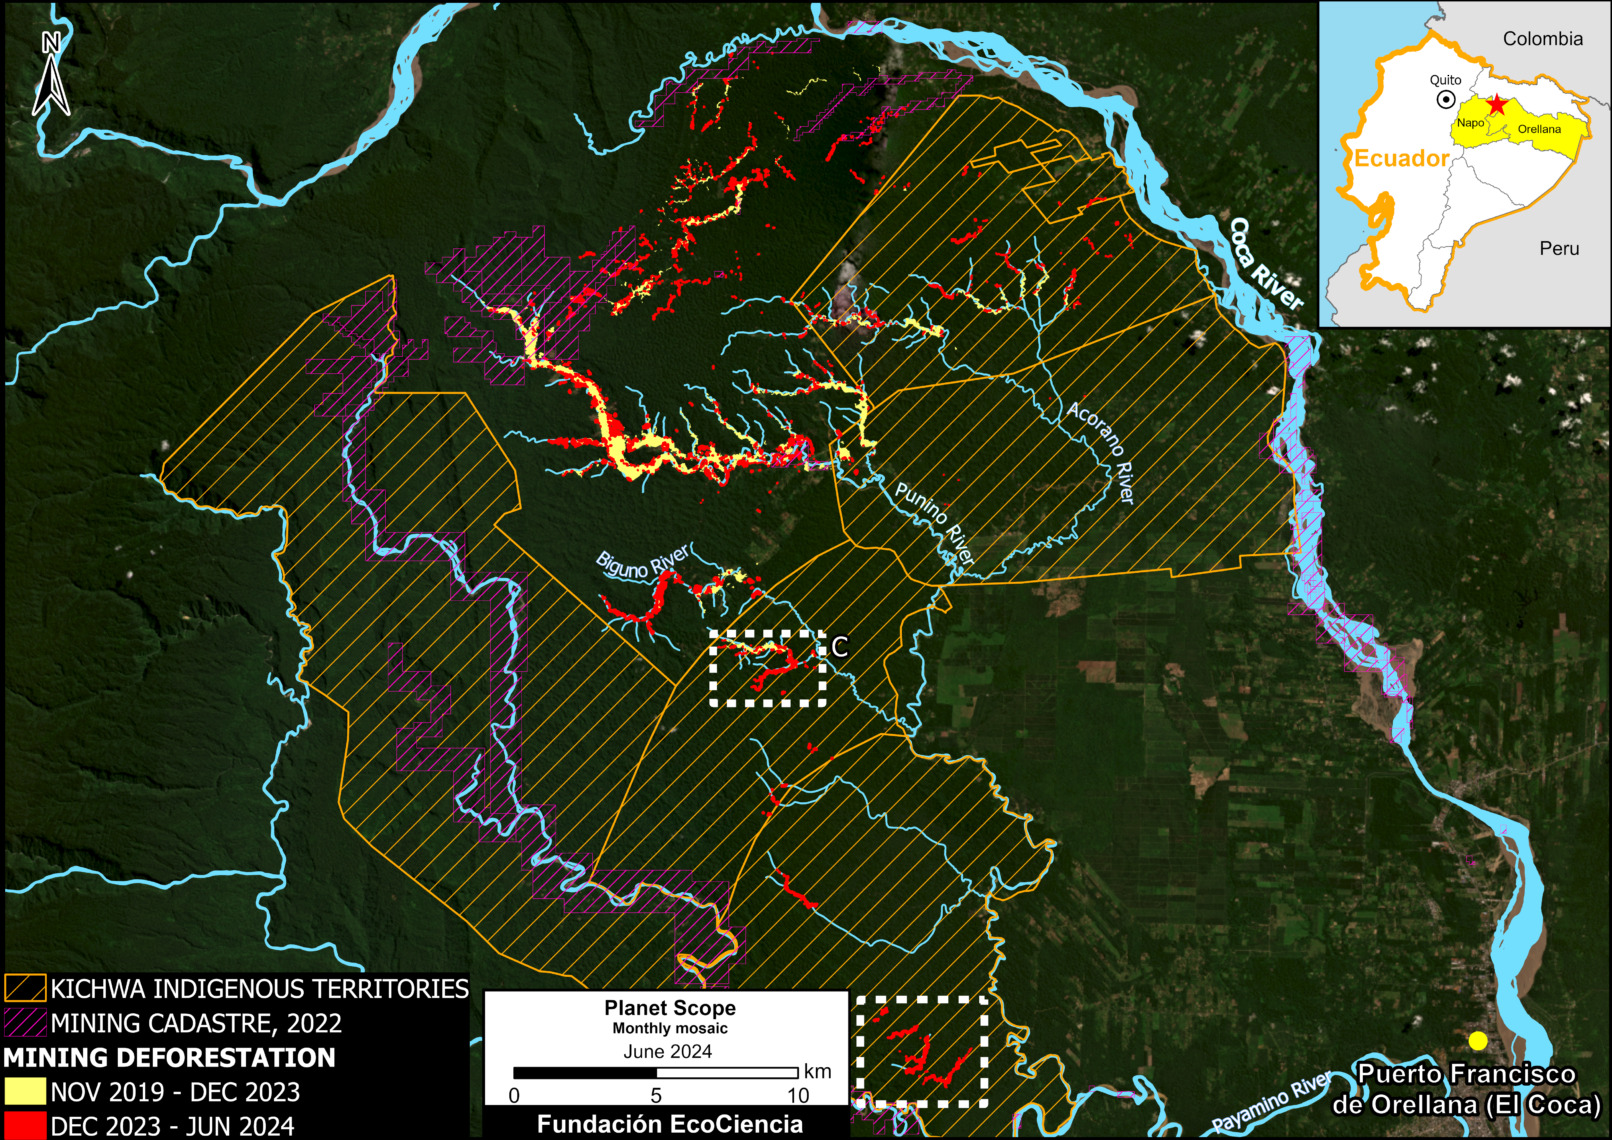
The Base Map shows an increase of 420 hectares in 2024 (indicated in red), bringing the total impact to 1,422 hectares (3,500 acres) since its inception in 2019 (yellow and red combined). This total is equivalent to more than 2,000 professional soccer fields.

The Base Map also shows that the vast majority (90%) of the mining deforestation is located outside the limits of the areas authorized for such activity (according to the mining registry updated to 2022). In other words, the vast majority of mining is likely illegal.

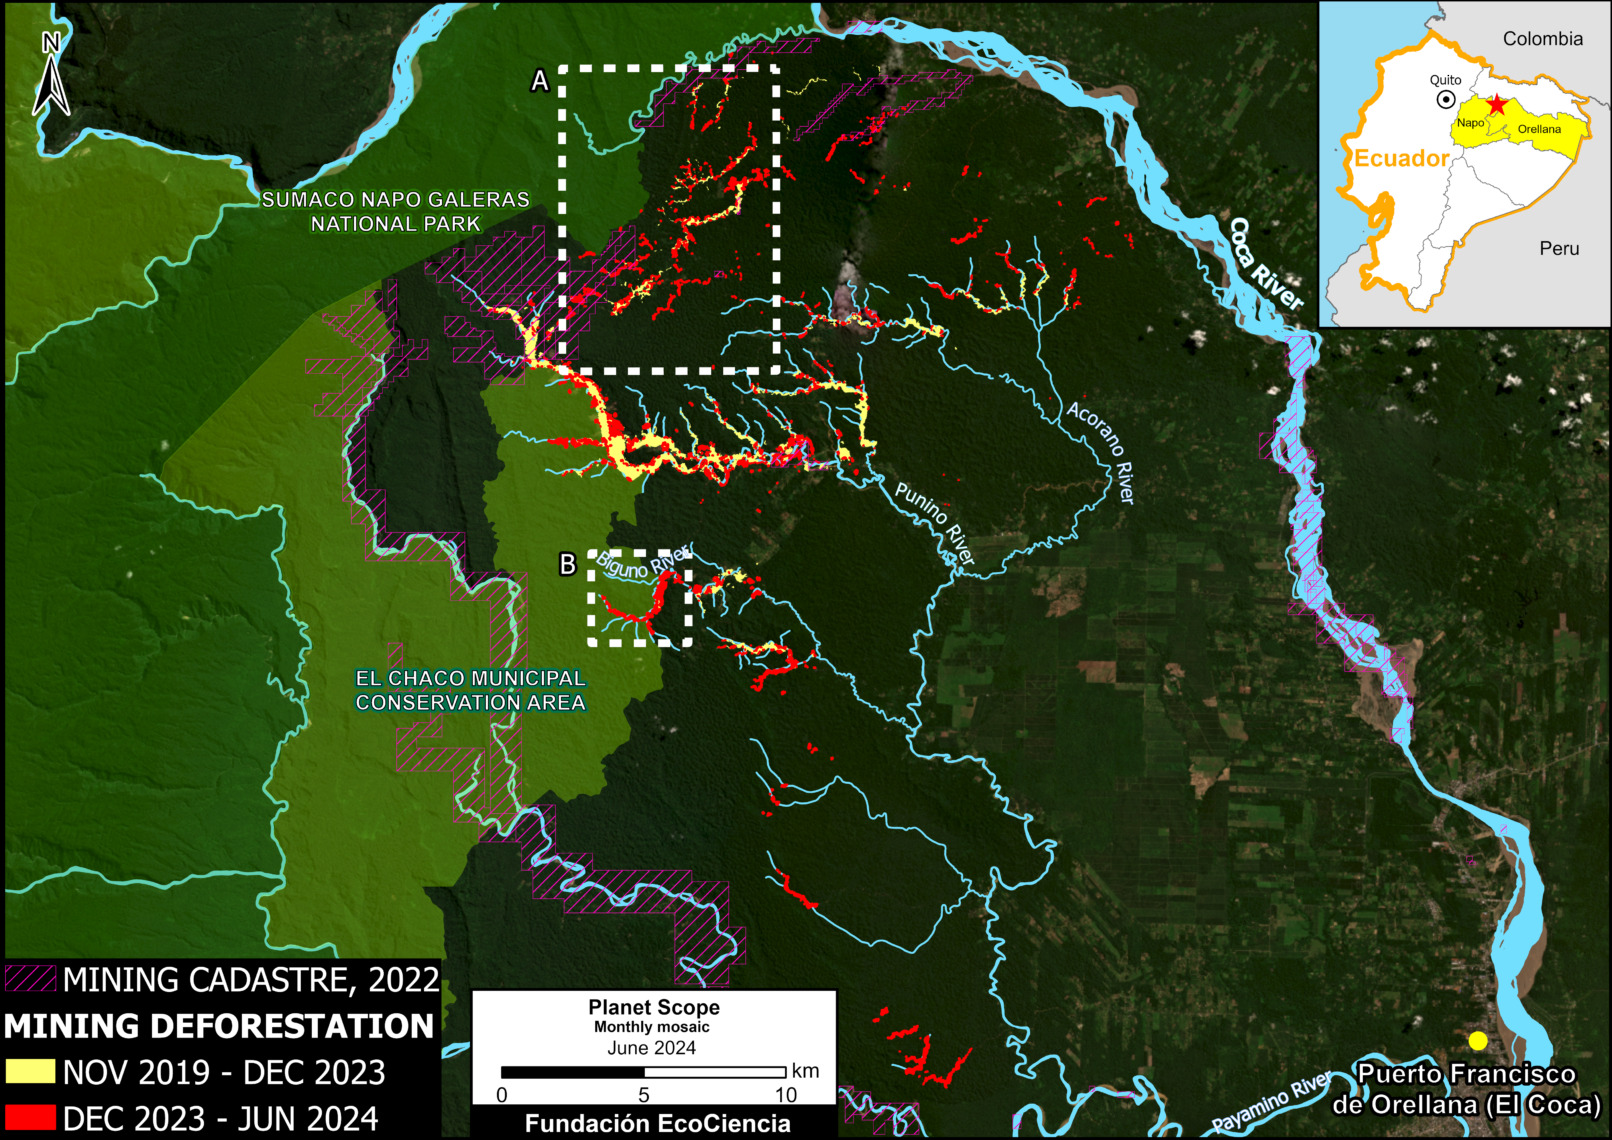
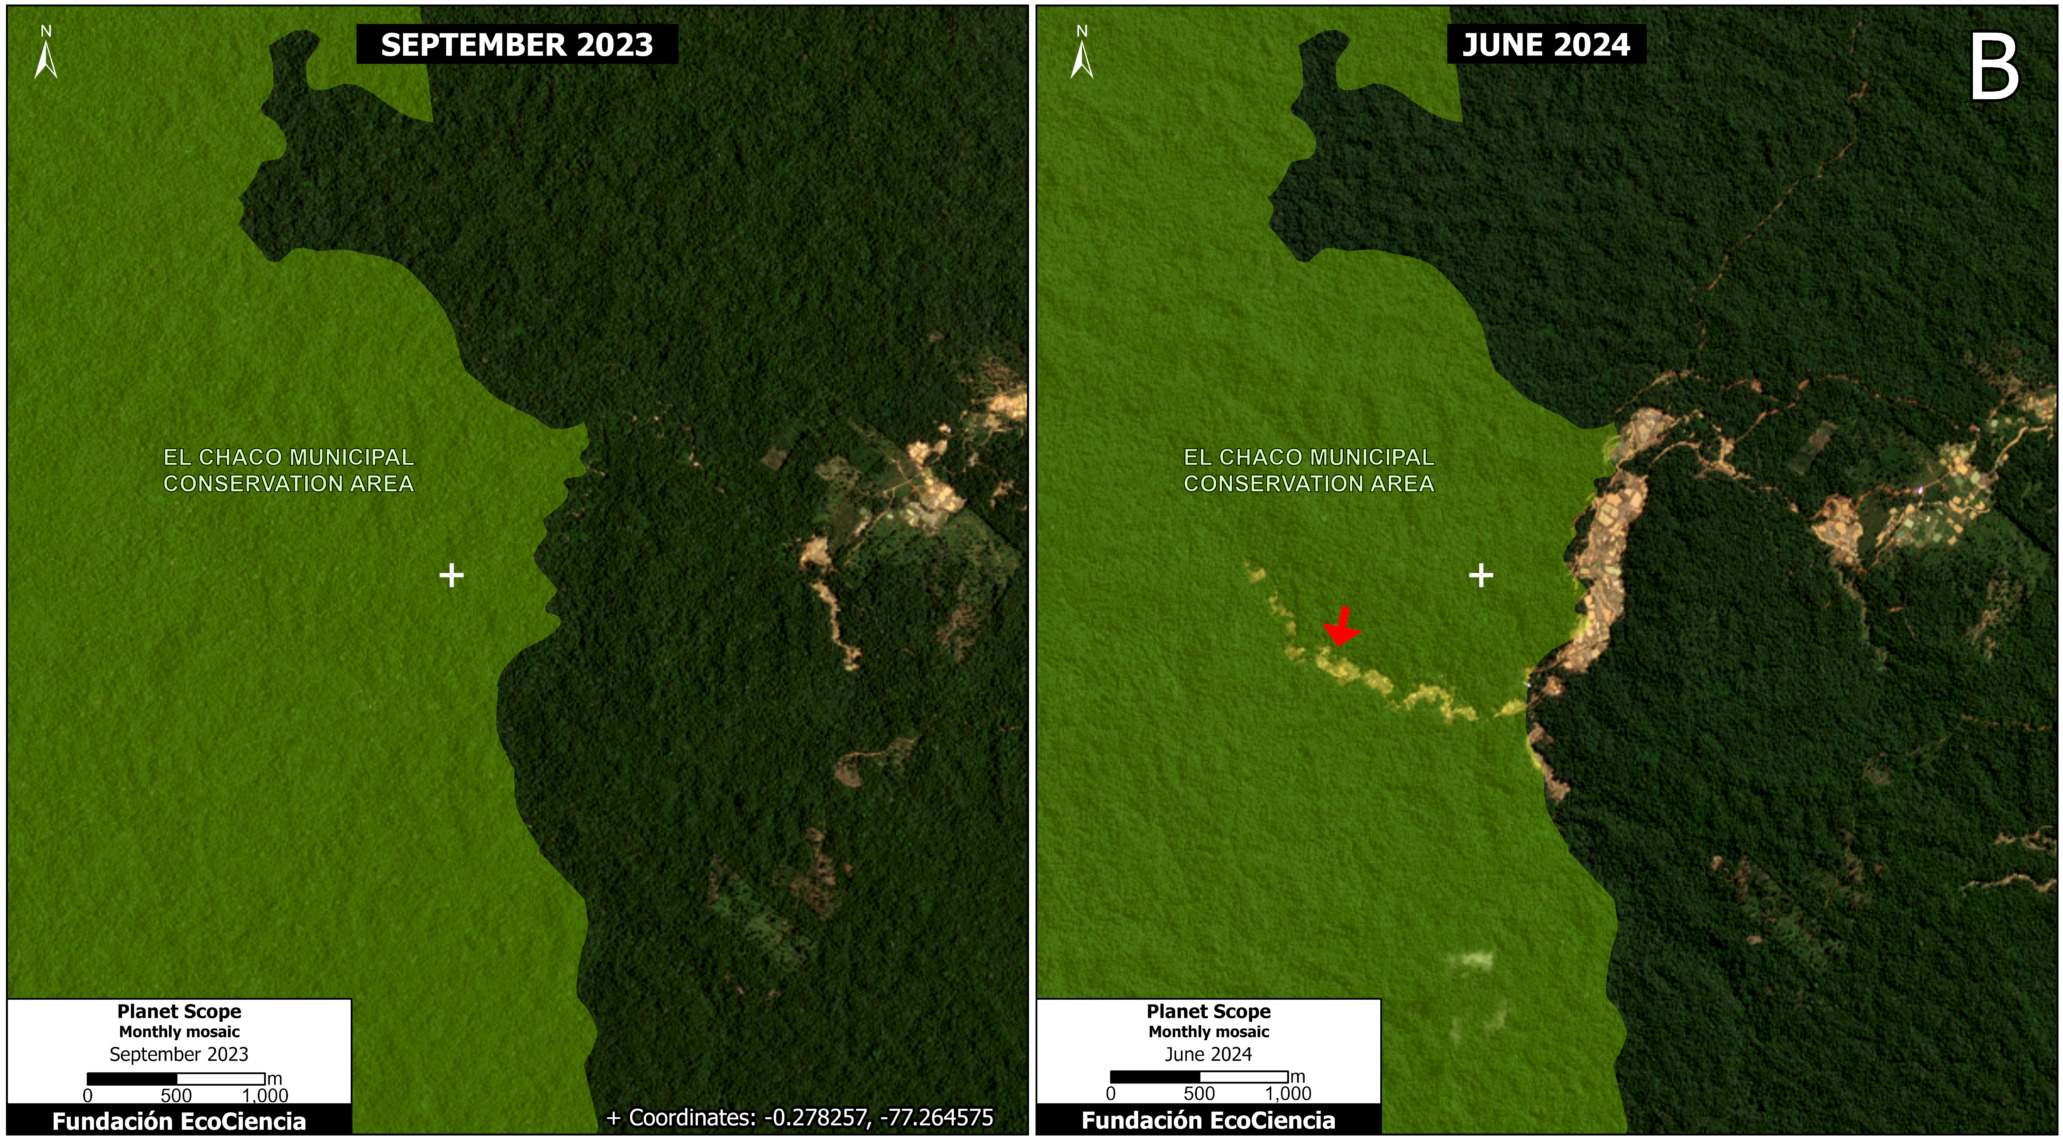
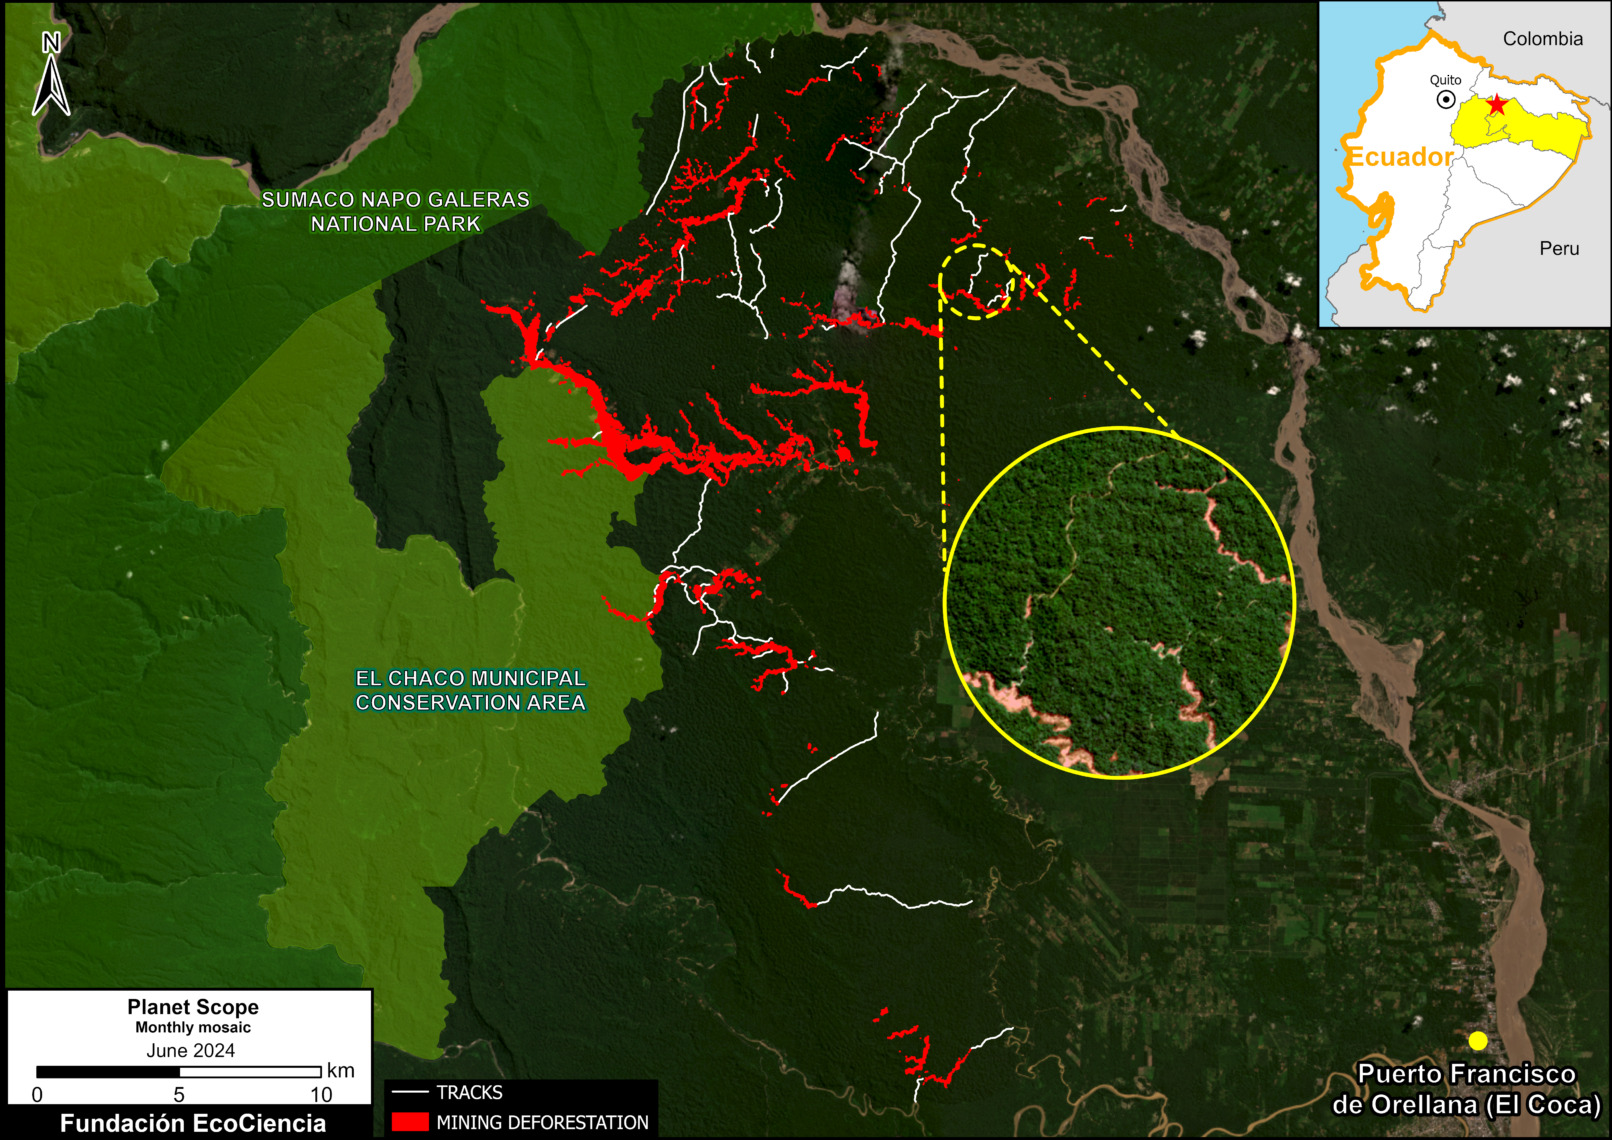
We emphasize that the mining deforestation has rapidly expanded to enter the limits of two protected areas: Sumaco-Napo Galeras National Park and El Chaco Municipal Conservation Area (see Figure 1, below).

In addition, the mining deforestation is actively expanding within the boundaries of Indigenous territories of the Kichwa nationality (see Figure 2, below).

Below we illustrate in more detail the rapid increase in mining deforestation, especially in these protected areas and Indigenous territories.

Mining expansion in the Punino area, 2019-2024

Chart 1 illustrates the steadily increasing mining deforestation in the Punino area over the past 5 years. The impact began in 2019, reaching 1,000 hectares by the end of 2023, and more recently reaching 1,422 hectares in June 2024.

Chart 1. Historical deforestation due to mining in the Punino area between November 2019 and June 2024

Expansion of illegal mining in protected areas

Figure 1 shows the expansion of mining deforestation in and around the two protected areas of the Punino zone. Note that mining has recently penetrated the boundaries of both Sumaco-Napo Galeras National Park (0.32 hectares) and El Chaco Municipal Conservation Area (144 hectares).

Figure 1. Protected areas affected by mining activity between 2019 and 2024 in the Punino area. Data: ARCERNNR 2022, MAATE 2024, NCI 2018, Planet-NICFI, EcoCiencia.

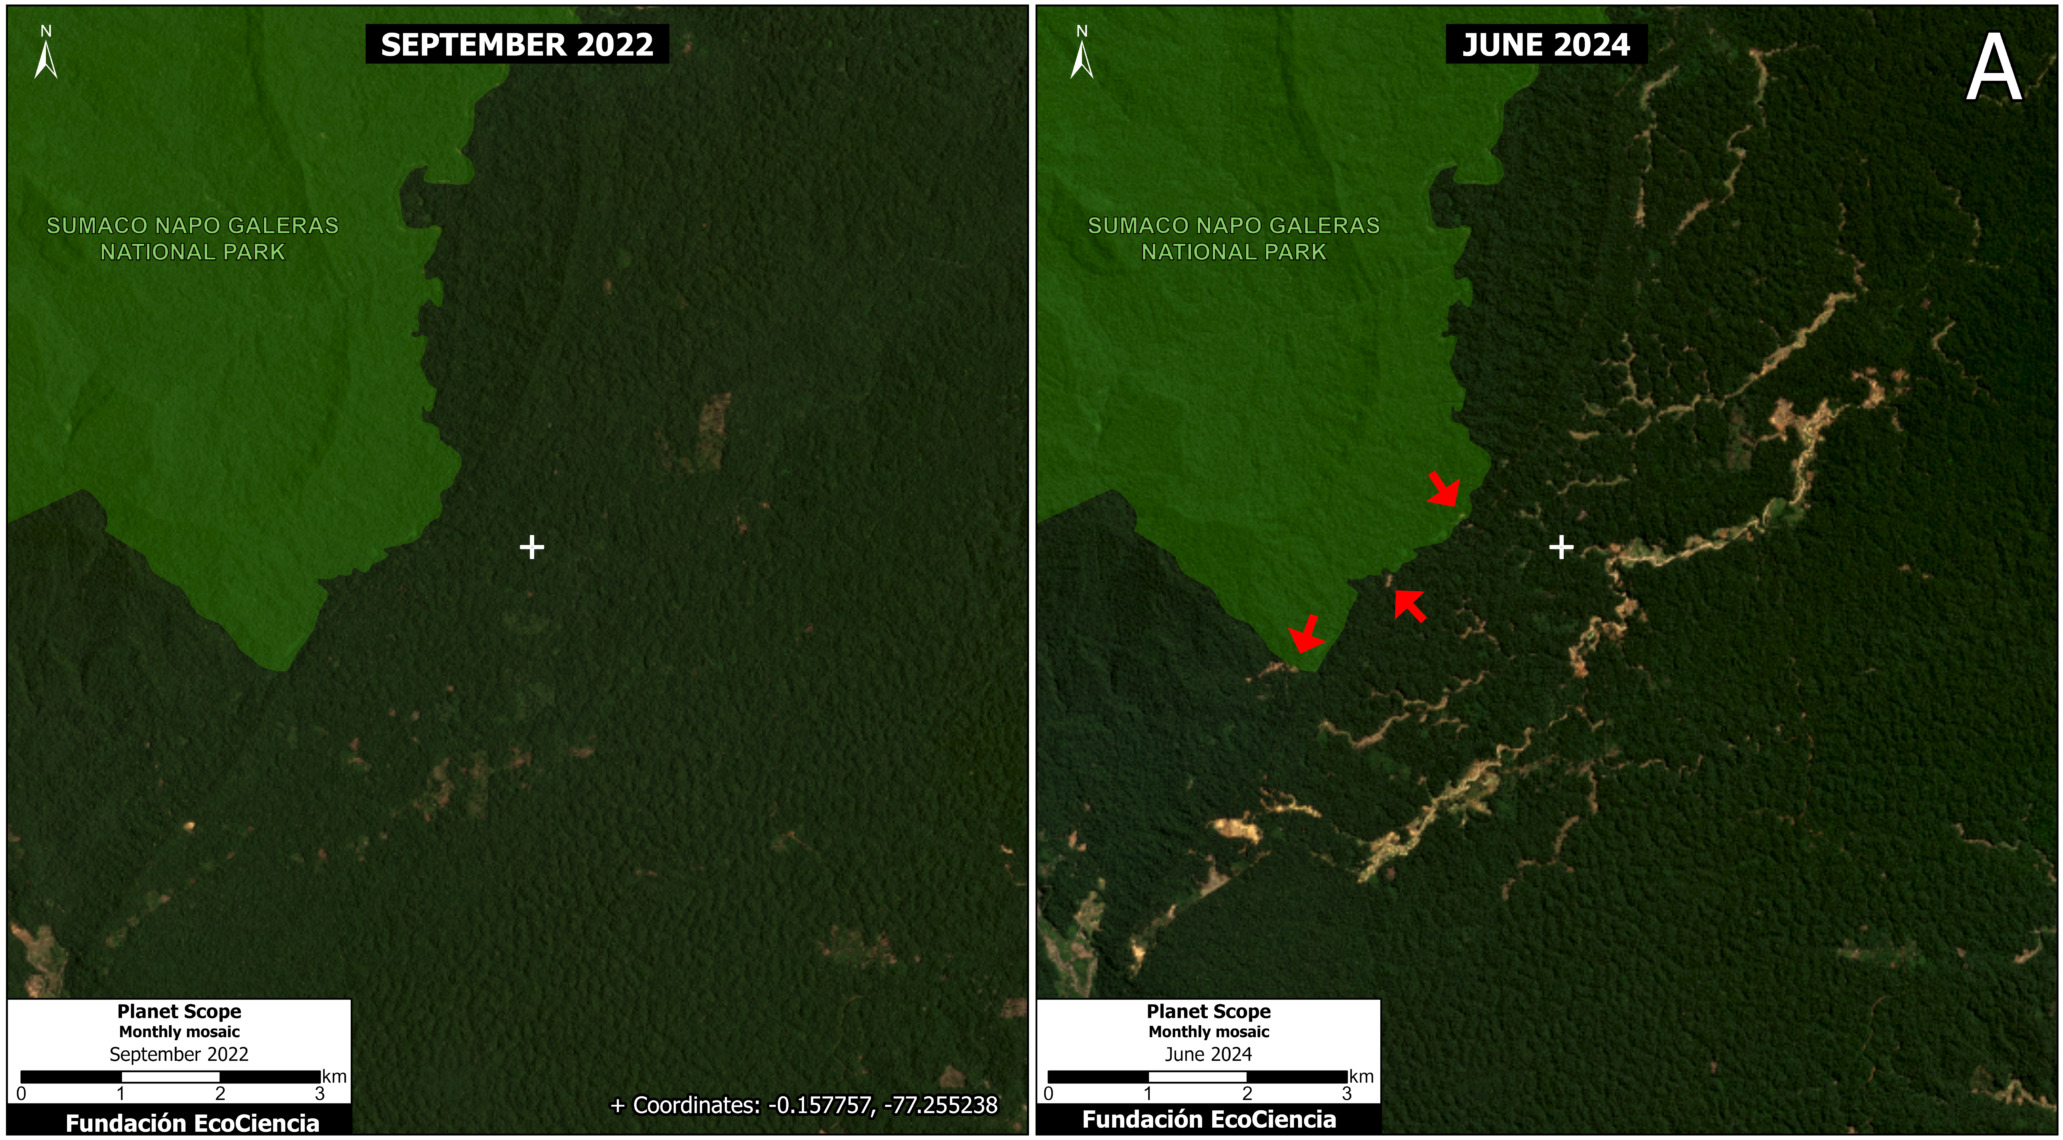
Figure 2 shows the initial encroachment (0.32 hectares) of mining deforestation in the boundaries of Sumaco Napo-Galeras National Park between September 2022 (left panel) and June 2024 (right panel).

Figure 2. Mining deforestation within the boundaries of Sumaco Napo-Galeras National Park, comparing September 2022 (left panel) with June 2024 (right panel). Data: MAATE 2024, Planet/NICFI, EcoCiencia.

Figure 3 shows the invasion and expansion of deforestation due to mining (144 hectares) within the boundaries of El Chaco Municipal Conservation Area between September 2023 (left panel) and June 2024 (right panel).

Figure 3. Mining deforestation within the boundaries of the El Chaco Municipal Conservation Area, comparing September 2023 (left panel) with June 2024 (right panel). Data: NCI 2018, Planet/NICFI, Ecociencia.

Expansion of illegal mining in indigenous territories

Figure 4 shows the expansion of mining deforestation (300 hectares) in relation to the Indigenous territories of the Kichwa nationality in the Punino area.

Figure 4. Indigenous territories affected by mining activity between 2019 and 2024 in the Punino area. Data: RAISG 2023, ARCERNNR 2022, Planet-NICFI, EcoCiencia.

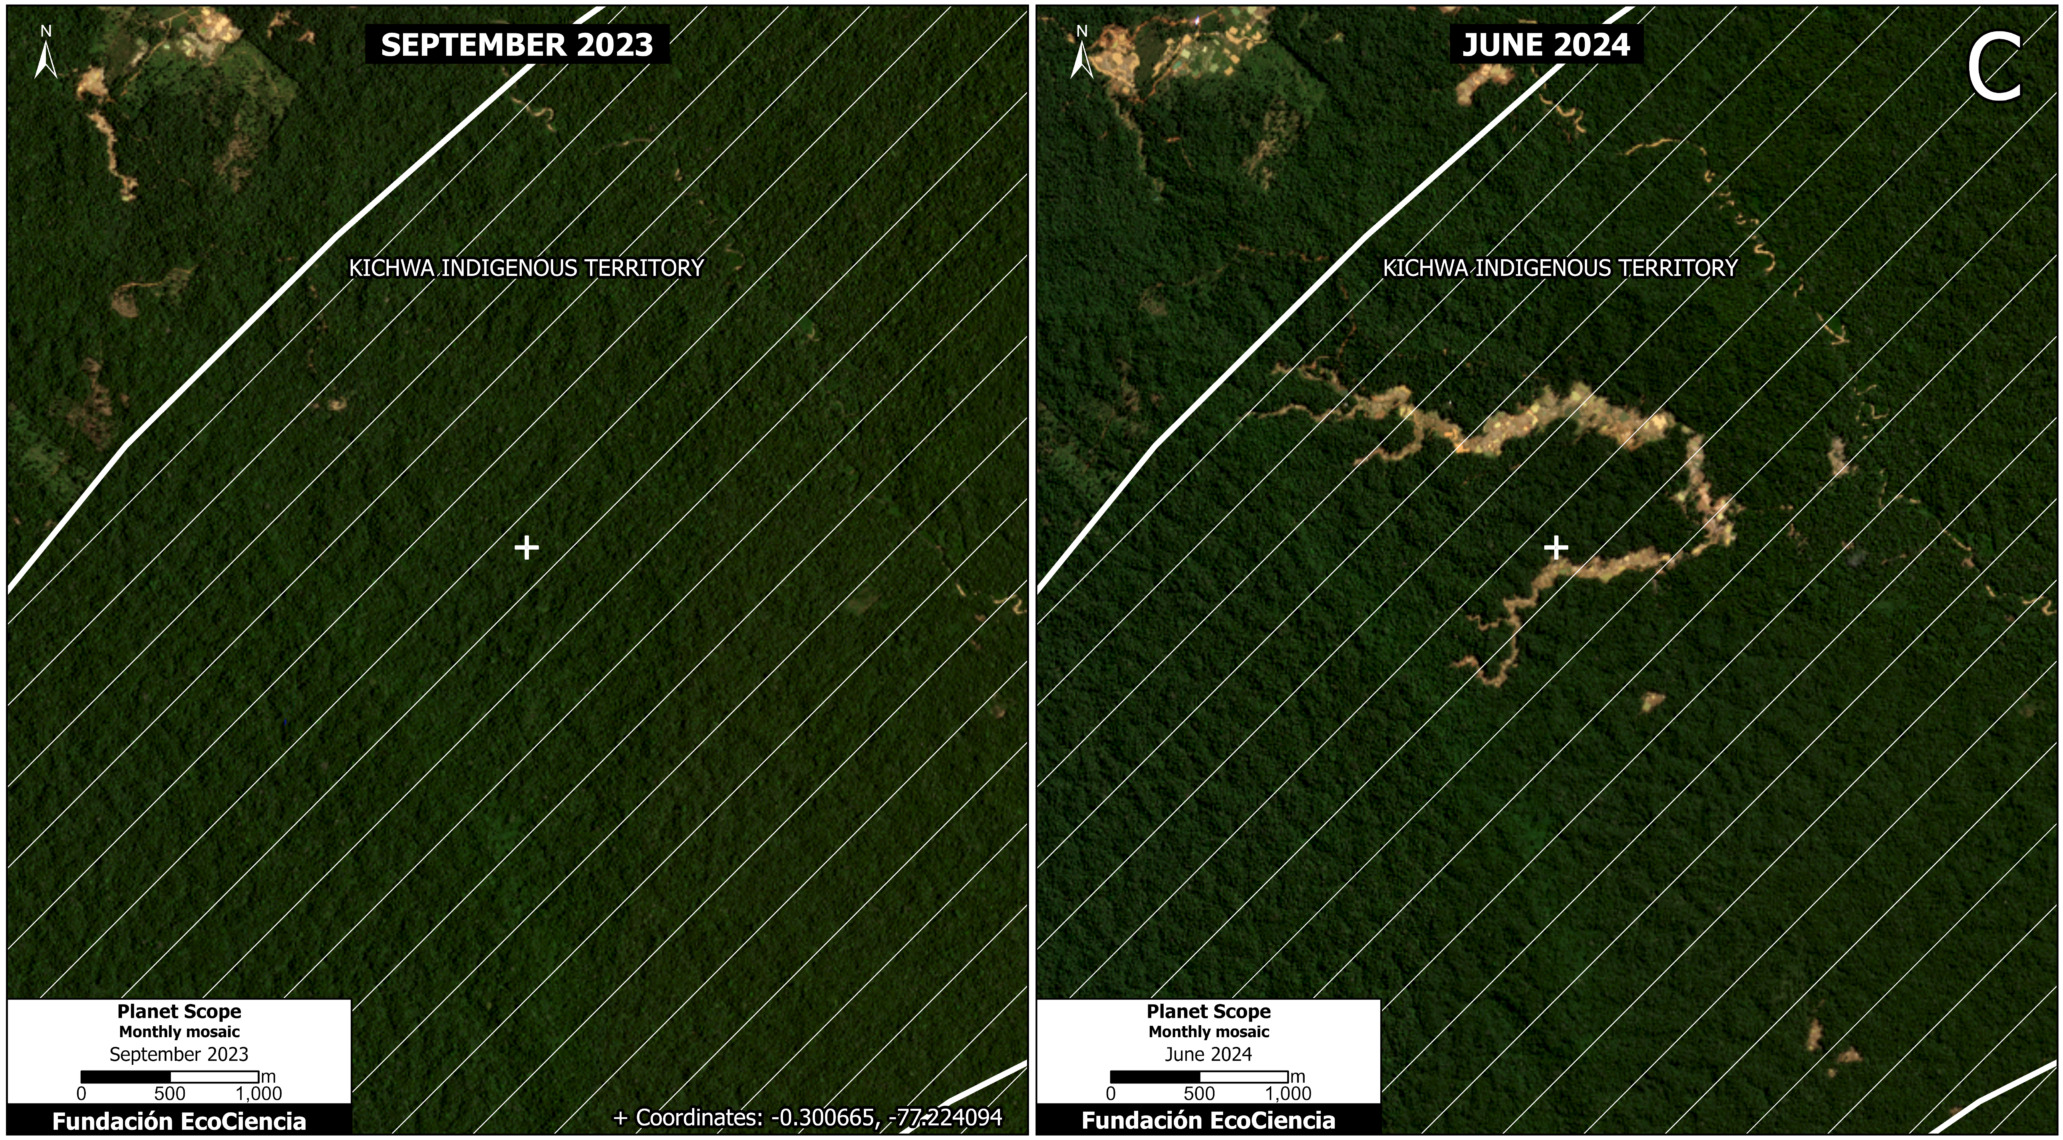
Figure 5 shows the expansion of deforestation due to mining in the indigenous territories of the Kichwa nationality between September 2023 (left panel) and June 2024 (right panel).

Figure 5. Mining deforestation within indigenous territory of the Kichwa nationality, comparing September 2023 (left panel) with June 2024 (right panel). Data: RAISG 2023, Planet-NICFI, EcoCiencia.

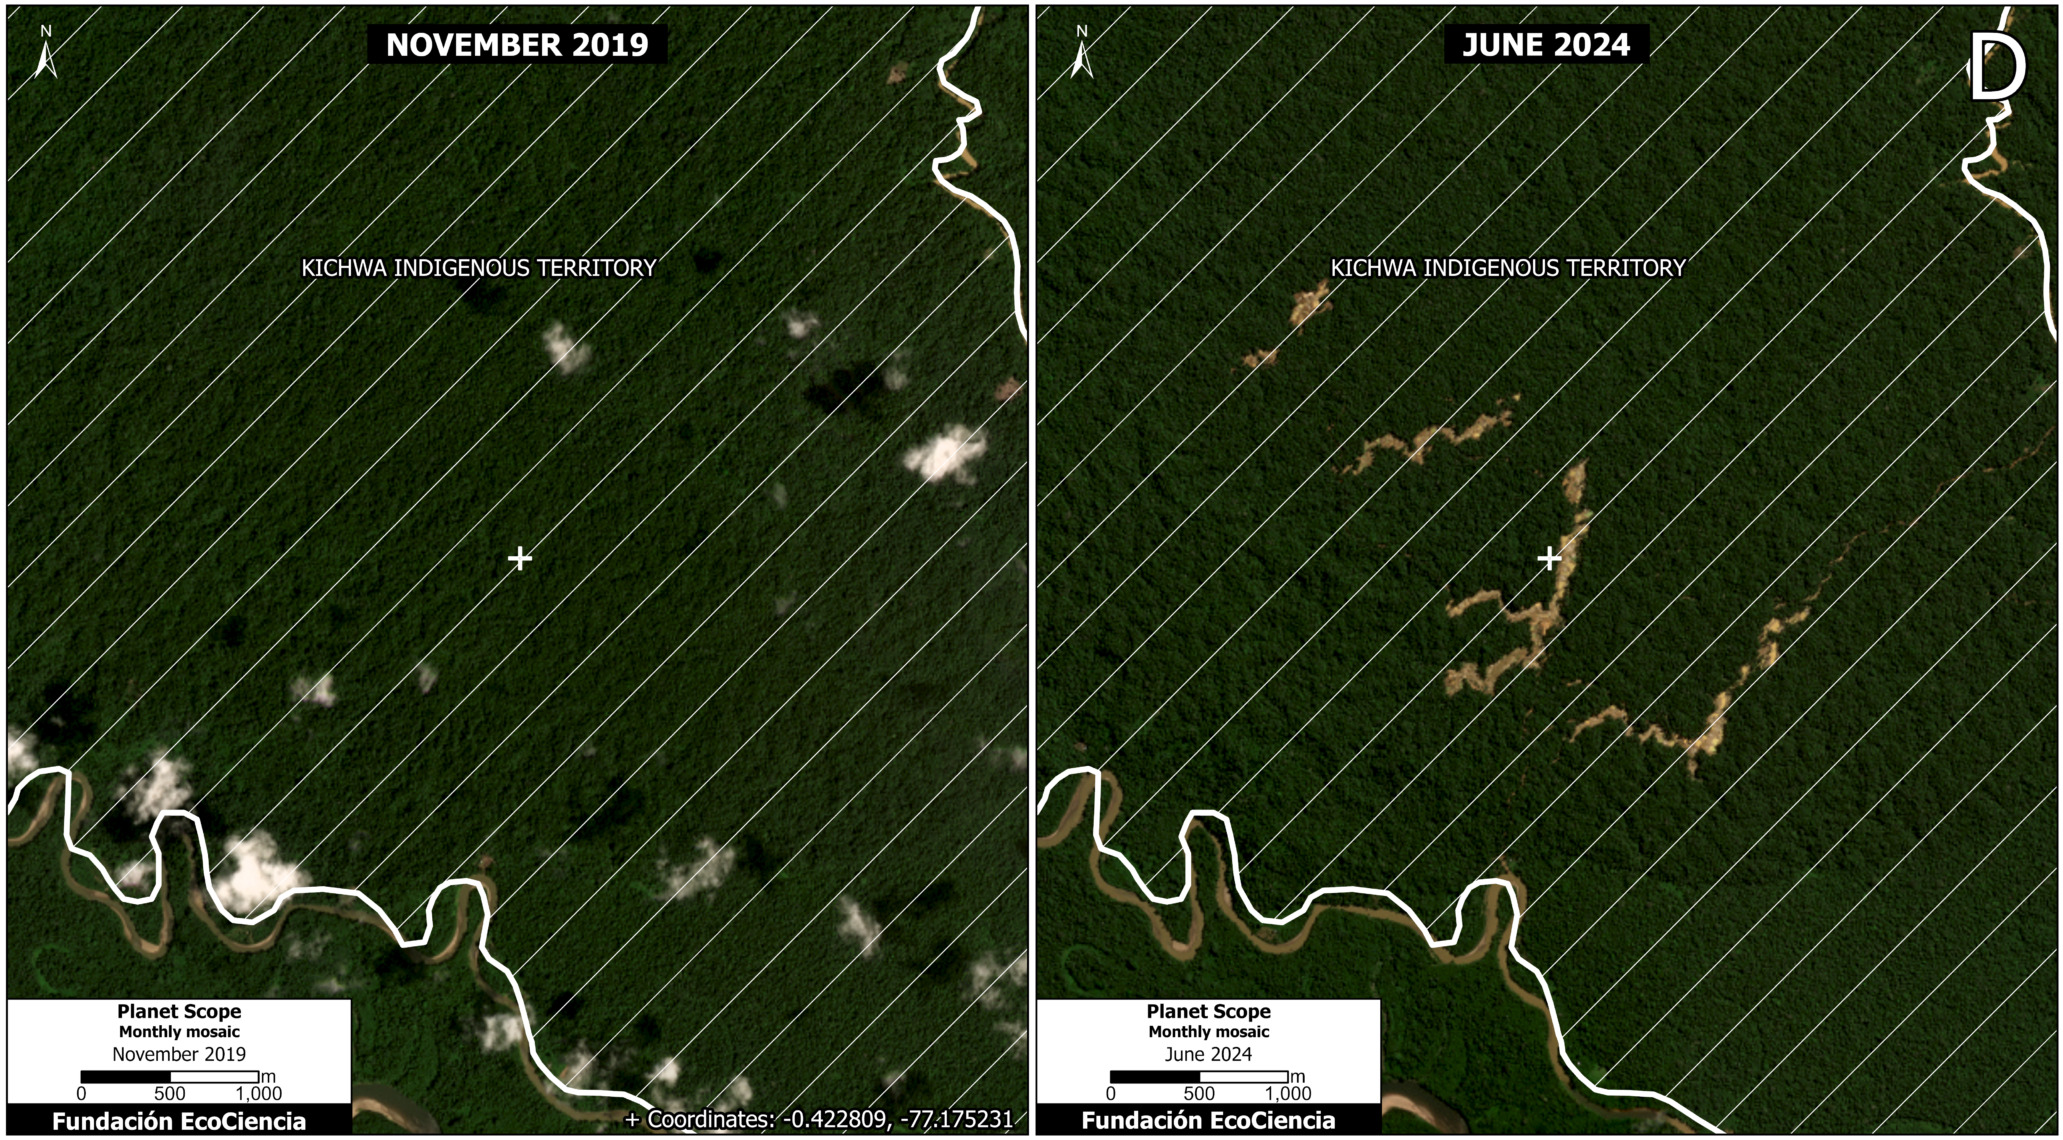
Figure 6 shows the expansion of deforestation due to mining in indigenous territories of the Kichwa nationality south of the study area between November 2019 (left panel) and June 2024 (right panel).

Figure 6. Mining deforestation within indigenous territory of the Kichwa nationality, comparing November 2019 (left panel) with June 2024 (right panel). Data: RAISG 2023, Planet-NICFI, EcoCiencia.


Annex 1

Annex 1 shows the four watersheds impacted by mining activity: the Punino River basin and also the Sardinas River, Lumucha River and Supayacu River basins, which in turn form part of the Coca River macro-water system.

Annex 1. Water systems impacted by mining activity in the Punino area.


Annex 2

Annex 2 shows the construction of 91 kilometers of roads due to mining activity.

Annex 2. Construction of access roads associated with mining activity.

Acknowledgements

This report is part of a series focused on the Ecuadorian Amazon through a strategic collaboration between the EcoCiencia Foundation and Amazon Conservation, with the support of the Norwegian Agency for Development Cooperation (Norad).

MAAP #218: Killing of Environmental Defenders in the Peruvian Amazon


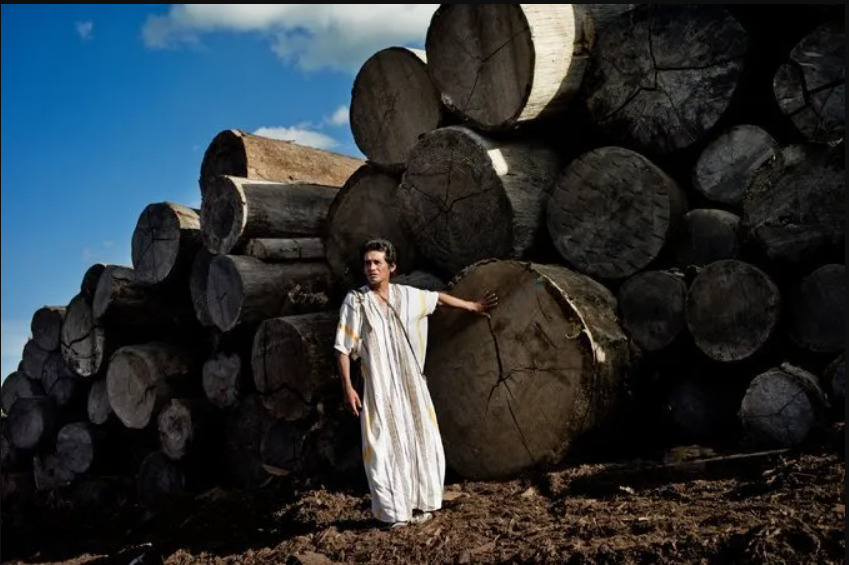
Peruvian environmental defender Edwin Chota was murdered by illegal loggers in 2014 for attempting to protect his Indigenous community from Exploitation. See Illegal Logging section. Photo: NYT/Tomas Munita.


Amazon Conservation’s MAAP program specializes in reporting on the most urgent deforestation threats facing the Amazon and producing big-picture analyses of key Amazon-wide issues.

This report uniquely presents a view into the complicated but critical issue of murders of environmental defenders, examining the relationship between the location of these killings and deforestation in the Peruvian Amazon to provide a better understanding of the context of their deaths.

Between 2010 and 2022, an estimated 29 Peruvian environmentalists and Indigenous leaders were killed while defending various parts of Peru’s Amazon from invaders seeking to exploit its resources (RAISG 2022).

Importantly, the frequency of these murders has increased in recent years, with nearly half (14 out of 29) occurring since 2020.
Our findings indicate that these murders are connected to five major issues in the Peruvian Amazon:
Illegal gold mining, Illegal logging, Illicit crops (coca), Land trafficking, and Protesting.

This report focuses on the first three (Illegal gold mining, Illegal logging, and Illicit crops).

Base Map

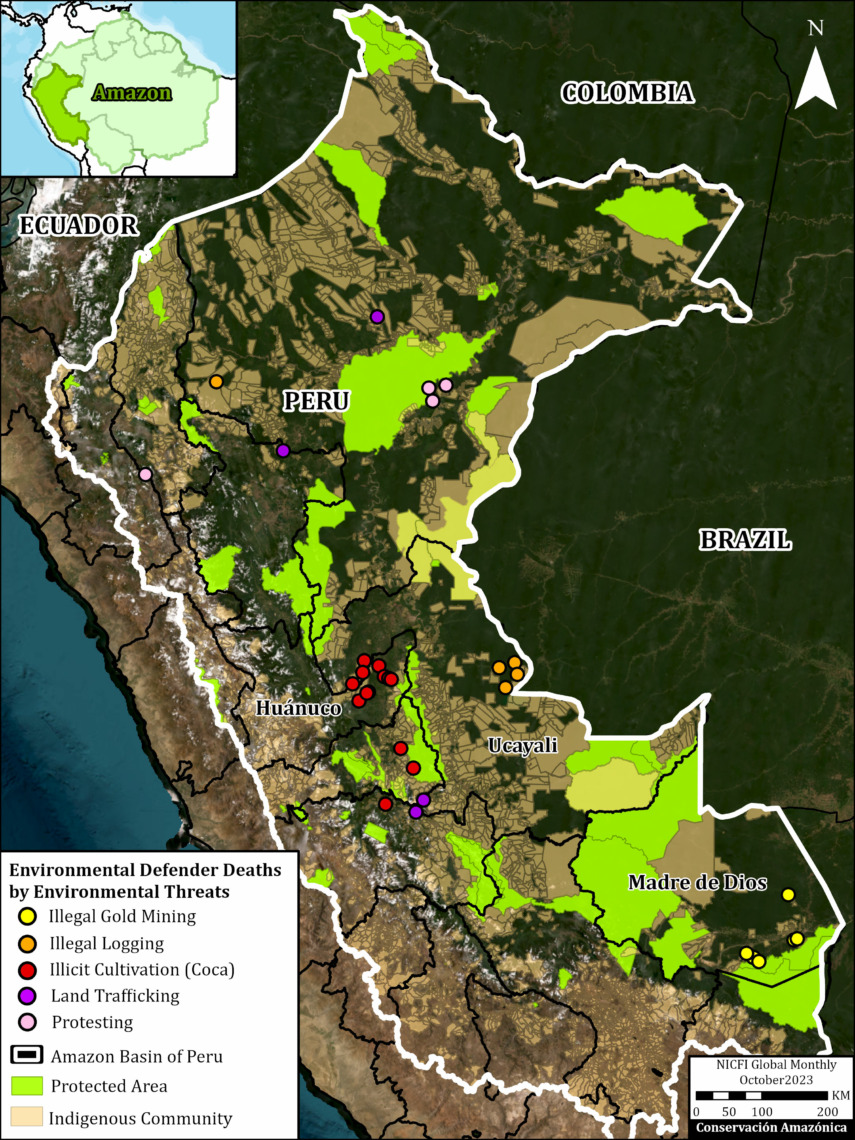
Base Map. Location of the 29 environmental defenders murdered in Peru and the suspected causes related to major environmental threats in the region 2010-2022. Sources: IBC, MINJUS, SERNANP, Conservación Amazónica-ACCA.

The Base Map shows the location of the 29 documented environmental defenders killed in Peru between 2010-2022.

It also indicates the environmental threat related to each death as the suspected or confirmed motive for the crime: Illegal Gold Mining, Illegal Logging, Illicit Crops (coca), Land Trafficking, and Protest.

Note that many of the murders occurred in geographic clusters that coincide with the major environmental conflict of that specific area.

For example, gold mining is a major cause of conflict in the southern Peruvian Amazon, while illegal logging and illicit crops are more common threats in the central Peruvian Amazon.

Murders related to Illegal Gold Mining

Illegal gold mining has long been, and continues to be, a major issue in the southern Peruvian Amazon (Madre de Dios region), particularly in Indigenous territories and protected area buffer zones (MAAP#208).

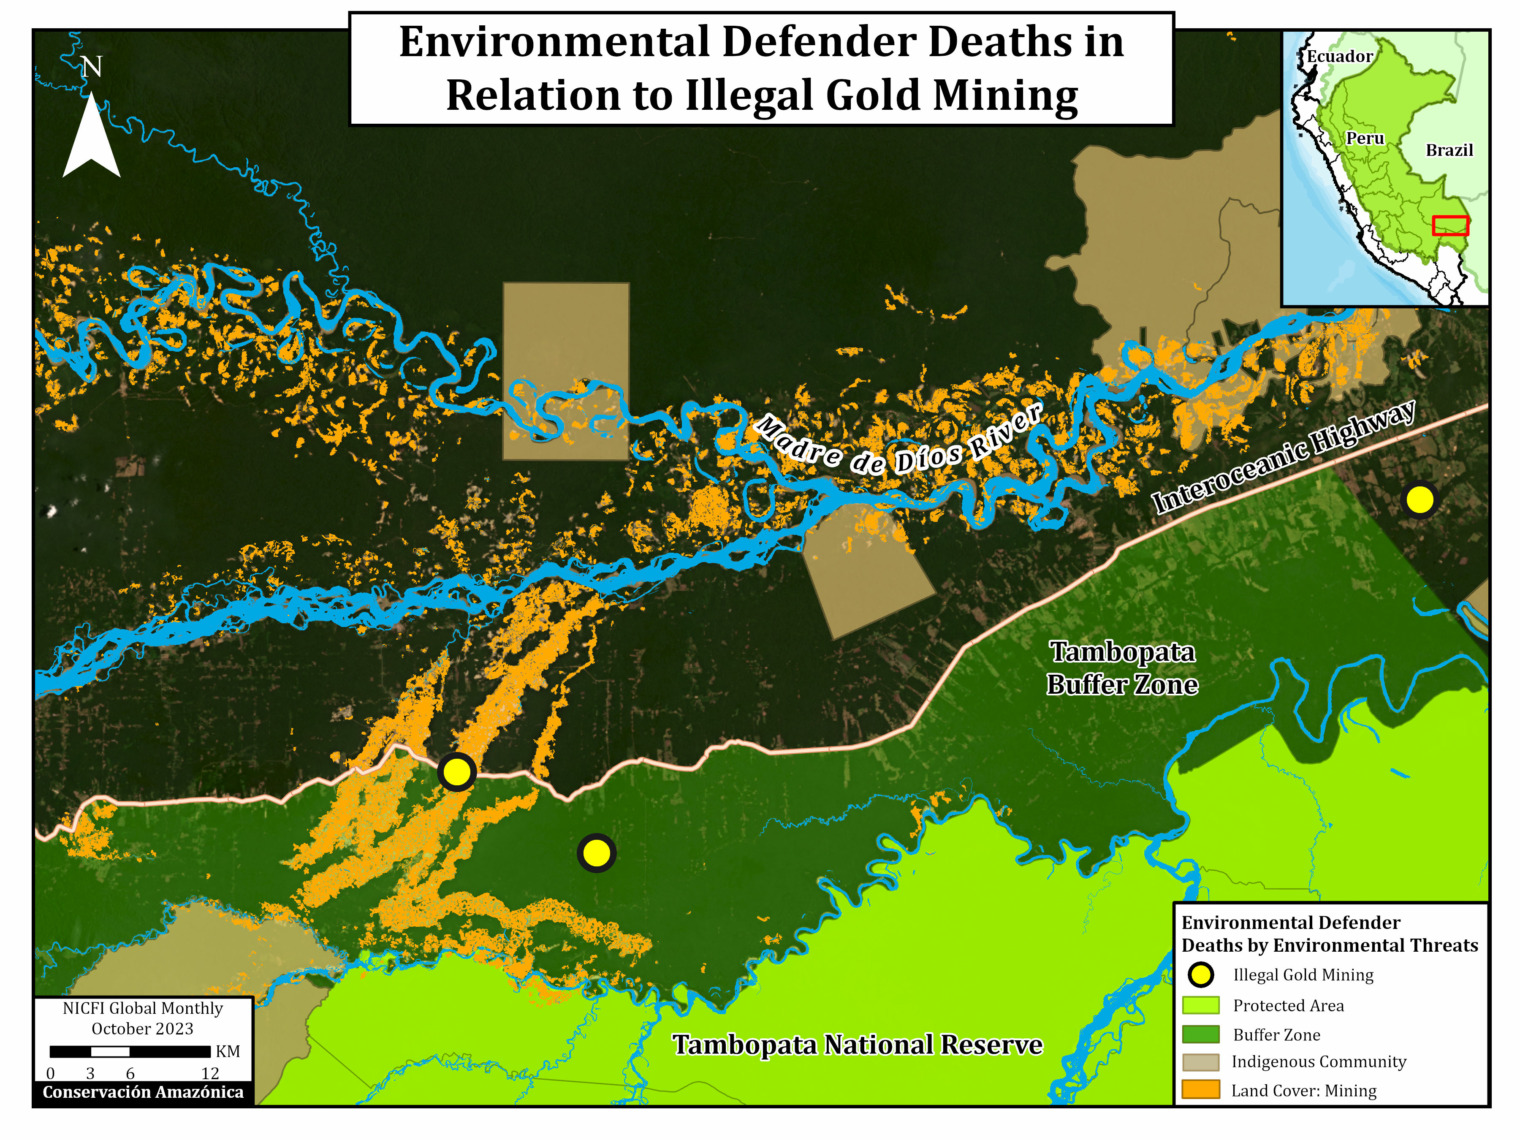
For example, Figure 1 illustrates the extensive gold mining deforestation (indicated in orange) in the Tambopata National Reserve buffer zone and surrounding Indigenous territories.

Figure 1. Three cases of environmental defender deaths related to illegal mining. Sources: IBC, MINJUS, SERNANP, Conservación Amazónica-ACCA.

Since 2015, three environmental defenders have been killed within or near the Tambopata National Reserve buffer zone (see yellow dots in Figure 1). All three cases involved forestry concessionaires trying to defend their concession from illegal mining invasion.

In 2015, Alfredo Vracko Neuenschwander was killed near the critical mining area known as “La Pampa” located in the core of the buffer zone. Note that during the two years prior to his death, more than 1,700 hectares were deforested in La Pampa due to illegal gold mining (MAAP #1). Vracko, who was president of the Madre de Dios Federation of Forestry and Reforestation Concessionaires at the time, is believed to have been killed by illegal miners who were scheduled to be evicted from his forestry concession on the same day. However, his murder remains officially unsolved.

In 2020, Roberto Carlos Pacheco Villanueva was killed just outside the Tambopata buffer zone. Villanueva owned a forestry concession that had been illegally deforested and burned by invaders linked to illegal mining. Having filed legal complaints about the illegal use of his land, Villanueva faced numerous threats against his life in the years leading up to his murder. While still unsolved, it is believed that his murder was committed by the same miners who invaded his concession.

More recently, in 2022, Juan Julio Fernández Hanco was murdered just off the Interoceanic Highway near the edge of the Tambopata buffer zone. During this period (2021-2023), nearly 24,000 hectares were deforested due to gold mining in this area (MAAP #195). The investigation is ongoing, with the suspects being illegal miners who invaded Juan Julio’s reforestation concessions.

Murders related to Illegal Logging

Illegal logging has been a significant problem across the Peruvian Amazon for years. A recent report revealed that over 20% of timber harvested in Peru in 2021 came from illegal origins (OSINFOR, 2024). Loreto, Madre de Dios, Amazonas, and Ucayali were identified as the regions with the highest levels of unauthorized timber extraction.

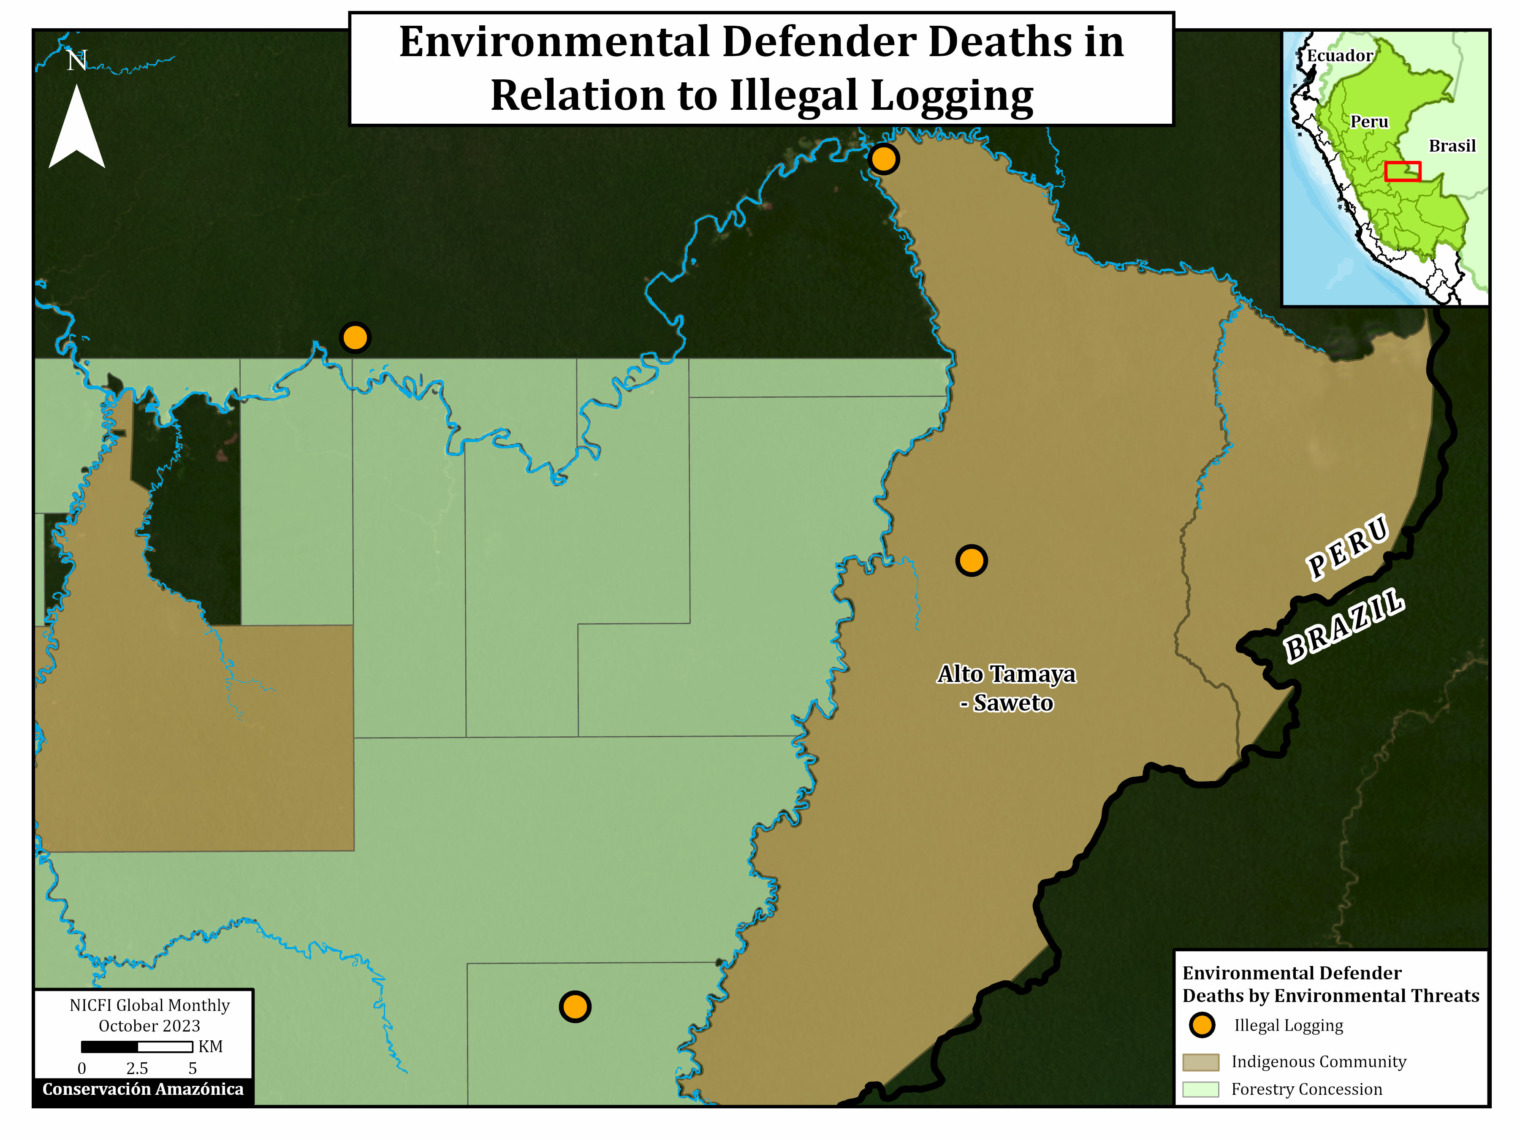
Figure 2. Four environmental defender deaths related to illegal logging. Sources: IBC, MINJUS, DEVIDA, SERNANP, ACCA.

In 2014, illegal loggers murdered four men from the community of Alto Tamaya-Saweto, in one of the most well-known murder cases of Peruvian environmental defenders. These defenders (Edwin Chota Valera, Francisco Pinedo Ramírez, Jorge Ríos Pérez, and Leoncio Quintisima Meléndez) were killed along the Peru-Brazil border (see orange dots in Figure 2), following a decade of complaints from Chota about the presence of criminal logging groups in their community. Ten years later, in April 2024, a group of loggers were found guilty of the murders and sentenced to nearly 30 years in prison. This case has since been appealed with the expectation of going to Peru’s supreme court.

Murders related to Illicit Crops (Coca)

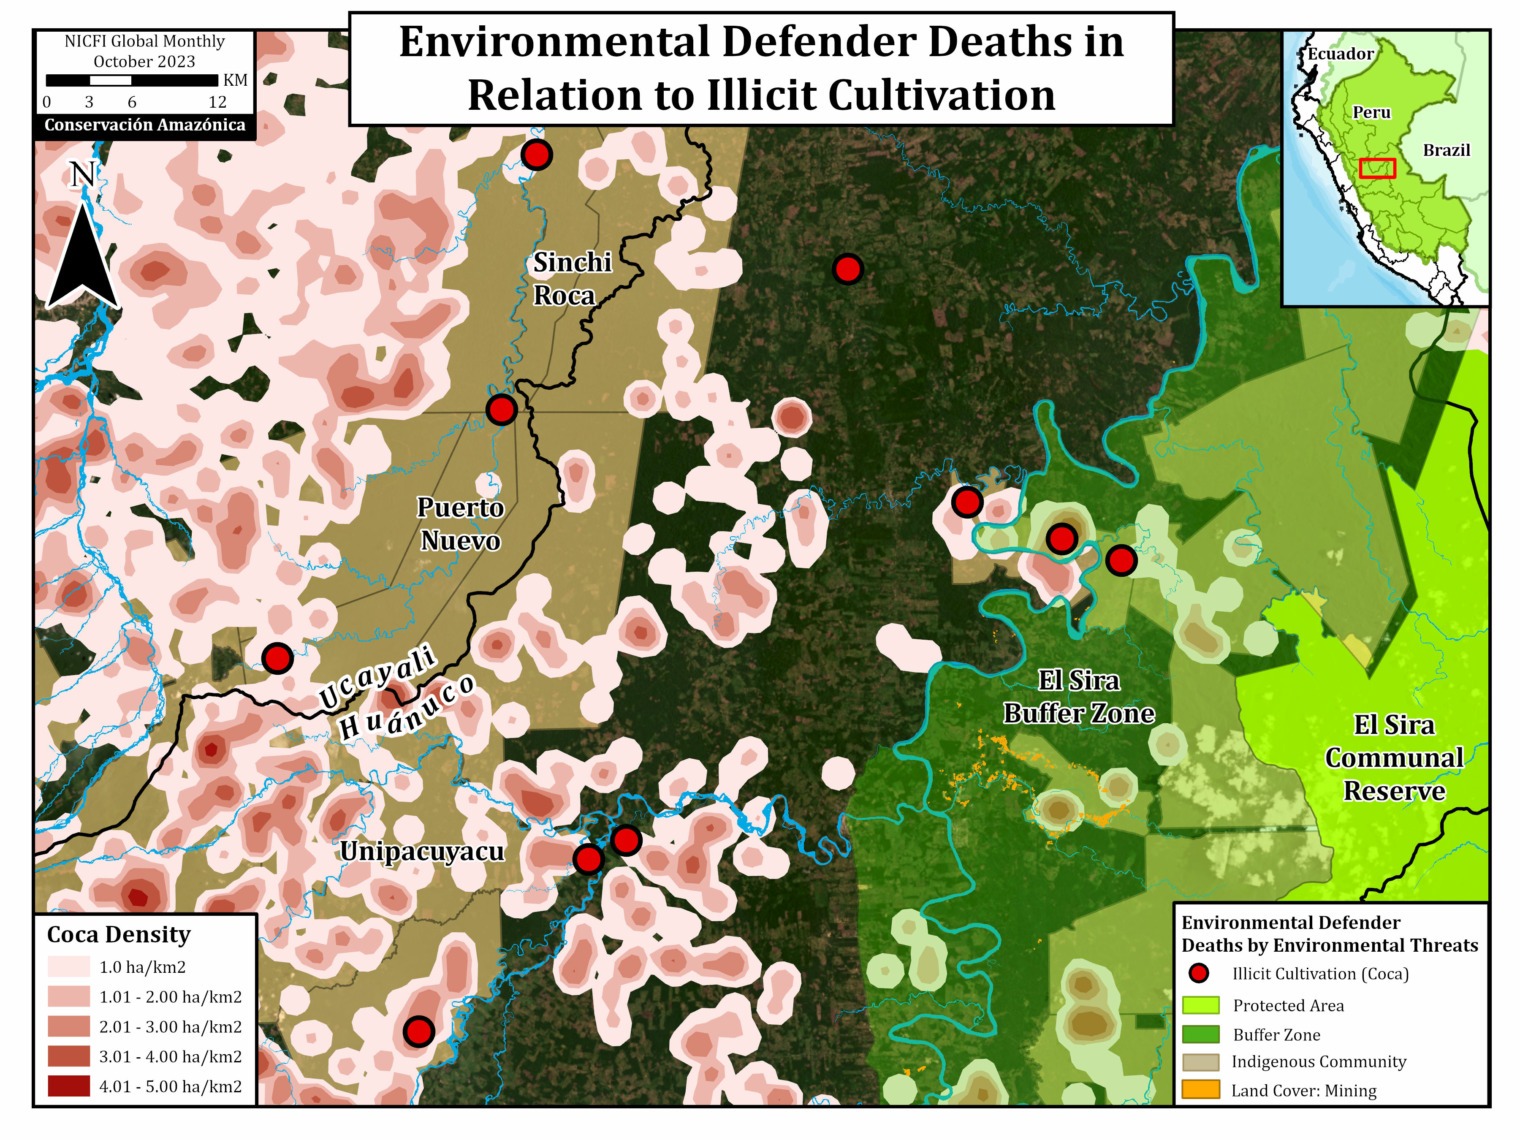
Official data indicates that the surface area of coca production in Peru continues to increase, particularly in the central Peruvian Amazon along the Andes Mountains (in the regions of Ucayali and Huánuco). Since 2010, ten environmental defenders have been killed in this area related to their fight against coca-related activities (see red dots in Figure 3).

Figure 3. Ten cases of environmental defender deaths related to illegal coca production. Sources: IBC, MINJUS, DEVIDA, SERNANP, Conservación Amazónica-ACCA.

Three environmental defenders (Santiago Vega Chota, Yenes Ríos Bonsano, and Herasmo García Grau) were killed in 2020 and 2021 within or near their communities of Sinchi Roca and Puerto Nuevo in the region of Ucayali, following their attempts to monitor their communities’ territories for coca production. Both communities are located within a coca production zone known as Aguaytía, which experienced a 158% increase in coca cultivation between 2018 and 2022 (DEVIDA 2022).

Between 2010 and 2020, four environmental defenders (Segundo José Reategui, Manuel Tapullima, Justo Gonzales Sangama, and Arbildo Melendez) were murdered in or near the Unipacuyacu Indigenous community. These four deaths have been linked to illegal coca production by outsiders on community lands that have not yet been officially titled by the government, which has facilitated these invasions. Unipacuyacu is located within the Pichis-Palcazu-Pachitea coca production zone spanning the Huánuco and Pasco regions, where coca cultivation increased by more than 450% between 2018 and 2022 (DEVIDA 2022).

Finally, three other environmental defenders (Jesús Berti Antaihua Quispe, Gemerson Pizango Narvaes, and Nusat Parisada Benavides de la Cruz) were killed in 2022 in their communities of Santa Teresa and Cleyton. These two indigenous communities are located within and just outside of the in an area outside of the El Sira Communal Reserve buffer zone. During the four years leading up to their deaths, coca production in El Sira and its buffer zone increased by over 500% (DEVIDA 2022). While unconfirmed, it is believed that these murders were committed by mafias tied to drug trafficking and illegal mining.

Regulatory Basis

Peru ranks among the countries with the highest number of environmental defender deaths worldwide (Global Witness 2023).

Peru’s National Plan for Human Rights 2018-2021, defines an environmental defender as someone who: As an individual or collective, carries out a legitimate activity, paid or not, consisting of demanding and promoting, within the legally permitted framework, in a peaceful and nonviolent manner, the effectiveness of violated rights. Their efforts are usually manifested publicly through demands and raised through regular process channels, conforming with the framework devoted to these fundamental rights.

To address the vulnerability of environmental defenders, the Peruvian government, specifically the Ministry of Justice and Human Rights (MINJUSDH), has developed regulations to ensure their protection. The most important of these are:

Regulation Title Importance
 

Supreme Decree N 002-2018-JUS


National Plan for Human Rights 2018-2021

Establishes that environmental defenders are a group of special protection and requests that the state adopts measures to protect them.
 

Supreme Decree 004-2021-JUS


Intersectoral Mechanism for the Protection of Human Rights Defenders

Establishes the principles, measures, and proceedings to guarantee the prevention, protection, and access to justice for human rights defenders prior to risk situations, being the highest ranking standard in the country.
 

Ministerial Resolution 255-2020-JUS


Registry on Risk Situations for Human Rights Defenders


Recognizes, analyzes, and manages information about the risks that human rights defenders face, and adopts actions to prevent threats.


Peru has also taken an intersectoral approach by coordinating participation among eight ministries: Ministry of Justice and Human Rights, Ministry of the Interior, Ministry of the Environment, Ministry of Culture, Ministry of Woman and Vulnerable Populations, Ministry of External Relations, Ministry of Energy and Mines, and Ministry of Agriculture and Irrigation Development. A public implementing agency, the National Commission for Development and Life Without Drugs (DEVIDA), also cooperates with this effort.

Despite these efforts, defenders continue to face criminalization, legal harassment, and threats of violence and murder. This shows the urgent need to strengthen their protection and institutional support in Peru.

In response, the Peruvian Congress has recently enacted three new laws to further protect human rights defenders. These include (i) Bill 4686/2022-CR, a law that recognizes and protects defenders of environmental rights, and (ii) Bill 2069/2021-PE, a law for the protection and assistance of communal and/or Indigenous or native leaders at risk. Moving forward, how the ongoing Alto Tamaya-Saweto case proceeds through Peru’s Supreme Court will be crucial to future efforts to protect environmental and human rights defenders.

References

Comisión Nacional Para El Desarrollo y Vida Sin Drogas (DEVIDA). 2023. Perú: Monitoreo de cultivos de coca 2022.

Global Witness 2023. Casi 2.000 personas defensoras de la tierra y el medioambiente asesinadas entre 2012 y 2022 por proteger el planeta.

Organismo de Supervisión de los Recursos Forestales y de Fauna Silvestre (OSINFOR). 2024. Estimación del índice y porcentaje de tala y comercio ilegal de madera en el Perú 2021.

Red Amazónica de Información Socioambiental Georreferenciada (RAISG). 2022. Presiones, amenazas y violencia en la Amazonía peruana.

Acknowledgments

This report was prepared with support from the Instituto de Bien Común (IBC).

Citation

Montoya M, Bonilla A, Novoa S, Tipula P, Salisbury D, Quispe M, Finer M, Folhadella A, Cohen M (2024) Killing of Environmental Defenders in the Peruvian Amazon. MAAP:218.

MAAP #215: Unprecedented Look at Carbon across the Amazon (part 1)

Figure 1. Example of Planet Forest Carbon Diligence, focused on southern Peru and adjacent western Brazil.

The Amazon biome has long been one of the world’s largest carbon sinks, helping stabilize the global climate.

Precisely estimating this carbon, however, has been a challenge. Fortunately, new satellite-based technologies are providing major advances, most notably NASA’s GEDI mission (see MAAP #213) and, most recently, Planet Forest Carbon Diligence.1

Here, we focus on the latter, analyzing Planet’s cutting-edge new dataset, featuring a 10-year historical time series (2013 – 2022) with wall-to-wall estimates for aboveground carbon density at 30-meter resolution.

As a result, we can produce high-resolution aboveground carbon maps and estimates for anywhere and everywhere across the vast Amazon (see Figure 1).

Through a generous sharing agreement with Planet, we have been granted access to this data across the entire Amazon biome for the analysis presented in the following three-part series:

  1. Estimate and illustrate total aboveground forest carbon across the Amazon biome in unprecedented detail (see results of this first report, below).
    j
  2. Highlight which parts of the Amazon are home to the highest aboveground carbon levels, including protected areas and Indigenous territories (see second report, MAAP #217).
    l
  3. Present emblematic deforestation cases that have resulted in the highest aboveground carbon emissions across the Amazon (see third report, MAAP #220).

Major Results

Carbon across the Amazon

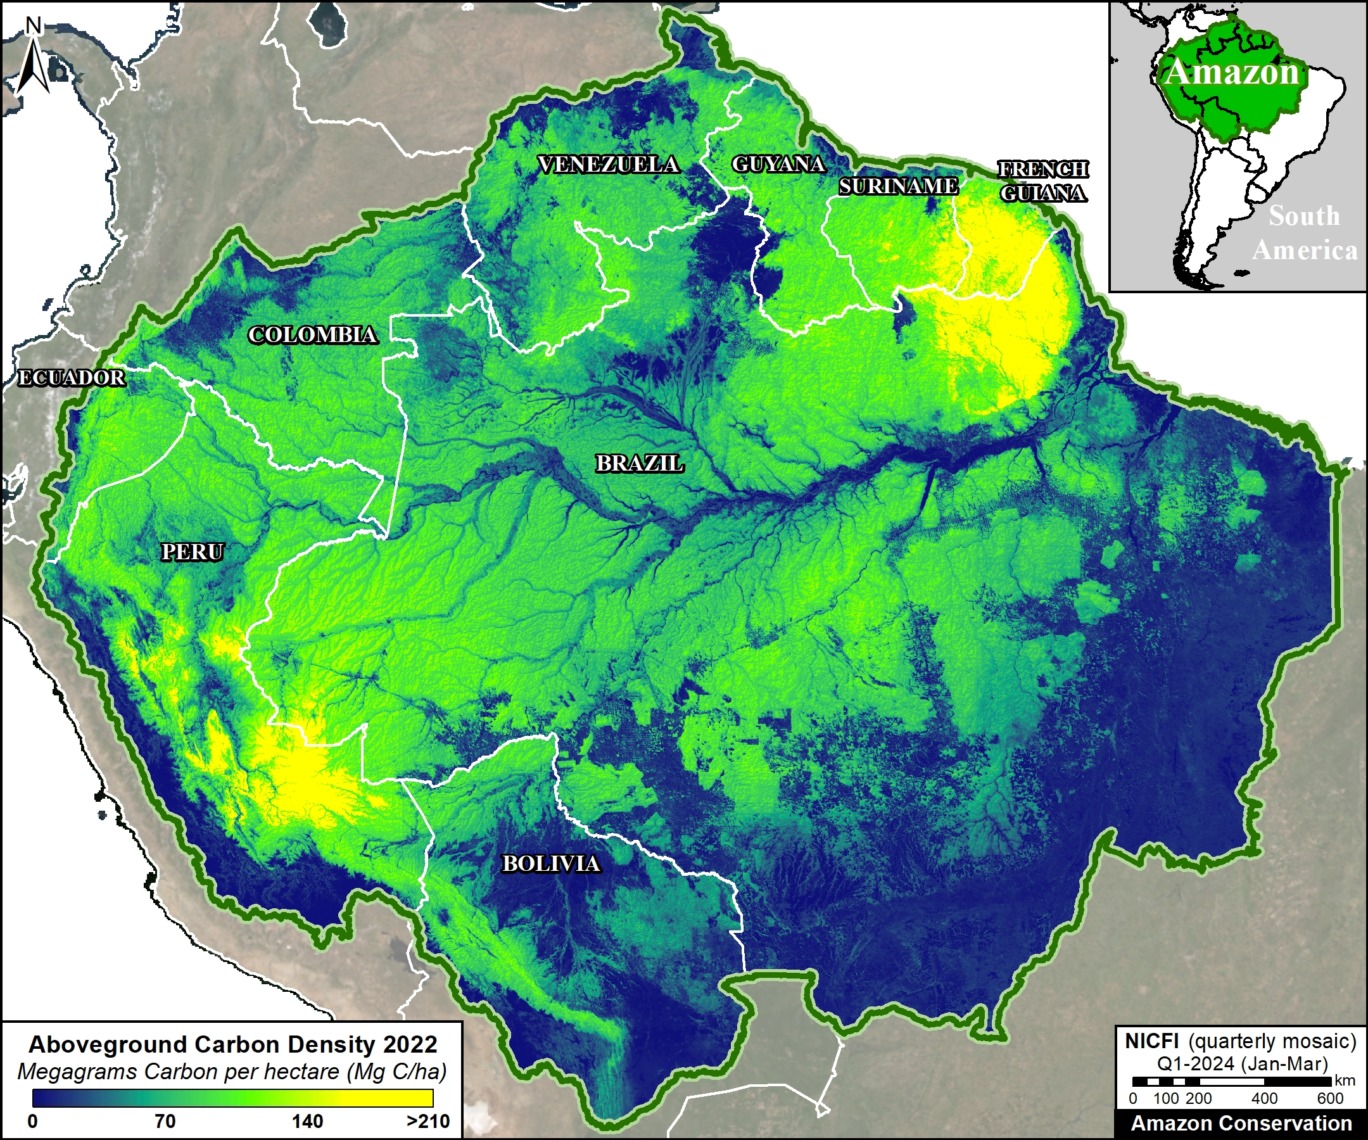
Based on our analysis of Planet Forest Carbon Diligence, we estimate that the Amazon contained 56.8 billion metric tons of aboveground carbon, as of 2022 (see Base Map). Applying a standard root-to-shoot ratio conversion (26%), this estimate increases to 71.5 billion metric tons of above and belowground carbon. This total is equivalent to nearly two years of global carbon dioxide emissions at the peak 2022 level (37.15 billion metric tons).5

The peak carbon levels are largely concentrated in the southwest Amazon (southern Peru and adjacent western Brazil) and northeast Amazon (northeast Brazil, French Guiana, and Suriname).

Base Map. Planet Forest Carbon Diligence across the Amazon biome.

Total Carbon by Country

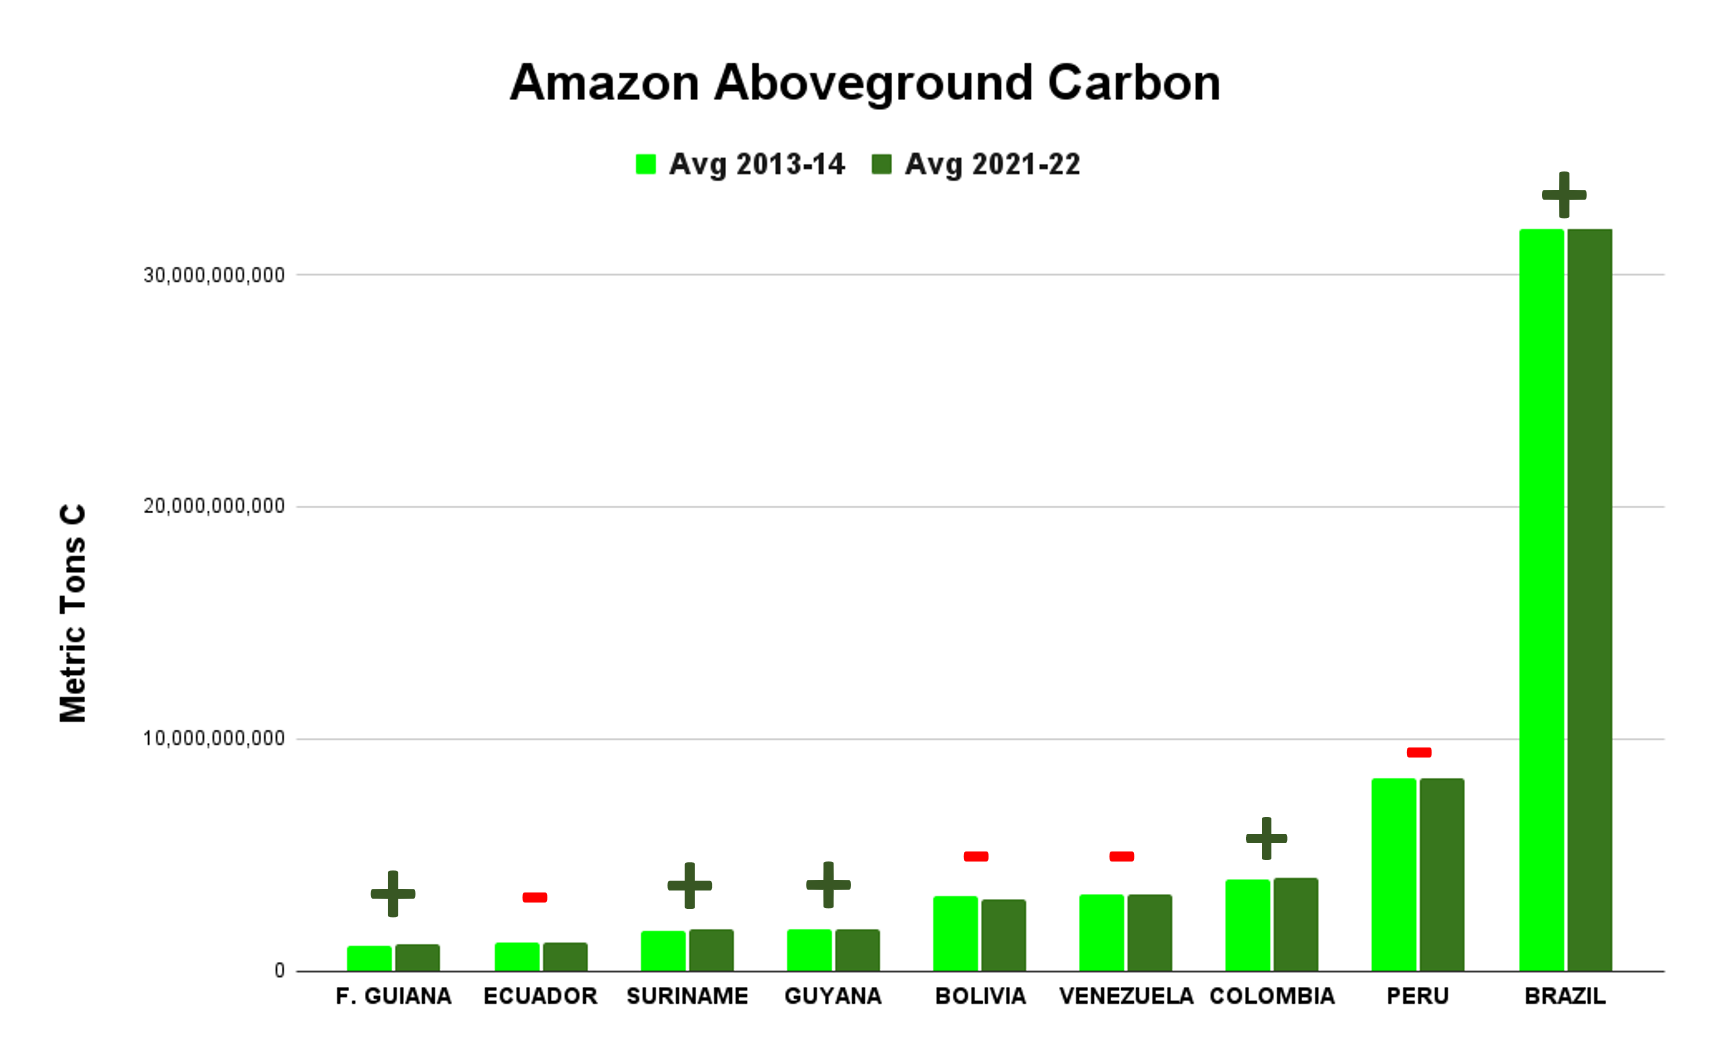
As shown in Graph 1, countries with the most aboveground carbon are 1) Brazil (57%; 32.1 billion metric tons), 2) Peru (15%; 8.3 billion metric tons), 3) Colombia (7%; 4 billion metric tons), 4) Venezuela (6%; 3.3 billion metric tons), and 5) Bolivia (6%; 3.2 billion metric tons). These countries are followed by Guyana (3%; 2 billion metric tons), Suriname (3%; 1.6 billion metric tons), Ecuador (2%; 1.2 billion metric tons), and French Guiana (2%; 1.1 billion metric tons).

Overall, we documented the total gain of 64.7 million metric tons of aboveground carbon across the Amazon during the ten years between 2013 and 2022.2 In other words, the Amazon is still functioning as a critical carbon sink.

The countries with the most aboveground carbon gain over the past ten years are 1) Brazil, 2) Colombia, 3) Suriname, 4) Guyana, and 5) French Guiana. Note that we show Brazil as a carbon sink (gain of 102.8 million metric tons), despite other recent studies showing it as a carbon source.3 Also note the important gains in aboveground carbon across several key High Forest cover, Low Deforestation (HFLD) countries, namely Colombia, Suriname, Guyana, and French Guiana.4

In contrast, the countries with the most aboveground carbon loss over the past ten years are 1) Bolivia, 2) Venezuela, 3) Peru, and 4) Ecuador.

Graph 1. Planet Forest Carbon Diligence data across the Amazon biome, comparing 2013-14 with 2021-22. Note that a “+” symbol indicates that the country gained aboveground carbon, while a “-“ symbol indicates that the country lost aboveground carbon.

Carbon Density by Country

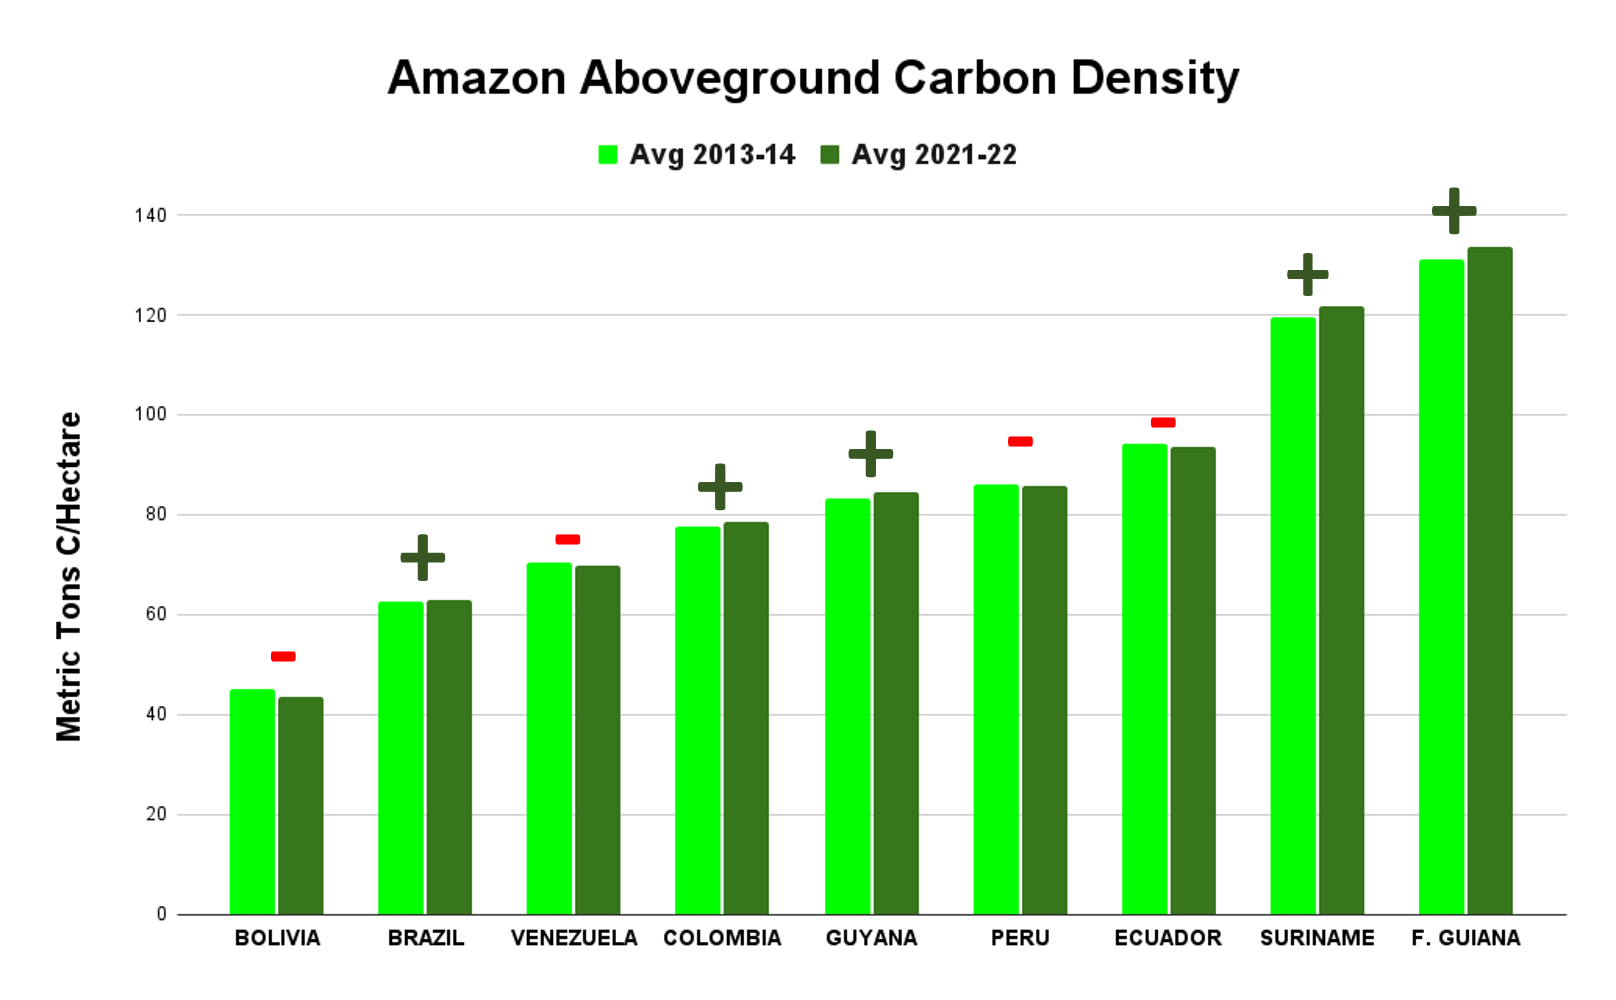
Standardizing for area, Graph 2 shows that countries with the highest aboveground carbon density (that is, aboveground carbon per hectare as of 2021-22) are located in the northeast Amazon: French Guiana (134 metric tons/hectare), Suriname (122 metric tons/hectare), and Guyana (85 metric tons/hectare). Ecuador is also high (94 metric tons/hectare).

Note that countries in the northeast Amazon (French Guiana, Suriname, and Guyana) have lower total aboveground carbon due to their smaller size (Graph 1), but high aboveground carbon density per hectare (Graph 2). This also applies to Ecuador.

Graph 2. Planet Forest Carbon Diligence data for aboveground carbon density by country across the Amazon, comparing 2013-14 with 2021-22. Note that a “+” symbol indicates that the country gained aboveground carbon, while a “-“ symbol indicates that the country lost aboveground carbon.

Notes & Citations

1 Anderson C (2024) Forest Carbon Diligence: Breaking Down The Validation And Intercomparison Report. https://www.planet.com/pulse/forest-carbon-diligence-breaking-down-the-validation-and-intercomparison-report/

2 In terms of uncertainty, the data contains pixel-level estimates, but not yet at national levels. To minimize annual uncertainty at the country level, we averaged 2013 and 2014 for the baseline and 2021 and 2022 for the current state.

3 Recently, in MAAP #144, we showed Brazil as a carbon source, based on data from 2001 to 2020. In contrast, Planet Forest Carbon Diligence is based on data from 2013 to 2022. Thus, one interpretation of the difference is that most carbon loss occurred in the first decade of the 2000s, which is consistent with historical deforestation data showing peaks in the early 2000s. It also highlights the likely importance of the interplay between forest loss/degradation (carbon loss) and forest regeneration (carbon gain) in terms of whether a country is a carbon source or sink during a given timeframe.

4 HFDL, or “High Forest cover, Low Deforestation” describes countries with both a) high forest cover (>50%) and low deforestation rates (<0.22% per year). For more information on HFDL, see https://www.conservation.org/blog/what-on-earth-is-hfld-hint-its-about-forests

5 Annual carbon dioxide (CO₂) emissions worldwide from 1940 to 2023

Citation

Finer M, Mamani N, Anderson C, Rosenthal A (2024) Unprecedented Look at Carbon across the Amazon. MAAP  #215.


MAAP #216: Uncontacted Indigenous group threatened by logging in the southern Peruvian Amazon

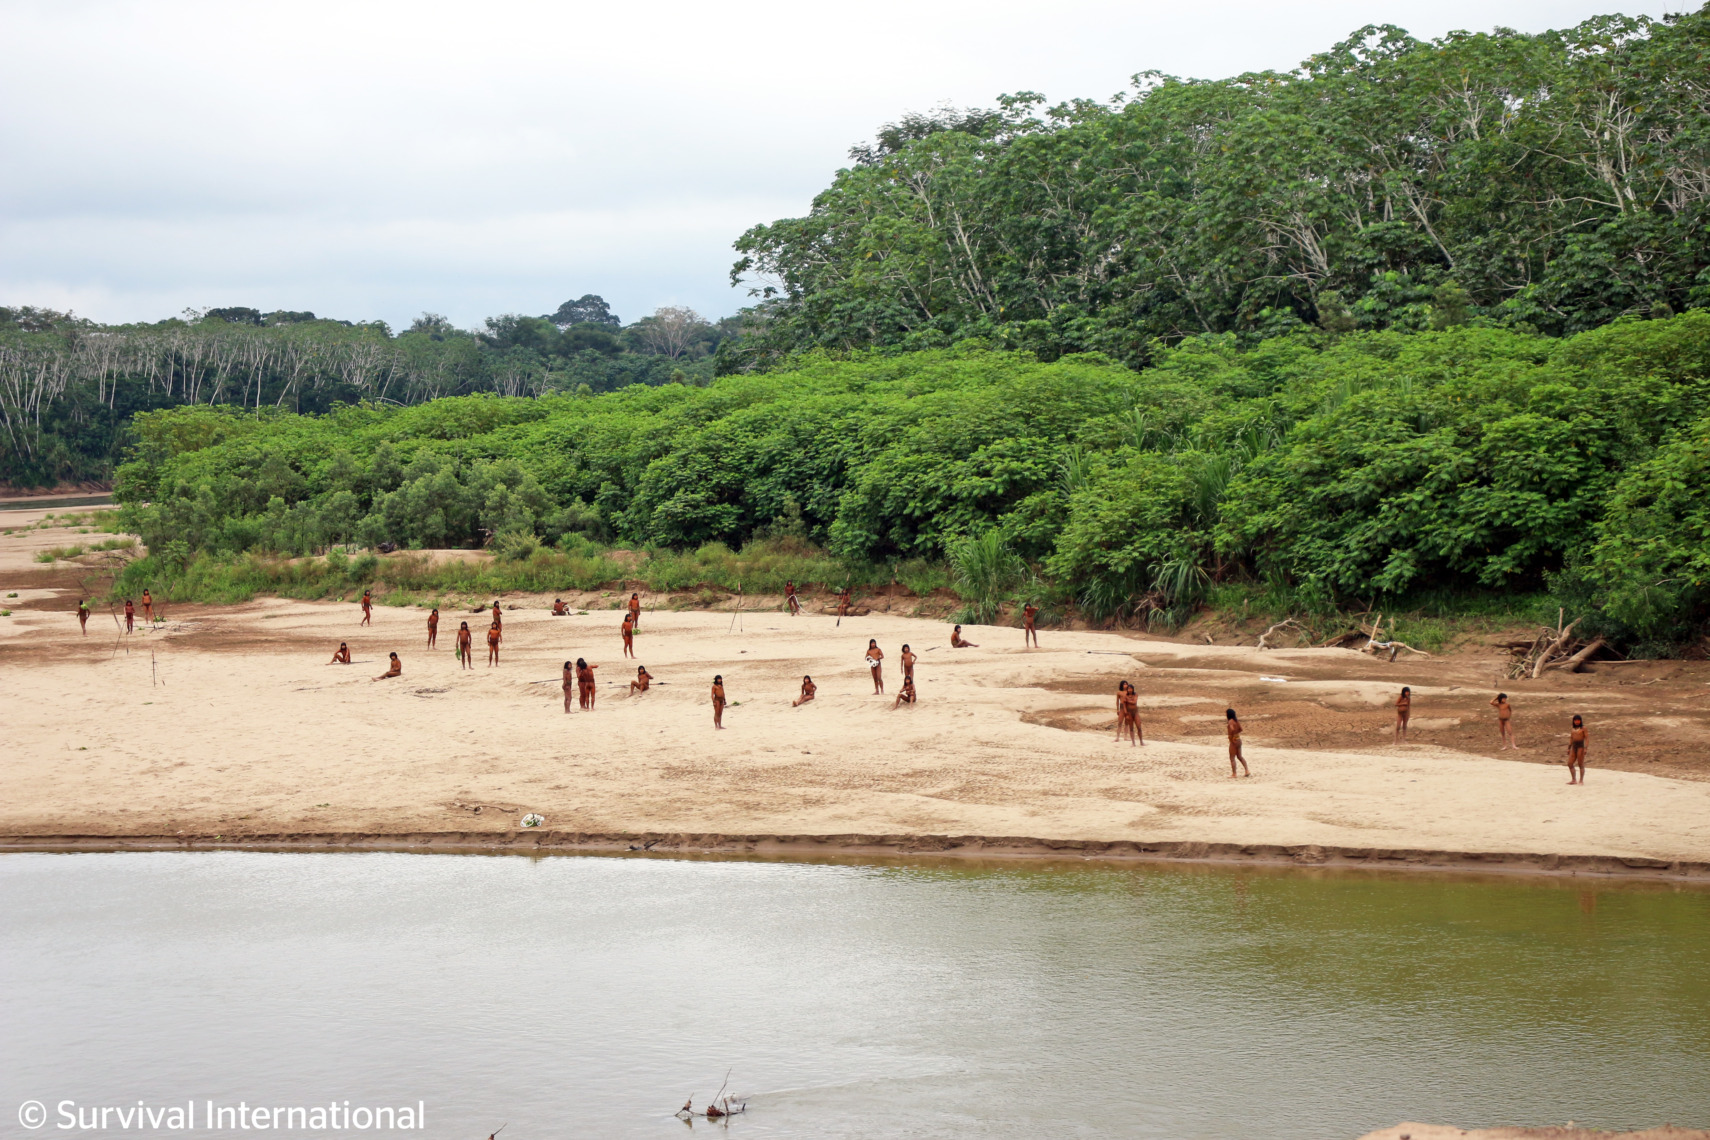
Photo taken from the recent encounter with Mashco Piro along the Las Piedras River, June 2024. Photo: Survival International.

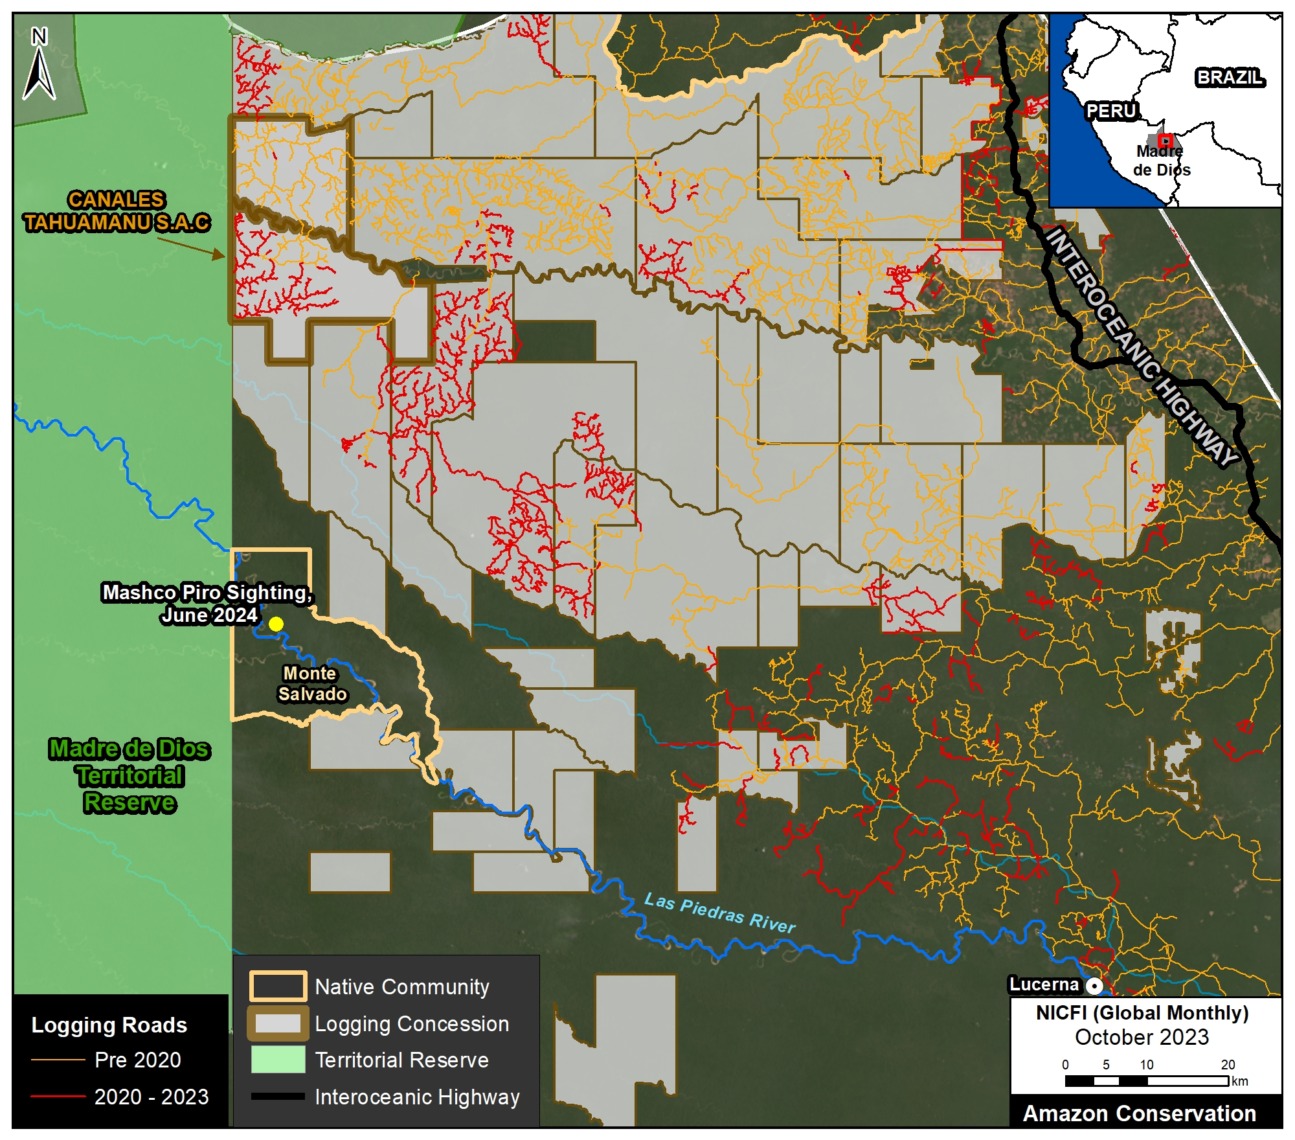
In late June 2024, a large group of Mashco Piro men appeared along the upper Las Piedras River, in the southern Peruvian Amazon (see photo), near the Yine Indigenous community of Monte Salvado.

The Mashco Piro are one of the largest and most emblematic uncontacted Indigenous groups in the world. They live in voluntary isolation in this remote but increasingly threatened area.

The photos and videos of this encounter, released by the organization Survival International, have generated worldwide news about the event.1

On the one hand, local experts and Indigenous representatives indicate that the Mashco Piro were likely searching the exposed riverbanks for turtle eggs, a usual occurrence that time of year when river levels are low.

On the other hand, the encounter also highlighted that the Mashco Piro are increasingly threatened by external pressures, especially by logging concessions granted by the Peruvian government.

In 2002, the Peruvian government created the Madre de Dios Territorial Reserve to protect part of the Mashco Piro territory. However, some of their ancestral territory was left out and granted to logging companies.

Here, we analyze and illustrate the conflict caused by these logging concessions (and their logging roads) in the ancestral territory of the Mashco Piro.

Base Map of the Encounter Area

The Base Map shows the general area where the Mashco Piro recently appeared along the upper Las Piedras River (see “Encounter Area”) in relation to the Madre de Dios Territorial Reserve, logging concessions, and logging roads.

Base Map. Recent Mashco Piro encounter point in relation to logging concessions and logging roads in the southern Peruvian Amazon. Data: SERFOR (logging concessions), Conservación Amazónica-ACCA (logging roads).

Logging Concessions

As mentioned above, although the government created the Madre de Dios Territorial Reserve to protect part of the Mashco Piro territory, their ancestral territory extended over areas now covered by logging concessions, causing the current context of risk and conflict. Much of the area east of the Madre de Dios Territorial Reserve is subject to legalized logging in the ancestral territory.

Survival International’s press release made special note of the fact that some of the companies operating in Mashco Piro territory are additionally legitimized through certificates of sustainable origin and respect for human rights, in particular the concession operated by the company Canales Tahuamanu S.A.C.

Despite its controversial location next to the Madre de Dios Territorial Reserve, this concession is certified by the Forest Stewardship Council (FSC) as a responsible forestry operation that is environmentally appropriate and socially beneficial.

In contrast, the Indigenous Federation FENAMAD (Native Federation of the Madre de Dios River and Tributaries) points out that this concession is within the proposed expansion zone of the Madre de Dios Territorial Reserve, given its importance for the Mashco Piro and the high probability of conflict.

Logging Roads

We also highlight the recent expansion of logging roads,2 which is our best proxy for actual logging activity.

We indicate the most recent logging roads, built between 2020 and 2023, in red. Of these, we estimate the construction of over a thousand kilometers (1,013 km) in the logging concessions east of the Madre de Dios Territorial Reserve.

Most notably, we detect the recent construction of 110 kilometers of new logging roads in the FSC-certified concession operated by Canales Tahuamanu, adjacent to the Madre de Dios Territorial Reserve.

Notes

1 Examples of global coverage on the encounter include CNN, Reuters, and BBC. The original press release was produced by Survival International, and the photos and video they released can be viewed here.

2 Data for logging roads obtained from MOCAF (Monitoreo de Caminos Forestales), an initiative developed by the organization Conservación Amazónica to specifically track logging roads in Peru, within the SERVIR Amazonia Program.

Citation

Finer M, Ariñez A (2024) Uncontacted Indigenous group threatened by logging in the southern Peruvian Amazon. MAAP: 216.

MAAP #214: Agriculture in the Amazon: New data reveals key patterns of crops & cattle pasture

Figure 1. Agricultural and pasture data in a section of the Brazilian Amazon.

A burst of new data and online visualization tools are revealing key land use patterns across the Amazon, particularly regarding the critical topic of agriculture. This type of data is particularly important because agriculture is the leading cause of overall Amazonian deforestation.

These new datasets include:

  • Crops. The International Food Policy Research Institute (IFPRI), a leading agriculture and food systems research authority, recently launched the latest version of their innovative crop monitoring product, the Spatial Production Allocation Model (SPAM).1 This latest version, developed with support from WRI’s Land & Carbon Lab, features spatial data for 46 crops, including soybean, oil palm, coffee, and cocoa. This data is mapped at 10-kilometer resolution across the Amazon and updated through 2020.2
    j
  • Cattle pasture. The Atlas of Pastures,3 developed by the Federal University of Goiás, facilitates access to data regarding Brazilian cattle pastures generated by MapBiomas. This data is mapped at 30-kilometer resolution and updated through 2022. We use Collection 5 from Mapbiomas for the rest of the Amazonian countries.4
    j
  • Gold mining. New mining data is included for additional context. Amazon Mining Watch uses machine learning to map open-pit gold mining.5 This data is mapped at 10-kilometer resolution across the Amazon and updated through 2023.

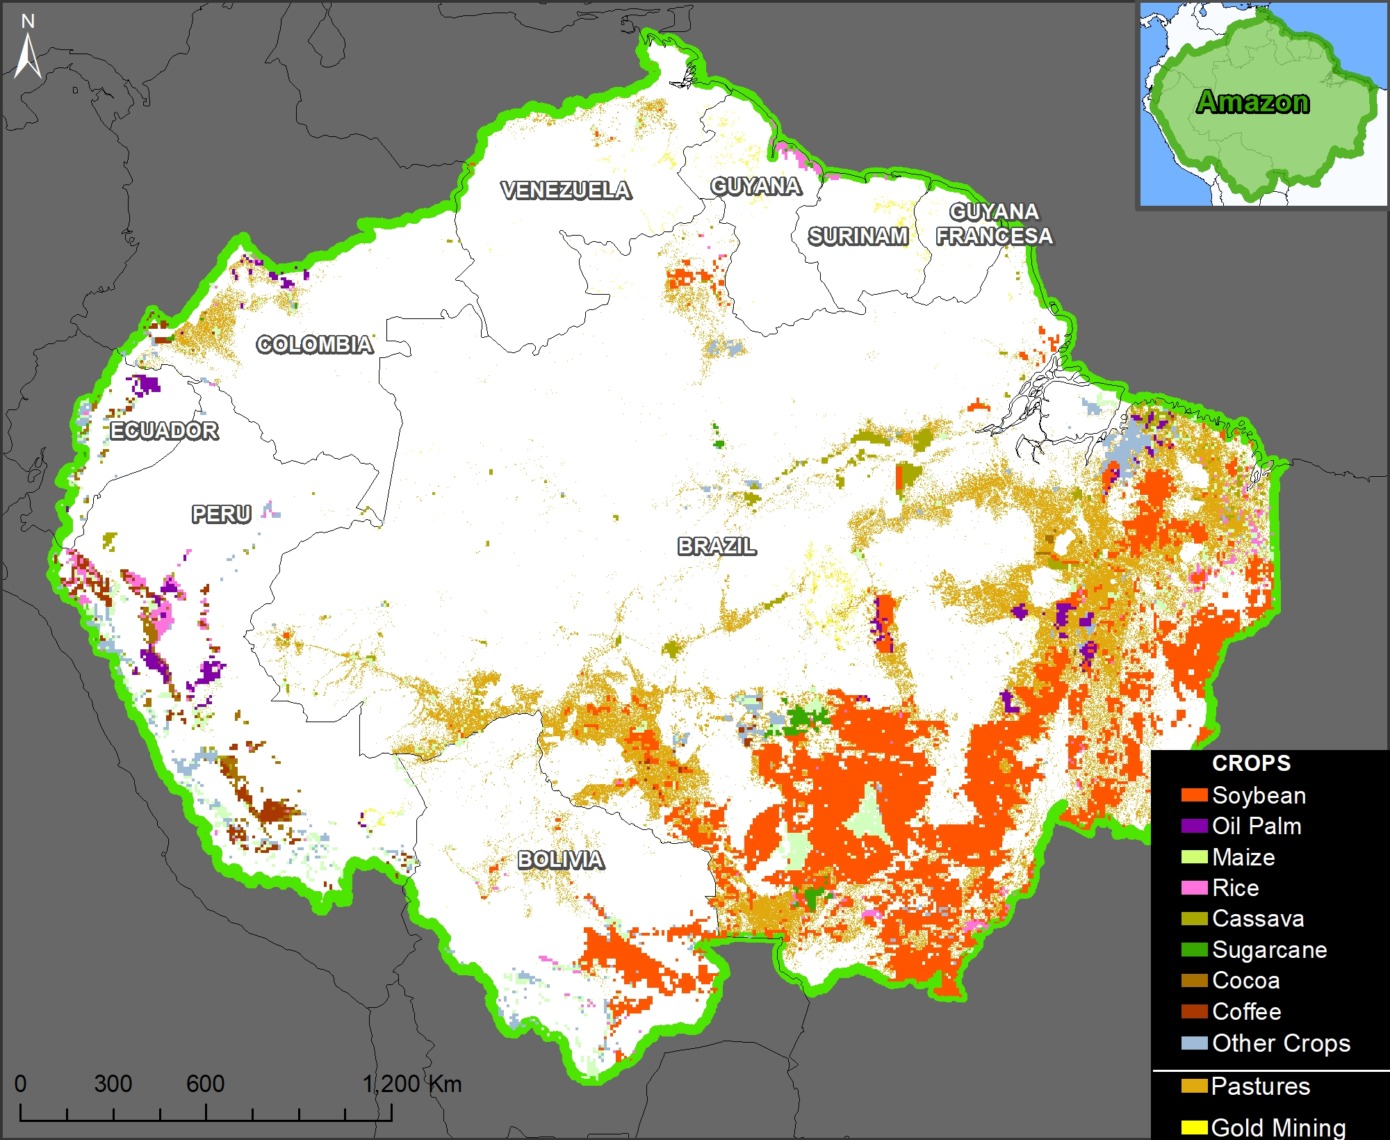
We merged and analyzed these new datasets to provide our first overall estimate of Amazonian land use, the most detailed effort to date across all nine countries of the biome. Figure 1 shows an example of this merged data in a section of the Brazilian Amazon.

Below, we present and illustrate the following major findings across the Amazon, and then zoom in on several regions across the Amazon to show the data in greater detail.

Major Findings

The Base Map illustrates several major findings detailed below.

Base Map. Overview of the merged datasets noted above for crops, pasture, and gold mining. Double-click to enlarge. Data: IFRI/SPAM, Lapig/UFG, Mapbiomas, AMW, ACA/MAAP.

1) Crops
We found that 40 crops in the SPAM dataset overlap with the Amazon, covering over 106 million hectares (13% of the Amazon biome).

Soybean covers over 67.5 million hectares, mostly in southern Brazil and Bolivia. Maize covers slightly more area (70 million hectares) but we consider this a secondary rotational crop with soy (thus, there is considerable overlap between these two crops).

Oil palm covers nearly 8 million hectares, concentrated in eastern Brazil, central Peru, northern Ecuador, and northern Colombia.

In the Andean Amazon zones of Peru, Ecuador, and Colombia, cocoa covers over 8 million hectares and the two types of coffee (Arabica and Robusta) cover 6.7 million hectares.

Other major crops across the Amazon include rice (13.8 million hectares), sorghum (10.9 million hectares), cassava (9.8 million hectares), sugarcane (9.6 million hectares), and wheat (5.8 million hectares).

2) Cattle Pasture
Cattle Pasture covers 76.3 million hectares (9% of the Amazon biome). The vast majority (92%) of the pasture is in Brazil, followed by Colombia and Bolivia.

3) Crops & Cattle Pasture
Overall, accounting for overlaps between the data, we estimate that crops and pasture combined cover 115.8 million hectares. This total is the equivalent of 19% of the Amazon biome.

In comparison, open-pit gold mining covered 1.9 million hectares (0.23% of the Amazon biome).

Zooms across the Amazon

Eastern Brazilian Amazon

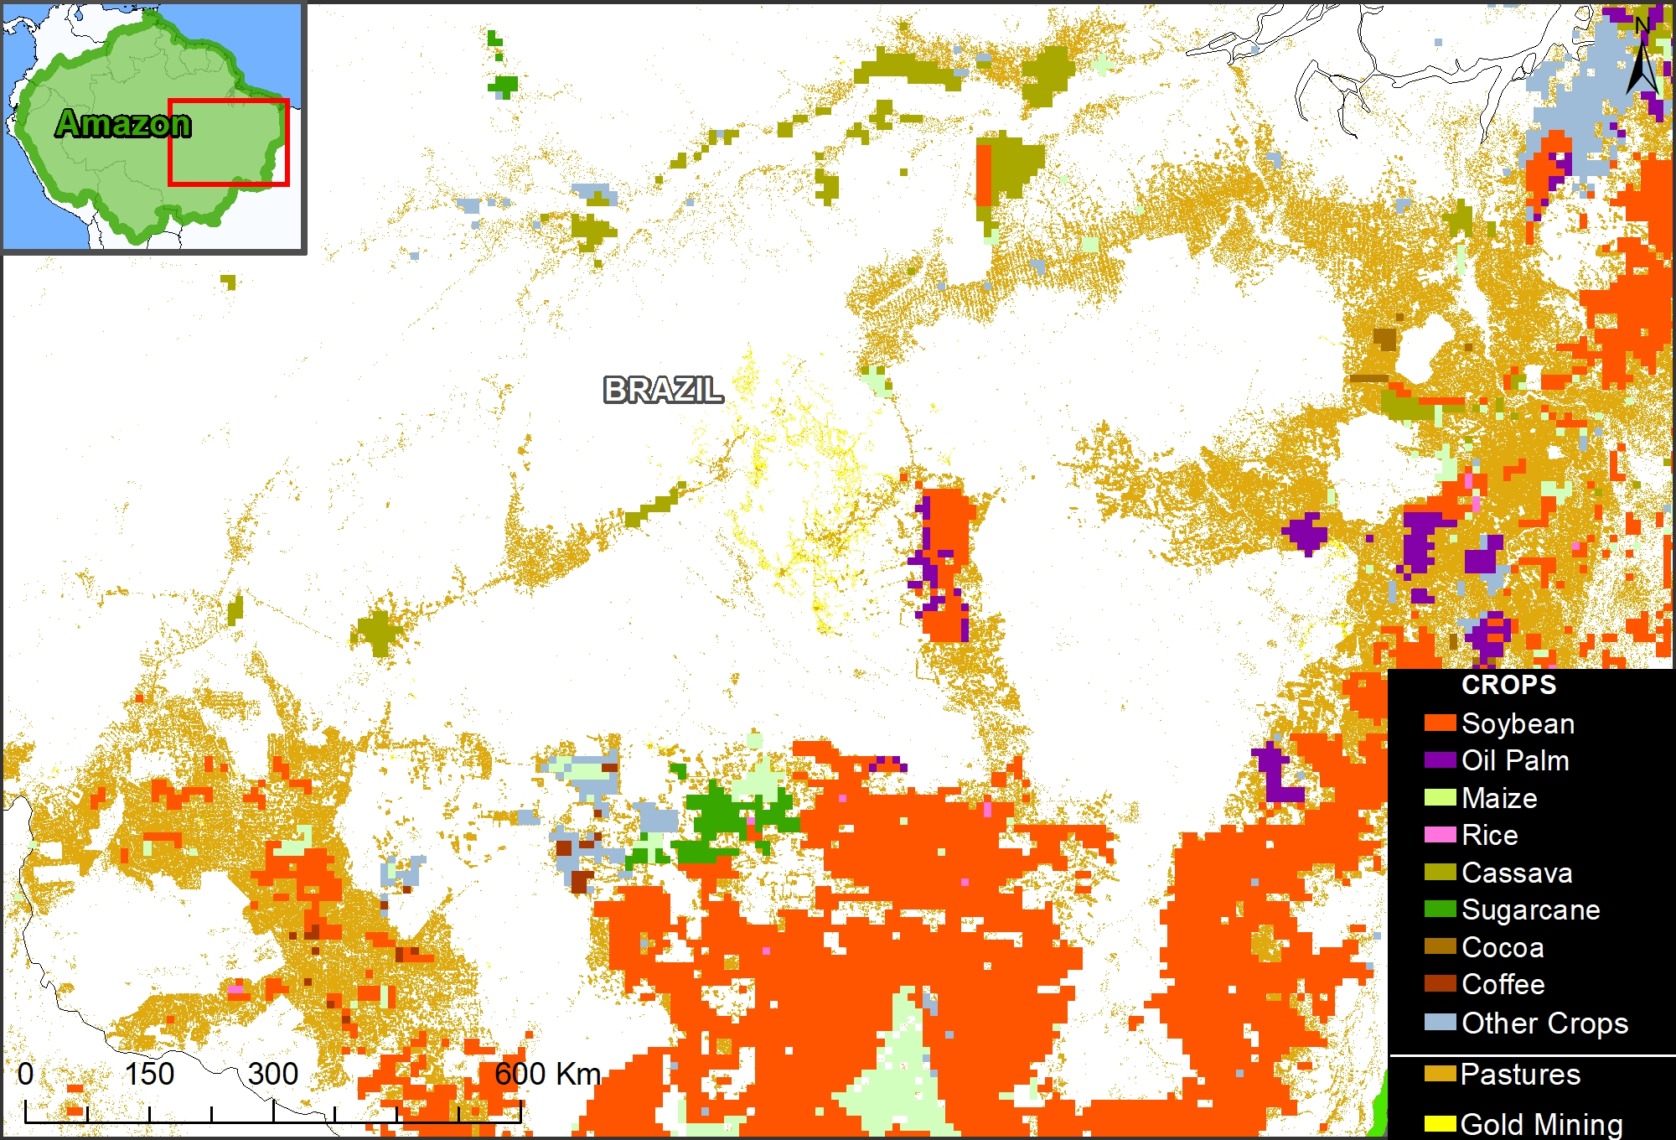
Figure 2 shows the transition from the soy frontier to the cattle pasture frontier in the eastern Brazilian Amazon. Also note a mix of other crops, such as oil palm, sugarcane, and cassava, and some gold mining.

Figure 2. Eastern Brazilian Amazon. Data: IFRI/SPAM, Lapig/UFG, Mapbiomas, AMW, ACA/MAAP.

Andean Amazon (Peru and Ecuador)

Figure 3. Andean Amazon. Data: IFRI/SPAM, Lapig/UFG, Mapbiomas, AMW, ACA/MAAP.

The land use patterns are quite different in the Andean Amazon regions of Peru and Ecuador.

Figure 3 shows, that instead of soy and cattle pasture, there is instead oil palm, rice, coffee, and cocoa.

Also note the extension of the cattle pasture frontier in the western Brazilian Amazon, towards Peru and Bolivia.


Northeast Amazon (Venezuela, Guyana, Suriname, French Guiana)

Figure 4 shows the general lack of crops in the core Amazon regions Guyana, Suriname, and French Guiana, which is surely a major factor they are all considered High Forest cover, Low Deforestation countries (HFLD). In contrast, note there is abundant gold mining activity throughout this region.

Figure 4. Northeastern Amazon. Data: IFRI/SPAM, Lapig/UFG, Mapbiomas, AMW, ACA/MAAP.

Methods

For the SPAM data, we used the physical area, which is measured in a hectare and represents the actual area where a crop is grown (not counting how often production was harvested from it). We only considered values ​​greater than or equal to 100 ha per pixel.

For the Base Map, due to their importance as primary economic crops, we layered soybean and oil palm as the top two layers, respectively. From there, crops were layered in order of their total physical area across the Amazon. Thus, the full extensions of some crops are not shown if they overlap pixels with other crops that have greater physical area. For overlaps with crops and pasture, we favored the crops.

Notes & Data Sources

1 International Food Policy Research Institute (IFPRI), 2024, “Global Spatially-Disaggregated Crop Production Statistics Data for 2020 Version 1.0” https://doi.org/10.7910/DVN/SWPENT, Harvard Dataverse, V1

Spatial Production Allocation Model (SPAM)
SPAM 2020 v1.0 Global data (Updated 2024-04-16)

2 Note that the spatial resolution is rather low (10-kilometers) so all crop coverage data above should be interpreted as referential only.

3 The Atlas of Pastures (Atlas das Pastagens), open to the public, was developed by the Image Processing and Geoprocessing Laboratory of the Federal University of Goiás (Lapig/UFG), to facilitate access to results and products generated within the MapBiomas initiative, regarding Brazilian pastures.

https://atlasdaspastagens.ufg.br/

4 MapBiomas Collection 5;  https://amazonia.mapbiomas.org/en/

5 See MAAP #212 for more information on Amazon Mining Watch.

Citation

Finer M, Ariñez A (2024) Agriculture in the Amazon: New data reveals key patterns of crops & cattle pasture. MAAP: 214.

MAAP #213: Estimating Carbon in Amazon Protected Areas & Indigenous Territories

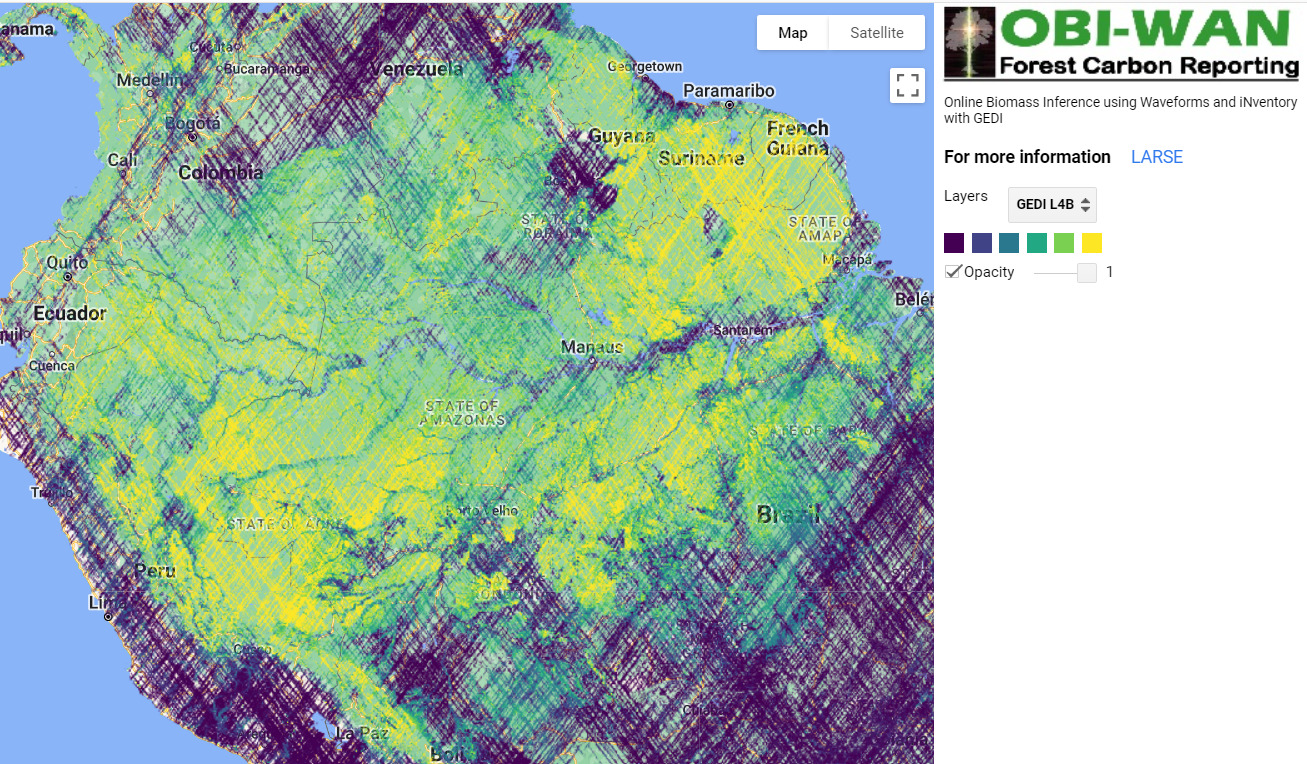
Intro Image. Screenshot of OBI-WAN forest carbon reporting app.

In a recent report (MAAP #199), we presented the updated version of NASA’s GEDI data,1 which uses lasers aboard the International Space Station to provide cutting-edge estimates of aboveground carbon globally, including our focal area, the Amazon.

These lasers, however, have not yet achieved full coverage, leaving considerable gaps in the data and resulting maps.

Here, we feature two new tools that allow us to fill in these gaps and provide detailed wall-to-wall estimates of aboveground biomass for specific areas, which can then be converted to aboveground carbon estimates.

The first is the OBI-WAN forest carbon reporting app (see Intro Image), which uses statistical inference to produce mean, total, and uncertainty estimates for biomass baselines at any given scale (from local to worldwide).2

The second is a fused product from GEDI and TanDEM-X missions.3 The combination of lidar (GEDI) and radar (TanDEM-X) has started to produce unmatched maps that combine the ability of lidar to retrieve forest structure and the ability of radar to offer wall-to-wall coverage at multiple resolutions (see Figures 1-5 below for examples at 25m resolution).

Employing these two tools, we focus on estimating aboveground carbon for select examples of two critical land designations in the Amazon: protected areas and indigenous territories. Both are critical to the long-term conservation of the core Amazon (MAAP #183). We hope that providing precise carbon data will provide additional incentives for their long-term conservation.

We select 5 focal areas (3 National Parks and 2 Indigenous Territories; see list below) across the Amazon to demonstrate the power of these datasets. Together, these five areas are currently home to over 1.4 billion metric tons of aboveground carbon.

  • Protected Areas (National Parks)
    Chirbiquete National Park (Colombian Amazon)
    Manu National Park (Peruvian Amazon)
    Madidi National Park (Bolivian Amazon)
    k
  • Indigenous Territories
    Kayapó Indigenous Territory (Brazilian Amazon)
    Barranco Chico Indigenous Territory (Peruvian Amazon)

Focal Areas

As noted above, the aboveground carbon estimates below are based on the aboveground biomass estimates from the OBI-WAN forest carbon reporting app and GEDI-TanDEM-X data. Figures 1 – 5 are based on GEDI-TanDEM-X, at 25 meter resolution.

National Parks

Chirbiquete National Park (Colombian Amazon)

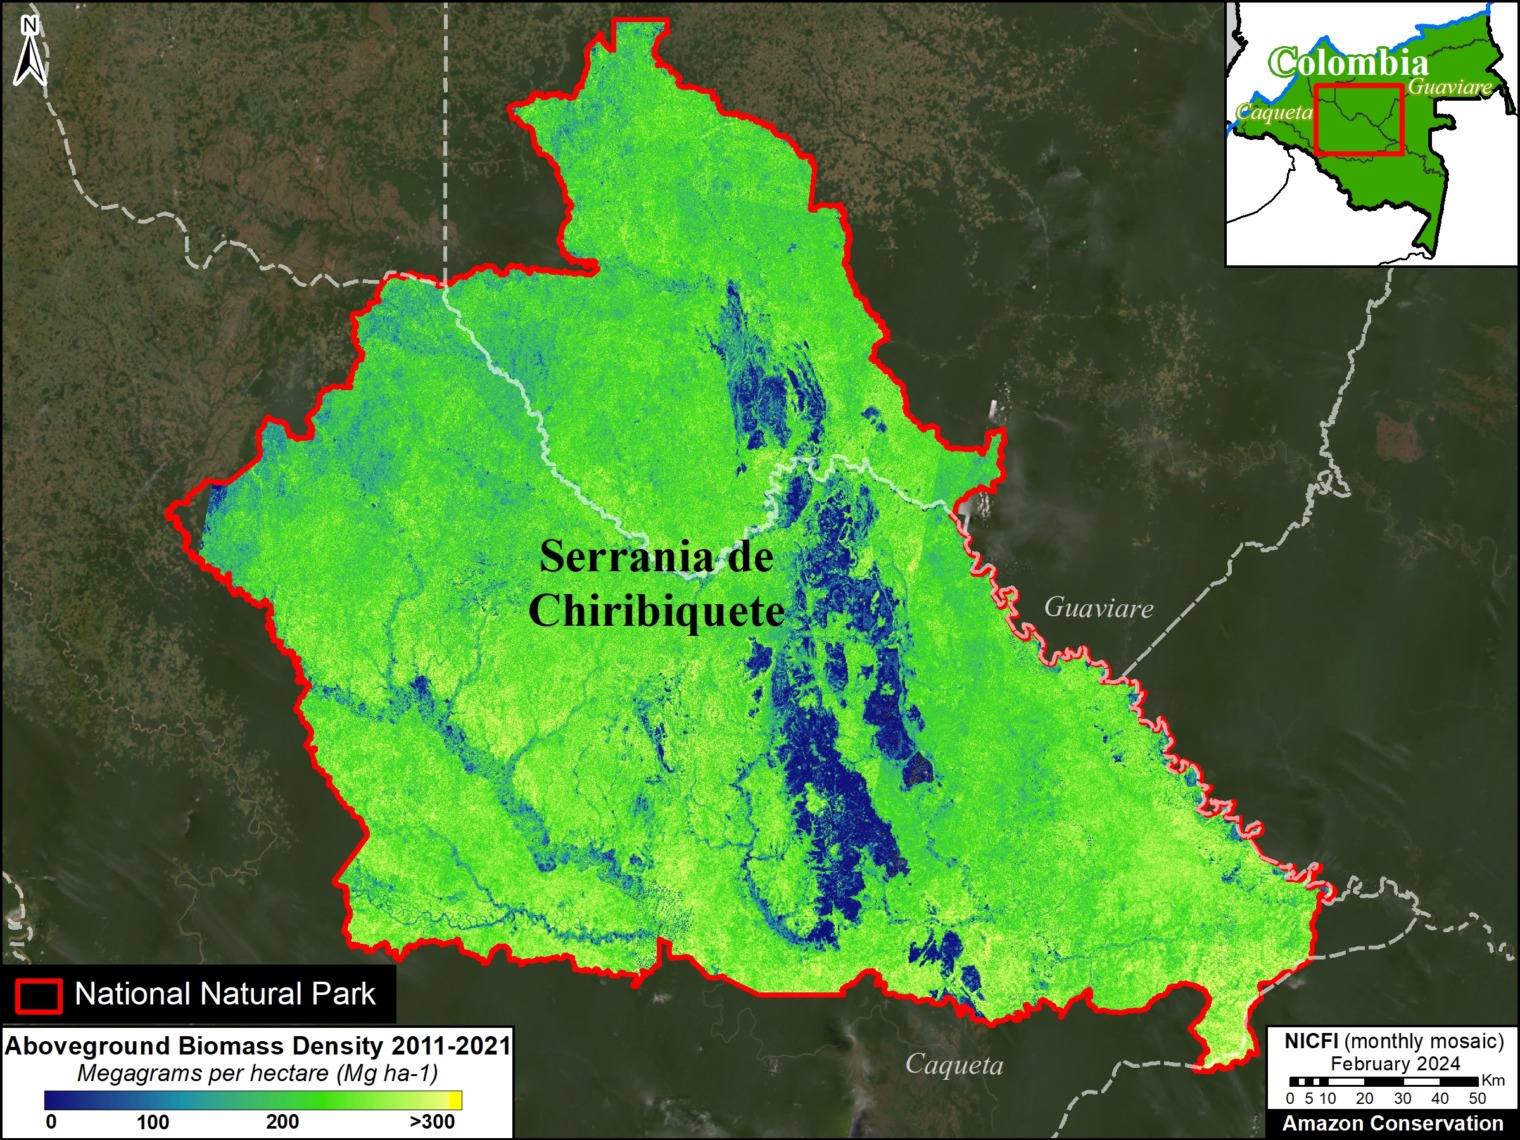
Chirbiquete National Park covers over 4.2 million hectares in the heart of the Colombian Amazon (Guaviare and Caqueta departments). Both datasets converge in the estimate of around 600 metric tons of aboveground biomass, equating to over 300 million metric tons of aboveground carbon across the park (80.5 tons of carbon per hectare). Figure 1 shows the detailed spatial distribution of this biomass across Chirbiquete National Park. Note that the GEDI-TanDEM-X data misses the western tip of the park.

Figure 1. Aboveground biomass across Chiribiquete National Park (Colombian Amazon). Data: GEDI-TanDEM-X


Manu National Park (Peruvian Amazon)

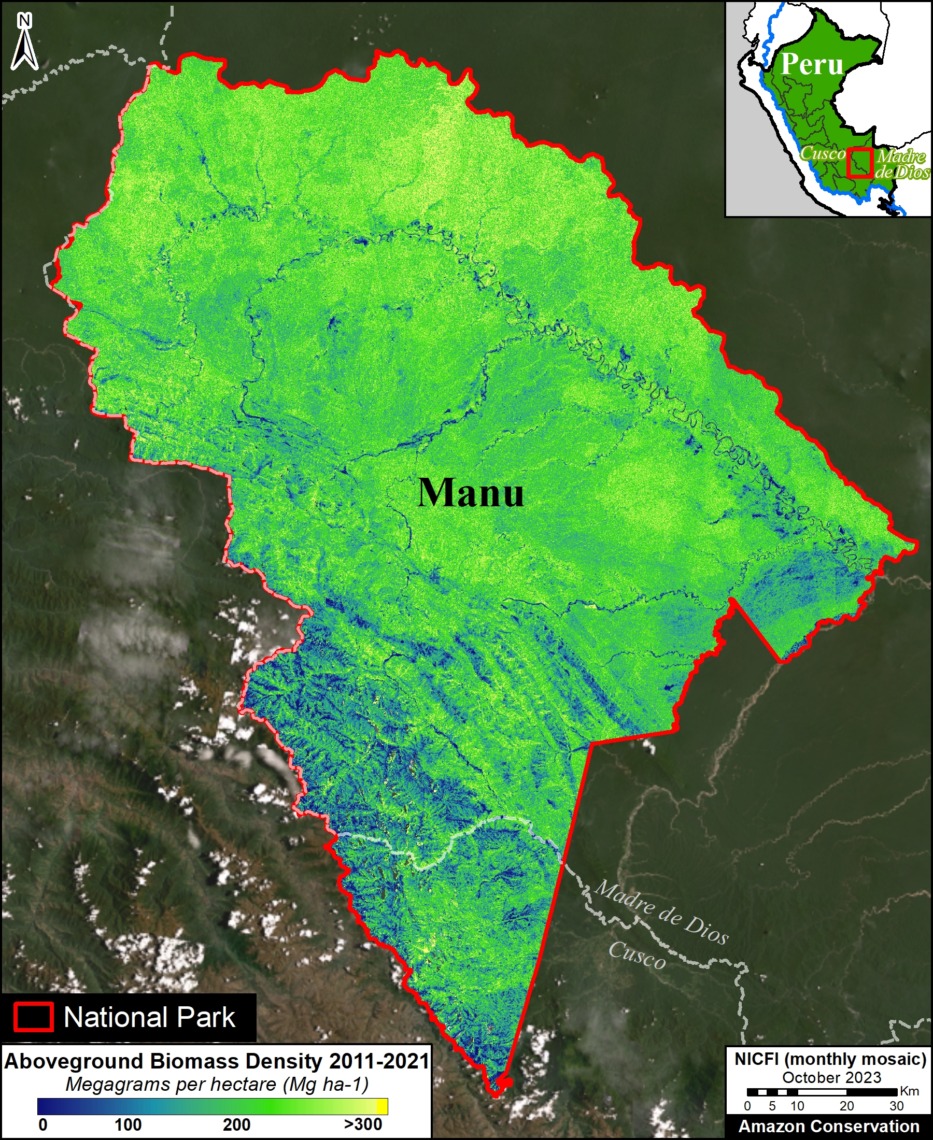
Figure 2. Aboveground biomass across Manu National Park (Peruvian Amazon). Data: GEDI-TanDEM-X

Manu National Park covers over 1.7 million hectares in the southern Peruvian Amazon (Madre de Dios and Cusco regions).

Both datasets converge in the estimate of over 450 metric tons of aboveground biomass, equating to over 215 million metric tons of aboveground carbon across the territory (126.8 tons of carbon per hectare).

Figure 2 shows the detailed spatial distribution of this biomass across Manu National Park.


Madidi National Park (Bolivian Amazon)

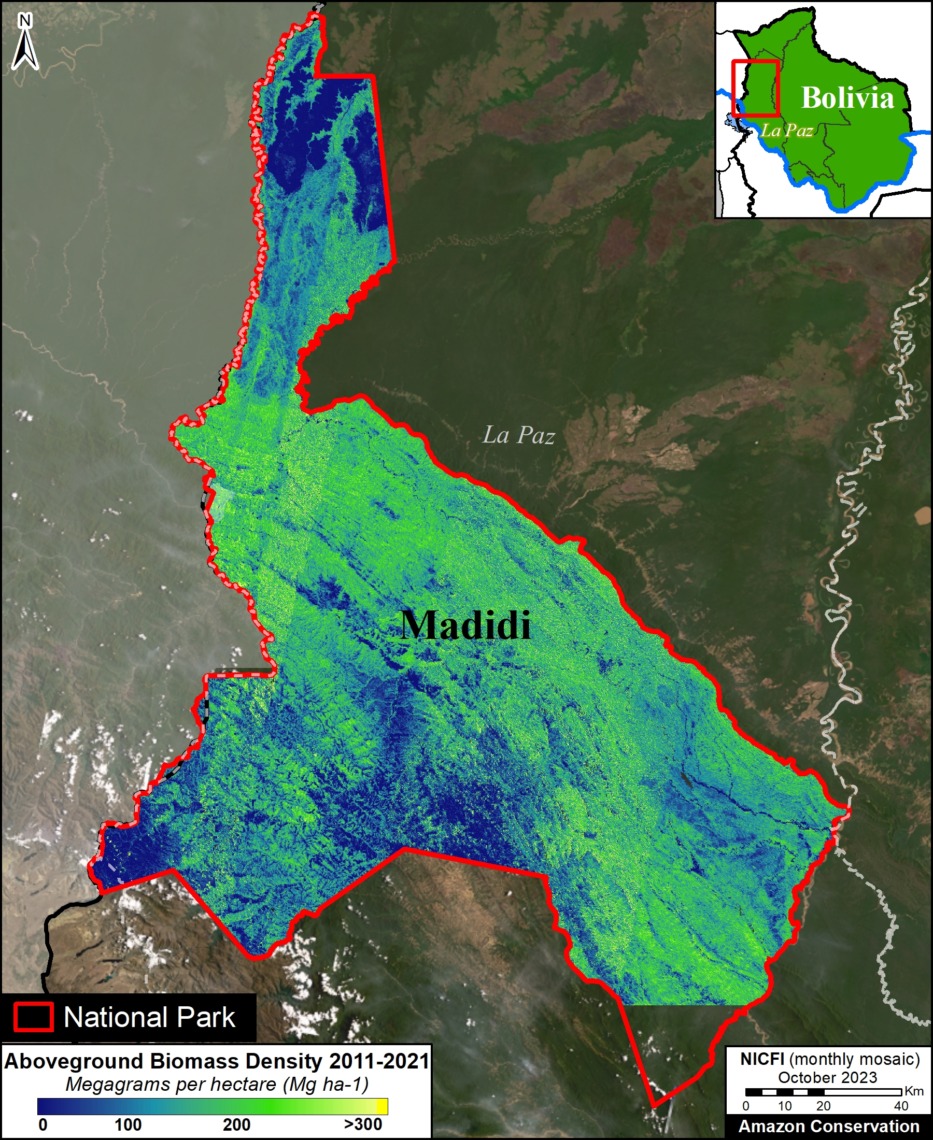
Figure 3. Aboveground biomass across Madidi National Park (Bolivian Amazon). Data: GEDI-TanDEM-X

Madidi National Park and Integrated Management Area covers over 1.8 million hectares in the western Bolivian Amazon (La Paz department).

Both datasets converge in the estimate of over 350 metric tons of aboveground biomass, equating to over 160 million metric tons of aboveground carbon across the park (85.3 tons of carbon per hectare).

Figure 3 shows the detailed spatial distribution of this biomass across Madidi National Park. Note that the GEDI-TanDEM-X data misses the southern tip of the park.


Indigenous Territories

Kayapó Indigenous Territory (Brazilian Amazon)

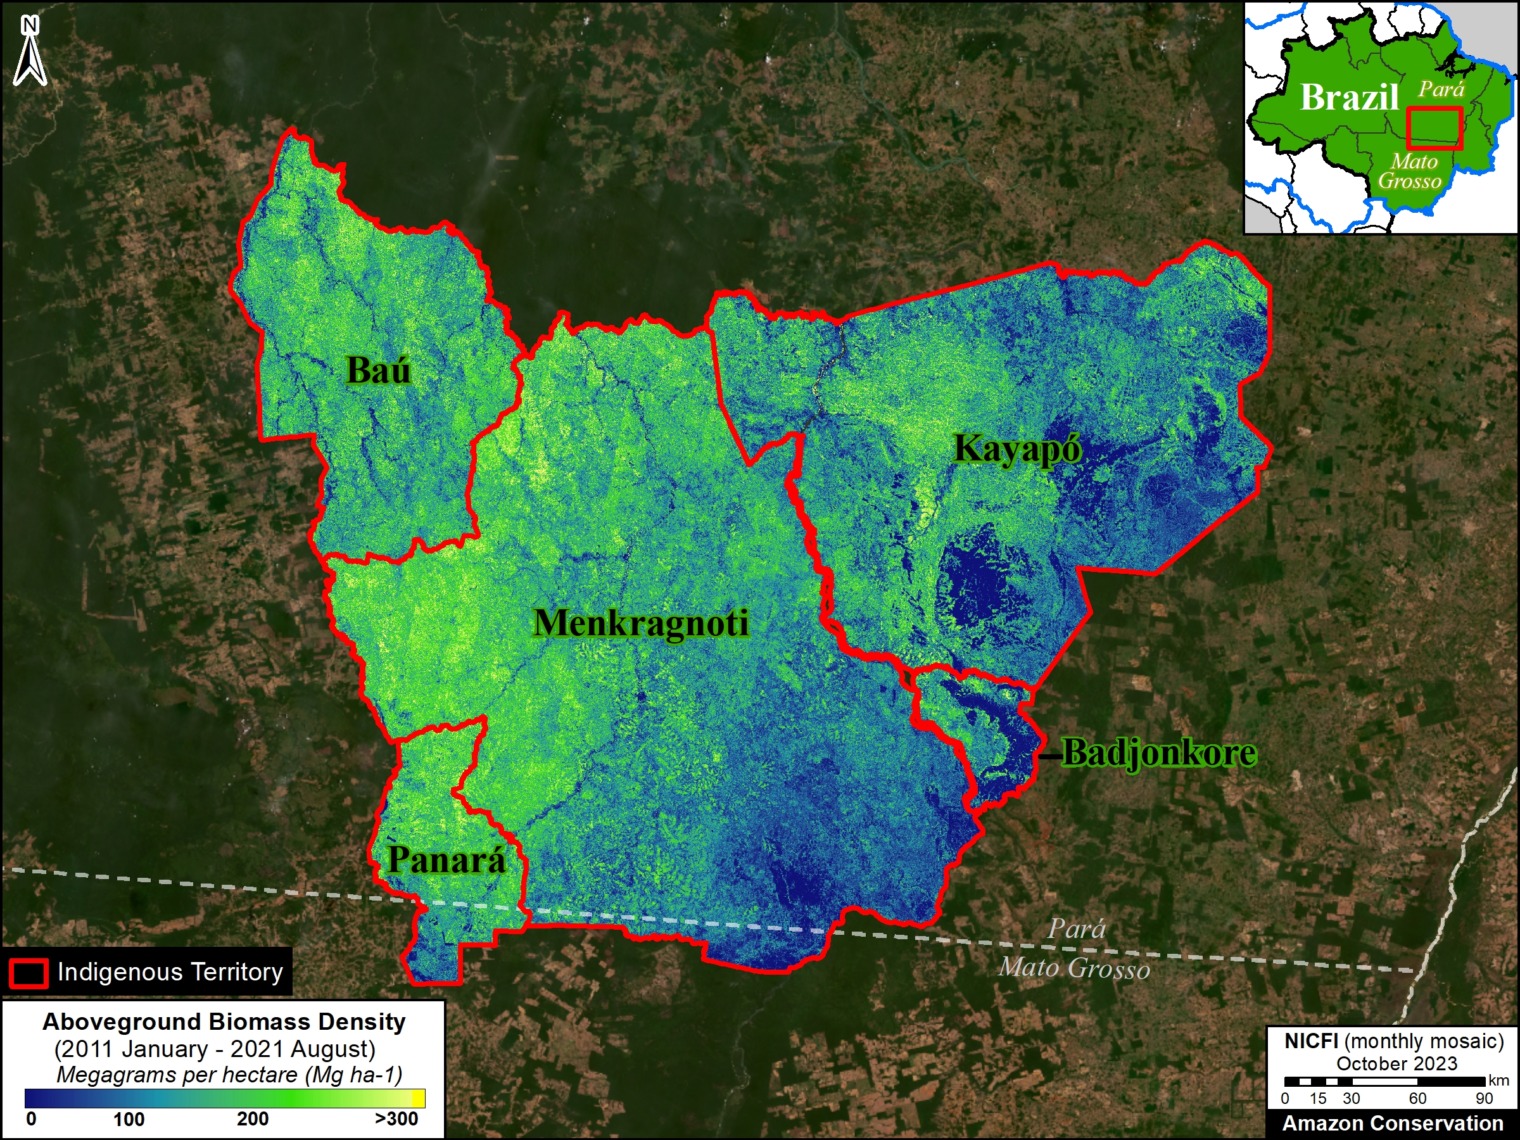
Kayapó Indigenous Territory covers over 3.2 million hectares in the eastern Brazilian Amazon (Pará state). Both datasets converge in the estimate of over 413,000 metric tons of aboveground biomass, equating to over 198 million metric tons of aboveground carbon across the territory. Figure 4 shows the detailed spatial distribution of this biomass across Kayapó and four neighboring Indigenous Territories. Totaling across these five territories (10.4 million hectares), the data sets converge on over 1.5 billion metric tons of aboveground biomass, and 730 million metric tons of aboveground carbon (70 tons per hectare).

Figure 4. Aboveground biomass across Kayapó and neighboring Indigenous Territories (Brazilian Amazon). Data: GEDI-TanDEM-X

Barranco Chico Indigenous Territory (Peruvian Amazon)

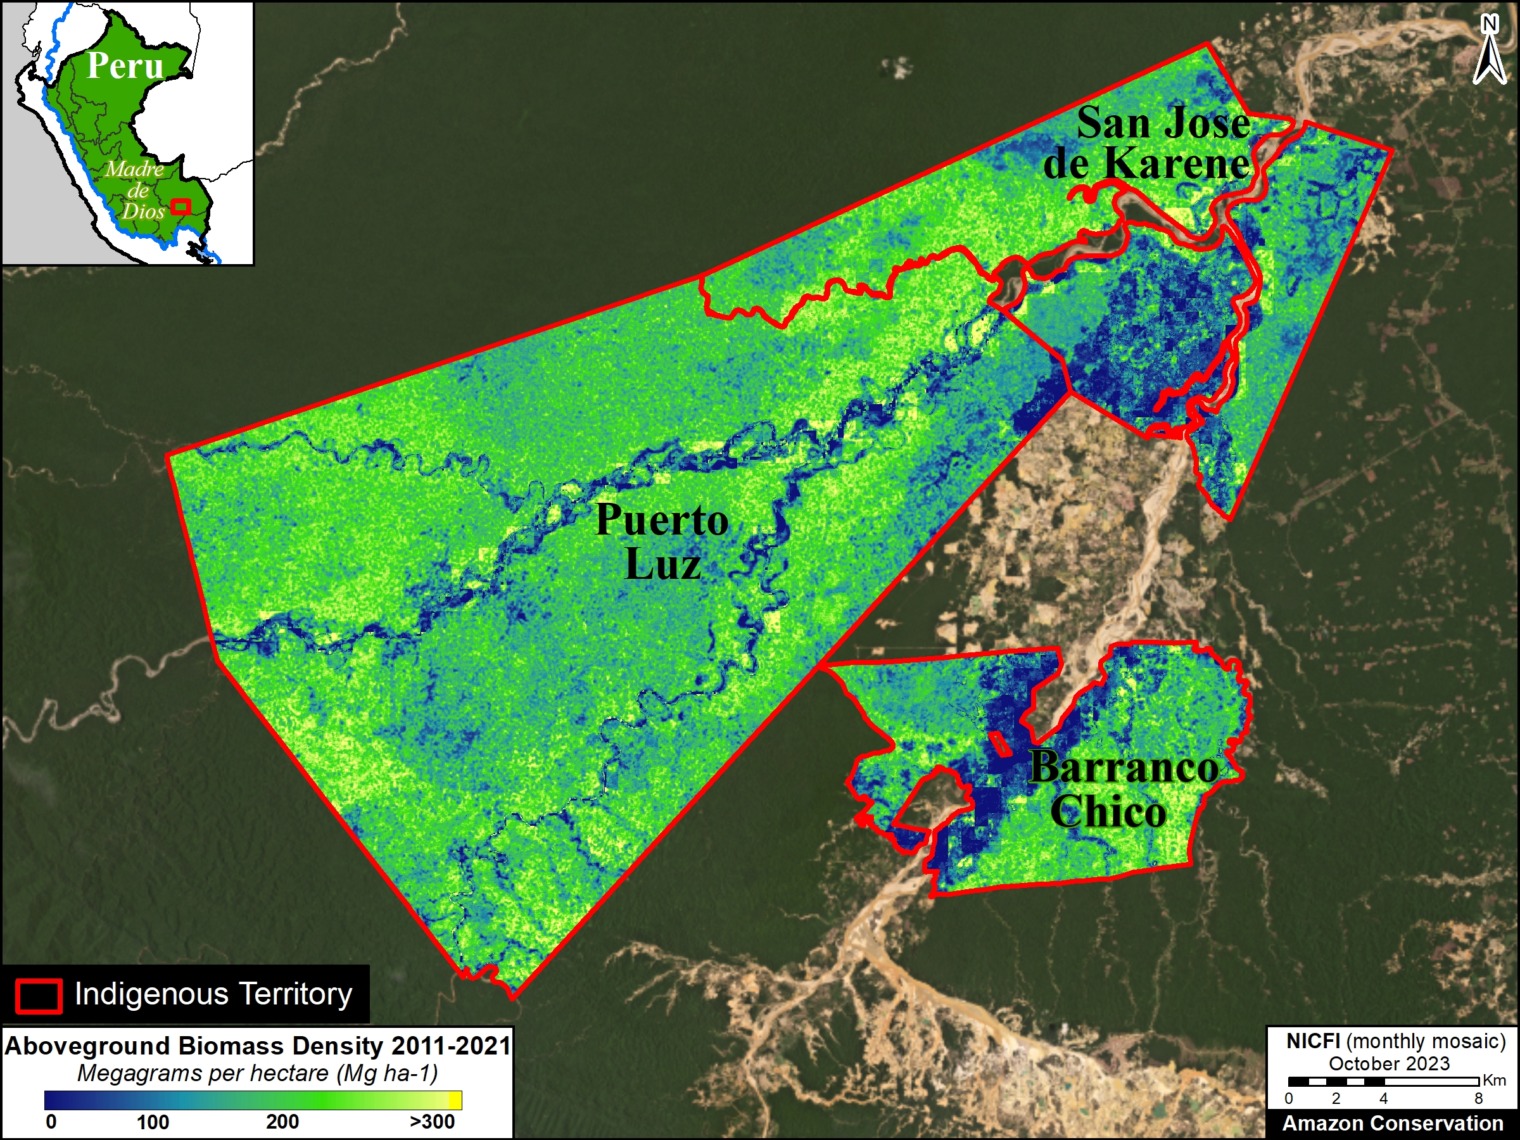
Barranco Chico Indigenous Territory covers over 12,600 hectares in the southern Peruvian Amazon (Madre de Dios region). Both datasets converge in the estimate of over 2 million metric tons of aboveground biomass, equating to over 1 million metric tons of aboveground carbon. Figure 5 shows the detailed spatial distribution of this biomass across Barranco Chico and two neighboring Indigenous Territories (Puerto Luz and San Jose de Karene). Totaling across these three territories (nearly 90,000 hectares), the data sets converge on over 19 million metric tons of aboveground biomass, and over 9 million metric tons of aboveground carbon (102 tons per hectare).

Figure 5. Aboveground biomass across Barranco Chico and neighboring Indigenous Territories (Peruvian Amazon). Data: GEDI-TanDEM-X

Notes

1 GEDI L4B Gridded Aboveground Biomass Density, Version 2.1. This data is measured in megagrams of aboveground biomass per hectare (Mg/ha) at a 1-kilometer resolution, with the period of April 2019 – March 2023. This serves as our estimate for aboveground carbon reserves, with the science-based assumption that 48% of recorded biomass is carbon.

The approach relies on the foundational paper from Patterson et al., (2019) and it is used by the GEDI mission to estimate mean and total biomass worldwide (Dubayh et al., 2022, Armston et al., 2023). The method considers the spatial distribution of GEDI tracks within a given user-specify boundary to infer the sampling error component of the total uncertainty that also includes the error from the GEDI L4A models used to predict biomass from canopy height estimates (Keller et al., 2022). For more information on the OBI-WAN app, see Healey and Yang 2022.

3 GEDI-TanDEM-X (GTDX) is a fusion of GEDI Version 2 and TanDEM-X (TDX) Interferometric Synthetic Aperture Radar (InSAR) images (from Jan 2011 to December 2020). It also incorporates annual forest loss data to account for deforestation during this time. The GTDX aboveground biomass maps were produced based on a generalized hierarchical model-based (GHMB) framework that utilizes GEDI biomass as training data to establish models for estimating biomass based on the GTDX canopy height. The combination of lidar (GEDI) and radar (TanDEM-X) has started to produce unmatched maps that combine the ability of lidar to retrieve forest structure and the ability of radar to offer wall-to-wall coverage (Qi et al.,2023, Dubayah et a;., 2023). This fused product is a wall-to-wall gap-free map that was produced at multiple resolutions: 25m, 100m and 1ha. Ongoing processing over the Pantropic region will be made available over the next months but some geographies have been already mapped such as most of the Amazon Basin (Dubayah et al., 2023). The data we used is publicly available.

References

Armston, J., Dubayah, R. O., Healey, S. P., Yang, Z., Patterson, P. L., Saarela, S., Stahl, G., Duncanson, L., Kellner, J. R., Pascual, A., & Bruening, J. (2023). Global Ecosystem Dynamics Investigation (GEDI)GEDI L4B Country-level Summaries of Aboveground Biomass [CSV]. 0 MB. https://doi.org/10.3334/ORNLDAAC/2321

Dubayah, R. O., Armston, J., Healey, S. P., Yang, Z., Patterson, P. L., Saarela, S., Stahl, G., Duncanson, L., Kellner, J. R., Bruening, J., & Pascual, A. (2023). Global Ecosystem Dynamics Investigation (GEDI)GEDI L4B Gridded Aboveground Biomass Density, Version 2.1 [COG]. 0 MB. https://doi.org/10.3334/ORNLDAAC/2299

Dubayah, R., Armston, J., Healey, S. P., Bruening, J. M., Patterson, P. L., Kellner, J. R., Duncanson, L., Saarela, S., Ståhl, G., Yang, Z., Tang, H., Blair, J. B., Fatoyinbo, L., Goetz, S., Hancock, S., Hansen, M., Hofton, M., Hurtt, G., & Luthcke, S. (2022). GEDI launches a new era of biomass inference from space. Environmental Research Letters, 17(9), 095001. https://doi.org/10.1088/1748-9326/ac8694

Dubayah, R., Blair, J. B., Goetz, S., Fatoyinbo, L., Hansen, M., Healey, S., Hofton, M., Hurtt, G., Kellner, J., Luthcke, S., Armston, J., Tang, H., Duncanson, L., Hancock, S., Jantz, P., Marselis, S., Patterson, P. L., Qi, W., & Silva, C. (2020). The Global Ecosystem Dynamics Investigation: High-resolution laser ranging of the Earth’s forests and topography. Science of Remote Sensing, 1, 100002. https://doi.org/10.1016/j.srs.2020.100002

Healey S, Yang Z (2022) The OBIWAN App: Estimating Property-Level Carbon Storage Using NASA’s GEDI Lidar. https://www.fs.usda.gov/research/rmrs/understory/obiwan-app-estimating-property-level-carbon-storage-using-nasas-gedi-lidar

Kellner, J. R., Armston, J., & Duncanson, L. (2022). Algorithm Theoretical Basis Document for GEDI Footprint Aboveground Biomass Density. Earth and Space Science, 10(4), e2022EA002516. https://doi.org/10.1029/2022EA002516

Dubayah, R.O., W. Qi, J. Armston, T. Fatoyinbo, K. Papathanassiou, M. Pardini, A. Stovall, C. Choi, and V. Cazcarra-Bes. 2023. Pantropical Forest Height and Biomass from GEDI and TanDEM-X Data Fusion. ORNL DAAC, Oak Ridge, Tennessee, USA. https://doi.org/10.3334/ORNLDAAC/2298

Qi, W., J. Armston, C. Choi, A. Stovall, S. Saarela, M. Pardini, L. Fatoyinbo, K. Papathanasiou, and R. Dubayah. 2023. Mapping large-scale pantropical forest canopy height by integrating GEDI lidar and TanDEM-X InSAR data. Research Square. https://doi.org/10.21203/rs.3.rs-3306982/v1

Krieger, G., M. Zink, M. Bachmann, B. Bräutigam, D. Schulze, M. Martone, P. Rizzoli, U. Steinbrecher, J. Walter Antony, F. De Zan, I. Hajnsek, K. Papathanassiou, F. Kugler, M. Rodriguez Cassola, M. Younis, S. Baumgartner, P. López-Dekker, P. Prats, and A. Moreira. 2013. TanDEM-X: A radar interferometer with two formation-flying satellites. Acta Astronautica 89:83–98. https://doi.org/10.1016/j.actaastro.2013.03.008

Acknowledgments

We greatly thank the University of Maryland’s GEDI team for data access and reviewing this report. In particular, we thank Ralph Dubayah, Matheus Nunes, and Sean Healey.

Citation

Mamani N, Pascual A, Finer M (2024) Estimating Carbon in Amazon Protected Areas & Indigenous Territories. MAAP: 213