MAAP #201: Amazon Deforestation Carbon Update for 2023

Graph 1. Major decrease in primary forest loss in 2023 compared to both last year 2022 and the recent peak year 2020, across the entire Amazon biome. Data: ESA/S2, GFW, ACA/MAAP.

As national policymakers begin the global COP28 climate summit in Dubai, we provide here a concise update on the current state of  Amazon forest loss and remaining carbon reserves, both based on the latest cutting-edge data.

For Amazon forest loss, we analyze the primary forest loss alerts known as GLAD-S2, which are based on 10-meter resolution optical imagery from the European Space Agency’s Sentinel-2 satellite1. These advanced alerts have been available from 2019 to present.

For Amazon carbon reserves, we analyze the newly updated version of NASA’s GEDI data2, which used lasers aboard the International Space Station to provide recent estimates of aboveground biomass density on a global scale. This data has a 1-kilometer resolution and covers the time period of April 2019 – March 2023.

In summary, we report two key findings:

  • A dramatic reduction (over one-half) in primary forest loss between the current year 2023 and last year 2022 across the Amazon. The biggest declines were documented in the Brazilian and Colombian Amazon (59% and 67%, respectively).
  • Over 78 billion metric tons of aboveground biomass across the Amazon biome, which converts to over 37 billion metric tons of carbon. The highest carbon densities are located in the northeast (Suriname, French Guiana, and northeast Brazil) and southwest (southern Peru) sections of the Amazon.

Amazon Forest Loss

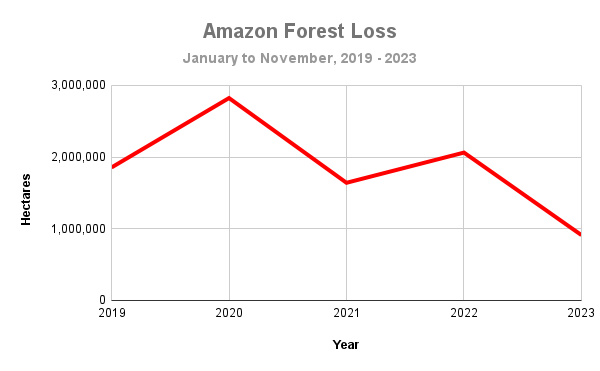
We estimate that forest loss dropped by 55.8% between 2023 (911,740 hectares) and 2022 (2,062,939 hectares). The loss is even more striking (dropping by over two-thirds, 67.7%) when compared to 2020 (2,823,475 hectares). It is important to emphasize that these are all directly relevant comparisons, covering the same time frame of January to early November for each year.

Graph 1 (see above) illustrates this major decrease in primary forest loss in 2023 compared to both last year 2022 and the recent peak year 2020, across the entire Amazon biome.

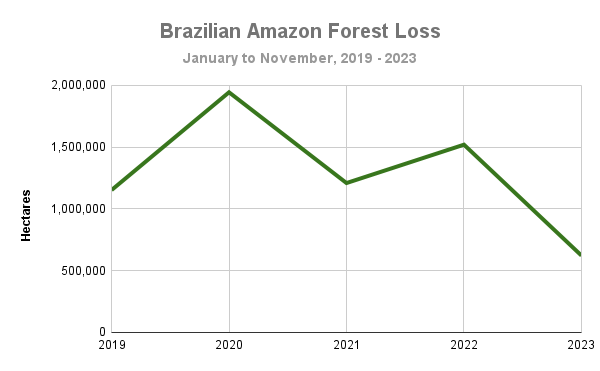
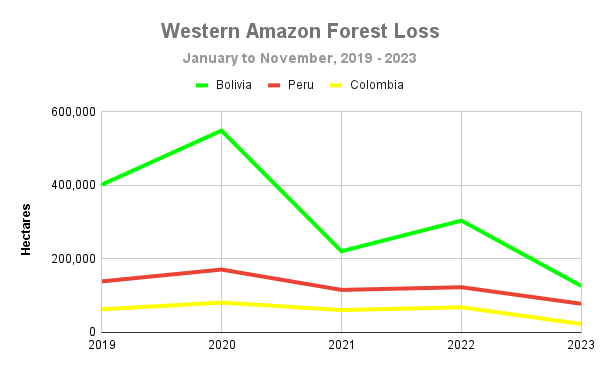
Graphs 2 and 3 (see below) break down these results for the Brazilian Amazon and western Amazon (Bolivia, Peru, and Colombia), respectively. Note the especially large forest loss declines in Brazil (59%) and Colombia (67%). We did document an increase in primary forest loss in three countries of the northeast Amazon (Suriname, Guyana, and Venezuela) during 2023, but this seems to be mostly due to natural causes.

Graph 2. Major decrease in primary forest loss in 2023 compared to both last year 2022 and the recent peak year 2020, in the Brazilian Amazon. Data: ESA/S2, GFW, ACA/MAAP.
Graph 3. Major decrease in primary forest loss in 2023 compared to both last year 2022 and the recent peak year 2020, in the western Amazon (Bolivia, Peru, Colombia). Data: ESA/S2, GFW, ACA/MAAP.

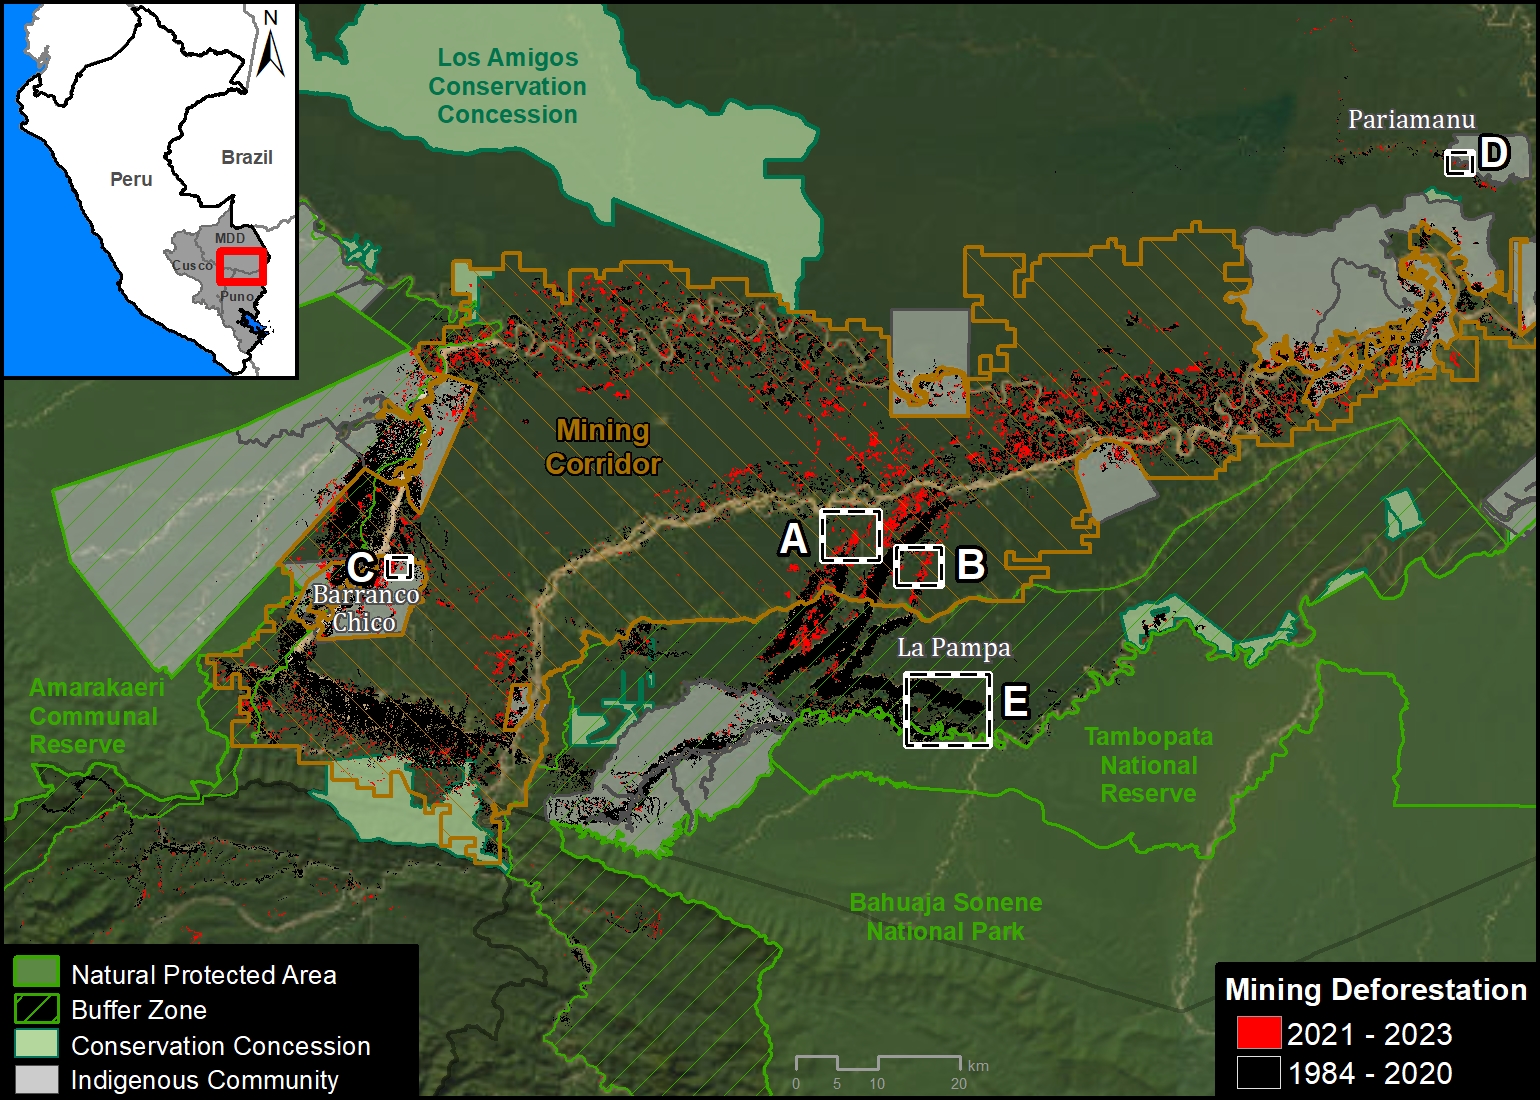
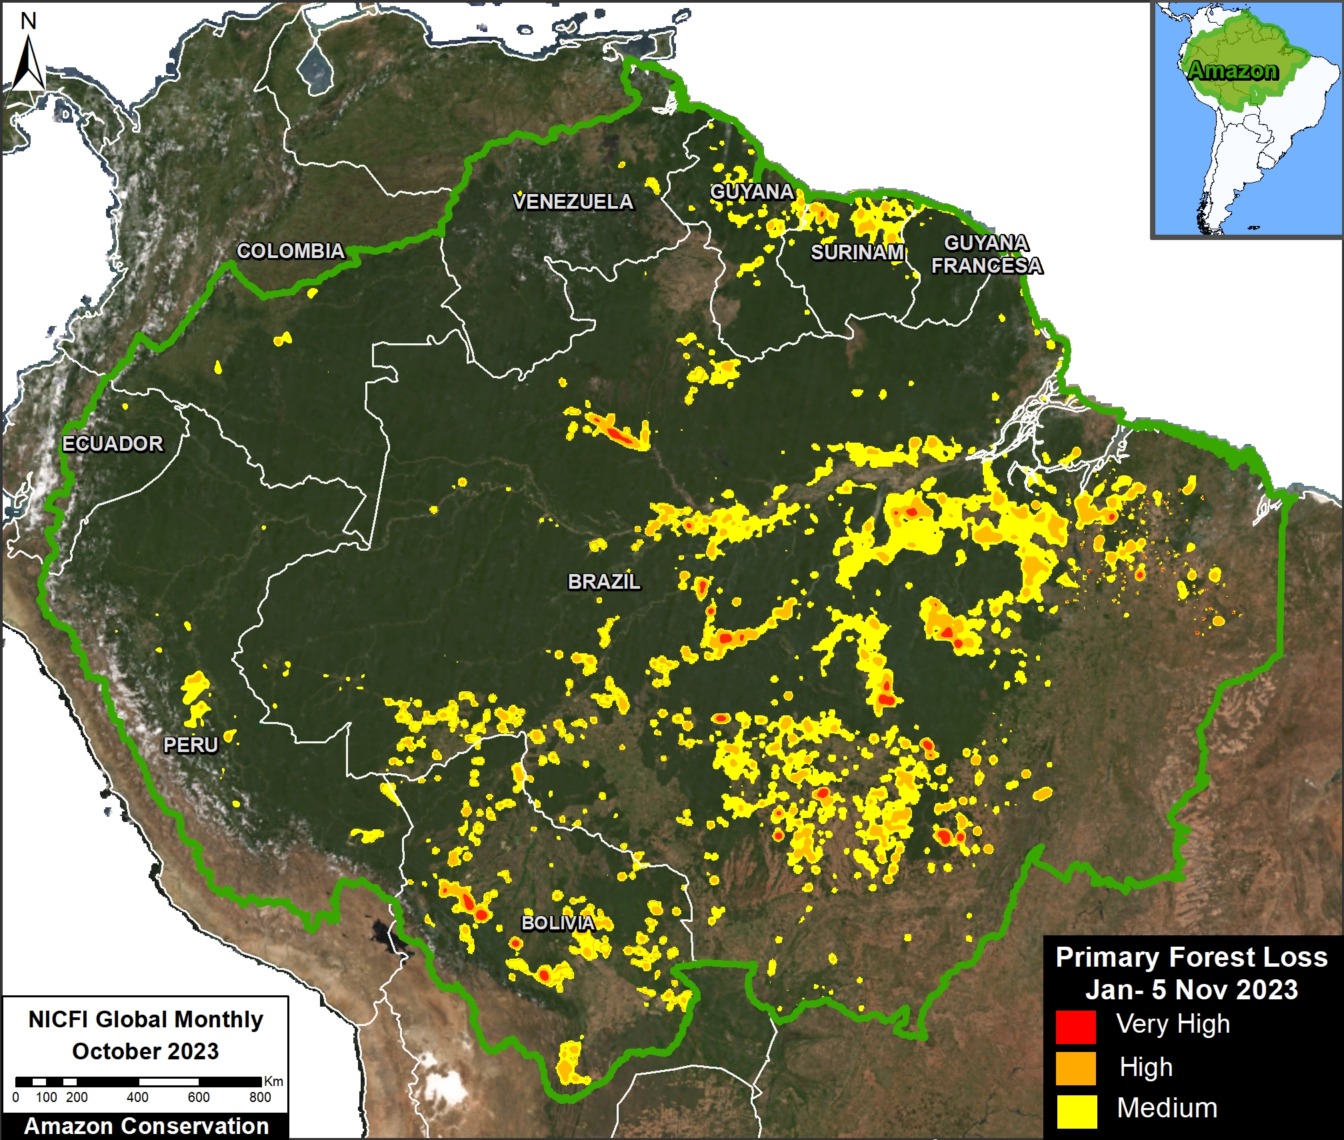
Although primary forest loss is way down across the Amazon in  2023, we did document the clearing of nearly a million hectares (911,740 ha). Figure 1 shows the distribution of this loss. Note the concentrations in the following sections of the Amazon: eastern and southern Brazil, across Bolivia, central and southern Peru, northwest Colombia. Hotspots in the northeast Amazon (Suriname, Guyana, and Venezuela) are mostly due to natural causes.

Figure 1. Primary forest loss across the Amazon in 2023. Data: ESA/S2, GFW, ACA/MAAP, NICFI.


Amazon Carbon Reserves

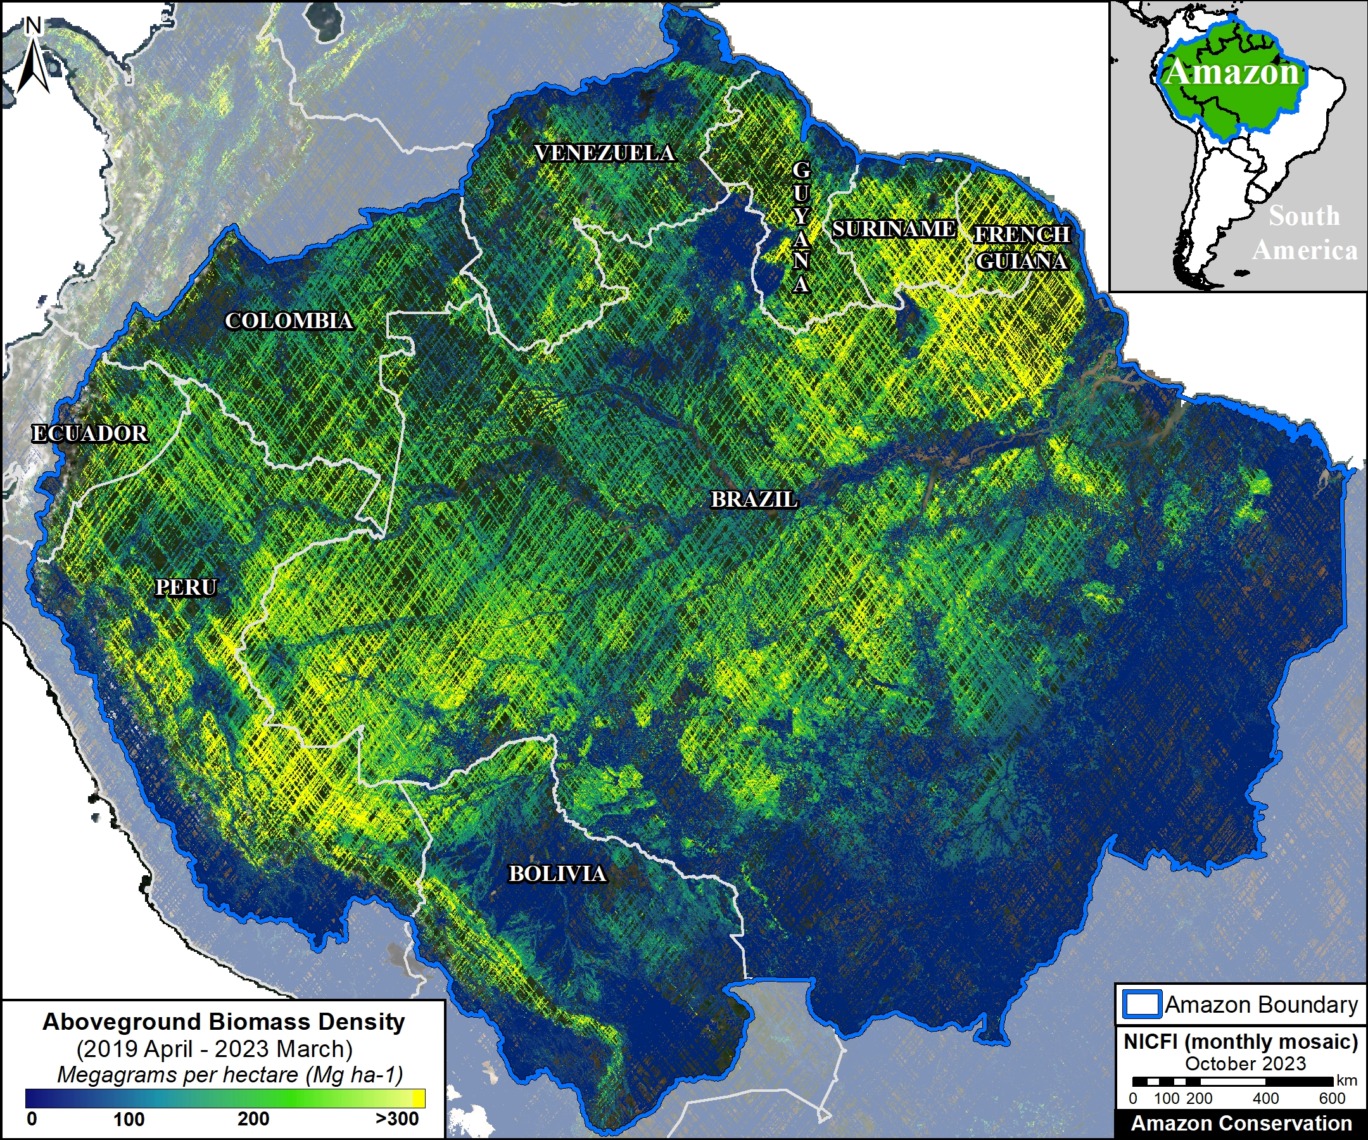
Figure 2 displays aboveground biomass across the Amazon biome. Note the highest carbon densities (indicated in bright yellow) are located in the northeast Amazon (Suriname, French Guiana, and the northeast corner of Brazil) and southwest Amazon (southern Peru). Also note that many parts of Ecuador, Colombia, Venezuela, Guyana, Bolivia, Brazil and northern Peru have high carbon densities as well.

As first reported in MAAP #199, we calculated over 78 billion metric tons of aboveground biomass across the Amazon biome (78,184,161,090 metric tons). Using a general assumption that 48% of this biomass is carbon3, we estimate over 37 billion metric tons of carbon across the Amazon (37,528,397,323 metric tons).

Note that these totals are likely underestimates given that the laser-based data has not yet achieved full coverage across the Amazon (that is, there are many areas where the lasers have not yet recorded data, leaving visible blanks in the maps above).

Figure 2. Aboveground biomass density (carbon estimate) across the Amazon biome, with country boundaries. Data: NASA/GEDI, NICFI.

Notes

1Information for GLAD-S2 alerts obtained from Global Forest Watch. Alerts are within a primary forest mask, where previous forest loss was removed Pickens et al 2020). These alerts are operating in the primary humid tropical forest areas of South America from January 2019 to the present. We present data covering the time frame of January 1 – November 8 for each year, so all noted annual comparisons are appropriate. Based on our analysis of final annual forest loss data for the years 2021 and 2022, we determined that using both High and Medium confidence alerts were the most accurate and conservative predictor of ultimate outcome (that is, not including Low confidence alerts).

Citation:

Pickens, A.H., Hansen, M.C., Adusei, B., and Potapov P. 2020. Sentinel-2 Forest Loss Alert. Global Land Analysis and Discovery (GLAD), University of Maryland.

2GEDI L4B Gridded Aboveground Biomass Density, Version 2.1.
https://daac.ornl.gov/cgi-bin/dsviewer.pl?ds_id=2299

3Domke et al (2022) How Much Carbon is in Tree Biomass?. USDA/Forest Service.
https://www.fs.usda.gov/research/nrs/news/highlights/how-much-carbon-tree-biomass#summary

Acknowledgements

This work was supported by NORAD (Norwegian Agency for Development Cooperation) and ICFC (International Conservation Fund of Canada).

Citation

Finer M, Ariñez A, Mamani N (2023) Amazon Deforestation & Carbon Update for 2023. MAAP: 201.

MAAP #195: Gold Mining Deforestation in the Southern Peruvian Amazon, 2021-2023

In the context of overall Amazon gold mining, where illegal mining is rampant, southern Peru is an important case study given that the government has created the “Mining Corridor“, where mining is allowed in order to organize and promote this activity.

maaproject.org-maap-195-deforestacion-minera-en-2023-en-la-amazonia-peruana-sur-Panel-A-CorredorMinero2023-Intro-640x580
Figure 1. Recent deforestation in the Mining Corridor of the Madre de Dios region in the southern Peruvian Amazon (Guacamayo zone). Data: Planet.

In this large area, officially known as the “Zone of small-scale and artisanal mining in the department of Madre Dios,” mining activity can be formal, informal, or illegal, depending on the location and legal compliance (see more details in the Notes section).

Knowing the level of mining deforestation that occurs within its limits is important because, although it may not be illegal, it can be considerable given that the Mining Corridor covers a large area of almost half a million hectares (498,296 ha).

Indeed, we estimate the mining deforestation of 18,174 hectares within the Mining Corridor over the last three years (2021-2023).

In addition, we identified the mining deforestation of 5,707 hectares outside the Mining Corridor, that is, in prohibited areas and thus likely illegal mining.

Consequently, we found a total mining deforestation of 23,881 hectares (59,011 acres) during this period (2021-2023) in southern Peru.

Of this total, 76% of the deforestation occurred within the Mining Corridor, while the remaining 24% corresponds to surrounding illegal mining.

Base Map: Mining Deforestation in the Southern Peruvian Amazon

The Base Map highlights the most recent mining deforestation in the years 2021-2023 (shown in red) in relation to the historical loss of forests in the area (shown in black), both inside and outside the Mining Corridor.

Base Map. Mining deforestation inside and outside the Madre de Dios Mining Corridor, in the southern Amazon of Peru, during the years 2021 and 2023. Data: ACCA/MAAP.

Note that mining deforestation is concentrated within the Mining Corridor, representing 76% of the total. This is especially evident in the Guacamayo mining area (See Zooms A and B) and along the Madre Dios River.

The rest of the mining deforestation (24%) is outside the Mining Corridor. The majority of this deforestation is occurring in the 10 Indigenous Communities of the area, covering  3,406 hectares. The most affected communities are Barranco Chico (Zoom C), San José de Karene, Tres Islas, and Kotsimba.

Mining deforestation has also been identified in buffer zones of protected natural areas. The most affected are Tambopata National Reserve, Bahuaja Sonene National Park and Amarakaeri Communal Reserve. However, it must be emphasized that mining within protected natural areas has been effectively controlled by the Peruvian State, through the National Service of Protected Natural Areas (SERNANP).

Additionally, a certain amount of mining deforestation (161 hectares) has been detected in Brazil nut forest concessions located in the Pariamanu area (Zoom D).

Finally, it is worth mentioning an area of importance in the buffer zone of Tambopata National Reserve, known as La Pampa (Zoom E). This area was the epicenter of destructive mining deforestation between 2014 and 2018. However, the imagery reveals that after Operation Mercurio, which began in early 2019, the expansion of mining deforestation in La Pampa basically stopped. Despite this, a recent report has shown a large increase in mining activity in previously deforested areas of La Pampa (MAAP #193).

High Resolution Zooms (A-E)

The following high-resolution zooms compare mining deforestation between the year 2020 (left panel) and the current time period of 2023 (right panel). Zooms A and B are located inside the Mining Corridor (Guacamayo area), while Zooms C-E are located outside.

Zoom A. Mining Corridor (Guacamayo zone – west)

Zoom B. Mining Corridor (Guacamayo zone – east)

Zoom C. Barranco Chico Indigenous Community

Zoom D. Brazil Nut Concession, Pariamanu zone

Zoom E. La Pampa

Notes

The Mining Corridor, designated by Legislative Decree No. 1100 as the “Zone for small-scale and artisanal mining in the department of Madre de Dios,” categorizes mining activities as follows:

  • Formal: Completed formalization process with approved environmental and operational permits.
  • Informal: In the process of formalization; Operates only in authorized extraction areas, uses permitted machinery, and is considered an administrative offense, not a crime.
  • Illegal: Operates in prohibited areas such as bodies of water (e.g., rivers or lakes), uses prohibited machinery, is considered a criminal offense, and is punishable by imprisonment.

Methodology

We used LandTrendR, a temporal segmentation algorithm that identifies changes in pixel values over time, to detect forest loss within the Mining Corridor between 2021 and 2023 using the Google Earth Engine platform. It is important to note that this method was originally designed for Landsat images with moderate resolution (30 meters)1, but we adapted it for higher spatial resolution NICFI-Planet monthly mosaics (4.7 meters).2

Additionally, we created a baseline for the period 2016-2020 to eliminate old deforested areas (prior to 2021) due to rapid changes in the natural regrowth process.

Finally, we manually separated forest loss due to mining and other causes between 2021 and 2023 to specifically report on direct impacts related to mining. For this part of the analysis, we used various resources to aid the manual process, such as radar image alerts (RAMI) from the SERVIR Amazonia program, historical data from CINCIA from 1985 to 2020, forest loss data from the Peruvian government (National Forest Conservation Program for Climate Change Mitigation), and the University of Maryland.

  1. Kennedy, R.E., Yang, Z., Gorelick, N., Braaten, J., Cavalcante, L., Cohen, W.B., Healey, S. (2018). Implementation of the LandTrendr Algorithm on Google Earth Engine. Remote Sensing. 10, 691.
  2. Erik Lindquist, FAO, 2021

Acknowledgements

This report was prepared with the technical support of USAID through the Prevent Project. Prevent (Proyecto Prevenir in Spanish) works with the Government of Peru, civil society, and the private sector to prevent and combat environmental crimes for the conservation of the Peruvian Amazon, particularly in the regions of Loreto, Madre de Dios, and Ucayali.

Disclaimer: This publication is made possible by the generous support of the American people through USAID. The contents are the sole responsibility of the authors and do not necessarily reflect the views of USAID or the United States Government.


Citation

Finer M, Mamani N, Ariñez A (2023) Gold Mining Deforestation in the Southern Peruvian Amazon, 2021-2023. MAAP: 195.

MAAP #199: Amazon Carbon Update, based on NASA’s GEDI Mission

As we approach the COP28 climate summit, starting in Dubai in late November, we provide here a concise update on the current state of remaining Amazon carbon reserves.

We present the newly updated version of NASA’s GEDI data1, which uses lasers aboard the International Space Station to provide cutting-edge estimates of aboveground biomass density on a global scale.

Here, we zoom in on the Amazon and take a first look at the newly updated data, which covers the time period of April 2019 – March 2023.2

This data, which is measured in megagrams of aboveground biomass per hectare (Mg/ha) at a 1-kilometer resolution, serves as our estimate for aboveground carbon reserves.

Figure 1 displays aboveground biomass across the Amazon biome. Note the highest carbon densities (indicated in bright yellow) are located in both the northeast Amazon and southwest Amazon.

Aboveground Biomass across the Amazon

Figure 2 also displays aboveground biomass across the Amazon biome, but this time with country boundaries and labels added.

Note that the peak biomass concentrations in the northeast Amazon include Suriname, French Guiana, and the northeast corner of Brazil. The peak biomass concentrations in the southwest Amazon are centered in southern Peru. Also note that many parts of Ecuador, Colombia, Venezuela, Guyana, Bolivia, Brazil, and northern Peru have high carbon densities as well.

Figure 2. Aboveground biomass density (carbon estimate) across the Amazon biome, with country boundaries. Data: NASA/GEDI, NICFI.

Carbon Estimates

We calculated over 78 billion metric tons of aboveground biomass across the Amazon biome (78,184,161,090 metric tons to be exact). Using a general assumption that 48% of this biomass is carbon3, we estimate over 37 billion metric tons of carbon across the Amazon (37,528,397,323 metric tons).

Note that these totals are likely underestimates given that the laser-based data has not yet achieved full coverage across the Amazon (that is, there are many areas where the lasers have not yet recorded data, leaving visible blanks in the maps above).

This is consistent with a previous study based on another independent dataset, where we estimated 6.7 billion metric tons of carbon in the Peruvian Amazon as of 2013 (MAAP #148). The current GEDI data estimates at least 5.3 billion metric tons in the Peruvian Amazon.

Carbon Sink

In a previous report, we showed that the Brazilian Amazon has become a net carbon source, whereas the total Amazon is still a net carbon sink (MAAP #144). Our current report goes one step further in terms of showing just how much carbon is left in that sink.

Notes

1GEDI L4B Gridded Aboveground Biomass Density, Version 2.1. https://daac.ornl.gov/cgi-bin/dsviewer.pl?ds_id=2299

2Note that we previously reported on the initial data release, which covered the time period of April 2019 – August 2021 (see MAAP #160).

3Domke et al (2022) How Much Carbon is in Tree Biomass?. USDA/Forest Service.

Acknowledgements

This work was supported by NORAD (Norwegian Agency for Development Cooperation) and ICFC (International Conservation Fund of Canada).

Citation

Mamani N, Finer M, Ariñez A (2022) Amazon Carbon Update, based on NASA’s GEDI Mission. MAAP: 199.