MAAP #58: Link between Peru’s Flooding and Warm Coastal Waters

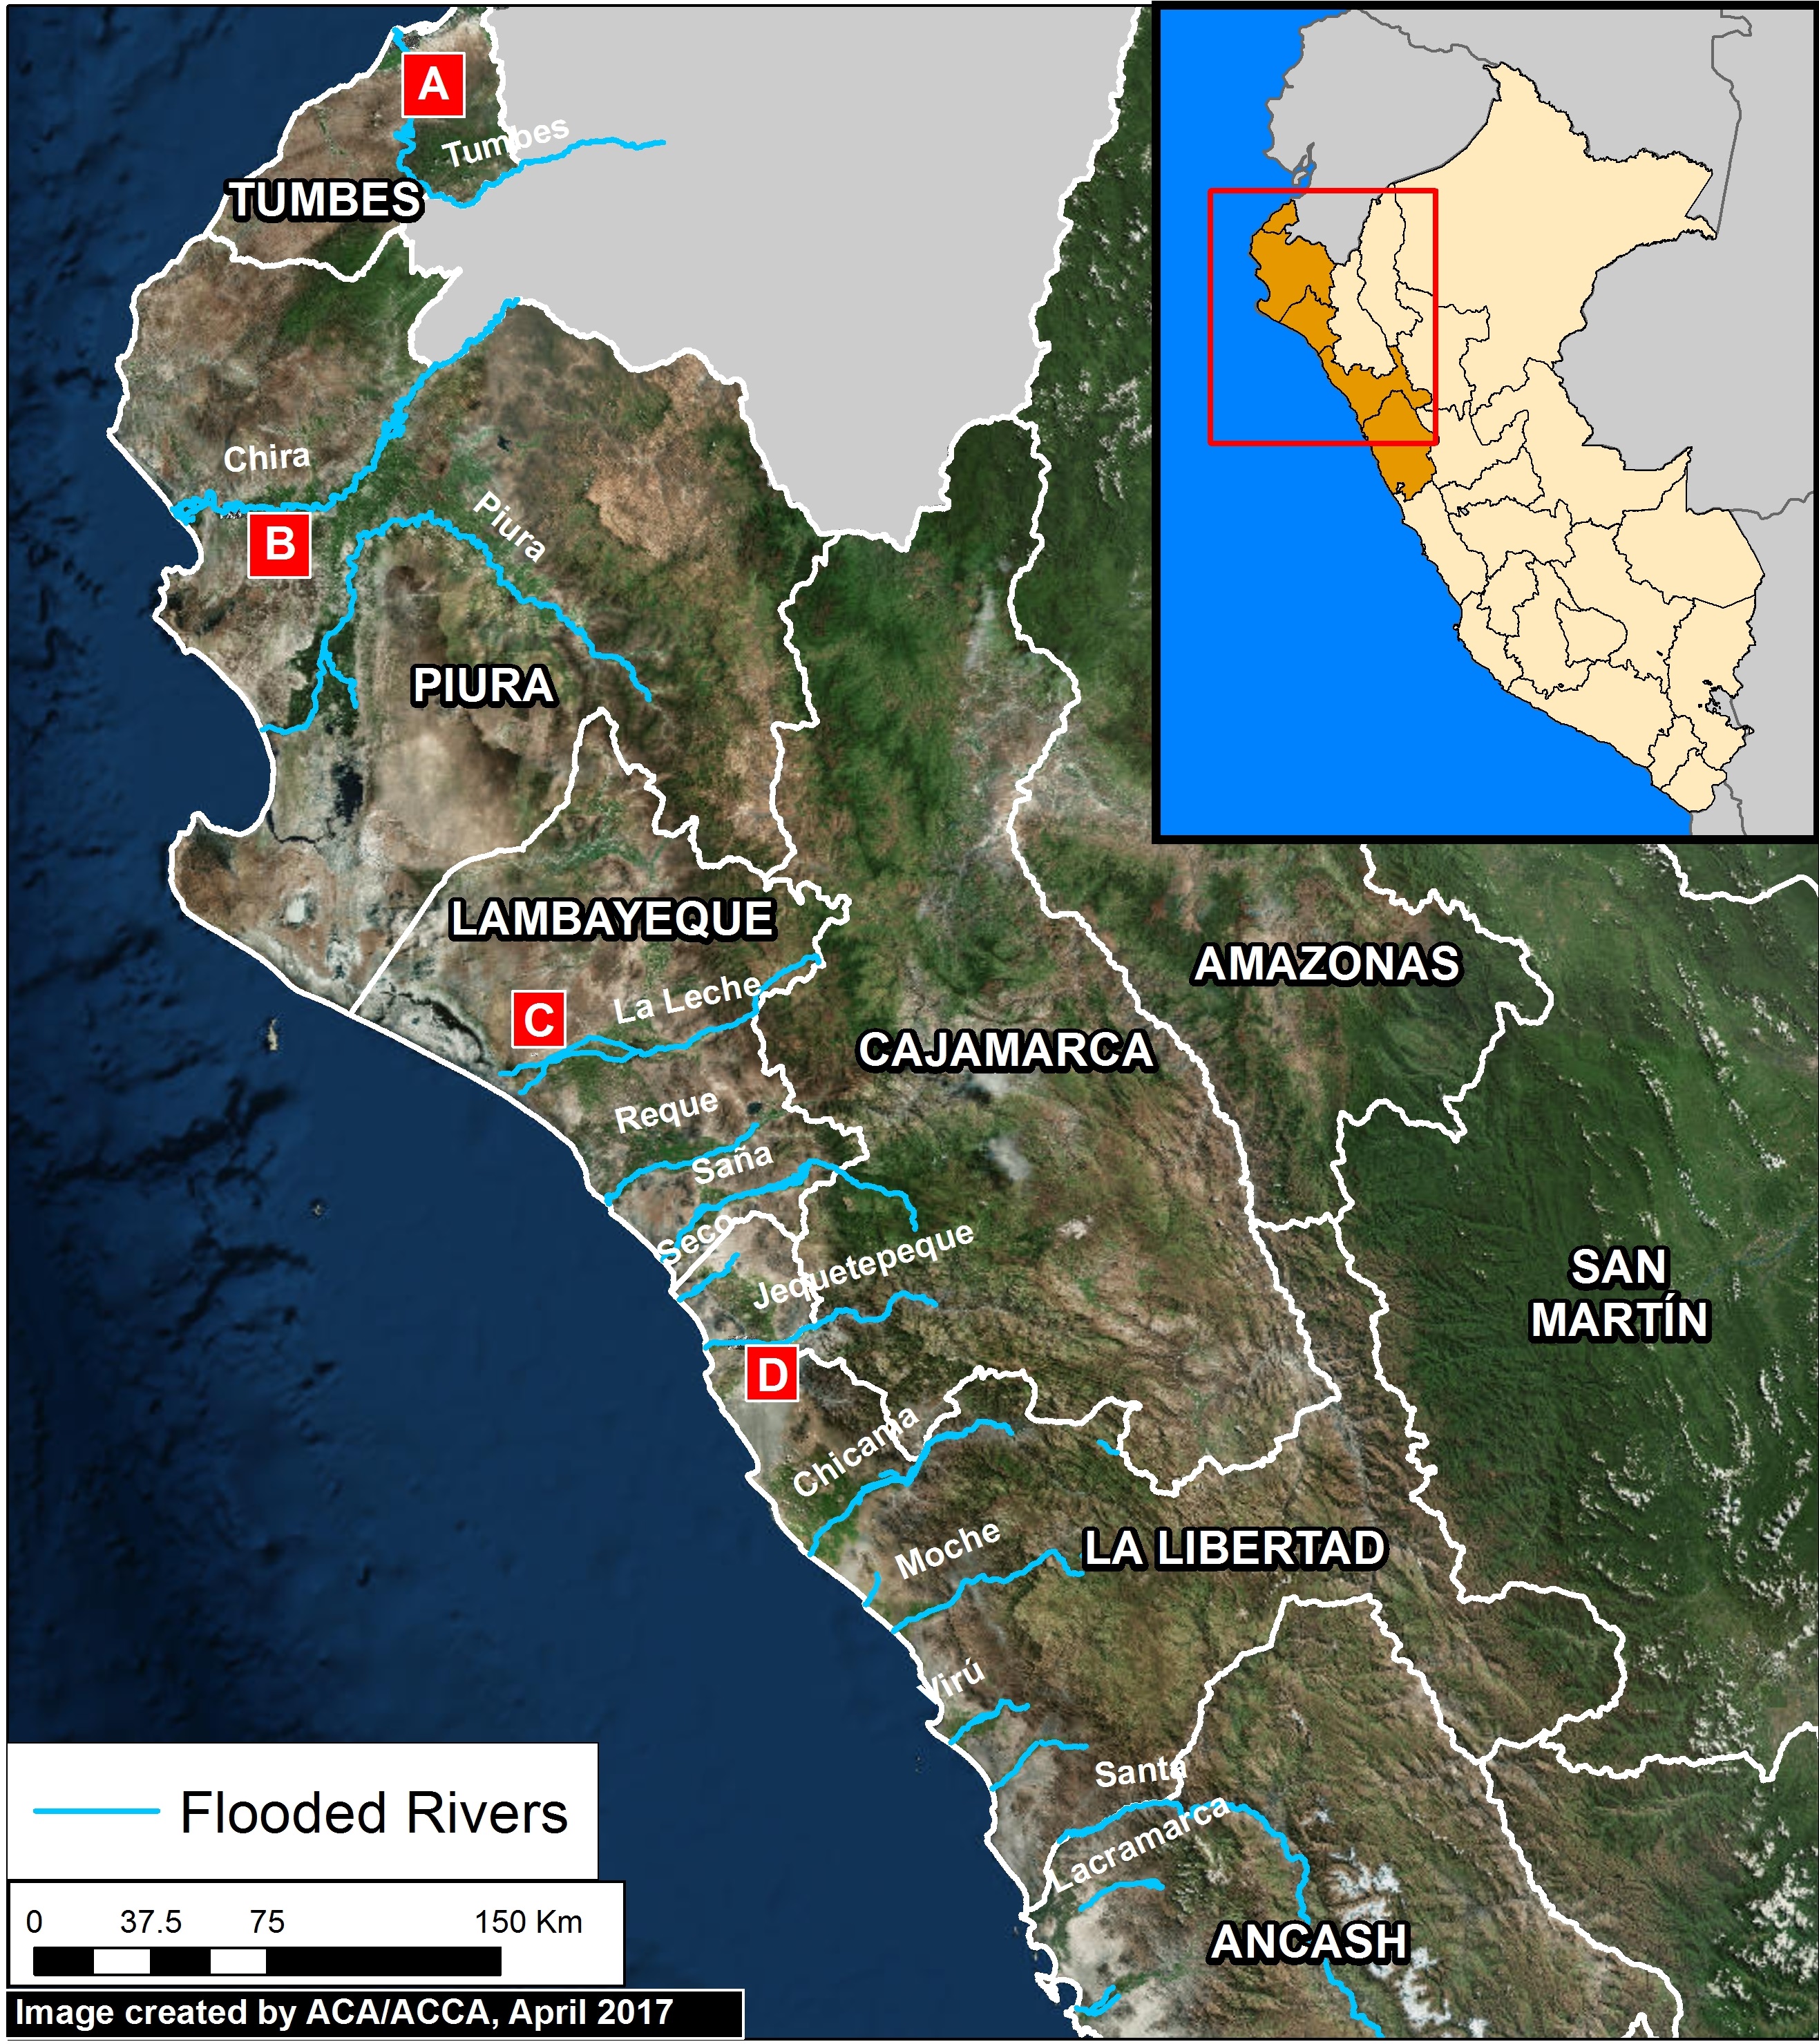
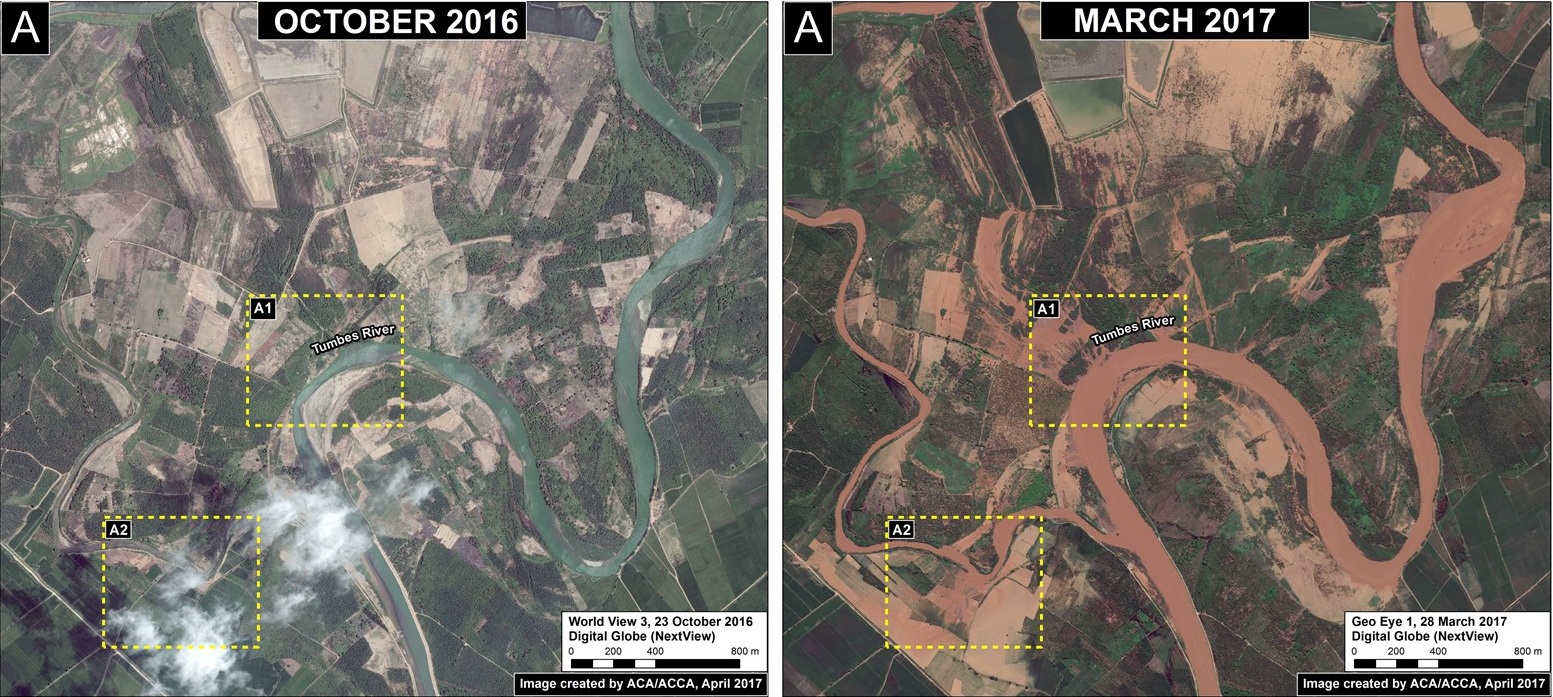
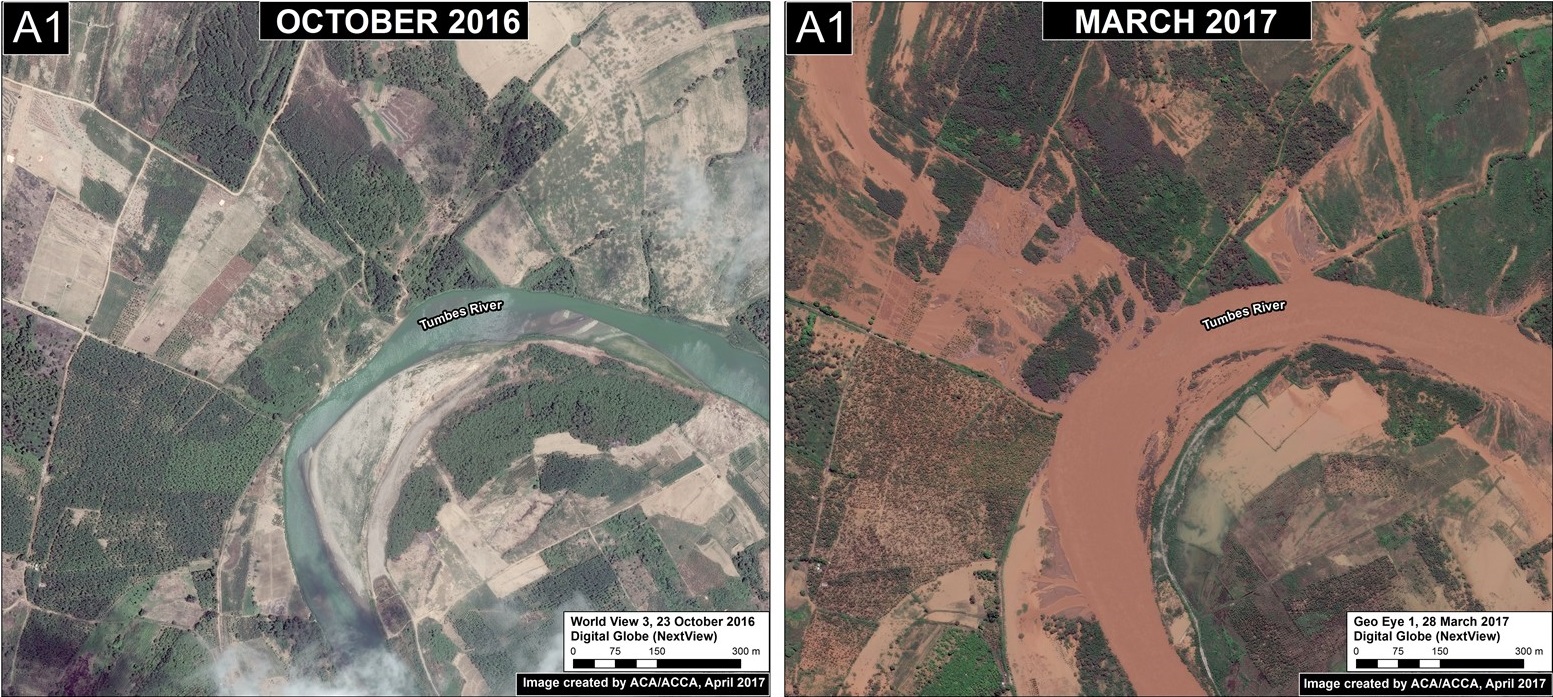
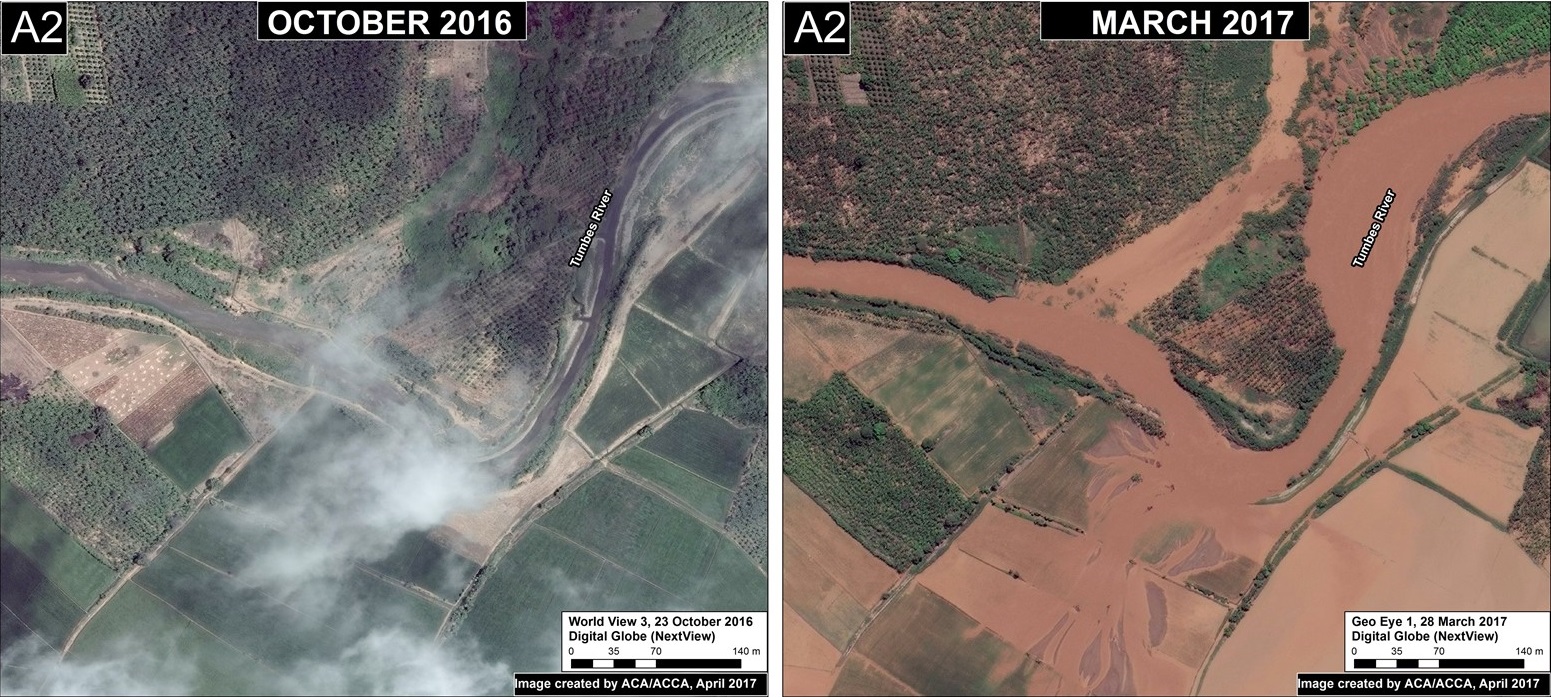
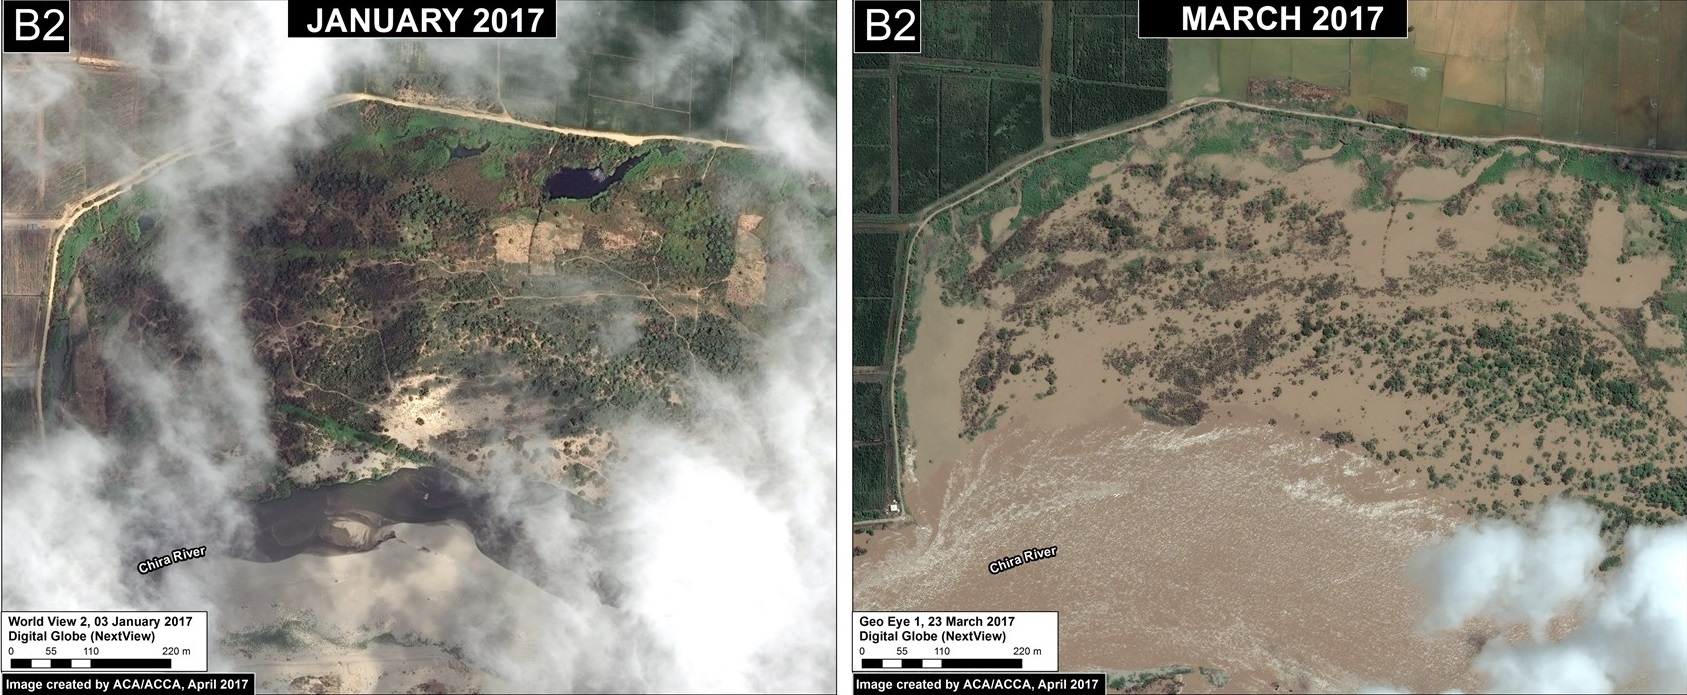
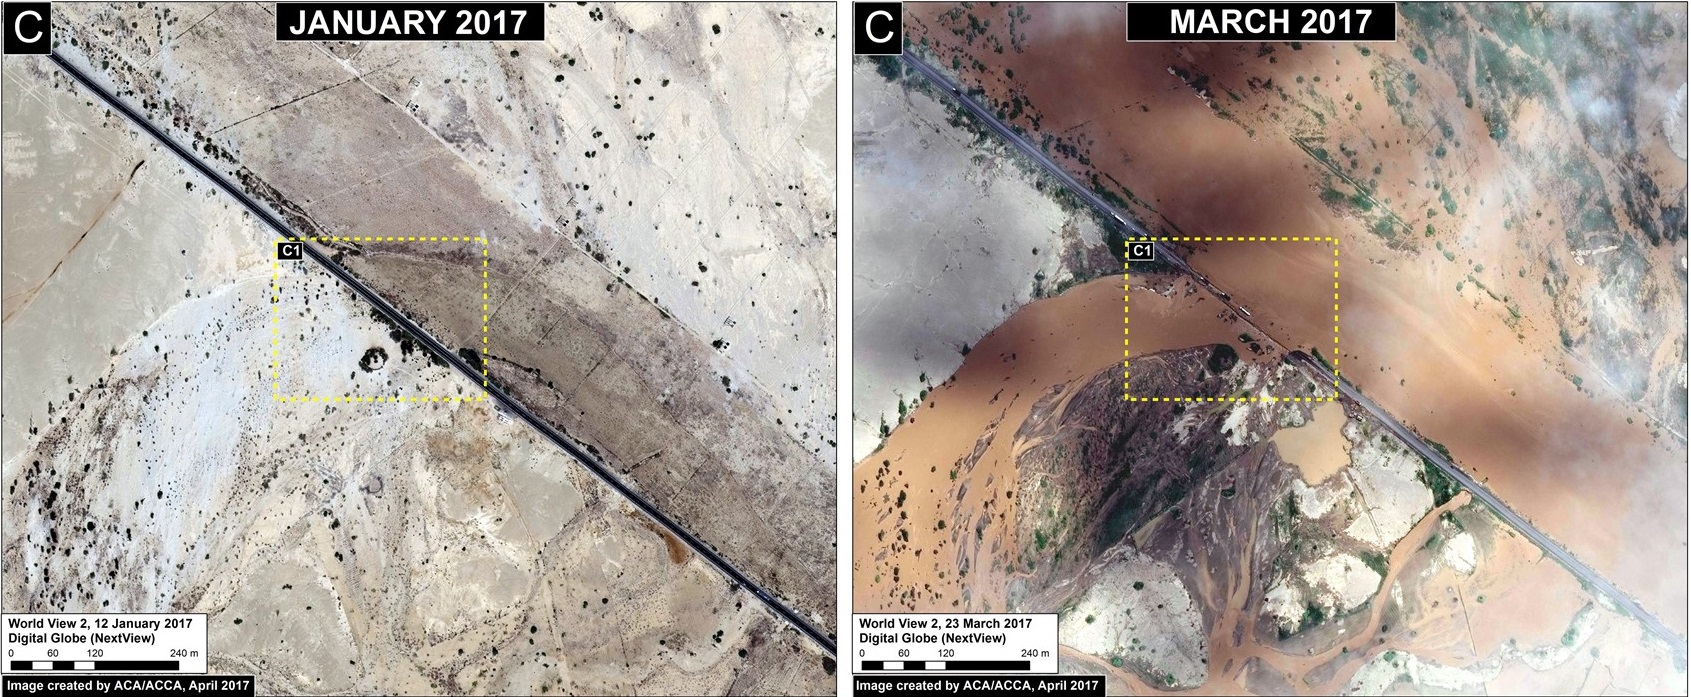
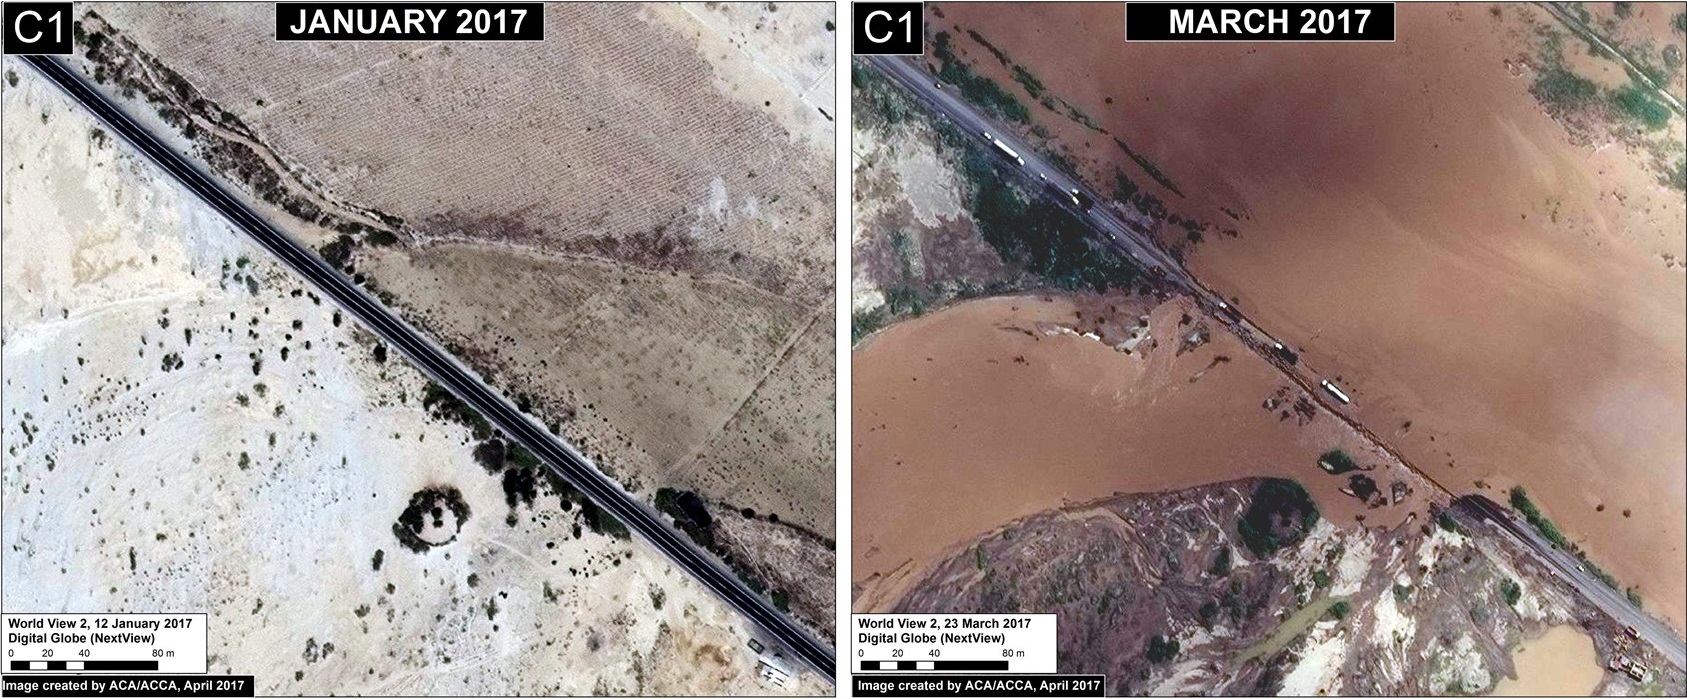
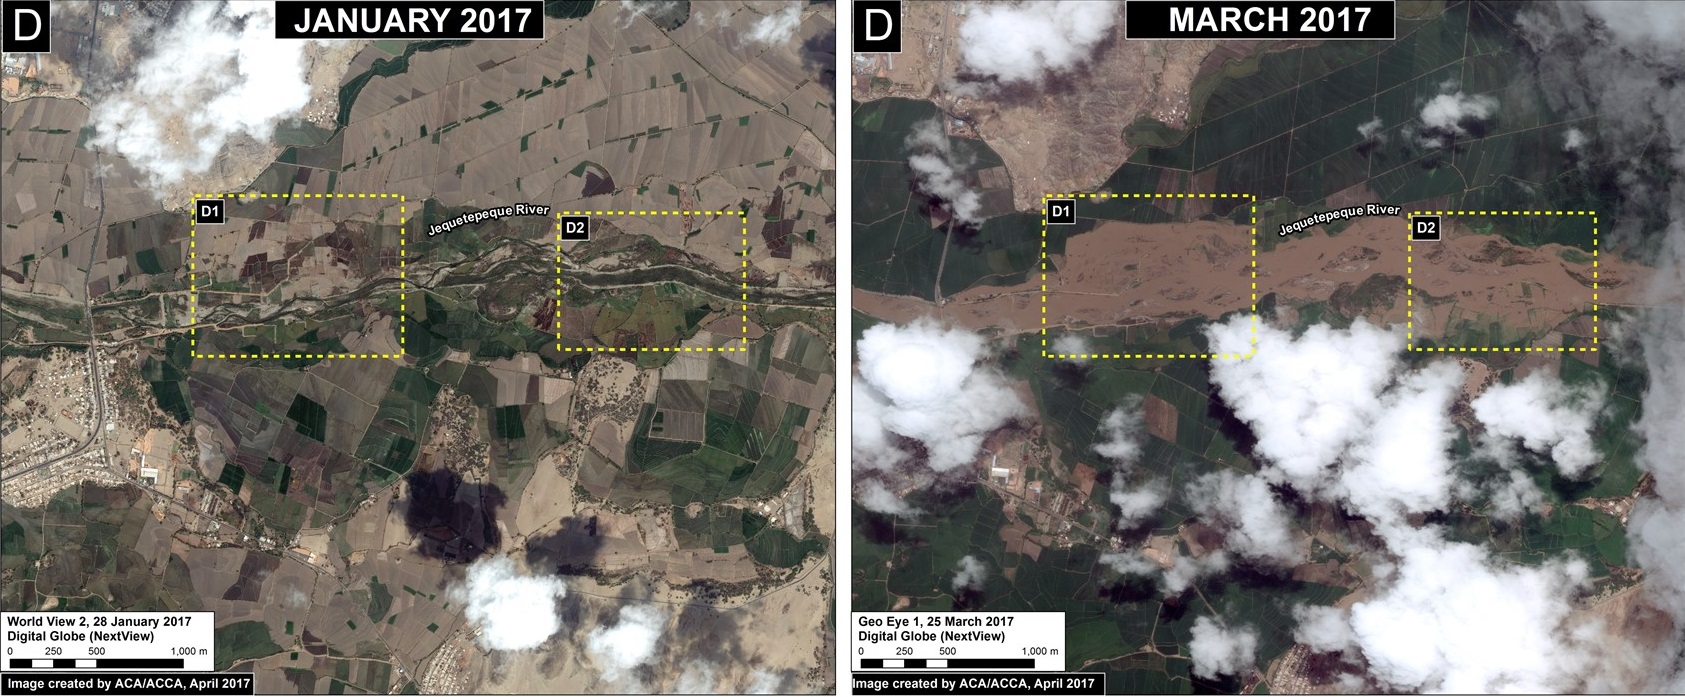
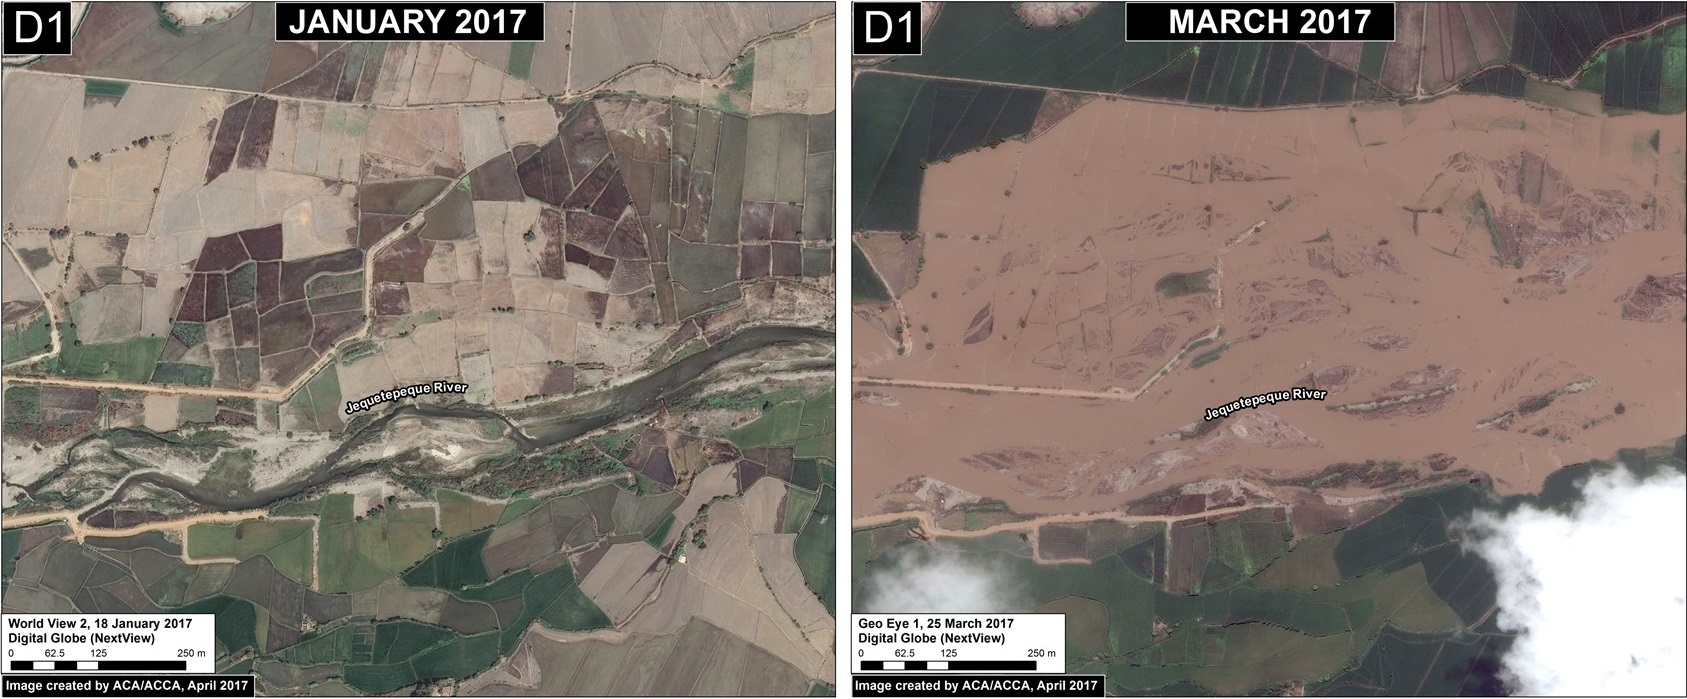
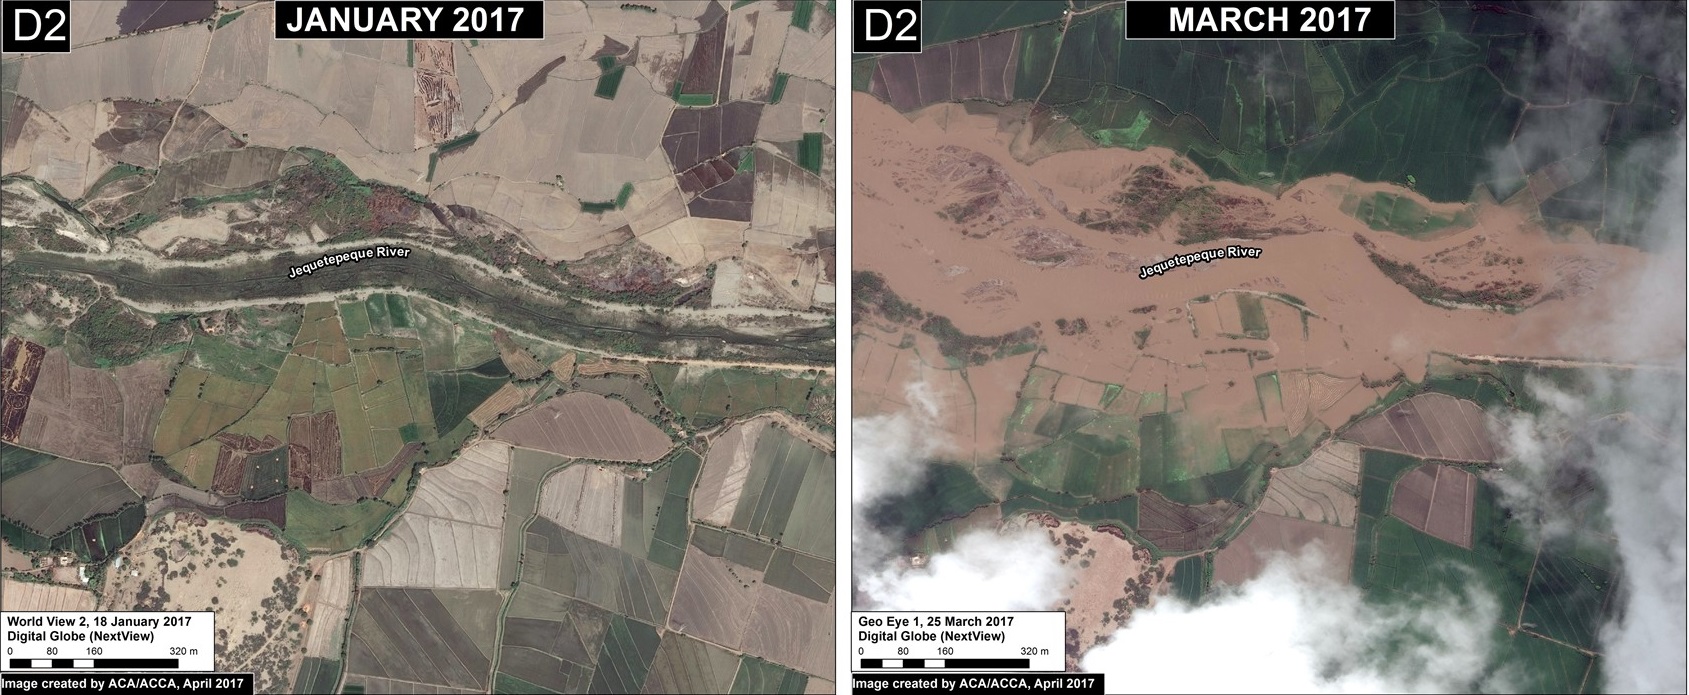
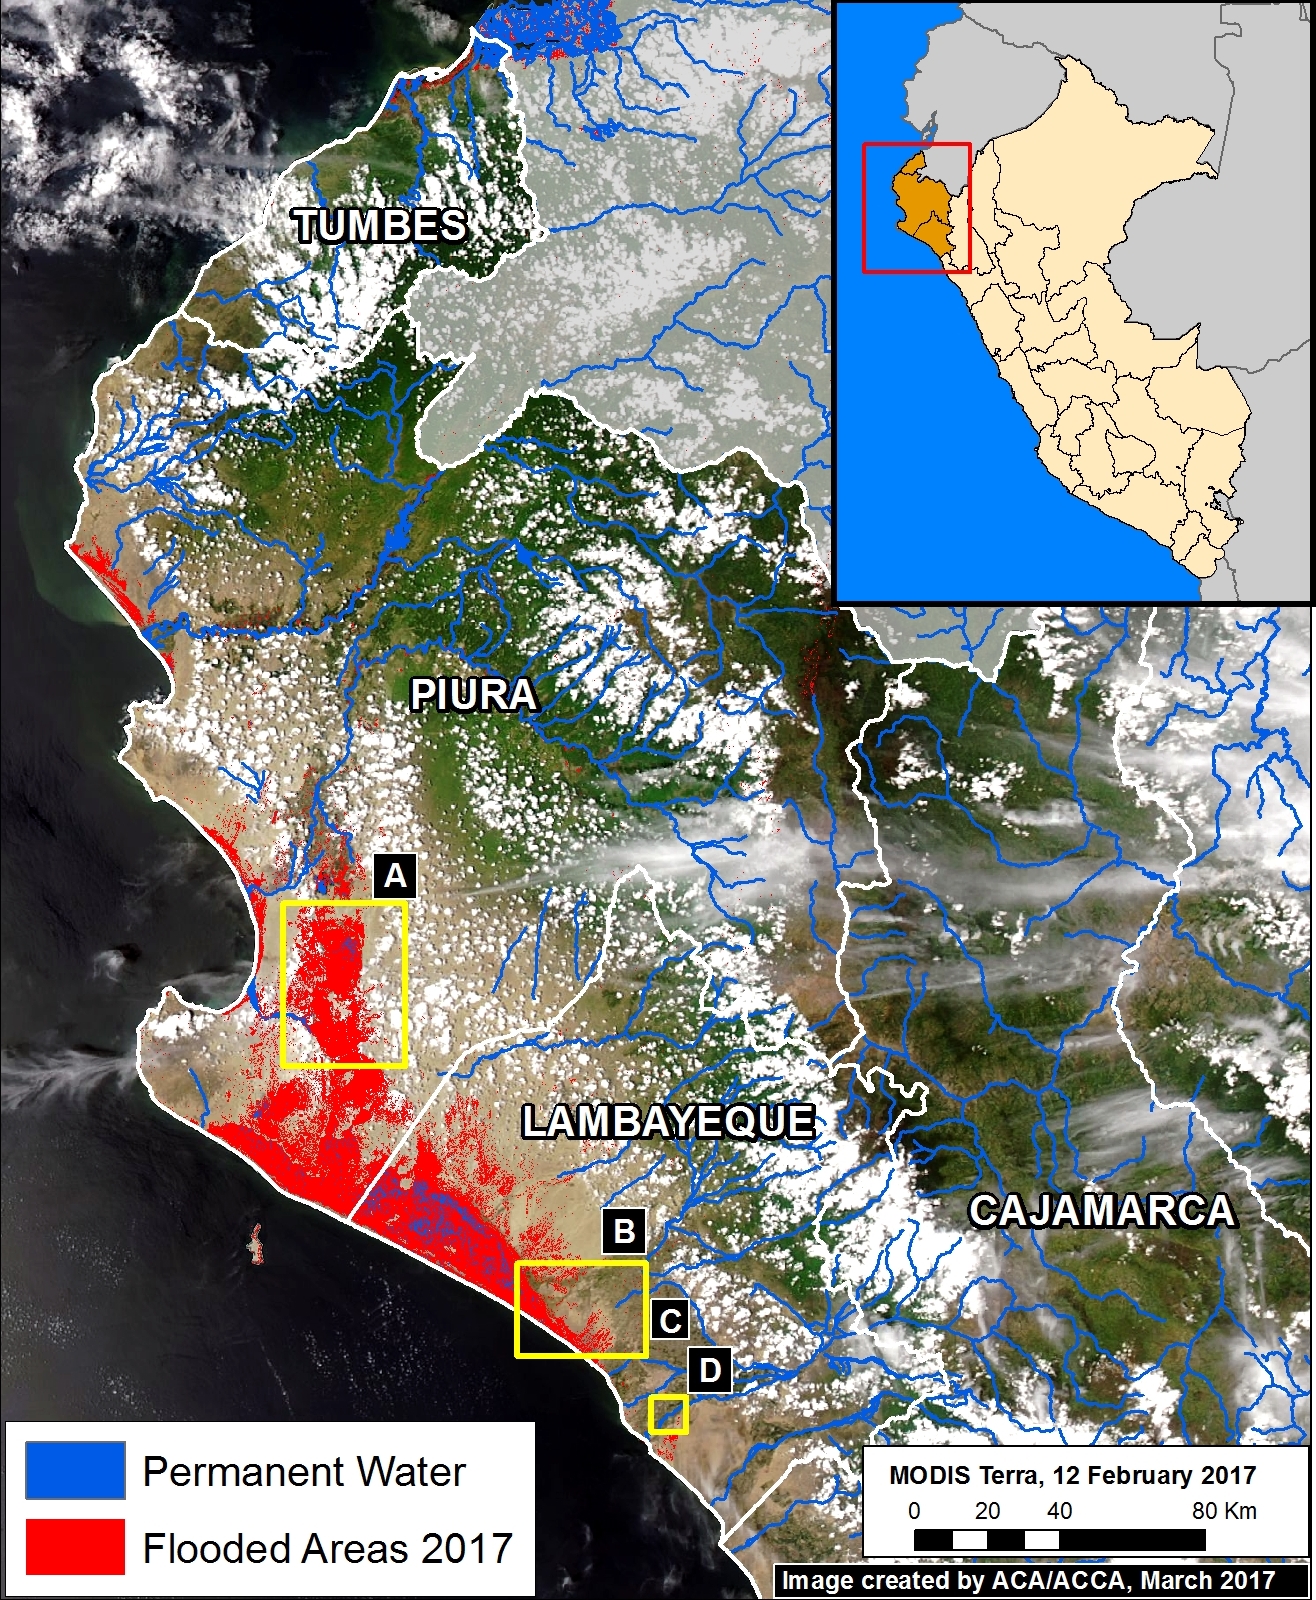
In previous articles MAAP #56 and MAAP #57, we presented a series of striking satellite images of the recent deadly floods in northern Peru. Satellites provide additional types of data critical to better understanding events such as extreme flooding. Here, we present two more types of satellite data related to the flooding: ocean water temperature and precipitation.


Warming Coastal Waters

Image 58a. Data: NOAA

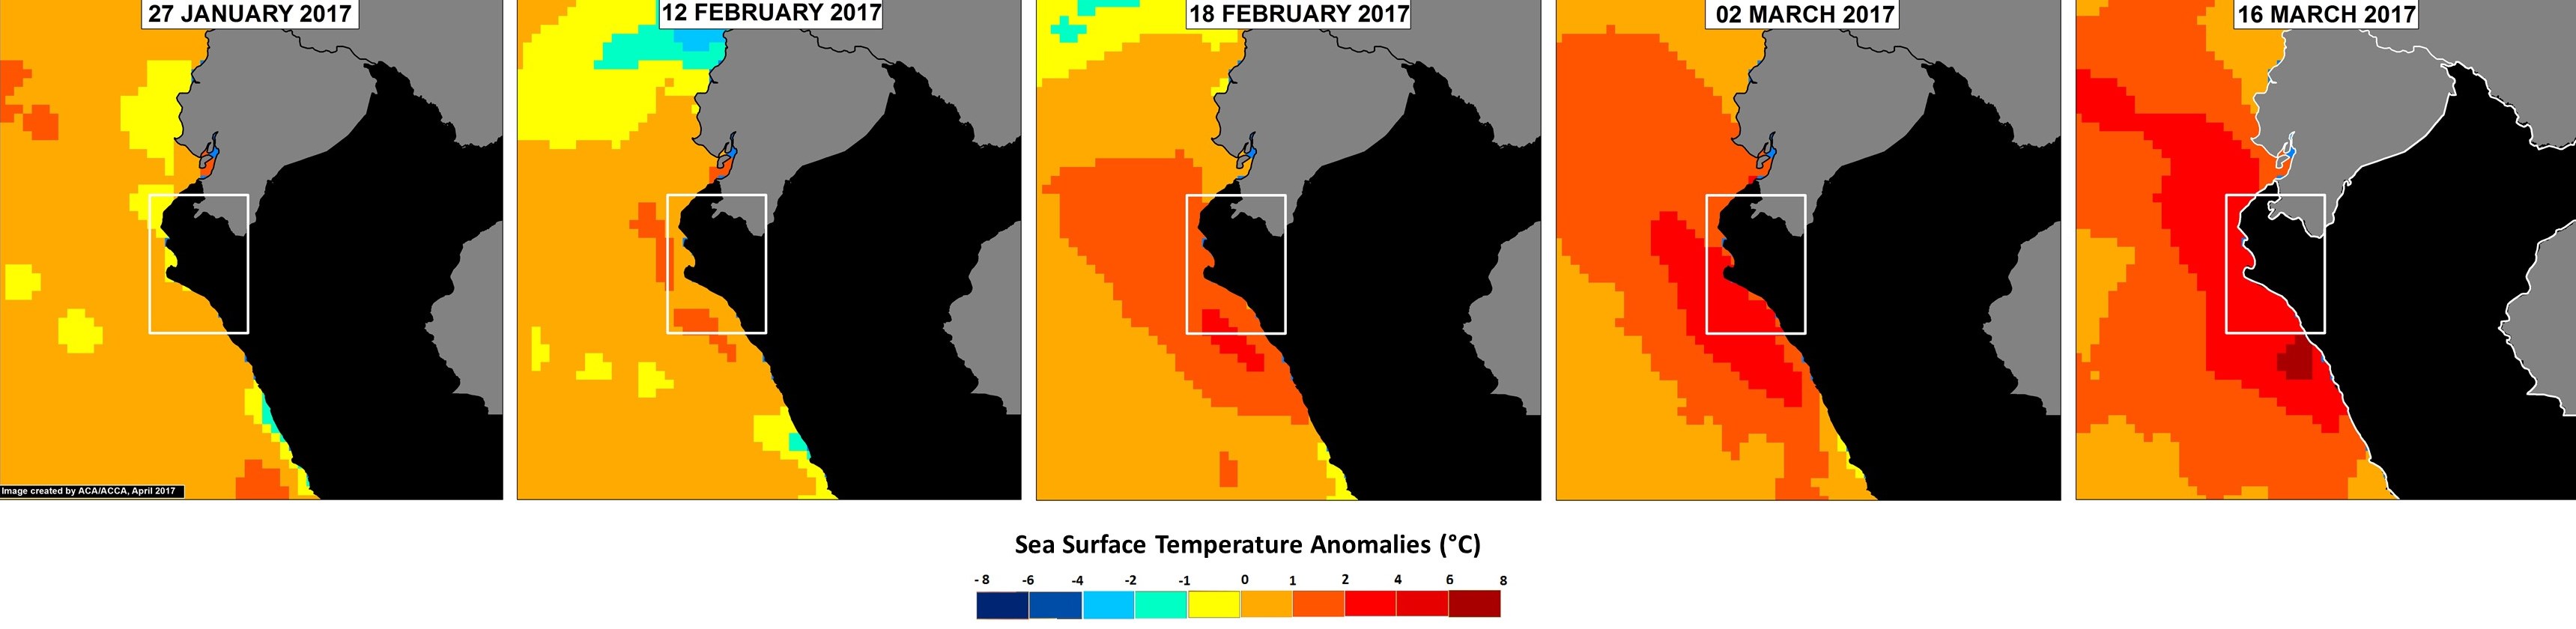
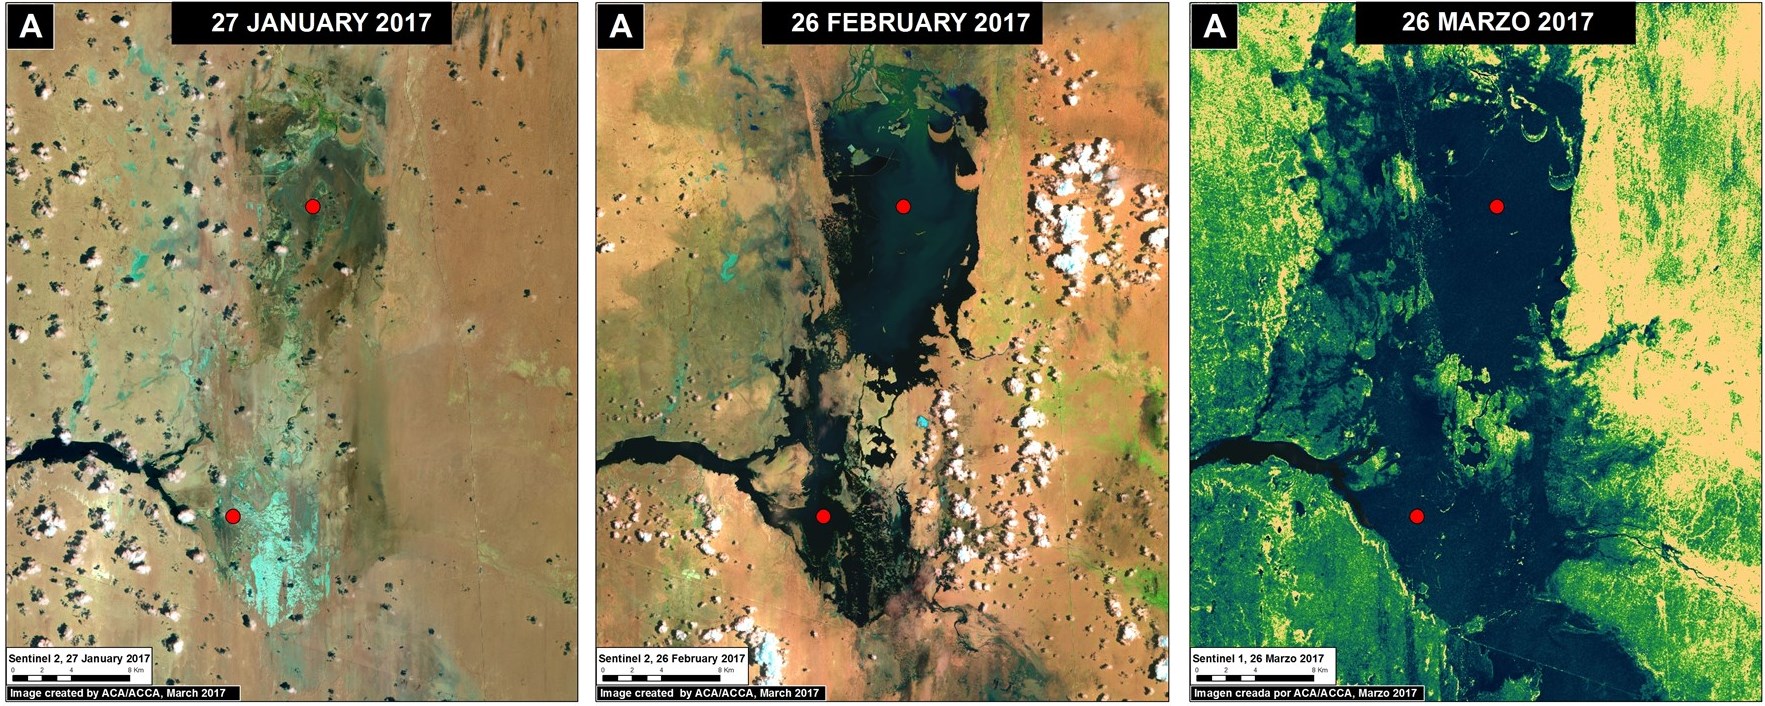
Satellite data from NOAA (the U.S. National Oceanic and Atmospheric Administration) clearly shows the warming of the northern Peruvian coastal waters immediately before and during the heavy rains and flooding (1, 2). Specifically, Image 58a shows the sudden warming in January, followed by intensifying warming in February and March (white inset box indicates primary flooding zone). Peruvian experts have referred to this phenomenon as “coastal El Niño”.

Heavy Rains

Image 58b. Data: Senamhi, GPM/NASA

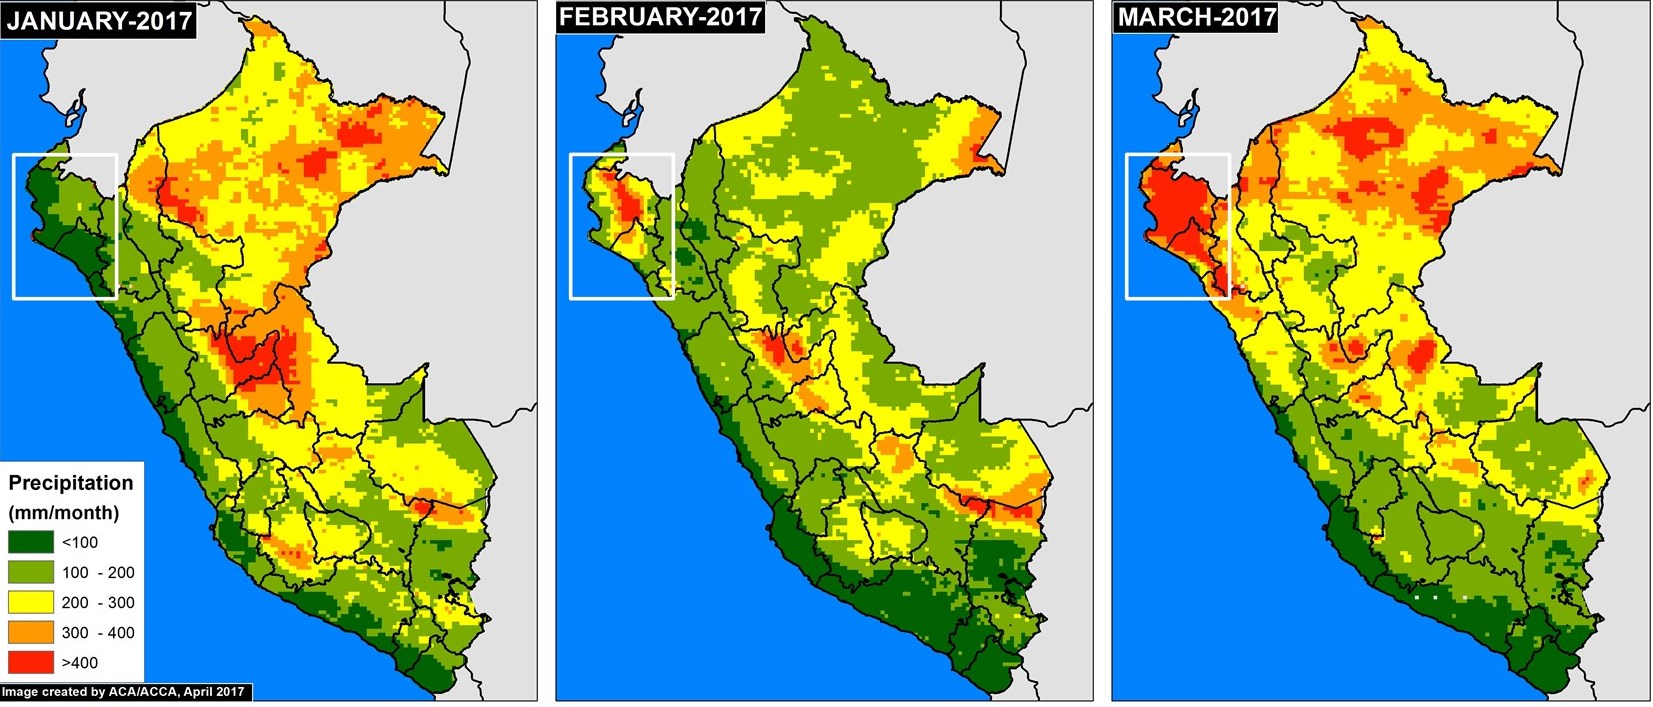
Image 58b shows the resulting accumulated monthly precipitation totals (white inset box indicates primary flooding zone). In January, as expected, the dry northern coast had much lower precipitation than the Amazon region to the east. In February and March, however, the northern coast experienced abnormally intense rainfall, even more than many parts of the Amazon.

Floods linked to Climate Change?

Questions have emerged regarding the link between the deadly Peruvian floods and climate change (3). As seen in the images above, the sudden appearance of warm coastal waters coincides with intense rains in the primary flooding zone. Additional analysis is needed to better understand the link between the Peruvian floods and climate change, but such events are consistent with predictions related to heavy rains fueled by ocean warming due to climate change (3). Climate change could also increase the frequency or intensity of El Niño events (4).

References

  1. Villa, L. (27 de marzo 2017). Radar Sentinel-1: Evaluación Preliminar del Impacto del Niño Costero en Perú (Parte II). [Mensaje en un blog]. Recuperado de: http://luciovilla.blogspot.com/2017/03/radar-sentinel-1-evaluacion-preliminar_27.html
  2. Villa, L. (17 de marzo 2017). Radar Sentinel-1: Evaluación Preliminar del Impacto del Niño Costero en Perú (Parte I). [Mensaje en un blog]. Recuperado de: http://luciovilla.blogspot.com/2017/03/radar-sentinel-1-evaluacion-preliminar.html
  3. Berwyn B (2017) Peru’s Floods Follow Climate Change’s Deadly Extreme Weather Trend. Inside Climate News. Link: https://insideclimatenews.org/news/24032017/peru-floods-extreme-weather-climate-global-warming-el-nino
  4. Fraser B (2017) Coastal El Niño catches Peru by surprise. EcoAmericas March 2017.

Citation

Finer M, Novoa S, Gacke S (2017) Link between Peru’s Flooding and Warm Coastal Waters. MAAP: 58.

MAAP #57: High Resolution Satellite Images of the Flooding in Peru

Image 57. Data: ESRI, INEI, MINAM. Click to enlarge.

In the previous MAAP #56, we showed a series of satellite images of the deadly floods that recently hit northern Peru.

In this report, we show a series of new, very high resolution satellite images (50 cm) of the flooding. They show, in striking detail, some of the local impacts, including to croplands and the Panamerican Highway.

Image 57 shows the 13 rivers that recently overflowed in northern Peru.

Below, we show images of the flooding around four of the rivers, labelled A-D.


Tumbes River

Image 57a shows the flooding along a stretch of the Tumbes River between October 2016 (left panel) and March 2017 (right panel). The yellow inset boxes indicate the areas of the follow-up zooms.

Image 57a. Data: Digital Globe (Nextview)
Inset A1. Data: Digital Globe (Nextview)
Inset A2. Data: Digital Globe (Nextview)

Chira River

Image 57b shows the flooding along a stretch of the Tumbes River between January (left panel) and March 2017 (right panel). The yellow inset boxes indicate the areas of the follow-up zooms.

Image 57b. Data: Digital Globe (Nextview)
Inset B1. Data: Digital Globe (Nextview)
Inset B2. Data: Digital Globe (Nextview)

La Leche River

Image 57c shows the flooding along a stretch of the La Leche River between January (left panel) and March 2017 (right panel). The yellow inset boxes indicate the areas of the follow-up zooms. Note the flooding of the PanAmerican Highway.

Image 57c. Data: Digital Globe (Nextview)
Inset C1. Data: Digital Globe (Nextview)

Jequetepeque River

Image 57d shows the flooding along a stretch of the Jequetepeque River between January (left panel) and March 2017 (right panel). The yellow inset boxes indicate the areas of the follow-up zooms.

Image 57d. Data: Digital Globe (Nextview)
Inset D1. Data: Digital Globe (Nextview)
Inset D2. Data: Digital Globe (Nextview)

References

UNOSAT, 2017. Efectos del Niño Costero: Inundaciones en Perú, Departamentos de La Libertad & Ancash. _Marzo_20170321

UNOSAT, 2017. Efectos del Niño Costero: Inundaciones en Perú, Departamentos de La Libertad & Ancash. _Marzo_20170321

UNOSAT, 2017. Efectos del Niño Costero: Inundaciones en Perú, Departamentos de Piura. Marzo_20170320

Citation

Novoa S, Finer M (2017) High Resolution Images of the Flooding in Peru. MAAP: 57

MAAP: What satellites show us about Peru’s flooding

Image 57. Data: ESRI, INEI, MINAM. Click to enlarge.

Satellites provide unique information that is critical to understanding events on Earth, including the recent deadly flooding in northern Peru.

In the previous MAAP #56, we showed a series of satellite images of the deadly floods that recently hit northern Peru.

Here, we highlight how satellites can show us the extent, indicators, impacts, and causes of the flooding.

Image A (see left) shows the general extent of the flooding in northern Peru. Analyzing satellite imagery, we identified 13 major rivers that flooded, indicated in blue.


Indicators of Flooding

An indicator of intense rains and flooding in northern Peru is the formation of the temporary lagoons La Niña and La Niña Sur, in the region of Piura. Image B shows the rapid formation of the lagoons between late January (left panel) and March 2017 (right panel).

Image B. Data: ESA

Impact of Flooding

The centerpiece of our analysis is a series of high resolution satellite images of the flooding. Images C and D show, in striking detail, some of the local impacts to the Panamerican Highway and croplands between January (left panel) and March (right panel) 2017.

Image C. Data: DigitalGlobe (Nextview)
Inset C1. Data: DigitalGlobe (Nextview)
Image D. Data: DigitalGlobe (Nextview)
Inset D1. Data: DigitalGlobe (Nextview)

Causes of Flooding

Satellites also provide data about the link between ocean water temperature and the heavy rains causing the floods. Image E shows the warming of the northern Peruvian coastal waters immediately before and during the heavy rains and flooding. Peruvian experts have referred to this phenomenon as “coastal El Niño”.

Image E. Data: NOAA


Image F shows  the resulting accumulated monthly precipitation totals (white inset box indicates primary flooding zone). In January, as expected, the dry northern coast had much lower precipitation than the Amazon region to the east. In February and March, however, the northern coast experienced abnormally intense rainfall, even more than many parts of the Amazon.

Image F. Data: Senamhi, GPM/NASA

Citation

Novoa S, Finer M (2017) What satellites show us about Peru’s flooding. MAAP.

MAAP #56: Major Flooding in Northern Peru from Coastal El Niño

Image 56. Datos: NASA, ESA, JRC/Google

Intense rainfall is causing severe and deadly flooding along the northern coast of Peru.

The cause is likely “coastal El Niño,” a phenomenon produced by abnormal ocean warming along the equatorial coast of the Pacific Ocean.

Image 56 shows a preliminary estimate of the flooded areas along the northern coast (in red). We created this estimation via an analysis of radar images (Sentinel-1) that identified areas saturated with water.

Below, we show satellite images of the areas indicated by Insets A-D, which represent examples of flooding events.

Note that the red points indicate the same spots between panels.


Formation of Temporary Lagoons

An indicator of intense rains in northern Peru is the formation of the temporary lagoons La Niña and La Niña Sur, in the region of Piura. Image 56a shows the rapid formation of the lagoons between late January (left panel) and March 2017 (right panel).

Image 56a. Data: ESA

Floods that affect Towns, Infrastructure, and Crops

Image 56b shows areas where flooding has affected the Pan-American highway between January (left panel) and March (right panel) in the Lambayeque region. Image 56c shows a zoom of the overflowing La Leche River and the flooding of agricultural areas around the highway. Image 56d shows the flooding of the Reque River and the impact on agricultural areas and urban zones.

Image 56b. Data: ESA, NASA/USGS
Image 56c. Data: ESA
Image 56d. Data: Planet

References

Planet Team (2017). Planet Application Program Interface: In Space for Life on Earth. San Francisco, CA. https://api.planet.com

Citation

Novoa S, Finer M (2017) Major Flooding in Northern Peru from Coastal El Niño. MAAP: 56.