MAAP #66: Satellite Images of Belo Monte Dam Project (Brazil)

Image 66a. Red circle indicates dam project area.

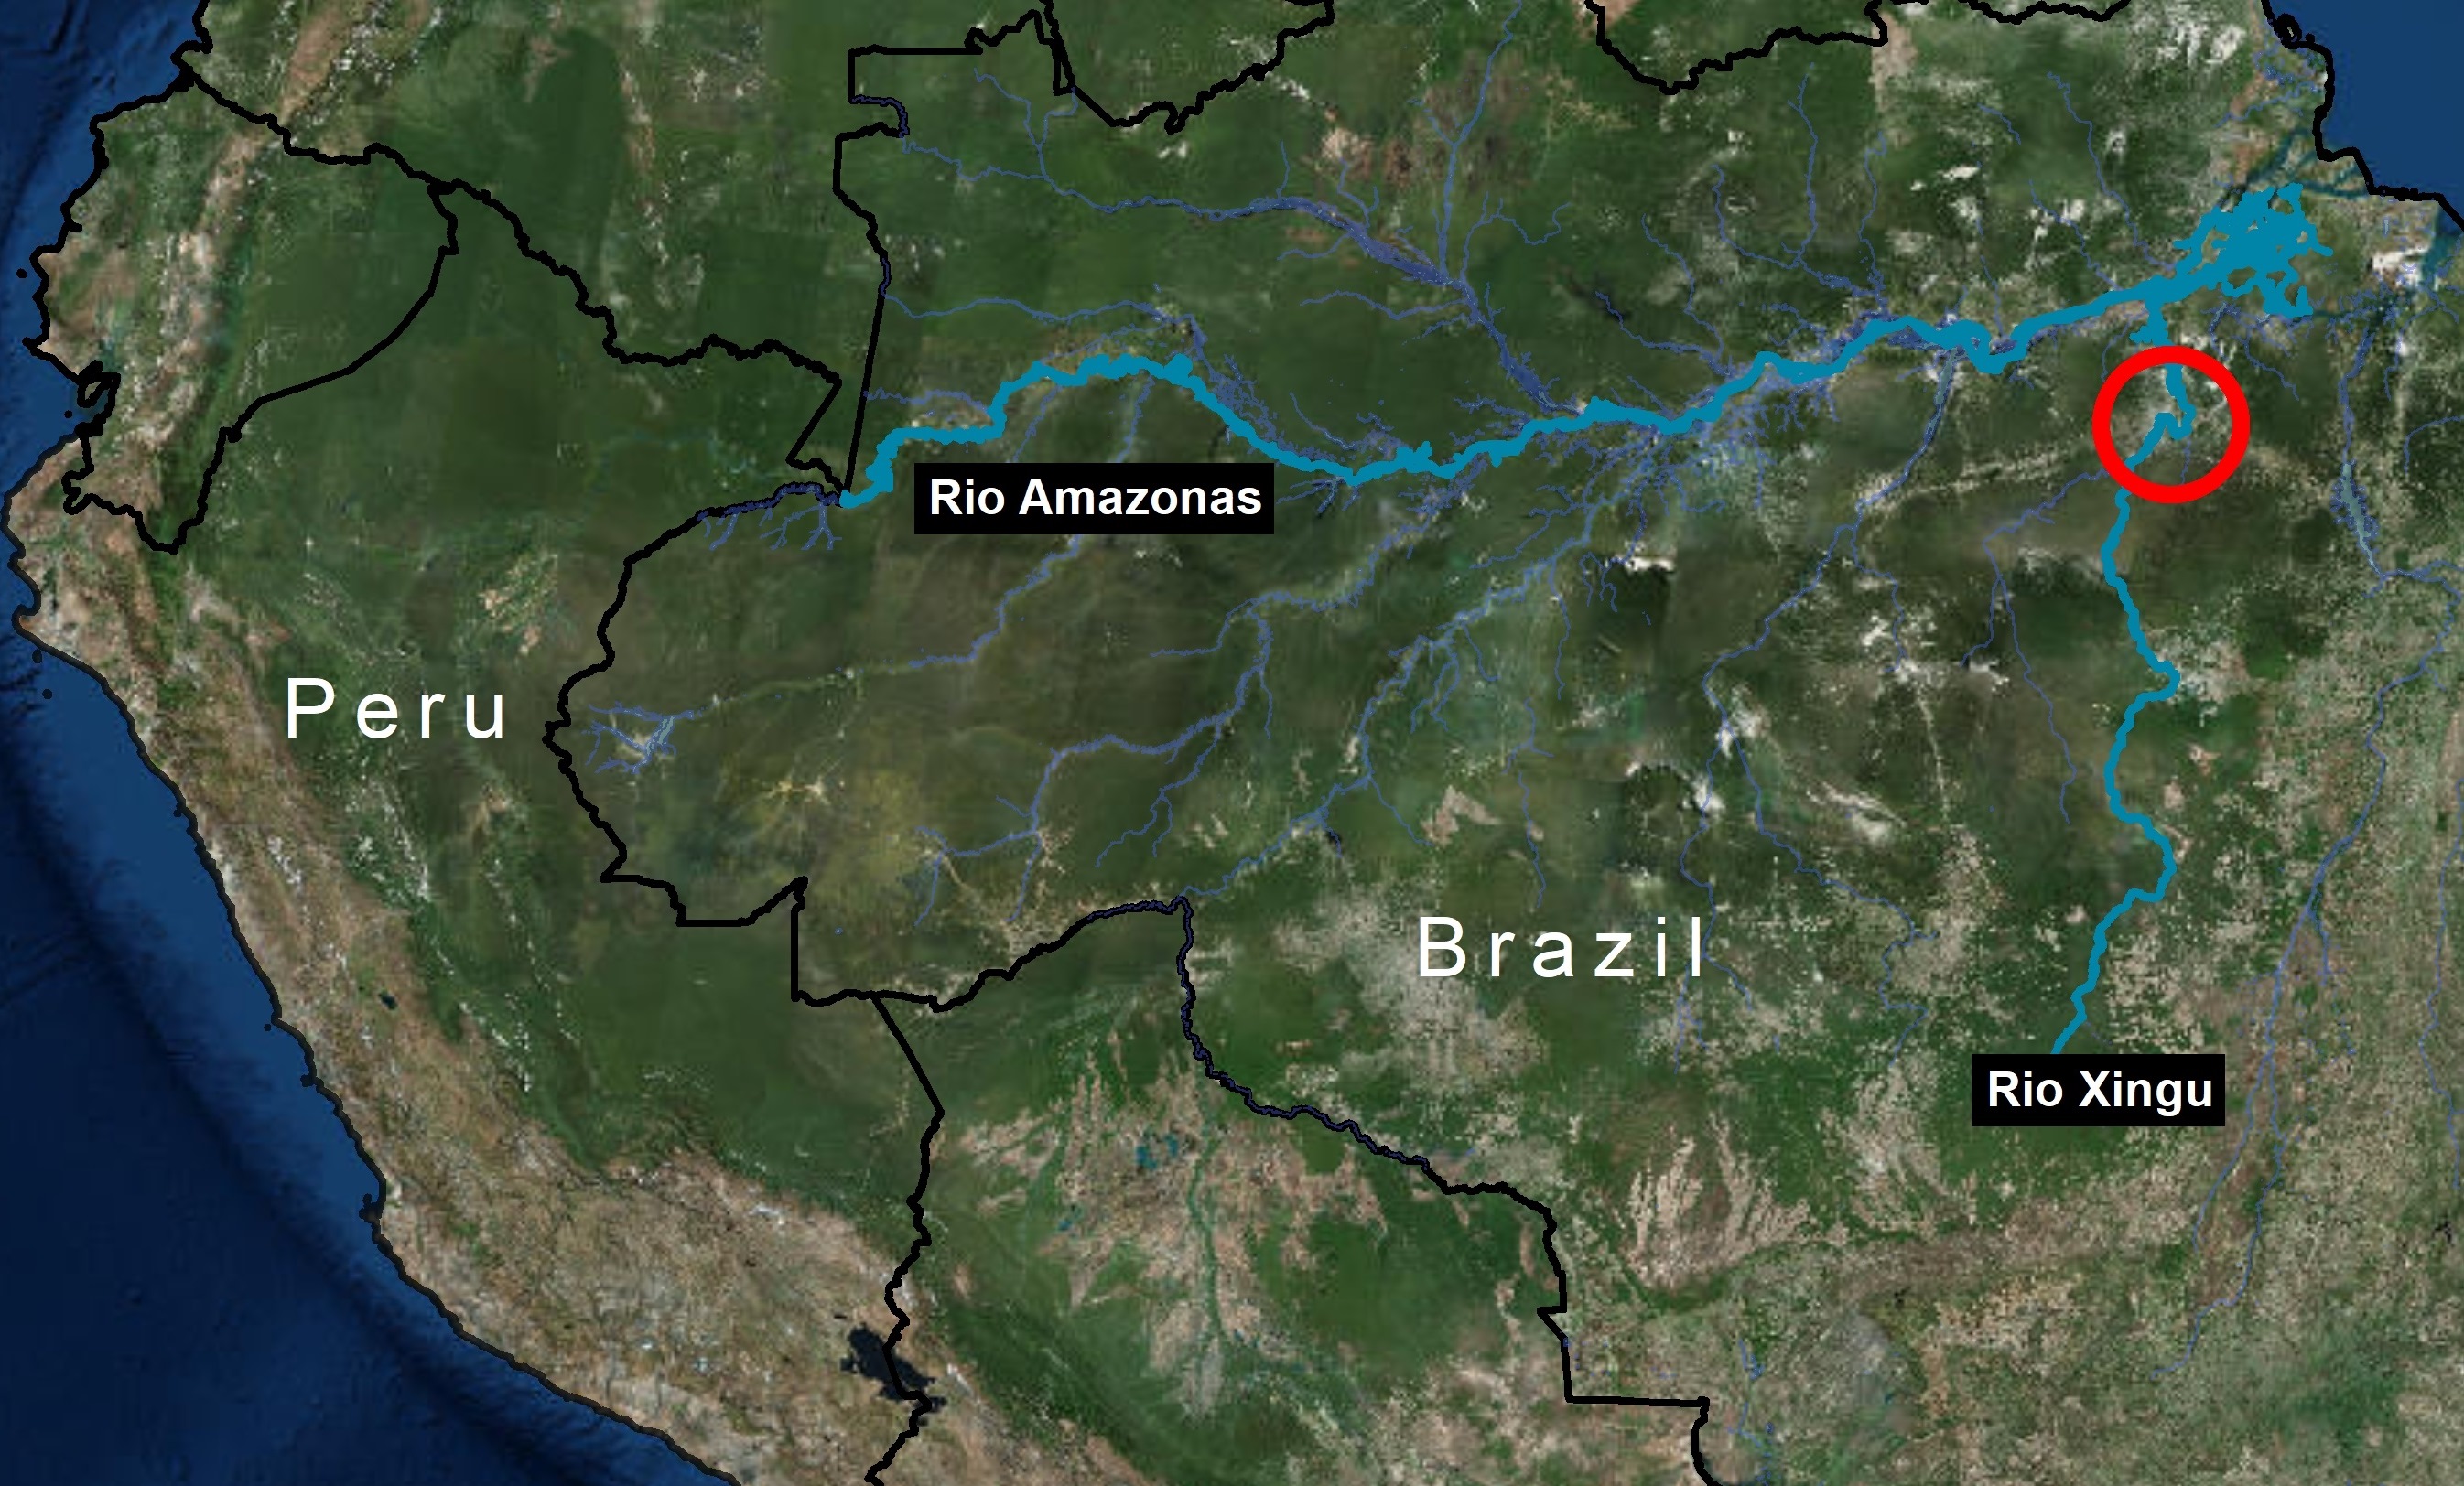
The Belo Monte hydroelectric dam complex, located on the Xingu River in the state of Para in the eastern Brazilian Amazon (see Image 66a), has been controversial since its inception over 15 years ago, due to both environmental and social concerns related to building and operating one of the largest dams in the world in a sensitive environment.

The dam has recently become operational, providing an opportunity to evaluate initial impacts.

The objective of this article is to present satellite imagery, including a time series from 2011 to 2017, that provides insight into major ecological impacts of the hydroelectric dam project.


Despite legal challenges and strong opposition from impacted indigenous groups, construction of Belo Monte began in 2011 and the first turbines became operational in early 2017. Image 66b shows a direct comparison of before (left panel, July 2011) and after (right panel, July 2017) dam construction.

Image 66b. NASA/USGS

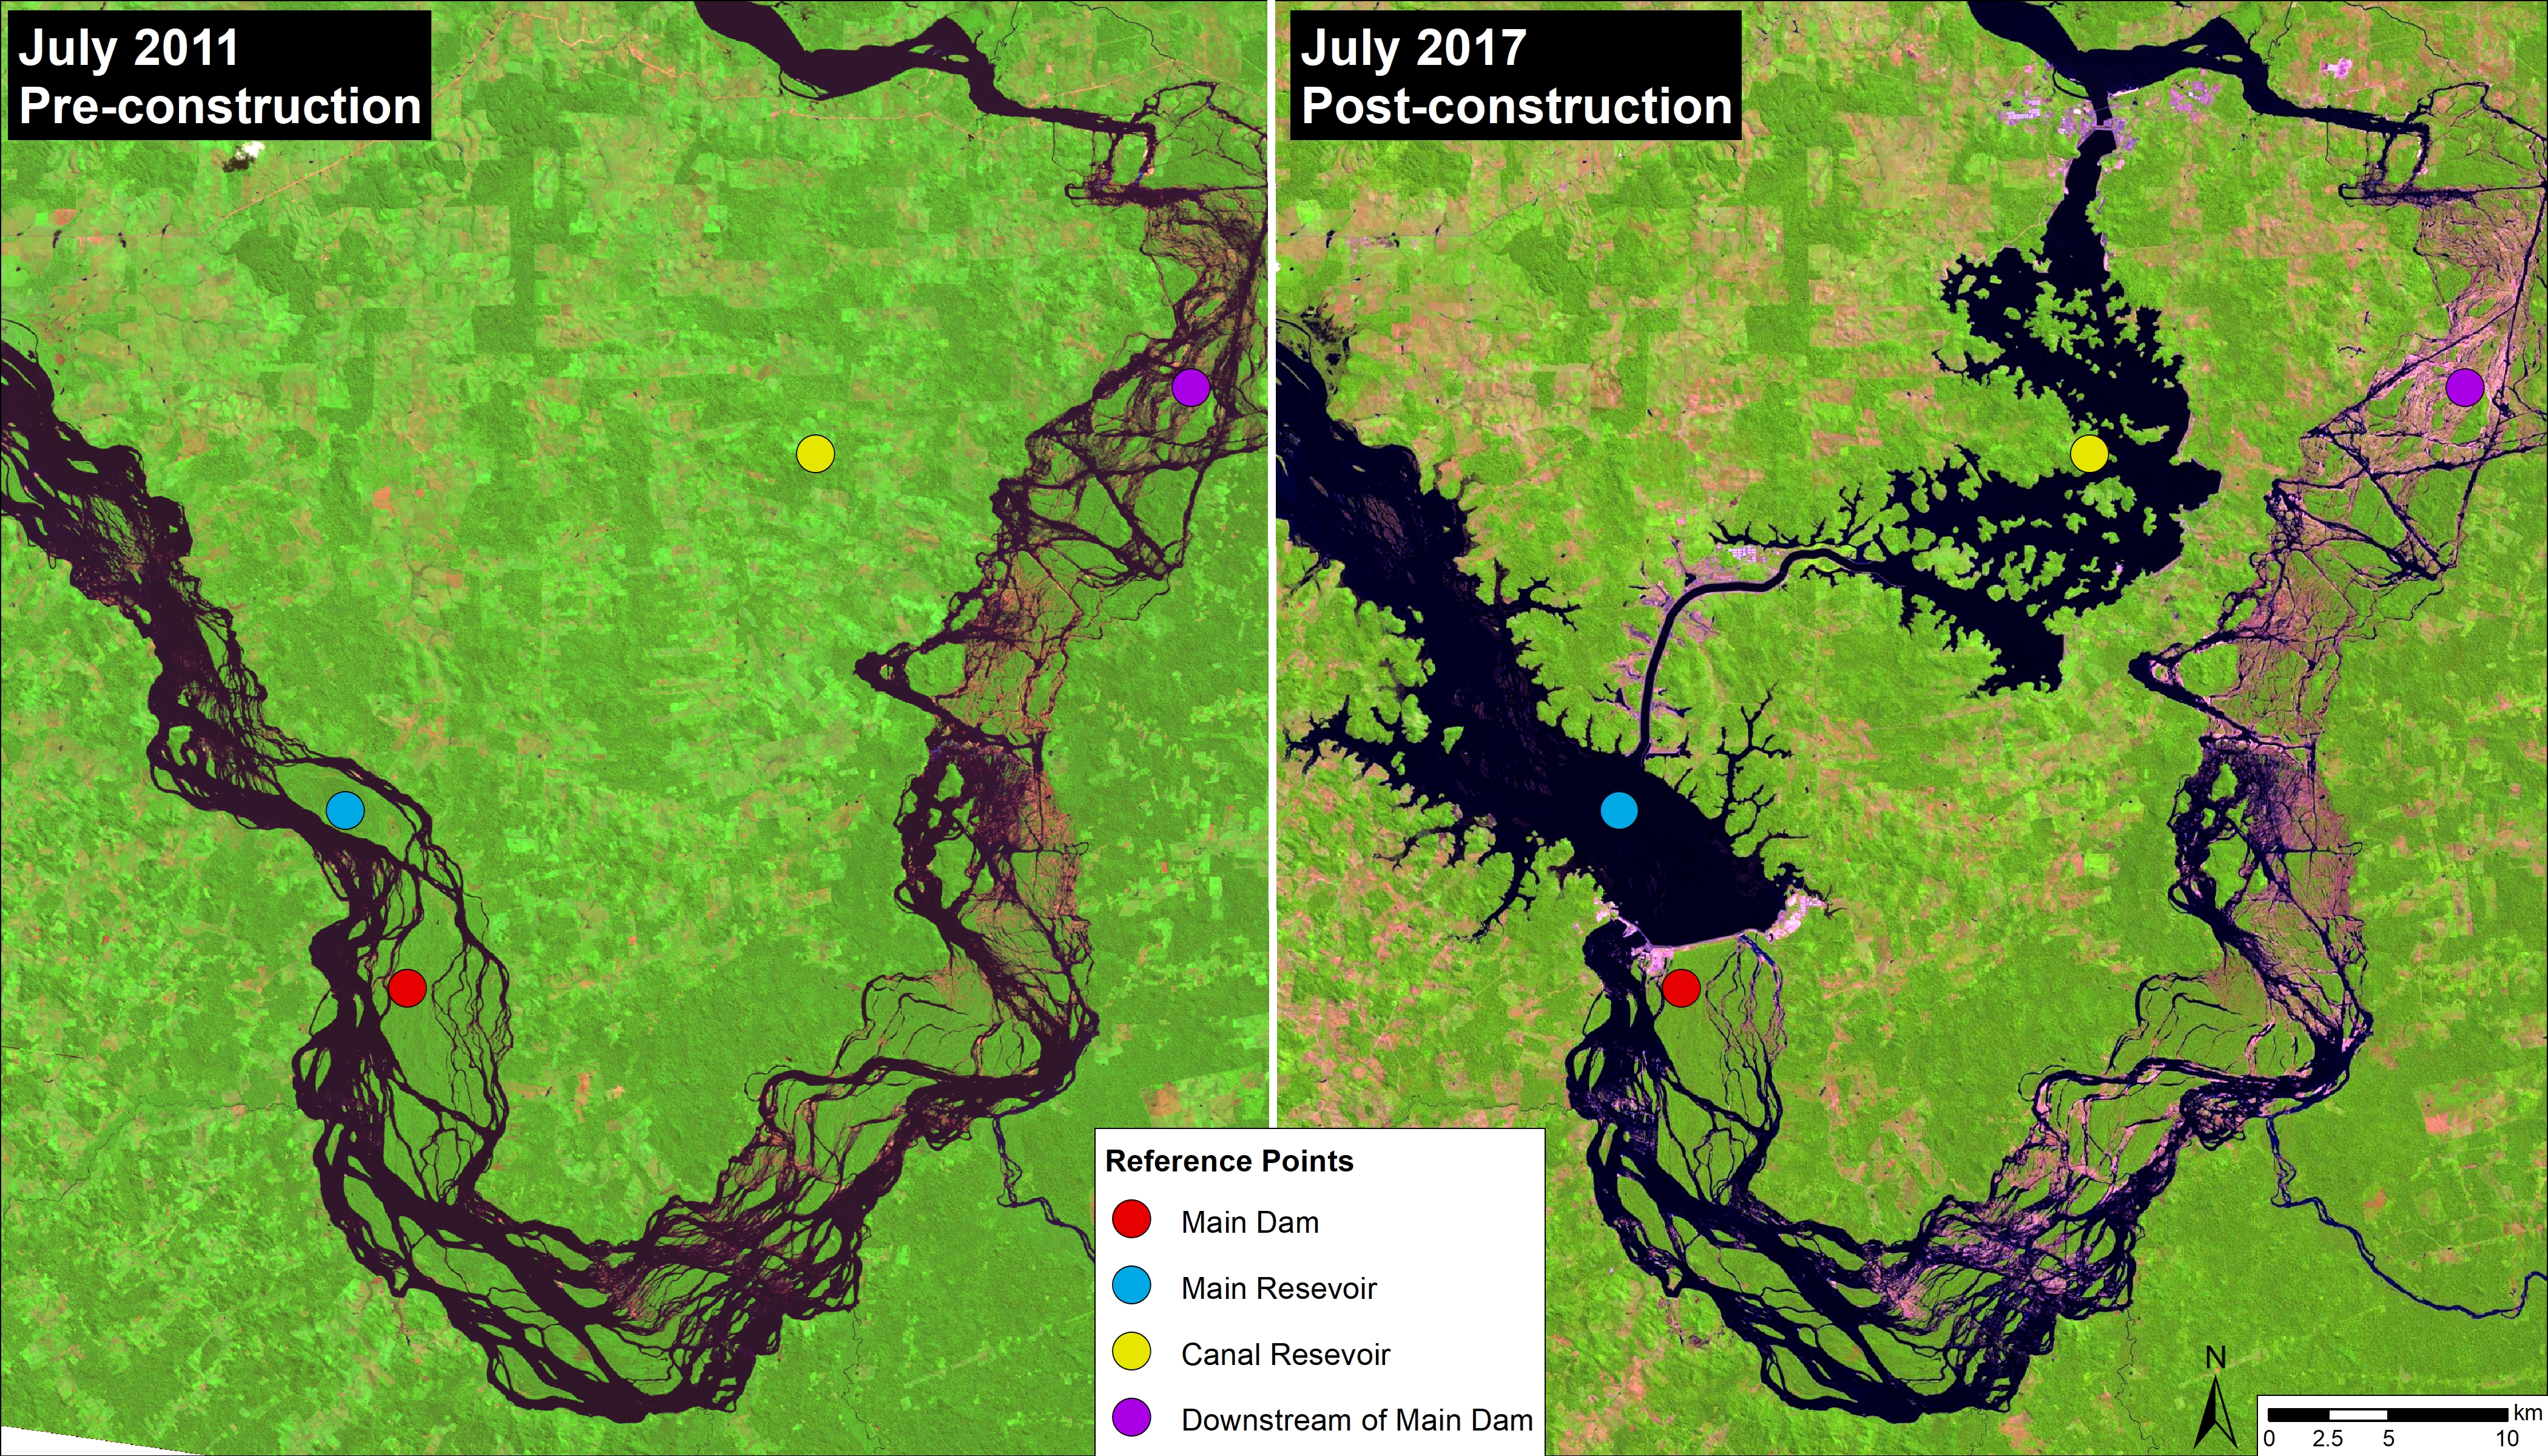
The dam is in fact a complex: the main dam (red circle) on the Xingu River creates a main reservoir (blue circle); a canal diverts much (up to 80%) of the river’s flow from the main reservoir to the canal reservoir (yellow circle), which feeds the turbines generating the electricity. As a result, downstream of the main dam is left with a much reduced flow (20%) for a stretch of 100 km. This reduced flow stretch, known as the Xingu River’s “Big Bend,” is home to two indigenous peoples (Arara and Juruna). The reference points in the images show these four areas of the complex across time, including before construction.

Satellite Image Time Series

Image 66c. Data: NASA/USGS

Image 66c is a GIF showing a satellite (Landsat) imagery time series of the project impact area from July 2011 through May 2017. July 2011 serves as the pre-project baseline before the start of construction. By July 2015, construction of the main dam and canal is well under way. By January 2016, the main dam has closed, forming both the main and canal reservoirs. August 2016 provides a nearly cloudless view of the dam complex, including how dry the downstream section becomes. July 2017 represents the most recent cloud-free Landsat image.

In the most recent images, note the negative impact on local fisheries: flooding of river islands, rock outcrops, and seasonally flooded forests in the Main Reservoir that were important fish habitat; and reduced water flow along the “Big Bend” below the Main Dam, also important fish habitat.
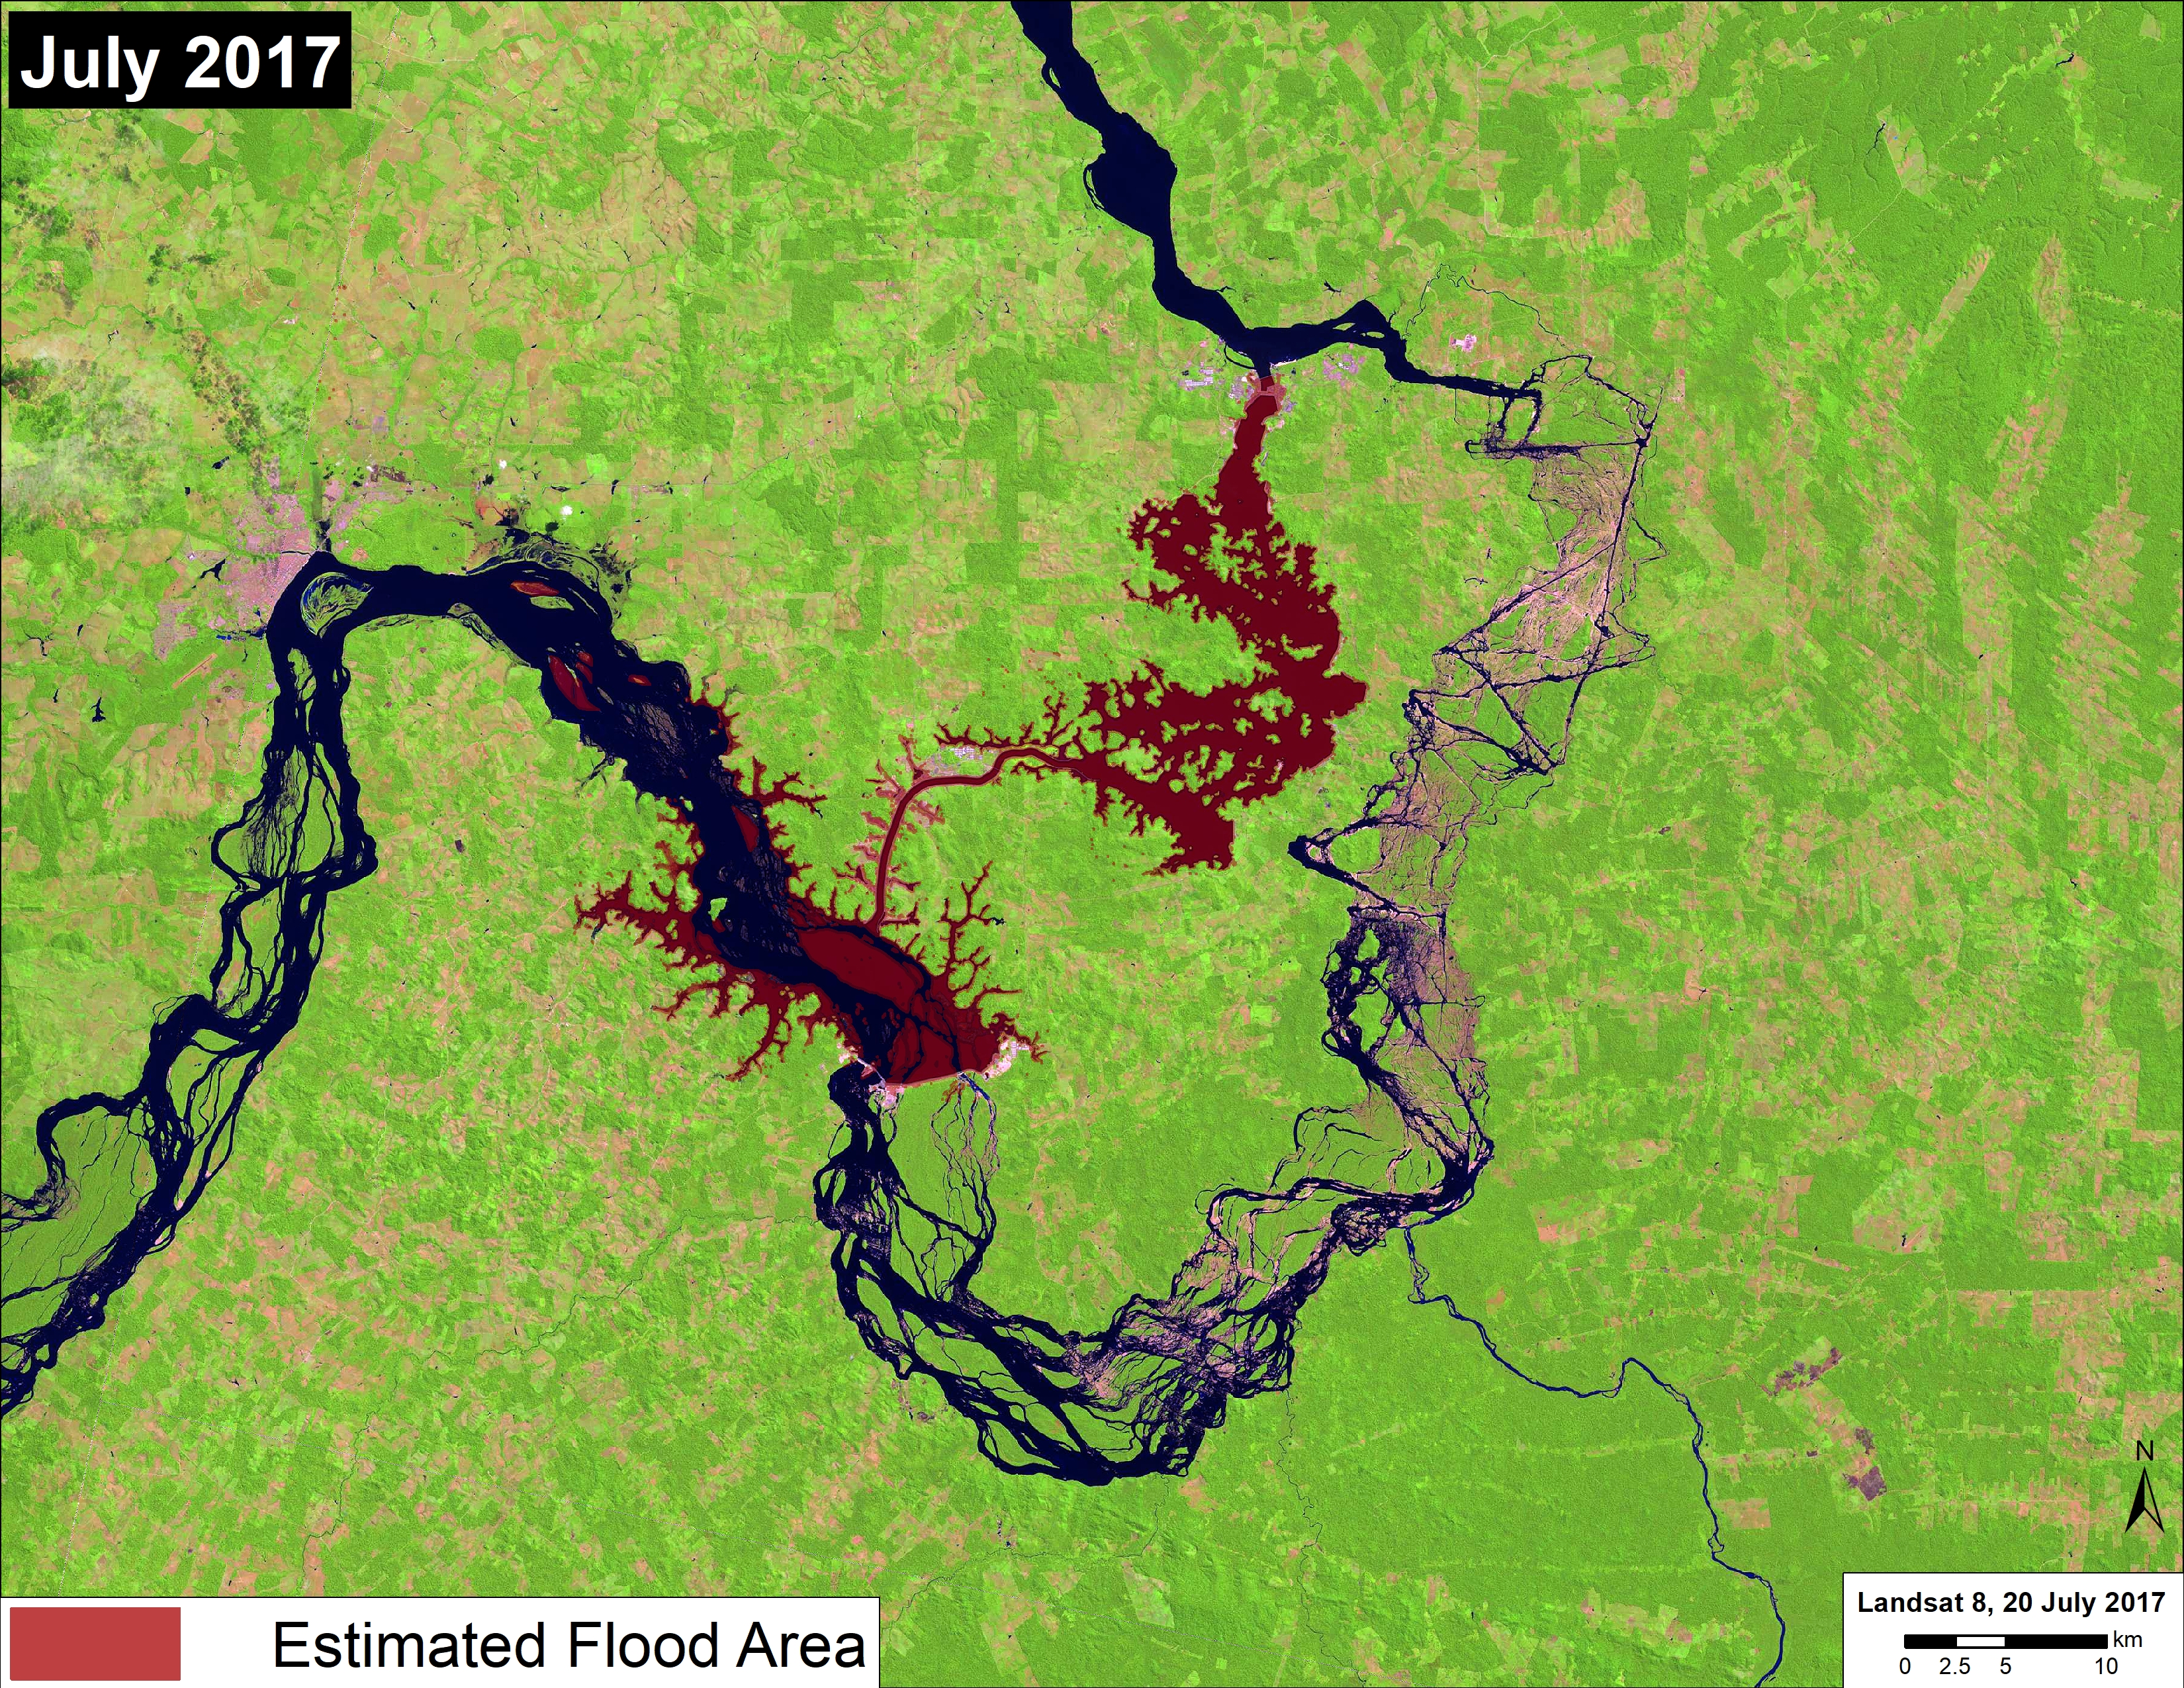
Flooding Estimate

Based on an analysis of the Landsat images, we estimate the flooding of 48,960 acres (19,880 hectares) of land that, according to the imagery, appeared to be a mix of forest and agriculture (Image 66d). In other words, some of the flooded area was previously degraded.

Image 66d. Data: NASA/USGS, MAAP

Damming of the Xingu River

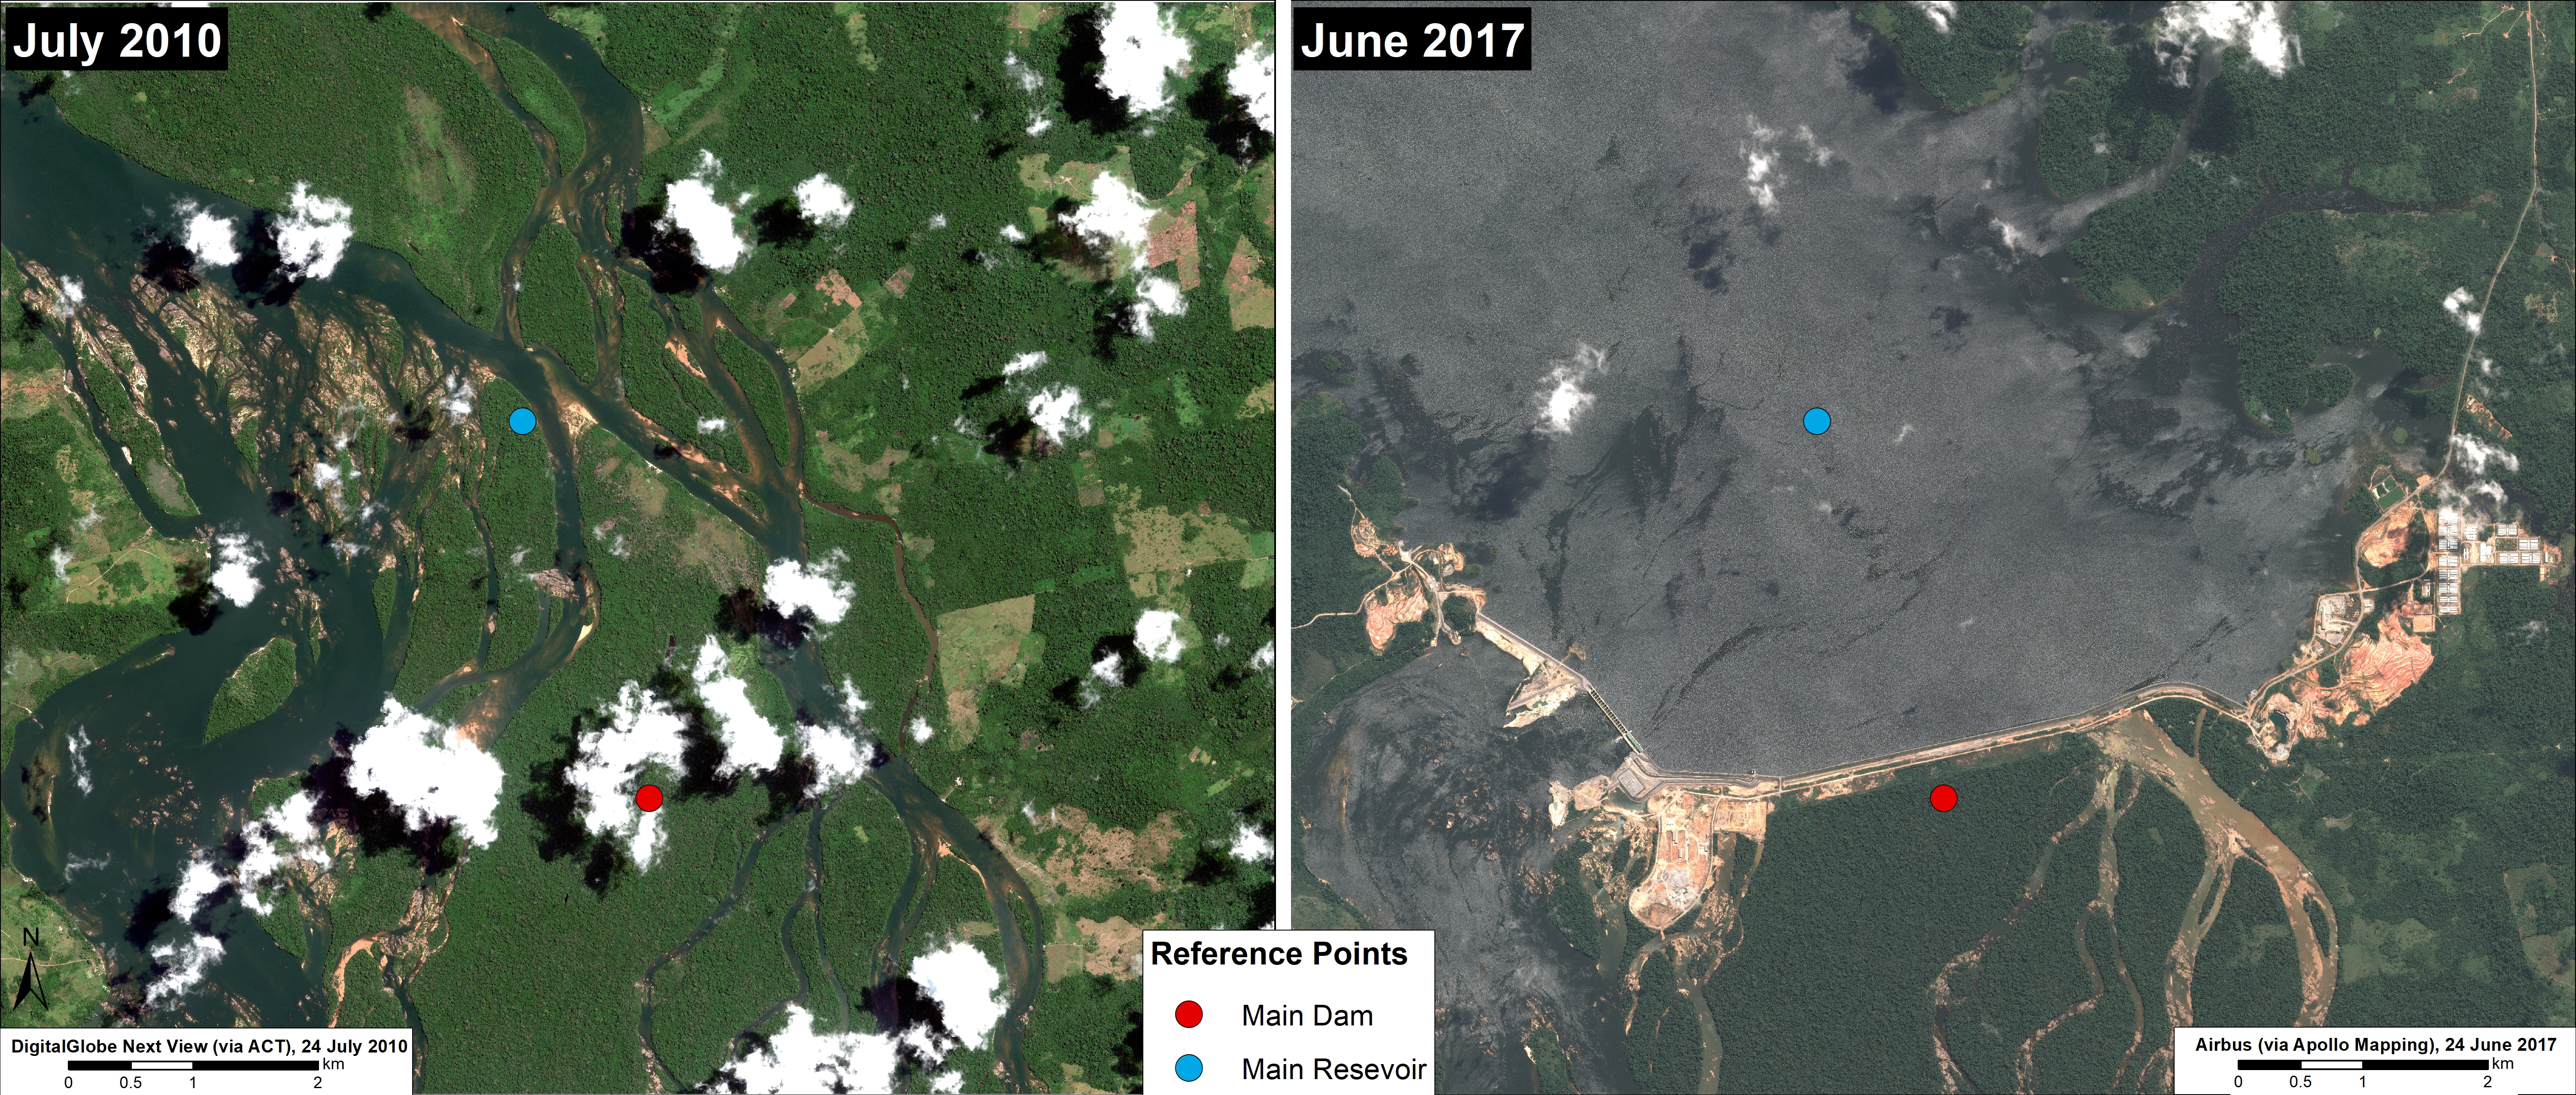
Image 66e shows, in high resolution (50 cm), the drastic change at the dam site between July 2010 (left panel) and June 2017 (right panel). The July 2010 image, which serves as the pre-construction baseline, shows the free-flowing Xingu River, whereas the June 2017 image shows the impact of the main dam and main reservoir. Image 66f is a GIF showing, in striking detail, the construction of the main dam and formation of the main reservoir between 2010 and 2017.

Image 66e. Data: DigitalGlobe (via ACT), Airbus (via Apollo Mapping)
Image 66f. Data: DigitalGlobe (Nextview), DigitalGlobe (via ACT), Airbus (via Apollo Mapping)

We thank International Rivers and Amazon Watch for reviewing earlier drafts of this article and providing crucial comments.

Finer M, Olexy T, Scott A (2017) Satellite Images of Controversial Belo Monte Dam Project. MAAP: 66.

MAAP #65: Deforestation Hotspots of 2017 in the Peruvian Amazon

Image 65. Data: MINAM/PNCB, UMD/GLAD, SERNANP, MAAP

In an earlier report, MAAP #40, we highlighted the power of combining early warning GLAD* alerts with analysis of high-resolution satellite images (for example, from the company Planet), as part of a comprehensive near real-time deforestation monitoring system.

In the current report, we analyze the GLAD alerts for the first half of 2017 (through July 17) to identify current deforestation hotspots in the Peruvian Amazon.** These alerts indicate an estimated total forest loss of 37,000 acres (15,000 hectares) thus far during the year.

Image 65 (see right) highlights the 2017 deforestation hotspots, defined here as areas with medium to high density of forest loss.

Below, we describe and show images of the most intense hotspots, indicated in red and orange.

These areas include:

  • Buffer zones of Tambopata National Reserve and Cordillera Azul National Park
  • Natural loss due to blowdowns from “hurricane winds,” in the Madre de Dios region
  • Northwest border with Colombia


Buffer Zone of Tambopata National Reserve 

Inset A indicates an area of high intensity deforestation due to gold mining activity in the buffer zone of Tambopata National Reserve in the southern Peruvian Amazon (Madre de Dios region). Image 65a shows the deforestation of 1,210 acres (490 hectares) in this area in 2017. The Peruvian government recently (early July) led a major raid in this area. However, the most recent satellite images (late July – early August) indicate that mining camps are still present in the area.

Image 65a. Data: Planet

Hurricane Winds

Insets B and C indicate two areas in the southern Peruvian Amazon (Madre de Dios region) that experienced the natural forest loss of 980 acres (400 hectares) caused by hurricane winds, localized thunderstorms with strong winds. Images 65b and 65c show the recent 2017 forest loss. See MAAP #54 and MAAP #55 for more details about hurricane winds.

Image 65b. Data: Planet
Image 65c. Data: Planet

Buffer Zone of Cordillera Azul National Park

Inset D shows an area of medium intensity deforestation in the buffer zone of Cordillera Azul National Park, in the central Peruvian Amazon (San Martin region). Image 65d shows an example of the deforestation (138 acres) in this area in 2017. The main cause of the deforestation appears to be agricultural activity.

Image 65d. Data: Planet

Northwest Border with Colombia

Inset E indicates a medium intensity hotspot in the extreme northern Peruvian Amazon (Loreto region), along the border with Colombia. The deforestation is approaching the limit of the Huimeki Communal Reserve. Image 65e shows the deforestation of 390 acres (158 hectares) in this area in 2017. The driver appears to be linked to agricultural activities and illicit crops (The United Nations has confirmed coca in this area).

Image 65e. Data: Planet

Notes

*GLAD alerts are a powerful new tool to monitor tropical forest loss in near real-time. This early warning system, created by the GLAD (Global Land Analysis and Discovery) laboratory at the University of Maryland and supported by Global Forest Watch, was launched in March 2016 as the first Landsat-based (30-meter resolution) forest loss alert system (previous systems were based on lower-resolution imagery). The alerts are updated weekly and can be accessed through Global Forest Watch.

**We performed a kernel density estimation, an analysis that calculates the magnitude per unit area of a particular phenomenon, in this case, forest loss.

Reference

Planet Team (2017). Planet Application Program Interface: In Space for Life on Earth. San Francisco, CA. https://api.planet.com.

Citation

Novoa S, Finer M (2017) Deforestation Hotspots in the Peruvian Amazon in 2017. MAAP: 65.