MAAP #46: Gold Mining Deforestation Within Tambopata National Reserve Exceeds 450 Hectares

In previous articles, we documented the illegal gold mining invasion of Tambopata National Reserve (Madre de Dios region in the southern Peruvian Amazon) in November 2015 and the subsequent deforestation of 350 hectares as of July 2016. Here, we report that the mining deforestation in the Reserve now exceeds 450 hectares (1,110 acres) as of September 2016. Image 46a illustrates the extent of the invasion, with red indicating the most recent deforestation fronts. Insets A-D indicate the location of the high-resolution zooms below.

Imagen 46a. Datos: Planet, SERNANP, MAAP
Image 46a. Data: Planet, SERNANP, MAAP

High Resolution Zooms

Images 45b-e show, in high-resolution, the recent deforestation within Tambopata National Reserve between July (left panel) and September (right panel) 2016. These areas correspond to Insets A-D. The red circles indicate the primary areas of new deforestation between these dates. Click on images to enlarge.

Imagen 45b. Datos: Planet, SERNANP
Image 45b. Data: Planet, SERNANP
Imagen 45c. Datos: Planet, SERNANP
Image 45c. Data: Planet, SERNANP
Imagen 45d. Datos: Planet, SERNANP
Image 45d. Data: Planet, SERNANP
Imagen 45e. Datos: Planet, SERNANP
Image 45e. Data: Planet, SERNANP

Citation

Finer M, Olexy T, Novoa S (2016) Gold Mining Deforestation Within Tambopata National Reserve Exceeds 450 Hectares. MAAP: #46

MAAP #45: Threats to El Sira Communal Reserve in central Peruvian Amazon

esira_recovery_o_v2_en
Image 45a. Data: ESRI, SERNANP

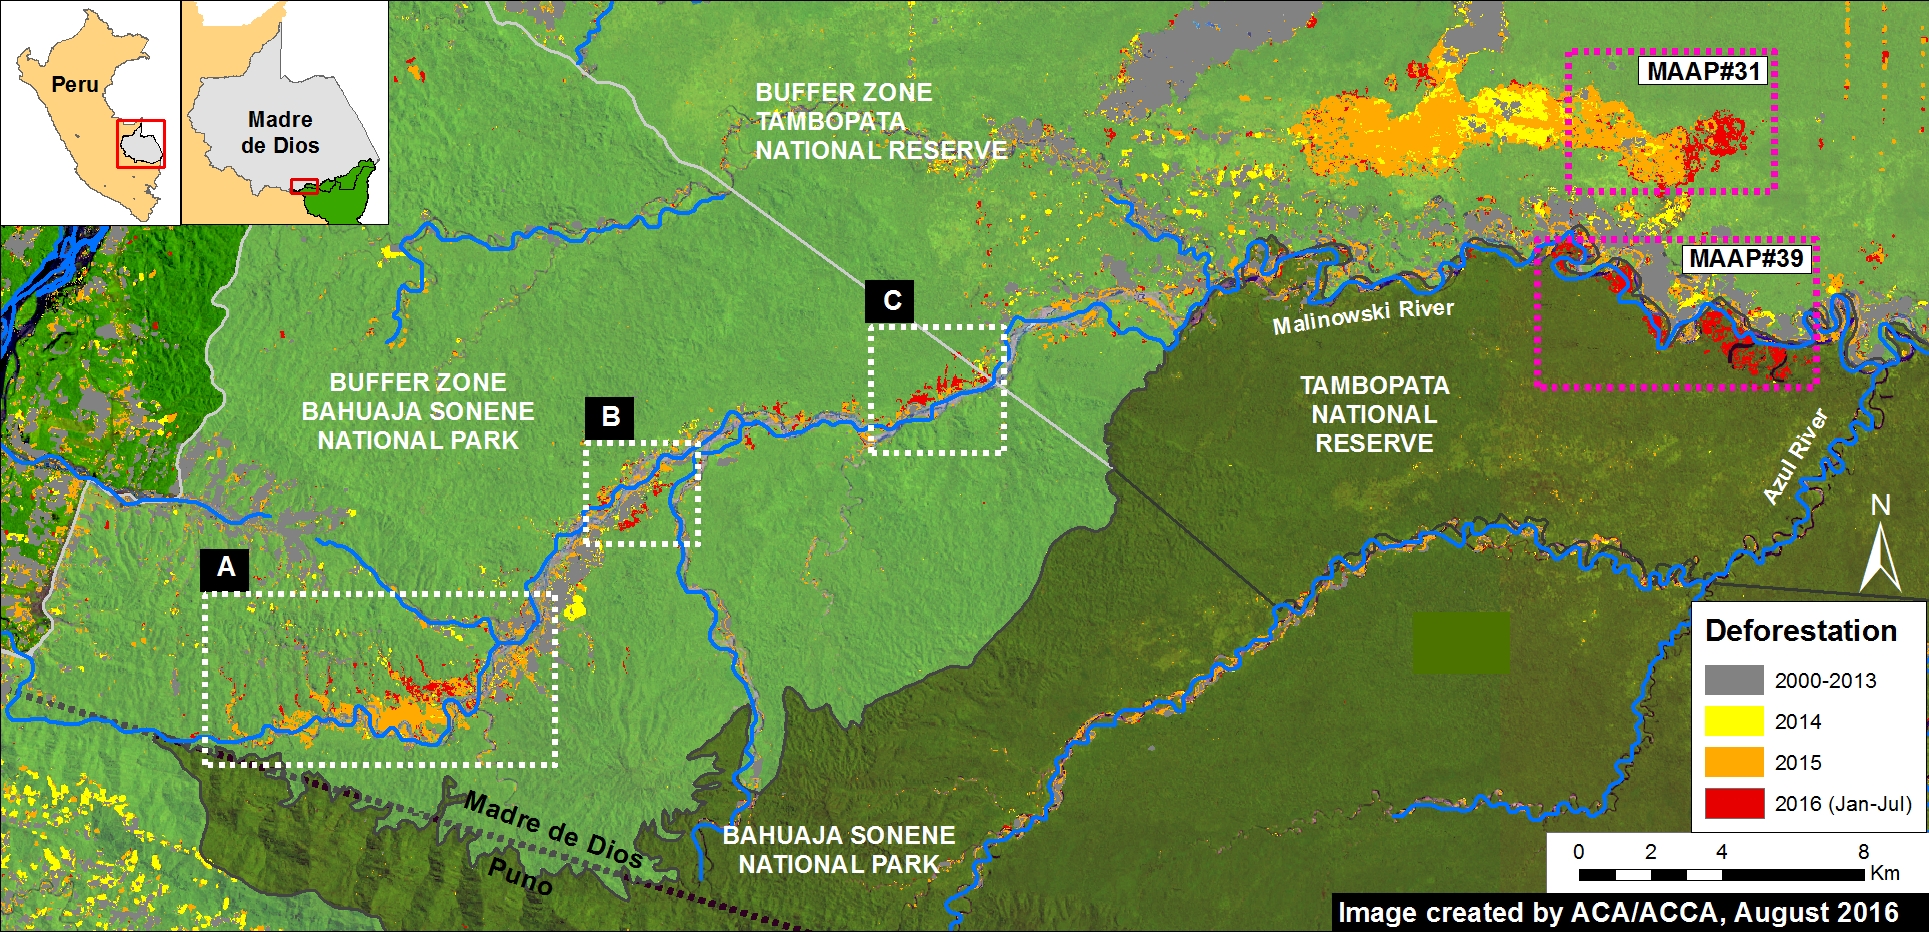
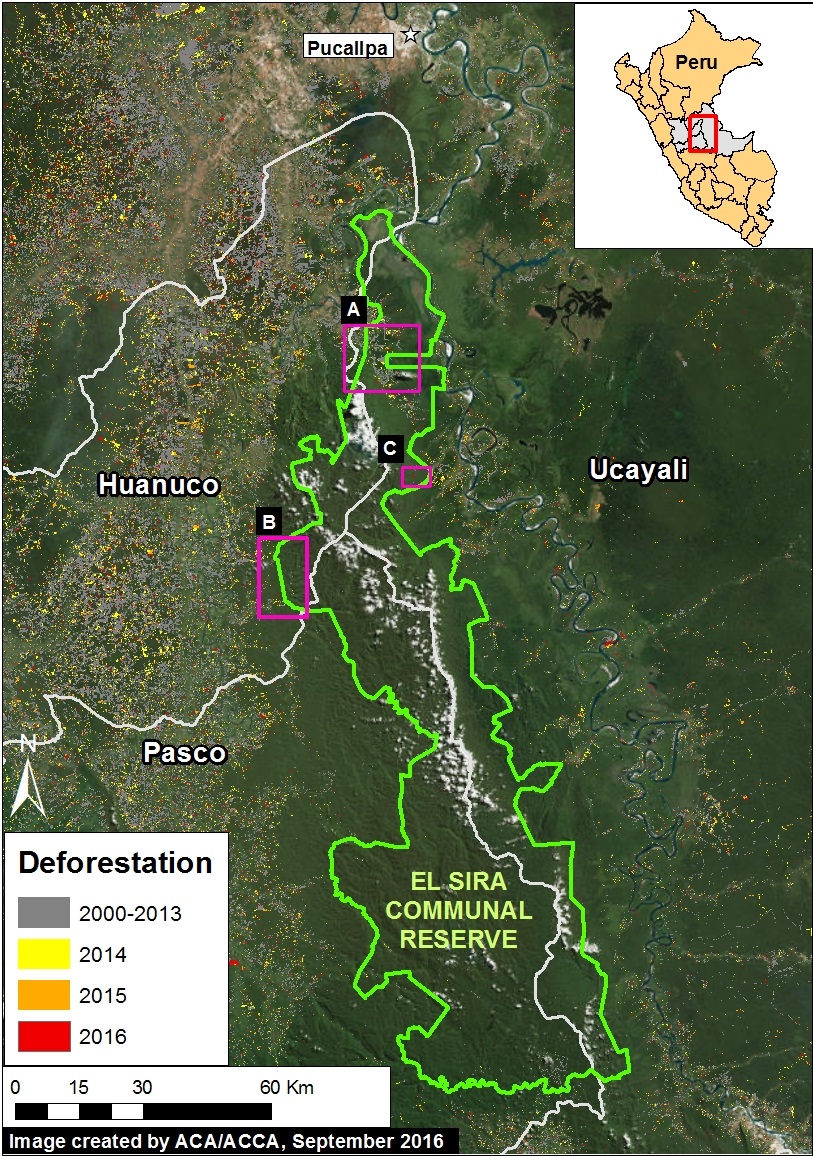
El Sira Communal Reserve, located in the central Peruvian Amazon (regions of Pasco, Huánuco and Ucayali), aims to protect the biological diversity of the El Sira Mountain Range in benefit of the native communities of the area (Ashaninka, Yanesha, and Shipibo-Conibo indigenous groups).

This report presents an initial threat assessment for this large national protected area, which covers more than 615,000 hectares (1.5 million acres).

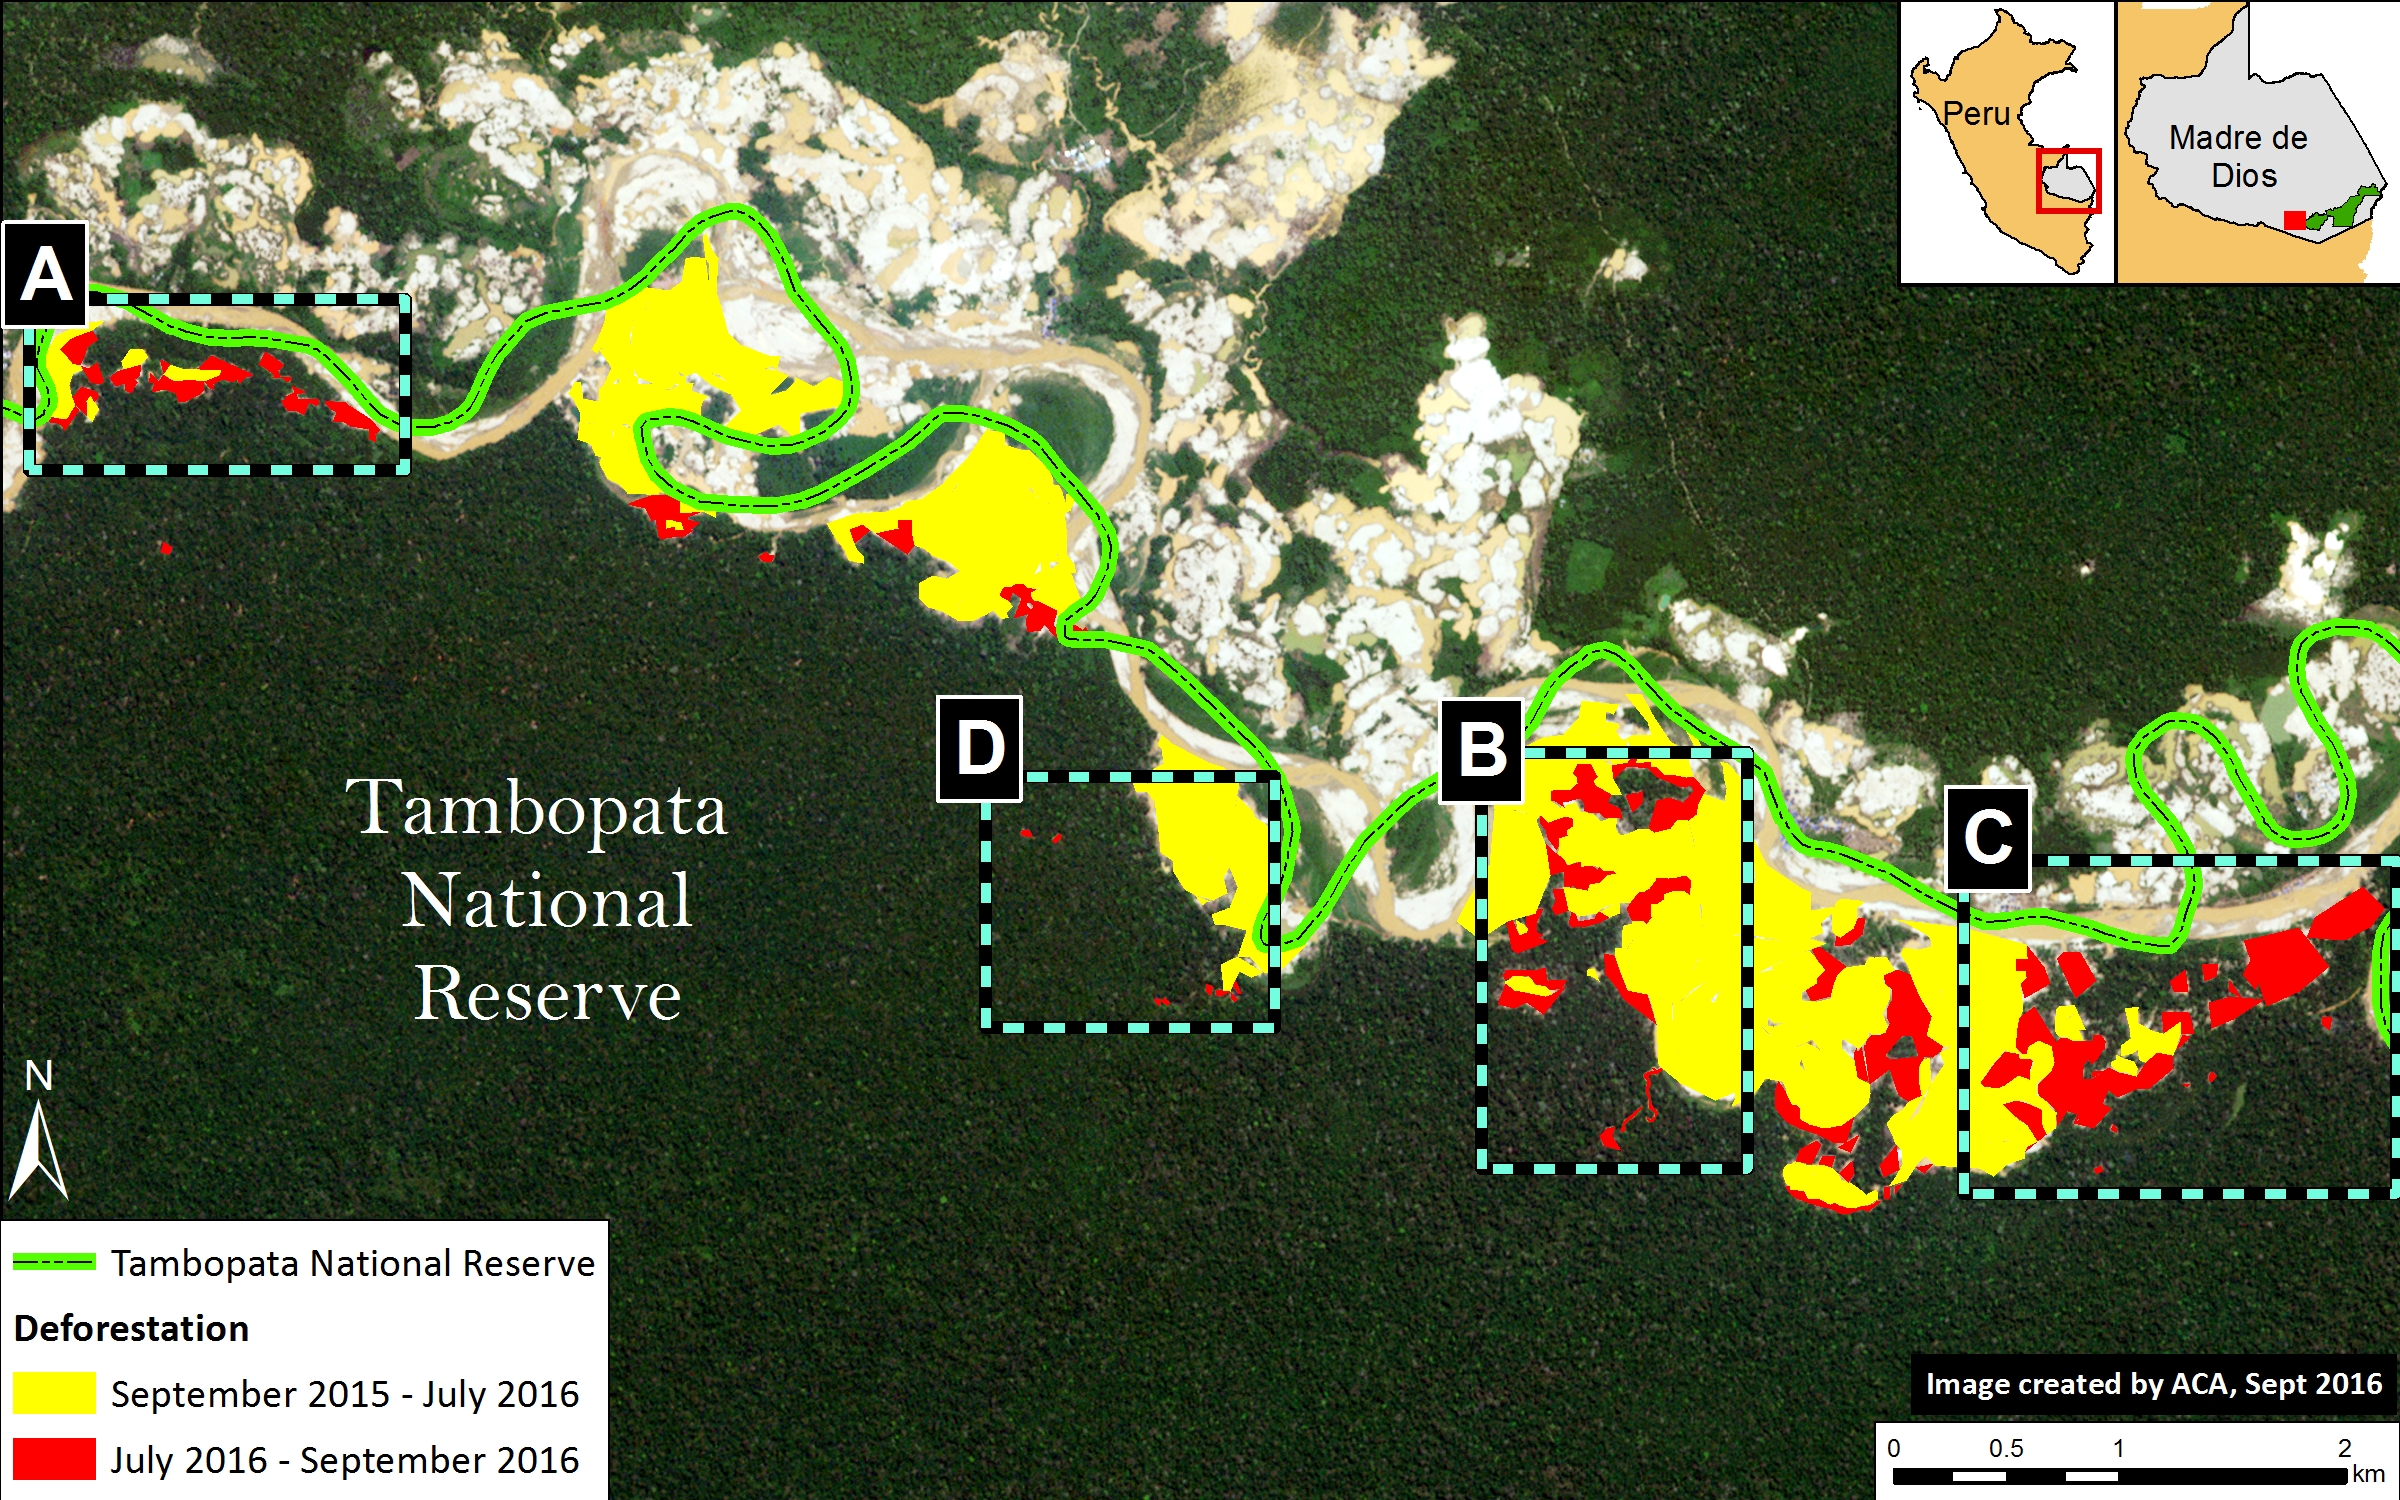
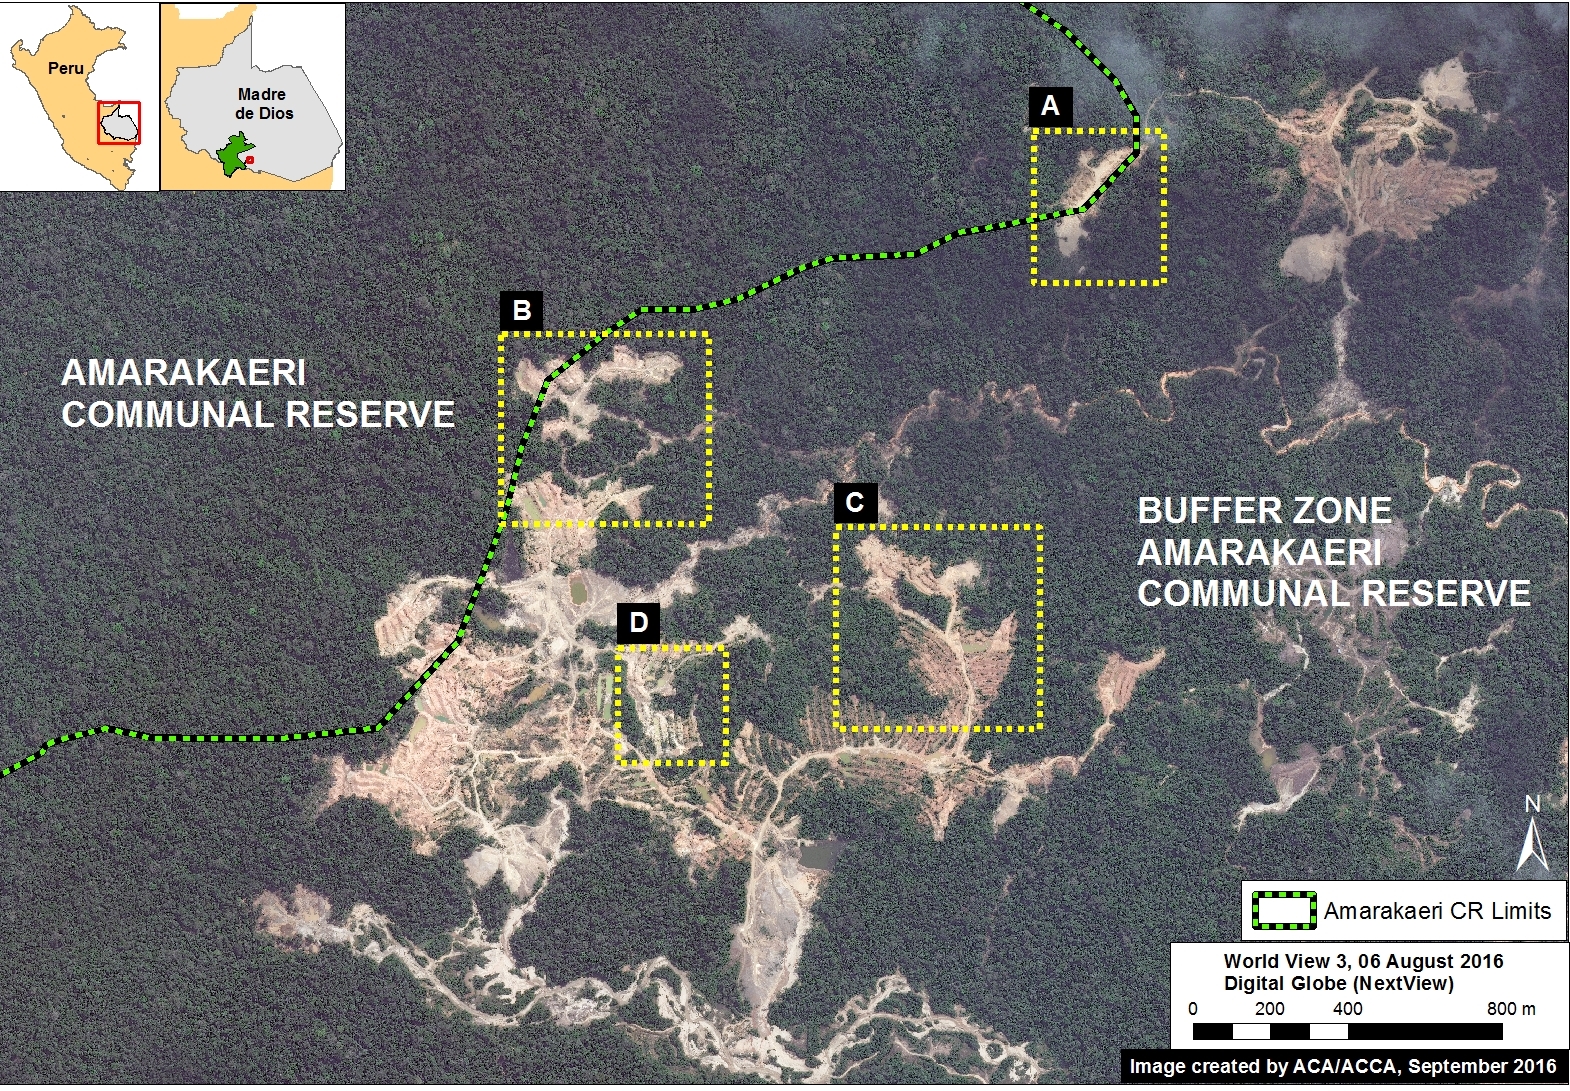
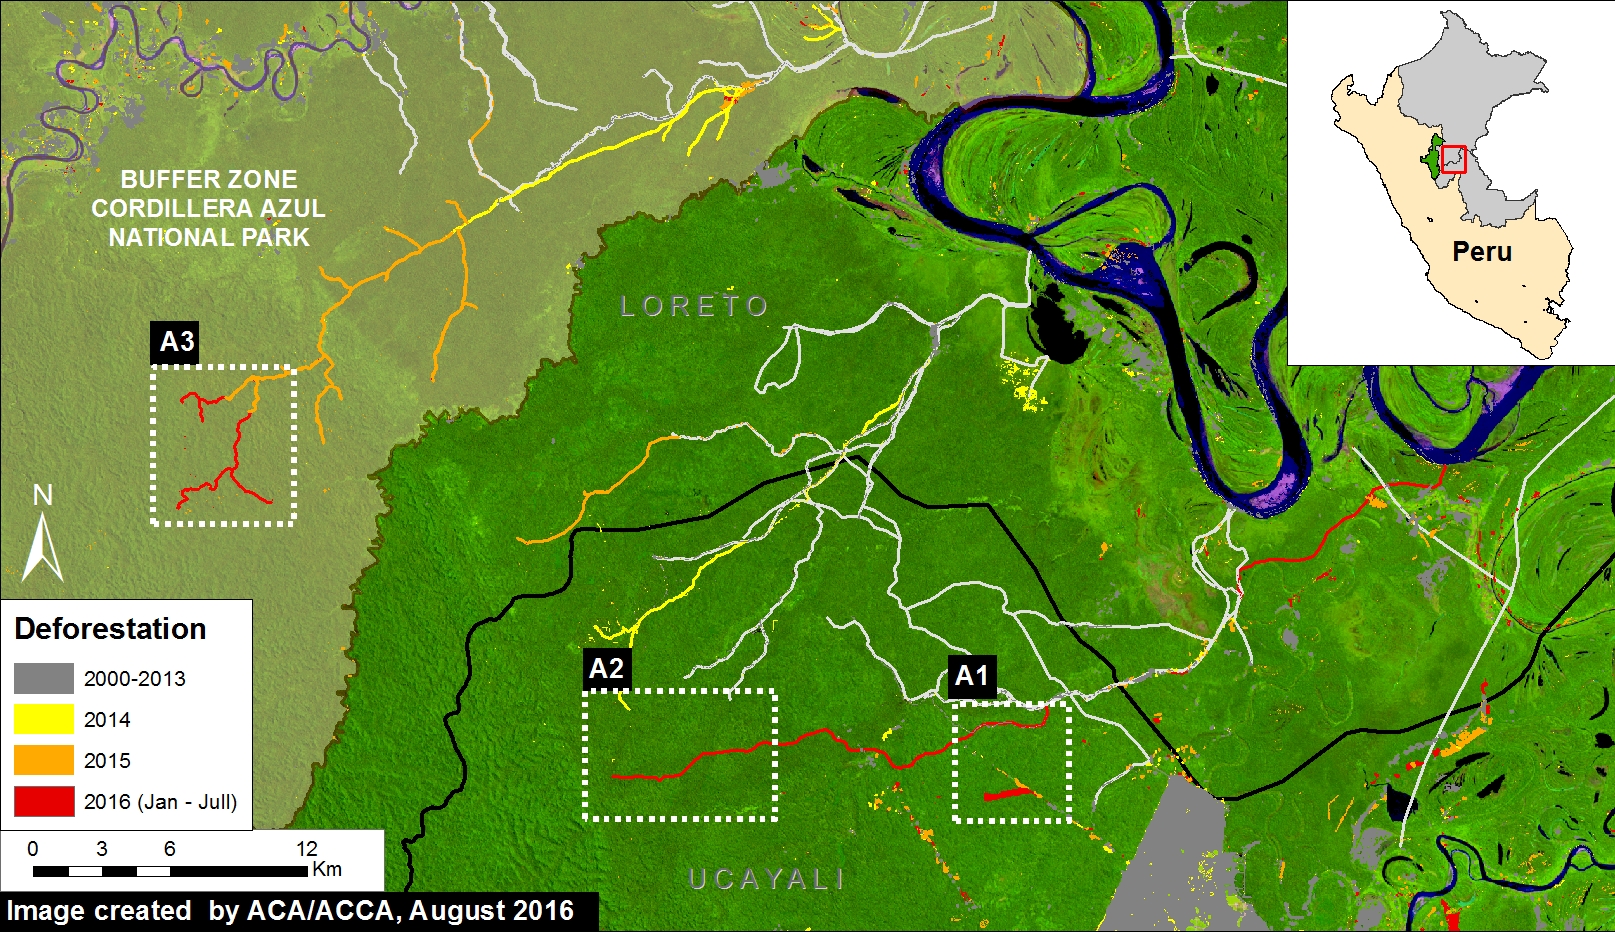
We identified 3 threatened sectors of the Reserve, as indicated in Image 45a (see Insets A-C).

We found that the principal drivers of deforestation in these three sectors are agriculture & cattle pasture (Insets A and C) and illegal gold mining (Inset B).

It is important to note that the deforestation for agriculture & cattle pasture continues to rapidly increase – 1,600 hectares (3,950 acres) since 2013 – while the deforestation for gold mining has been limited due to regular interventions by the Peruvian government.

Below, we show high-resolution satellite images of the recent deforestation in all three threatened sectors. Click each image to enlarge.


Inset A: Increasing Deforestation in the Northern Sector

esira_recovery_a_v3_en
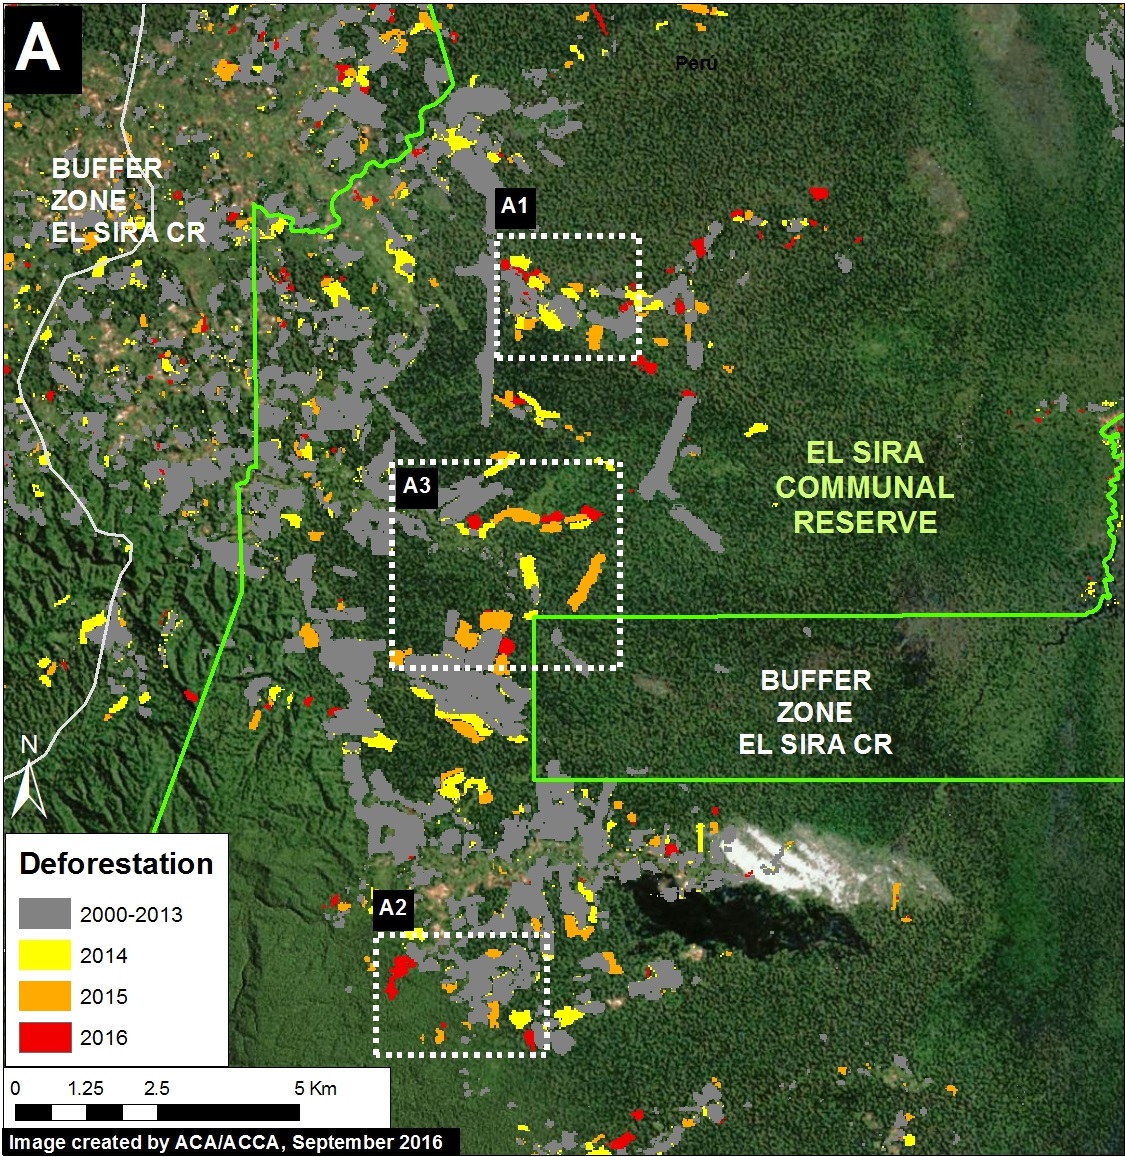
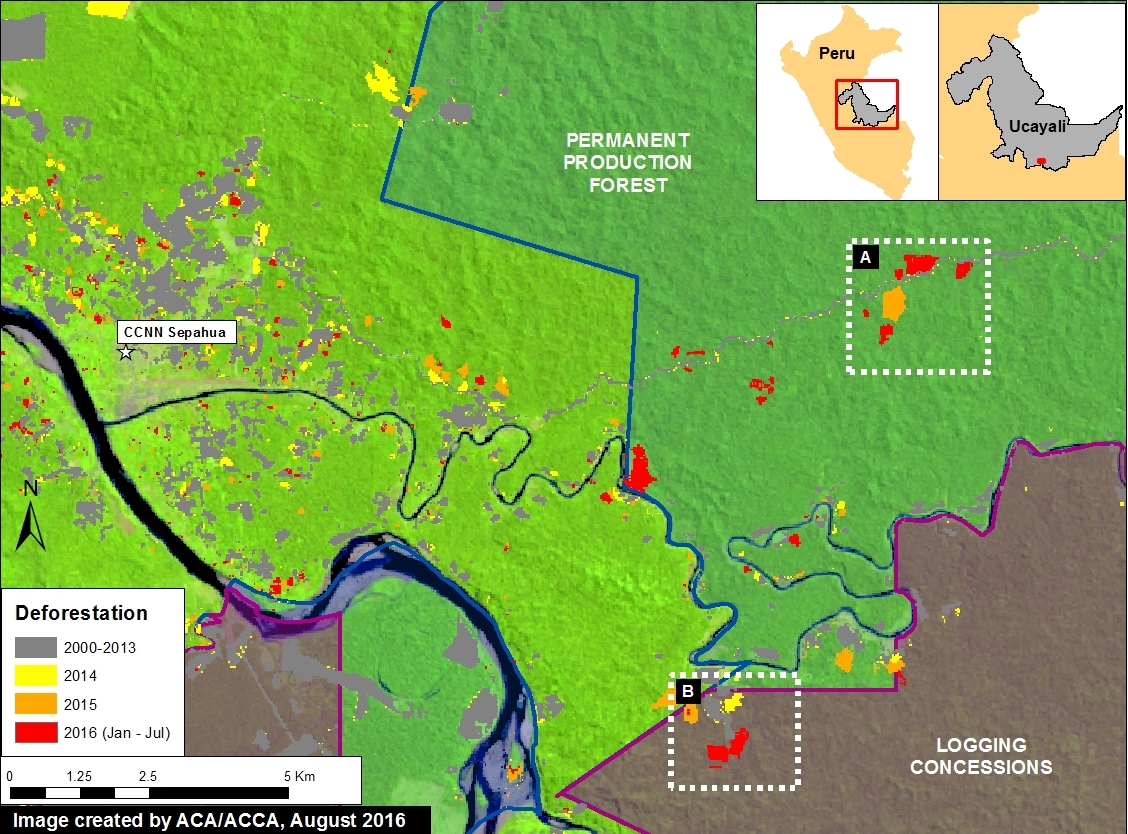
Image 45b. Data: UMD/GLAD, Hansen/UMD/Google/USGS/NASA, USGS/NASA, SERNANP

Image 45b illustrates the increasing deforestation in the northern sector of the El Sira Communal Reserve.

We documented the deforestation of 285 hectares (700 acres) within the Reserve thus far in 2016 (as of late August). Over 90% of this loss comes from small-scale deforestation events (less than 5 hectares).

We calculated an additional deforestation of 1,320 hectares (3,260 acres) within the Reserve between 2013 and 2015.

Thus, we documented a total deforestation of 1,600 hectares (3,950 acres) within the northern sector of the Reserve since 2013.

Based on the analysis of high-resolution imagery, we found that the principal driver of this deforestation was agriculture & cattle pasture.

Note that this sector is near the deforestation hotspot described in MAAP #37, where we determined that cattle pasture was the principal driver of deforestation.

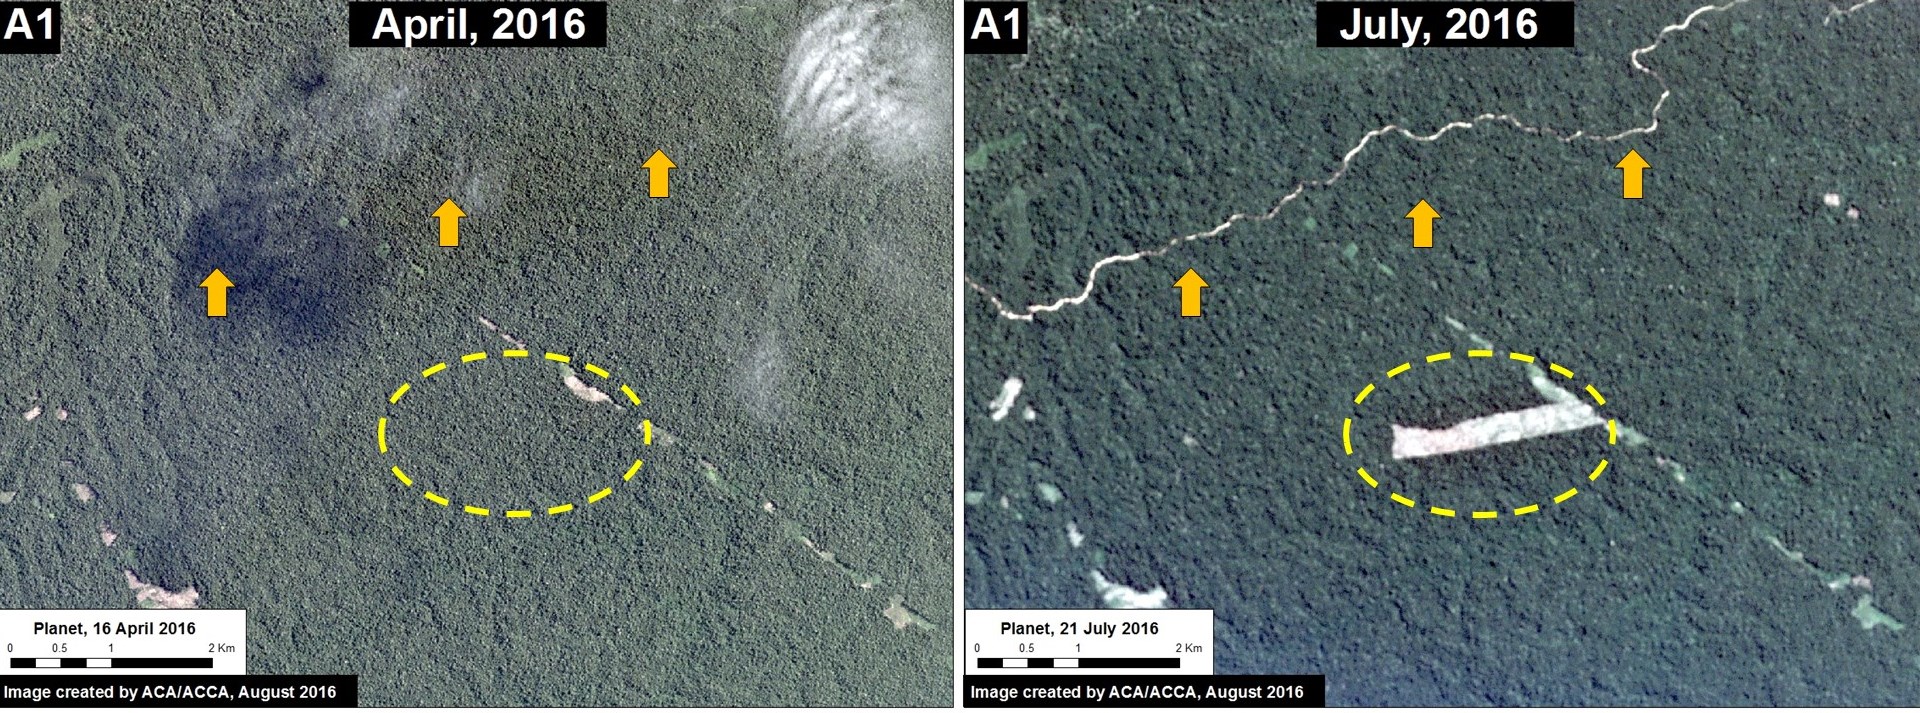
Insets A1 – A3 indicate the location of the high-resolution zooms described below.


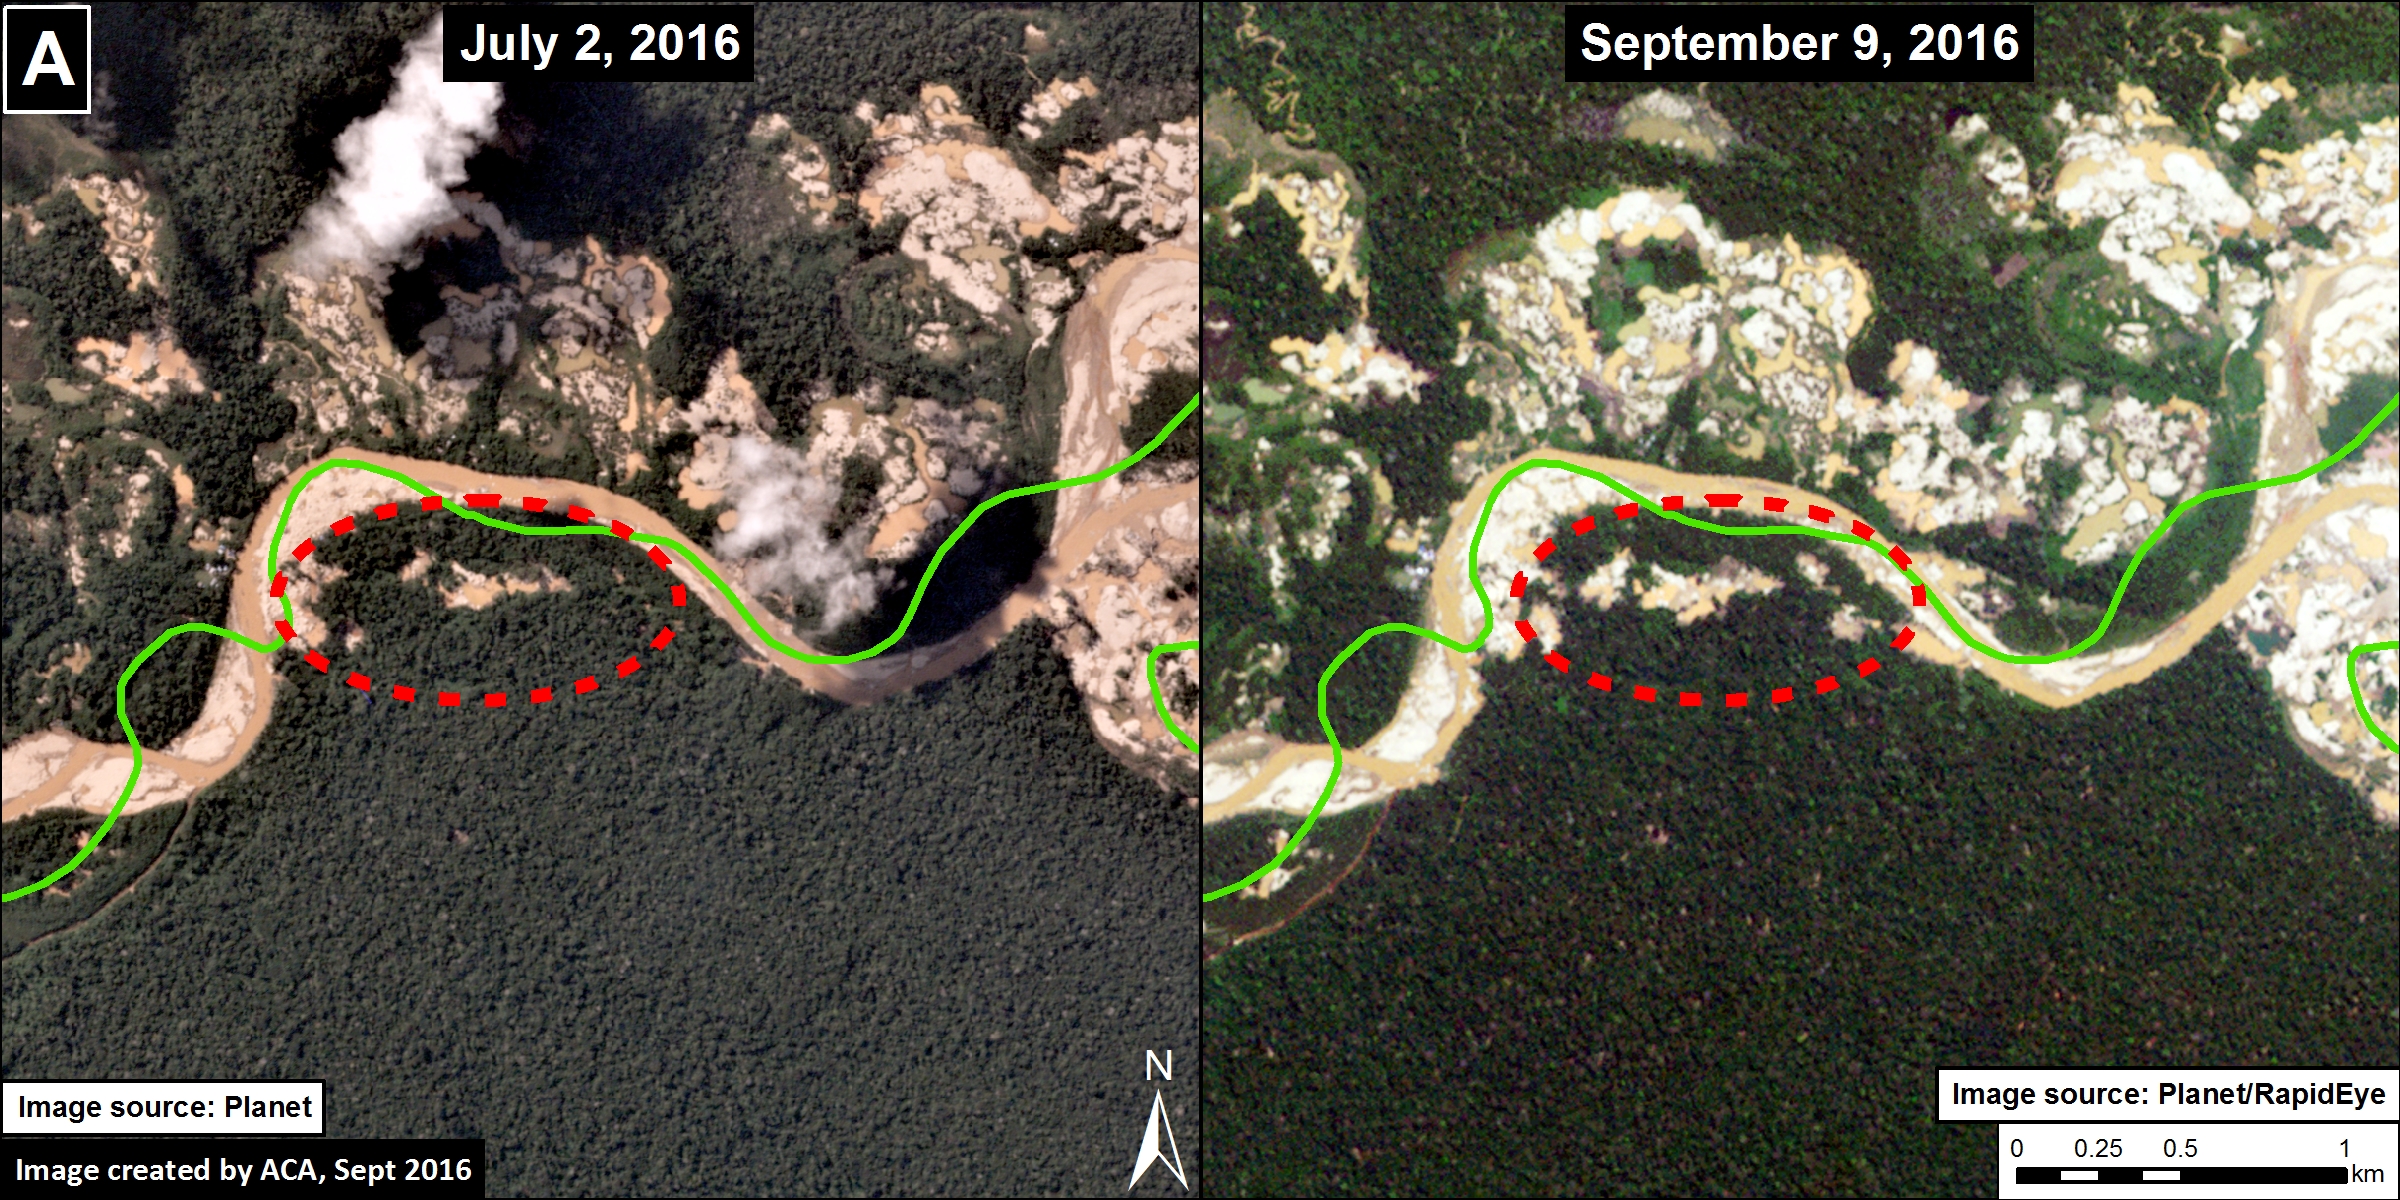
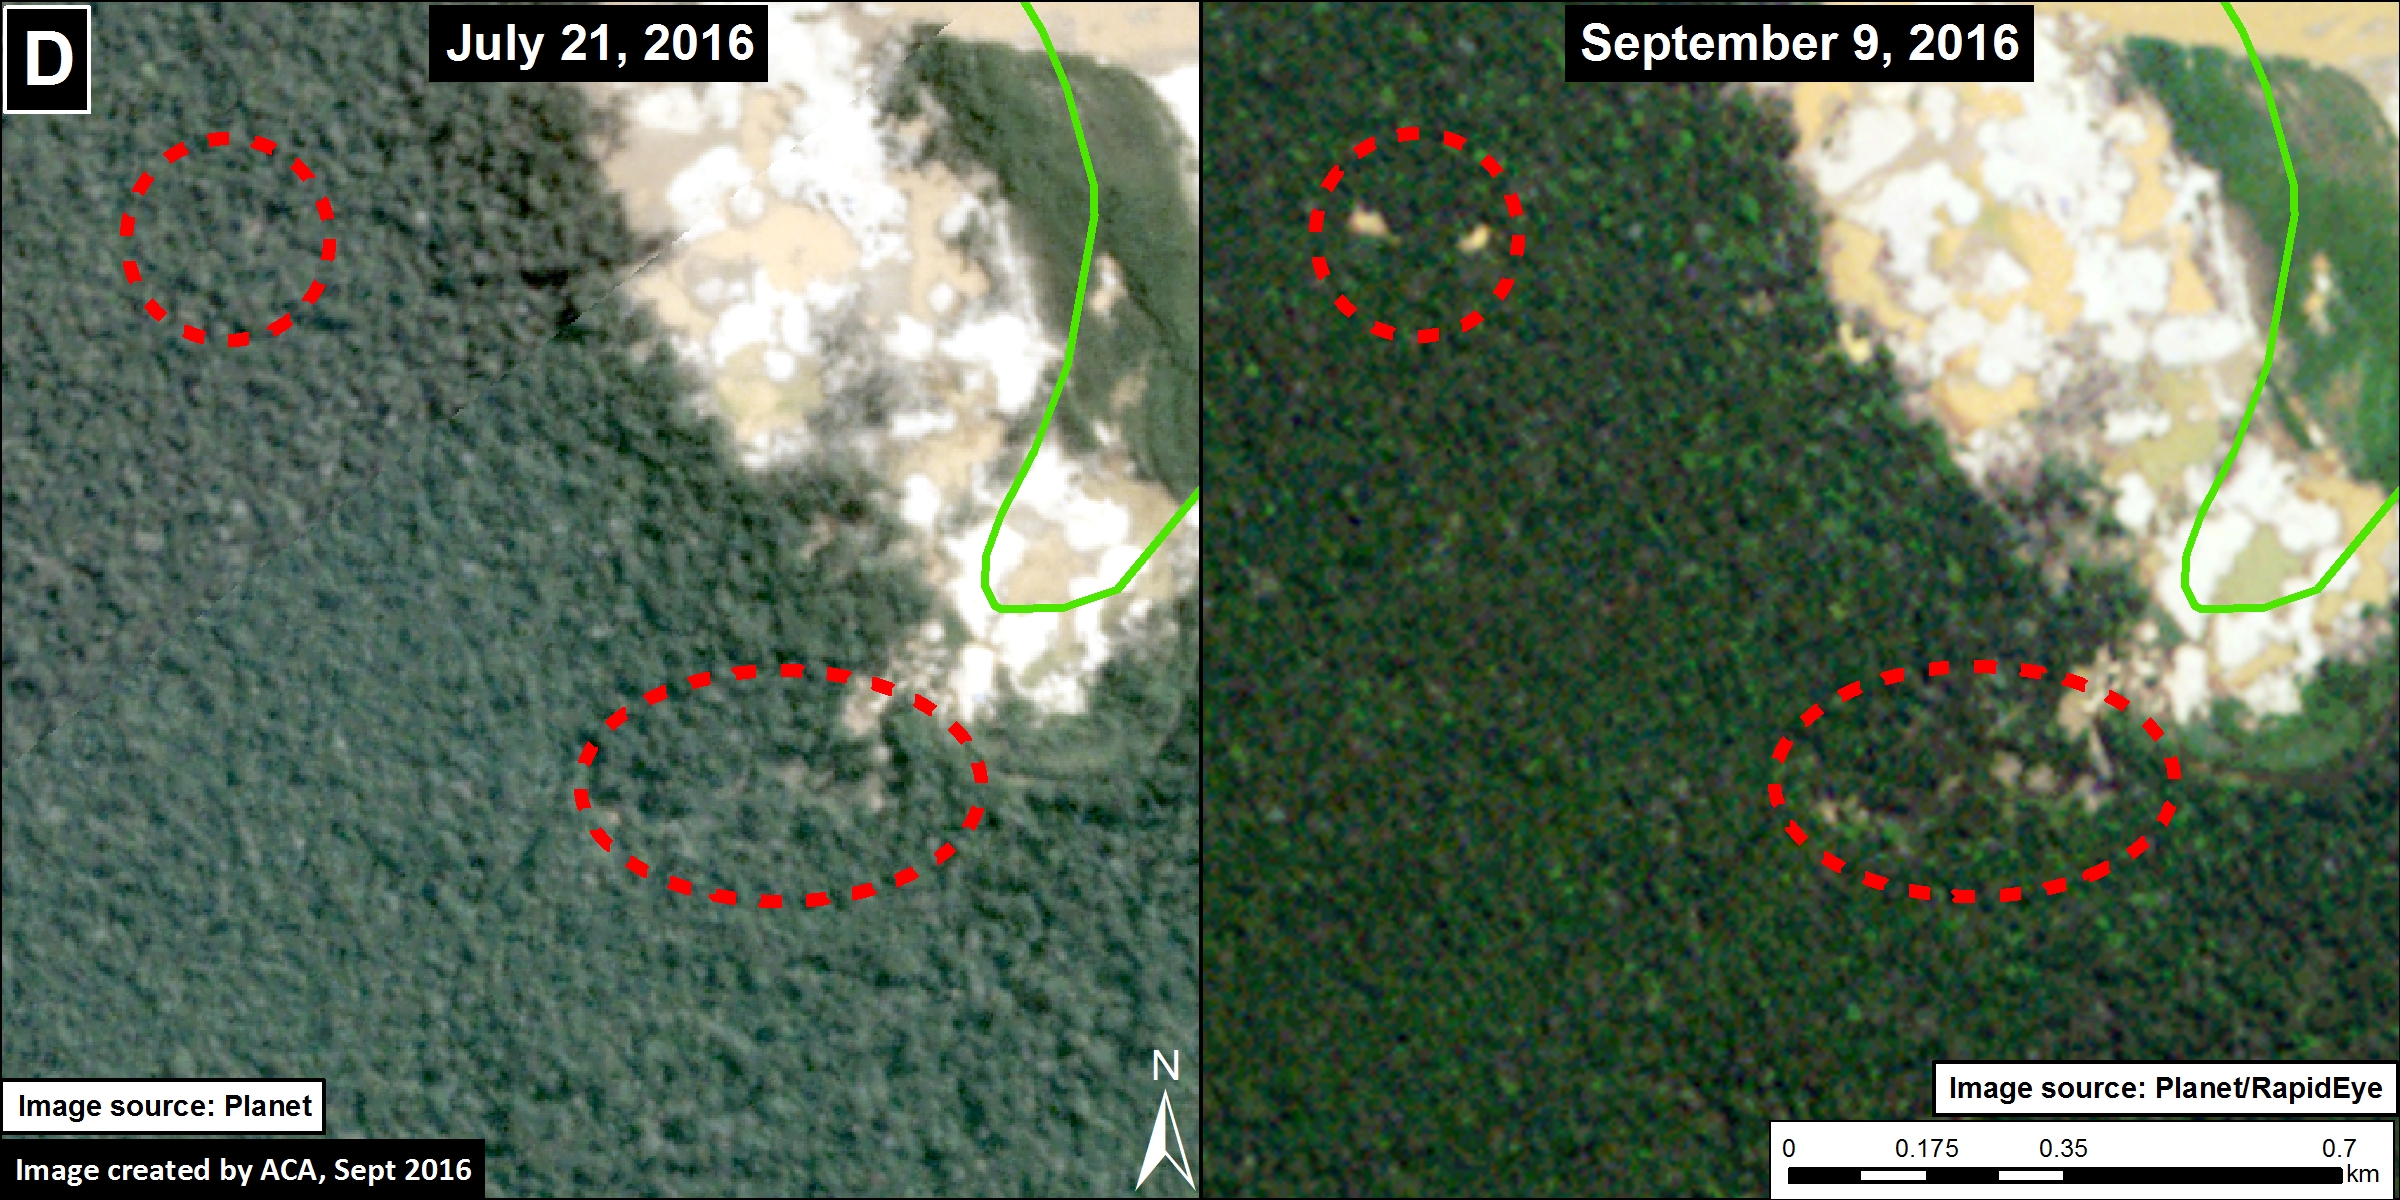
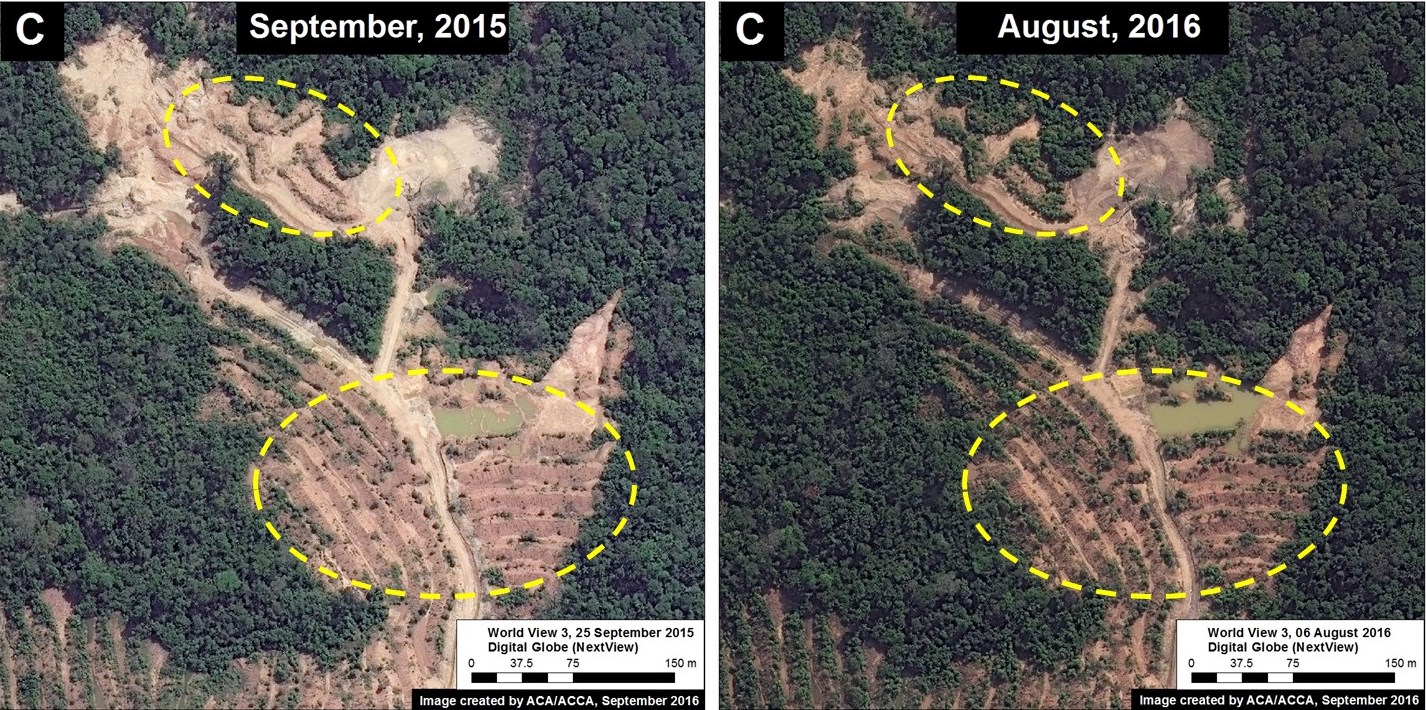
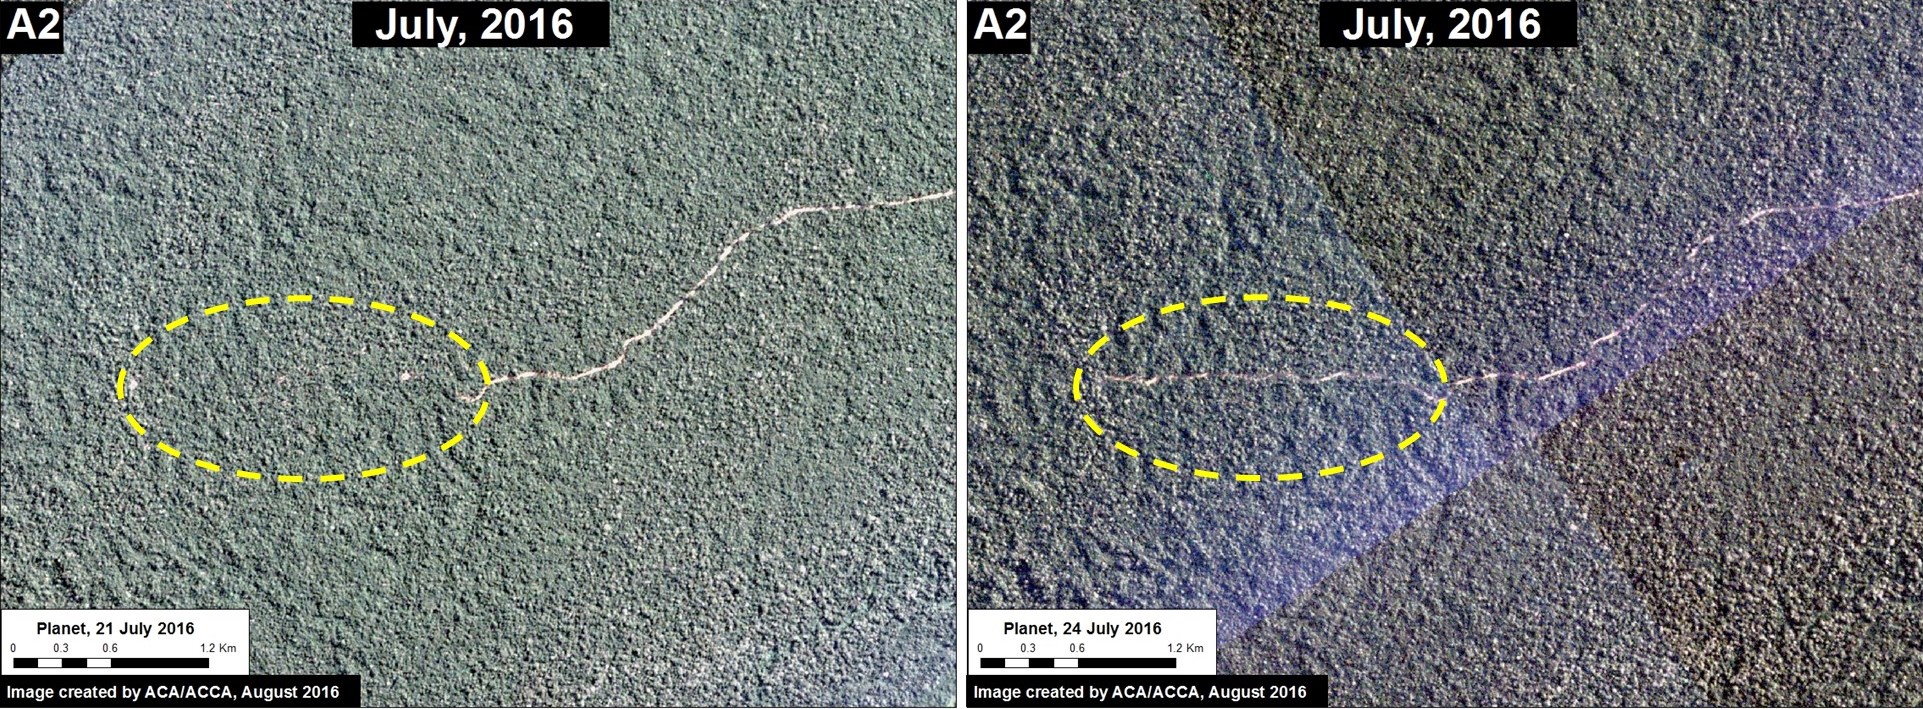
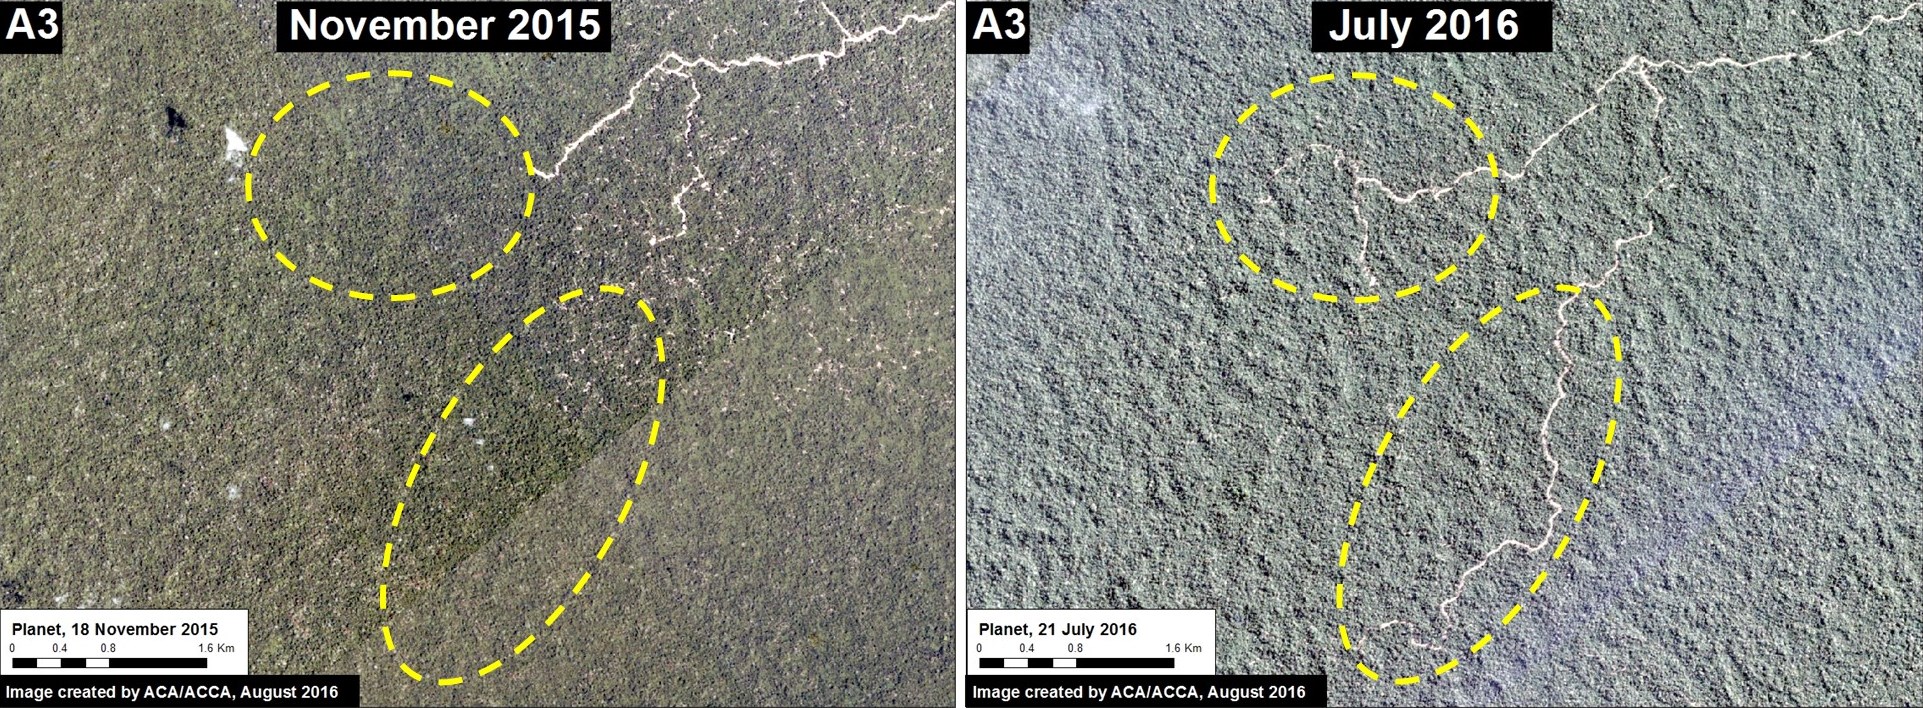
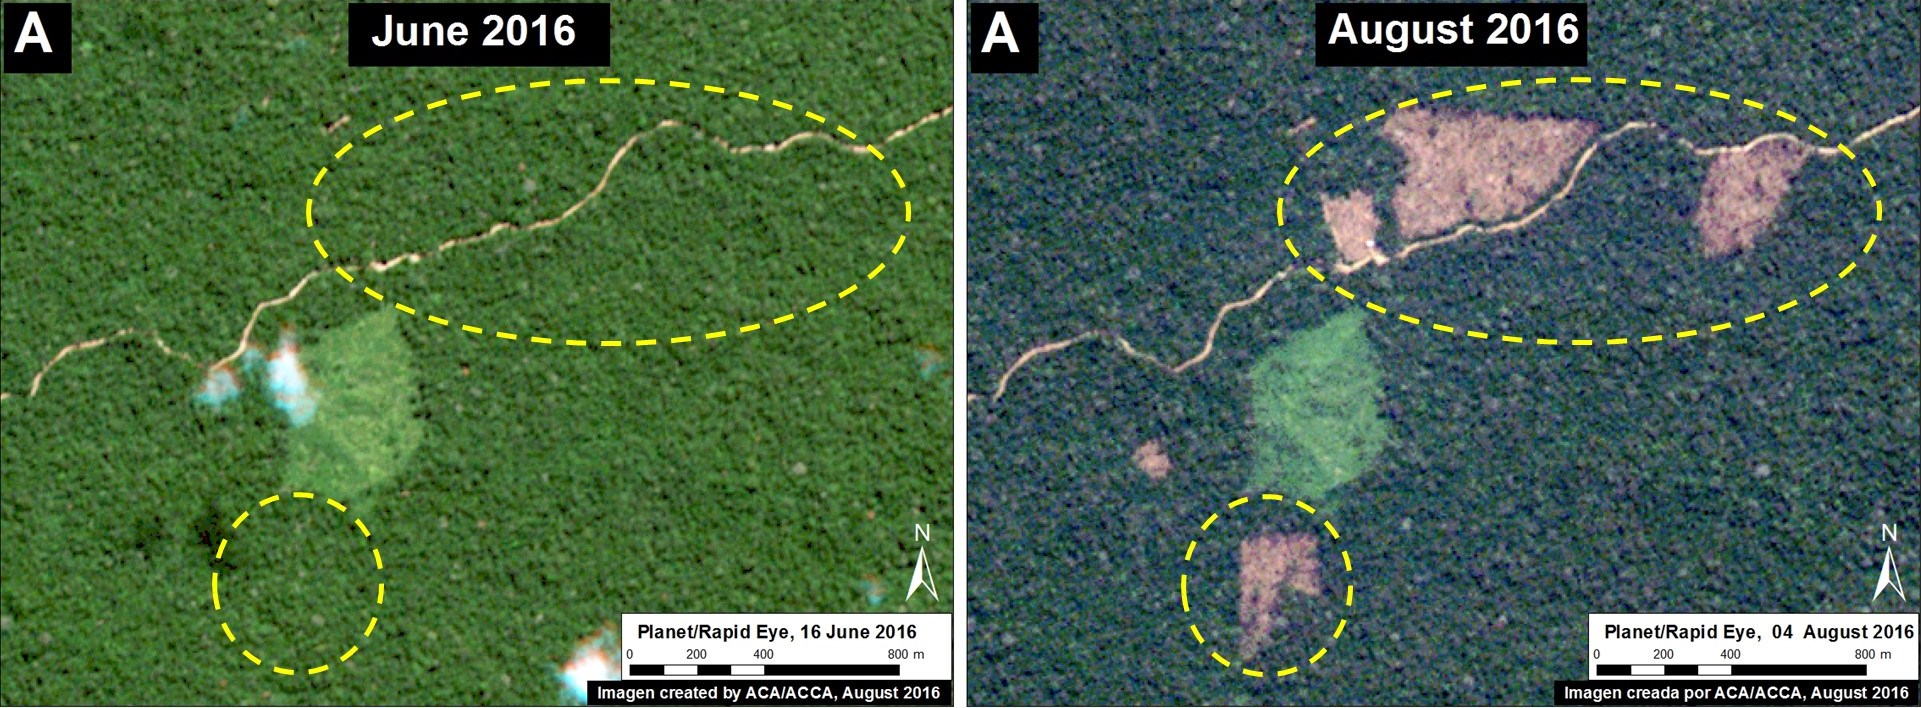
Images 45c-45d show examples of deforestation between September 2015 (left panel) and August/September 2016 (right panel). The red circles indicate newly deforested areas in 2016. The yellow circles indicate areas deforested in 2015 and subsequently converted to cattle pasture in 2016.

esira_recovery_a1_m_v1_en
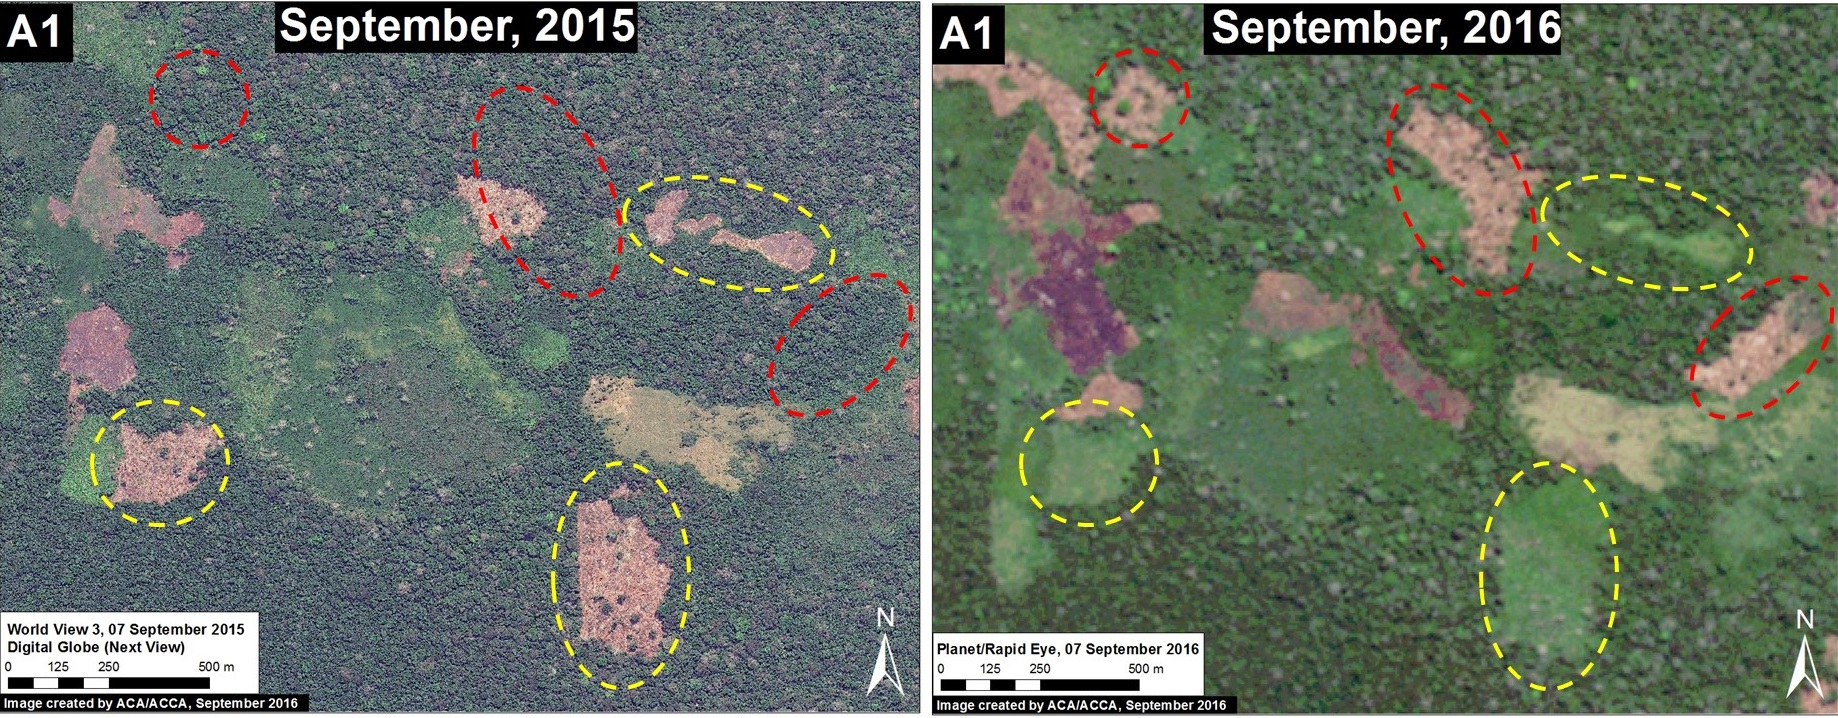
Image 45c. Data: Digital Globe (Next View), Planet
esira_recovery_a2_m_v1_en
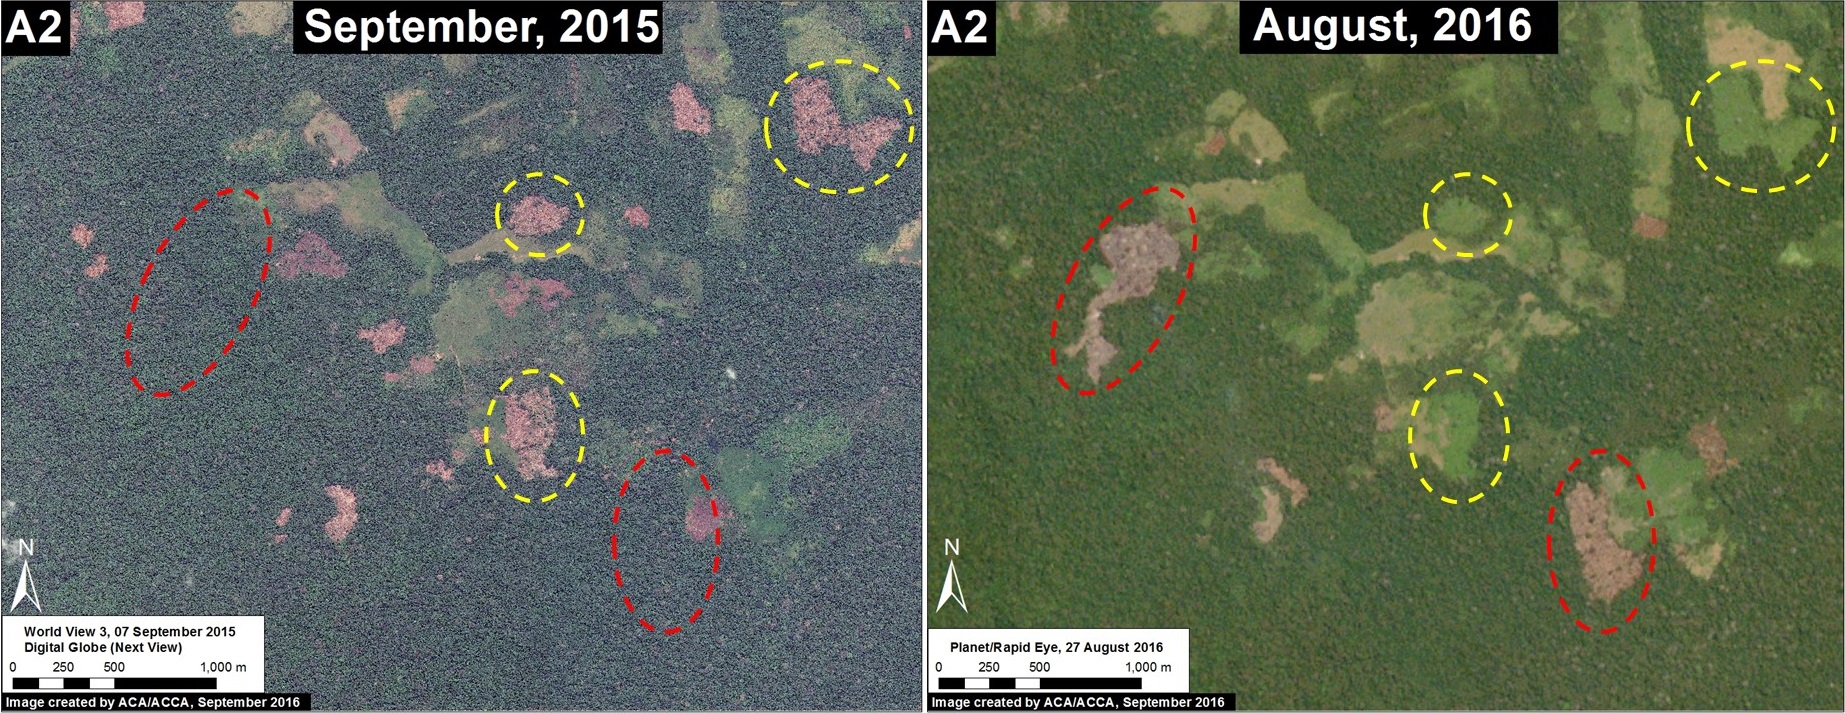
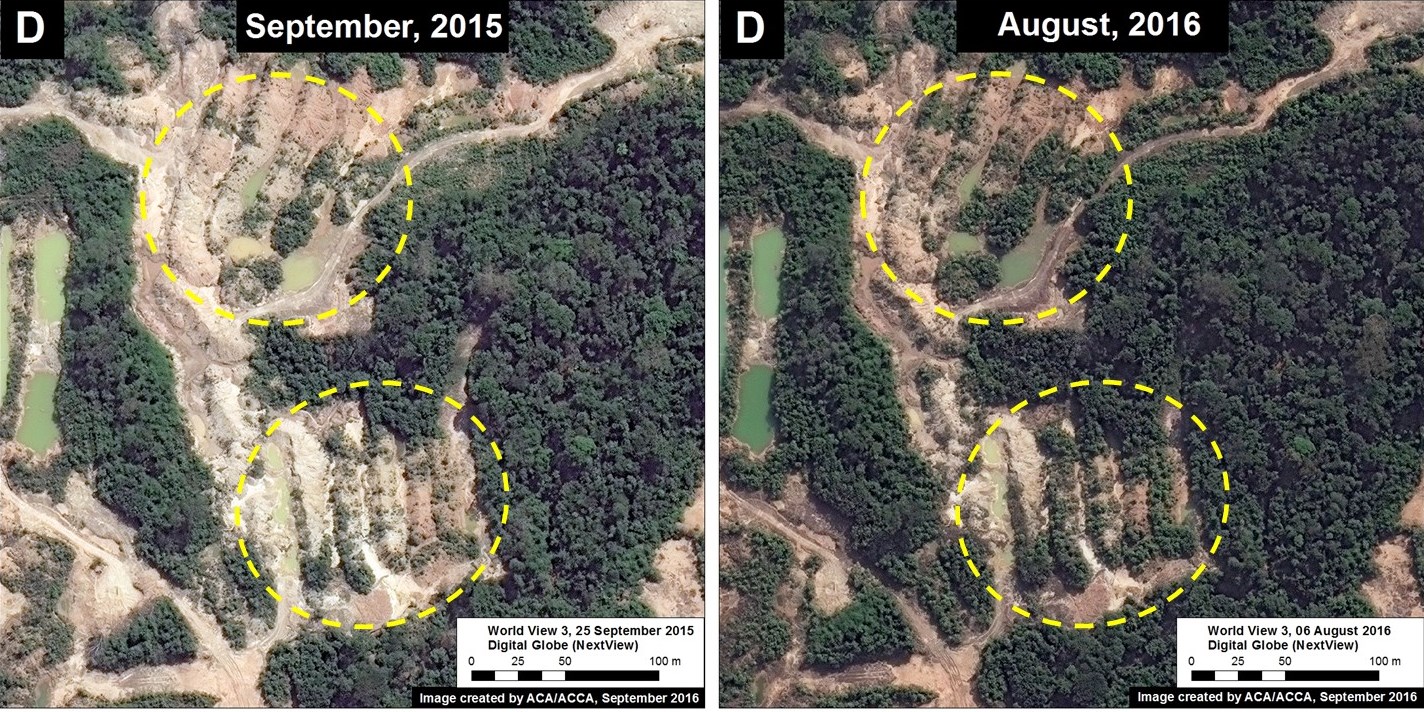
Image 45d. Data: Digital Globe (Next View), Planet


Image 45e shows examples of deforestation between September 2015 (left panel) and August/September 2016 (right panel). The yellow circles indicate areas deforested in 2015 and subsequently converted to cattle pasture in 2016. The blue circles indicate recently burned areas (note the smoke in the right) panel. This type of annual burning pattern is characteristic of cattle-grazing areas.

esira_recovery_a3_m_v1_en
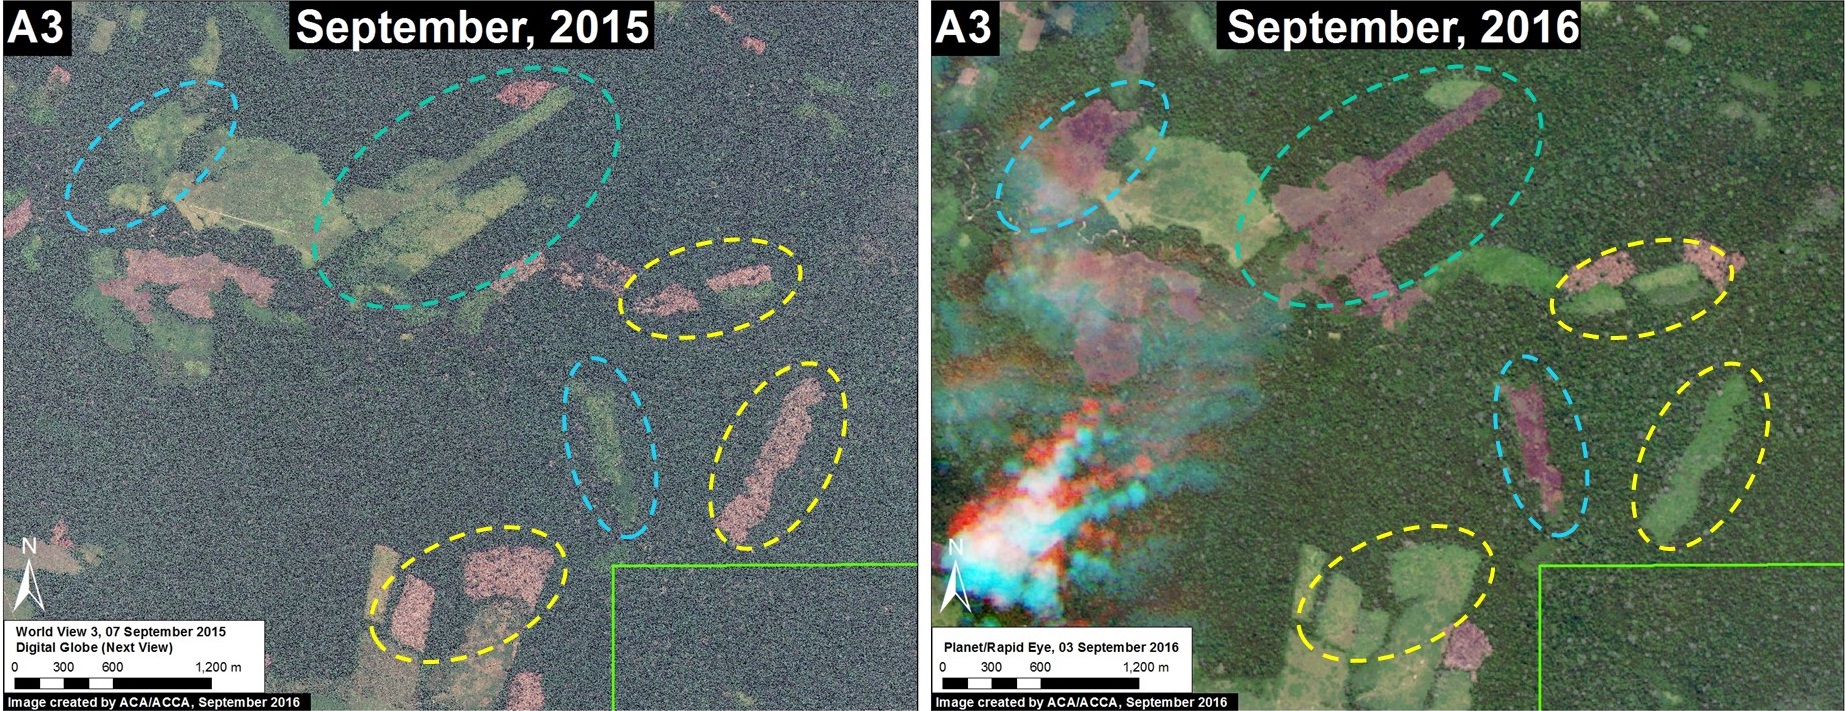
Image 45e. Data: Digital Globe (Next View), Planet

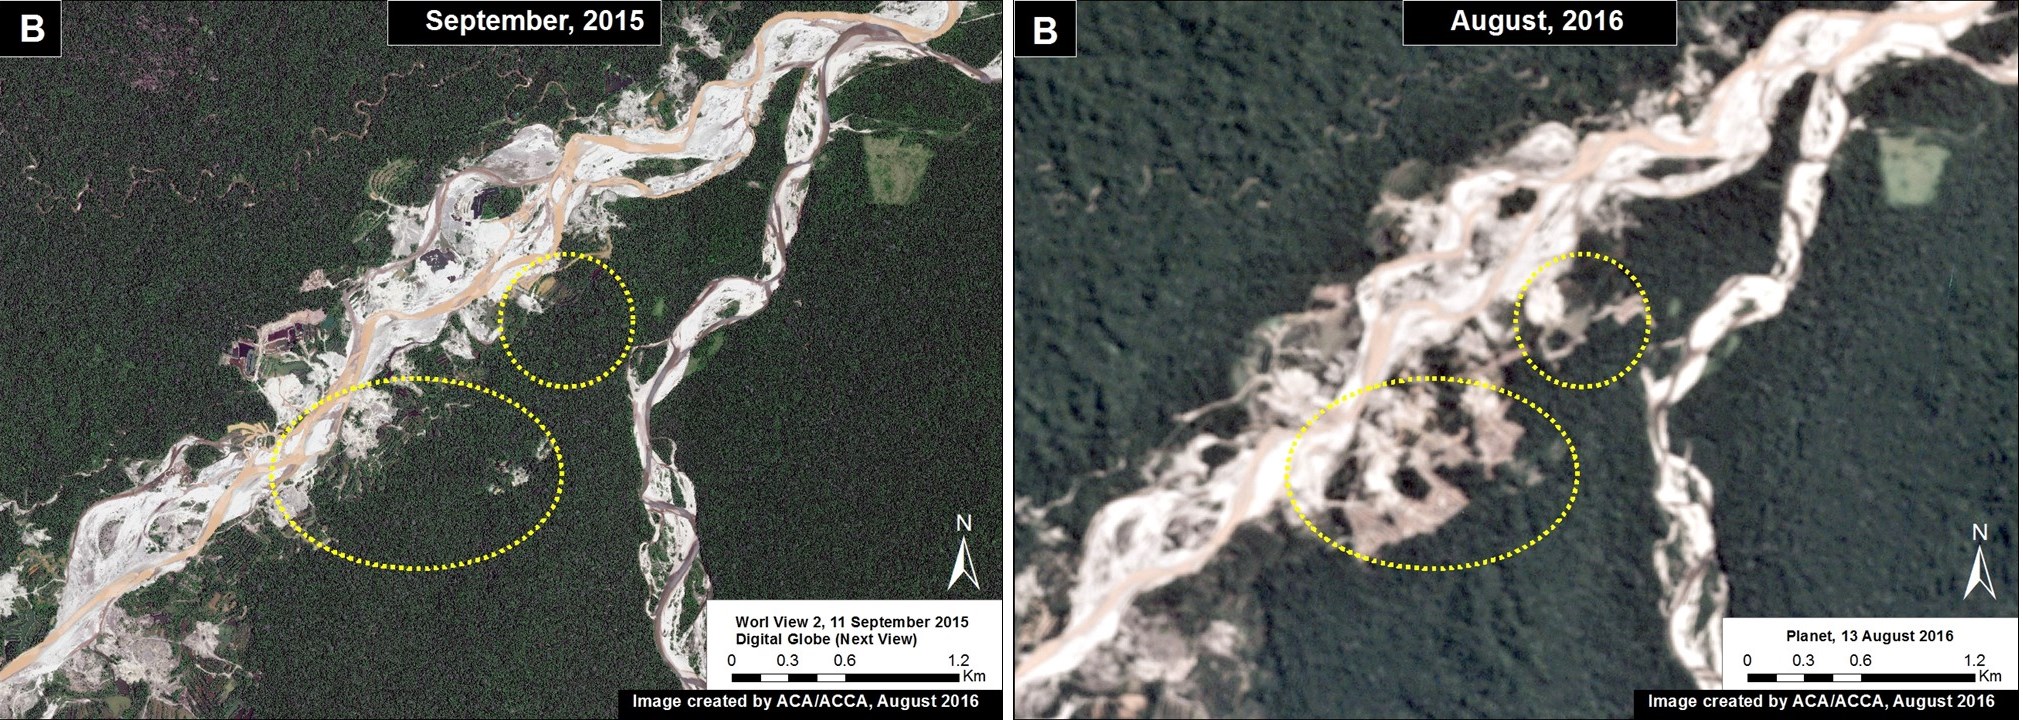
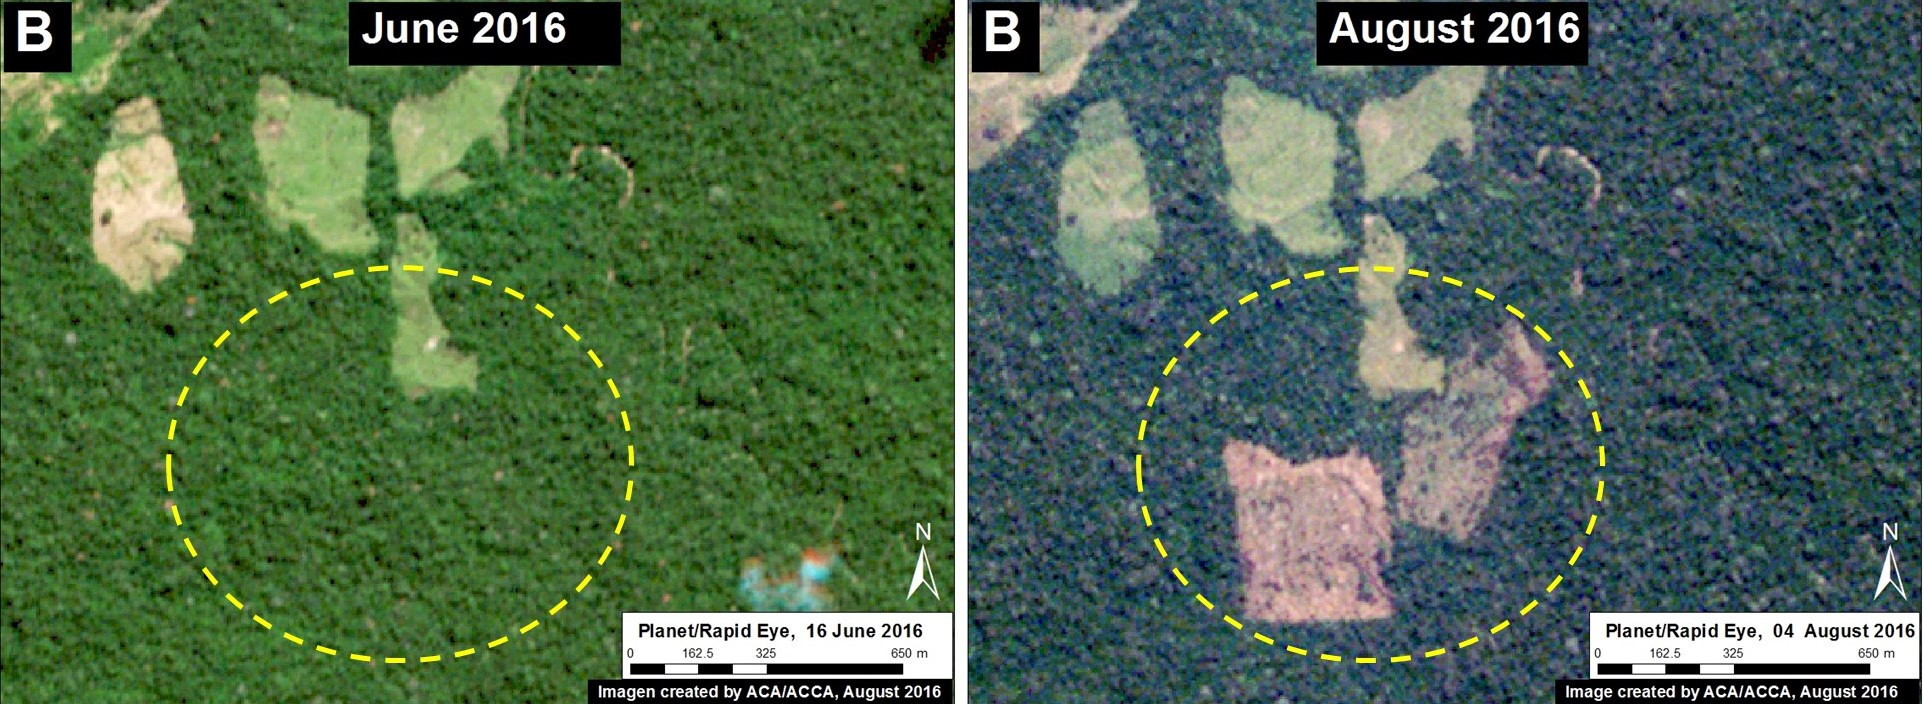
Inset B: Illegal Gold Mining Activity

esira_recovery_b_v3_en
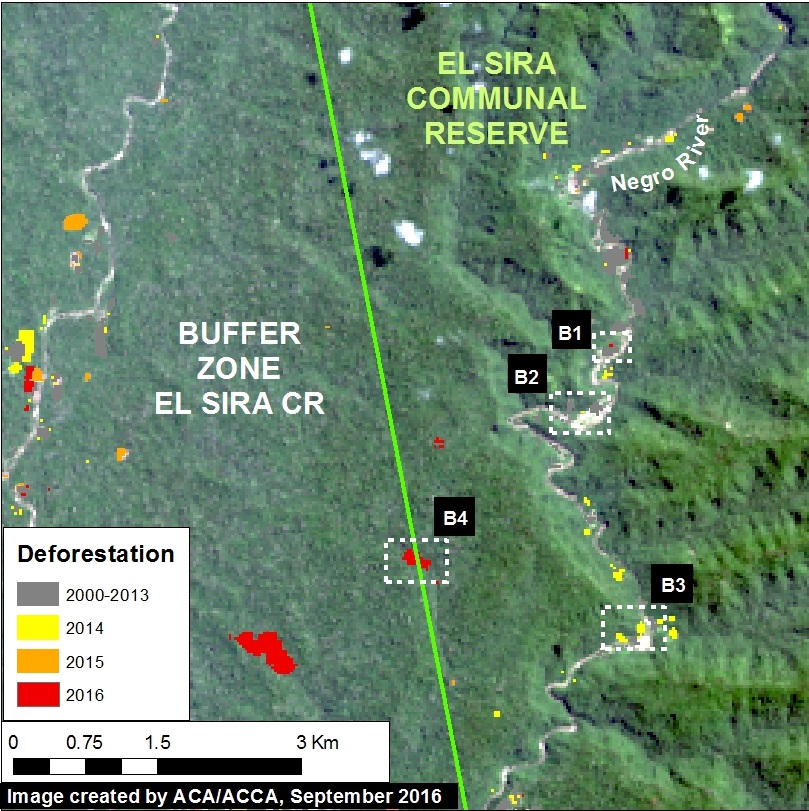
Image 45f. Data: UMD/GLAD, Hansen/UMD/Google/USGS/NASA, USGS/NASA, SERNANP

Illegal gold mining currently threatens the upper Negro River, located in the northwest sector of the Reserve (see Inset B of Image 45a).

During 2015 and 2016, the Peruvian government has carried out several interventions against this illegal mining.

Image 45f shows the recent deforestation along the upper Negro River. Insets B1-B3 indicate the areas detailed below in high resolution.


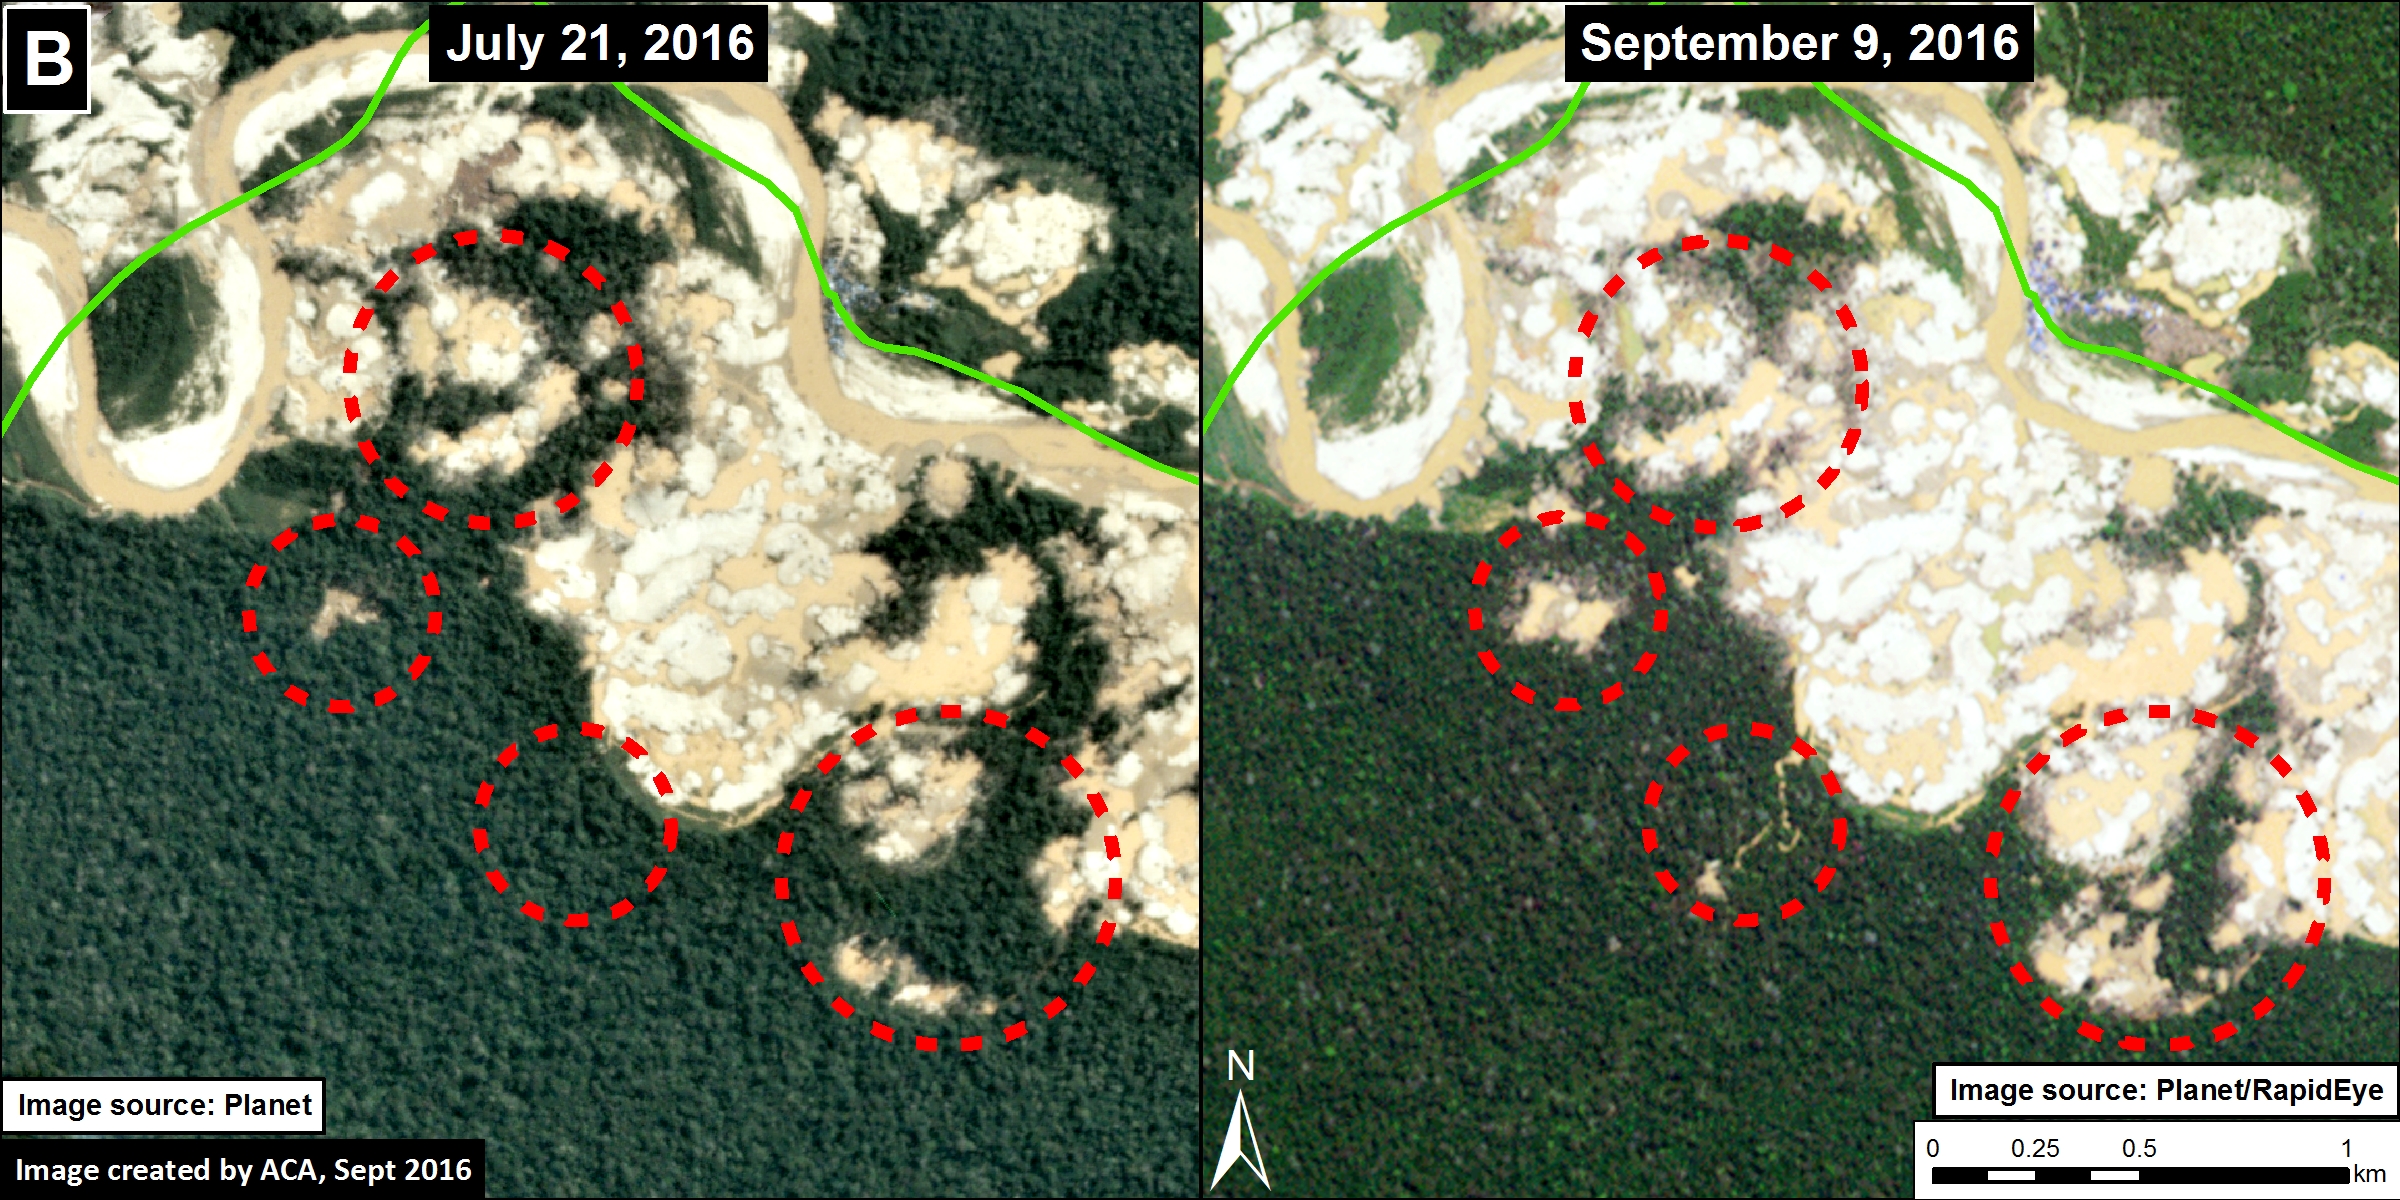
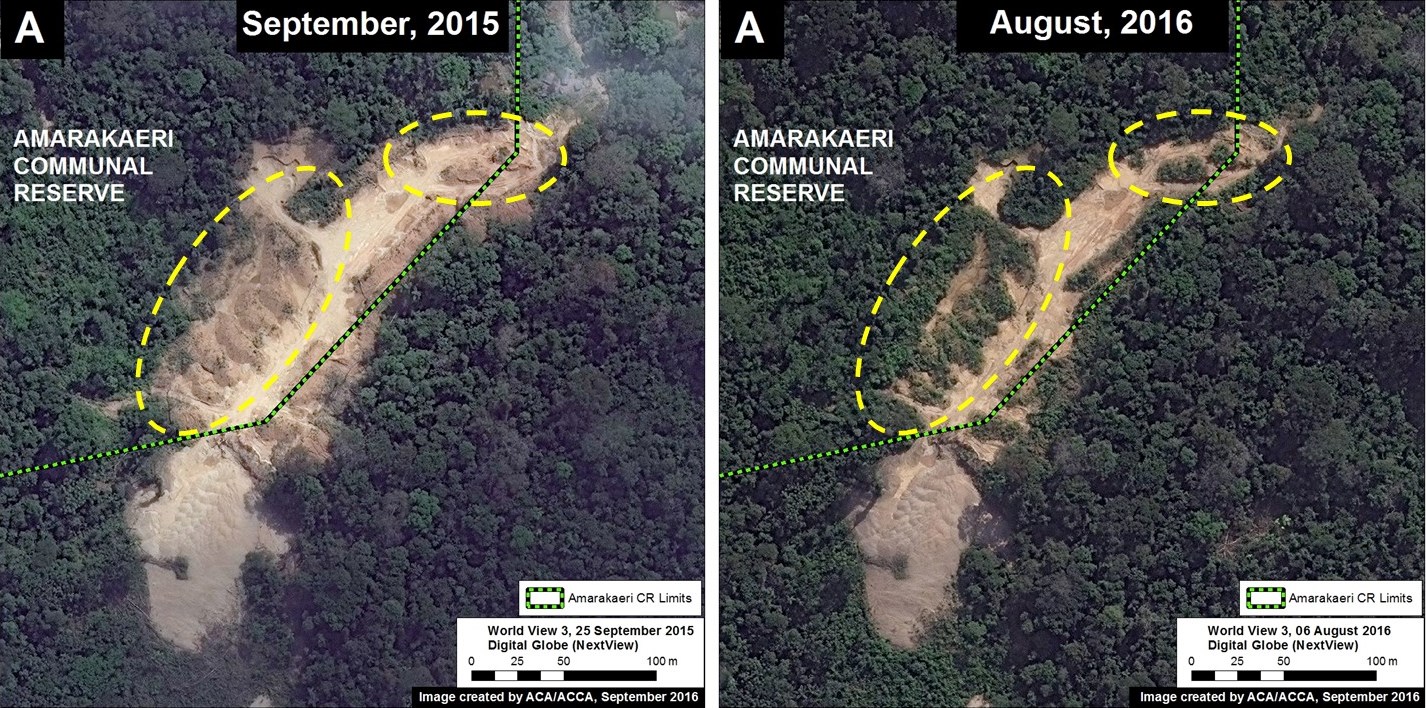
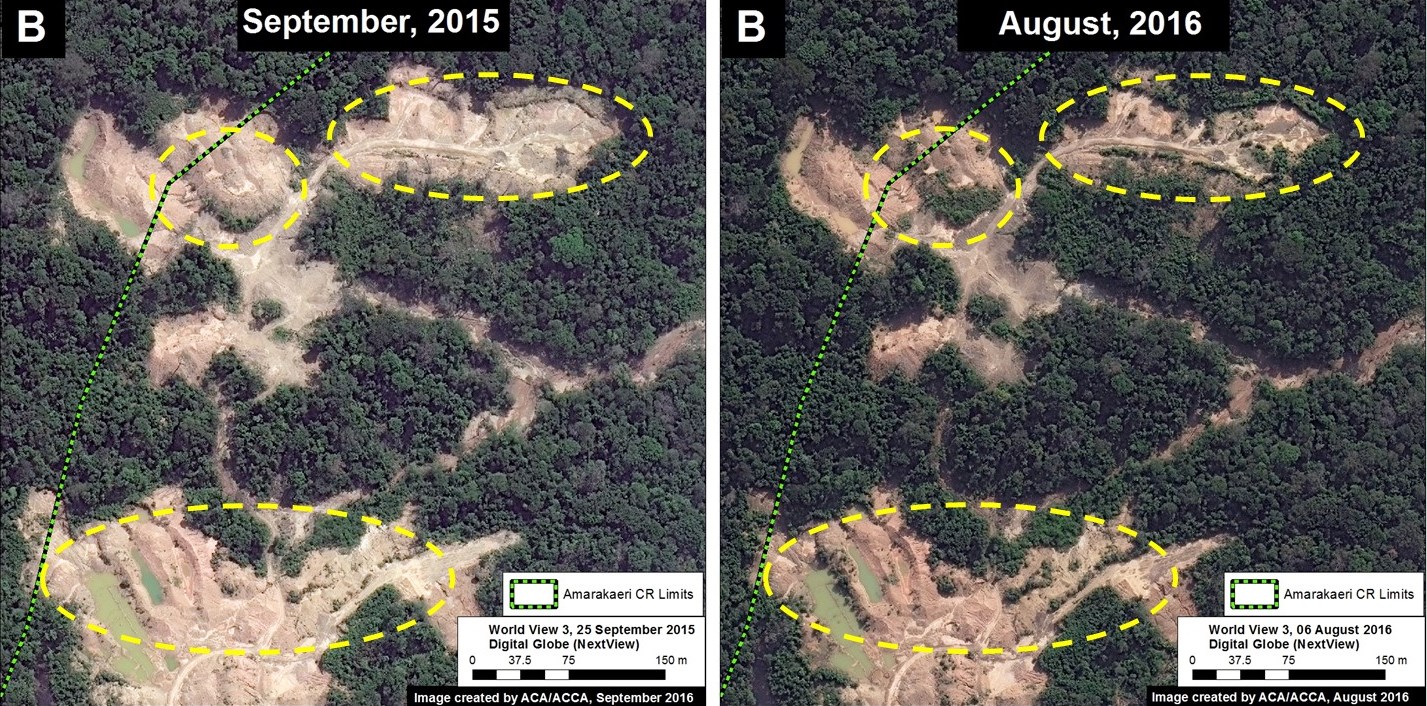
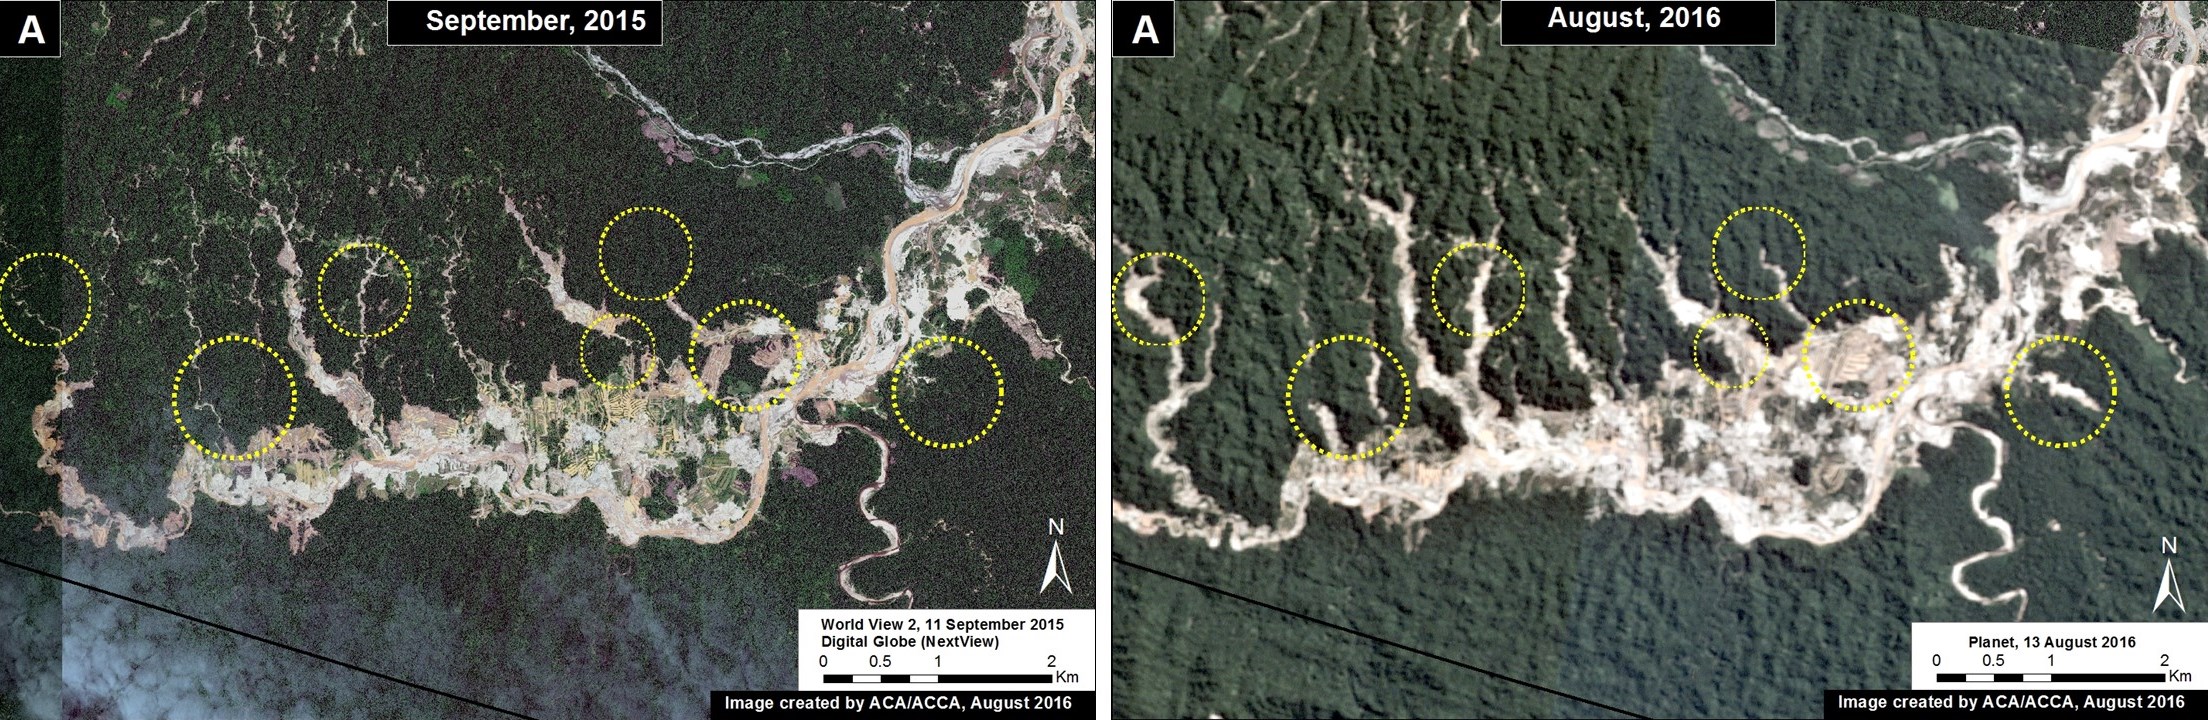
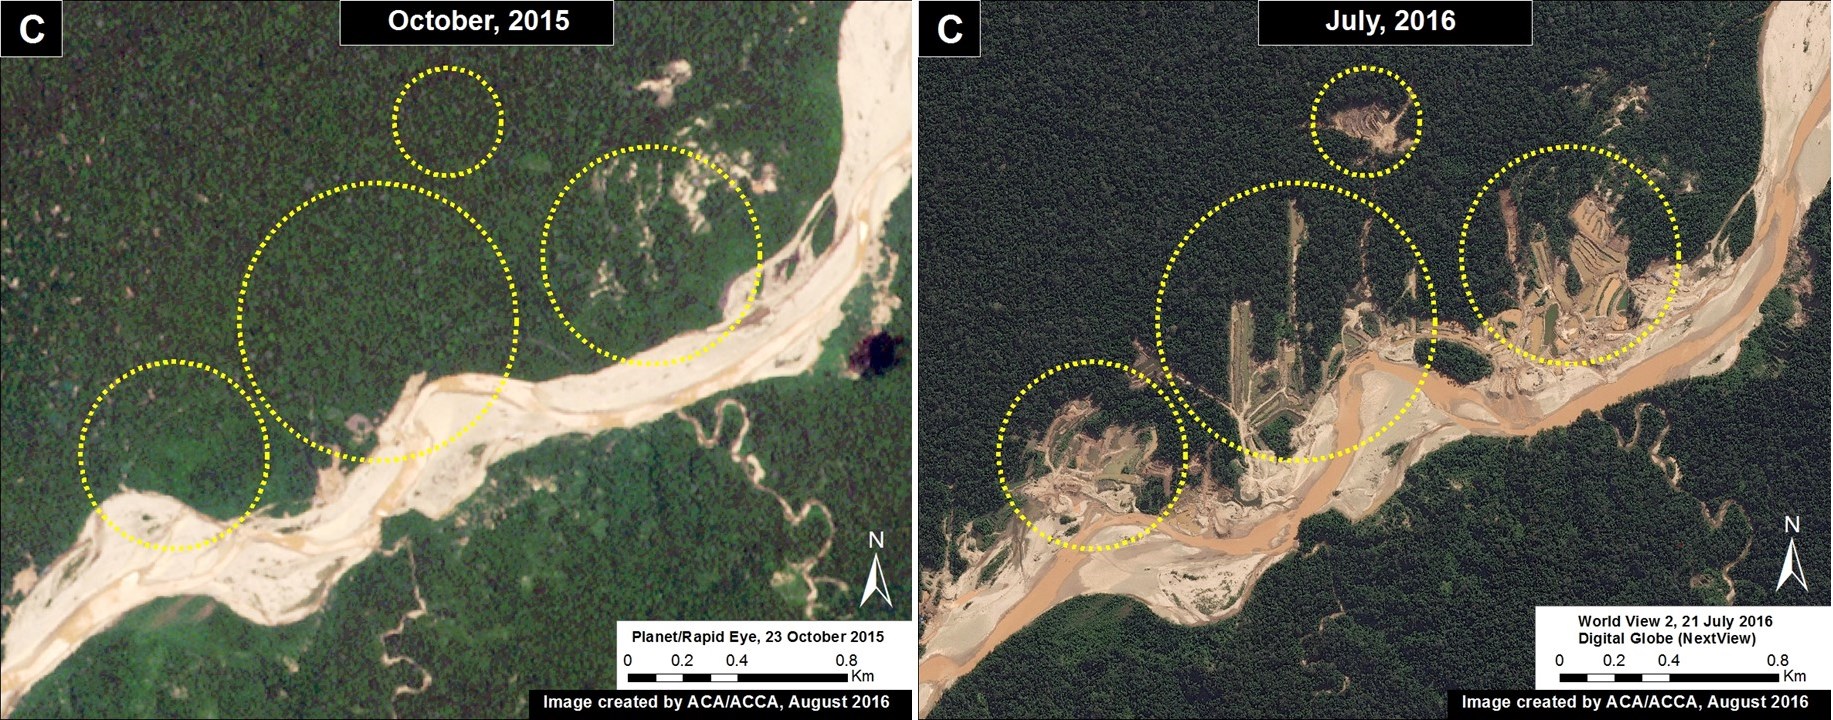
Images 45g-h show recently deforested areas (indicated by yellow circles) between 2015 (left panel) and 2016 (right panel). These areas have been the target of recent government interventions; note that within the red circles the mining machinery has been eliminated between August and September 2016.

esira_recovery_b1_a_m_v1_en
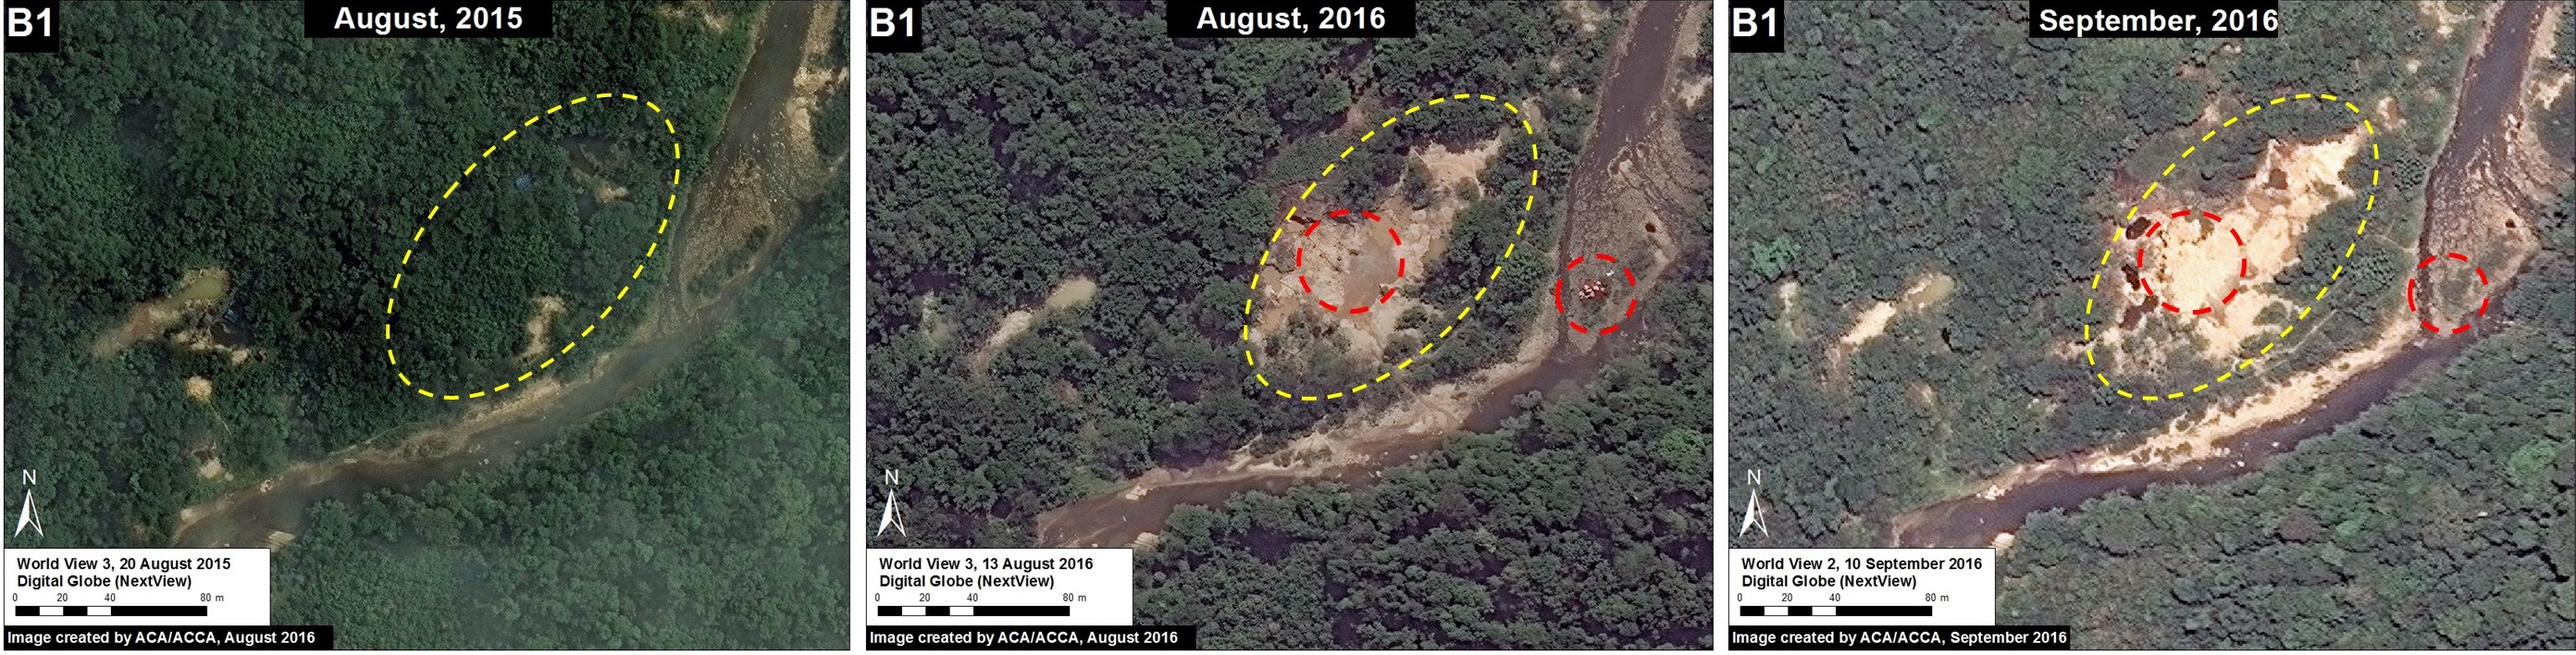
Image 45g. Data: Digital Globe (NextView)
esira_recovery_b2_a_m_v1_en
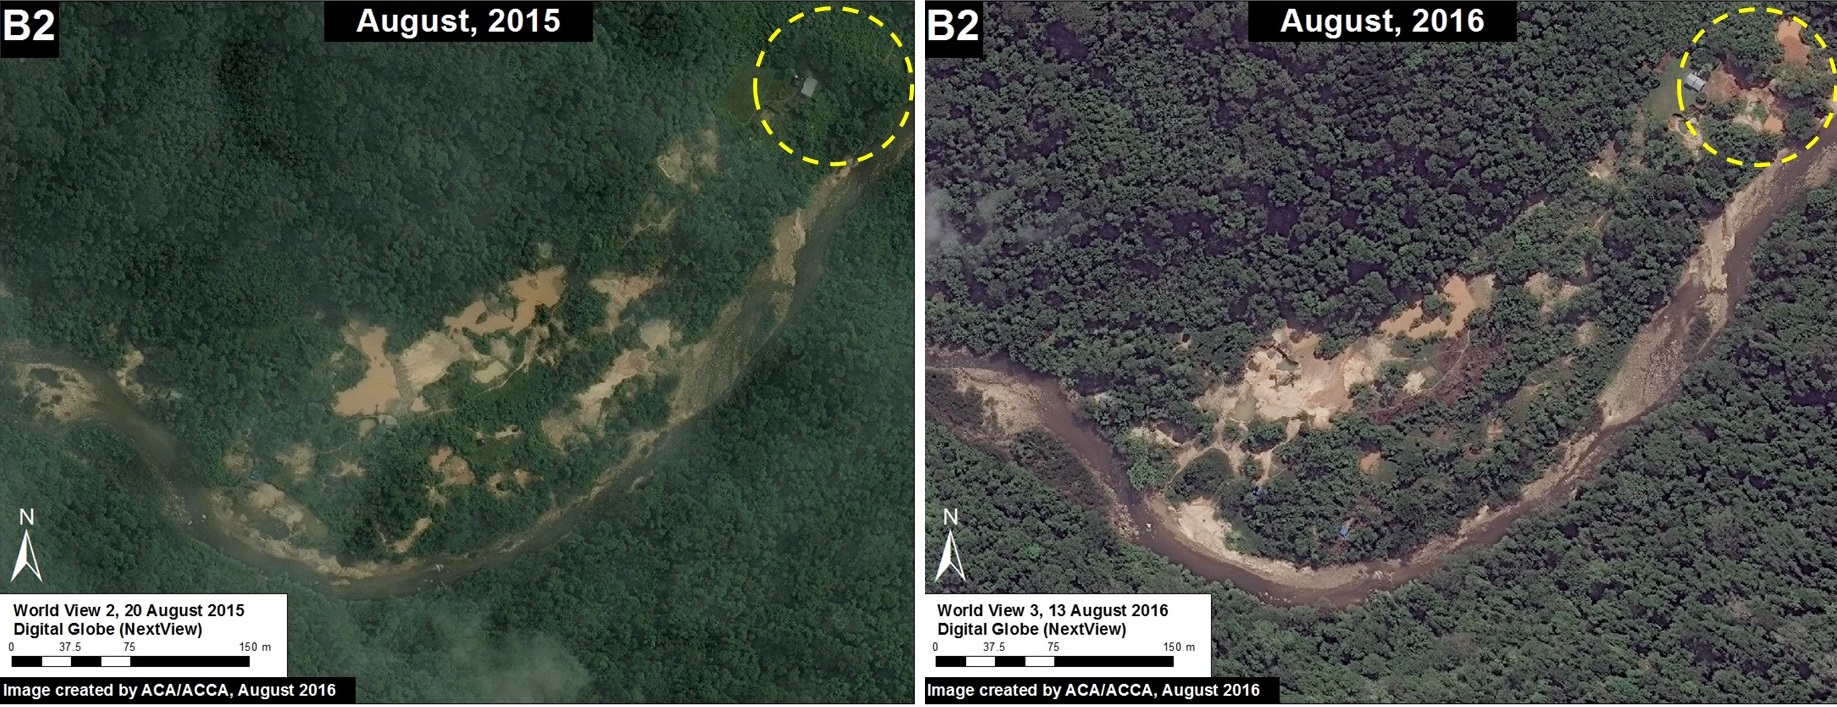
Image 45h. Data: Digital Globe (NextView)


Image 45i shows a mining area abandoned between 2015 and 2016.

esira_recovery_b3_a_m_v1_en
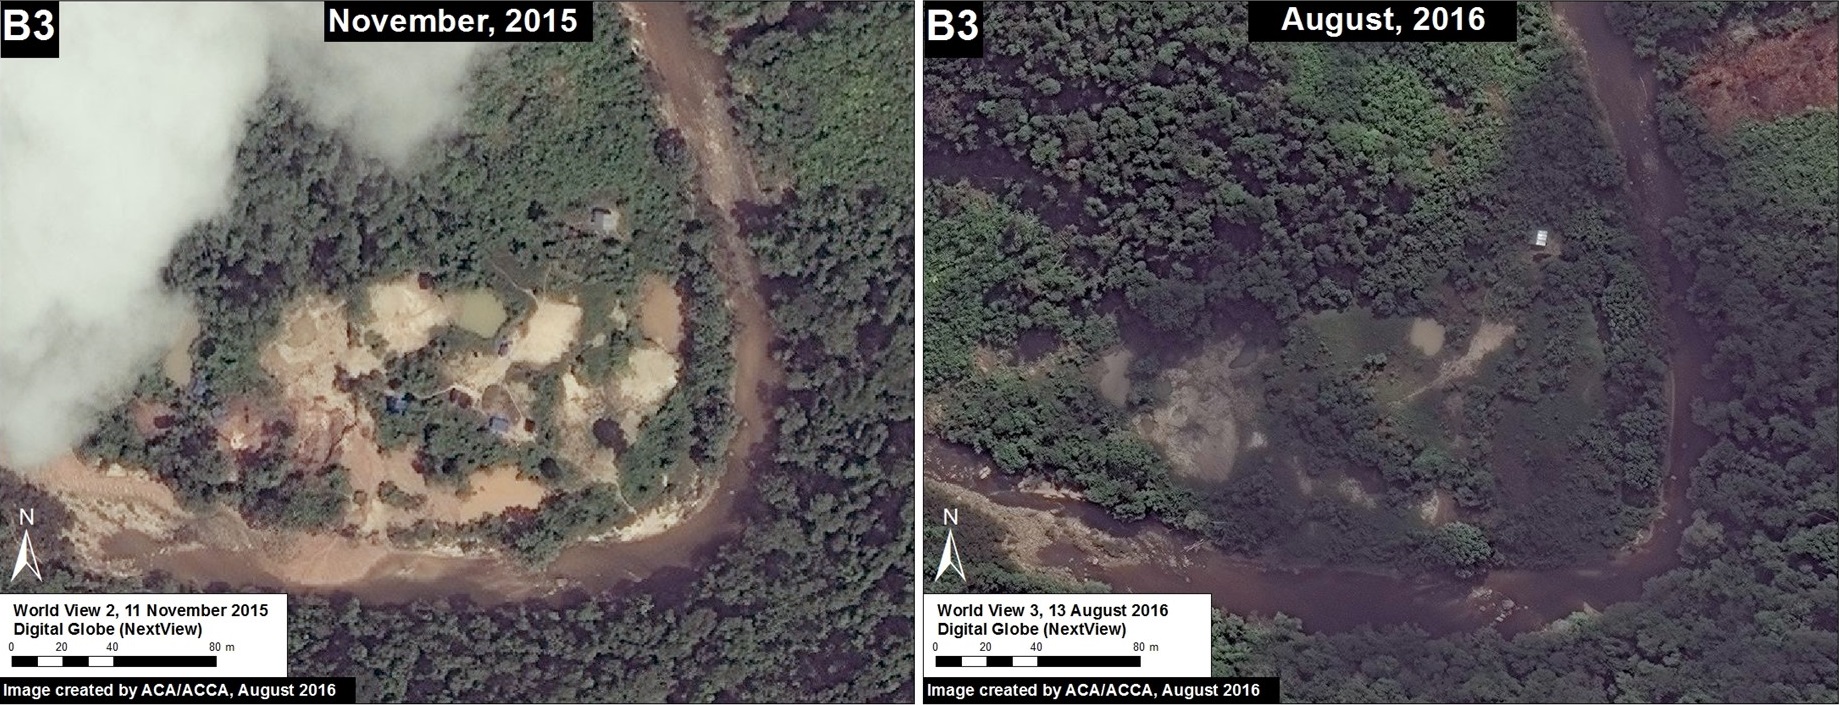
Image 45i. Data: Digital Globe (NextView)

New Deforestation Zones

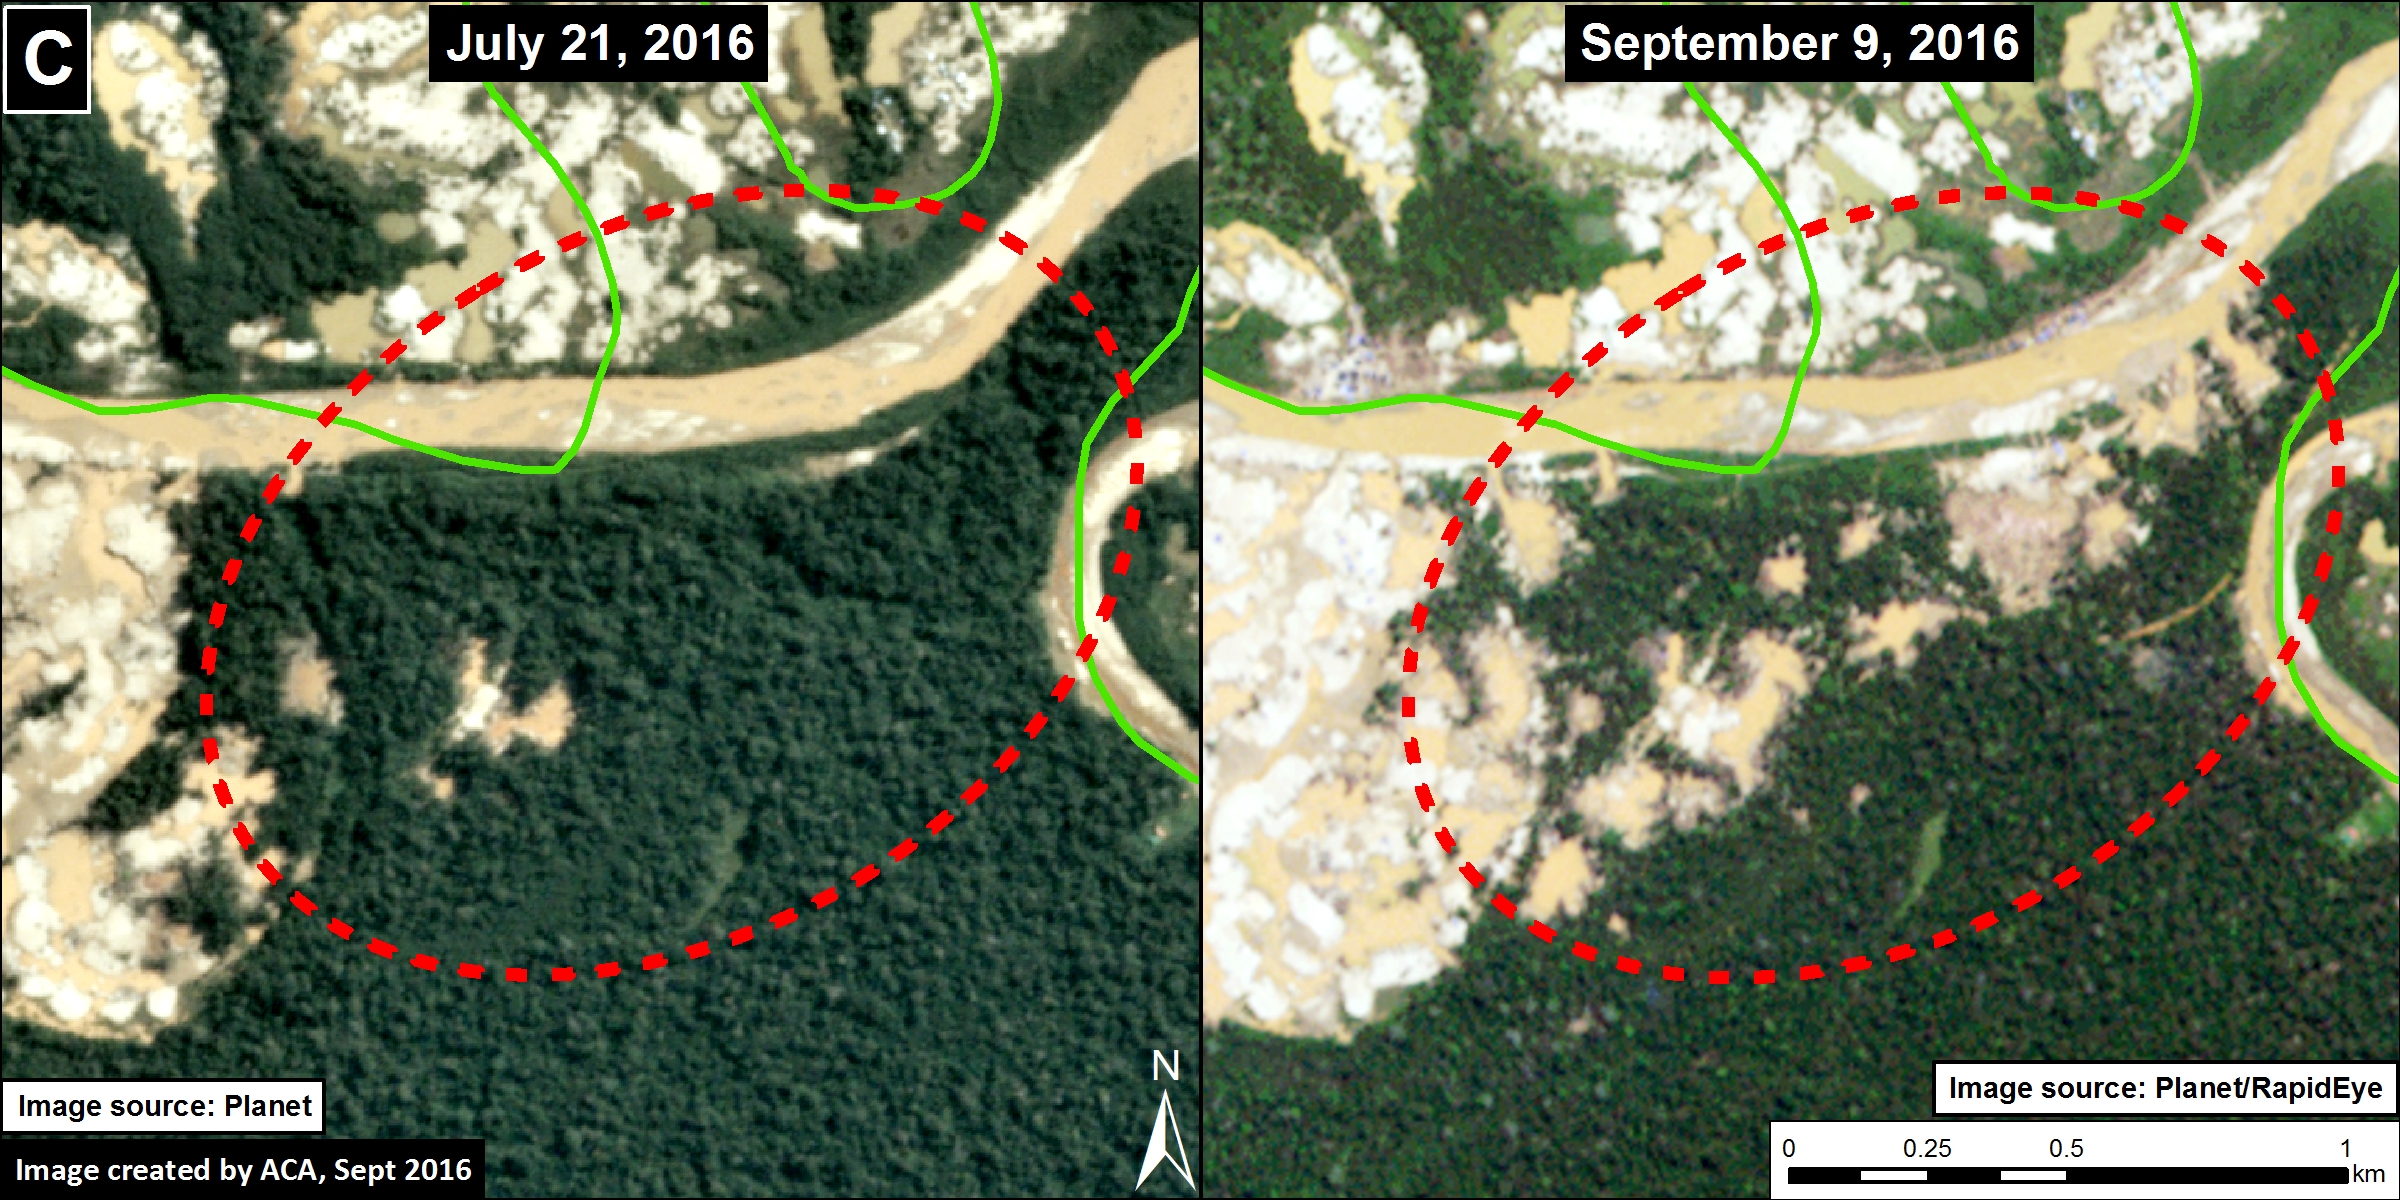
Image 45j shows the recent deforestation of 8.6 hectares (21 acres) between August (left panel) and September (right panel) 2016, within the area indicated by Inset B4 in Image 45f.

esira_recovery_b4_m_v1_en
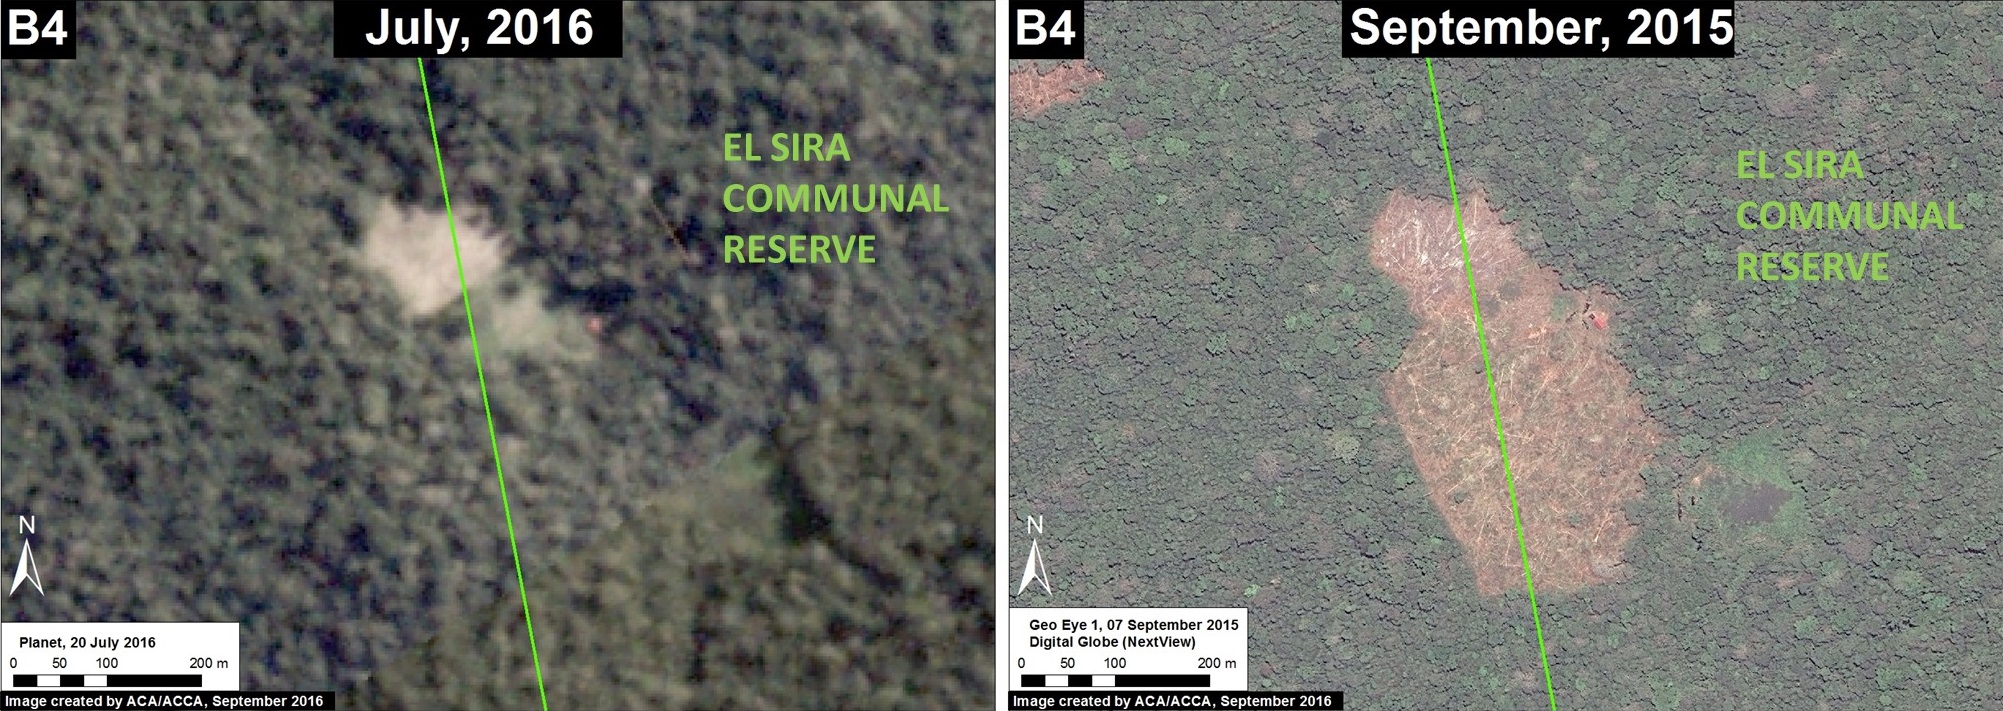
Image 45j. Data: Digital Globe (Nextview)

Image 45k shows the recent deforestation of 12 hectares (30 acres) within a remote area located in the northeast sector of the Reserve (see Inset C in Image 45a for context).

esira_recovery_c_m_v1_en
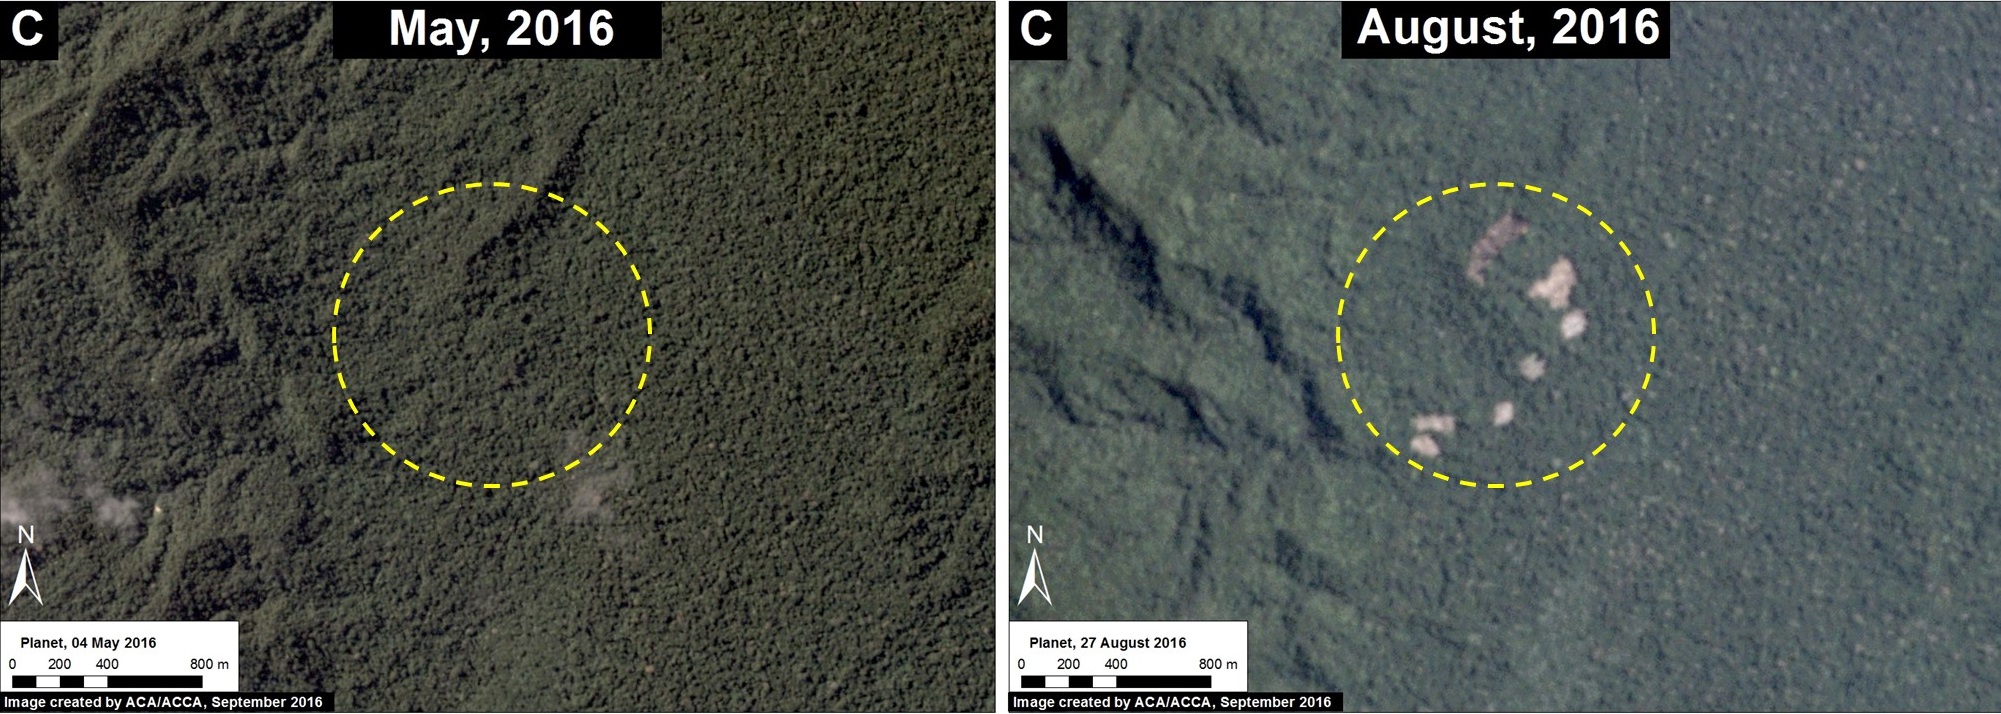
Image 45j. Data: Planet

Citation

Novoa S, Finer M, Snelgrove C (2016) Threats to Peru’s El Sira Communal Reserve. MAAP: 45

MAAP #44: Potential Recuperation of Illegal Gold Mining area in Amarakaeri Communal Reserve

In the previous MAAP #6, published in June 2015, we documented the deforestation of 11 hectares in the Amarakaeri Communal Reserve due to a recent illegal gold mining invasion. The Reserve, located in the Madre de Dios region of the southern Peruvian Amazon, is an important protected area that is co-managed by indigenous communities and Peru’s National Protected Areas Service (known as SERNANP). In the following weeks, the Peruvian government, led by SERNANP, cracked down on the illegal mining activities and effectively halted the deforestation within that part of the Reserve.

Here, we present high-resolution satellite images that show an initial vegetation regrowth in the invaded area. This finding may represent good news regarding the Amazon’s resilience to recover from destructive mining if it is stopped at an early stage. However, many questions and caveats remain regarding the nature of the regrowth and the long-term recovery potential of the degraded land, please see the Additional Information section below for more details.

Image 44a shows the base map of the area invaded by illegal gold mining in the southeast sector of Amarakaeri Communal Reserve. Insets A–D indicate the areas featured in the high-resolution zooms below.

Image 44a. Data: Digital Globe (Nextview), SERNANP

High-Resolution Zooms

Images 44b-e show, in high-resolution, areas where we detected vegetation regrowth between September 2015 (left panel) and August 2016 (right panel) following the gold mining invasion.

Image 44b. Data: Digital Globe (Nextview)
Image 44c. Data: Digital Globe (Nextview)
Image 44d. Data: Digital Globe (Nextview)
Image 44e. Data: Digital Globe (Nextview)

Additional Information

The natural vegetation regrowth observed in the images is not totally unexpected considering the area’s high biological diversity, the presence of nearby primary forest, and the relatively small area invaded prior to the government intervention. However, it’s important to consider that the regrowth has occurred mainly on the mounds of soil that were left behind by the mining activity. The regrowth is not yet evident in the other mining areas where the soil alteration was more severe. Further investigation is needed to better understand the characteristics of the regrowth and explore the true restoration potential of the area. Extreme degradation and mercury contamination left behind by mining activities may prevent many species from returning, allowing only the establishment of a few hardy colonizing specialist species.

Citation

Novoa S, Finer M, Román F (2016) Regeneration of Vegetation in Zone Affected by Gold Mining in the Amarakaeri Communal Reserve. MAAP: 44.

MAAP #43: Early Warning Deforestation Alerts in the Peruvian Amazon, Part 2

In the previous MAAP #40, we emphasized the power of combining early warning forest loss GLAD alerts with analysis of high-resolution satellite imagery as part of a comprehensive near real-time deforestation monitoring system for the Peruvian Amazon.

In the current MAAP, we present 3 new examples of this system across different regions of Peru. Click on the images below to enlarge.

Example 1: Illegal Gold Mining in buffer zone of Bahuaja Sonene National Park (Madre de Dios)
Example 2: Logging Road in buffer zone of Cordillera Azul National Park (Ucayali/Loreto)
Example 3: Deforestation in Permanent Production Forest (Ucayali)

Example 1: Illegal Gold Mining in buffer zone of Bahuaja Sonene National Park (Madre de Dios)

In the previous MAAP #5, we discussed illegal gold mining deforestation along the upper Malinowski River, located in the buffer zone of the Bahuaja Sonene National Park. As seen in Image 43a, the upper Malinowski is just upstream of the areas invaded by illegal gold mining in Tambopata National Reserve and its buffer zone (see MAAP #39 and #31, respectively). In MAAP #5, we documented the deforestation of more than 850 hectares between 2013 and 2015 along the upper Malinowski. Here, we show that gold mining deforestation continues in 2016, with an additional loss of 238 hectares (806 acres). Insets A-C correspond to the areas featured in the high-resolution zooms below.

Image 43a. Data: UMD/GLAD, Hansen/UMD/Google/USGS/NASA, NASA/USGS, SERNANP

The following Images 43b-d show, in high-resolution, the rapid expansion of gold mining deforestation between August/September 2015 (left panel) and July/August 2016 (right panel). The yellow circles indicate the main areas of deforestation between the images.

Imagen 43b. Datos: Planet, Digital Globe (Nextview)
Image 43b. Data: Planet, Digital Globe (Nextview)
Imagen 43c. Datos: Planet, Digital Globe (Nextview)
Image 43c. Data: Planet, Digital Globe (Nextview)
Imagen 43d. Datos: Planet, Digital Globe (Nextview)
Image 43d. Data: Planet, Digital Globe (Nextview)

Example 2: Logging Road in buffer zone of Cordillera Azul National Park (Ucayali/Loreto)

In the previous MAAP #18, we discussed the proliferation of logging roads in the central Peruvian Amazon in 2015. Here, we show the expansion of two of these logging roads in 2016. (see Image 43e). Red indicates construction during 2016 (47 km). Insets A1-A3 correspond to the areas featured in the high-resolution zooms below. Note that the northern road (Inset A3) is within the buffer zone of Cordillera Azul National Park. Evidence suggests that this road is not legal because it extends out of the permited area (see MAAP #18 for more details).

Imagen 43e. Datos: UMD/GLAD, Hansen/UMD/Google/USGS/NASA, SERNANP
Image 43e. Data: UMD/GLAD, Hansen/UMD/Google/USGS/NASA, SERNANP

The following images show, in high-resolution, the rapid construction of these logging roads. Image 43f shows the construction of part of the southern road (Inset A1), and the deforestation for a nearby agricultural parcel, between April (left panel) and July (right panel) 2016. Image 43g shows the construction of 1.8 km in just three days along this same road (Inset A2) between July 21 (left panel) and July 24 (right panel) 2016.

Imagen 43f. Datos: Planet
Image 43f. Data: Planet
Imagen 43g. Datos: Planet
Image 43g. Data: Planet

Image 43h shows the construction of 13 km on the northern road between November 2015 (left panel) and July 2016 (right panel) within the buffer zone of the Cordillera Azul National Park.

Imagen 43h. Datos: Planet
Image 43h. Data: Planet

Example 3: Deforestation in Permanent Production Forest  (Ucayali)

Image 43i shows recent deforestation of 136 hectares (336 acres) in 2016 in southern Ucayali region within areas classified as Permanent Production Forest and Foresty Concession. These types of areas are generally zoned for sustainable forestry uses, not clear-cutting, thus we question the legality of the deforestation. Tables A-B correspond to the areas featured in the high-resolution zooms, below.

Imagen 43i. Datos: UMD/GLAD, Hansen/UMD/Google/USGS/NASA, MINAGRI
Image 43i. Data: UMD/GLAD, Hansen/UMD/Google/USGS/NASA, MINAGRI

Image 43j shows deforestation within a section of Permanent Production Forest, and Image 43k shows deforestation within a section of Forestry Concession.

Imagen 43j. Datos: Planet
Image 43j. Data: Planet
Imagen 43k. Datos: Planet
Image 43k. Data: Planet

Citation

Finer M, Novoa S, Goldthwait E (2016) Early Warning Deforestation Alerts in the Peruvian Amazon, Part 2. MAAP: 43.