MAAP #158: Amazon Deforestation & Fire Hotspots 2021

2021 Amazon Forest Loss Base Map. Deforestation and fire hotspots across the full Amazon biome. Data: UMD/GLAD, ACA/MAAP.

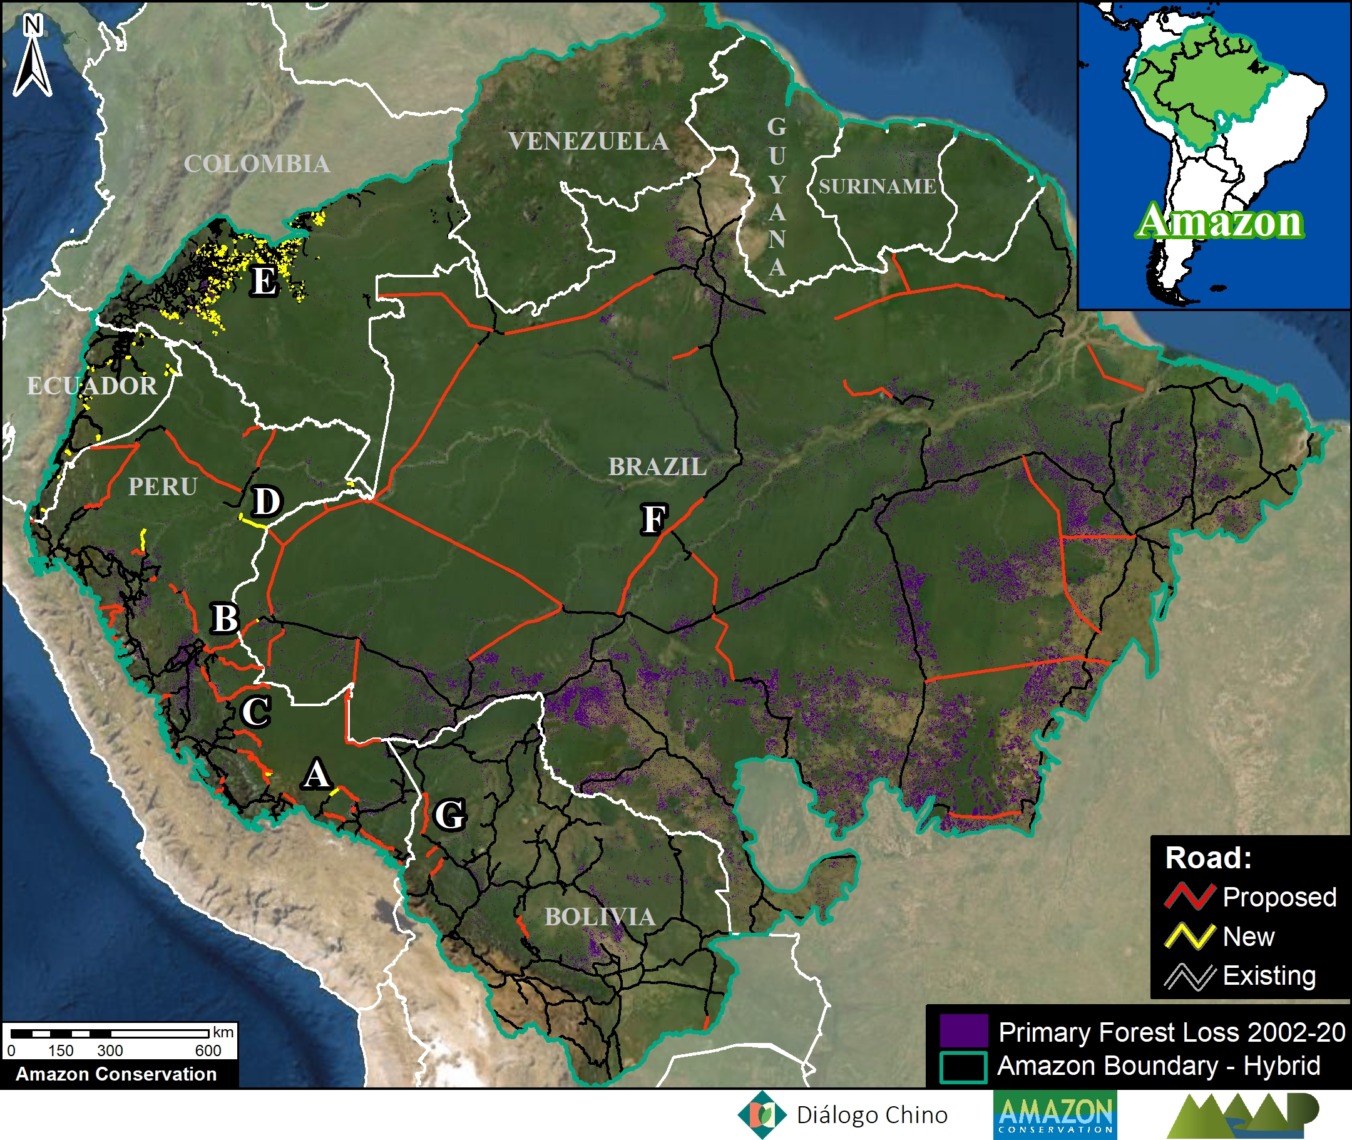
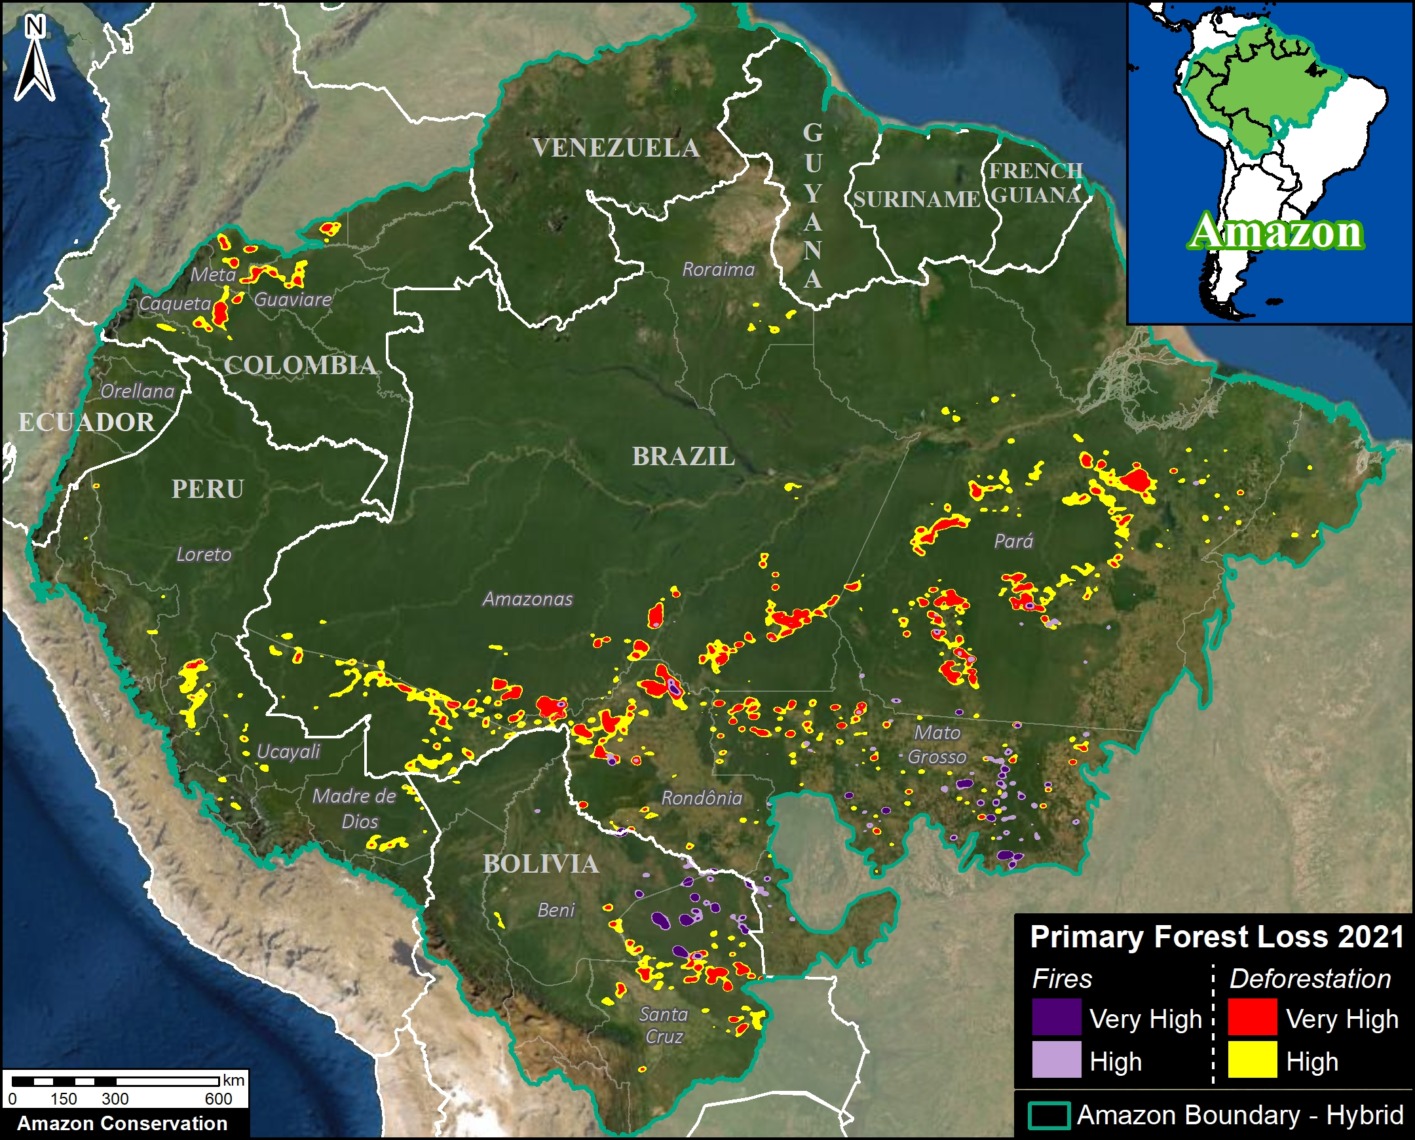
We present a detailed look at the major 2021 Amazon forest loss hotspots, based on the final annual data produced by the University of Maryland.

This dataset is unique in that distinguishes forest loss from fire, leaving the rest as a close proxy for deforestation.

Thus, for the first time, the results include both deforestation and fire hotspots across the Amazon.

The Base Map (see right) and Results Graph (see below) reveal several key findings:p

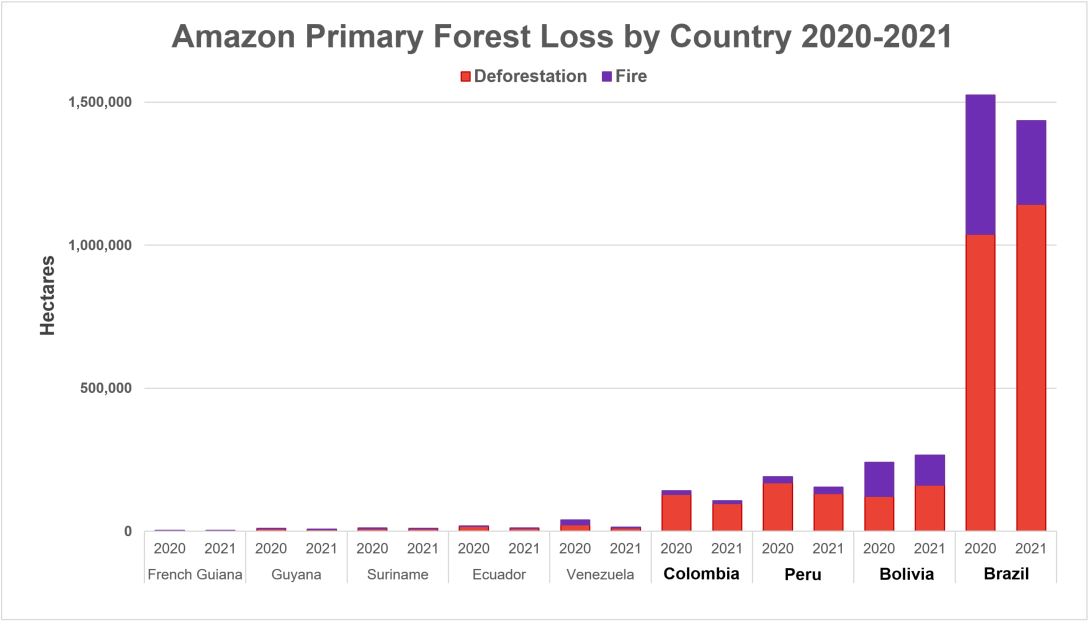
  • In 2021, we estimate the loss of 2 million hectares (4.9 million acres) of primary forest loss across the nine countries of the Amazon biome. This total represents a slight decrease from 2020, but the 6th highest on record.
    l
  • The vast majority of this loss was deforestation (78%), accounting for 1.57 million hectares. This total represents a slight increase from 2020, and the 5th highest on record. This deforestation impacted the entire stretch of the southern Amazon (southern Brazil, Bolivia, and Peru) plus further north in Colombia.
    l
  • This deforestation was concentrated in Brazil (73%), Bolivia (10%), Peru (8%), and Colombia (6%). In Brazil and Bolivia, deforestation was the highest since 2017. In Peru and Colombia, deforestation dropped from 2020 but was still historically high. See below for maps and graphs for each country. See Annex for 2020-21 details.
    k
  • Fires directly caused the remaining primary forest loss (22%), accounting for 436,000 hectares. This total represents a decrease from the severe fire season of 2020, but was the 4th highest on record. Moreover, each of the six most intense fire seasons has occurred in the past six years. Over 90% of the fire impact occurred in just two countries: Brazil and Bolivia. Note that fire impacts were concentrated in the southeast of each country (Mato Grosso and Santa Cruz states, respectively).
    k
  • Since 2002, we estimate the deforestation of over 27 million hectares (67 million acres) of primary forest, greater than the size of the United Kingdom or the U.S. state of Colorado. On top of this, we estimate an additional impact of 6.7 million hectares due to fires.

Below, we zoom in on the four countries with the highest deforestation (Brazil, Bolivia, Peru, and Colombia), with additional maps and analysis.

Amazon Forest Loss Results Graph, 2002-21. Data: UMD/GLAD, ACA/MAAP.

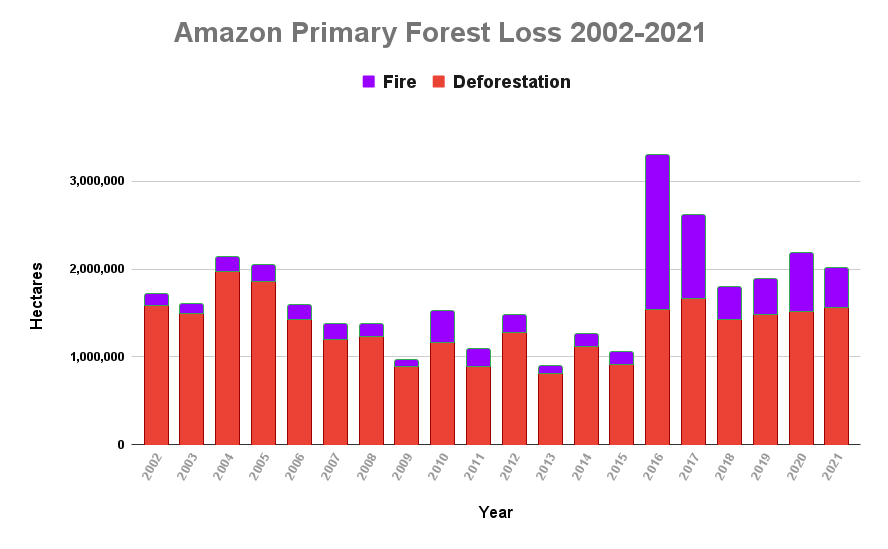
For deforestation, note that in 2021 there was a slight increase across the Amazon, continuing a gradual four-year trend. 2021 had the 5th highest deforestation on record (behind just 2002, 2004, 2005, and 2017).

For fire, in 2021 there was a decrease from the severe fire season of 2020, but was the 4th highest on record (behind just 2016, 2017, and 2020). Moreover, each of the last six years is in the top six worst fire seasons across the Amazon.

For total forest loss (deforestation and fire combined), in 2021 there was slight decrease from 2020, but the 6th highest on record.
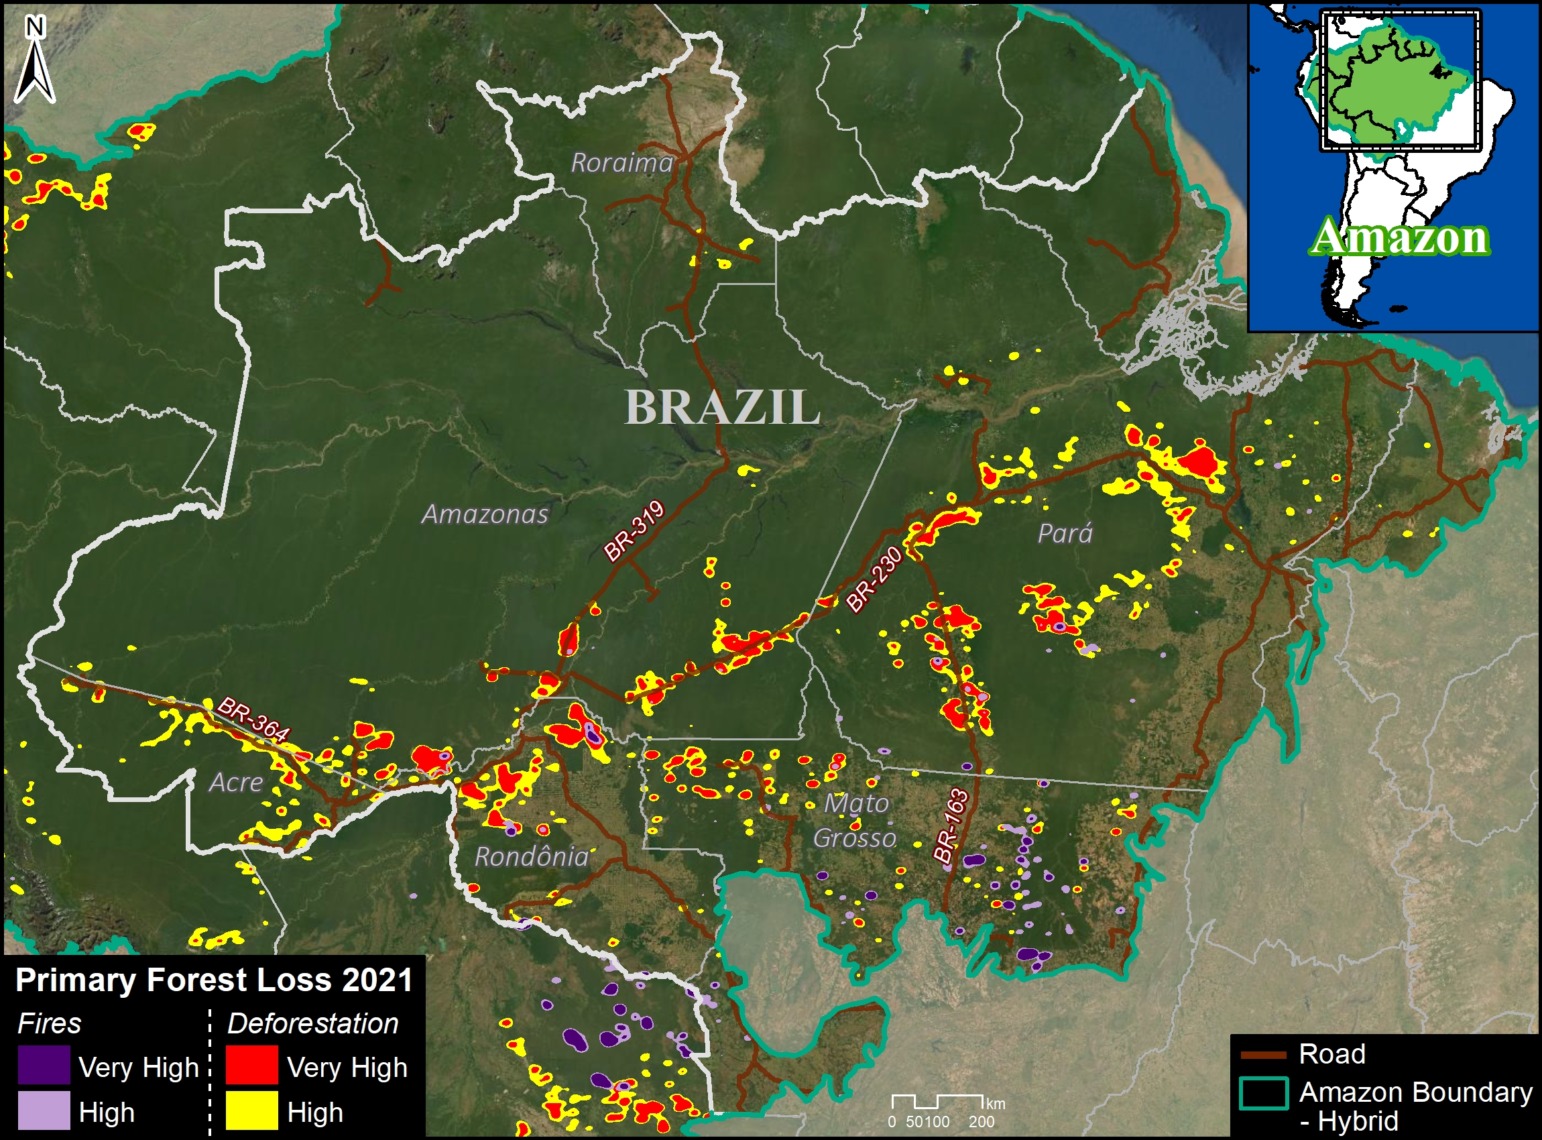
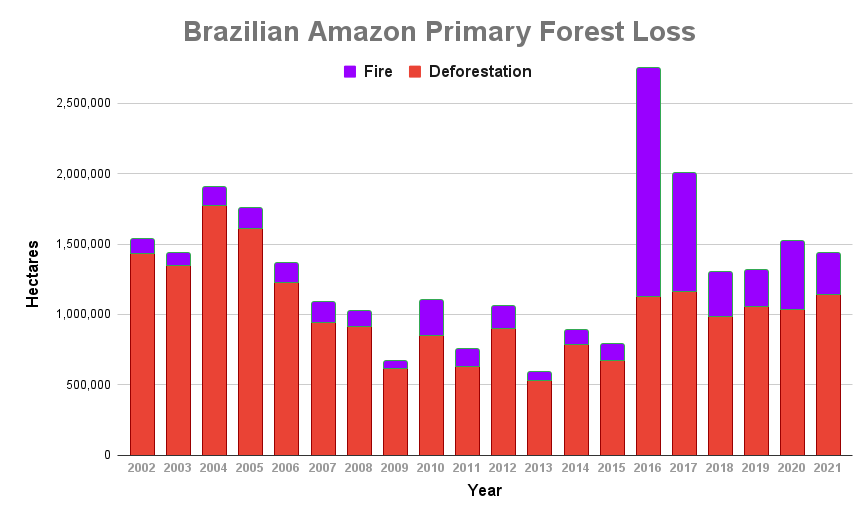
Brazil Base Map, 2021. Deforestation and fire hotspots in the Brazilian Amazon. Data: UMD/GLAD, ACA/MAAP.

Brazilian Amazon

In 2021, the Brazilian Amazon lost 1.1 million hectares of primary forest to deforestation. Fires directly impacted an additional 293,000 hectares.

The deforestation was the highest since 2017 and also the peak of the early 2000s (6th highest on record). The fire impact was relatively high (5th highest on record), but less than the peak years of 2016, 2017, and 2020.

The deforestation was concentrated along the major road networks, especially roads 163, 230, 319, and 364 in the states of Acre, Amazonas, Pará, and Rondônia (see Brazil Base Map).

The direct fire impacts were concentrated in the southeastern state of Mato Grosso.

It is also important to note that many areas experienced the one-two combination of initial deforestation followed by fire to prepare the area for agriculture or cattle.
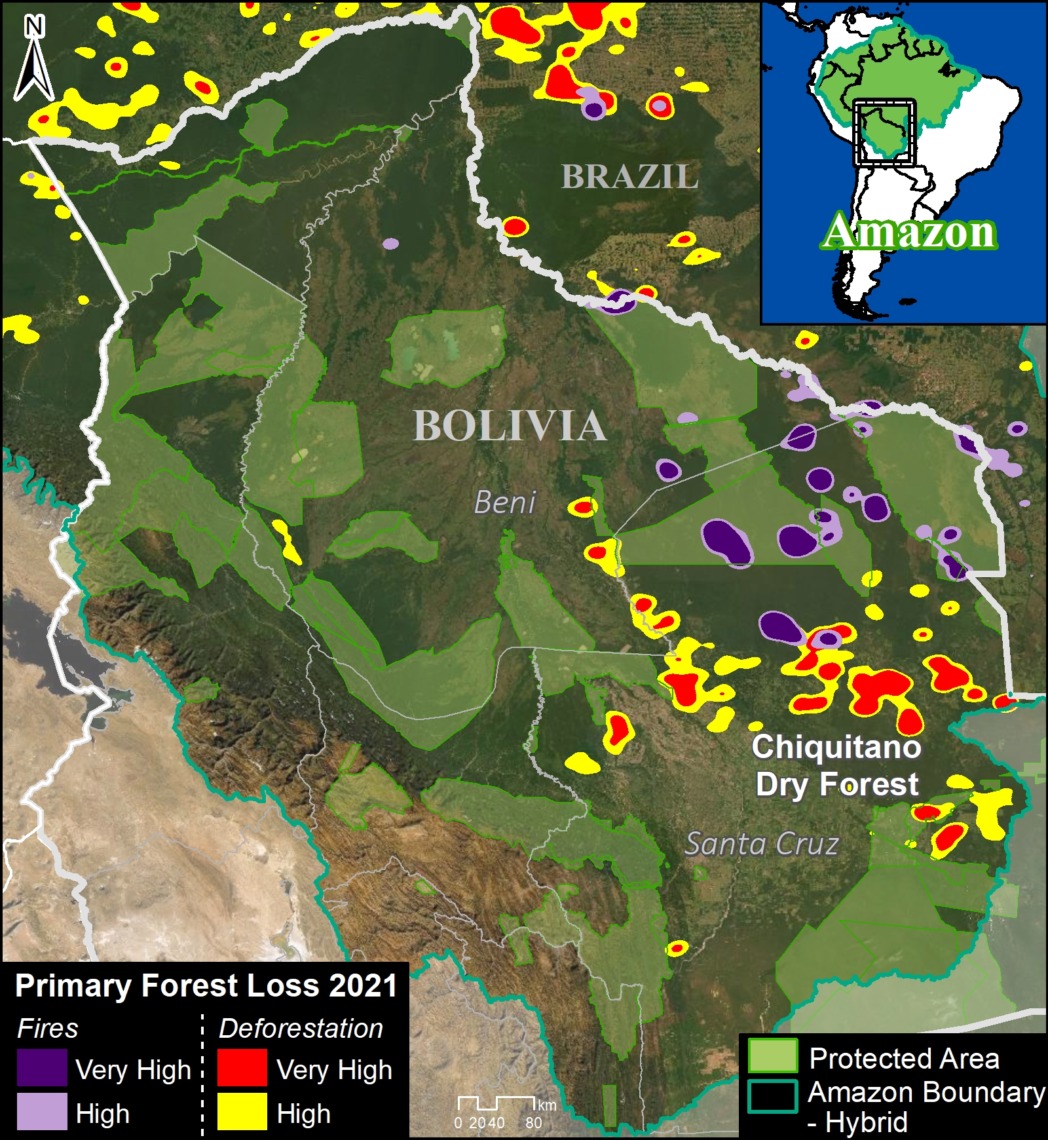
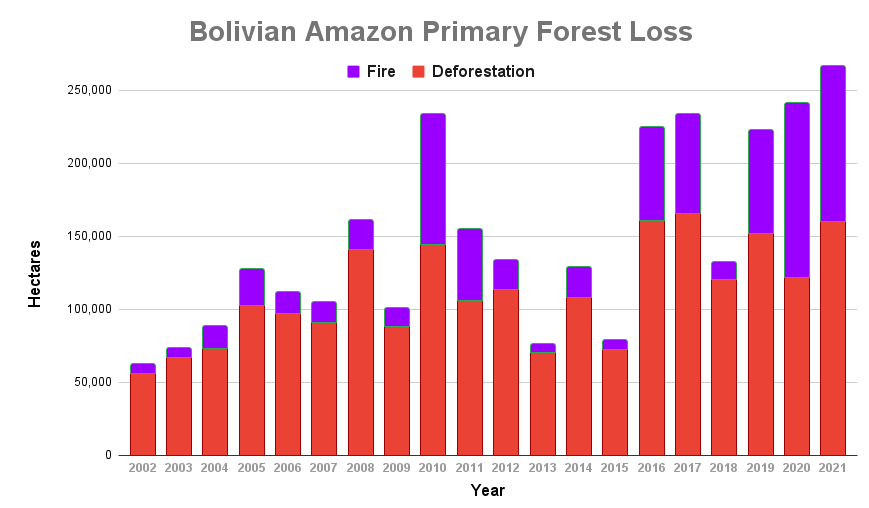


Bolivia Base Map. Deforestation hotspots in Bolivian Amazon. Data: UMD/GLAD, ACA/MAAP.

Bolivian Amazon

In 2021, the Bolivian Amazon lost 161,000 hectares of primary forest to deforestation. Fires directly impacted an additional 106,000 hectares.

Deforestation was the third-highest on record, just behind the peak in 2016 and 2017. The fire impact was the second-highest on record, behind just the intense year of 2020 (thus, the last two years are the two highest on record).

Both the deforestation and fires were concentrated in the southeastern department of Santa Cruz (see Bolivia Base Map).

Much of the deforestation was associated with large-scale agriculture, while the fires once again impacted important natural ecosystems, most notably the Chiquitano dry forests.
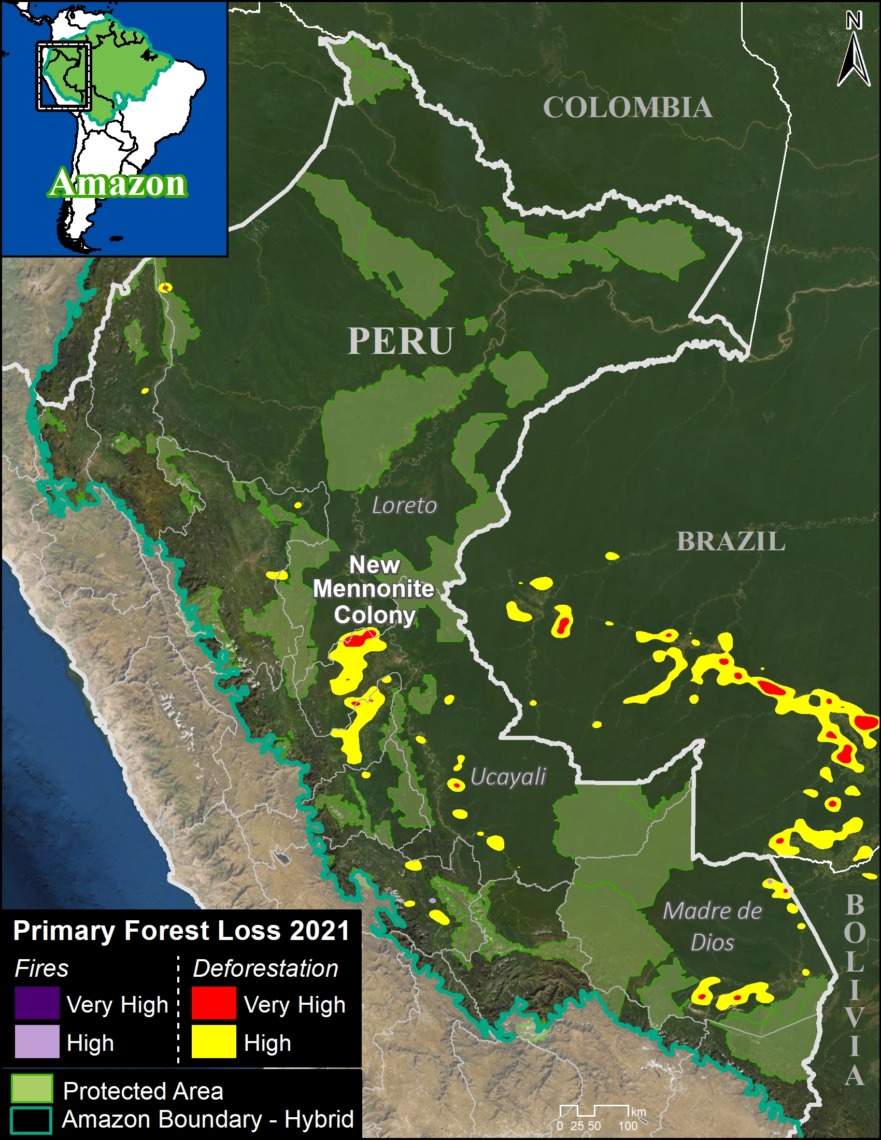
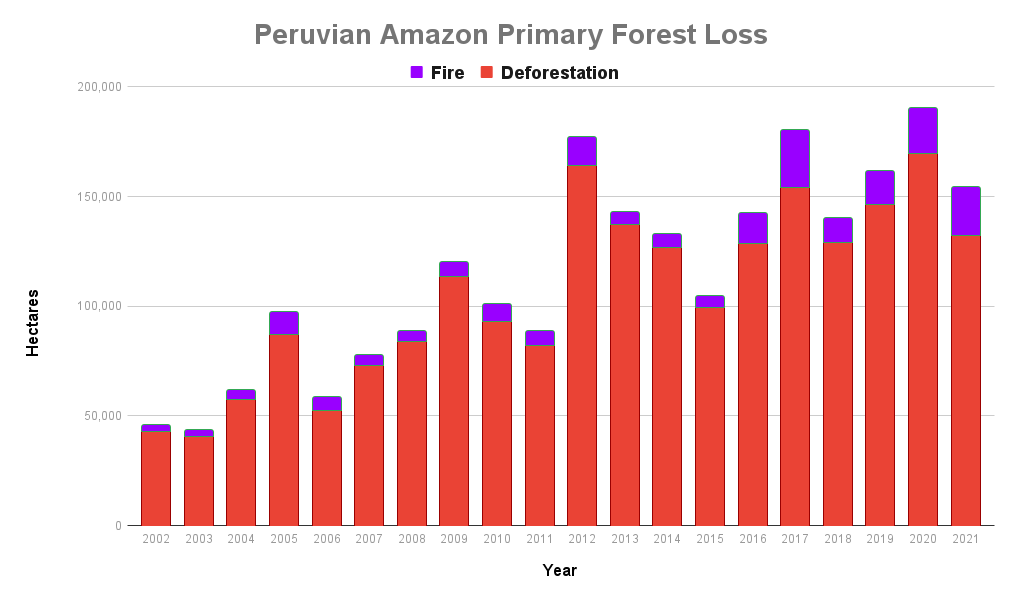


Peru Base Map. Deforestation hotspots in the Peruvian Amazon. Data: UMD/GLAD, ACA/MAAP.

Peruvian Amazon

In 2021, the Peruvian Amazon lost 132,400 hectares of primary forest to deforestation. Fires directly impacted an additional 21,800 hectares.

Deforestation dropped from a record high in 2020, but was 6th highest on record. Thre fire impact was the second-highest on record (behind just 2017).

The deforestation was concentrated in the central and southern Amazon (Ucayali and Madre de Dios regions, respectively) (see Peru Base Map).

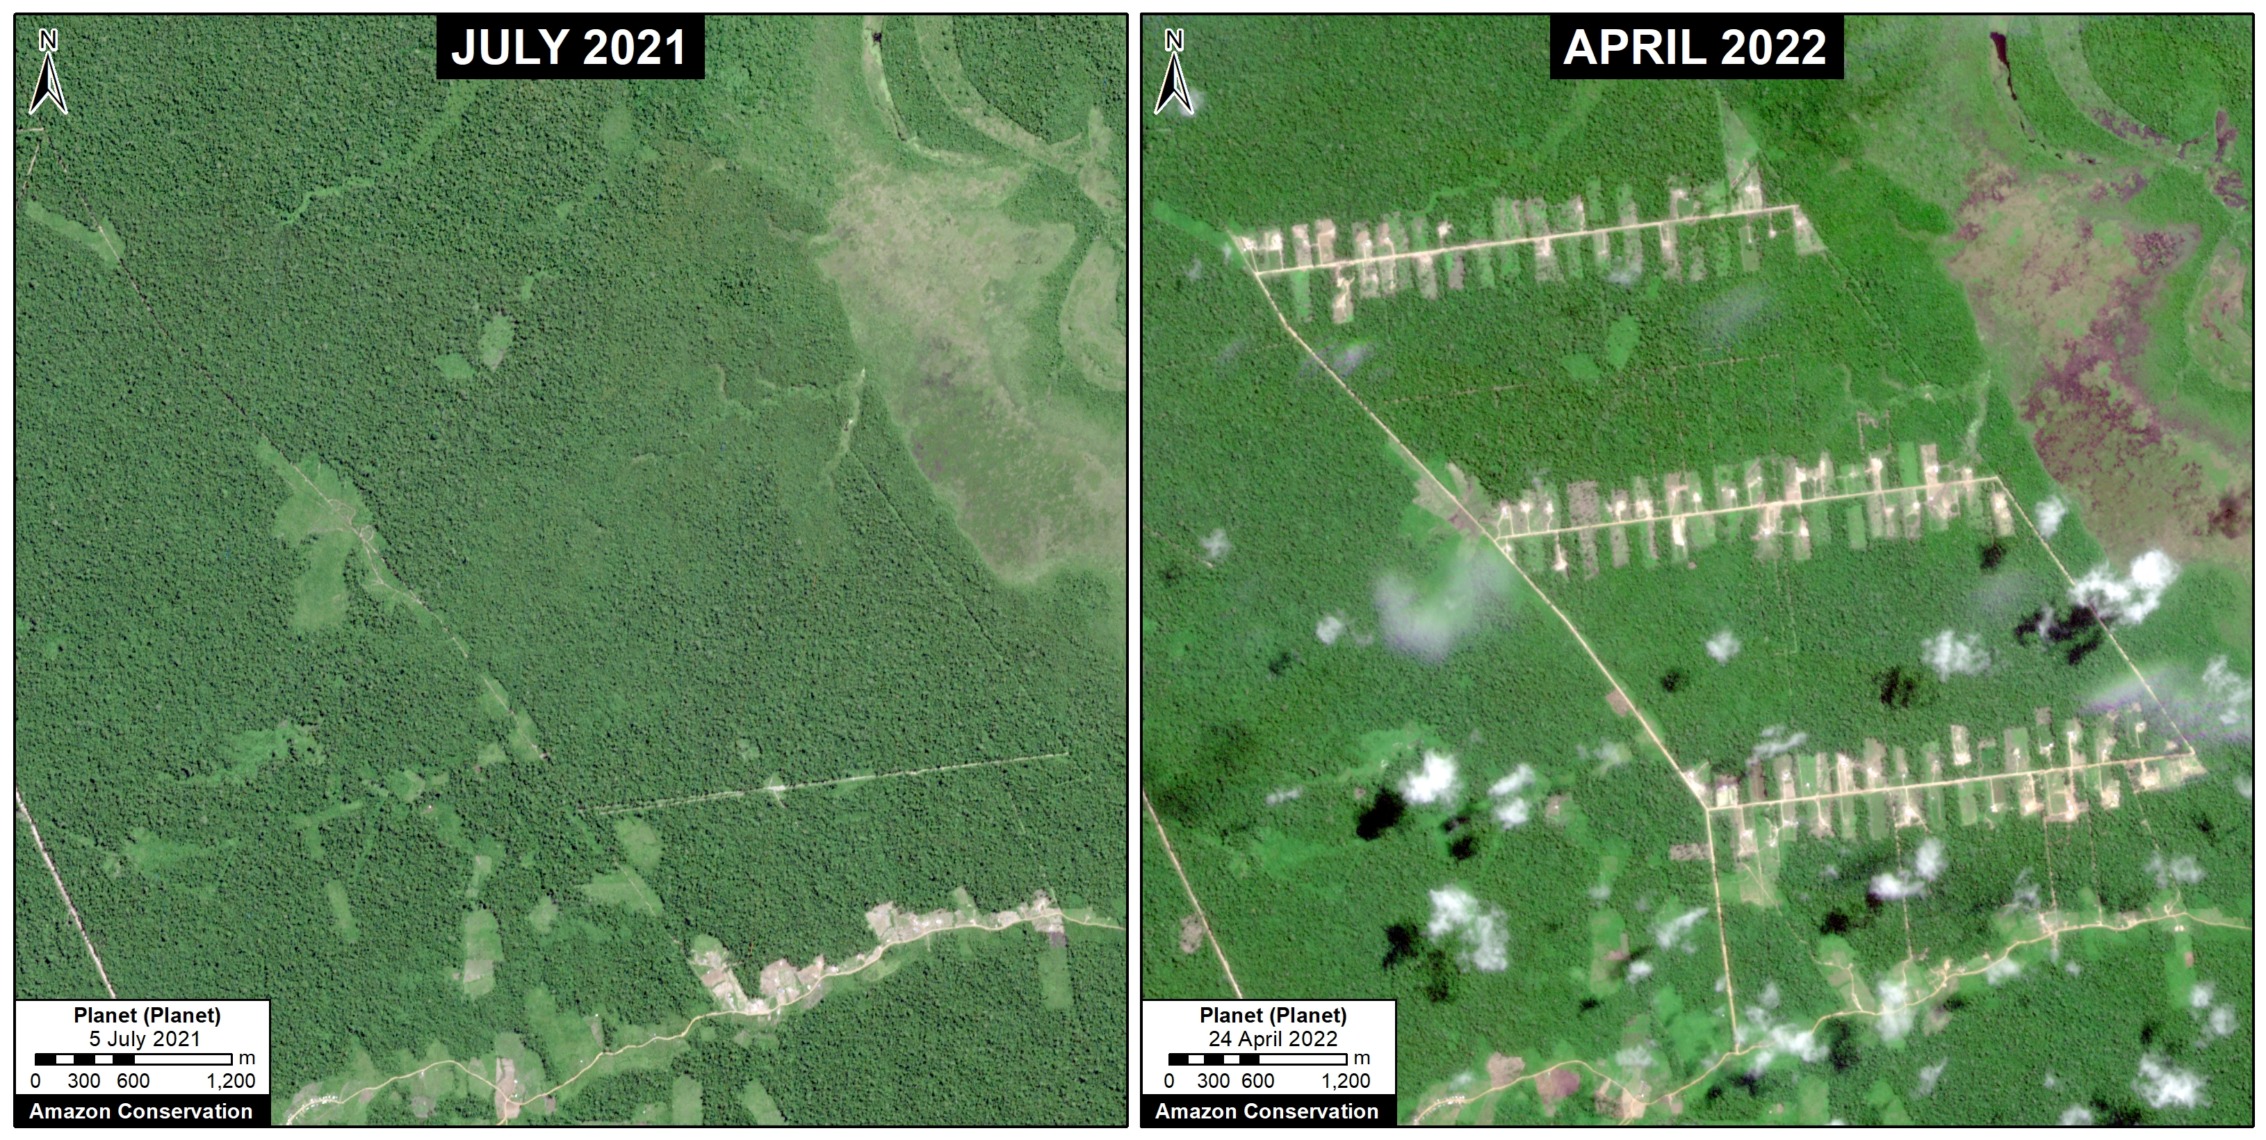
We highlight the rapid deforestation (365 hectares) for a new Mennonite colony in 2021, near the town of Padre Marquez (see MAAP #149).

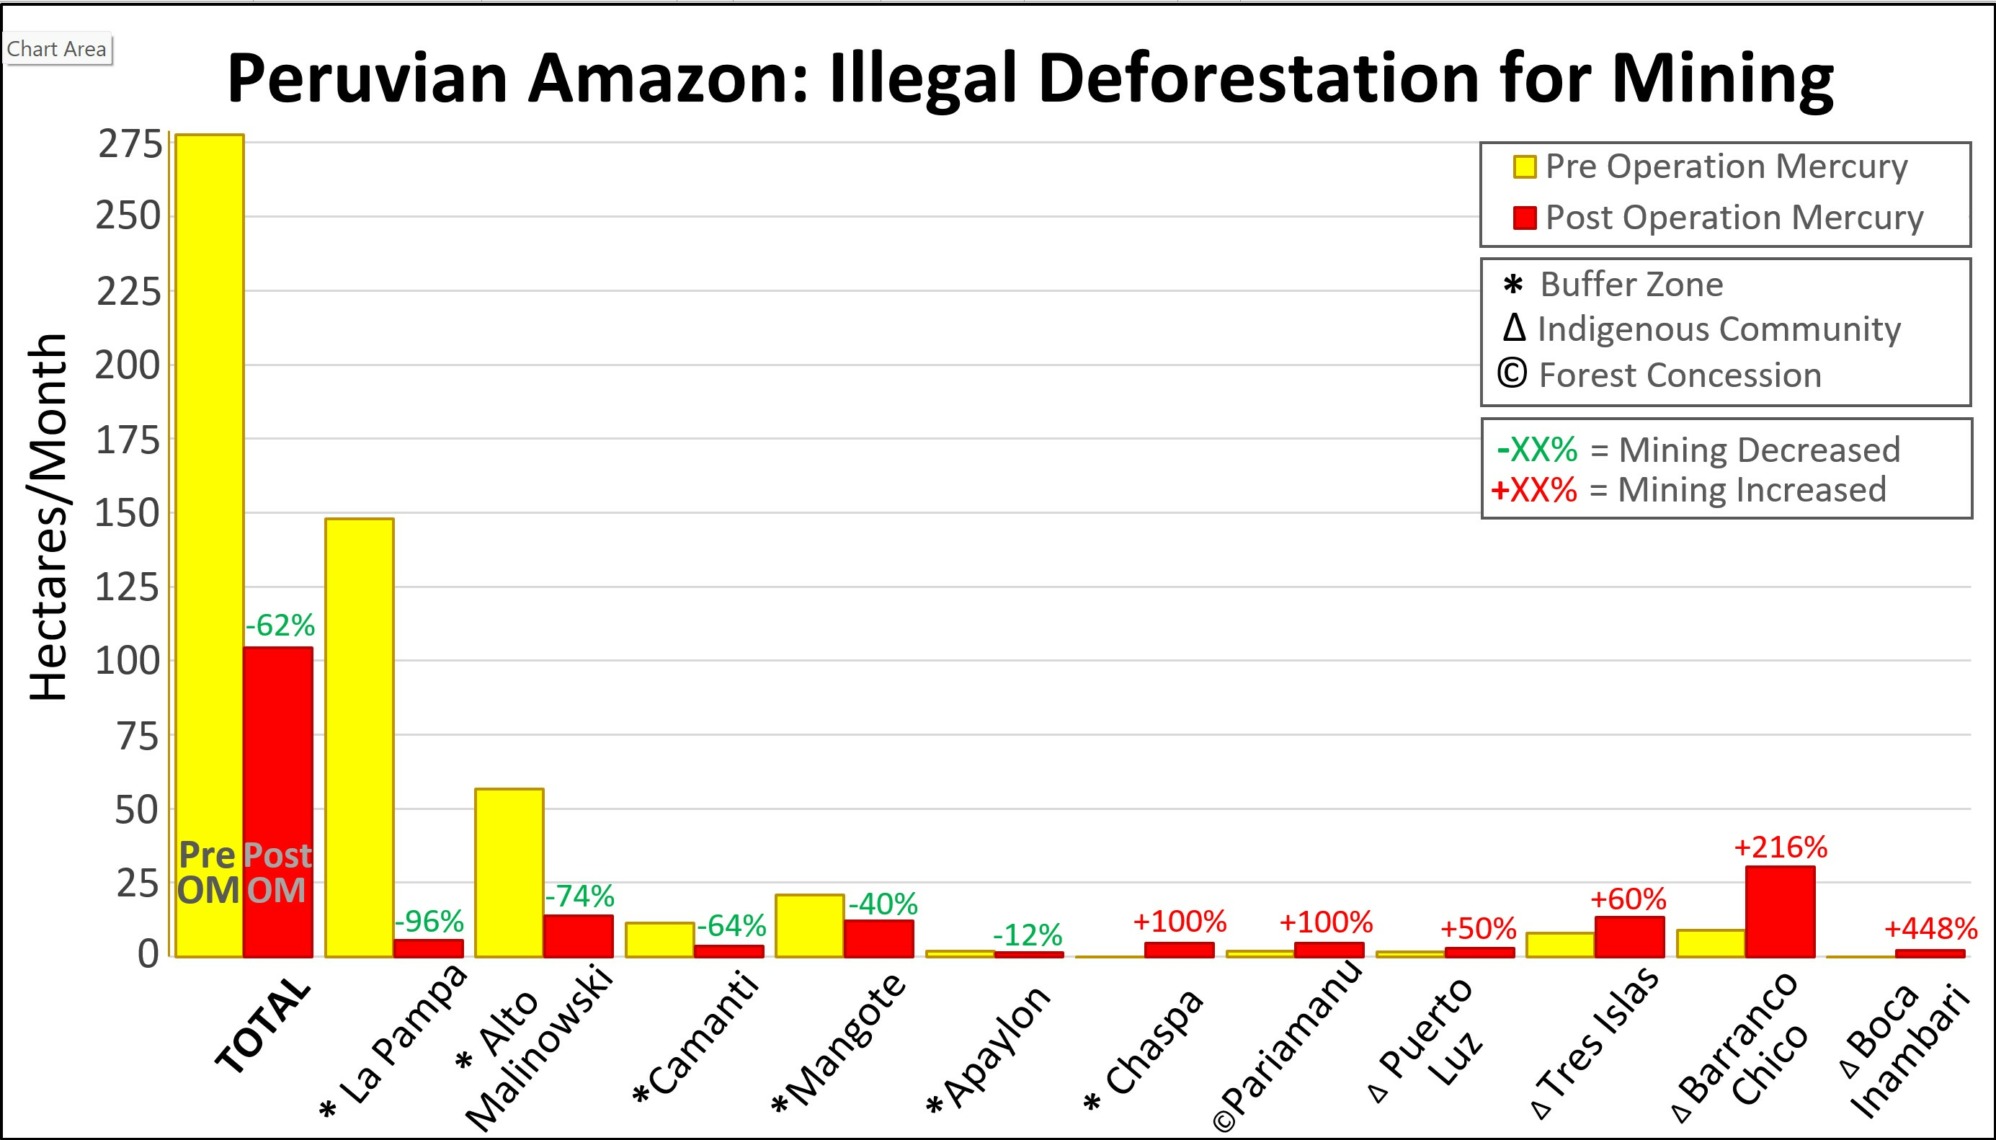
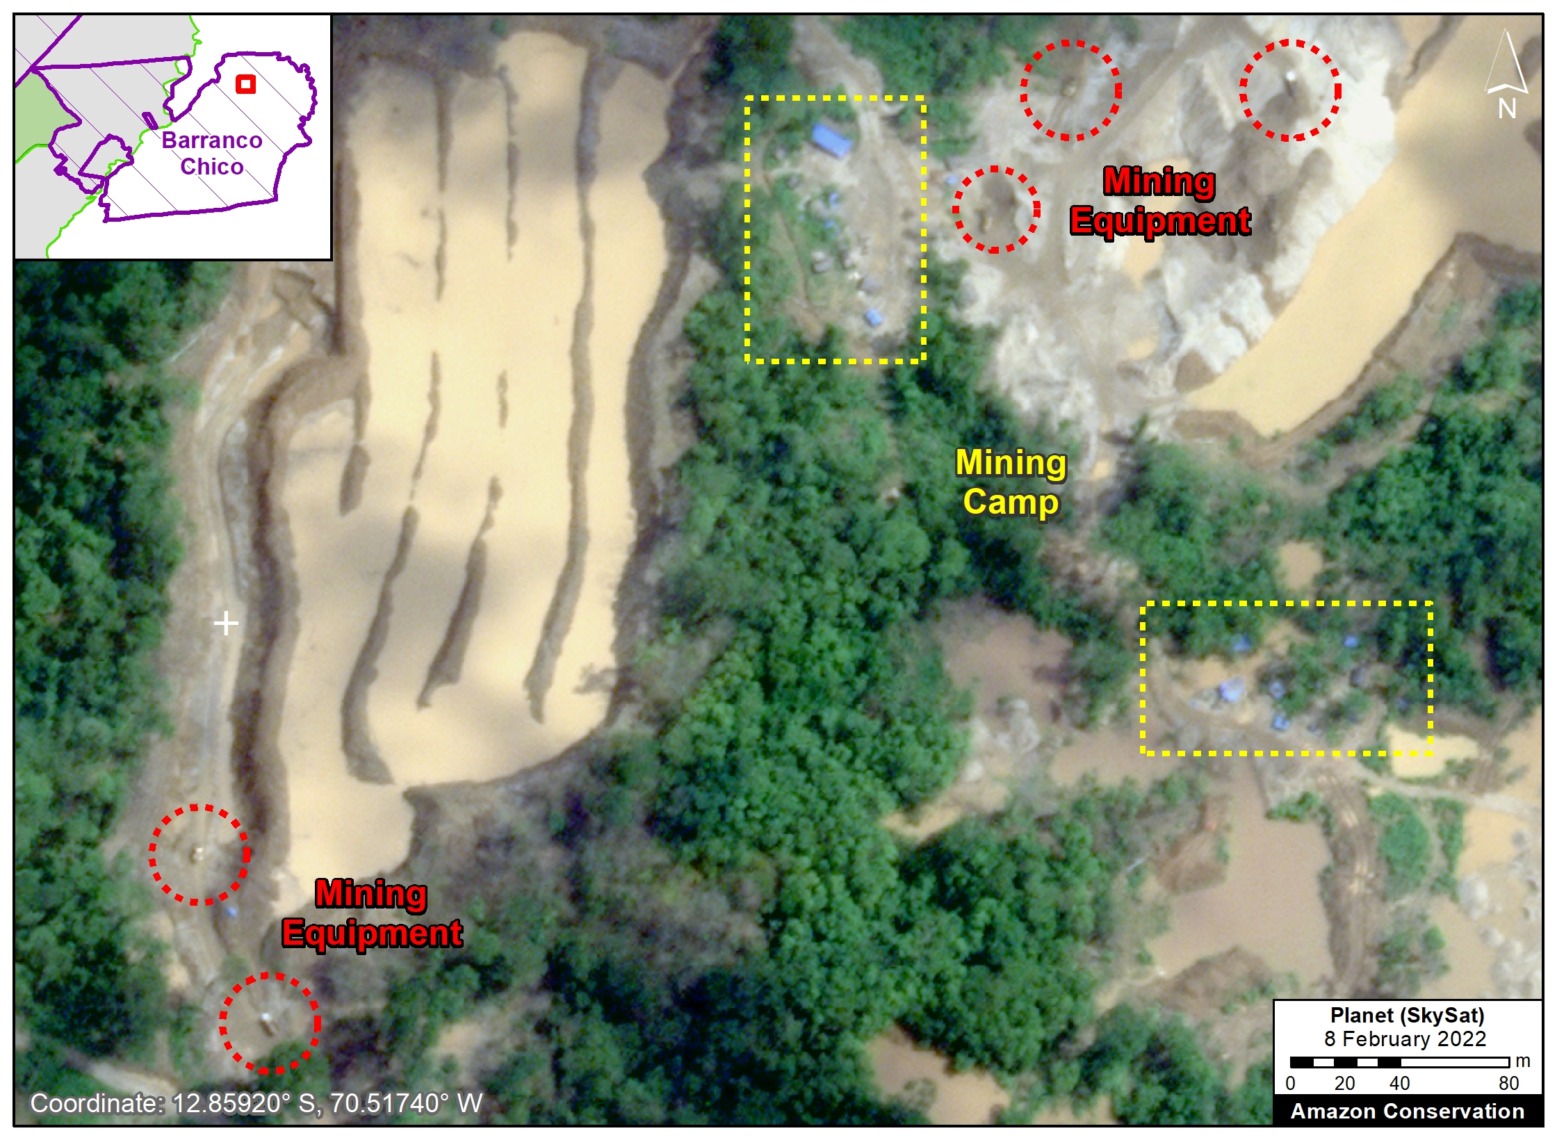
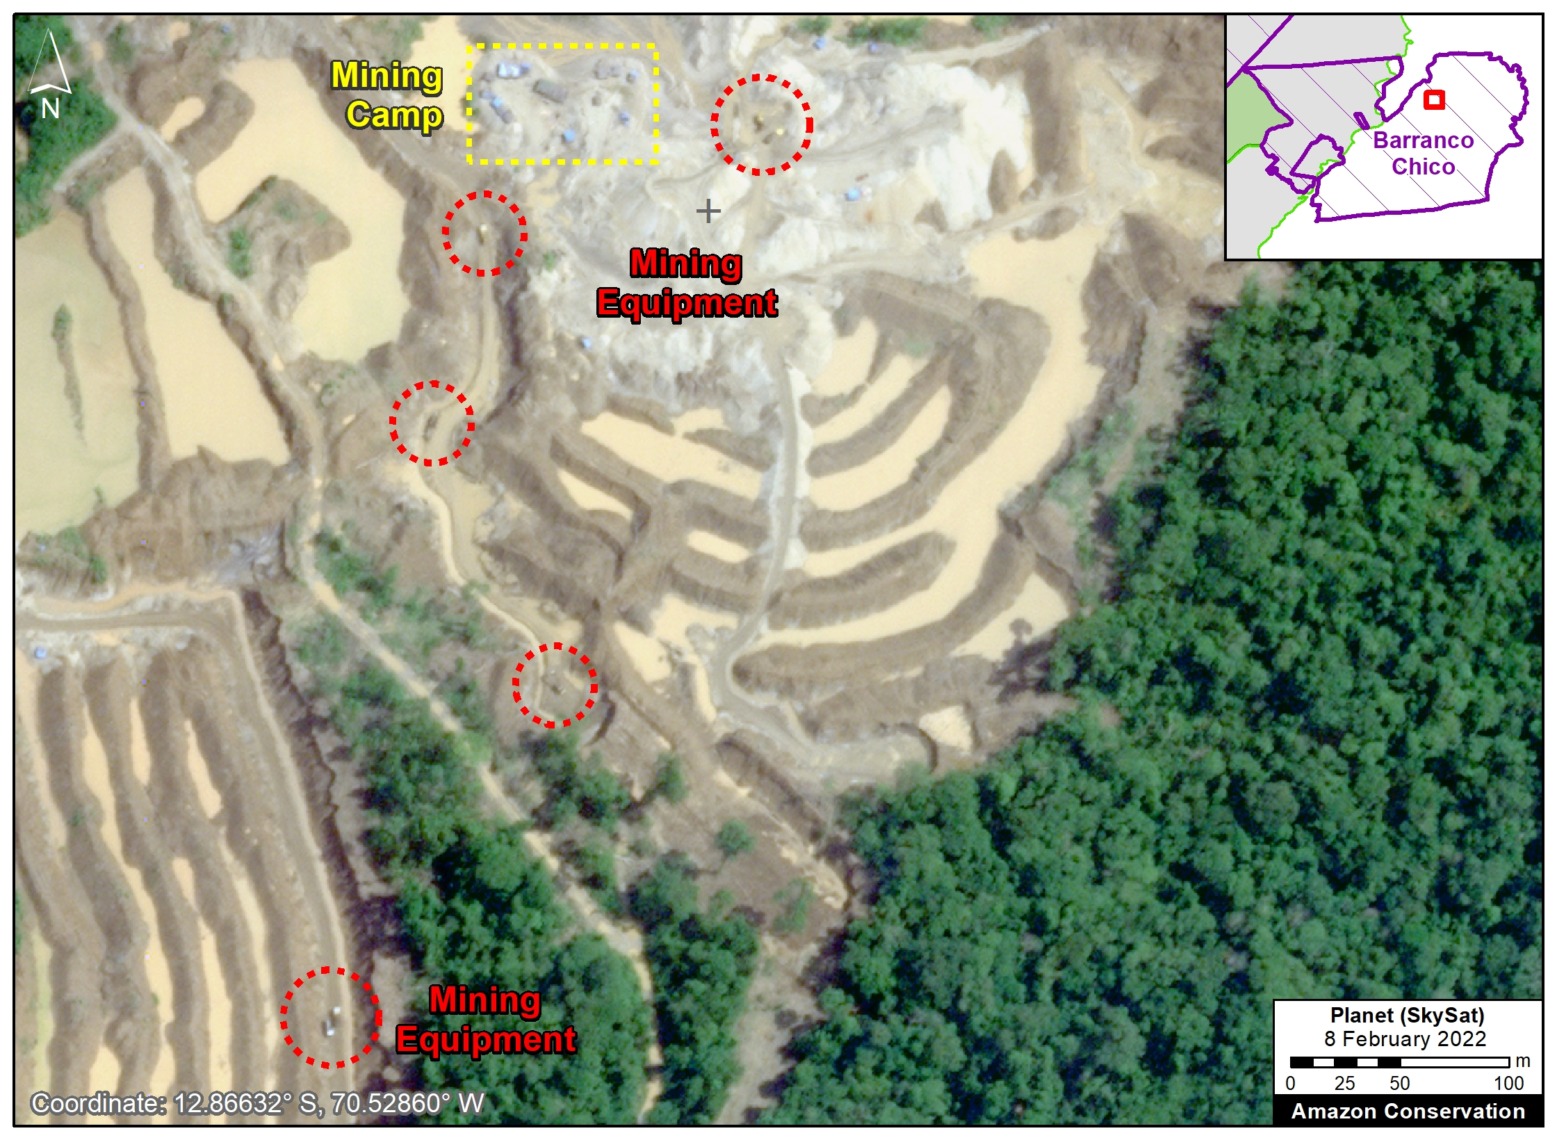
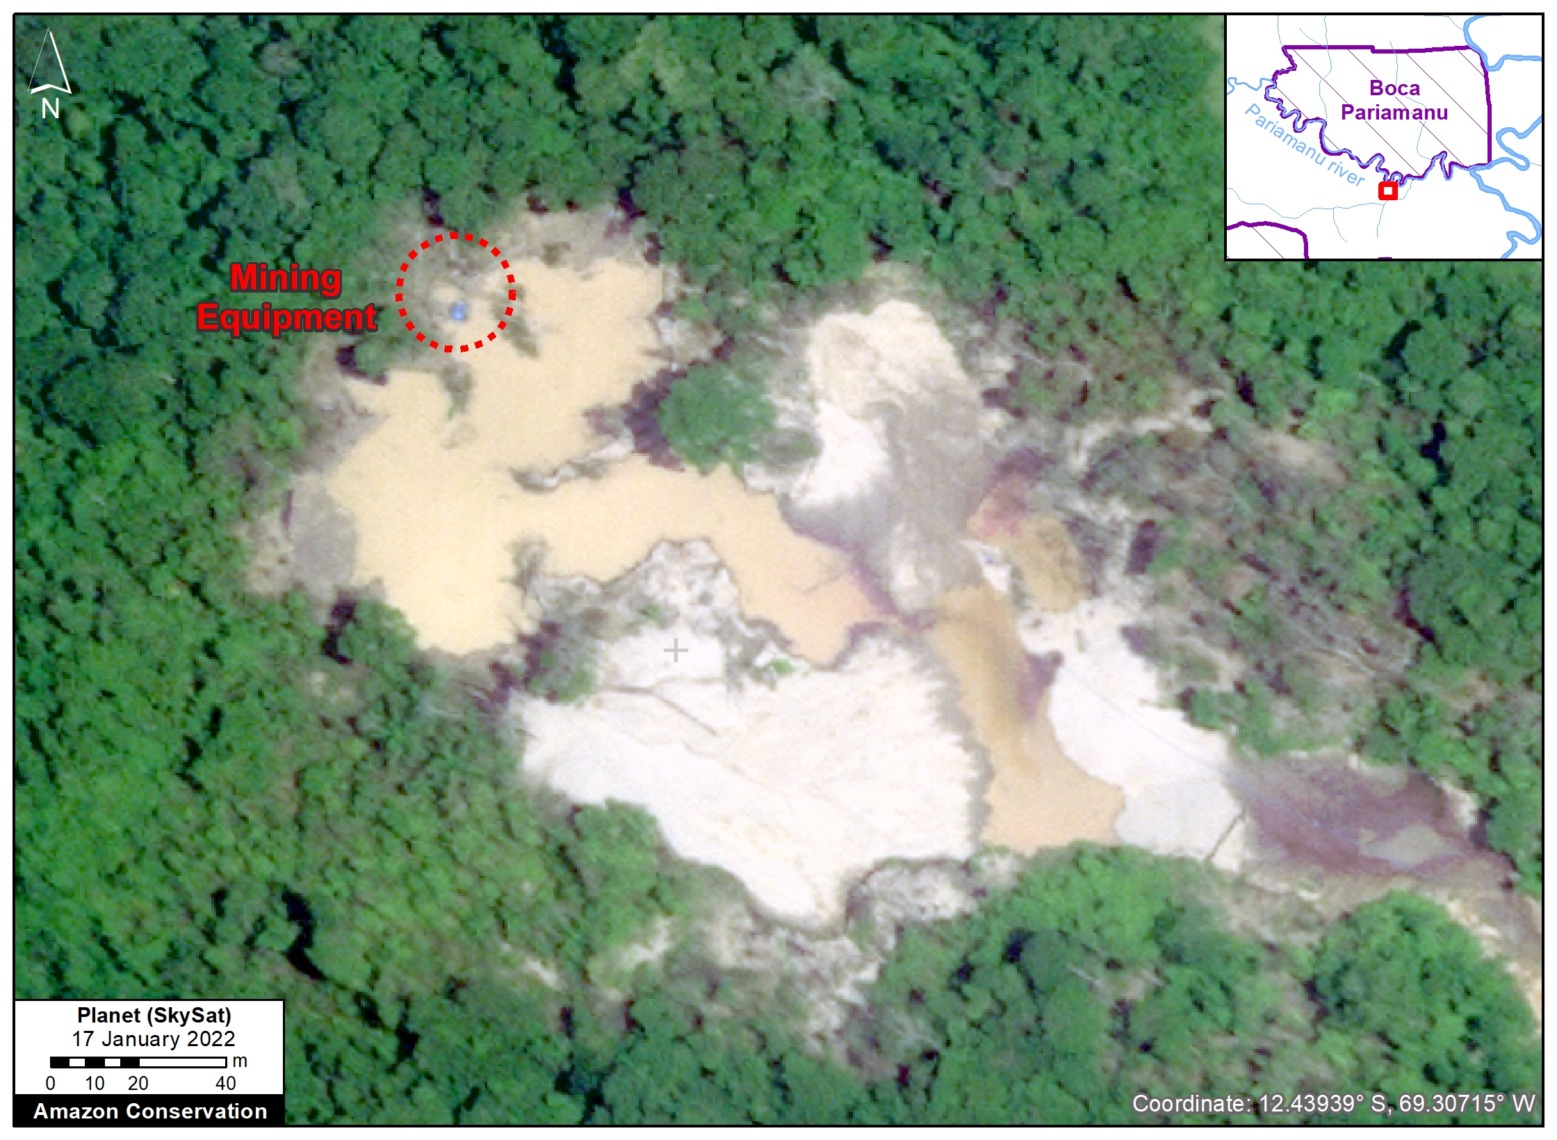
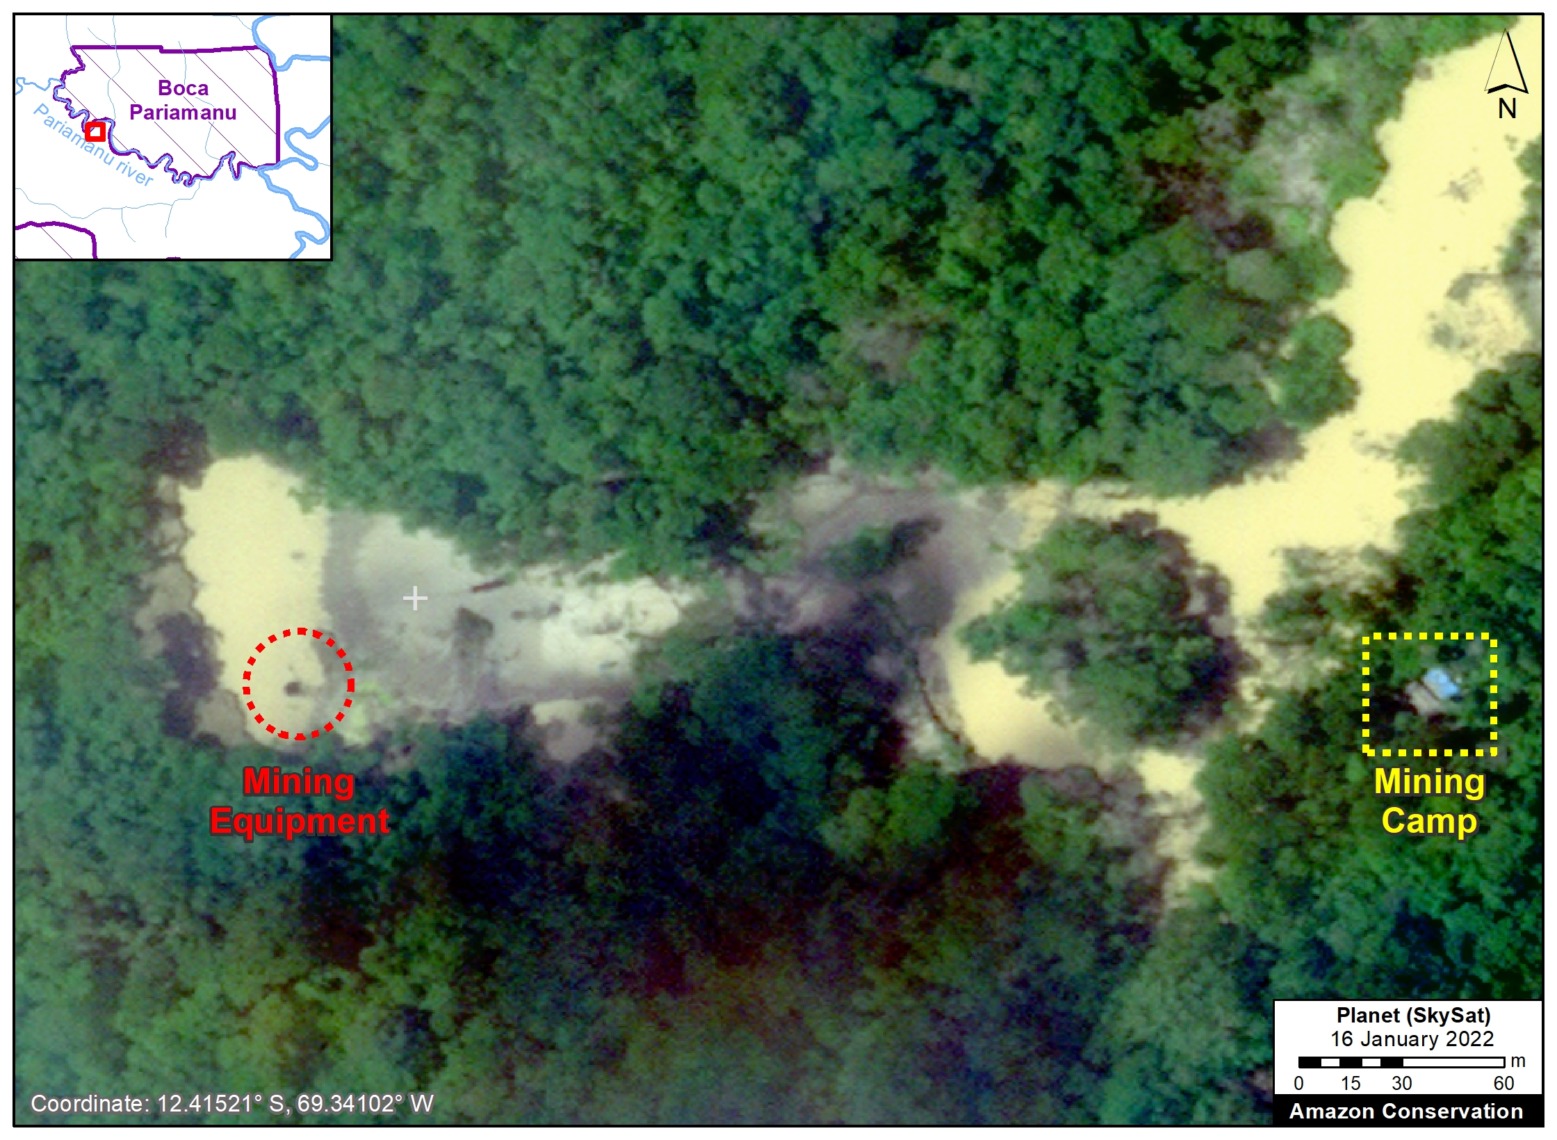
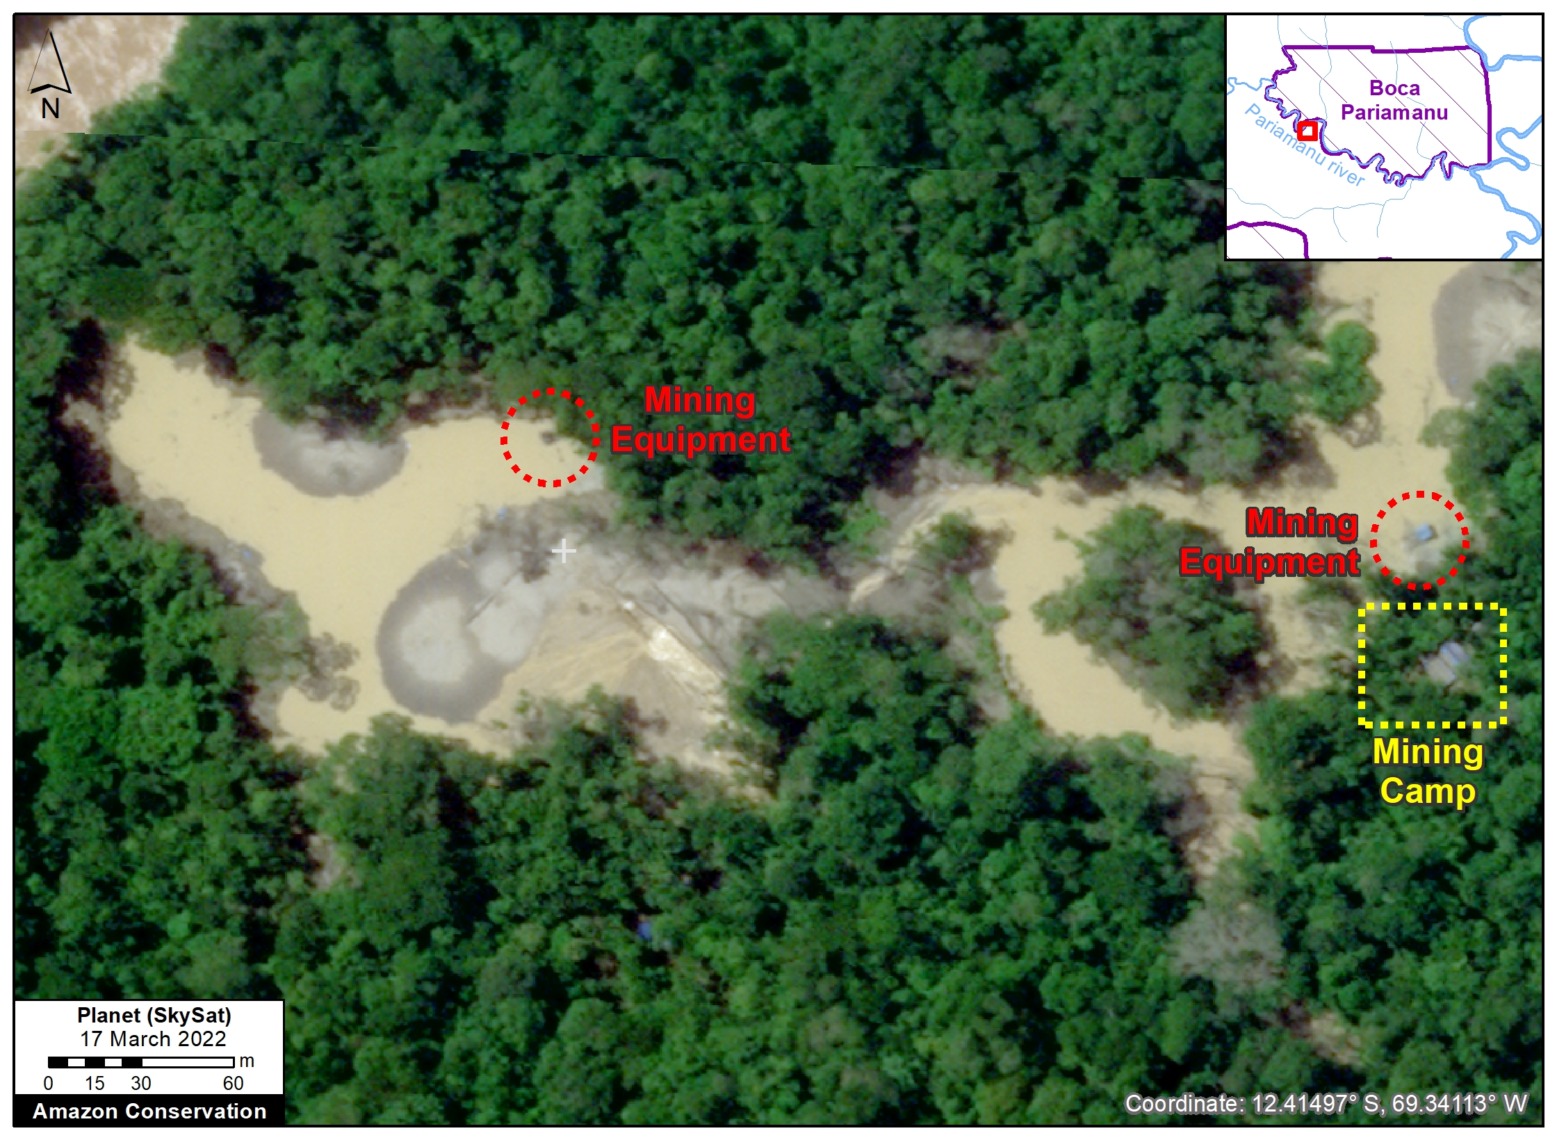
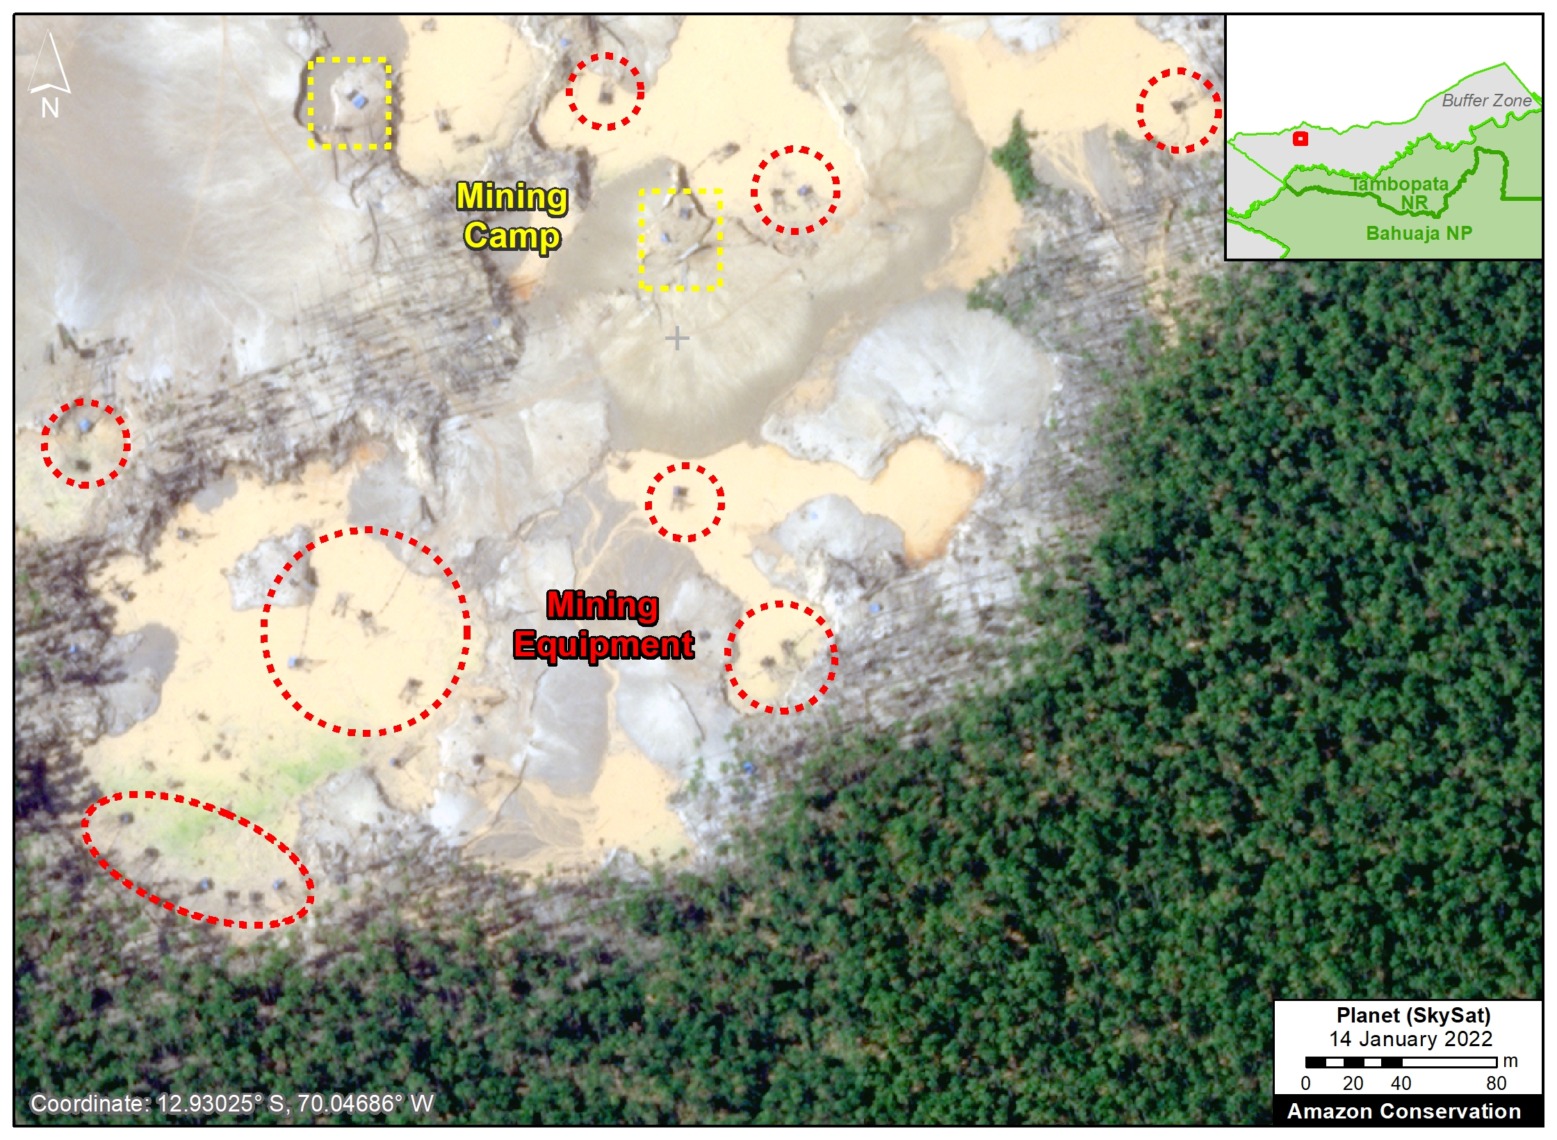
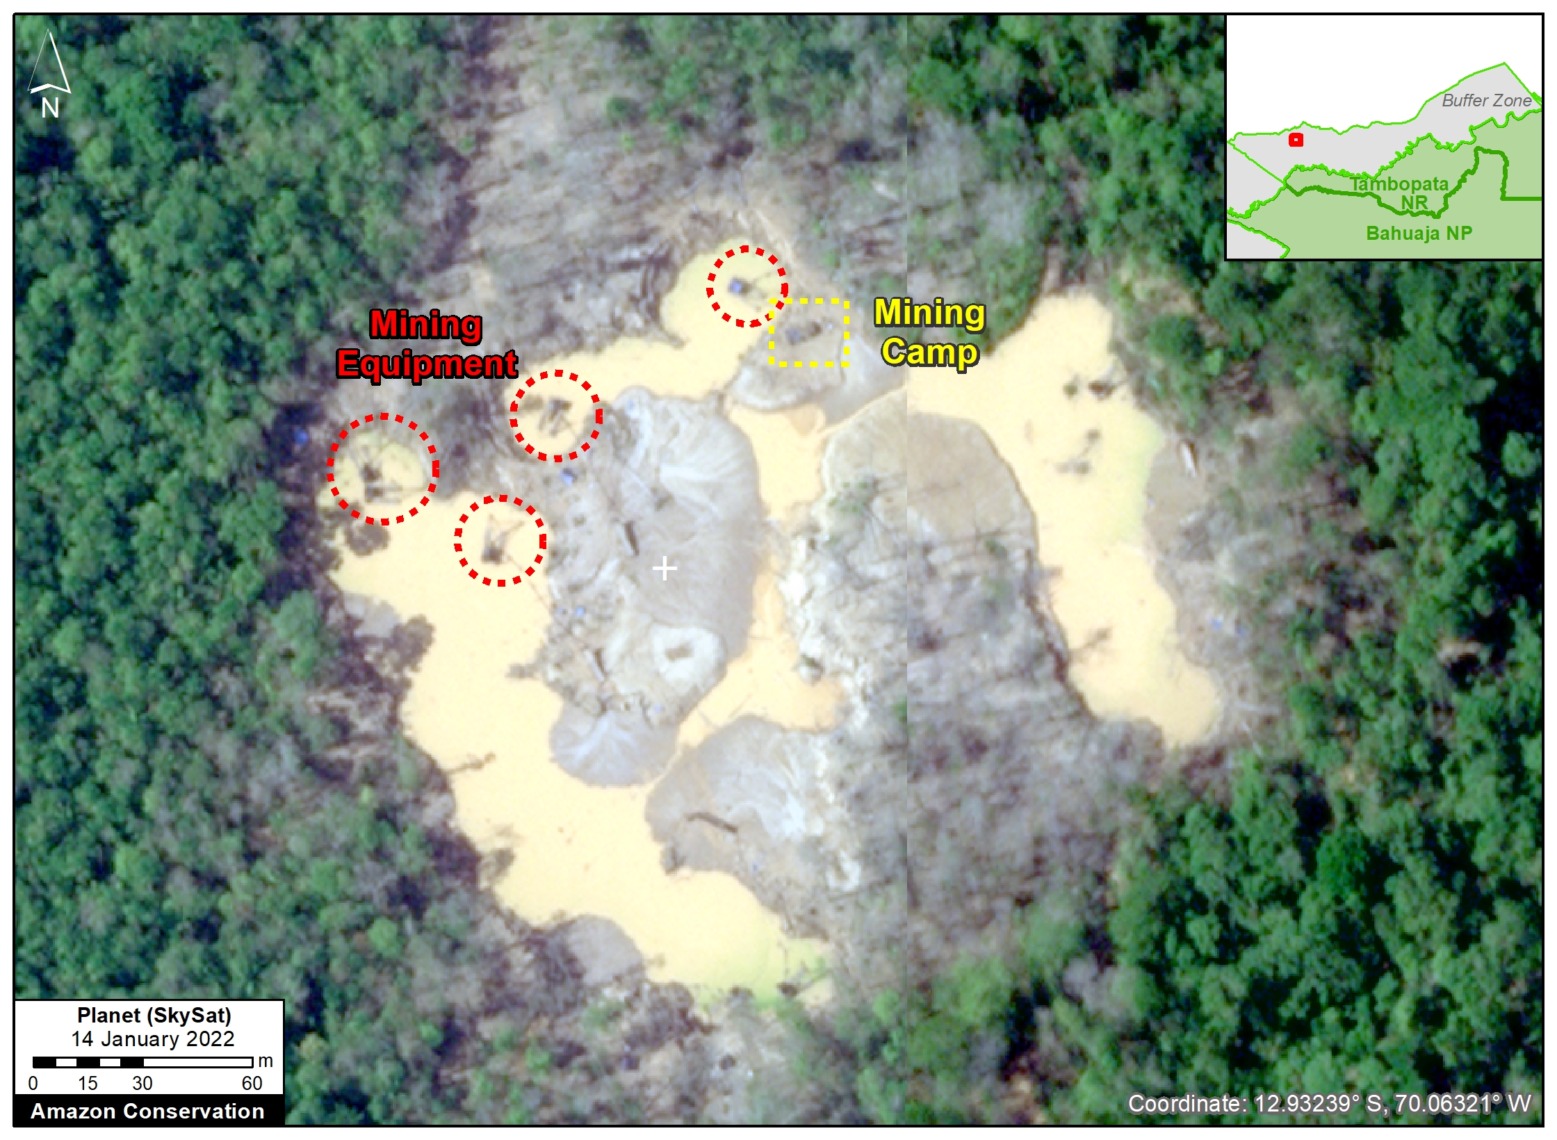
Also, note some additional hotspots in the south (Madre de Dios region), but these are largely from expanding agriculture instead of the historical driver of gold mining.

Indeed, gold mining deforestation has been greatly reduced due to government actions, but this illegal activity still threatens several key areas and indigenous territories (MAAP #154).
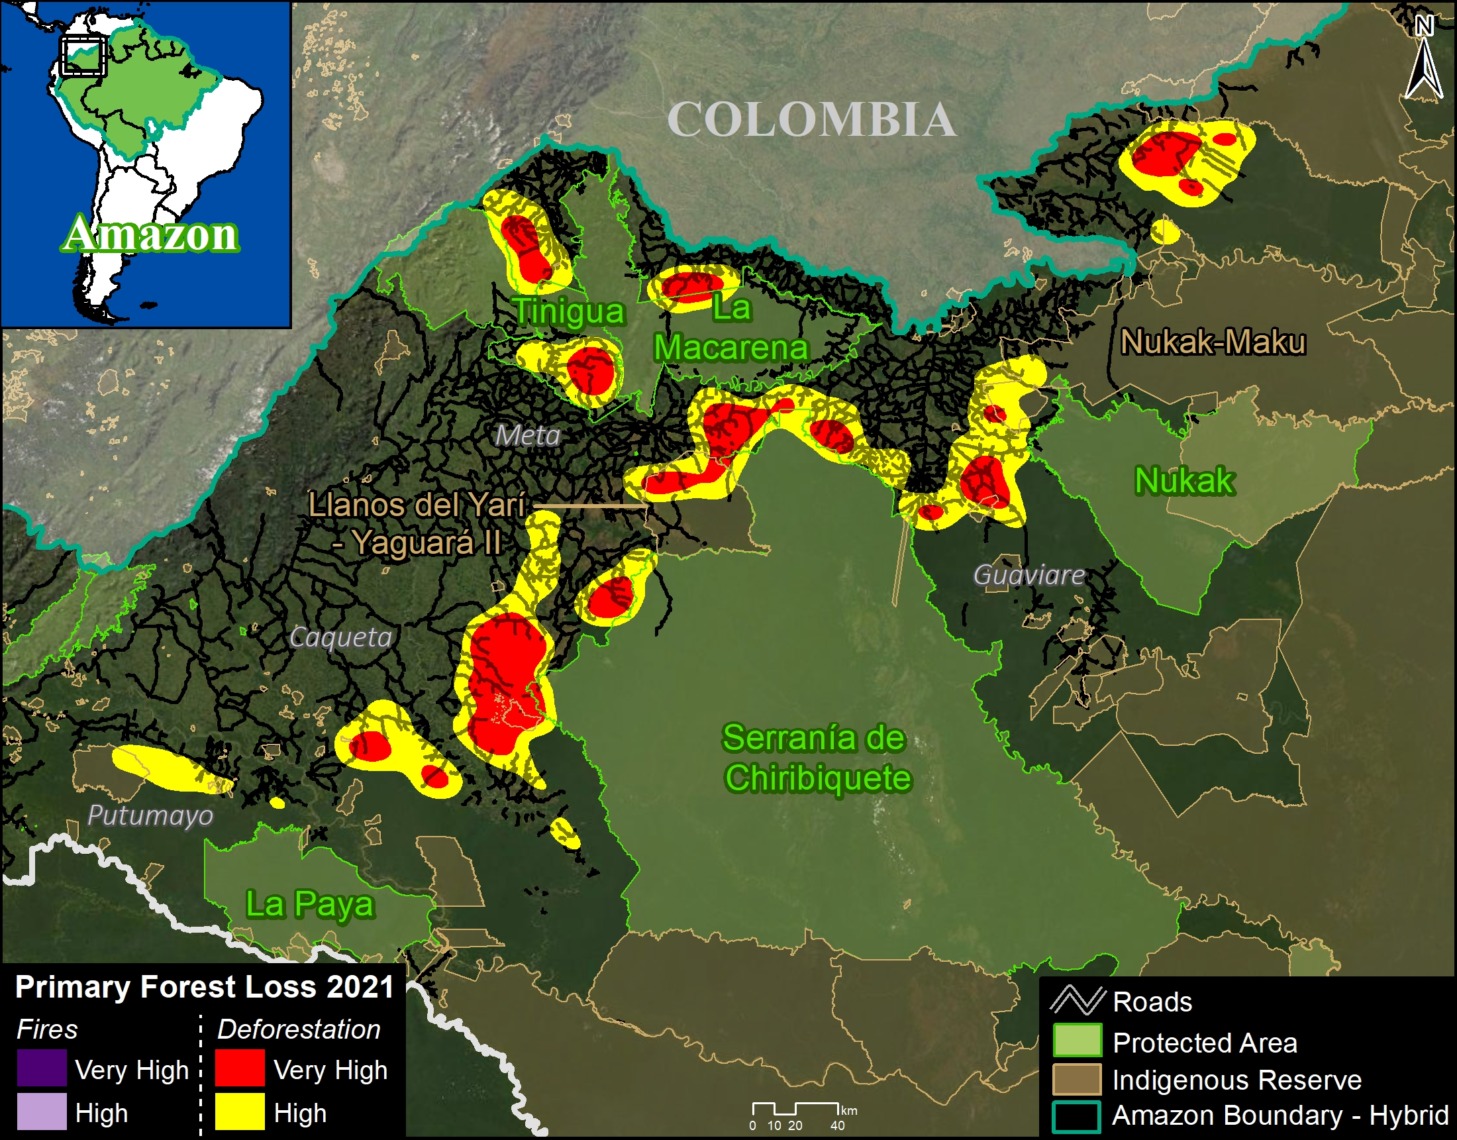


Rapid deforestation (365 hectares) for a new Mennonite colony in 2021, near the town of Padre Marquez. Data: Planet.

Colombia Base Map. Deforestation hotspots in northwest Colombian Amazon. Data: UMD/GLAD, ACA/MAAP, FCDS.

Colombian Amazon

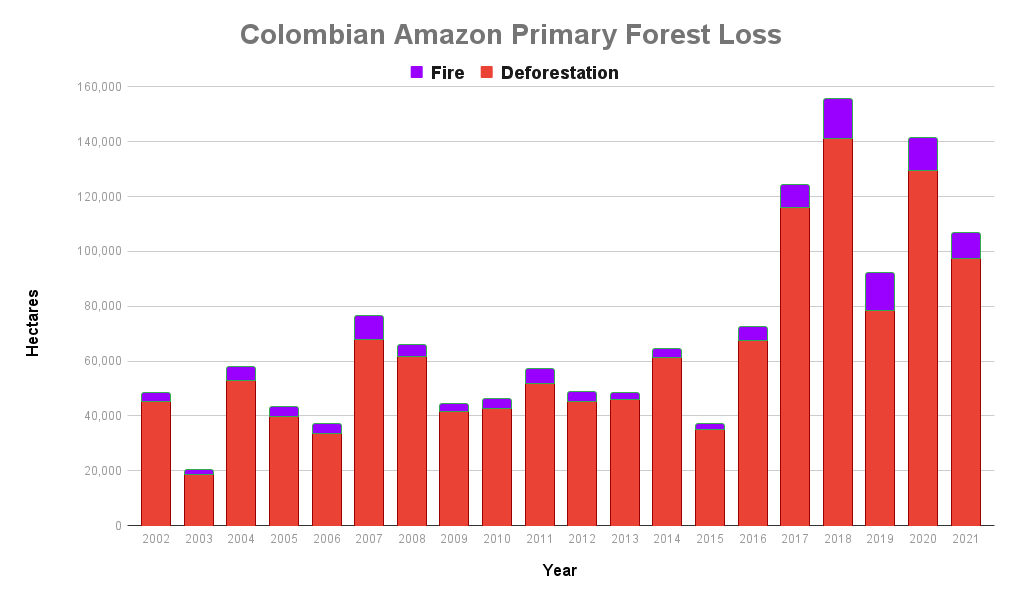
In 2021, the Colombian Amazon lost 98,000 hectares of primary forest to deforestation. Fires directly impacted an additional 9,000 hectares.

Deforestation and fire dropped from last year, but both were the fourth highest on record, following the trend of elevated forest loss and associated fires since the peace agreement in 2016.

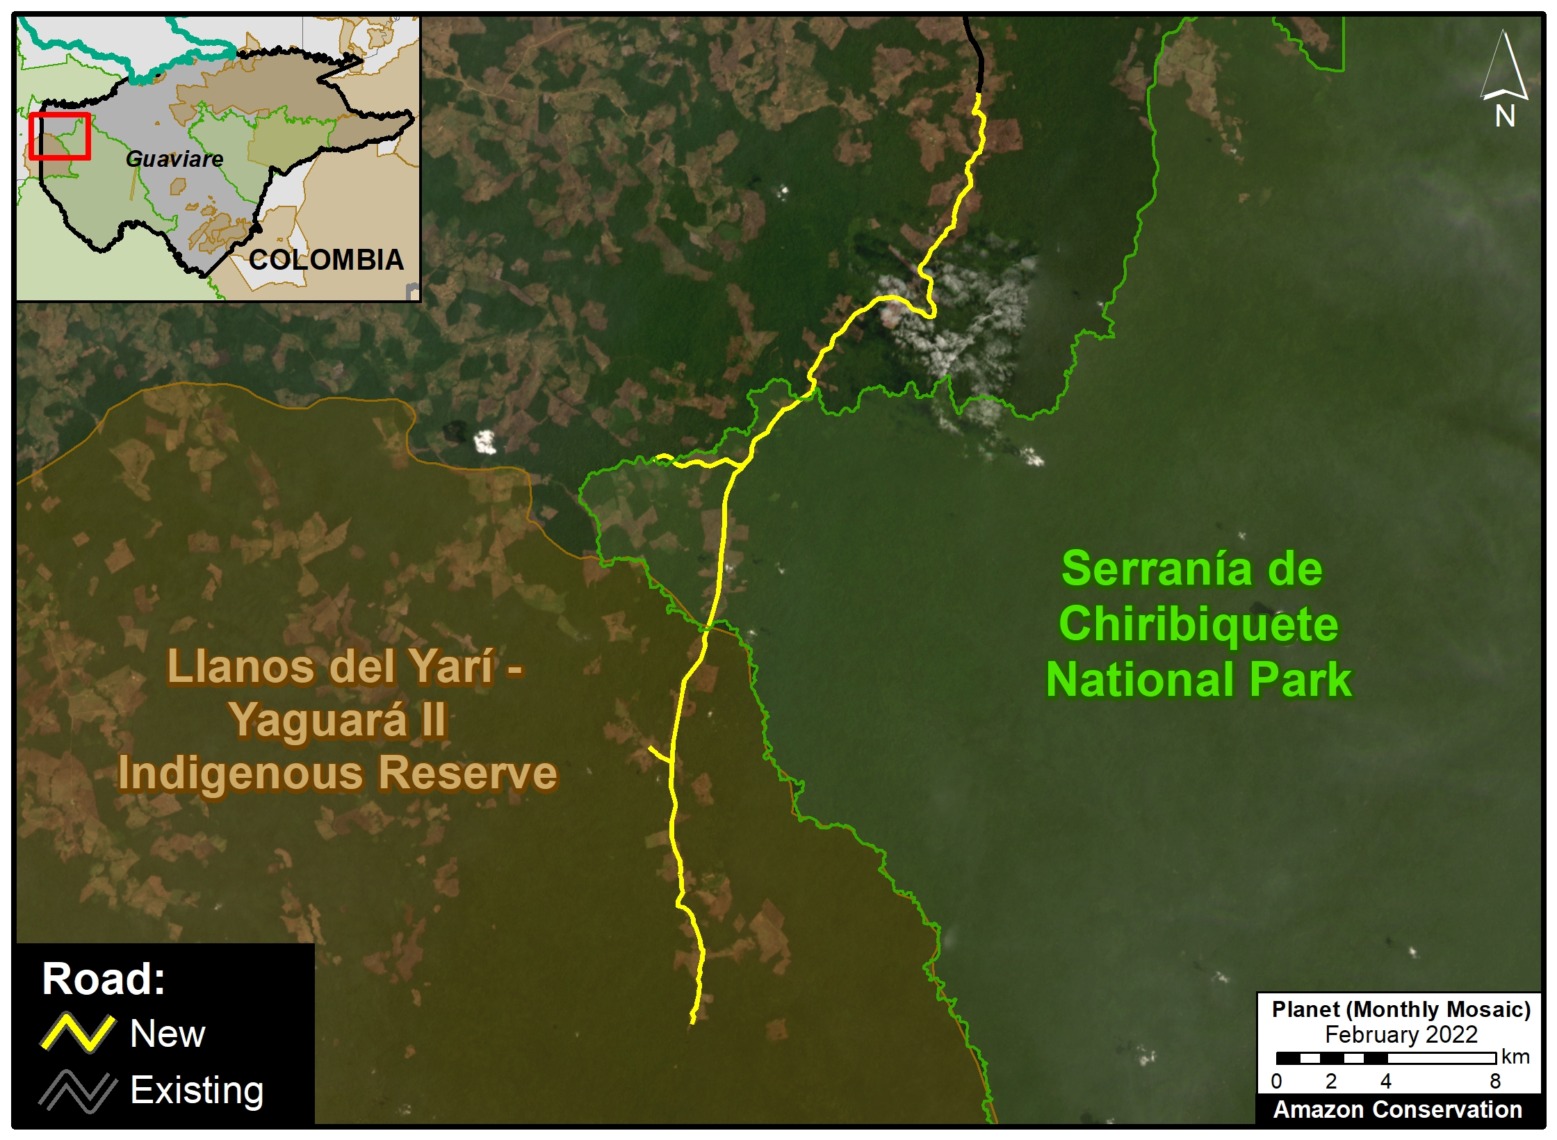
As described in previous reports (see MAAP #120), the Colombia Base Map shows there continues to be an “arc of deforestation” in the northwest Colombian Amazon (Caqueta, Meta, and Guaviare departments).

This arc impacts numerous Protected Areas (particularly Tinigua and Chiribiquete National Parks) and Indigenous Reserves (particularly Yari-Yaguara II and Nukak Maku).

The main drivers of deforestation in the Colombian Amazon are land grabbing, expansion of road networks, and cattle ranching.


Annex

Notes and Methodology

The analysis was based on 30-meter resolution annual forest loss data produced by the University of Maryland and also presented by Global Forest Watch. For the first time, this data set distinguished forest loss caused directly by fire (note that virtually all Amazon fires are human-caused). The remaining forest loss serves as a likely close proxy for deforestation, with the only remaining exception being natural events such as landslides, wind storms, and meandering rivers.

Importantly, we applied a filter to calculate only primary forest loss by intersecting the forest cover loss data with the additional dataset “primary humid tropical forests” as of 2001 (Turubanova et al 2018). For more details on this part of the methodology, see the Technical Blog from Global Forest Watch (Goldman and Weisse 2019).

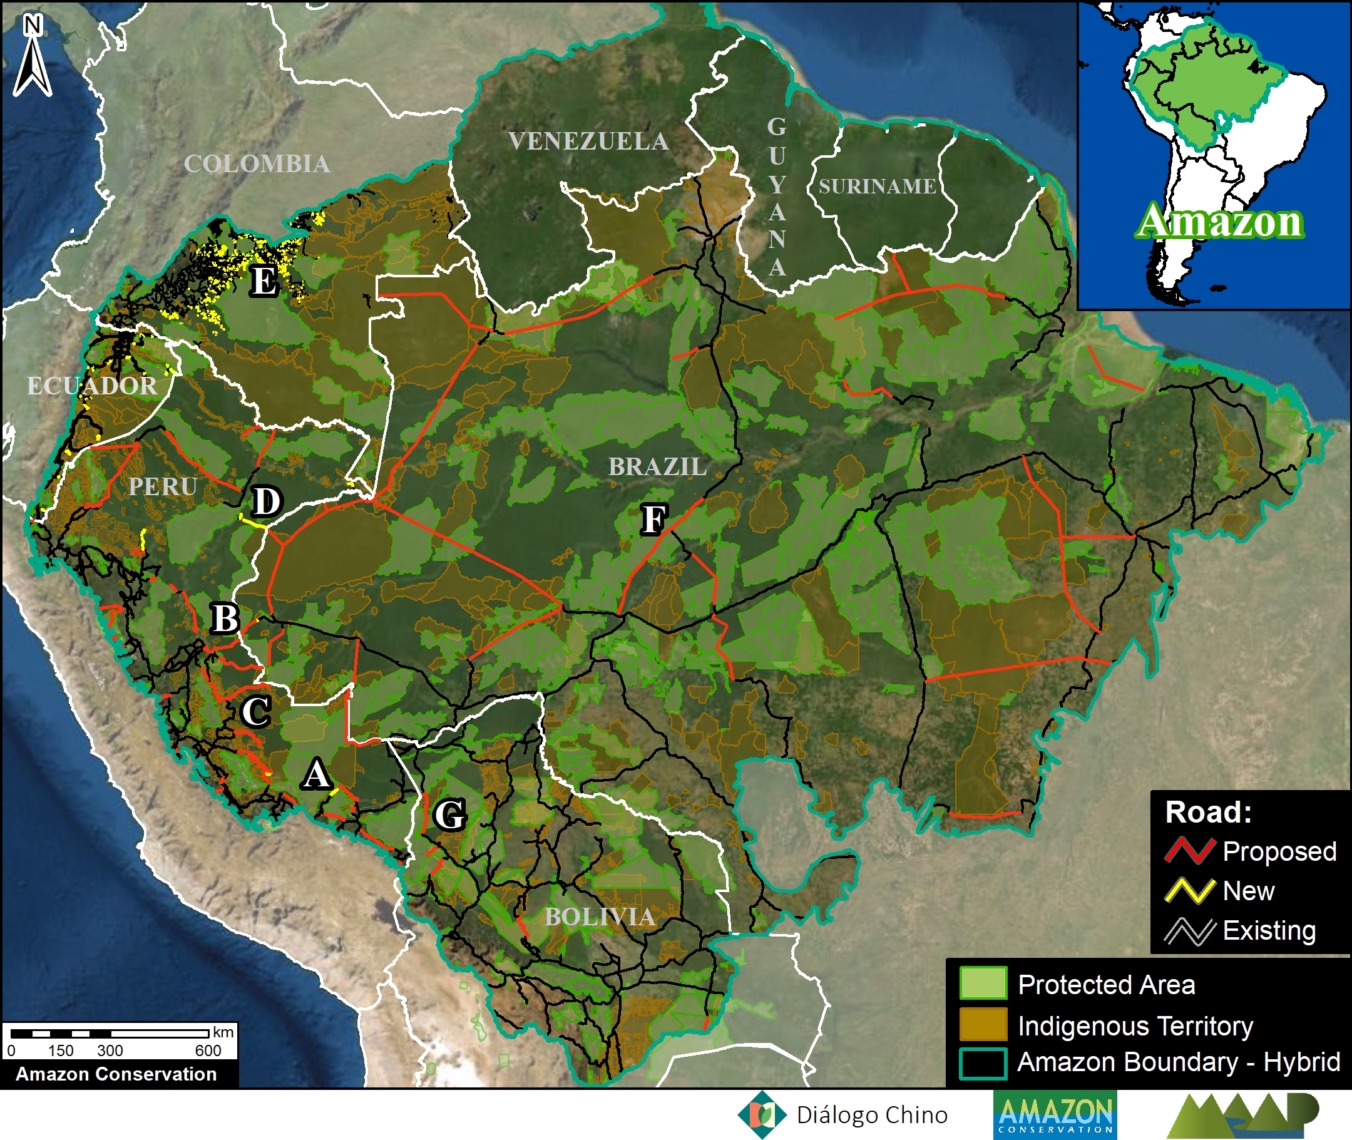
Our geographic range for the Amazon is a hybrid designed for maximum inclusion: biogeographic boundary (as defined by RAISG) for all countries, except for Bolivia where we use the watershed boundary.

To identify the deforestation hotspots, we conducted a kernel density estimate. This type of analysis calculates the magnitude per unit area of a particular phenomenon, in this case, forest cover loss. We conducted this analysis using the Kernel Density tool from the Spatial Analyst Tool Box of ArcGIS. We used the following parameters:

Search Radius: 15000 layer units (meters)
Kernel Density Function: Quartic kernel function
Cell Size in the map: 200 x 200 meters (4 hectares)
Everything else was left to the default setting.

For the Base Map, we used the following concentration percentages: Medium: >5%; High: >7%; Very High: >14%.

Acknowledgements

We thank A. Gómez (FCDS), R. Botero (FCDS)… for helpful comments on earlier drafts of the text and images.

This work was supported by NORAD (Norwegian Agency for Development Cooperation) and ICFC (International Conservation Fund of Canada).

Citation

Finer M, Mamani N (2022) Amazon Deforestation Hotspots 2021. MAAP: 153.

MAAP #157: New and Proposed Roads Across the Western Amazon

Amazon Roads Base Map 1.

Extensive deforestation, especially along the major road networks, has shockingly turned the eastern Brazilian Amazon into a net carbon source (see MAAP #144).

Fortunately, the greater Amazon across all nine countries is still a net carbon sink, largely thanks to the still intact core of the western Amazon.

The biggest long-term threat to this core Amazon is likely new roads, as they are a leading cause of opening up vast and previously remote areas to deforestation and degradation (Vilela et al 2020).

Here, we present an initial analysis of new and proposed roads across the western Amazon.

Although it’s difficult to predict what proposed projects are actually likely to eventually move forward, we do find the potential of a major road expansion across the core western Amazon (see Base Map 1).

Moreover, even by just focusing on the most advanced or actively discussed projects, we find the risk of major negative impact.

Below, we discuss our initial Amazon Roads Base Map and present a series of zooms showing the primary forest at risk if select road projects move forward.


Amazon Roads Base Map

Base Map 2 highlights new, proposed, and existing roads (red, yellow, and black lines, respectively), in relation to protected areas and indigenous territories for context. We focus on the still largely intact core of the western Amazon (Bolivia, Colombia, Ecuador, Peru, and western Brazil).

Most of the new roads were constructed in the past five years and were digitized from satellite imagery. Note that for some of these new roads, just initial construction of a rough road started and there is still potential for future impacts from road improvement and paving.

Most of the proposed roads were obtained from official government data sets. As noted above, it’s difficult to predict what proposed road projects are actually likely to eventually move forward. Nonetheless, it is clear to see there is the potential to greatly divide the remaining core western Amazon with the portfolio of proposed roads.

Amazon Roads Base Map 2. Data: ACA/MAAP, MTC, MINAM, MI, ABT, GAD Napo, FCDS, EcoCiencia, Diálogo Chino, CSF, RAISG, ACCA, ACEAA.

Zooms of High-Impact New & Proposed Roads

In this section, we focus on the currently most advanced or actively discussed projects (see Letters A-F on Amazon Roads Base Map). We highlight their potential impacts to vast sections of the core western Amazon protected areas and indigenous terrritories.

A. Boca Manu Road (Peru)

The new/proposed road that we refer to here as the Boca Manu road would serve as a new connection between Cusco and Madre de Dios regions. It is notable due its sensitive route between Manu National Park and Amarakaeri Communal Reserve to Boca Manu, and from there between Los Amigos Conservation Concession and Amarakaeri Communal Reserve to Boca Colorado. In addition to likely impacting these protected areas and the concession, the road also has the potential to impact the nearby territory of  indigenous groups in voluntary isolation. See this recent report from Diálogo Chino for more information about this road and its status and impacts.

Zoom A. Boca Manu Road. Data: MTC, MINAM, ACA, ACCA, RAISG.

B. Pucallpa – Cruzeiro do Sul Road (Peru – Brazil)

This proposed road would connect the Peruvian city of Pucallpa with the edge of the existing road network in western Brazil, near the town of Cruzeiro do Sul. Although the potential route has several options, it would sure cut through or near Sierra del Divisor National Park in Peru and the adjacent Serra do Divisor National Park in Brazil. This area is characterized by vast primary forests, thus creating a new binational route connecting the deforestation fronts in each country could obviously trigger significant impacts. See this recent report from Diálogo Chino for more information about this road and its status and impacts.

Zoom B. Pucallpa – Cruzeiro do Sul Road. Data: MTC, MINAM, ACA, CSF, Diálogo Chino, RAISG.

C. Yurua Road (Peru)

The new/proposed road that we refer to here as the Yurua road would connect the Peruvian towns of Nueva Italia on the Ucayali River and Breu on the Yurua River. This 200 km route was originally built as a logging road in the late 1980s to access remote timber areas in the central Peruvian Amazon, but had fallen into disrepair by the early 2000s. A recent MAAP analysis (see MAAP #146) found that between 2010 and 2021 much of the route had been rehabilitated, triggering elevated deforestation along the way. If this road were ever to be paved then impacts would likely continue to rise, including with native communities along the route. See MAAP #146 for more information about this road and its status and impacts.

Zoom C. Yurua Road. Data: MTC, MINAM, ACA, ACCA, RAISG.

D. Genaro Herrera – Angamos Road (Peru)

This new/proposed road would build off an old track through the vast forests connecting the northern Peruvian towns of Genaro Herrera and Angamos, in the region of Loreto. In 2021, clearing began along this route, advancing over 100 kilometers from both ends. If completed and paved, the final road project would impact protected areas on both sides (including the Matsés National Reserve to the south) and pose a major threat to indigenous people in voluntary isolation reportedly living to the north. See this recent report for more information about this road and its status and impacts.

Zoom D. Genaro Herrera – Angamos Road. Data: MTC, ACA, RAISG.

E. Cachicamo – Tunia Road (Chiribiquete National Park, Colombia)

Chiribiquete National Park, located in the heart of the Colombian Amazon, has been experiencing increasing deforestation pressures, partly due to expanding road networks around and even within the park. For example, the Cachicamo-Tunia Road, constructed in 2020, has triggered a new deforestation front in the northwest section of the park. Note this road is also impacting an adjacent Indigenous Reserve.

Zoom E. Cachicamo – Tunia Road. Data: FCDS, RAISG, ACA.

F.  Manaus – Porto Velho Road (BR-319, Brazil)

Arguably the most controversial project on the list: paving the middle section of BR-319 in the heart of the Brazilian Amazon. This nearly 900 km road connects the remote city of Manaus (otherwise only reachable by air or water) with the rest of Brazilian road network in Humaitá and Porto Velho to the south. It was built in the early 1970s but abandoned and impassable by the late 1980s, isolating Manaus once again. Since 2015, a basic maintenance program has made the road generally passable, but the main project remains: paving the 400 km middle section that passes through the core western Amazon. This paving would effectively connect Manaus with the existing highways in the south, and most likely trigger massive forest loss by extending the arc of deforestation northwards, including within and around the protected areas that surround the road. This road project has been the subject of numerous recent press reports, including investigative pieces by the Washington Post and El Pais.

Zoom F. Manaus – Porto Velho Road. Data: Ministério da Infraestrutura, ACA, RAISG.

G. Ixiamas – Chivé Road (Bolivia)

In recent years, Bolivia has been seeking financing for a 250 km road linking the current frontier town Ixiamas with the isolated town Chivé, located near the Peruvian border on the Madre de Dios river. This road would cross extensive tracts of primary Amazon forest and savannah in the north of the La Paz department, including the newly created Bajo Madidi Municipal Conservation Area and the Tacana II indigenous territory.

Zoom G. Ixiamas – Chivé Road. Data: ABT, ACEAA, ACA, RAISG.

Methodology

Our analysis and maps focus on the western Amazon (Bolivia, Colombia, Ecuador, Peru, and western Brazil).

Most of the new roads were constructed in the past five years and were digitized from satellite imagery. Note that for some of these new roads, just initial rehabilitation/improvement of a rough road started and there is still potential for future impacts from paving.

Most of the proposed roads were obtained from official government data sets (and complemented by civil society reports).

We credit the following data sources: Ministerio de Transportes y Comunicaciones (Peru), Geobosques/MINAM (Peru), Ministério da Infraestrutura (Brazil),  Autoridad de Fiscalización y Control Social de Bosques y Tierra – ABT (Bolivia), Gobierno Autonomo Descentralizado Provincial de Napo (Ecuador), Fundación para la Conservación y el Desarrollo Sostenible – FCDS (Colombia), Fundación EcoCiencia (Ecuador), Diálogo Chino, Conservation Strategy Fund, RAISG, Conservación Amazónica – ACCA (Peru), Conservación Amazónica – ACEAA (Bolivia), and Amazon Conservation (digitalization of some new and proposed roads).

Reference:
Vilela et al (2020) A better Amazon road network for people and the environment. PNAS 17 (13) 7095-7102.

Acknowledgments

We especially thank Diálogo Chino for their support of this report. We also thank E. Ortiz, S. Novoa, S. Villacis, D. Larrea, M. Terán, and D. Larrea for helpful comments on earlier drafts of the text and images.

Citation

Finer M, Mamani N (2022) New and Proposed Roads Across the Western Amazon. MAAP: 157.

MAAP #154: Illegal Gold Mining in the Peruvian Amazon – 2022 update

Base Map. Locations of illegal gold mining sites in the southern Peruvian Amazon analyzed in this report. Click to enlarge. Data: MAAP/ACA.

Illegal gold mining reached crisis levels in the southern Peruvian Amazon in 2017 and 2018, clearing over 1,200 hectares (3,000 acres) in the most critically impacted area, known as La Pampa (located in the buffer zone of Tambopata National Reserve, region of Madre de Dios).

In early 2019, the Peruvian government launched Operation Mercury, an unprecedented long-term crackdown on illegal mining, with an initial focus in La Pampa.

Here, we present an updated analysis of illegal gold mining in the Peruvian Amazon. Specifically, we compare rates of deforestation before vs after Operation Mercury at the most important illegal mining sites (see Base Map).

We found that illegal gold mining deforestation decreased 62% overall across all sites following Operation Mercury, including a remarkable 96% decrease in La Pampa.

However, illegal mining deforestation has increased at several key sites, most notably indigenous territories.


Results: Base Map

The Results Map below illustrates the major findings. Red indicates gold mining deforestation post-Operation Mercury (3,688 hectares between March 2019 and December 2021), while yellow indicates the pre Operation baseline (6,933 hectares between January 2017 and February 2019).

Note that deforestation in the most critical illegal mining front, La Pampa (Tambopata National Reserve buffer zone), has essentially been stopped. However, mining continues in other key areas such as Mangote, Pariamanu, Camanti (Amarakaeri Commuanl Reserve buffer zone), Chaspa (Bahuaja Sonene National Park buffer zone), leading to new government interventions in each of these areas.

Regarding Native Communities, the most impacted after Operation Mercury include Barranco Chico (1,098 hectares), Tres Islas (503 hectares), Puerto Luz (136 hectares), and Kotsimba (inside the Alto Malinowski area; 518 hectares). The government has recently conducted two raids in Barranco Chico, indicating they are aware of this situation.

Results Map. Major gold mining fronts in the southern Peruvian Amazon before (yellow) and after (red) Operation Mercury. Data: MAAP. Click to enlarge.

Results: Graph

The Results Graph below further details the major findings:

  • Overall, gold mining deforestation decreased 62% across all sites following Operation Mercury (from 279 to 105 hectares per month).
    h
  • Most notably, mining deforestation decreased 96% in La Pampa, the most critically impacted area (from 149 to 6.5 hectares per month).
    j
  • Mining deforestation decreased 81% in the other sites within the buffer zones of key protected area (Tambopata National Reserve, Bahuaja Sonene National Park, and Amarakaeri Communal Reserve).
    j
  • Mining deforestation increased 100% in two new critical fronts, Pariamanu and Chaspa.
    g
  • Mining deforestation increased 128% in the four Native Communities (Barranco Chico, Boca Inambari, Tres Islas, and Puerto Luz).
Results Graph. Data: ACA/MAAP.

Very High Resolution Satellite Imagery (Skysat)

Below, we show a striking series of recent (January to March 2022) and very high resolution (0.5 meter Skysat) images of three primary current illegal mining sites: Barranco Chico, Pariamanu and Mangote. These images reveal machinery and infrastructure (indicated by red circles) as well as camps (indicated by yellow squares) directly associated with illegal gold mining activity.

Native Community Barranco Chico

Native Community Barranco Chico 1. Data: MAAP/ACA, Skysat/Planet.
Native Community Barranco Chico 2. Data: MAAP/ACA, Skysat/Planet.

Pariamanu

Pariamanu 1. Data: MAAP/ACA, Skysat/Planet.
Pariamanu 2. Data: MAAP/ACA, Skysat/Planet.
Pariamanu 3. Data: MAAP/ACA, Skysat/Planet.

Mangote

Mangote 1. Data: MAAP/ACA, Skysat/Planet.


Mangote 2. Data: MAAP/ACA, Skysat/Planet.


Methodology

We analyzed high-resolution imagery (3 meters) from the satellite company Planet obtained from their interface Planet Explorer. Based on this imagery, we digitized gold mining deforestation across ten major sites: La Pampa, Mangote, Alto Malinowski, Camanti, Pariamanu/Pariamarca, Apaylon, Chaspa, Barranco Chico, and Boca Inambari. These were identified as the major active illegal gold mining deforestation fronts based on analysis of automated forest loss alerts generated by University of Maryland (GLAD alerts) and the Peruvian government (Geobosques) and additional land use layers. The area referred to as the “mining corridor” is not included in the analysis because the issue of legality is more complex.

Across these sites, we identified, digitized, and analyzed all visible gold mining deforestation between January 2017 and the present (December 2021). We defined before Operation Mercury as data from January 2017 to February 2019, and after Operation Mercury as data from March 2019 to the present. Given that the former was 26 months and the latter 32 months, during the analysis the data was standardized as gold mining deforestation per month.

The data is updated through December 2021.

Acknowledgments

We thank O. Liao, S. Otoya, J. Guerra, K. Nielsen, S. Novoa, M.E. Gutierrez, Z. Romero, and G. Palacios for their helpful comments on this report.

This report was conducted with technical assistance from USAID, via the Prevent project. Prevent works with the Government of Peru, civil society and the private sector to prevent and combat environmental crimes for the sake of the conservation of the Peruvian Amazon, particularly in the regions of Loreto, Madre de Dios and Ucayali.

This publication is made possible with the support of the American people through USAID. Its content is the sole responsibility of the authors and does not necessarily reflect the views of USAID or the US government.

Citation

Finer M, Mamani N, Spore J (2021) Peruvian Amazon Illegal Gold Mining update. MAAP: #154.