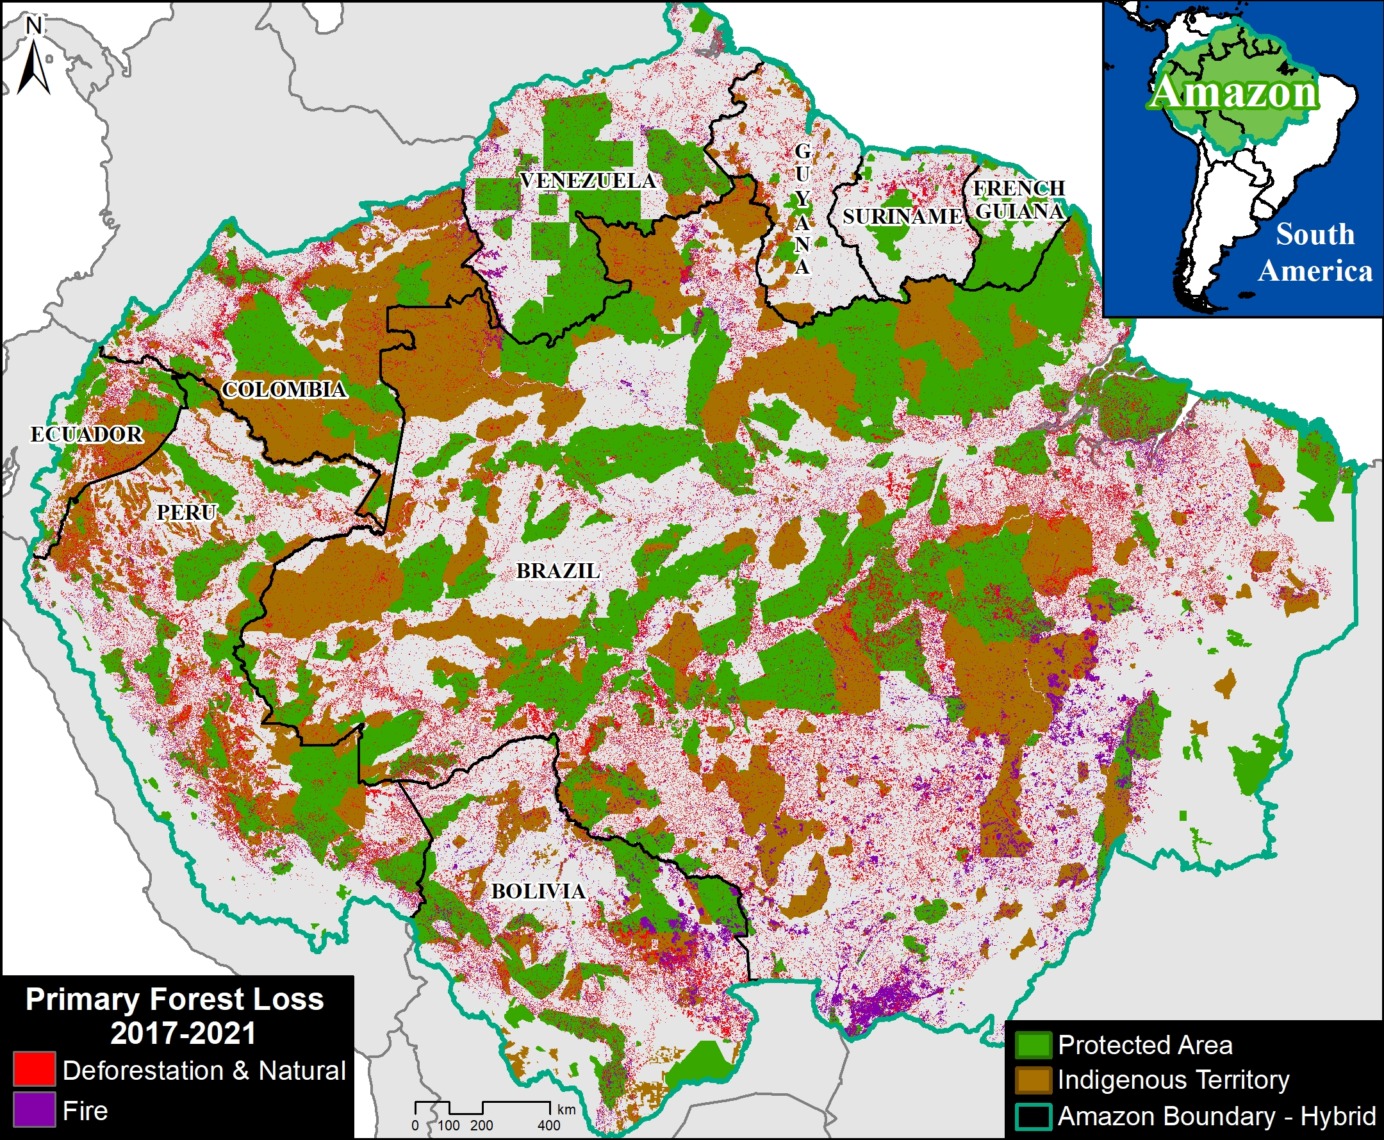
We present a detailed look at the major 2022 Amazon forest loss hotspots, based on the final annual data recently released by the University of Maryland (and featured on Global Forest Watch).
This dataset is unique in that it is consistent across all nine countries of the Amazon, and distinguishes forest loss from fire, leaving the rest as a proxy for deforestation (but also includes natural loss).
Thus, we are able to present both deforestation and fire hotspots across the Amazon.
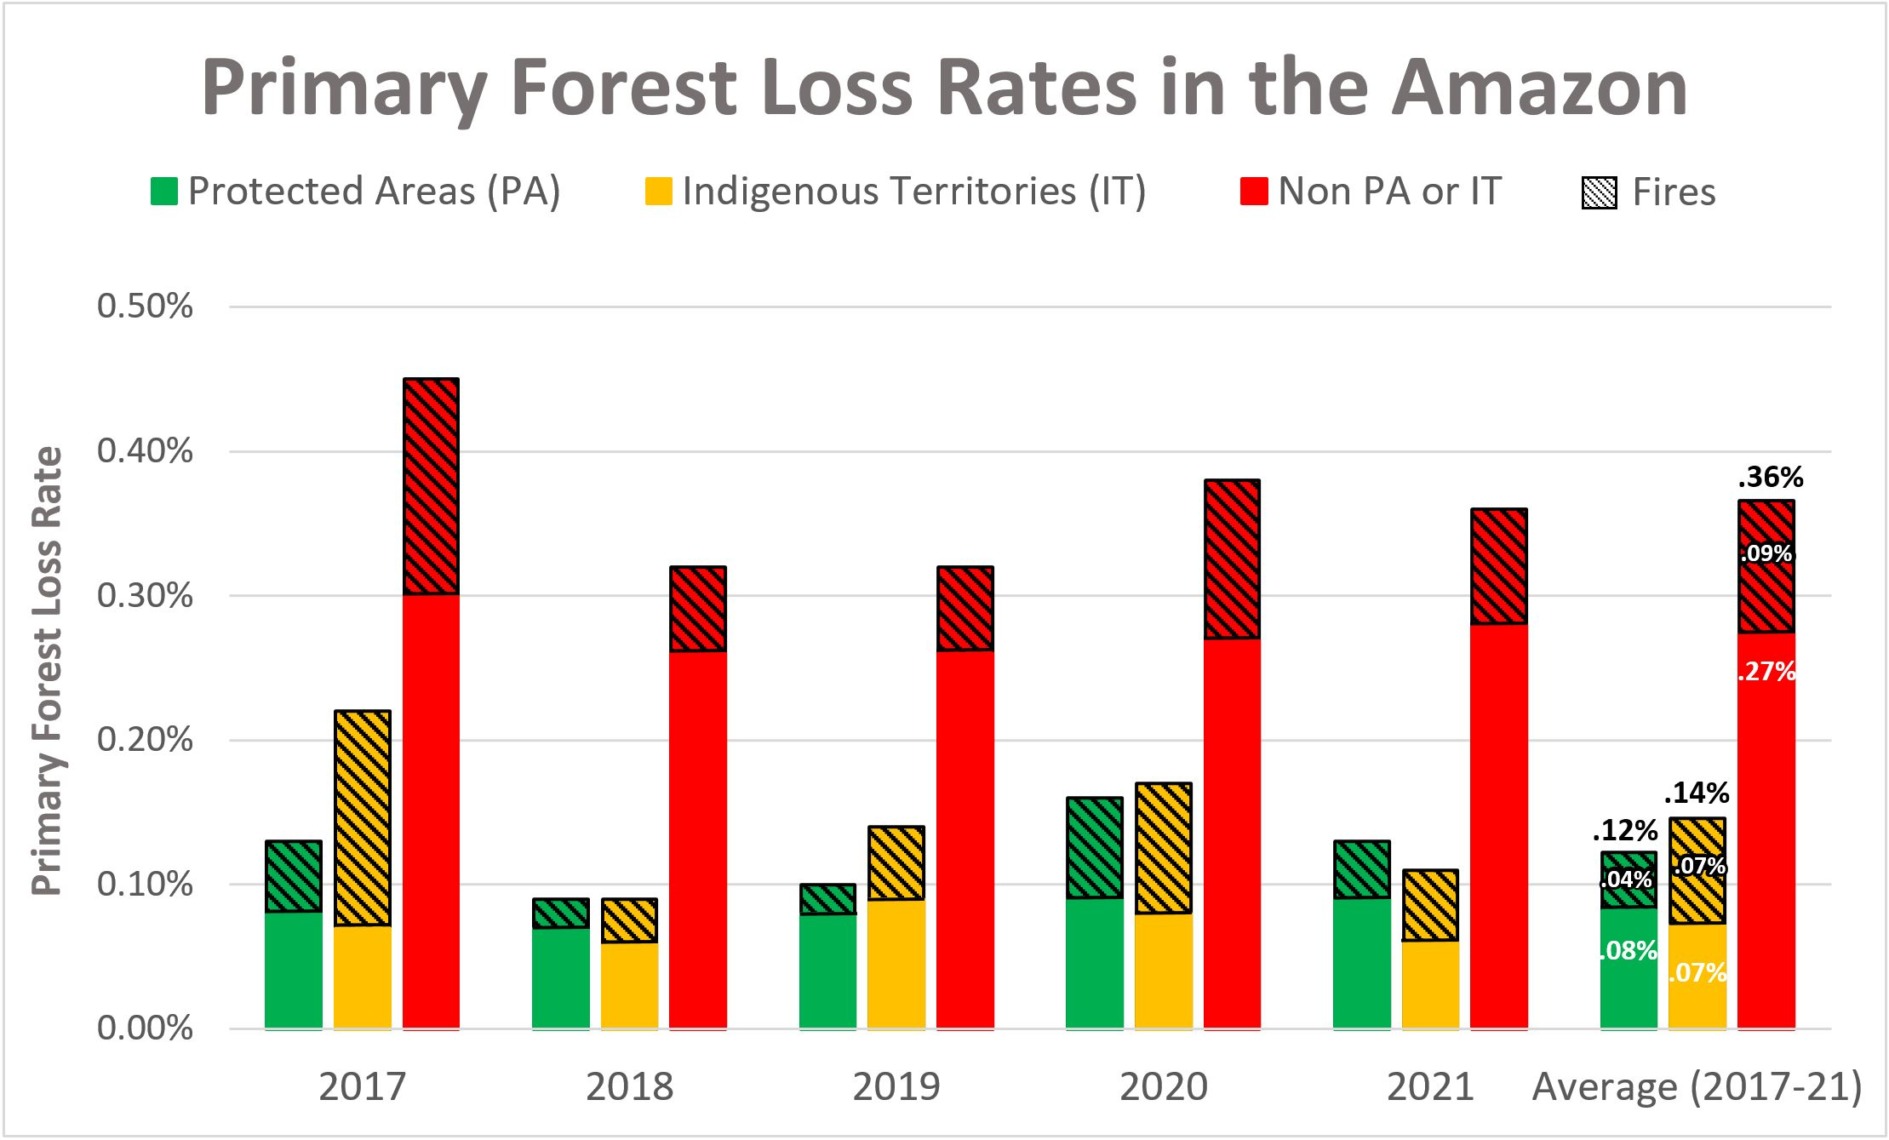
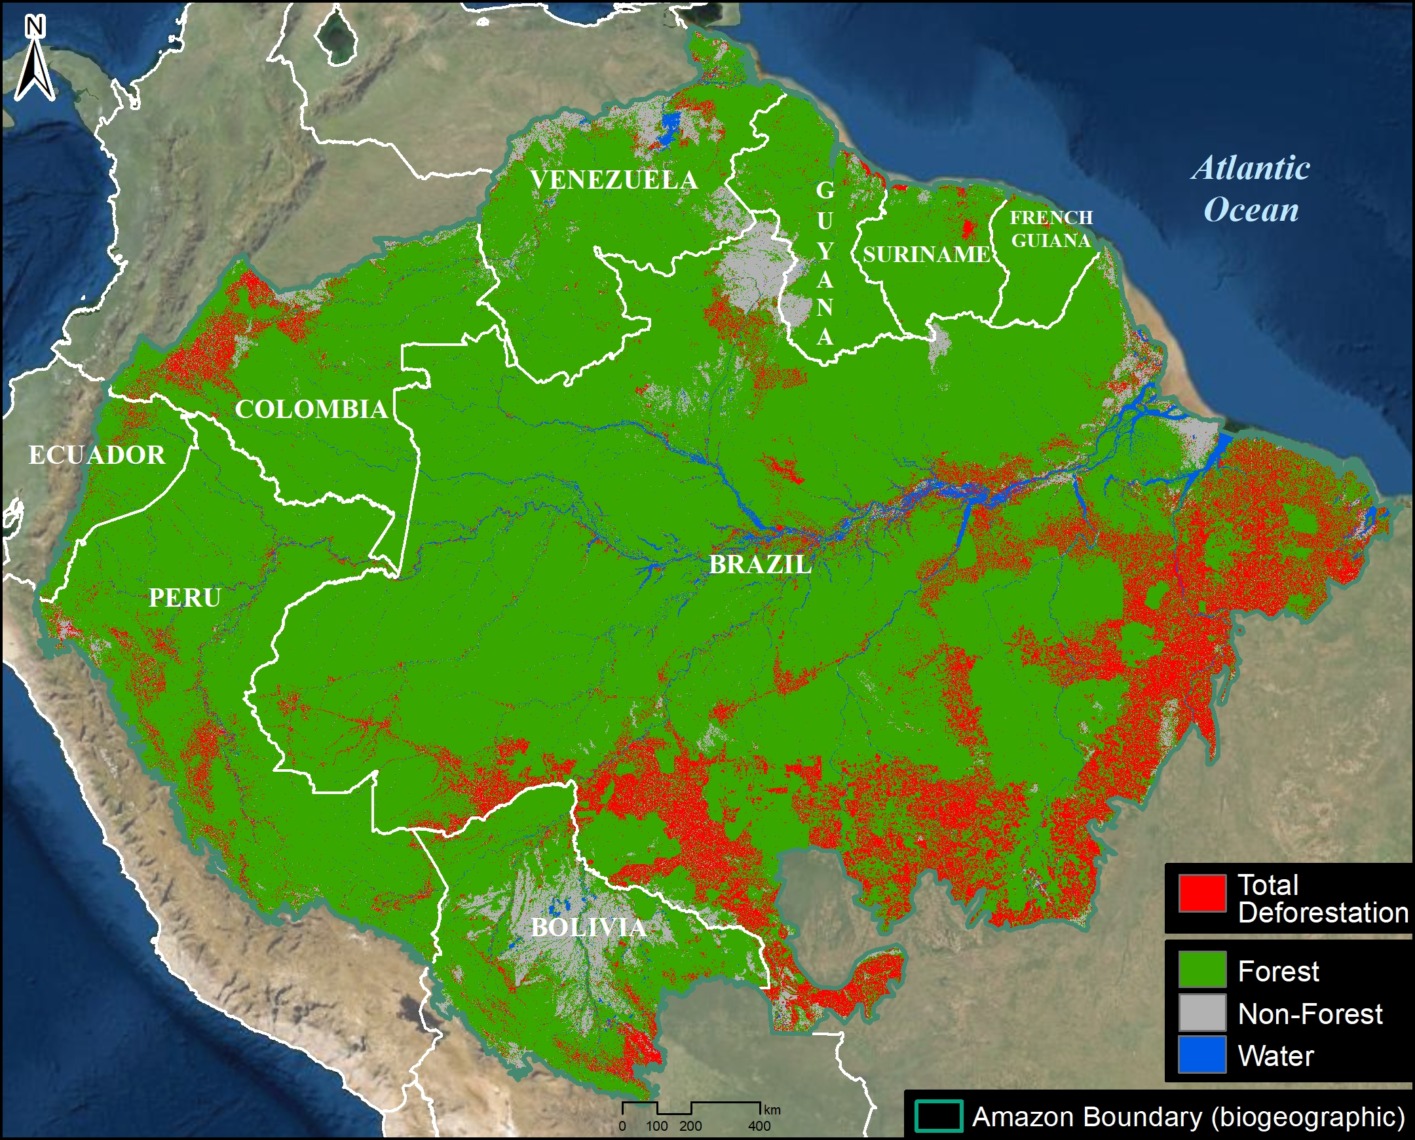
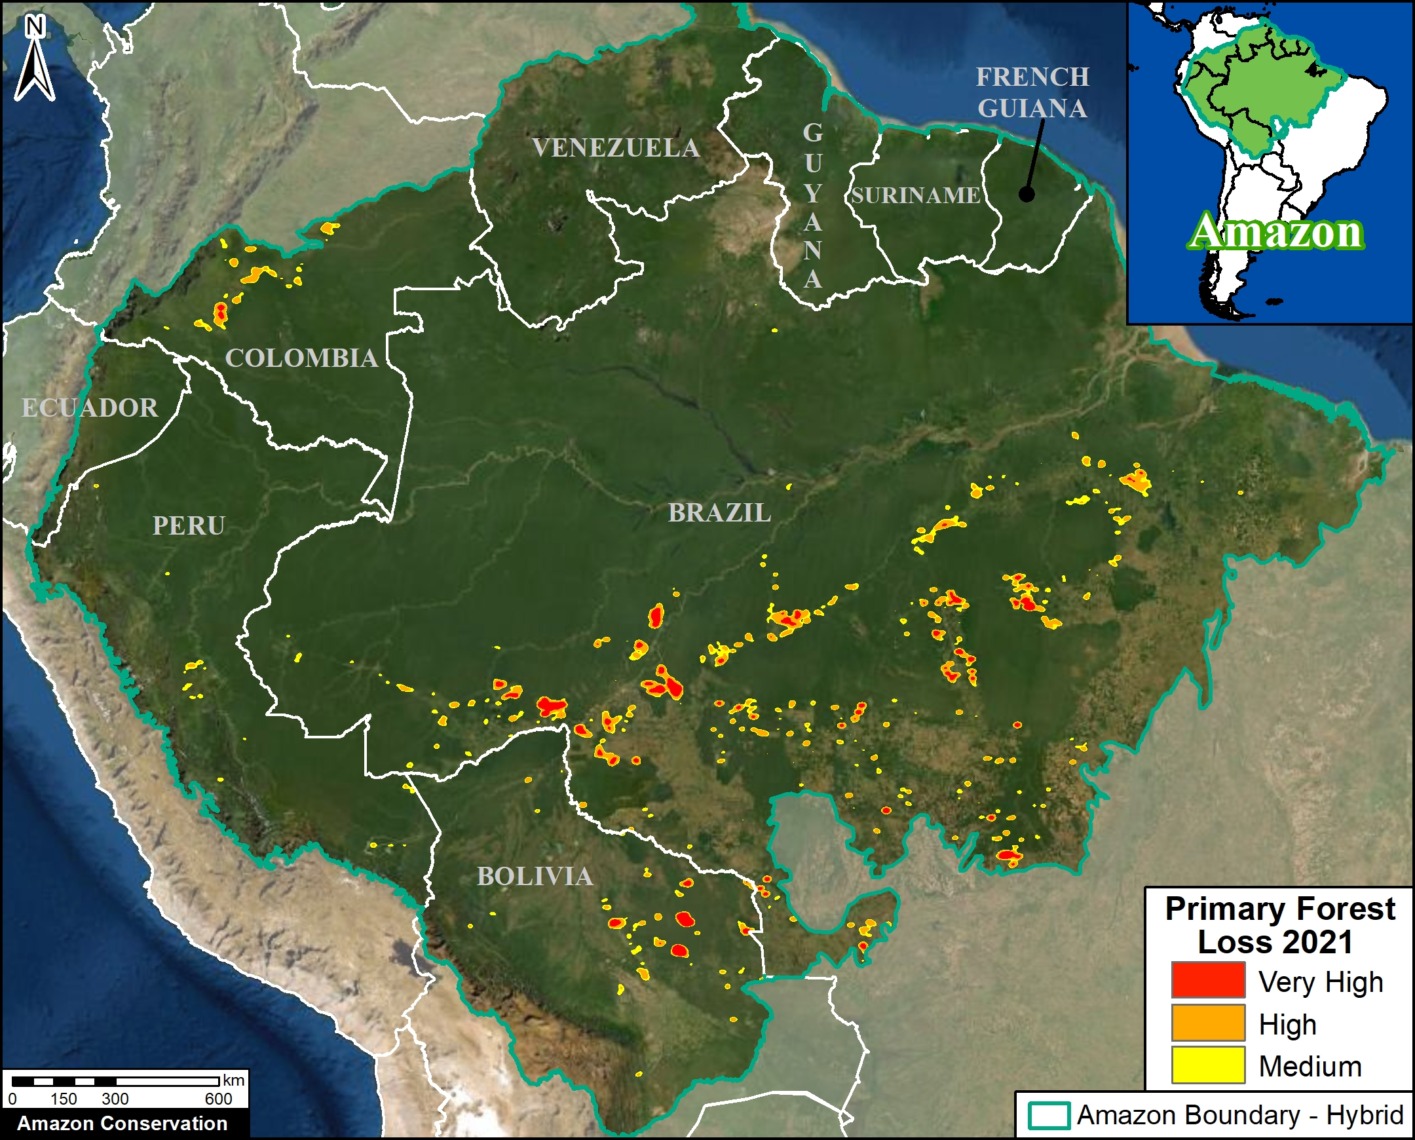
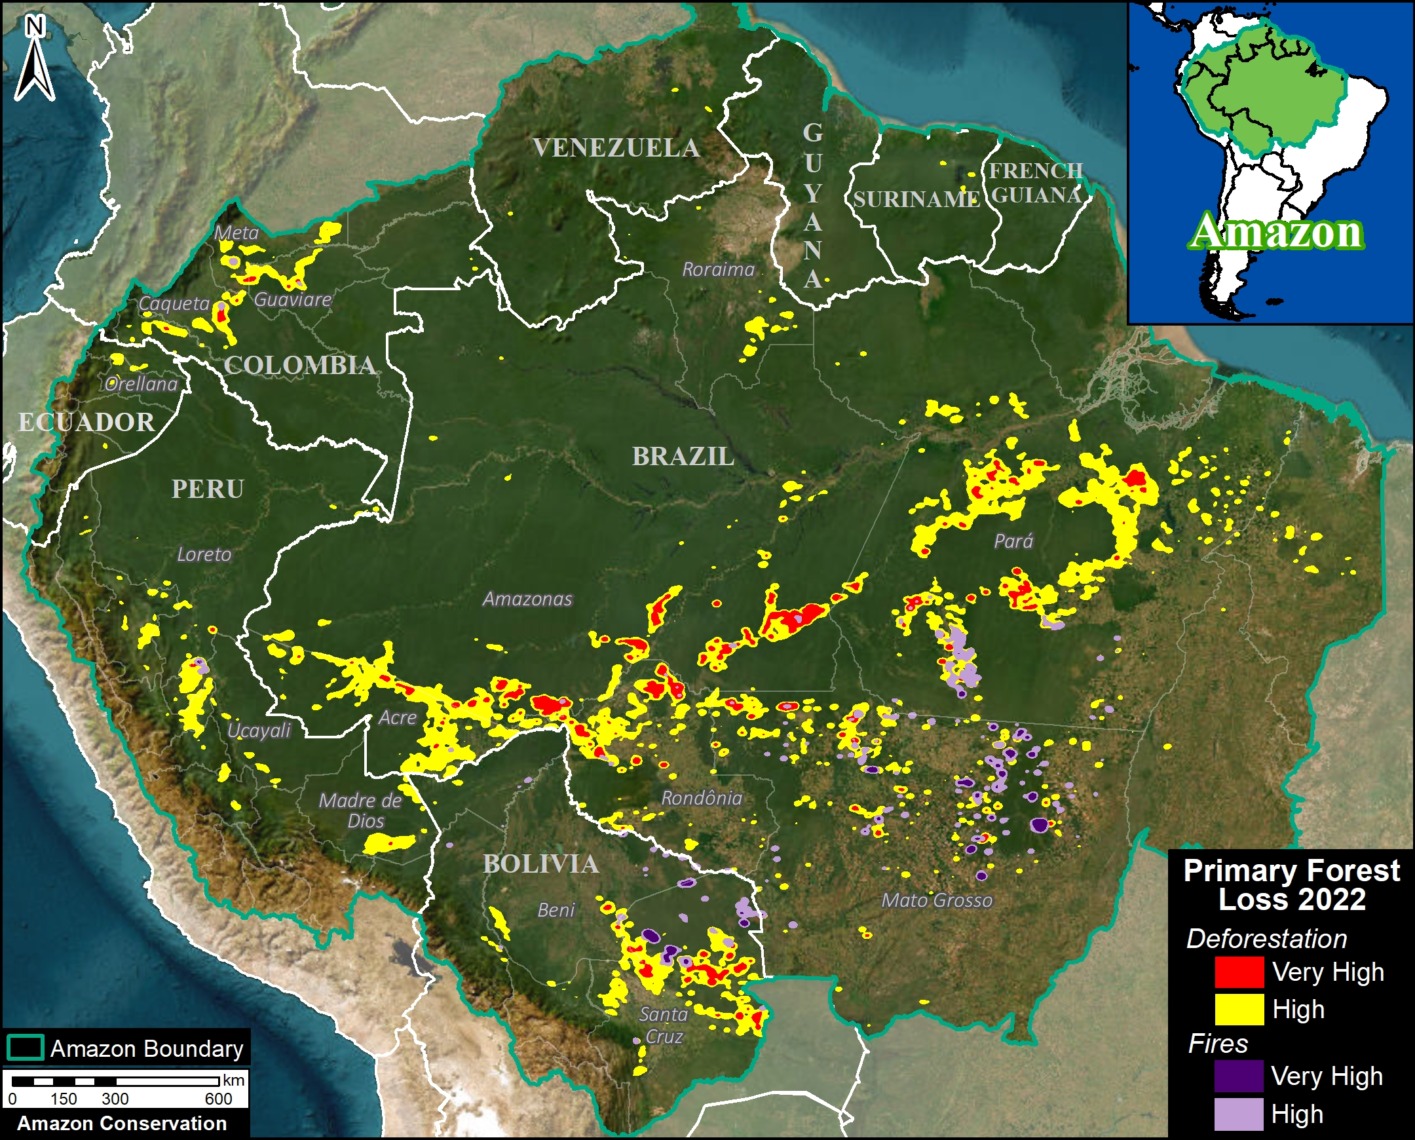
The Base Map (see right) and Results Graph (see below) reveal several key findings:
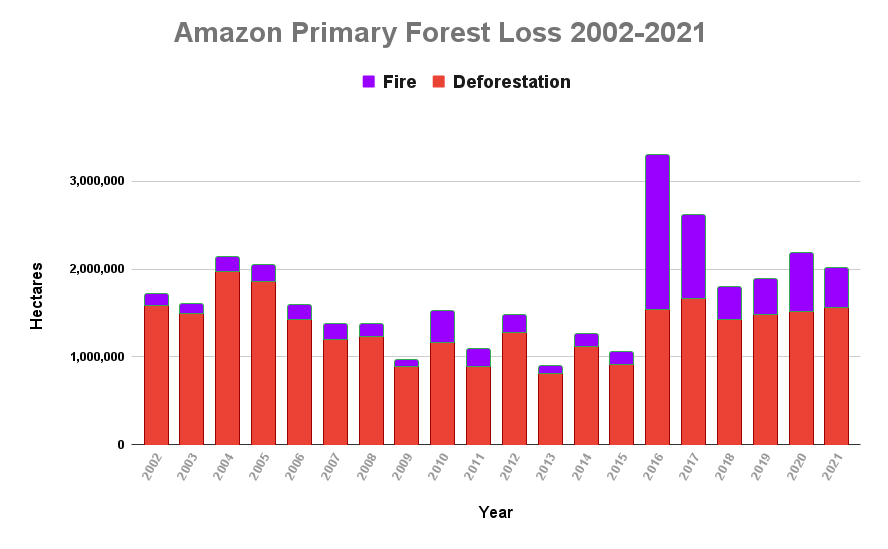
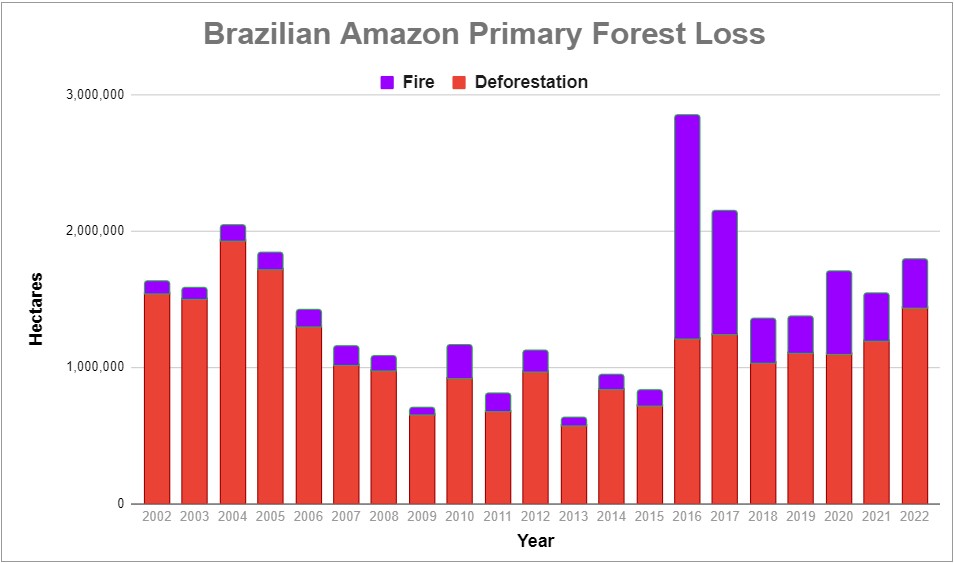
- In 2022, we estimate the deforestation of 1.98 million hectares (4.89 million acres). This represents a major 21% increase from 2021, and is the second highest on record, behind only the peak in 2004.
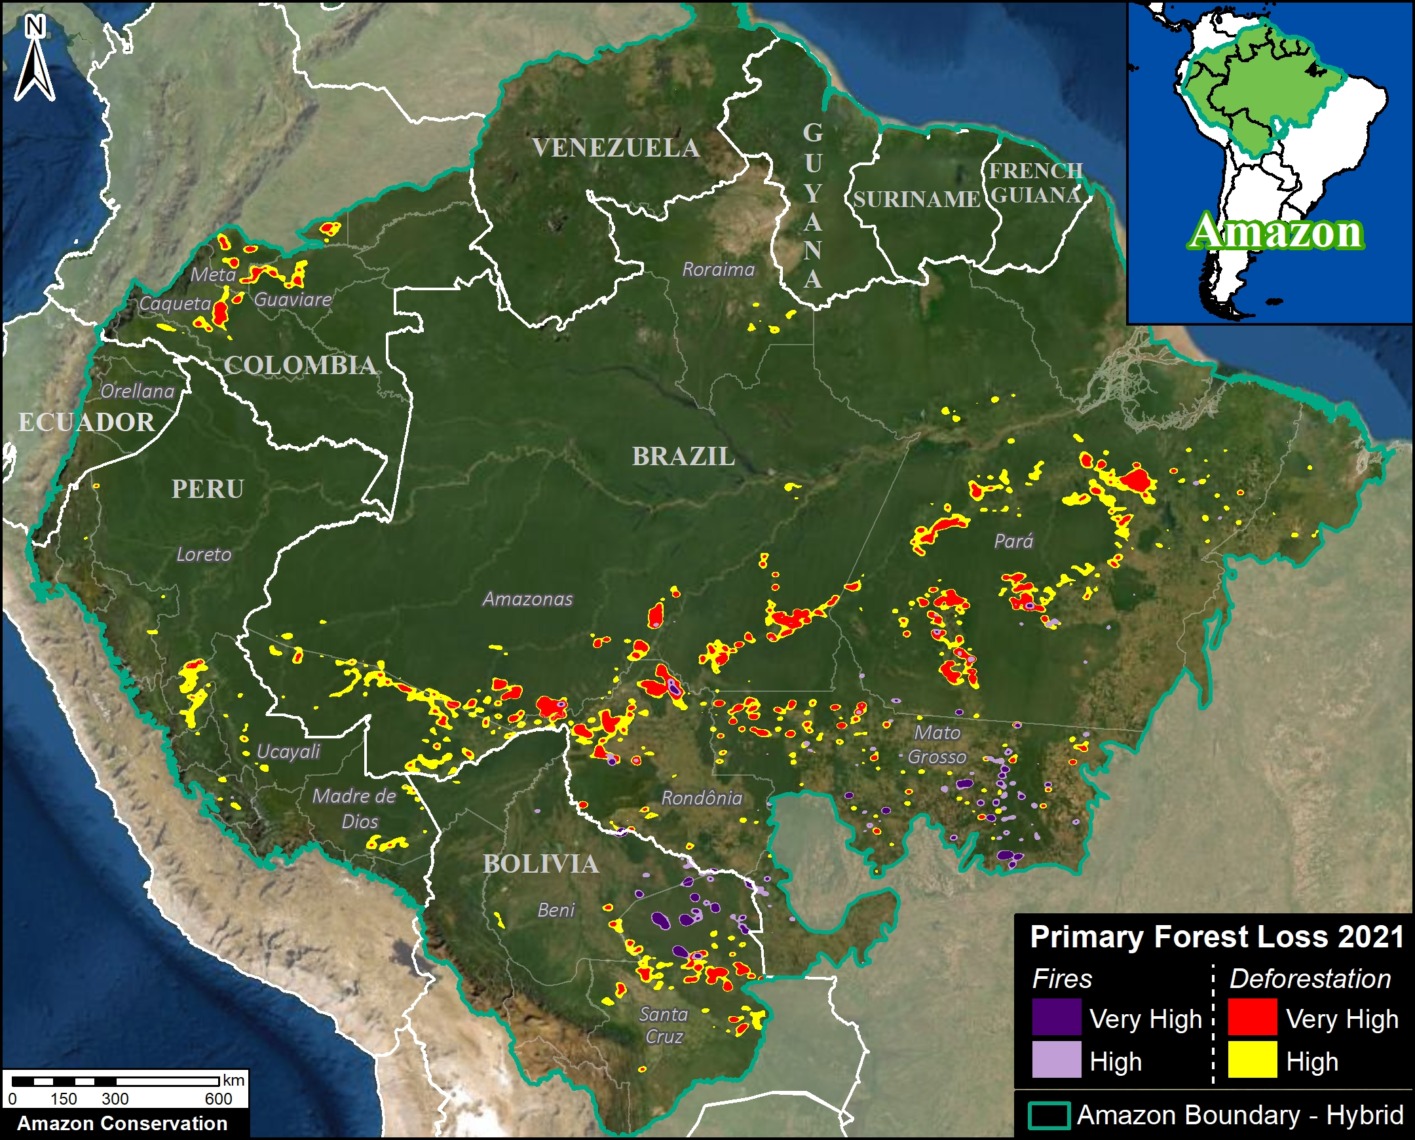
k - Deforestation hotspots were especially concentrated along roads in the Brazilian Amazon, the soy frontier in the southeast Bolivian Amazon, and near protected areas in northwest Colombian Amazon.
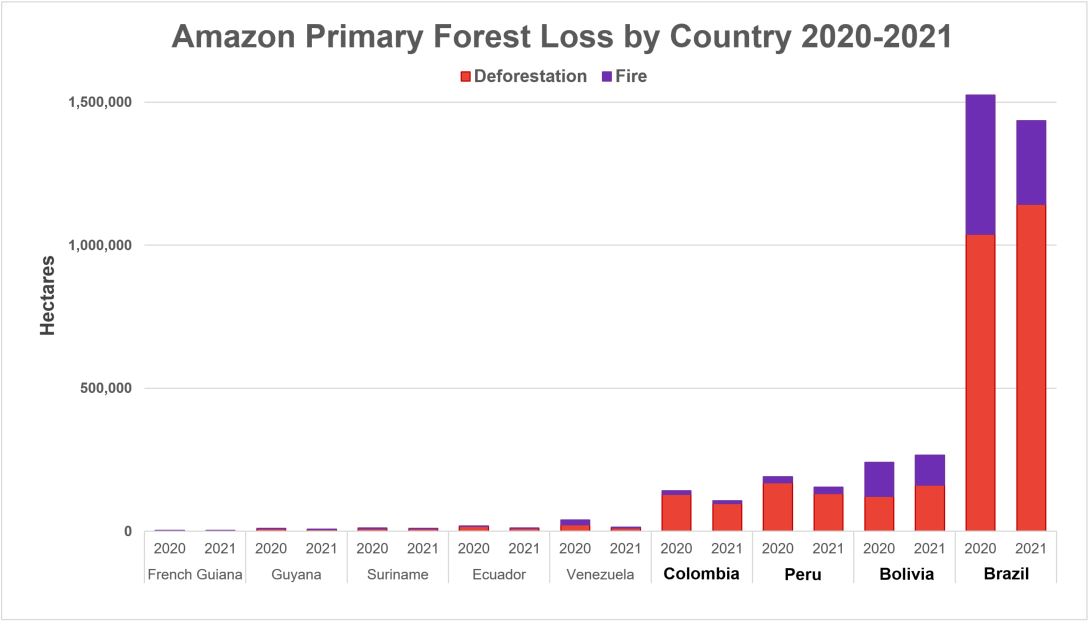
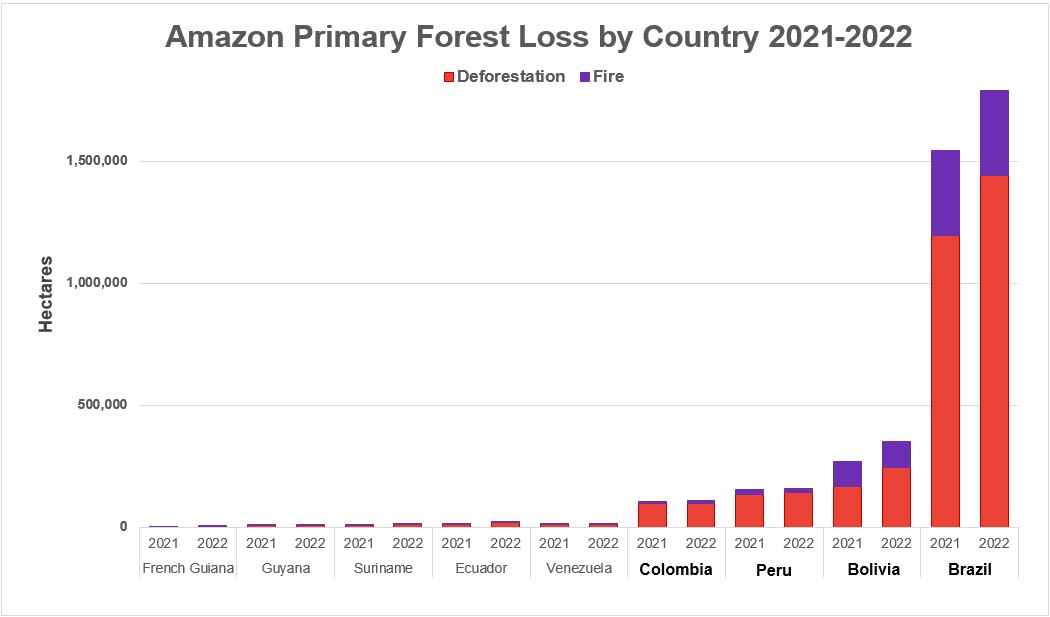
k - The vast majority of the deforestation occurred in Brazil (72.8%), followed by Bolivia (12.4%), Peru (7.3%), and Colombia (4.9%). Note that deforestation in Bolivia was the highest on record, and in Brazil the highest since the early 2000s.
k - Fires impacted an additional 491,223 hectares (1.2 million acres) of primary forest. This total represents a 1.6% increase from 2021, and the 4th highest on record (behind only intense fire seasons of 2016, 2017, and 2020). Moreover, each of the seven most intense fire seasons has occurred in the past seven years. Nearly 93% of the fire impact occurred in just two countries: Brazil and Bolivia.
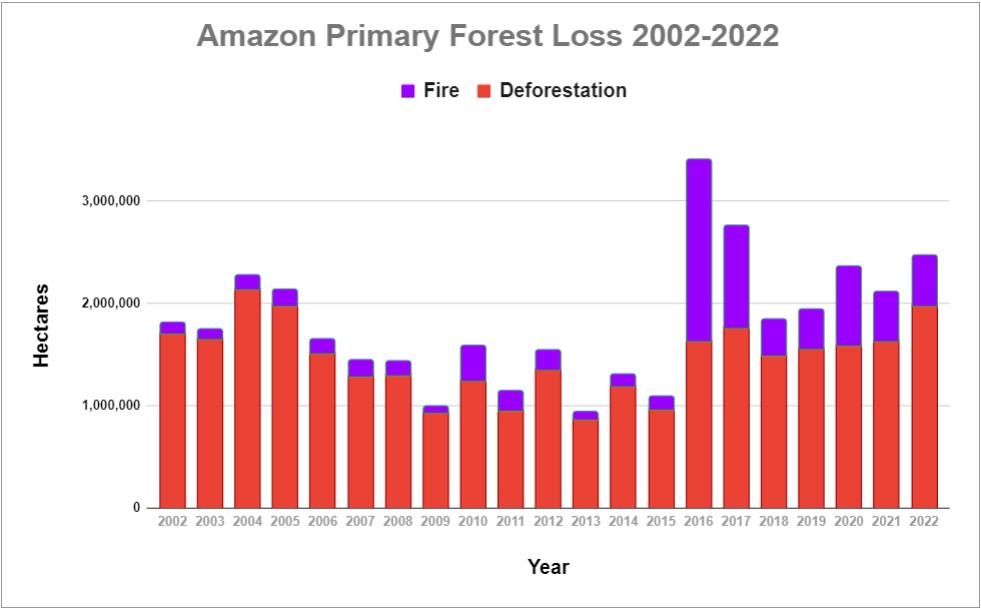
k - In total, 2.47 million hectares (6.1 million acres) of primary forest were impacted by deforestation and fire. This total represents the third highest on record, only behind the post-El Niño years of 2016 and 2017.
k - Since 2002, we estimate the deforestation of 30.7 million hectares (75.9 million acres) of primary forest, greater than the size of Italy or the U.S. state of Arizona.
Below, we zoom in on the six countries with the highest deforestation (Brazil, Bolivia, Peru, Colombia, Ecuador, and Venezuela) with additional maps and analysis.
Amazon Primary Forest Loss (Combined), 2002-2022
Amazon Primary Forest Loss (By Country), 2002-2022
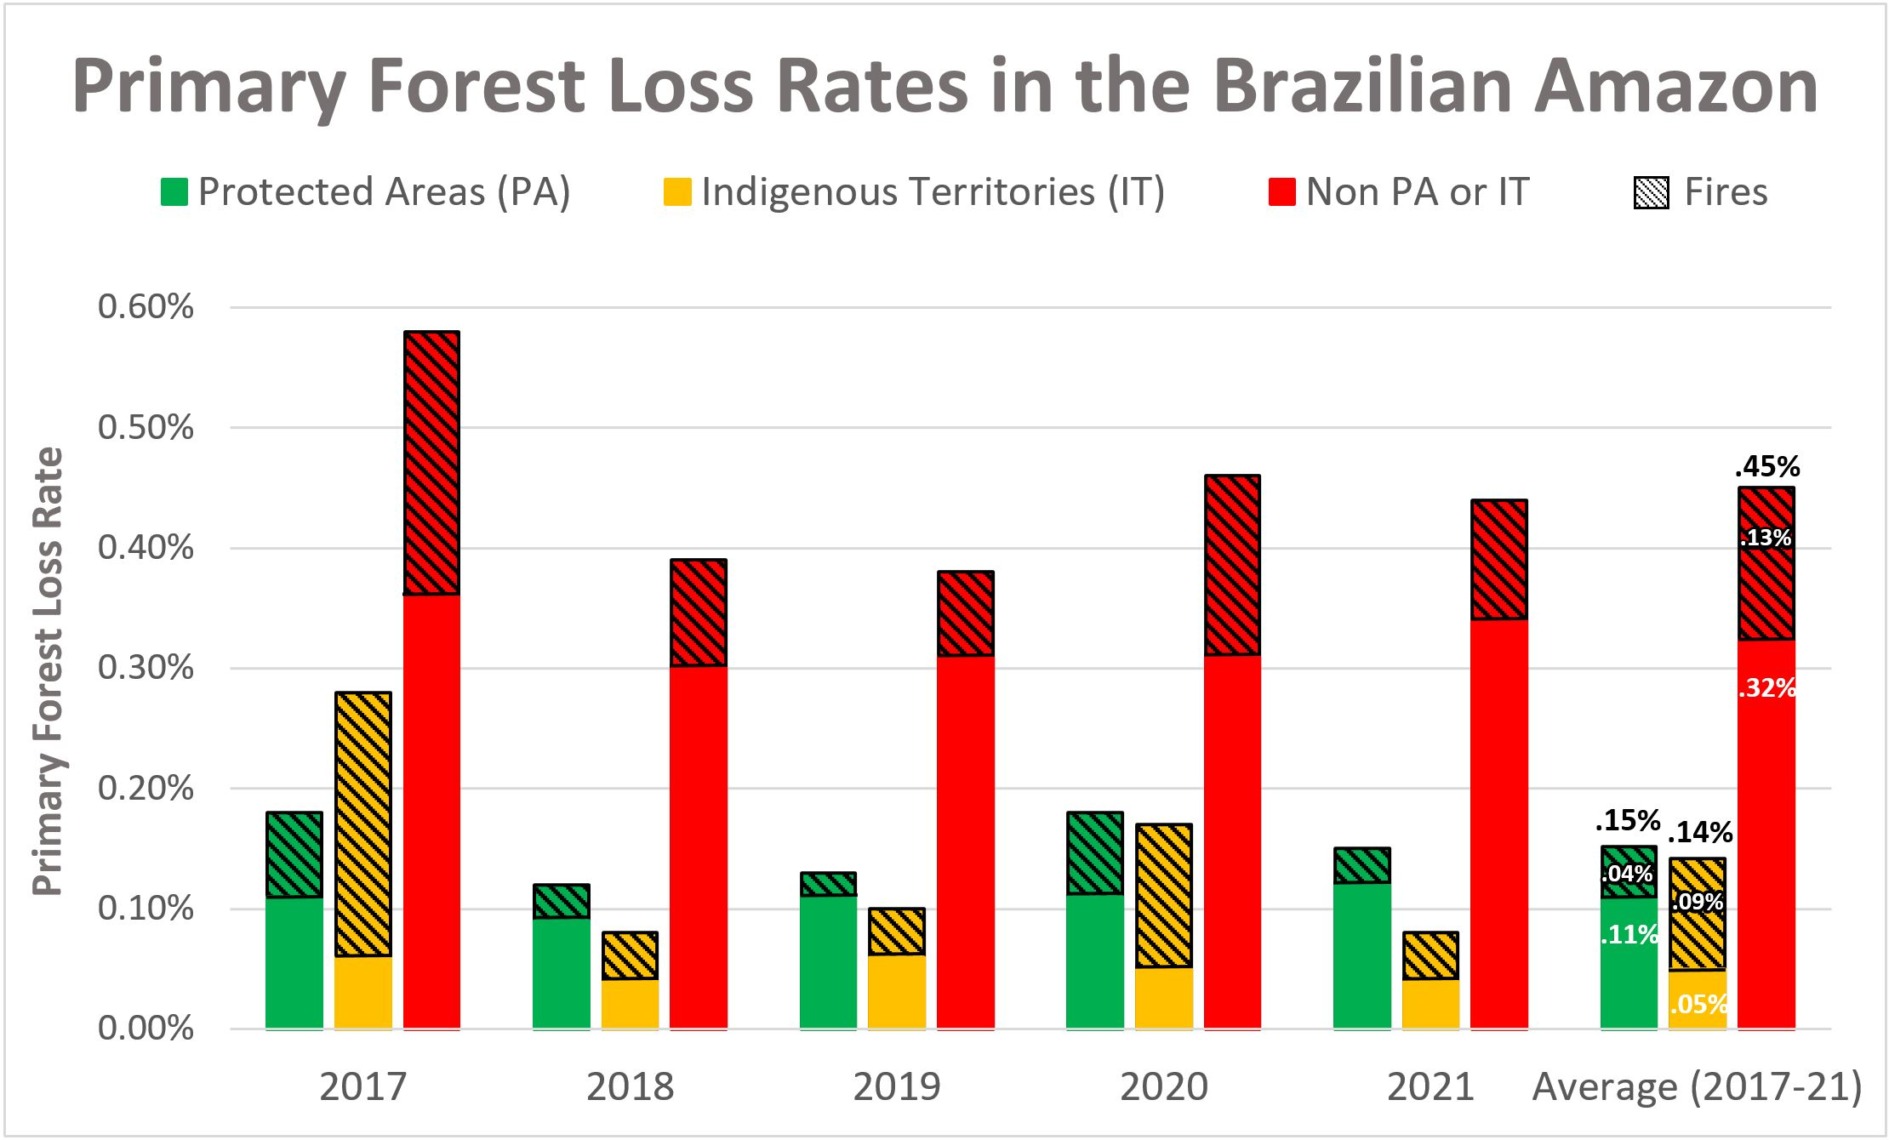
Brazilian Amazon
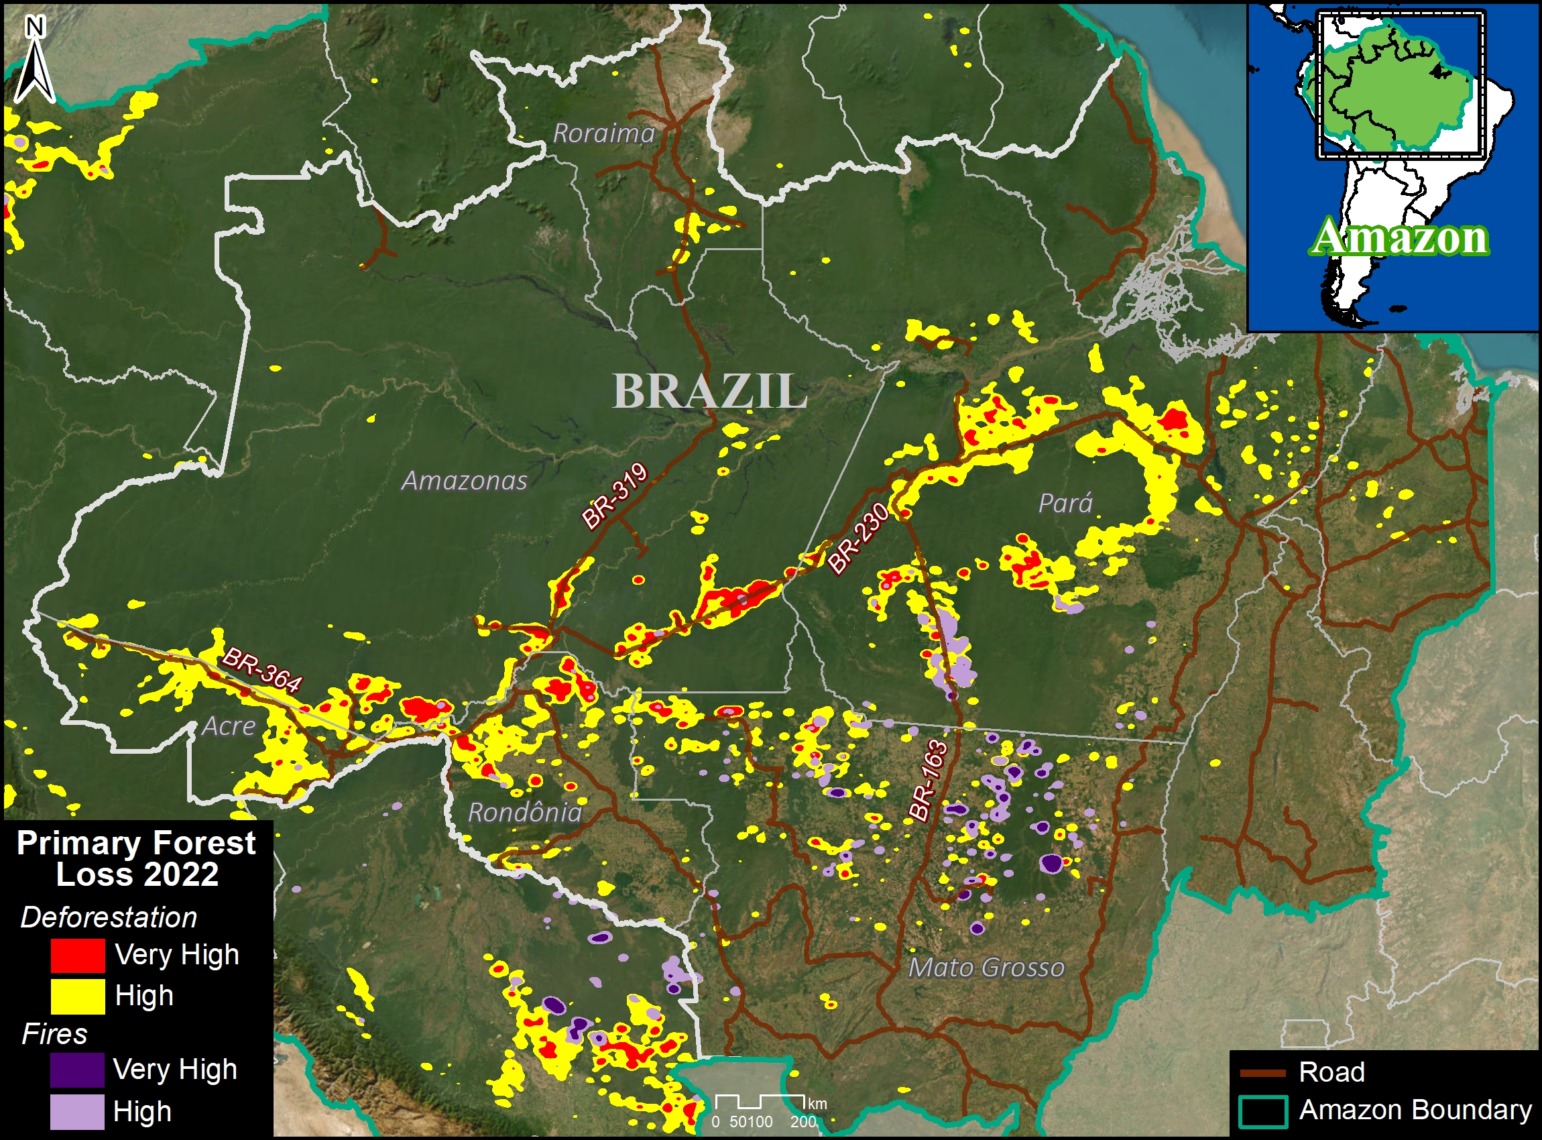
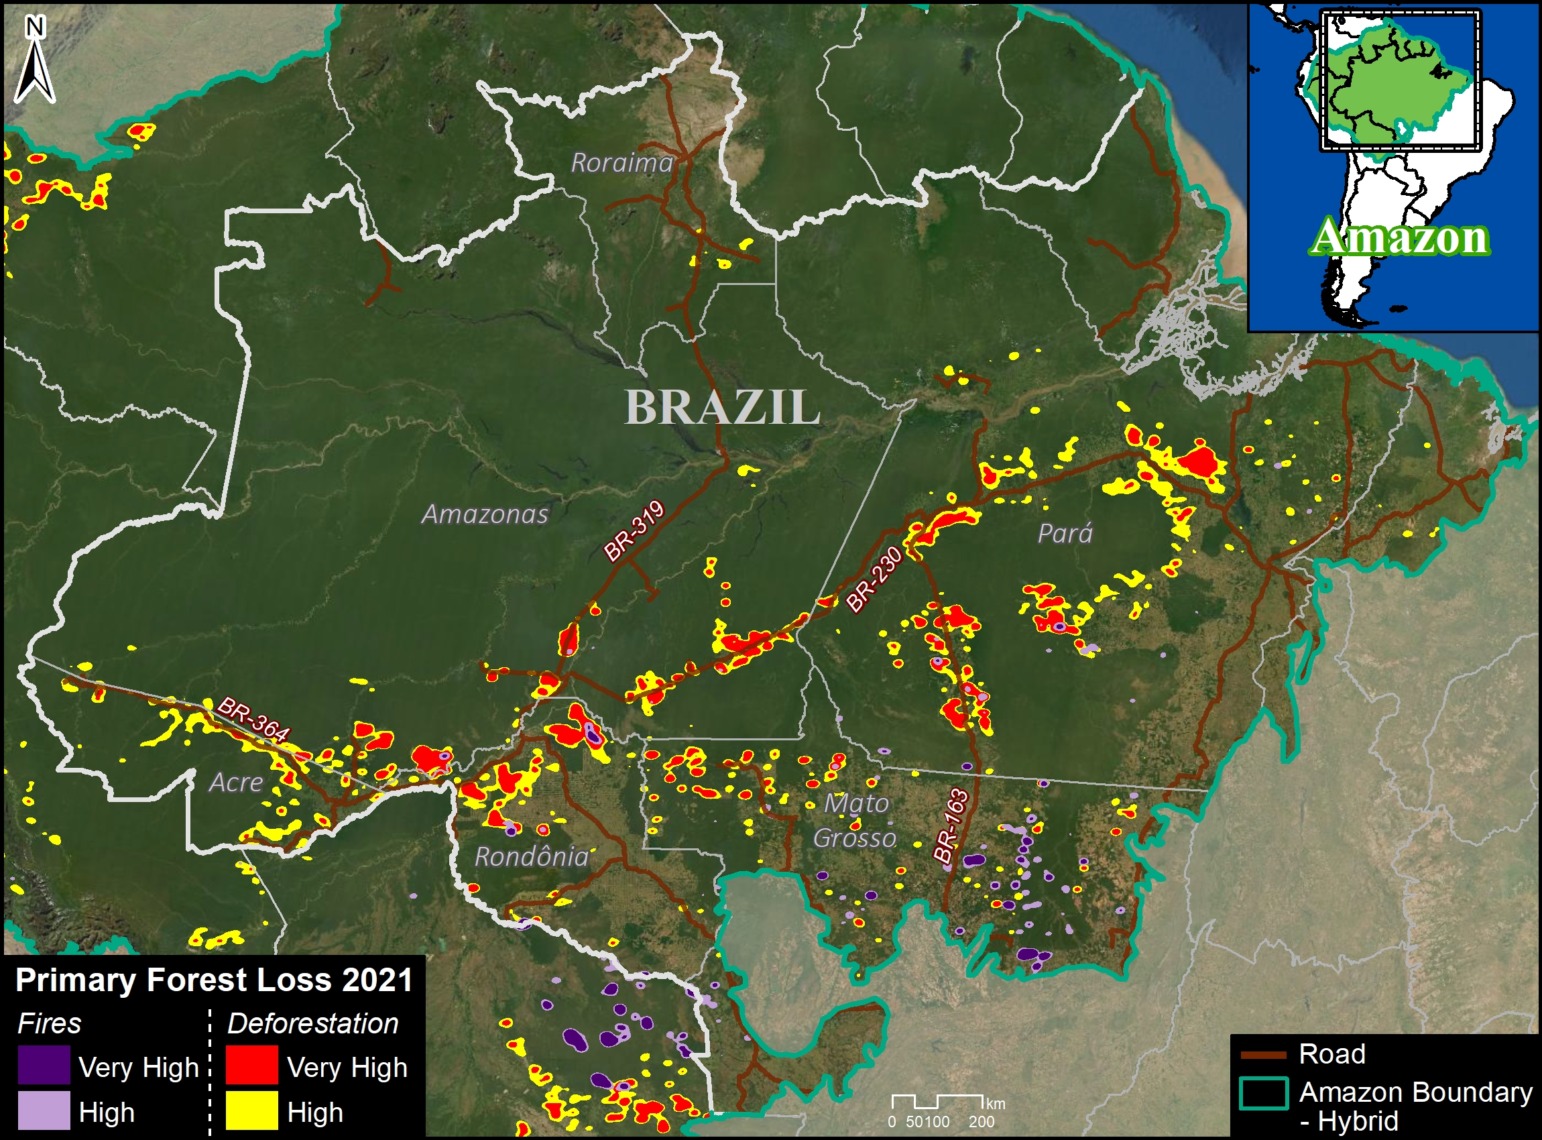
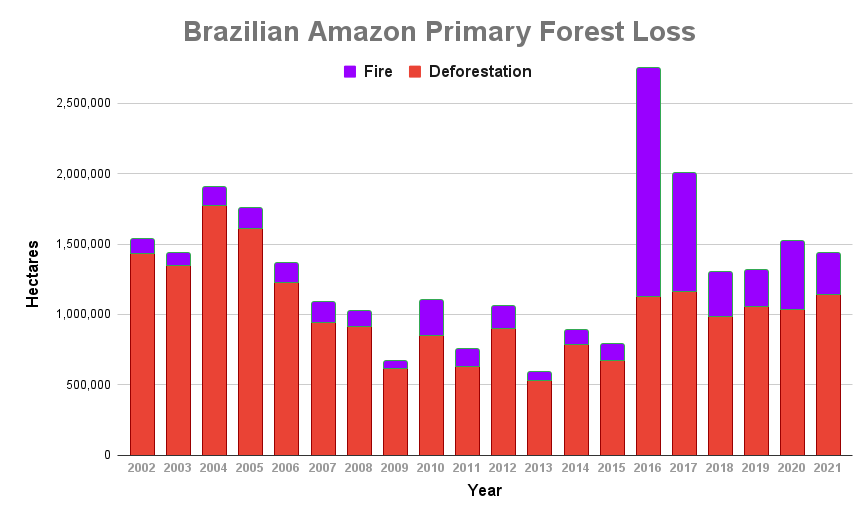
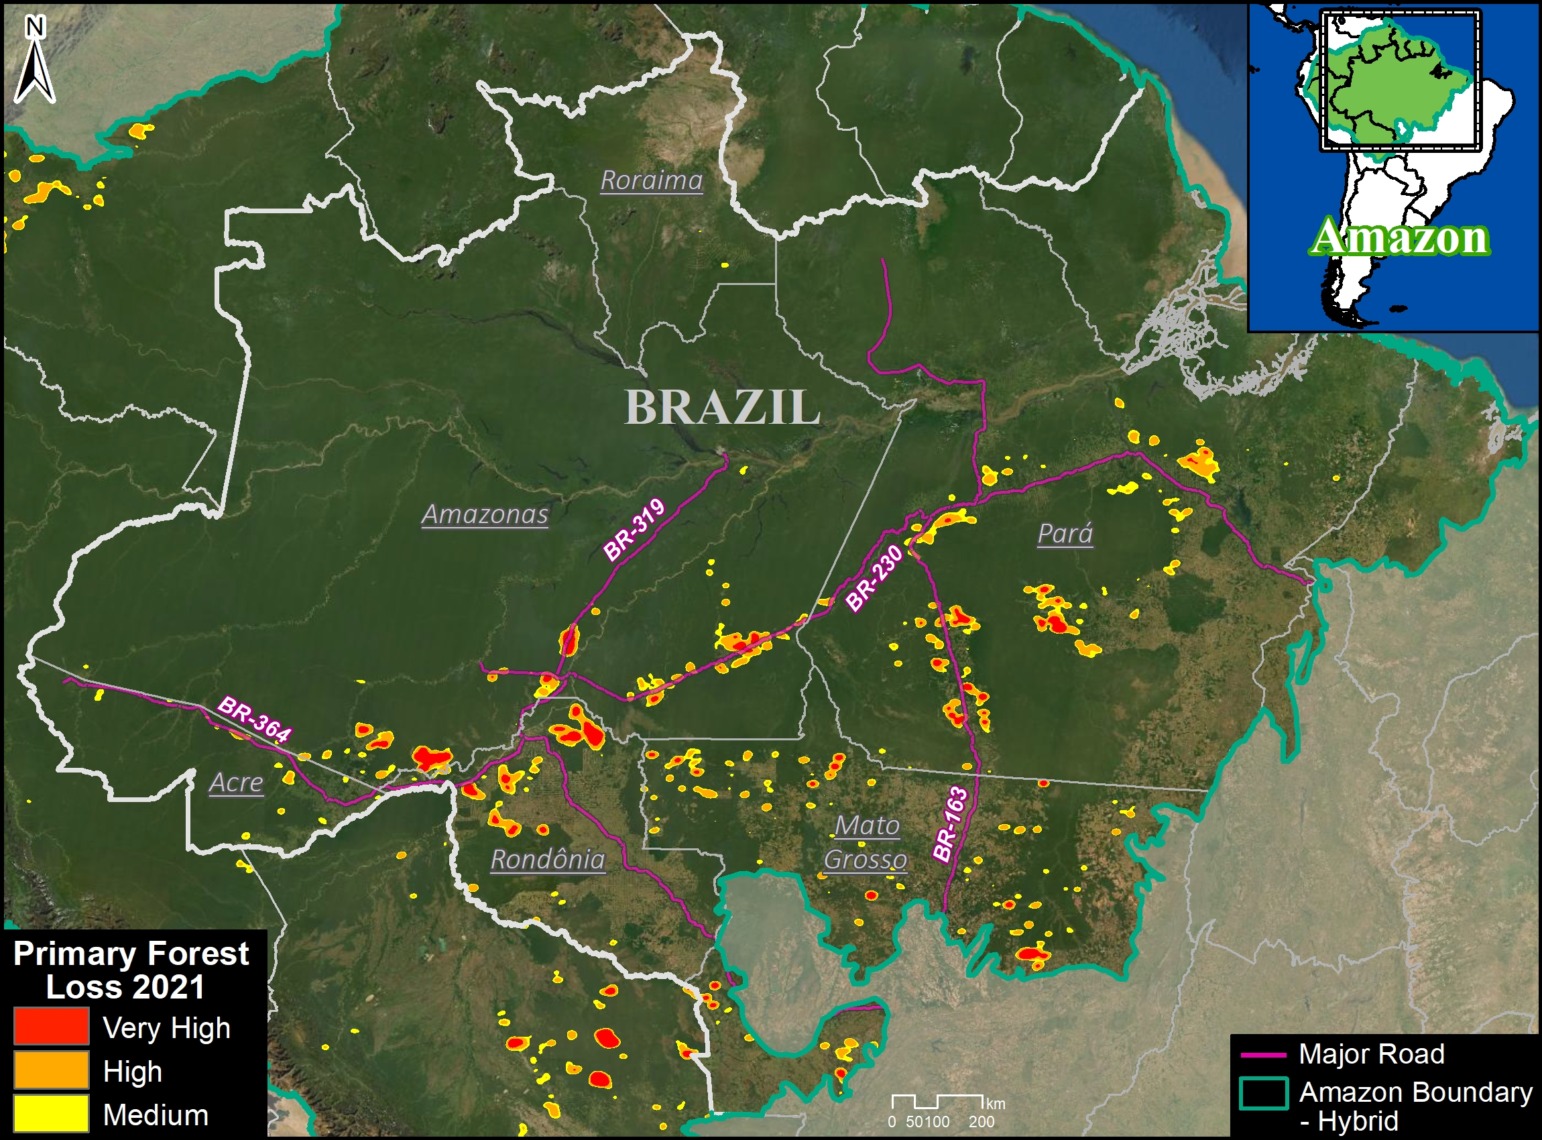
In 2022, the Brazilian Amazon lost 1.4 million hectares (3.56 million acres) of primary forest to deforestation. Fires directly impacted an additional 348,824 hectares.
The deforestation rose 20.5% from 2021, and was the highest on record since the peak years of 2002 – 2005.
The fire impact was the 4th highest on record, only behind the intense fire years of 2016, 2017, and 2020.
The deforestation was concentrated along the major road networks, especially roads 230 (Trans-Amazonian Highway), 364, 319, and 163 in the states of Amazonas, Pará, Rondônia, and Acre (see Brazil Base Map).
The direct fire impacts were concentrated in the soy frontier, located in southeastern state of Mato Grosso
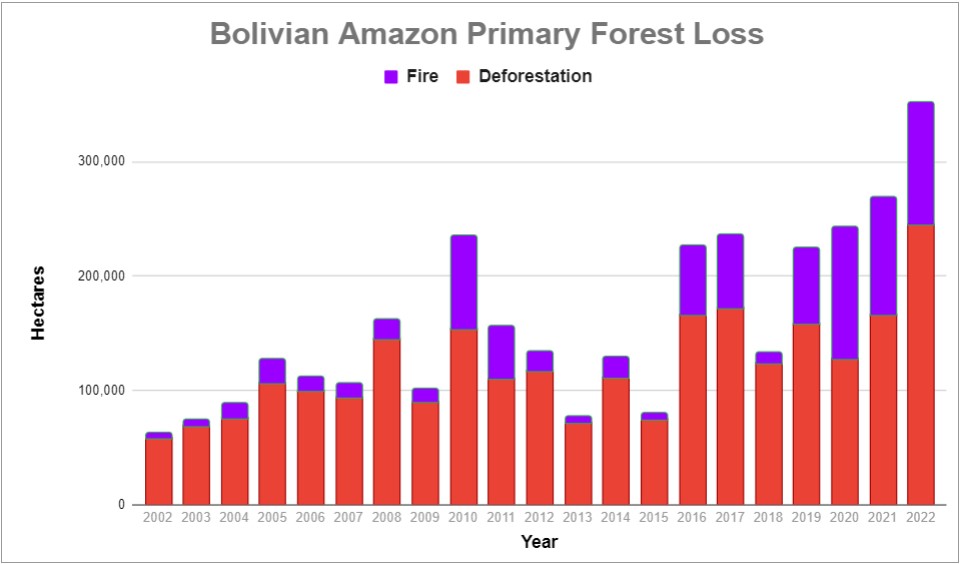
Bolivian Amazon
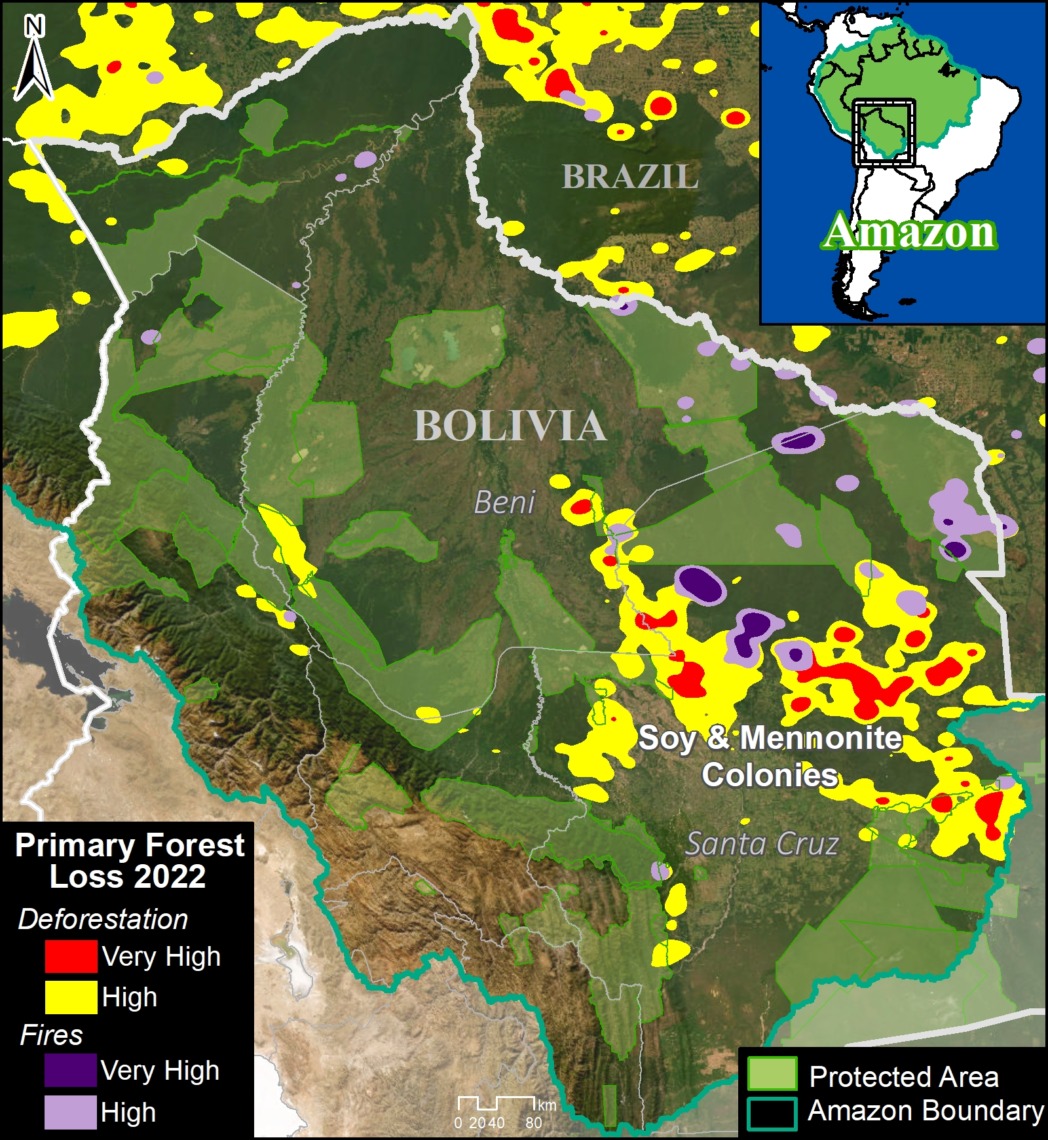
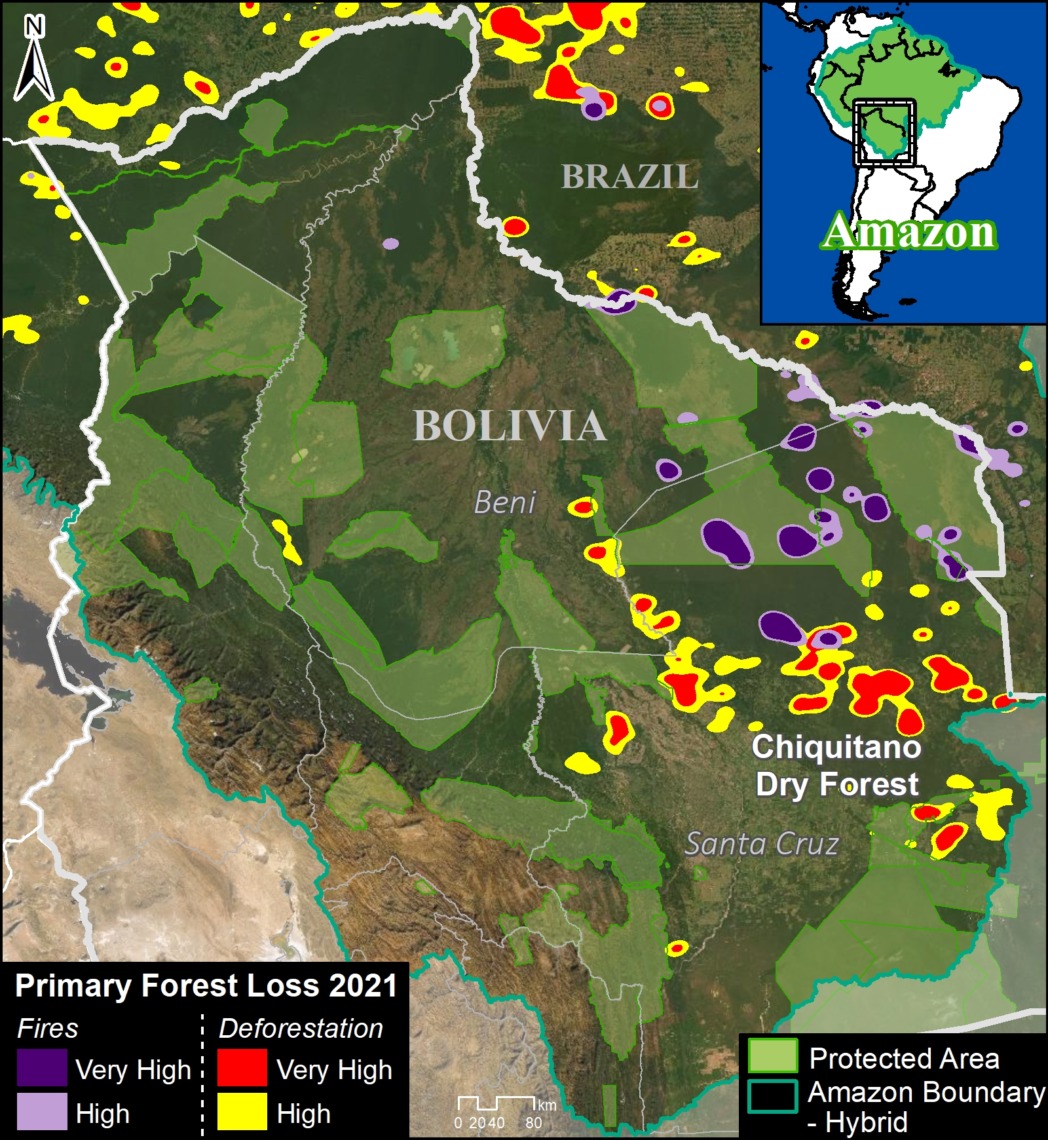
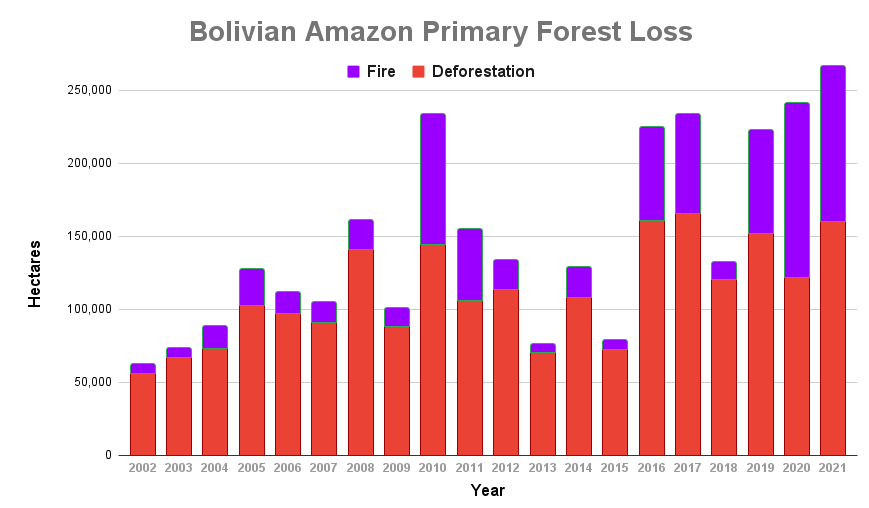
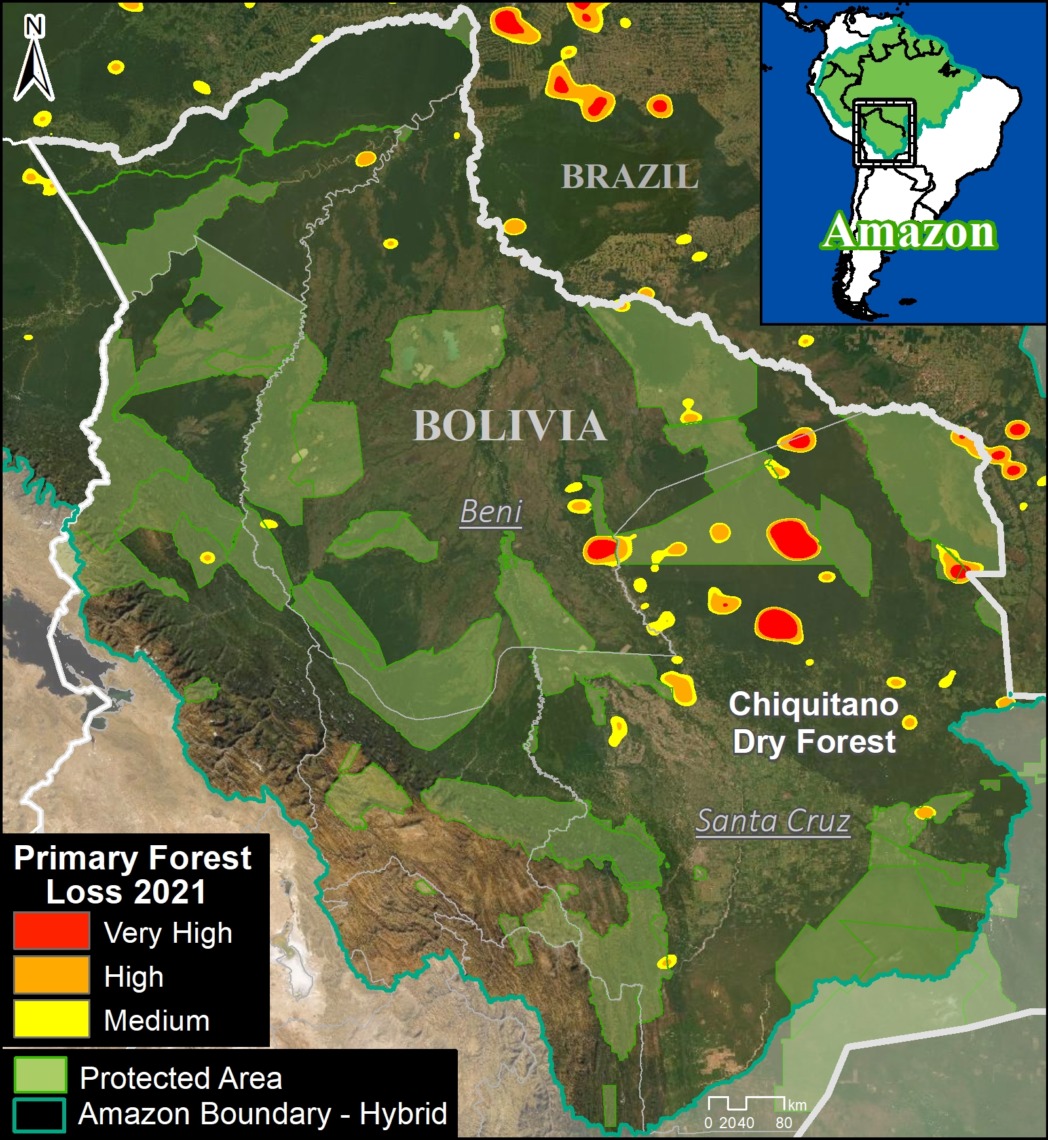
In 2022, the Bolivian Amazon lost 245,177 hectares of primary forest to deforestation. Fires directly impacted an additional 106,922 hectares.
We highlight that this deforestation was 47% higher than 2021, and the highest on record (by far).
The fire impact was also up from last year, and the second-highest on record behind just the intense year of 2020.
Both the deforestation and fires were concentrated in the soy frontier located in southeastern department of Santa Cruz (see Bolivia Base Map).
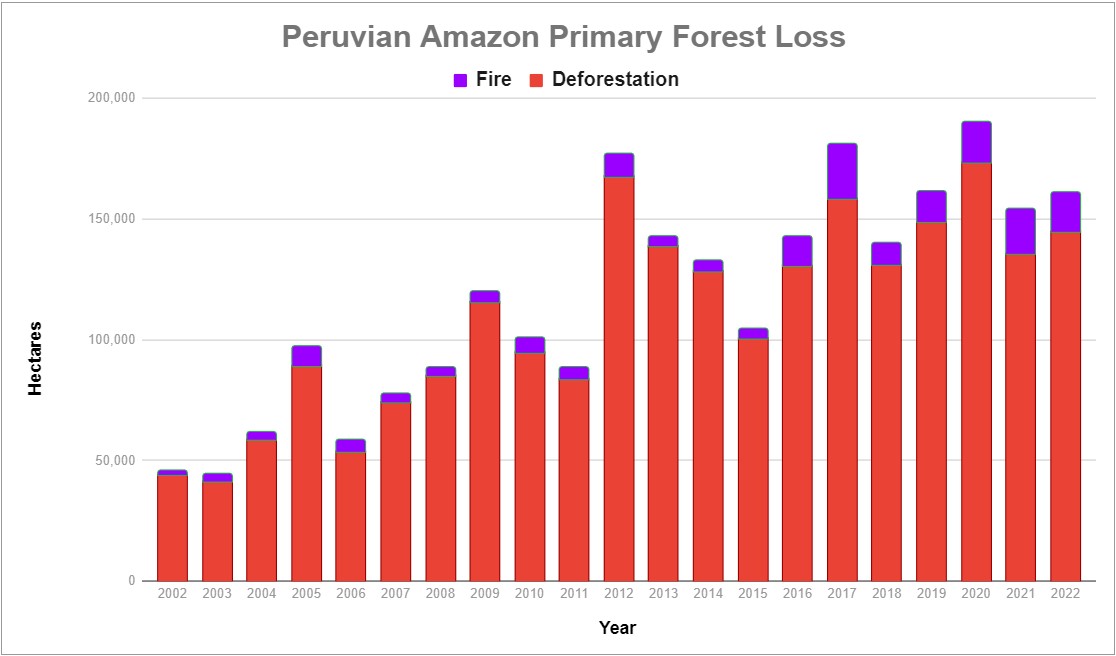
Peruvian Amazon
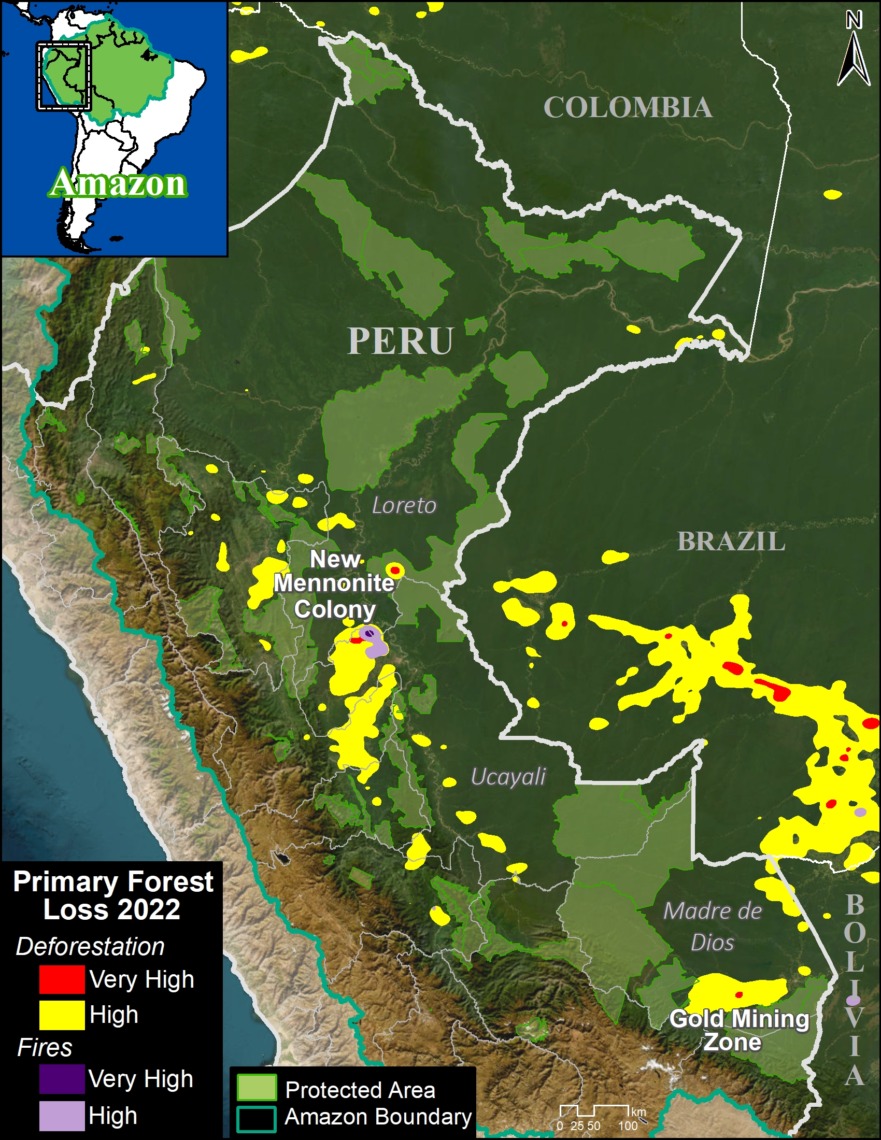
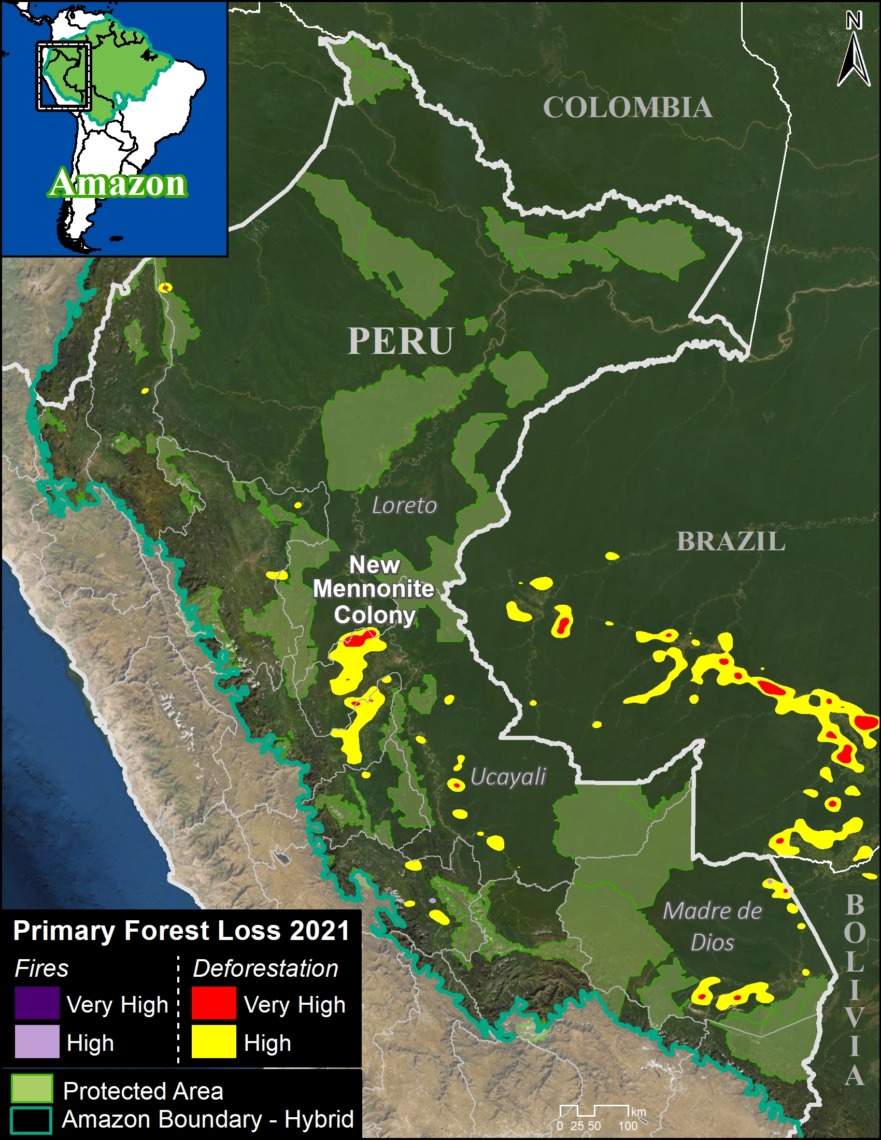
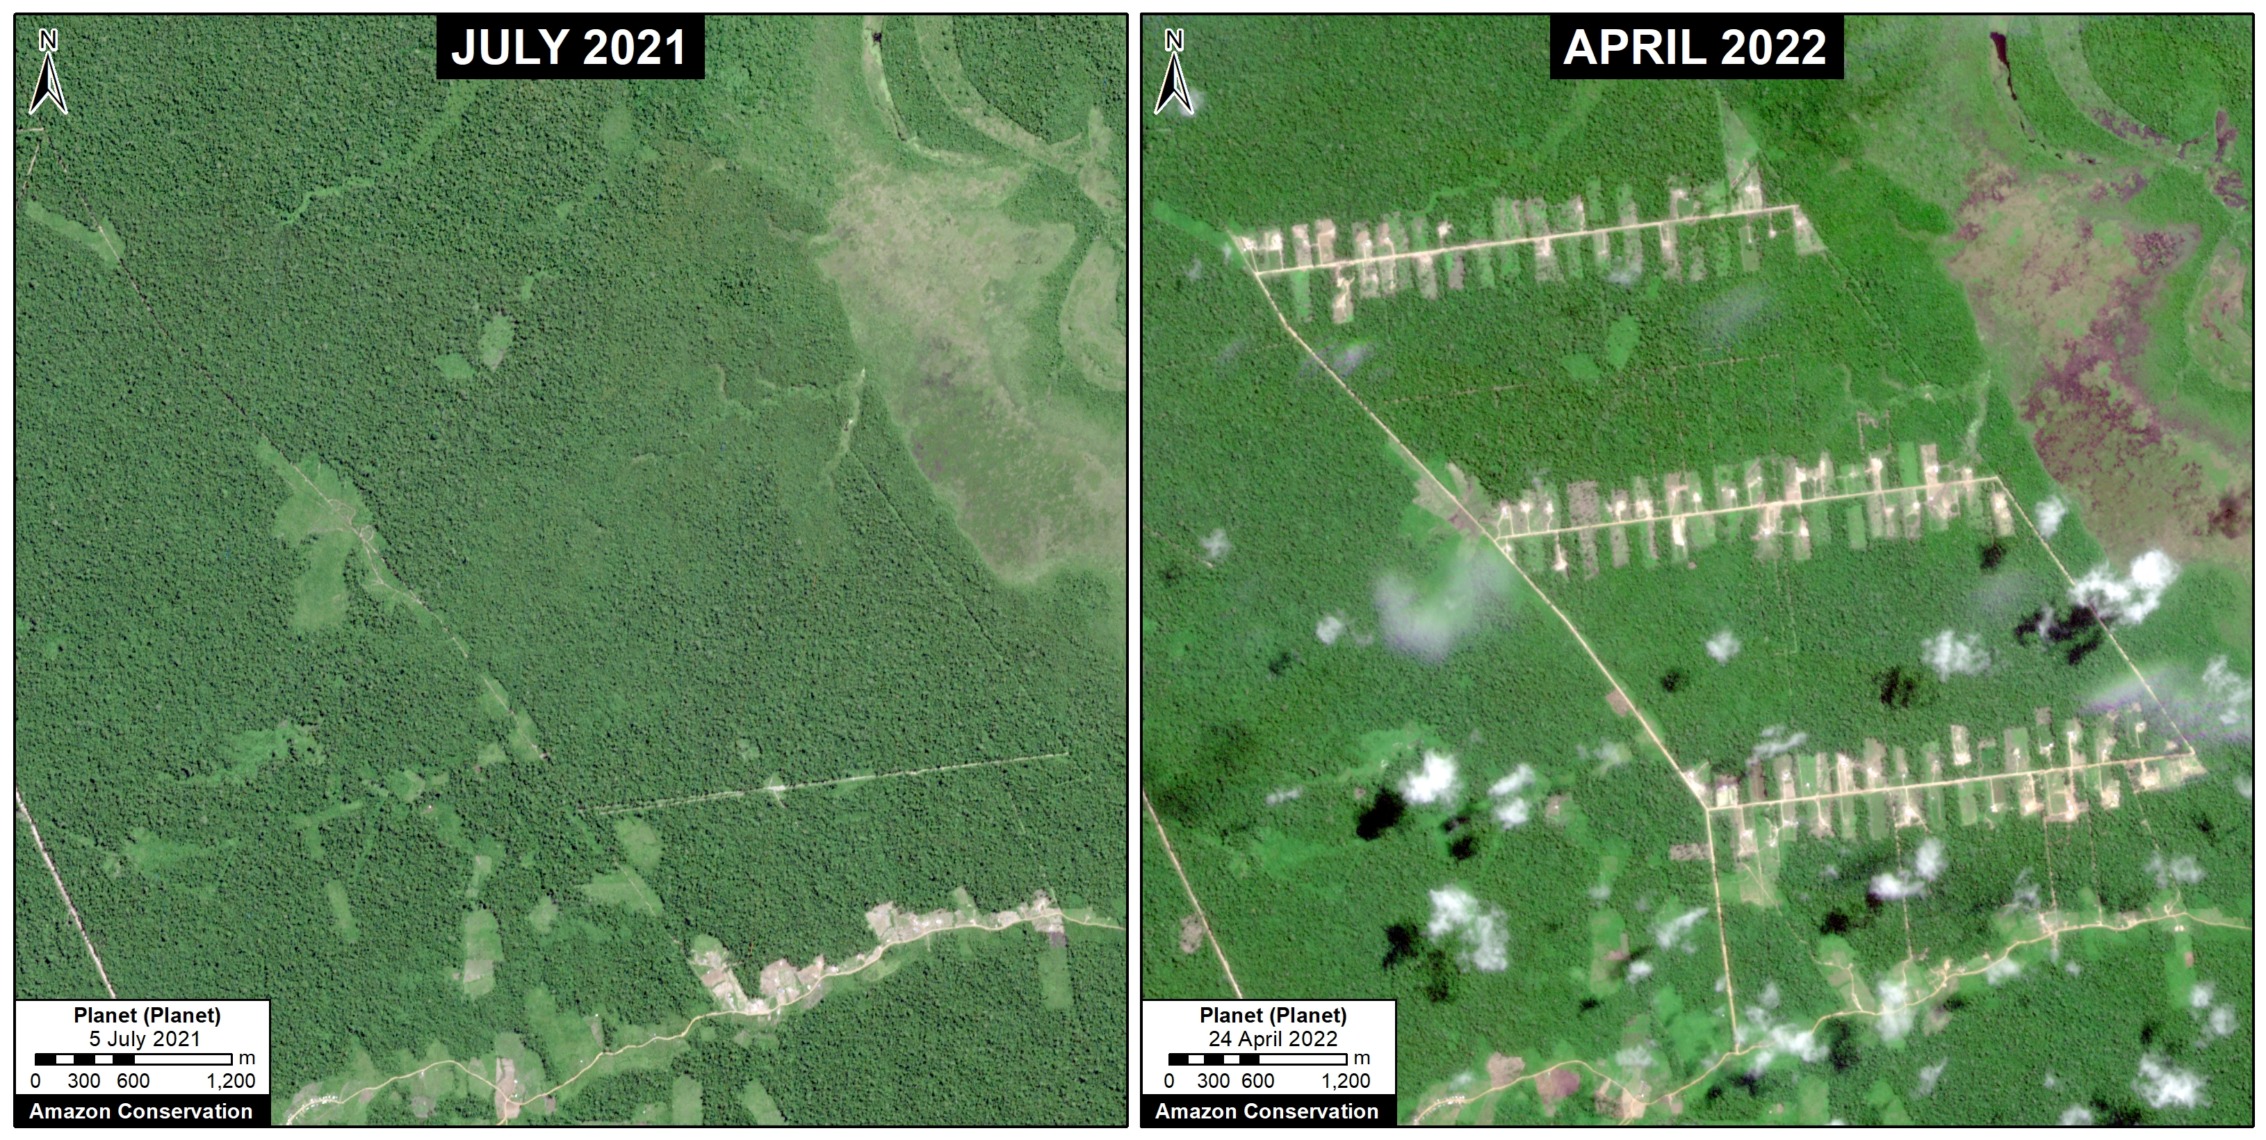
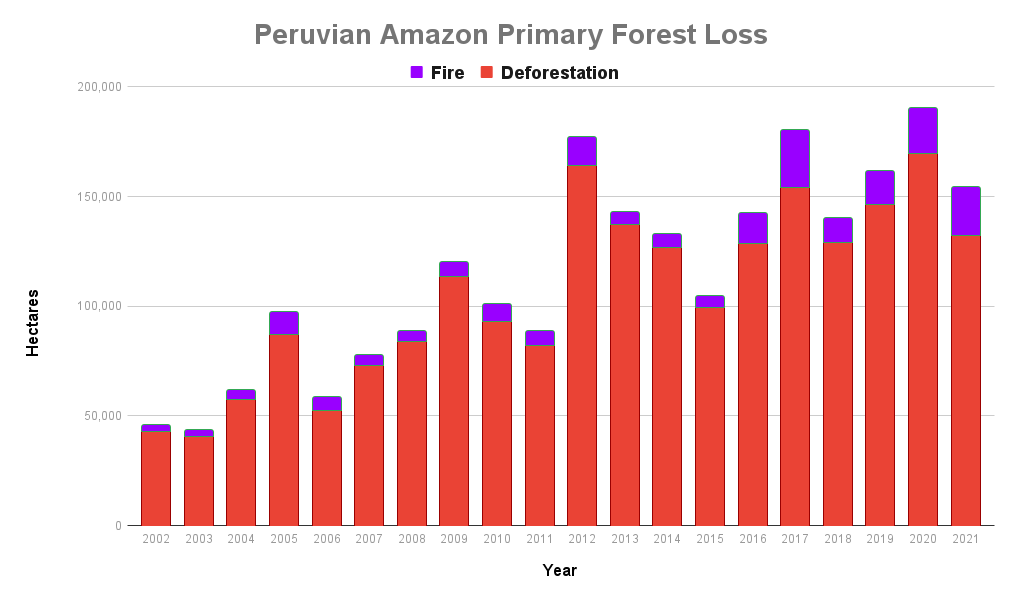
In 2022, the Peruvian Amazon lost 144,682 hectares of primary forest to deforestation. Fires directly impacted an additional 16,408 hectares.
Deforestation increased 6.7% from 2021, and was the 5th highest on record. Fire impact decreased from last year, but was still relatively high.
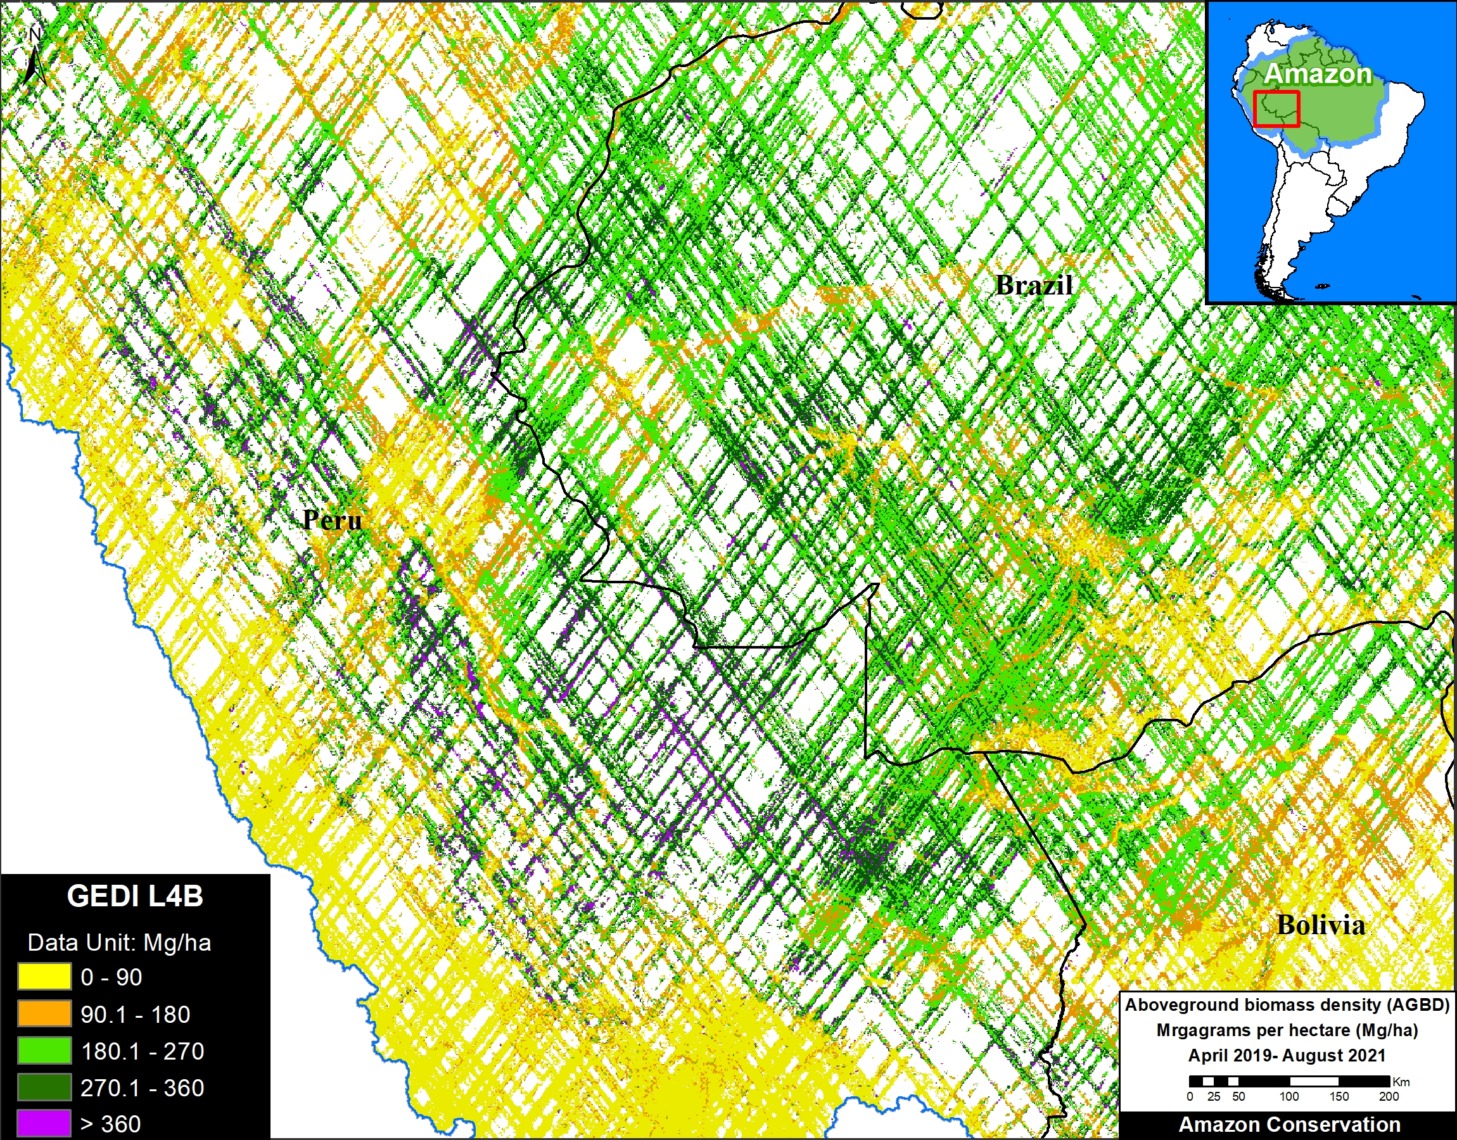
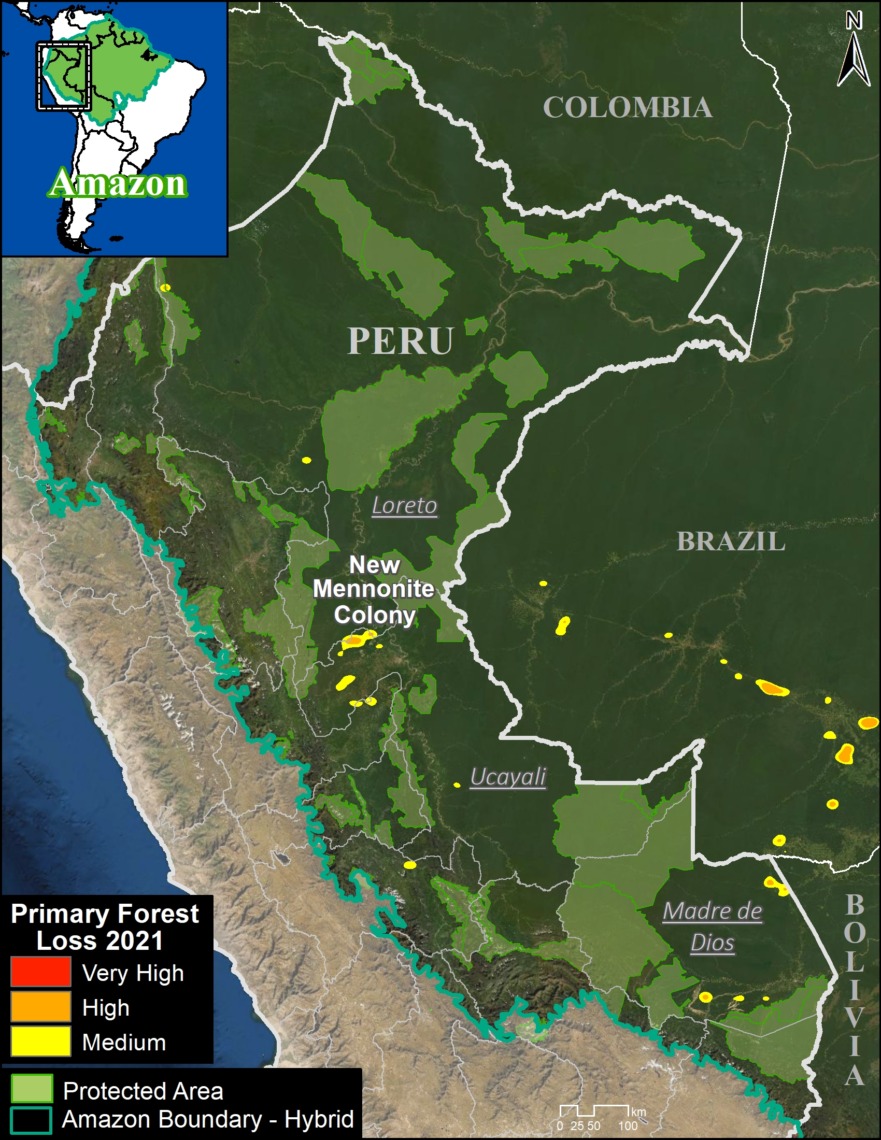
The deforestation was concentrated in the central and southern Amazon (Ucayali and Madre de Dios regions, respectively) (see Peru Base Map).
In the central Amazon, we highlight the rapid deforestation for a new Mennonite colony (see MAAP #166).
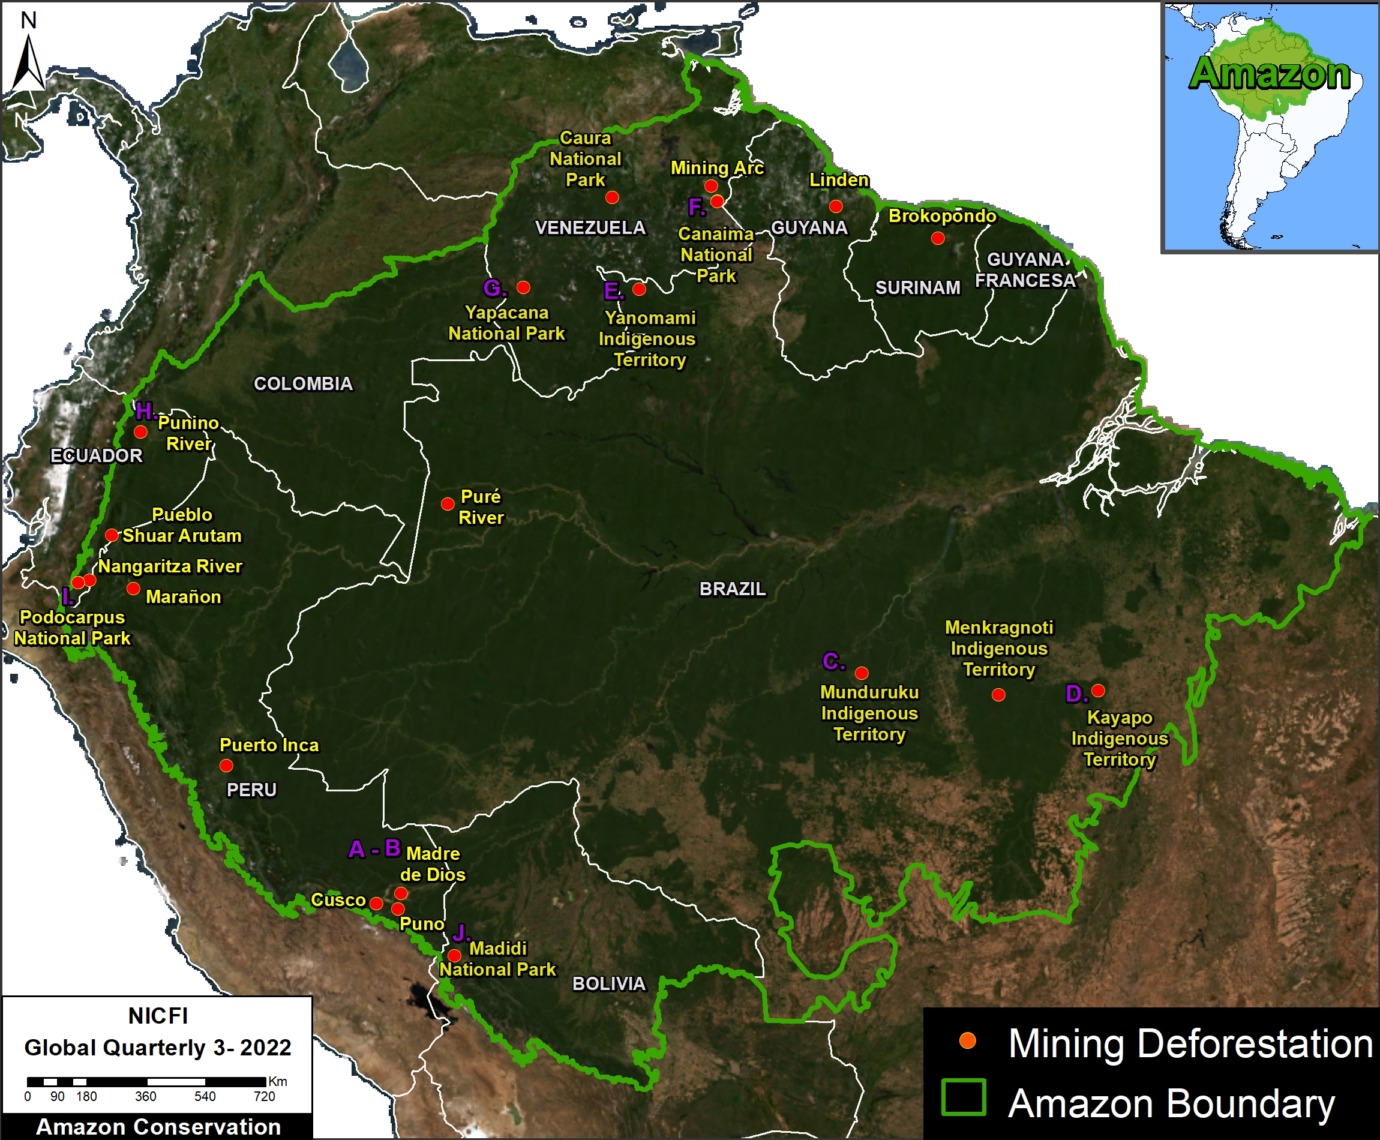
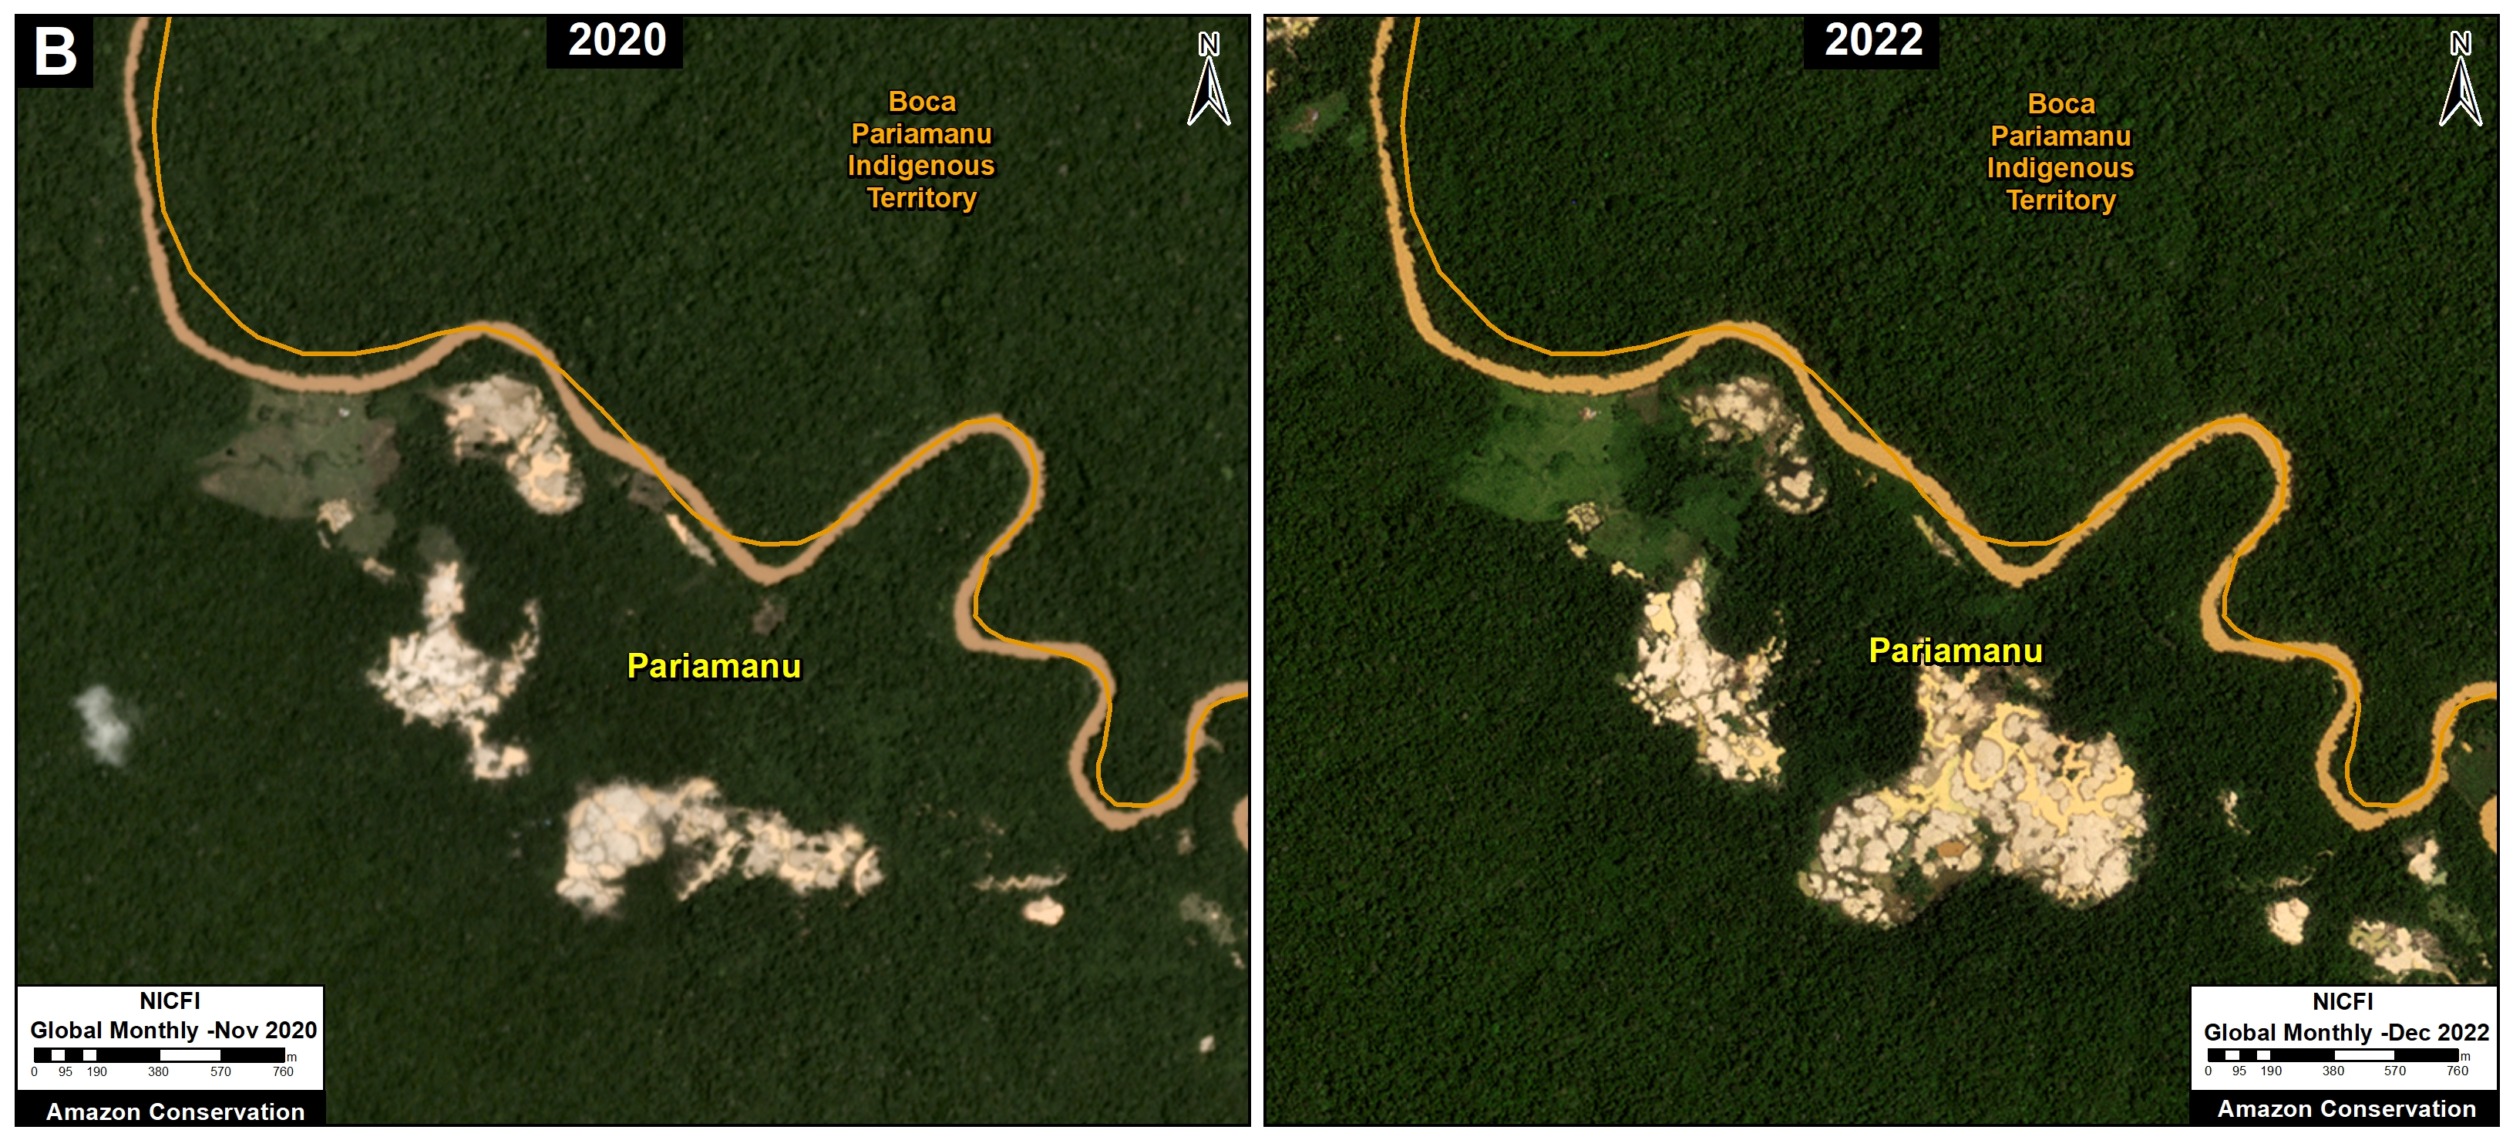
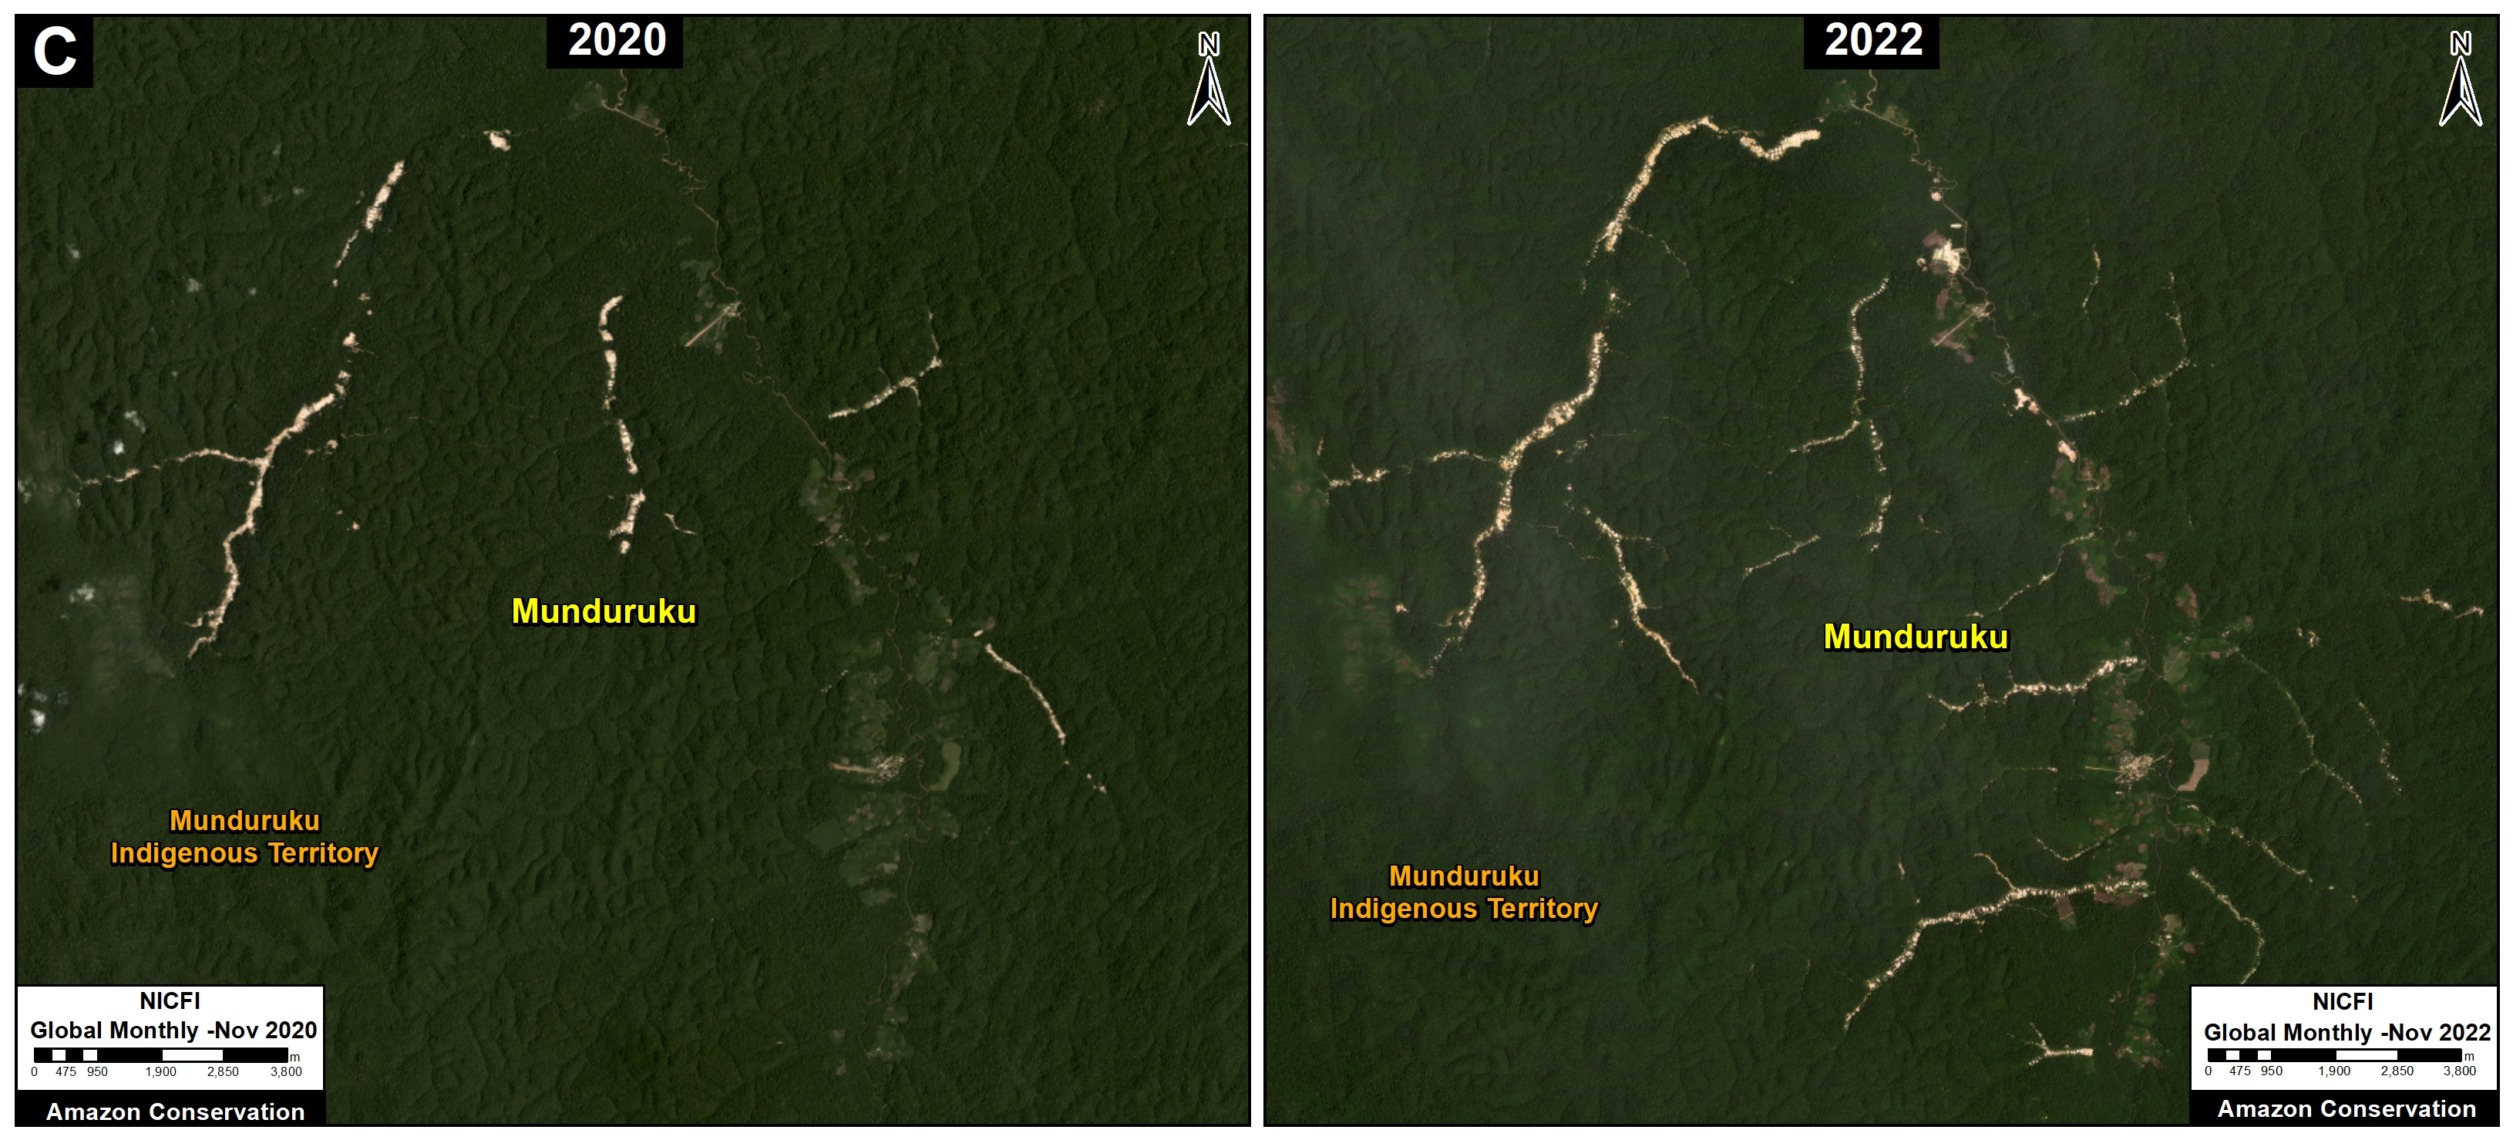
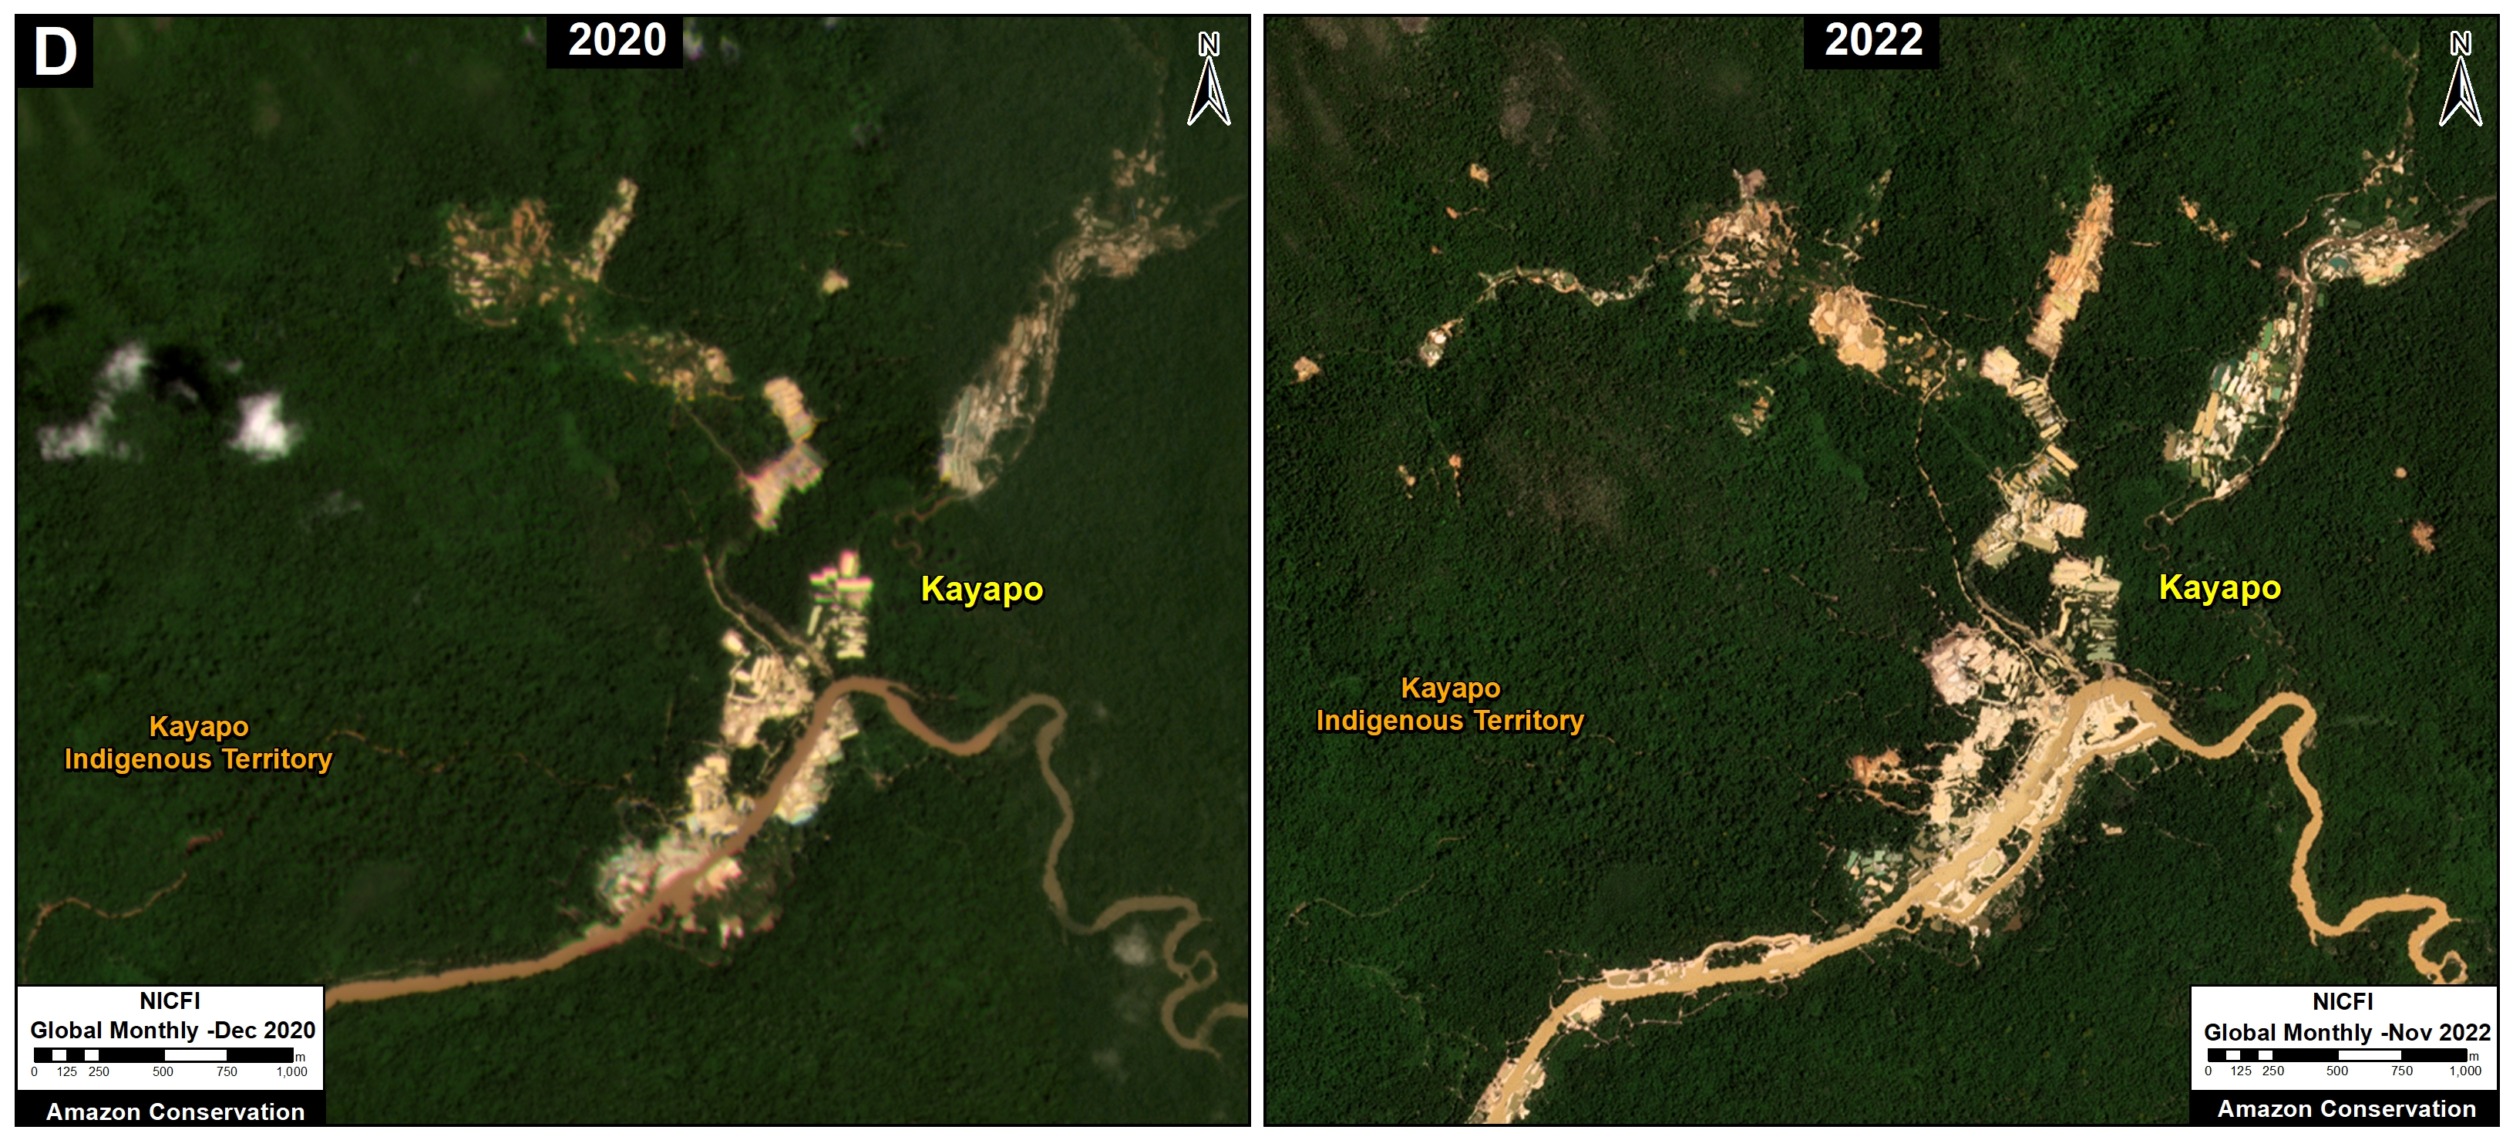
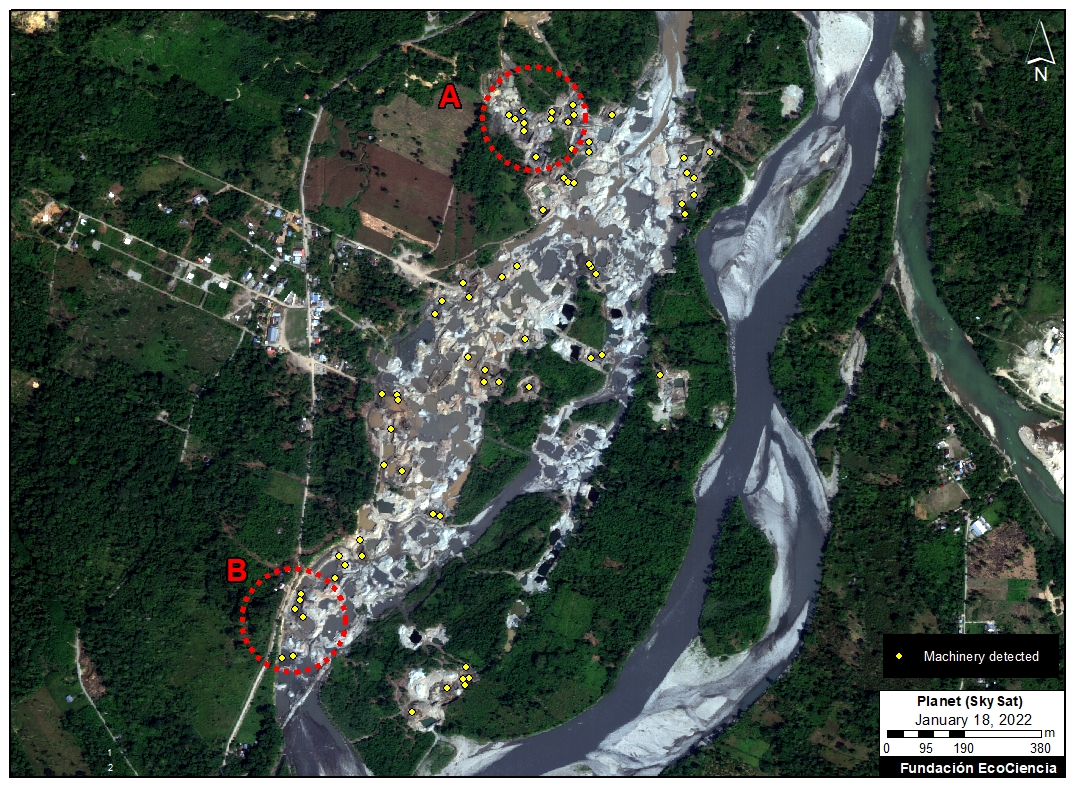
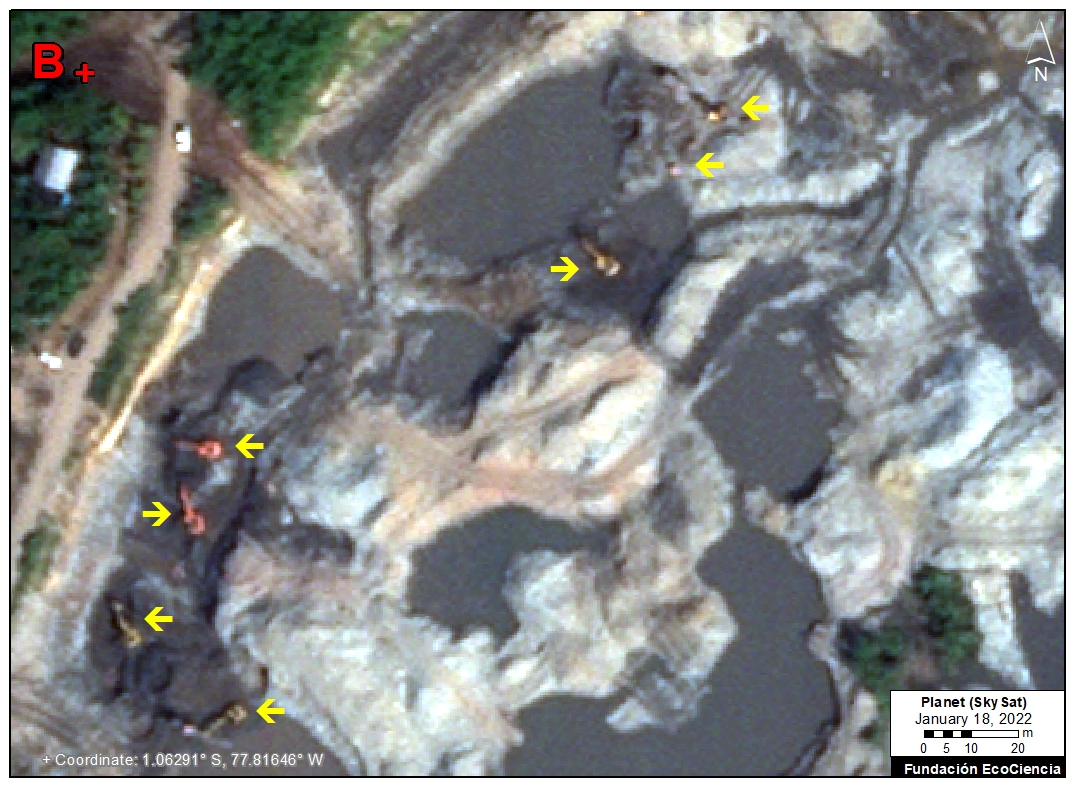
In the southern Amazon, gold mining deforestation continues to be an issue in indigenous communities and within the official Mining Corridor.
Colombian Amazon
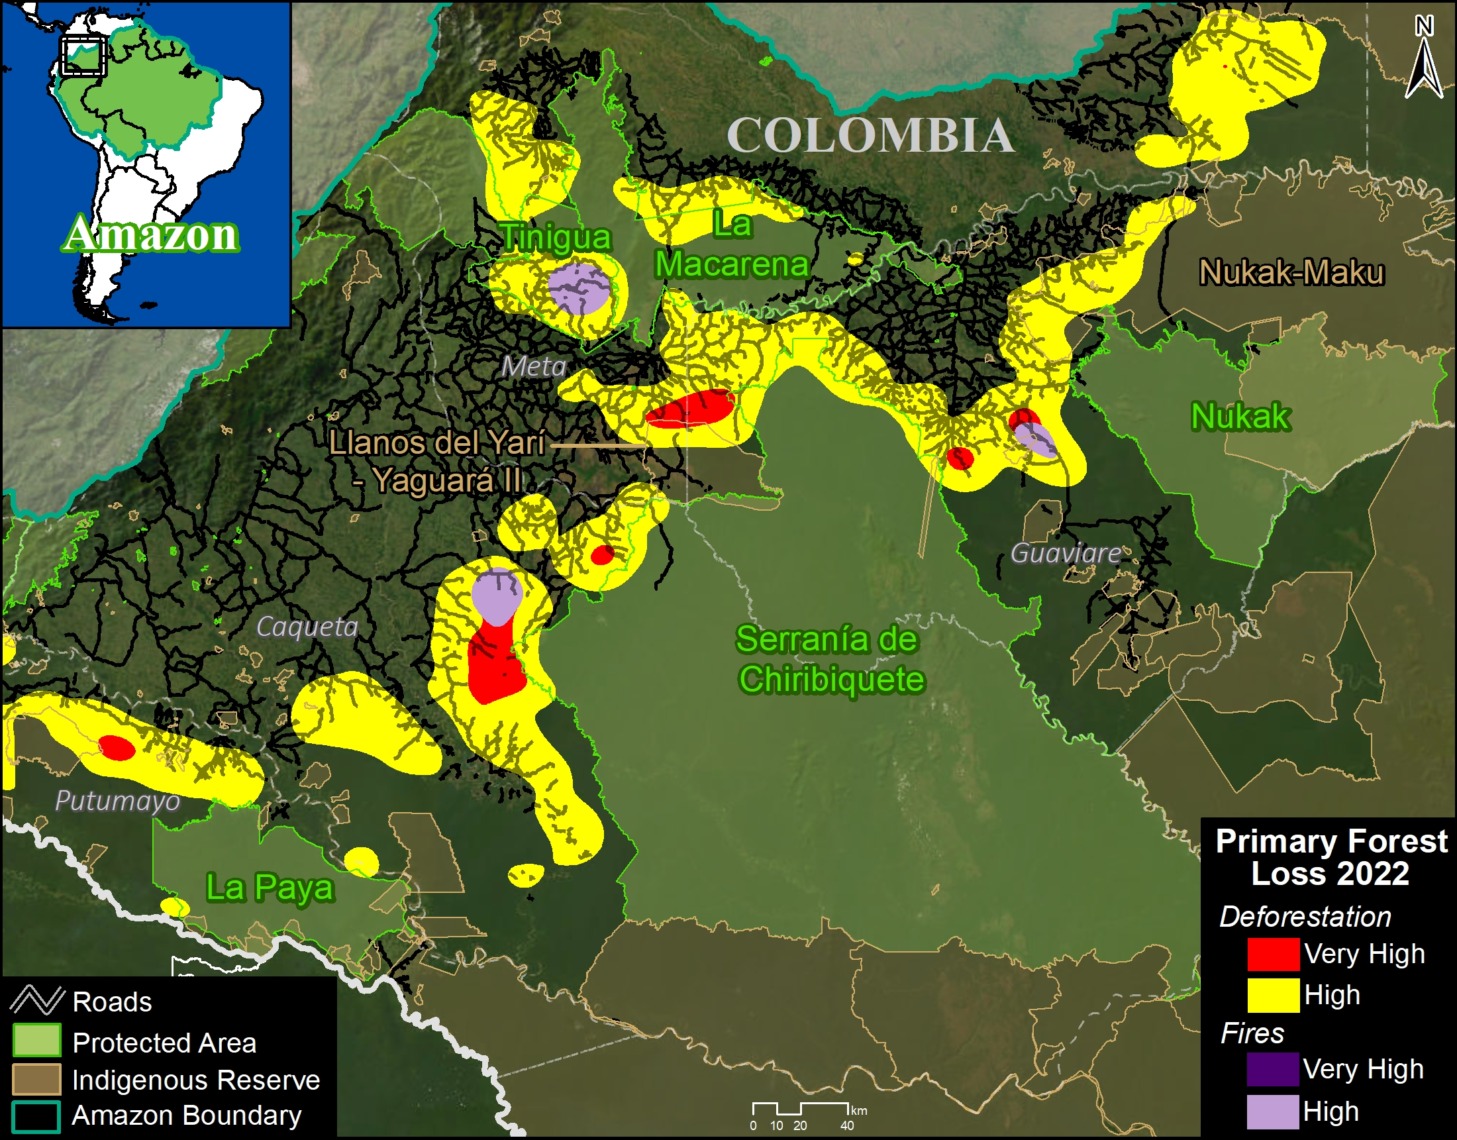
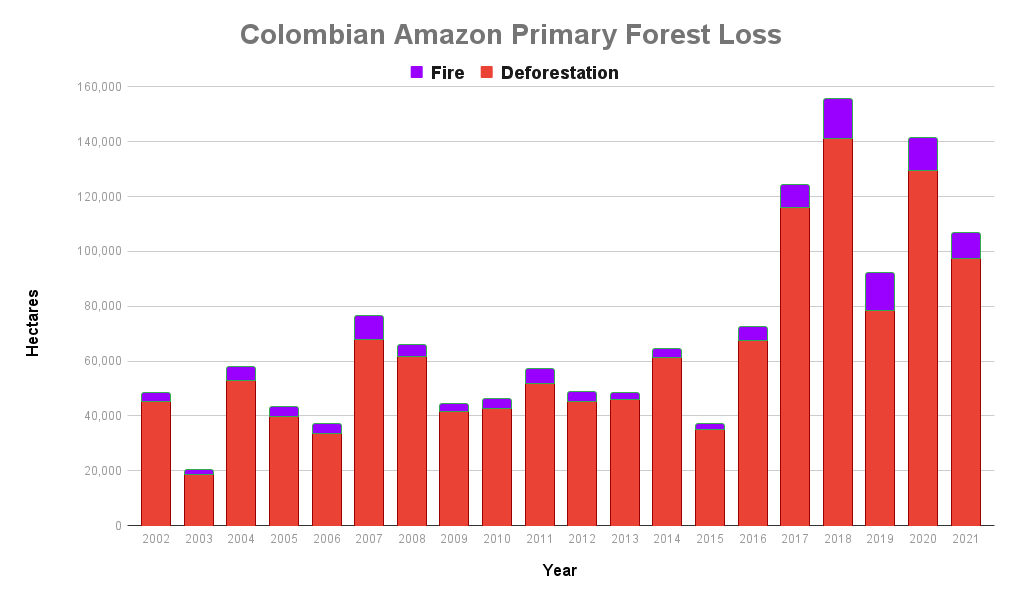
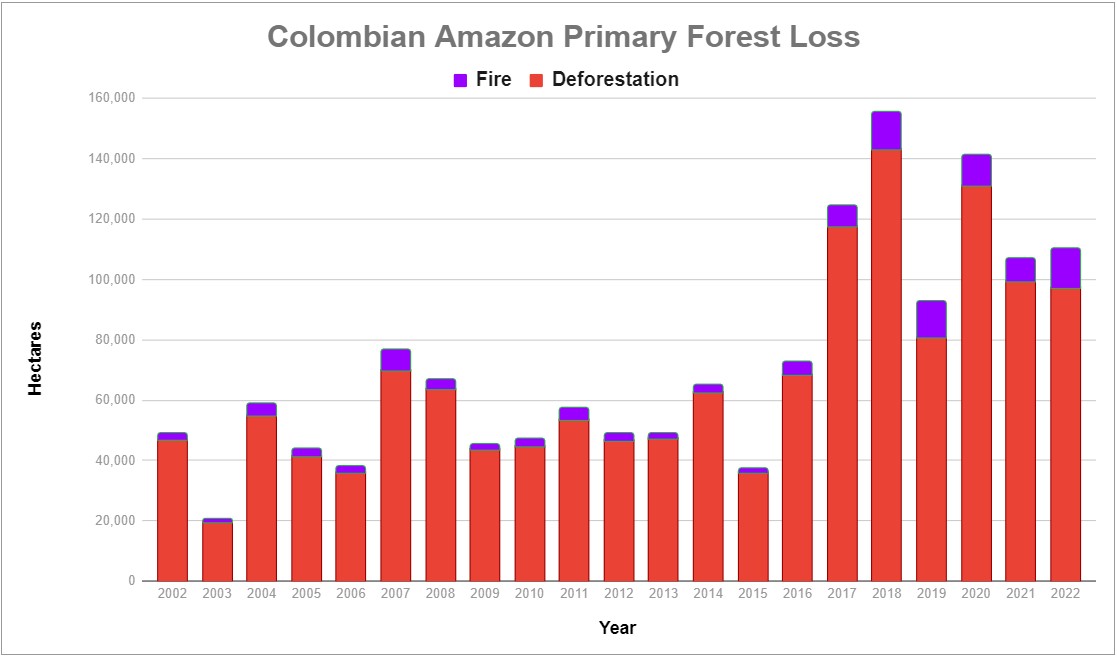
In 2022, the Colombian Amazon lost 97,417 hectares of primary forest to deforestation. Fires directly impacted an additional 12,880 hectares.
Deforestation decreased 2% from 2021, but it was still relatively high (5th highest on record), continuing the trend of elevated forest loss since the FARC peace agreement in 2016.
Fire impact increased from last year and was actually the highest on record, edging out 2018 and 2019.
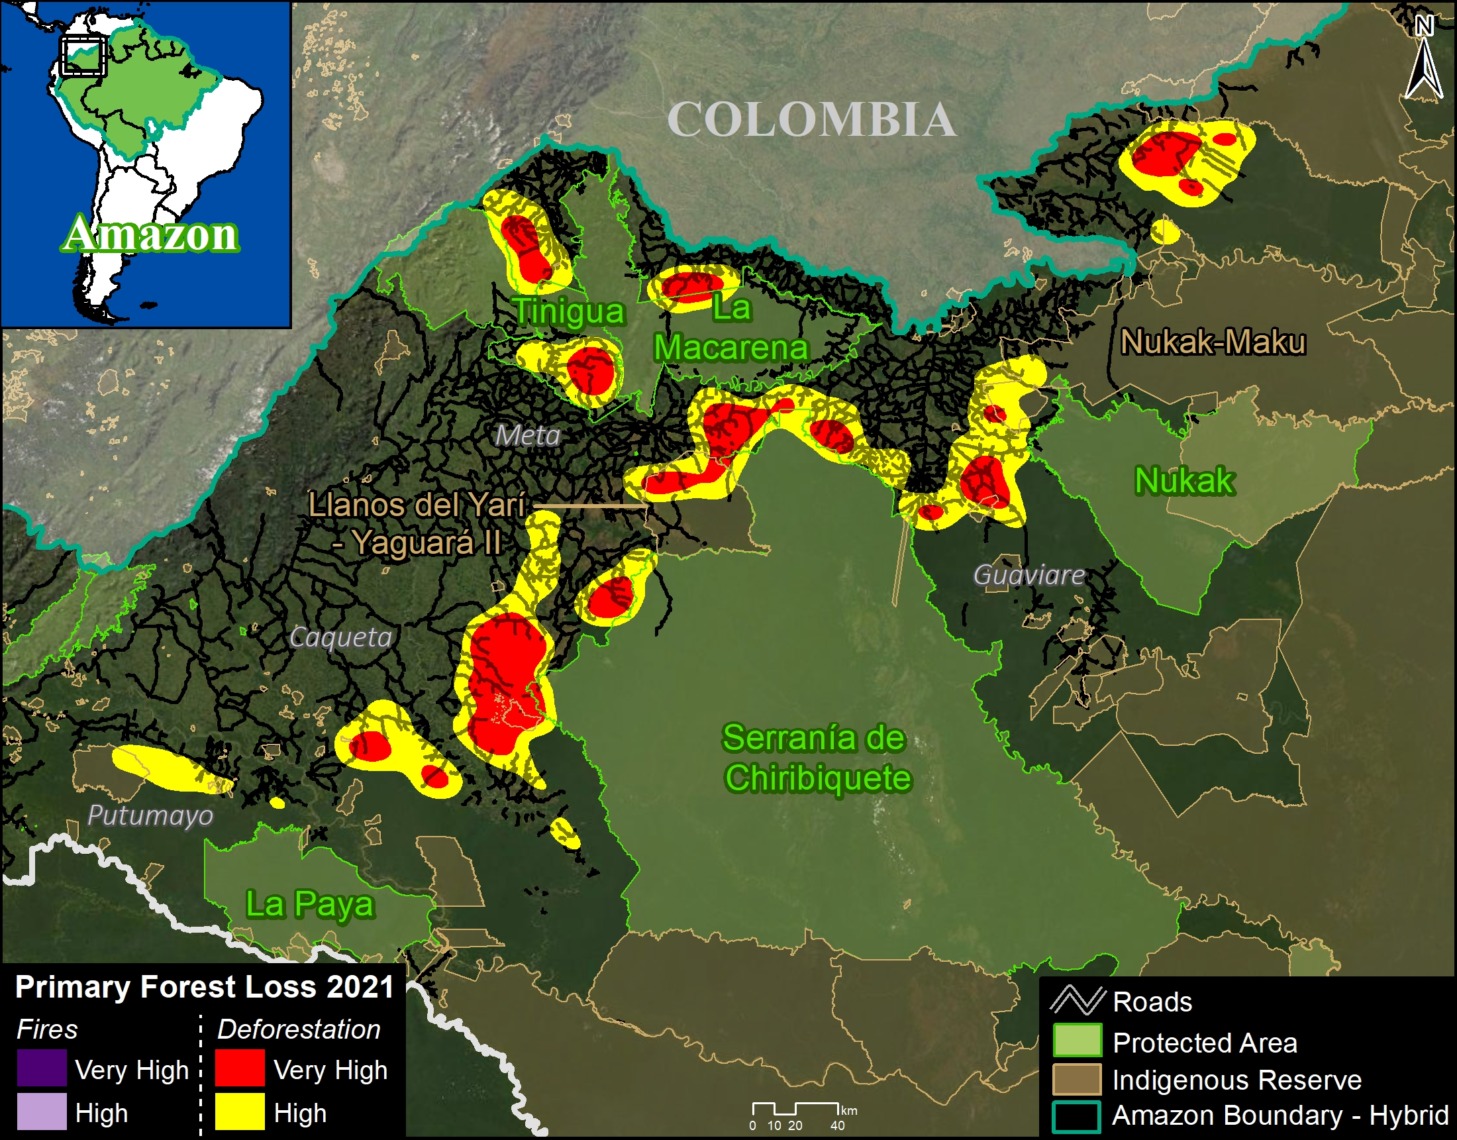
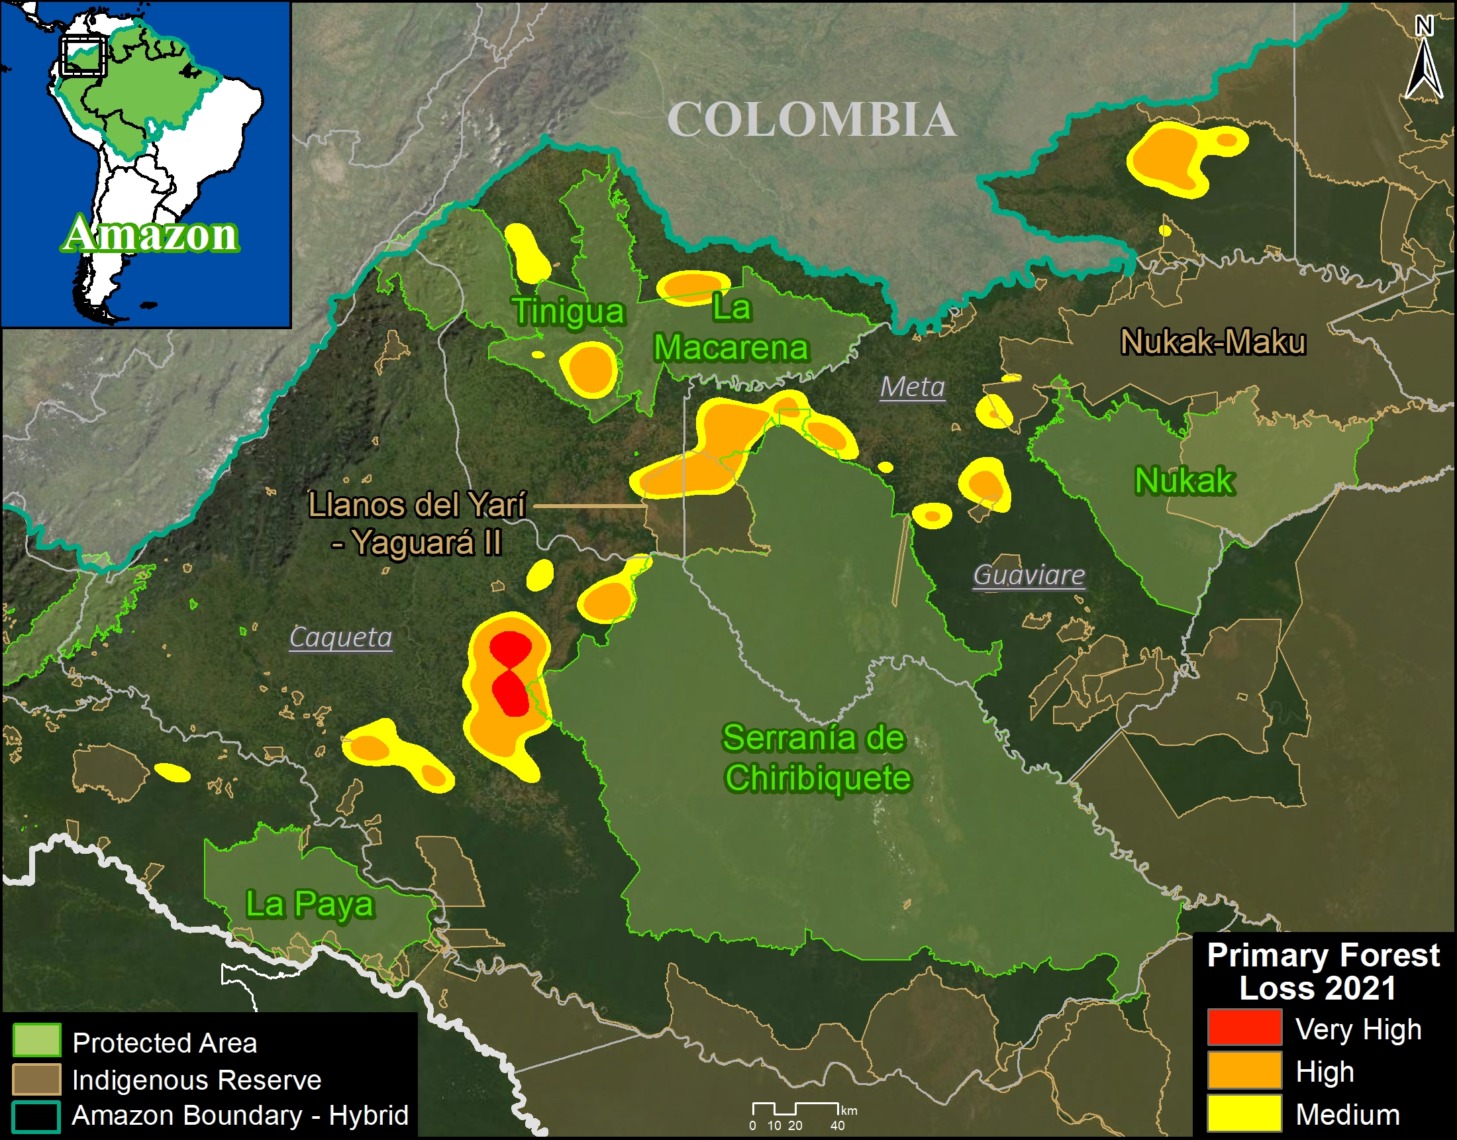
As described in previous reports (see MAAP #120), the Colombia Base Map shows there continues to be an “arc of deforestation” in the northwest Colombian Amazon (Caqueta, Meta, and Guaviare departments).
This arc impacts numerous Protected Areas (particularly Tinigua and Chiribiquete National Parks) and Indigenous Reserves (particularly Yari-Yaguara II and Nukak Maku).
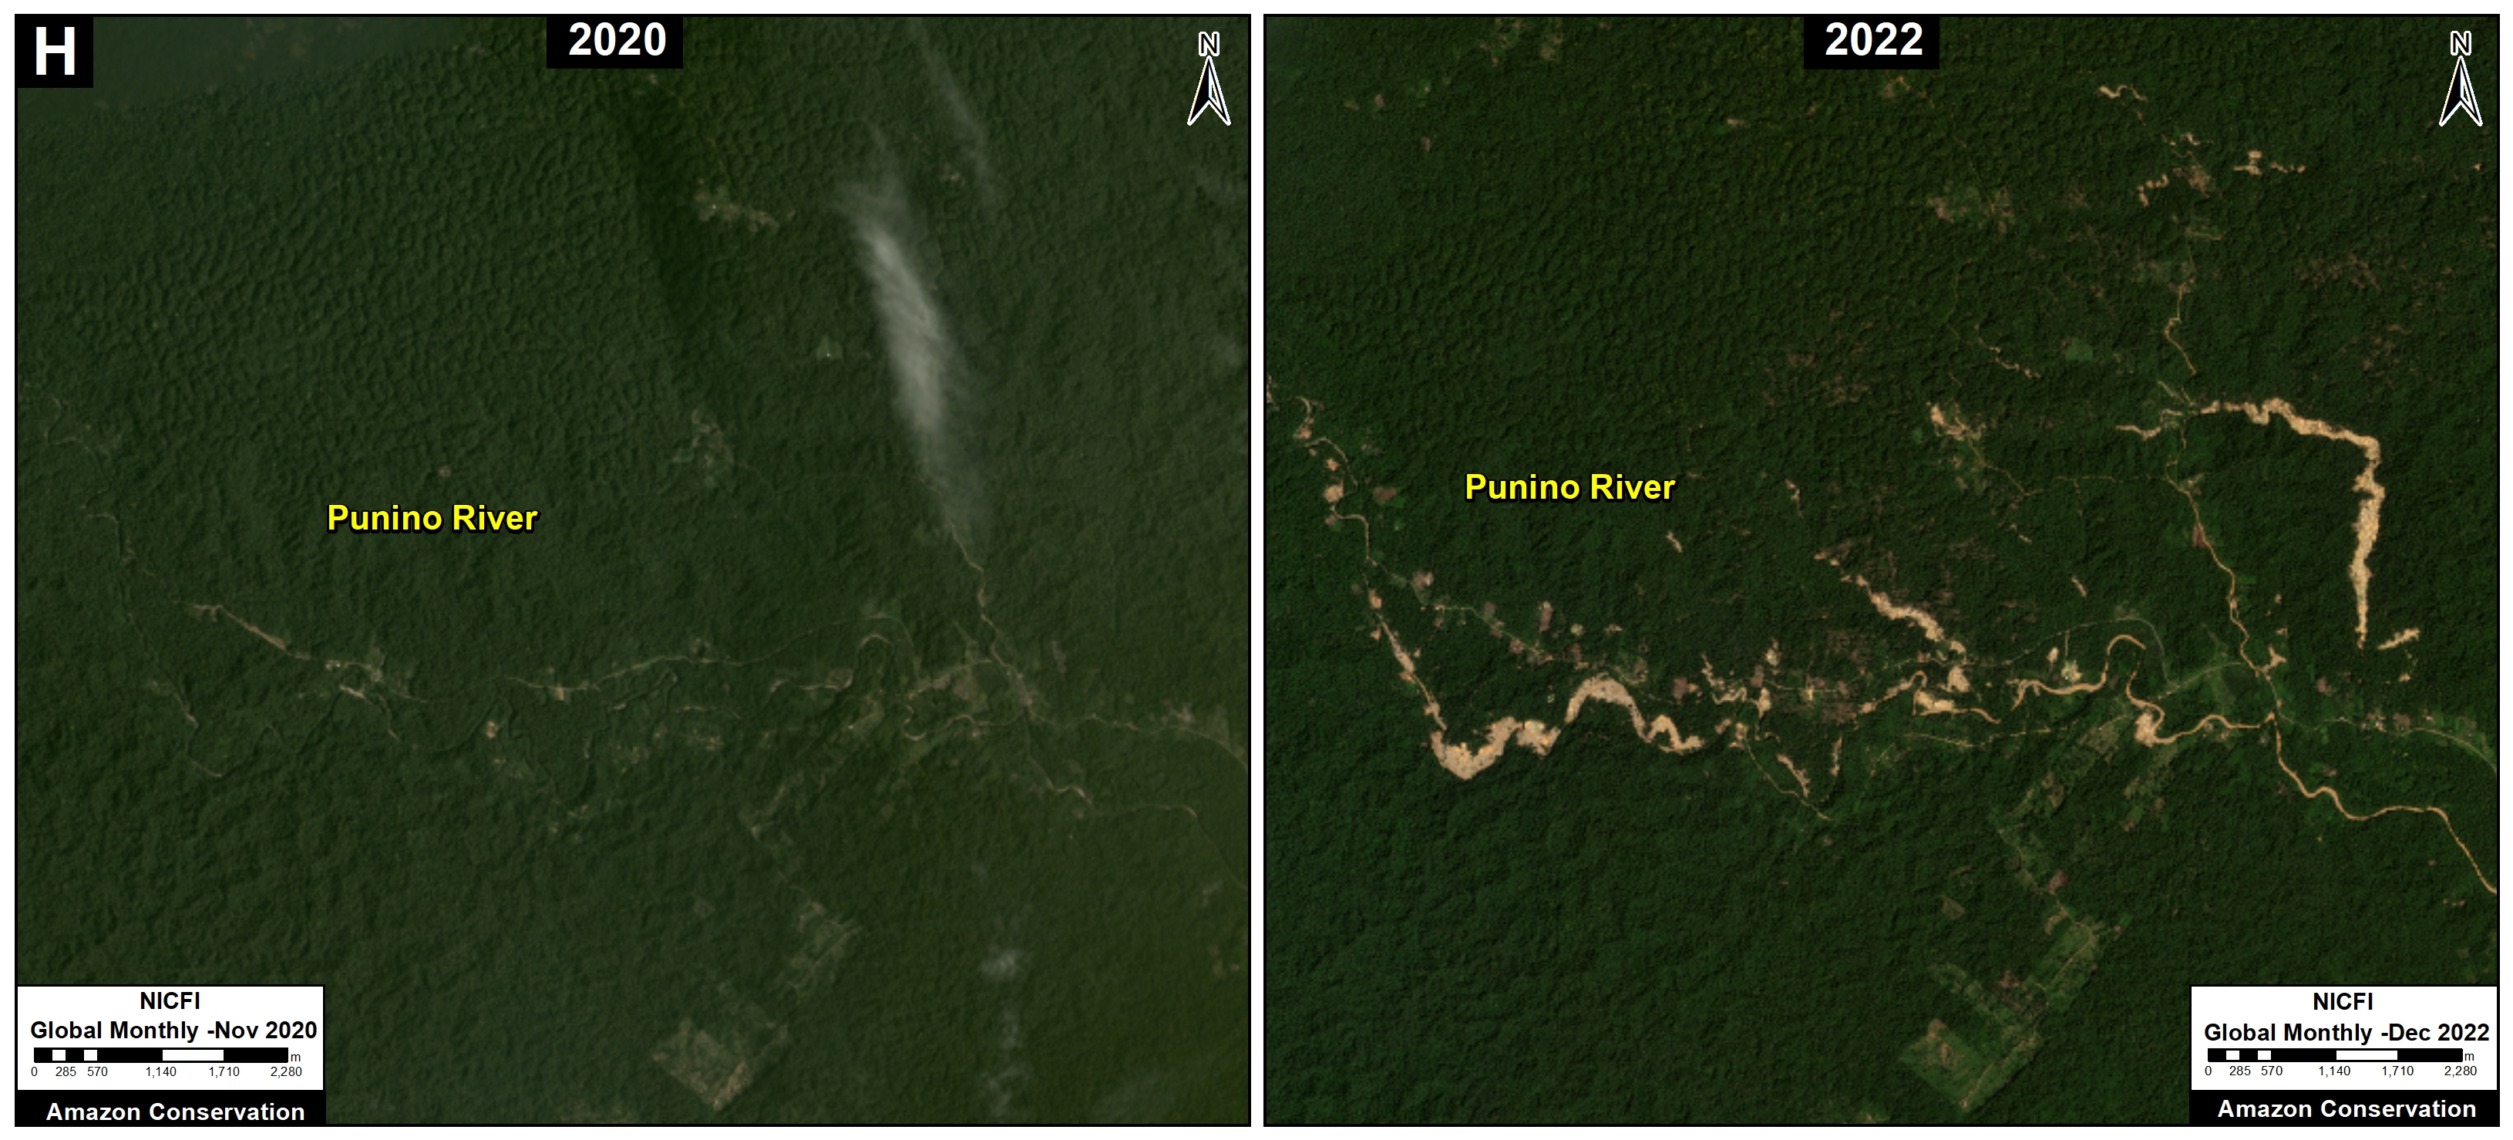
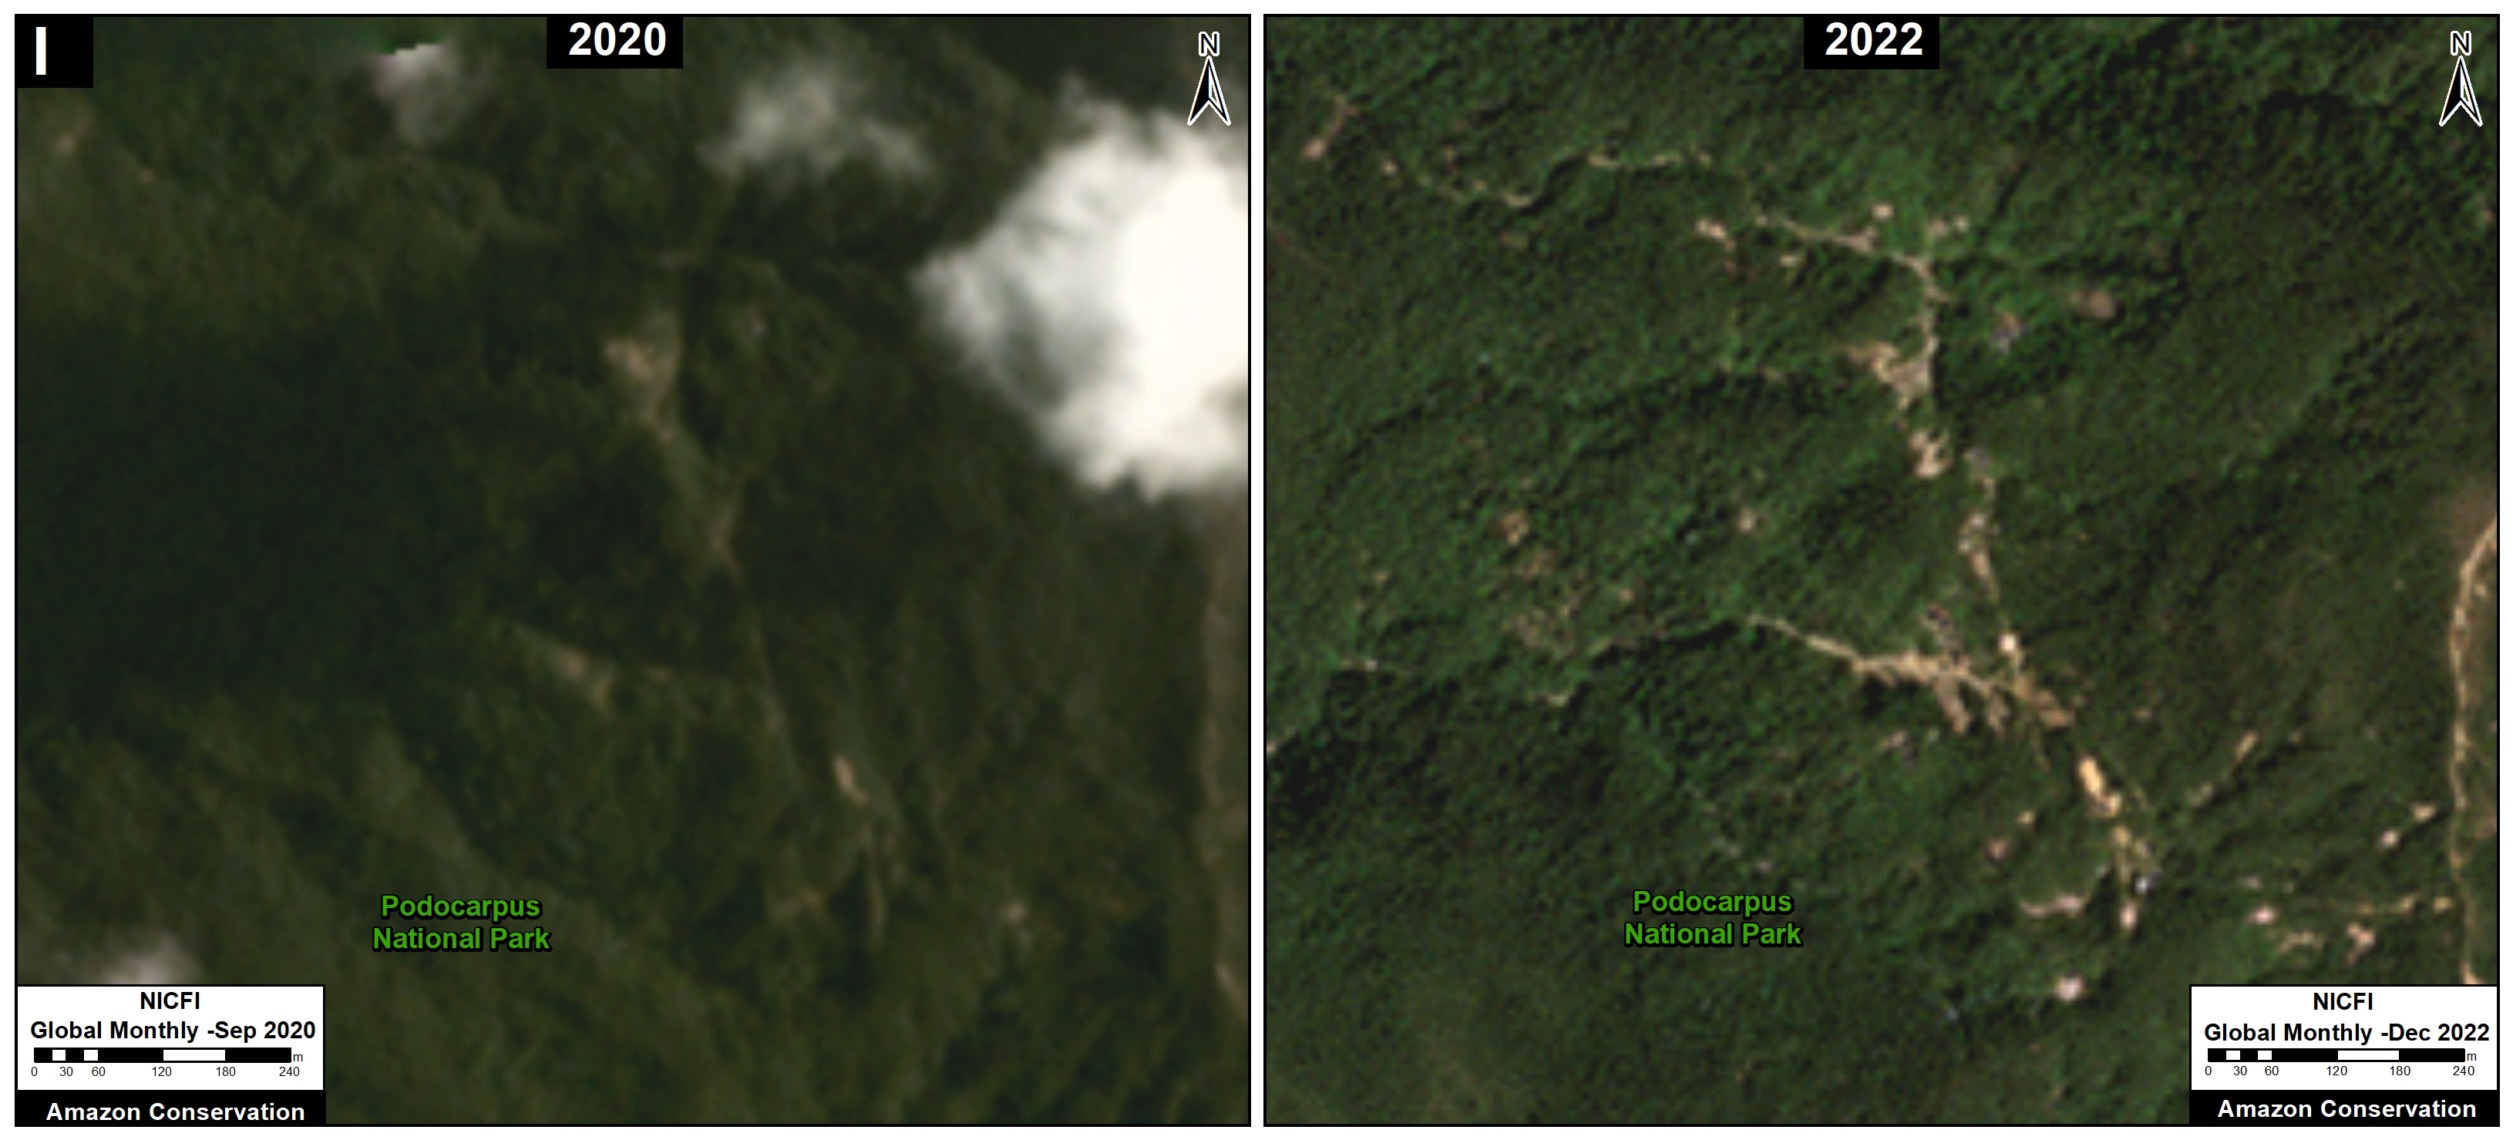
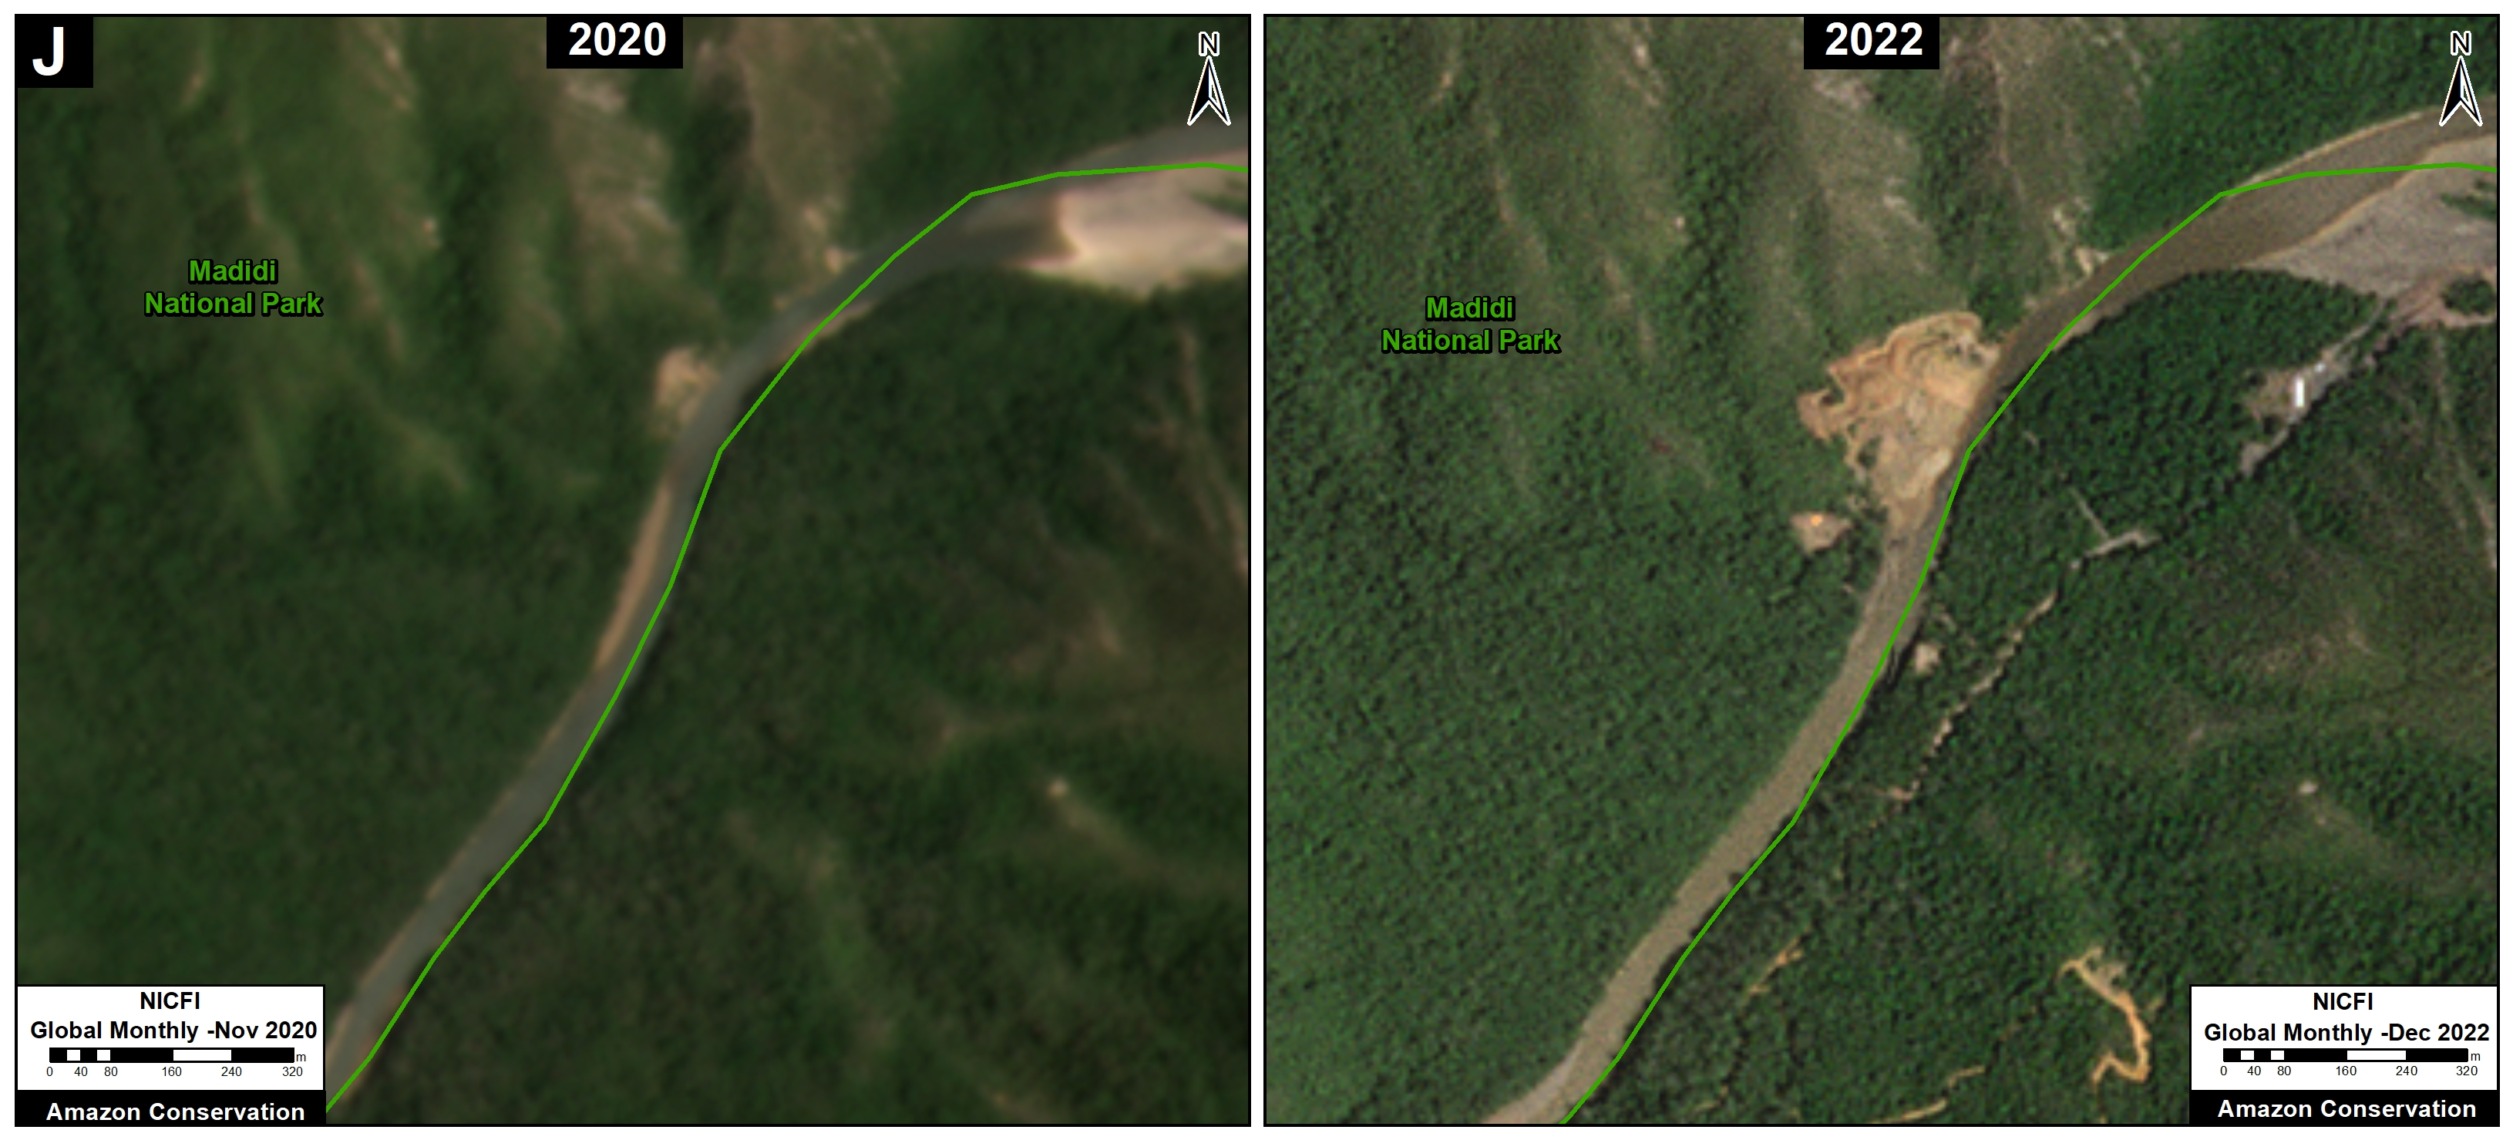
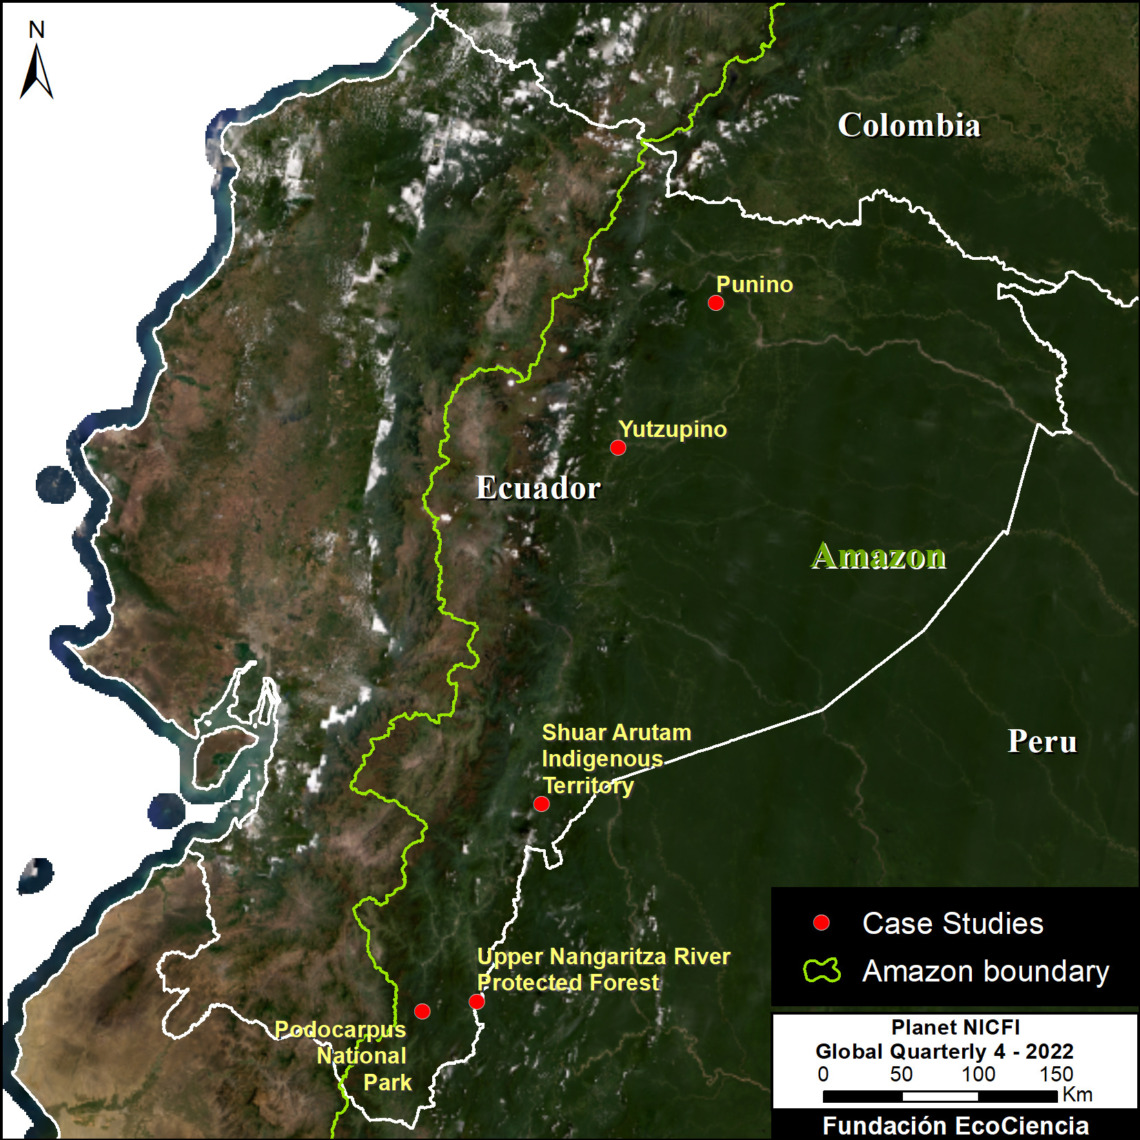
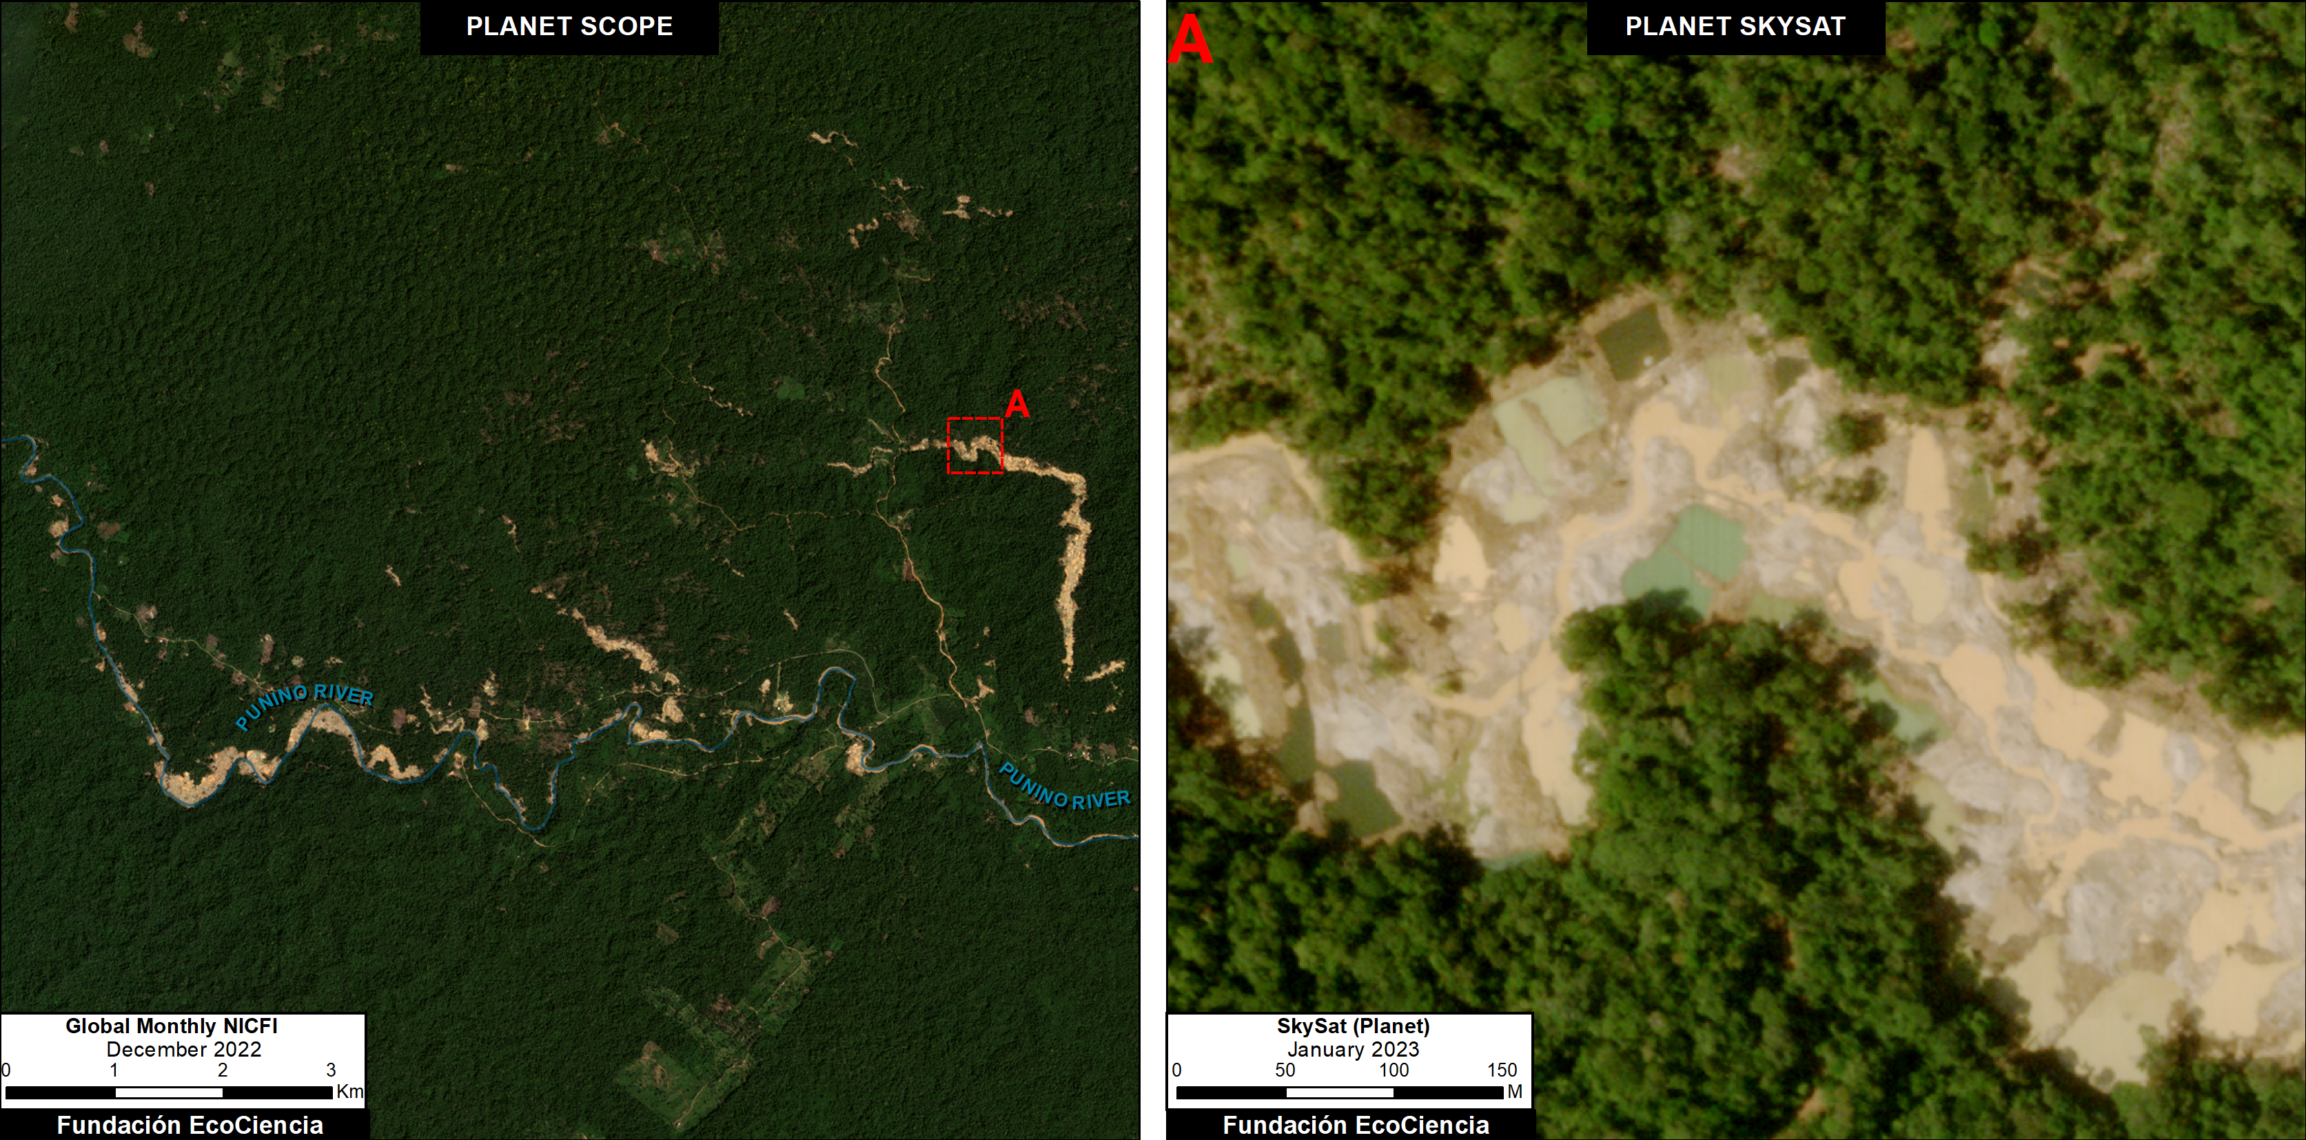
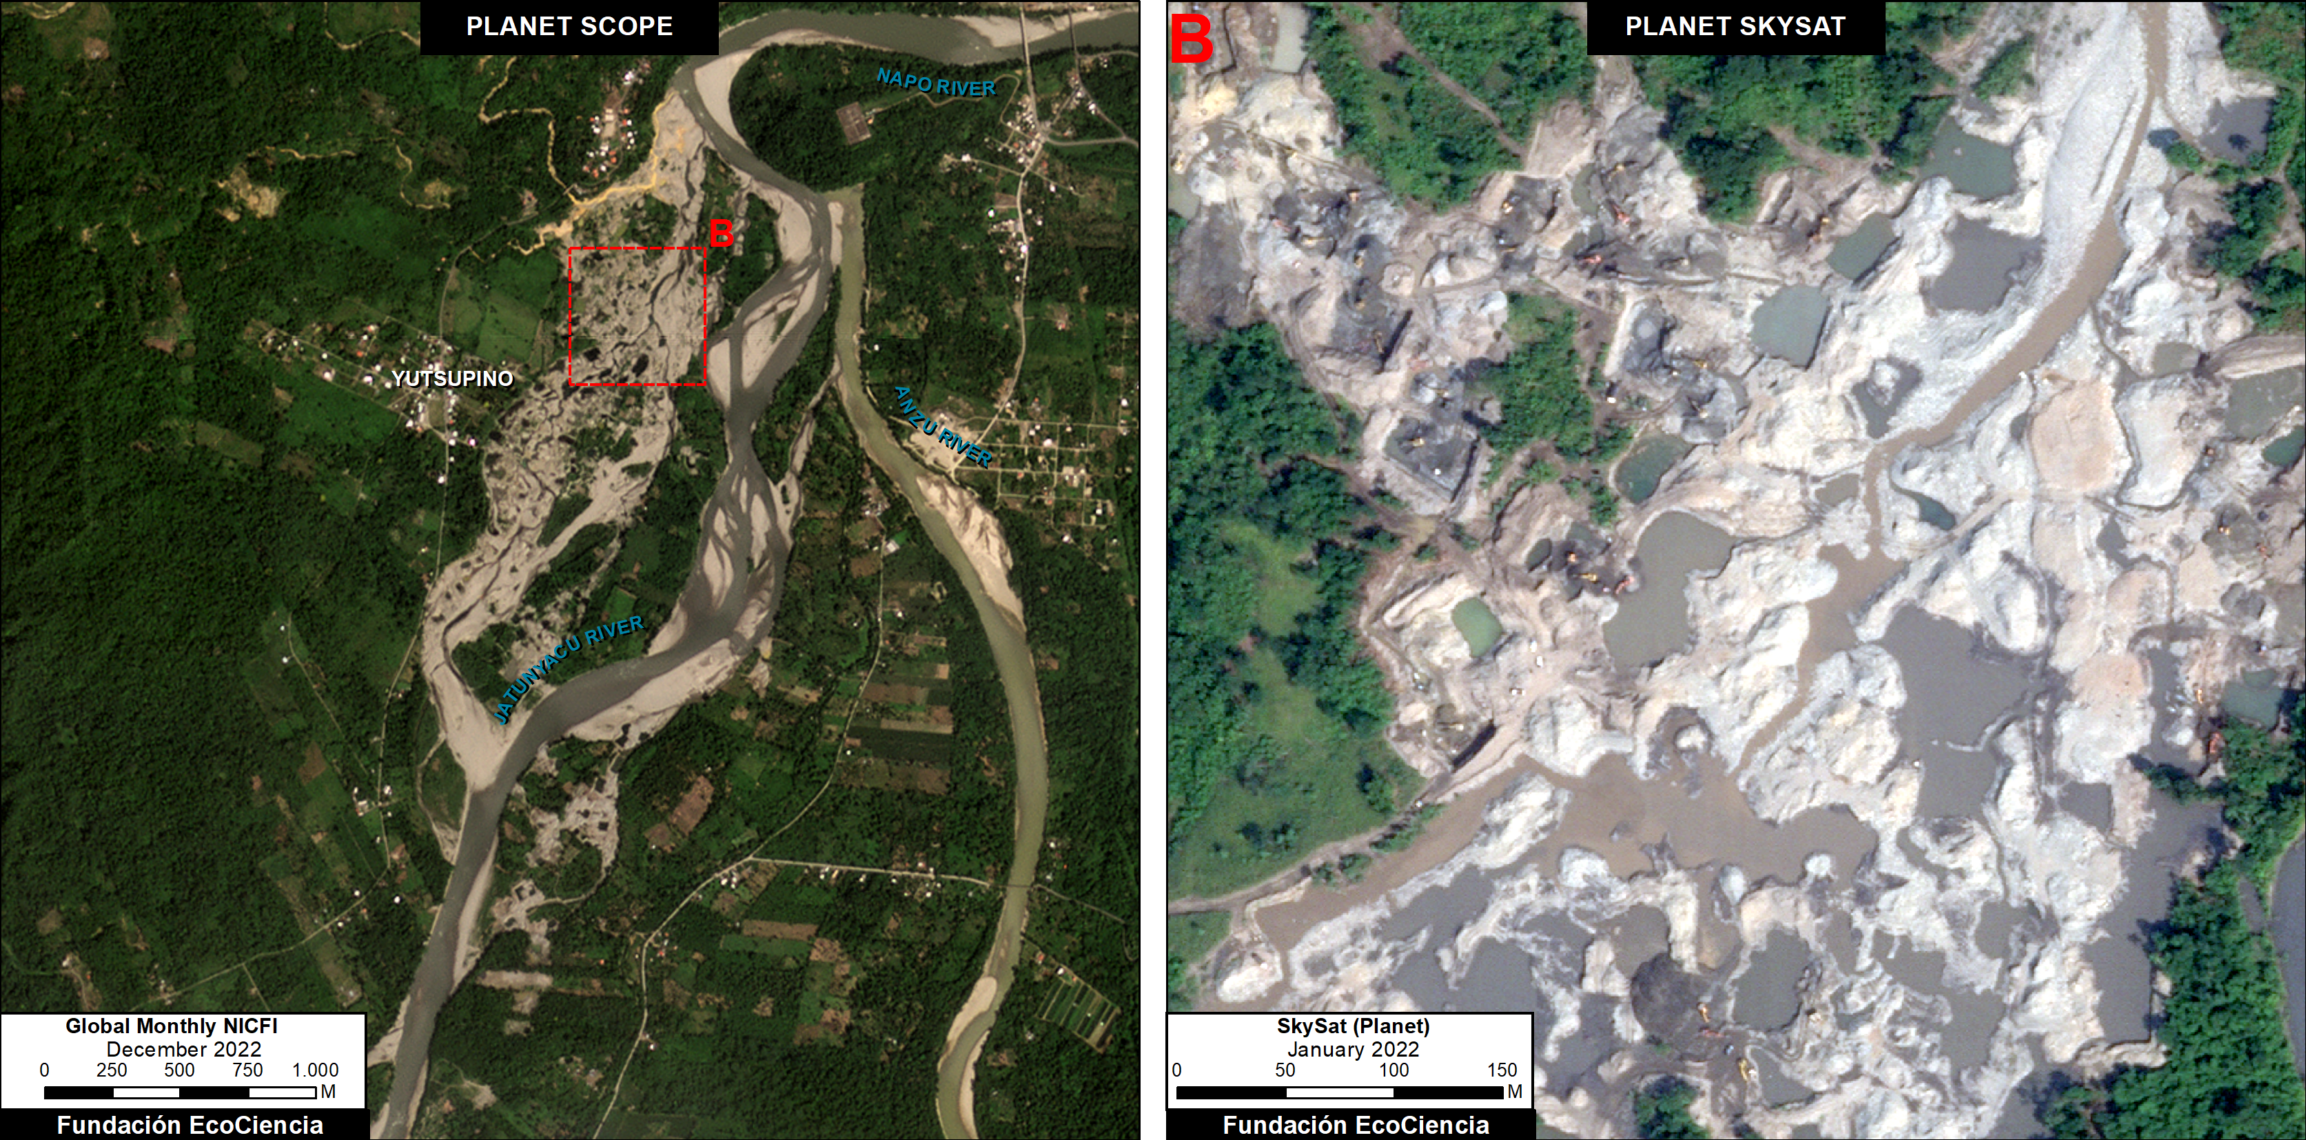
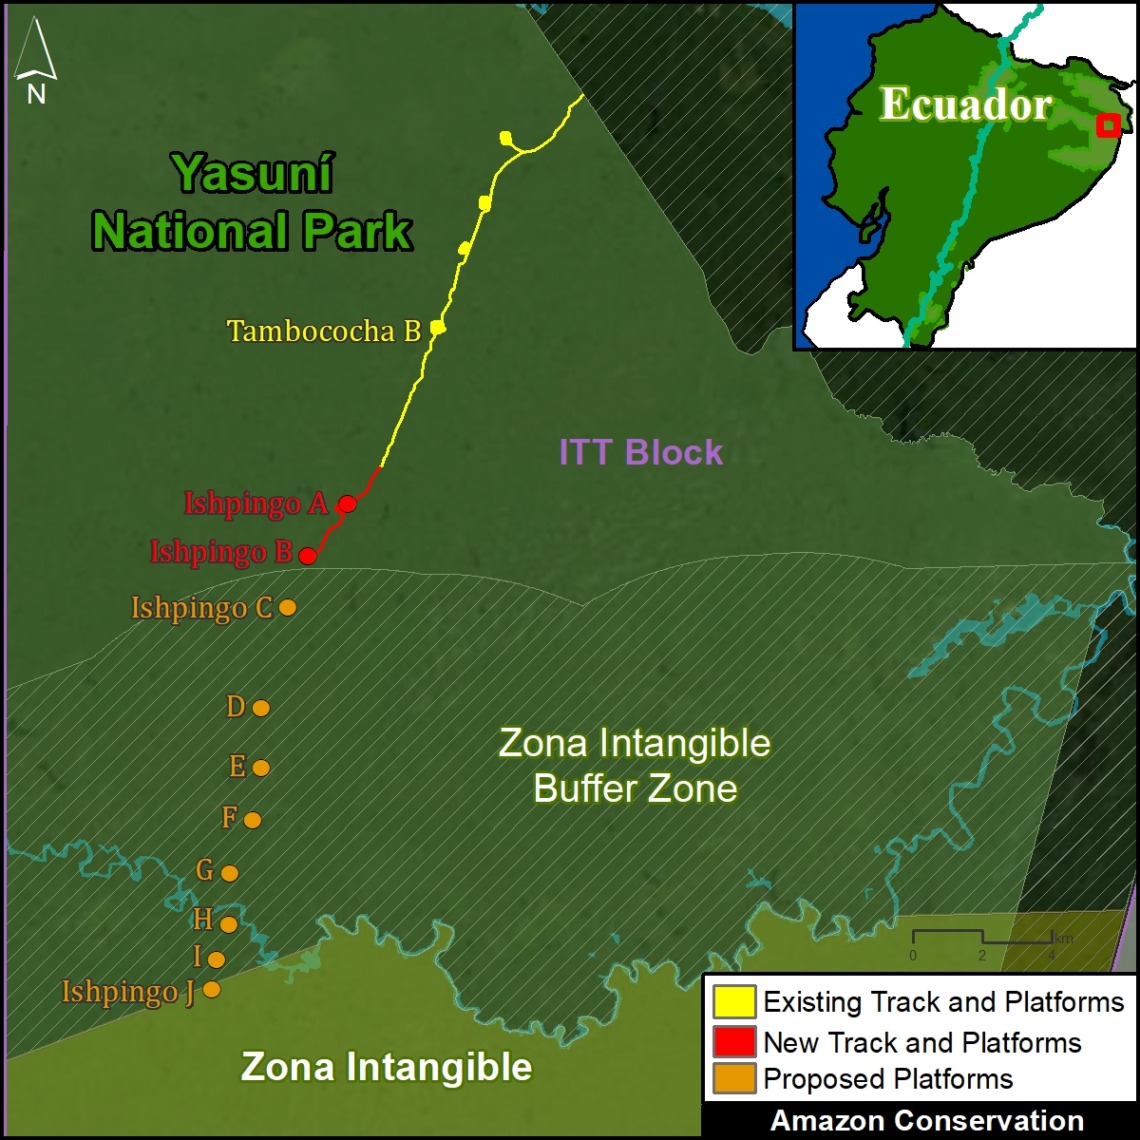
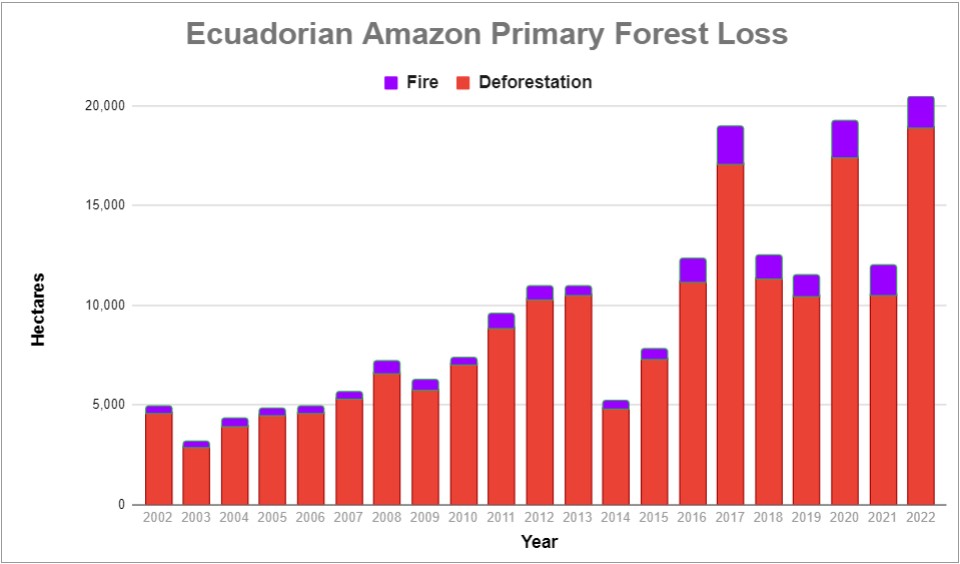
Ecuadorian Amazon
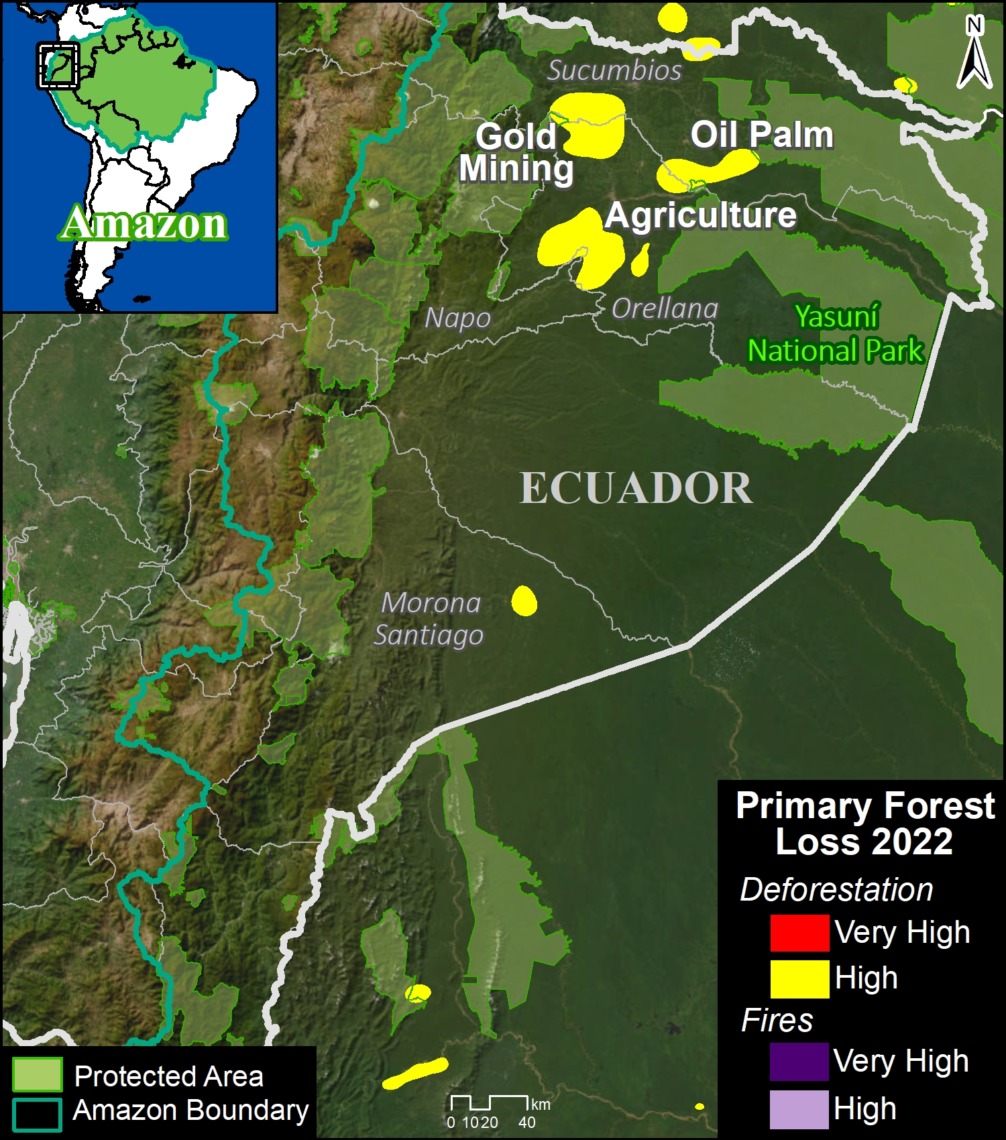
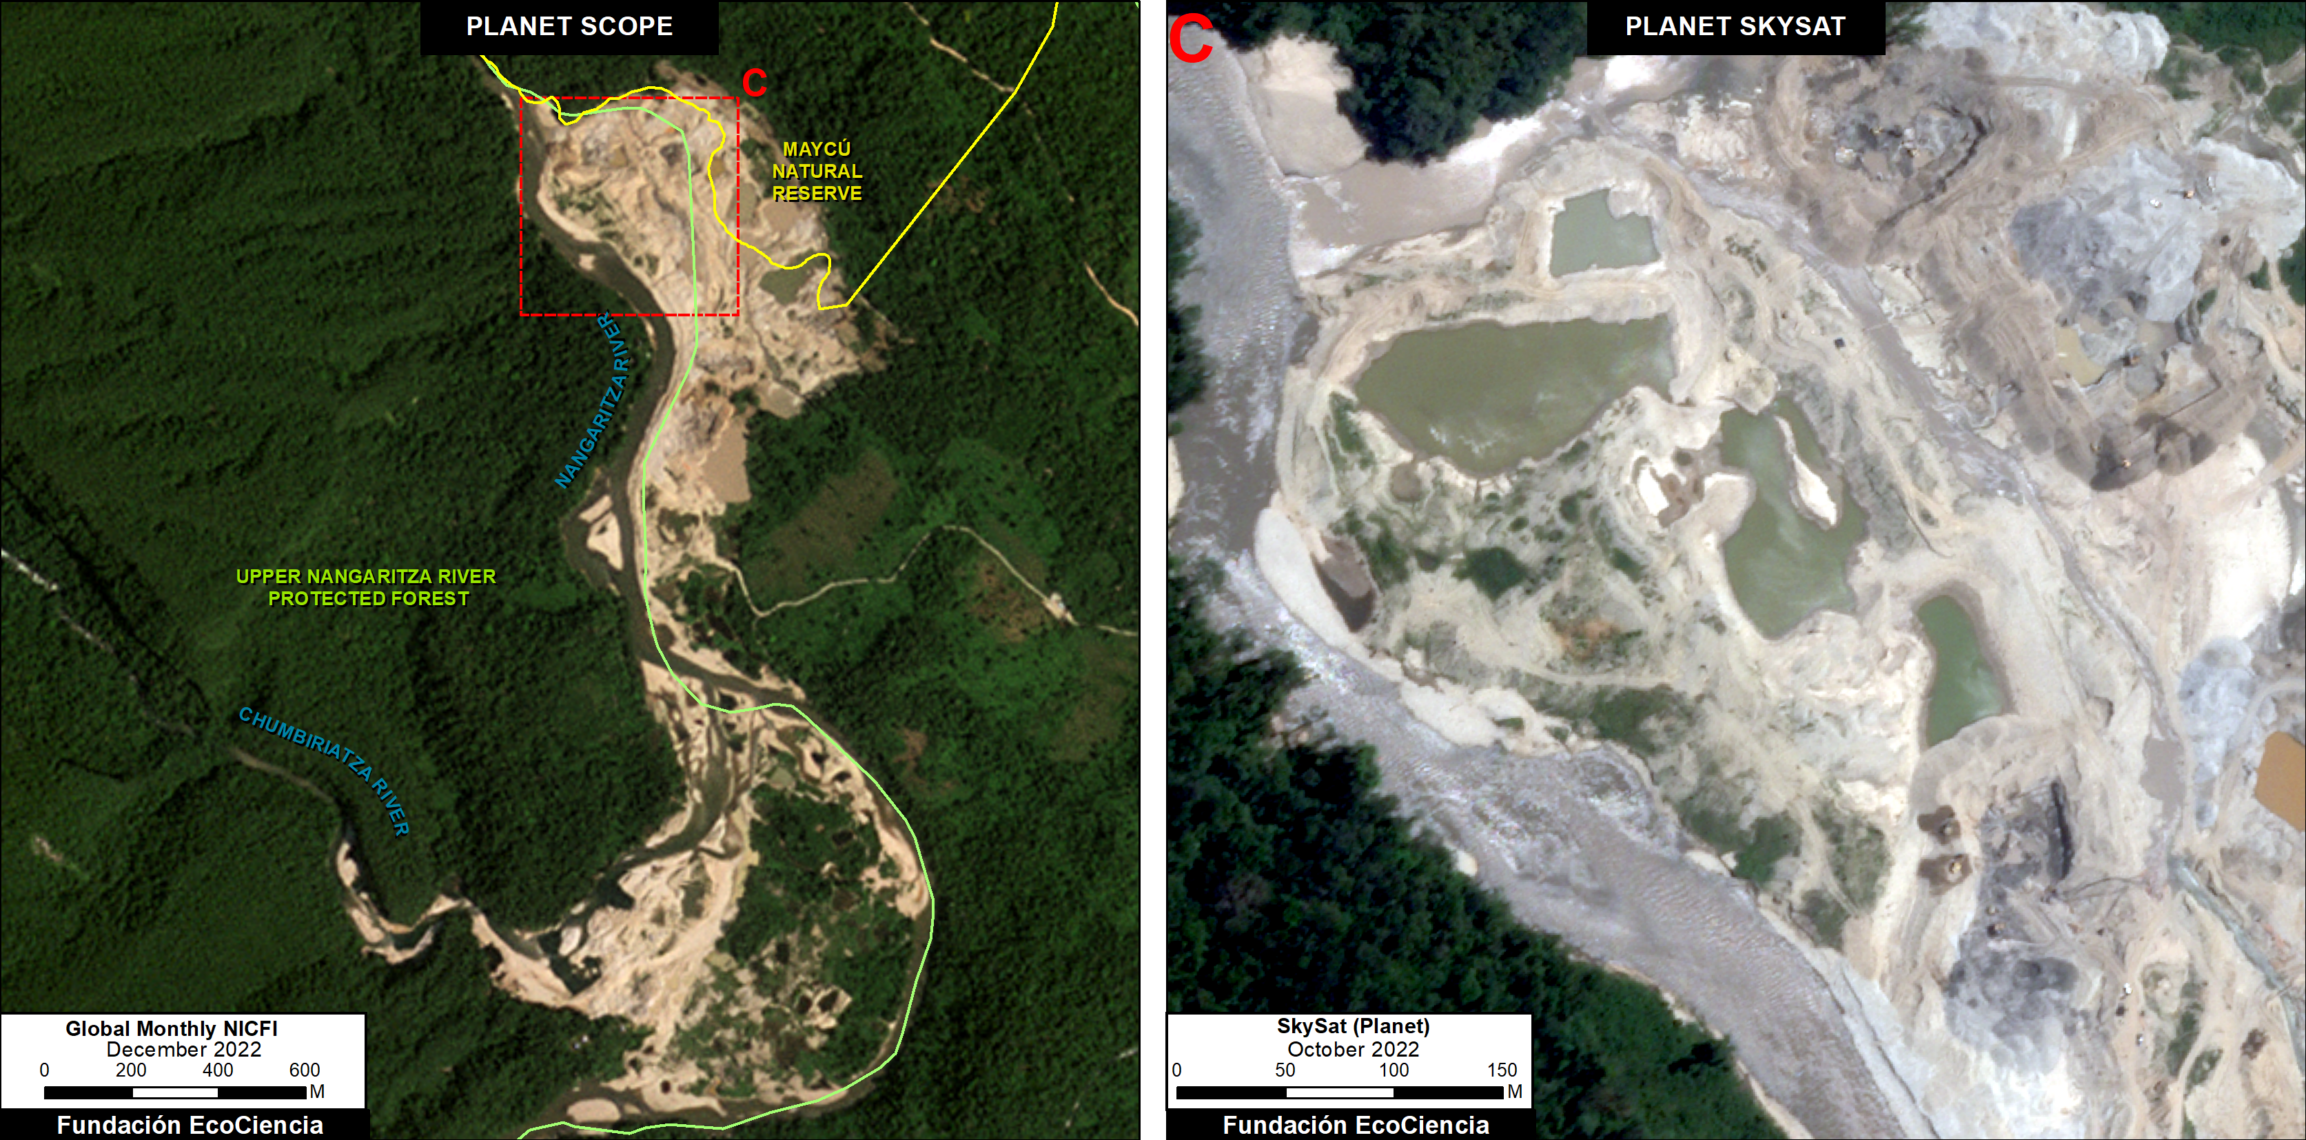
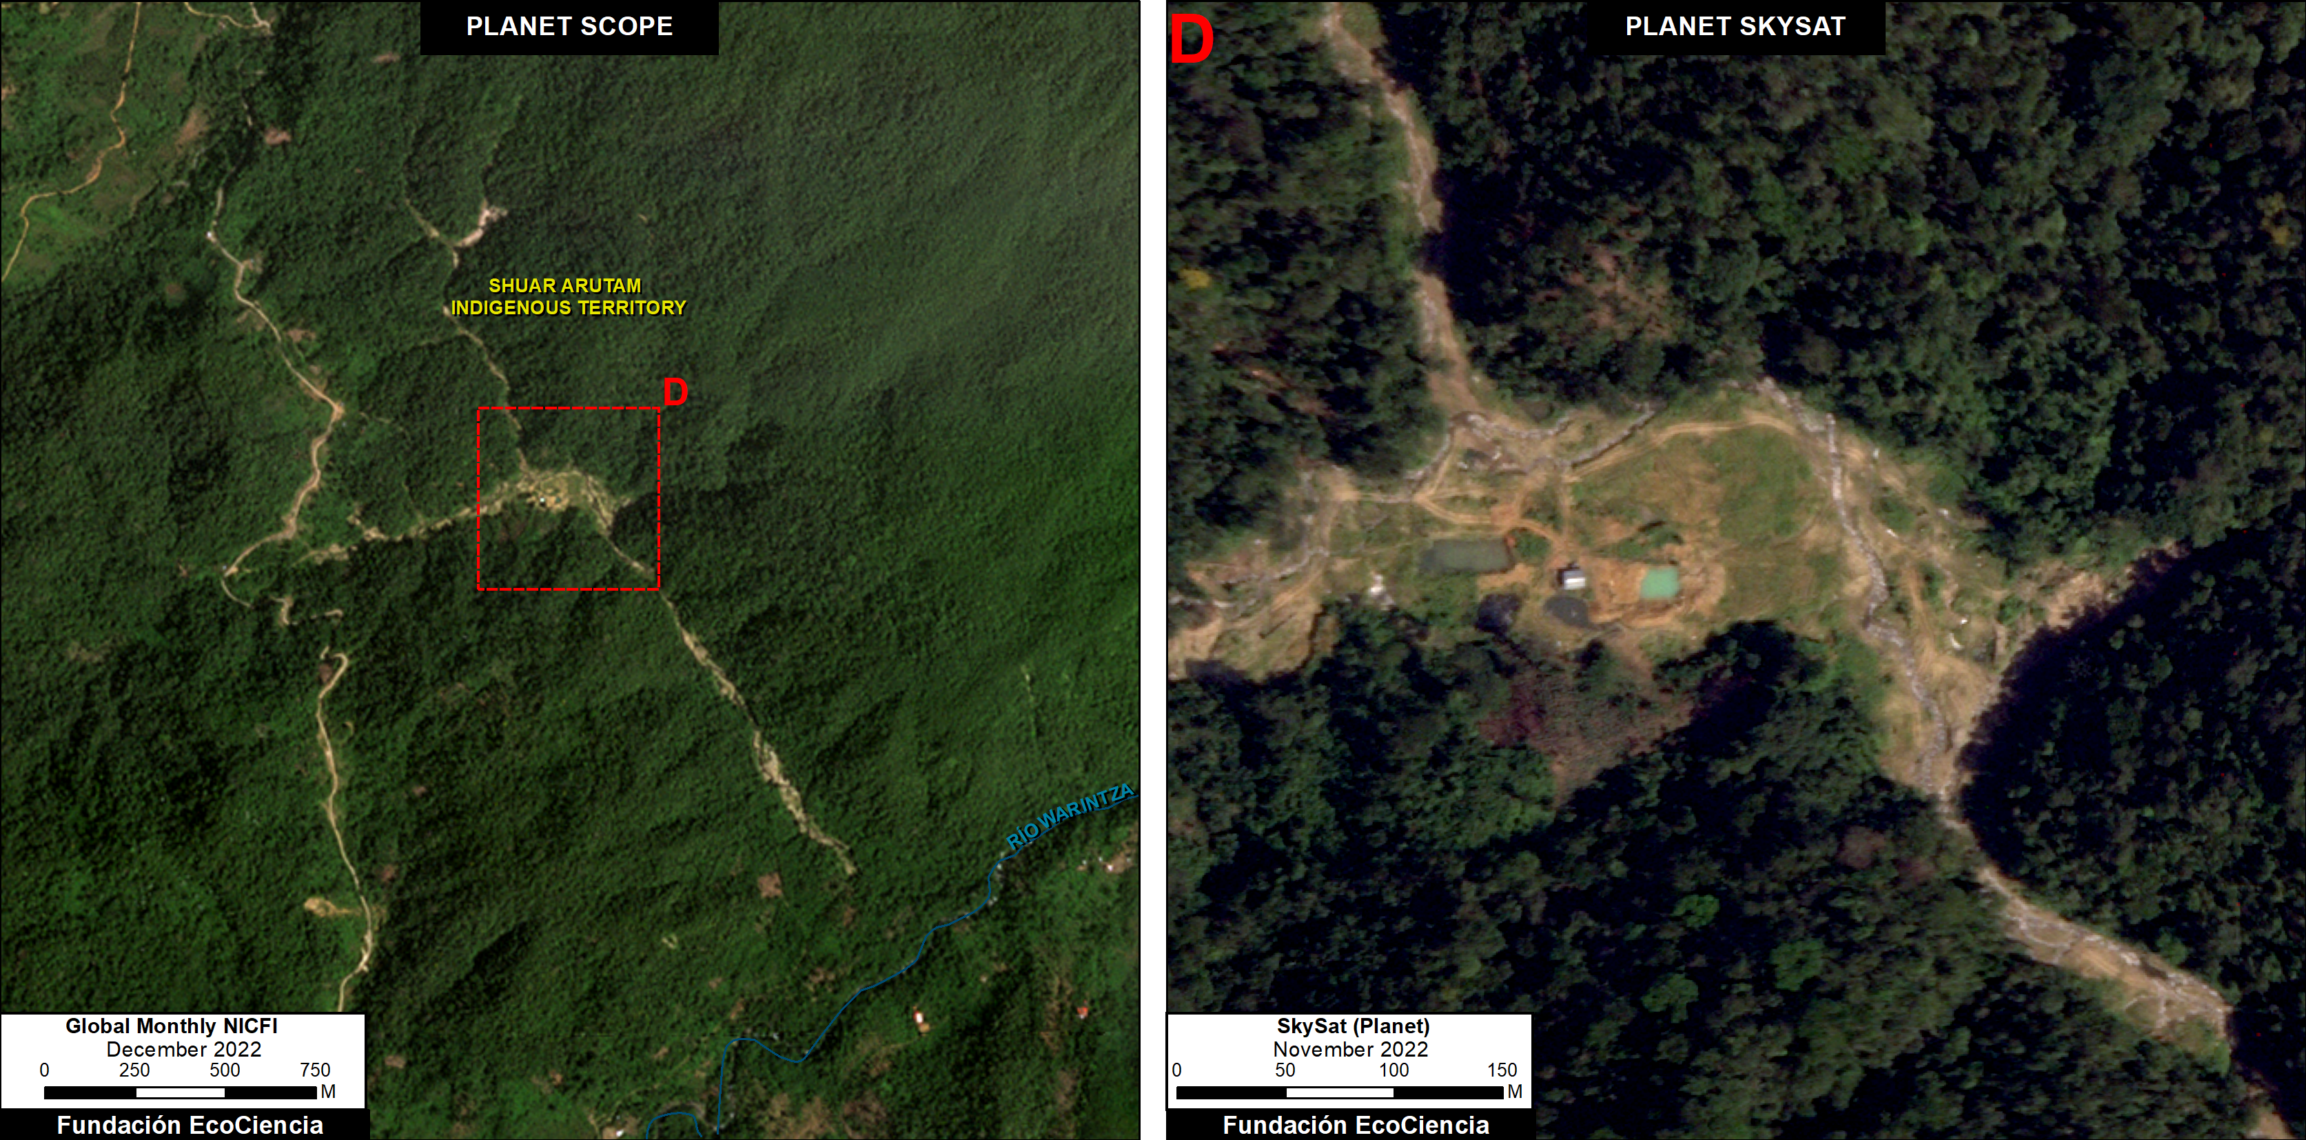
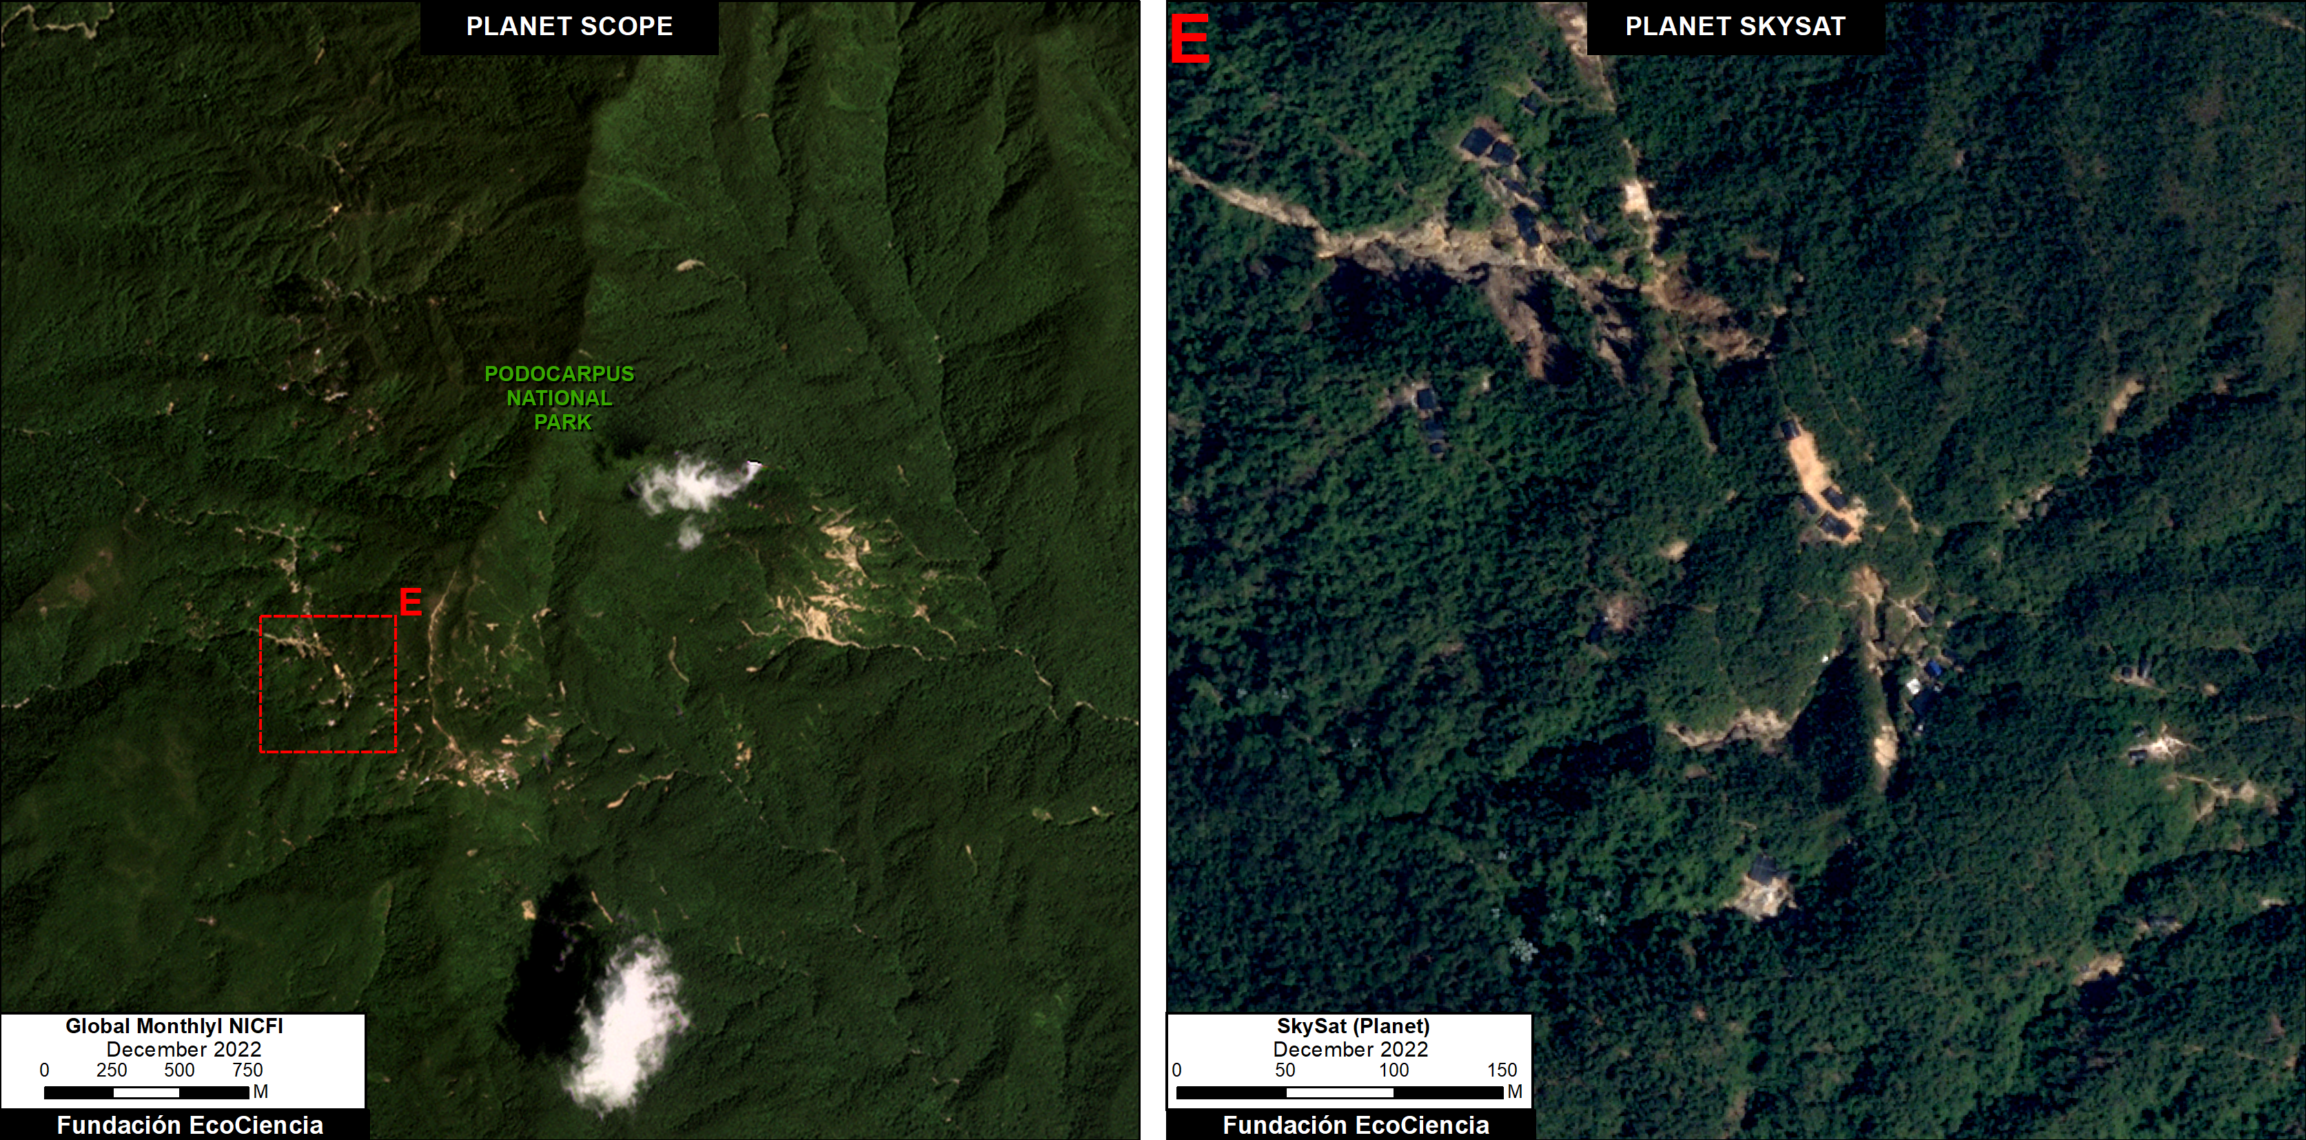
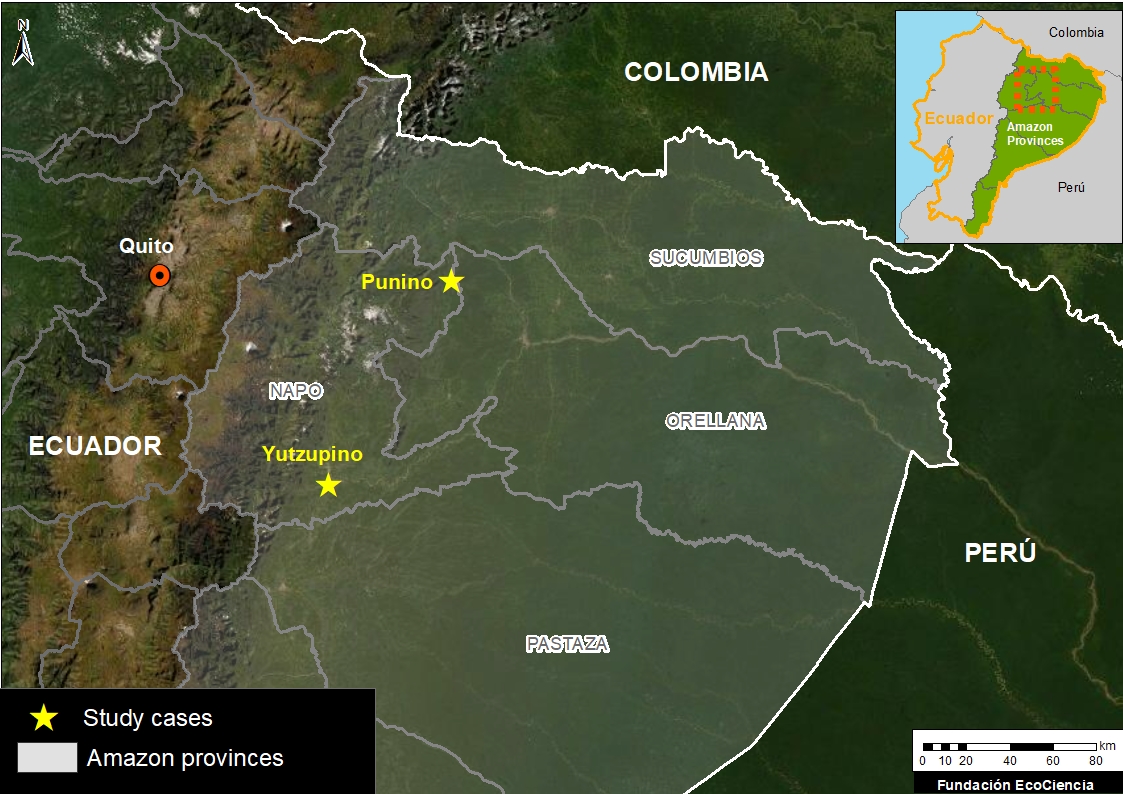
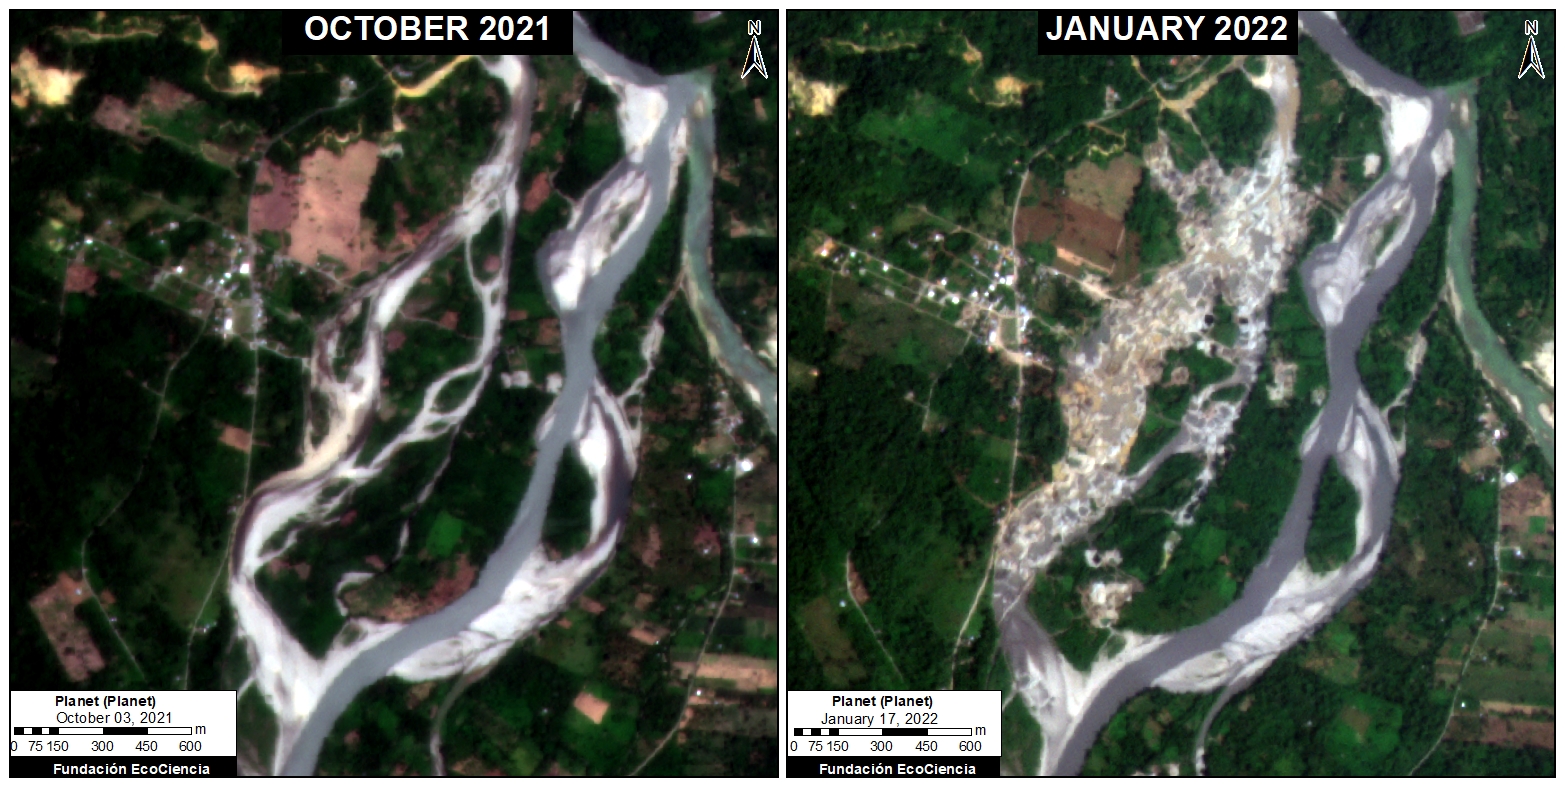
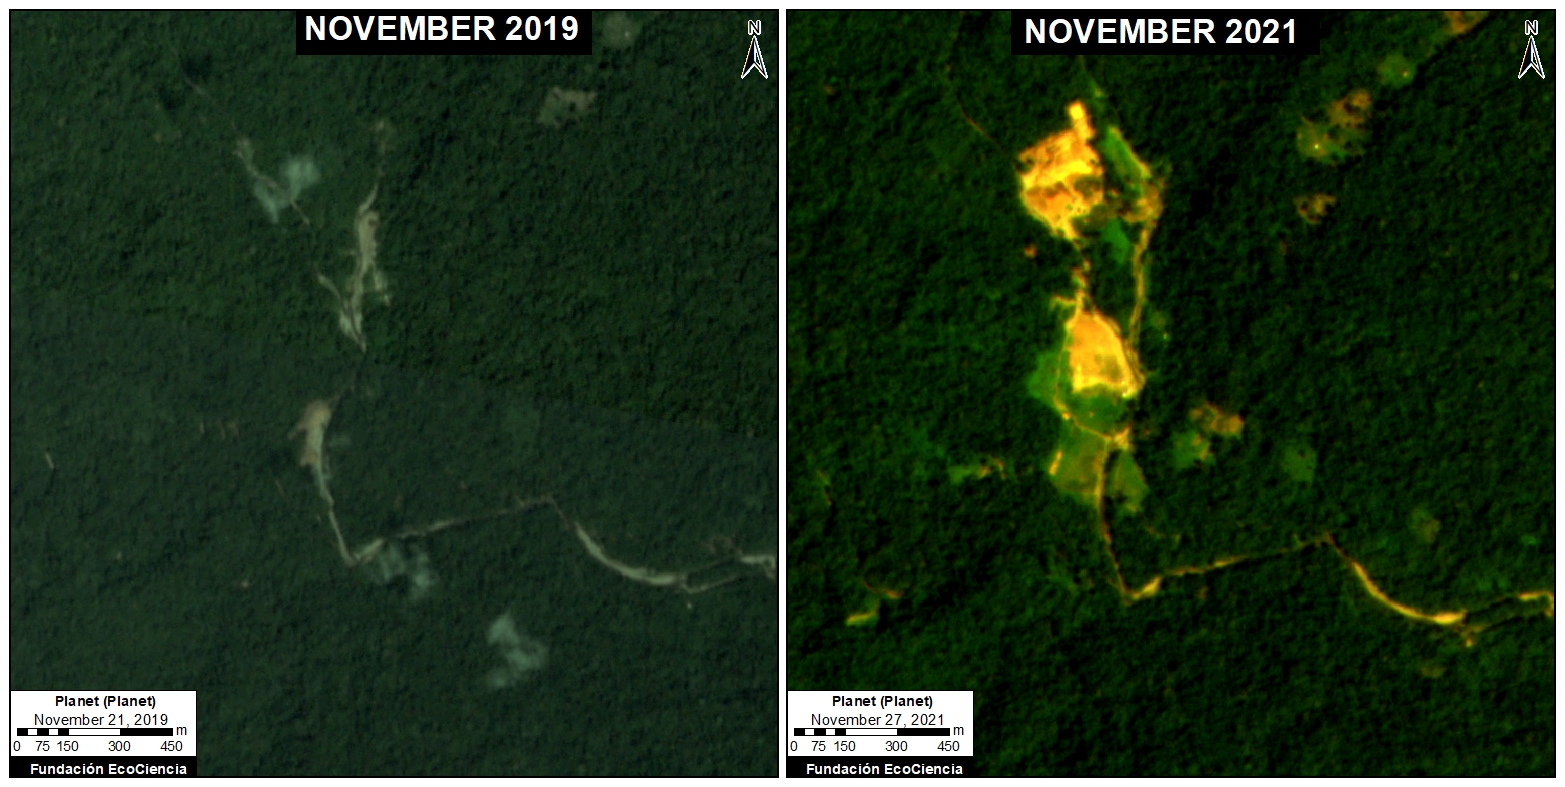
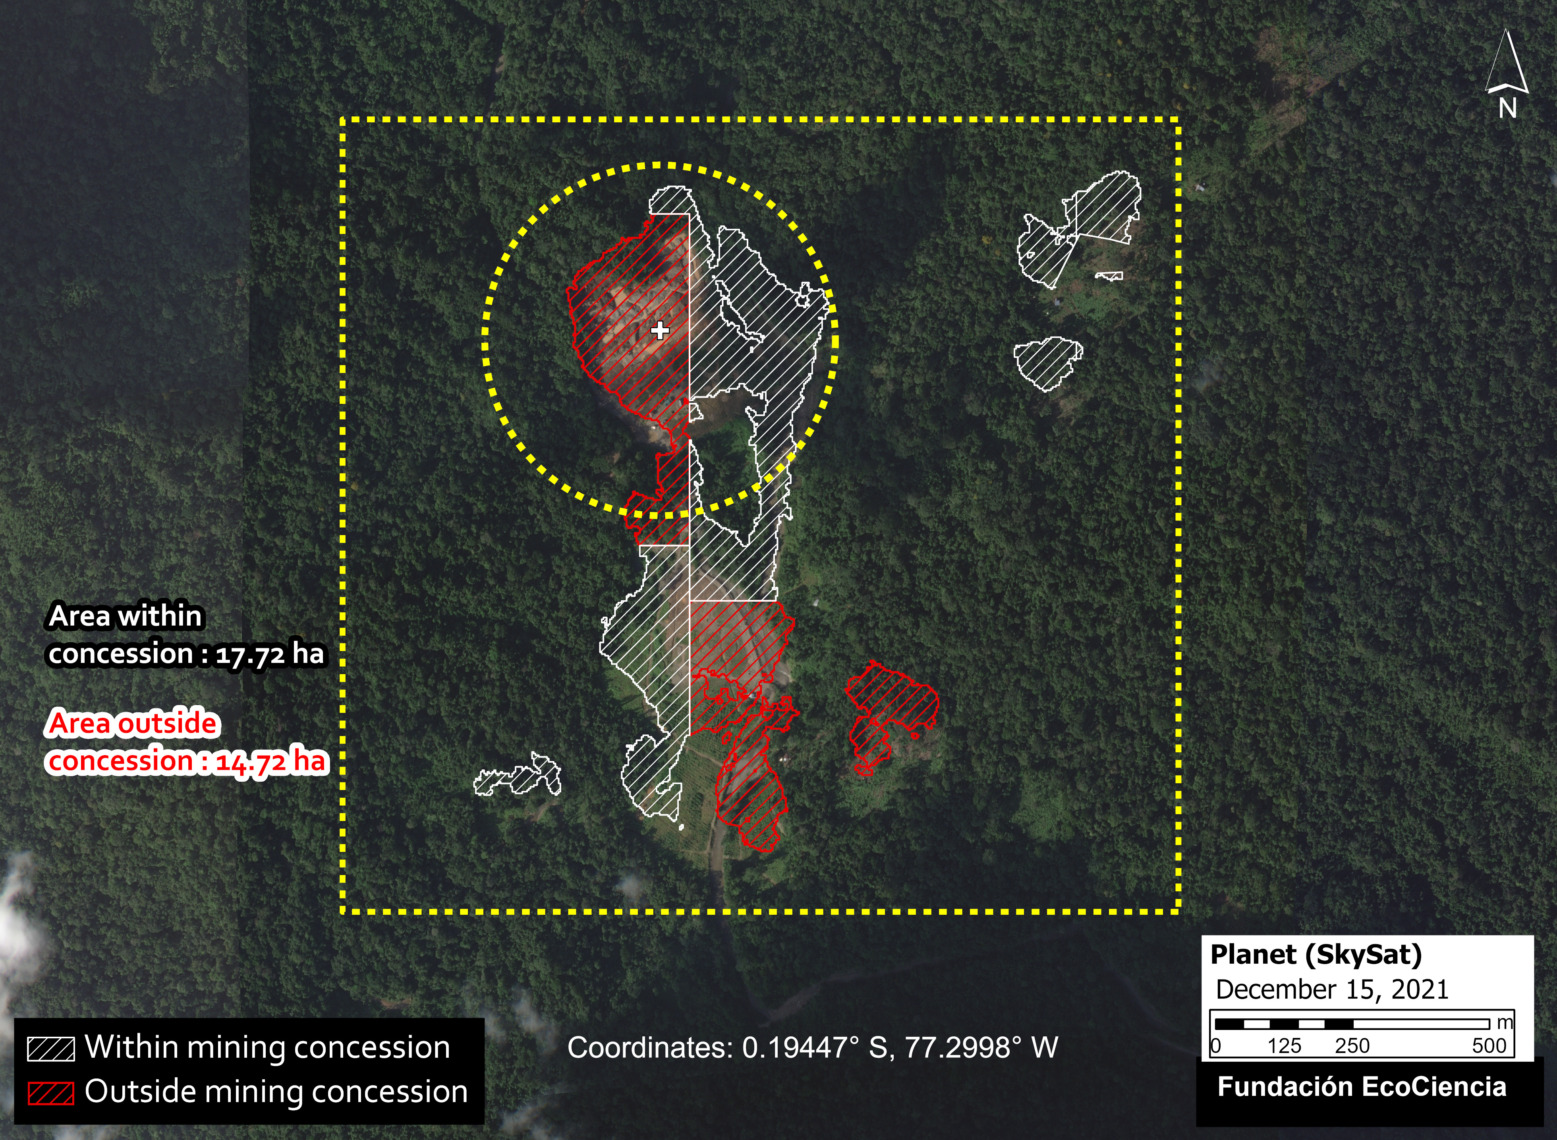
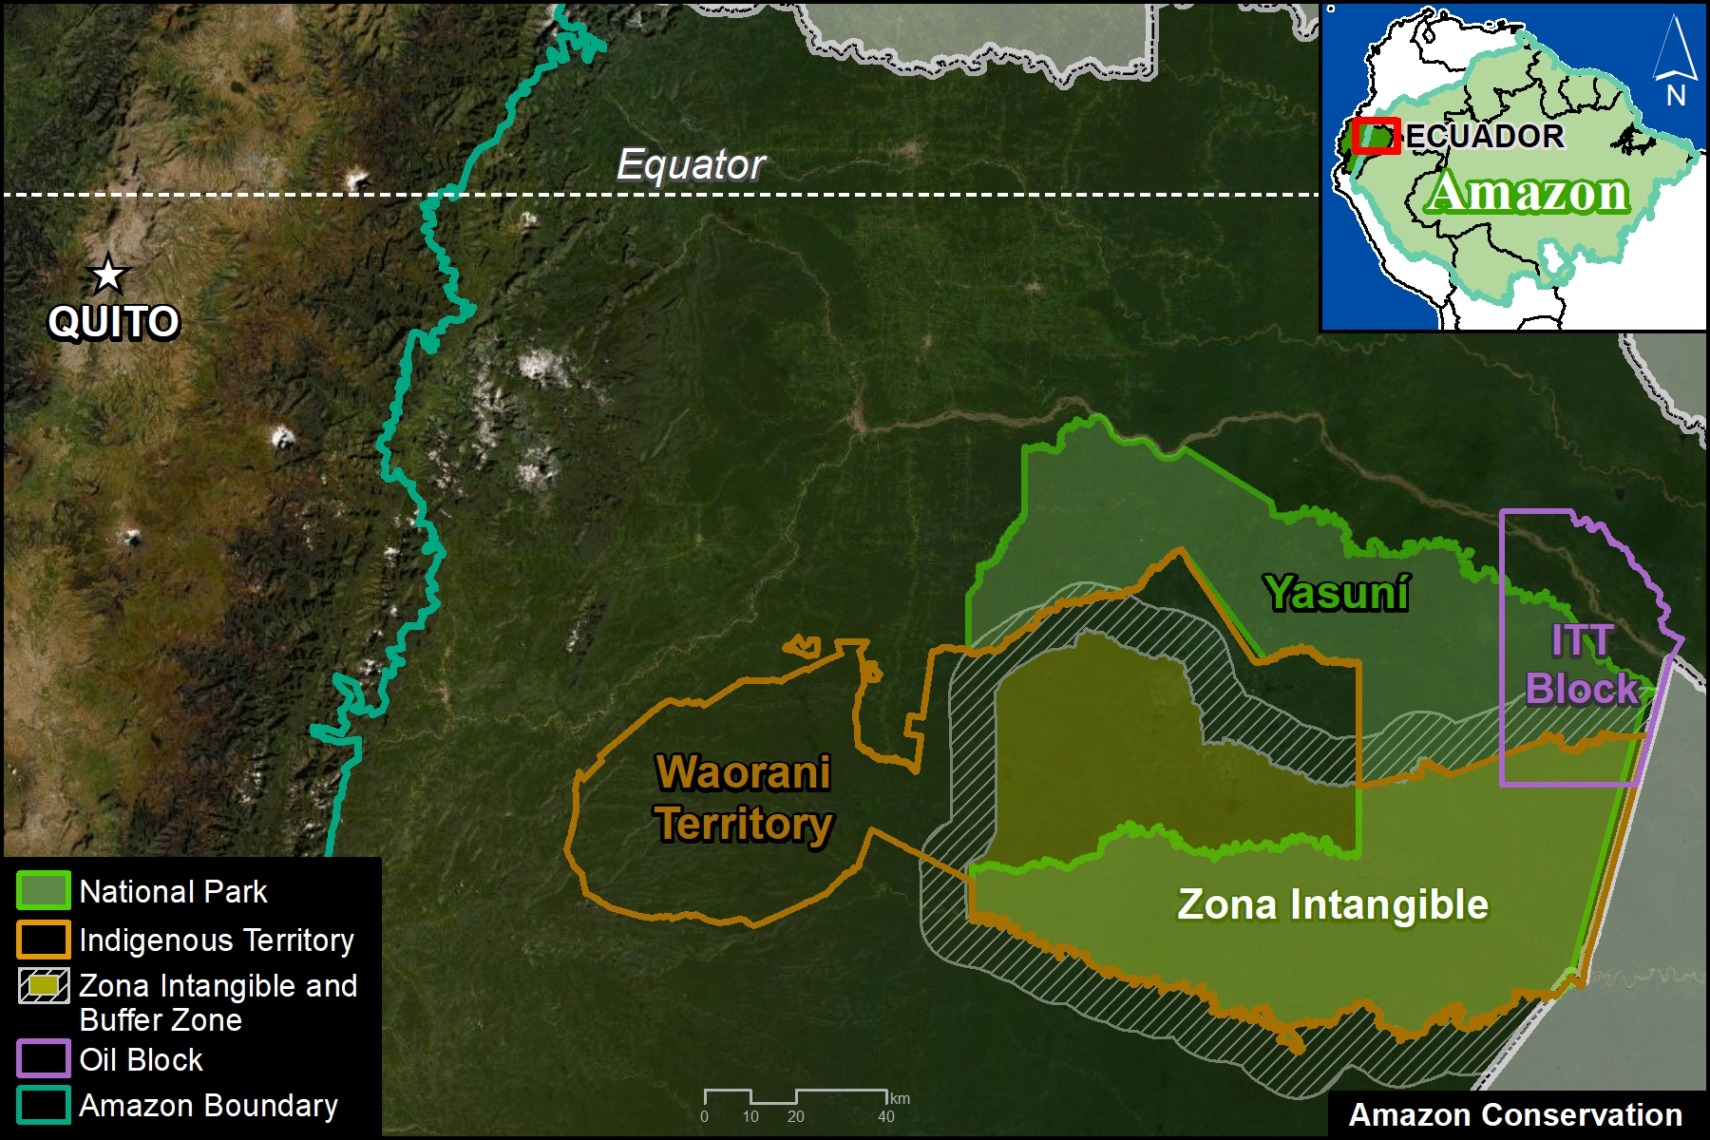
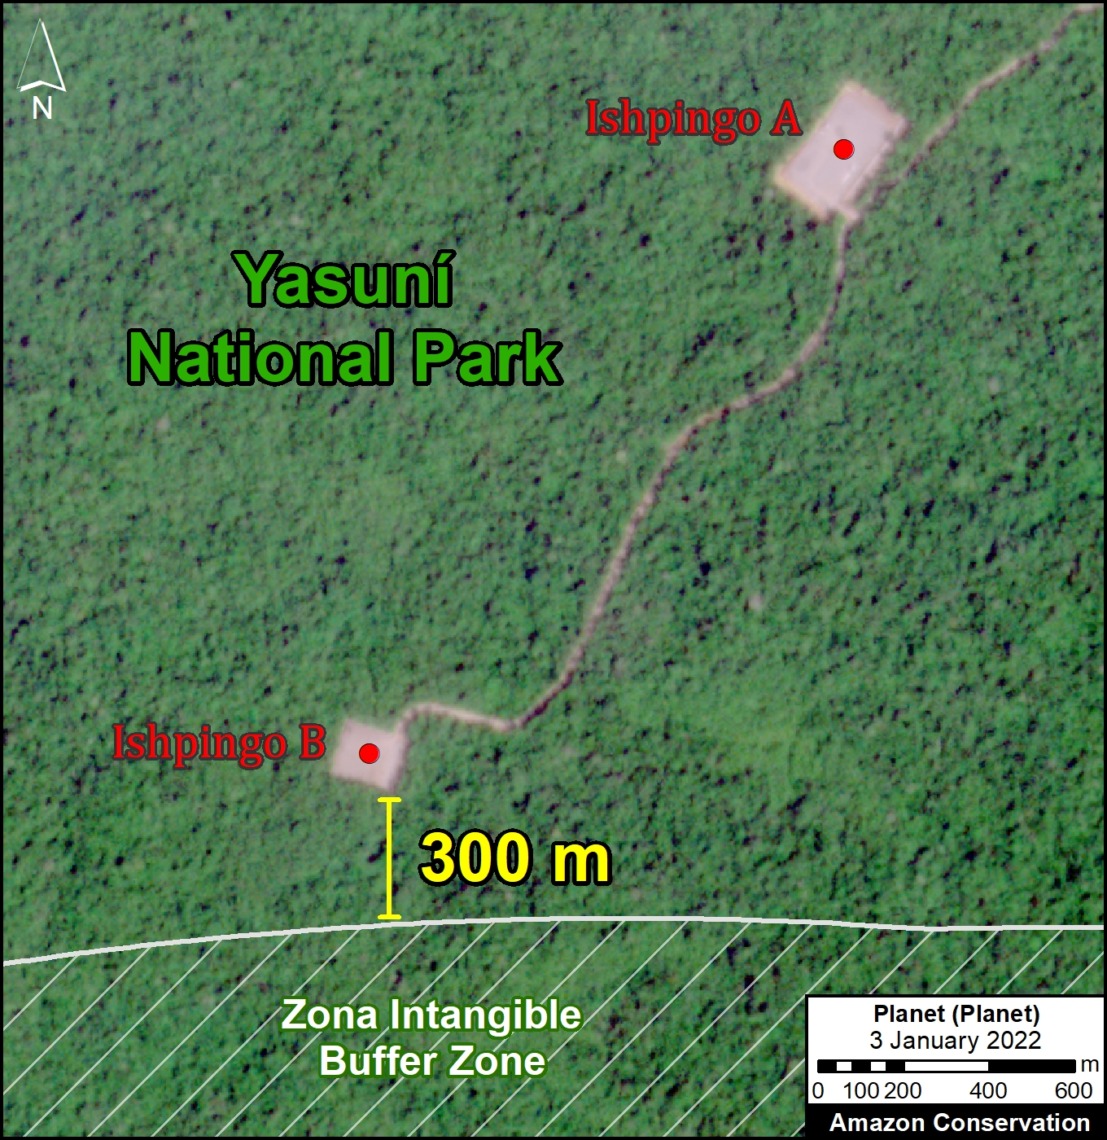
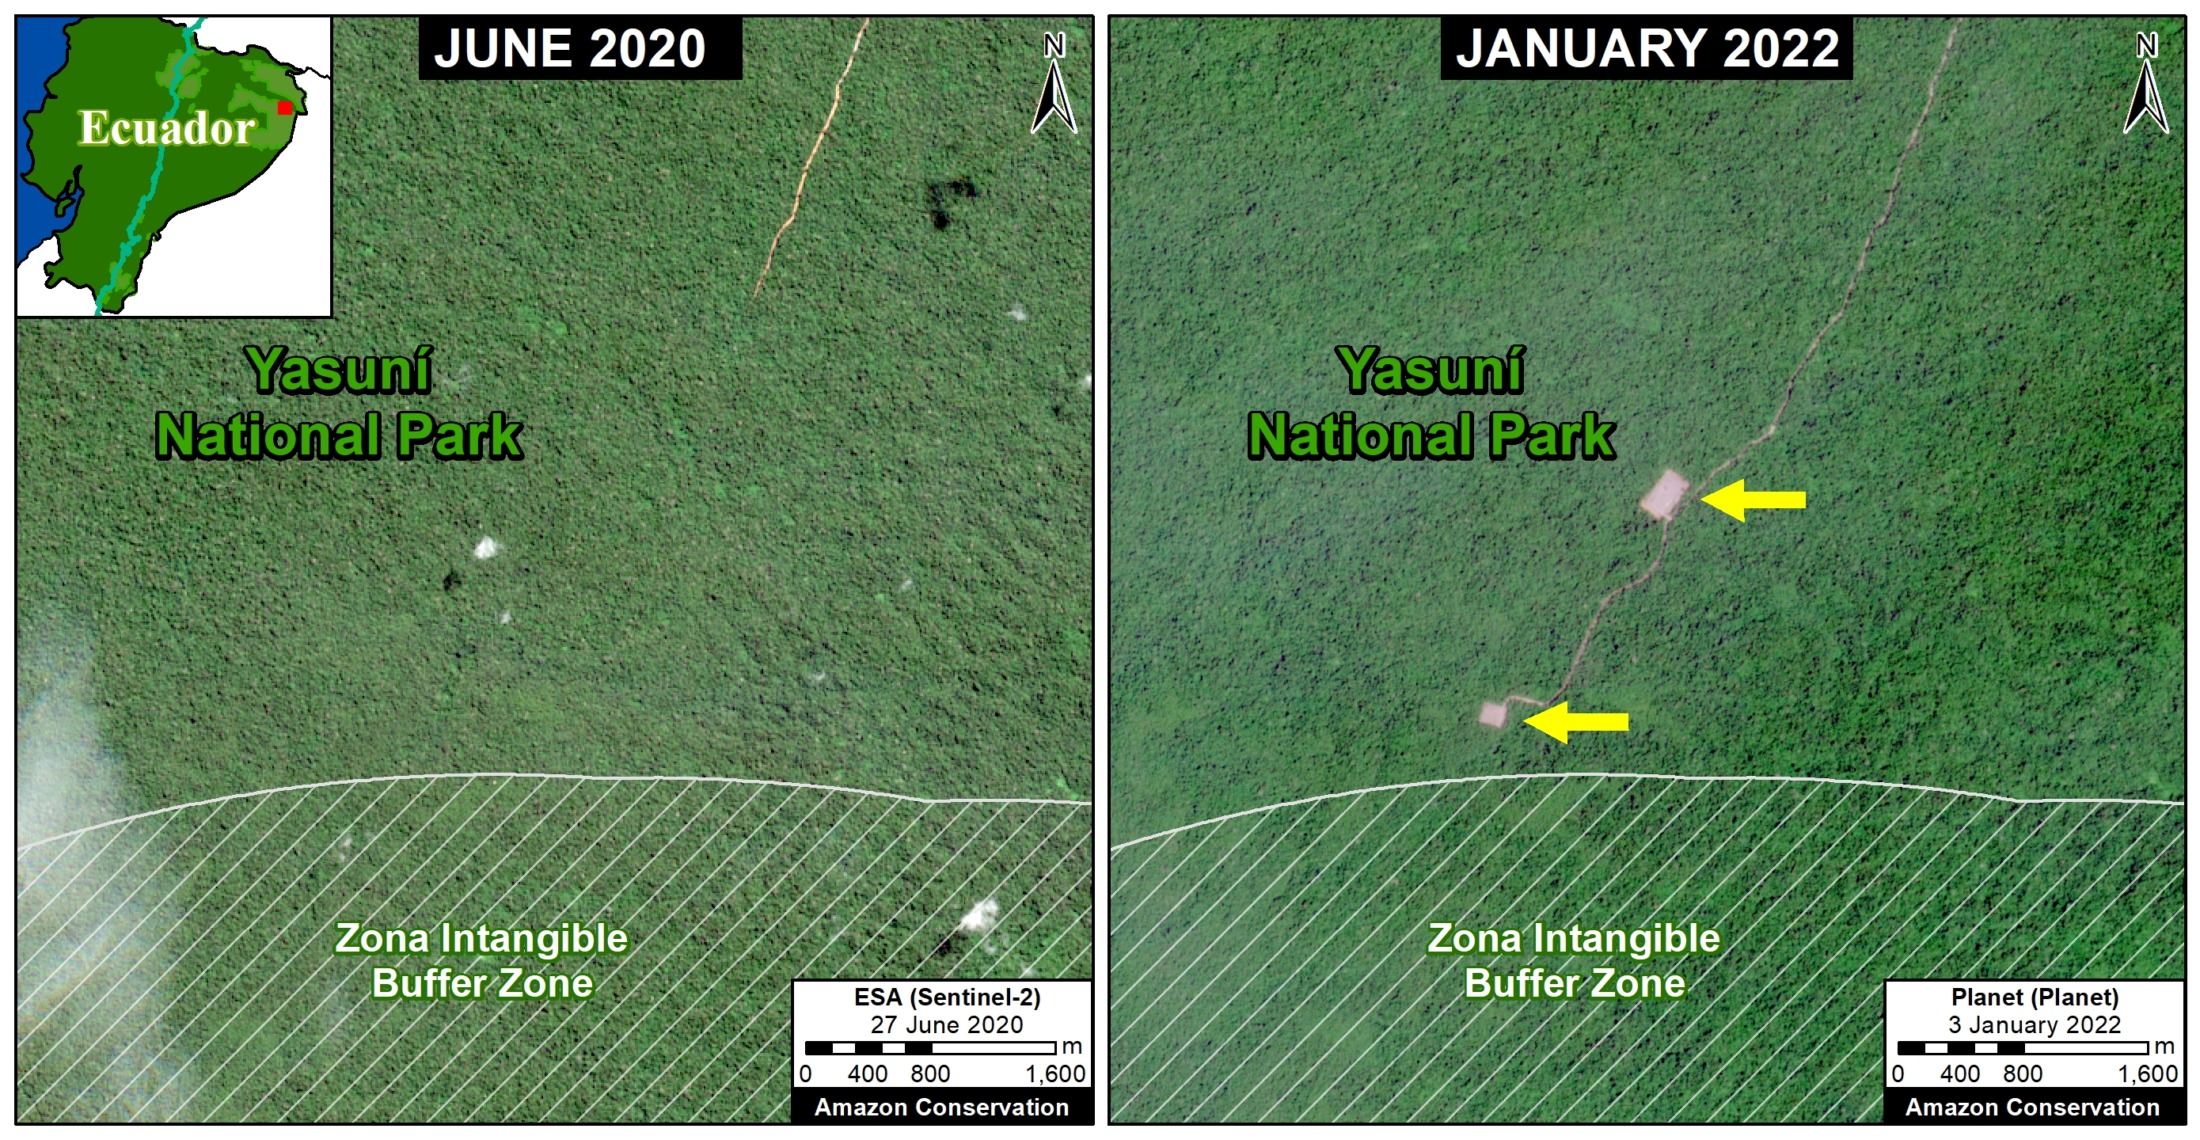
Although accounting for just 1% of total loss across the Amazon, deforestation in the Ecuadorian Amazon was the highest on record in 2022 (18,902 hectares), up a striking 80% since 2021.
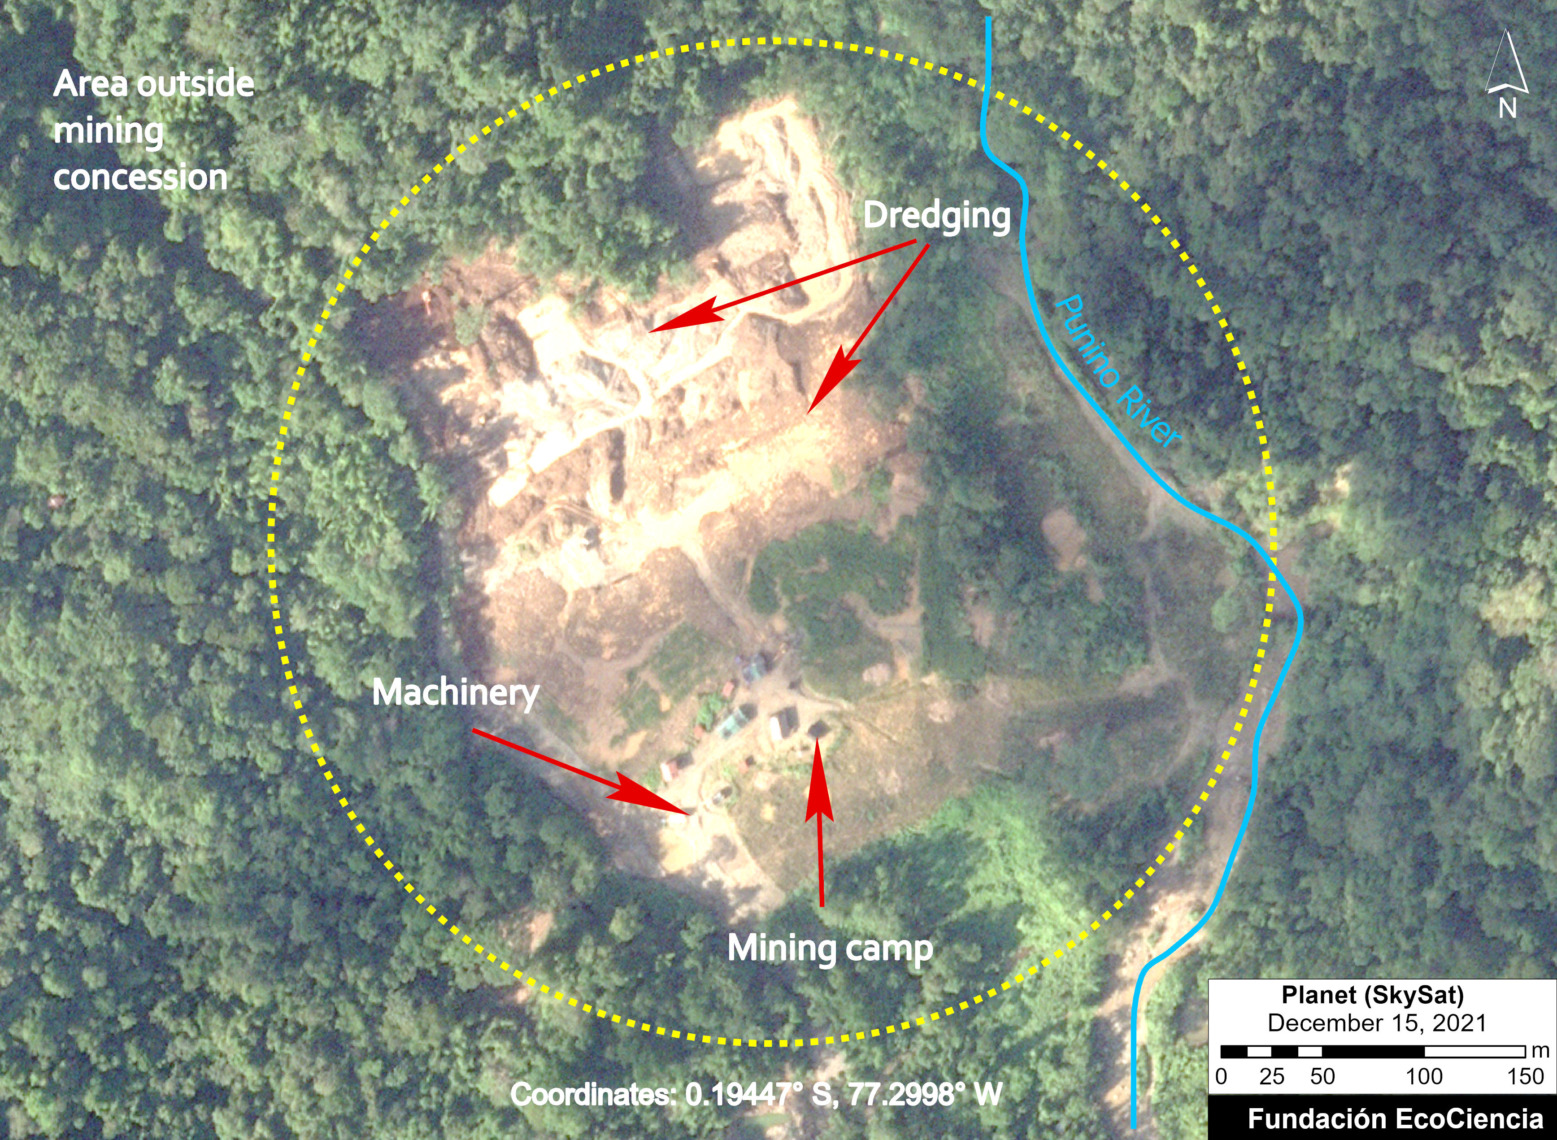
There are several deforestation hotspots caused by gold mining (see MAAP #182), oil palm plantation expansion, and small-scale agriculture.
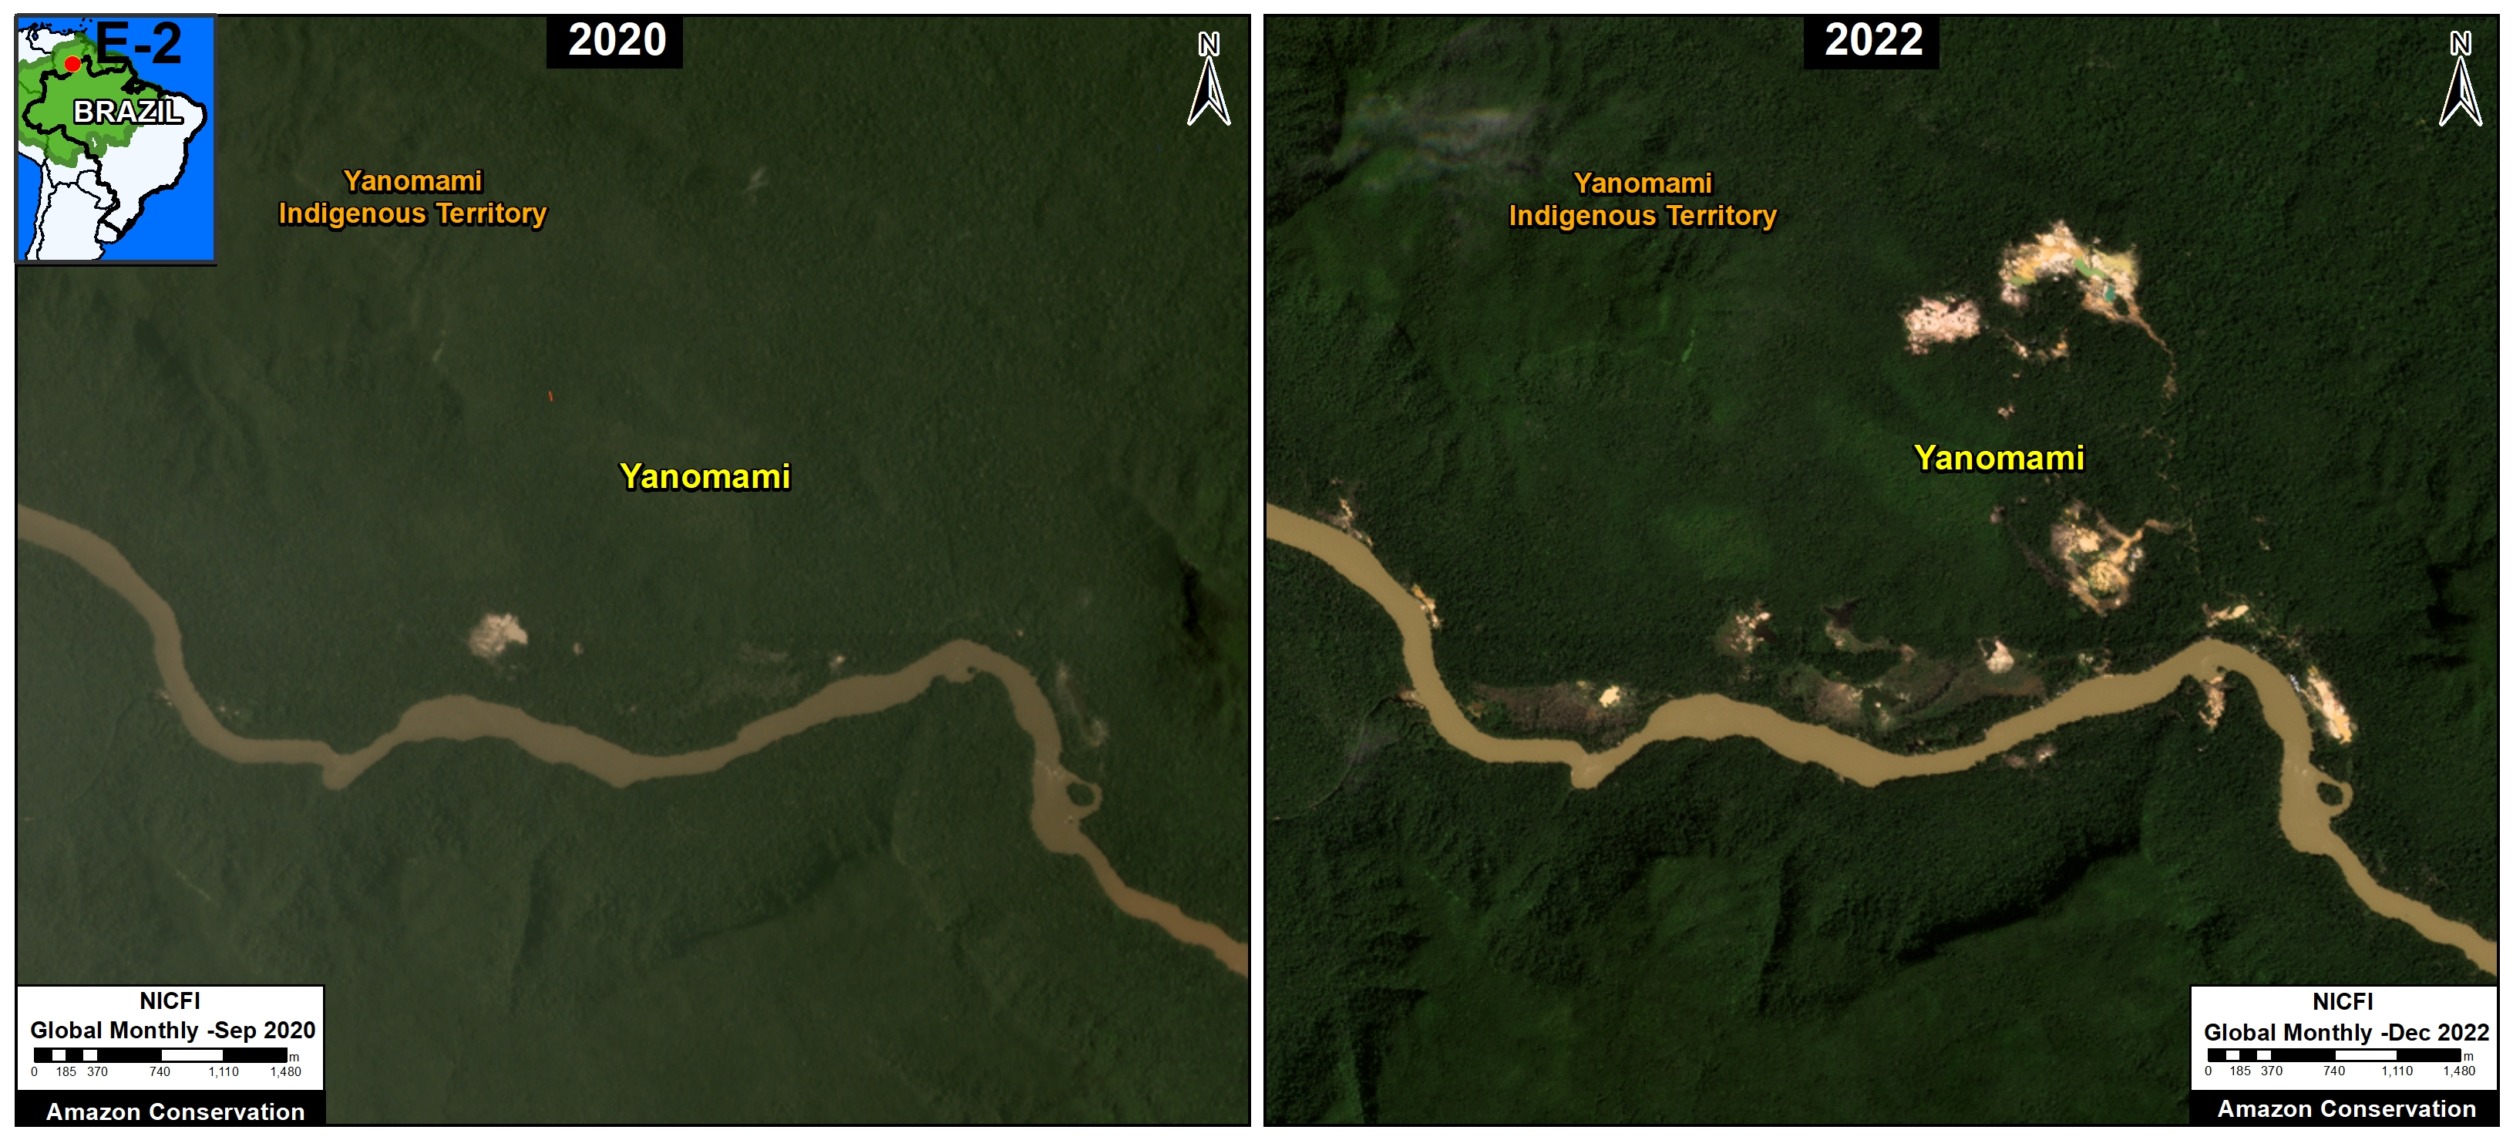
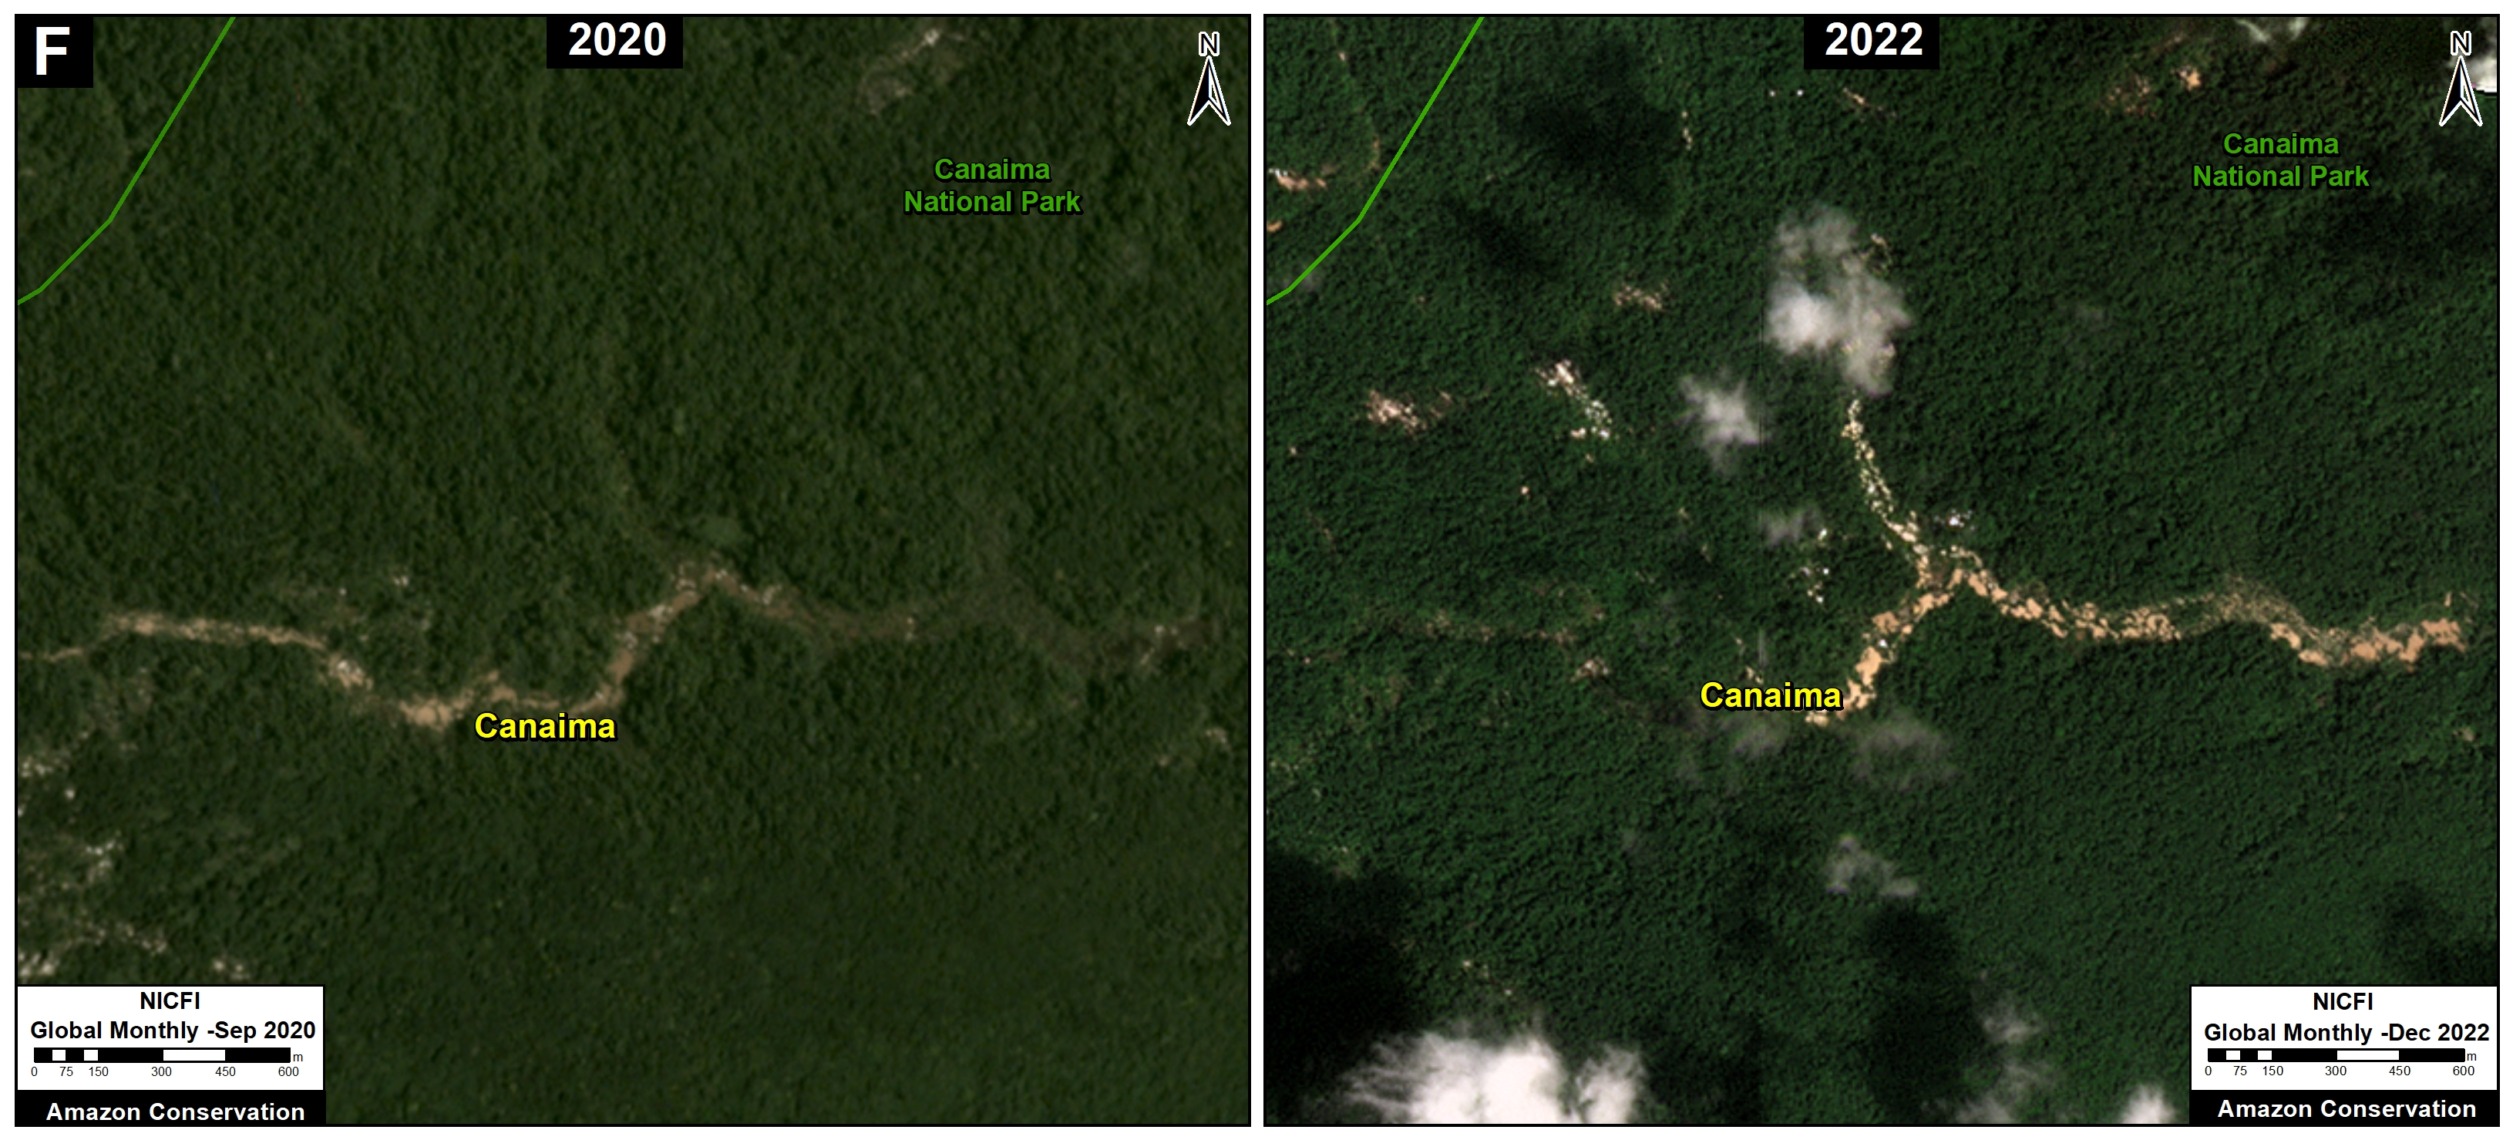
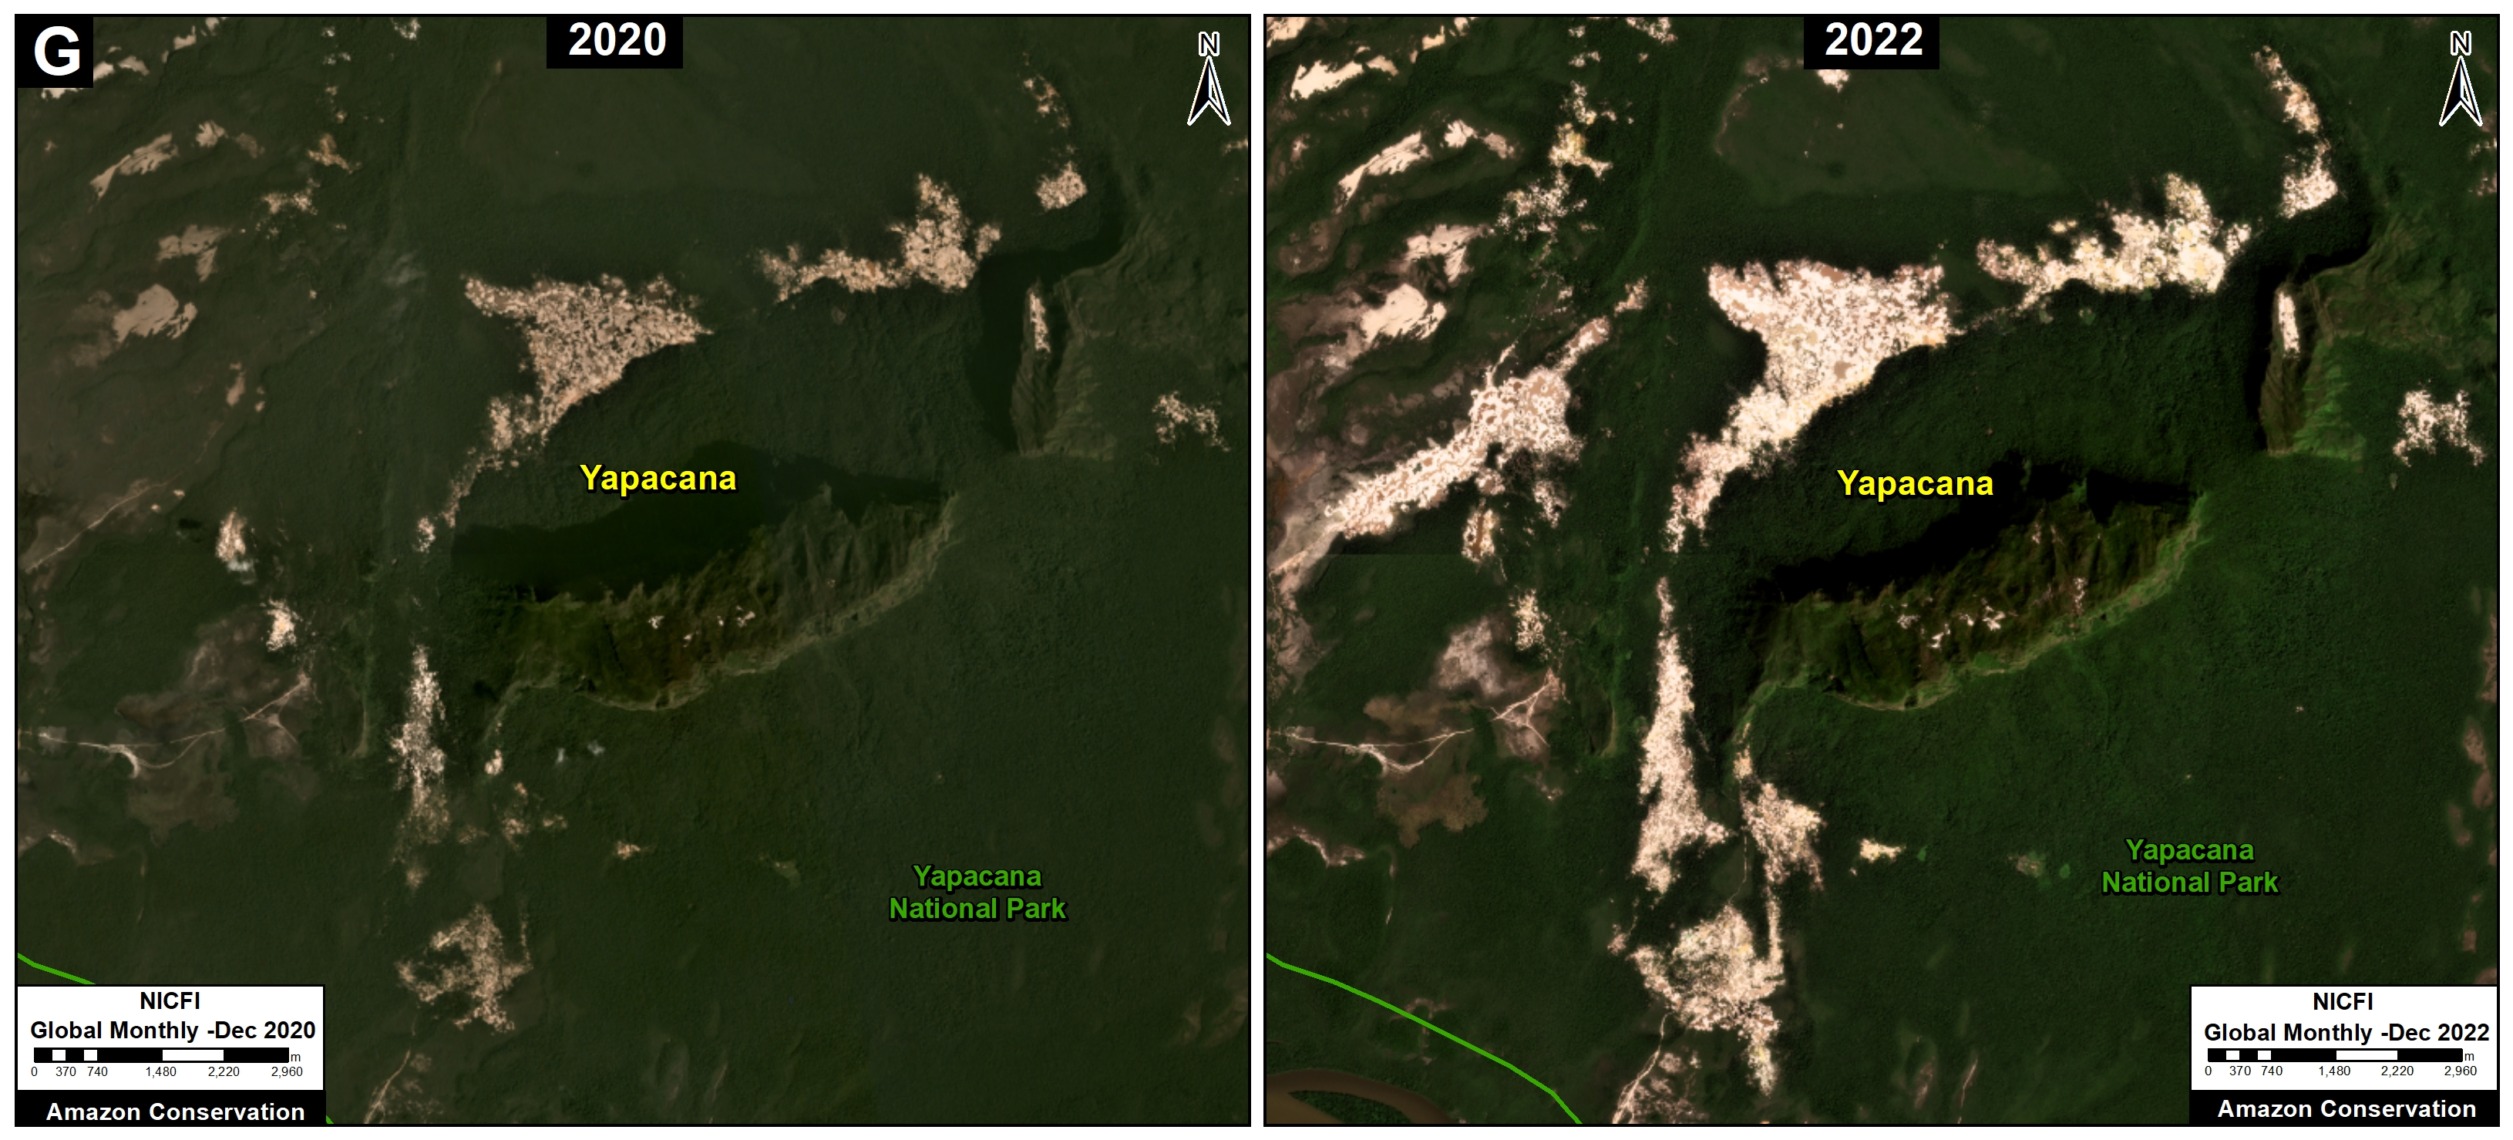
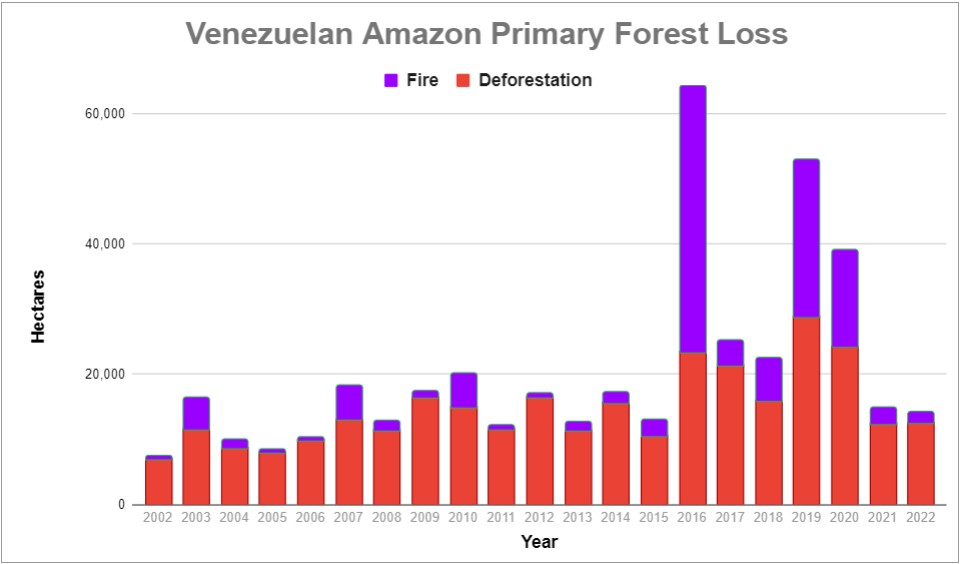
Venezuelan Amazon
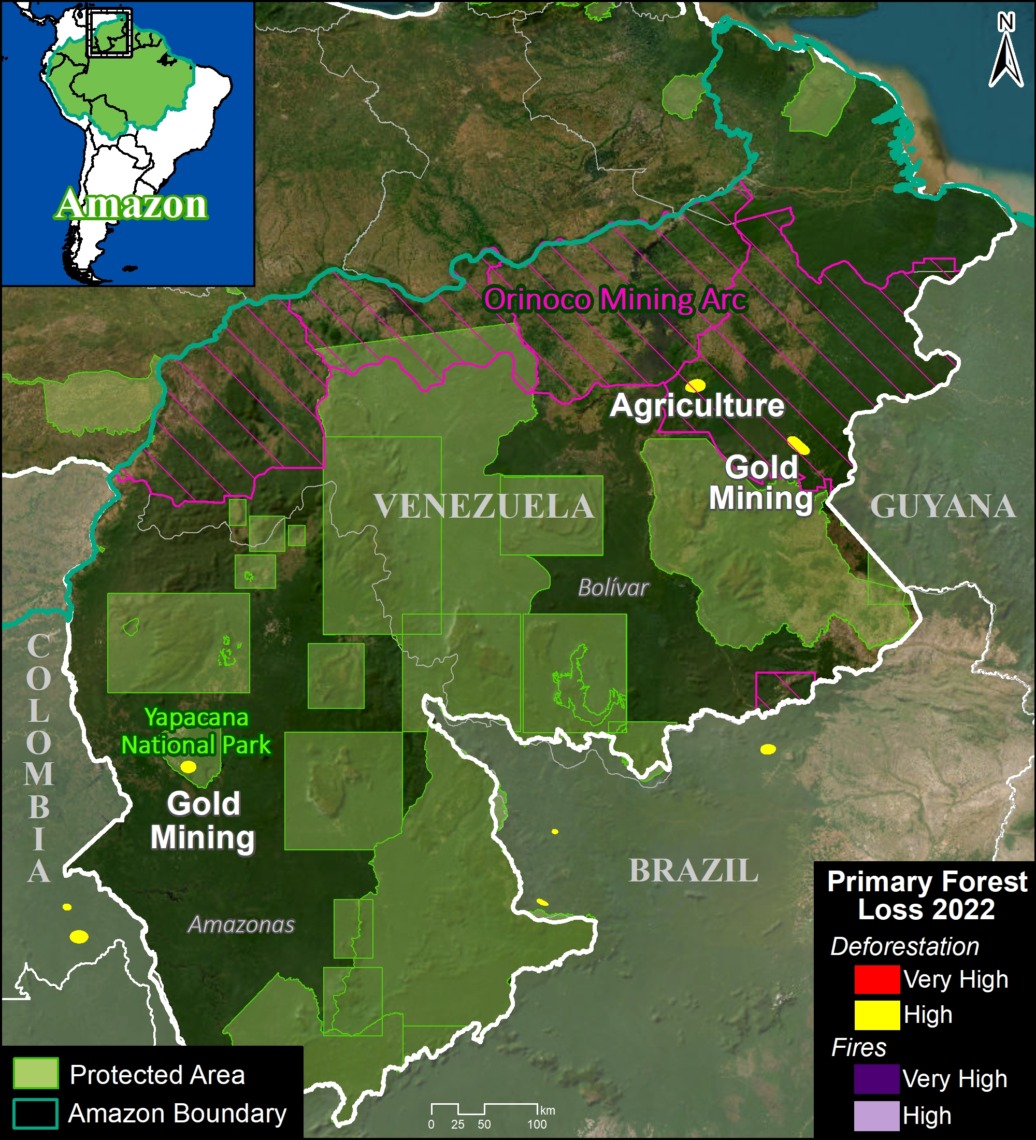 In the Venezuelan Amazon, deforestation was on par with last year (12,584 hectares).
There is a deforestation hotspot caused by gold mining in Yapacana National Park (see MAAP #173, MAAP #156, MAAP #169).
There are also hotspots in the Orinoco Mining Arc caused by mining and agriculture.
Methodology
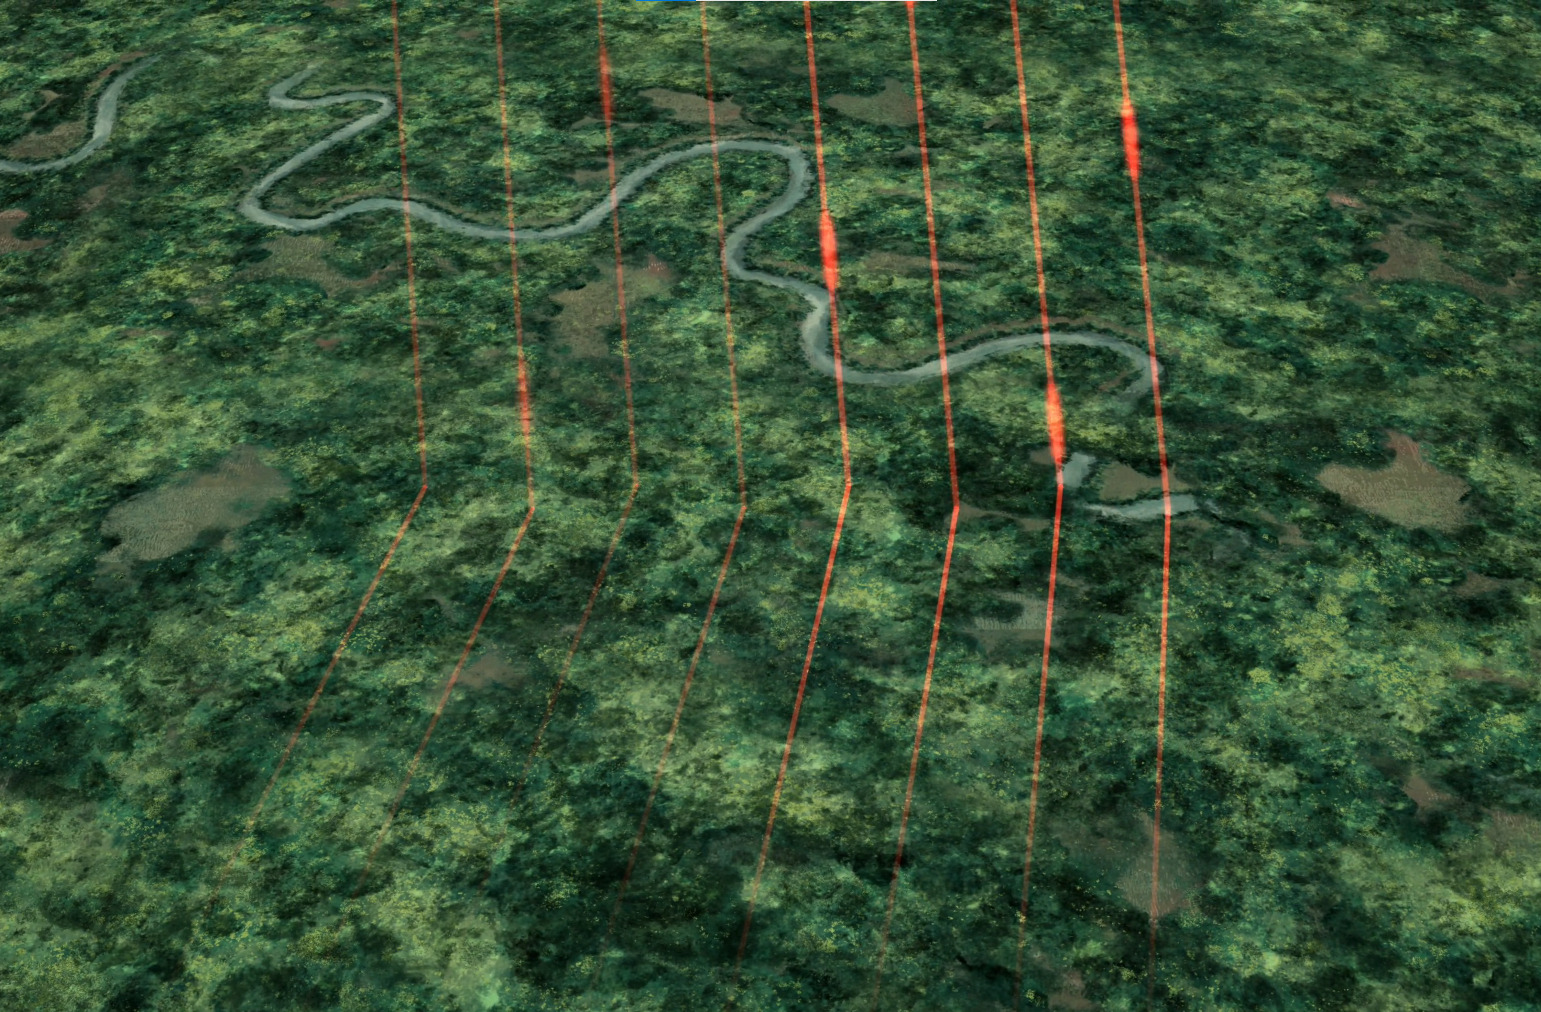
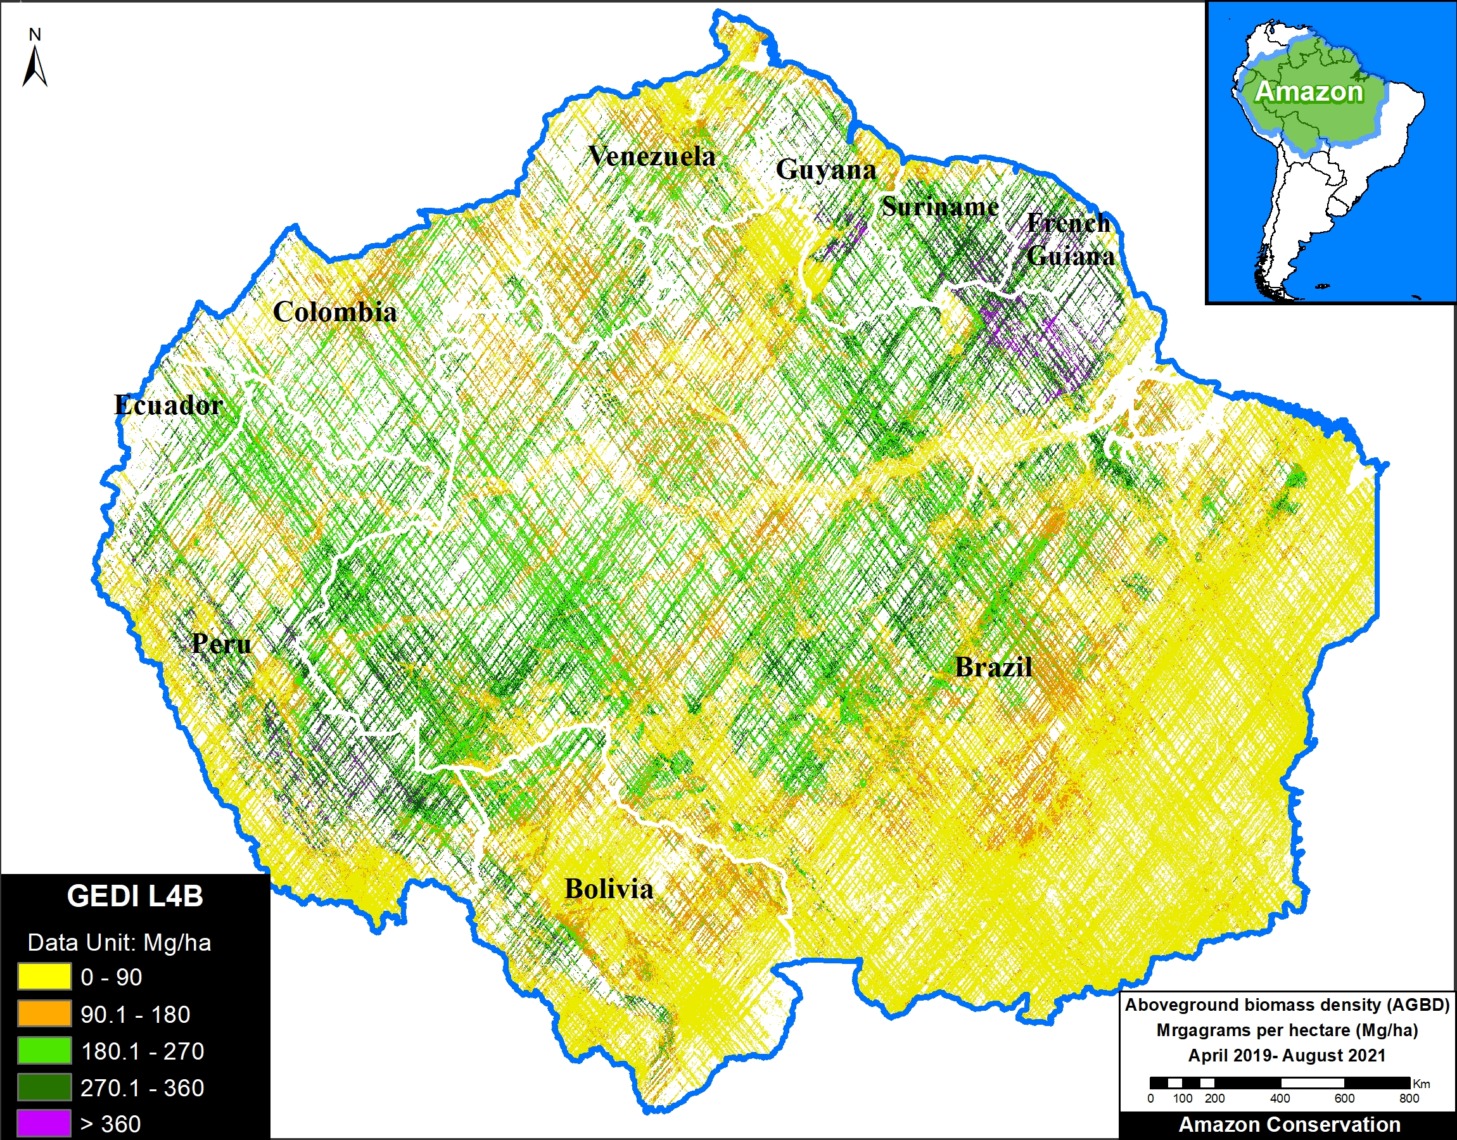
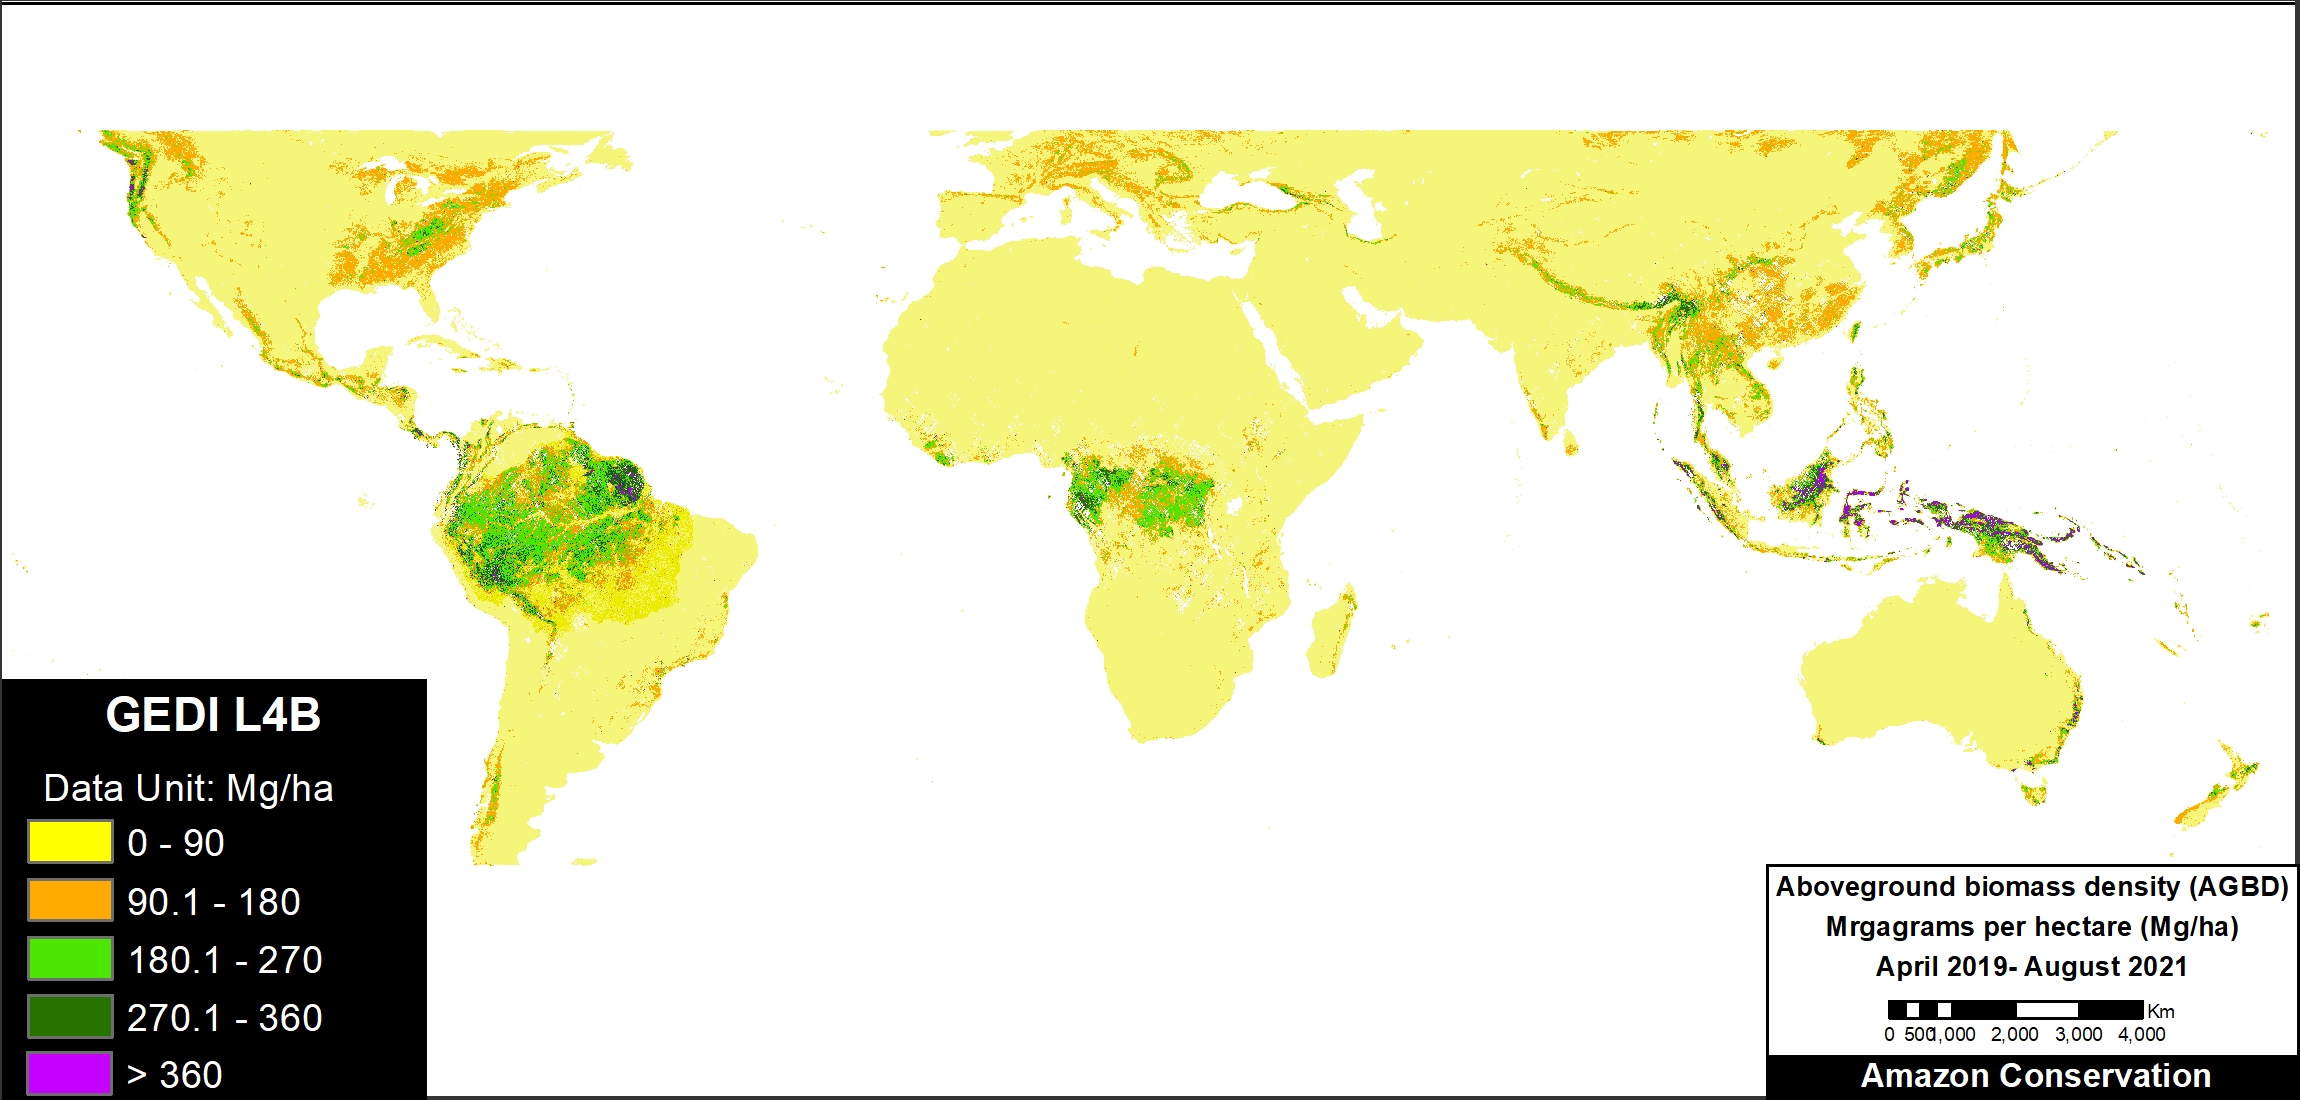
The analysis was based on 30-meter resolution annual forest loss data produced by the University of Maryland and also presented by Global Forest Watch.
This data was complemented with the Global Forest Loss due to fire dataset that is unique in terms of being consistent across the Amazon (in contrast to country specific estimates) and distinguishes forest loss caused directly by fire (note that virtually all Amazon fires are human-caused). The values included were ‘medium’ and ‘high’ confidence levels (code 3-4).
The remaining forest loss serves as a likely close proxy for deforestation, with the only remaining exception being natural events such as landslides, wind storms, and meandering rivers. The values used to estimate this category was ‘low’ certainty of forest loss due to fire (code 2), and forest loss due to other ‘non-fire’ drivers (code 1).
For the baseline, it was defined to establish areas with >30% tree canopy density in 2000. Importantly, we applied a filter to calculate only primary forest loss by intersecting the forest cover loss data with the additional dataset “primary humid tropical forests” as of 2001 (Turubanova et al 2018). For more details on this part of the methodology, see the Technical Blog from Global Forest Watch (Goldman and Weisse 2019).
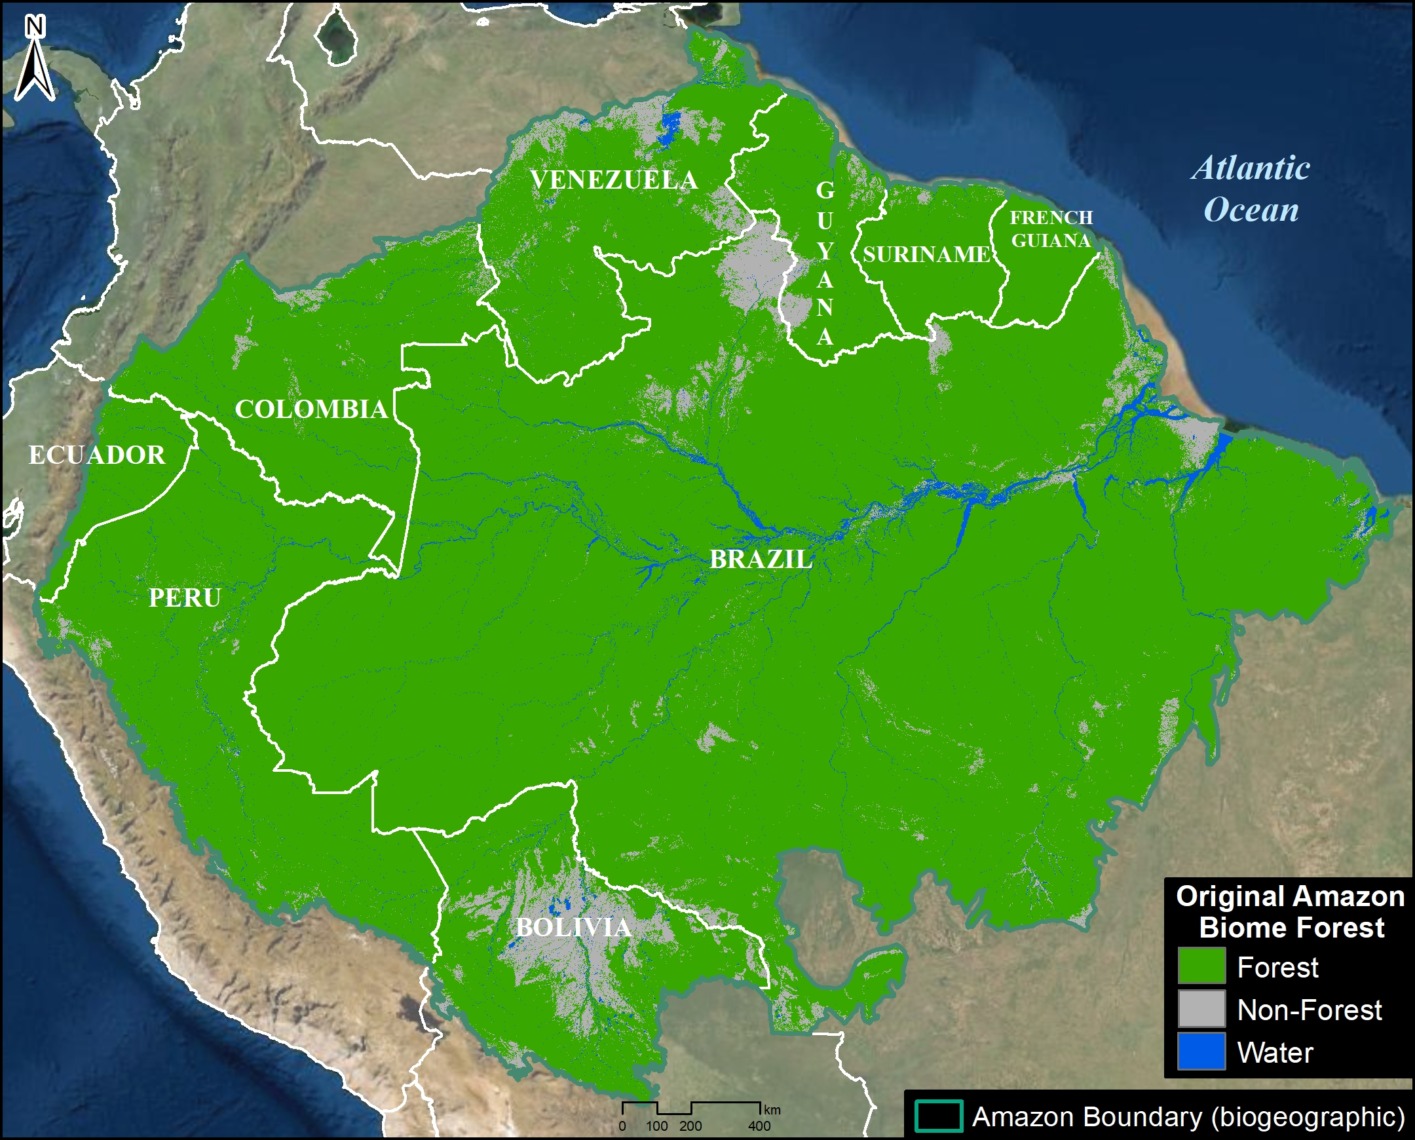
Our geographic range for the Amazon is a hybrid designed for maximum inclusion: biogeographic boundary (as defined by RAISG) for all countries, except for Bolivia and Peru, where we use the watershed boundary, and Brazil, where we use the Legal Amazon boundary.
To identify the deforestation hotspots, we conducted a kernel density estimate. This type of analysis calculates the magnitude per unit area of a particular phenomenon, in this case, forest cover loss. We conducted this analysis using the Kernel Density tool from the Spatial Analyst Tool Box of ArcGIS. We used the following parameters:
Search Radius: 15000 layer units (meters)
Kernel Density Function: Quartic kernel function
Cell Size in the map: 200 x 200 meters (4 hectares)
Everything else was left to the default setting.
For the Base Map, we used the following concentration percentages: High: 3-14%; Very High: >14%.
Acknowledgements
We thank colleagues at Global Forest Watch (GFW), an initiative of the World Resources Institute (WRI) for comments and access to data.
This work was supported by Norad (Norwegian Agency for Development Cooperation) and ICFC (International Conservation Fund of Canada).
Citation
Finer M, Mamani N (2023) Amazon Deforestation & Fire Hotspots 2022. MAAP: 187