MAAP #183: Protected Areas & Indigenous Territories Effective Against Deforestation Across Amazon

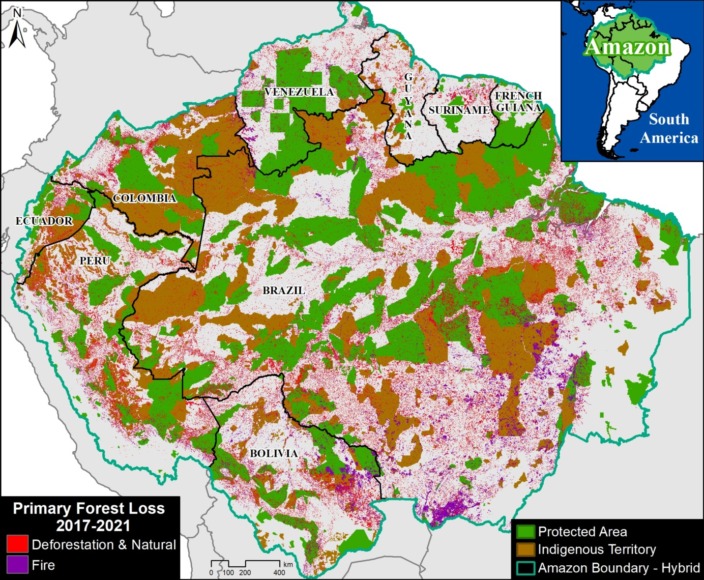
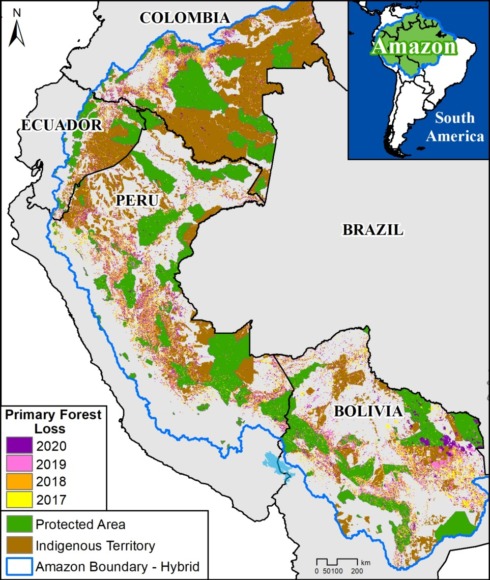
Base Map. Primary forest loss (2017-21) across the Amazon, in relation to protected areas and indigenous territories.

As deforestation continues to threaten primary forest across the Amazon, key land use designations are one of the best hopes for the long-term conservation of critical remaining intact forests.

Here, we evaluate the impact of two of the most important: protected areas & indigenous territories.

Our study looked across all nine countries of the Amazon biome, a vast area of 883.7 million hectares (see Base Map).

We calculated primary forest loss over the past 5 years (2017-2021).

For the first time, we were able to distinguish fire vs non-fire forest loss. For non-fire, while this does include natural events (such as landslides and wind storms), we consider this our best proxy for human-caused deforestation.

We analyzed the results across three major land use categories:

1) Protected Areas (national and state/department levels), which cover 197 million hectares (23.6% of Amazon).

2) Indigenous Territories (official), which cover 163.8 million hectares (19.6% of Amazon).

3) Other (all remaining areas outside protected areas and indigenous territories), which cover 473 million hectares (56.7% of Amazon).

In summary, we found that deforestation was the primary driver of forest loss, with fire always being a smaller subset. Averaged across all 5 years, protected areas and indigenous territories had similar levels of effectiveness, reducing primary forest loss rate by 3x compared to areas outside of these designations.

Below, we show the key results across the Amazon in greater detail, including a breakdown for the western Amazon (Bolivia, Colombia, Ecuador, and Peru) and the Brazilian Amazon.

Key Findings

Amazon Biome

We documented the loss of 11 million hectares of primary forests across all nine countries of the Amazon biome between 2017 and 2021. Of this total, 71% was non-fire (deforestation and natural) and 29% was fire.

For the major land use categories, 11% of the forest loss occurred in both protected areas and indigenous territories, respectively, while the remaining 78% occurred outside these designations.

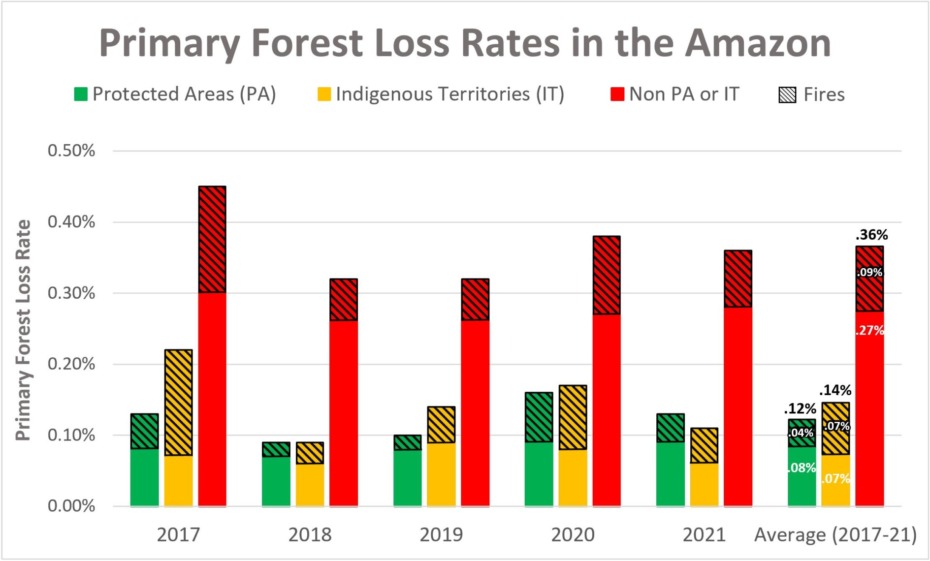
To standardize these results for the varying area coverages, we calculated annual primary forest loss rates (loss/total area of each category). Figure 1 displays the results for these rates across all nine countries of the Amazon biome.

Figure 1. Primary forest loss rates across the Amazon, 2017-21.

Broken down by year, 2017 had the highest forest loss rates, with both a severe deforestation and fire season. In addition, 2021 had the second highest deforestation rate, while 2020 had the second highest fire loss rate.

Averaged across all five years, protected areas (green) had the lowest overall primary forest loss rate (0.12%), closely followed by indigenous territories (0.14%).

Interestingly, indigenous territories (orange) actually had a slightly lower deforestation rate compared to protected areas (0.7 vs 0.8%), but higher fire loss rate (o.7 vs .04%), resulting in the overall higher forest loss rate noted above.

Outside of these designations (red), the primary forest loss rate was triple (.36%), especially due to much higher deforestation.

Western Amazon

Breaking the results down specifically for the western Amazon (Bolivia, Colombia, Ecuador, and Peru), we documented the loss of 2.6 million hectares of primary forests between 2017 and 2021. Of this total, 80% was non-fire (deforestation and natural) and 20% was fire.

For the major land use categories, 9.6% occurred in protected areas, 15.6% in indigenous territories, and the remaining 74.8% occurred outside these designations.

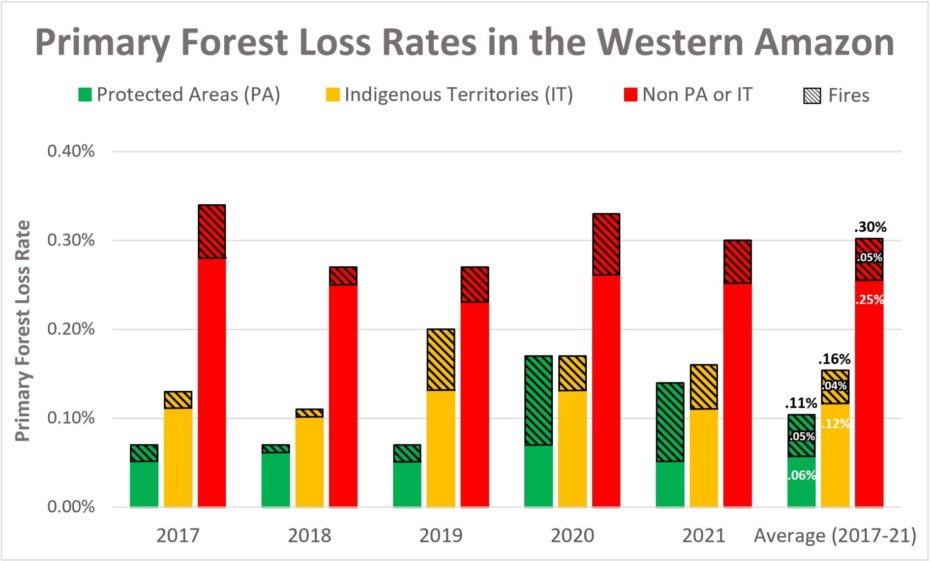
Figure 2 displays the standardized primary forest loss rates across the western Amazon.

Figure 2. Primary forest loss rates across the Western Amazon, 2017-21.

Broken down by year, 2017 had the highest deforestation rate and overall forest loss rates. But 2020 had the highest fire loss rate, mainly due to extensive fires in Bolivia. 2021 also had a relatively high deforestation rate. Also, note the high level of fires in protected areas in 2020 and 2021, and indigenous territories in 2019.

Averaged across all five years, protected areas had the lowest overall primary forest loss rate (0.11%), followed by indigenous territories (0.16%).

Outside of these designations, the primary forest loss rate was .30%. That is, triple the protected areas rate and double the indigenous territories rate.

Brazilian Amazon

Breaking the results down specifically for the Brazilian Amazon, we documented the loss of 8.1 million hectares of primary forests between 2017 and 2021. Of this total, 68% was non-fire (deforestation and natural) and 32% was fire.

For the major land use categories, 9.4% occurred in indigenous territories, 11.2% occurred in protected areas, and the remaining 79.4% occurred outside these designations.

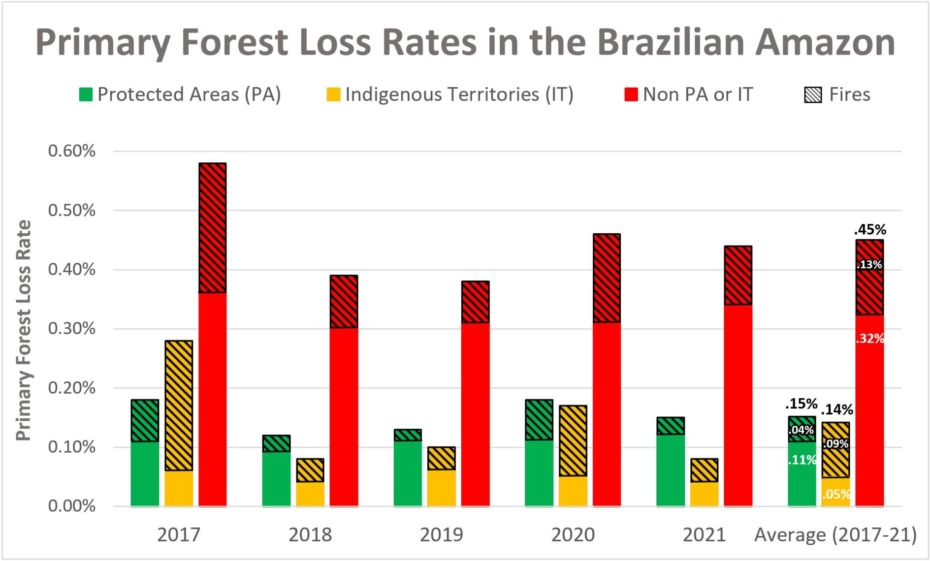
Figure 3 displays the standardized primary forest loss rates across the Brazilian Amazon.

Figure 3. Primary forest loss rates in the Brazilian Amazon, 2017-21.

Broken down by year, 2017 had the highest forest loss rate recorded in the entire study (.58%), due to both elevated deforestation and fire. Note that indigenous territories were particularly impacted by fire in 2017.

2020 had the next highest forest loss rate, also driven by an intense fire season. Fires were not as severe the following year in 2021, but deforestation increased.

Averaged across all five years, indigenous territories had the lowest overall primary forest loss rate (0.14%), closely followed by protected areas (0.15%).

Interestingly, indigenous territories had a lower deforestation rate compared to protected areas (0.5 vs 0.11%), but higher fire impact (0.09 vs 0.04%).

Outside of these designations (red), the primary forest loss rate was triple (.45%).

Methodology

To estimate deforestation across all three categories (protected areas, indigenous territories, and other), we used annual forest loss data (2017-21) from the University of Maryland (Global Land Analysis and Discovery GLAD laboratory) to have a consistent source across all countries (Hansen et al 2013).

We obtained this data, which has a 30-meter spatial resolution, from the “Global Forest Loss due to Fires 2000–2021” data download page. It is also possible to visualize and interact with the data on the main Global Forest Change portal.

The annual data is disaggregated into forest loss due to fire vs. non-fire (other disturbance drivers). It is important to note that the non-fire drivers include both human-caused deforestation and forest loss caused by natural forces (landslides, wind storms, etc.).

We also filtered this data for only primary forest loss, following the established methodology of Global Forest Watch. Primary forest is generally defined as intact forest that has not been previously cleared (as opposed to previously cleared secondary forest, for example). We applied this filter by intersecting the forest cover loss data with the additional dataset “primary humid tropical forests” as of 2001 (Turubanova et al 2018). Thus, we often use the term “primary forest loss” to describe this filtered data.

Data presented as primary forest loss rate is standardized per the total area covered of each respective category per year (annual). For example, to properly compare raw forest loss data in areas that are 100 hectares vs 1,000 hectares total size respectively, we divide by the area to standardize the result.

Our geographic range extends from the Andes to the Amazon plain and reaching the transitions with the Cerrado and the Pantanal. This range includes nine countries of the Amazon (or Pan-Amazon region as defined by RAISG) and consists of a combination of the Amazon watershed limit, the Amazon biogeographic limit and the Legal Amazon limit in Brazil. See Base Map above for delineation of this hybrid Amazon limit, designed for maximum inclusion.

Additional data sources include:

  • National and state/department level protected areas: RUNAP 2020 (Colombia), SNAP 2022 (Ecuador), SERNAP & ACEAA 2020 (Bolivia), SERNANP 2022 (Peru), INPE/Terrabrasilis 2022 (Brazil), SOS Orinoco 2021 (Venezuela), and RAISG 2020 (Guyana, Suriname, and French Guiana.)
  • Indigenous Territories: RAISG & Ecociencia 2022 (Ecuador), INPE/Terrabrasilis 2022 (Brazil), RAISG 2020 (Colombia, Bolivia, Venezuela, Guyana, Suriname, and French Guiana), and MINCU & ACCA 2021 (Peru). For Peru, this includes titled native communities and Indigenous/Territorial Reserves for indigenous groups in voluntary isolation.

For analysis, we categorized Protected Areas first, then Indigenous Territories to avoid overlapping areas. Each category was disaggregated by year created/recognized to match the annual report of forest loss, for example. If a Protected area was created in December 2018, it would be considered within the analysis for the year 2019.

Acknowledgements

This work was supported by the Andes Amazon Fund (AAF), Norwegian Agency for Development Cooperation (NORAD), and International Conservation Fund of Canada (ICFC).

We thank M. MacDowell and M. Cohen for helpful comments on this report.

Citation

Finer M, Mamani N (2023) Protected Areas & Indigenous Territories Effective Against Deforestation Across Amazon. MAAP: 176.

MAAP #141: Protected Areas & Indigenous Territories Effective Against Deforestation in the Western Amazon

Base Map. Primary forest loss across the western Amazon, with magnified visualization of the data. Click to enlarge. See Methodology for data sources.

As deforestation continues to threaten primary forest across the Amazon, key land use designations are one of the best hopes for the long-term conservation of critical remaining intact forests.

Here, we evaluate the impact of two of the most important land use designations: protected areas and indigenous territories.

Our study area focused on the four mega-diverse countries of the western Amazon (Bolivia, Colombia, Ecuador, & Peru), covering a vast area of over 229 million hectares (see Base Map).

We calculated primary forest loss over the past four years (2017-2020) across the western Amazon and analyzed the results across three major land use categories:

1) Protected Areas (national and state/department levels), which covered 43 million hectares as of 2020.

2) Indigenous Territories (official), which covered over 58 million hectares as of 2020.

3) Other (that is, all remaining areas outside protected areas and indigenous territories), which covered the remaining 127 million hectares as of 2020.

In addition, we took a deeper look at the Peruvian Amazon and also included long-term forestry lands.

In summary, we found that, averaged across all four years, protected areas had the lowest primary forest loss rate, closely followed by indigenous territories (see Figure 1). Outside of these critical areas, the primary forest loss rate was more than double.

Below, we describe the key results in greater detail, including a detailed look at each country.


Key Findings – Western Amazon
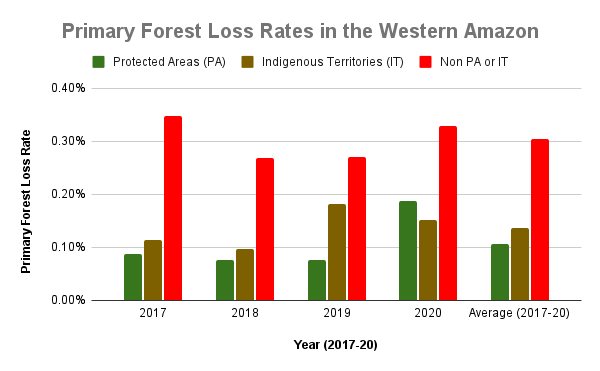
Figure 1. Primary forest loss rates in the western Amazon.

Overall, we documented the loss of over 2 million hectares of primary forests across the four countries of the western Amazon between 2017 and 2020. Of the four years, 2020 had the most forest loss (588,191 ha).

Of this total, 9% occurred in protected areas (179,000 ha) and 15% occurred in indigenous territories (320,000 ha), while the vast majority (76%) occurred outside key these land use designations (1.6 million ha).

To standardize these results for the varying area coverages, we calculated primary forest loss rates (loss/total area of each category). Figure 1 displays the combined results for these rates across all four countries.

From 2017-19, protected areas (green) had the lowest primary forest loss rates across the western Amazon (less than 0.10%).

Indigenous territories (brown) also had low primary forest loss rates from 2017-18 (less than 0.11%), but this rose in 2019 (0.18%) due to fires in Bolivia.

In the intense COVID pandemic year of 2020, this overall pattern flipped, with elevated primary forest loss in protected areas, again largely due to major fires in Bolivia. Thus, indigenous territories had the lowest primary forest loss rate followed by protected areas (0.15% and 0.19%, respectively) in 2020.

Averaged across all four years, protected areas had the lowest primary forest loss rate (0.11%), closely followed by indigenous territories (0.14%). Outside of these critical areas (red), the primary forest loss rate was more than double (0.30%). The lowest primary forest loss rates (less than 0.10%) occurred in the protected areas of Ecuador and Peru (0.01% and 0.03%, respectively), and indigenous territories of Colombia (0.07%).

Country Results
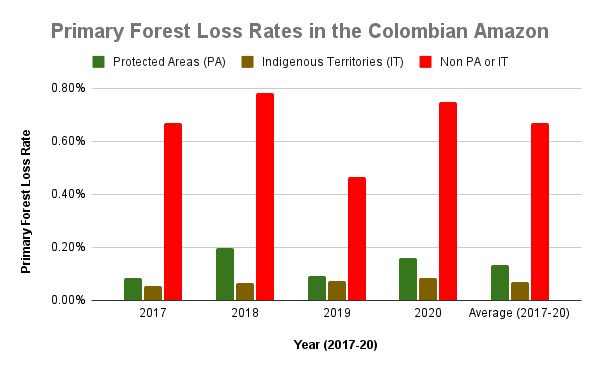
Figure 2. Primary forest loss rates in the Colombian Amazon.

Colombian Amazon

Colombia had, by far, the highest primary forest loss rates outside protected areas and indigenous territories (averaging 0.67% across all four years).

By contrast, Colombian indigenous territories had one of the lowest primary forest loss rates across the western Amazon (averaging 0.07% across all four years).

The primary forest loss rates for protected areas were on average nearly double that of indigenous territories (mostly due to the high deforestation in Tinigua National Park), but still much lower than non-protected areas.
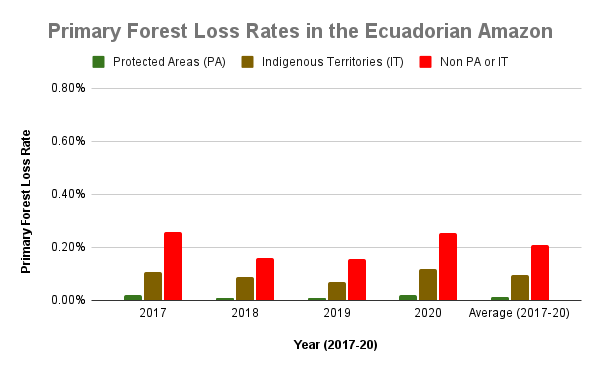


Figure 3. Primary forest loss rates in the Ecuadorian Amazon.

Ecuadorian Amazon

Overall, Ecuador had the lowest primary forest loss rates across all three categories.

Protected areas had the lowest primary forest loss rate of any category across the western Amazon (averaging 0.01% across all four years).

Indigenous territories also had relatively low primary forest loss rates, averaging half that of outside protected areas and indigenous territories (0.10% vs 0.21%, respectively).
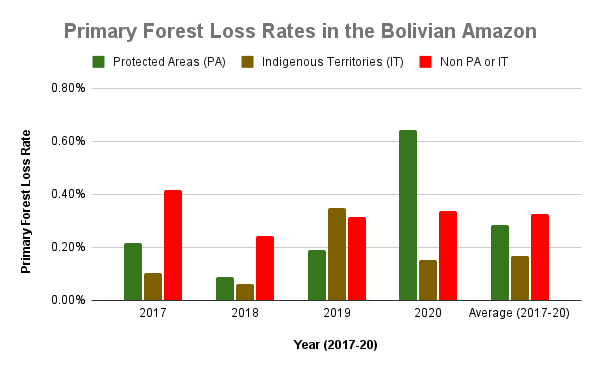


Figure 4. Primary forest loss rates in the Bolivian Amazon.

Bolivian Amazon

Bolivia had the most dynamic results, largely due to intense fire seasons in 2019 and 2020. Indigenous territories had the lowest primary forest loss rates, with 2019 being the only exception, due to large fires in the Santa Cruz department that affected the Monte Verde indigenous territory.

Protected areas had the lowest primary forest loss rate in 2019, but in extreme contrast, the highest the following year in 2020, also due to large fires in the Santa Cruz department that affected Noel Kempff Mercado National Park.

Overall, primary forest loss was highest outside protected areas and indigenous territories (averaging 0.33% across all four years).
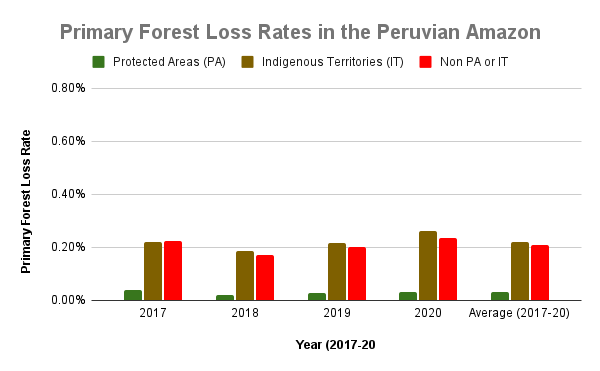


Figure 5a. Primary forest loss rates in the Peruvian Amazon. Data: UMD.

Peruvian Amazon

Following Ecuador, Peru also had relatively low primary forest loss rates, particularly in protected areas (averaging 0.03% across all four years).

Primary forest loss in indigenous territories (that is, combined data for native communities and Territorial/Indigenous Reserves for groups in voluntary isolation) was surprisingly high, similar to that of areas outside protected areas across all four years. For example, in 2020, elevated primary forest loss was concentrated in several titled native communities in the regions of Amazonas, Ucayali, Huánuco, and Junín.
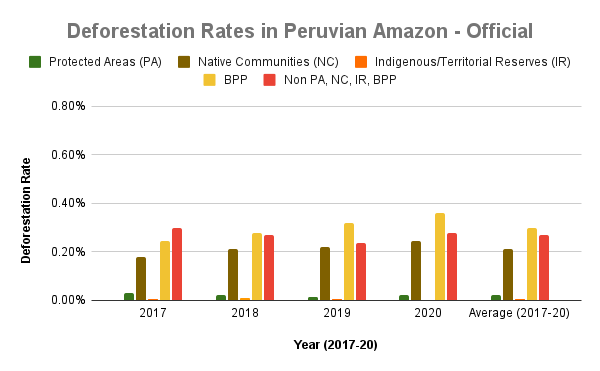


Figure 5b. Deforestation rates in the Peruvian Amazon. Data: MINAM/Geobosques.

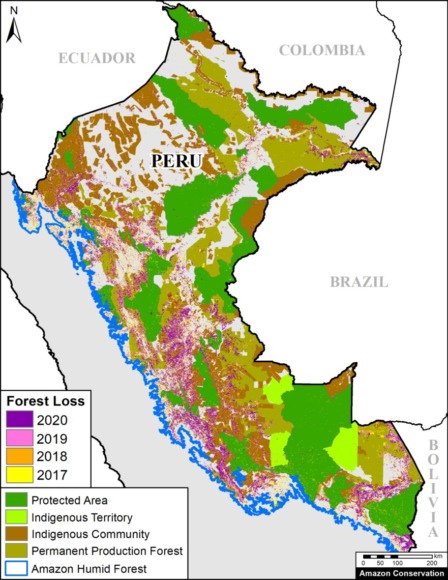
As noted above, we conducted a deeper analysis for the Peruvian Amazon, using deforestation data produced by the Peruvian government and adding the additional category of long-term forestry lands (known as Permanent Production Forests, or BPP in Spanish) (see Annex map).

We also separated the data for indigenous territories into native communities and Territorial/Indigenous Reserves for groups in voluntary isolation, respectively.

These data also show that deforestation was lowest in the remote Territorial/Indigenous Reserves, closely followed by protected areas (0.01% vs 0.02% across all four years, respectively). Deforestation in titled native communities was 0.21% across all four years. Surprisingly, deforestation was higher in the forestry lands than areas outside protected areas and indigenous territories (0.30% vs 0.27% across all four years).


Annex – Peruvian Amazon

The following map shows added detail for Peru, most notably the inclusion of long-term forestry lands (known as Permanent Production Forests, or BPP in Spanish).


*Methodology

To estimate deforestation across all three categories, we used annual forest loss data (2017-20) from the University of Maryland (Global Land Analysis and Discovery GLAD laboratory) to have a consistent source across all four countries (Hansen et al 2013).

We obtained this data, which has a 30-meter spatial resolution, from the “Global Forest Change 2000–2020” data download page. It is also possible to visualize and interact with the data on the main Global Forest Change portal.

It is important to note that these data include both human-caused deforestation and forest loss caused by natural forces (landslides, wind storms, etc…).

We also filtered this data for only primary forest loss, following the established methodology of Global Forest Watch. Primary forest is generally defined as intact forest that has not been previously cleared (as opposed to previously cleared secondary forest, for example). We applied this filter by intersecting the forest cover loss data with the additional dataset “primary humid tropical forests” as of 2001 (Turubanova et al 2018). For more details on this part of the methodology, see the Technical Blog from Global Forest Watch (Goldman and Weisse 2019).

Thus, we often use the term “primary forest loss” to describe the data.

Data presented as primary forest loss or deforestation rate is standardized per the total area covered of each respective category. For example, to properly compare raw forest loss data in areas that are 100 hectares vs 1,000 hectares total size respectively, we divide by the area to standardize the result.

Our geographic range included four countries of the western Amazon and consists of a combination of the Amazon watershed limit (most notably in Bolivia) and Amazon biogeographic limit (most notably in Colombia) as defined by RAISG. See Base Map above for delineation of this hybrid Amazon limit, designed for maximum inclusion.

Additional data sources include: National and state/deprartment level protected areas: RUNAP 2020 (Colombia), SNAP 2017 & RAISG 2020 (Ecuador), SERNAP & ACEAA 2020 (Bolivia), and SERNANP 2020 (Peru).

Indigenous Territories: RAISG 2020 (Colombia, Ecuador, and Bolivia), and MINCU & ACCA 2020 (Peru). For Peru, this includes titled native communities and Indigenous/Territorial Reserves for indigenous groups in voluntary isolation.

For the additional analysis in Peru, we used deforestation data from MINAM/Geobosques (note this is actual deforestation and not primary forest loss) and BPP data from SERFOR. We also separated data from titled native communities and Territorial/Indigenous Reserves for groups in voluntary isolation.

Acknowledgements

We thank M. MacDowell (AAF) A. Folhadella (ACA), J. Beavers (ACA), S. Novoa (ACCA), and D. Larrea (ACEAA) for their helpful comments on this report.

This work was supported by the Andes Amazon Fund (AAF), Norwegian Agency for Development Cooperation (NORAD), and International Conservation Fund of Canada (ICFC).
 

Citation

Finer M, Mamani N, Silman M (2021) Protected Areas & Indigenous Territories Effective Against Deforestation in the Western Amazon. MAAP: 141.

MAAP #133: Deforestation Continues in National Parks of Colombian Amazon

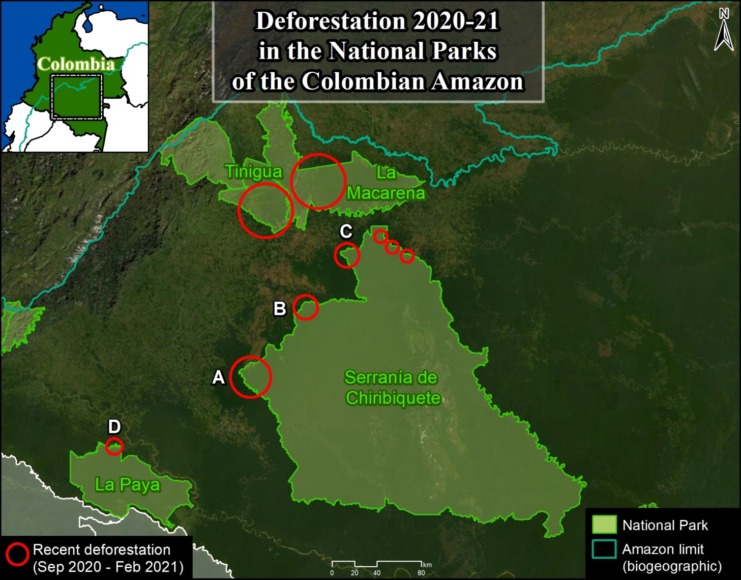
Base Map. Deforestation 2020-21 in the National Parks of the Colombian Amazon. Data: MAAP.

As we have indicated in previous reports (MAAP #120), there is an “arc of deforestation” in the northwest Colombian Amazon, impacting numerous protected areas and indigenous reserves.

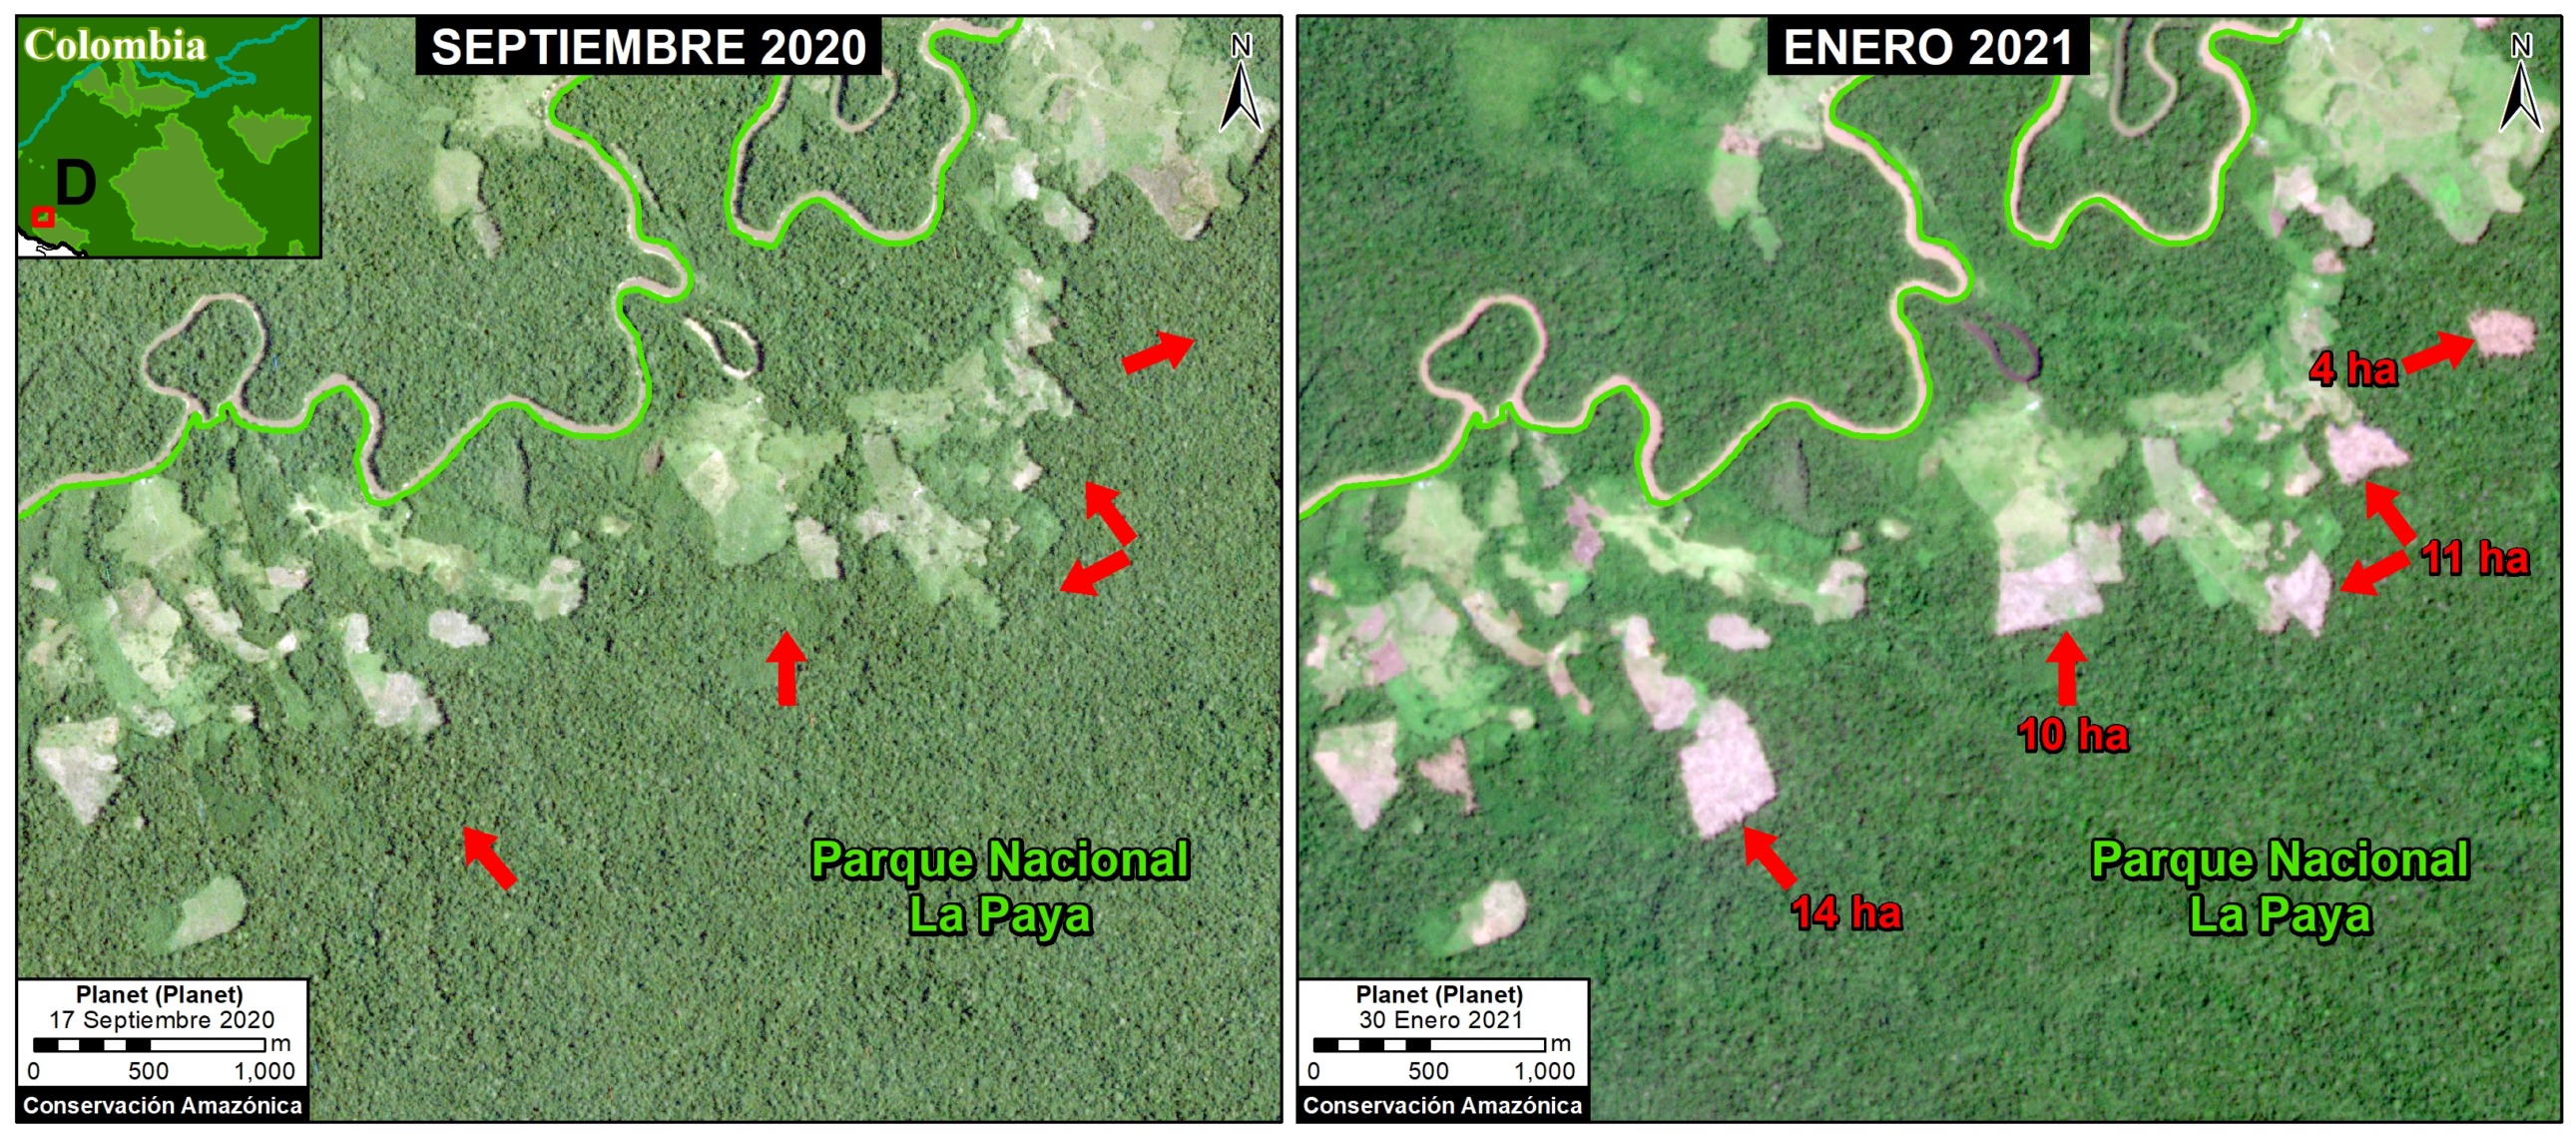
Here, we emphasize that this deforestation currently impacts four National Parks: Tinigua, Macarena, Chiribiquete and La Paya.

In the Base Map, the red circles indicate the areas most impacted by recent deforestation within these parks.

The letters (A-D) indicate the location of the high-resolution satellite images (Planet) below.

While Tinigua and Macarena continue as the most impacted National Parks, below we focus on the new deforestation fronts in Chiribiquete and La Paya.

Specifically, we show the most recent and urgent deforestation, since September 2020 to the present (February 2021).


Chiribiquete National Park

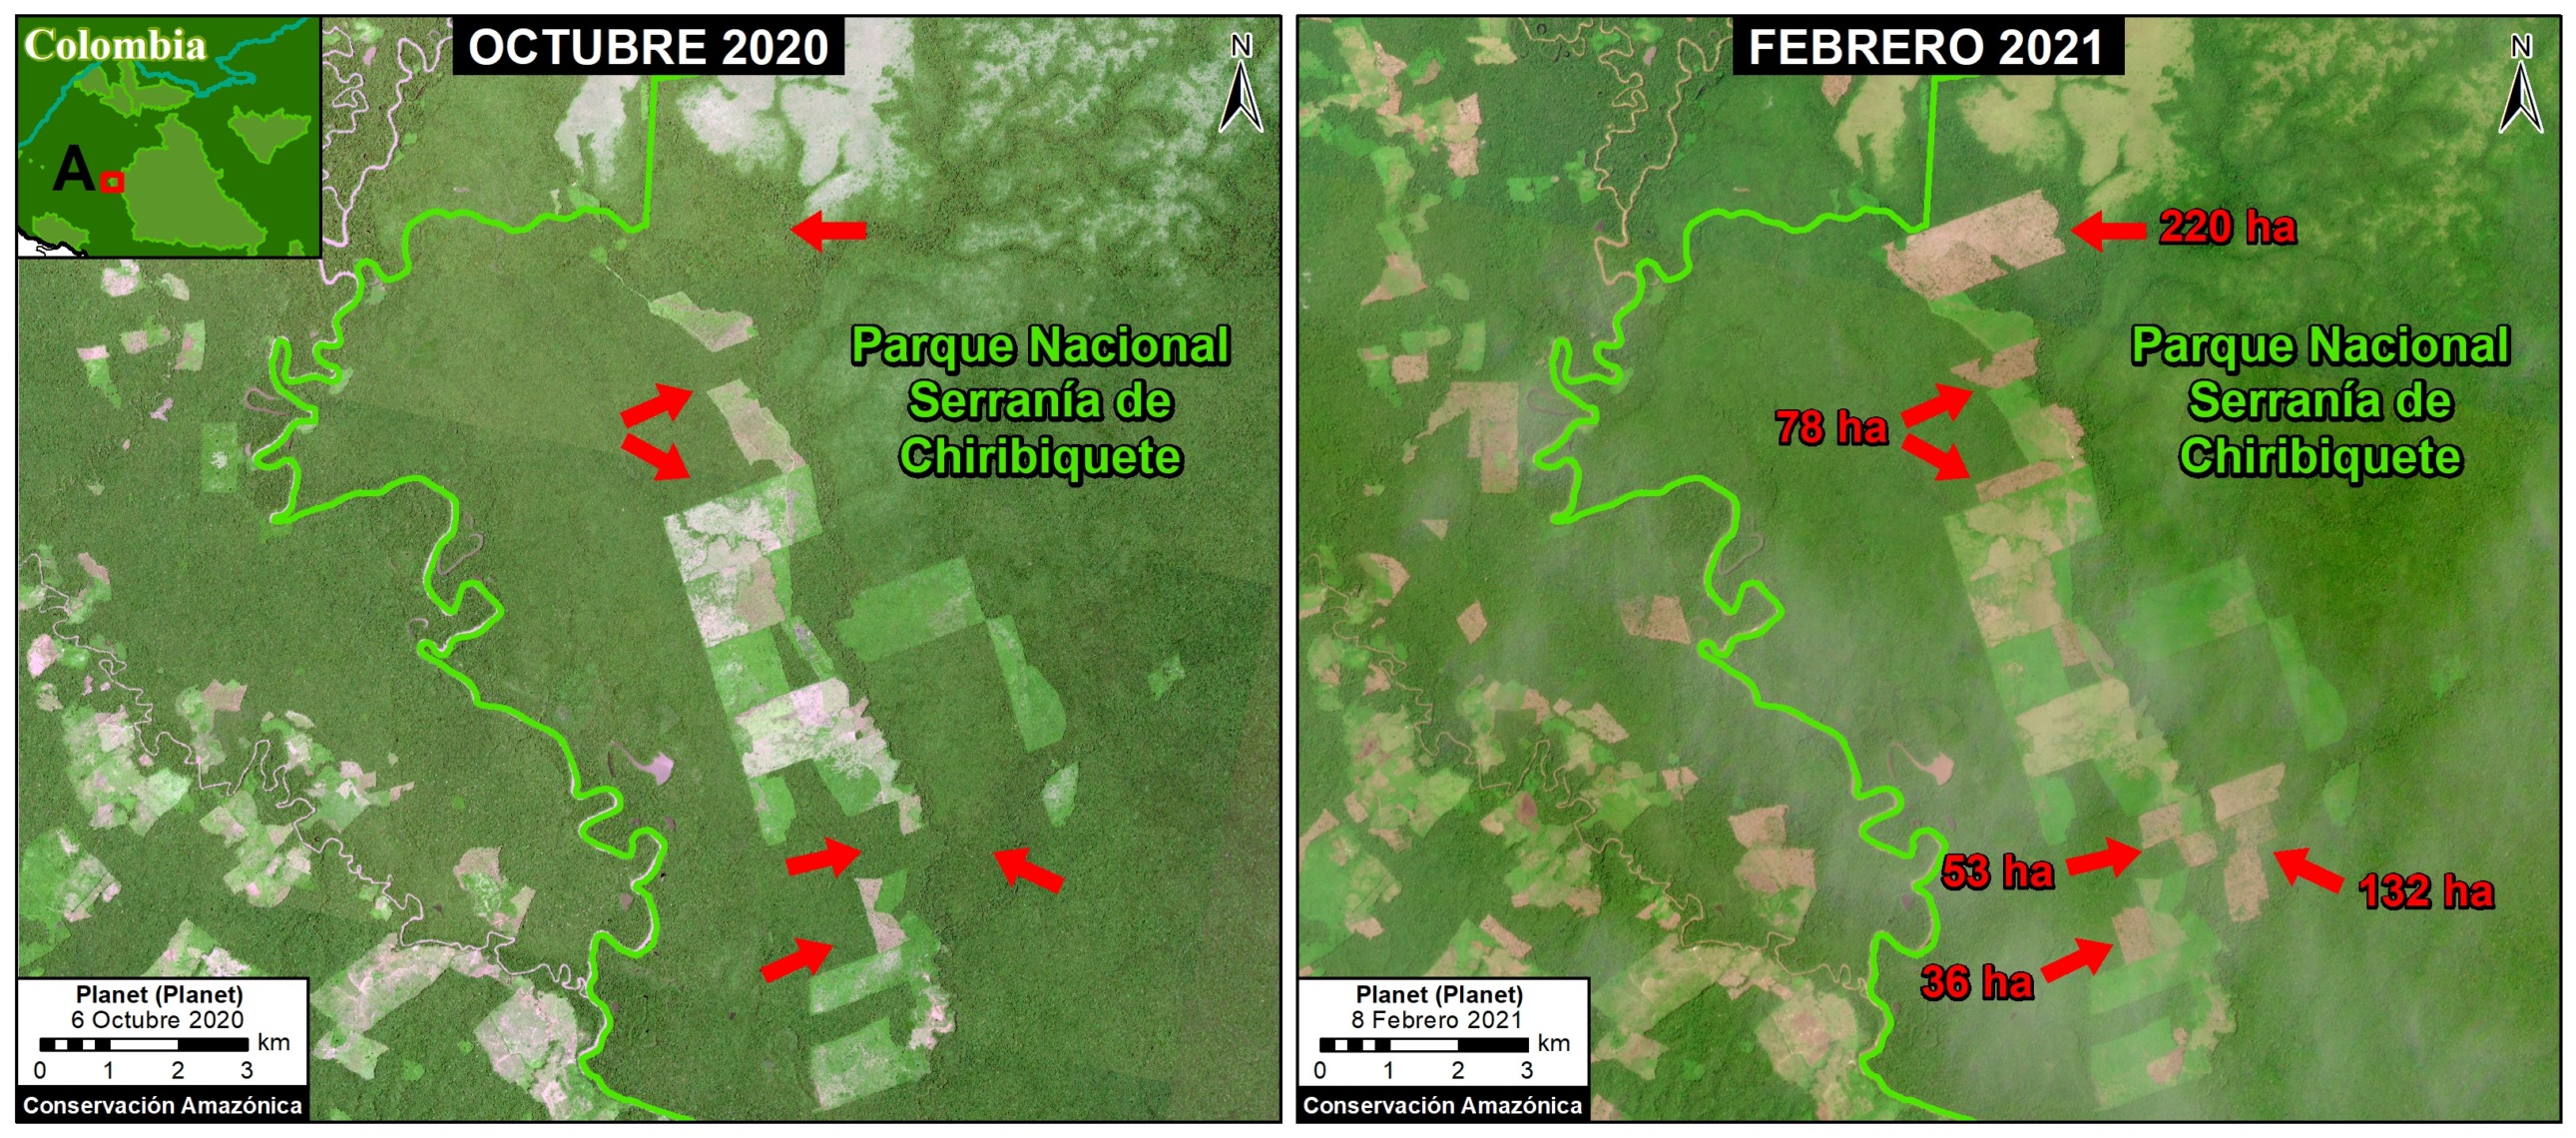
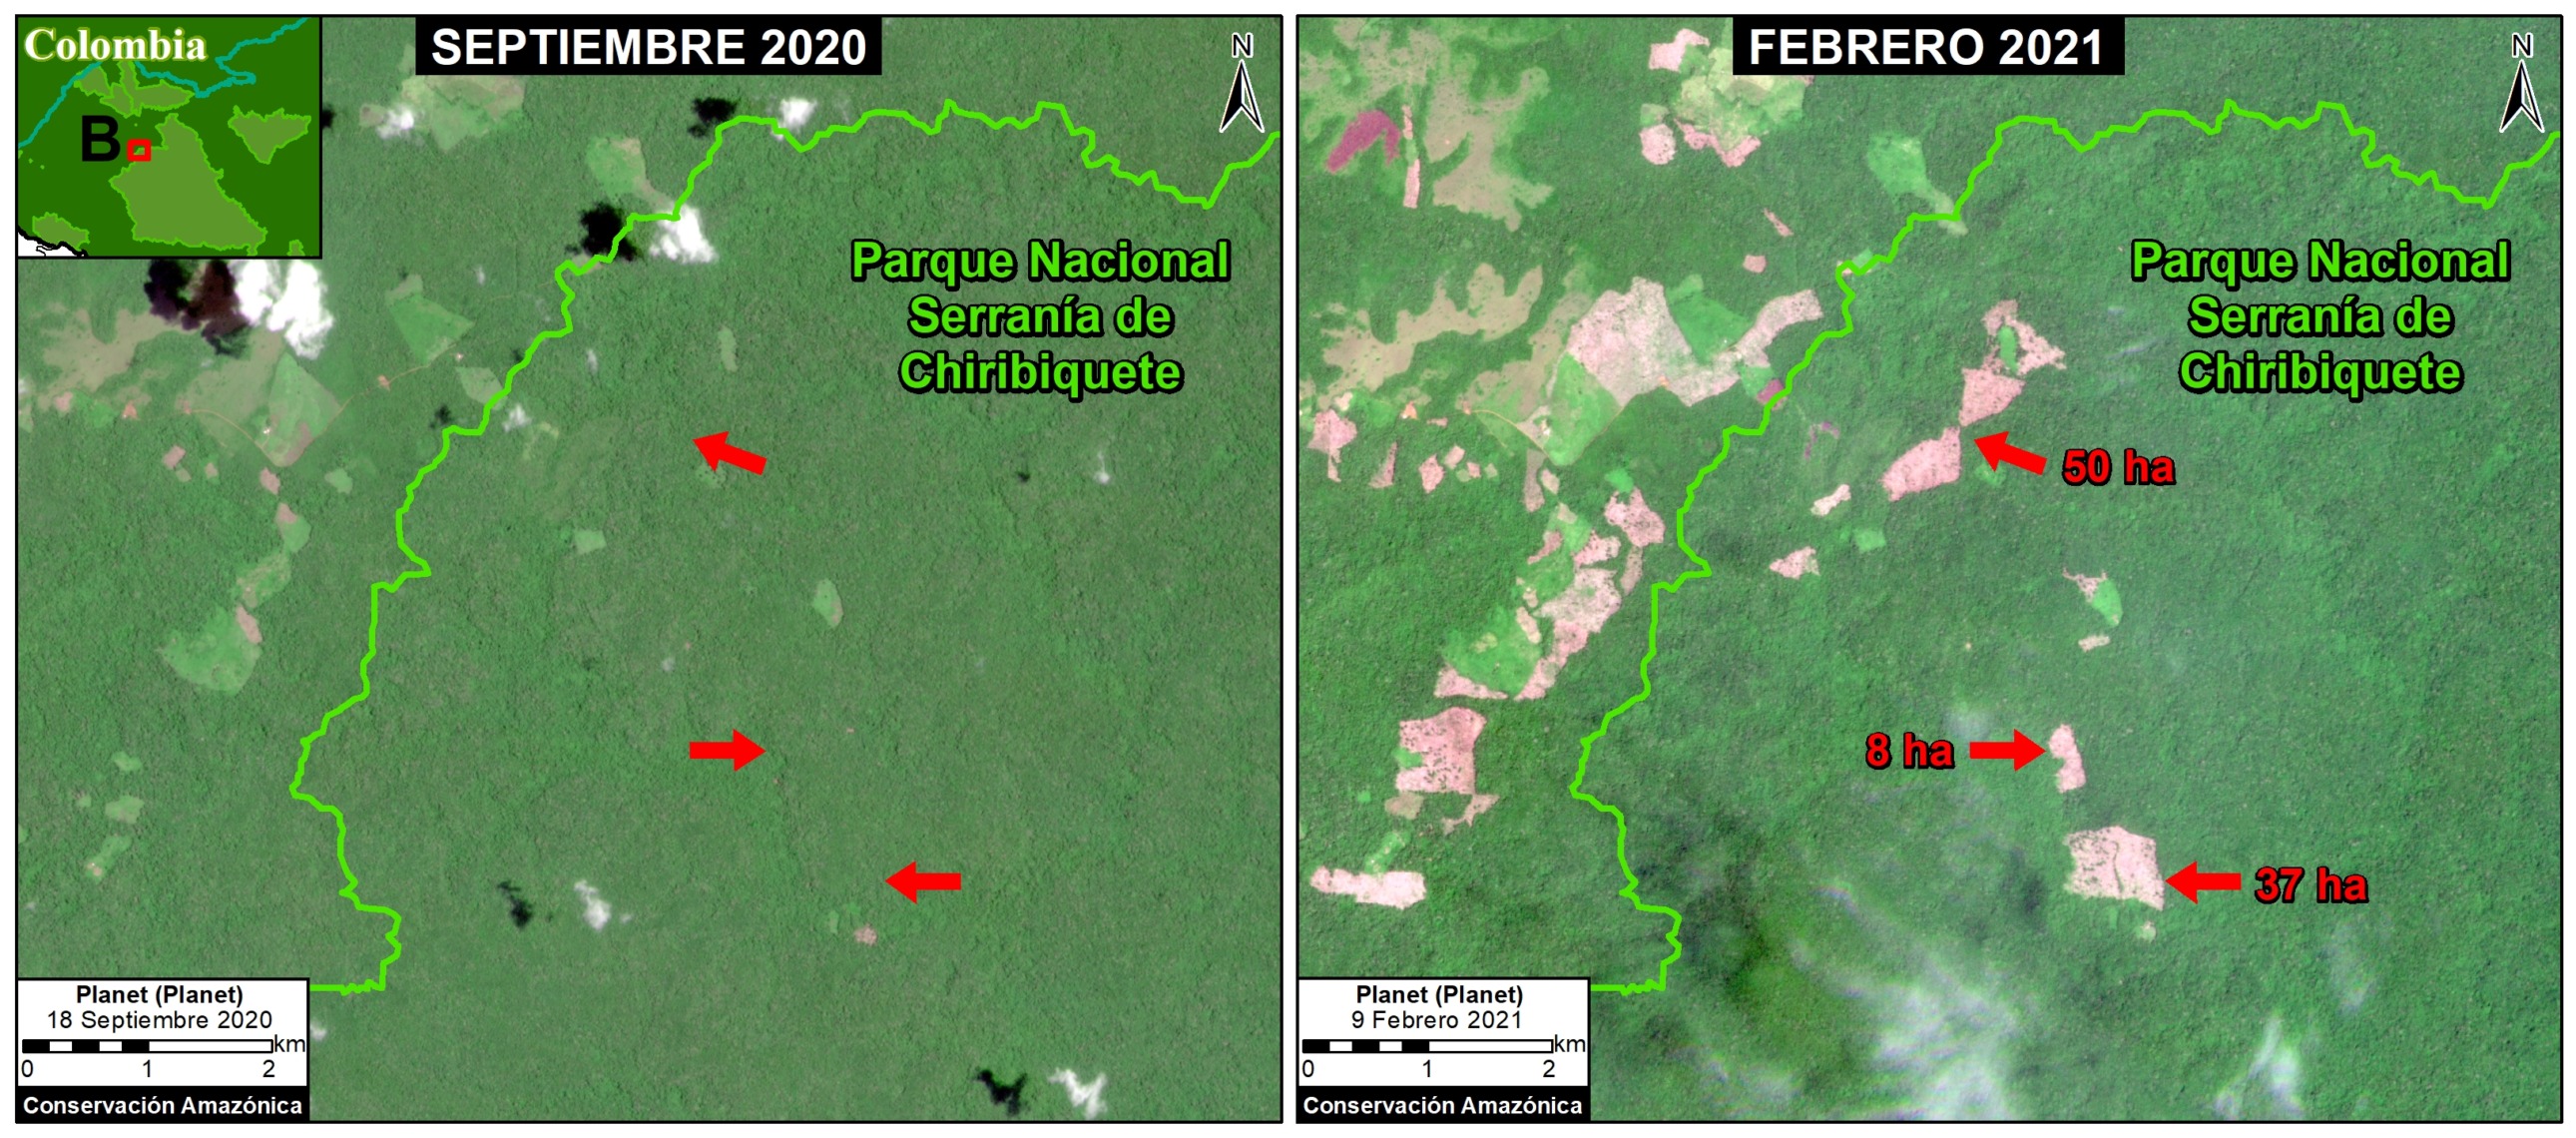
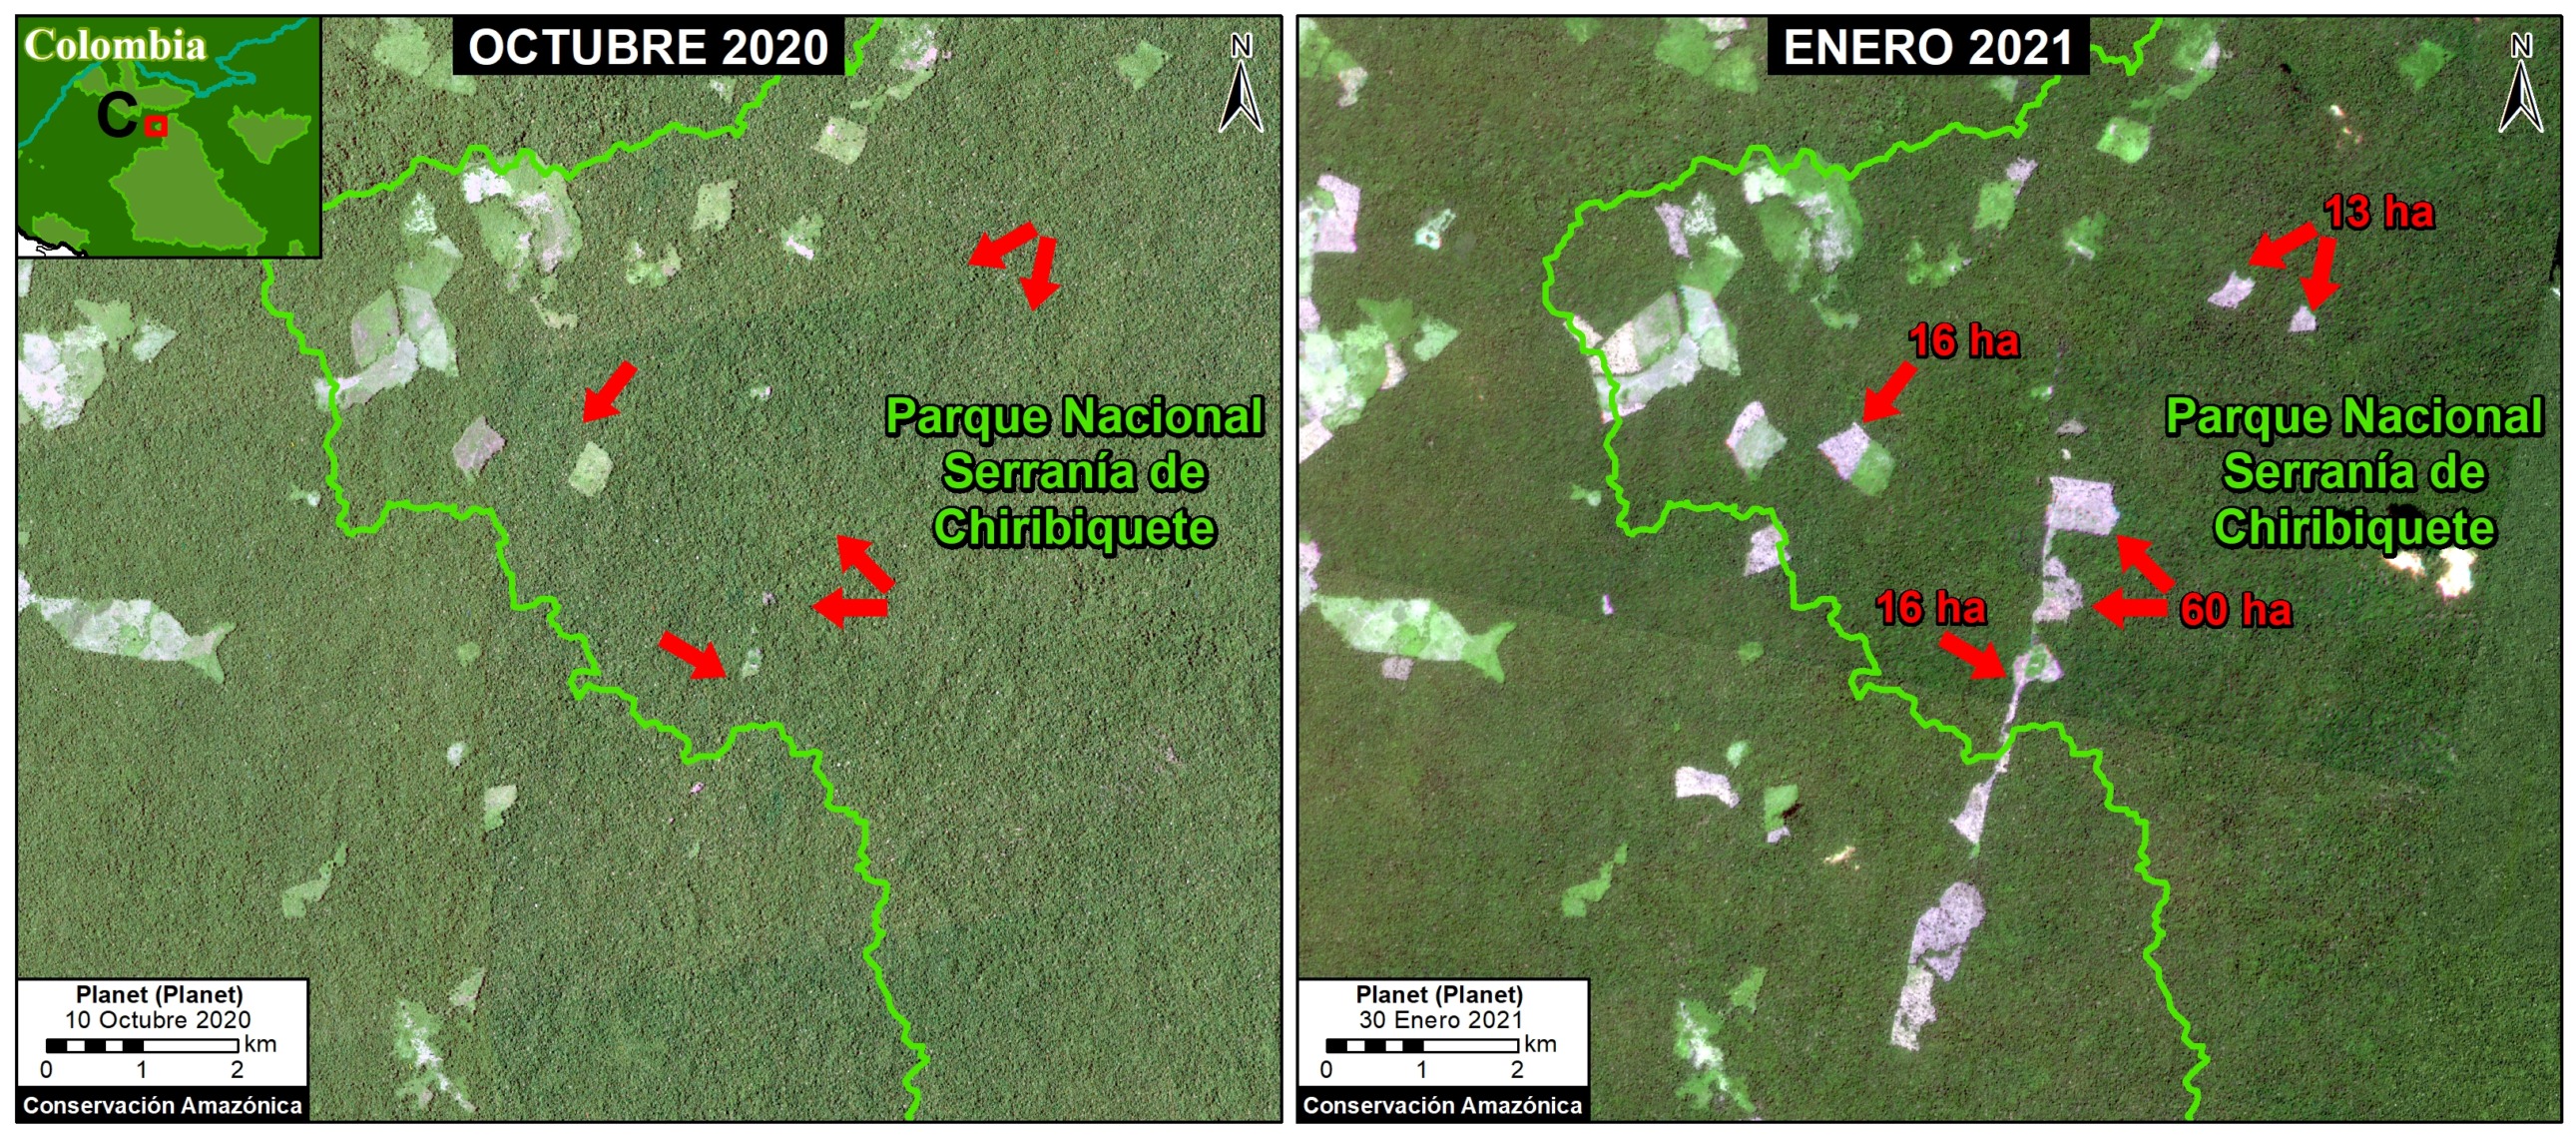
Chiribiquete National Natural Park lost more than 1,000 hectares (2,500 acres) in the last six months, in six different areas of the park (see Base Map above). Much of this deforestation appears to be associated with the conversion of primary forest to illegal cattle pasture. The following satellite images show deforestation in three of these areas (A-C) between September 2020 (left panel) and February 2021 (right panel). *It is important to note that immediately prior to this publication authorities carried out a major intervention to crack down on the illegal activity within the park (see news here).

Image A. Deforestation in Chiribiquete National Park, western sector 1. Reference coordinate: 1.05497 ° N, 74.26465 ° W. Data: Planet, MAAP.
Image B. Deforestation in Chiribiquete National Park, western sector 2. Reference coordinate: 1.57990 ° N, 73.78689 ° W. Data: Planet, MAAP.
Image C. Deforestation in Chiribiquete National Park, northern sector 1. Reference coordinate: 2.00975, -73.45541. Data: Planet, MAAP.
La Paya National Park

La Paya National Park lost more than 150 hectares (370 acres) in the last six months, in the northwest sector of the park (see Base Map above).
.
The following image shows an example of deforestation in this sector of the park between September 2020 (left panel) and January 2021 (right panel).

Image D. Deforestation in La Paya National Park, northern sector. Reference coordinate: 0.39677 ° N, 75.48505 ° W. Data: Planet, MAAP.

Fire Season

In addition, the fire season has started in the Colombian Amazon. Interestingly, now (February to March) is typically Colombia’s peak deforestation and fire season, in contrast with Brazil, Bolivia, and Peru, whose seasons peak between June and October.
l
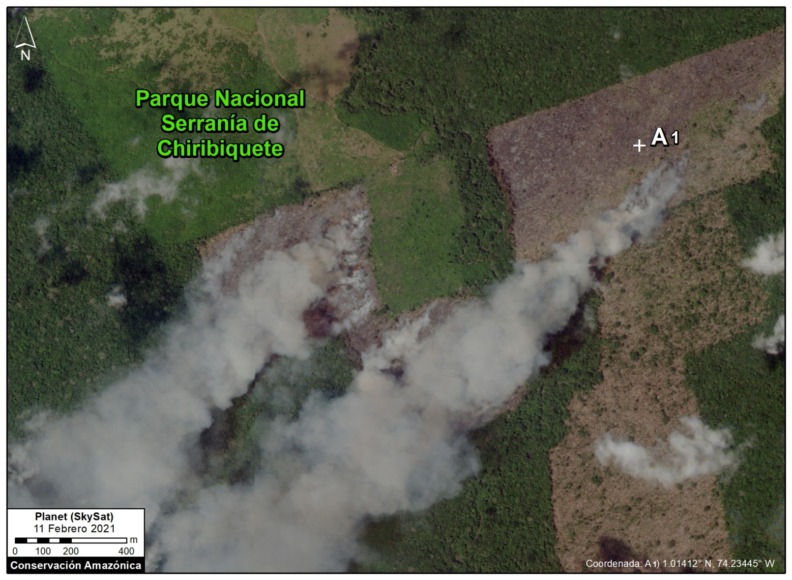
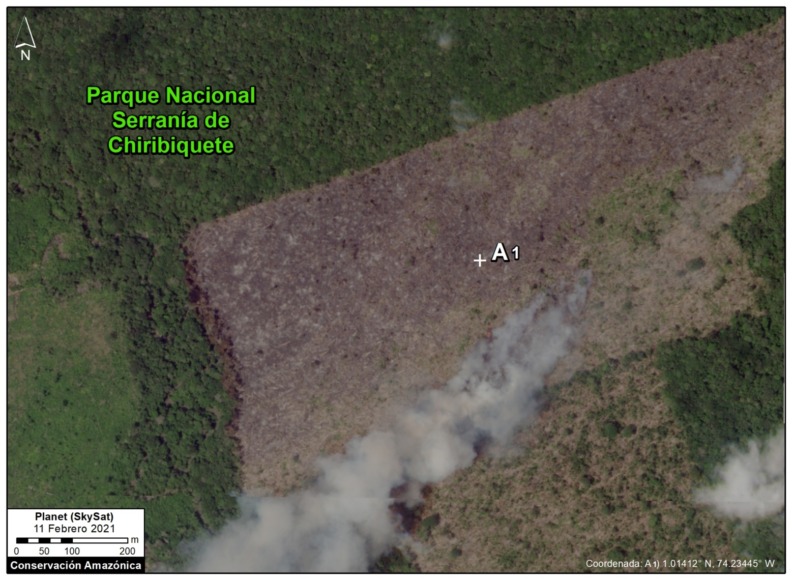
The following very high-resolution images (Skyat) reveal the burning of recently deforested areas within Chiribiquete National Park.
Fire inside Chiribuete National Park (February 11, 2021) burning recently deforested areas. Data: Planet (Skysat).
Zoom of fire inside Chiribuete National Park (February 11, 2021) burning recently deforested areas. Data: Planet (Skysat).

Acknowledgmens

We thank R. Botero (FCDS) and G. Palacios for their helpful comments on this report.

This work was supported by NORAD (Norwegian Agency for Development Cooperation) and ICFC (International Conservation Fund of Canada).

Citation

Finer M, Mamani N (2021) Deforestation Continues in National Parks of Colombian Amazon. MAAP: 133.

MAAP Colombia: Chiribiquete – Deforestation Hotspots in the Colombian Amazon, part 3

MAAP #86: Deforestation Hotspots in the Colombian Amazon, part 3: Chiribiquete-Macarena

We present our third report* in a series investigating deforestation hotspots in the Colombian Amazon. Here, we focus on the “Chiribiquete-Macarena” hotspot, located between the Chiribiquete and La Macarena National Parks.

The Colombian government is finalizing plans to expand the boundaries of Chiribiquete National Park, an important step for conservation. However, we show (with high-resolution images) that deforestation is surging in the area and rapidly expanding towards these new boundaries. In fact, in 2018, deforestation has entered the newly expanded park.

MAAP #86: Deforestation Hotspots in the Colombian Amazon, part 3: Chiribiquete-Macarena

https://www.maapprogram.org/chiribiquete/


*The first report focused on the “Caguan” hotspot in the department of Caquetá. The second report focused on the “La Paya” hotspot in the department of Putumayo.

MAAP #83: Climate Change Defense: Amazon Protected Areas and Indigenous Lands

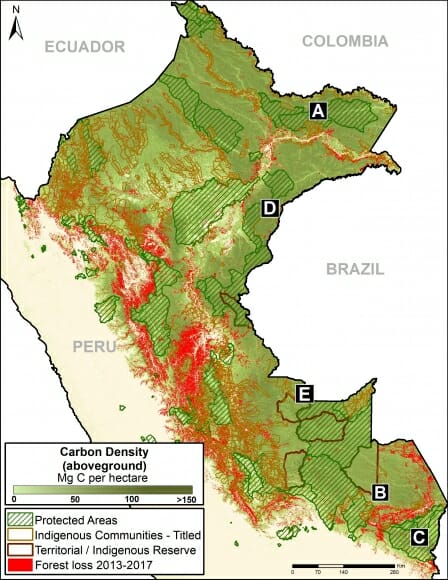
Base Map. Data: Asner et al 2014, MINAM/PNCB, SERNANP, IBC

Tropical forests, especially the Amazon, sequester huge amounts of carbon, one of the main greenhouse gases driving climate change.

Here, we show the importance of protected areas and indigenous lands to safeguard these carbon stocks.

In MAAP #81, we estimated the loss of 59 million metric tons of carbon in the Peruvian Amazon during the last five years (2013-17) due to forest loss, especially deforestation from mining and agricultural activities.

This finding reveals that forest loss represents nearly half (47%) of Peru’s annual carbon emissions, including from burning fossil fuels.1,2

In contrast, here we show that protected areas and indigenous lands have safeguarded 3.17 billion metric tons of carbon, as of 2017.3,4

The Base Map (on the right) shows, in shades of green, the current carbon densities in relation to these areas.

The breakdown of results are:
1.85 billion tons safeguarded in the Peruvian national protected areas system;
1.15 billion tons safeguarded in titled native community lands; and
309.7 million tons safeguarded in Territorial Reserves for indigenous peoples in voluntary isolation.

The total safeguarded carbon (3.17 billion metric tons) is the equivalent to 2.5 years of carbon emissions from the United States.5

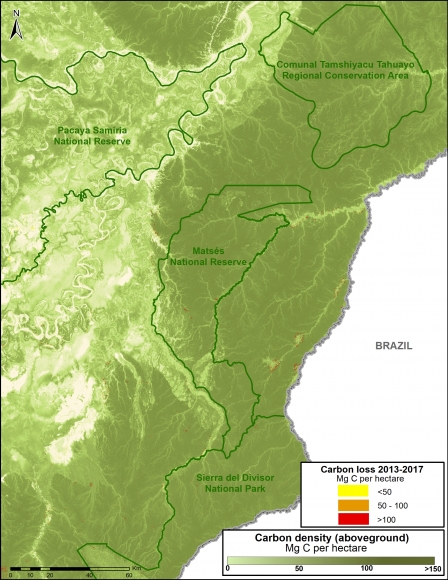
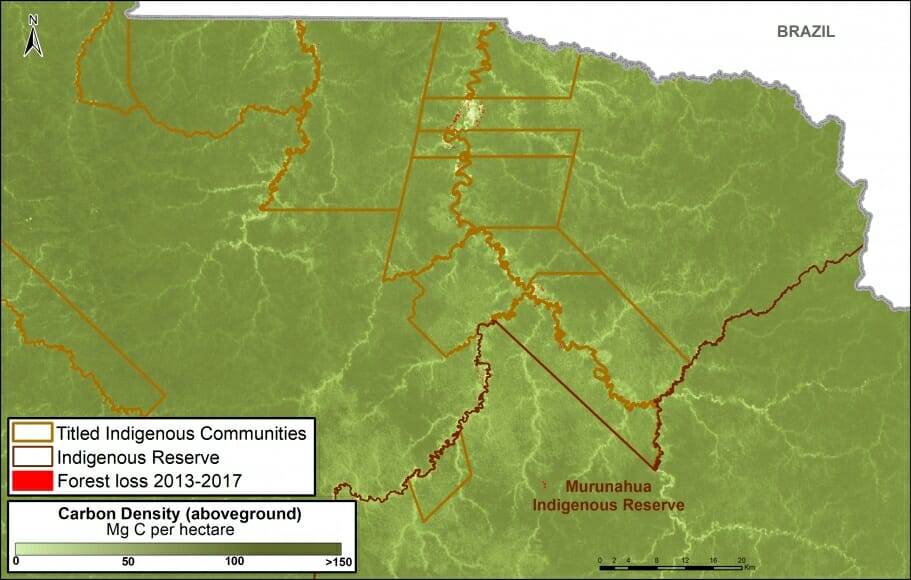
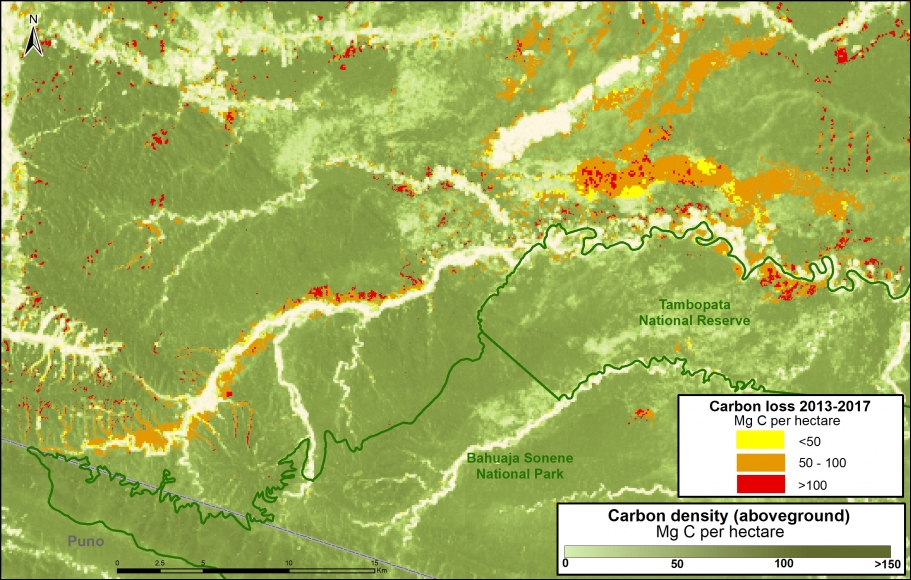
Below, we show several examples of how protected areas and indigenous lands are safeguarding carbon reservoirs in important areas, indicated by insets A-E.

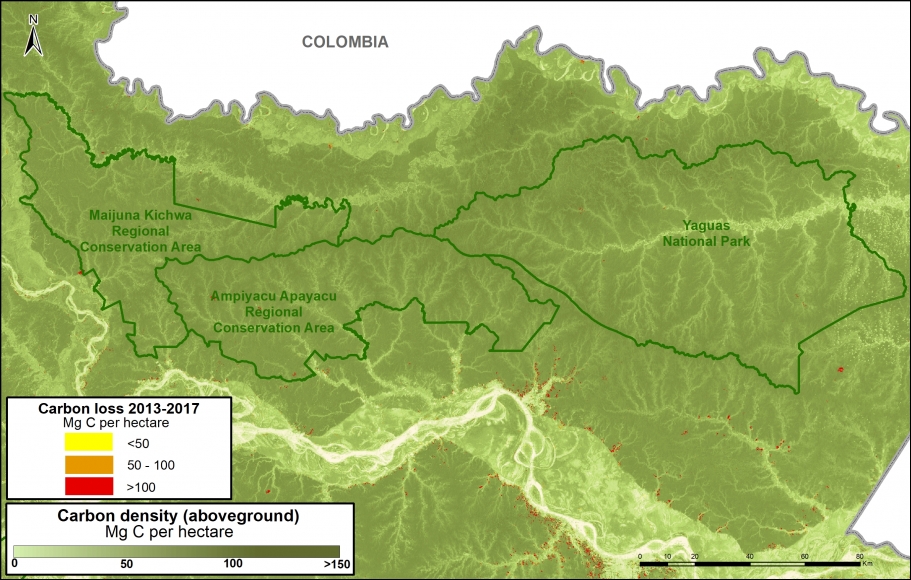
A. Yaguas National Park

The following Image A shows how three protected areas, including the new Yaguas National Park, are effectively safeguarding 202 million metric tons of carbon in the northeastern Peruvian Amazon. This area is home to some of the highest carbon densities in the country.

Image 83a. Yaguas. Data: Asner et al 2014, MINAM/PNCB, SERNANP

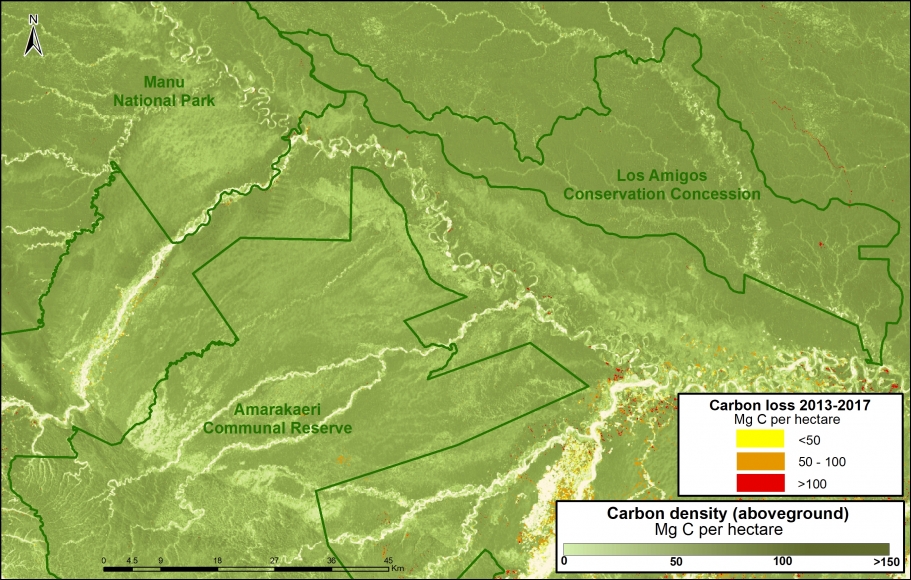
B. Manu National Park, Amarakaeri Communal Reserve, CC Los Amigos

The following Image B shows how Los Amigos, the world’s first conservation concession, is effectively safeguarding 15 million metric tons of carbon in the southern Peruvian Amazon. Two surrounding protected areas, Manu National Park and Amarakaeri Communal Reserve, safeguard an additional 194 million metric tons. This area is home to some of the highest carbon densities in the country.

Image 83b. Los Amigos-Manu-Amarakaeri. Data: Asner et al 2014, MINAM/PNCB, SERNANP, ACCA

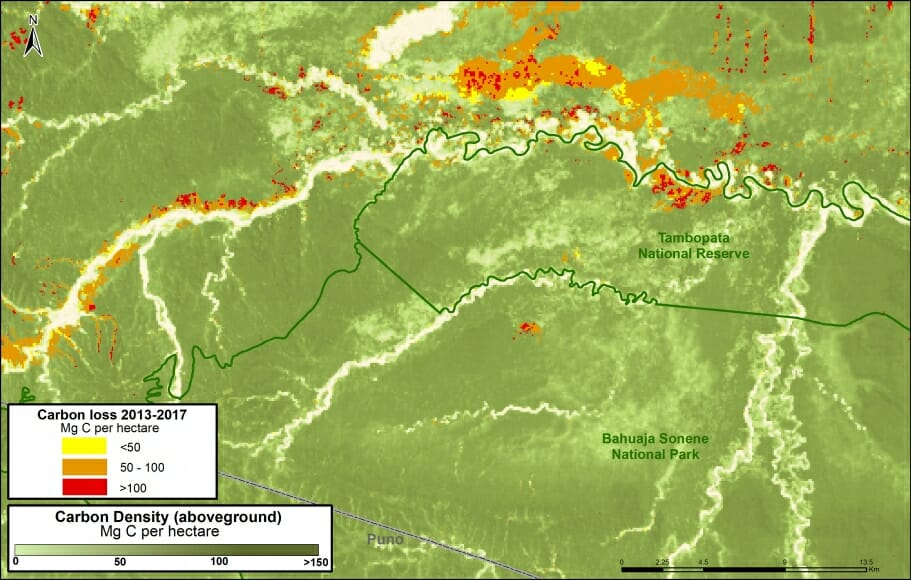
C. Tambopata National Reserve, Bahuaja Sonene National Park

The following Image C shows how two important natural protected areas, Tambopata National Reserve and Bahuaja Sonene National Park, are helping conserve carbon stocks in an area with intense illegal gold mining activity.

D. Sierra del Divisor National Park, National Reserve Matsés

Image 83d. Data: Asner et al 2014, MINAM/PNCB, SERNANP

The following Image D shows how four protected areas, including the new Sierra del Divisor National Park, and adjacent National Reserve Matsés are effectively safeguarding 270 million metric tons of carbon in the eastern Peruvian Amazon.

This area is home to some of the highest carbon densities in the country.

E. Murunahua Indigenous Reserve

The following Image E shows the carbon protected in the Murunahua Indigenous Reserve (for indigenous peoples in voluntary isolation) and the surrounding titled native communities.

Imagen 83e. Datos: Asner et al 2014, MINAM/PNCB, SERNANP

References

1  UNFCCC. Emissions Summary for Peru. http://di.unfccc.int/ghg_profile_non_annex1

2  No incluye las emisiones por la degradación de bosques

Asner GP et al (2014). The High-Resolution Carbon Geography of Perú. Carnegie Institution for Science. ftp://dge.stanford.edu/pub/asner/carbonreport/CarnegiePeruCarbonReport-English.pdf

Sistema de Áreas Naturales Protegidas del Perú, que incluye áreas de administración nacional, regional, y privado. Datos de las tierras indígenas son de Instituto de Bien Común. Datos de pérdida forestal son de la Programa Nacional de Conservación de Bosques para la Mitigación del Cambio Climático (MINAM/PNCB).

UNFCCC. Emissions Summary for United States. http://di.unfccc.int/ghg_profile_annex1

Citation

Finer M, Mamani N (2017). Climate Change Defense: Amazon Protected Areas and Indigenous Lands. MAAP: 83.

MAAP #82: Oil-related Deforestation in Yasuni National Park, Ecuadorian Amazon

MAAP #82: Oil-related Deforestation in Yasuni National Park, Ecuadorian Amazon
https://www.maapprogram.org/yasuni_eng/ 

Yasuni National Park, located in the heart of the Ecuadorian Amazon, is arguably the most biodiverse area in the world. It is also the ancestral territory of the Waorani, and their relatives in voluntary isolation.

However, underneath the park are large oil fields, setting up the constant conflict looming over Yasuni. In fact, in a recent referendum, Ecuadorian voters approved limiting the oil extraction area within Yasuni National Park to 300 hectares (740 acres).

Here, we analyze high-resolution satellite imagery to estimate both direct and indirect oil-related deforestation within Yasuní National Park.

For direct impact, we document the deforestation of 169 hectares (418 acres) within the park for oil-related infrastructure.
For indirect impact, we document the deforestation of 248 hectares (613 acres) due to colonization along an oil access road.
The total direct and indirect deforestation due to oil extraction is 417 hectares (1,030 acres).

Thus, one could argue that the oil-related deforestation has already exceeded the 300 hectares (740 acres) approved by the voters.

We illustrate these results in a Story Map.

MAAP #82: Oil-related Deforestation in Yasuni National Park, Ecuadorian Amazon
https://www.maapprogram.org/yasuni_eng/ 

MAAP #81: Carbon loss from deforestation in the Peruvian Amazon

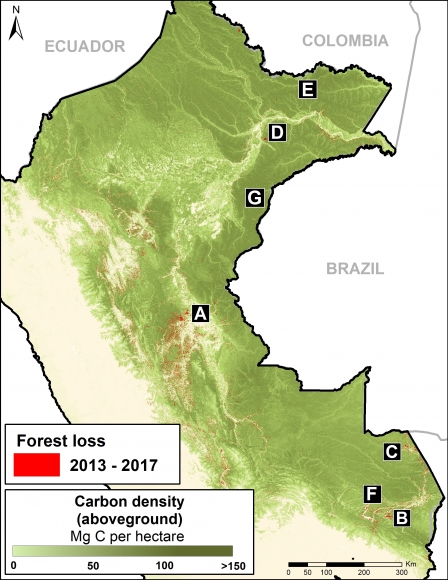
Base Map. Data: MINAM/PNCB, Asner et al 2014

When tropical forests are cleared, the enormous amount of carbon stored in the trees is released to the atmosphere, making it a major source of global greenhouse gas emissions (CO2) that drive climate change.

In fact, a recent study revealed that deforestation and degradation are turning tropical forests into a new net carbon source for the atmosphere, exacerbating climate change.1

The Amazon is the world’s largest tropical forest, and Peru is a key piece of that. Researchers (led by Greg Asner at the Carnegie Institution for Science) recently published the first high-resolution estimate of aboveground carbon in the Peruvian Amazon, documenting 6.83 billion metric tons.2

Here, we analyze this same dataset to estimate the total carbon emissions from deforestation in the Peruvian Amazon between 2013 and 2017. We estimate the loss of 59 million metric tons of carbon during these last five years, the equivalent of around 4% of annual United States fossil fuel emissions.3

We present a series of zoom images to show how carbon loss happened in several key areas impacted by the major deforestation drivers: gold mining, large-scale oil palm and cacao plantations, and smaller-scale agriculture. The labels A-G correspond to the zooms below.

We also show how protected areas are protecting hundreds of millions of metric tons of carbon in some of the most important areas in the country.

On the positive side, having this detailed information may provide added incentives to slow deforestation and degradation as part of critical climate change strategies.


Major Findings

Data: Asner et al 2014

The base map (see above) shows, in shades of green, carbon densities across Peru. It also shows, in red, the forest loss layer from 2013 to 2017.

We calculated the estimated amount of carbon emissions from forest loss during these five years: 59.029 teragrams, or 59 million metric tons.

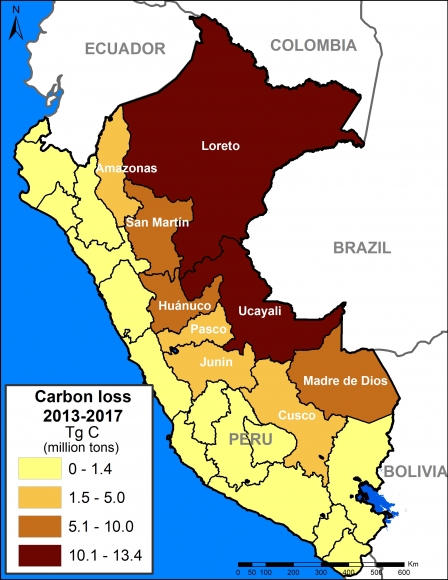
The regions with the most carbon loss are 1) Loreto (13.4 million metric tons), 2) Ucayali (13.2 million), 3) Huánuco (7.3 million), 4) Madre de Dios (7 million), and 5) San Martin (6.9 million).

These values include some natural forest loss. Overall, however, they should be considered underestimates because they do not include forest degradation (for example, selective logging).

A recent study revealed that degradation may account for 70% of emissions, thus total carbon emissions from forests in the Peruvian Amazon may be closer to 200 million metric tons.

Next, we show a series of zoom images to show how carbon loss happened in several key areas. We also show how protected areas and conservation concessions are protecting the most important carbon reserves.


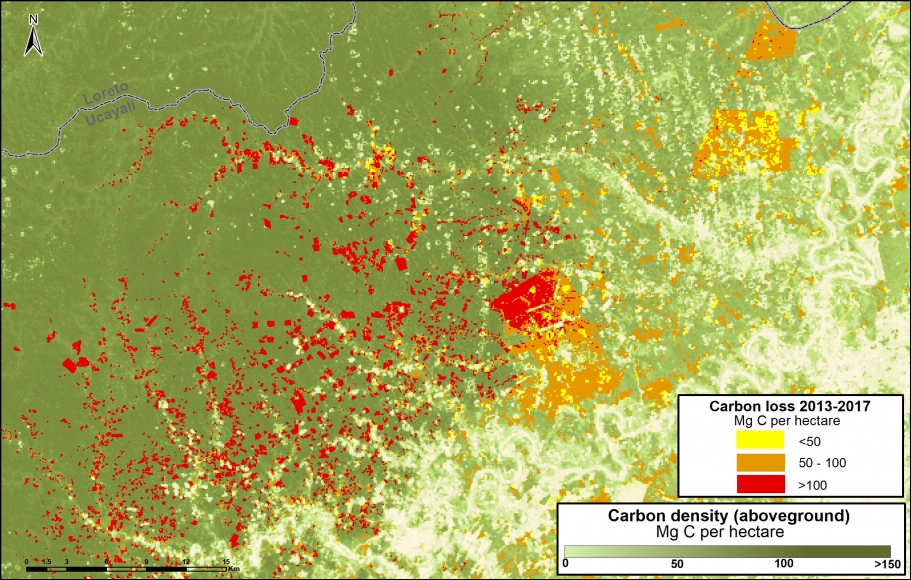
Zoom A: Central Peruvian Amazon

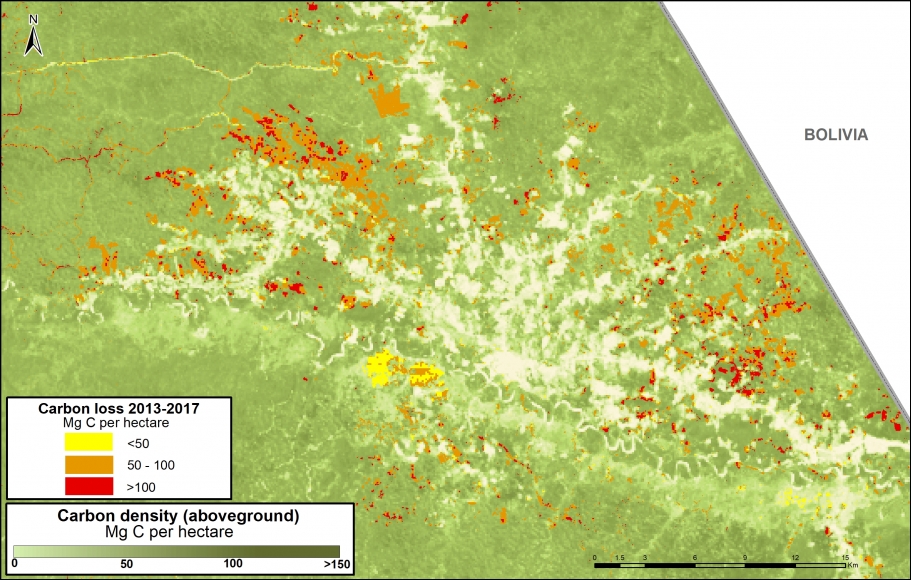
Image A shows the loss of 2.8 million metric tons of carbon in a section of the central Peruvian Amazon (Ucayali region). On the east side of image, note the loss due to two large-scale oil palm plantations (649,000 metric tons); on the west side, note small-scale agriculture penetrating deeper into high carbon density forest.

Image A. Central Peruvian Amazon. Data: Asner et al 2014, MINAM/PNCB

Zoom B: Southern Peruvian Amazon (gold mining) 

Image B shows the loss of 756 thousand metric tons of carbon due to gold mining in the southern Peruvian Amazon (Madre de Dios region). On the east side of image is the sector known as La Pampa; west side is Upper Malinowski.

Image B. Gold mining. Data: Asner et al 2014, MINAM/PNCB

Zoom C: Southern Peruvian Amazon (agriculture)

Image C shows the loss of 876 thousand metric tons of carbon in the southern Peruvian Amazon around the town of Iberia (Madre de Dios region). Note the expanding carbon loss along both sides of the Interoceanic Highway that crosses the image.

Image C. Iberia. Data: Asner et al 2014, MINAM/PNCB

Zoom D: United Cacao

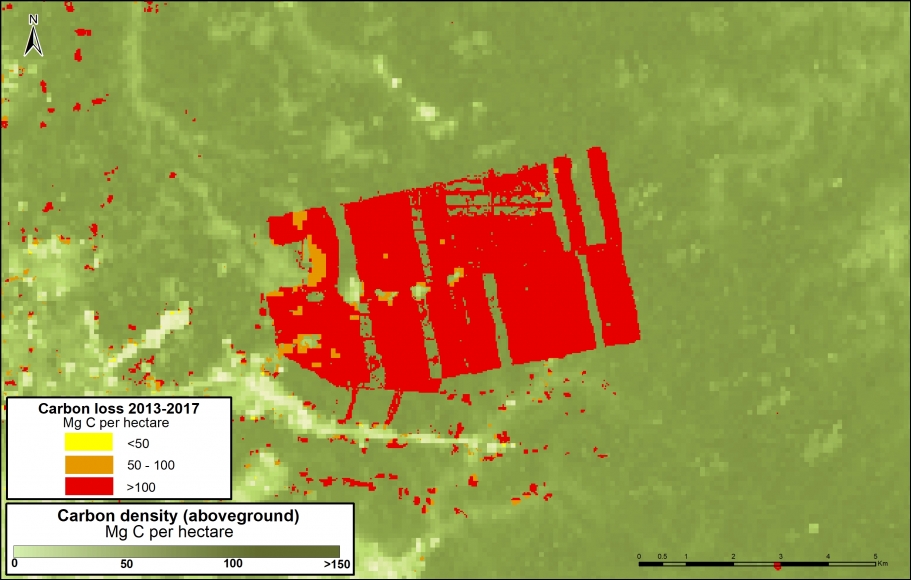
Image D shows the loss of 291 thousand metric tons of carbon for a large-scale cacao project (United Cacao) in the northern Peruvian Amazon (Loreto region). Note that nearly all the forest clearing occurred in high carbon density forest. This is another line of evidence that the company cleared primary forest, contrary to their claims that the area was already degraded.

Image D. United Cacao. Data: Asner et al 2014, MINAM/PNCB

Zoom E: Yaguas National Park

Image E shows how three protected areas, including the new Yaguas National Park, are effectively safeguarding 202 million metric tons of carbon in the northeastern Peruvian Amazon. This area is home to some of the highest carbon densities in the country.

Image E. Yaguas. Data: Asner et al 2014, MINAM/PNCB

Zoom F: Los Amigos Conservation Concession

Image F shows how Los Amigos, the world’s first conservation concession, is effectively safeguarding 15 million metric tons of carbon in the southern Peruvian Amazon. Two surrounding protected areas, Manu National Park and Amarakaeri Communal Reserve, safeguard an additional 194 million metric tons. This area is home to some of the highest carbon densities in the country.

Image F. Los Amigos. Data: Asner et al 2014, MINAM/PNCB

Zoom G: Sierra del Divisor National Park

Image G. Data: Asner et al 2014, MINAM/PNCB

Image G shows how three protected areas, including the new Sierra del Divisor National Park, are effectively safeguarding 270 million metric tons of carbon in the eastern Peruvian Amazon.

This area is home to some of the highest carbon densities in the country.


Methodology

Para el análisis se utilizó los datos de carbono sobre el suelo  generados por Asner et al 2014, y los datos de pérdida de bosques identificados por el Programa Nacional de Conservación de Bosques (PNBC-MINAM) de los años 2013 al 2016 así como las alertas tempranas del año 2017. Primero uniformizamos los datos de pérdida de bosque 2013-2016 con las alertas tempranas del año 2017 para evitar superposición y tener un solo dato 2013-2017. Posteriormente, extraemos los datos de carbono de las áreas de pérdida de bosque del 2013-2017, este proceso permitió obtener la densidad de carbono (por hectárea) en relación al área de la pérdida de bosque para finalmente estimar el total de stocks de carbono perdido entre el año 2013 al 2017.

References

Baccini A, Walker W, Carvalho L, Farina M, Sulla-Menashe D, Houghton RA (2017) Tropical forests are a net carbon source based on aboveground measurements of gain and loss. Science. 13;358(6360):230-4.

Asner GP et al (2014). The High-Resolution Carbon Geography of Perú. Carnegie Institution for Science.

Boden TA, Andres RJ, Marland G (2017) National CO2 Emissions from Fossil-Fuel Burning, Cement Manufacture, and Gas Flaring: 1751-2014. DOI 10.3334/CDIAC/00001_V2017

Citation

Finer M, Mamani N (2017). Carbon loss from deforestation in the Peruvian Amazon. MAAP: 81.


MAAP #77: Deforestation Hotspots in the Colombian Amazon, part 2

We present the second in a series of story maps investigating deforestation hotspots in the Colombian Amazon. Our goal is to identify the most critical hotspots (areas with the highest densities of deforestation) and use satellite imagery to identify the primary deforestation drivers.
The first report focused on a hotspot approaching Chiribiquete National Park in Caquetá department, and the  deforestation was largely driven by cattle pasture.

Here, we move to the south and focus on a hotspot surrounding La Paya National Park in Putumayo Department. We show high-resolution satellite imagery that reveals the major driver is again cattle pasture.

Please follow this link to view the Story Map: Deforestation Hotspots in the Colombian Amazon, part 2


This work reflects an important collaboration with our colleagues at Amazon Conservation Team, funded by the MacArthur Foundation.

MAAP Interactive: Deforestation Drivers in the Andean Amazon

Since its launch in April 2015, MAAP has published over 70 reports related to deforestation (and natural forest loss) in the Andean Amazon. We have thus far focused on Peru, with several reports in Colombia and Brazil as well.

These reports are meant to be case studies of the most important and urgent deforestation events. We often use forest loss alerts (known as GLAD) to guide us, and satellite imagery (from Planet and DigitalGlobe) to identify the deforestation driver.

Here we present an interactive map highlighting the drivers identified in all published MAAP reports. These drivers include gold mining, agriculture (e.g. oil palm and cacao), cattle pasture, roads, and dams (see icon legend below map). We also include natural causes such as floods and blowdowns (fire included under agriculture since most human caused). Furthermore, we highlight deforestation events within protected areas. Note that you can filter by driver by checking boxes of interest.

We hope the result is one of the most detailed and up-todate resources on patterns and drivers of deforestation in the Andean Amazon. Over the coming year we will continue to focus on Peru and Colombia, and begin to include Ecuador and Bolivia as well.

To view the interactive map, please visit:

MAAP Interactive: Deforestation Drivers in the Andean Amazon
https://www.maapprogram.org/interactive/

For more information on patterns and drivers of deforestation in the Peruvian Amazon, see our latest Synthesis report 

MAAP #61: Illegal Gold Mining Decreases in Tambopata National Reserve

In the previous MAAP #60, we showed the rapidly increasing illegal gold mining deforestation in the buffer zone of Tambopata National Reserve. In contrast, here we show that the rate of illegal gold mining deforestation is decreasing within Tambopata National Reserve, due to the active interventions by the Peruvian Government. Tambopata is an important protected area in the southern Peruvian Amazon due to its high biodiversity.

Image 61. Data: Planet, MAAP, SERNANP

Gold Mining Deforestation within Reserve

Image 61 shows the trajectory of illegal gold mining deforestation within Tambopata National Reserve, from the initial invasion in September 2015 to May 2017. Although the rate has decreased, total deforestation within the Reserve has increased to 1,360 acres (550 hectares*) since September 2015. The Peruvian national protected areas agency, SERNANP, is stating that 90% of the invaded area has been cleared of illegal miners.

* Our estimate of 550 hectares refers specifically to gold mining deforestation within Tambopata National Reserve since September 2015. SERNANP’s estimate of 750 hectares includes all mining activities (not just deforestation) since the creation of the Reserve.

Decreasing Deforestation Rate

Table 61 shows how the rate of gold mining deforestation within Tambopata National Reserve between January 2016 and April 2017. Peaks in deforestation occurred in March and August 2016, followed by a sharp decrease in September, when the Peruvian government carried out a series of raids within the Reserve.

Table 61. Data: MAAP

Two Areas to Watch

We detected, however, some recent mining activity in two areas within Tambopata National Reserve (Insets A and B in Image 61). Images 61A and 61B show these areas between November 2016 (left panel) and May 2017 (right panel). The red dots () indicate the same location across time between the panels.

Image 61a. Data: SERNANP, RapidEye/Planet, Sentinel/ESA
Image 61b Data: SERNANP, RapidEye/Planet, Sentinel/ESA

In response to these continued, isolated incursions by illegal miners in Tambopata National Reserve, SERNANP has been continuously carrying out patrols and raids, with the goal of completely eliminating illegal gold mining from the Reserve. In fact, prior to this publication, SERNANP, together with other authorities, carried out a raid in the area shown in Image 61b.

Citation

Finer M, Novoa S, Olexy T (2017) Illegal Gold Mining Decreases in Tambopata National Reserve. MAAP: 61.