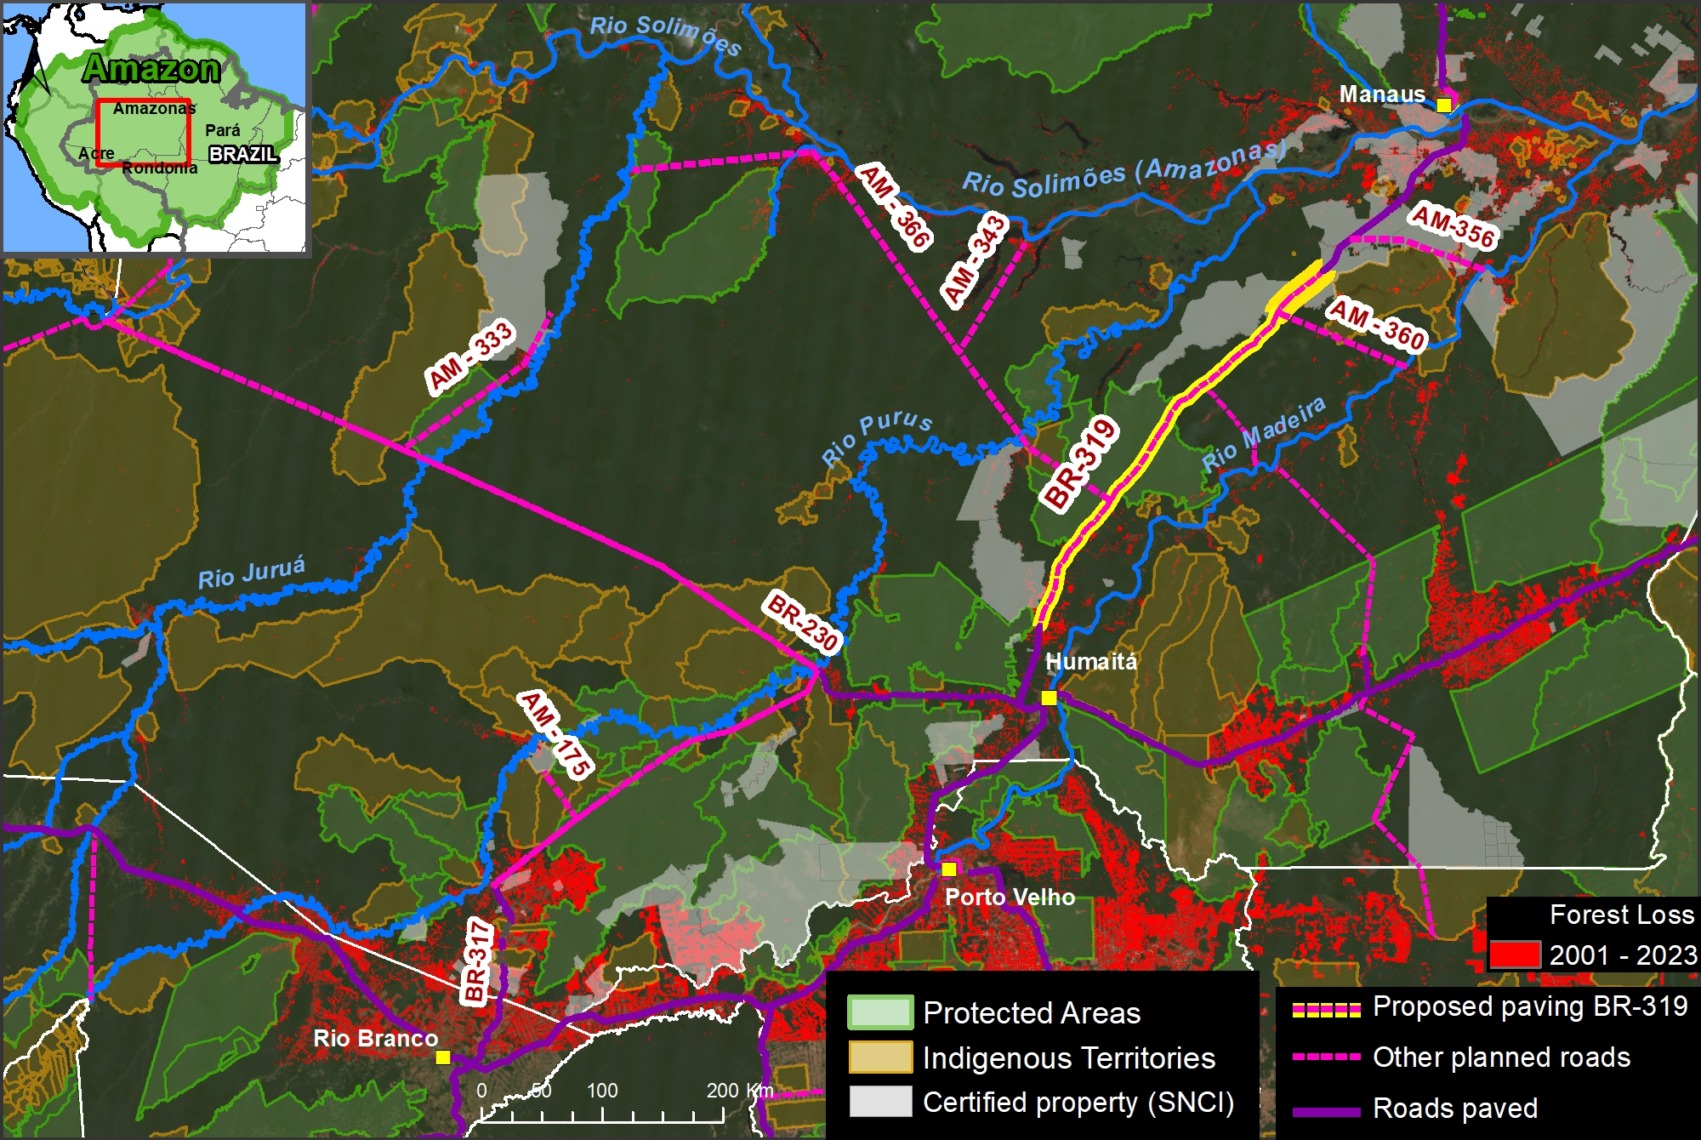
Month: September 2024
MAAP #217: Carbon across the Amazon (part 2): Peak Carbon Areas
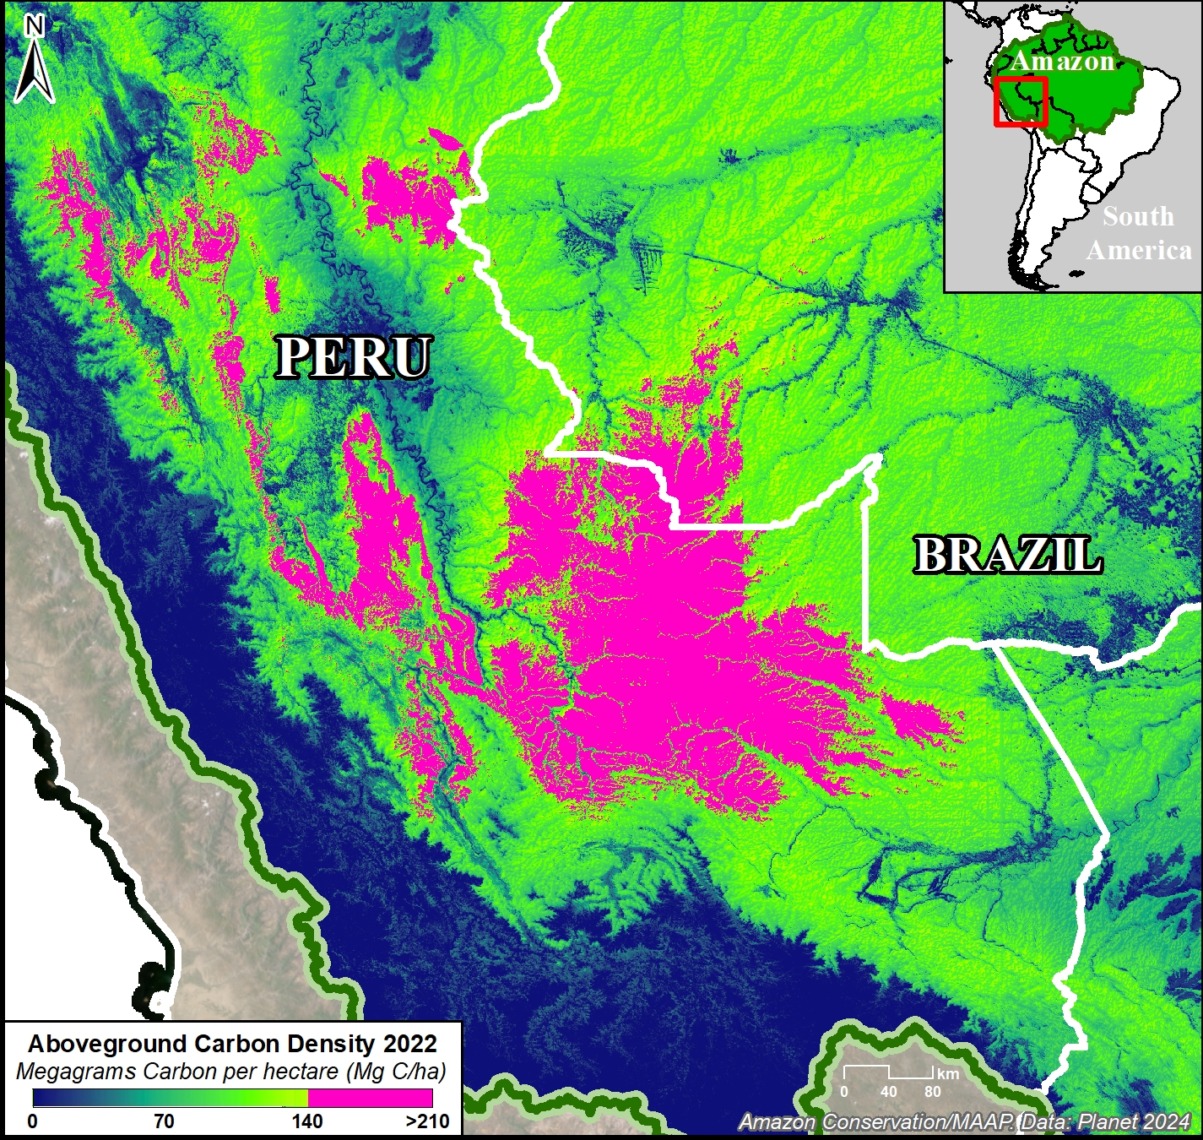
Figure 1. Example of peak carbon areas in southern Peru and adjacent western Brazil. Data: Planet.
In part 1 of this series (MAAP #215), we introduced a critical new resource (Planet Forest Carbon Diligence) that provides wall-to-wall estimates for aboveground carbon density at an unprecedented 30-meter resolution. This data uniquely merges machine learning, satellite imagery, airborne lasers, and a global biomass dataset from GEDI, a NASA mission.4
In that report, we showed that the Amazon contains 56.8 billion metric tons of aboveground carbon (as of 2022), and described key patterns across all nine countries of the Amazon biome over the past decade.
Here, in part 2, we focus on the peak carbon areas of the Amazon that are home to the highest aboveground carbon levels.
These peak carbon areas correspond to the upper one-third of aboveground carbon density levels (>140 metric tons per hectare).1
They likely have experienced minimal degradation (such as selective logging, fire, and edge/fragmentation effects)2 and are thus a good proxy for high-integrity forests.
Figure 1 shows an important example of peak carbon areas in southern Peru and adjacent western Brazil.
The peak carbon areas are often found in the remote primary forests of protected areas and Indigenous territories, but some are located in forestry concessions (specifically, logging concessions) or undesignated lands (also referred to as undesignated public forests).
Our goal in this report is to leverage unprecedented aboveground carbon data to reinforce the importance of these designated areas and draw attention to the remaining undesignated lands.
For example, peak carbon areas would be excellent candidates for the High Integrity Forest (HIFOR) initiative, a new financing instrument that uniquely focuses on maintaining intact tropical forests.3 HIFOR rewards the climate services that intact tropical forests provide, including ongoing net carbon removal from the atmosphere, and complements existing instruments to reduce emissions from deforestation and degradation (REDD+) by focusing on tropical forests that are largely undegraded.
Below, we detail the major findings and then zoom in on the peak carbon areas in the northeast and southwest Amazon.
Peak Carbon Areas in the Amazon
The Base Map below illustrates our major findings.
The peak carbon areas (>140 metric tons per hectare; indicated in pink) are concentrated in the southwest and northeast Amazon, covering 27.8 million hectares (11 million ha in the southwest and 16.8 million ha in the northeast).
k
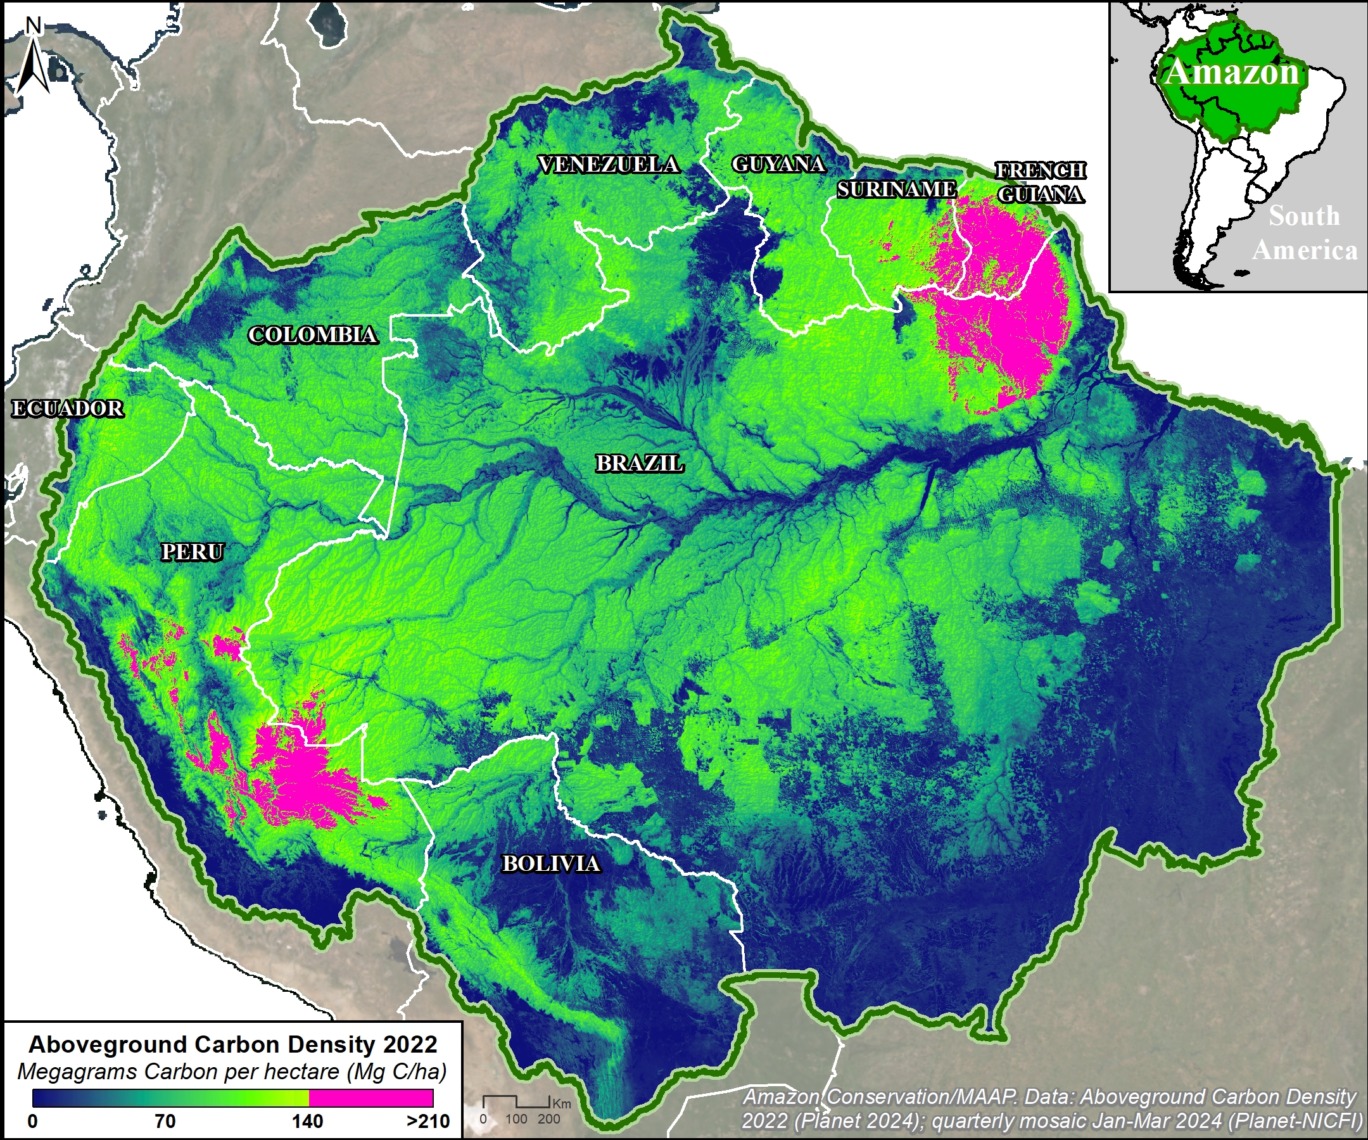
Base Map. Planet Forest Carbon Diligence across the Amazon biome for the year 2022. Data: Planet.
In the southwest Amazon, peak carbon levels are found in southern & central Peru, and adjacent western Brazil.
In the northeast Amazon, peak carbon levels are found in northeast Brazil, much of French Guiana, and parts of Suriname.
By country, Brazil and Peru have the largest area of peak carbon (10.9 million and 10.1 million hectares respectively), followed by French Guiana (4.7 million ha), and Suriname (2.1 million ha).
Protected areas and Indigenous territories cover much (61%) of the peak carbon area (16.9 million hectares).
The remaining 39% remains unprotected, and arguably threatened, in undesignated lands (9.4 million hectares) and forestry concessions (1.5 million ha), respectively.
In addition, high carbon areas (>70 metric tons per hectare; indicated by the greenish-yellow coloration in the Base Map) are found in all nine countries of the Amazon biome, notably Colombia, Ecuador, Bolivia, Venezuela, and Guyana.
Southwest Amazon
Southern Peru
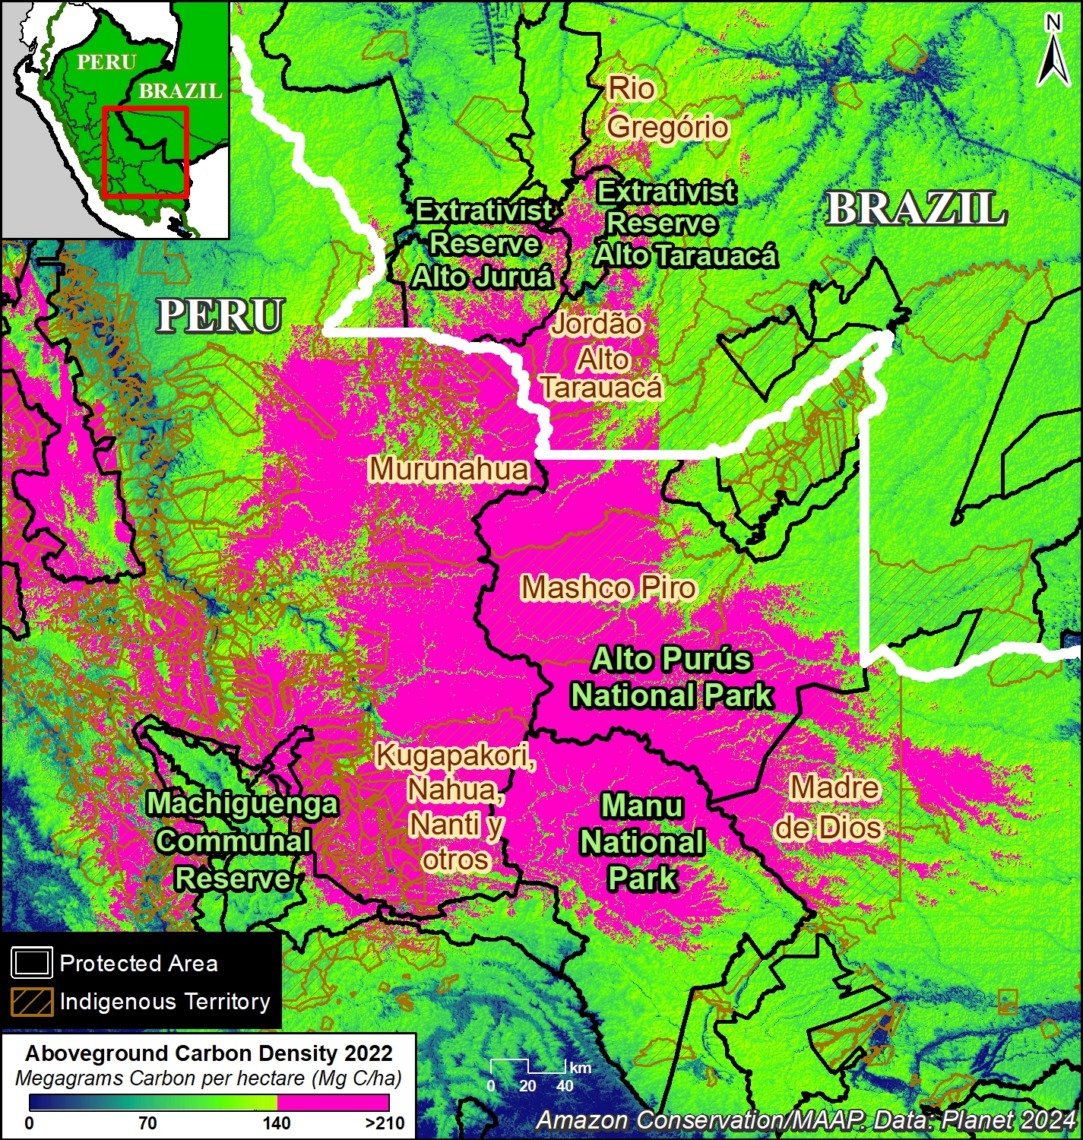
Figure 2a. Peak carbon area in the southern Peruvian Amazon. Data: Planet, SERNANP, RAISG.
Figure 2a zooms in on the peak carbon area covering 7.9 million hectares in southern Peru (regions of Madre de Dios, Cusco, and Ucayali) and adjacent southwest Brazil (Acre).
Several protected areas (such as Manu and Alto Purús National Parks, and Machiguenga Communal Reserve) anchor this area.
It is also home to numerous Indigenous territories (such as Mashco Piro, Madre de Dios, and Kugapakori, Nahua, Nanti & Others Indigenous Reserves).
Figure 2b highlights the major land designations within the peak carbon area of southern Peru.
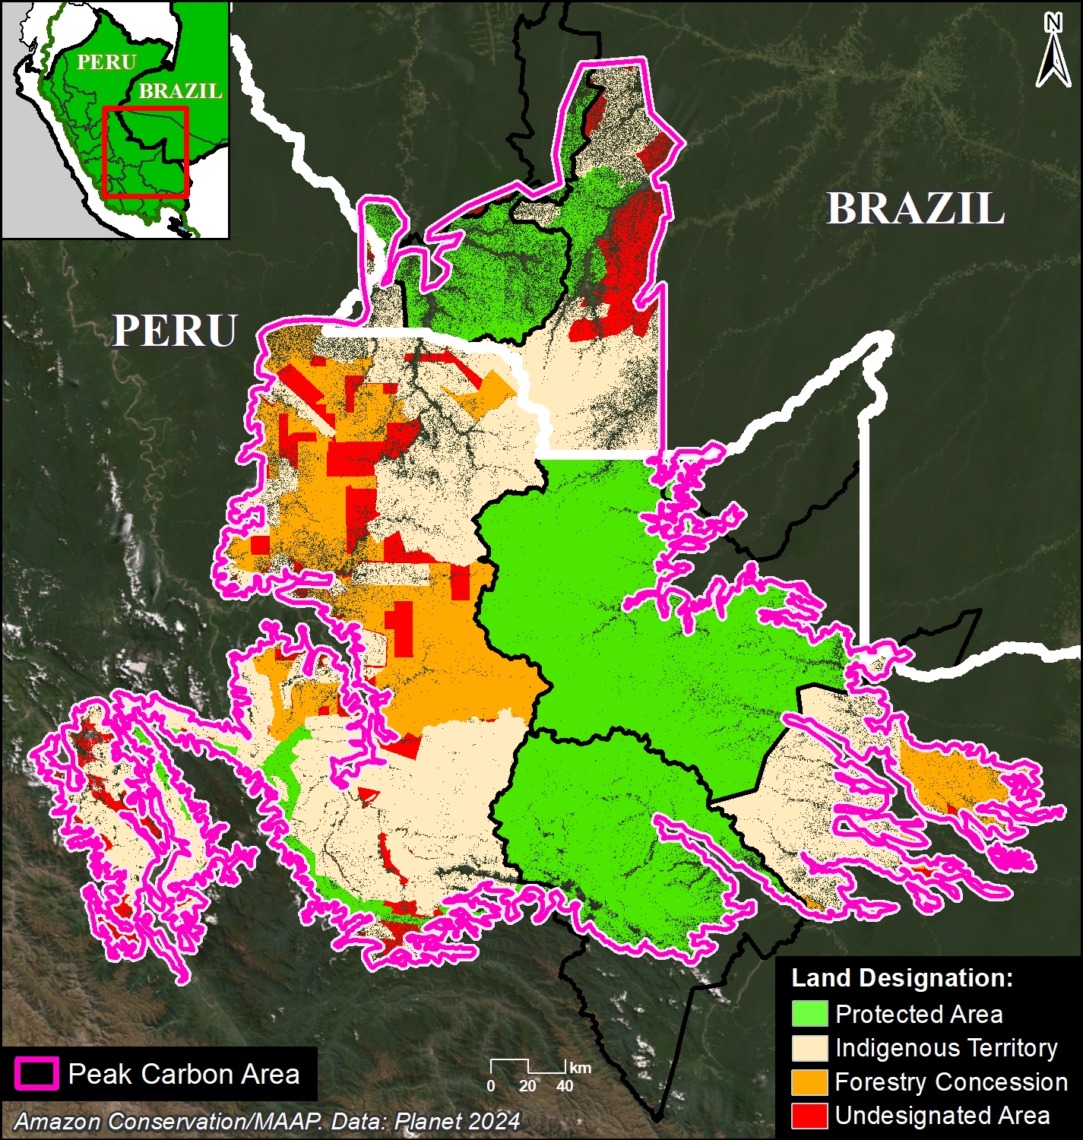
Figure 2b. Peak carbon areas in southern Peru.
Protected areas and Indigenous territories cover 77% of this area (green and brown, respectively).
The remaining 23% could be considered threatened, as they are located in forestry concessions or undesignated lands (orange and red, respectively). Thus, these areas are ideal candidates for increased protection to maintain their peak carbon levels.
Figure 2b. Peak carbon areas (outlined in pink), categorized by land designation in southern Peru and adjacent western Brazil. Data: Planet, NICFI, SERNANP, SERFOR, RAISG.
Central Peru
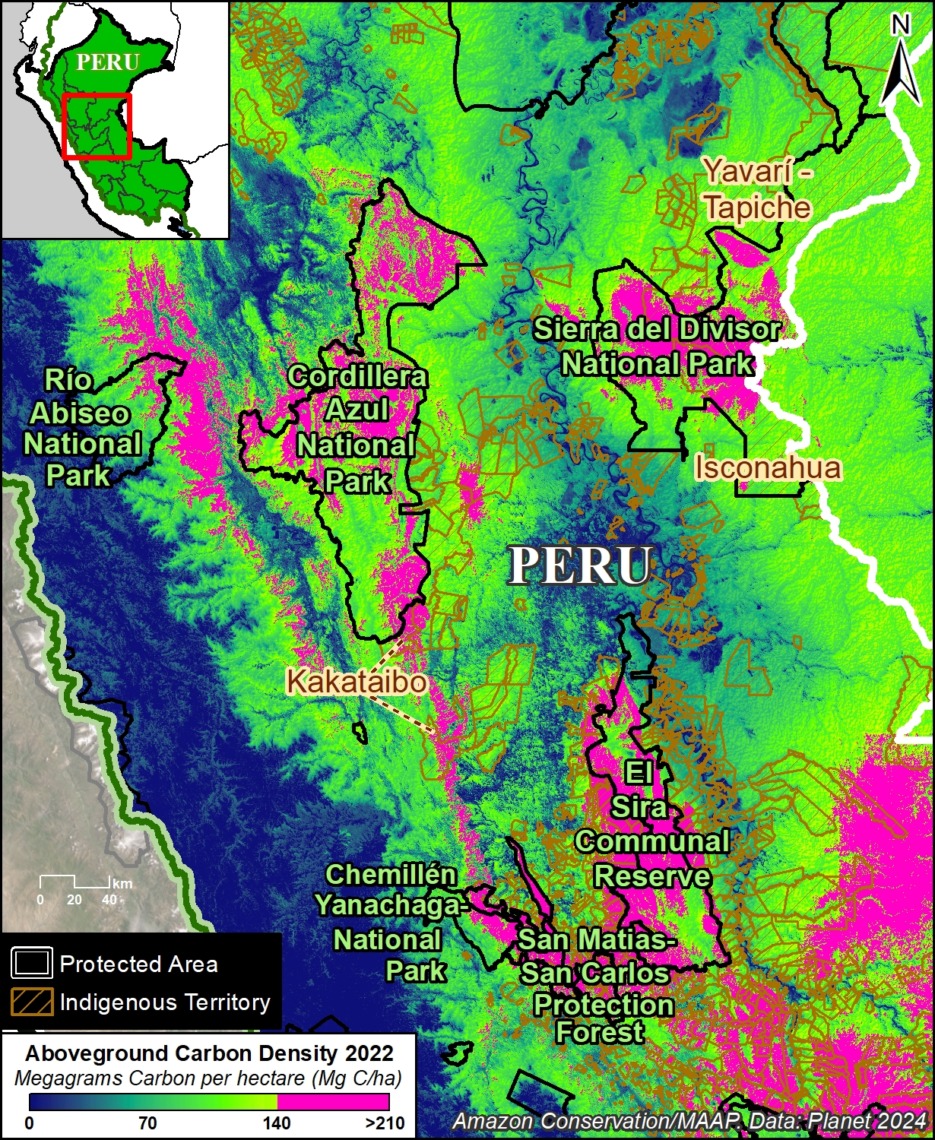
Figure 3a. Peak carbon area in the central Peruvian Amazon. Data: Planet, SERNANP, RAISG.
Figure 3a zooms in on the peak carbon area in the central Peruvian Amazon, which covers 3.1 million hectares in the regions of Ucayali, Loreto, Huánuco, Pasco, and San Martin.
Several protected areas (including Sierra del Divisor, Cordillera Azul, Rio Abiseo, and Yanachaga–Chemillén National Parks, and El Sira Communal Reserve) anchor this area.
It is also home to numerous Indigenous territories (such as Kakataibo, Isconahua, and Yavarí Tapiche Indigenous Reserves).
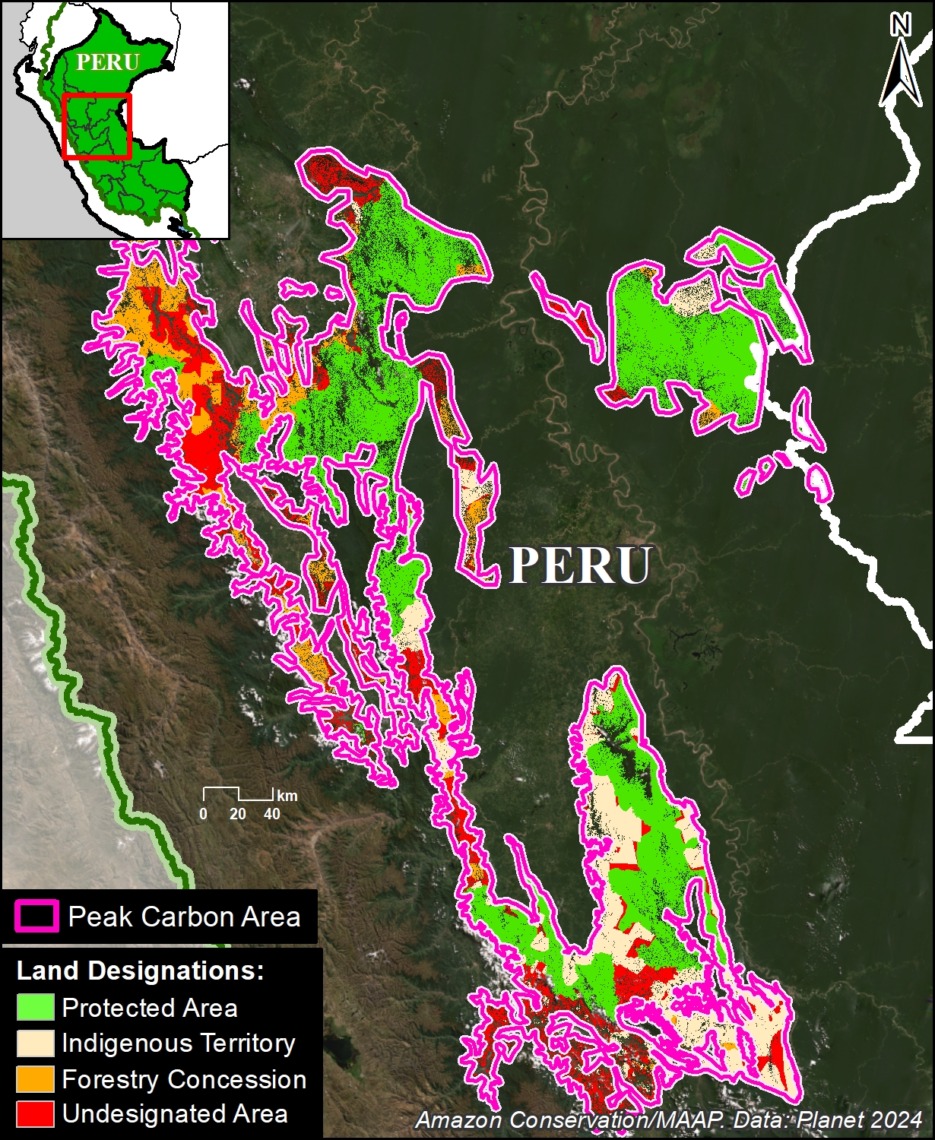
Figure 3b. Peak carbon areas categorized by land designation in central Peru.
Figure 3b highlights the major land designations within the peak carbon area of central Peru.
Protected areas and Indigenous territories cover 69% of this area (green and brown, respectively).
The remaining 31% could be considered threatened, as they are located in forestry concessions or undesignated lands (orange and red, respectively), and are ideal candidates for increased protection.
Figure 3b. Peak carbon areas (outlined in pink), categorized by land designation in central Peru. Data: Planet, NICFI, SERNANP, SERFOR, RAISG.
Northeast Amazon
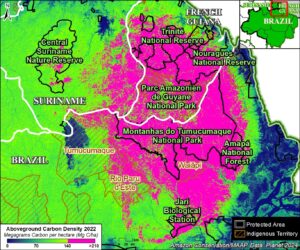
Figure 4a. Peak carbon area in the tri-border region of the northeast Amazon. Data: Planet, RAISG.
Figure 4a zooms in on the peak carbon area in the tri-border region of the northeast Amazon, which covers 16.8 million hectares in northern Brazil, French Guiana, and Suriname.
Several protected areas (including Montanhas do Tumucumaque National Park in northeast Brazil, Amazonien de Guyane National Park in French Guiana, and Central Suriname Nature Reserve) anchor this area.
It is also home to numerous Indigenous territories (such as Tumucumaque, Rio Paru de Este, and Wayãpi in northeast Brazil).
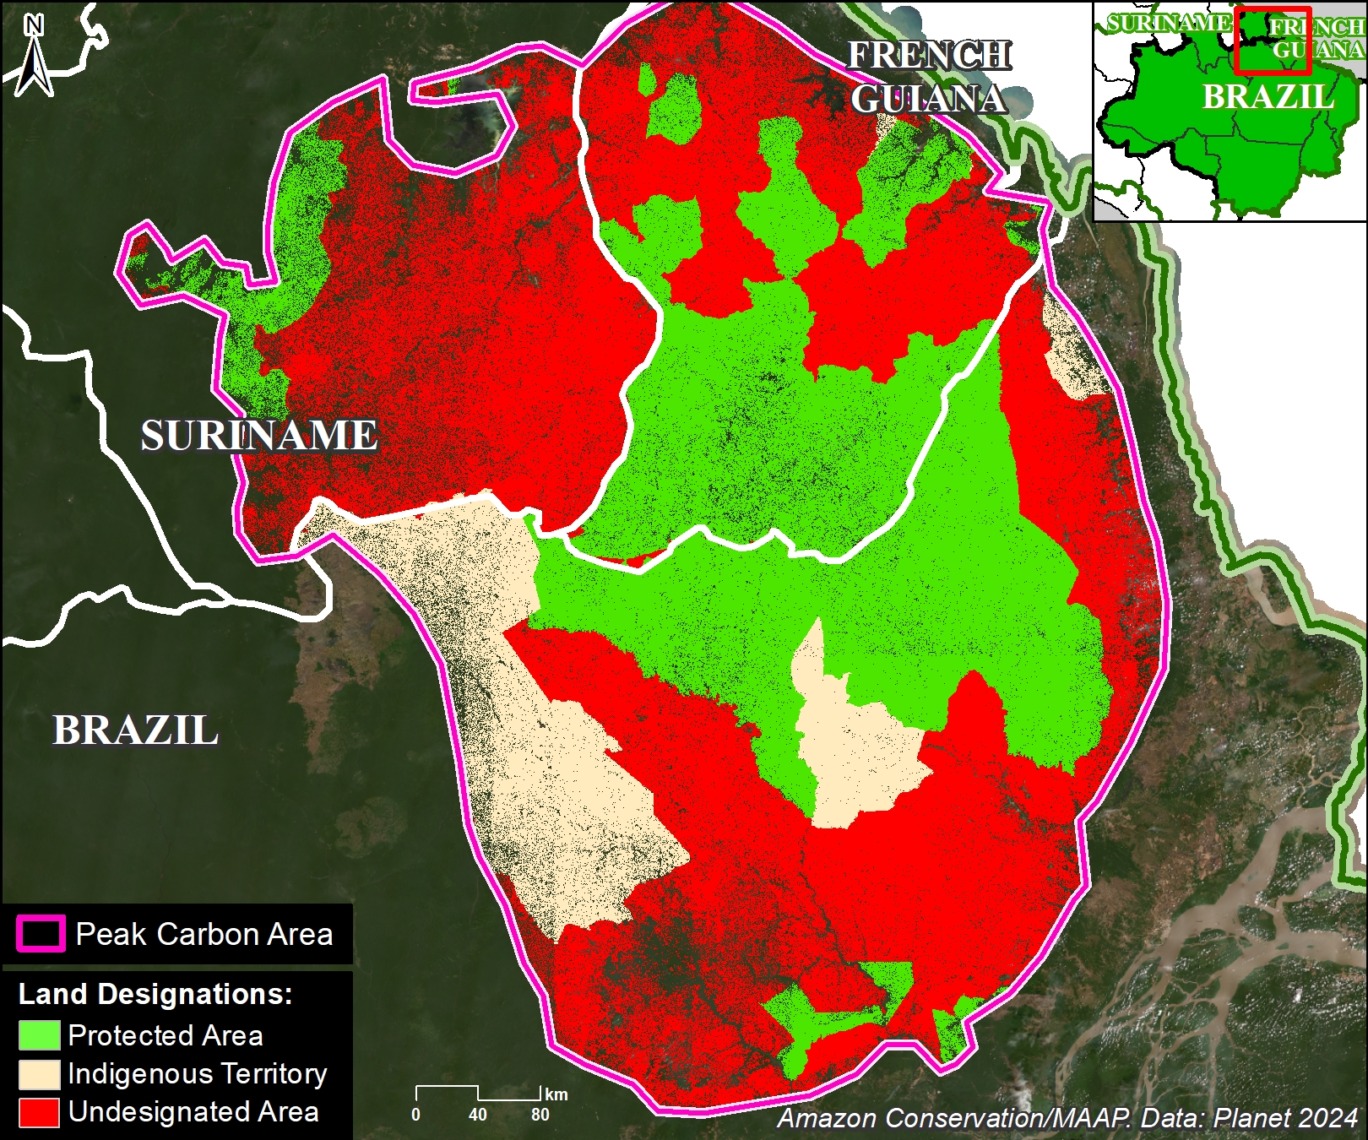
Figure 4b. Peak carbon areas (outlined in pink), categorized by land designation in northeast Amazon. Data: Planet, NICFI, RAISG.
Figure 4b highlights the major land designations within the peak carbon area of the northeast Amazon.
Protected areas and Indigenous territories cover just over half (51%) of this area (green and brown, respectively).
The remaining 49% could be considered threatened, as they are located in undesignated lands, and are ideal candidates for increased protection.
Notes
1 We selected this value (upper 33%) to capture the highest aboveground carbon areas and include a range of high carbon areas. Additional analyses could target different values, such as the highest 10% or 20% of aboveground carbon.
2 A recent paper documented a strong relationship between selective logging and aboveground carbon loss (Csillik et al. 2024, PNAS). The link between forest edges and carbon is presented in Silva Junior et al, Science Advances.
3 High Integrity Forest (HIFOR) units are a new tradable asset that recognizes and rewards the essential climate services and biodiversity conservation that intact tropical forests provide, including ongoing net removal of CO2 from the atmosphere. For more information see https://www.wcs.org/our-work/climate-change/forests-and-climate-change/hifor
4 For more information, see the “What is Forest Carbon Diligence?” section in this recent blog from Planet.
Citation
Finer M, Mamani N, Anderson C, Rosenthal A (2024) Carbon across the Amazon (part 2): Peak Carbon Areas. MAAP #217.
Acknowledgments
This report was made possible by the generous support of the Norwegian Agency for Development Cooperation (NORAD)
![]()
MAAP #220: Carbon across the Amazon (part 3): Key Cases of Carbon Loss & Gain _alt
In part 1 of this series (MAAP #215), we introduced a critical new dataset (Planet’s Forest Carbon Diligence product) that provides wall-to-wall estimates for aboveground carbon at an unprecedented 30-meter resolution. This data uniquely merges machine learning, satellite imagery, airborne lasers, and a global biomass dataset from GEDI, a NASA mission.
In part 2 (MAAP #217), we highlighted which parts of the Amazon are currently home to the highest (peak) carbon levels.
Here in part 3, we focus on aboveground carbon loss and gain, presenting a novel Base Map that shows wall-to-wall estimates across the Amazon between 2013 and 2022.
Overall, we find that the Amazon still narrowly functions as an overall carbon sink, gaining 64.7 million metric tons of aboveground carbon between 2013 and 2022.1
The countries with the most carbon gain are 1) Brazil, 2) Colombia, 3) Suriname, 4) Guyana, and 5) French Guiana. In contrast, the countries with the most carbon loss are 1) Bolivia, 2) Venezuela, 3) Peru, and 4) Ecuador.
Zooming in to the site level yields additional important findings.
For example, areas with the highest carbon loss highlight emblematic deforestation cases across the Amazon during the past ten years (Figure 1).
On the flip side, areas with the highest carbon gain indicate excellent candidates for the High Integrity Forest (HIFOR) initiative, a new financing instrument that uniquely focuses on maintaining intact tropical forests.2 Importantly, a HIFOR unit represents a hectare of high integrity tropical forest that has been ‘well-conserved’ over a decade.3
Below, we further illustrate these findings with a series of zooms of emblematic cases of high carbon loss and gain across the Amazon over the past 10 years.
Figure 1. Example of major deforestation event resulting in high carbon emissions…
Base Map – Amazon Carbon Loss & Gain (2013-2022)
Base Map. Major areas of carbon loss and gain across the Amazon between 2013 and 2022.
The Base Map shows wall-to-wall estimates of aboveground carbon loss and gain across the Amazon between 2013 and 2022.
Carbon loss is indicated by yellow to red, indicating low to high carbon loss.
Note the extensive carbon loss across the arc of deforestation in Brazil, the soy plantation region in southern Bolivia, the gold mining region in southern Peru, and the other arc of deforestation in Colombia (see Insets A-E).
We also note that the areas of high carbon loss in the remote border area between Brazil, Colombia, and Venezuela appear to be from natural causes, according to an additional review of satellite imagery.
Carbon gain is indicated by light to dark green, indicating low to high carbon gains.
Note that much of the Amazon functions as a carbon sink, with especially high carbon gain along the Ecuador-northern Peru border, eastern Colombia, western Brazil, and the northeast corner (Brazil, Guyana, Suriname, and French Guiana) (See Insets F-J).
Below, we present a series of zooms of the specific cases of high carbon loss and gain indicated in Insets A-J.
Emblematic Cases of Carbon Loss
Below we show a series…
A. Colombia National Parks (combine Tinigua, Macarena, north Chiribiquete)
B. Menonites Peru (just Vanderland area, not Chipiar)
C. Mining southern Peru
D – F. Best examples across Brazil
G. Suriname mining
Key Examples of Carbon Gain
Annex
In part 2 of this series (MAAP #217), we highlighted which parts of the Amazon are currently home to the highest (peak) aboveground carbon levels. Annex 1 shows these peak carbon areas in relation to the carbon loss and gain data presented above. Note that both peak carbon areas (southeast and northeast Amazon) are largely characterized by carbon gain.
Notes
1 In part 1 of this series (MAAP #215), we found the Amazon “is still functioning as a critical carbon sink”. As pointed out in a companion blog by Planet, however, the net carbon sink +64 million metric tons is quite small relative to the total estimate of 56.8 billion metric tons of aboveground carbon across the Amazon. That is a net positive change of just +0.1%. As the blog notes, that’s a “very small buffer” and there’s “reason to worry that the biome could flip from sink to source with ongoing deforestation.”
2 High Integrity Forest (HIFOR) units are a new tradable asset that recognizes and rewards the essential climate services and biodiversity conservation that intact tropical forests provide, including ongoing net removal of CO2 from the atmosphere. HIFOR rewards the climate services that intact tropical forests provide, including ongoing net carbon removal from the atmosphere, and complements existing instruments to reduce emissions from deforestation and degradation (REDD+) by focusing on tropical forests that are largely undegraded. For more information see https://www.wcs.org/our-work/climate-change/forests-and-climate-change/hifor
3 High Integrity Forest Investment Initiative, Methodology for HIFOR units, April 2024. Downloaded from https://www.wcs.org/our-work/climate-change/forests-and-climate-change/hifor
Citation
Finer M, Mamani N, Anderson C, Rosenthal A (2024) Carbon across the Amazon (part 3): Key Cases of Carbon Loss & Gain. MAAP: 220.
MAAP #219: Illegal mining expansion in the Ecuadorian Amazon (Punino area)
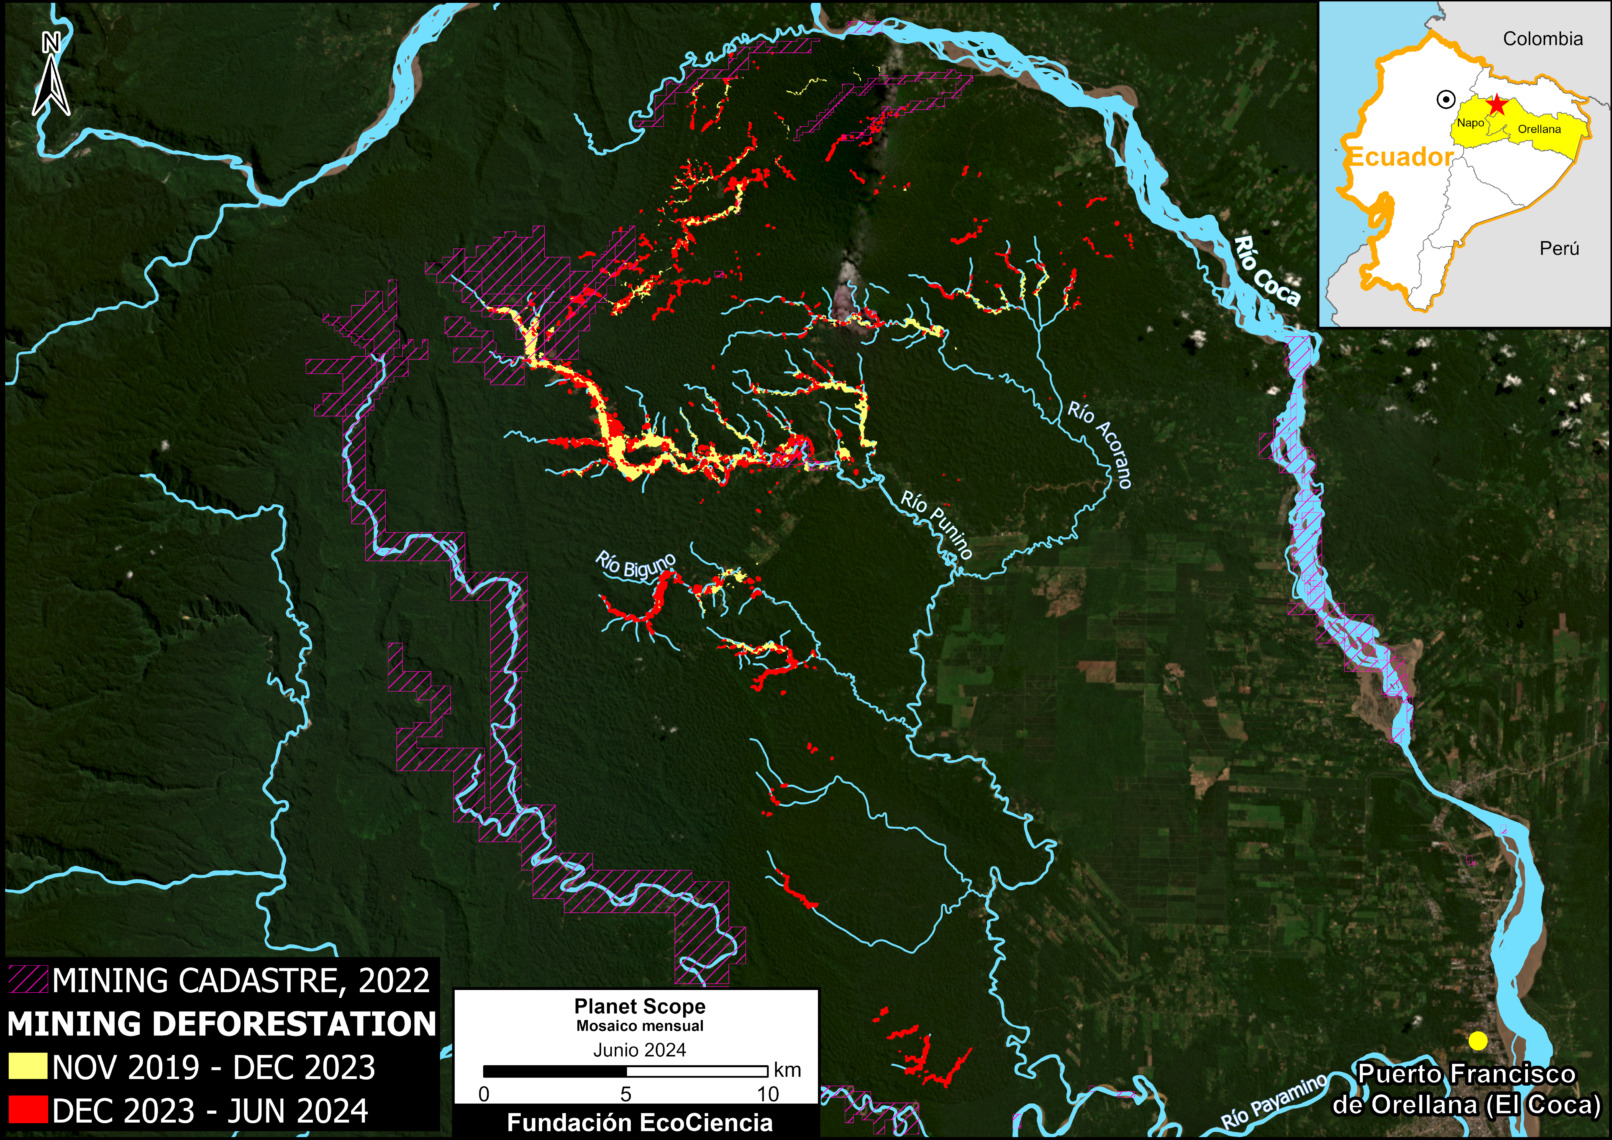
Base Map. Mining deforestation in the heart of the Ecuadorian Amazon (Punino area). Data: ARCERNNR 2022, Planet-NICFI, EcoCiencia.
In a series of previous reports, we warned about the emergence and expansion of illegal mining deforestation in the heart of the Ecuadorian Amazon, in the area surrounding the Punino River, located between the provinces of Napo and Orellana (MAAP #182, MAAP #151).
In the most recent report, we informed that this mining impact had reached 1,000 hectares (MAAP #206).
Here, we provide an update on the growing mining activity in and around the Punino River basin during the first half of 2024.
The Base Map shows an increase of 420 hectares in 2024 (indicated in red), bringing the total impact to 1,422 hectares (3,500 acres) since its inception in 2019 (yellow and red combined). This total is equivalent to more than 2,000 professional soccer fields.
The Base Map also shows that the vast majority (90%) of the mining deforestation is located outside the limits of the areas authorized for such activity (according to the mining registry updated to 2022). In other words, the vast majority of mining is likely illegal.
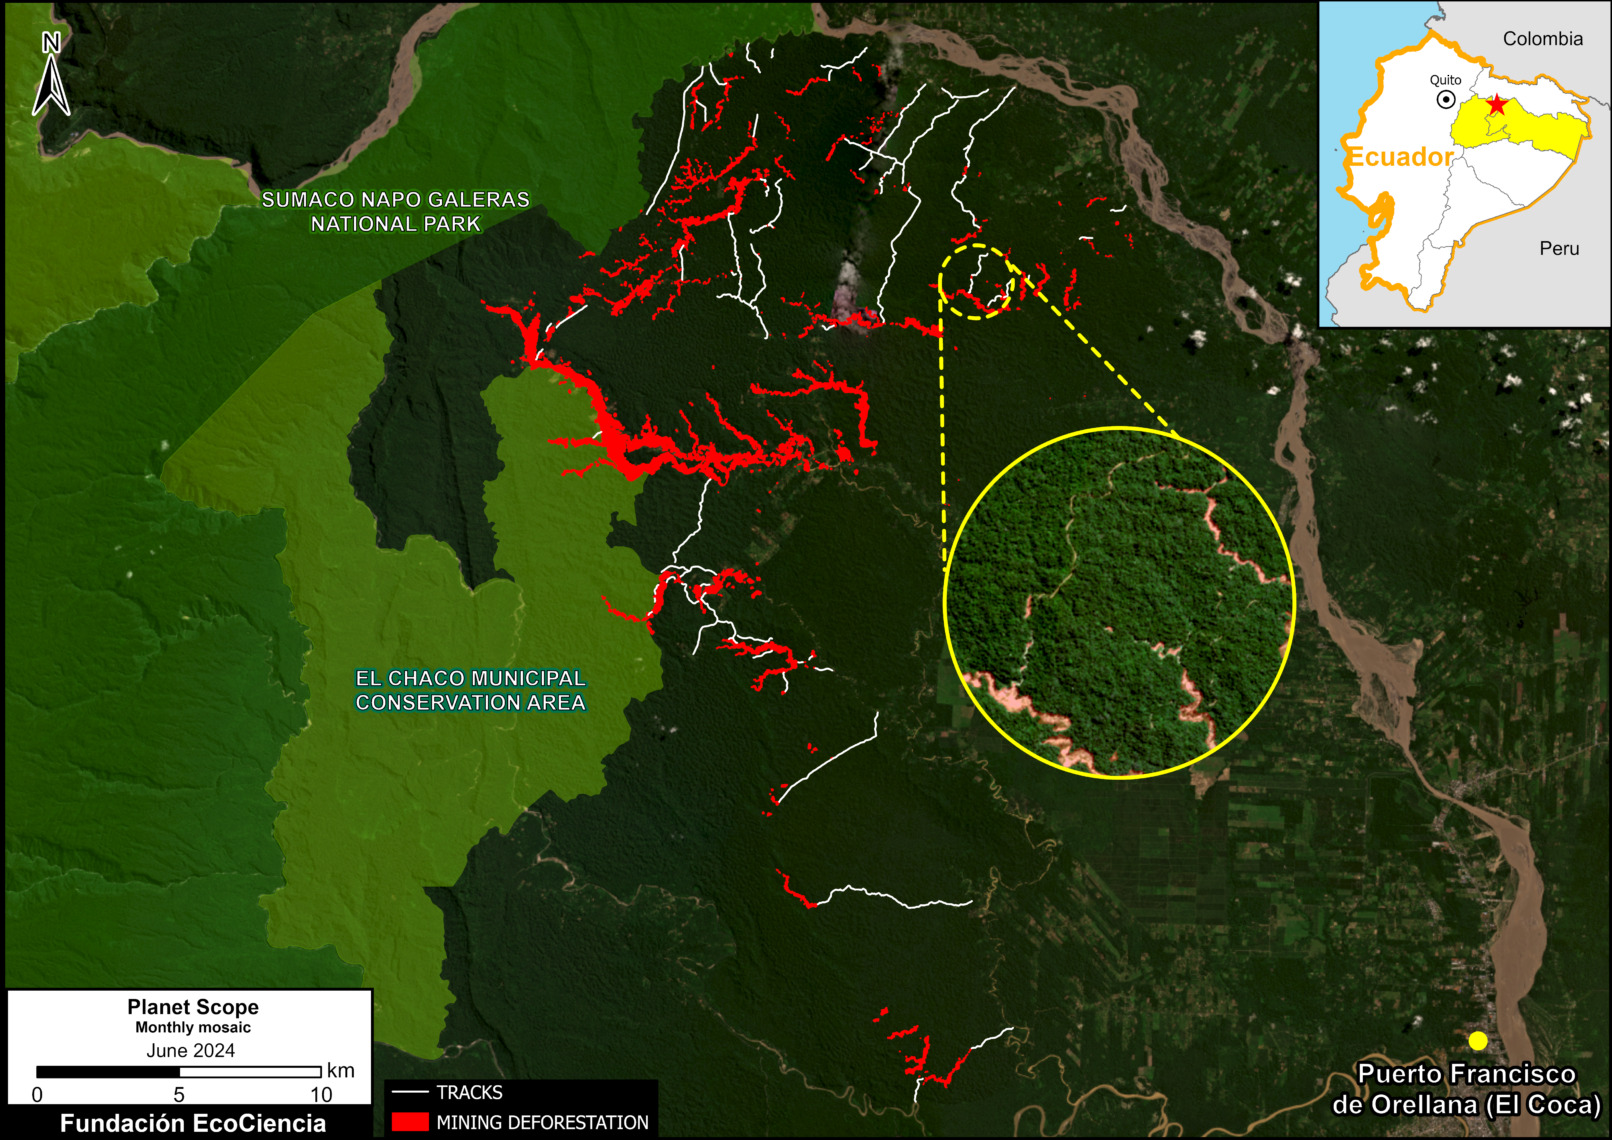
We emphasize that the mining deforestation has rapidly expanded to enter the limits of two protected areas: Sumaco-Napo Galeras National Park and El Chaco Municipal Conservation Area (see Figure 1, below).
In addition, the mining deforestation is actively expanding within the boundaries of Indigenous territories of the Kichwa nationality (see Figure 2, below).
Below we illustrate in more detail the rapid increase in mining deforestation, especially in these protected areas and Indigenous territories.
Mining expansion in the Punino area, 2019-2024
Chart 1 illustrates the steadily increasing mining deforestation in the Punino area over the past 5 years. The impact began in 2019, reaching 1,000 hectares by the end of 2023, and more recently reaching 1,422 hectares in June 2024.
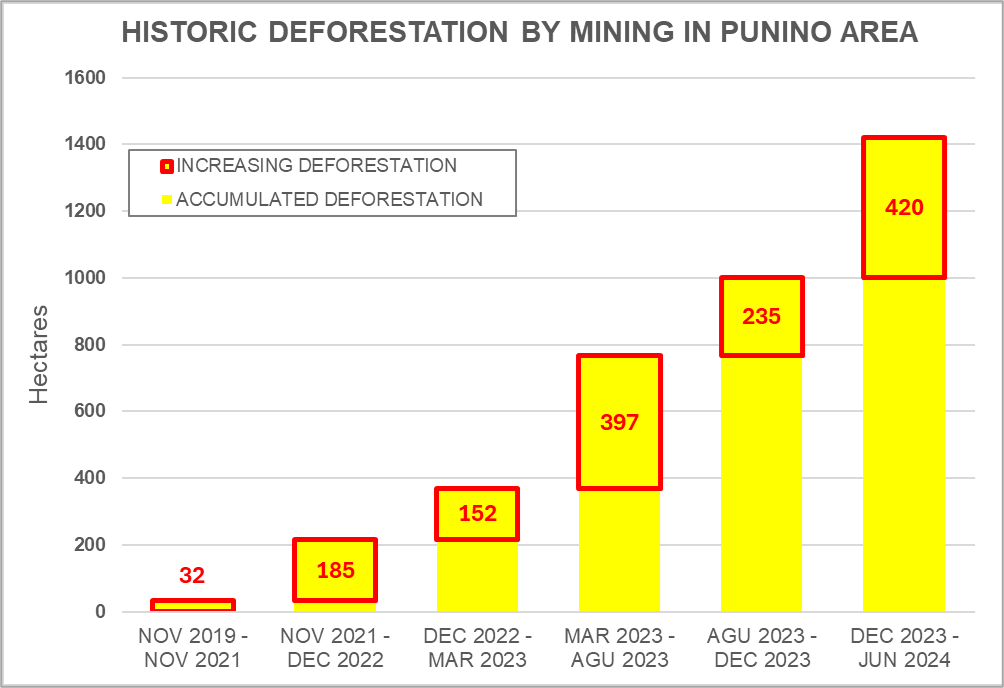
Chart 1. Historical deforestation due to mining in the Punino area between November 2019 and June 2024
Expansion of illegal mining in protected areas
Figure 1 shows the expansion of mining deforestation in and around the two protected areas of the Punino zone. Note that mining has recently penetrated the boundaries of both Sumaco-Napo Galeras National Park (0.32 hectares) and El Chaco Municipal Conservation Area (144 hectares).
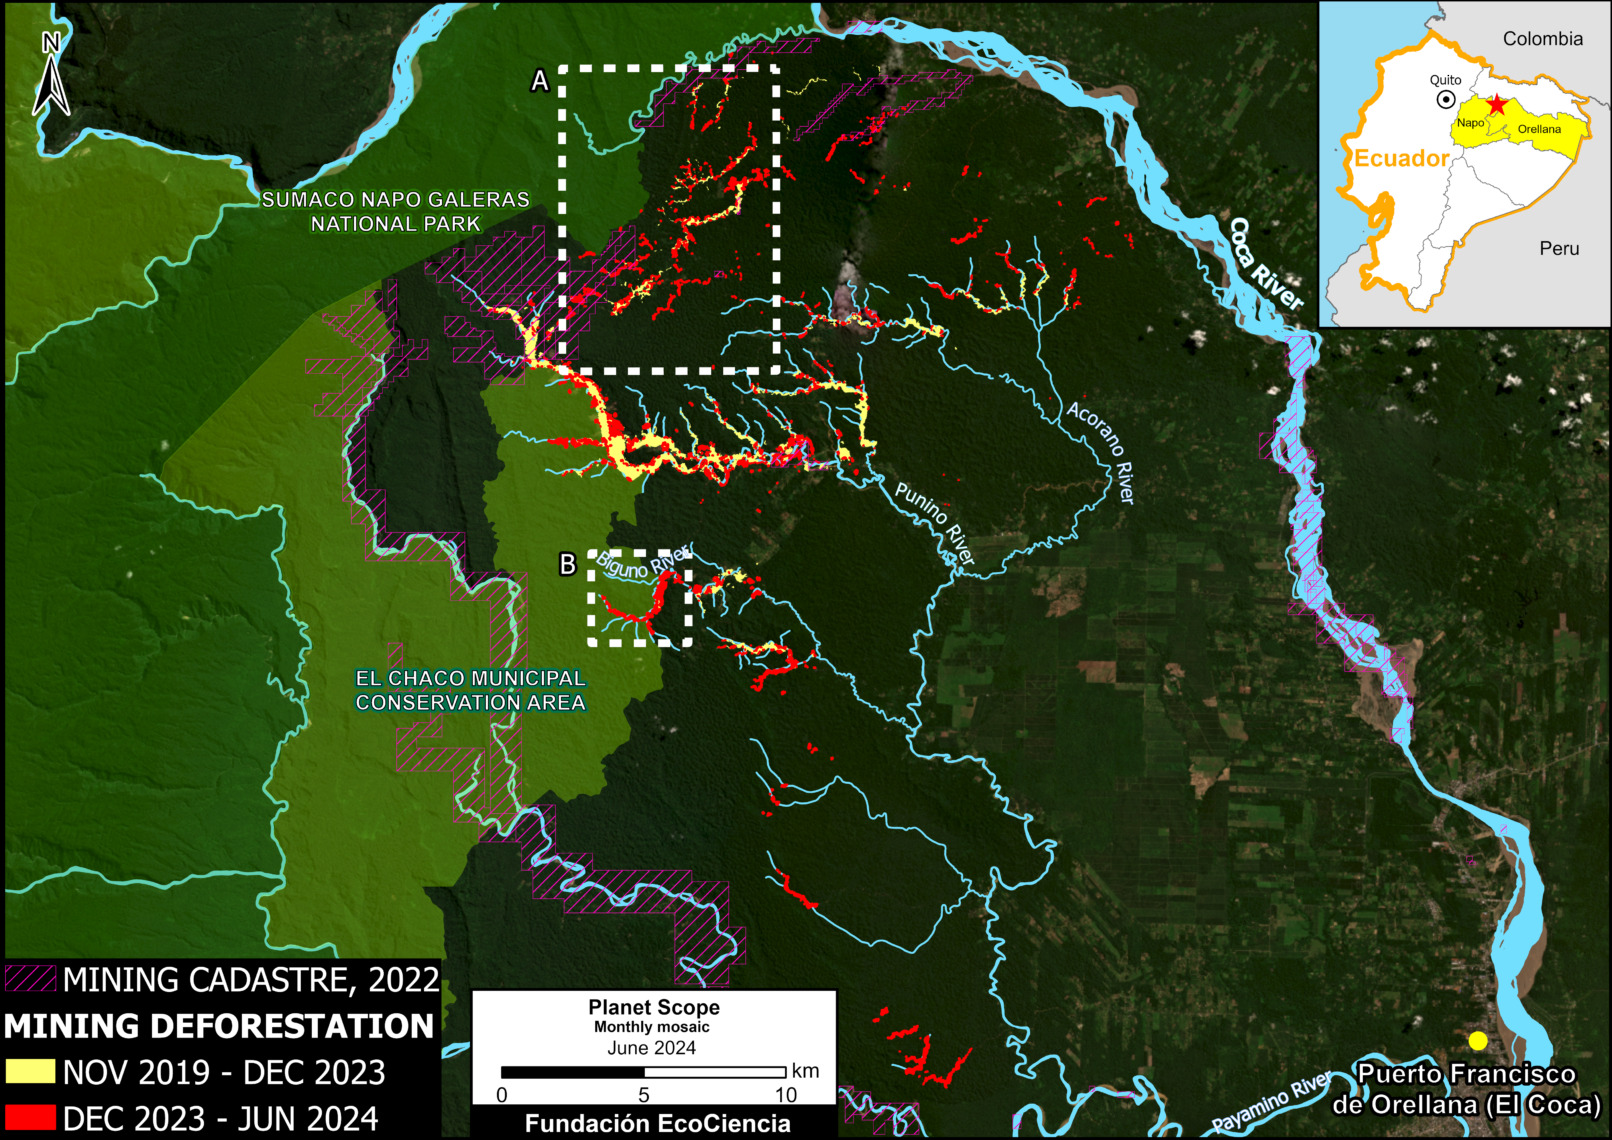
Figure 1. Protected areas affected by mining activity between 2019 and 2024 in the Punino area. Data: ARCERNNR 2022, MAATE 2024, NCI 2018, Planet-NICFI, EcoCiencia.
Figure 2 shows the initial encroachment (0.32 hectares) of mining deforestation in the boundaries of Sumaco Napo-Galeras National Park between September 2022 (left panel) and June 2024 (right panel).
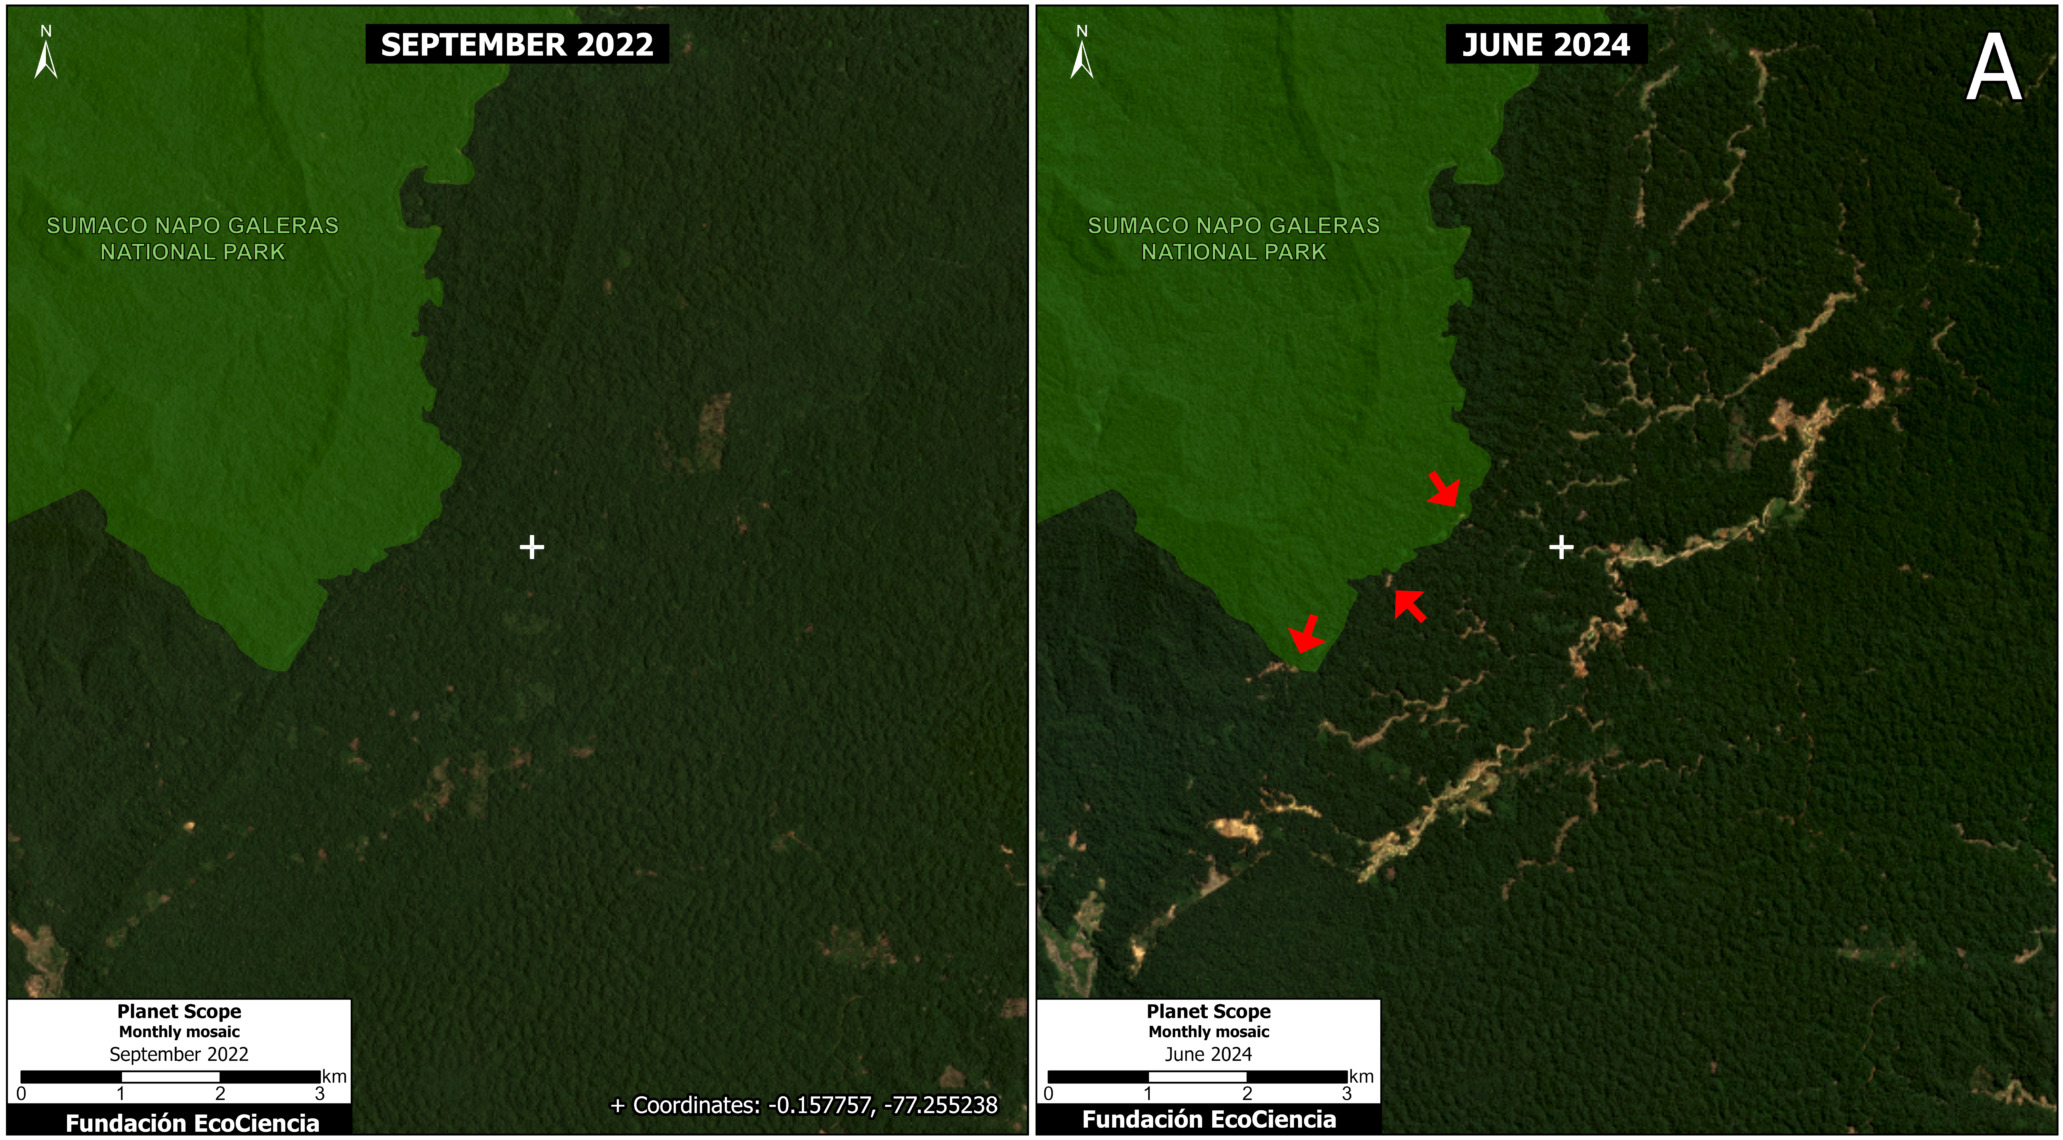
Figure 2. Mining deforestation within the boundaries of Sumaco Napo-Galeras National Park, comparing September 2022 (left panel) with June 2024 (right panel). Data: MAATE 2024, Planet/NICFI, EcoCiencia.
Figure 3 shows the invasion and expansion of deforestation due to mining (144 hectares) within the boundaries of El Chaco Municipal Conservation Area between September 2023 (left panel) and June 2024 (right panel).
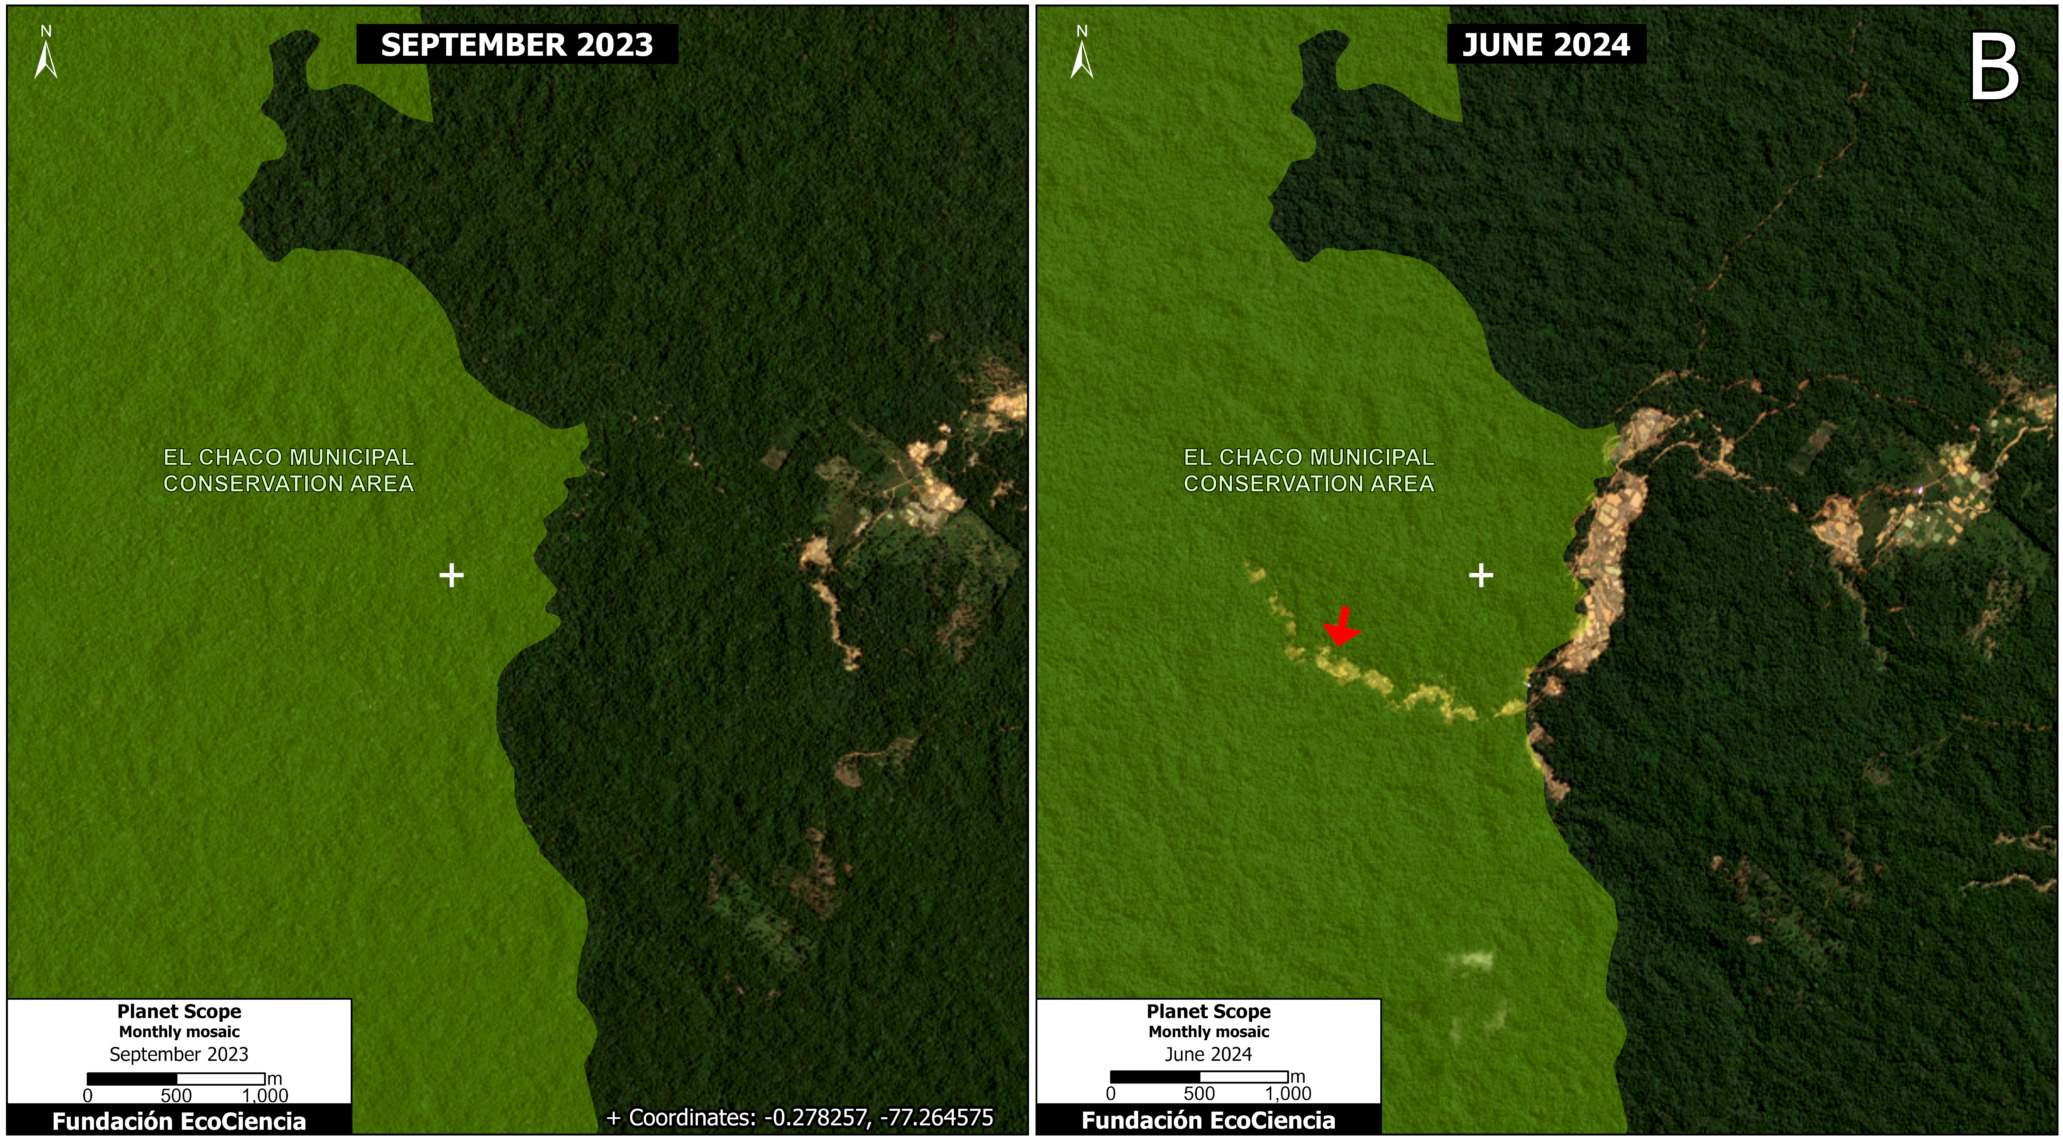
Figure 3. Mining deforestation within the boundaries of the El Chaco Municipal Conservation Area, comparing September 2023 (left panel) with June 2024 (right panel). Data: NCI 2018, Planet/NICFI, Ecociencia.
Expansion of illegal mining in indigenous territories
Figure 4 shows the expansion of mining deforestation (300 hectares) in relation to the Indigenous territories of the Kichwa nationality in the Punino area.
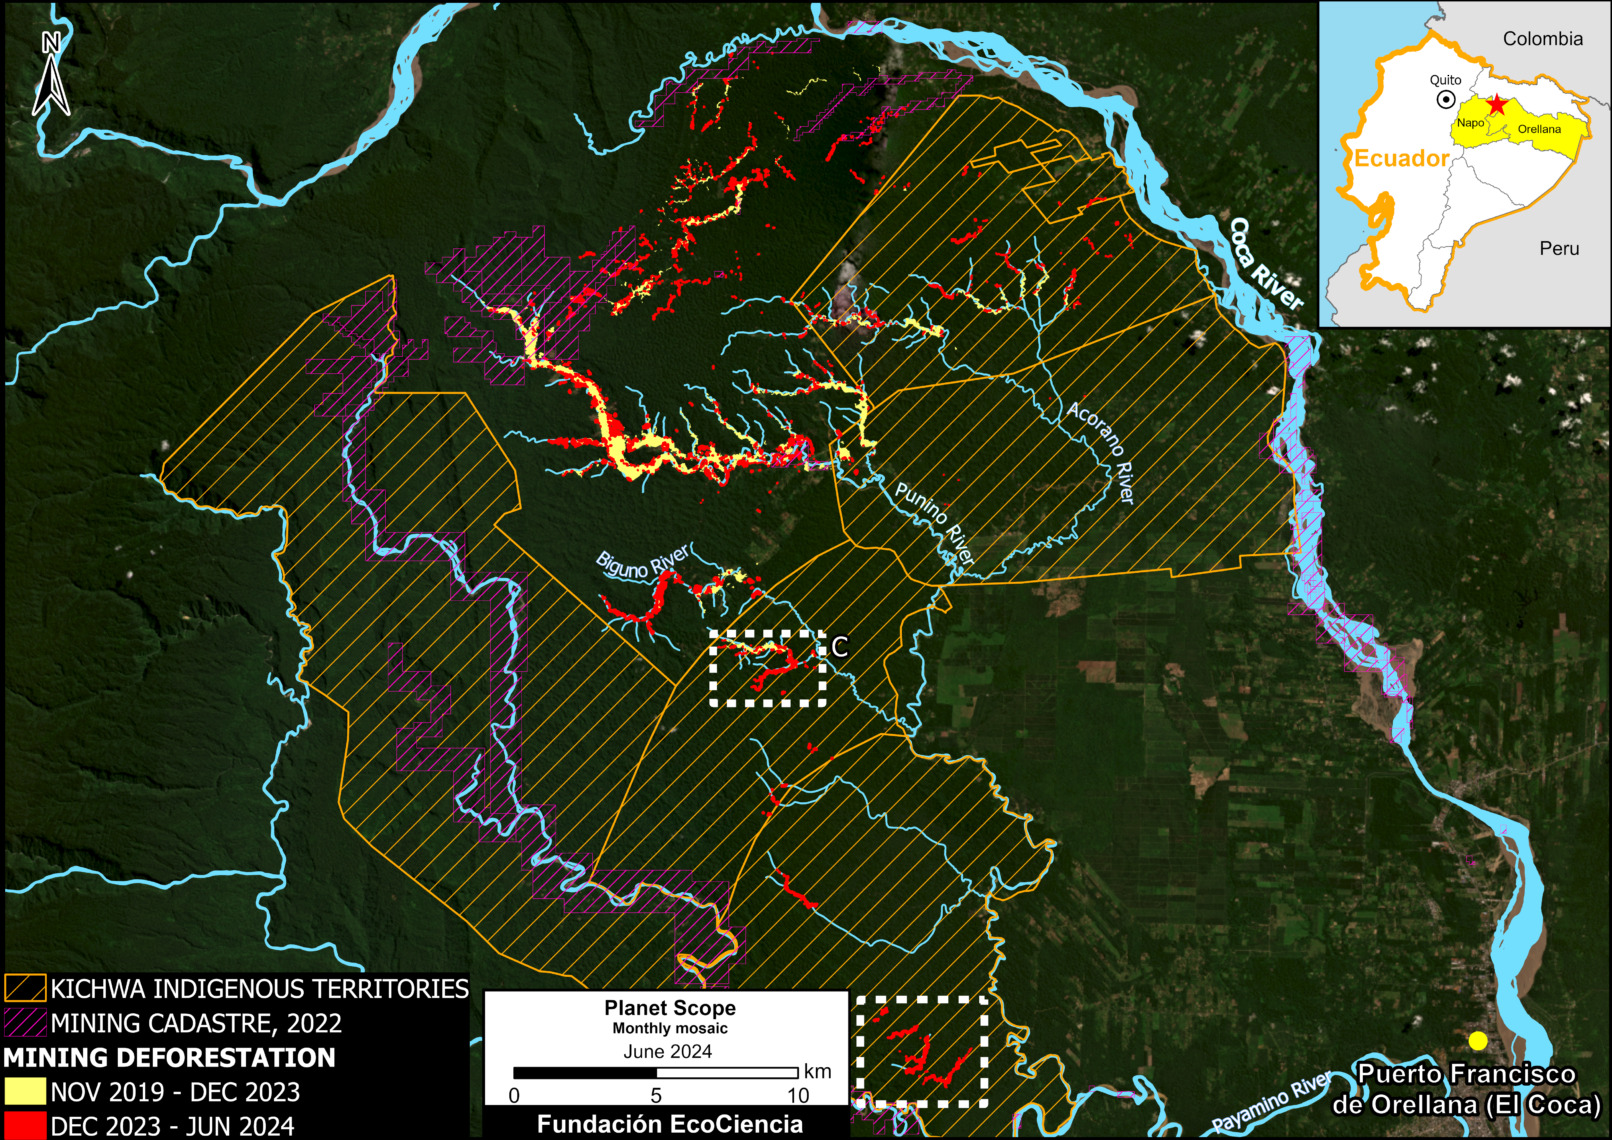
Figure 4. Indigenous territories affected by mining activity between 2019 and 2024 in the Punino area. Data: RAISG 2023, ARCERNNR 2022, Planet-NICFI, EcoCiencia.
Figure 5 shows the expansion of deforestation due to mining in the indigenous territories of the Kichwa nationality between September 2023 (left panel) and June 2024 (right panel).
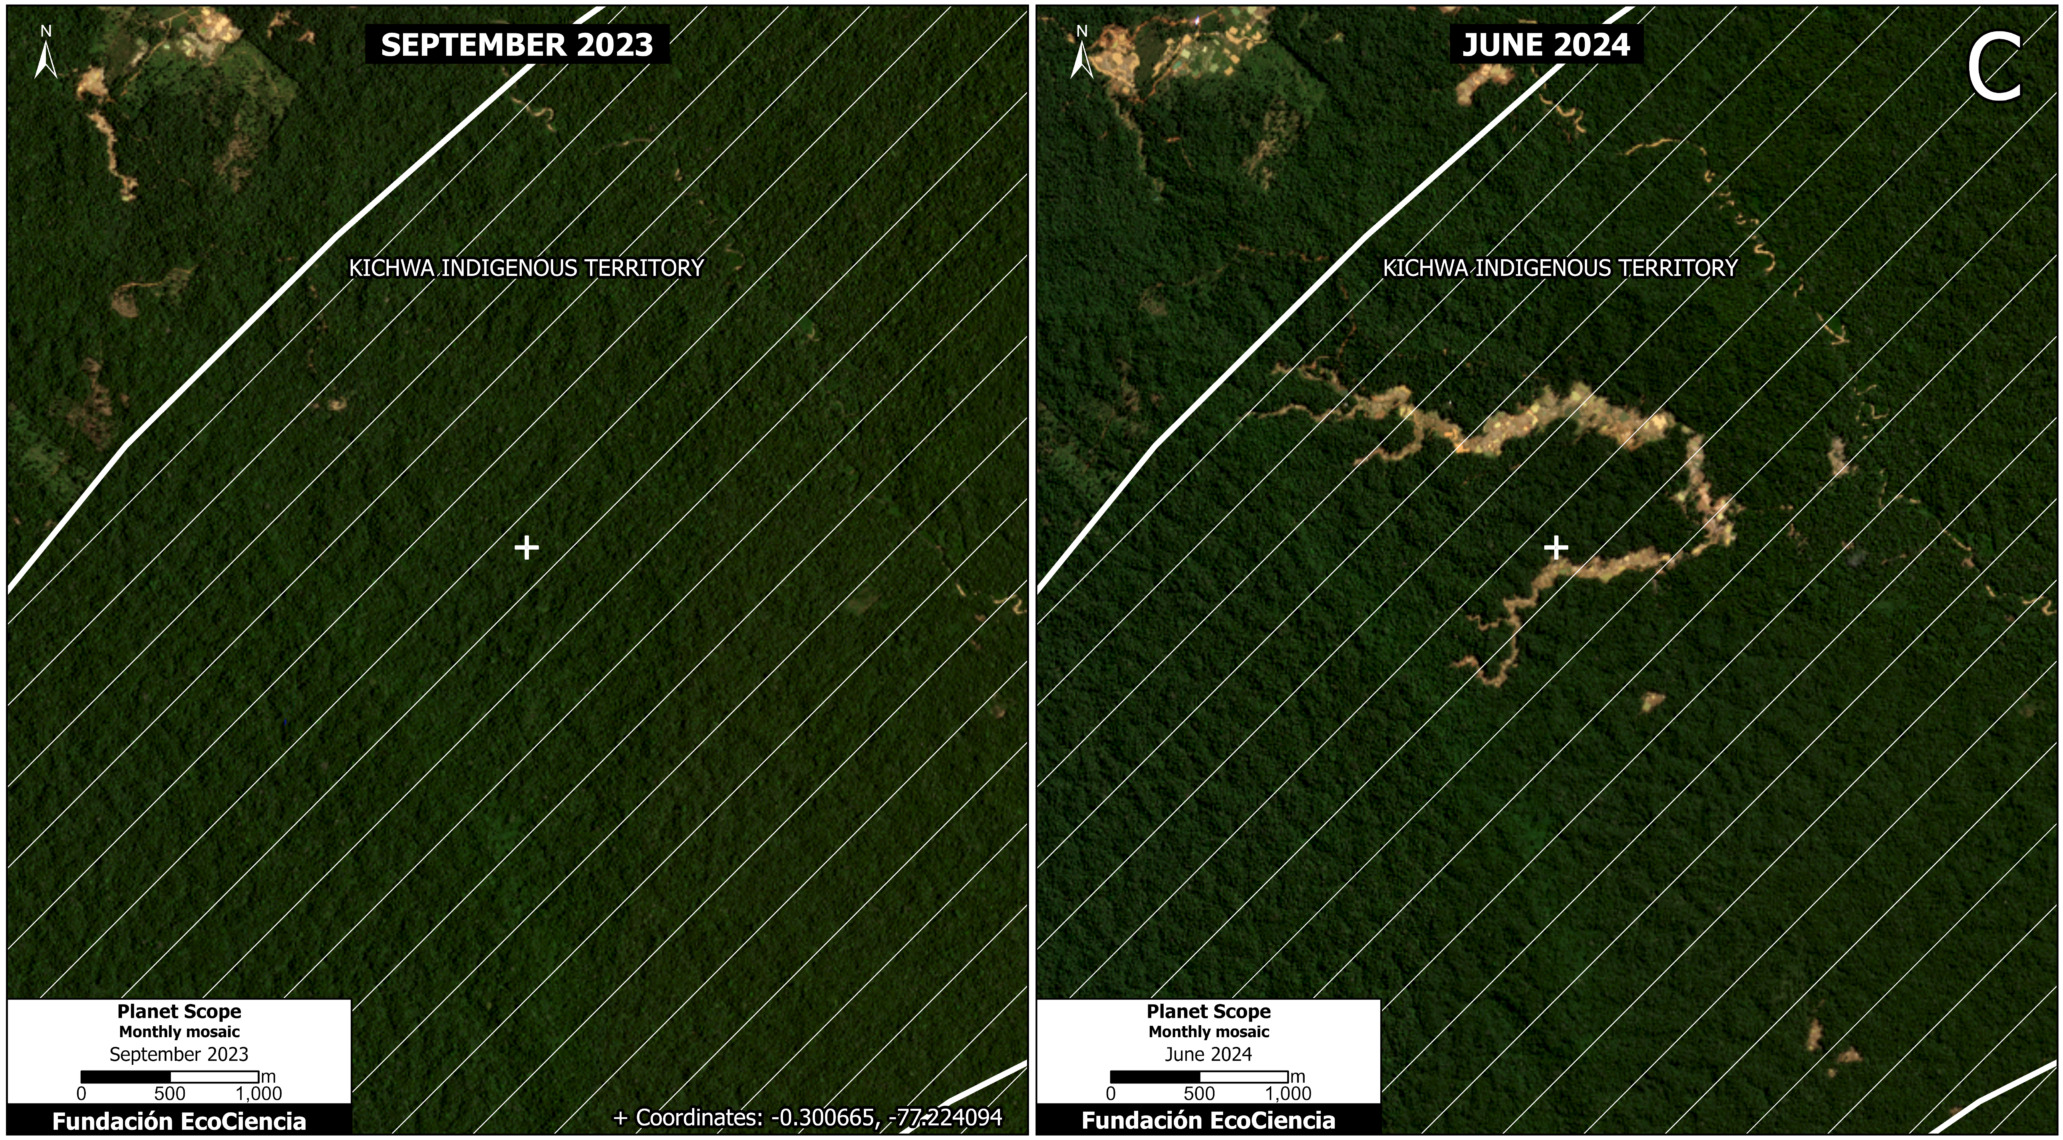
Figure 5. Mining deforestation within indigenous territory of the Kichwa nationality, comparing September 2023 (left panel) with June 2024 (right panel). Data: RAISG 2023, Planet-NICFI, EcoCiencia.
Figure 6 shows the expansion of deforestation due to mining in indigenous territories of the Kichwa nationality south of the study area between November 2019 (left panel) and June 2024 (right panel).
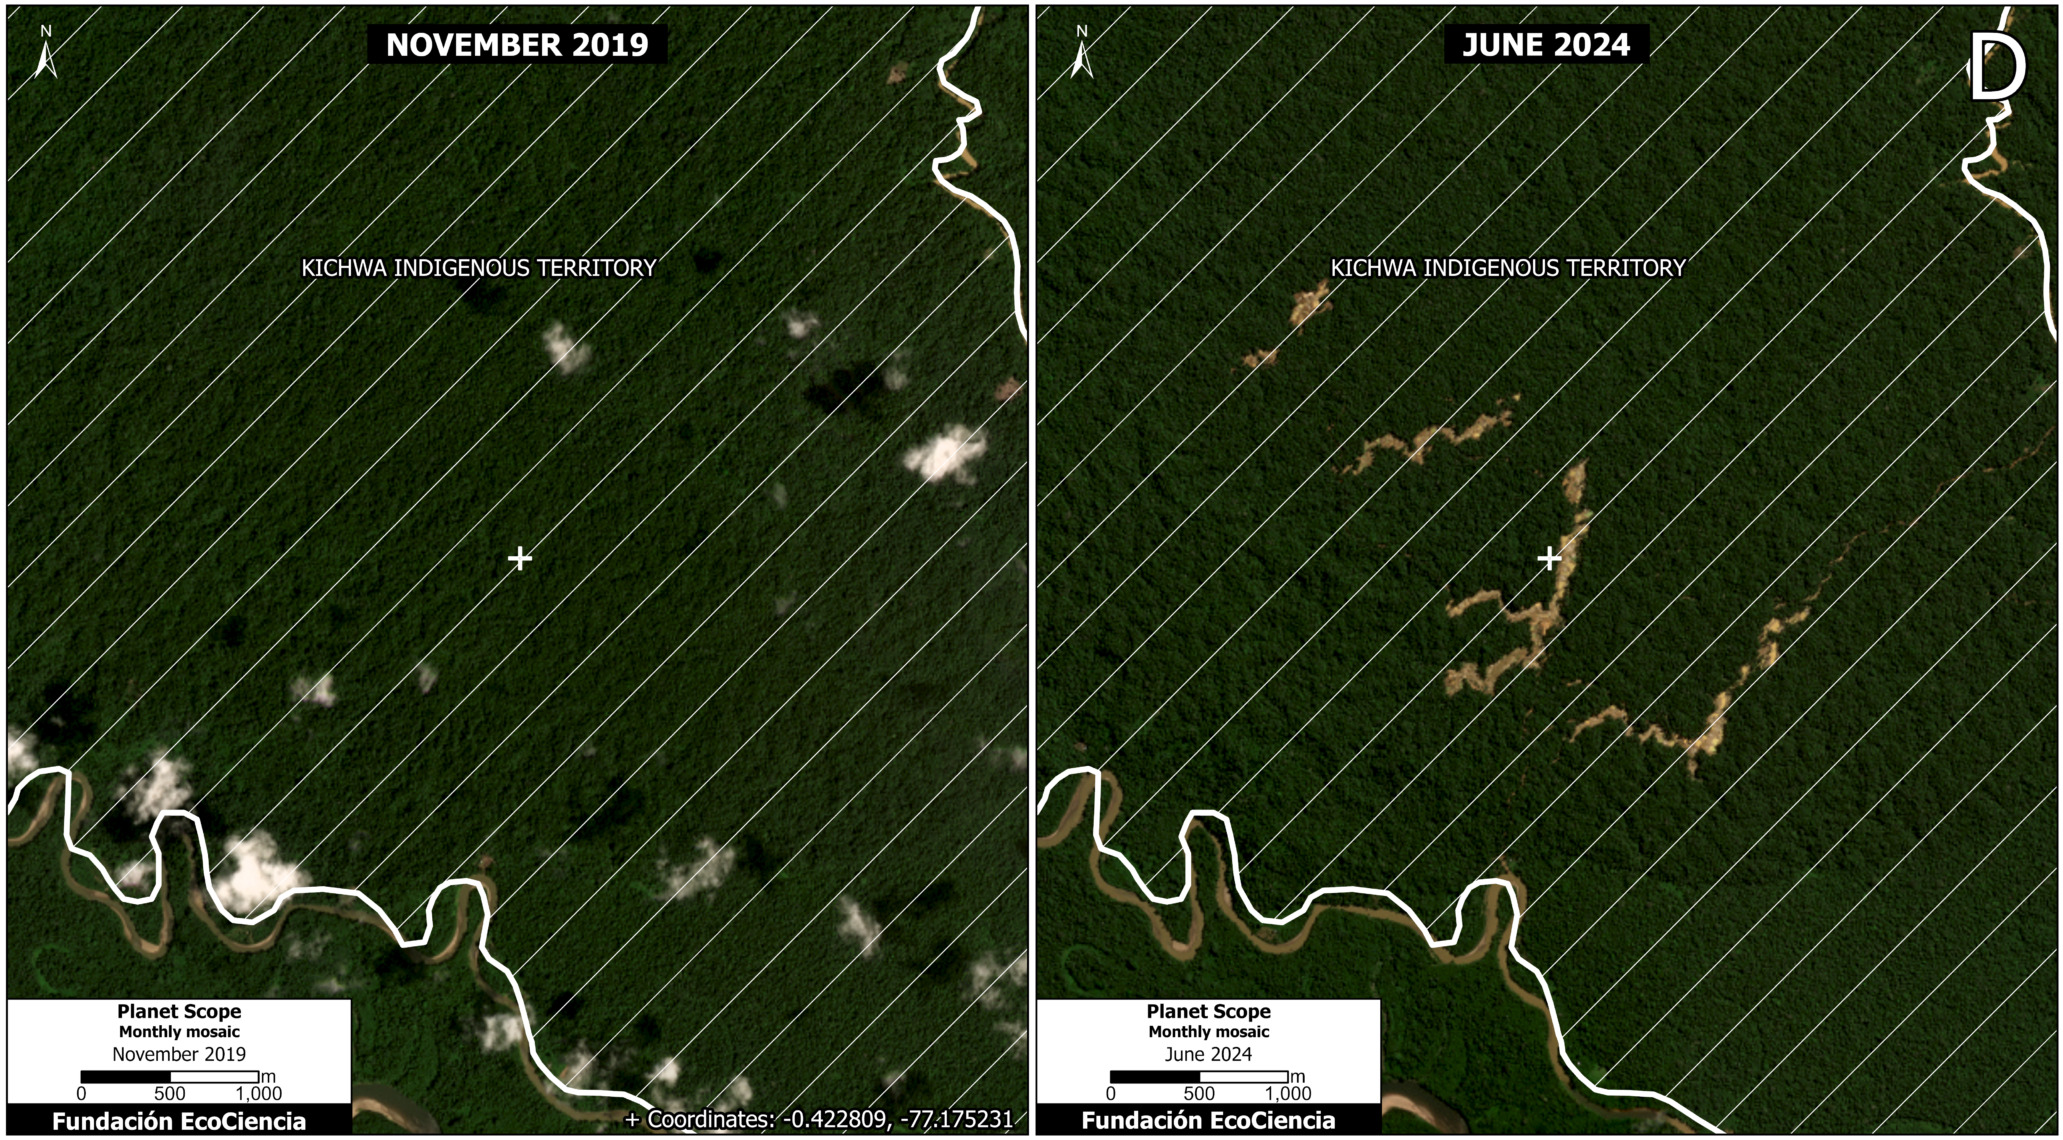
Figure 6. Mining deforestation within indigenous territory of the Kichwa nationality, comparing November 2019 (left panel) with June 2024 (right panel). Data: RAISG 2023, Planet-NICFI, EcoCiencia.
Annex 1
Annex 1 shows the four watersheds impacted by mining activity: the Punino River basin and also the Sardinas River, Lumucha River and Supayacu River basins, which in turn form part of the Coca River macro-water system.
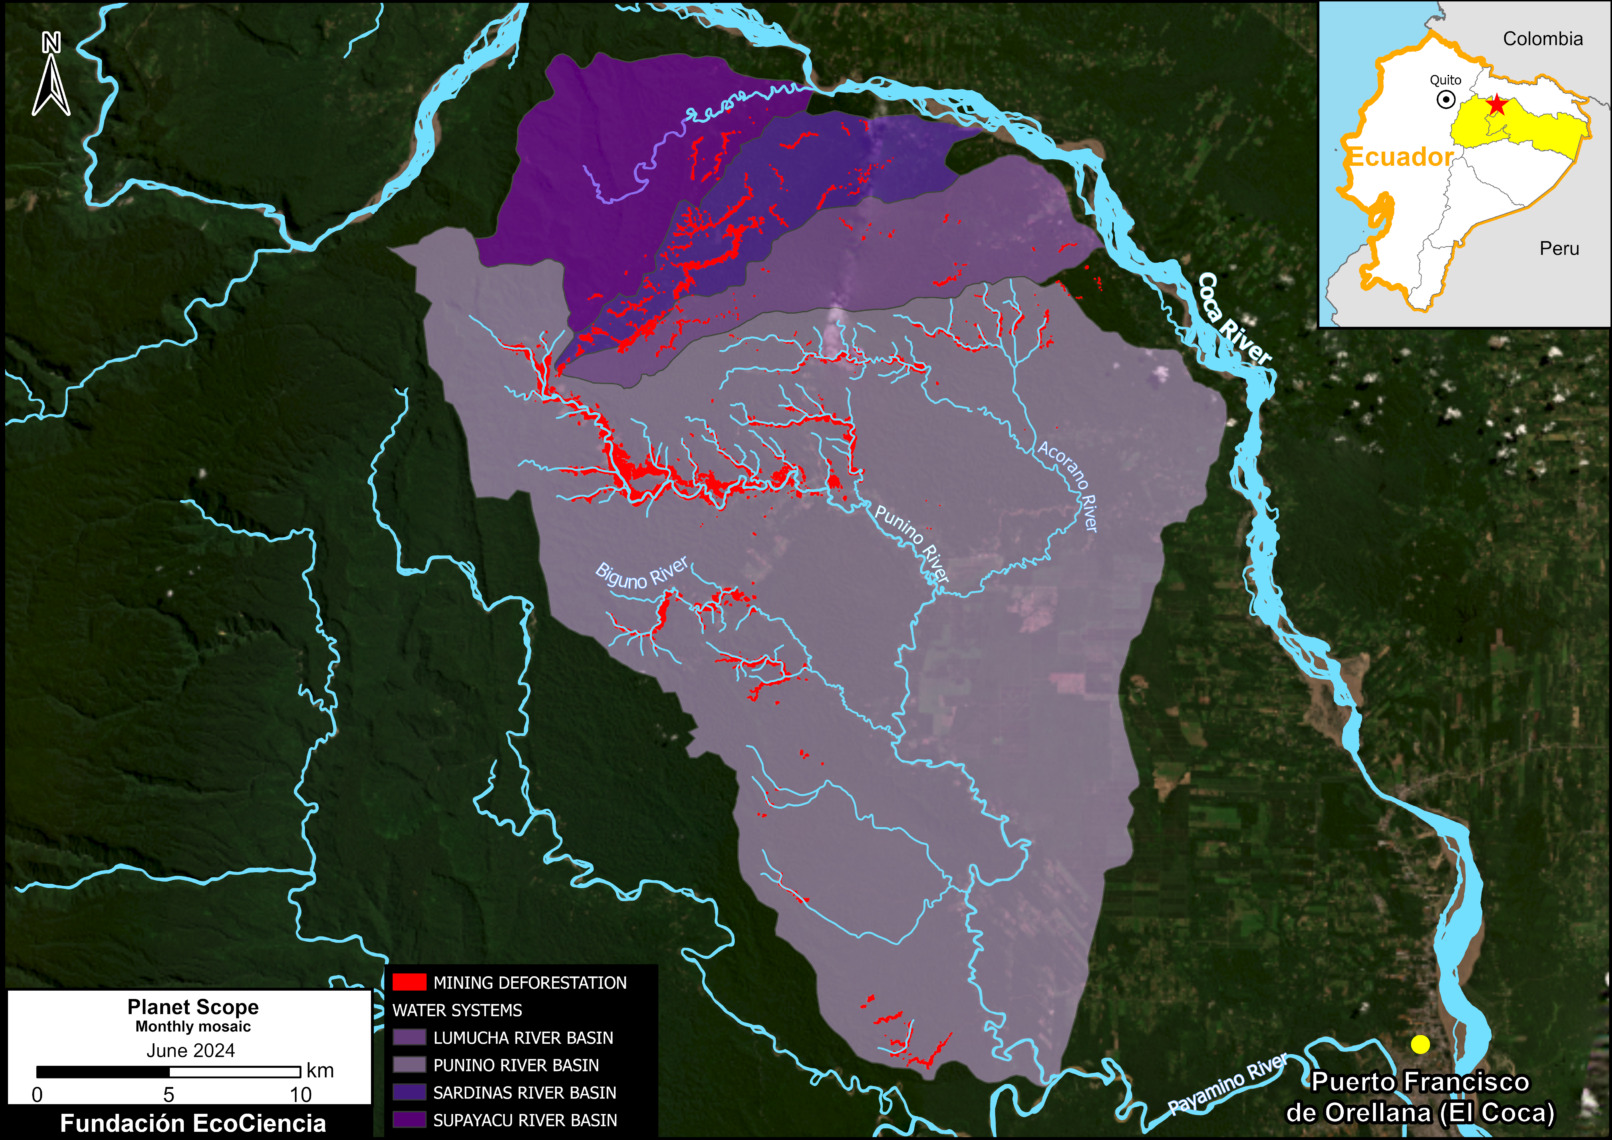
Annex 1. Water systems impacted by mining activity in the Punino area.
Annex 2
Annex 2 shows the construction of 91 kilometers of roads due to mining activity.
Annex 2. Construction of access roads associated with mining activity.
Acknowledgements
This report is part of a series focused on the Ecuadorian Amazon through a strategic collaboration between the EcoCiencia Foundation and Amazon Conservation, with the support of the Norwegian Agency for Development Cooperation (Norad).

![]()


