MAAP #108: Understanding the Amazon Fires with Satellites, part 2

Base Map. Updated Amazon fire hotspots map, August 20-26, 2019. Red, Orange, and Yellow indicate the highest concentrations of fire, as detected by NASA satellites that detect fires at 375 meter resolution. Data. VIIRS/NASA, MAAP.

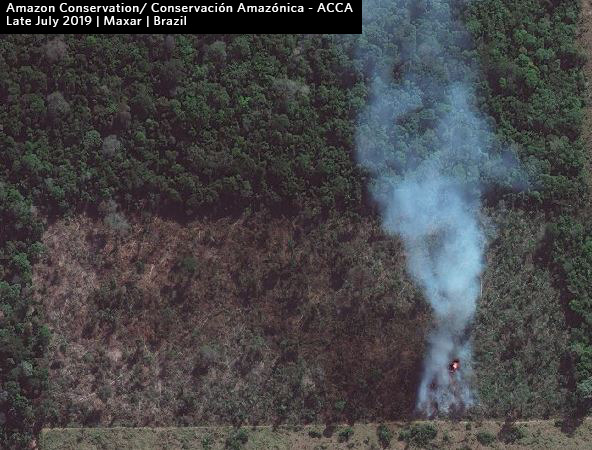
Here we present an updated analysis on the Amazon fires, as part of our ongoing coverage and building off what we reported in MAAP #107.

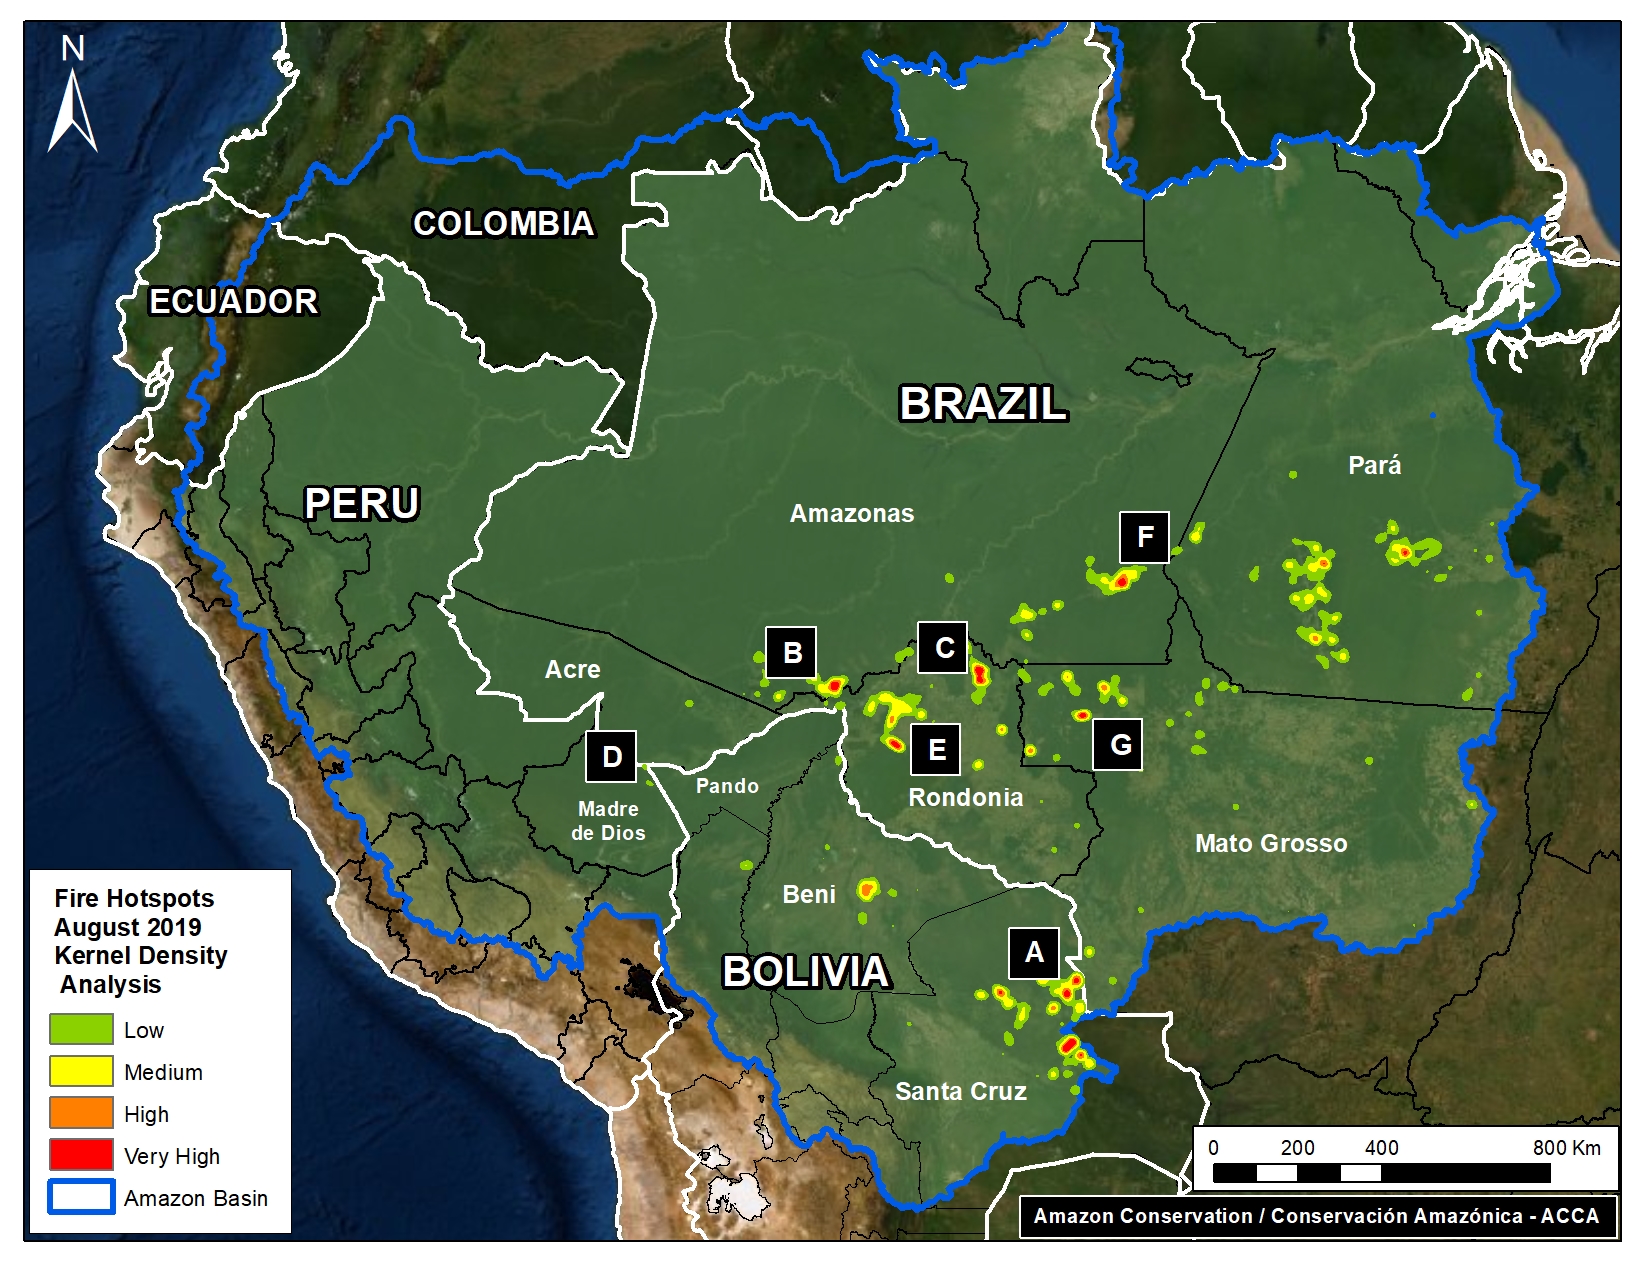
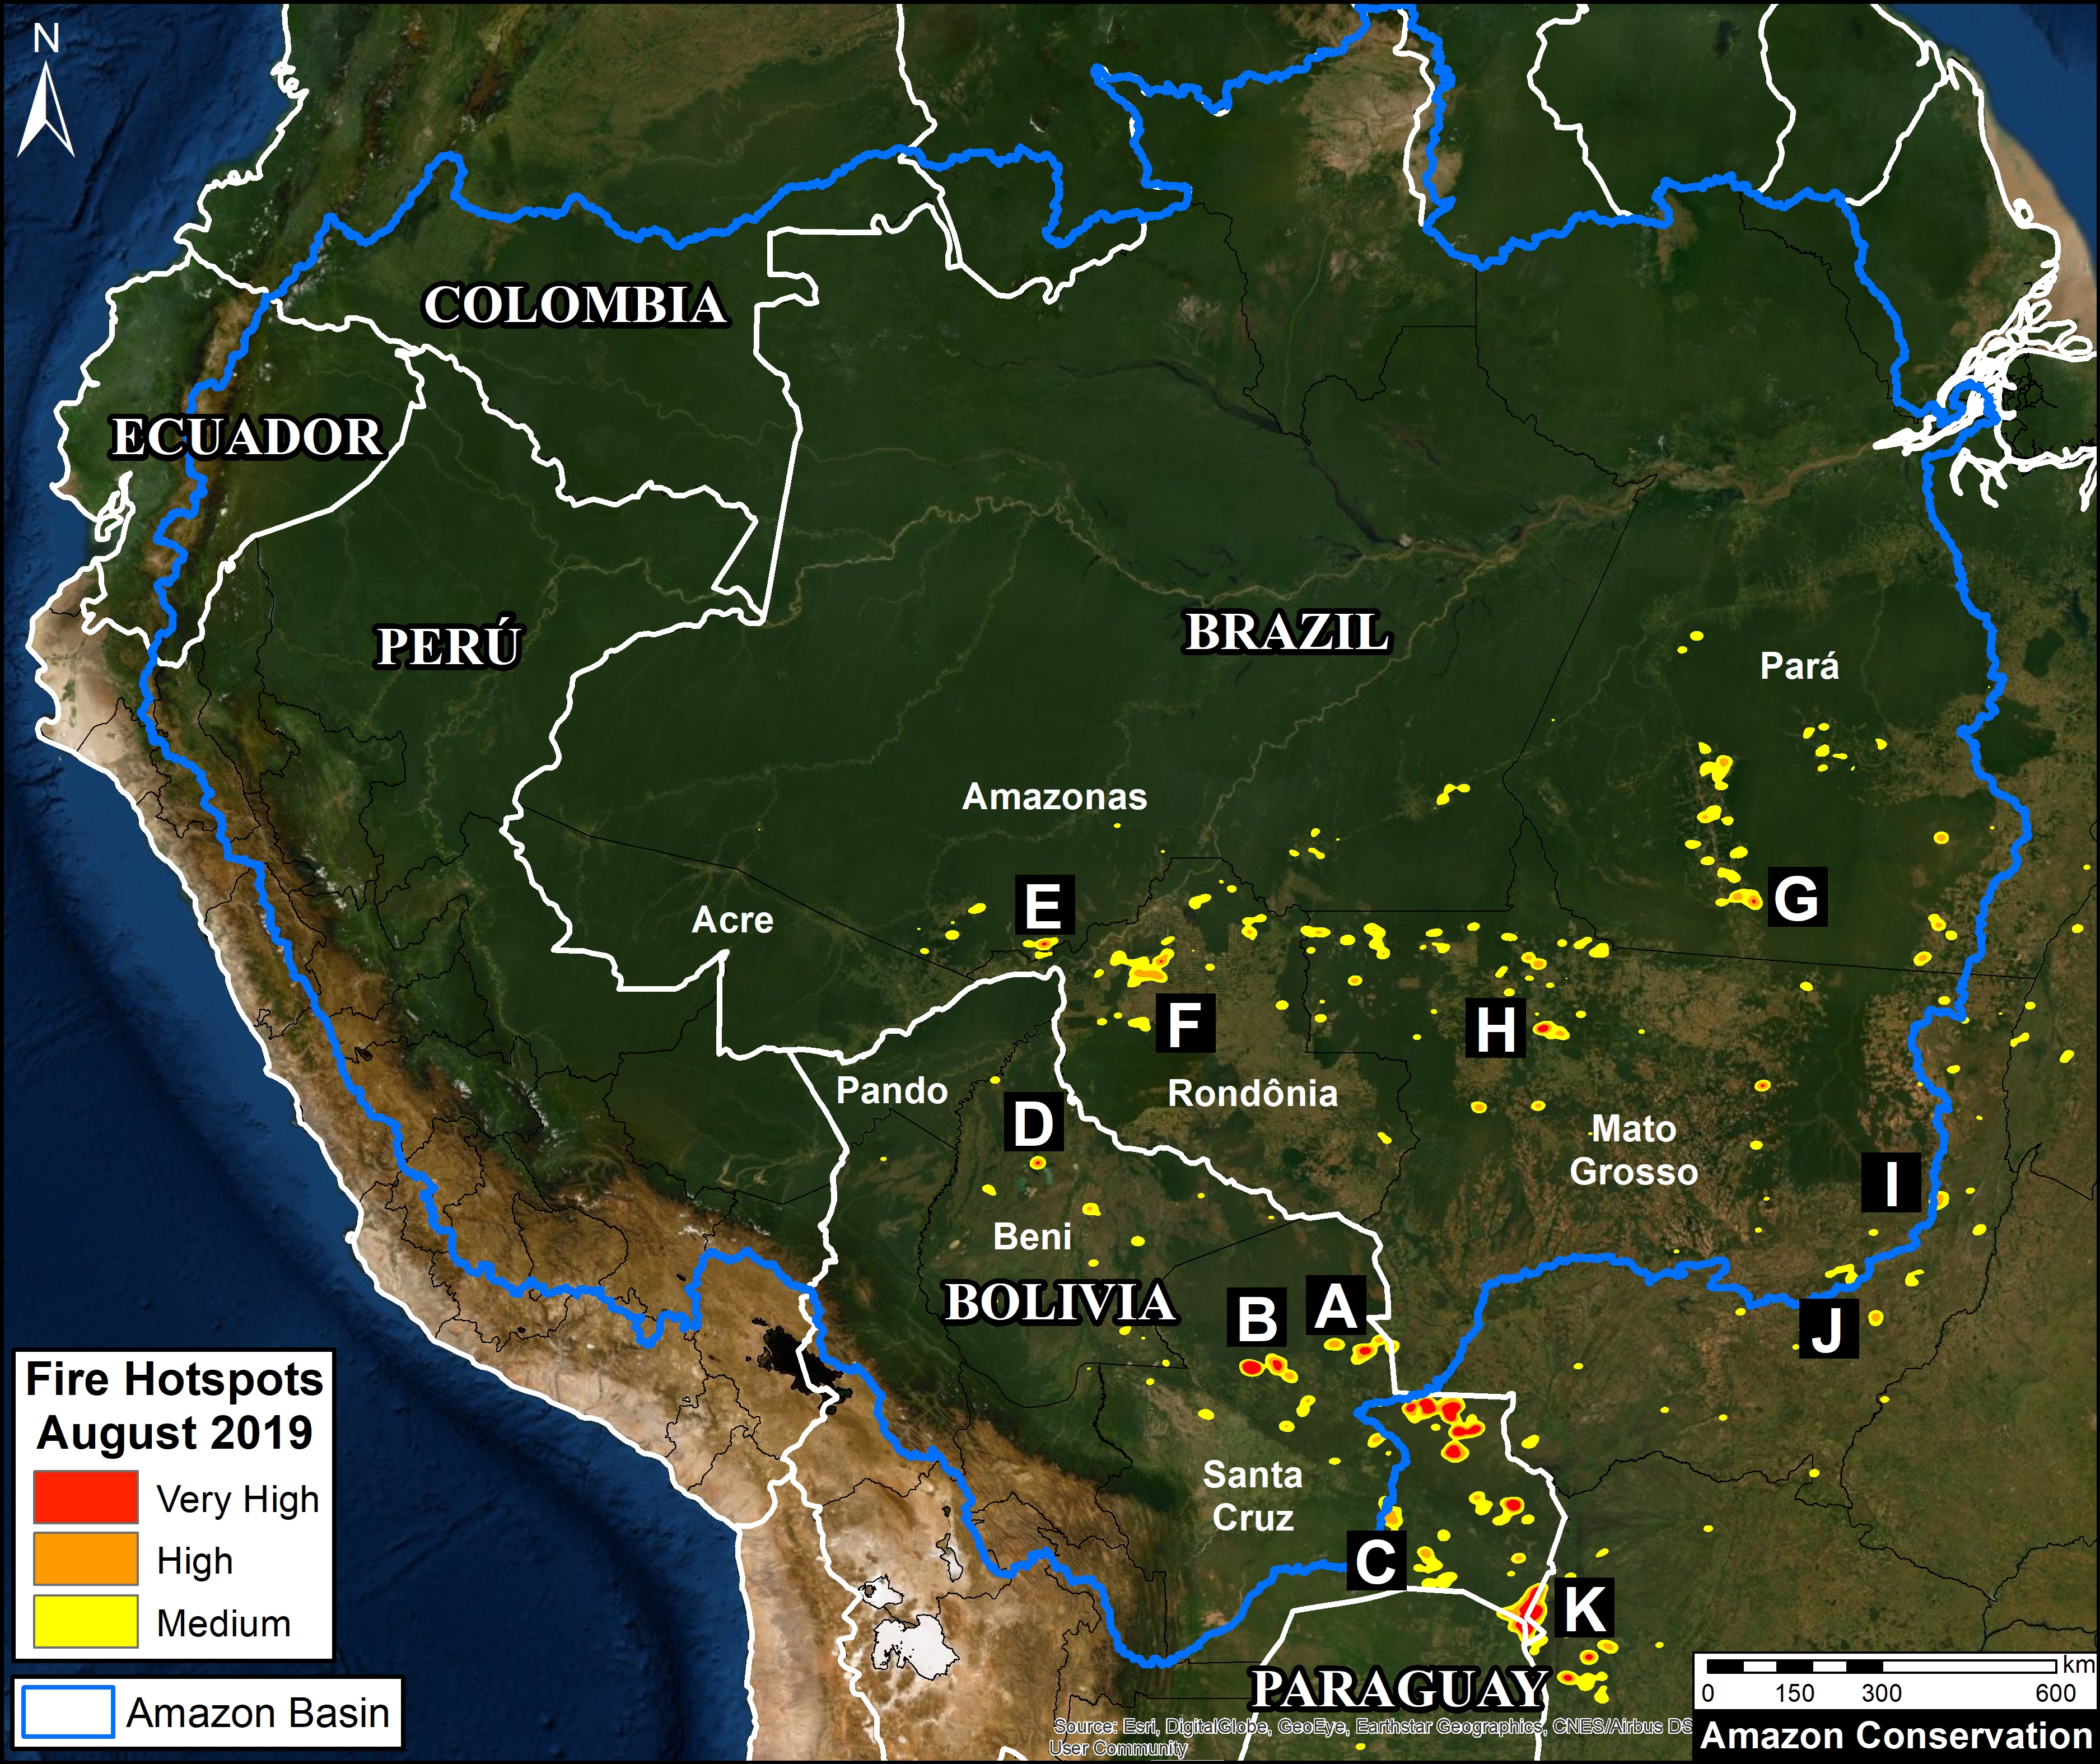
First, we show an updated Base Map of the “fire hotspots” across the Amazon, based on very recent fire alerts (August 20-26). Hotspots (shown in red, orange, and yellow) indicate the highest concentrations of fire as detected by NASA satellites.

Our key findings include:

– The major fires do NOT appear to be in the northern and central Brazilian Amazon characterized by tall moist forest (Rondônia, Acre, Amazonas, Pará states),* but in the drier southern Amazon of Brazil and Bolivia characterized by dry forest and shrubland (Mato Grosso and Santa Cruz).

– The most intense fires are actually to the south of the Amazon, along the border of Bolivia and Paraguay, in areas characterized by drier ecosystems.

– Most of the fires in the Brazilian Amazon appear to be associated with agricultural lands. Fires at the agriculture-forest boundary may be expanding plantations or escaping into forest, including indigenous territories and protected areas.

– The large number of agriculture-related fires in Brazil highlights a critical point: much of the eastern Amazon has been transformed into a massive agricultural landscape over the past several decades. The fires are a lagging indicator of massive previous deforestation.

– We continue to warn against using satellite-based fire detection data alone as a measure of impact to Amazonian forests. Many of the detected fires are in agricultural areas that were once forest, but don’t currently represent forest fires.

In conclusion, the classic image of wildfires scorching everything in their path are currently more accurate for the unique and biodiverse dry forests of the southern Amazon then the moist forests to the north. However, the numerous fires at the agriculture-moist forest boundary are both a threat and stark reminder of how much forest has been, and continues to be, lost by deforestation.

Next, we show a series of 11 satellite images that show what the fires look like in major hotspots and how they are impacting Amazonian forests. The location of each image corresponds to the letters (A-K) on the Base Map.

*If anyone has detailed information to the contrary, please send spatial coordinates to maap@amazonconservation.org

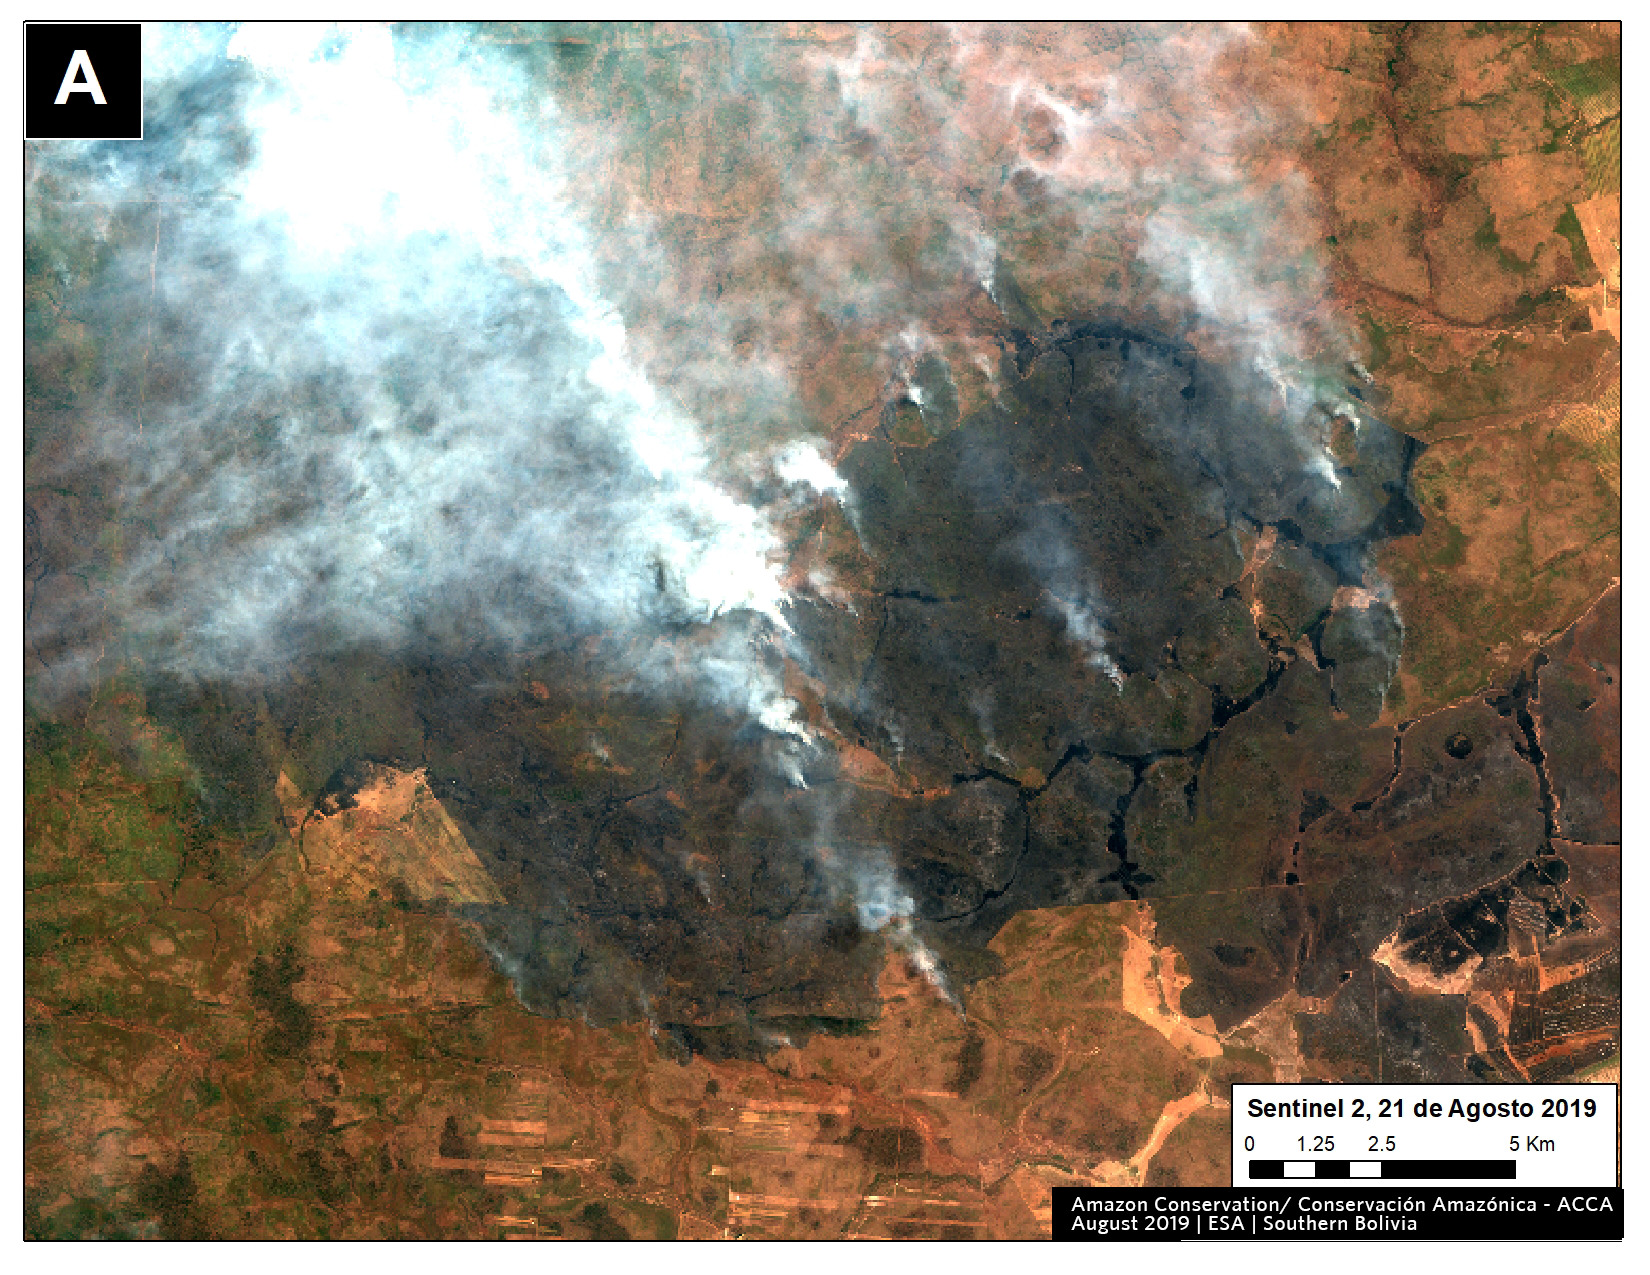
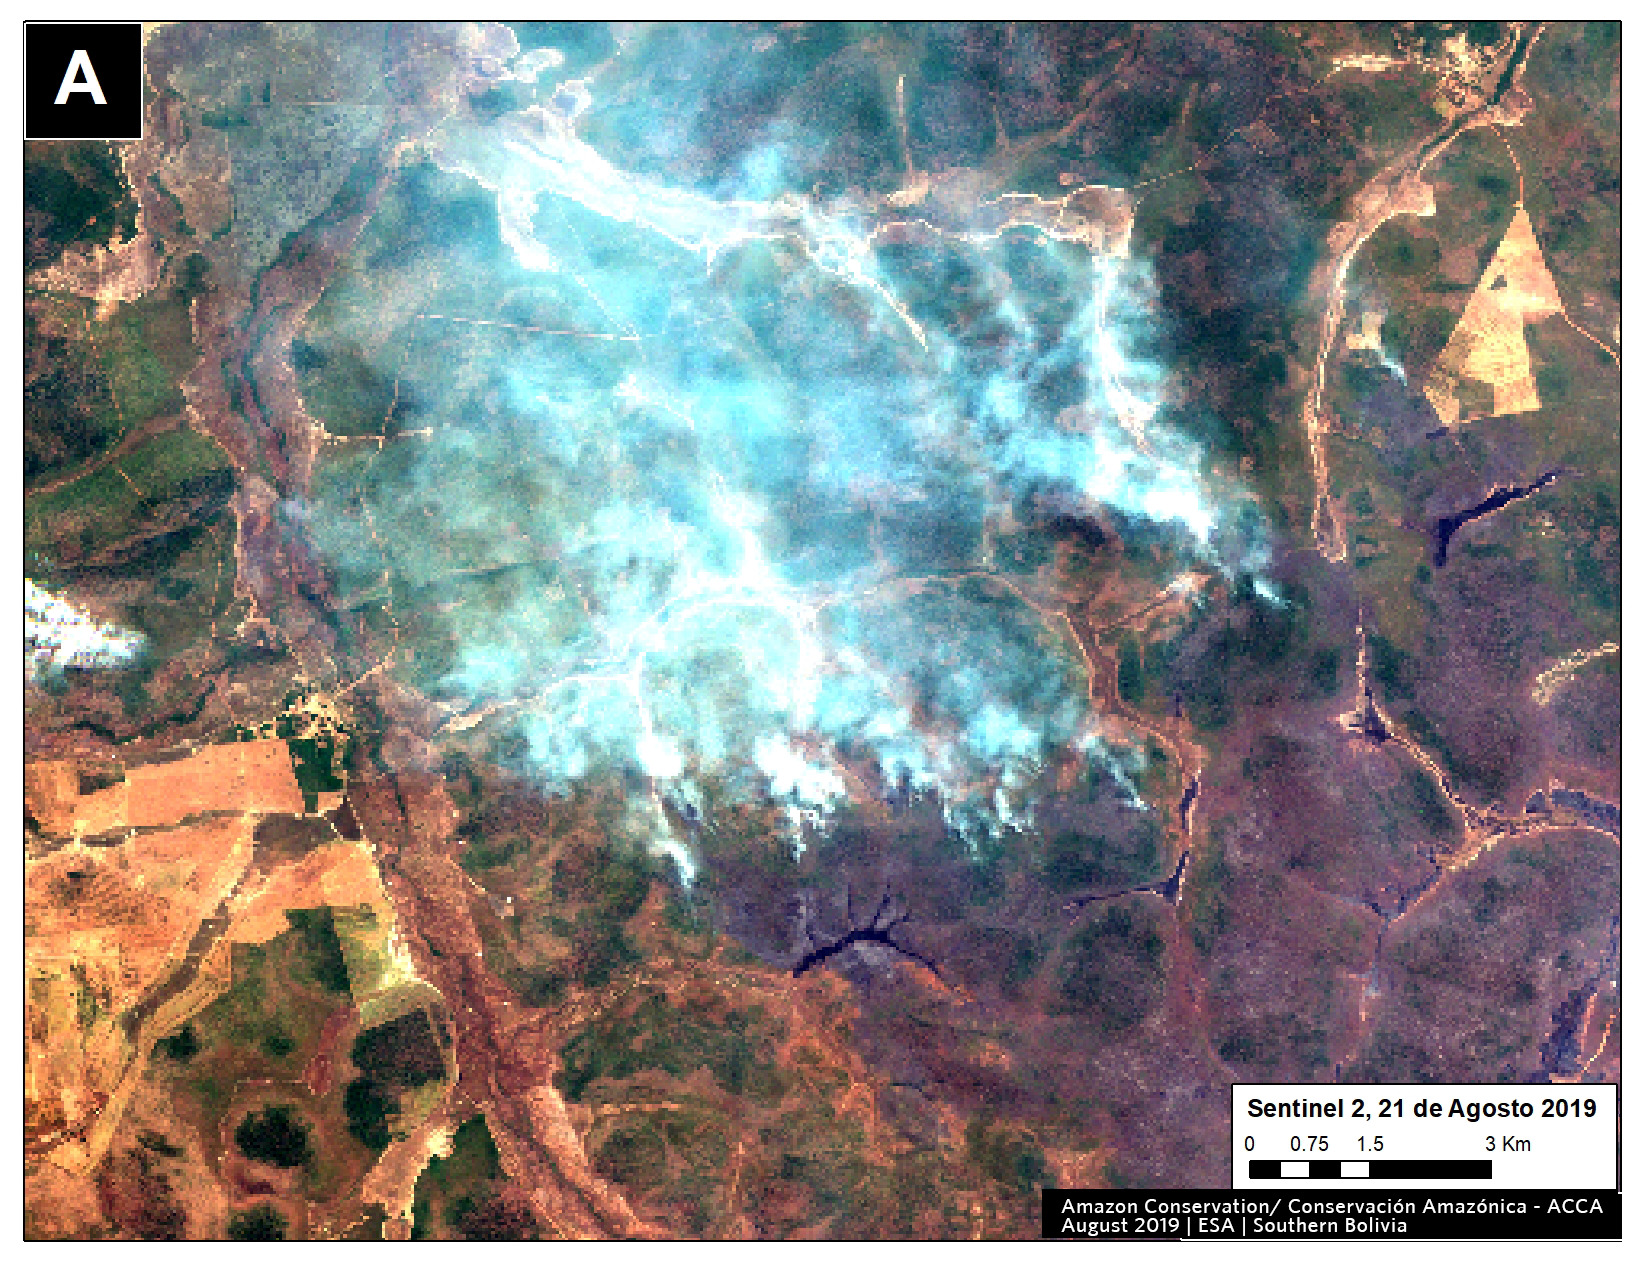
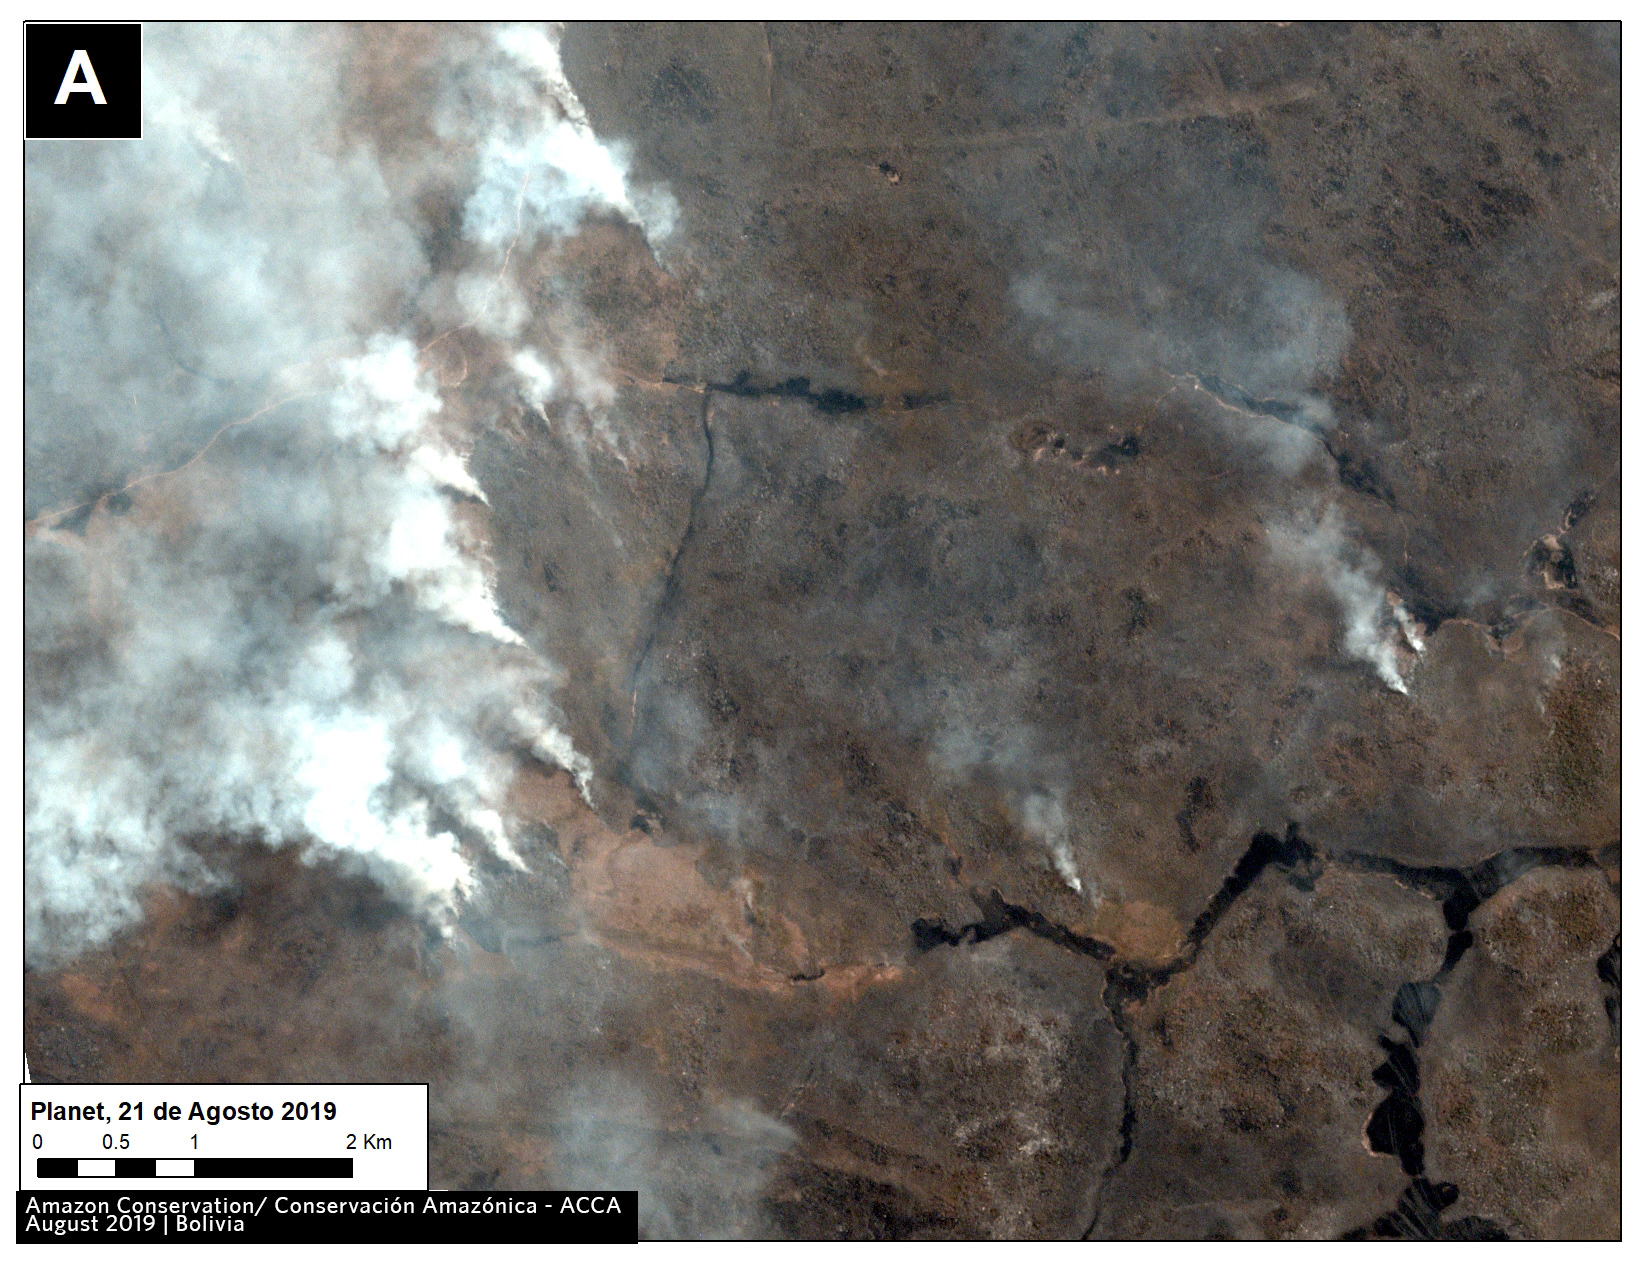
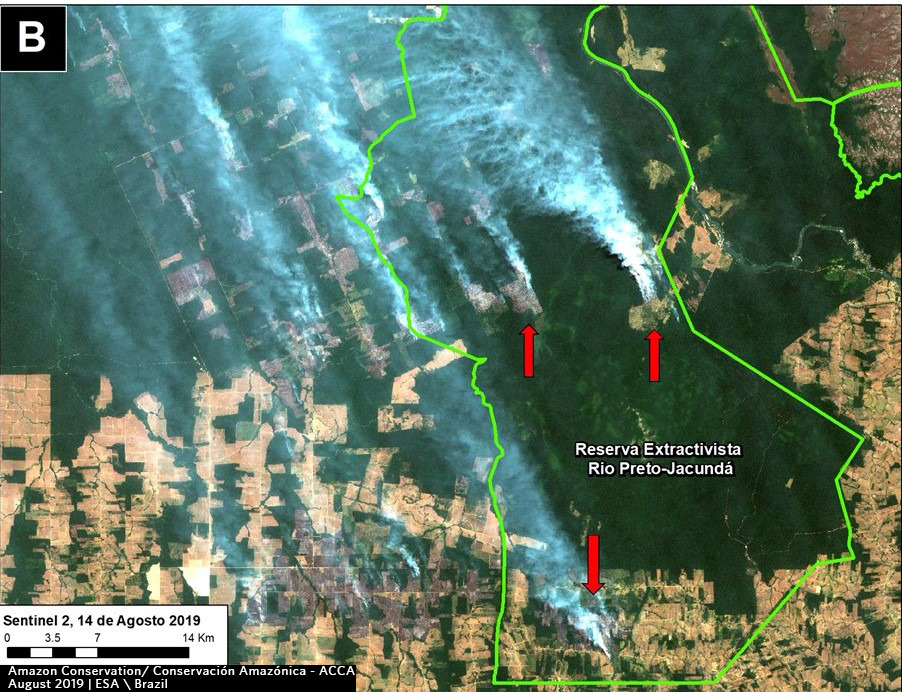
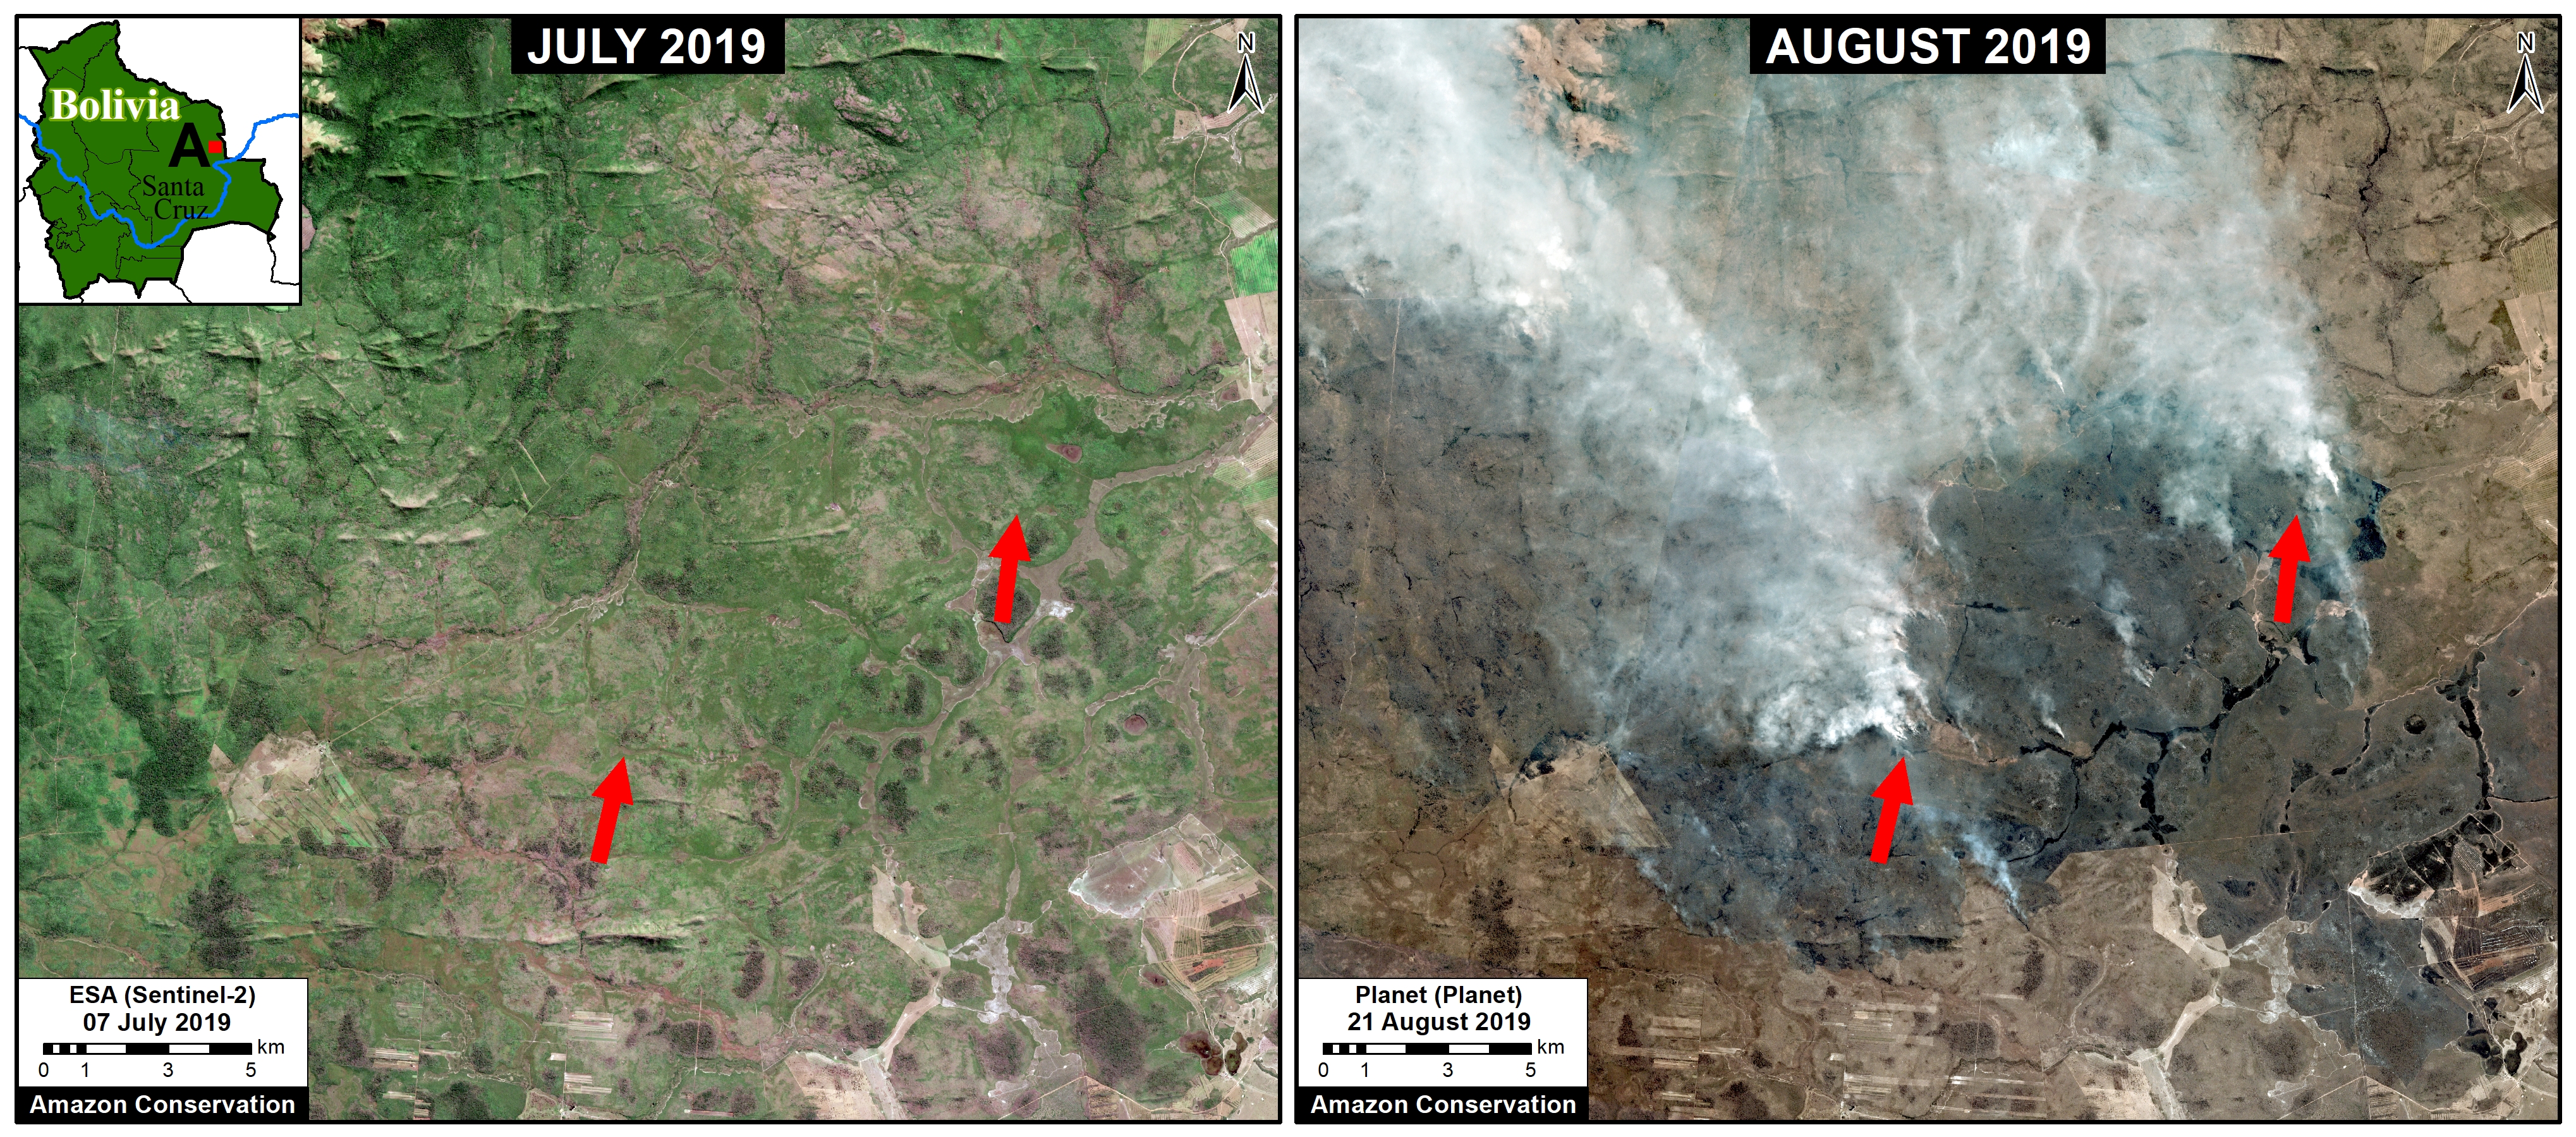
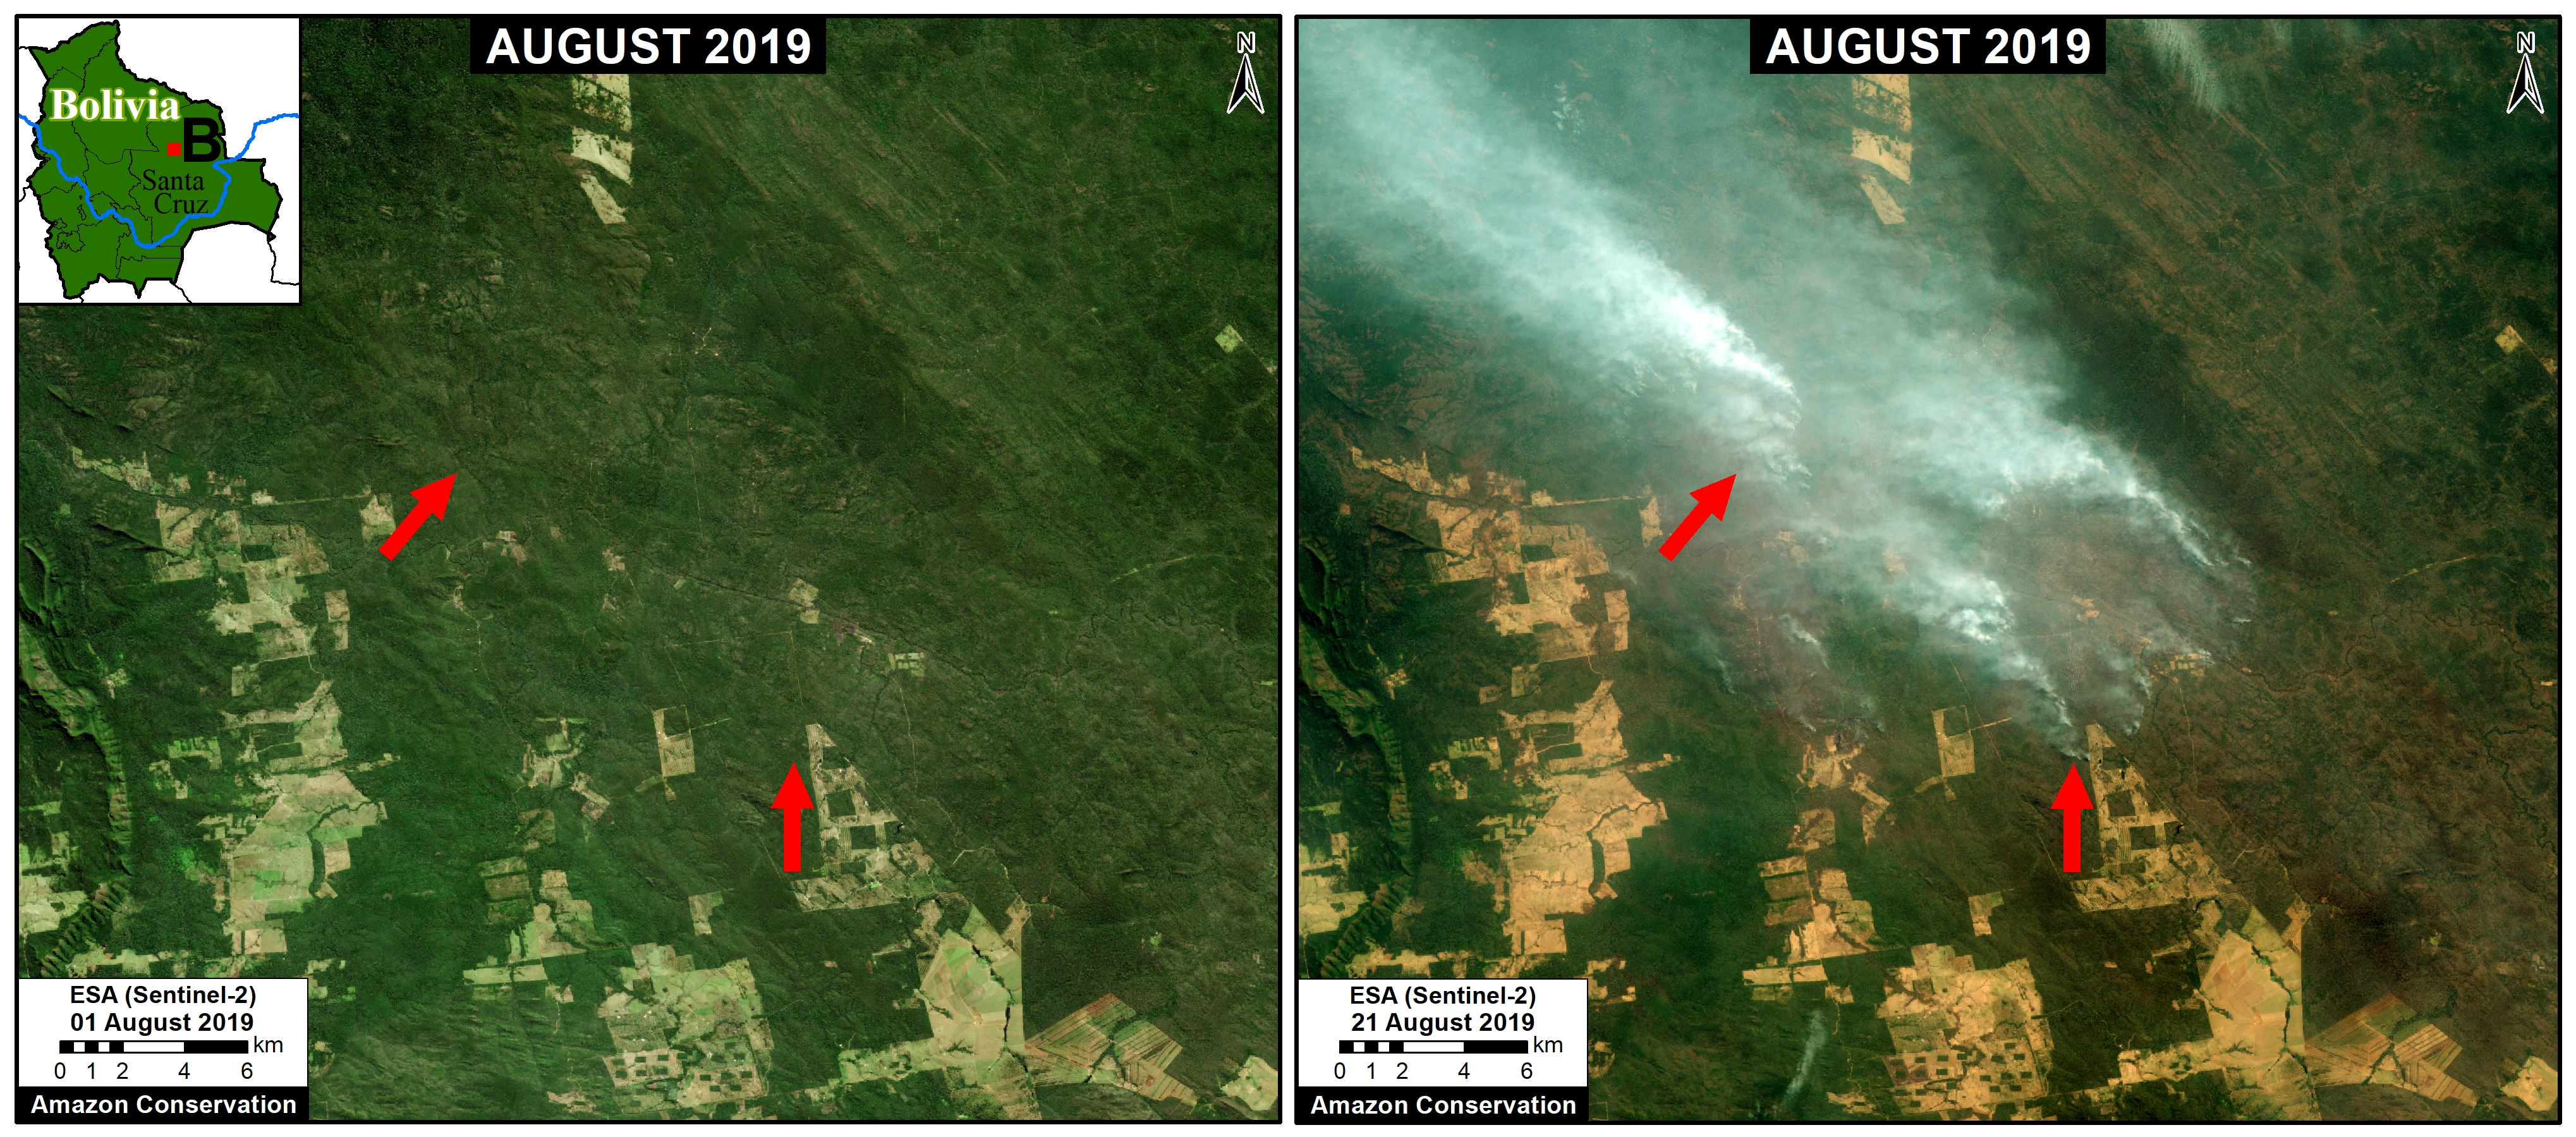
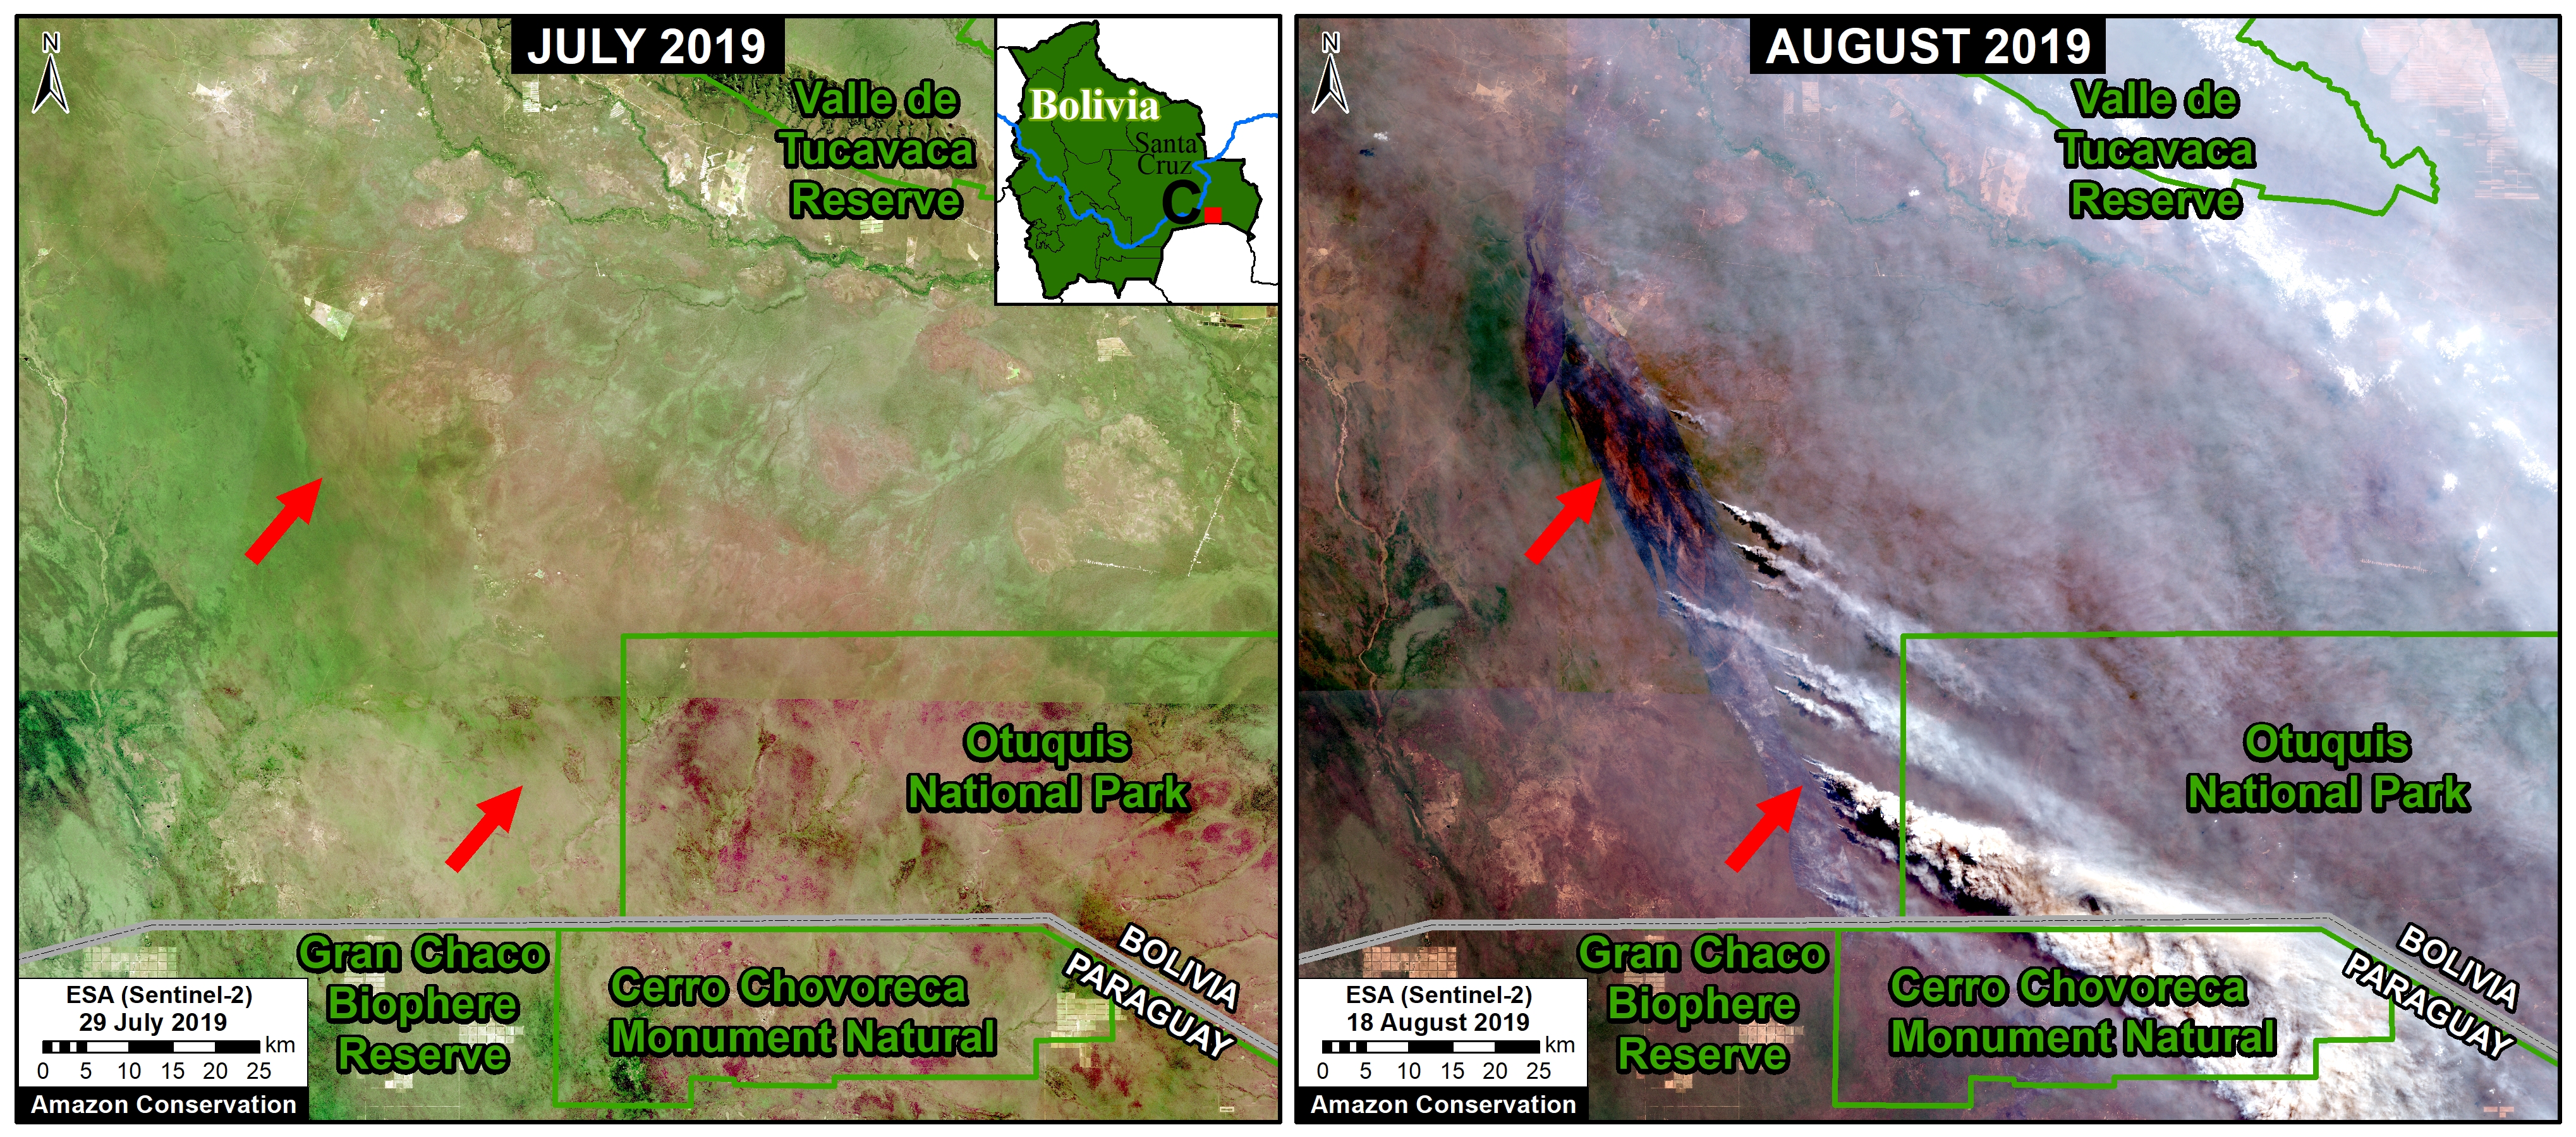
Zooms A, B: Chiquitano Dry Forest (Bolivia)

Some of the most intense fires are concentrated in the dry Chiquitano of southern Bolivia. The Chiquitano is part of the largest tropical dry forest in the world and is a unique, high biodiversity, and poorly explored Amazonian ecosystem. Zooms A-C illustrate fires in the Chiquitano between August 18-21 of this year, likely burning a mixture of dry forest, scrubland, and grassland.

Zoom A. Recent fires in the dry Chiquitano of southern Bolivia. Data: Planet.
Zoom B. Recent fires in the dry Chiquitano of southern Bolivia. Data: Planet.

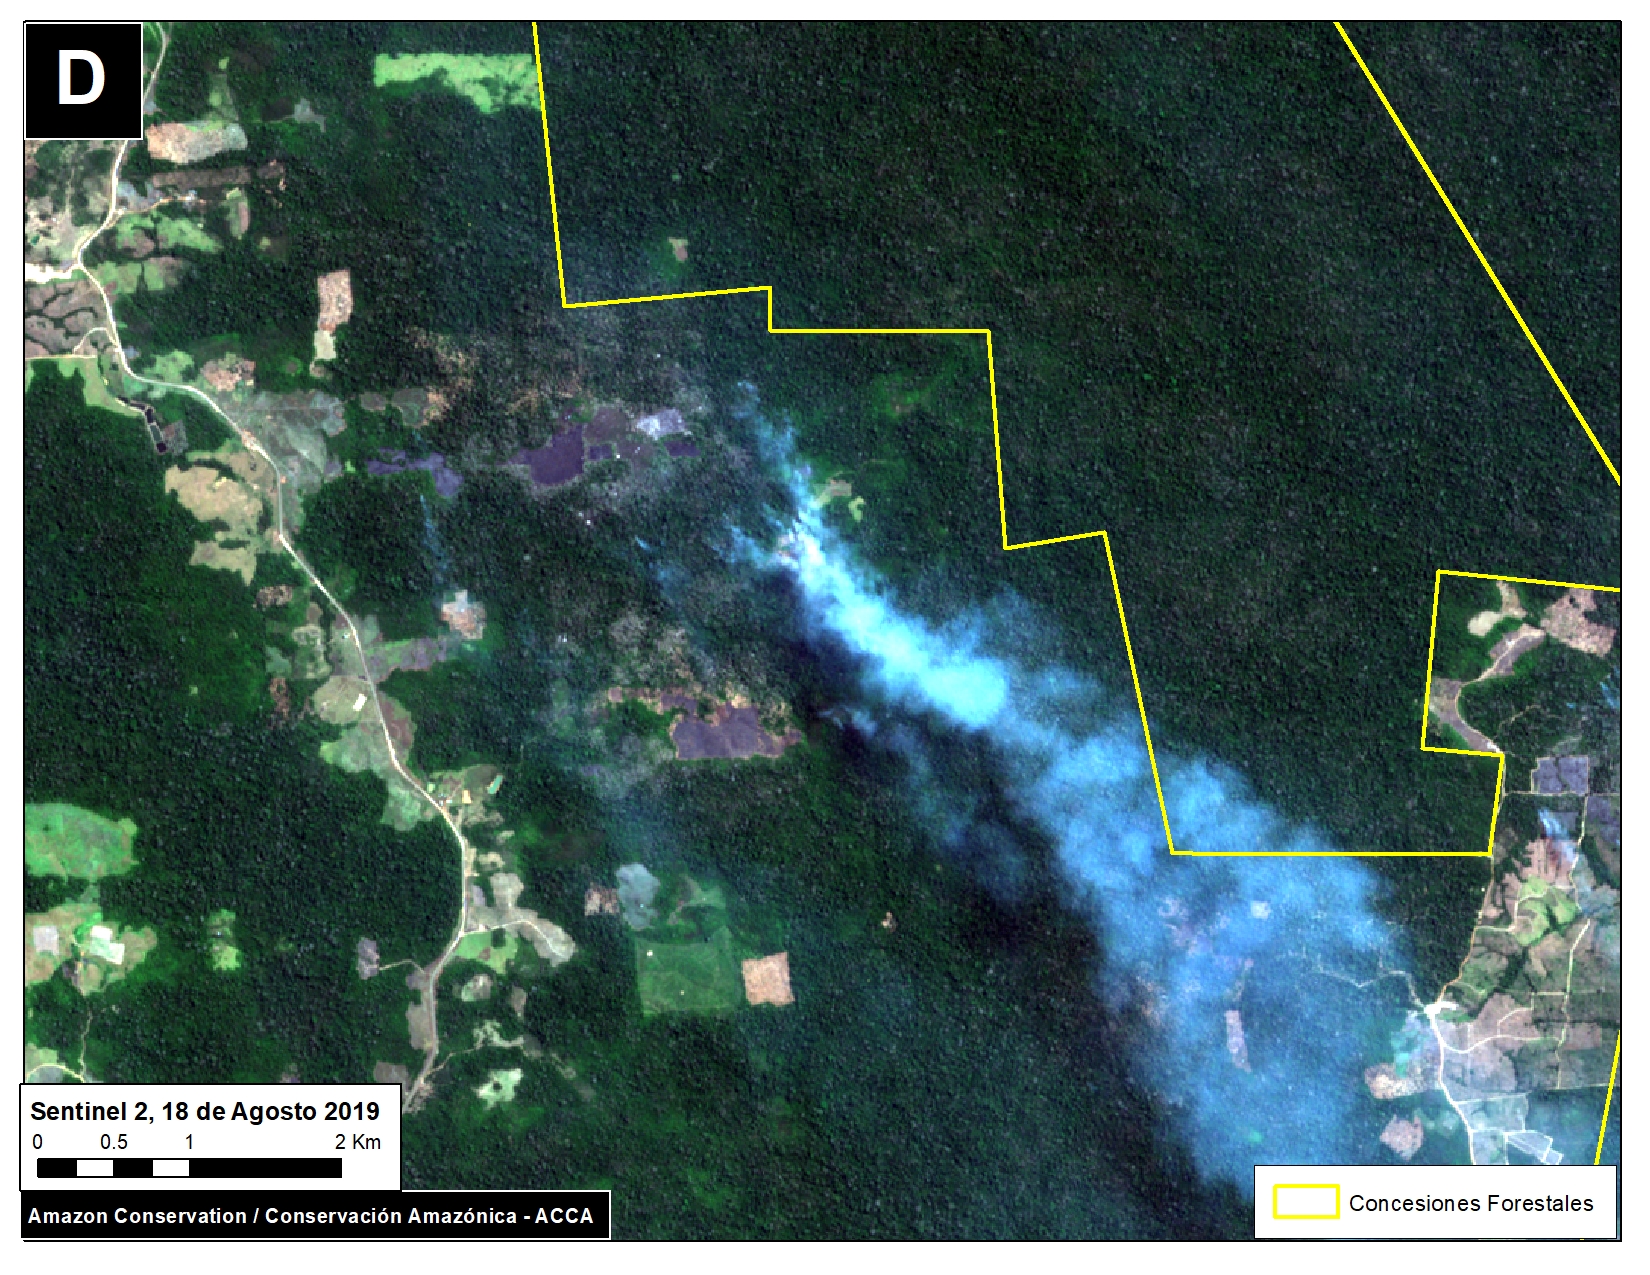
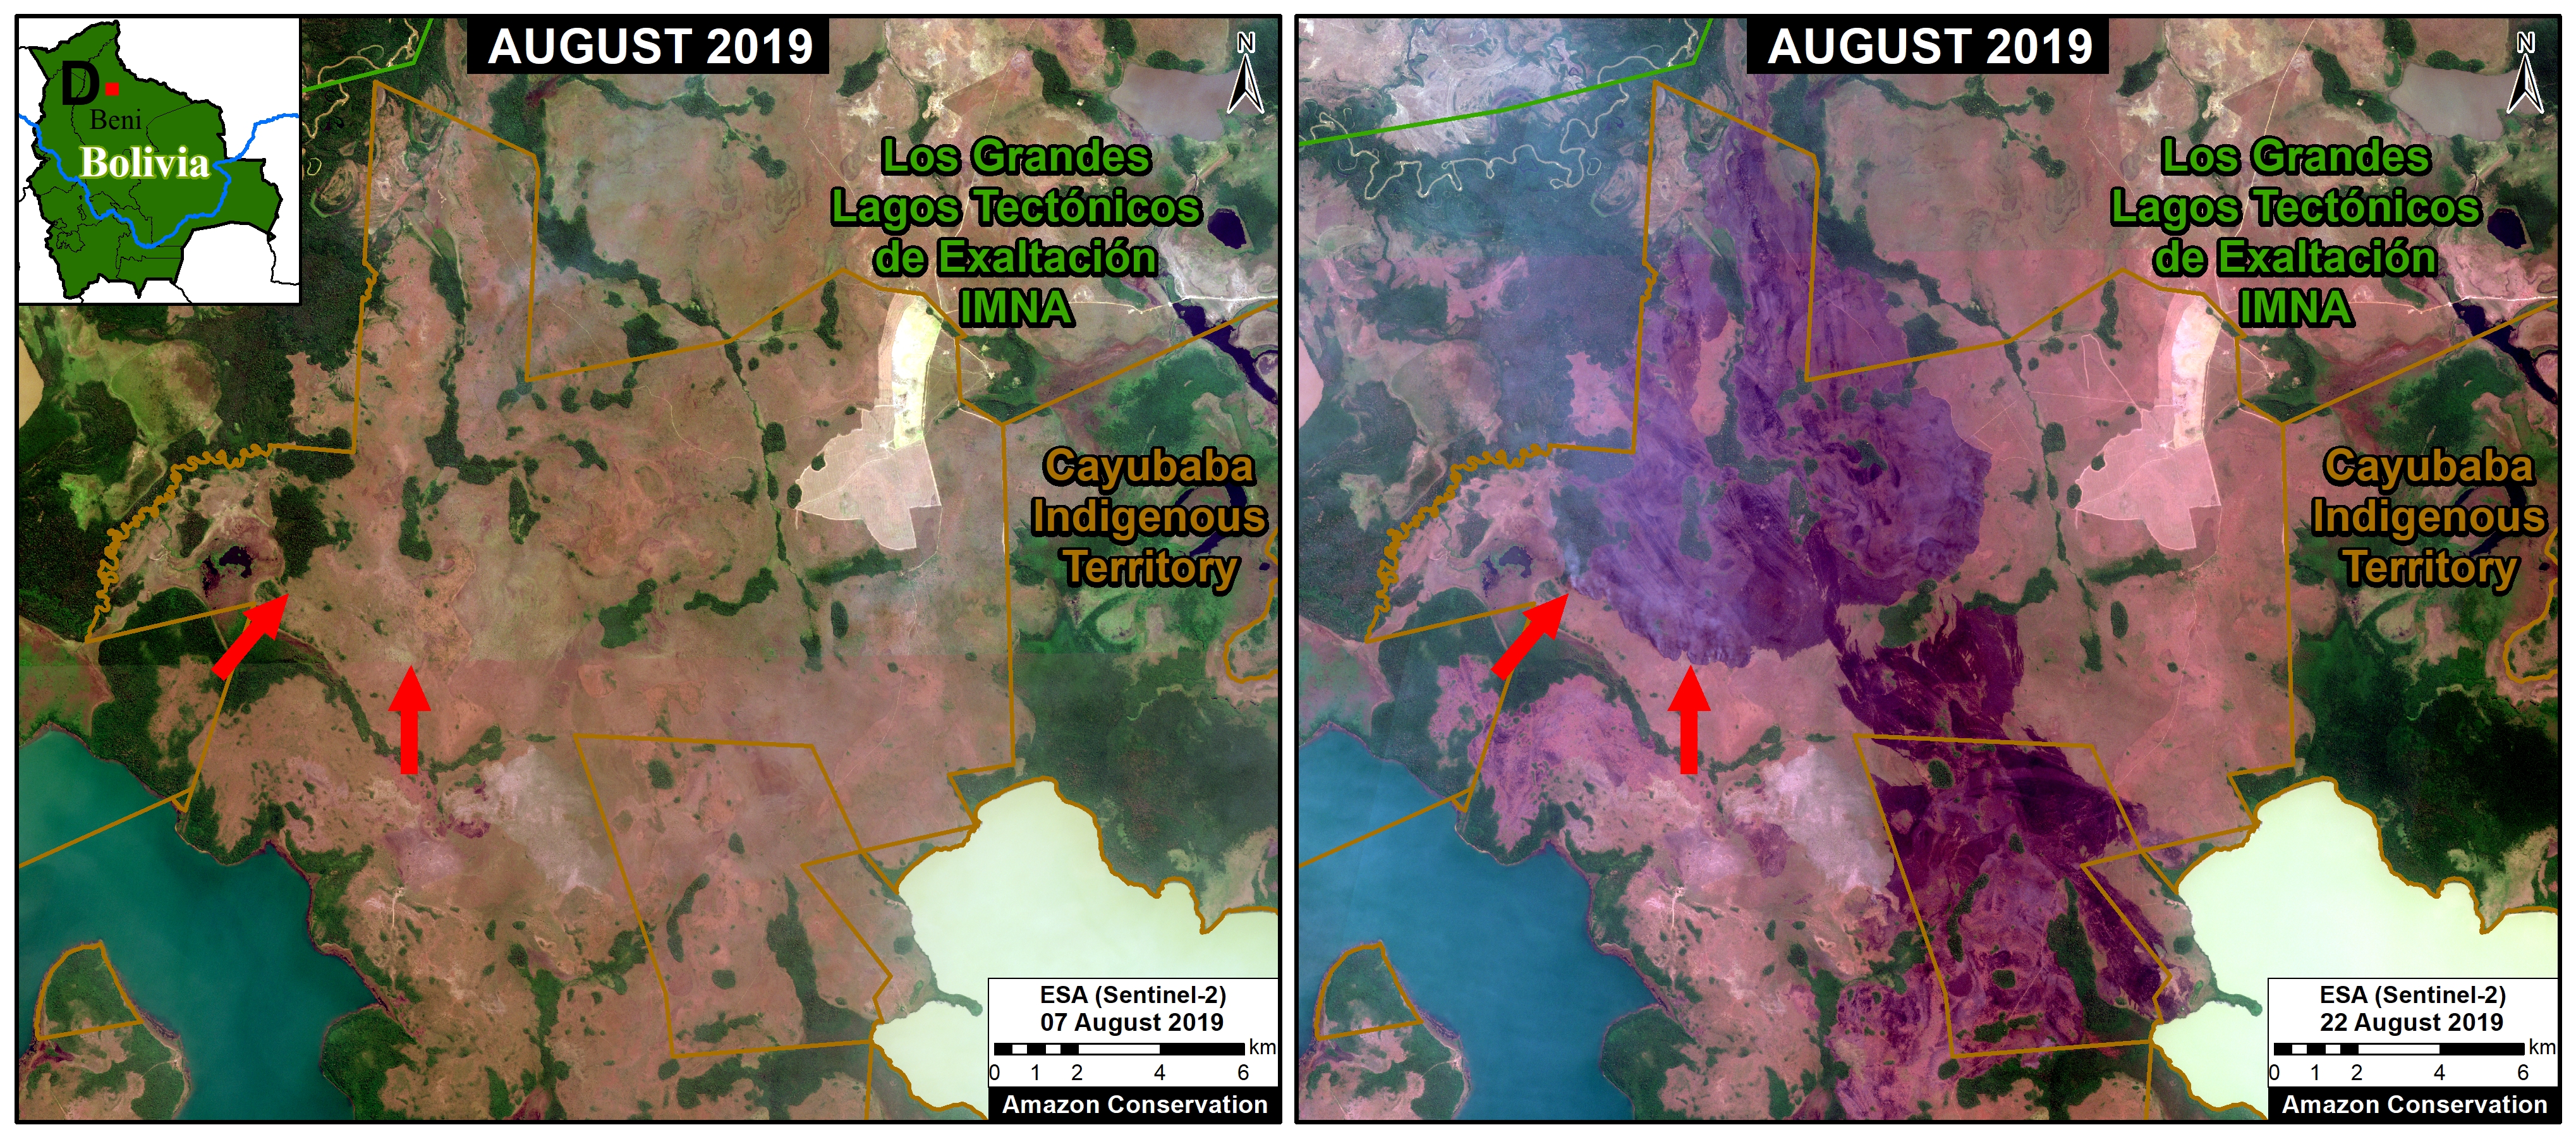
Zoom D: Beni Grasslands (Bolivia)

Zoom D shows recent fires and burned areas in Bolivia’s Beni grasslands.

Zoom D. Recent fires and burned areas in Bolivia’s Beni grasslands. Data: ESA.

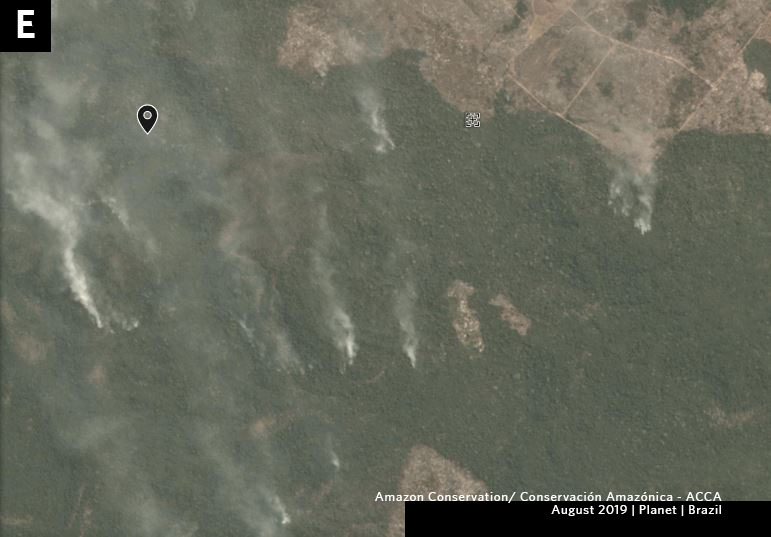
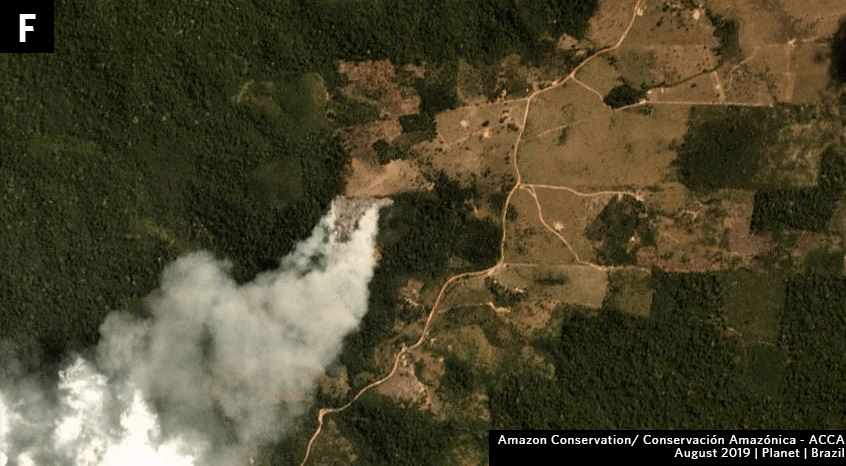
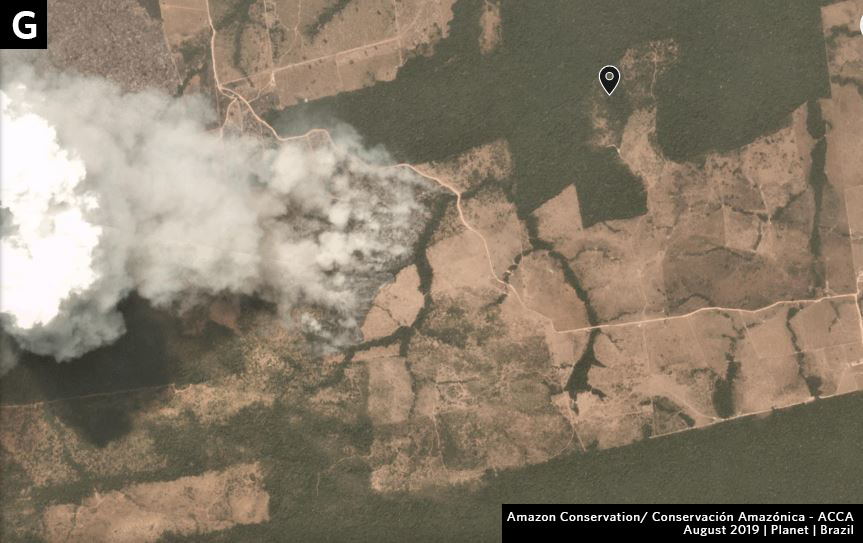
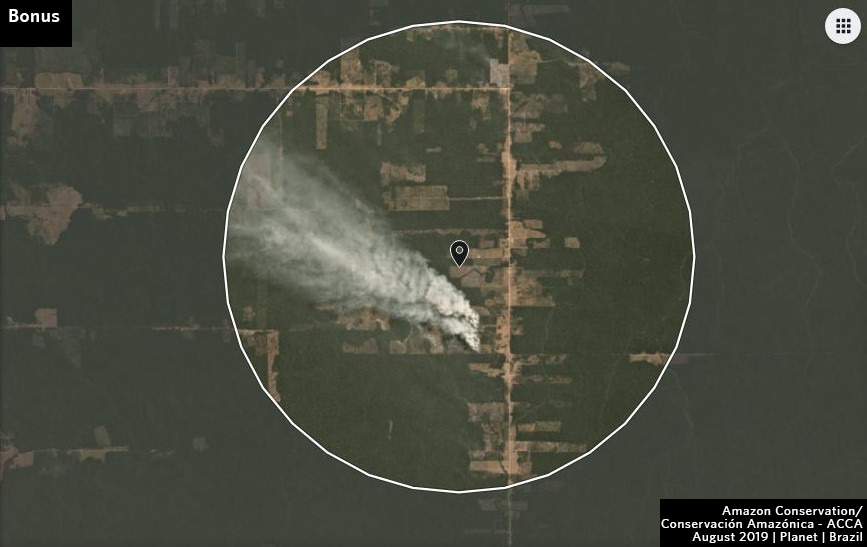
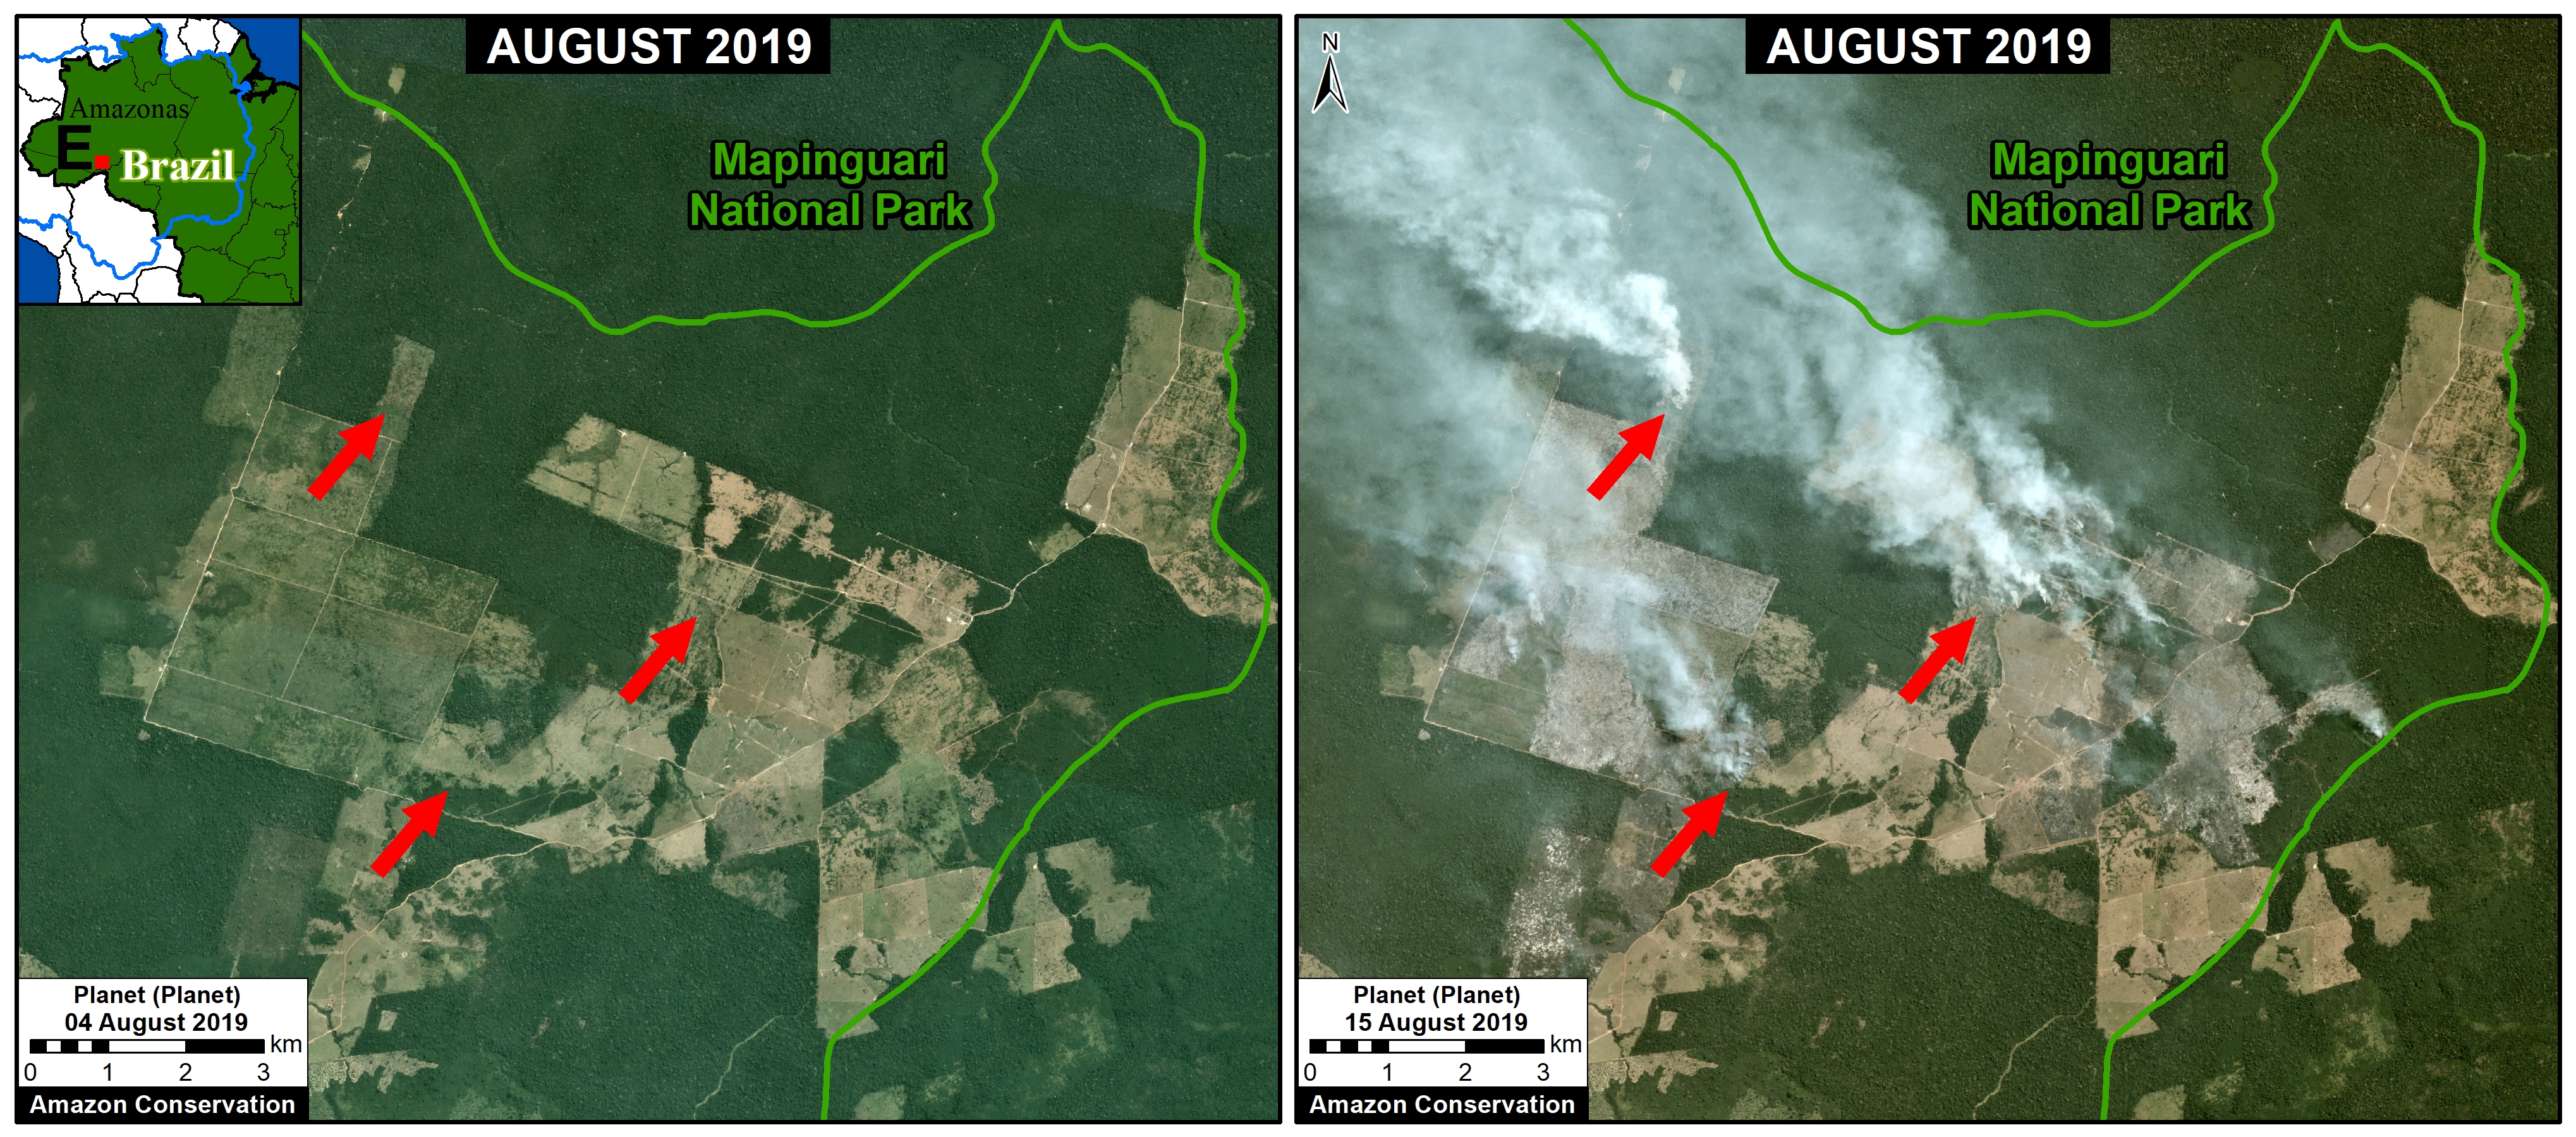
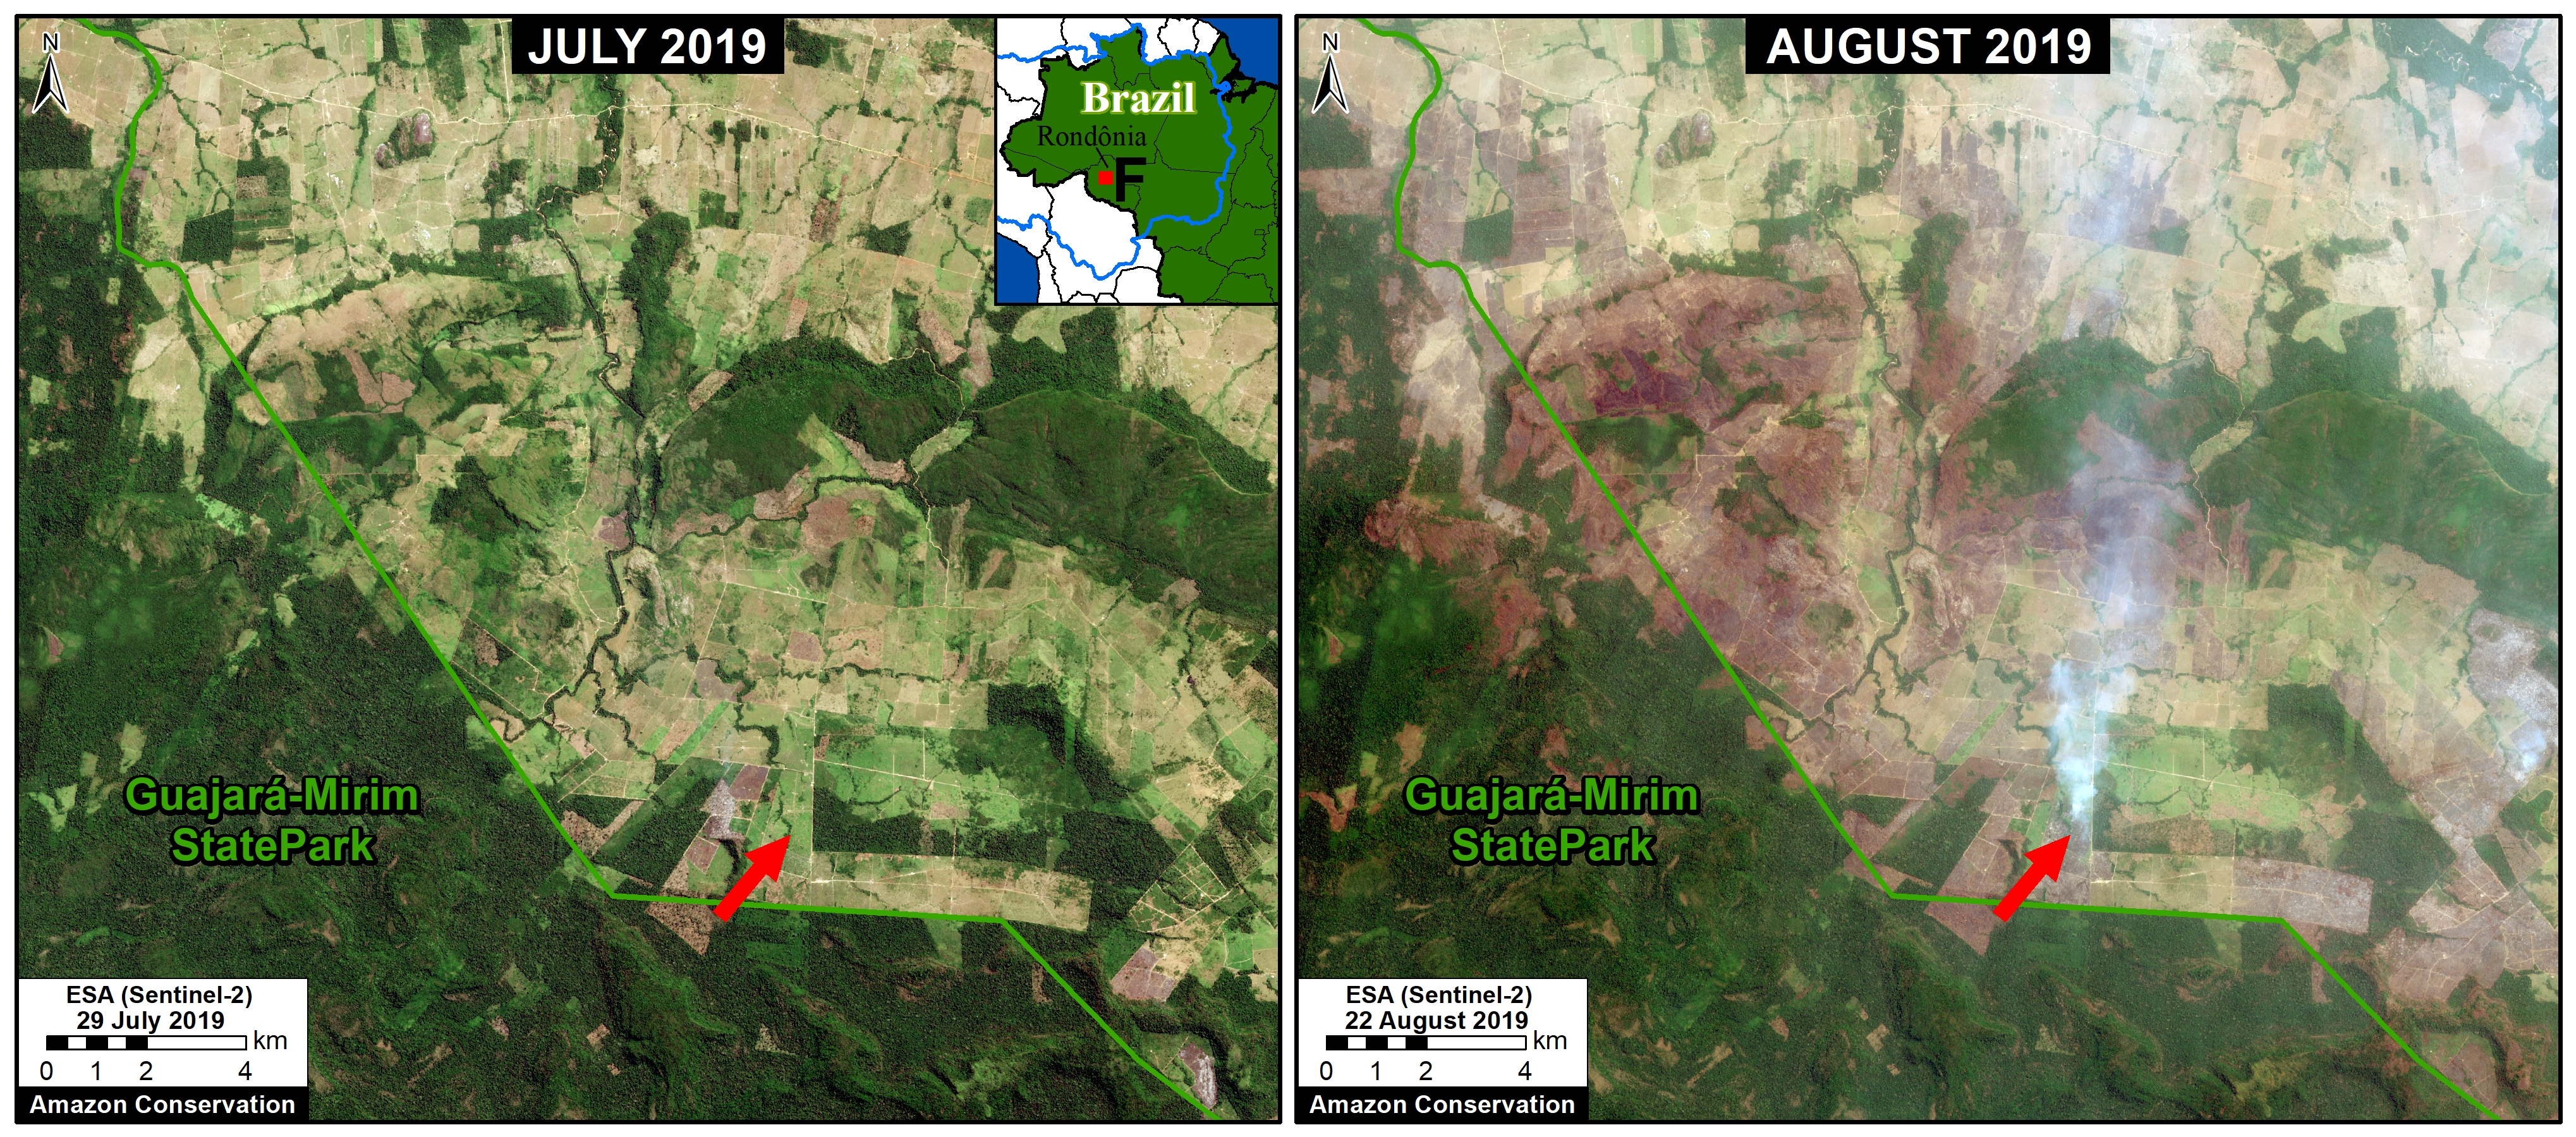
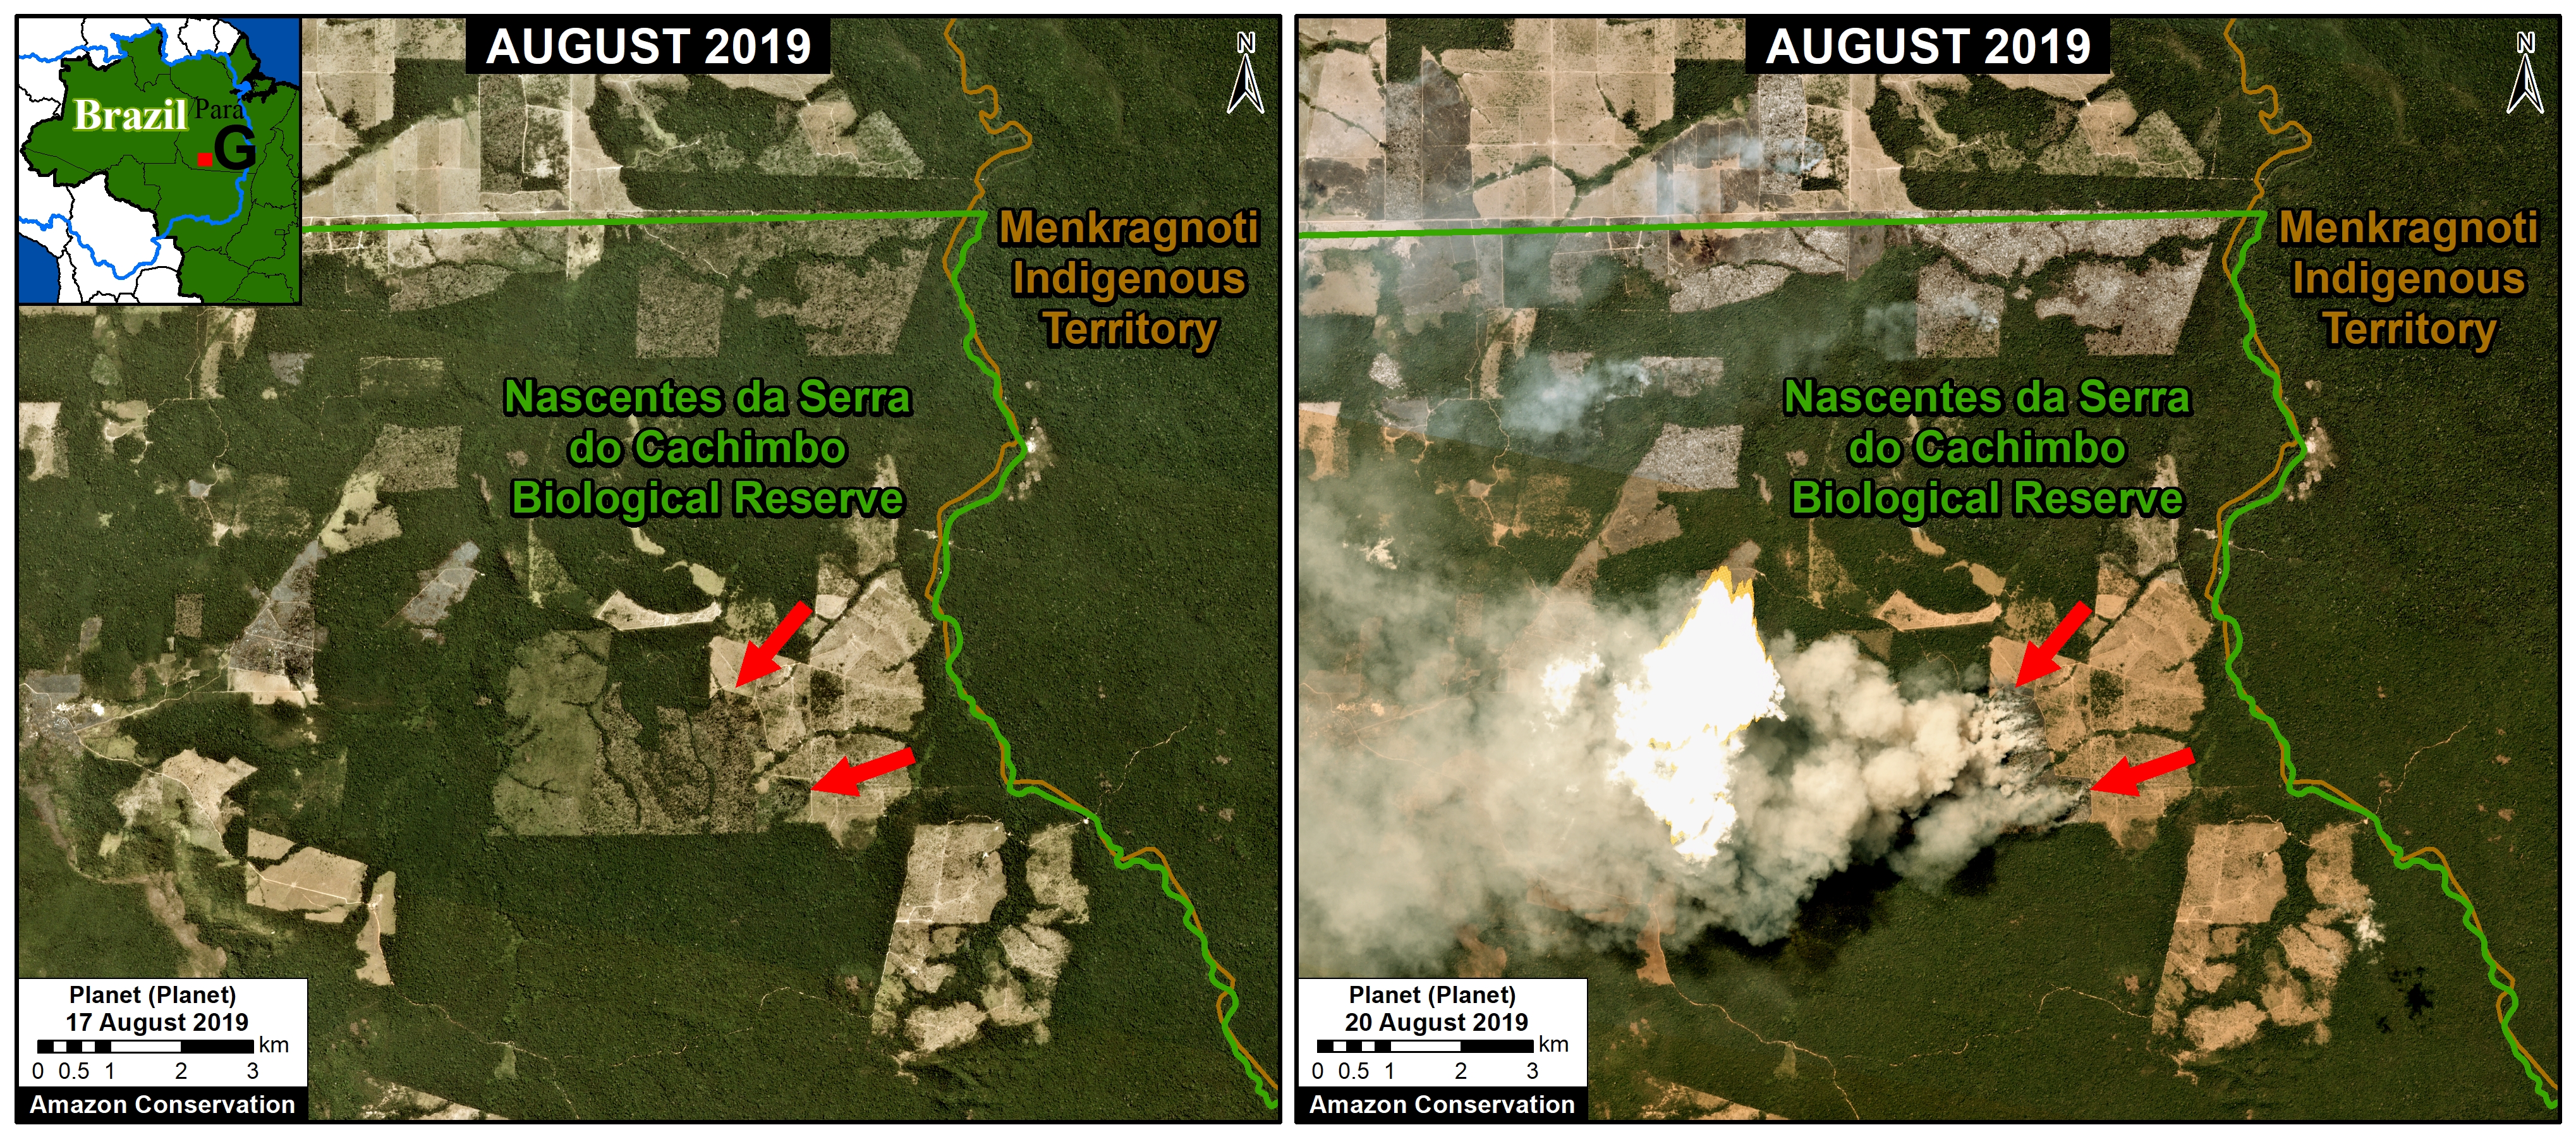
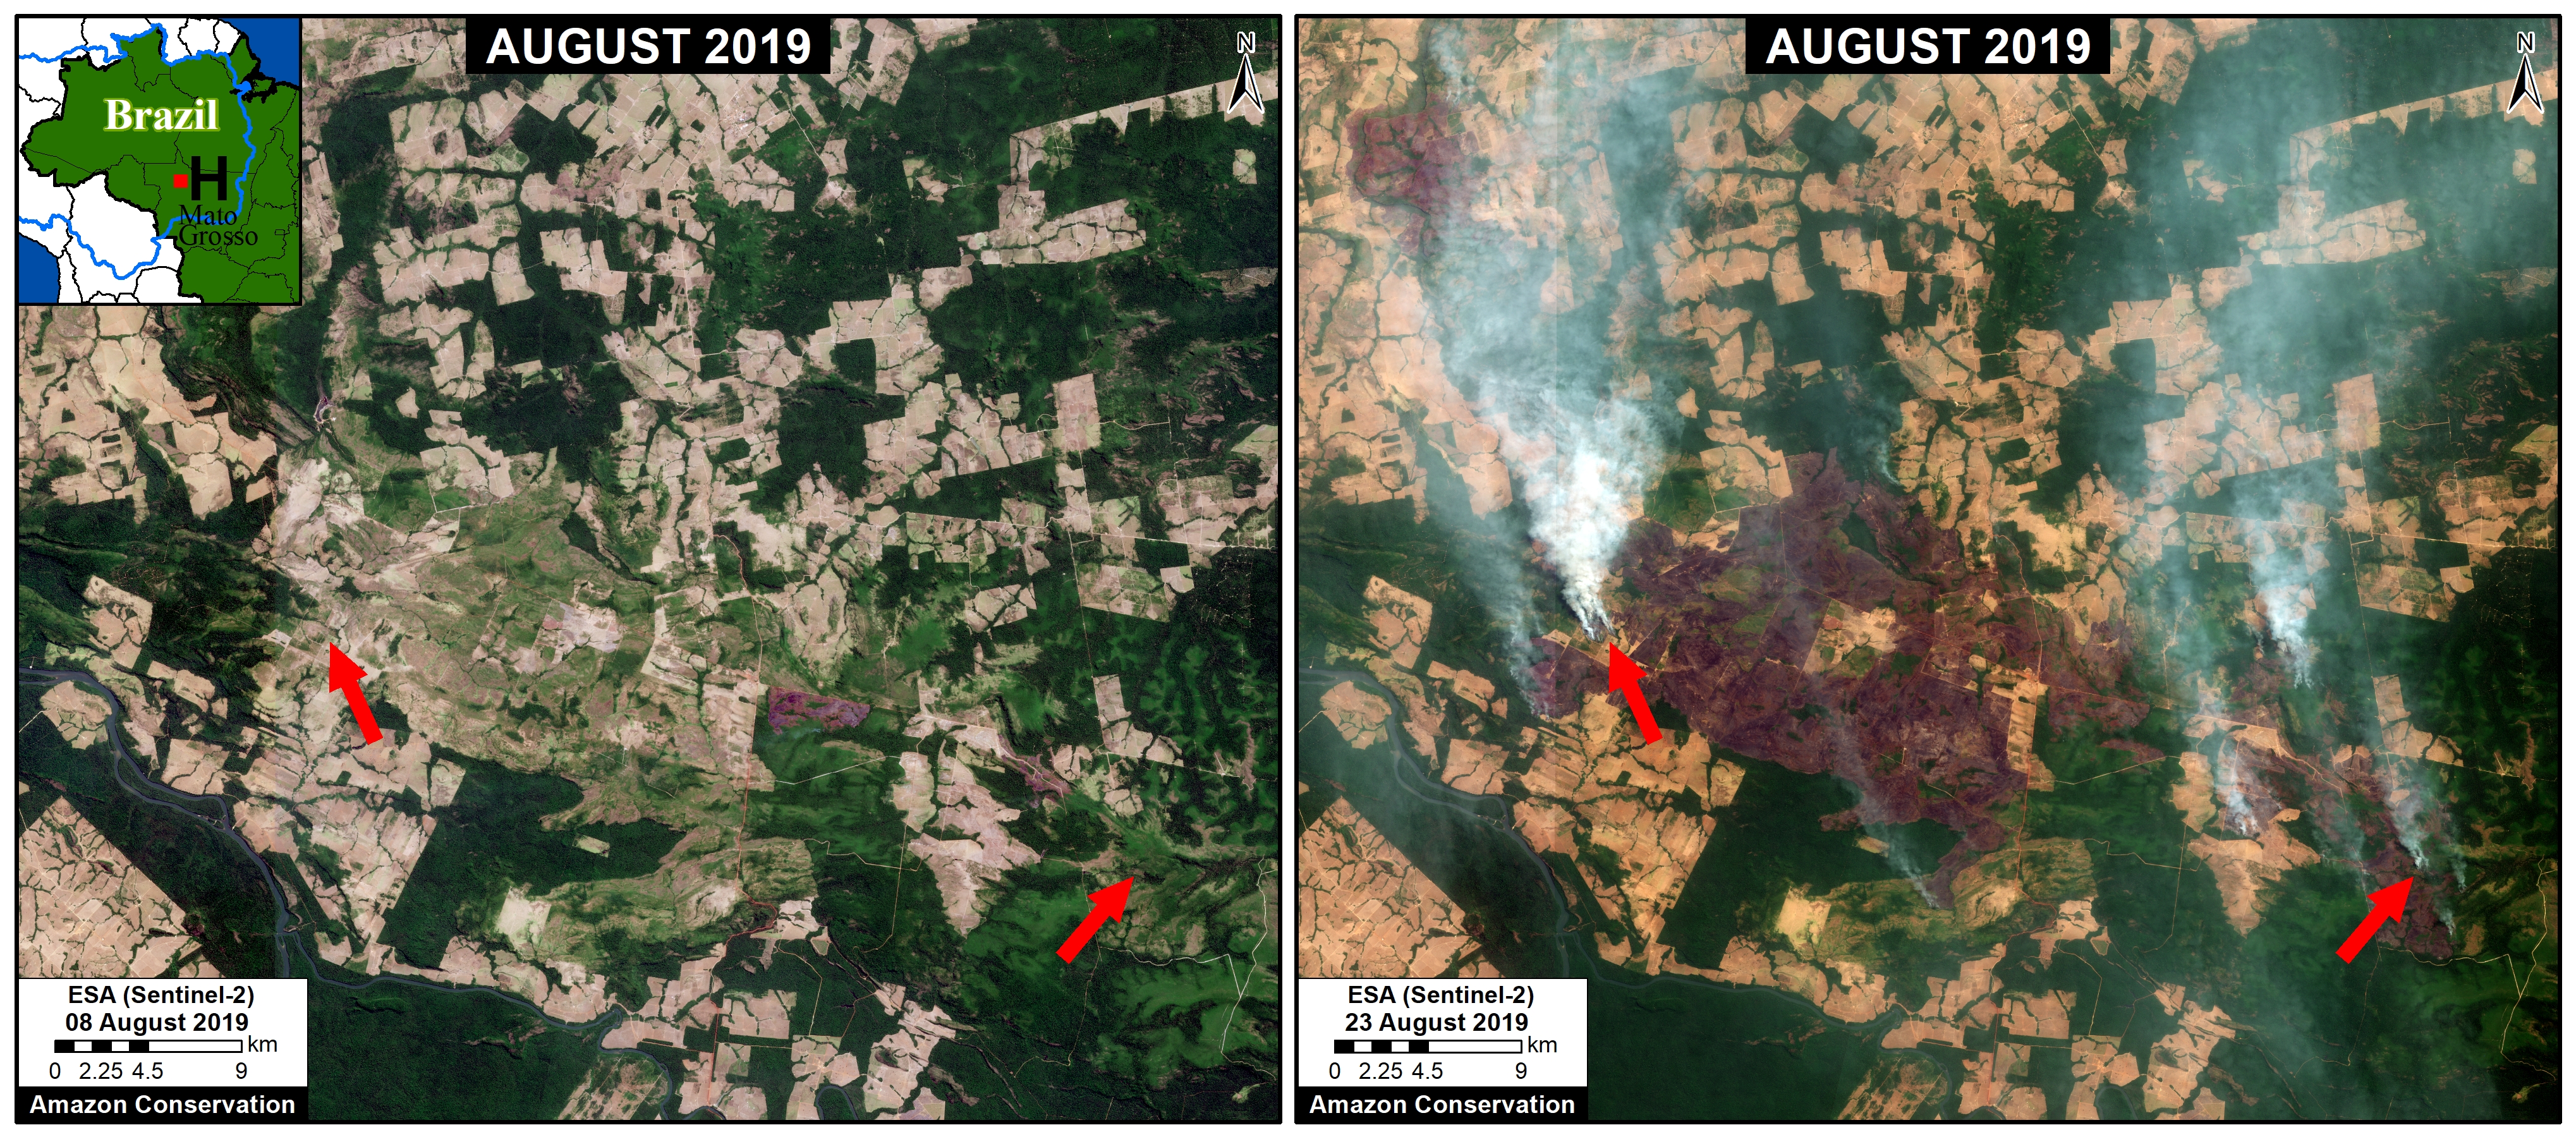
Zooms E,F,G,H: Brazilian Amazon (Amazonas, Rondônia, Pará, Mato Grosso)

Zoom E-H take us to moist forest forests of the Brazilian Amazon, where much of the media and social media attention has been focused. All fires we have seen in this area are in agricultural fields or at the agriculture-forest boundary. Note Zoom E is just outside a national park in Amazonas state; Zoom F shows fires at the agriculture-forest boundary in Rondônia state; Zoom G shows fires at the agriculture-forest boundary within a protected area in Pará state; and Zoom H shows fires at the agriculture-forest boundary in Mato Grosso state.

Zoom E. Fires at the agriculture-forest boundary outside a national park in Amazonas state. Data: Planet.
Zoom F. Fires at the agriculture-forest boundary in Rondônia state. Data: ESA.
Zoom G. Fires at the agriculture-forest boundary within a protected area in Pará state.
Zoom H. Fires at the agriculture-forest boundary in Mato Grosso. Data: ESA.

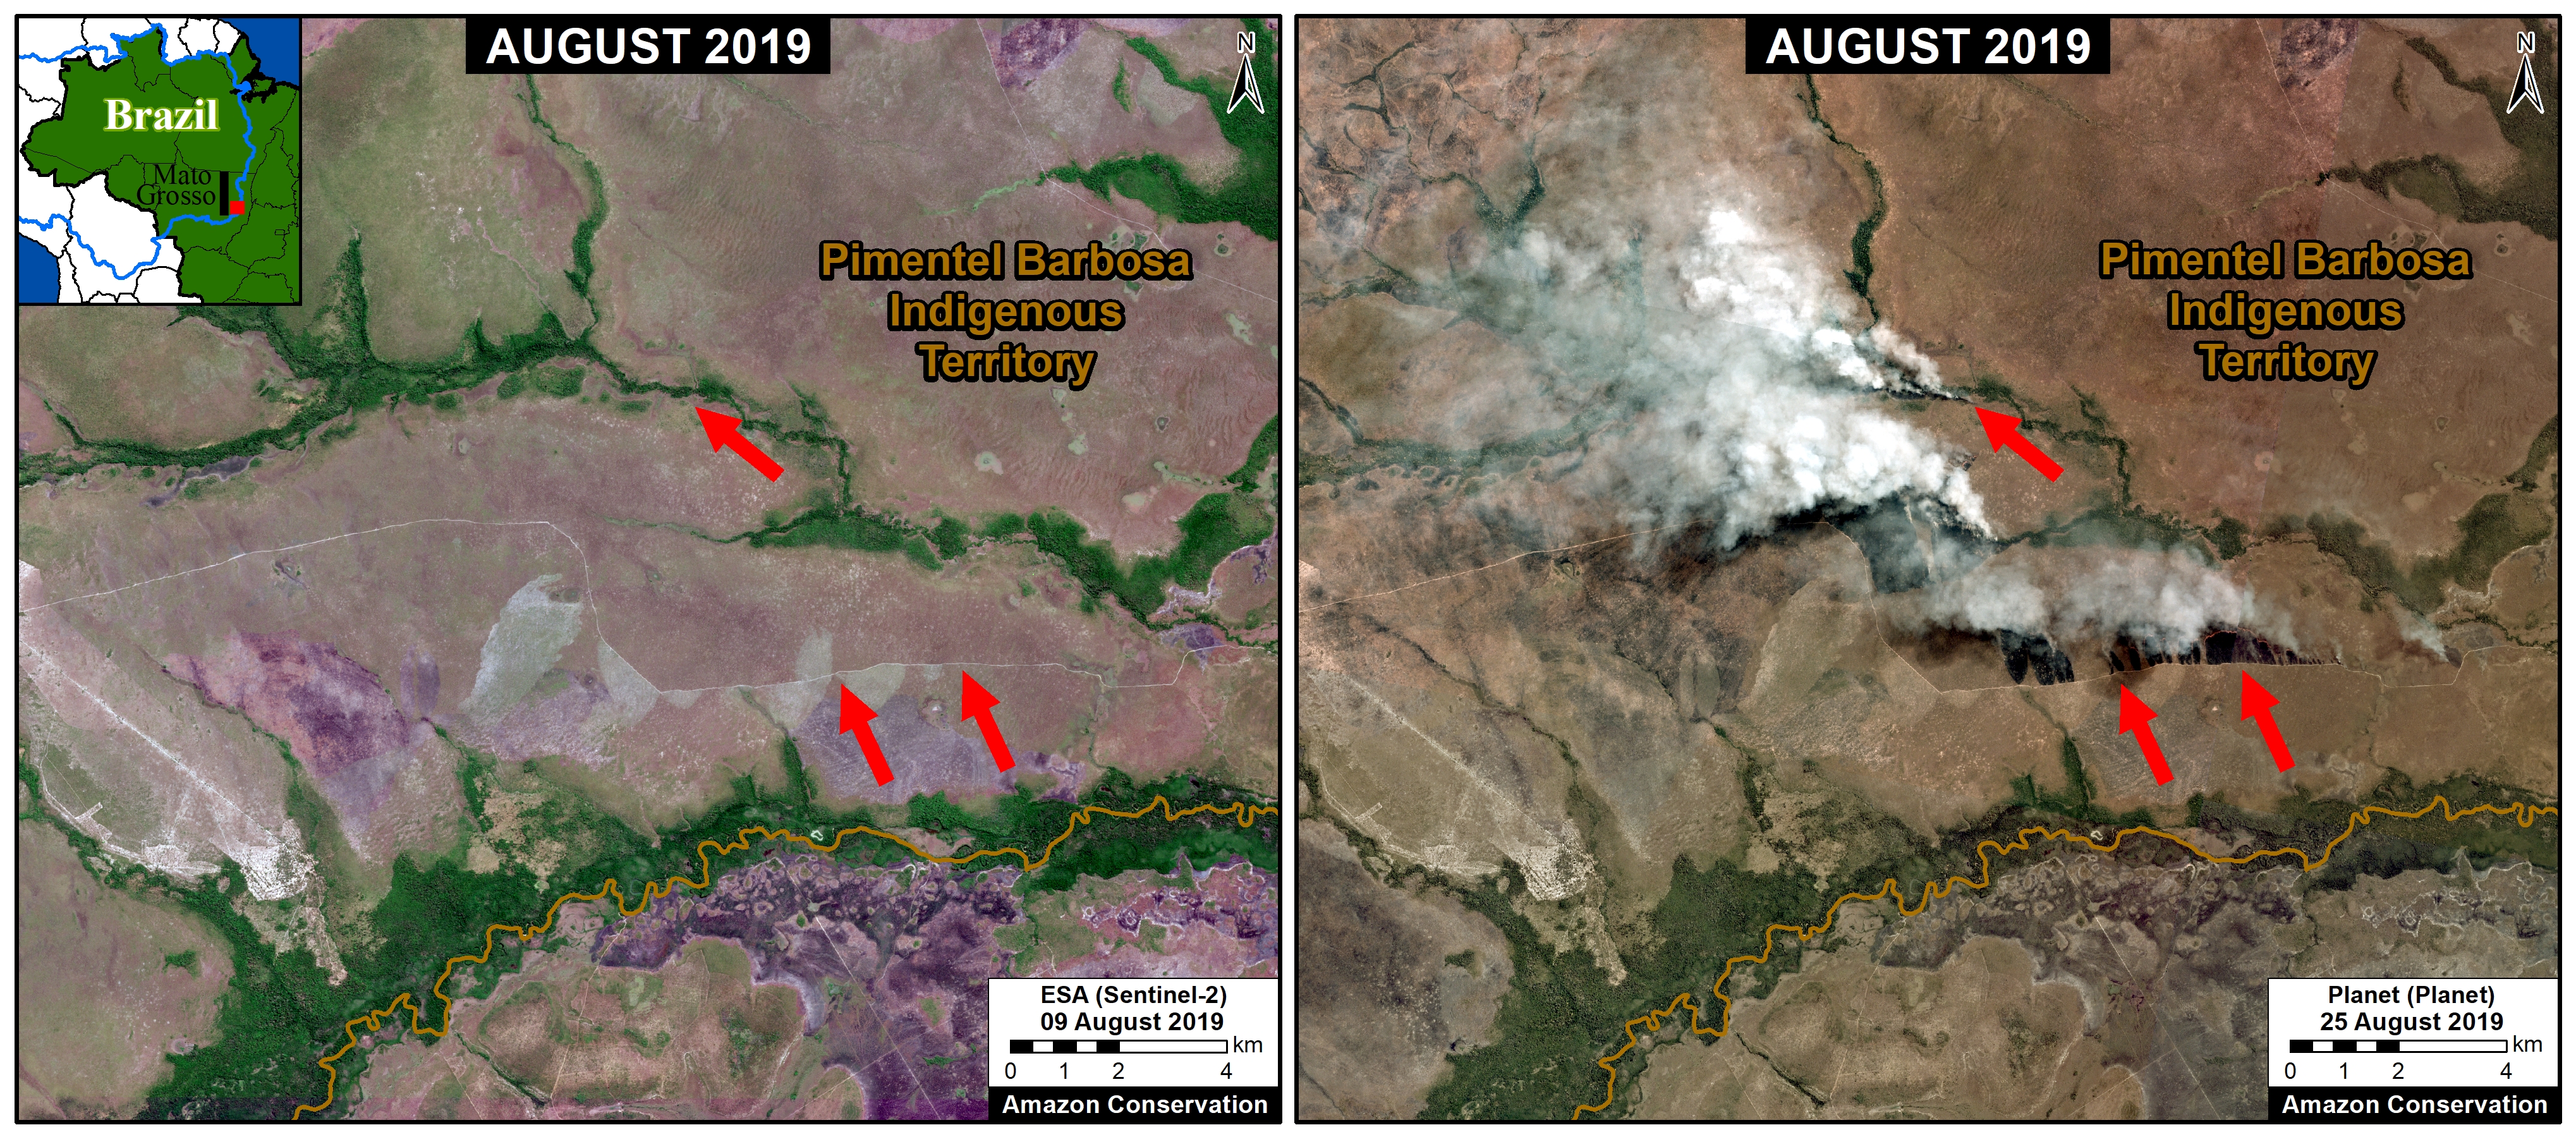
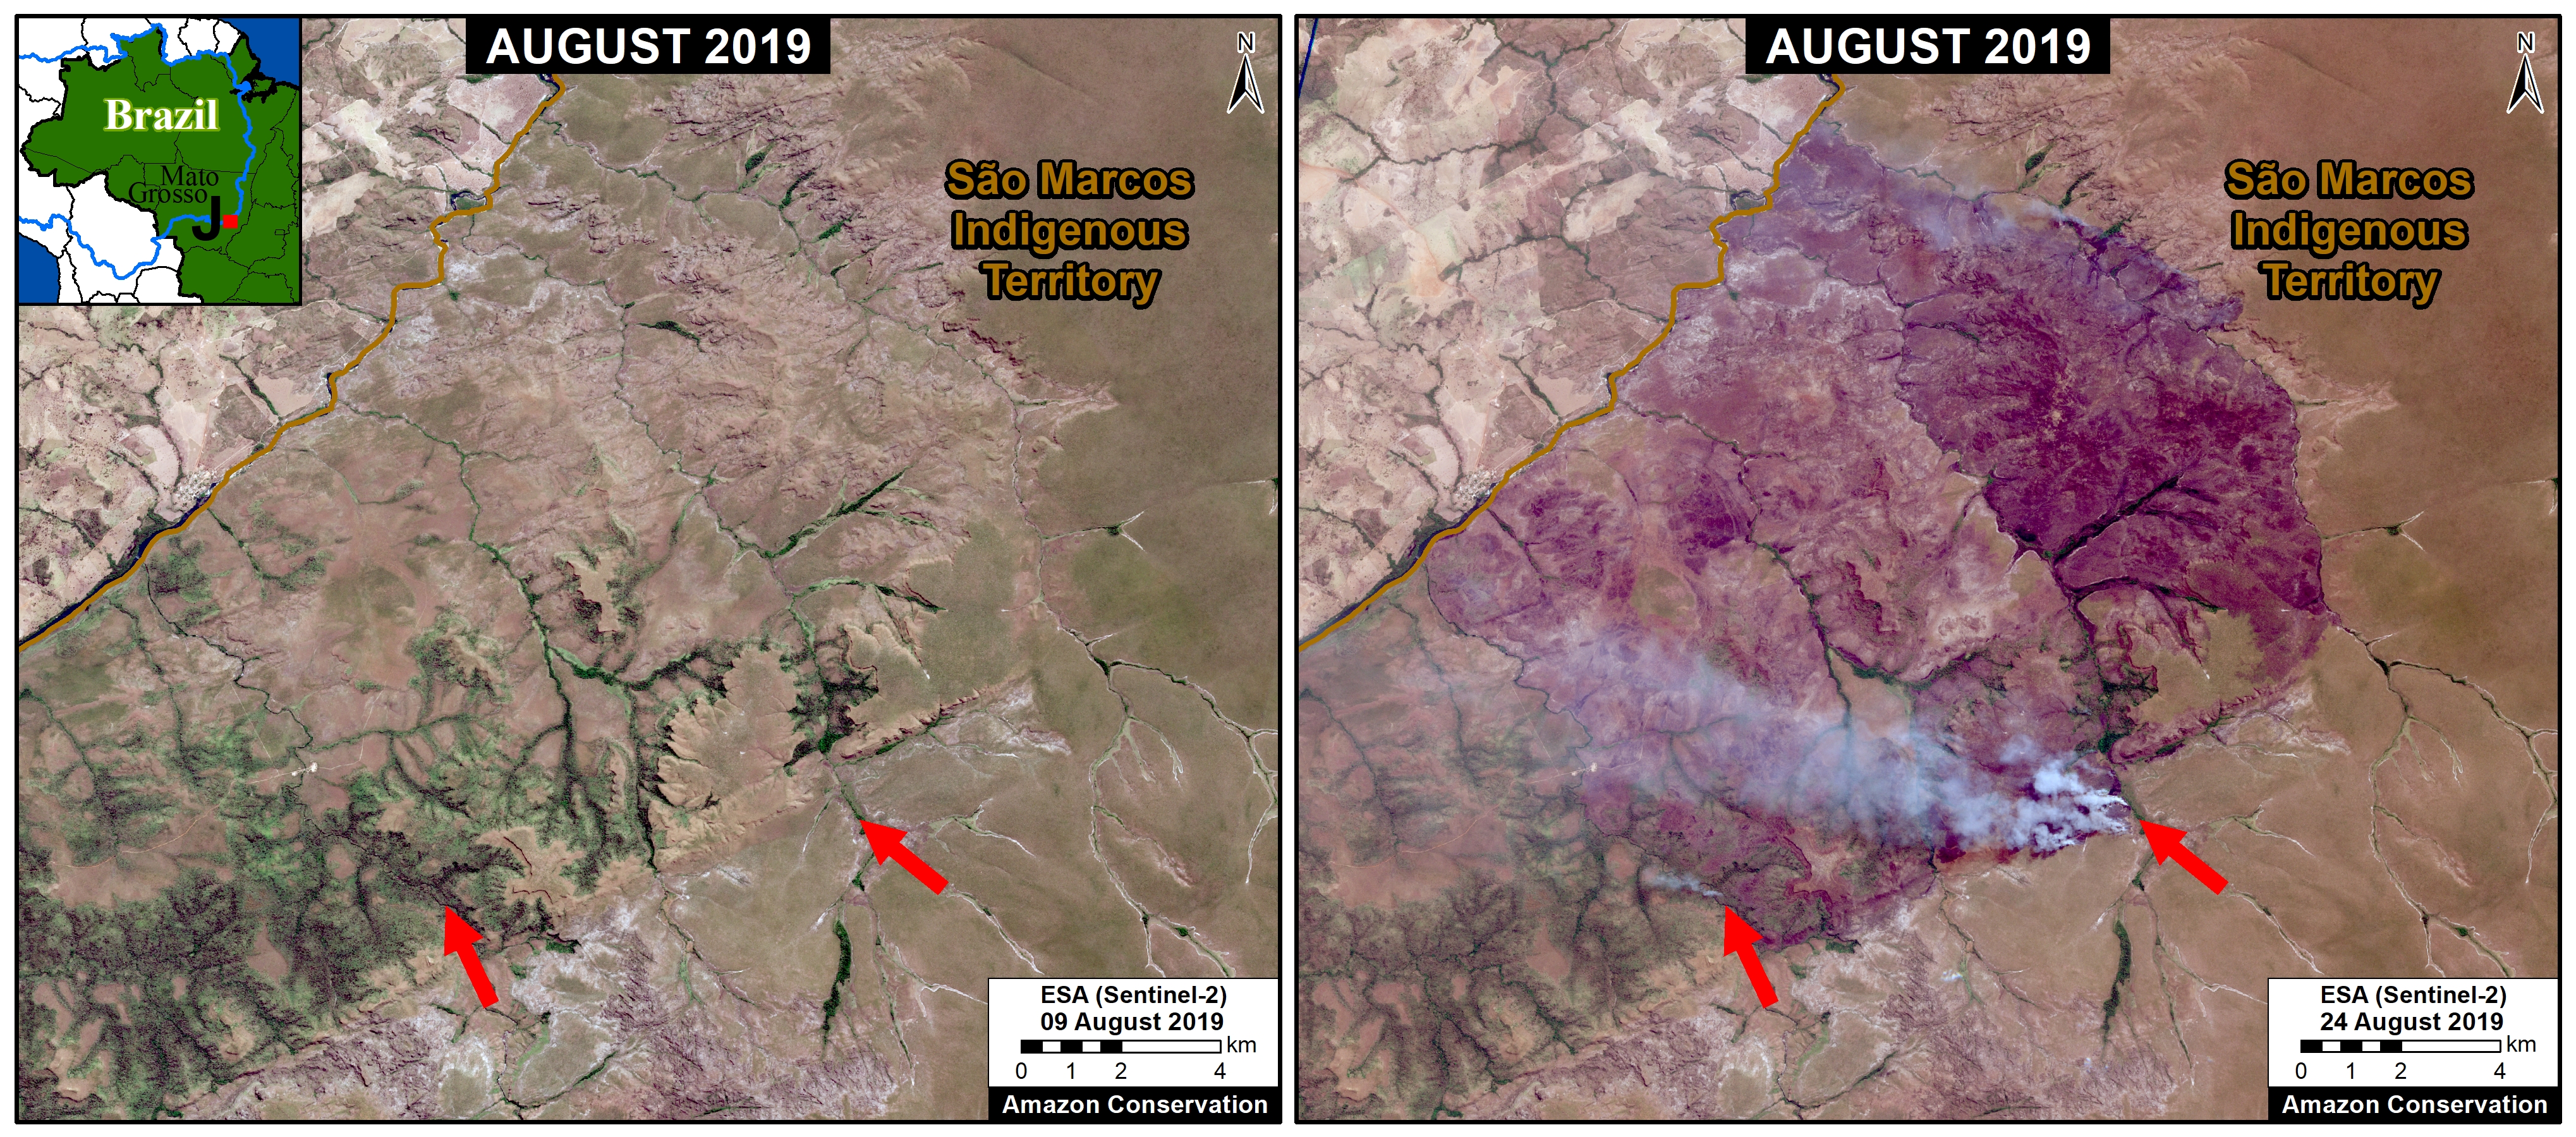
Zooms I, J: Southern Mato Grosso (Brazil)

Zooms I and J shows fires in grassland/scrubland at the drier southern edge of the Amazon Basin. Note both of these fires are within Indigenous Territories.

Zoom I. Fires within an Indigenous Territory at the drier southern edge of the Amazon Basin. Data: Planet.
Zoom J. Fires within an Indigenous Territory at the drier southern edge of the Amazon Basin. Data: Planet.

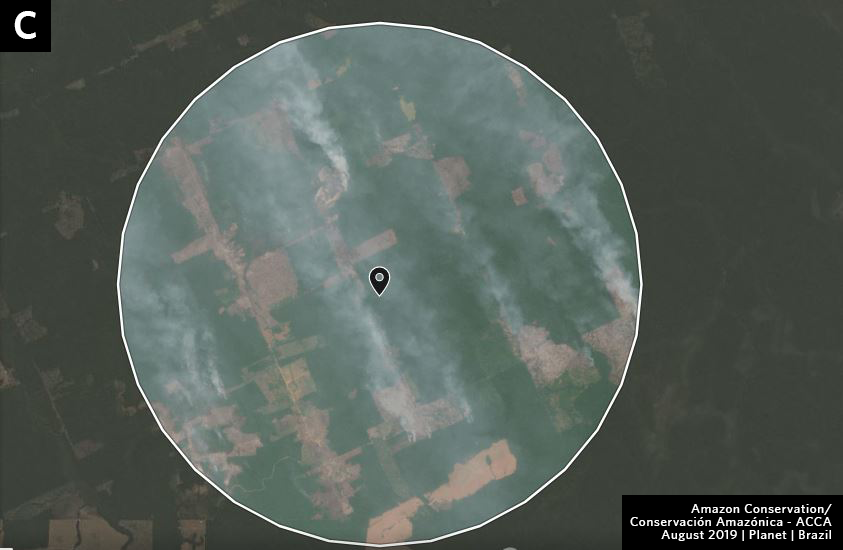
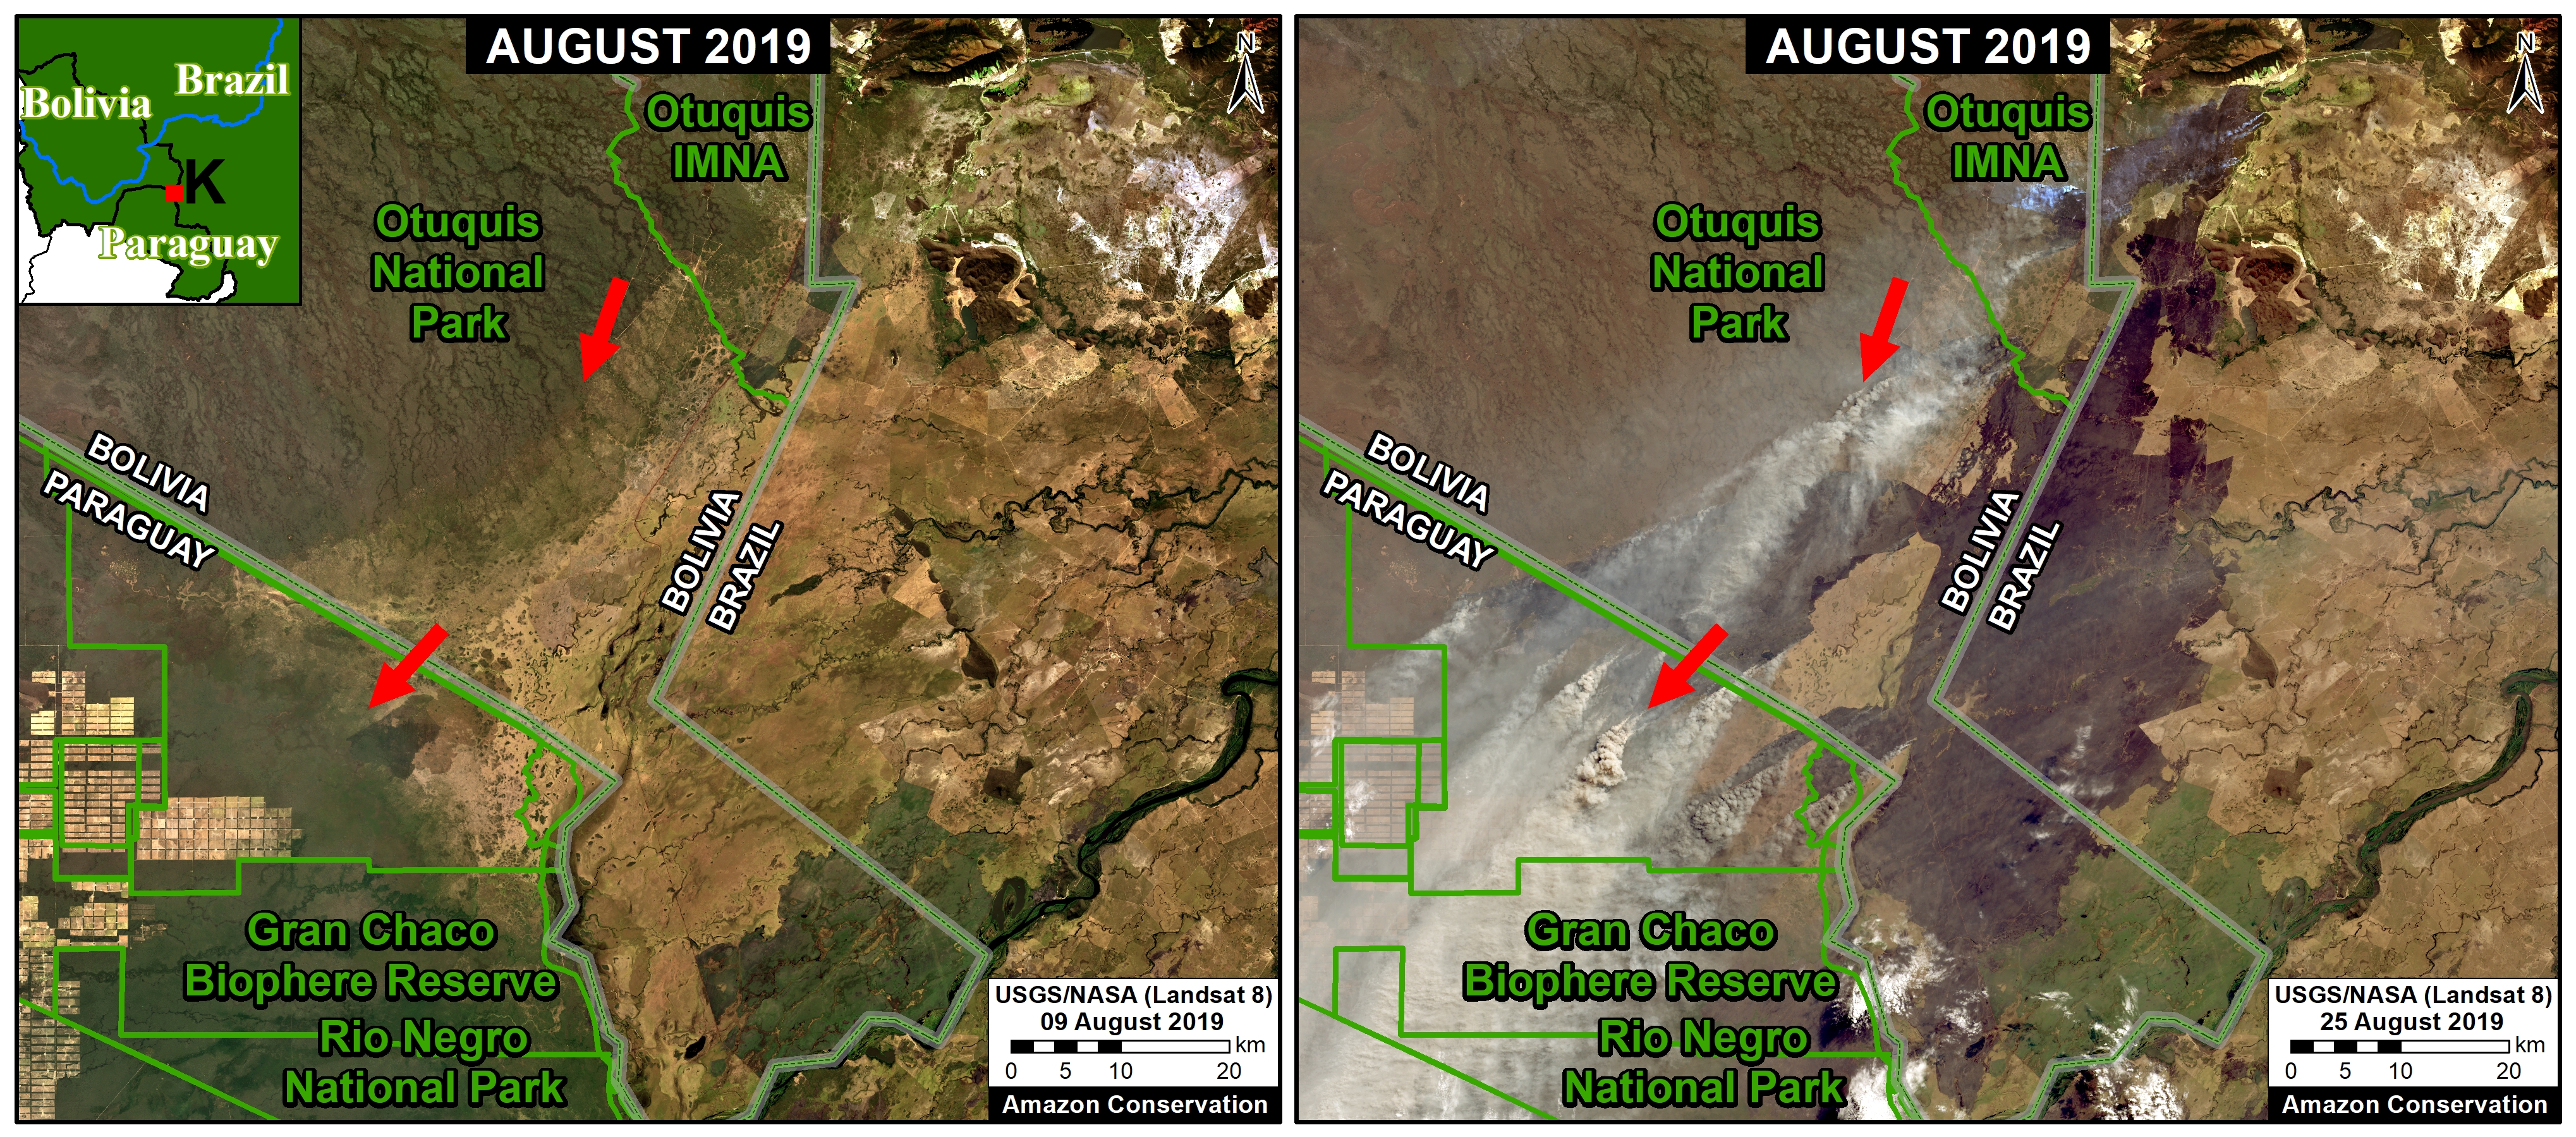
Zooms C, K: Bolivia/Brazil/Paraguay Border

Zooms C and K show large fires burning in the drier ecosytems at the Bolivia-Brazil-Paraguay border. This area is outside the Amazon Basin, but we include it due it’s magnitude.

Zoom C. Recent fires in the dry Chiquitano of southern Bolivia. Data: Planet.
Zoom K. Large fires burning around the Gran Chaco Biosphere Reserve. Data: NASA/USGS.

Acknowledgements

We thank  J. Beavers (ACA), A. Folhadella (ACA), M. Silman (WFU), S. Novoa (ACCA), M. Terán (ACEAA), and D. Larrea (ACEAA) for helpful comments to earlier versions of this report.

This work was supported by the following major funders: MacArthur Foundation, International Conservation Fund of Canada (ICFC), Metabolic Studio, and Global Forest Watch Small Grants Fund (WRI).

Citation

Finer M, Mamani N (2019) Seeing the Amazon Fires with Satellites. MAAP: 108.

MAAP #107: Seeing the Amazon Fires with Satellites

Recent fire (late July 2019) in the Brazilian Amazon. Data: Maxar.

Fires now burning in the Amazon, particularly Brazil and Bolivia, have become headline news and a viral topic on social media.

Yet little information exists on the impact on the Amazon rainforest itself, as many of the detected fires originate in or near agricultural lands.

Here, we advance the discussion on the impact of the fires by presenting the first Base Map of current “fire hotspots” across three countries (Bolivia, Brazil, and Peru). We also present a striking series of satellite images that show what the fires look like in each hotspot and how they are impacting Amazonian forests. Our focus is on the most recent fires in August 2019.

Our key findings include:

  • Fires are burning Amazonian forest in Bolivia, Brazil, and Peru.
    .
  • The fires in Bolivia are concentrated in the dry Chiquitano forests in the southern Amazon.
    .
  • The fires in Brazil are much more scattered and widespread, often associated with agricultural lands. Thus, we warn against using fire detection data alone as a measure of impact as many are clearing fields. However, many of the fires are at the agriculture-forest boundary and maybe expanding plantations or escaping into forest.
    .
  • Although not as severe, we also detected fires burning forest in southern Peru, in an area that has become a deforestation hotspot along the Interoceanic Highway.

Given the nature of the fires in Bolivia and Brazil, estimates of total burned forest area are still difficult to determine. We will continue monitoring and reporting on the situation over the coming days.


Base Map

The Base Map shows “fire hotspots” for the Amazonian regions of Bolivia, Brazil, and Peru in August 2019. The data comes from a NASA satellite that detects fires at 375 meter resolution. The letters (A-G) correlate to the satellite image zooms below.

Base Map. Fire Hotspots in the Amazon during August 2019. Data: VIIRS/NASA.

Zoom A: Southern Bolivian Amazon

Fires are concentrated in the dry Chiquitano of southern Bolivia. It is part of the largest tropical dry forest in the world. The fires coincide with areas that have been part of cattle ranching expansion in recent decades (References 1 and 2), suggesting that poor burning practices could be the cause of the fires. Ranching using sown pastures has previously been referred to as a direct cause of forest loss in Bolivia (References 2 and 3). The Bolivian National Service of Meteorology and Hydrology (SENAMHI) issued high wind alerts in July and August for southern Bolivia, which could have led to the expansion of poorly managed fires. Also, August is usually the driest month of the year in this region. These conditions could explain the origin (poor fire practice) and expansion (little rain and strong winds) of the current fires.

Zoom A1. Fire in southern Bolivian Amazon. Data: ESA
Zoom A2. Fire in southern Bolivian Amazon. Data: ESA
Zoom A3. Fire in southern Bolivian Amazon. Data: Planet

Zooms B, C, E, F, G: Western Brazilian Amazon

The major fires in western Brazil seem to be at the agriculture-forest boundary. Note that Zoom B shows fire in a protected area in Amazonas state; Zoom C seems to show fire escaping (or deliberately set) in the primary forests in Rondonia state; and Zooms F and G seems to show fire expanding plantation into forest in Amazonas and Mato Grosso states, respectively.

Zoom B. Fire in a protected area in Amazonas state. Data: ESA
Zoom C. Fires at agriculture-forest boundary in Rondonia state. Data: Sentinel.
Zoom E. Fire escaping (or deliberately set) in the primary forests in Rondonia state. Data: Planet
Zoom F. Fire that seems to be expanding plantation into forest in Amazonas state. Data: Planet.
Zoom G. Fire that seems to be expanding plantation into forest in Mato Grosso state. Data: Planet.
Bonus Zoom. Recent fire in Brazilan Amazon. Data: Planet.


Zoom D: Southern Peruvian Amazon

Fires burning forest near the town of Iberia, an area along the Interoceanic Highway that has become a deforestation hotspot in the region of Madre de Dios (see MAAP #28 and MAAP #47).

Zoom D. Fire in southern Peruvian Amazon (near Iberia, Madre de Dios). Data: ESA

Additonal References

We have these to be some of the most informative additional references:

New York Times, Aug 24

Global Forest Watch, Aug 23

Technical References

1 Müller, R., T. Pistorius, S. Rohde, G. Gerold & P. Pacheco. 2013. Policy options to reduce deforestation based on a systematic analysis of drivers and agents in lowland Bolivia. Land Use Policy 30(1): 895-907. http://dx.doi.org/10.1016/j. landusepol.2012.06.019

2 Muller, R., Larrea-Alcázar, D.M., Cuéllar, S., Espinoza, S. 2014.  Causas directas de la deforestación reciente (2000-2010) y modelado de dos escenarios futuros  en las tierras bajas de Bolivia. Ecología en Bolivia 49: 20-34.

3 Müller, R., P. Pacheco & J. C. Montero. 2014. El contexto de la deforestación y degradación de los bosques en Bolivia: Causas, actores e instituciones. Documentos Ocasionales CIFOR 100, Bogor. 89 p.

Acknowledgements

We thank  J. Beavers, D. Larrea, T. Souto, M. Silman, A. Condor, and G. Palacios for helpful comments to earlier versions of this report.

This work was supported by the following major funders: MacArthur Foundation, International Conservation Fund of Canada (ICFC), Metabolic Studio, and Global Forest Watch Small Grants Fund (WRI).

Citation

Novoa S, Finer M (2019) Seeing the Amazon Fires with Satellites. MAAP: 107.

MAAP #106: Deforestation impacts 4 protected areas in the Colombian Amazon (2019)

Table 1. Deforestation in the Colombian Amazon. Data: Hansen/UMD/Google/USGS/NASA

We continue our focus on the northwest Colombian Amazon,* one of the most intense deforestation hotspots in the western Amazon (see MAAP# 100).

Here, we analyze deforestation data over the past five years (2015-19) to better understand current trends and patterns.

We found a major increase in deforestation as of 2016. The Colombian Amazon lost nearly 1.2 million acres (478,000 hectares) of forest between 2016 and 2018. Of this, 73% (860,000 acres) was primary forest (see Table 1).

One of the main deforestation drivers in the region is conversion to pasture for land grabbing or cattle ranching.

Next, we provide a real-time update of 2019, based on early warning forest alerts (GLAD alerts) from the University of Maryland/Global Forest Watch), updated through July 25, 2019.

*MAAP in Colombia represents a collaboration between Amazon Conservation and its Colombian partner, the Foundation for Conservation and Sustainable Development (FCDS).”

Base Map. Deforestation hotspots in Colombian Amazon. Data: UMD/GLAD, RUNAP, RAISG

Deforestation 2019

The GLAD alerts estimate the additional loss of 150,000 acres (60,654 hectares) in the first 7 months of 2019 (through end of July). Of  this, 75% (113,000 acres) was primary forest.

The Base Map shows that 2019 deforestation primarily impacts 4 protected areas* in the northwest Colombian Amazon: Tinigua, Serranía de Chiribiquete, and Sierra de la Macarena National Parks, and Nukak National Reserve.

Next, we detail the recent deforestation in these four protected areas of the Colombian Amazon, including the presentation of a series of satellite-based images.

*There are other protected areas in the Colombian Amazon with recent deforestation (such as Picachos and La Paya National Parks), but here we focus on the four with the highest deforestation thus far during 2019.


Protected Areas Zoom Map. Deforestation in four protected areas of the Colobian Amazon. Data: UMD/GLAD, Hansen/UMD/Google/USGS/NASA, RUNAP, RAISG

Deforestation in Protected Areas

We conducted a deforestation analys within the 4 protected areas noted above (Chiribiquete, Tinigua, Macarena, and Nukak), generating the following key results:

  • From 2016-18, deforestation claimed over  70,000 acres (29,000 ha) in the four protected areas, 86% of which were primary forests (62,000 acres).
    .
  • Thus far in 2019 (through July 25), deforestation claimed an additional 10,600 acres (4,300 ha), 87% of which were primary forests (9,200 acres).
    .
  • Tinigua National Park has been the most impacted protected area, as deforestation claimed 39,500 acres (16,000 ha) from 2017-19 (96% of which were primary forests). Note the major deforestation spike in 2018.
    .
  • Deforestation has claimed 6,400 acres (2,600 ha) in Chiribiquete National Park since its expansion in July 2018 (96% of which were primary forests).

Zoom A: Deforestation in Tinigua, Chiribiquete, and Macarena National Parks

See location of Zooms A-C in Protected Areas Zoom Map above. Data updated through July 25, 2019.

Zoom A. Deforestation in Tinigua, Serranía de Chiribiquete, and Sierra de la Macarena National Parks, *through July 25, 2019. Data: UMD/GLAD, Hansen/UMD/Google/USGS/NASA, RUNAP, RAISG

Zoom B. Deforestation in Chiribiquete National Park (western sector)

Zoom B. Deforestation Serranía de Chiribiquete National Park (western sector), *through July 25, 2019. Data: UMD/GLAD, Hansen/UMD/Google/USGS/NASA, RUNAP, RAISG

Zoom C. Deforestation in Nukak National Reserve

Zoom C. Deforestation in Nukak National Reserve *through July 25, 2019. Data: UMD/GLAD, Hansen/UMD/Google/USGS/NASA, RUNAP, RAISG

Annex 1: Table
Deforestation of Primary Forest in four protected areas (2015-18)

Annex 2: Map
Deforestation of Primary Forest in four protected areas (2016-19)

Annex 2. Data: Turubanova 2018, UMD/GLAD, Hansen/UMD/Google/USGS/NASA, RUNAP, RAISG

Methodology

We primarily used data generated by the GLAD laboratory of the University of Maryland, available on Global Forest Watch. This data is based on moderate resolution Landsat imagery (30 m). For 2017-18, we analyzed annual data (Hansen et al 2013), and for 2019 we analyzed GLAD alerts (Hansen et al 2016).

For our deforestation estimates, we multiplied the annual “forest cover loss” data by the density percentage of the “tree cover” from the year 2000 (values >30%). Including this percentage allows us to look at the precise area of each pixel, thus improving the preciseness of the results.

We define primary forest as “mature natural humid tropical forest cover that has not been completely cleared and regrown in recent history,” following the definition from Turubanova et al 2018. For our primary forest deforestation estimates, we intersected the forest cover loss data with the additional dataset “primary humid tropical forests” as of 2001 (Turubanova et al 2018). For more details on this part of the methodology, see the Technical Blog from Global Forest Watch (Goldman and Weisse 2019).

All data were processed under the geographical coordinate system WGS 1984. To calculate the areas in metric units the UTM (Universal Transversal Mercator) projection was used: Colombia 18 North.

To identify the deforestation hotspots in the Base Map, we conducted a kernel density estimate. This type of analysis calculates the magnitude per unit area of a particular phenomenon, in this case forest cover loss. We conducted this analysis using the Kernel Density tool from Spatial Analyst Tool Box of ArcGIS. We used the following parameters:

Search Radius: 15000 layer units (meters)
Kernel Density Function: Quartic kernel function
Cell Size in the map: 200 x 200 meters (4 hectares)
Everything else was left to the default setting.

For the Base Map, we used the following concentration percentages: Medium: 10%-25%; High: 26%-50%; Very High: >50%.

References

Hansen, M. C., P. V. Potapov, R. Moore, M. Hancher, S. A. Turubanova, A. Tyukavina, D. Thau, S. V. Stehman, S. J. Goetz, T. R. Loveland, A. Kommareddy, A. Egorov, L. Chini, C. O. Justice, and J. R. G. Townshend. 2013. “High-Resolution Global Maps of 21st-Century Forest Cover Change.” Science 342 (15 November): 850–53.

Hansen, M.C., A. Krylov, A. Tyukavina, P.V. Potapov, S. Turubanova, B. Zutta, S. Ifo, B. Margono, F. Stolle, and R. Moore. 2016. Humid tropical forest disturbance alerts using Landsat data. Environmental Research Letters, 11 (3).

Hansen, M.C., A. Krylov, A. Tyukavina, P.V. Potapov, S. Turubanova, B. Zutta, S. Ifo, B. Margono, F. Stolle, and R. Moore. 2016. Humid tropical forest disturbance alerts using Landsat data. Environmental Research Letters, 11 (3).

Turubanova S., Potapov P., Tyukavina, A., and Hansen M. (2018) Ongoing primary forest loss in Brazil, Democratic Republic of the Congo, and Indonesia. Environmental Research Letters.

Acknowledgements

We thank R. Botero (FCDS), A. Rojas (FCDS) y G. Palacios for helpful comments to earlier versions of this report.

This work was supported by the following major funders: MacArthur Foundation, International Conservation Fund of Canada (ICFC), Metabolic Studio, and Global Forest Watch Small Grants Fund (WRI).

Citation

Finer M, Mamani N (2019) Deforestation impacts 4 protected areas in the Colombian Amazon (2019). MAAP: 106.

MAAP #105: From satellite to drone to legal action in the Peruvian Amazon

ACOMAT member flying a drone for monitoring. Source: ACCA.

Amazon Conservation, in collaboration with its Peruvian sister organization, is implementing a project aimed at linking cutting-edge technology (satellites and drones) with legal action, in the southern Peruvian Amazon (Madre de Dios region).

The project is building a comprehensive deforestation monitoring system with a local group of forestry concessionaires, known as ACOMAT,* who manage over 486,000 acres (see Base Map).

The monitoring system has three basic steps:

1) Real-time deforestation monitoring with satellite-based early warning forest loss alerts.*

2) Verify and document the alerts with drone overflights.*

3) Initiate a criminal complaint with the local environmental prosecuter’s office* (or an administrative complaint with the relevant forestry authorities) if suspected illegalities are found.

Below, we describe 6 cases (A-E) that have been generated from this comprehensive monitoring system.

It is important to emphasize that this type of monitoring system, featuring local forest custodians (such as concessionaires and indigenous communities) is possible to replicate in the Amazon and other tropical forests.

This innovative project is largely funded by the Norwegian Agency for Development Cooperation (NORAD) and International Conservation Fund of Canada (ICFC).

Base Map. The 6 Acomat cases (A-F) described in this report. Data: ACCA, MINAM/PNCB, SERNANP.

Case A. Illegal logging in the “Los Amigos” Conservation Concession

This evidence in this case was obtained from a drone overflight of an area that was the subject of an early warning forest loss alert within Los Amigos Conservation Consession (a conservation area where logging is not permitted). The overflight documented the illegal logging of the timber species known locally as tornillo (Cedrelinga cateniformis) within the concession (see image below).  The drone images were presented to the environmental prosecuter’s office in Madre de Dios as part of a criminal complaint.

Case A. Illegal logging in the Conservation Concession “Los Amigos”, identified with a drone flying over. Source: ACCA.

Case B. Illegal mining in the “Sonidos de la Amazonía” Ecotourism Concession      

The owner of the Sonidos de la Amazonía Ecotourism Concession received an early warning forest loss alert on his cellphone. She then organized a drone overflight and documented active illegal gold mining activity, including infrastructure (see image below). The drone images were presented to the environmental prosecuter’s office in Madre de Dios as part of a criminal complaint.

Case B. Illegal mining in the Tourism Concession “Sonidos de la Amazonía,” identified with drone images. Source: ACCA.

Case C. Illegal mining in the “AGROFOCMA” Forestry Concession    

The owner of the AGROFOCMA forestry (logging) concession received an early warning forest loss alert on his cellphone. He then organized a drone overflight and documented active illegal gold mining activity, including infrastructure (see image below). The drone images were presented to the environmental prosecuter’s office in Madre de Dios as part of a criminal complaint.

Case C. Illegal mining in the Forest Concession “AGROFOCMA,” identified with drone images. Source: ACCA.

Case D. Illegal mining in the “Inversiones Manu” Forestry Concession     

The owner of the Inversiones Manu forestry (logging) concession received an early warning forest loss alert on his cellphone. He then organized a drone overflight and documented active illegal gold mining activity, including workers and infrastructure (see image below). The drone images were presented to the environmental prosecuter’s office in Madre de Dios as part of a criminal complaint.

Case D. Illegal mining in the Forest Concession “Inversiones Manu,” identified with drone images. Source: ACCA.

Case E. Illegal logging in the “Sara Hurtado” Brazil Nut Concession 

The owner of the Sara Hurtado Brazil Nut Concession received an early warning forest loss alert on her cellphone. She then organized a drone overflight and documented active illegal logging activity, including cedar wood planks (see image below). The drone images were presented to the environmental prosecuter’s office in Madre de Dios as part of a criminal complaint.

In a related case, drones also captured images of a nearby collection center and transport truck for the recently logged planks. These images were also presented to the environmental prosecuter’s office as part of a sixth case.

Case E. Illegal logging in the Forest Concession “Sara Hurtado” identified with drone images. Source: ACCA.

*Notes

ACOMAT is the “Asociación de Concesionarios Forestales Maderables y no Maderables de las Provincias del Manu, Tambopata y Tahuamanu.”

The early warning alerts are generated by the Peruvian government (Geobosques/MINAM). GLAD alerts can also be used (these are generated by the University of Maryland and presented by Global Forest Watch). In our case, the concessionaires receive Geobosques alerts in their emails.

We used quadricopter drones. Obtained images are very-high resolution (<5 cm).

The local environmental prosecuter’s office is the “Fiscalía Especializada en Materia Ambiental (FEMA) de Madre de Dios.”

Acknowledgements

We thank S. Novoa (ACCA), H. Balbuena (ACCA), E. Ortiz (AAF), T. Souto (ACA), P. Rengifo (ACCA), A. Condor (ACCA), y G. Palacios for helpful comments on earlier drafts of this report.

This work supprted by the following funders:  Norwegian Agency for Development Cooperation (NORAD), International Conservation Fund of Canada (ICFC), MacArthur Foundation, Metabolic Studio.

Citation

Guerra J, Finer M, Novoa S (2019) From satellite to drone to legal action in the Peruvian Amazon. MAAP: 105.


MAAP #104: Major Reduction in Illegal Gold Mining from Peru’s Operation Mercury

Graph 1. Illegal gold mining deforestation in La Pampa, 2017-19. Data: ACA, MAAP.

In February 2019, the Peruvian government launched Operation Mercury (Operación Mercurio), a major multi-sectoral crackdown on the illegal gold mining crisis in the area known as La Pampa,* located  in the southern Peruvian Amazon (Madre de Dios region). Note that this area is not within Tambopata National Reserve, but in its buffer zone.

In this report, we present the results of our analysis on the initial impacts of this Operation.

We found a major reduction in gold mining deforestation in La Pampa in 2019, compared to the same time period (February – June) of the previous two years (see Graph 1).

In fact, the gold mining deforestation decreased 92% between 2018 (900 hectares) and 2019 (67 hectares), representing the situation before and after the start of Operation Mercury.

The Base Map illustrates how the expansion of gold mining deforestation greatly dropped in 2019 compared to the two previous years, especially in the eastern front. The letters (A-C) correspond to the location of the Zooms, below.

The analysis also reveals, however, that the gold mining deforestation in La Pampa has not yet been completely eradicated and continues in numerous remote and isolated areas.

Base Map. Illegal gold mining deforestation in La Pampa. Data: ACCA, MAAP, SERNANP.

Zoom A1 shows the critical eastern front of the gold mining deforestion between February (left panel) and June (right panel) 2019, the first five months of Operation Mercury. While the rapid eastward expansion of the front has greatly decreased, the red circles indicate areas where we have detected isolated mining activity.

Zoom A1. Eastern front of the gold mining deforestation in La Pampa. Data: ESA, MAAP.

High Resolution Zooms

Zoom B shows the eradication of one of the biggest mining camps in La Pampa between 2018 (left panel) and 2019 (right panel).

Zoom B. Eradication of major gold mining camp. Data: Maxar.

The following Zooms show examples of the persistence of isolated illegal gold mining activity and infrastructure in La Pampa, with recent (June 2019) high resolution satellite and drone images. The letters (A2, C1, C2) correspoind to the Base Map, above.

Zoom A2. Data: Maxar, MAAP.
Zoom C1. Data: ACCA.
Zoom C2. Data: ACCA.

Google Earth Engine App

We present a new app, developed with Google Earth Engine, that allows an interactive visualization of the evolution of gold mining deforestation in La Pampa. The app allows the user to take advantage of Google’s powerful computers to compare (with a slider) different dates from a large archive of Sentinel-1 satellite images (see screenshot, below). Sentinel-1 is radar, so there are no clouds in the images.

https://luciovilla.users.earthengine.app/view/mining-monitoring-by-sar-sentinel-1


Screen shot of the app. Data: ESA, MAAP

Notes 

*La Pampa is the sector located in the buffer zone of Tambopata National Reserve, delimited by the northern boundary of the reserve, the Malinowski River and the Interoceanic Highway.

Full study area of La Pampa (shaded). Data: ACCA, MAAP.

Acknowledgements

We thank S. Novoa (ACCA), H. Balbuena (ACCA), E. Ortiz (AAF), T. Souto (ACA), P. Rengifo (ACCA), A. Condor (ACCA), y G. Palacios for helpful comments on earlier drafts of this report.

This work supprted by the following funders:  Norwegian Agency for Development Cooperation (NORAD), International Conservation Fund of Canada (ICFC), MacArthur Foundation, Metabolic Studio, and Global Forest Watch Small Grants Fund (WRI).

Citation

Villa L, Finer M (2019) Major Reduction in Illegal Gold Mining from Peru’s Operation Mercury. MAAP: 104.