New sugarcane plantations have caused the deforestation of more than 6,175 acres (2,500 hectares) in the department of La Paz.
https://news.mongabay.com/2016/10/exclusive-rainforest-rapidly-cleared-for-sugarcane-in-bolivia/
New sugarcane plantations have caused the deforestation of more than 6,175 acres (2,500 hectares) in the department of La Paz.
https://news.mongabay.com/2016/10/exclusive-rainforest-rapidly-cleared-for-sugarcane-in-bolivia/
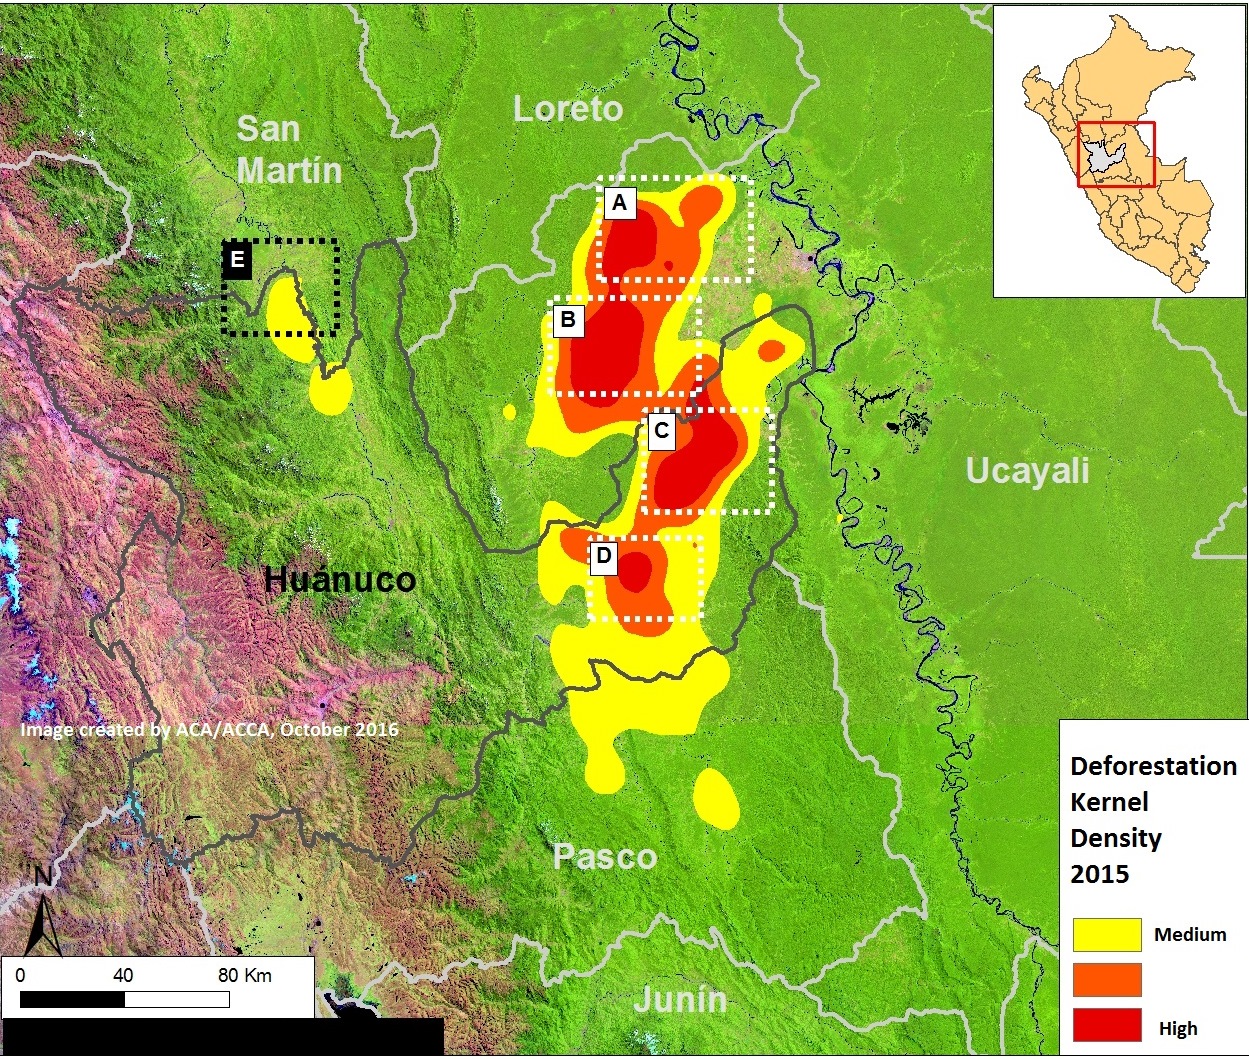
In MAAP #26, we presented a 2015 Deforestation Hotspots map for the Peruvian Amazon, which showed that the highest concentration of deforestation is located in the central Amazon region.
Here, we zoom in on one of these hotspots, located in the northern Huanuco region along its border with San Martin (see Inset E of Image 48a).*
We found that the main deforestation driver in this hotspot was the establishment of small- and medium-scale oil palm plantations.**
*Note that we analyzed the hotspots in Insets A-D in MAAP #26 and MAAP #37.
** We defined small-scale as less than 5 hectares, medium-scale as 5-50 hectares, and large-scale as greater than 50 hectares
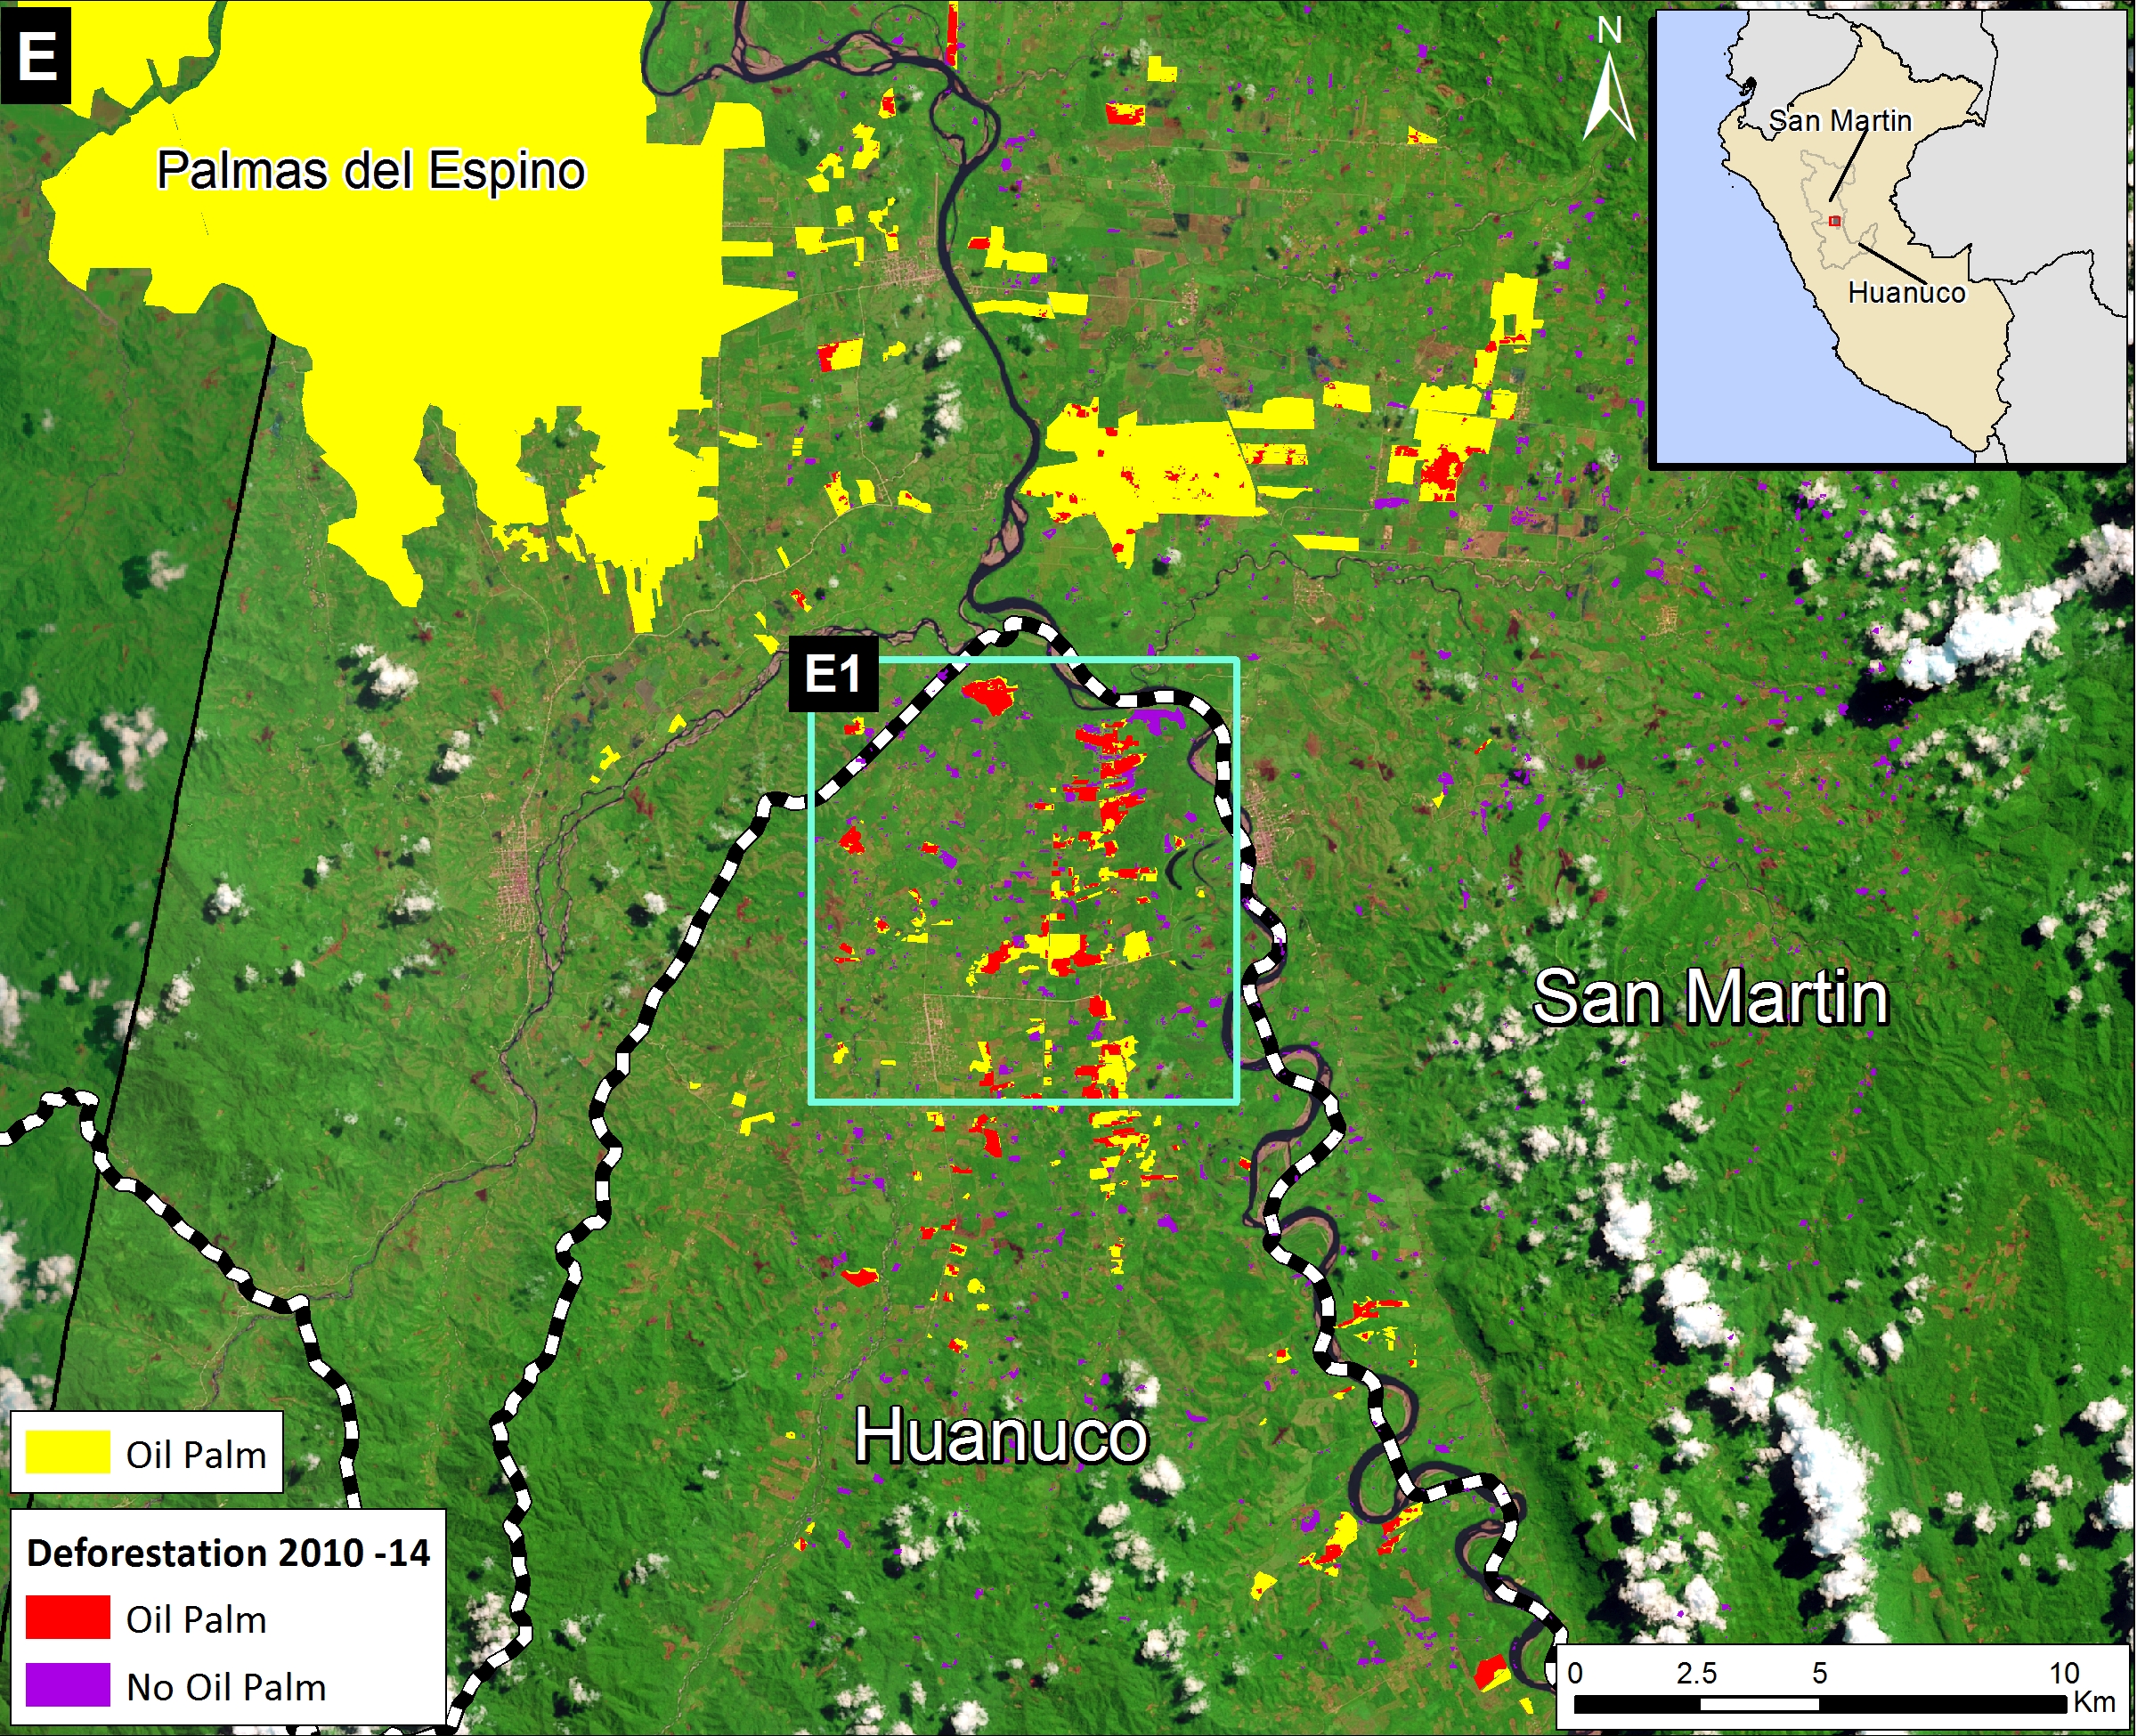
Image 48b shows our area of interest.
The San Martin side is characterized by large- and medium-scale plantations (yellow), while the Huanuco side is characterized by small- and medium-scale plantations.
Red indicates areas deforested and converted to oil palm plantations between 2010 and 2014, according to our analysis of high-resolution satellite imagery.
We estimate the deforestation of 558 hectares (1,370 acres) for establishment of oil palm plantations between 2010-2014 in northern Huanuco. Two-thirds of the plantations are medium scale (5-50 hectares) and the remaining third are small-scale (<5 hectares).***
Historical forest loss data indicates that most of the deforestation occurred in secondary forests, with a smaller percentage in primary forests.
***See MAAP #32 for more information on the importance of knowing the size of the deforestation events.
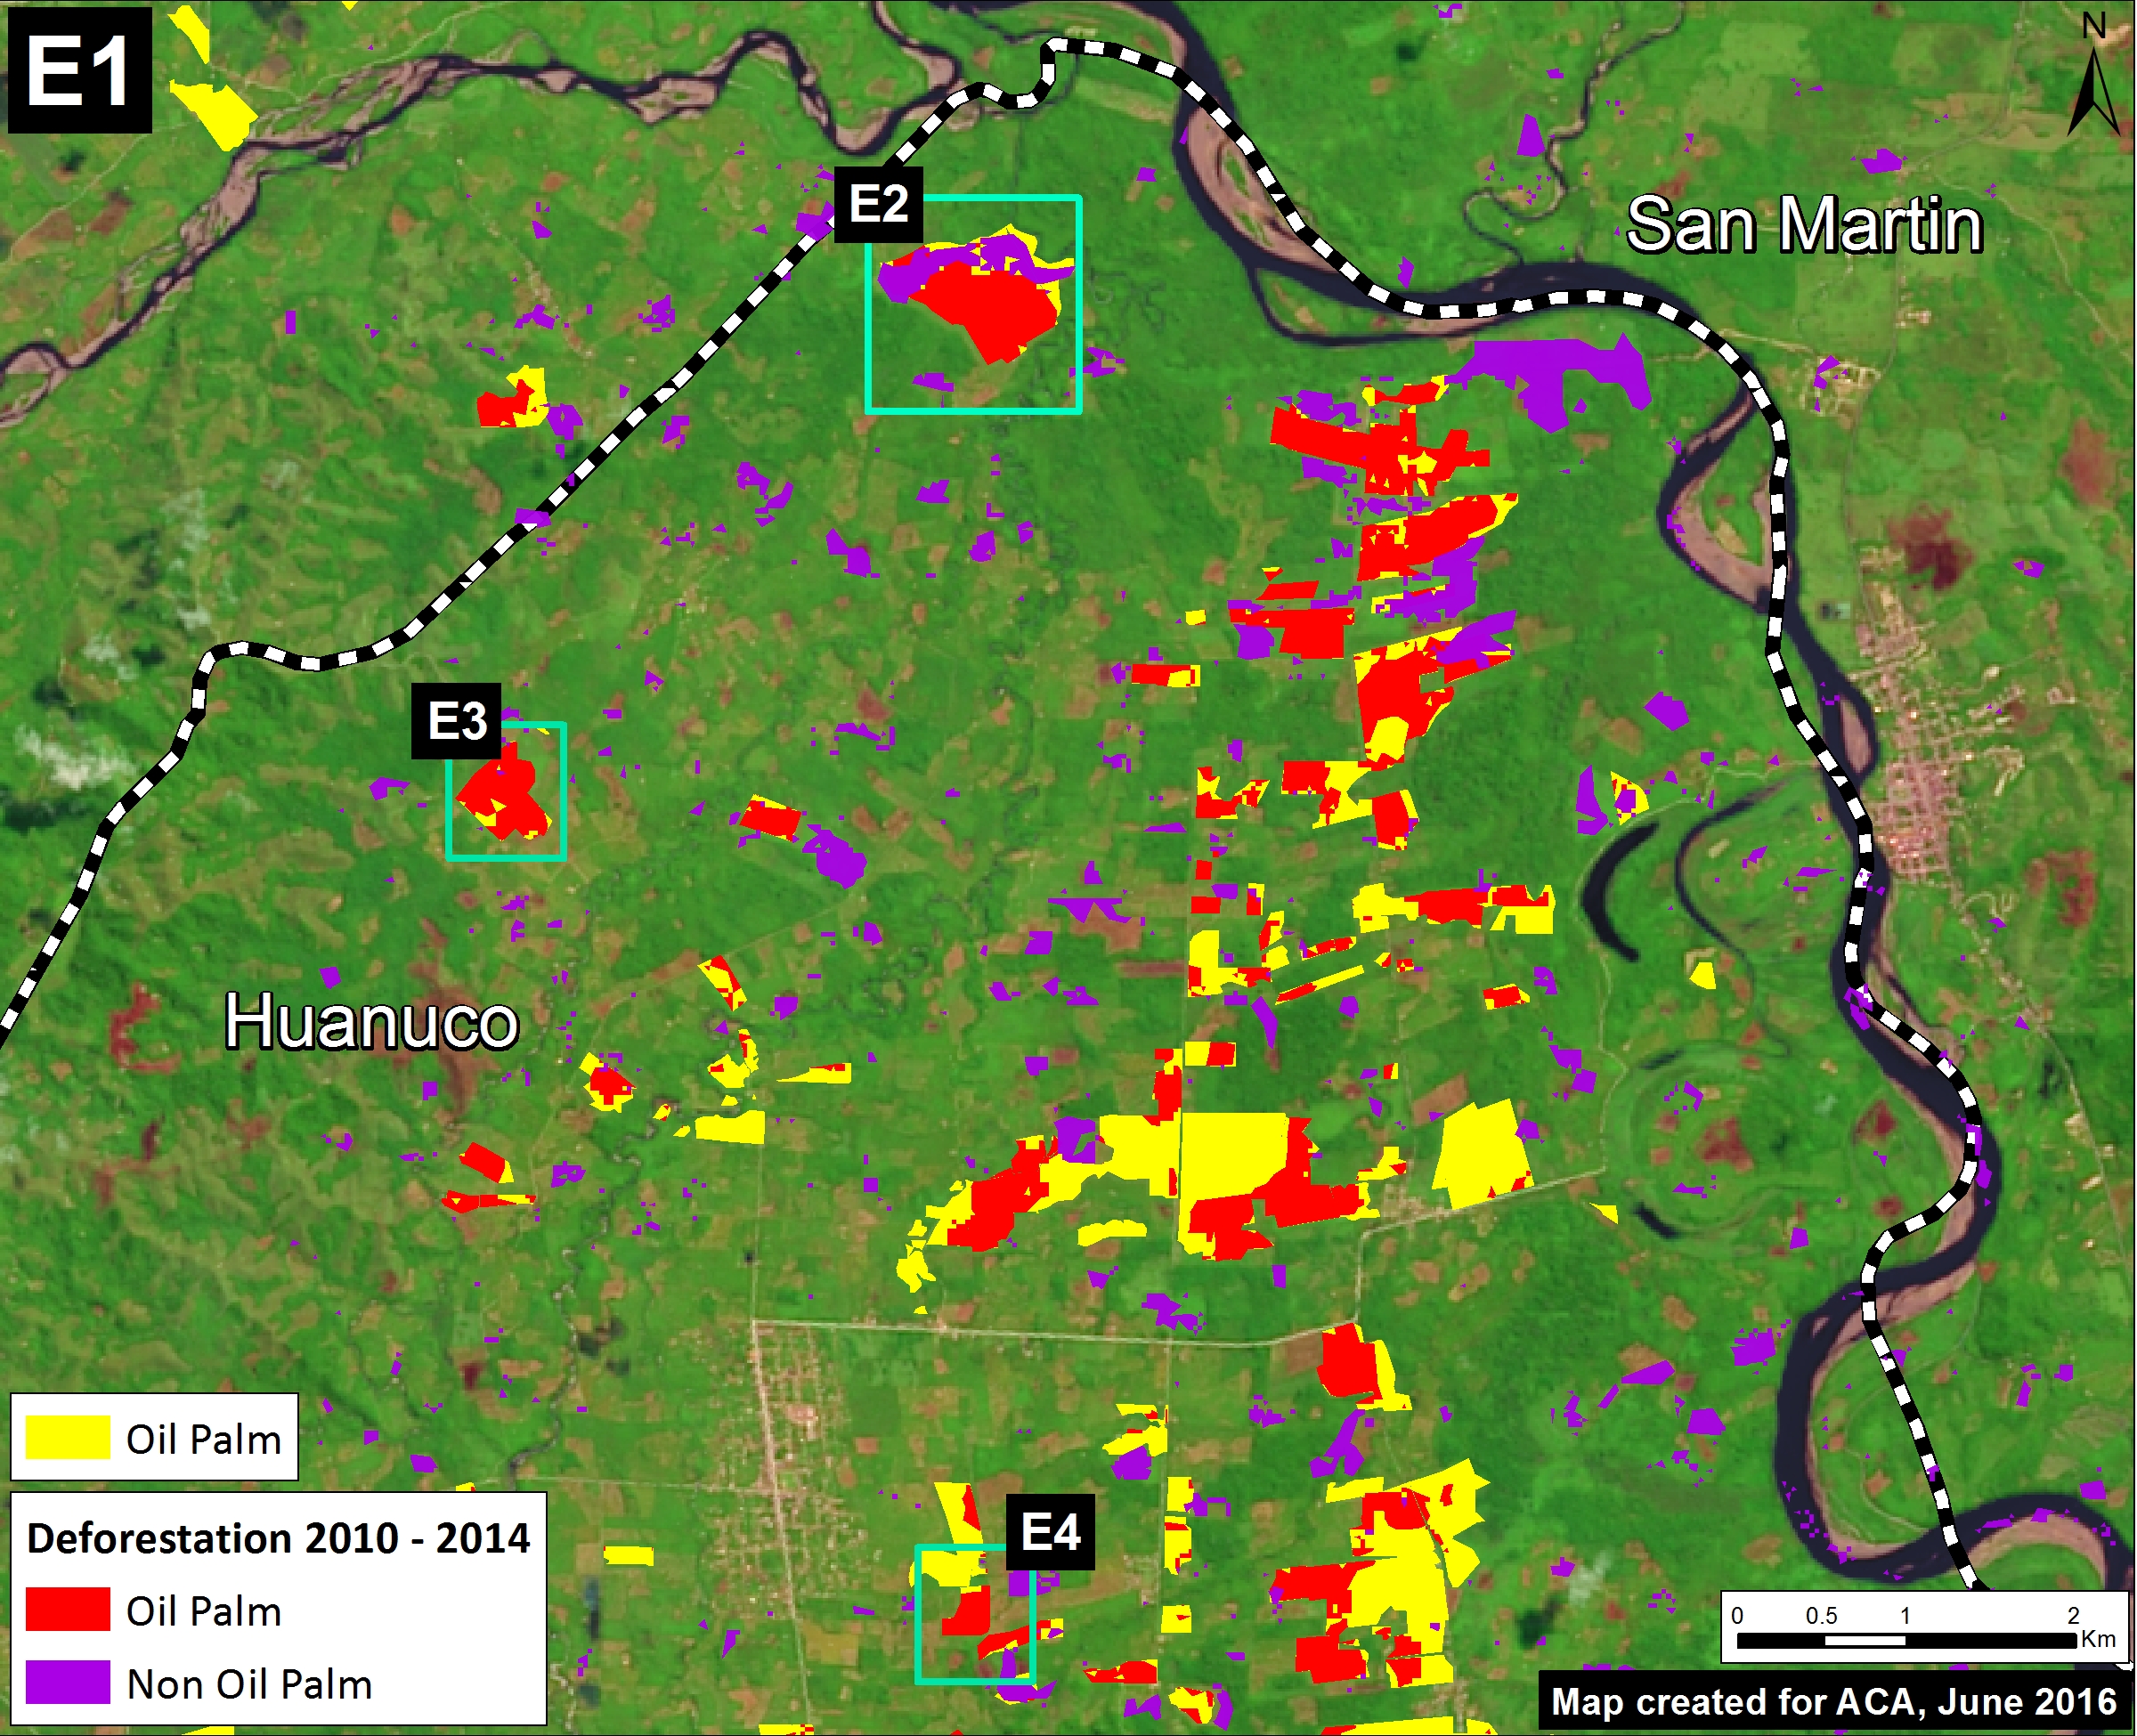
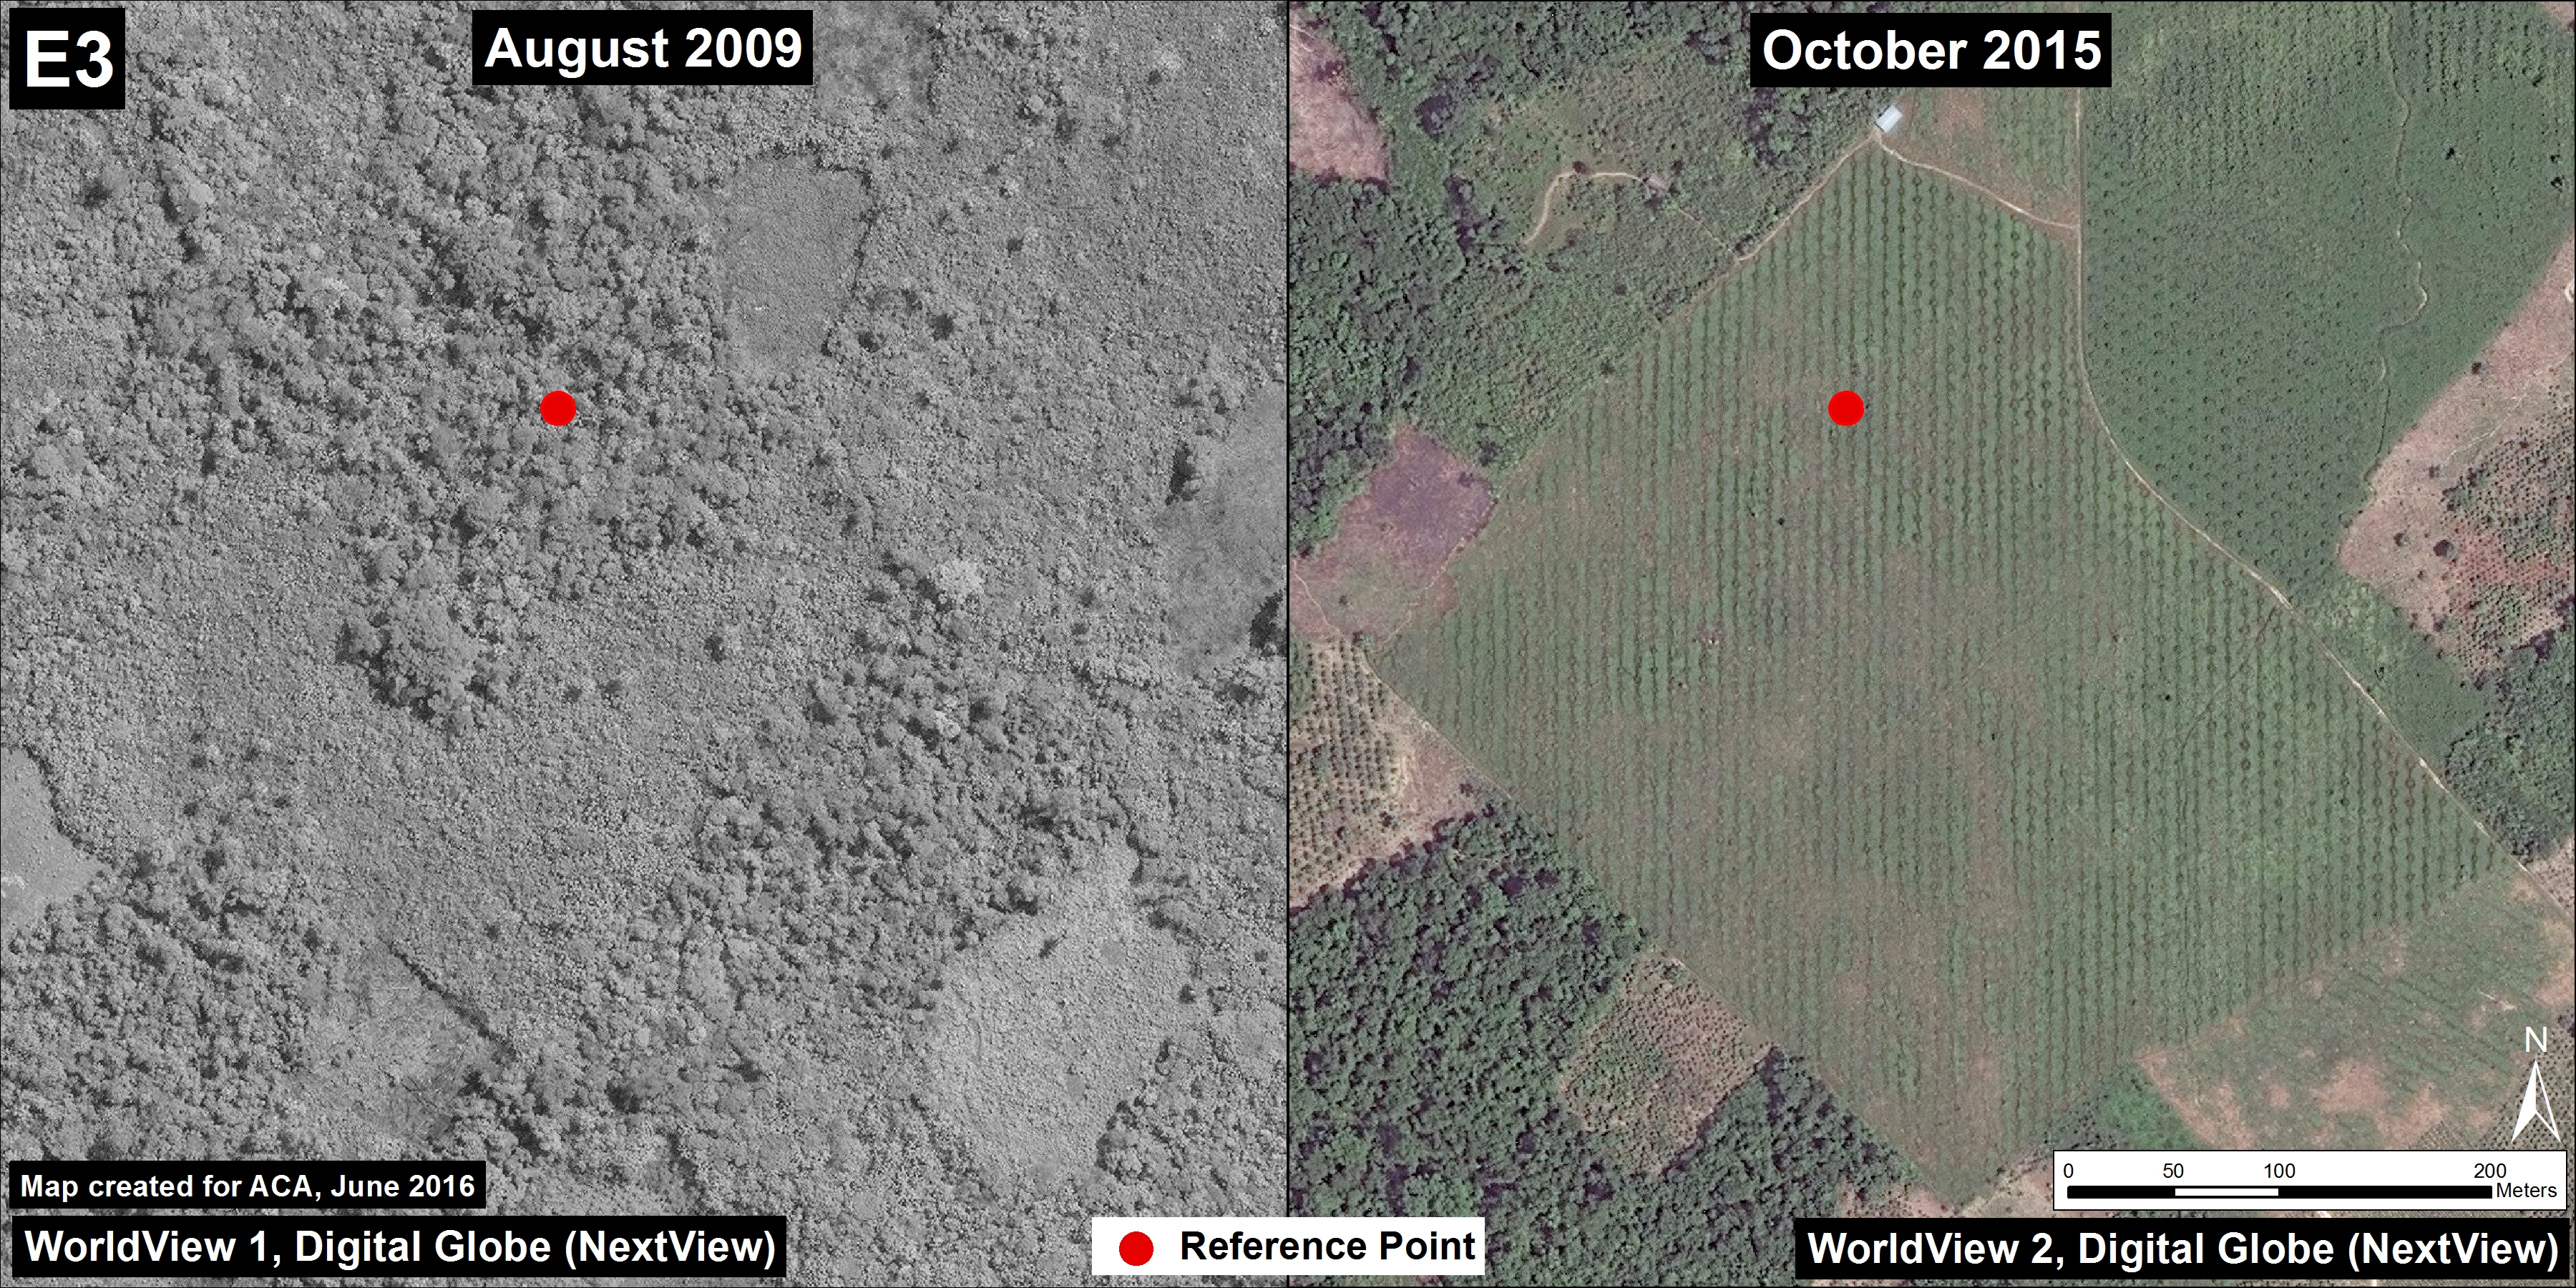
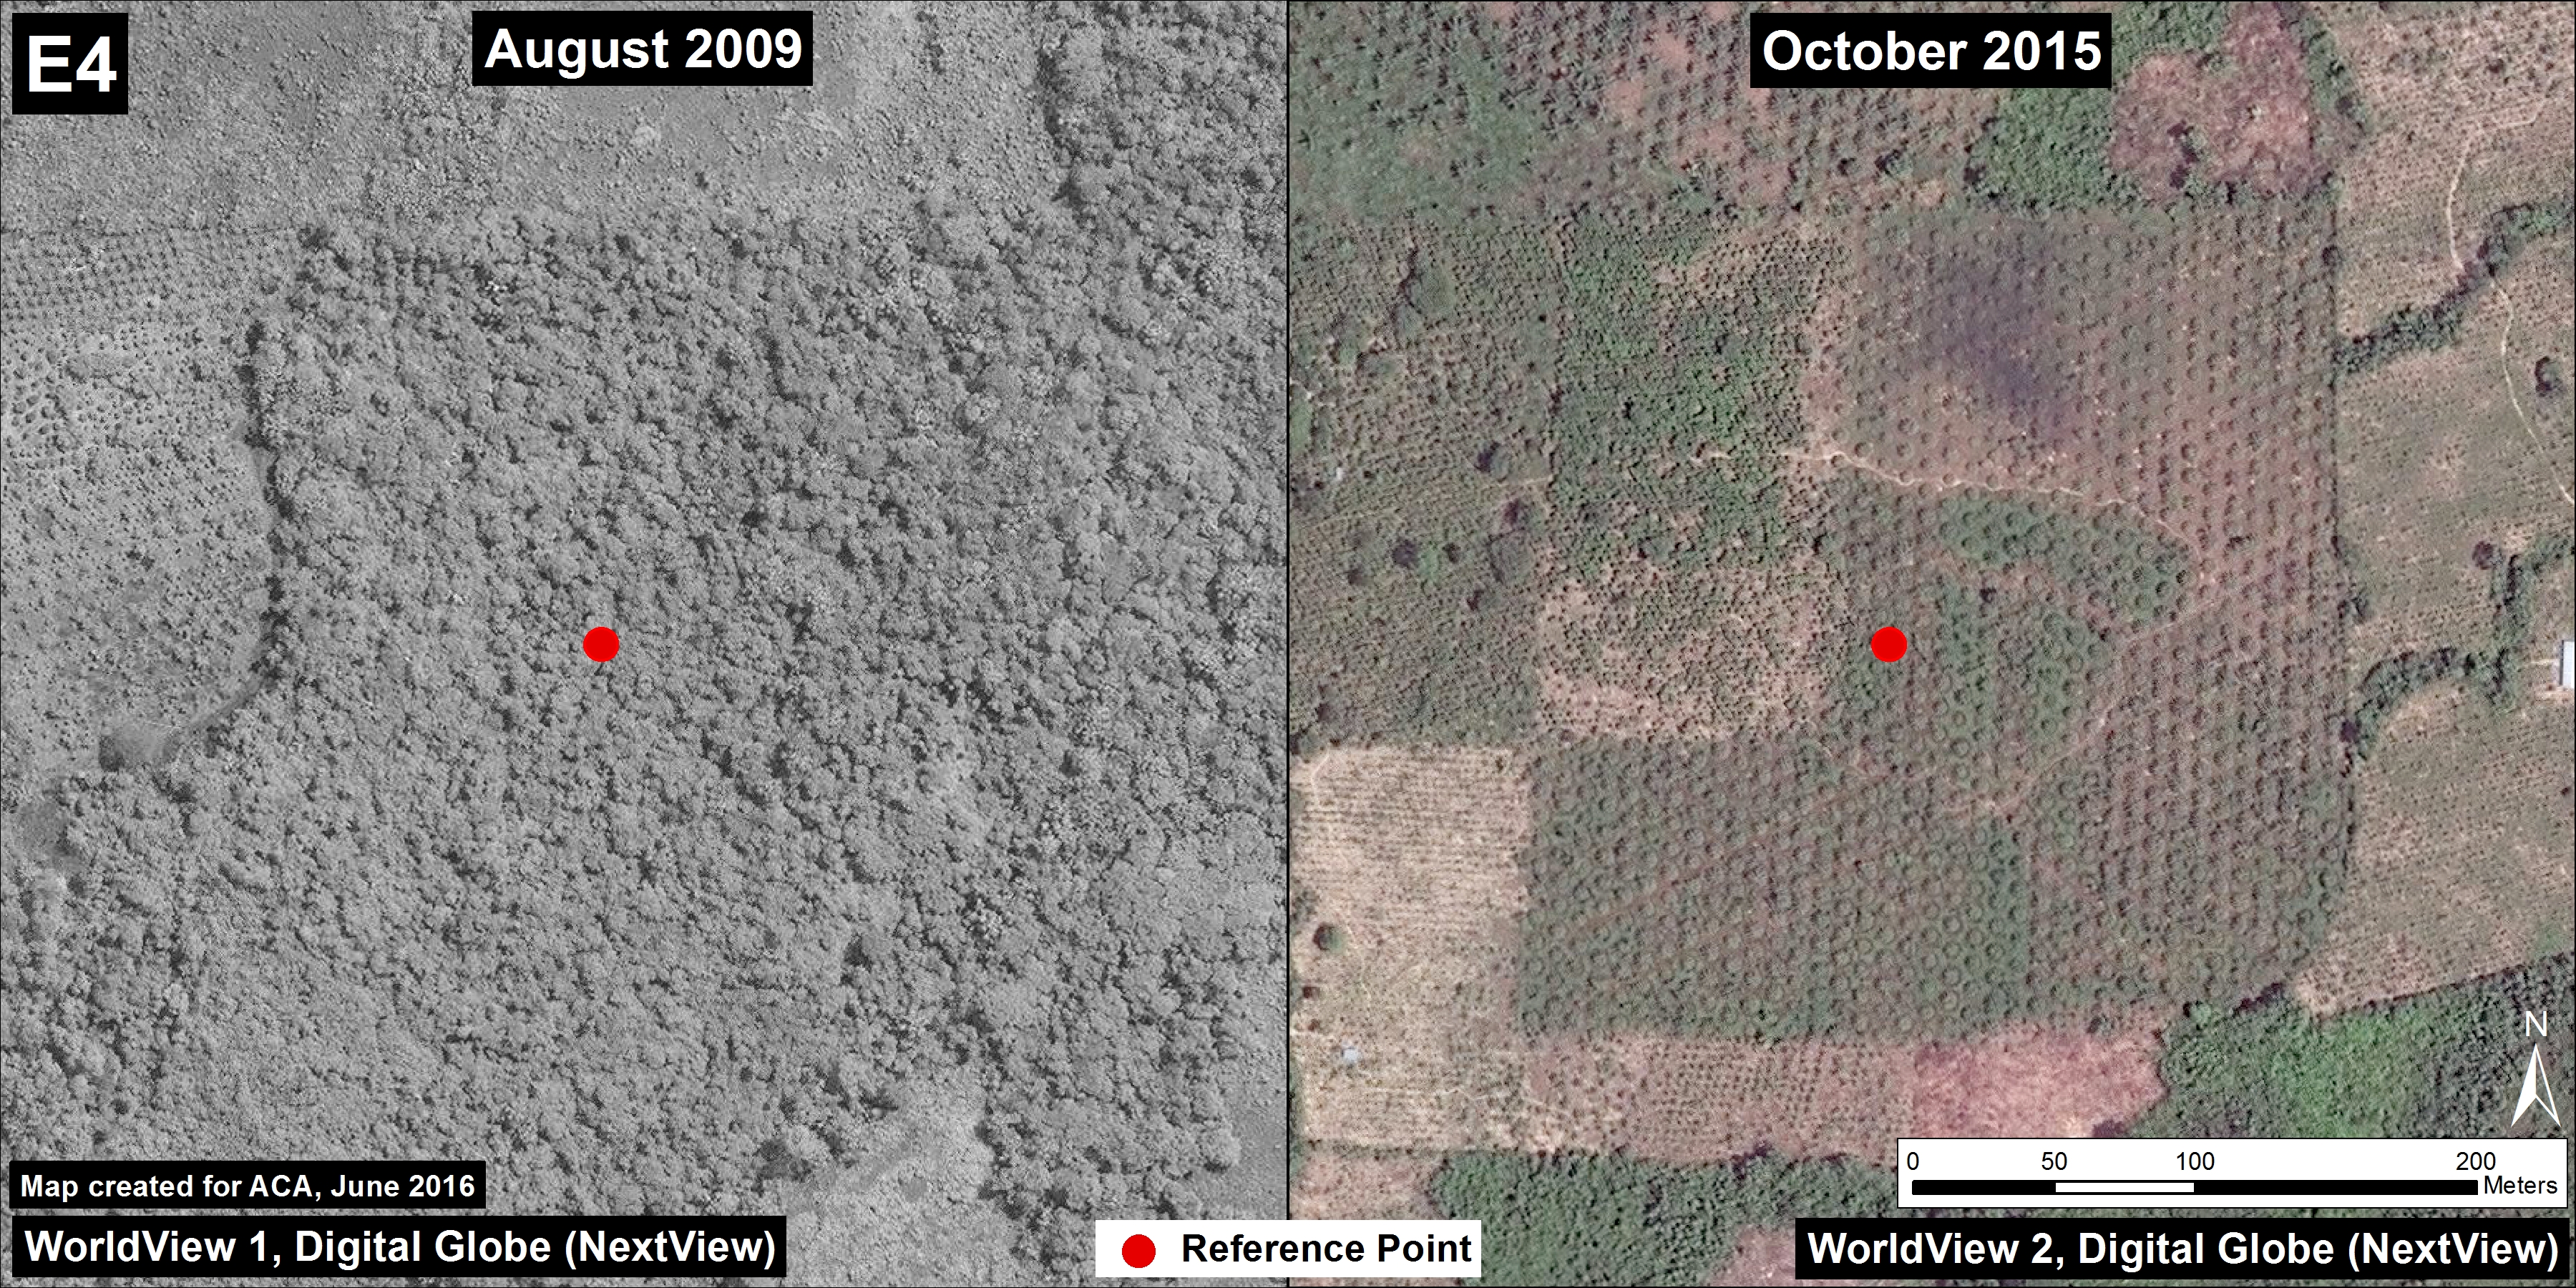
Image 48c shows a zoom of our area of interest.
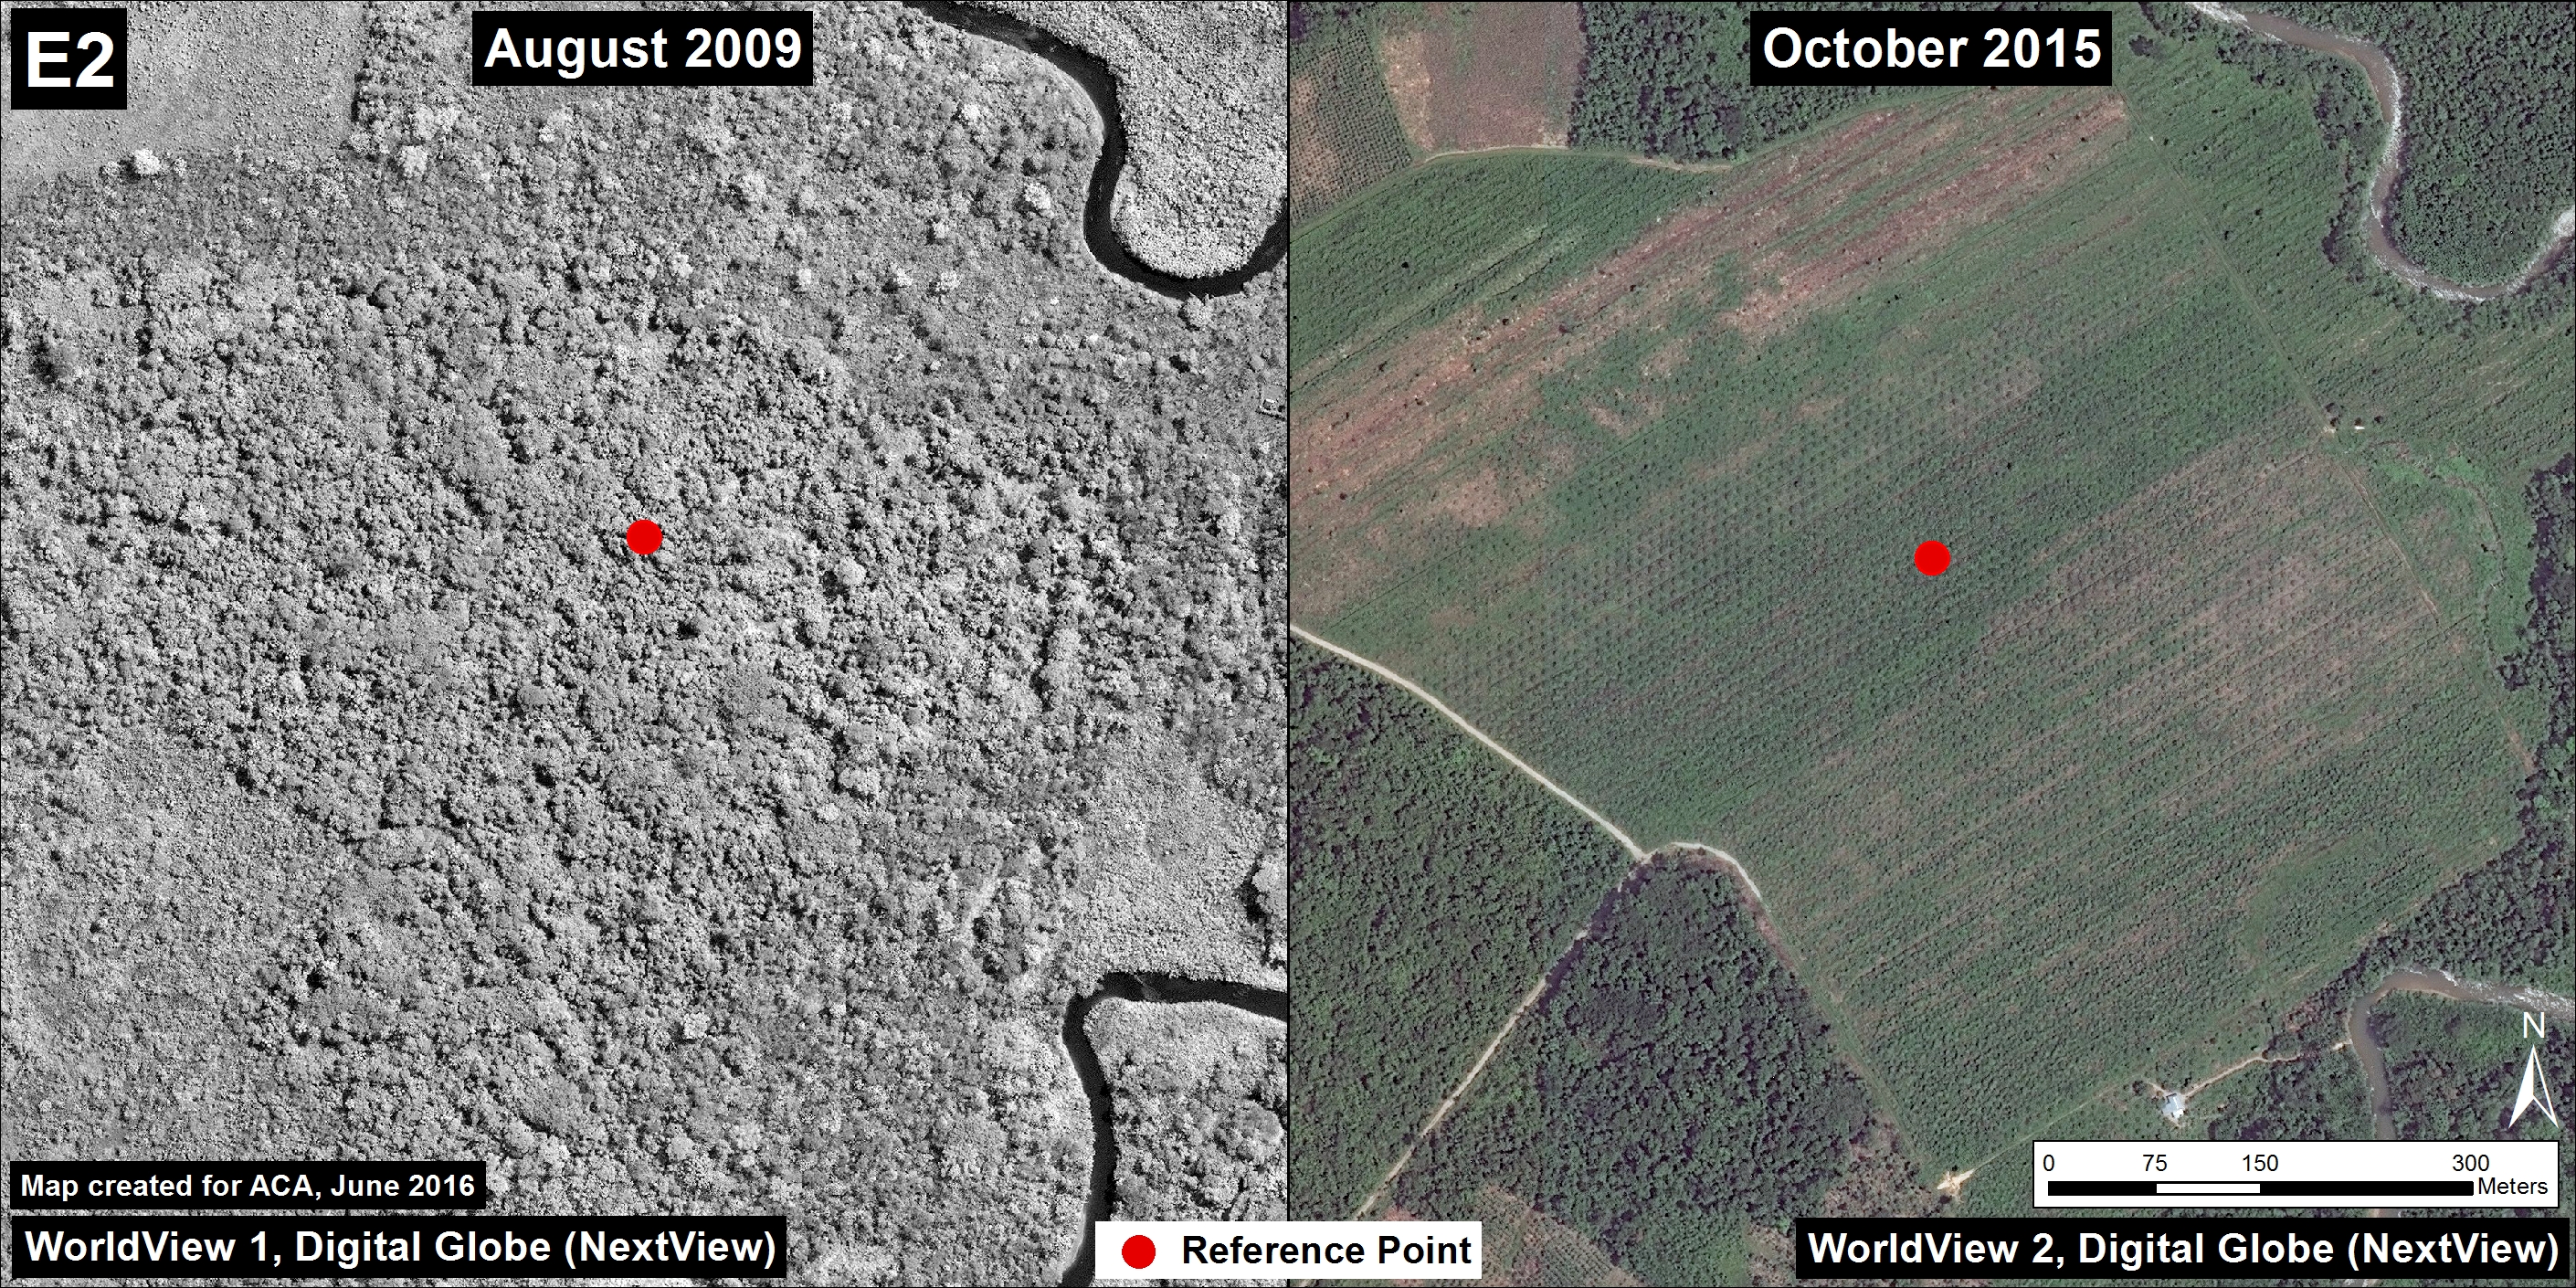
The insets indicate the areas shown below with satellite imagery from August 2009 (left panel) and October 2015 (right panel).
Each image shows the existence of forest in 2009 replaced by oil palm in 2015 (the red dot is a point of reference indicating the same spot across time).
Finer M, Olexy T (2016) Oil Palm Deforestation in the central Peruvian Amazon. MAAP: 48.
The Peruvian Amazon is experiencing an intense 2016 fire season due to one of its driest periods in decades. In recent weeks, we have presented a series of articles showing the power of the new GLAD alerts in detecting deforestation in near real time. Here, we go a step further and also evaluate alerts to detect fires in near real time. These fire alerts are based on the moderate resolution (375 meters) VIIRS sensor that detects heat sources and highlights areas where the temperature is significantly above normal.
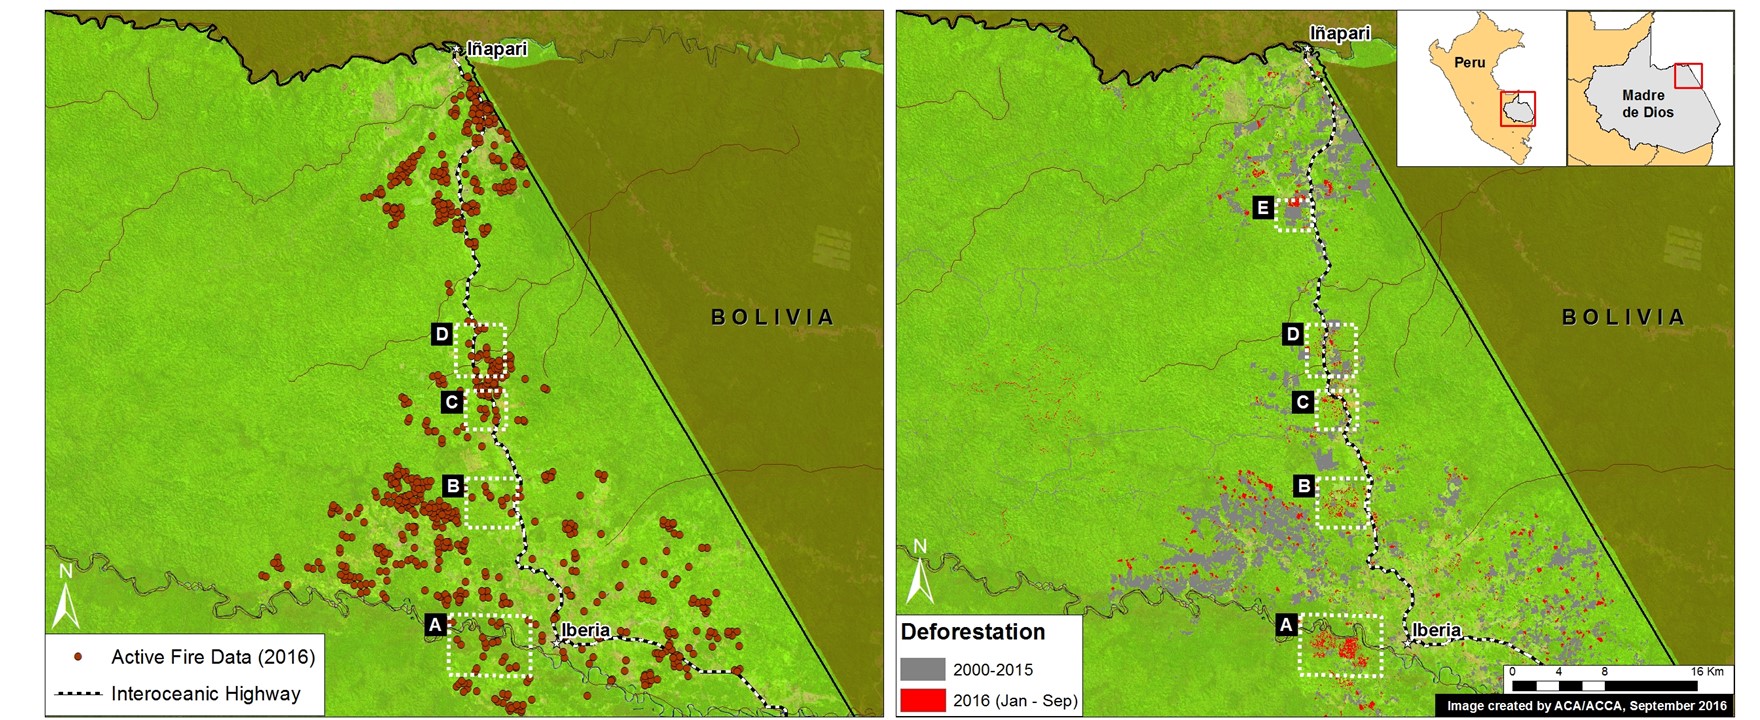
We compared, for the first time, these two types of alerts and found a correlation between fires and forest loss along a stretch of the Interoceanic Highway in the southern Peruvian Amazon (Madre de Dios region).
Image 47a shows the occurrence of fire alerts (left panel) in relation to deforestation alerts (right panel) during 2016 along the highway between the towns of Iberia and Iñapari. Insets A-E indicate the areas highlighted in the high-resolution zooms below, where approximately 600 hectares were affected by fires in 2016..
Images 47b-f show the forest loss/degradation between July (left panel) and September (right panel) of 2016 in the areas indicated by Insets A-E. Yellow circles indicate areas with the most forest loss/degradation between these dates. Brown dots indicate the fire alerts. Note that the forest loss/degradation is often adjacent to recently burned pasture and agricultural areas.
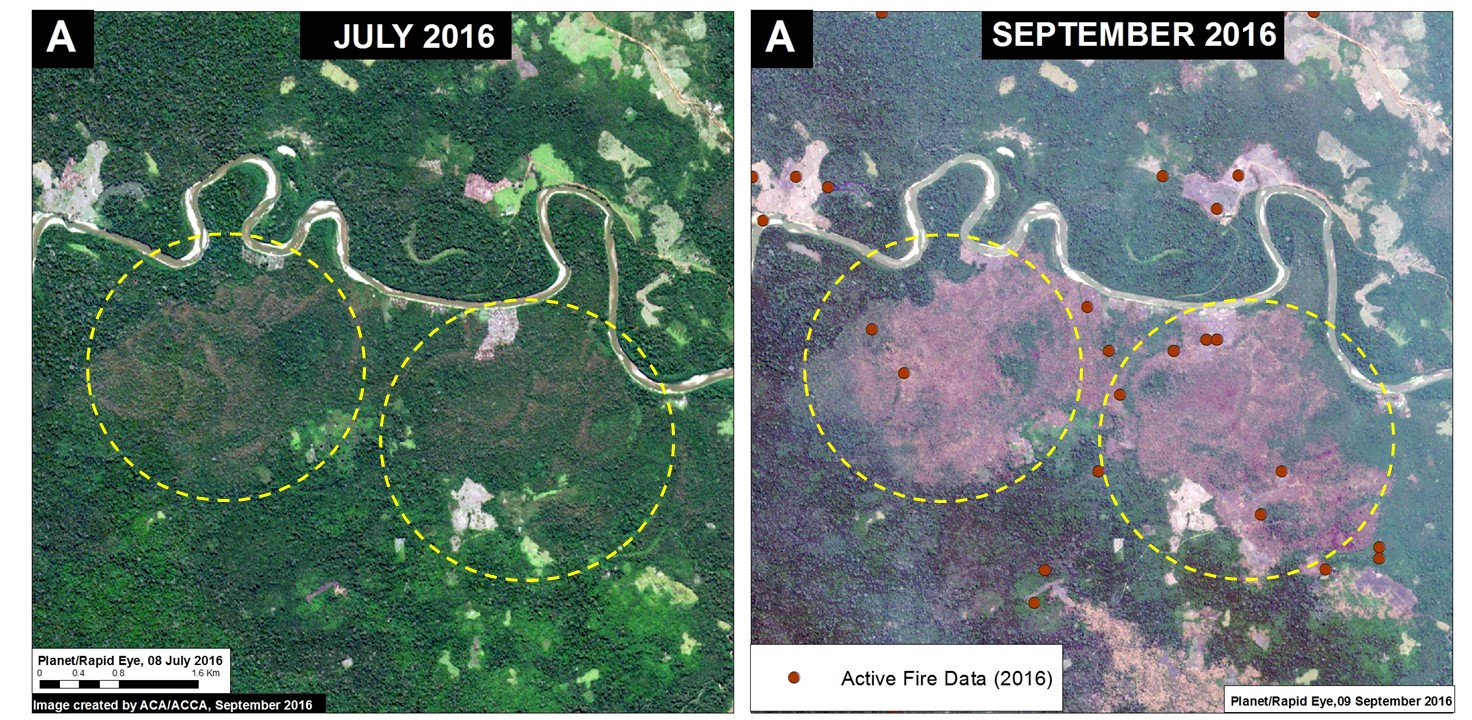
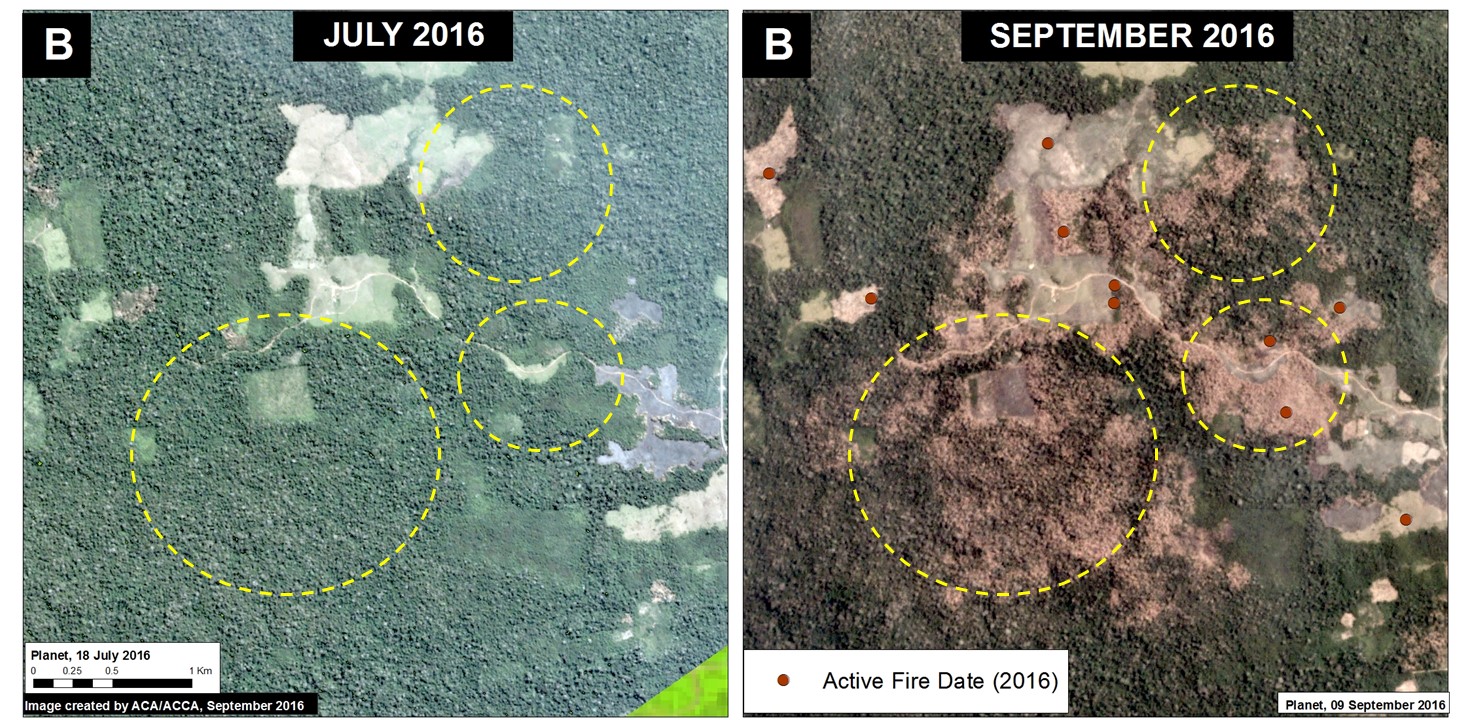

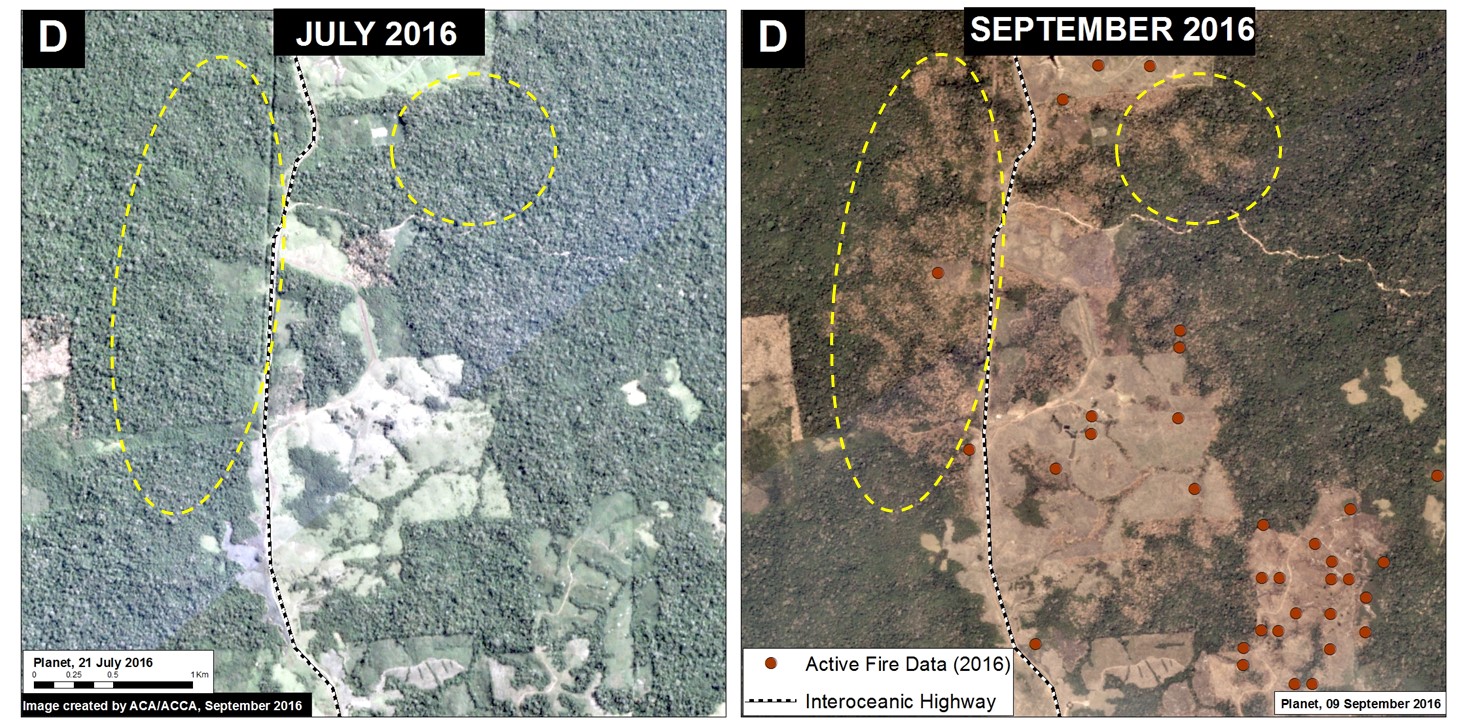
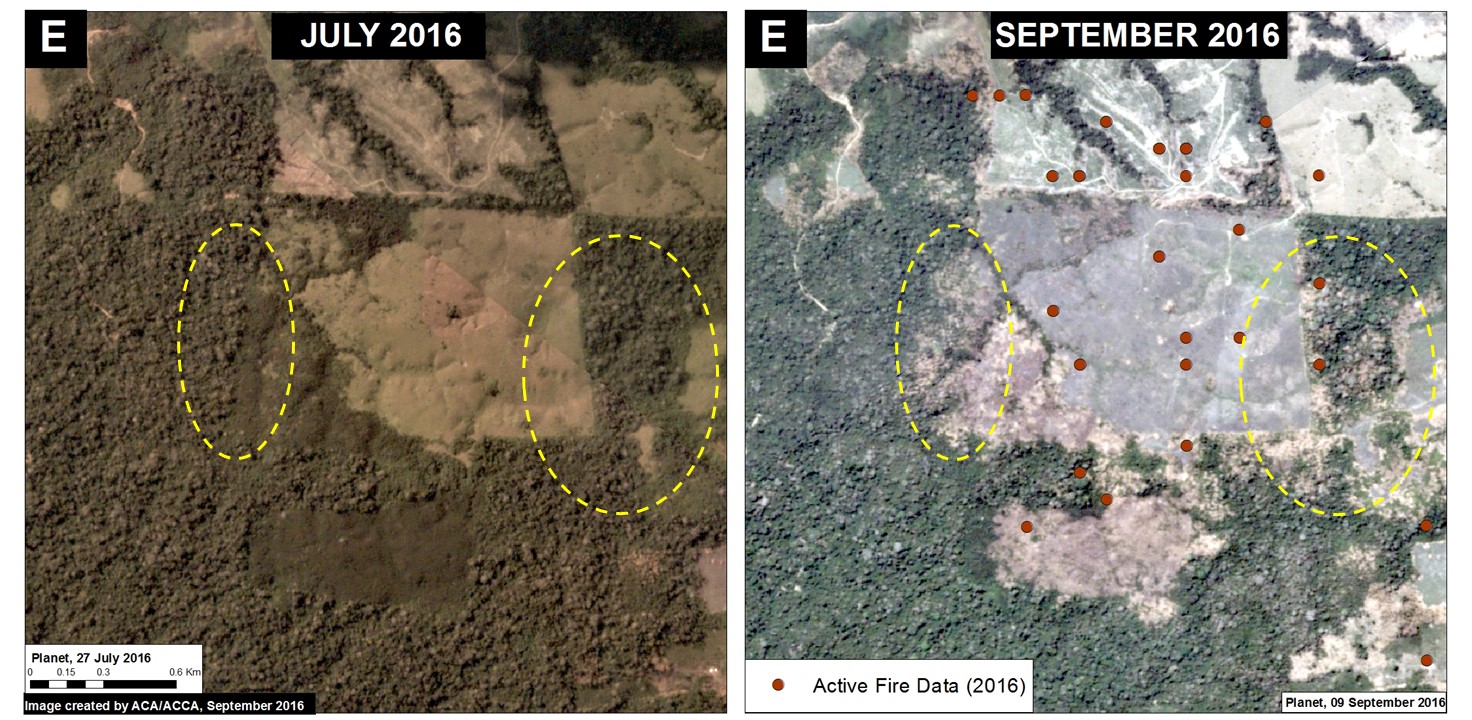
Image 47g shows a detailed example of the relationship between fire and deforestation alerts. The left panel shows both the fire hot spots (brown spots) and confirmed burned areas (purple). Also note the forest fire smoke. The confirmation of the burned areas was achieved through the Normalized Burn Ratio index. The right panel displays the subsequent GLAD forest loss alerts in red.
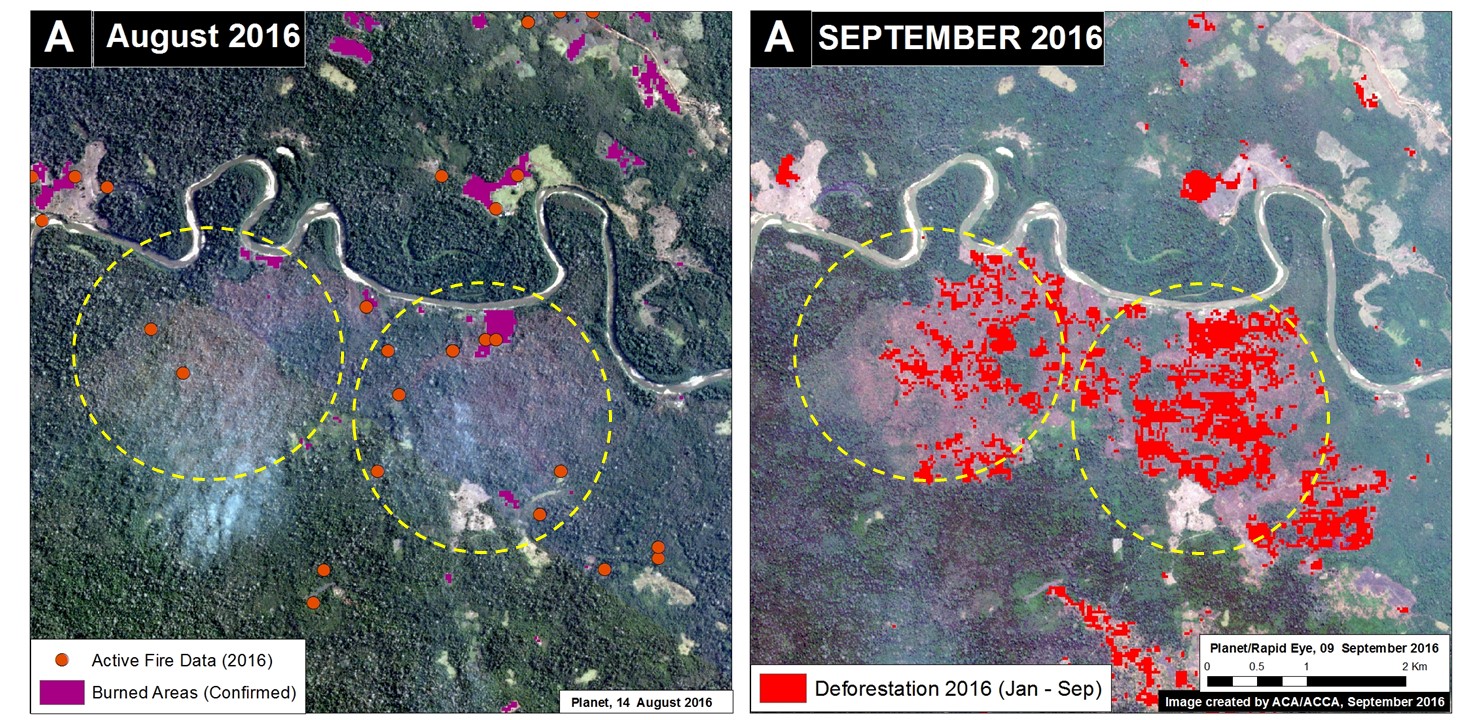
Novoa S, Finer M, Mendoza E (2016) Fires Degrade Southern Peruvian Amazon (Madre De Dios). MAAP: 47.


