MAAP #83: Climate Change Defense: Amazon Protected Areas and Indigenous Lands

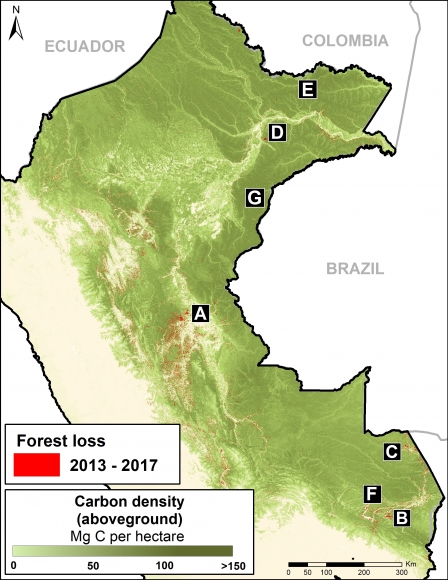
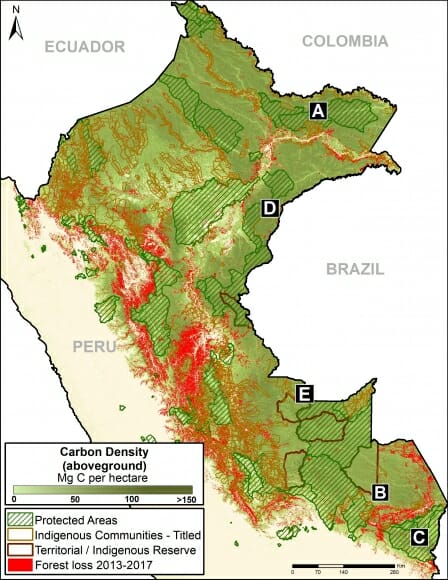
Base Map. Data: Asner et al 2014, MINAM/PNCB, SERNANP, IBC

Tropical forests, especially the Amazon, sequester huge amounts of carbon, one of the main greenhouse gases driving climate change.

Here, we show the importance of protected areas and indigenous lands to safeguard these carbon stocks.

In MAAP #81, we estimated the loss of 59 million metric tons of carbon in the Peruvian Amazon during the last five years (2013-17) due to forest loss, especially deforestation from mining and agricultural activities.

This finding reveals that forest loss represents nearly half (47%) of Peru’s annual carbon emissions, including from burning fossil fuels.1,2

In contrast, here we show that protected areas and indigenous lands have safeguarded 3.17 billion metric tons of carbon, as of 2017.3,4

The Base Map (on the right) shows, in shades of green, the current carbon densities in relation to these areas.

The breakdown of results are:
1.85 billion tons safeguarded in the Peruvian national protected areas system;
1.15 billion tons safeguarded in titled native community lands; and
309.7 million tons safeguarded in Territorial Reserves for indigenous peoples in voluntary isolation.

The total safeguarded carbon (3.17 billion metric tons) is the equivalent to 2.5 years of carbon emissions from the United States.5

Below, we show several examples of how protected areas and indigenous lands are safeguarding carbon reservoirs in important areas, indicated by insets A-E.

A. Yaguas National Park

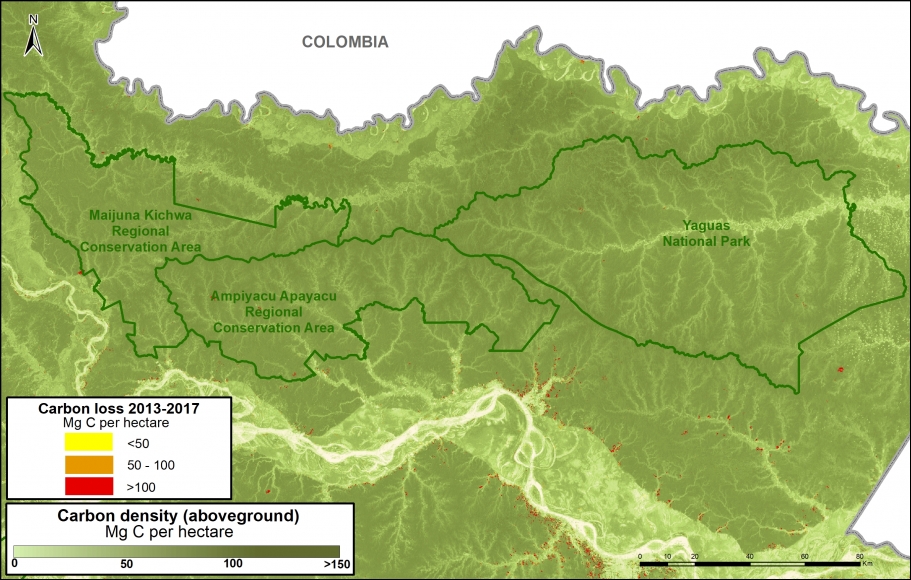
The following Image A shows how three protected areas, including the new Yaguas National Park, are effectively safeguarding 202 million metric tons of carbon in the northeastern Peruvian Amazon. This area is home to some of the highest carbon densities in the country.

Image 83a. Yaguas. Data: Asner et al 2014, MINAM/PNCB, SERNANP

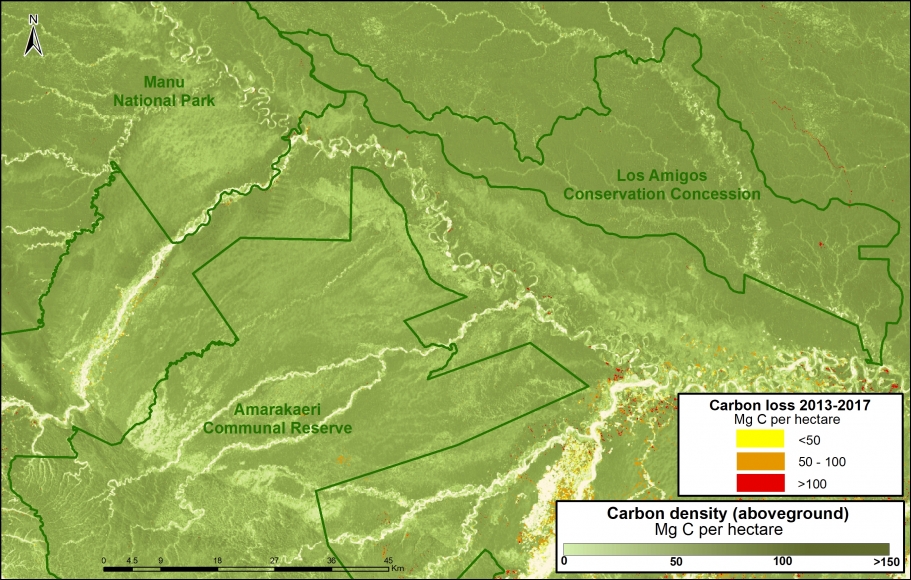
B. Manu National Park, Amarakaeri Communal Reserve, CC Los Amigos

The following Image B shows how Los Amigos, the world’s first conservation concession, is effectively safeguarding 15 million metric tons of carbon in the southern Peruvian Amazon. Two surrounding protected areas, Manu National Park and Amarakaeri Communal Reserve, safeguard an additional 194 million metric tons. This area is home to some of the highest carbon densities in the country.

Image 83b. Los Amigos-Manu-Amarakaeri. Data: Asner et al 2014, MINAM/PNCB, SERNANP, ACCA

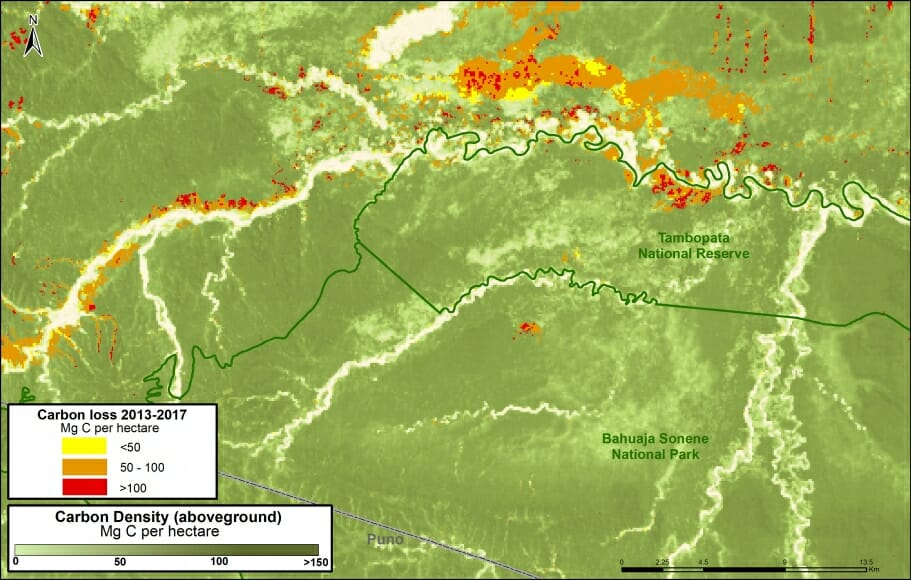
C. Tambopata National Reserve, Bahuaja Sonene National Park

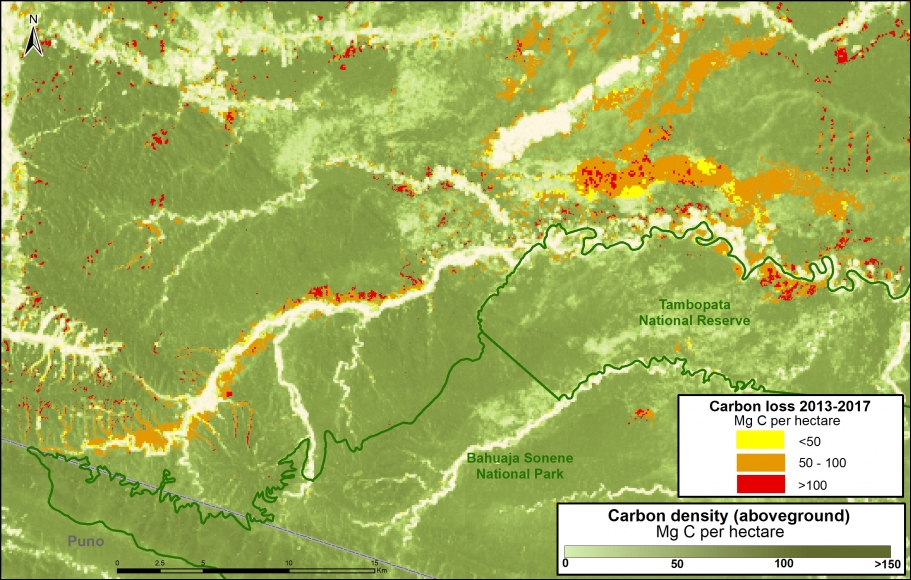
The following Image C shows how two important natural protected areas, Tambopata National Reserve and Bahuaja Sonene National Park, are helping conserve carbon stocks in an area with intense illegal gold mining activity.

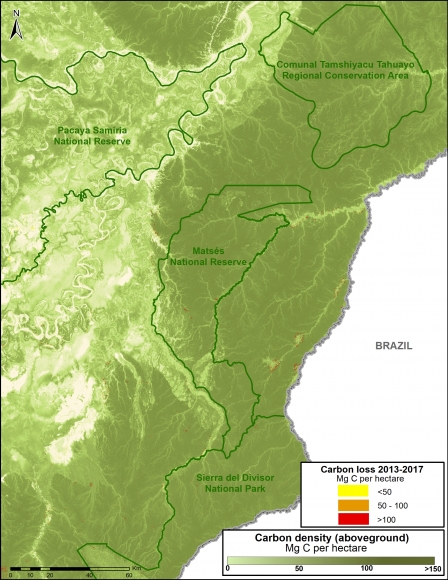
D. Sierra del Divisor National Park, National Reserve Matsés

Image 83d. Data: Asner et al 2014, MINAM/PNCB, SERNANP

The following Image D shows how four protected areas, including the new Sierra del Divisor National Park, and adjacent National Reserve Matsés are effectively safeguarding 270 million metric tons of carbon in the eastern Peruvian Amazon.

This area is home to some of the highest carbon densities in the country.

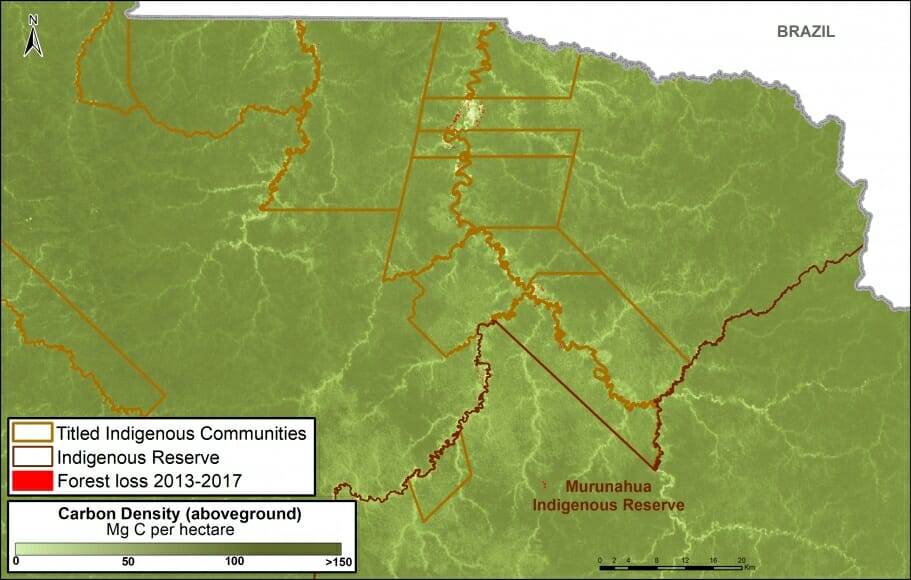
E. Murunahua Indigenous Reserve

The following Image E shows the carbon protected in the Murunahua Indigenous Reserve (for indigenous peoples in voluntary isolation) and the surrounding titled native communities.

Imagen 83e. Datos: Asner et al 2014, MINAM/PNCB, SERNANP

References

1  UNFCCC. Emissions Summary for Peru. http://di.unfccc.int/ghg_profile_non_annex1

2  No incluye las emisiones por la degradación de bosques

Asner GP et al (2014). The High-Resolution Carbon Geography of Perú. Carnegie Institution for Science. ftp://dge.stanford.edu/pub/asner/carbonreport/CarnegiePeruCarbonReport-English.pdf

Sistema de Áreas Naturales Protegidas del Perú, que incluye áreas de administración nacional, regional, y privado. Datos de las tierras indígenas son de Instituto de Bien Común. Datos de pérdida forestal son de la Programa Nacional de Conservación de Bosques para la Mitigación del Cambio Climático (MINAM/PNCB).

UNFCCC. Emissions Summary for United States. http://di.unfccc.int/ghg_profile_annex1

Citation

Finer M, Mamani N (2017). Climate Change Defense: Amazon Protected Areas and Indigenous Lands. MAAP: 83.

Acknowledgments

This report was made possible by the generous support of the Norwegian Agency for Development Cooperation (NORAD).

MAAP #81: Carbon loss from deforestation in the Peruvian Amazon

Base Map. Data: MINAM/PNCB, Asner et al 2014

When tropical forests are cleared, the enormous amount of carbon stored in the trees is released to the atmosphere, making it a major source of global greenhouse gas emissions (CO2) that drive climate change.

In fact, a recent study revealed that deforestation and degradation are turning tropical forests into a new net carbon source for the atmosphere, exacerbating climate change.1

The Amazon is the world’s largest tropical forest, and Peru is a key piece of that. Researchers (led by Greg Asner at the Carnegie Institution for Science) recently published the first high-resolution estimate of aboveground carbon in the Peruvian Amazon, documenting 6.83 billion metric tons.2

Here, we analyze this same dataset to estimate the total carbon emissions from deforestation in the Peruvian Amazon between 2013 and 2017. We estimate the loss of 59 million metric tons of carbon during these last five years, the equivalent of around 4% of annual United States fossil fuel emissions.3

We present a series of zoom images to show how carbon loss happened in several key areas impacted by the major deforestation drivers: gold mining, large-scale oil palm and cacao plantations, and smaller-scale agriculture. The labels A-G correspond to the zooms below.

We also show how protected areas are protecting hundreds of millions of metric tons of carbon in some of the most important areas in the country.

On the positive side, having this detailed information may provide added incentives to slow deforestation and degradation as part of critical climate change strategies.


Major Findings

Data: Asner et al 2014

The base map (see above) shows, in shades of green, carbon densities across Peru. It also shows, in red, the forest loss layer from 2013 to 2017.

We calculated the estimated amount of carbon emissions from forest loss during these five years: 59.029 teragrams, or 59 million metric tons.

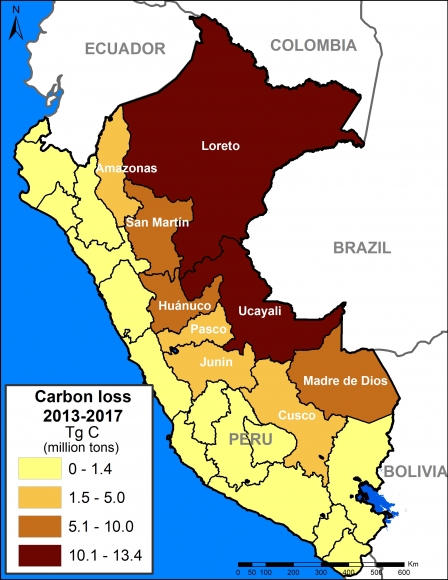
The regions with the most carbon loss are 1) Loreto (13.4 million metric tons), 2) Ucayali (13.2 million), 3) Huánuco (7.3 million), 4) Madre de Dios (7 million), and 5) San Martin (6.9 million).

These values include some natural forest loss. Overall, however, they should be considered underestimates because they do not include forest degradation (for example, selective logging).

A recent study revealed that degradation may account for 70% of emissions, thus total carbon emissions from forests in the Peruvian Amazon may be closer to 200 million metric tons.

Next, we show a series of zoom images to show how carbon loss happened in several key areas. We also show how protected areas and conservation concessions are protecting the most important carbon reserves.


Zoom A: Central Peruvian Amazon

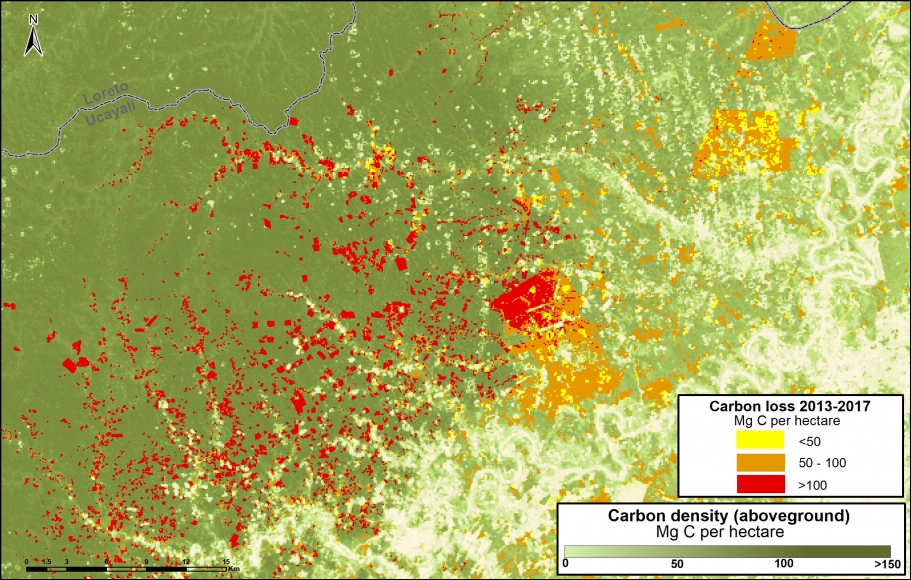
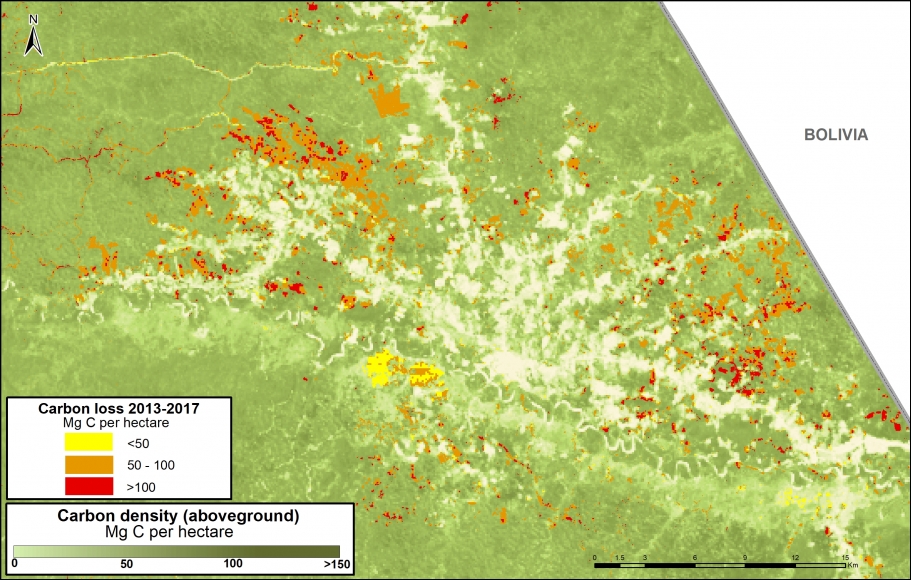
Image A shows the loss of 2.8 million metric tons of carbon in a section of the central Peruvian Amazon (Ucayali region). On the east side of image, note the loss due to two large-scale oil palm plantations (649,000 metric tons); on the west side, note small-scale agriculture penetrating deeper into high carbon density forest.

Image A. Central Peruvian Amazon. Data: Asner et al 2014, MINAM/PNCB

Zoom B: Southern Peruvian Amazon (gold mining) 

Image B shows the loss of 756 thousand metric tons of carbon due to gold mining in the southern Peruvian Amazon (Madre de Dios region). On the east side of image is the sector known as La Pampa; west side is Upper Malinowski.

Image B. Gold mining. Data: Asner et al 2014, MINAM/PNCB

Zoom C: Southern Peruvian Amazon (agriculture)

Image C shows the loss of 876 thousand metric tons of carbon in the southern Peruvian Amazon around the town of Iberia (Madre de Dios region). Note the expanding carbon loss along both sides of the Interoceanic Highway that crosses the image.

Image C. Iberia. Data: Asner et al 2014, MINAM/PNCB

Zoom D: United Cacao

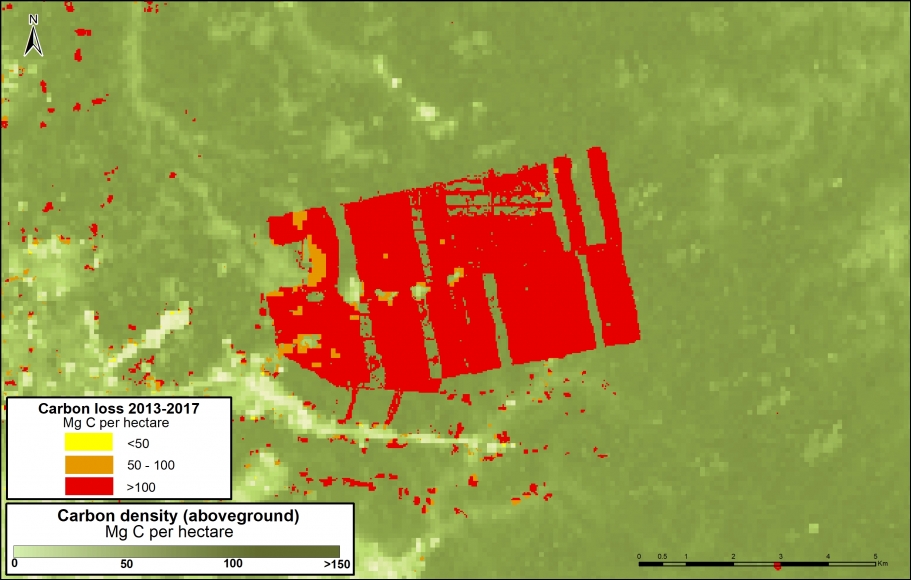
Image D shows the loss of 291 thousand metric tons of carbon for a large-scale cacao project (United Cacao) in the northern Peruvian Amazon (Loreto region). Note that nearly all the forest clearing occurred in high carbon density forest. This is another line of evidence that the company cleared primary forest, contrary to their claims that the area was already degraded.

Image D. United Cacao. Data: Asner et al 2014, MINAM/PNCB

Zoom E: Yaguas National Park

Image E shows how three protected areas, including the new Yaguas National Park, are effectively safeguarding 202 million metric tons of carbon in the northeastern Peruvian Amazon. This area is home to some of the highest carbon densities in the country.

Image E. Yaguas. Data: Asner et al 2014, MINAM/PNCB

Zoom F: Los Amigos Conservation Concession

Image F shows how Los Amigos, the world’s first conservation concession, is effectively safeguarding 15 million metric tons of carbon in the southern Peruvian Amazon. Two surrounding protected areas, Manu National Park and Amarakaeri Communal Reserve, safeguard an additional 194 million metric tons. This area is home to some of the highest carbon densities in the country.

Image F. Los Amigos. Data: Asner et al 2014, MINAM/PNCB

Zoom G: Sierra del Divisor National Park

Image G. Data: Asner et al 2014, MINAM/PNCB

Image G shows how three protected areas, including the new Sierra del Divisor National Park, are effectively safeguarding 270 million metric tons of carbon in the eastern Peruvian Amazon.

This area is home to some of the highest carbon densities in the country.


Methodology

Para el análisis se utilizó los datos de carbono sobre el suelo  generados por Asner et al 2014, y los datos de pérdida de bosques identificados por el Programa Nacional de Conservación de Bosques (PNBC-MINAM) de los años 2013 al 2016 así como las alertas tempranas del año 2017. Primero uniformizamos los datos de pérdida de bosque 2013-2016 con las alertas tempranas del año 2017 para evitar superposición y tener un solo dato 2013-2017. Posteriormente, extraemos los datos de carbono de las áreas de pérdida de bosque del 2013-2017, este proceso permitió obtener la densidad de carbono (por hectárea) en relación al área de la pérdida de bosque para finalmente estimar el total de stocks de carbono perdido entre el año 2013 al 2017.

References

Baccini A, Walker W, Carvalho L, Farina M, Sulla-Menashe D, Houghton RA (2017) Tropical forests are a net carbon source based on aboveground measurements of gain and loss. Science. 13;358(6360):230-4.

Asner GP et al (2014). The High-Resolution Carbon Geography of Perú. Carnegie Institution for Science.

Boden TA, Andres RJ, Marland G (2017) National CO2 Emissions from Fossil-Fuel Burning, Cement Manufacture, and Gas Flaring: 1751-2014. DOI 10.3334/CDIAC/00001_V2017

Citation

Finer M, Mamani N (2017). Carbon loss from deforestation in the Peruvian Amazon. MAAP: 81.

Acknowledgments

This report was made possible by the generous support of the Norwegian Agency for Development Cooperation (NORAD).


MAAP #22: Yaguas – Another Big Conservation Opportunity for Peru

Peru recently celebrated a major conservation victory for 2015 with the creation of Sierra del Divisor National Park. Prior to this announcement, Sierra del Divisor was classified as a Reserved Zone, which is a temporary measure to protect an area of biological importance until the government is able to determine a final designation. In these cases, national park status represents the strongest possible final designation.

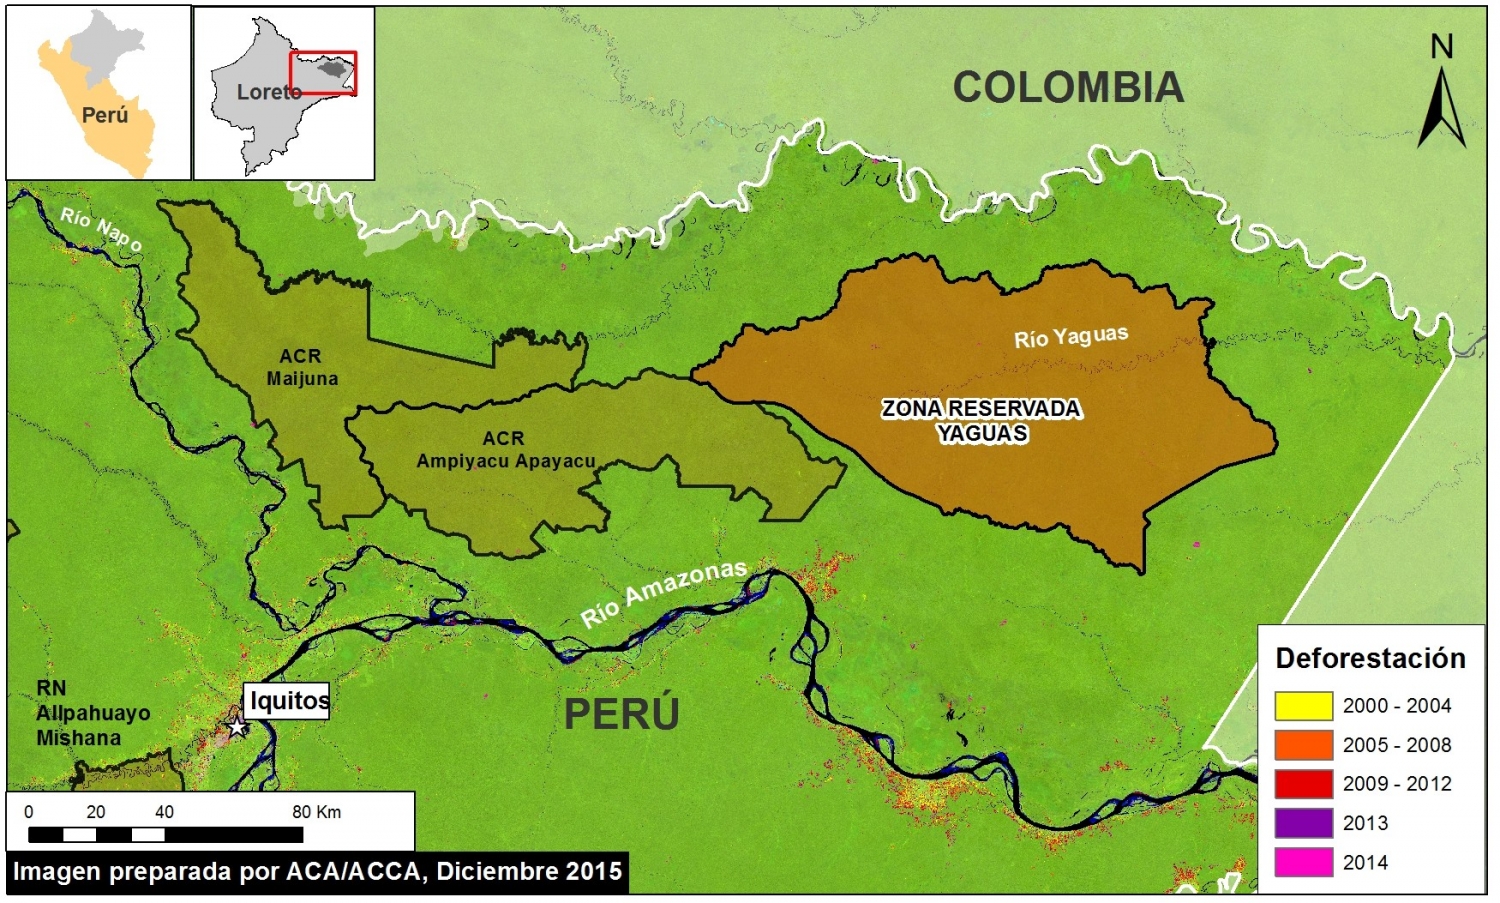
Now in 2016, there is the opportunity for another major conservation victory in Peru: creation of Yaguas National Park. Yaguas received Reserved Zone status in 2011 and is now awaiting its final designation. Yaguas Reserved Zone is both big (868,928 hectares or 2,147,168 acres) and remote, located in extreme northeast Peru within the department of Loreto (see Image 22a).

1. MAAP_Yaguas_2x_a_v4
Image 22a. Yaguas Reserved Zone. Data: USGS, SERNANP, PNCB/MINAM, Hansen/UMD/Google/USGS/NASA

Note that Yaguas is a critical part of a series of protected areas that provide landscape level biological connectivity in northeast Peru. In addition, Yaguas borders and complements a large protected Colombian landscape, forming one of the largest assemblies of protected areas and indigenous lands in the Amazon.

Deforestation Analysis

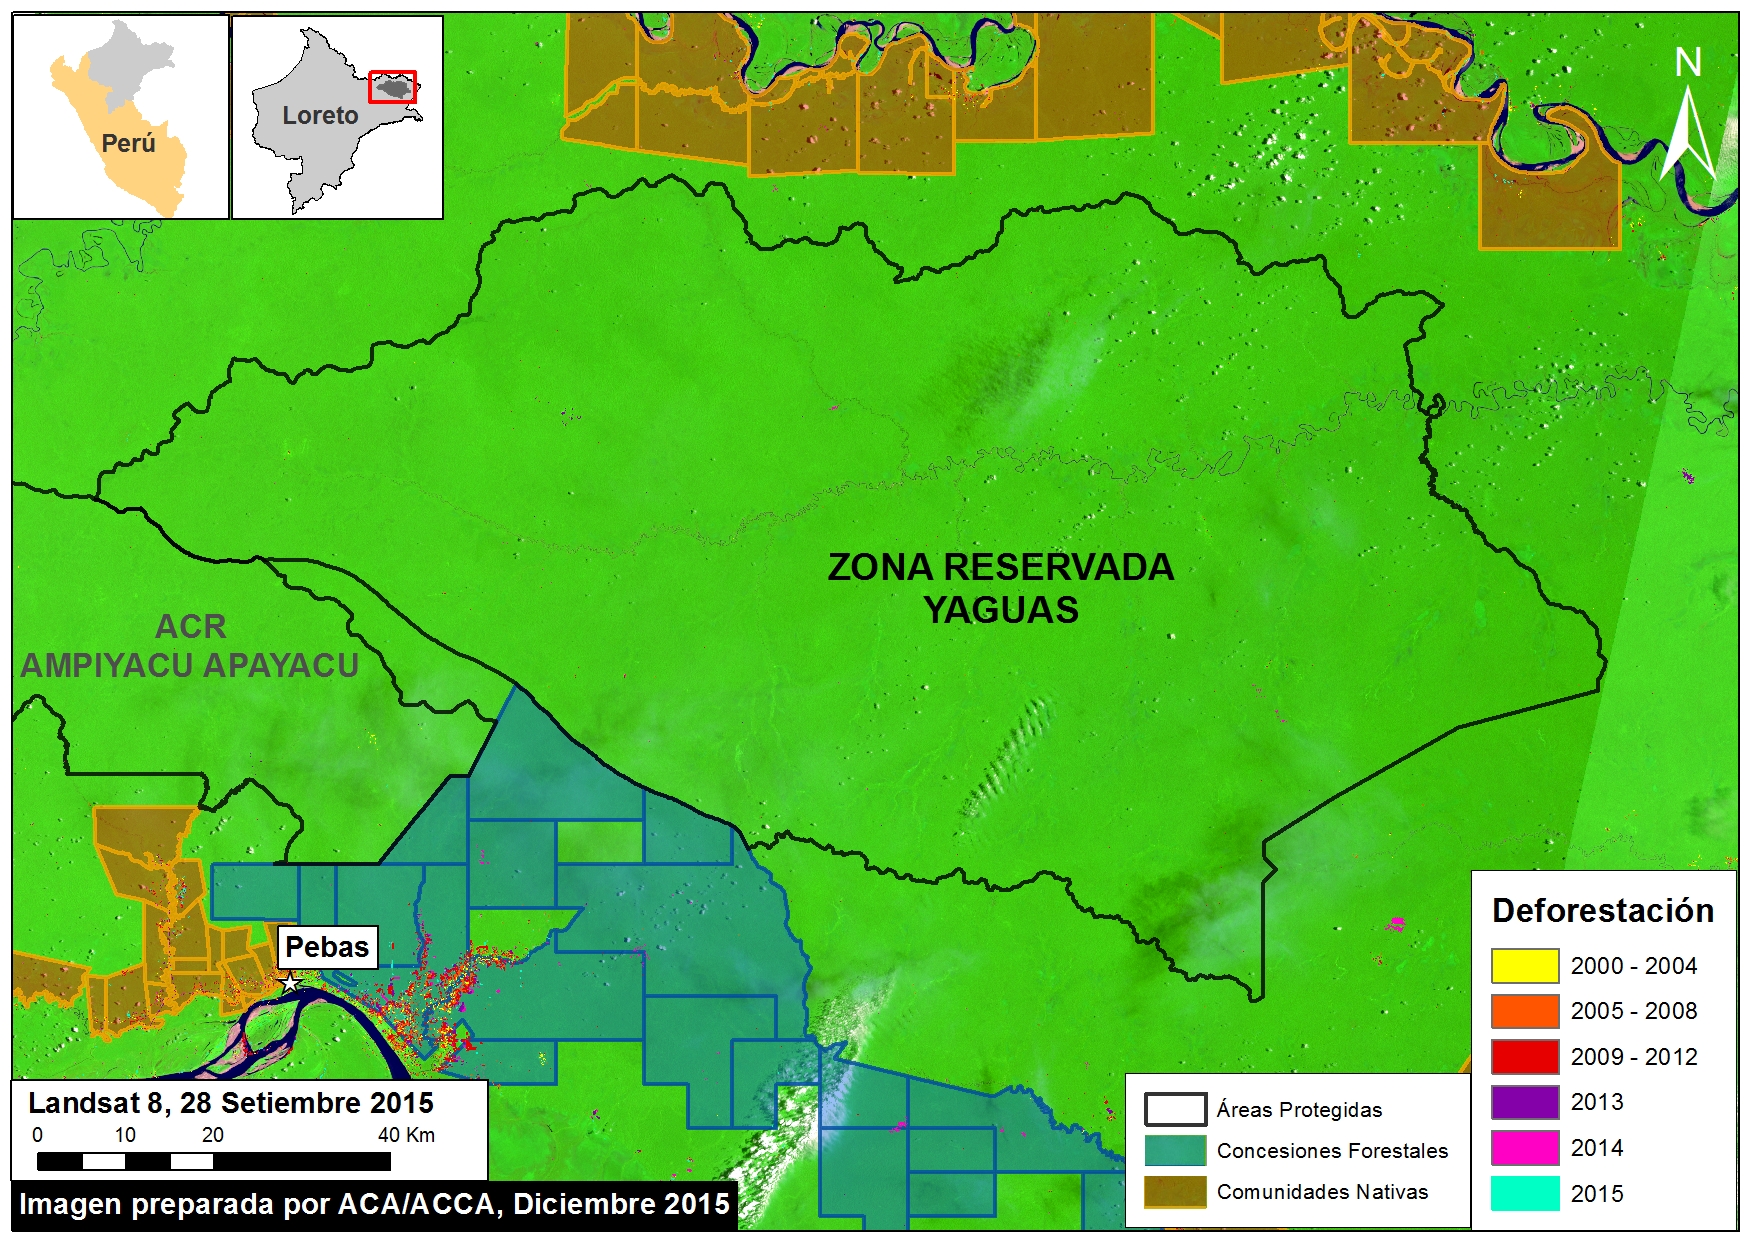
Yaguas Reserved Zone is the rare example of an area in extremely good conservation condition. As seen In Image 22b, we detected virtually no deforestation within or surrounding the reserve. Note that the background in Image 22b is a Landsat image (30 m resolution) from December 2015 showing the reserve is completely covered with intact forest.

2. MAAP_Yaguas_a_v2_es
Image 22b. Yaguas Deforestation analysis. Data: USGS, PNCB/MINAM, Hansen/UMD/Google/USGS/NASA, MINAGRI, SERNANP

Carbon Analysis

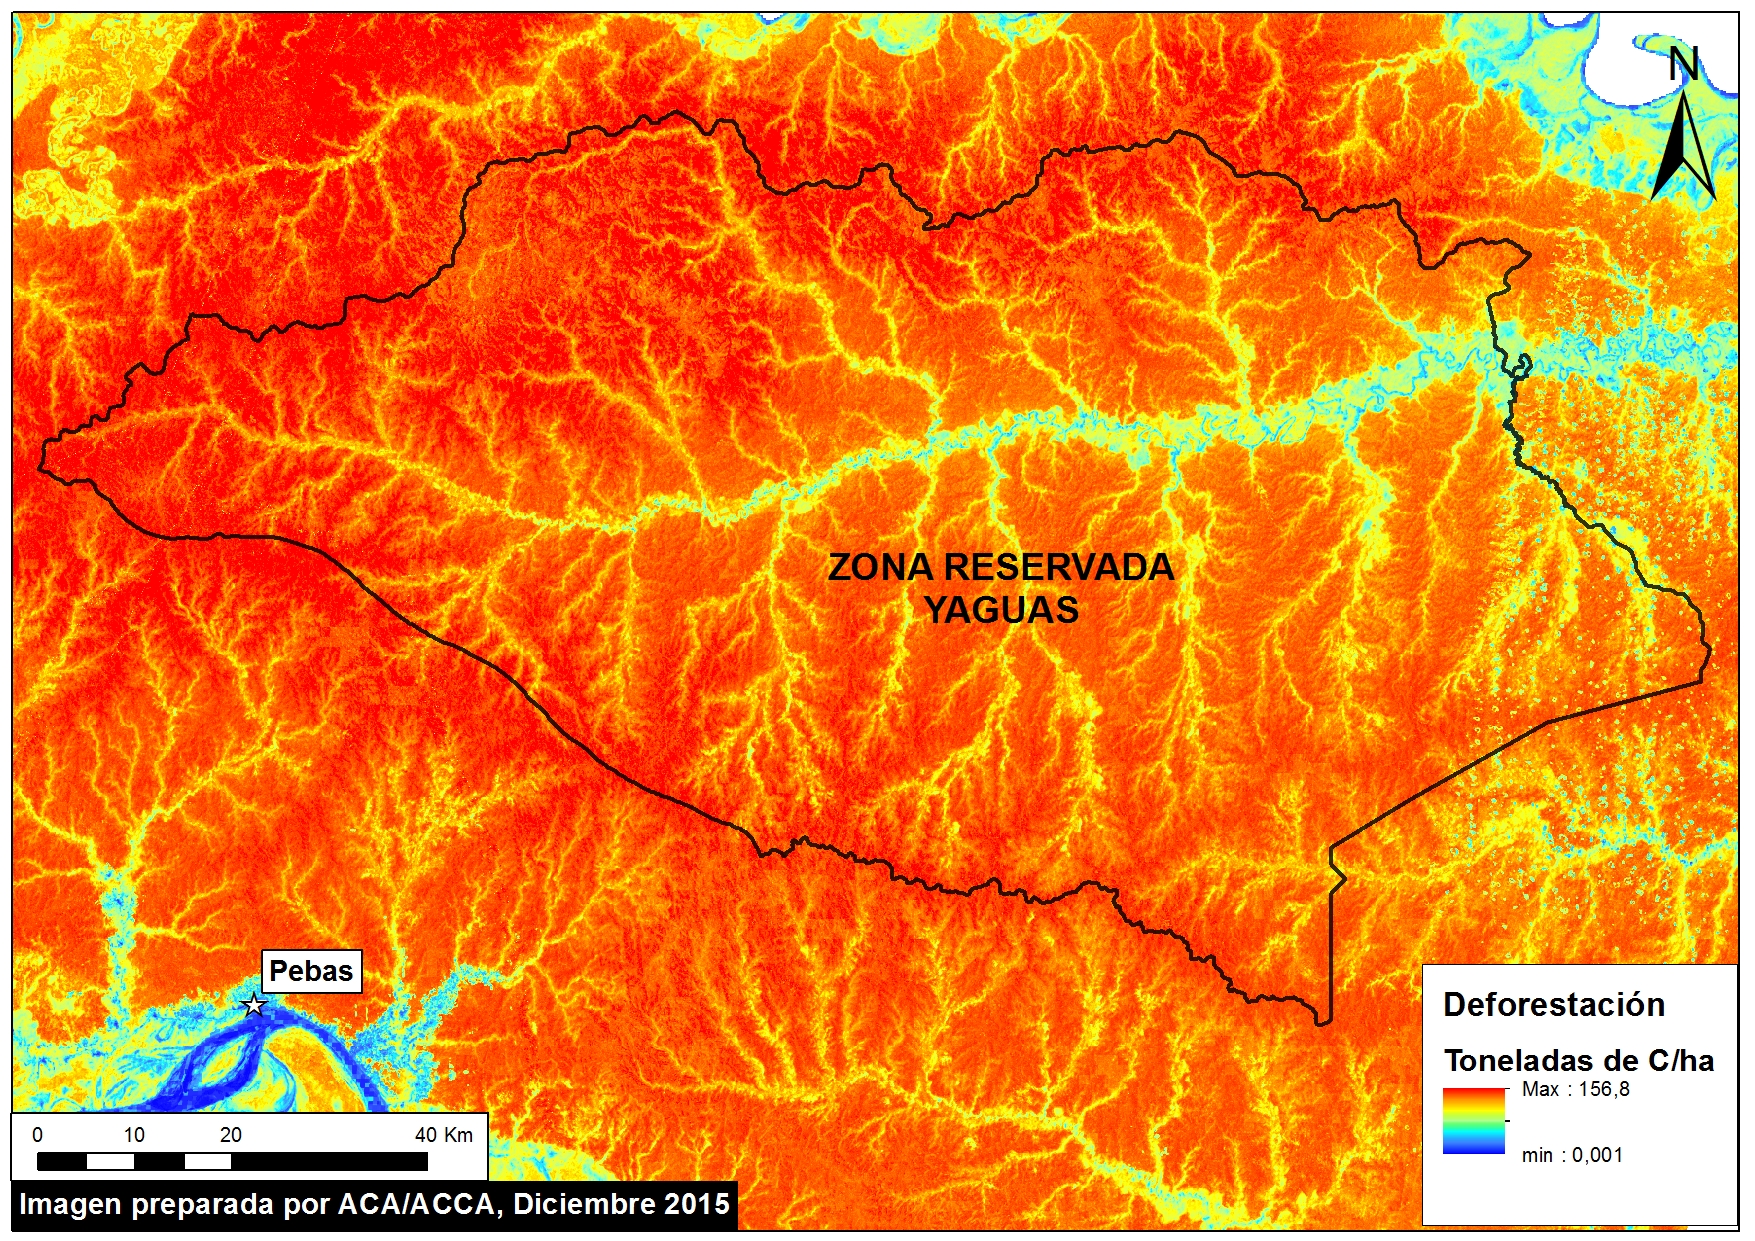
Dr. Greg Asner (Carnegie Institution for Science) and the Peruvian Ministry of the Environment recently produced a high-resolution carbon map of Peru (Asner et al. 2014 a,b). As seen in Image 22c, much of the reserve contains very high carbon levels. Using this data, we calculated that Yaguas Reserved Zone contains approximately 102 million metric tons of above-ground carbon, one of the highest totals for a protected area in all of Peru.

3. MAAP_Yaguas_carbono
Image 22c. High-resolution carbon geography of the Yaguas Reserved Zone. Data: Asner et al. 2014 a,b.

Asner GP, Knapp DE, Martin RE, Tupayachi R, Anderson CB, et al. (2014 a) Targeted carbon conservation at national scales with high-resolution monitoring. Proceedings of the National Academy of Sciences111(47), E5016-E5022.

Asner GP, Knapp DE, Martin RE, Tupayachi R, Anderson CB, et al. (2014 b) The high-resolution carbon geography of Peru. Berkeley, CA: Minuteman Press.

Biodiversity

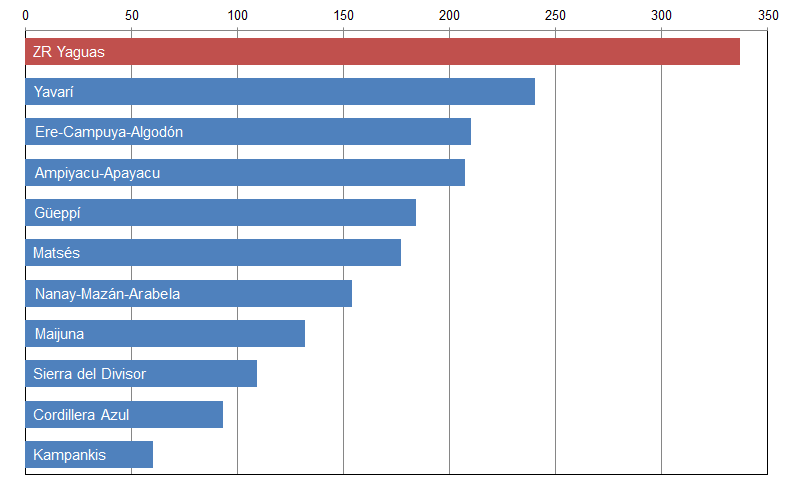
The Yaguas Reserved Zone also contains extremely high levels of biodiversity, particularly for fish. In fact, according to a rapid biological inventory by the Field Museum in 2010, Yaguas may be home to the highest fish diversity in Peru. During the inventory, scientists recorded 337 fish species in three weeks, far more than any other rapid inventory in Peru (see Image 22d). Biologists estimate that Yaguas is home to around 550 fish species, making it one of South America’s most diverse aquatic ecosystems.

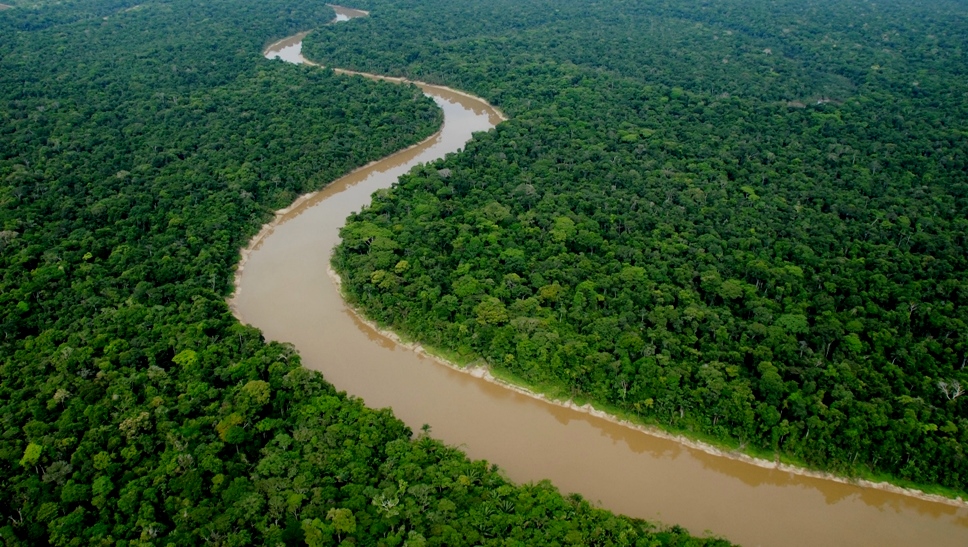
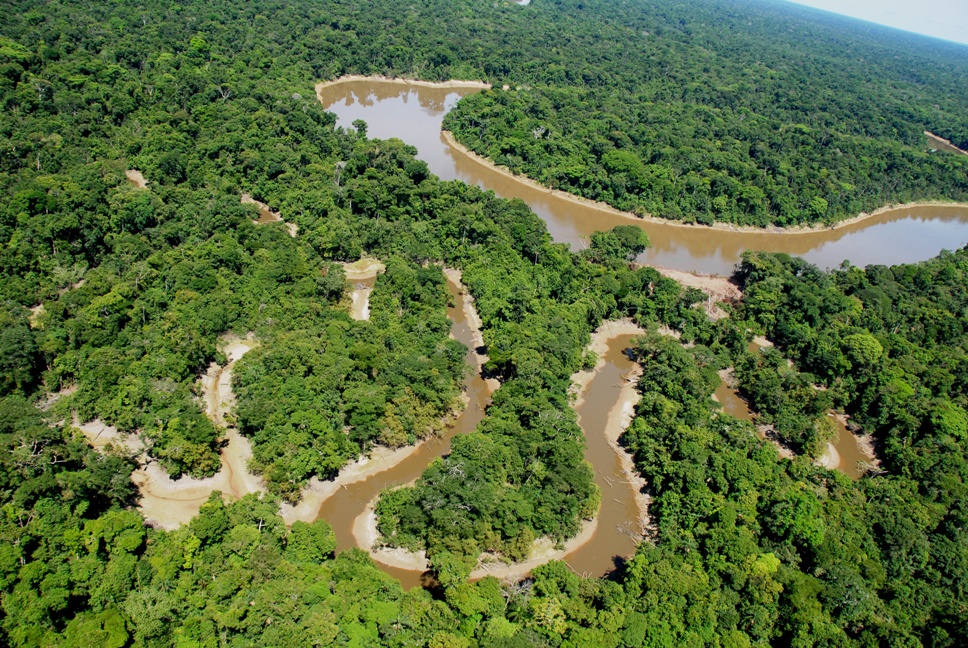
The Reserved Zone (and proposed national park) was specifically designed to protect this extraordinary aquatic diversity. It contains a complete gradient of lowland river aquatic habitats, from headwaters (first order and intermediate) and springs to lowland areas encompasing habitats such as floodplains, lakes, swamps, bogs, and a meandering main river (see Images 22e and 22f). Importantly, unlike most of the major rivers protected by Peruvian national parks, the Yaguas River is born in the Amazon lowlands, not in the Andes. Thus, it contains hydrological processes and riparian habitats that are not yet strictly protected by the Peruvian system of protected areas.

Image Xd. Number of fish species recorded in rapid inventories of the Yaguas Reserved Zone and 10 other sites in Loreto, Peru. Data: http://fm2.fieldmuseum.org/rbi/results.asp
Image 22d. Number of fish species recorded in rapid inventories of the Yaguas Reserved Zone and 10 other sites in Loreto, Peru. Data: http://fm2.fieldmuseum.org/rbi/results.asp


Image Xe. Aerial view of Yaguas River. Photo Credit: Alvaro del Campo (Field Museum)
Image 22e. Aerial view of Yaguas River. Photo Credit: Alvaro del Campo (Field Museum)
Quebrada_Cachimbo_1_ADC
Image 22f. Aerial view of Yaguas River and the Cachimbo tributary. Photo Credit: Alvaro del Campo (Field Museum)

References:

Hidalgo, M. H., y A. Ortega-Lara. 2011. Peces. Pp. 98–108 y 308–329 en N. Pitman, C. Vriesendorp, D. K. Moskovits, R. von May, D. Alvira, T. Wachter, D. F. Stotz y Á. del Campo, eds. Perú: Yaguas-Cotuhé. Rapid Biological and Social Inventories Report 23. The Field Museum, Chicago. http://fm2.fieldmuseum.org/rbi/results_23.asp

Pitman, N., C. Vriesendorp, D. K. Moskovits, R. von May, D. Alvira, T. Wachter, D. F. Stotz y Á. del Campo, eds. 2011. Perú: Yaguas-Cotuhé. Rapid Biological and Social Inventories Report 23. The Field Museum, Chicago. http://fm2.fieldmuseum.org/rbi/results_23.asp

Acknowledgments

We thank the Field Museum and Instituto del Bien Común for helpful comments and information.

Citation

Finer M, Novoa S (2015) Another Big Conservation Opportunity for Peru: Yaguas.