In the previous MAAP #51, we gave an initial impact assesment regarding the recent wave of fires in protected areas in northern Peru. Here, we provide a more comprehensive update.
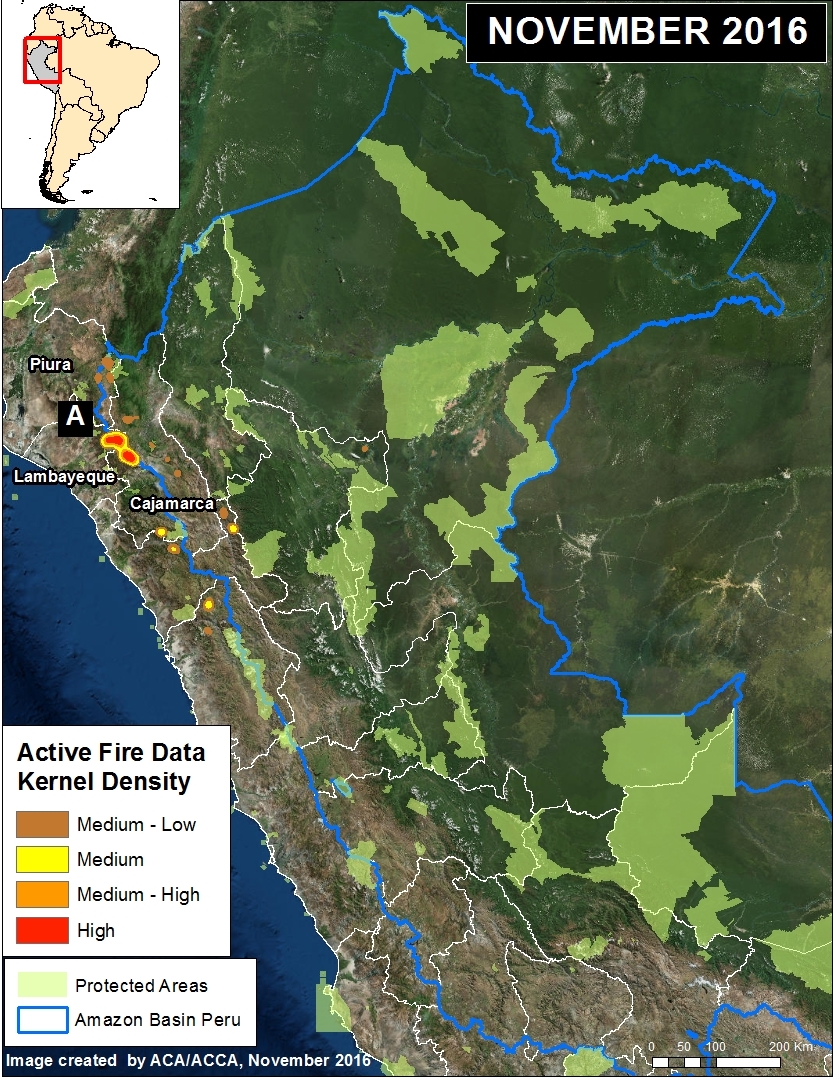
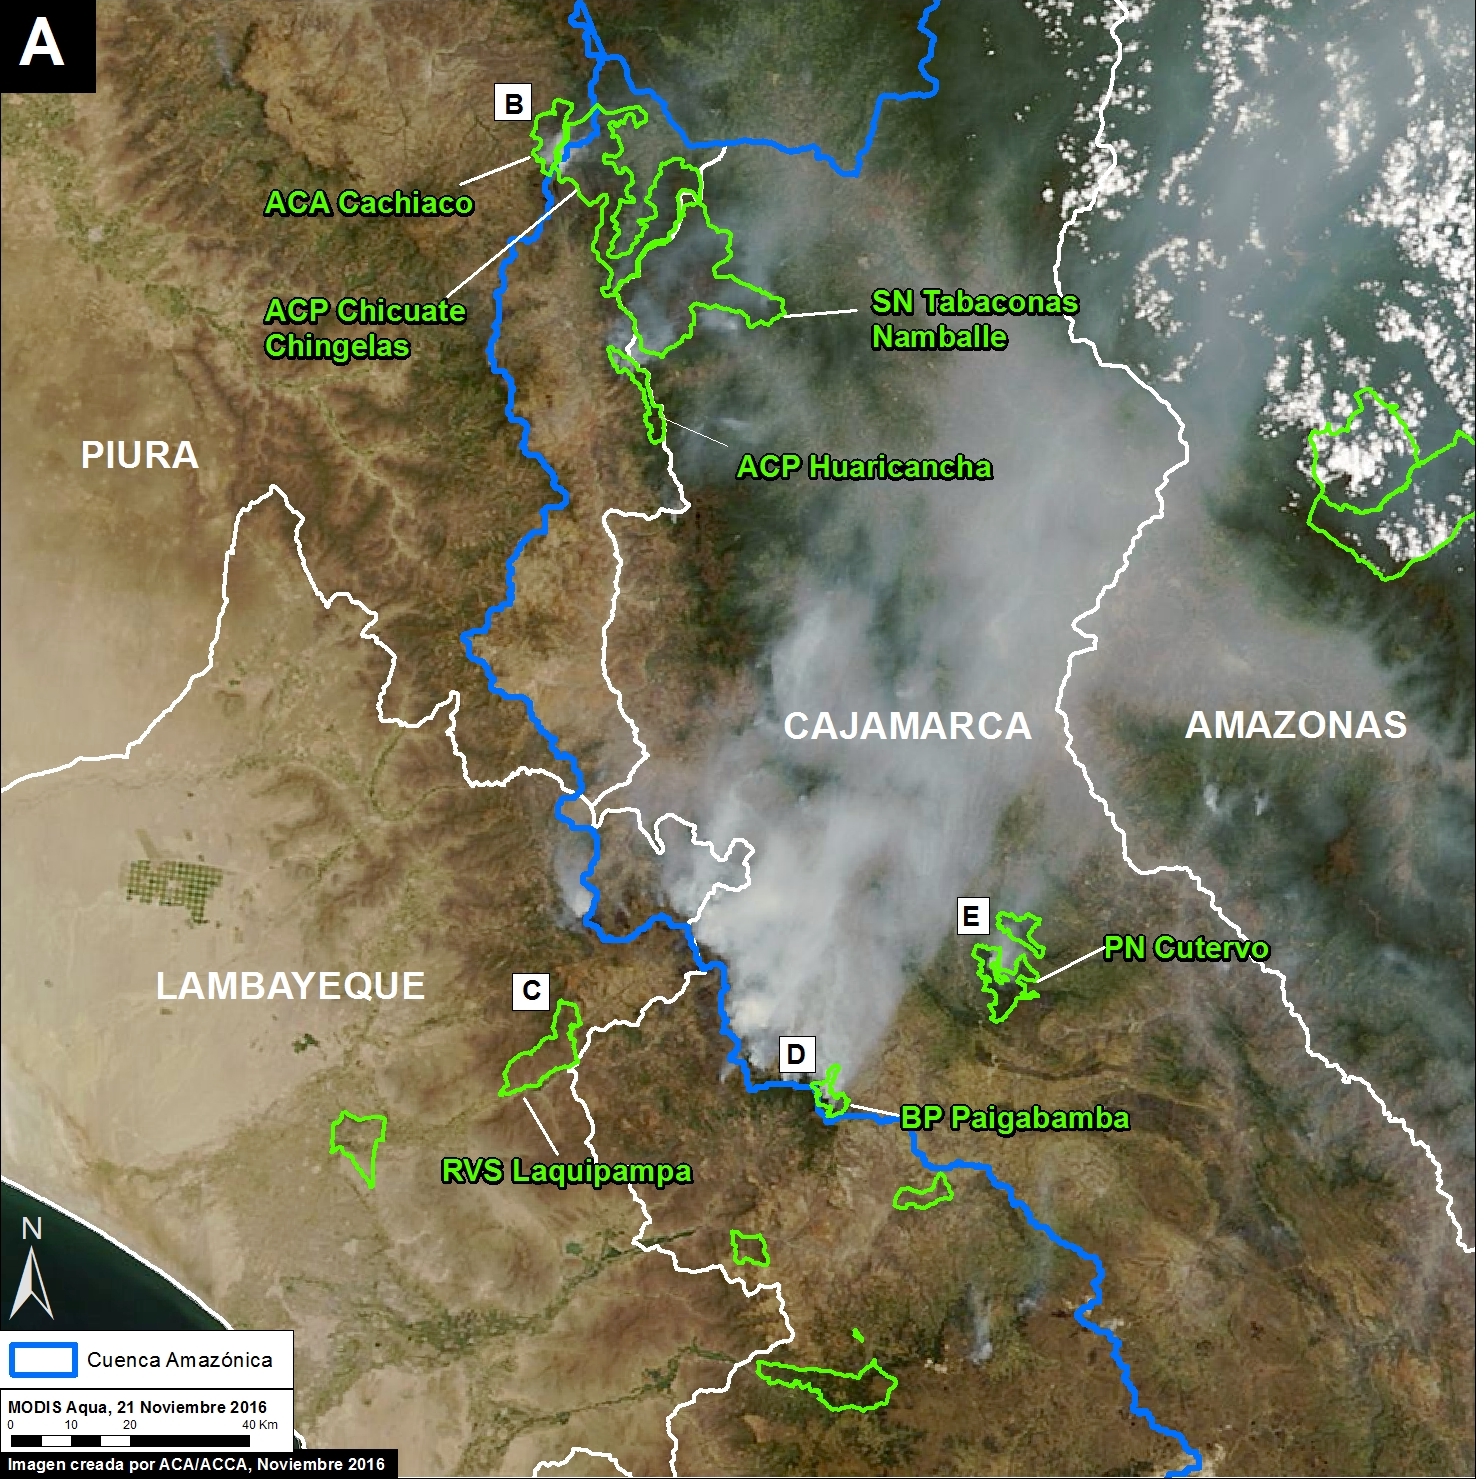
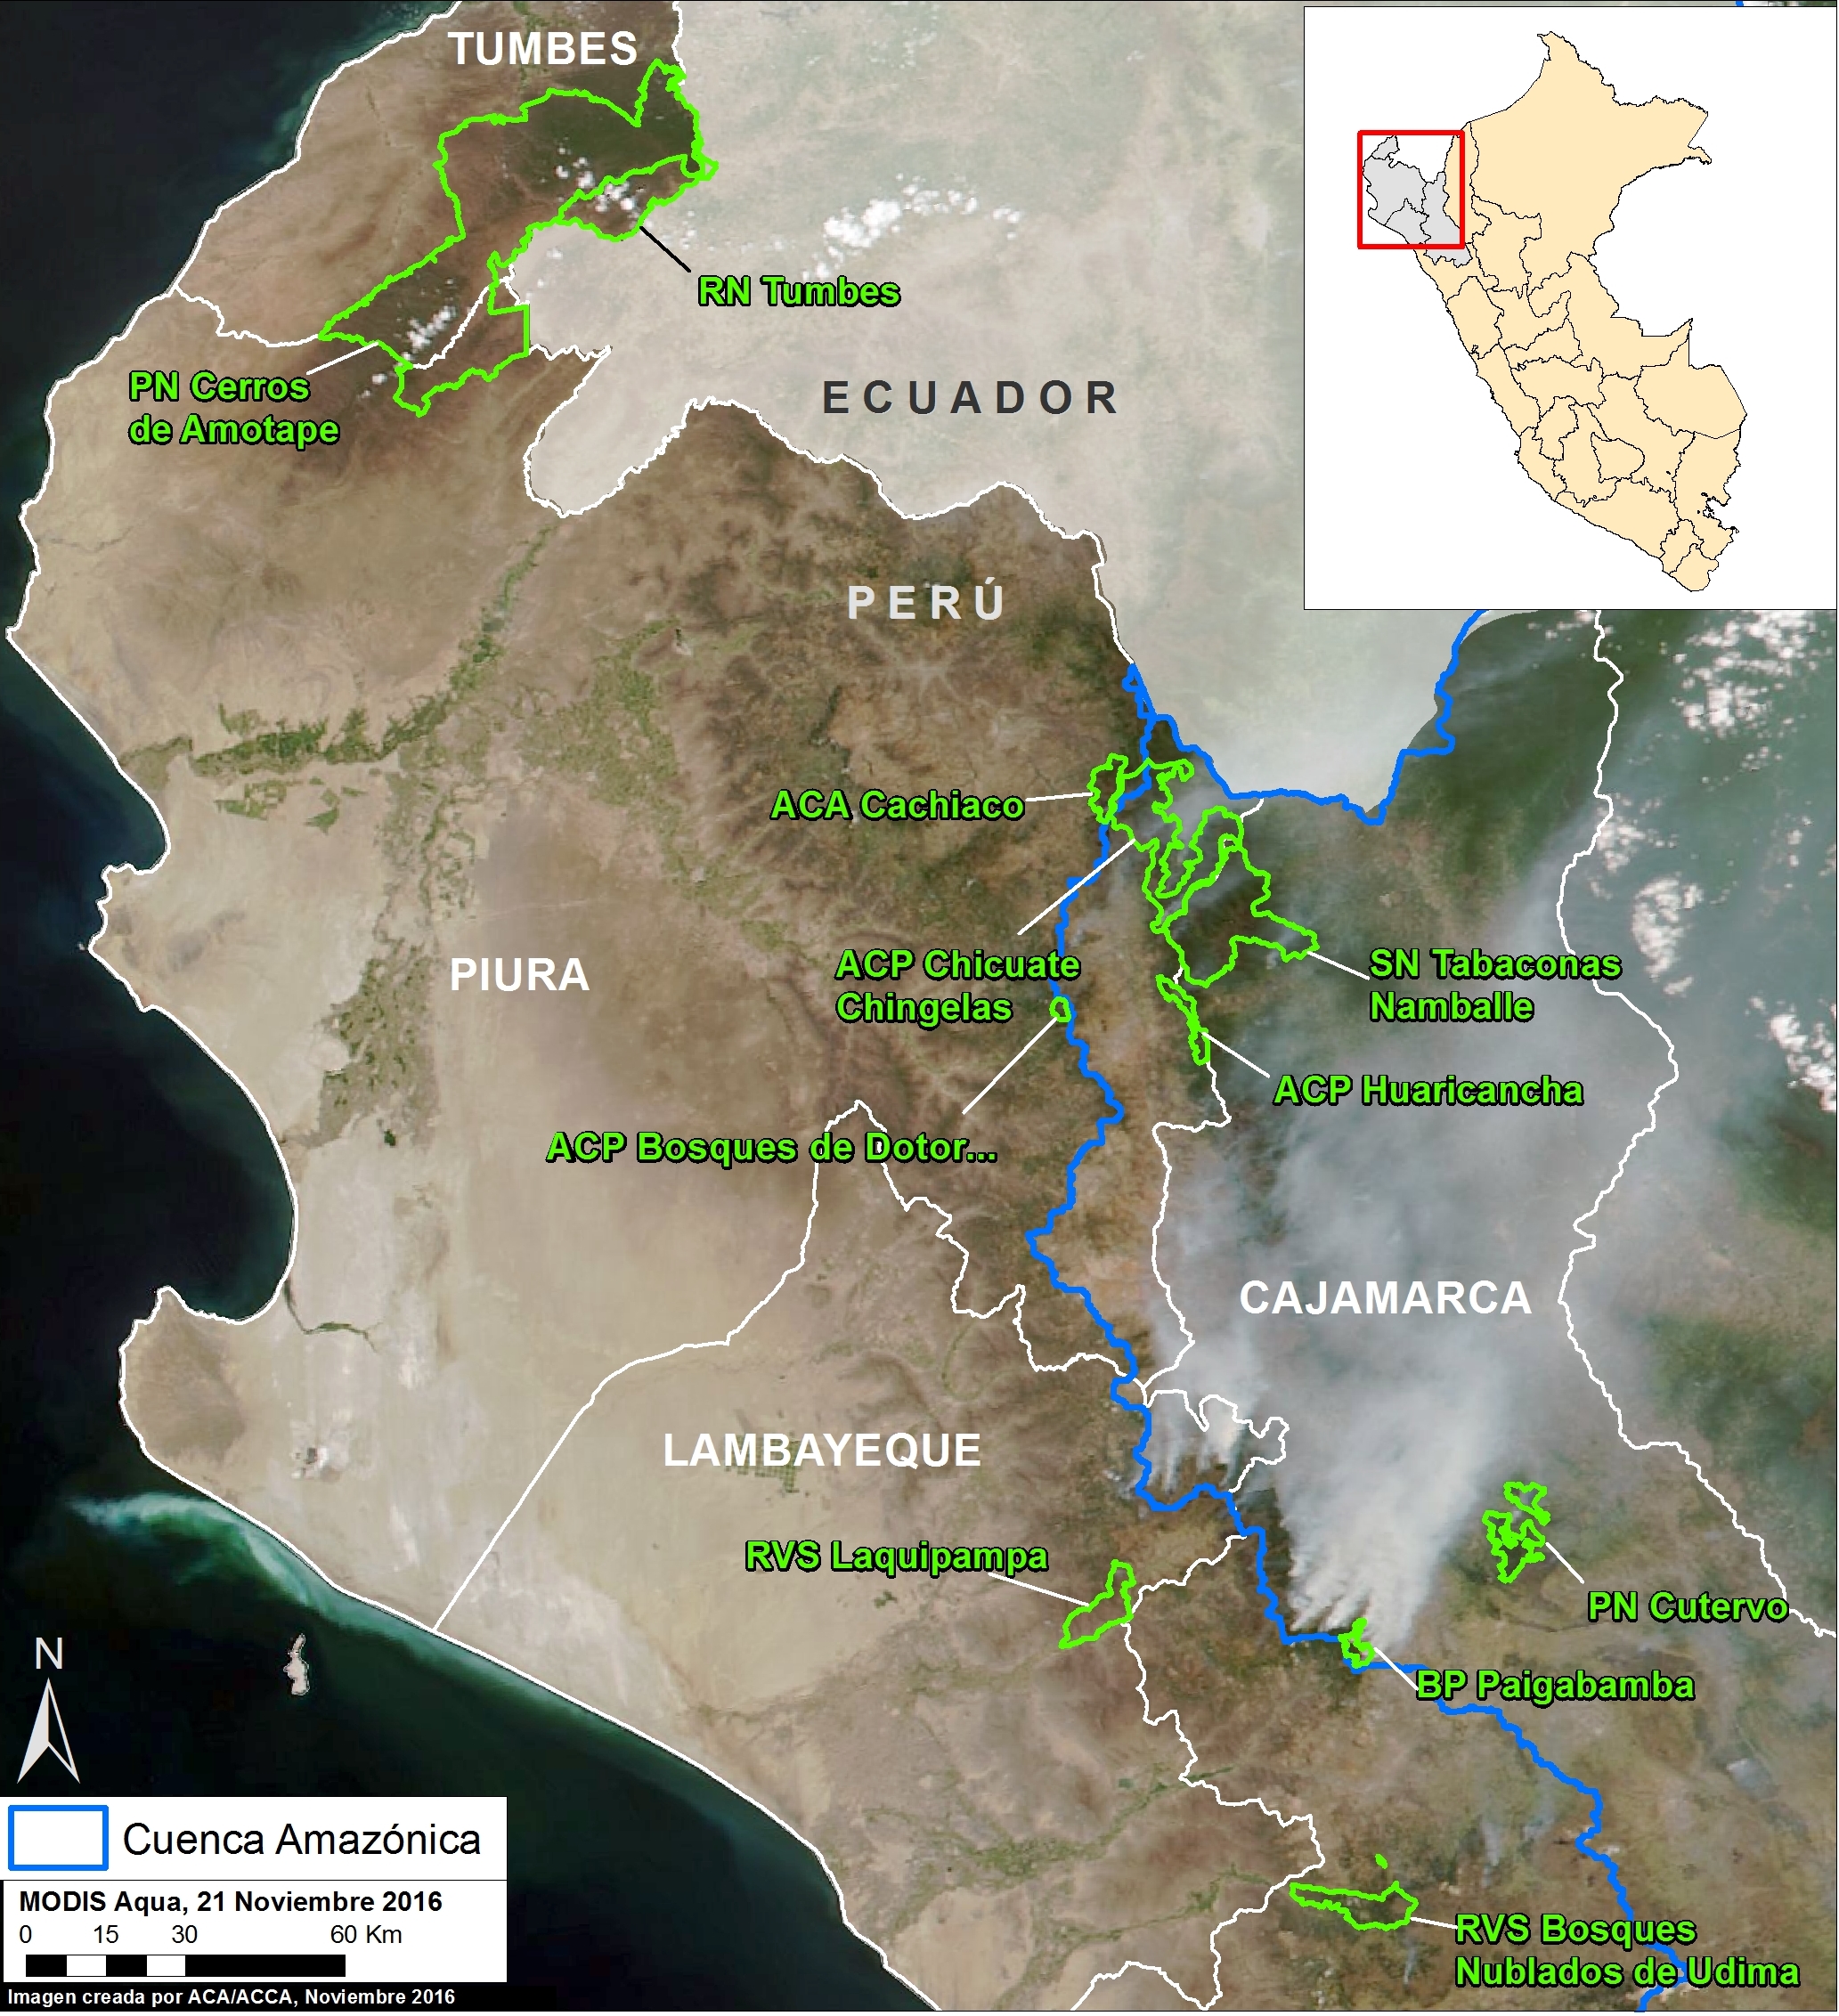
Our revised estimate is 6,594 acres (2,668 hectares) burned in 11 Protected Areas (see Image 52a) in late 2016. Note that the image is from November and smoke from the fires is clearly seen.
The majority (4,165 acres) occured in 7 national protected areas under national administration (Cutervo National Park, Pagaibamba Protected Forest, Laquipampa Wildlife Refuge, Tumbes National Reserve, Cerros de Amotape National Park, Tabaconas-Namballe National Sanctuary, Udima Wildlife Refuge).*
The estimates refer to areas directly affected by fires (i.e. burned) and come from two sources: our analysis of satellite images and field information from SERNANP, the Peruvian protected areas agency.
It appears that the primary cause of these fires is poor agricultural burning practices during a time of intense drought. These conditions allowed fires to escape into protected areas.
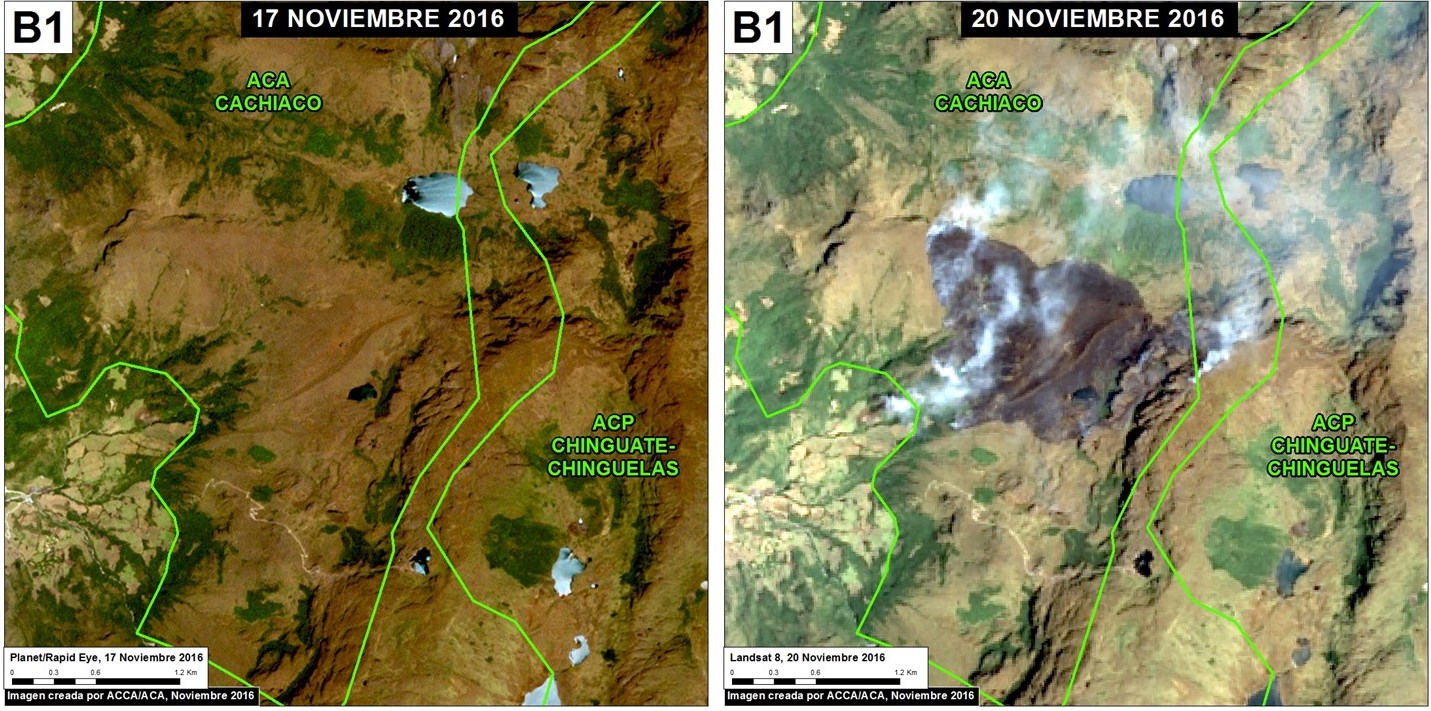
Below, we show a series of new satellite images of some of the burn areas (for images of other areas, see MAAP #51). We also publish a statement from SERNANP.
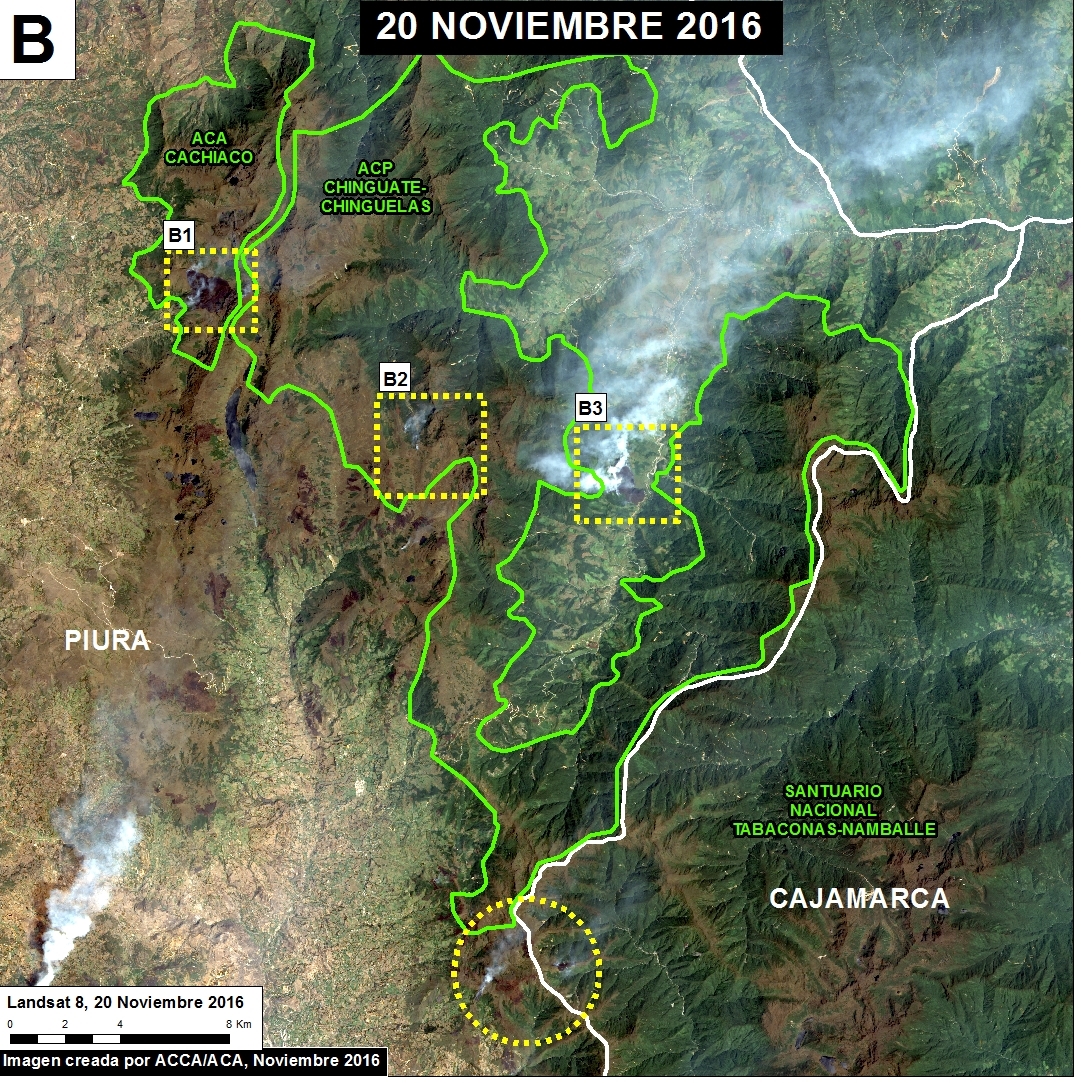
*The rest occured in 3 national protected areas under private administration (Chicuate-Chinguelas, Huaricancha, and Bosques de Dotor Private Conservation Areas; 1,927 acres) and 1 municipal protected area (ACA Cachiaco-San Pablo; 502 acres).
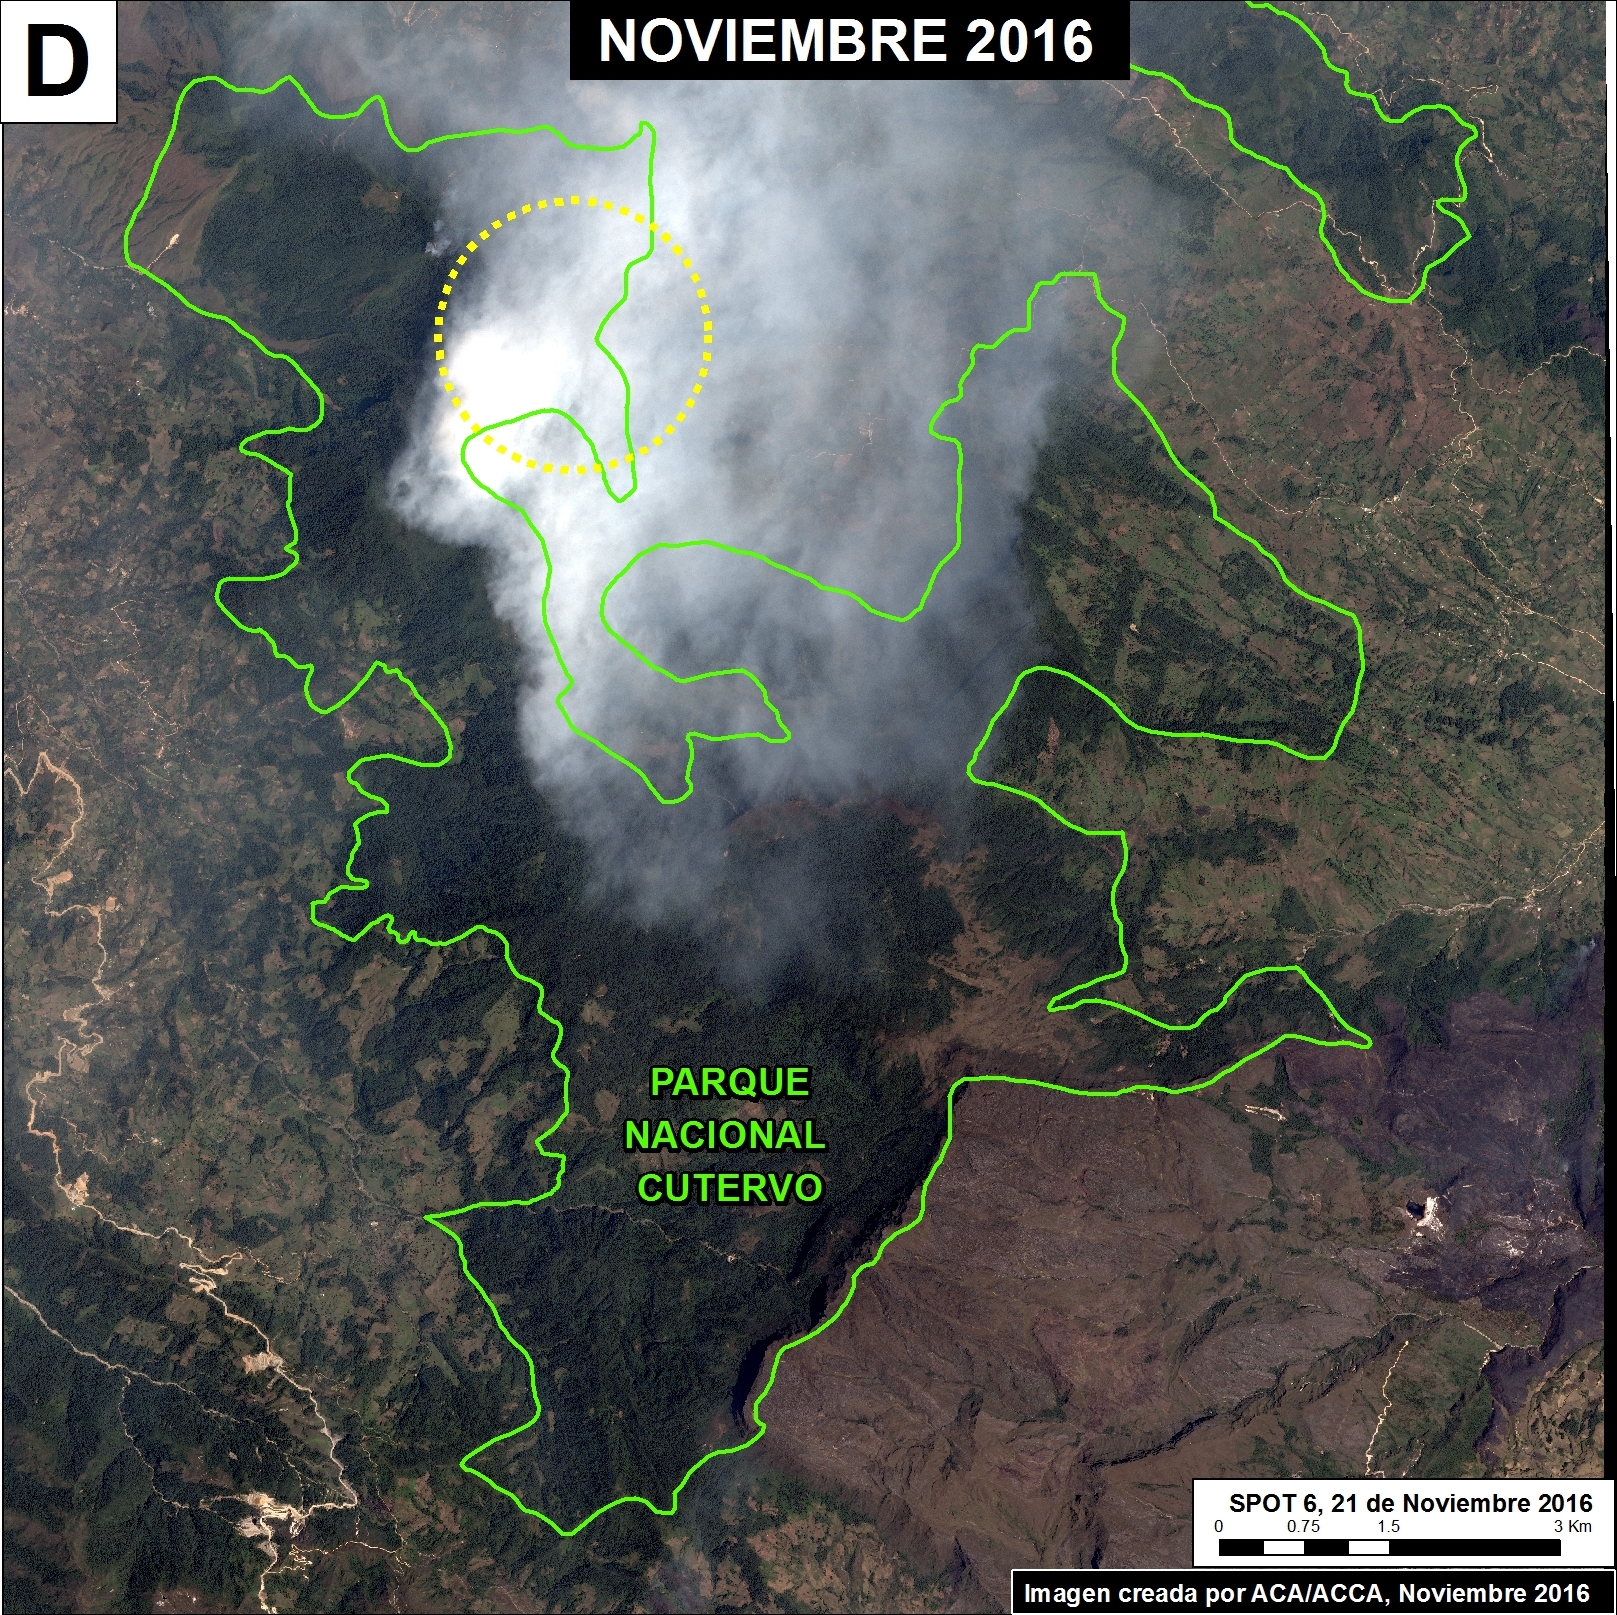
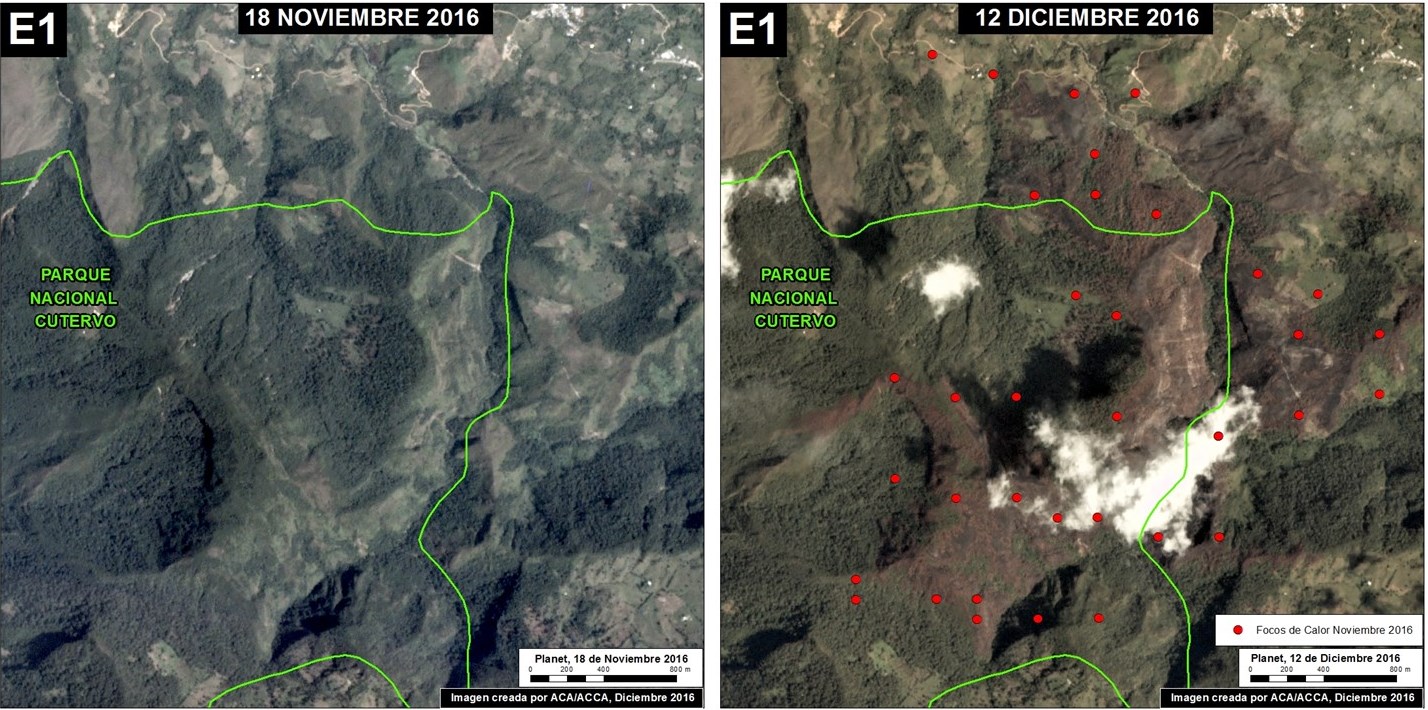
Cutervo National Park
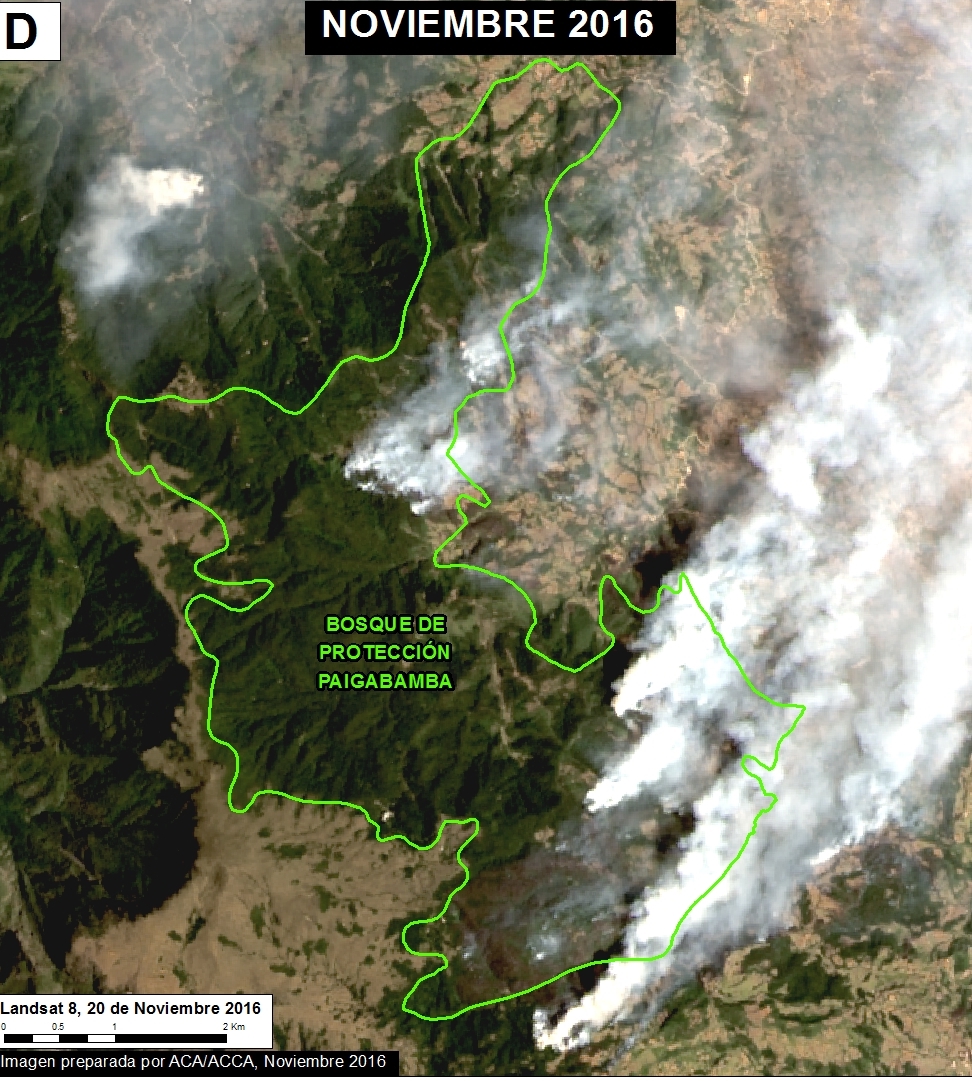
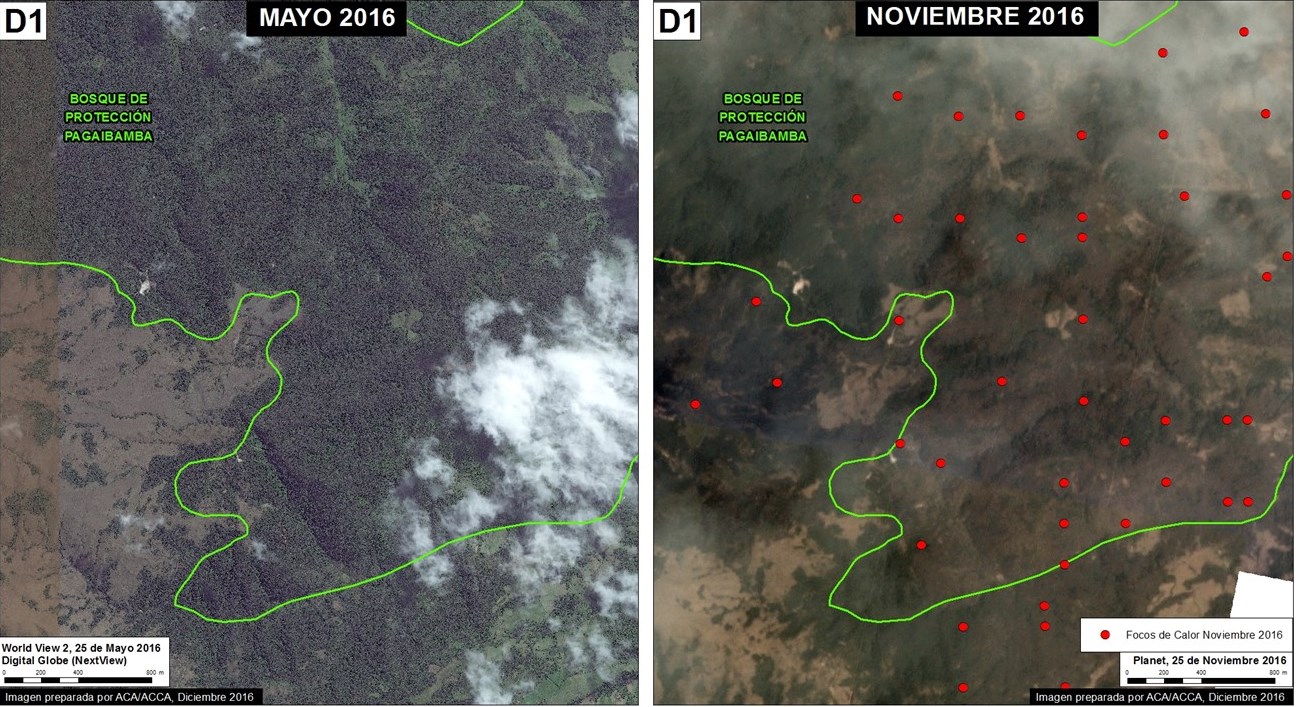
Pagaibamba Protected Forest
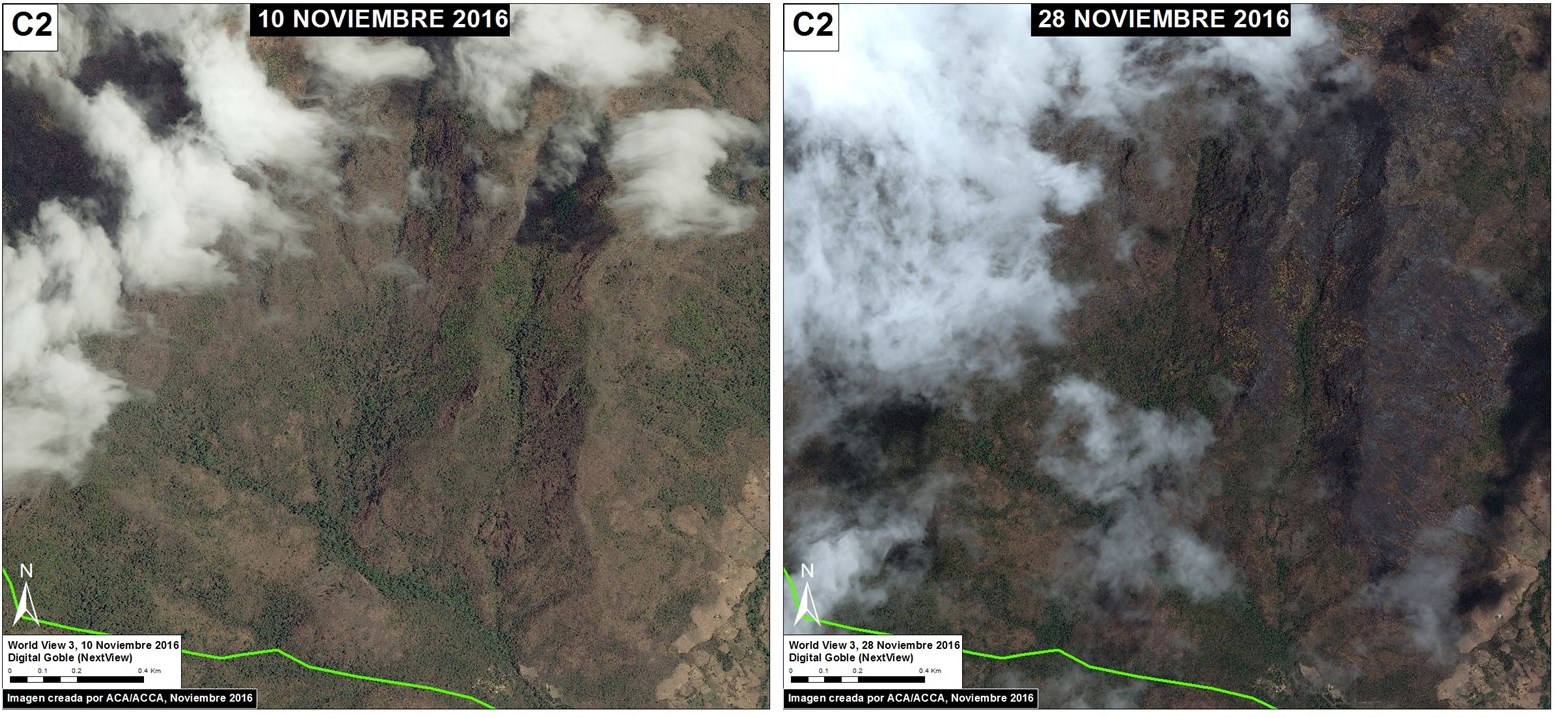
The following image shows a comparison of the southern sector of Pagaibamba Protected Forest before (left panel) and after (right panel) the fires. The red dots indicate the fire alerts. SERNANP estimates the burn area within the protected forest at 1,013 acres (see SERNANP statement below).
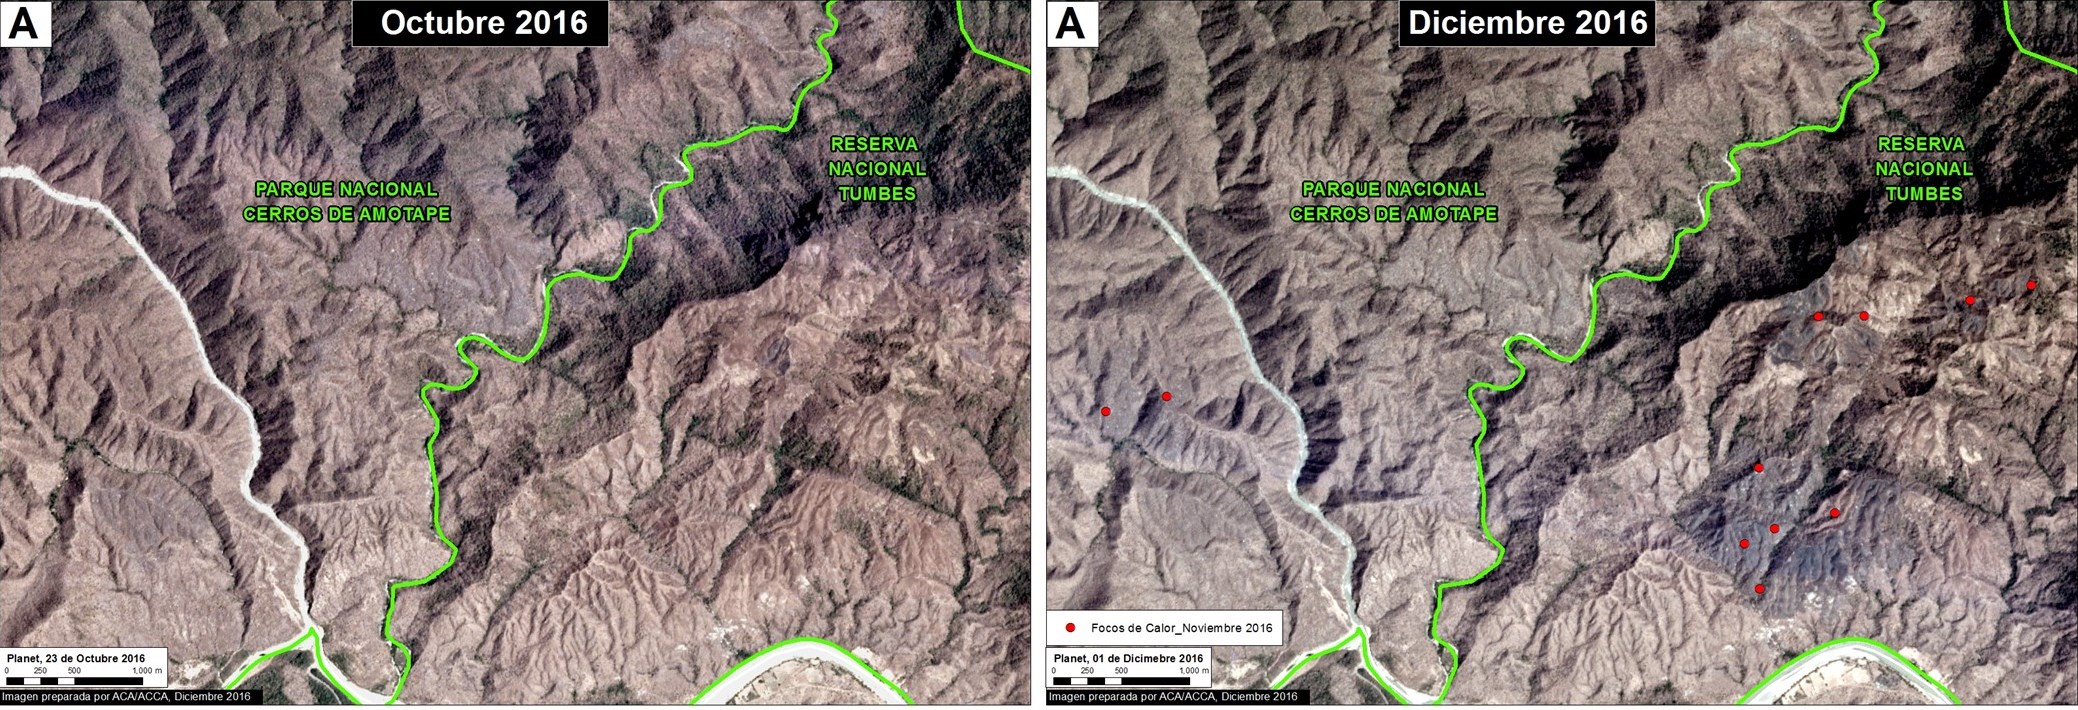
Tumbes National Reserve
The following image shows a comparison of the western sector of Tumbes National Reserve before (left panel) and after (right panel) the fires. It also shows the smaller burn area within Cerros de Amotape National Park. The estimated burn area within the two adjacent protected areas is 1,285 acres. The red dots indicate the fire alerts.
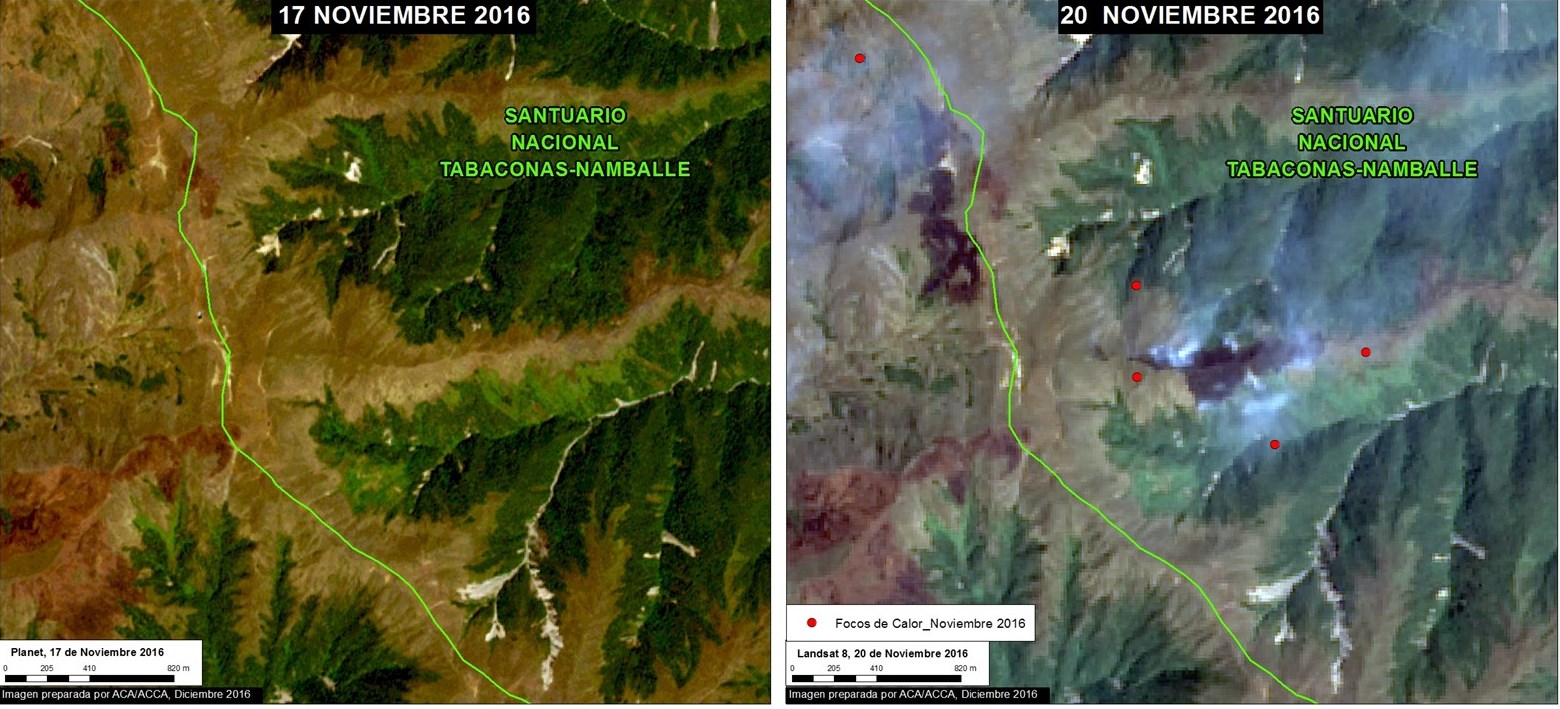
Tabaconas-Namballe National Sanctuary
The following image shows a comparison of the western sector of Tabaconas-Namballe National Sanctuary before (left panel) and after (right panel) the fires. The estimated burn area within the national sanctuary is 35 acres. The red dots indicate the fire alerts.
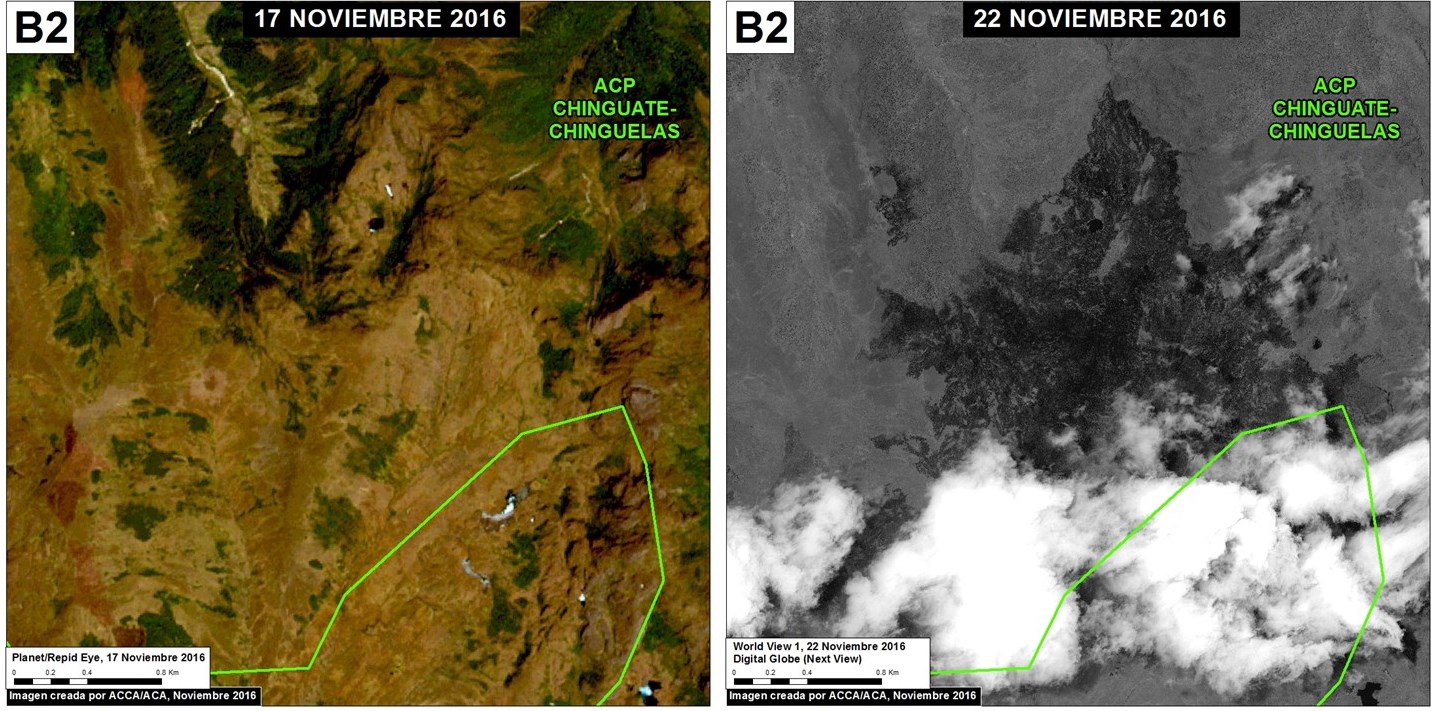
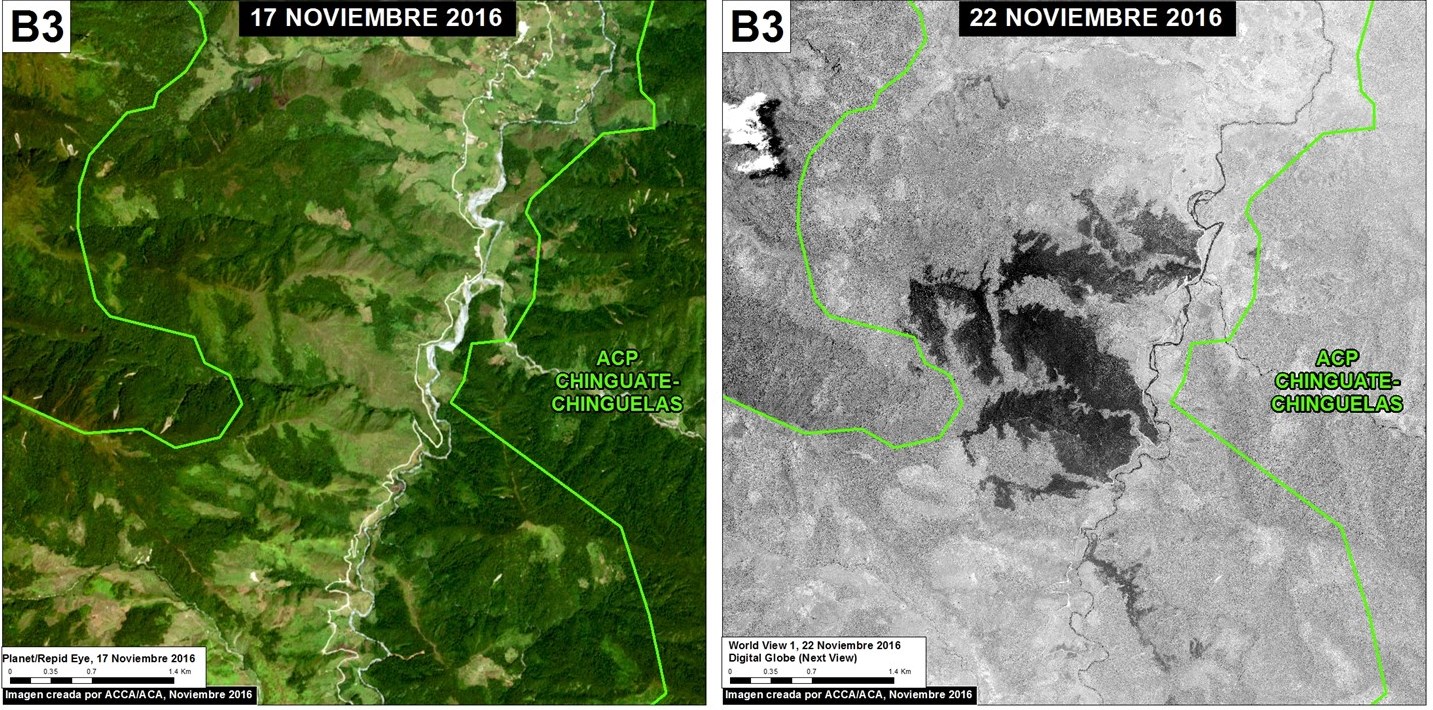
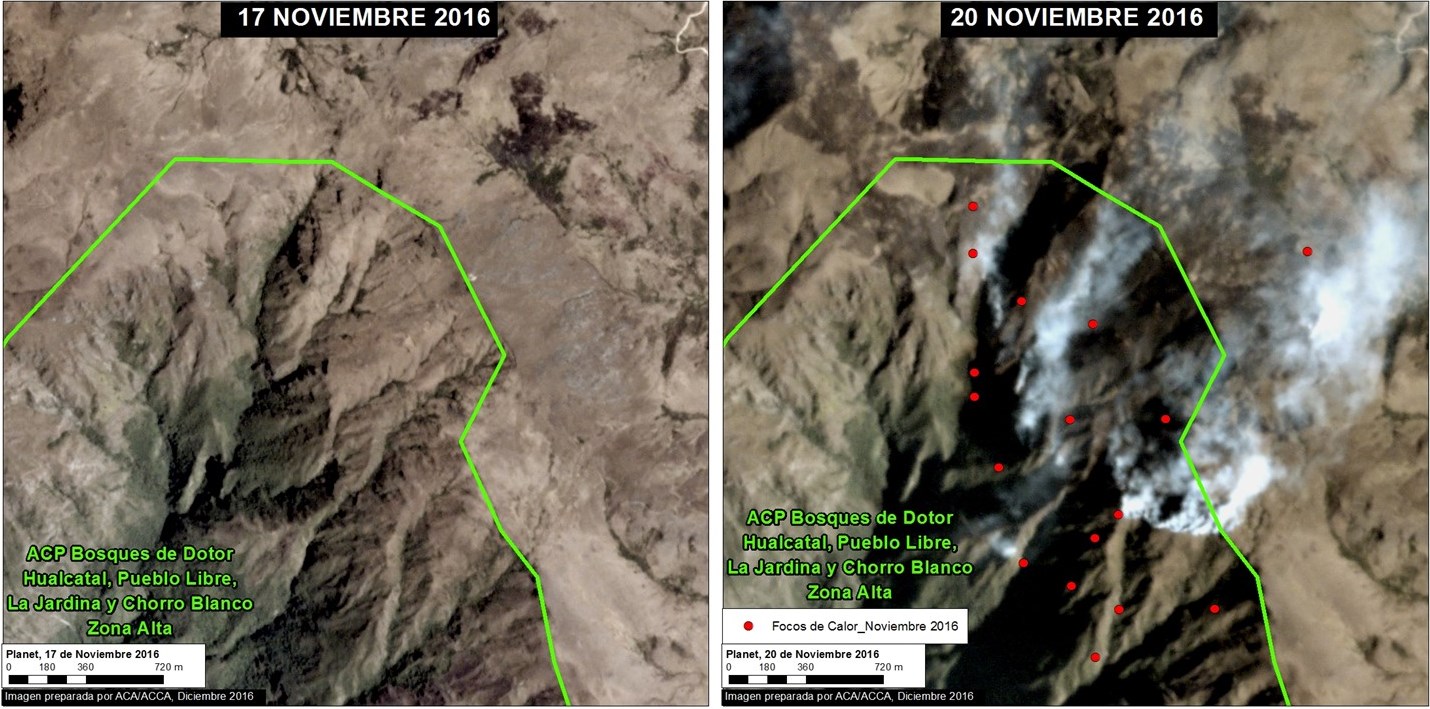
Dotor Private Conservation Area
The following image shows a comparison of the northern sector of the private conservation area before (left panel) and after (right panel) the fires. The estimated burn area within the national sanctuary is 395 acres. The red dots indicate the fire alerts.
Statement from SERNANP
Note: This statement refers to the data in MAAP #51. In the current MAAP #52 report we have made the necessary corrections.
In regards to the effect of forest fires in 6 natural protected areas (Refugio de Vida Silvestre Laquipampa, Refugio de Vida Silvestre Bosques Nublados de Udima, Parque Nacional de Cutervo, Parque Nacional Cerros de Amotape, Reserva Nacional de Tumbes y Bosque de Protección Pagaibamba), located in the departments of Lambayeque and Cajamarca, we clarify that although the ACA and ACCA report refers to 1,400 hectares of heat sources in the particular case of the Pagaibamba Protected Forest, it should be noted that according to the verification carried out in-situ by the SERNANP personnel, the burned habitat amounts to only 410 hectares. The remaining 990 hectares were affected, but indirectly, by presence of smoke and ash.
In addition, SERNANP led a multisectoral action along with our park guards who hare specialized in forest fires, as part of immediate attention to the emergency regarding the forest fires in the affected protected areas, obtaining positive results in a short time.
Finally, SERNANP personnel are assessing the ecological damage and developing a recovery plan.
Citation
Novoa S, Finer M (2017) Update – Fires Degrade 11 Protected Areas in northern Peru. MAAP: 52.