Image #12: High-resolution View of Illegal Gold Mining Deforestation in La Pampa (Madre de Dios, Peru)

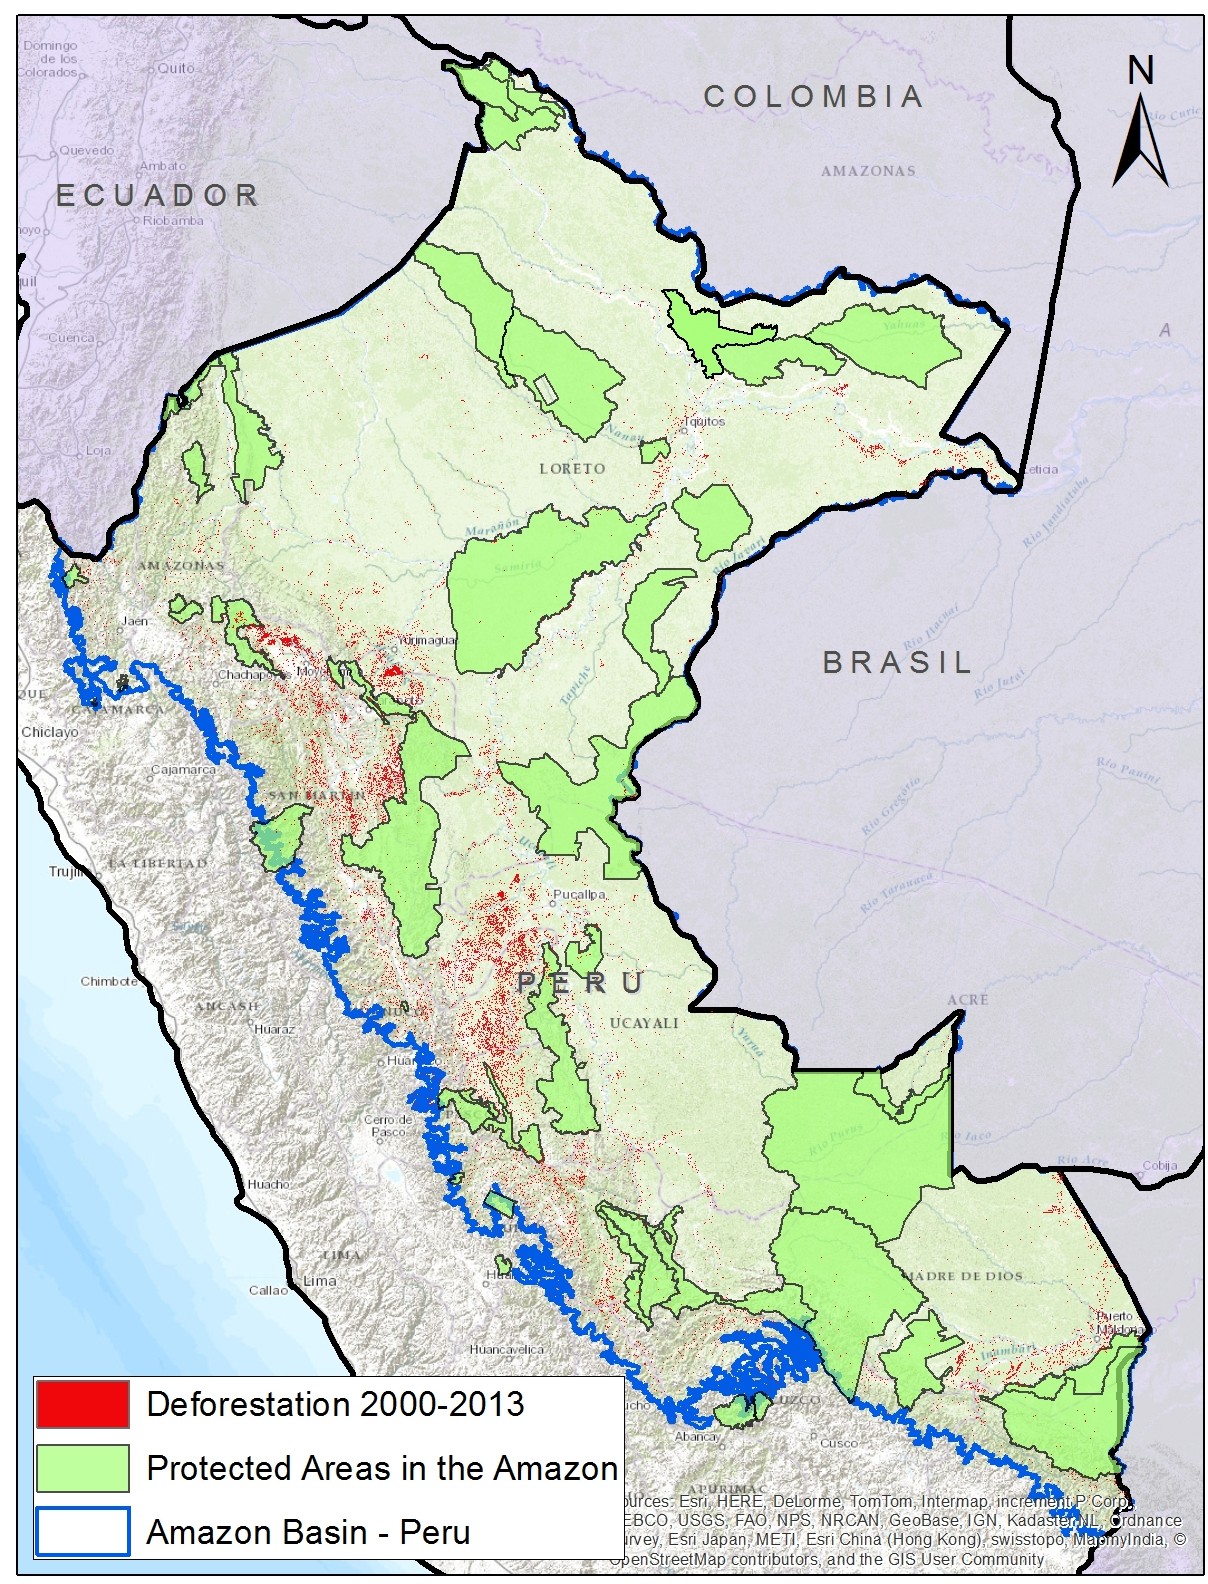
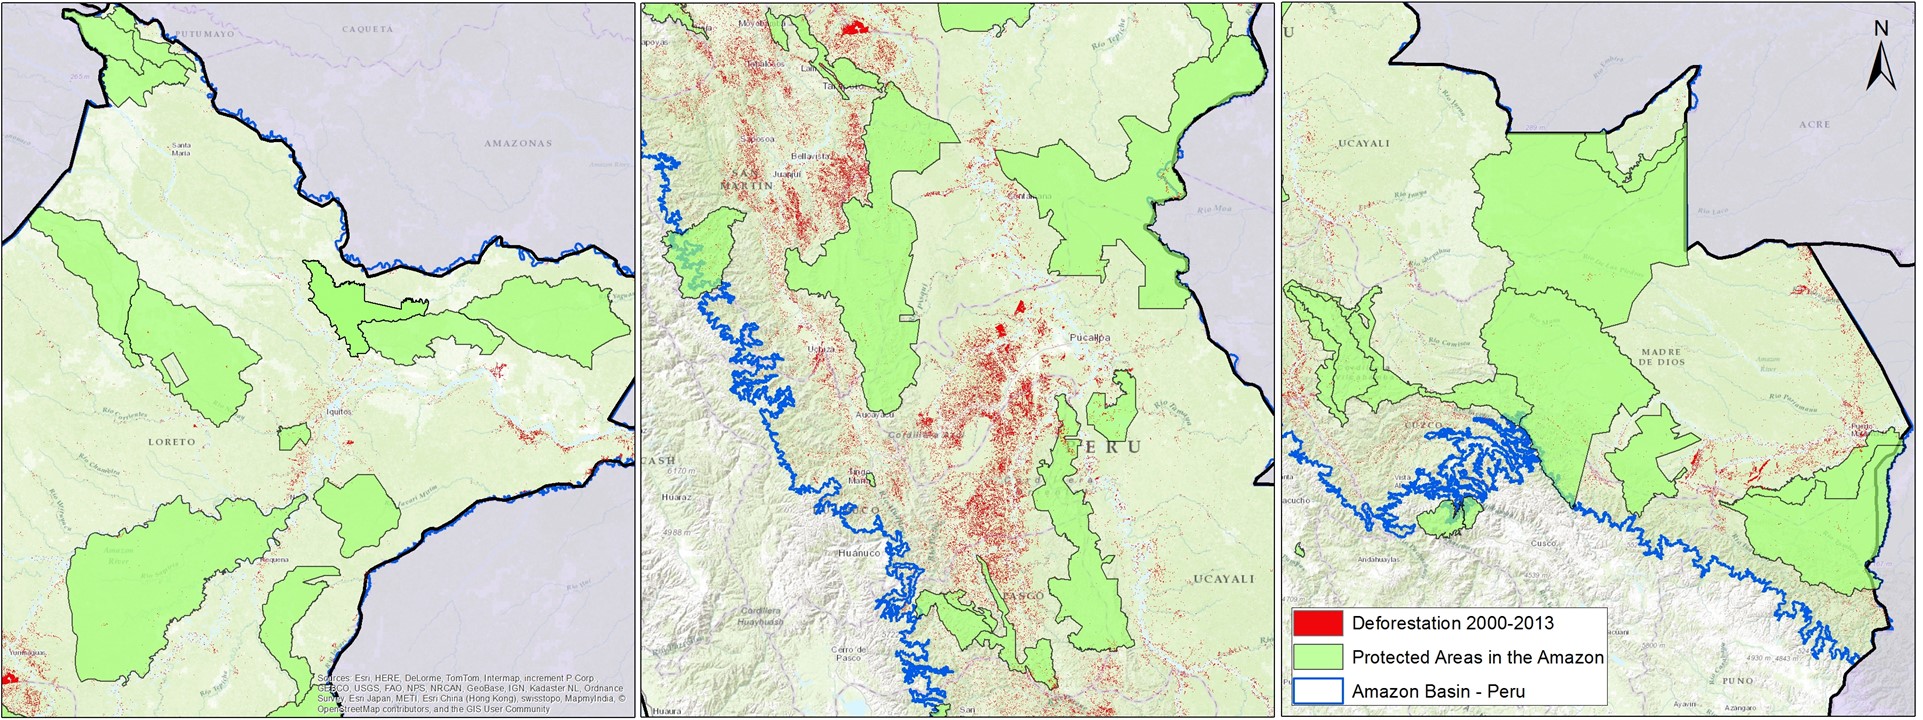
In MAAP #1, we described the expansion of deforestation through February 2015 in La Pampa, a gold mining hotspot located in the Madre de Dios region in the southern Peruvian Amazon. Since then, we have obtained a new high-resolution image showing the current situation (as of late July 2015) in great detail in La Pampa.

Here in MAAP #12, we present an analysis with the following three objectives: 1) Update data for the recent expansion of gold mining deforestation in La Pampa, 2) show a series of high-resolution images that illustrate the scale and magnitude of current gold mining operations, and 3) illustrate how the Tambopata National Reserve currently represents a good defense against deforestation expansion.

13A_v7_english - Copy (1)
Image 12a. High-resolution images showing the expansion of deforestation by gold mining in La Pampa between August 2014 and July 29, 2015. Data: GeoEye and WorldView2 from Digital Globe (NextView).

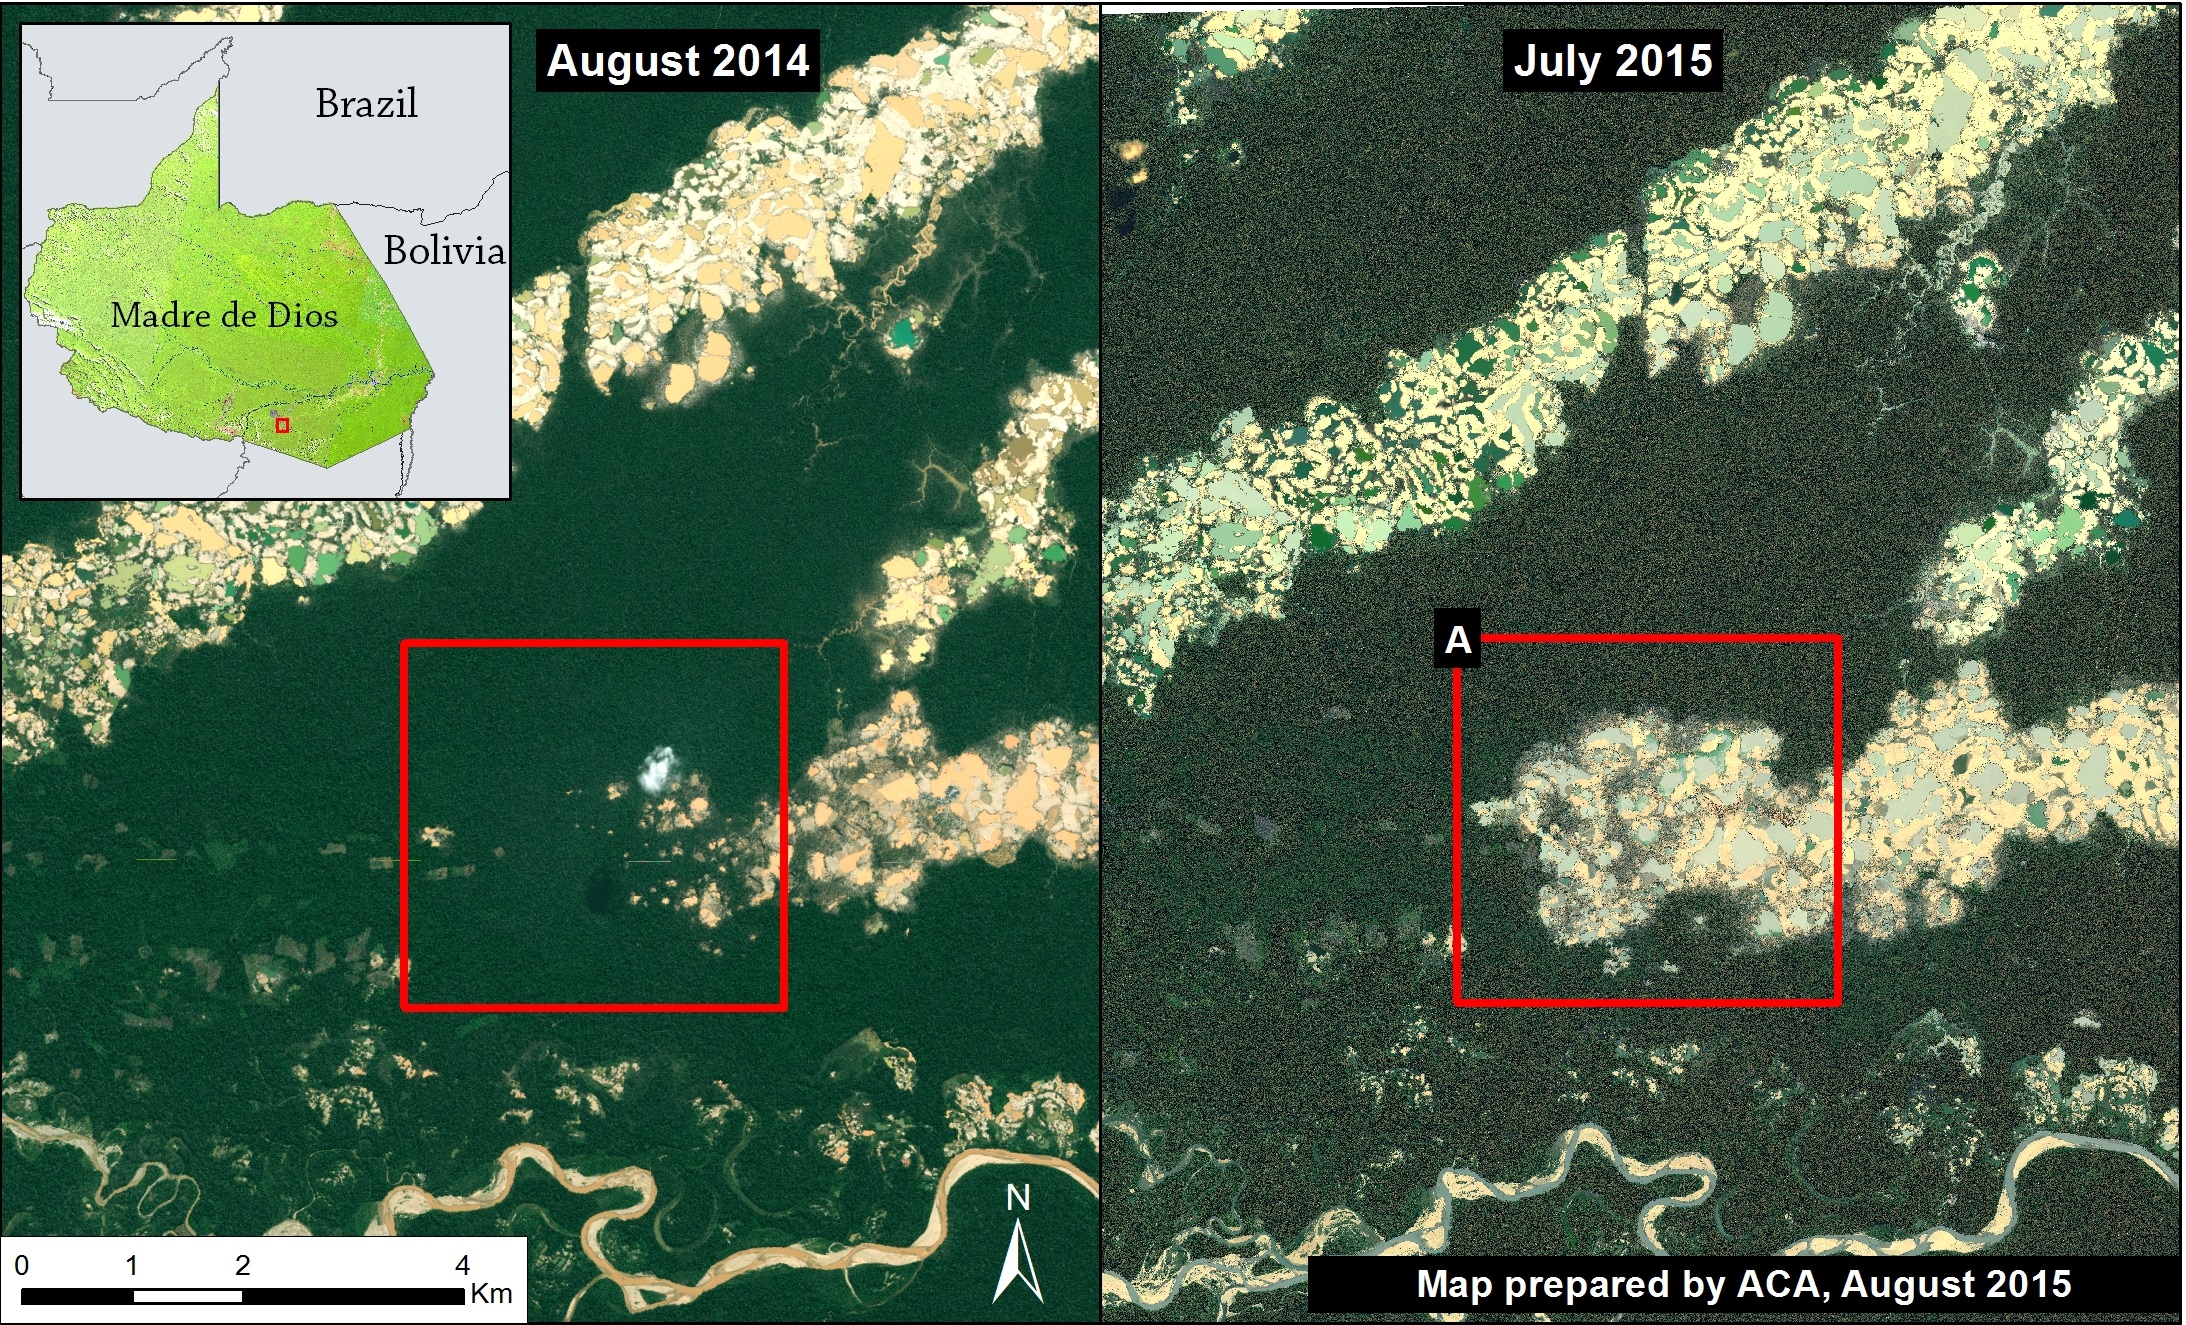
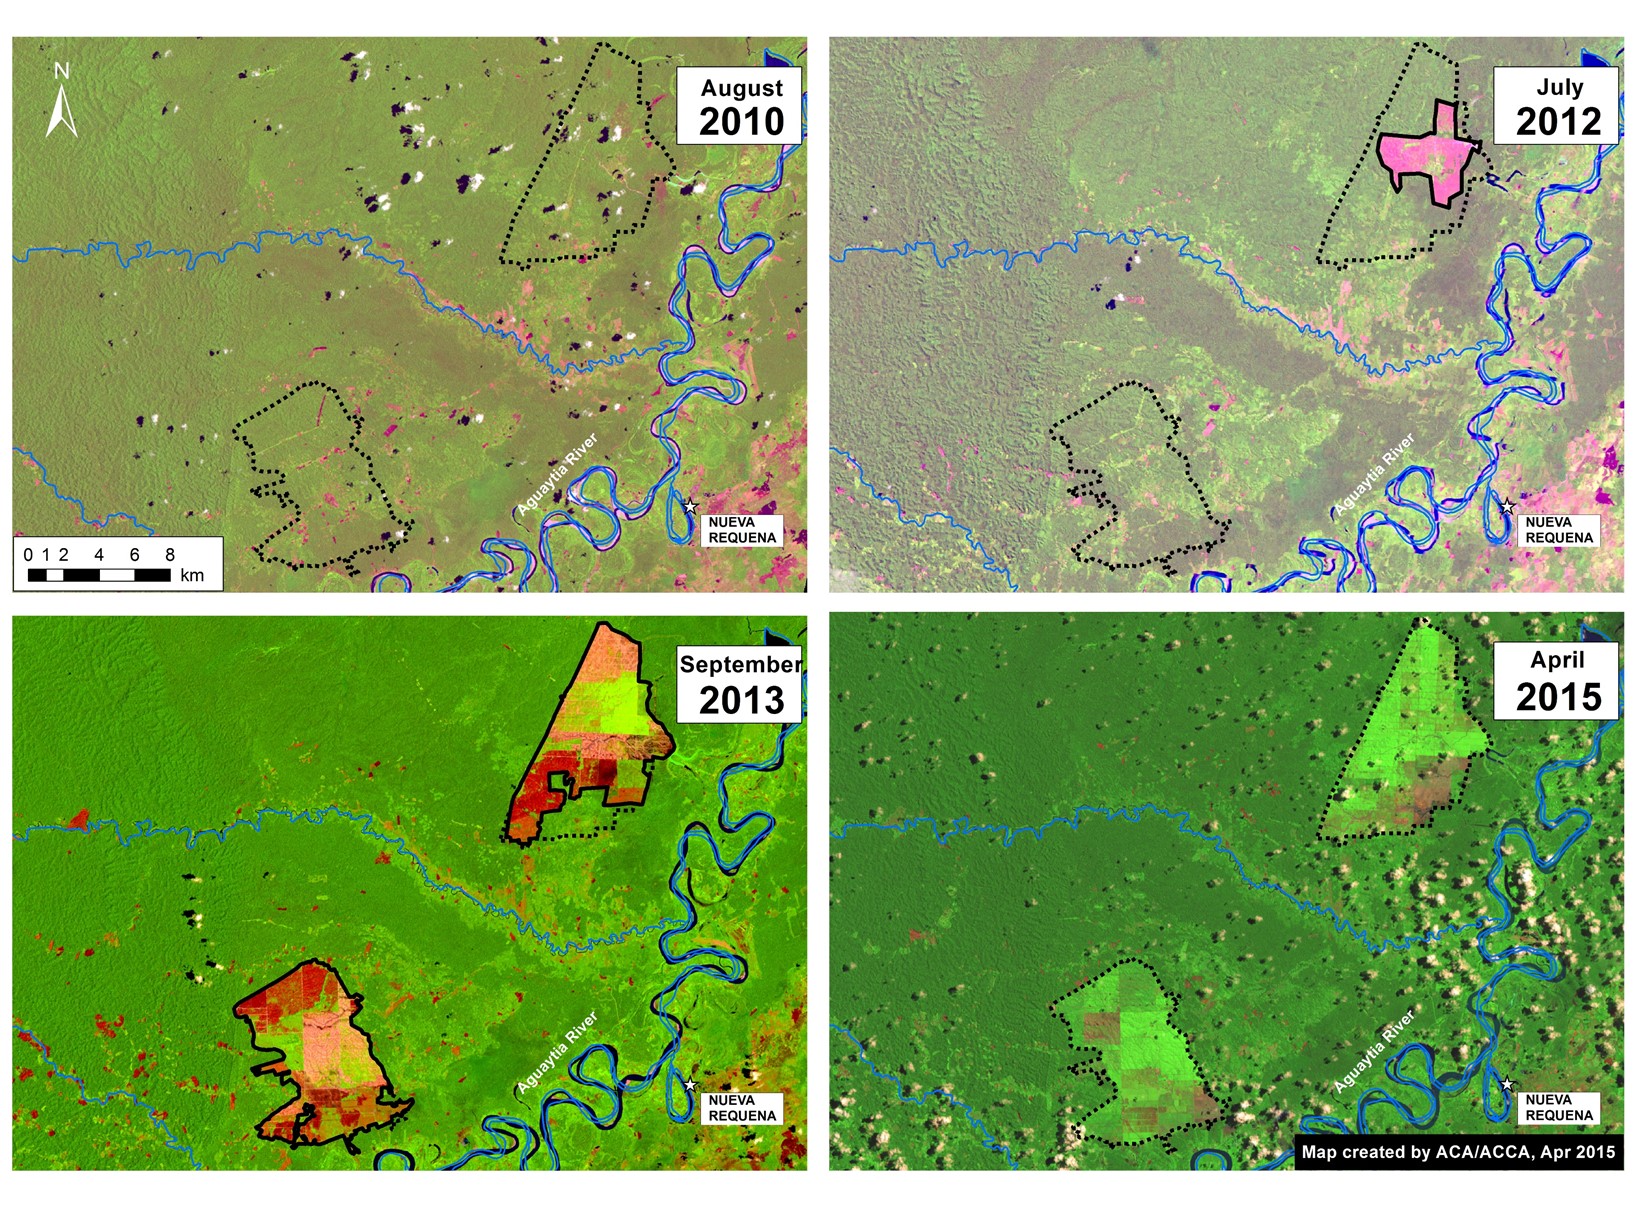
Image 12a shows, in high resolution, the expansion of gold mining deforestation in La Pampa during the last year (between August 2014 and July 2015). The red square indicates the main zone of deforestation.

Deforestation 2014-15

La Pampa_CLASlite LossV5 english
Image 12b. CLASlite Results 2014-15. Data: USGS, SERNANP.

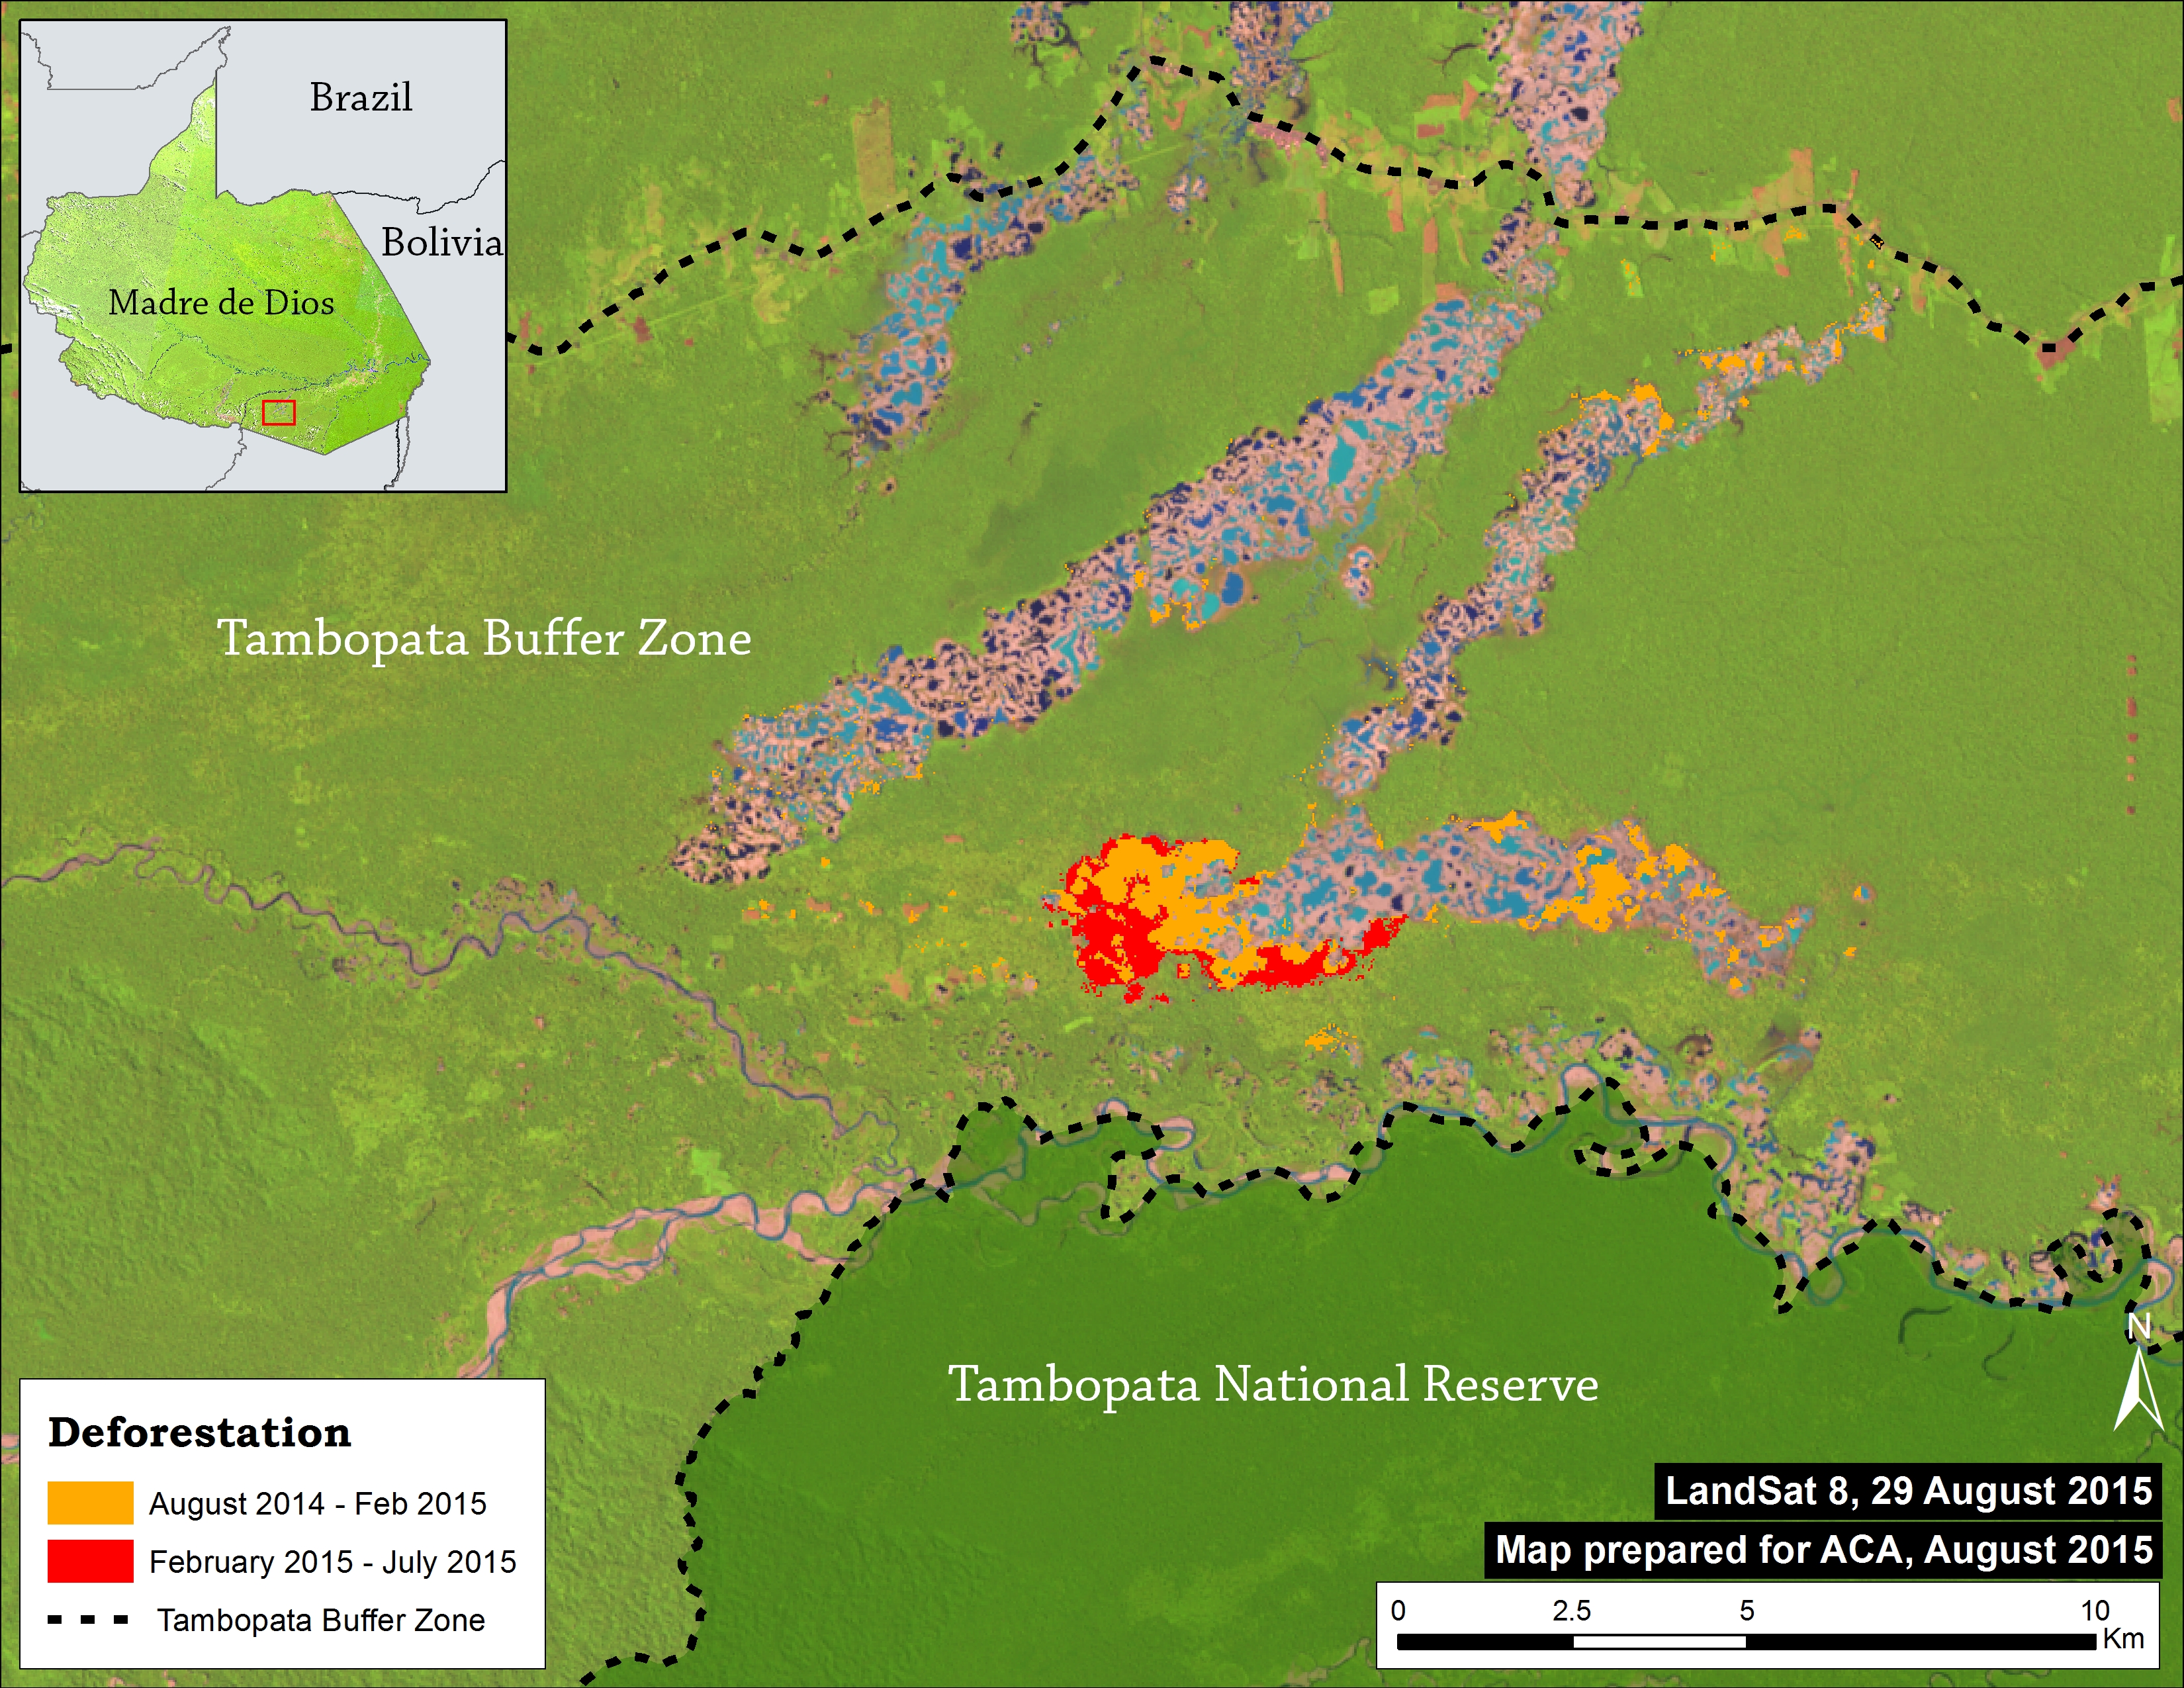
Image 12b shows the CLASlite results of the expansion of gold mining deforestation in La Pampa during the past year (between August 2014 and July 2015). We found deforestation of 725 hectares (Ha) in the last year, including 224 Ha since February (the date of the last image analyzed in the MAAP #1). This equates to nearly 1,000 soccer fields of deforestation throughout the year.

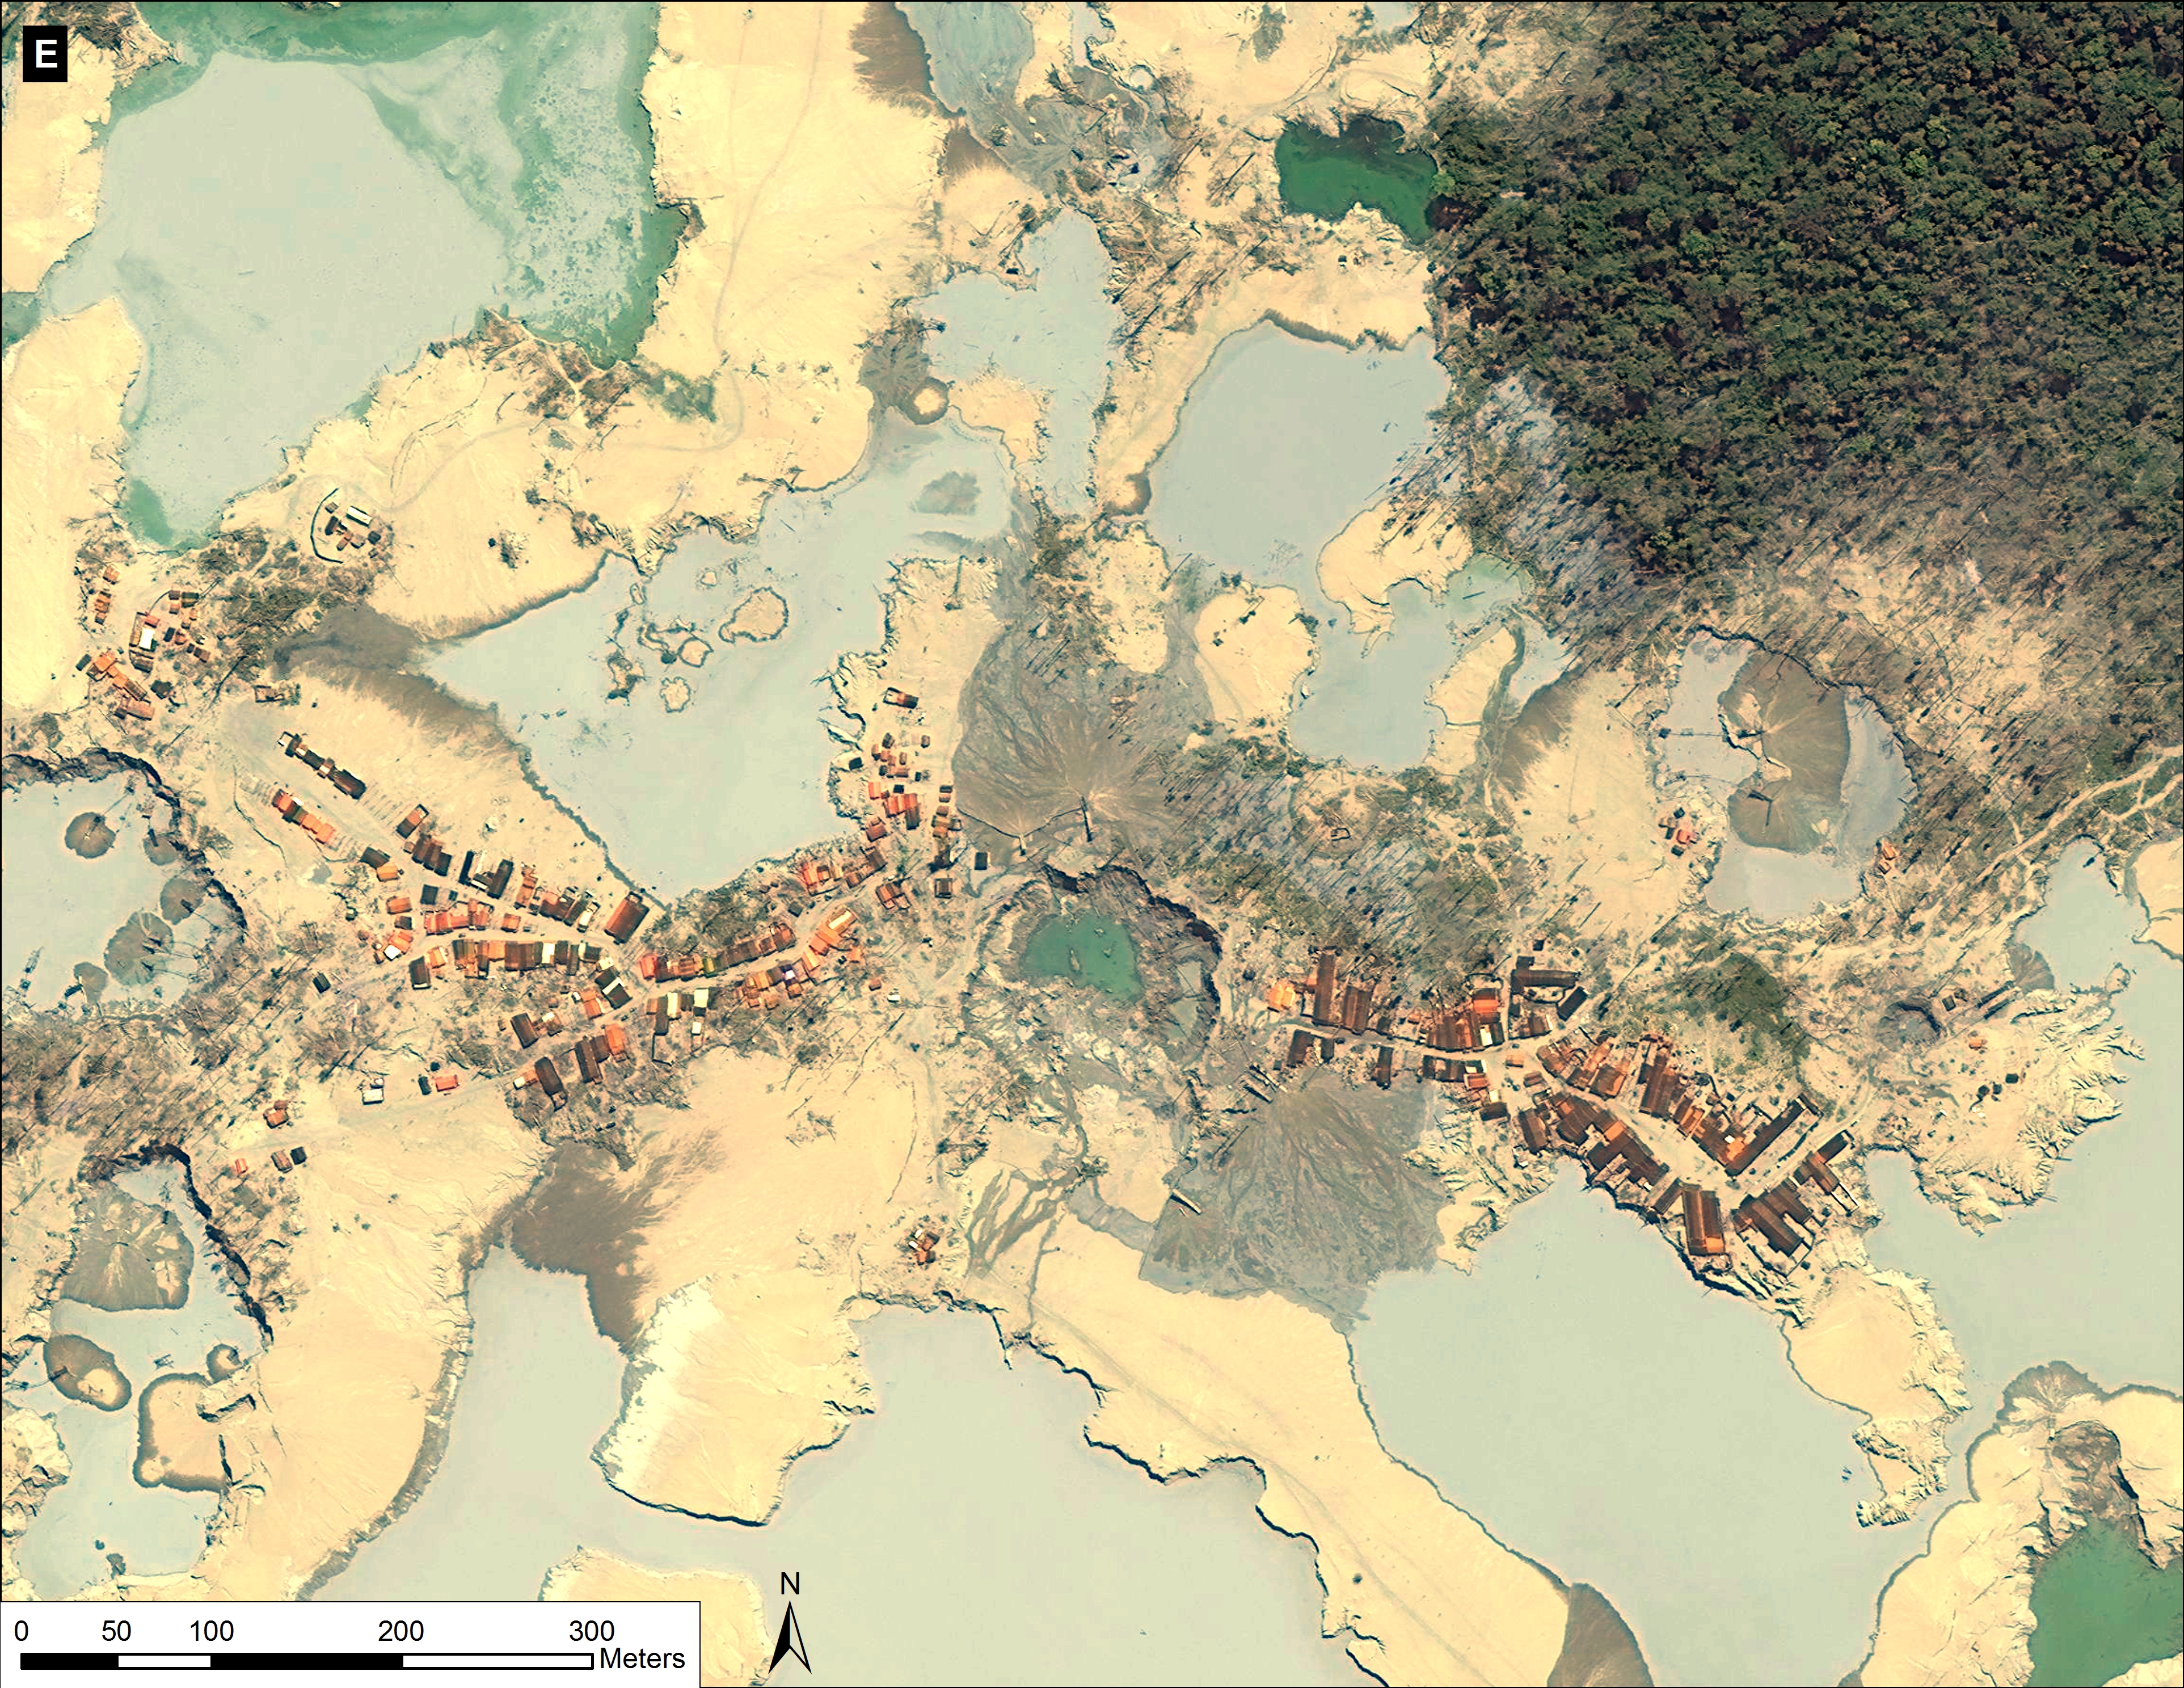
High Resolution View – July 2015

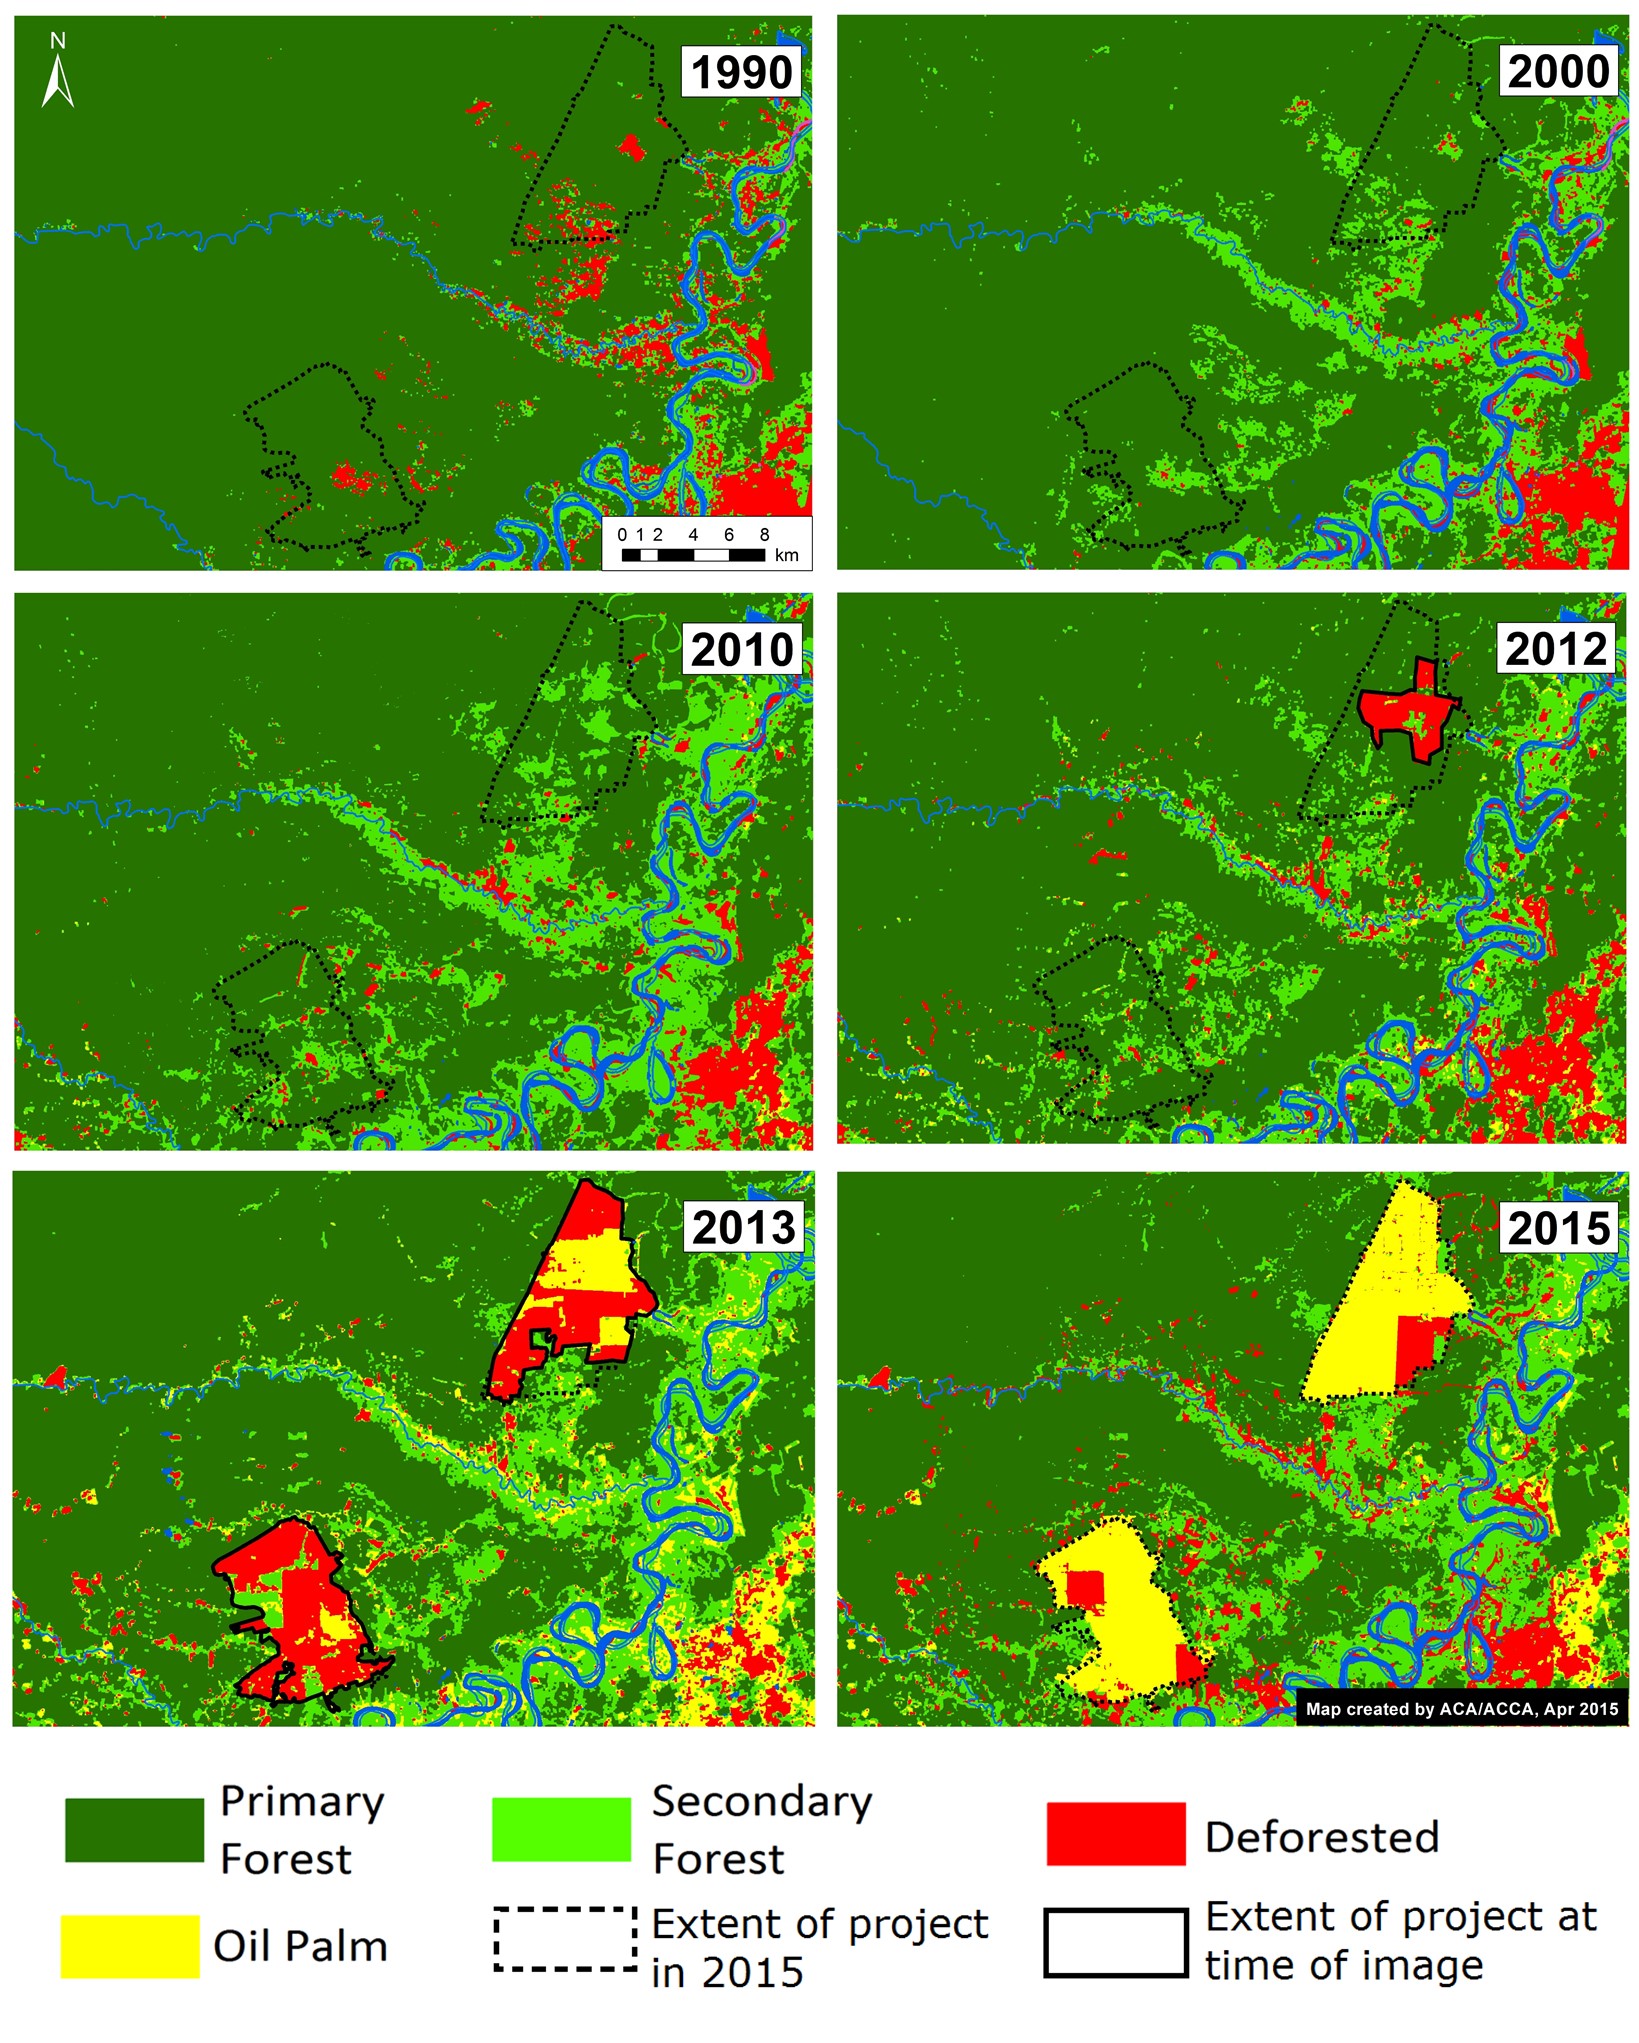
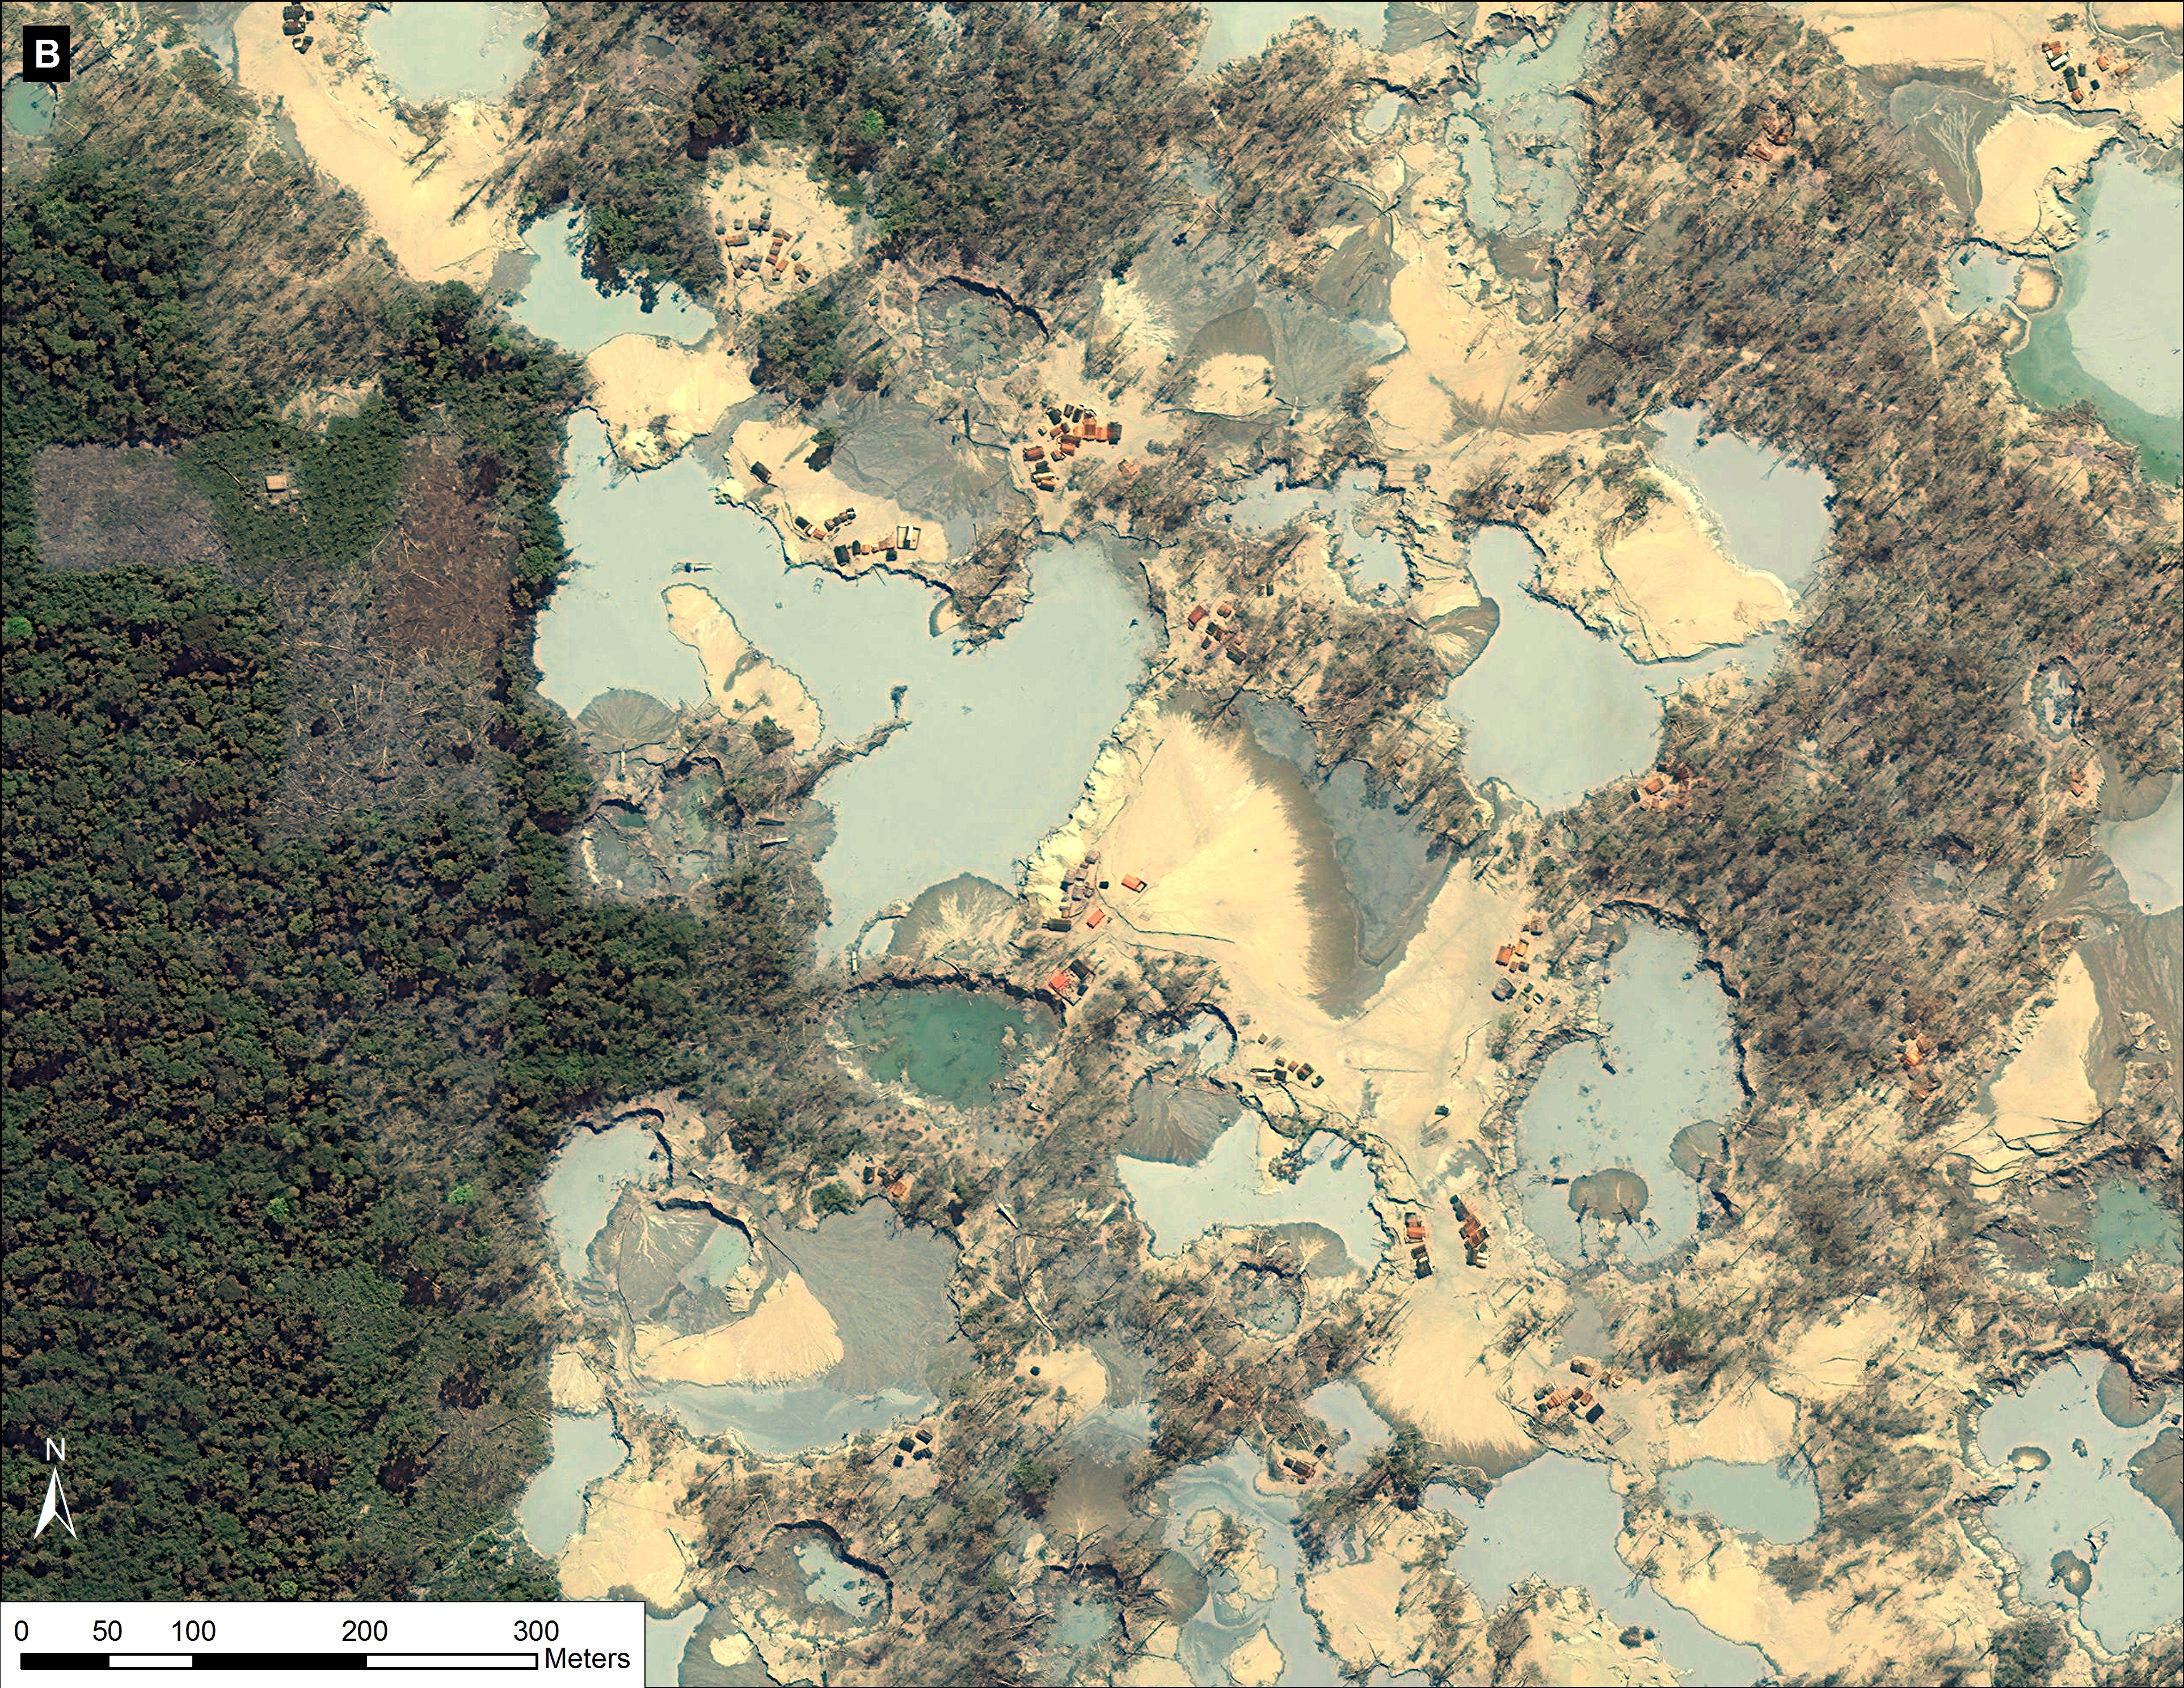
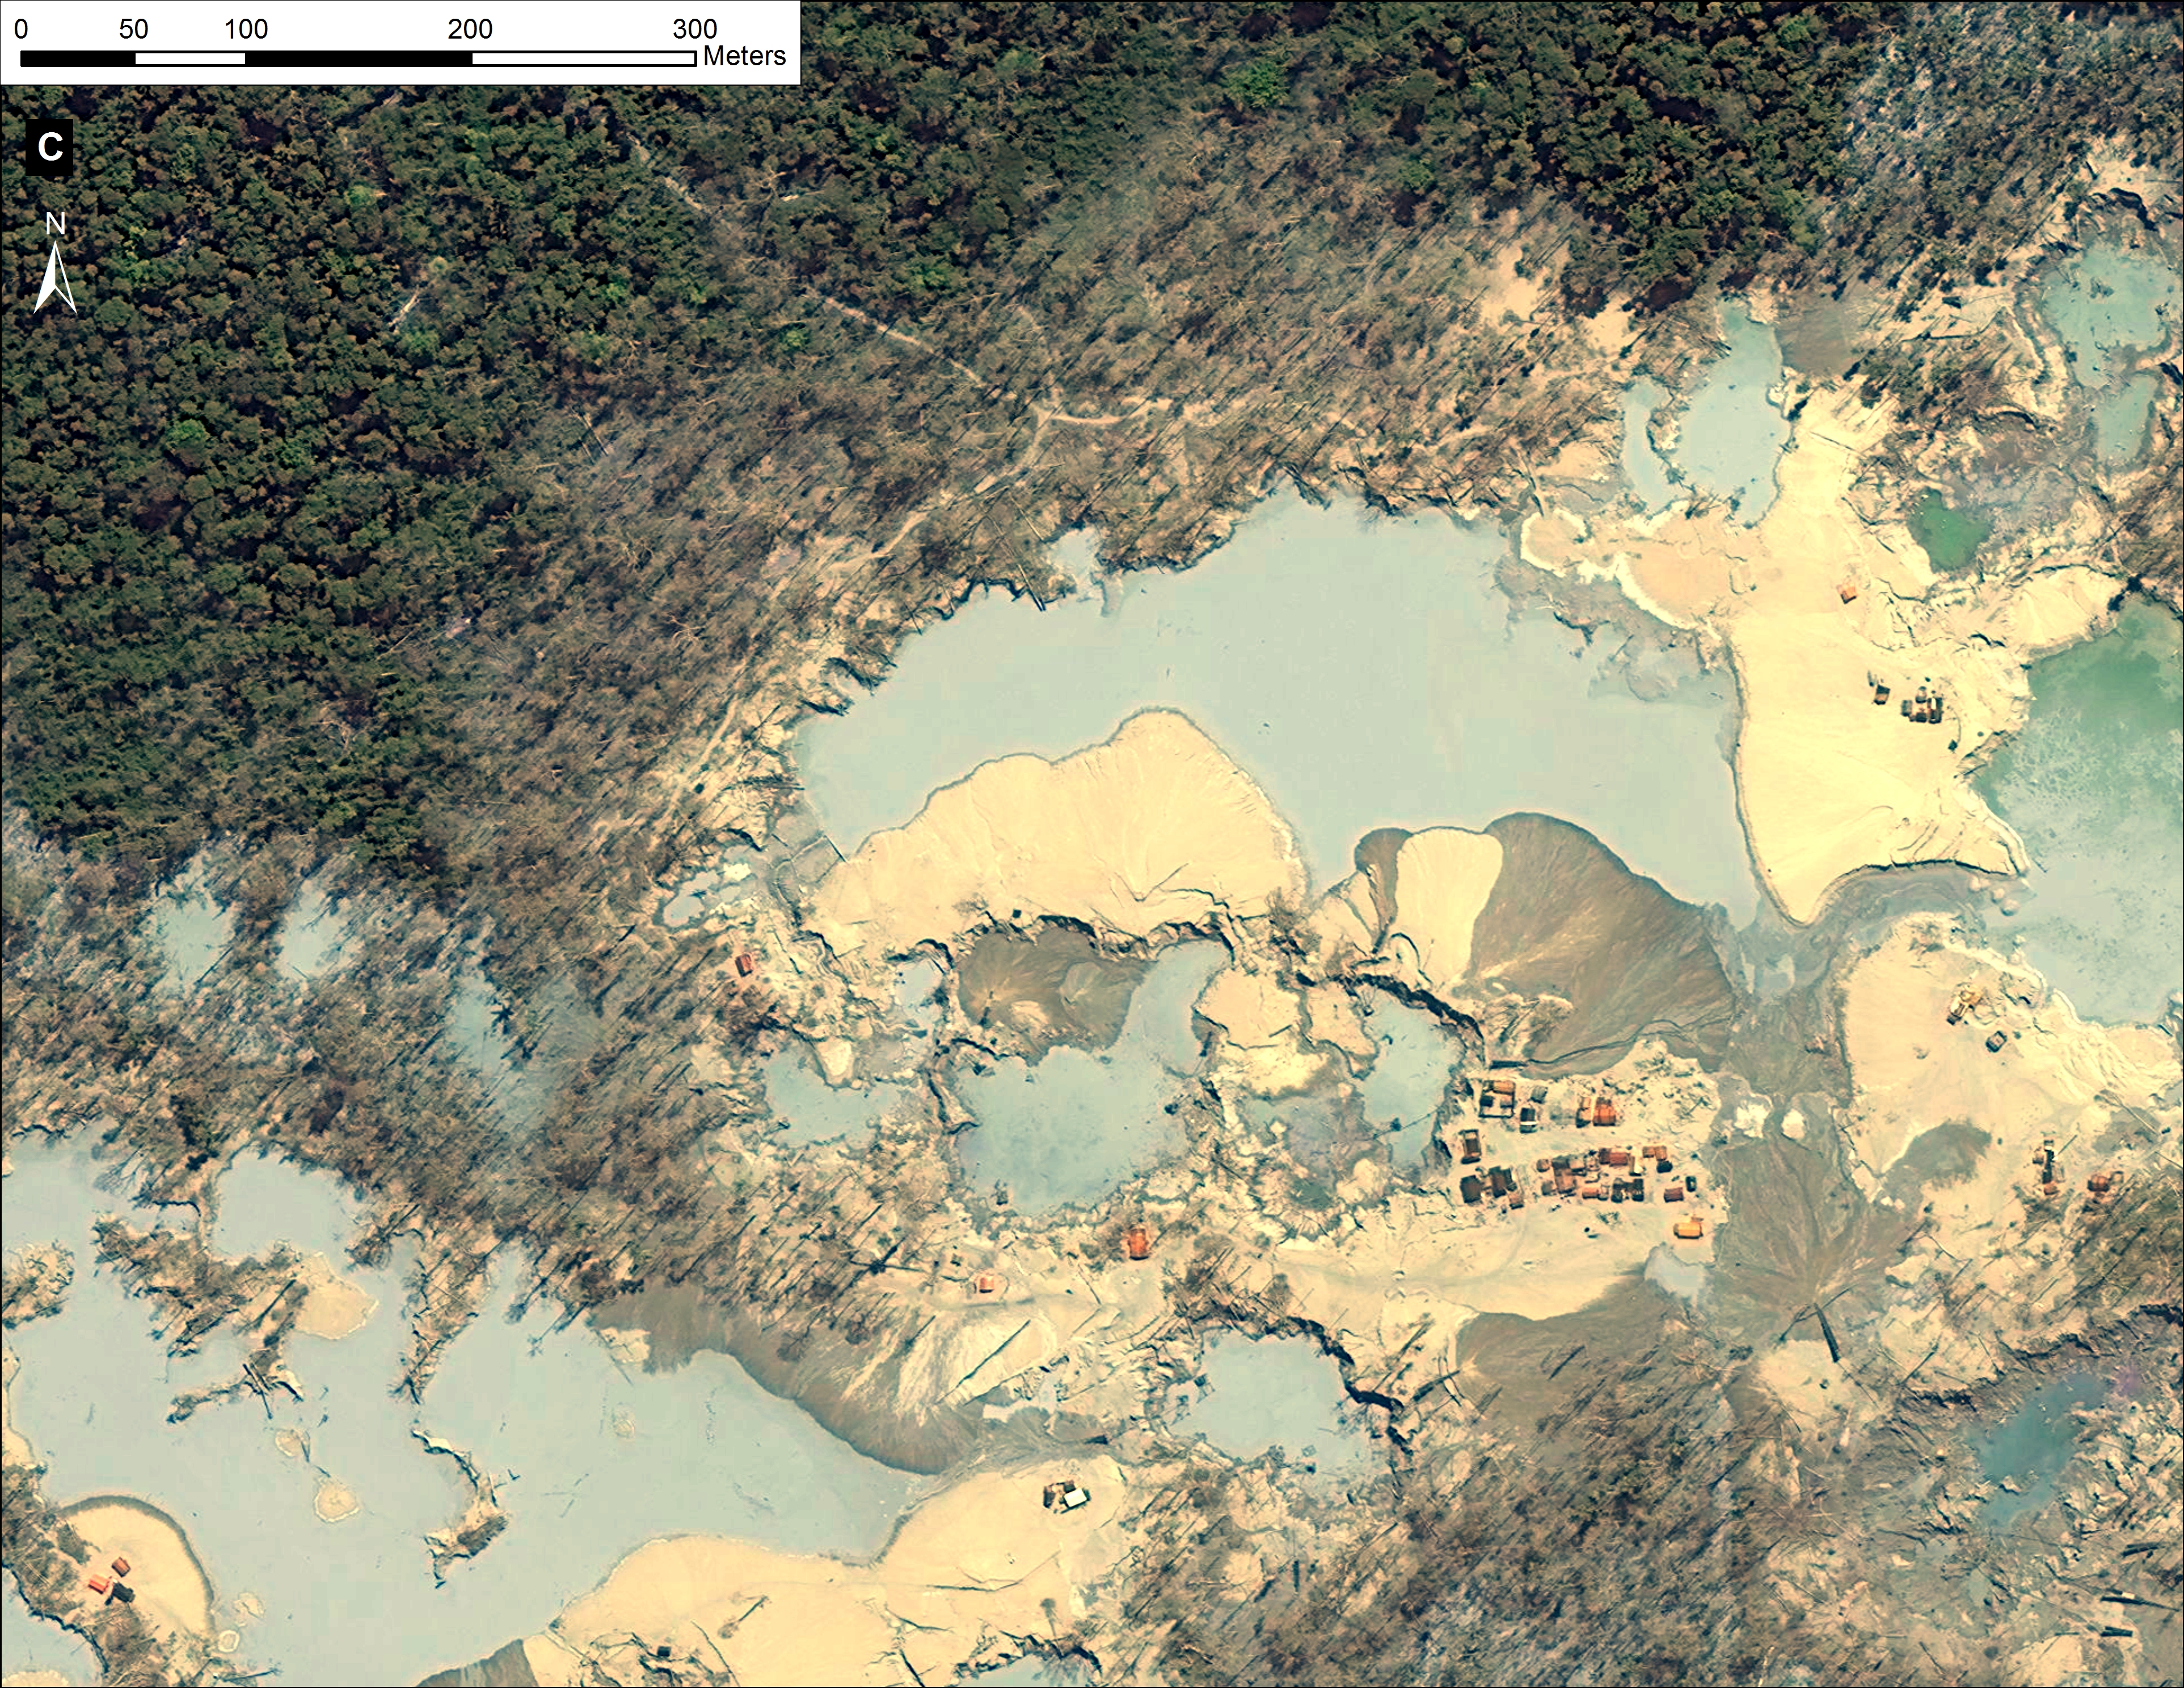
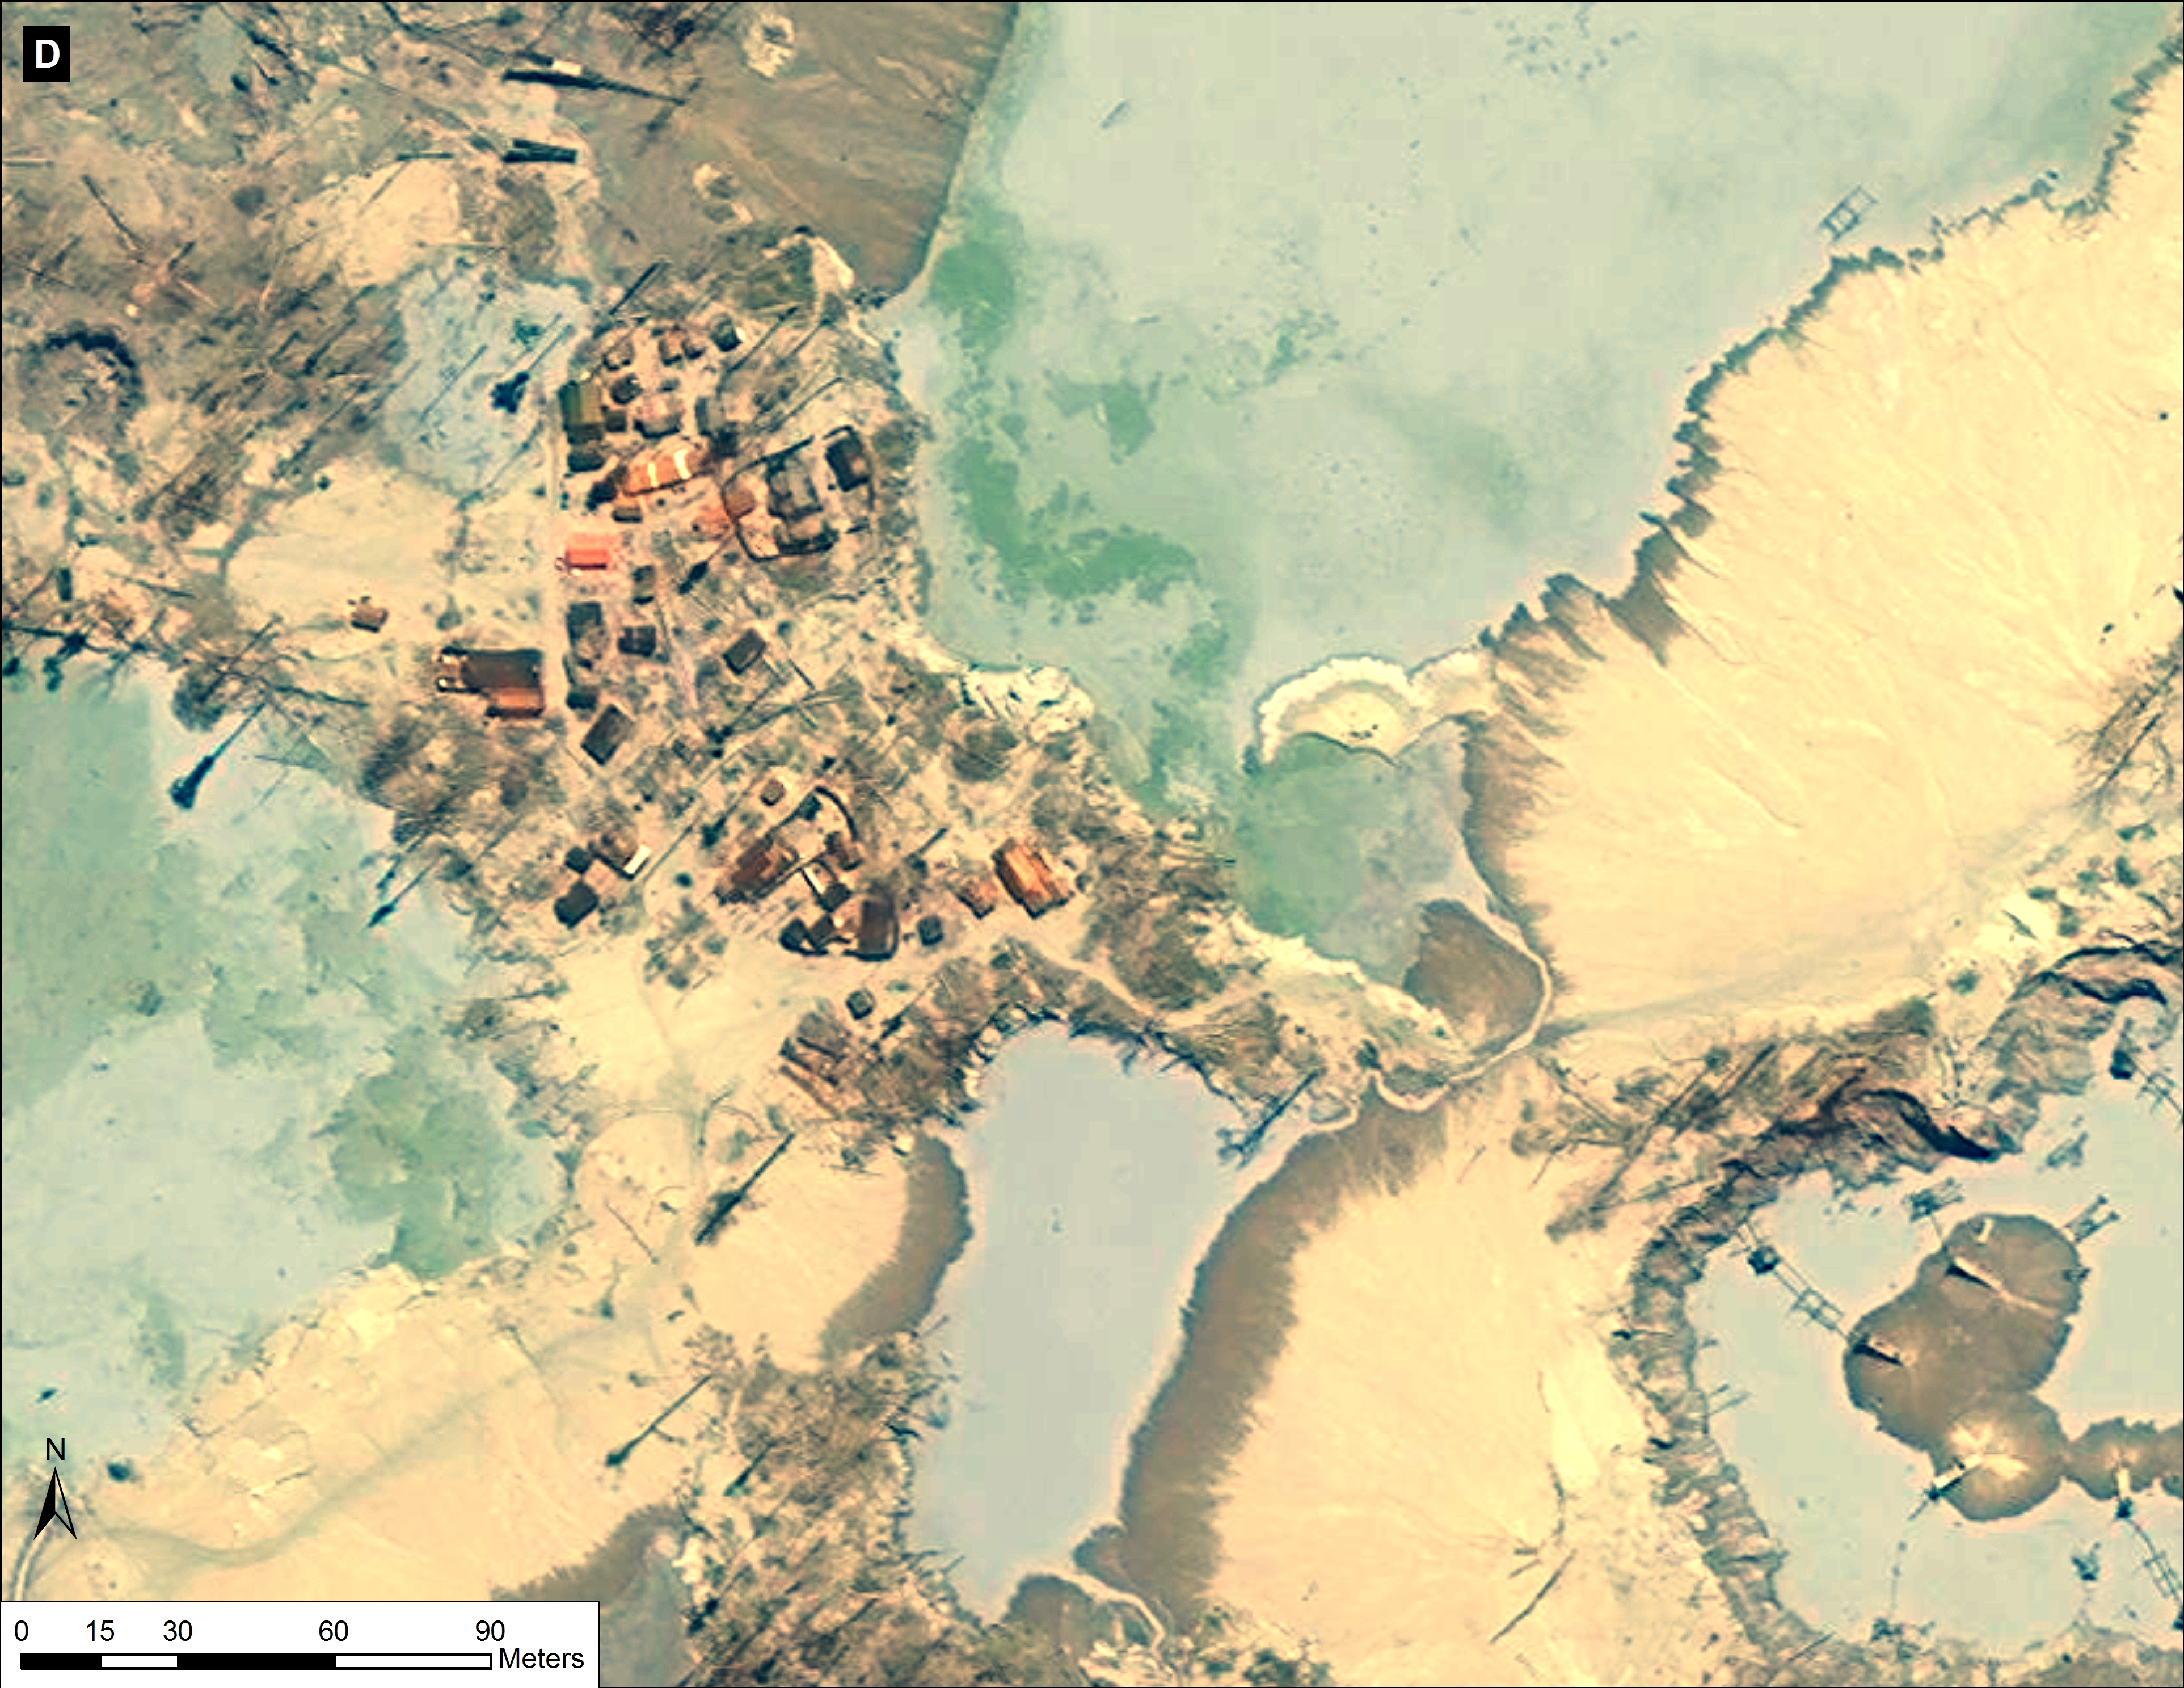
This series of maps illustrates the scale and magnitude of gold mining operations in La Pampa as of July 29, 2015, just two weeks after a major raid by the Peruvian government against illegal gold mining camps.

13c Zooms_BCDE v6
Image 12c. Zoom A (see Image 12a for context). Date of image: July 29, 2015. Data: WorldView2 from Digital Globe (NextView).

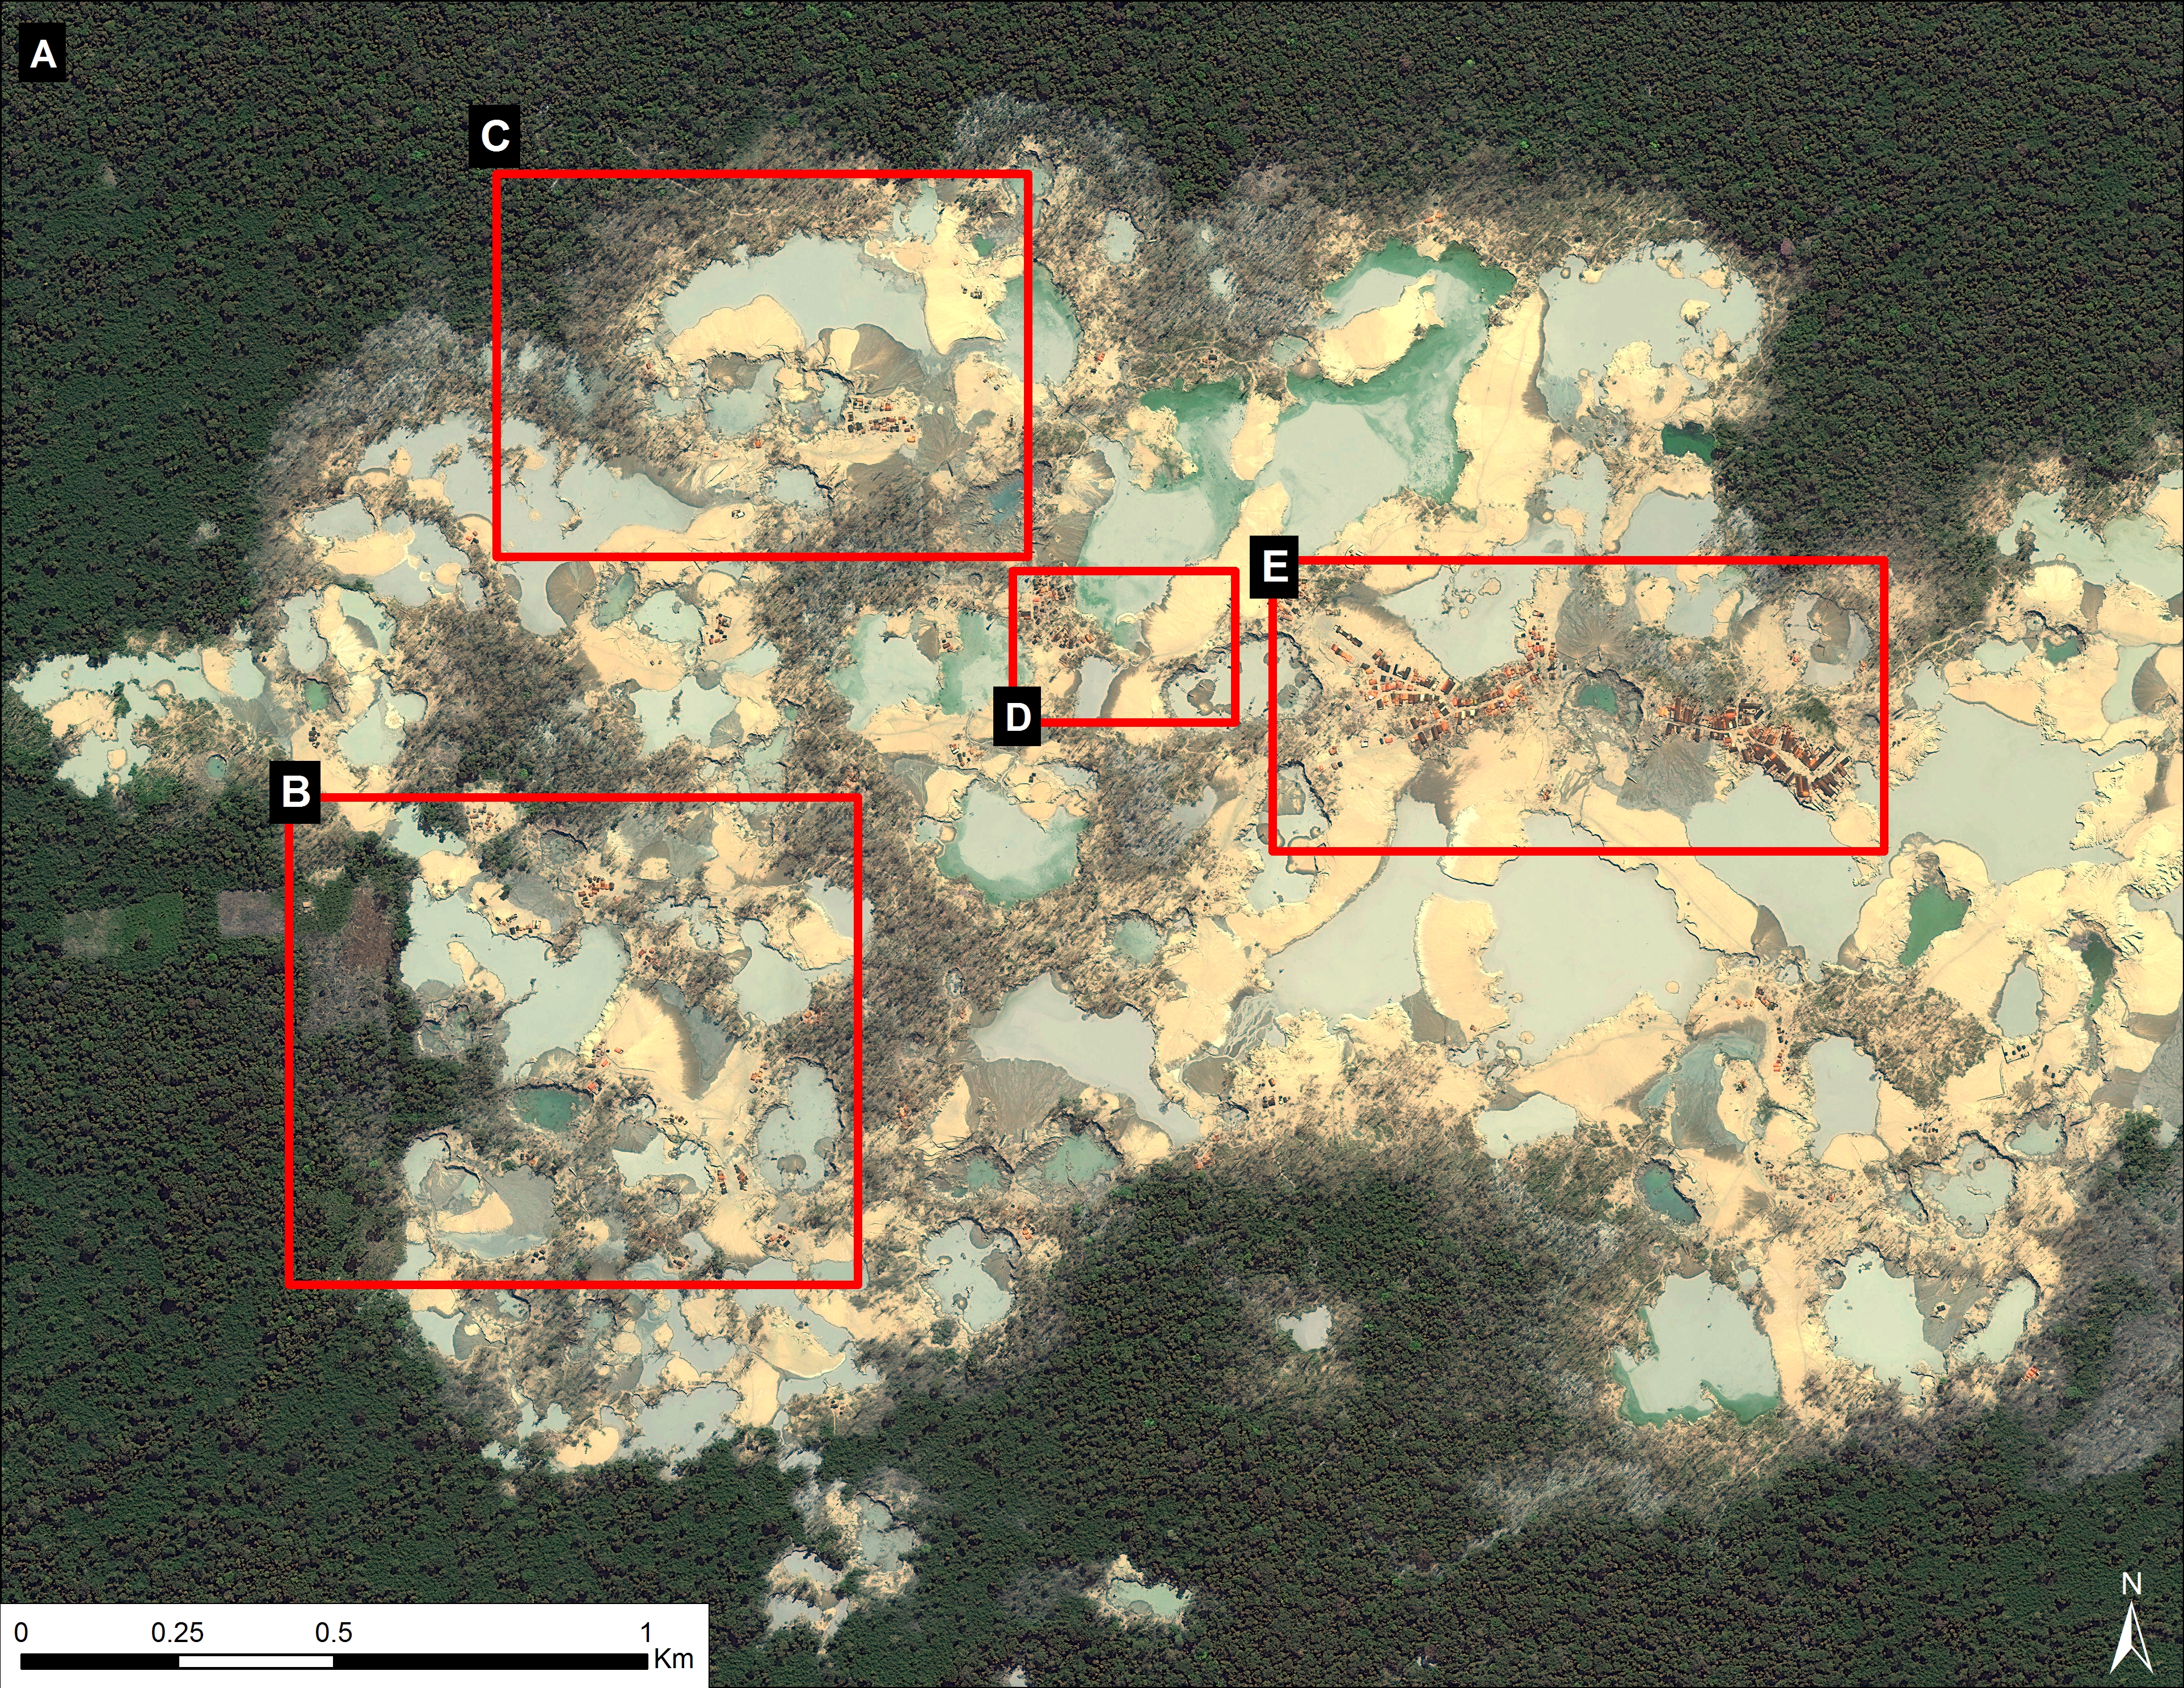
Image 12c displays, in high-resolution, the current center of the mining activity in La Pampa. Note that it is a zoom of zone A indicated in Image 12a. One can see the high density of gold mining operations and infrastructure in almost every area of the image. Also note in Image 12c that the location of four additional zooms described below are also shown.
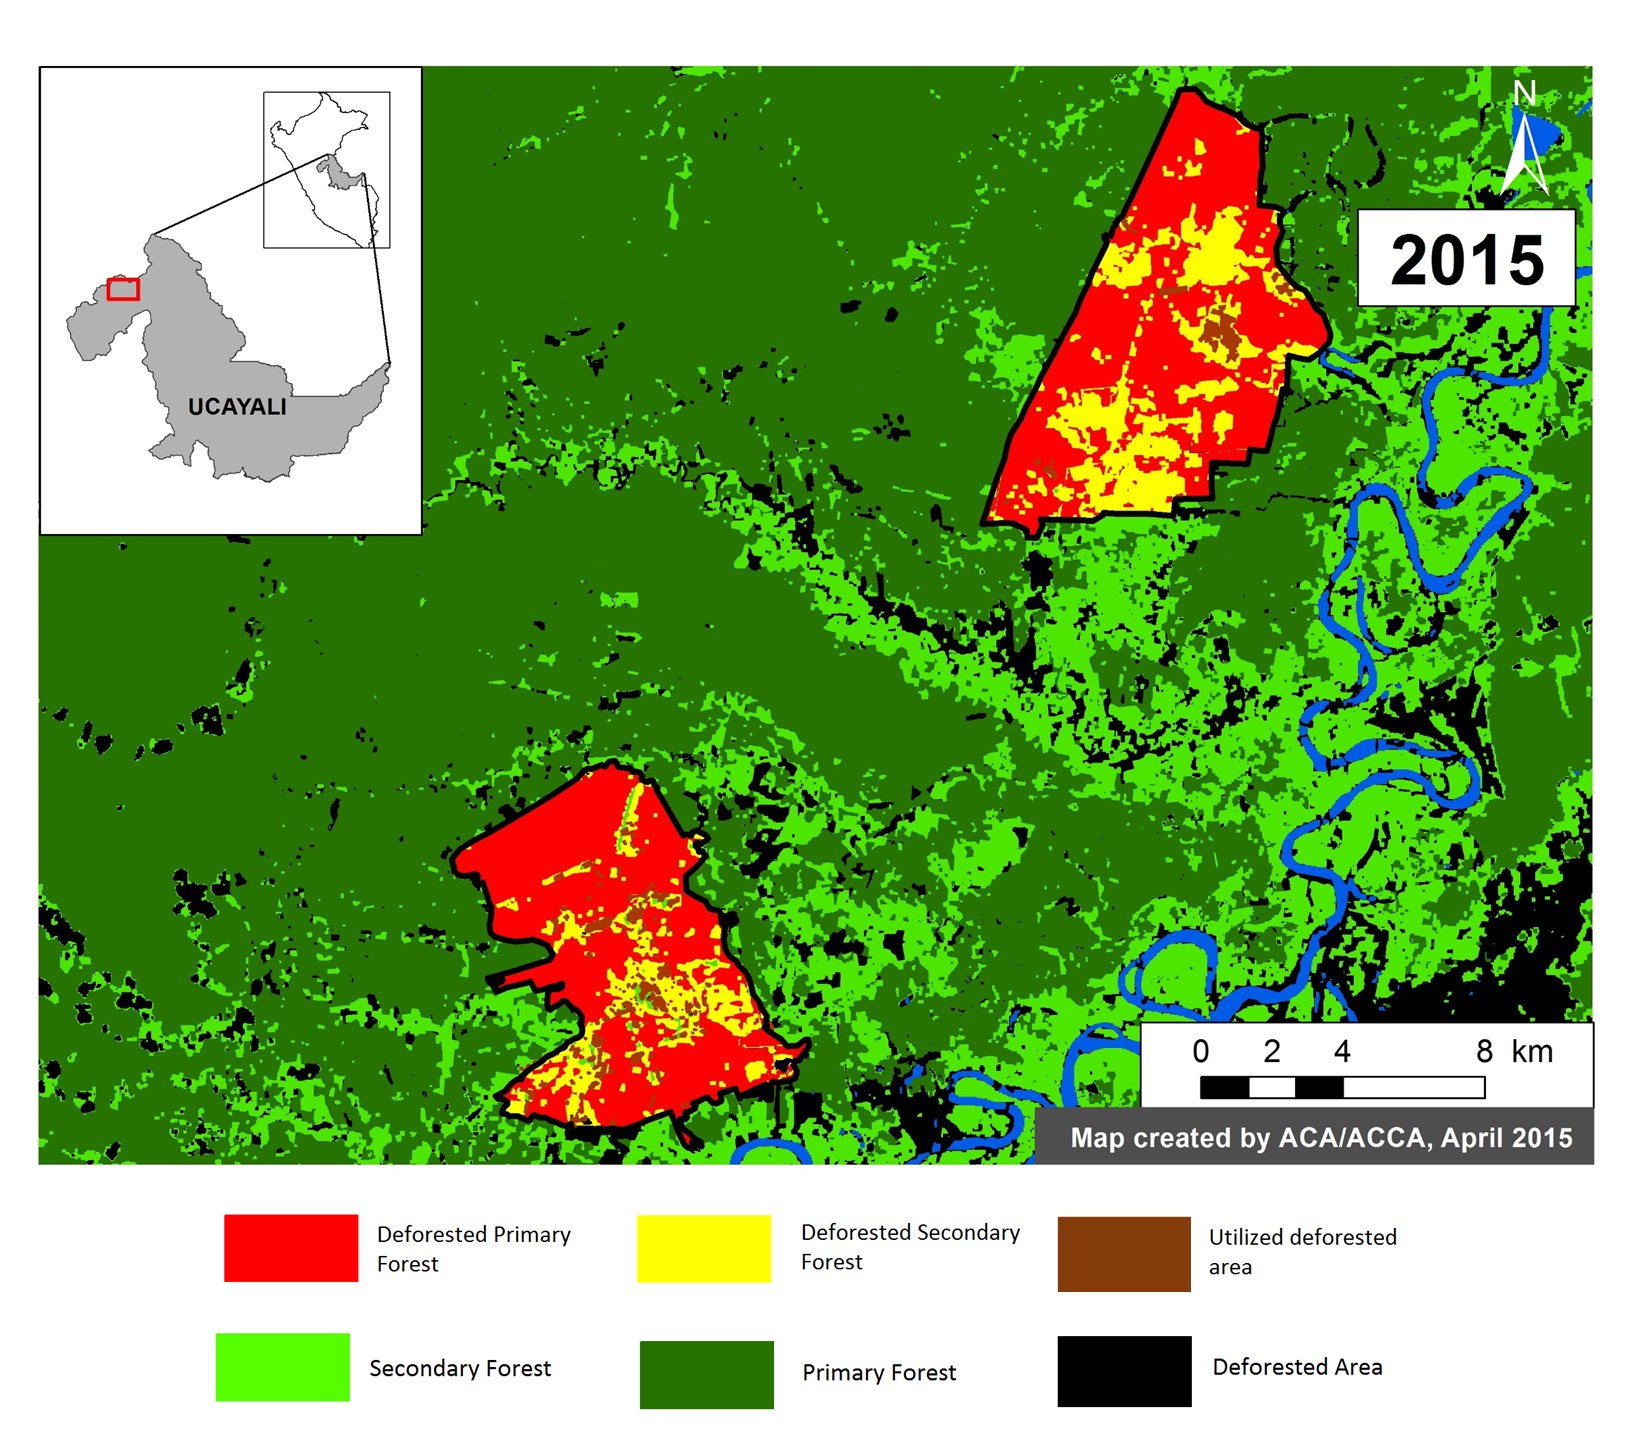
Images 12d g show a series of additional zooms from four different locations within the center of the current mining activity in this sector of La Pampa and highlights the scale and magnitude of operations.

13d ZoomB v6
Image 12d. Zoom B (see Image 12c for context). Data: WorldView2 from Digital Globe (NextView).
13e ZoomC v6
Image 12e. Zoom C (see Image 12c for context). Data: WorldView2 from Digital Globe (NextView).
13f ZoomD v6
Image 12f. Zoom D (see Image 12c for context). Data: WorldView2 from Digital Globe (NextView).
13g ZoomE v6
Image 12g. Zoom E (see Image 12c for context). Data: WorldView2 from Digital Globe (NextView).

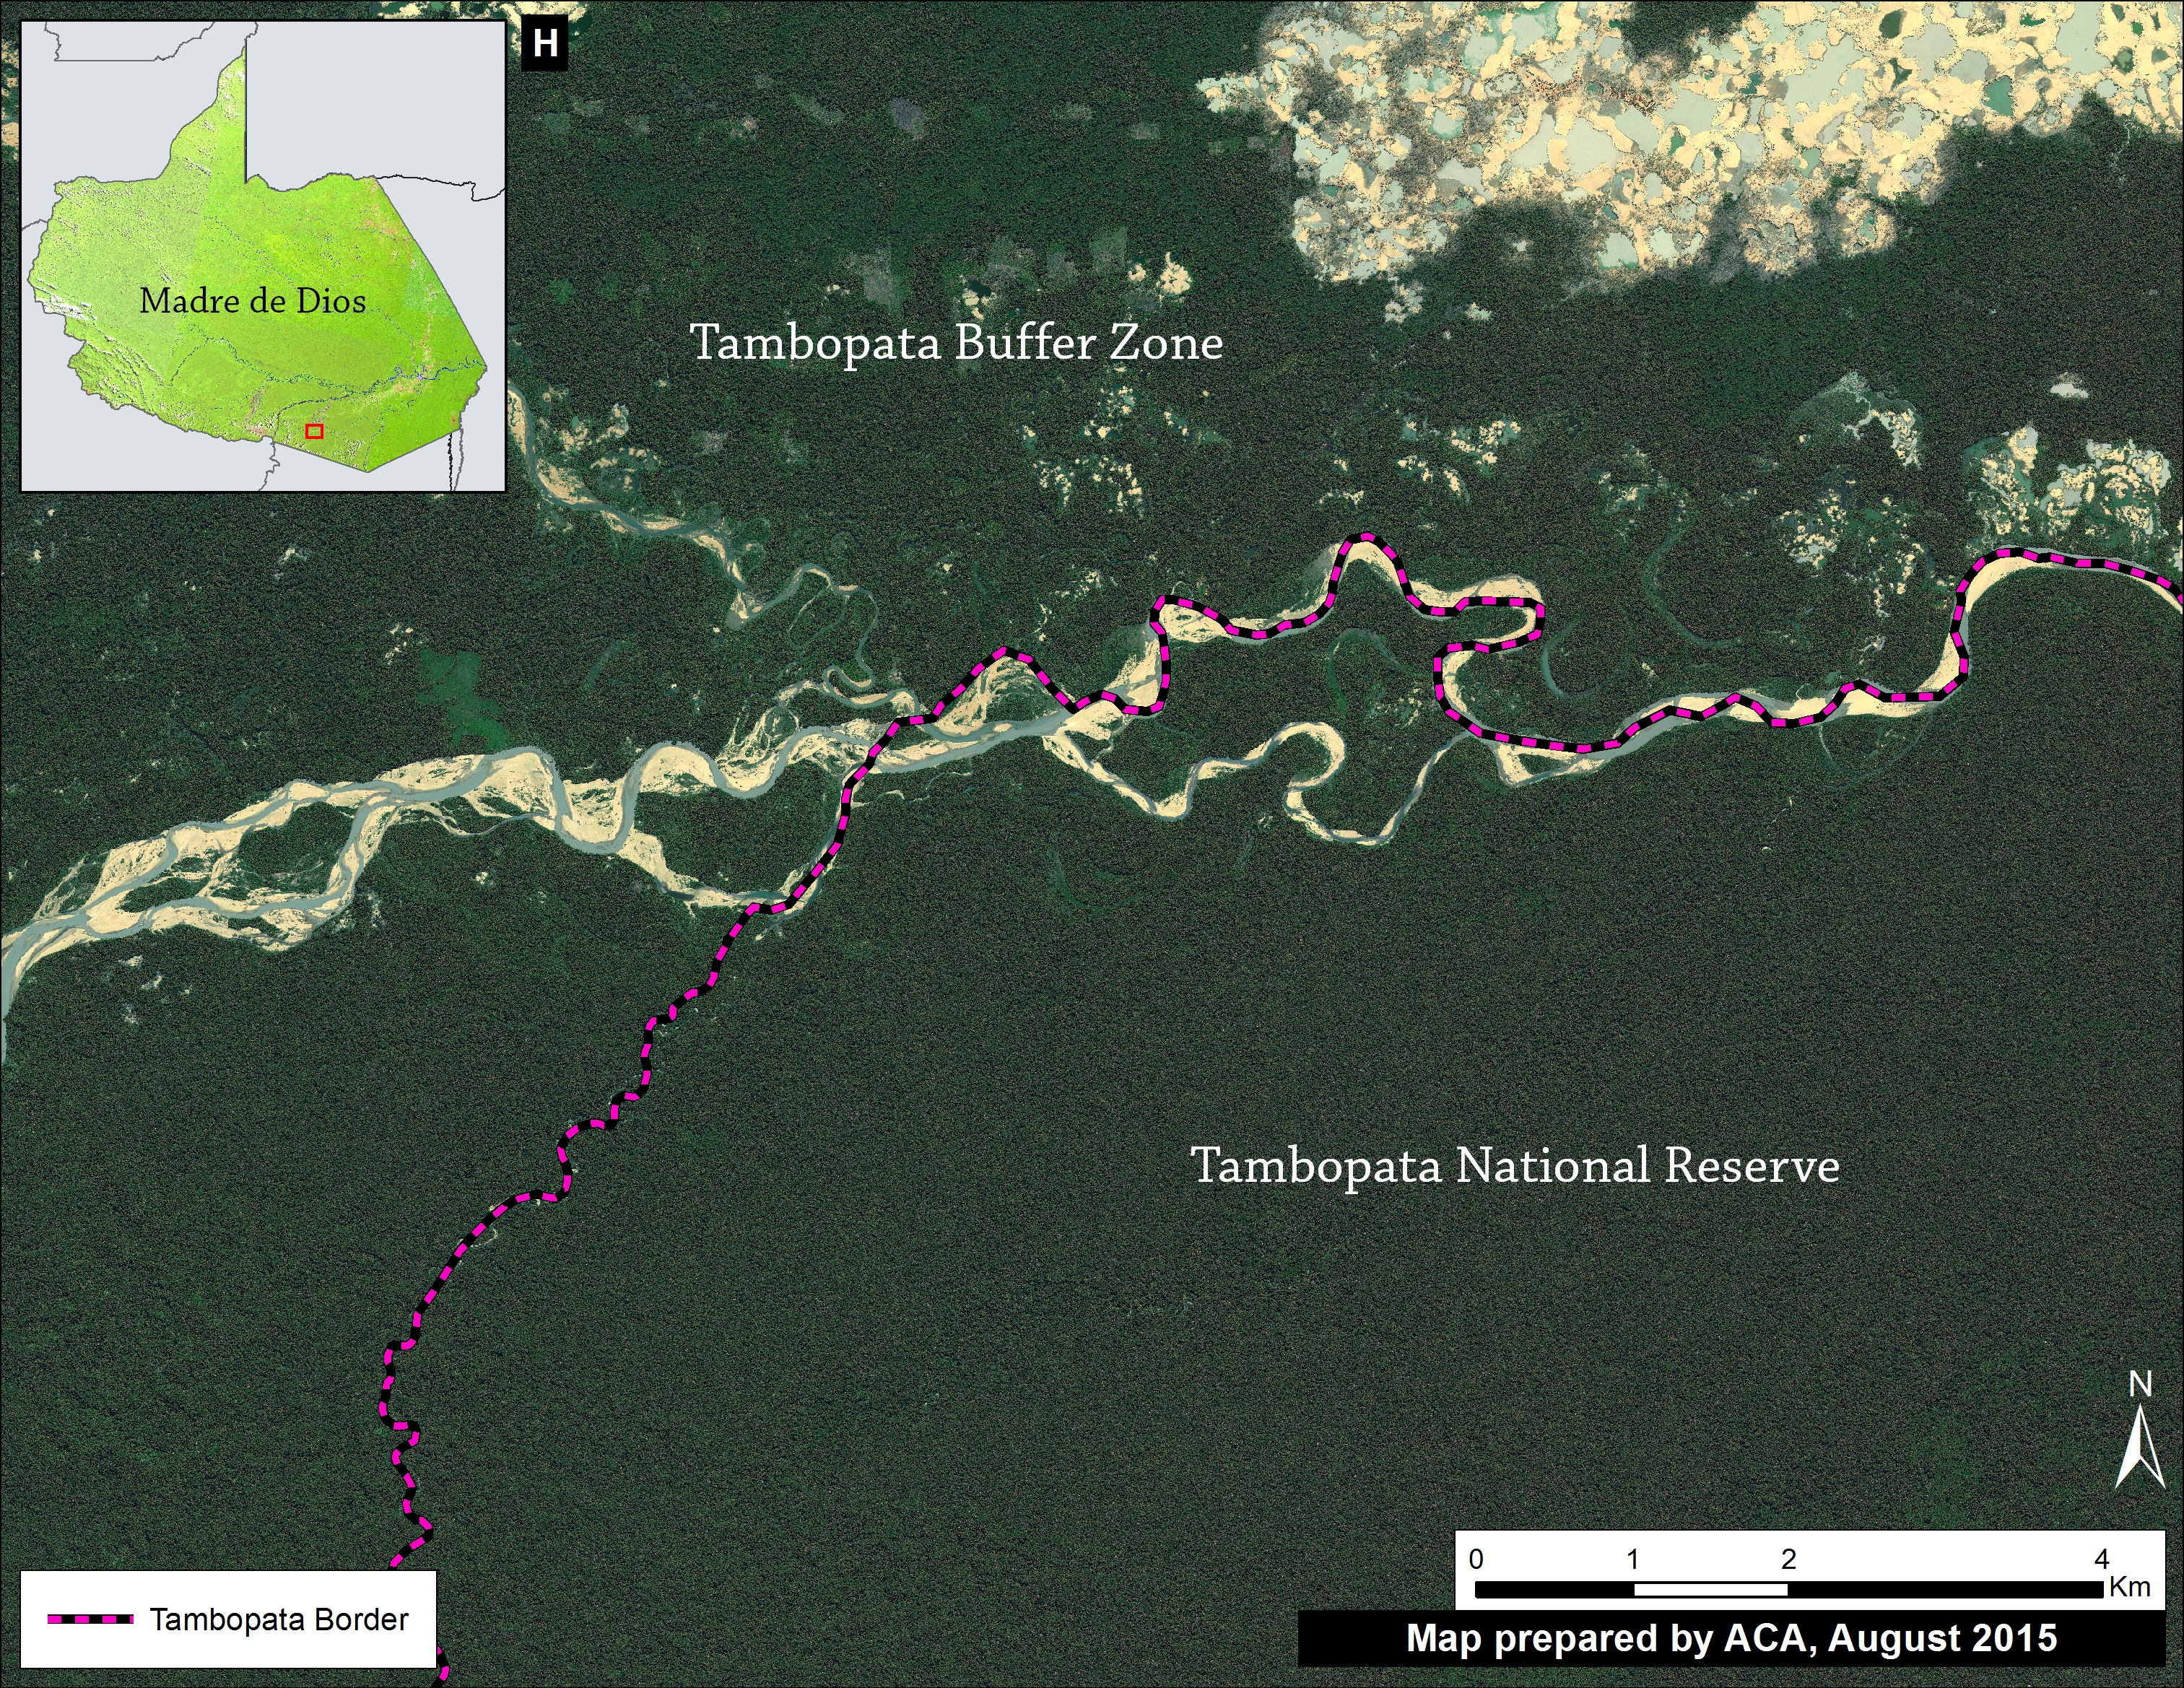
Tambopata National Reserve: Defense Against Deforestation

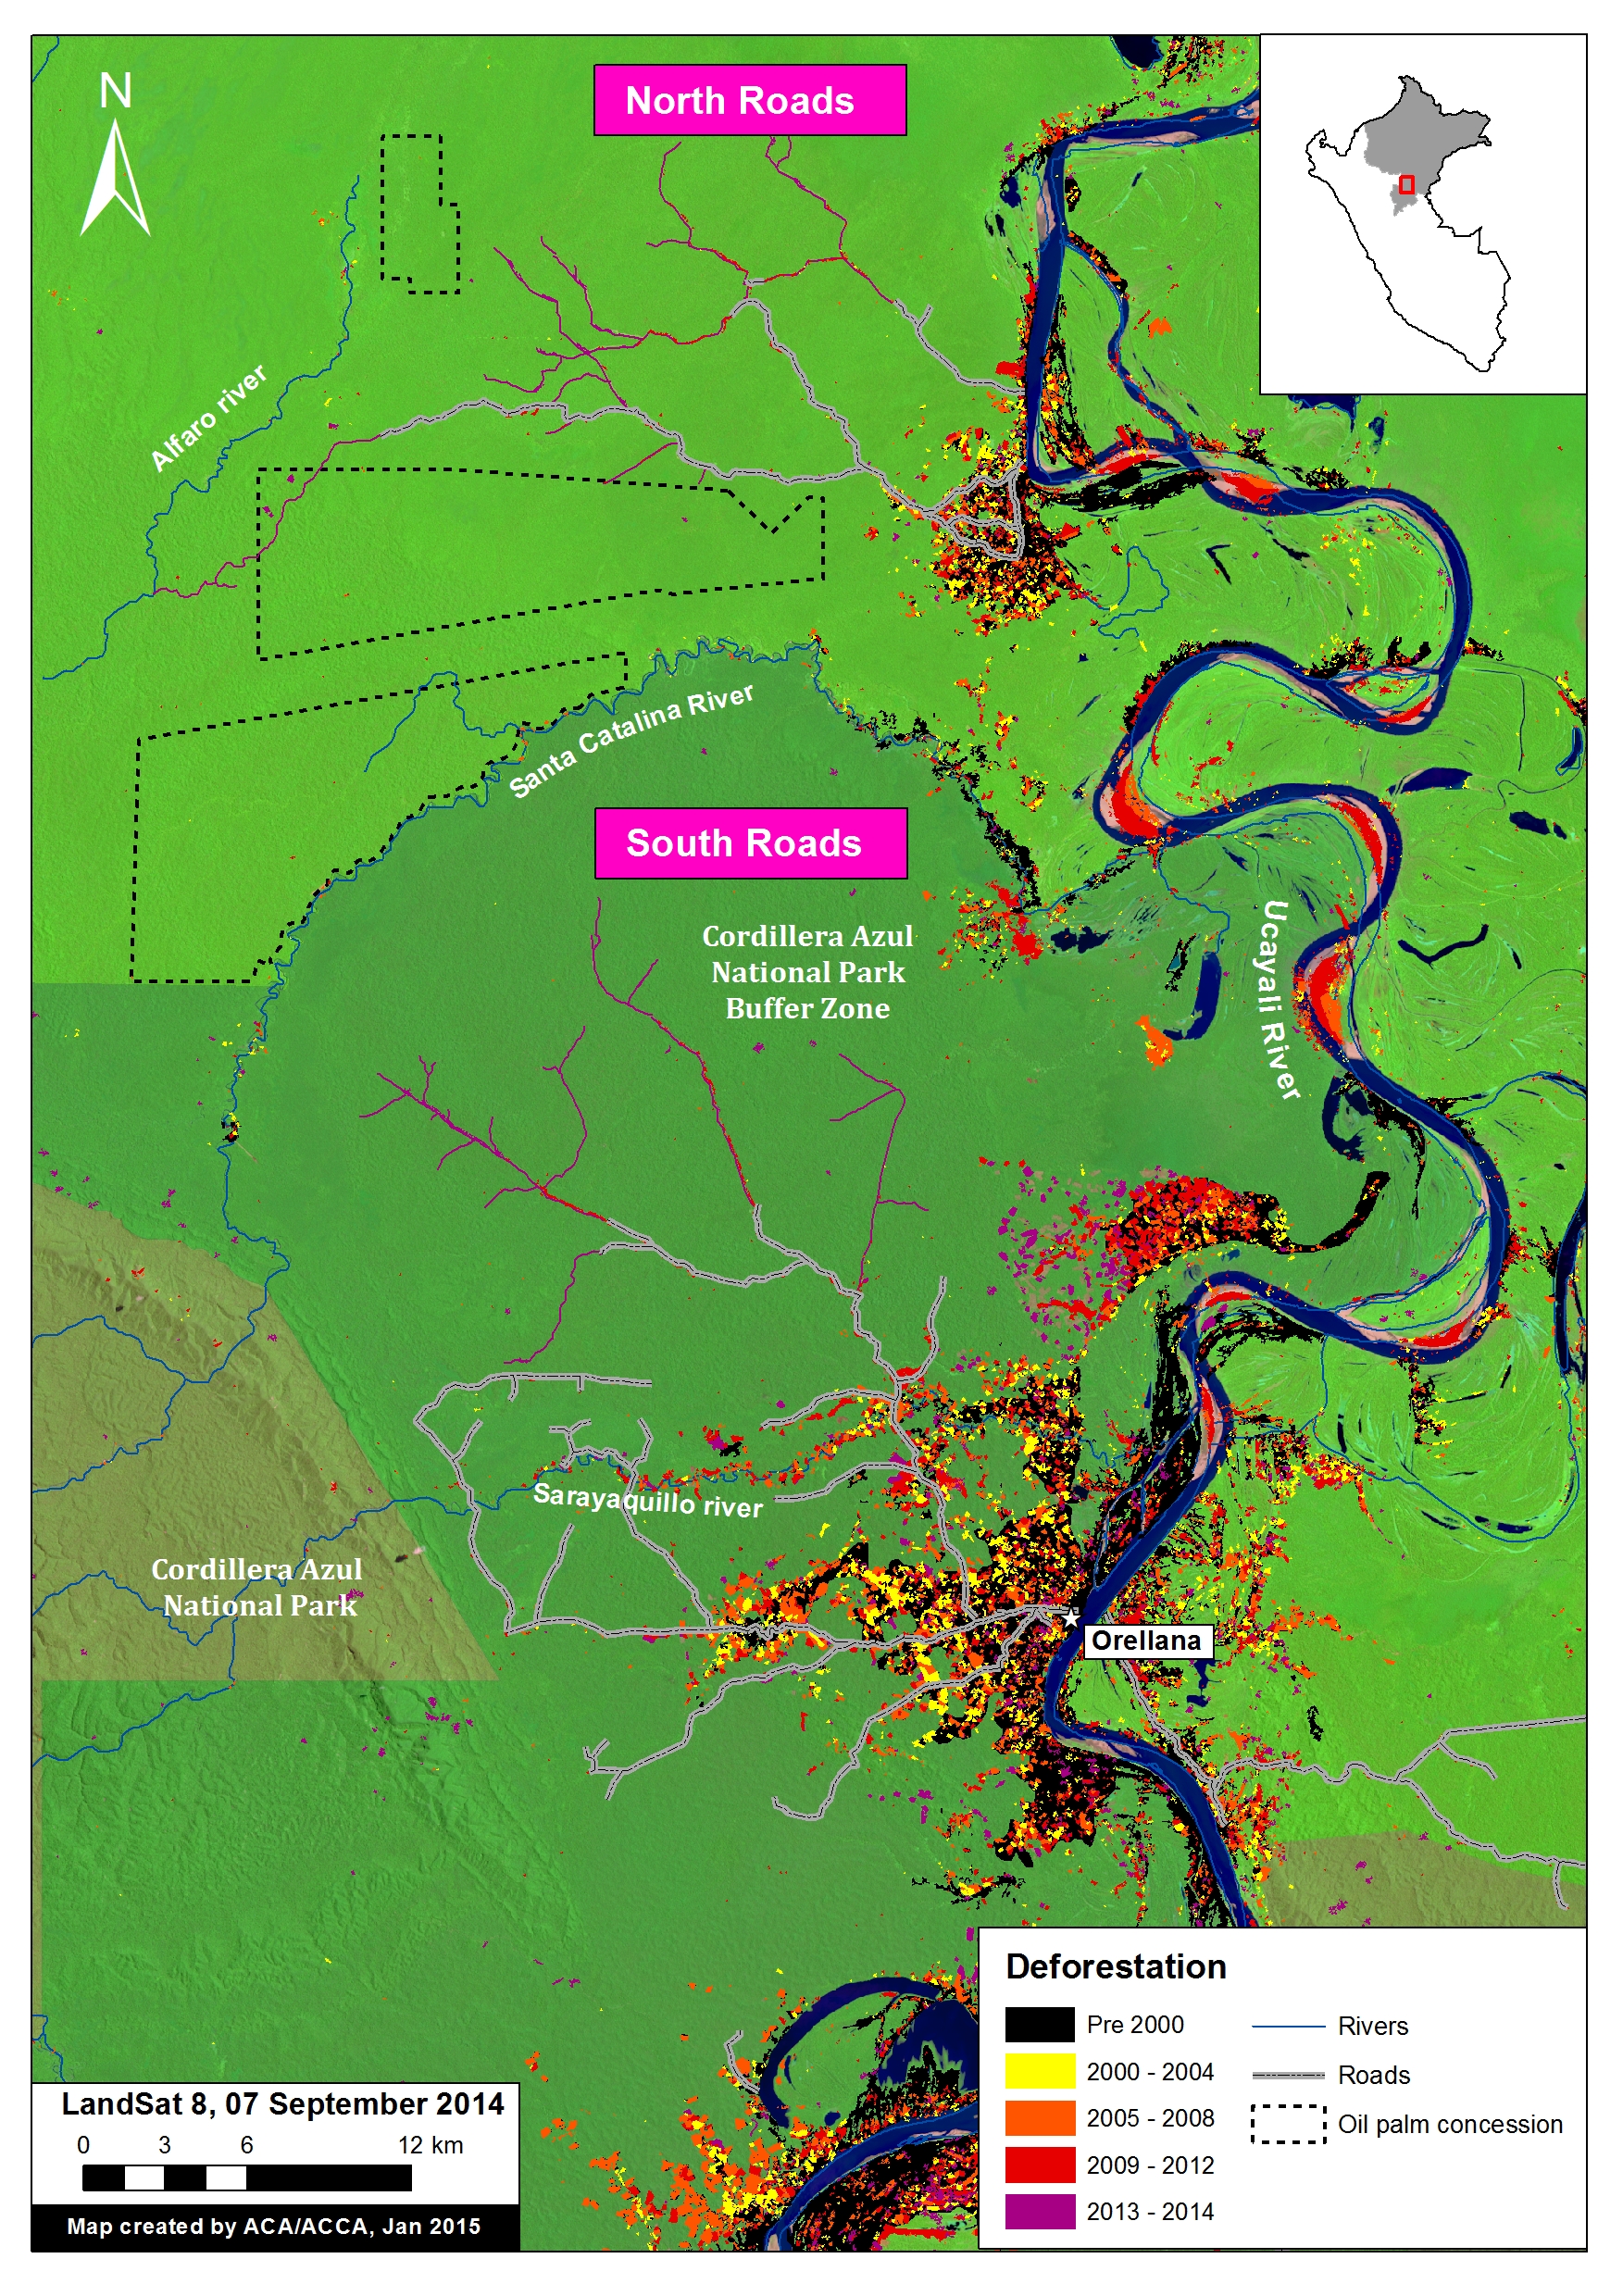
Image 12h illustrates how the Tambopata National Reserve remains a good defense against deforestation.

ZoomH v5_english
Image 12h. Tambopata National Reserve. Date of Image: July 29, 2015. Data: WorldView2 from Digital Globe (NextView).

SERNANP Response

In response to this article, SERNANP (the Peruvian protected areas agency) issued this statement:

The area known as La Pampa is located in the buffer zone of the Tambopata National Reserve (RNTAMB) in the Madre de Dios region.

“El sector denominado La Pampa se encuentra ubicado en la zona de amortiguamiento de la Reserva Nacional Tambopata (RNTAMB) en la región Madre de Dios.”

In its capacity as lead agency of natural protected areas of Peru, SERNANP has been making great efforts to deal with illegal mining and other activities that threaten the Reserve. As part of these actions, we carried out monitoring in this region through images from LANDSAT 8). This monitoring system has confirmed the excellent state of conservation of the Reserve. Information has also been collected by park guards on patrols conducted along the Malinowski River and on monitoring trails located within the protected area.

“En su calidad de ente rector de las áreas naturales protegidas del Perú, el SERNANP viene realizando grandes esfuerzos para hacer frente a la minería ilegal y otras actividades que amenacen a la Reserva. Como parte de estas acciones se realiza un monitoreo mediante imágenes (LANSAT 8), sistema que ha corroborado el óptimo estado de conservación de la Reserva,  información que ha sido recopilada también por los guardaparques en los patrullajes realizados a lo largo del río Malinowski y en las trochas de monitoreo ubicadas al interior del área protegida.”

Similarly, this system has allowed SERNANP to collect information on threats in the buffer zone, data that has been shared promptly with leading authorities on illegal mining. This information is centered on points of access to the buffer zone, trails, gas stations, distances, among others; this has contributed to the development and implementation of the strategy against illegal mining in the Tambopata Natural Reserve.

“Asimismo, este sistema ha permitido recopilar información sobre las amenazas  en la zona de amortiguamiento, datos que han sido compartidos oportunamente con las principales autoridades competentes en materia de minería ilegal. Esta información está centrada en puntos de acceso a la zona de amortiguamiento, trochas, grifos, distancias, entre otros; lo que ha contribuido en la elaboración y aplicación de la estrategia de la RN Tambopata contra la minería ilegal.”

This strategy also includes the continued involvement and support of the Chief of the Tambopata National Reserve on issues related to the promotion of economic activities and the exploitation of natural resources by local populations, promoting tourism as a strategy for conservation of the protected area, lectures on environmental education, and others.

“Esta estrategia comprende también la permanente participación y apoyo de la Jefatura de la Reserva Nacional Tambopata en temas relacionados con el impulso de actividades económicas como el aprovechamiento de recursos naturales por parte de las poblaciones locales, la promoción del turismo como estrategia de conservación del área protegida, charlas de educación ambiental, entre otros.”

Citation

Finer M, Olexy T (2015) High Resolution View of Illegal Gold Mining in La Pampa (Madre de Dios, Peru). MAAP #12. Link: https://www.maapprogram.org/2015/08/image12-lapampa/


Image #11: Importance of Protected Areas in the Peruvian Amazon

The Peruvian national protected areas system, known as SINANPE, is critically important to Amazon conservation efforts in the country.

There are currently 46 protected areas in the Peruvian Amazon under national or regional administration*. In total, these areas cover 19.5 million hectares and include a wide variety of designations, including areas of indirect use (those with strict protection, such as National Parks) and direct use (those that allow the exploitation of natural resources, such as National Reserves) under national administration and Regional Conservation Areas  under regional administration.

Here, MAAP #11 presents a deforestation analysis that demonstrates the effectiveness of protected areas in relation to the surrounding landscape in the Peruvian Amazon.

MAAP_All_ANP_11a_v4_e
Image 11a. Recent forest loss in relation to protected areas in the Peruvian Amazon. Data: SERNANP, PNCB-MINAM/SERFOR-MINAGRI, NatureServe.

Key Results

Image 11a shows recent (2000 – 2013) forest loss patterns in relation to the current national protected area system in the Peruvian Amazon (Image 11b shows the same, but with zooms of the northern, central, and southern regions, respectively).  Note that some of the documented forest loss surely comes from natural causes, such as landslides or meandering rivers.

Across all protected areas administered nationally (such as National Parks and National Reserves), we found that deforestation was significantly lower starting at 2 km within their boundaries compared to outside them (see Images 11b and 11c).

The rate of deforestation outside of protected areas is more than twice of that within them (within the 5 km buffer zone study area, see below).

MAAP_All_ANP_11b_v2_z_m
Image 11b. Regional zooms (north, central, south) of recent forest loss in relation to protected areas. Data: SERNANP, PNCB-MINAM/SERFOR-MINAGRI, NatureServe.

Deforestation Analysis – Methods

We conducted a basic analysis of all protected areas administered nationally (National Park, National Sanctuary, Historic Sanctuary, National Reserve, Protection Forest, Communal Reserve, and Reserved Zone) to estimate their relative effectiveness in controlling deforestation in relation to the surrounding landscape. The forest loss data comes from the National Program of Forest Conservation for the Mitigation of Climate Change (PNCB) of the Ministry of the Environment of Peru. This deforestation analysis had two key components.

MAAP_All_ANP_11b_v3_
Image 11c. Illustration of spatial intervals for deforestation analysis.

First, we compared recent forest loss within versus outside each protected area at four different spatial intervals: 1 km, 2 km, 3 km, and 5 km (see Image 11c). In other words, starting at the boundary line for each area, we created a 1 km buffer both inside and outside the area and compared the relative (forest loss/area *100) deforestation. We then repeated this analysis for the other intervals. The establishment of these intervals areas is based on the assumption that the closer to the limits of each protected area, deforestation could be more related to anthropogenic activities in surrounding areas, which is expected to reduce the effect of natural losses due to changes in the courses of rivers and landslides in unstable areas.

Second, we controlled for protected area creation date. If an area was created prior to 2000, such as Manu National Park created in 1973, we used the complete 2000-2013 PNCB forest loss dataset. If an area was created after 2000, such as Alto Purus National Park created in 2004, we used just the forest loss dataset for the years following its creation (in this case, 2005-2013).

This analysis was designed to show general patterns, not be a definitive evaluation of the effectiveness of protected areas. A more complete evaluation could control for additional variables (such as slope, elevation, climate, distance to population centers, etc…).


Deforestation Analysis – Results

MAAP_All_ANP_11c_v3_m
Image 11d. Results of deforestation analysis.

Across all protected areas administered nationally, we found that deforestation was significantly lower starting at 2 km within their boundaries compared to outside them (p < 0.05) (see Image 11d). The significance level increased by an order of magnitude between 3 and 5 km. We didn’t detect a significant difference between 1 km within and outside the protected area boundaries.

On average, we found that 0.5% of the area within protected areas experienced forest loss between 2000-2013, while outside the protected areas was nearly 1.2%. In other words, the rate of deforestation outside of protected areas is more than twice of that within them. Furthermore, as mentionned earlier, some forest loss within the protected areas surely comes from natural causes, such as landslides or meandering rivers.

Related Studies

As noted above, this analysis was designed to show general patterns, not be a definitive evaluation of the effectiveness of protected areas. Several other recent studies have pointed out the importance of controlling for additional variables.

In a study focused on the Brazilian Amazon, Pfaff et al (PLOS ONE 2015) found that is important to control for the location of protected areas, which is often in more isolated areas with lower deforestation pressures.

Specifically regarding the Peruvian Amazon, a study by the research organization Resources for the Future (2014) found that “the average protected area reduces forest cover change”. This study rigorously controlled for a number of key variables (such as elevation, slope, climate, and distance to cities), but used older and more limited forest loss and protected areas data.

*This total of 46 protected areas includes: a) all the categories considered part of SINANPE (including Reserved Zones and Regional Conservation Areas) except for Private Conservation Areas, and b) all areas that are totally or partially located in the Amazon basin.

SERNANP Response

In response to this article, SERNANP (the Peruvian protected areas agency) issued this statement:

Actualmente el SERNANP viene realizando una verificación en campo por parte del personal guardaparque de las Áreas Naturales Protegidas durante sus acciones de patrullaje merced a la información de pérdida de bosque proporcionada por el Ministerio del Ambiente, periodo 2013-2014, a fin de determinar si el cambio de la cobertura se debe a causas naturales o antrópicas. Esto podrá complementar el análisis desarrollado por ACCA.

Es importante señalar, que el SERNANP viene aplicando el enfoque ecosistémico en la planificación y gestión de las Áreas Naturales Protegidas, en este sentido desarrolla acciones que permiten evitar la deforestación al interior de estos espacios protegidos, pero a su vez nos proponemos que en su entorno se desarrollen actividades compatibles con la conservación que eviten el fraccionamiento del hábitat y permitan la sostenibilidad de la conservación de las Áreas Naturales Protegidas a futuro.

En este sentido, considerando de vital importancia generar alianzas con las entidades que toman decisiones en el territorio fuera de estos espacios, hemos establecido a nivel nacional un trabajo conjunto con los Gobiernos Regionales a fin de integrar las Áreas Naturales Protegidas dentro de corredores de conservación con otras modalidades de conservación que  se impulsan a través de sus sistemas regionales de conservación. Con ello, se esperaría detener el fraccionamiento de hábitat alrededor de las Áreas Naturales Protegidas, lo que podría conllevar a su insostenibilidad a futuro. Al respecto, es preciso mencionar que los Sistemas Regionales de Conservación cuentan con un espacio de coordinación donde se reúnen las principales instituciones que gestionan territorio y en la cual se discuten las iniciativas de desarrollo social y económico para que se realicen en armonía con la conservación de la biodiversidad del país, el SERNANP forma parte de estos espacios a nivel nacional.

Citation

Finer M, Novoa S (2015) Importance of Protected Areas in the Peruvian Amazon. MAAP: Image #11. Link: https://www.maapprogram.org/2015/08/image-11-protected-areas

Mining News Watch #17

Mining News Watch #17 covers the time period June 10- July 30, 2015

Top Stories 

  • On July 13th, the Peruvian police carried out a major raid in the La Pampa mining zone (Madre de Dios), the first major government operation against illegal mining in eight months.

  • Following the raid, the regional President of Madre de Dios, Luis Otsuka, complained of the inefficiency of the formalization process in Madre de Dios, and how it is damaging the region’s economy.

  • Technical reports released by the Amazon Conservation Association (ACA) and the Conservación Amazónica (ACCA) has found growing deforestation in the Amarakaeri Communal Reserve and Sierra del Divisor.

  • OjoPublico released an investigative report on the foreign financing of illegal mining in South America, including the foreign businesses that help finance illegal gold mining.

Government Action

  • On July 13th, a team of 900 Peruvian police agents destroyed 55 illegal gold mining settlements in the La Pampa mining zone, located in the buffer zone of the Tambopata National Reserve. This was the first major operation against illegal gold mining camps in Madre de Dios in eight months. [1, 2]
  • Two days after the raids, on July 15th, the regional president of Madre de Dios, Luis Otsuka, demanded clear regulations for formalized mining from the national government. He complained of the irregularity with the formalization process, as well as the fact that the boundary line for Madre de Dios also marks the beginning of territory where mining activity is categorically rejected. Otsuka claimed that the national government is unknowingly causing Madre de Dios’s economic axis to come to a halt. [3]
  • In June, the National Police of Peru officially established a new police body of 1,000 agents that will focus on combatting illegal mining and illegal logging in all Peruvian departments. This team led the major operation on July 13th in La Pampa. [4, 5]
  • Further north, police destroyed three mining camps in the region of Amazonas in June. The illegal mining was occurring within an indigenous community territory, and was negatively effecting the riverbeds of the Maranon and Santiago rivers, including exposure to mercury and cyanide. [6]
  • The Environmental Evaluation and Auditing Organization (OEFA) released a series of reports in July with the regional results of the 2014 environmental audits, including one that focused on small-scale mining. The 25 regional governments in Peru were given a score on a scale of 0 to 20 based off of OEFA’s formal and operative standards for mining. OEFA categorizes the results as follows: scores above 14 are good; 11-14 is average; 8 to 11 is low; 5 to 8 is very low; and scores below 5 are critical. There was substantial improvement in Madre de Dios, which was ranked 24th in 2013, but rose to 4th in 2014. During the 2013-2014 year, Madre de Dios established identifications for illegal mining, developed environmental evaluations, and worked with the federal government to monitor mining, all which helped raise its score. [7]

Region

Score 2013

Rank 2013 Score 2014 Rank 2014
Madre de Dios 3.36 #24 9.97 #4
Amazones 5.92 #13 6.72 #16
Loreto 4.42 #23 6.17 #19
Ucayali 5.35 #15 5.28

#23

  • An executive decree from the Ministry of Energy and Mines (MEM) that assigned new fees on gasoline in Madre de Dios has been improved so that it will prevent gasoline from being used for illegal mining without interfering with legal productive sectors of the economy. MEM used information from the National Customs and Tax Administration (SUNAT) to figure out proper gasoline supplies and fees for the logging, forestry, Brazil nut harvesting, and tourism industries. However, businesses in the area are still concerned that the law is not effectively combatting illegal mining because it is currently applied only in the La Pampa mining zone, not all of Madre de Dios. [8]
  • In July, 68 kg of mercury and 2,400 gal of diesel were seized in Madre de Dios. It is believed that the mercury and diesel were going to be used for illegal mining in La Pampa. [9]

Formalization

  • Since June, a team from MEM has been issuing audits for the “saneamiento” registration that will help 40,000 miners finalize the formalization process. Saneamiento lacks a direct translation in English, but implies legal ordering and restructuring of the original complex formalization process. This nationwide audit comes as a result of the approval of the “Saneamiento Strategy for Small and Artisanal Miners,” (la Estrategia de Saneamiento de la Pequeña Minería y de la Minería Artesanal) which streamlines the six step formalization process. The auditing team examines the legal documentation and field sites of informal miners, and if the audit is consistent with the saneamiento requirements, then the subject can continue the formalization process. [10] 
  • With the goal of simplifying and renergizing the formalization process, “Ventanilla Unica,” the website used to help informal miners, is being restructured. Ventanilla Unica has documents, information on the Corrective Environmental Management Instrument, news on informal mining, and resources for other state institutions. [11, 12]

Deforestation

  • ACA and ACCA released a technical report on their MAAP website concerning deforestation from a mining zone in Madre de Dios that has expanded into the Amarakaeri Communal Reserve. Their analysis showed that gold mining deforestation entered the reserve in 2013 and continued expanding in 2014 and 2015. The total gold mining deforestation within the reserve is currently at 11 hectares. [13] The Peruvian National Service of Natural Protected Areas (SERNANP) later confirmed ACA’s report that illegal mining had been the cause of the deforestation. [14]
  • ACA released a technical report on their MAAP site that illustrated the recent expansion of gold mining near Sierra del Divisor in the region of Ucayali. [15]

Other

  • OjoPublico, an online investigative journalism news source, released a report investigating the exportation of gold from illegal mining. The report estimated that 150 tons of gold was illegally smuggled from Peru in 2010, which makes Peru unofficially the second biggest global producer of gold with 330 tons, behind only China. The report released the names of several European and American businesses in the London Bullion Market Association that financially supported the operations, including American companies Northern Texas Refinery and Republic Metals Corporation. [16]
  • Peru established three alliances with Colombia, Ecuador, and Bolivia in hopes of eradicating illegal mining, including sharing ideas for mining formalization, combatting illegal mining, and environmental remediation. Peruvian officials also stated that they were working on establishing an alliance with Brazil. [17]
  • The Association for Research and Integral Development, a private organization with a contract with the National Service for Protected Natural Areas (Sernanp), presented an environmental management project that can help avoid deforestation by using agroforestry to produce cacao. The project would prevent deforestation in 12,000 hectares of forest in the Tambopata National Reserve and Bahuaja Sonene National Park, both located in Madre de Dios. [18]


Notes: The ACA Mining News Watch focuses mostly on issues pertaining to the Peruvian Amazon and may not cover issues related to non-Amazonian parts of the country. We would like to credit ProNaturaleza’s “Observatorio Amazonia” as our primary resource for articles related to illegal mining in Peru.

Photo Credit: http://elcomercio.pe/peru/madre-de-dios/operacion-contra-mineria-ilegal-pampa-fotos-noticia-1826310/3

ACA contact for Comments/Questions:  Matt Finer (mfiner@amazonconservation.org)

Citation: DeRycke E, Finer M (2015). Peru Mining News Watch Report #17. Amazon Conservation Association. https://www.maapprogram.org/2015/08/mining-news-watch-17


Image #10: Bahuaja Sonene National Park – Increasing Deforestation Within and Around Southern Section (Puno, Peru)

Here, in MAAP #10, we show the results of a deforestation analysis of two sectors of Bahuaja Sonene National Park and its surrounding buffer zone. The Park, which covers an area of more than 1.6 million hectares in the regions of Puno and Madre de Dios in the southern Peruvian Amazon, is an area of high biological diversity.

Specifically, we found increasing deforestation in 1) the buffer zone of the Park’s western section (Loromayo sector) and 2) inside the Park’s southeastern section (Colorado sector). In both cases, we identified shifting cultivation associated with coca cultivation as one of the main drivers of deforestation.

Bahuaja_Sonene_MAAP_10a_v3_e (1)
Image 10a. Deforestation detected in and around Bahuaja Sonene National Park and its buffer zone. Please note that Zooms “A” and “B” are described in more detail below. Data: SERNANP, PNCB, USGS.

Key Results

We highlight two key areas within and around Bahuaja Sonene National Park where deforestation grew substantially between 2013 and 2015:

1) Sector Loromayo, located in the buffer zone immediately outside the western section of the Park (see Zoom A). We estimate that more than 1,000 hectares (ha) were deforested since 2010, peaking in 2014 (331 ha). This expanding deforestation entered the Park in 2014.

2) Sector Colorado, located in the southeastern section of the Park (see Zoom B). We estimate, between 2001 to 2014, the deforestation of over 530 hectares inside the Park and over 1,170 hectares in the surrounding buffer zone. As in Loromayo, there was a notable increase in deforestation starting in 2010, with the peak occurring in 2014.

In both sectors, Loromayo and Colorado, we identified that one of the main drivers of deforestation is coca cultivation.

Description of Data

In the following maps:

Any variation of green in the satellite imagery indicates areas of forest cover.

Yellow (2000-2004), orange (2005-2008), red (2009-2012), and purple (2013) indicate areas that were deforested between 2000 and 2013 according to data from the National Program of Forest Conservation for the Mitigation of Climate Change (PNCB) of the Ministry of the Environment of Peru.

The colors pink (2014) and turquoise (2015) indicate areas that were deforested in the last two years based on our analysis of Landsat imagery using CLASlite forest monitoring software.

Zoom A: Loromayo River (western buffer zone)

Bahuaja_Sonene_MAAP_10c_v3_e
Image 10b. The expansion of deforestation along the Loromayo river in the buffer zone to the west of Bahuaja Sonene National Park. Data: SERNANP, USGS, IBC, PNCB.

As shown in Figure 10b, we identified a striking pattern of deforestation in the sector Loromayo, located between the Malinowski and Chaspa rivers in the Park’s western buffer zone in the department of Puno. Note that the deforestation entered the Park in 2014.

In this area, we documented the deforestation of 1,005 hectares since 2010. This deforestation peaked in 2014, with 331 hectares, including 1.8 hectares within the Park. Not much data is yet available for 2015.

Please note that we previously reported on the advance of gold mining deforestation seen in Image 10b along the Malinowski River in MAAP #5.

Sector Loromayo: Shifting Agriculture that includes Coca Cultivation

Bahuaja_Sonene_MAAP_10g_v3_m_e
Image 10c. Coca density data (upper panel) in relation to a recent high resolution satellite image of the area (lower panel). Data: UNODC 2014, SERNANP, Worldview-2 from Digital Globe (NextView).

In the recent UNODC (United Nations Office on Drugs and Crime) report “Monitoreo de Cultivos de Coca 2014” [Coca Crop Monitoring 2014], it was reported that the Loromayo sector (coca zone San Gabán) has a medium to high density of coca cultivation, with a recent increase of 5.9% since 2013. Therefore, we conculde that coca cultivation is one of the major drivers of the observed deforestation.

Image 10c displays the most recent UNODC coca density data (upper panel) in relation to a recent high resolution satellite image of the area (lower panel). Deforestation is rapidly expanding in the vicinity of the Park boundary. Unfortunately, in this image, a few clouds cover the small area where the deforestation recently entered Park.

Zoom B: Sector Colorado (Southeastern section of Park)

Bahuaja_Sonene_MAAP_10b_v2_e
Image 10d. The expansion of deforestation in the Colorado sector of Bahuaja Sonene National Park. Data: SERNANP, USGS, IBC, PNCB.

As seen in Figure 10d, deforestation is well established and increasing in the sector Colorado, located in the southeast section of Bahuaja Sonene National Park, with the Region of Puno. Our analysis in this area extended from the upper Tambopata River to the Azata river.

We document the deforestation, since 2001, of 538 ha inside the Park and an additional 1,172 ha within the surrounding buffer zone. Similar to the sector Loromayo sector, there was a marked increase in deforestation since 2010, with a peak in 2014. More than half of the deforestation (53%, 287 ha) occurred since 2010, with a maximum of 81 ha in 2014. Not much data is yet available for 2015.

Sector Colorado: Presence of Coca Cultivation Inside the Park

Bahuaja_Sonene_MAAP_10h_v3_m_e
Image 10e. Coca density data (upper panel) in relation to a recent high resolution satellite image of the area (lower panel). Data: UNODC 2014, SERNANP, SPOT6 from Airbus.

According to a recent report by the Wildlife Conservation Society (WCS), the deforestation in the Colorado sector was a result of the advance of agriculture and livestock cultivation in the area. Moreover, according to the recent UNODC  report noted above, this sector (coca zone Inambari-Tambopata) also has a high density of coca, with 108 ha on the interior of Bahuaja Sonene National Park and 1,610 ha in the buffer zone, likely making it one of the major drivers of the observed deforestation.

Image 10e displays the UNODC coca density data (upper panel) in relation to a recent high resolution satellite image of the area (lower panel).

SERNANP Response

In response to this article, SERNANP (the Peruvian protected areas agency) issued this statement:

“El sector denominado como Colorado es sector ubicado dentro del Parque Nacional Bahuaja Sonene, que actualmente se encuentra zonificado como Zona de Recuperación;  dicha zonificación se otorga a aquellas zonas que por actividades antrópicas han sido afectadas y que necesitan estudios complementarios para determinar su zonificación definitiva.”

[The sector named ‘Colorado’ is a sector located within the Bahuaja Sonene National Park, which currently is zoned as a ‘Restoration Zone.’  Said zoning is extended to those zones which have been affected due to anthropic activities and require supplementary studies so as to determine their definitive zoning designation.]

Debemos señalar que en este sector se han detectado severas plagas que afectan los cultivos de frutos como la naranja y café, desencadenando que la población asentada en la zona de amortiguamiento del Parque se vean forzada a reemplazar estas plantaciones por el cultivo de coca en algunos casos.

[We should note that severe pests have been detected in this sector which affect the cultivation of fruit such as oranges and coffee; this has lead the population settled in the park’s buffer zone to have no choice but to replace these crops with the cultivation of coca in some cases.]

Esta situación ha sido identificada y advertida oportunamente por el jefe del Parque Nacional Bahuaja Sonene a las entidades pertinentes para iniciar su erradicación; no obstante, el SERNANP también ha emprendido un trabajo conjunto con las autoridades locales y el comité de gestión del área natural protegida para combatir esta amenaza, lo cual figura en el Plan Maestro 2015-2019 del área en mención. Ahí se contemplan estrategias  como la construcción de un puesto de control y vigilancia para monitorear permanentemente esta situación.

[The head of the Bahuaja Sonene National Park has identified and issued a warning about this situation in a timely manner to the relevant entities so as to initiate its eradication work; notwithstanding, SERNANP has also undertaken joint work with local authorities and the management committee of the natural protected area to combat this threat, which figures in the 2015-2019 Master Plan of the area in question.  The latter contains strategies such as the construction of a checkpoint and guard post for permanently monitoring this situation.]

Asimismo, se vienen promoviendo mesas de diálogo y el desarrollo de actividades económicas sostenibles que reemplacen los cultivos ilícitos y que garanticen la calidad de vida de la población de Colorado.”

[Likewise, dialogue roundtables and the development of sustainable economic activities have been promoted that can replace the illicit crops and guarantee quality of life for the population of Colorado.]

Citation

Finer M, Novoa S (2015) Bahuaja Sonene National Park – Increasing Deforestation Within and Around the Southern Section (Puno, Peru). MAAP: Image #10. Link: https://www.maapprogram.org/2015/07/image-10-bahuaja/

References

UNODC. Monitoreo de cultivos ilícitos Perú 2014. p 29. (Lima, 2015).

MAAP #9: Confirming Forest Clearing for Cacao in Tamshiyacu (Loreto, Peru) came from Primary Forest

Recall that in Image #2 we documented the rapid clearing of 2,126 hectares of primary forest between May 2013 and August 2014 for a new cacao project outside of the town of Tamshiyacu in the northern Peruvian Amazon (Department of Loreto).

However, the company that carried out the forest clearing (United Cacao, through its wholly-owned subsidiary in Peru, Cacao del Peru Norte) has responded “that this area had been used for farming since the late 1990s, and thus it was not primary forest…There was no high-conservation-value forest on that land (Cannon JC, 2015, mongabay.com).” In addition, the company’s website states that “The site was heavily logged of all tropical hardwoods in the 1980s.”

Here, in Image #9, we 1) publish new high-resolution (33 cm) satellite imagery that shows how the cacao project is expanding into dense, closed-canopy forest and 2) detail exactly how we determined that the vast majority of the clearing indeed came from primary forest. These findings are critically important because the company has major expansion plans.

Tam_MAAP_Mapa_9a_p_v4
Image of the Week 9a. Mosaic of very high-resolution (33 cm) images of the United Cacao plantation near Tamshiyacu, Peru, in June 2015. Colors indicate insets. Data: WorldView-3 from Digital Globe (NextView).

Key Results:

We obtained very high-resolution (33 cm) satellite imagery taken over the United Cacao plantation in June 2015 (see Image 9a). In this imagery, one can clearly see that the cacao project is embedded and expanding into dense, closed-canopy forest.

We analyzed a series of satellite (Landsat) images dating back to 1985 to determine that, prior to the arrival of United Cacao in 2013, the project area 1) had NOT been used for major farming activities, 2) was NOT heavily logged of all tropical hardwoods, and 3) was dominated (98%) by primary forest (see Image 9b). In fact, by analyzing spectral signatures in the Landsat images, we confirm that the area cleared by United Cacao in 2013 was dominated by primary forest (see Image 9c).

We show data from the Carnegie Airborne Observatory showing that the majority of the United Cacao project area had the highest possible value of carbon (over 150 tons per hectare) immediately prior to the forest clearing in 2013.

Finally, we present information indicating that  the current documented forest clearing of 2,126 hectares may soon double or triple.

Landsat Time-series

Tam_MAAP_Mapa_9b_p_v3
Image 9b. Landsat time-series (1985-2012) of the future United Cacao plantation area (indicated by black box) prior to arrival of the company. Data: USGS

Image 9b displays a series of Landsat images dating back to 1985 showing that, prior to the arrival of United Cacao, the area was dominated (nearly 98%) by primary forest and NOT used for major agriculture activities or heavily logged of all tropical hardwoods.

In these Landsat images, dark green indicates forest cover, light green indicates secondary vegetation, pink indicates exposed ground (and is therefore a key indicator of recent forest clearing), and the scattered white and black spots indicate clouds and their shade.

In 1985, the future cacao project area (indicated by black box) was completely covered by forest with no signs of clearing, major logging, or farming. By 1995, there were a few scattered areas of cleared forest in the center of the future project area. By 2005, there was a slight expansion of these cleared areas in the center of the future project area. By 2012, immediately before the start of forest clearing, the future project area appeared much the same: a few scattered areas of cleared forest in the center, but the vast majority of the area was primary forest.

 We defined primary forest as an area that from the earliest available image (in this case, from 1985) was characterized by dense closed-canopy coverage and experienced no major clearing events.

NDVI Analysis

Tam_MAAP_Mapa_9c_p_v3
Image 9c. NDVI analysis of the United Cacao plantation area prior to arrival of the company. Letters indicate significance (i.e., “a” values are significantly different than “b” values). Data: USGS.

To further investigate the issue of primary forest, we used the Landsat imagery to conduct an NDVI (Normalized Difference Vegetation Index) analysis. NDVI is a common index of photosynthetic activity, or “greenness,” based on the fact that different surfaces (primary forest, secondary forest, water, bare ground, etc…) reflect light (visible and near-infrared) differently.

As seen in Image 9c, we obtained NDVI measurements across four different years (1985, 1995, 2005, and 2012) for 100 random points from each of three different areas: 1) area cleared by United Cacao in 2013 (orange dots), 2) nearby protected area that is proxy for primary forest (yellow dots), and 3) disturbed area along a major river that is proxy for secondary forest (purple dots).

For all four years, we found that the NDVI values for the area cleared by United Cacao in 2013 were similar to those of the nearby protected area (in fact, these values were nearly identical in 1985 and 1995), but significantly different than the disturbed area along the major river. In other words, the forest cleared by United Cacao was nearly identical to our proxy for primary forest and significantly different than our proxy for secondary forest. Thus, we conclude that United Cacao cleared over 2,000 hectares of primary forest in 2013.

Carbon Data Tells the Same Story

Tam_MAAP_Mapa_9d_v2
Image 9d. High-resolution carbon map of United Cacao plantation area (indicated by black box) prior to forest clearing. Data: Asner et al (2014) The high-resolution carbon geography of Peru. Berkeley, CA: Minuteman Press.

The Carnegie Airborne Observatory, led by Dr. Greg Asner, and the Peruvian Ministry of Environment, recently produced a high-resolution carbon geography of Peru. Interestingly, they mapped the carbon content of the United Cacao plantation area immediately prior to the forest clearing.

As seen in Image 9d, the vast majority of the United Cacao project area had the highest possible value of carbon (over 150 tons per hectare) immediately prior to the forest clearing in 2013. The only exceptions were the scattered previously cleared areas identified in Image 9b.

According to Asner, “The carbon levels were extremely high, indicating that they were large, intact forests that we normally picture when we think of primary Amazon forest.”

More Forest Clearing Coming…

Image8f
Image 9e. Project area map from the United Cacao website.

According to its website, United Cacao owns around 3,250 hectares near Tamshiyacu, and this total may soon increase to 4,000 hectares. In addition, the company has started an initiative with local farmers that may include an additional 3,250 hectares.

Thus, the current documented forest clearing of 2,126 hectares may soon double or triple.

Finally, it is worth mentioning that we detected a sawmill within the project area. This discovery raises the question, Has the company obtained the necessary permits for this activity?

Tam_MAAP_Mapa_9e_v3
Image 9f. A sawmill detected within the cacao project area. Inset: The pink dot indicates location of sawmill within the project area. Data: WorldView-3 de Digital Globe (NextView).

Citation

Finer M, Novoa S (2015) Demonstrating that Forest Clearing for Cacao in Tamshiyacu (Loreto, Peru) came from Primary Forest. MAAP: Image #8. Link: https://www.maapprogram.org/2015/06/image-9-cacao-tamshiyacu/

Image #8: New Deforestation Detected Within Sierra del Divisor (Peru) in June

Recall that in Image of the Week #7 we documented the increasing threats (illegal coca, logging, and mining) to the Sierra del Divisor Reserved Zone. We just obtained brand new, high-resolution imagery showing new deforestation deep within this protected area during the month of June. Here, Image of the Week #8, presents new maps of this recent deforestation. According to several consulted experts, the cause of this deforestation is illegal coca cultivation or a new illegal logging camp.

Sierra_divisor_MAAP_8d_v3p
Image 8a: Very high resolution (38 cm) image from June 23 showing new deforestation within the Sierra del Divisor Reserved Zone. Data: WorldView-3 from Digital Globe (NextView).

New Deforestation Detected

Image 8a shows the new deforestation detected within the southeast section of the Sierra del Divisor Reserved Zone. As of June 23, 2015 (the date of the image), the total new deforestation was 13 hectares. This deforestion is located between the La Cúpula and Shesha hills.

In Image of the Week #7 we showed that there is a series of illegal logging camps nearby, but this new deforestation is located much deeper in the reserve. According to several consulted experts, the cause of the new deforestation is illegal coca cultivation or a new illegal logging camp.

Updated Baseline Map

Sierra_divisor_MAAP_8b_Zoom3_v4
Image 8b. Updated baseline map of the southeast section of the Sierra del Divisor Reserved Zone. Data: MINAM, SERNANP, USGS, IBC, Hansen/UMD/Google/USGS/NASA.


Image 8b is an updated map of the deforestation within the southeast section of the Sierra del Divisor Reserved Zone. Note that the new 2015 deforestation is found much deeper within the reserve than previous detected forest loss.


Confirming Recent Deforestation

Sierra_divisor_MAAP_8c_v1p
Image 8c. Landsat time-series (2014-2015) of the recent deforestation. Data: USGS.

To better understand how the recent deforestation unfolded, we created a satellite (Landsat) image time-series. Note that in Image 8c all four panels show the exact same area over time. In August 2014, our focal area was completely forested. The first evidence of deforestation is seen in May 2015. In June 2015, the deforestation grows quickly.


Deforestation Within the Isconahua Territorial Reserve

Sierra_divisor_MAAP_8e_v2
Image 8d. Deforestation within the Territorial Reserve Isconahua. Data: MINAM, SERNANP, USGS, IBC, Hansen/UMD/Google/USGS/NASA.


Image 8d shows the new deforestation is also located with the Isconahua Territorial Reserve.

This is an official land designation in favor of indigenous peoples in isolation, to protect their rights, habitat, and the conditions that ensure their existence and integrity as a people.


SERNANP Response

In response to this article, SERNANP (the Peruvian protected areas agency) issued this statement:

“The Sierra del Divisor Reserved Zone is a transitional area under the Peruvian National Service of Natural Protected Areas (SERNANP).

Over the past few years, Sierra del Divisor has made significant efforts in its fight against ilegal logging and other activities that threaten it. However, it is worth noting that Image of the Week #8: New Deforestation Detected Within Sierra del Divisor (Peru) in June corresponds with an area of overlap with the Isconahua Territorial Reserve, a sector in which the Ministry of Culture works in coordination with SERNANP.

As part of our actions, SERNANP has planned a flyover in the zone to verify information regarding the new deforestation alert in the Sierra del Divisor, and will continue with special park guard patrolling that began last week, despite the local climate conditions.”

+++

“La Zona Reservada Sierra del Divisor es un espacio de carácter transitorio a cargo del Servicio Nacional de Áreas Naturales Protegidas por el Estado (SERNANP).

En los últimos años la ZRSD ha realizado grandes esfuerzos en su lucha contra la tala ilegal y otras actividades que la amenazan. Sin embargo, hay que precisar que la Imagen de la Semana #8: Nueva Deforestación al Interior de la ZRSD corresponde al ámbito de traslape (superposición) con la Reserva Territorial Isconahua, donde también interviene el Ministerio de Cultura, la cual el SERNANP trabaja de manera conjunta con dicho sector.

En el marco de nuestras acciones, el SERNANP viene programando un sobrevuelo en la zona para verificar la información sobre la nueva alerta de deforestación en la ZRSD, y continuar con el patrullaje especial del personal guardaparque que viene realizando desde la semana pasada, pese a las condiciones climáticas del lugar”.

Cita

Finer M, Novoa S, Peña N (2015) Nueva Deforestación al Interior de la Zona Reservada Sierra del Divisor. MAAP: Imagen #8. Link: https://www.maapprogram.org/2015/06/imagen-8-sierradivisor

Mining News Watch #16

Mining News Watch #16 covers the time period March 17- June 10, 2015

Top Stories

  • The Peruvian government announced in May that new complementary regulations for the formalization process will be released in August.

  • To date, only 16 permits have been issued for formalized mining, affecting just 631 of the 58,835 miners that started the process in Puno.

  • According to a pair of technical reports by the Amazon Conservation Association (ACA) and Conservaciόn Amazόnica (ACCA), 2,500 hectares has been deforested in the Tambopata National Reserve buffer zone due to illegal mining in the past two years.

  • The Ministry of the Environment (MINAM) reported that 40.5 tons of mercury enter the rivers of Madre de Dios annually.

  • The Foreign Relations Committee of the Peruvian Congress approved the Minamata Convention, and sent it to the full Peruvian Congress for final approval.

Recent Government Action

  • During a press conference in May, the Minister of Energy and Mines (MEM), Rosa María Ortiz, said that current regulations are not solving the illegal mining problem, and that in two months new complementary rules will be published to strengthen the formalization process. She stated that one focus of the new regulations will be to “achieve formalization for those that have not been able to do so.”[1]
  • The Regional President of Madre de Dios, Luis Otsuka, met with the Minister of the Interior, José Luis Pérez Guadalupe, in April to discuss possible actions to combat crime in Madre de Dios. The government is attempting to reduce illegal activity in Madre de Dios by increasing police patrols in critical zones and increasing containment of fuel used for illegal mining.[2] Guadalupe stated that the eradication of illegal mining is a priority for the national government. Along with the General Director of Police, Guadalupe visited the region to analyze the checkpoints and infrastructure designed to combat illegal mining in the area.[3]
  • The Peruvian government has invested over $63.5 million to be used for remediation projects in various areas damaged by illegal mining. Some of this money will focus on Madre de Dios, including the buffer zone of the Tambopata National Reserve.[4]

Formalization Process

  • The Office of the Ombudsman (La Defensoría del Pueblo) revealed that the Peruvian government has thus far only issued 16 permits for formalized mining, affecting about 631 miners, contrasting with the 58,835 informal miners that started the formalization process in Puno. The difficult and expensive “saneamiento” (restructuring) process, which involves the legal ordering of informal mines, coupled with the lack of human and financial resources, are some of the cited reasons for the slow formalization process.[5]
  • A new response to the low completion rates is the use of mediators to create a space of dialogue for the miners.[6]
  • During a recent visit by Madre de Dios Regional President Luis Otsuka with Peruvian President Ollanta Humala in March, Otsuka criticized the President for the illegal mining situation in the country. Otsuka stated that he “will continue to sell [his] gold on the black market” and that “in the past three years not one miner was formalized [in Madre de Dios], only six deaths. Things will not change if the laws are not modified.” Otsuka also expressed his frustration that current regulations seem to target small miners who only want to progress in the formalization process.[7]
  • Environmental specialist Juan Víctor Ortega Vargas found that in Puno, the only department in Peru with any formalized mining companies, the high cost of performing the Corrective Environmental Management Instrument (IGAC) is the main limitation for illegal miners attempting to complete the process. The IGAC is the fifth (out of six) step of the formalization process and is basically a streamlined Environmental Impact Assessment designed to prevent and control environmental impacts. However, performing the IGAC costs each company approximately $10,000.[8,9]

Deforestation

  • A pair of technical reports published by the ACA and ACCA revealed that a total of 2,500 hectares have been deforested due to gold mining in the Tambopata National Reserve buffer zone over the past two years.[10, 11, 12]

Mercury Regulation

  • The Vice Minister of MINAM, Mariano Castro, released a statement in March saying that as a result of illegal mining, a total of 40.5 tons of mercury enters the rivers of Madre de Dios each year. This quantity comprises 5.6% of global mercury emissions, which reached 721 tons in 2010. Castro also announced that MINAM will be working with the U.S. embassy and the Blacksmith Institute to reach an agreement on financing further studies about reductions in mercury emission.[13] The U.S. State Department gave the Blacksmith Institute one million dollars to conduct mercury emission reduction research in Madre de Dios.[14]
  • In May, the Foreign Relations Committee of the Peruvian Congress approved the Minamata Convention, a global treaty that seeks to avoid further damage to human health and the environment from mercury. This is a strong sign that Congress will ratify the convention.[15] The Office of the Ombudsman submitted a formal request to Congress on June 4th asking them to formally approve Minamata.[16]

  • A regional workshop on reducing mercury use took place in Lima at the end of March. The workshop was intended to encourage more countries to ratify the Minamata Convention. Government officials specializing in the fight against illegal mining from Peru, Colombia, Brazil, and Ecuador participated in the workshop, sharing experiences and successful practices.[17]
  • In March, Luis Fernández, a tropical ecologist from Stanford, interviewed with El Comercio in order to raise support for the Minamata Convention. He discussed the results from his 2013 research on mercury pollution in the Amazon, and warned that 250,000 Peruvians are currently exposed to mercury contamination.[18]
  • Police agents seized more than 15 kg of mercury that was being transported illegally near a mining zone in the Inambari district of Madre de Dios.[19]

Other

  • The Third Civil Chamber of the Superior Court of Lima sided with the Agency for Environmental Assessment and Enforcement (OEFA), saying that OEFA regulations are constitutional and do not infringe on any rights to miners and mining companies. This ruling gives OEFA power to combat illegal mining and to determine responsibility for environmental damage.[20]
  • Currently, around 100 kg of illegal gold travel across the border from Peru to Bolivia every week, where the gold can then be sold to U.S. and European markets.[21] Peru and Bolivia met in May to discuss tactics for protecting their shared border from criminal activity related to illegal mining, particularly the smuggling of fuel across the border. Peru promised to share its experience with Bolivia, which initiated its mining laws only a year ago.[22]
  • The Peruvian Society for Environmental Law (SPDA) and the International Union for Conservation of Nature (IUCN) launched a blog called “Las rutas del oro” (Routes of Gold) that will provide information on various aspects of illegal mining in different Amazonian countries.[23]
  • According to the Peruvian Financial Intelligence Unit (UIF), between January and December 2014, illegal mining generated $2,765 million, surpassing illegal drug trafficking, which generated $78 million.[24] The Office for National Electoral Processes reports that money from both mining and drug trafficking is making its way into the electoral campaigns of political organizations.[25]
  • The indigenous community of Tres Islas, located in Madre de Dios, demanded that the government fulfill a sentence forbidding outsiders to be within their designated indigenous land. The goal is to protect indigenous land from illegal gold mining. The claim is directed to the Constitutional Court, which unanimously declared in 2012 that the tribes have the right to control their lands.[26]

Notes: The ACA Mining News Watch focuses mostly on issues pertaining to the Peruvian Amazon and may not cover issues related to non-Amazonian parts of the country. We would like to credit ProNaturaleza’s “Observatorio Amazonia” as our primary resource for articles related to illegal mining in Peru.


ACA contact for Comments/Questions:  Matt Finer (mfiner@amazonconservation.org)

Citation:

DeRycke E, Finer M (2015). Peru Mining News Watch Report #16. Amazon Conservation Association. https://www.maapprogram.org/2015/06/mining-news-watch-16/

Image #4: Large-Scale Oil Palm Causes Deforestation of Primary Forest in the Peruvian Amazon (Part 1: Nueva Requena)

Image of the Week #4 shows the expansion of two large-scale oil palm projects near the town of Nueva Requena in the central Peruvian Amazon (Department of Ucayali). These projects began in late 2011 and, as of April 2015, now cover nearly 12,200 hectares (ha). Our analysis reveals that, of this total area, 9,400 ha came at the expense of primary forest and 2,350 ha from secondary forest.

NR_MAAP_4d_v5
Image of the Week 4a. Two large-scale oil palm projects near Nueva Requena in the central Peruvian Amazon (Department of Ucayali) began in late 2011 and now cover nearly 12,200 ha. Key data sources: USGS.

Map Description

Background map is a Landsat 8 satellite image (30 meter resolution) from August 2014. Dark green indicates forest cover. Light green indicates younger or secondary vegetation. Blue indicates water bodies. Data is from USGS.

The dashed black lines indicate the outline of the two large-scale oil palm projects, one of which is known to be “Plantaciones de Ucayali”, as of April 2015.

The colors indicate how the deforestation and plantation installation unfolded over time for the two projects according to our analysis of Landsat imagery.

Between October 2011 and August 2012, large scale-clearing and installation (indicated in yellow) started in the northern project.

Between September 2012 and August 2013, large-scale clearing and installation (indicated in orange) continued in the northern project and began in the southern project.

Between September and November 2013, clearing and installation (indicated in red) continued in the southern portion of both projects.

Most recently, between December 2013 and April 2015, clearing and installation (indicated in purple) continued in the southern portion of the northern project.

As of April 2015, the two projects cover an area of 12,188 ha.

Landsat Time-series 2010 – 2015

NR_MAAP_4g_v2
Image 4b. Landsat time-series (2010 – 2015) for both large-scale oil palm projects near Nueva Requena. Key data sources: USGS.

Image 4b is a series of Landsat images showing the change over time for both oil palm projects. In these images, dark green indicates forest cover, light green indicates secondary vegetation and oil palm plantations, pink indicates exposed ground (and is therefore a key indicator of recent deforestation), and the scattered white and black spots indicate clouds and their shade.

The first image, Landsat 5 from August 2010, shows the eventual project area (indicated by dashed black lines) immediately prior to the start of the project in 2011.

The second image, Landsat 7 from July 2012, shows the start of large-scale clearing in the northern portion of the project area.

The third image, Landsat 8 from September 2013, shows the clearing quickly expanded in both projects. It also shows the start of the oil palm plantation planting in the northern project (indicated by bright green).

The fourth image, Landsat 8 from April 2015, is the latest cloud-free image for the project area. It shows the continued expansion of the northern project and the extensive oil palm plantation plantings in both projects.

Landsat Time-series 1990 – 2015

NR_MAAP_4e_v5
Image 4c. Landsat time-series (1990 – 2015) for both large-scale oil palm projects near Nueva Requena. Key data sources: USGS.

We conducted another Landsat time-series analysis, but going back further in time (to 1990) in order to better understand the state of the forests cleared for the oil palm project. For each image, we determined whether an area was primary forest, secondary forest, deforested, or oil palm. Image 4c illustrates the results of this analysis.

It is important to note that in 2010, just prior to the large scale clearing, the two project areas were mostly a mix of primary and secondary forest.


Deforestation of Primary Forest

NR_MAAP_4f_v4
Image 4d. Classification of land use prior to oil palm activities. Key data sources: USGS.

Finally, we used the results from the Landsat time-series analysis to conduct a classification of land use prior to oil palm activities.

We determined that, of the 12,188 ha of the two oil palm projects, 9,404 ha (77%) was primary forest immediately prior to project installation. That is the equivalent to nearly 7,000 soccer fields. An additional 2,350 ha (19 %) was secondary forest. Only 434 ha (4 %) was already deforested at the start of the project.

We defined primary forest as an area that from the earliest available Landsat, in this case 1990, was characterized by dense closed canopy forest cover.


This work builds off of the following publication: Environmental Investigation Agency. Deforestation by Definition. 2015. Washington, DC. http://eia-global.org/news-media/deforestation-by-definition

Citation

Finer M, Novoa S (2015) Large-Scale Oil Palm Causes Deforestation of Primary Forest in the Peruvian Amazon (Part 1: Nueva Requena). MAAP: Image #4. Link: https://www.maapprogram.org/2015/04/image-4-oil-palm-projects-cause-deforestation-of-primary-forest-in-the-peruvian-amazon-part-1-nueva-requena/

Image #3: Detection of New (Logging?) Roads in the Peruvian Amazon

Image of the Week #3 shows the rapid proliferation of two new road networks in the northern Peruvian Amazon (Department of Loreto). Most notably, it highlights the construction of nearly 150 km of new roads, possibly illegal logging roads, through mostly primary forest between 2013 and 2014. One of the roads is within the buffer zone of the Cordillera Azul National Park.

TierraBlanca_MAAP_3a_v4
Image of the Week 3. Detection of new road construction in the northern Peruvian Amazon (Department of Loreto) Key data sources: MINAM, Hansen/UMD/Google/USGS/NASA, USGS, SERNANP, Grupo Palmas, GOREL.

Map Description

Background map is a Landsat 8 image (30 m resolution) from September 7, 2014. Green indicates forest cover. Our analysis has demonstrated that much of this forest cover is primary forestData is from USGS.

Black indicates areas that were deforested as of 2000 according to data from the Peruvian Environment Ministry. Yellow, orange, and red indicate areas that were deforested from 2000 to 2012 (each color covers a four year period) (Hansen MC et al. 2013 Science 342: 850–53; Data download).

Purple indicates areas that were deforested between 2013 and 2014 based on our analysis of Landsat imagery using CLASlite forest monitoring software. Note the two new road networks, labeled North and South, respectively, to the west of the Ucayali River.

Black dashed lines indicate planned oil palm plantations. We obtained this data from Environmental Impact Studies and the Regional Government of Loreto (GOREL).

Protected areas data is from SERNANP. Note the different shades of green to differentiate the protected area and its respective buffer zone.

TierraBlanca_MAAP_3b_v3
Image 3b. Road construction time-series. Key data sources: USGS, SERNANP, Grupo Palmas.

Construction of New Roads

We color coded the segments of road by construction period: Grey indicates  road segments constructed between 2009 and 2012. Teal indicates road  segments constructed between January 2013 and July 2014 (117.3 km). Dark-orange   indicates road segments constructed between July and September 2014 (25.9  km). Pink indicates road segments constructed between September and October  2014 (4.8 km).

In sum, 148 km of new roads was constructed in this area between January 2013 and  October 2014 (76.24 km in south and 77.38 km in the north).

The southern network is characteristic of a logging road in that it does not have a clear destination and instead just keeps extending and branching deeper into closed-canopy forest.

The northern network is more puzzling in that it crosses a proposed palm oil concession (Grupo Romero’s Tierra Blanca project) and terminates at the Alfaro River. Also note several areas of recent deforestation near the road in the northwest corner of the oil palm concession.


TierraBlanca_MAAP_3c_v3
Image 3c. High resolution SPOT 6 images (1.5 m resolution) of portions of the northern and southern road networks. Key data sources: USGS, SPOT 6.

High-resolution zooms

Panel A is a high resolution SPOT 6 image (1.5 m resolution) from August 2014 of a portion of the northern road network.

Panel B is a high resolution SPOT 6 image (1.5 m resolution) from October 2014 of a portion of the southern road network.


Citation

Finer M, Novoa S (2015) Detection of New (Logging?) Roads in the Peruvian Amazon. MAAP: Image #3. Link: https://www.maapprogram.org/2015/04/detection-of-new-road-construction-in-southern-loreto-peru/

Mining News Watch #15

Report #15 // January 28, 2015 – March 17, 2015

Top Stories

  • Antonio Fernández Jeri has been appointed as the new High Commissioner of Mining Formalization and the Interdiction of Illegal Mining.

  • The Amazon Conservation Association issued a new map showing that gold mining-driven deforestation grew by 226.5 hectares between October 2014 and February 2015 in the buffer zone of the Tambopata National Reserve.

  • A new report found that miners from Ecuador are using a series of underground tunnels to smuggle illegal gold from the Amazonas department of Peru.

Deforestation

  • A new analysis conducted by the Amazon Conservation Association (ACA) found that, despite government efforts to crack down on illegal gold mining, mining-driven deforestation in the buffer zone of the Tambopata National Reserve in Madre de Dios grew by 226.5 hectares between October 2014 and February 2015.[1] This deforestation is the equivalent of 310 soccer fields in just four months.

Formalization Process

  • The Presidency of the Council of Ministers (PCM) appointed Antonio Fernández Jeri as the new High Commissioner of Mining Formalization and the Interdiction of Illegal Mining. Fernández is the third person to hold this title, following Augusto Soto Castagnola and Daniel Urresti. He is now responsible for coordinating and overseeing the implementation of the national strategy to combat illegal mining.[2]
  • More than 2,000 informal miners met in Arequipa to demand a more efficient formalization strategy, under the leadership of economist Hernando de Soto of the Institute for Liberty and Democracy (ILD), a think-tank that focuses on helping developing countries modernize their economies. The new “true formalization” process will supposedly be more supportive of miners enrolled in the process and will include a plan to protect and remediate the environment. In contrast to the present formalization process, the plan will also contain different procedures for miners depending on region (coast, mountains, or rainforest). The proposal is set to be completed in 45 days and then sent to the Executive for approval.[3,4]
  • The regional president of Madre de Dios, Luis Otsuka, met with Peruvian President Ollanta Humala to address the issue of mining formalization. Prior to the meeting, the general manager of the regional government of Madre de Dios declared the process a “failure” in need of “integral revision.”[5] Otsuka reported that the first meeting with Humala yielded positive results in that the two leaders definitively agreed that the formalization process must be amended in order for “real” formalization to occur.[6] More concrete changes will likely develop out of further meetings, during which Otsuka hinted that the two will discuss amending Supreme Decree 016-2014, a controversial law regulating fuel supply, which Otsuka says negatively affects the region’s economy.[7]
  • To date, only eight mining companies have successfully completed the formalization process in Peru, all in the department of Puno. Around 70,000 miners initially registered for formalization.[8] Still, no informal miners have been formalized in Madre de Dios.
  • The Public Defender (Defensoría del Pueblo) analyzed the efficacy of the government’s strategies to eliminate illegal mining, including formalization and remediation of the environment. It found that the most significant difficulties were minimal budget dedicated to formalization, lack of qualified leaders and personnel, inadequate planning, and insufficient supervision.[9]

Illegal Gold Smuggling

  • A report aired on Peruvian news program Panorama showing that illegal miners from Ecuador are extracting gold from Peruvian territory in the Amazonas department through a series of 150 underground tunnels which are up to two kilometers long. The tunnels are used both to extract gold and to transport it illegally, and are used by both Peruvian and Ecuadorian miners.[10] The government plans to intervene in the area through raids on illegal mining operations and inspections of key checkpoints in the area.[11,12]
  • The President of the Central Reserve Bank of Peru denounced Bolivia for exporting US$1 billion more in gold in 2014 than the country has the capacity to produce. Analysts suspect that the gold was sourced illegally from Peru and then smuggled over the border due to inadequate customs control.[13]

Mercury Regulation

  • A new peer-reviewed study by the Royal Society of Chemistry found that mercury pollution from illegal mining sites moves rapidly downstream and can impact communities as least 560 kilometers (350 miles) away. According to the study, communities along the Madre de Dios River and its tributaries are at risk and should avoid regular consumption of carnivorous fish.[14,15]
  • The Alliance for Responsible Mining (ARM) has developed a new “fairmined” mining standard in an effort to promote sustainable mining. Currently, the AURELSA mine in Madre de Dios is one of the only companies in Peru to achieve the fairmined standard. To get the fairmined certification, a mining company must reduce their mercury emissions by 60 to 90 percent, ensure that chemical waste is disposed of safely, and guarantee worker’s rights. Buyers of fairmined gold pay a premium of ten percent which is then reinvested in the company and the interests of the local community.[16]

Other

  • Inspectors from the National Customs and Tax Administration (Sunat) seized 2,507 gallons of diesel fuel that was being transported along the Inambari River in Madre de Dios without the required documentation, destined for illegal mining operations.[17] A second seizure occurred a few weeks later, coordinated by the regional police and Sunat, during which 1,800 gallons of fuel were confiscated along the Madre de Dios River.[18] Sunat says it has increased its operational actions along the rivers and tributaries in the region.
  • The Magistrate Control Office (OCMA) found that the chief judge and president of the Court of Madre de Dios, John Russel Hurtado Centeno, was running an illegal mining camp called “Guadalupe” while simultaneously serving in the court system. He has been suspended indefinitely from his position while investigations continue.[19]
  • The Peruvian government found that gold production in the country fell by 6.7% in 2014 relative to 2013, yet Peru is still the sixth largest gold producer globally. The decrease is likely due to lower production in the largest mine in the country, Yanacocha.[20] Additionally, it is estimated that gold production in Madre de Dios will fall by 20% in 2015, largely due to the government’s offensive on illegal mining in the region.[21]

Notes: The ACA Mining News Watch focuses mostly on issues pertaining to the Peruvian Amazon and may not cover issues related to non-Amazonian parts of the country. We would like to credit ProNaturaleza’s “Observatorio Amazonia” as our primary resource for articles related to illegal mining in Peru.

Featured image credit: Gobierno Regional de Madre de Dios GOREMAD

Download the complete report in PDF