MAAP #199: Amazon Carbon Update, based on NASA’s GEDI Mission

As we approach the COP28 climate summit, starting in Dubai in late November, we provide here a concise update on the current state of remaining Amazon carbon reserves.

We present the newly updated version of NASA’s GEDI data1, which uses lasers aboard the International Space Station to provide cutting-edge estimates of aboveground biomass density on a global scale.

Here, we zoom in on the Amazon and take a first look at the newly updated data, which covers the time period of April 2019 – March 2023.2

This data, which is measured in megagrams of aboveground biomass per hectare (Mg/ha) at a 1-kilometer resolution, serves as our estimate for aboveground carbon reserves.

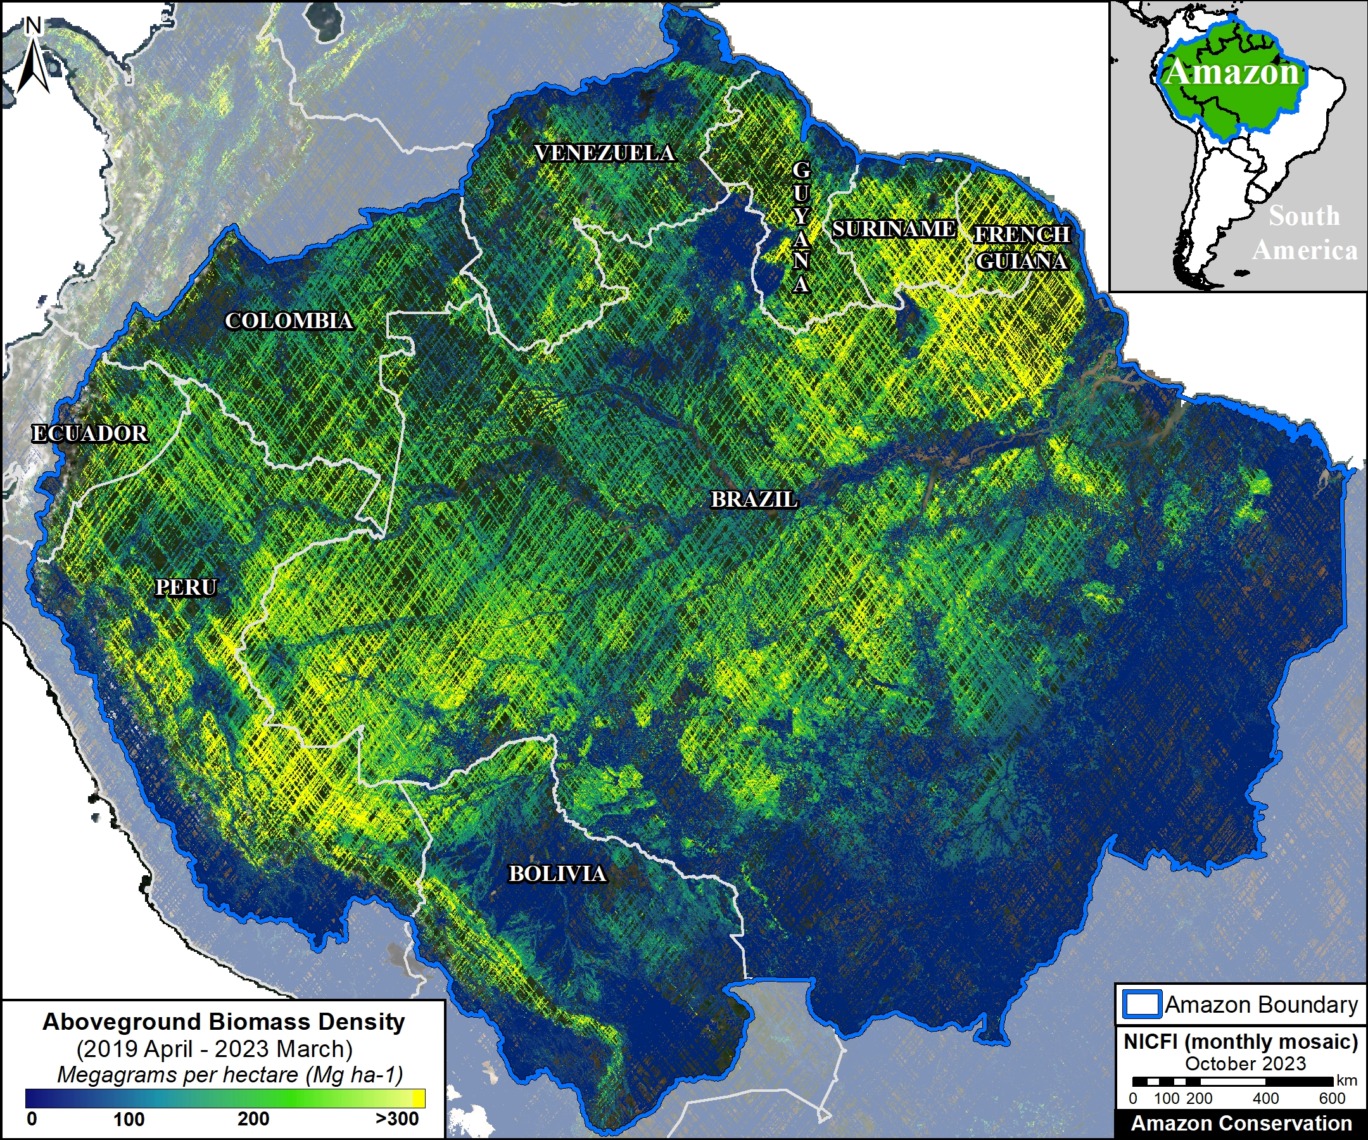
Figure 1 displays aboveground biomass across the Amazon biome. Note the highest carbon densities (indicated in bright yellow) are located in both the northeast Amazon and southwest Amazon.

Aboveground Biomass across the Amazon

Figure 2 also displays aboveground biomass across the Amazon biome, but this time with country boundaries and labels added.

Note that the peak biomass concentrations in the northeast Amazon include Suriname, French Guiana, and the northeast corner of Brazil. The peak biomass concentrations in the southwest Amazon are centered in southern Peru. Also note that many parts of Ecuador, Colombia, Venezuela, Guyana, Bolivia, Brazil, and northern Peru have high carbon densities as well.

Figure 2. Aboveground biomass density (carbon estimate) across the Amazon biome, with country boundaries. Data: NASA/GEDI, NICFI.

Carbon Estimates

We calculated over 78 billion metric tons of aboveground biomass across the Amazon biome (78,184,161,090 metric tons to be exact). Using a general assumption that 48% of this biomass is carbon3, we estimate over 37 billion metric tons of carbon across the Amazon (37,528,397,323 metric tons).

Note that these totals are likely underestimates given that the laser-based data has not yet achieved full coverage across the Amazon (that is, there are many areas where the lasers have not yet recorded data, leaving visible blanks in the maps above).

This is consistent with a previous study based on another independent dataset, where we estimated 6.7 billion metric tons of carbon in the Peruvian Amazon as of 2013 (MAAP #148). The current GEDI data estimates at least 5.3 billion metric tons in the Peruvian Amazon.

Carbon Sink

In a previous report, we showed that the Brazilian Amazon has become a net carbon source, whereas the total Amazon is still a net carbon sink (MAAP #144). Our current report goes one step further in terms of showing just how much carbon is left in that sink.

Notes

1GEDI L4B Gridded Aboveground Biomass Density, Version 2.1. https://daac.ornl.gov/cgi-bin/dsviewer.pl?ds_id=2299

2Note that we previously reported on the initial data release, which covered the time period of April 2019 – August 2021 (see MAAP #160).

3Domke et al (2022) How Much Carbon is in Tree Biomass?. USDA/Forest Service.

Acknowledgements

This work was supported by NORAD (Norwegian Agency for Development Cooperation) and ICFC (International Conservation Fund of Canada).

Citation

Mamani N, Finer M, Ariñez A (2022) Amazon Carbon Update, based on NASA’s GEDI Mission. MAAP: 199.

MAAP #197: Illegal Gold Mining Across the Amazon

Example of major gold mining zone in the Peruvian Amazon. Data: Planet.

Illegal Gold Mining continues to be one of the major issues facing nearly all Amazonian countries.

In fact, following the recent high-level summit of the Amazon Cooperation Treaty Organization, the nations’ leaders signed the Belém Declaration, which contains a commitment to prevent and combat illegal mining, including strengthened regional and international cooperation (Objective 32).

Illegal gold mining is a major threat to the Amazon because it impacts both primary forests and rivers, often in remote and critical areas such as protected areas & indigenous territories.

That is, illegal gold mining is both a major deforestation driver and a source of water contamination (especially mercury) across the Amazon.

Previously, in MAAP #178, we presented a large-scale overview of the major gold mining deforestation hotspots across the entire Amazon biome. We found that gold mining is actively causing deforestation in nearly all nine countries of the Amazon.

Here, we update this analysis with two important additions. First, we add to the overview major gold mining operations taking place in rivers, in addition to those causing deforestation (see Figure 1).

Second, we present a new map of likely illegal gold mining sites, based on information from partners and location with protected areas and indigenous territories (see Figure 2).

Finally, we show a series of high-resolution satellite images of key examples of illegal Amazon gold mining.

Updated Amazon Gold Mining Map

Figure 1 is our updated Amazon gold mining map.

The orange dots indicate areas where gold mining is currently causing deforestation of primary forests. The blue dots indicate areas where gold mining is occurring in rivers. Combined, we documented 58 active forest and river-based mining sites across the Amazon.

The dots outlined in red indicate the mining sites that are likely illegal, for both forest and river-based mining. We found at least 49 cases of illegal mining across the Amazon, the vast majority of the active mining sites noted above.

Note the concentrations of illegal mining causing deforestation in southern Peru, across eastern Brazil, and across Ecuador. Similarly, note the concentrations of illegal mining in rivers in northern Peru and adjacent Colombia and Brazil.

Figure 1. Updated Amazon gold mining map. Data: ACA/MAAP. Click to enlarge.

Protected Areas & Indigenous Territories

Figure 2 adds protected areas and indigenous territories. We found at least 36 conflictive overlaps: 16 in protected areas and 20 in indigenous territories. We also found an additional two conflicts with Brazilian National Forests.

We highlight a number of high-conflict zones. For protected areas: Podocarpus National Park in Ecuador; Madidi National Park in Bolivia; Canaima, Caura, and Yapacana National Parks in Venezuela. We note that the Peruvian government has been effectively minimizing invasions in protected areas in the southern region of Madre de Dios (Tambopata National Reserve and Amarakaeri Communal Reserve).

For indigenous territories: Kayapo, Menkragnoti, Yanomami, and Mundurucu in Brazil; Pueblo Shuar Arutam in Ecuador, and a number of communities in southern Peru.

Figure 2. Amazon gold mining map., with protected areas and indigenous territories. Data: ACA/MAAP, RAISG. Click to enlarge.

Methods

The forest-based mining sites displayed in Figure 1 are largely based on information obtained over the last several years of our deforestation monitoring work. The river-based sites are largely based on information obtained from partners in country and on the ground.

We complemented this information with automated, machine-based data from Amazon Mining Watch, and data from RAISG.

For these sources, we checked recent imagery and only included sites that appeared to still be active.

Classification as an illegal mining site is largely based on location within protected areas or indigenous territories, or clearly
outside of an authorized mining zone

Citation

Finer M, Mamani N, Arinez A, Novoa S, Larrea-Alcázar D, Villa J (2023) Illegal Gold Mining Across the Amazon. MAAP: 197.