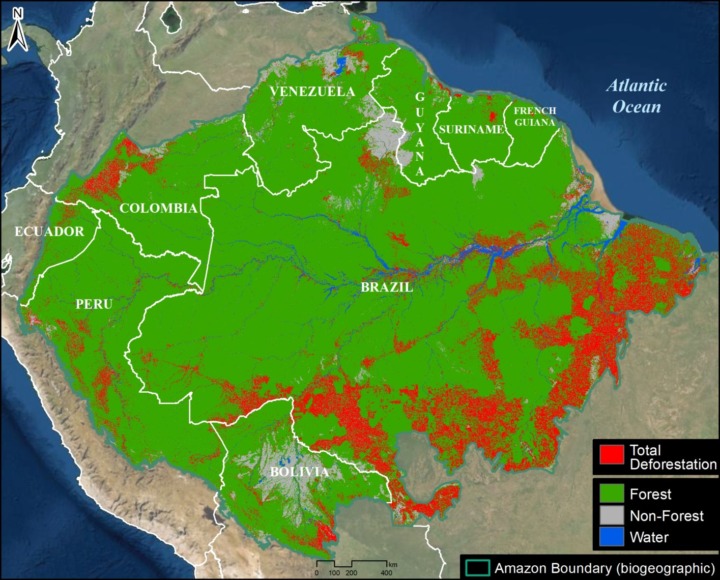
Base Map. Total Amazon forest loss. Data: ACA/MAAP.
It is increasingly reported that the largest rainforest in the world, the Amazon, is rapidly approaching a tipping point.
As repeatedly highlighted by the late Tom Lovejoy (see Acknowledgements), this tipping point is where parts of the rainforest will convert into drier ecosystems due to disrupted precipitation patterns and more intense dry seasons, both exacerbated by deforestation.
The Amazon generates much of its own rainfall by recycling water as air passes from its major source in the Atlantic Ocean. Thus, high deforestation in the eastern Amazon may lead to downwind impacts in the central and western Amazon (see Background section below).
The scientific literature indicates this tipping point could be triggered at 25% Amazon forest loss, in conjunction with climate change impacts.
The literature, however, is less clear on the critical first part of the tipping point equation: how much of the Amazon has already been lost?
There are numerous estimates, including 14% forest loss cited in the recent Science Panel for the Amazon report, but we did not find any actual definitive studies specifically addressing this question.
Here, we directly tackle this key question of how much of the original Amazon has been lost to date.
First, we present the first known rigorous estimate of original Amazon biome forest prior to European colonization: over 647 million hectares (1.6 billion acres; see Image 1 below).
Second, we estimate the accumulated total Amazon forest loss, from the original estimate to the present: over 85 million hectares (211 million acres; see Base Map).
Combining these two results, we estimate that 13% of the original Amazon biome forest has been lost.
More importantly, however, focusing on just the eastern third of the Amazon biome (see Image 2 below), we estimate that 31% of the original forest has been lost, above the speculated tipping point threshold. This finding is critical because the tipping point will likely be triggered in the eastern Amazon, as it is closest to the oceanic source of the water that then flows to the central and western Amazon.
Original Amazon Forest
Image 1 shows the first known estimate of original Amazon forest prior to European colonization. Note that we use a broader biogeographical definition of the Amazon that covers nine countries (Amazon biome) rather than the strict Amazon watershed (see Methodology).
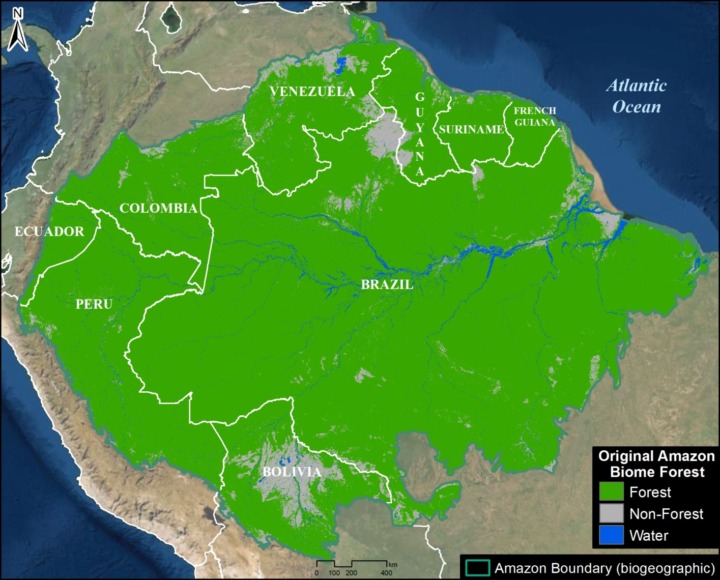
Image 1. Original Amazon biome forest. Data: ACA/MAAP.
This represents the most rigorous effort to date to recreate the original Amazon. For example, we attempted to recreate original forest lost to historic dam reservoirs.
The map has just three classes: Original Amazon forest, Original non-forest (such as natural savannah), and Water.
We found that the original Amazon forest covered over 647 million hectares (647,607,020 ha). This is equivalent to 1.6 billion acres.
Of this total, 61.4% occurred in Brazil, followed by Peru (12%), Colombia (7%), Venezuela (6%), and Bolivia (5%). The remaining four countries (Ecuador, Guyana, Suriname, and French Guiana) make up the final 8%.
Amazon Forest Loss
Image 2 shows the accumulated total Amazon forest loss, from the original estimate to the present (2022).
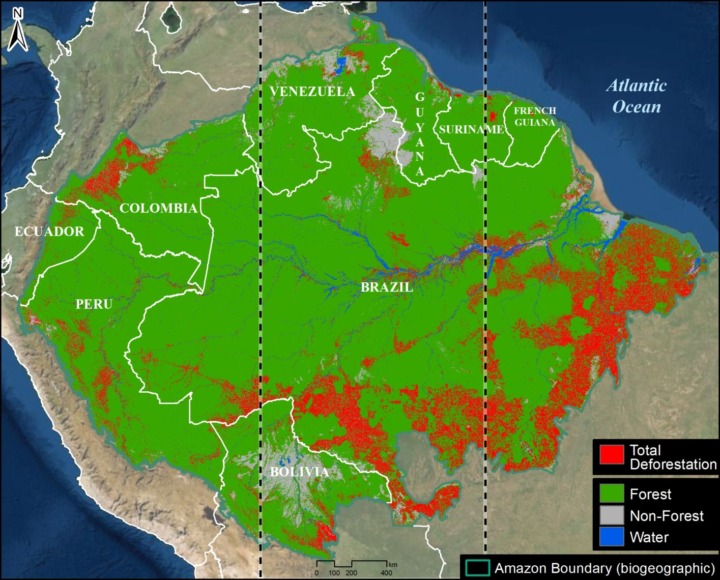
Image 2. Total Amazon forest loss. Vertical lines indicate the Amazon broken down into thirds. Data: ACA/MAAP.
Of the original forest noted above, we documented the historic loss of over 85 million hectares (85,499,157 ha). This is equivalent to 211 million acres.
The largest loss occurred in Brazil (69.5 million ha), followed by Peru (4.7 million ha), Colombia (4 million ha), Bolivia (3.8 million ha), and Venezuela (1.4 million ha). The remaining four countries (Ecuador, Guyana, Suriname, and French Guiana) make up the final 1.9 million ha.
By comparing the original Amazon biome, we calculated the historic loss of 13.2% of the original Amazon forest due to deforestation and other causes.
More importantly, however, we find that 30.8% of the original Amazon has been lost in the eastern third of the Amazon biome (see vertical dashed lines Image 2), above the speculated tipping point threshold. This finding is critical because as noted above, the tipping point will likely be triggered in the east as it is the source of the water flowing to the central and western Amazon.
In contrast, we find that 10.8% of the original Amazon has been lost in the central third of the Amazon biome and 6.3% has been lost in the western third, both of which are below the speculated tipping point threshold.
Background
The Amazon generates around half of its own rainfall by recycling moisture up to 6 times as air masses move from the Atlantic Ocean in the east across the basin to the west. Thus, the rainforest plays a major part in keeping itself alive, by recycling water through its trees to generate rainfall from east to west.
This unique hydrological cycle has historically supported rainforest ecosystems for vast areas far from the main ocean source.
But it also raises the question of how much deforestation would be required to cause the cycle to degrade to the point of being unable to support these forests, thus the Amazon tipping point hypothesis.
In this scenario, rainforests would transform into drier ecosystems, such as open canopy scrubland and savannah.
The tipping point concept originally referred to an abrupt ecosystem change, but it is now believed that the shift could happen gradually (30-50 years).
It is worth noting that the western Amazon near the Andes mountains would likely maintain its rainforests, as air currents flowing over the mountains would continue causing water vapor to condense and fall as rain.
Methodology
At the core of this work, we generated two major estimates: original Amazon forest and total historical Amazon forest loss.
For both of these estimates, we used the biogeographical boundary of the Amazon (as determined by RAISG 2020), which encompasses nine countries. Thus, we used a broader definition of the Amazon (Amazon biome) rather than the strict Amazon watershed, which omits part of the northeastern Amazon biome.
For original Amazon forest, we defined three major classes: Forest, Non-Forest, and Water. This analysis was based on data from MapBiomas Brazil (collection 2 from 1990) with some additional modifications. Original Forest was made up of these MapBiomas categories: Forest Formation, Mangrove, Flooded Forest, Mosaic of Agriculture and Pasture. Non-Forest was made up of these MapBiomas categories: Savanna Formation, Natural Non-Forest Flood Formation, Grassland, and Other non-Forest Formations. Water was made up of these MapBiomas categories: River, Lake, Ocean and Glacier.
We then made a number of modifications with manual edits based on data from the University of Maryland, INPE (Terrabrasilis), ArcGis satellite images, Planet mosaics, Google Earth Engine Landsat images from 1984-1990, and official government data for several countries (Ministry of the Environment of Ecuador (MAE) and Peru (GeoBosques/MINAM), Forest and Carbon Monitoring System/IDEAM of Colombia, National Institute for Space Research of Brazil (INPE/Terrabrasilis), General Directorate of Forest Management and Development of Bolivia (DGGDF), and the National Service of Protected Areas of Bolivia (SERNAP). As an example of a major modification, deforested areas and historic dam reservoirs were changed to Original Forest based on an analysis of the oldest available satellite image for the area (1984-1990). We also corrected some misclassifications, such as forest patches in clearly non-forest areas were changed to Non-Forest (and vice versa) and mountain forest areas found as water were changed to Forest. Also, agriculture and urban areas in likely savannah areas were changed to Non-Forest. Additional Water data from MapBiomas based on 1985 was incorporated. Overall, our focus was defining Original Forest as best as possible; data confusions between Non-Forest and Water categories were not worked on as thoroughly.
For total historical Amazon forest loss, we used data from the University of Maryland. Specifically, we first used their data layer ‘Tree Cover 2000″ (>30% canopy density) to estimate historical (pre-2000) forest loss. We then added annual forest loss data from 2001 to 2021.
Finally, we divided the original Amazon forest by the total historical loss to estimate how much of the original Amazon has been lost. In addition, we delimited the Amazon in thirds according to distance east to west at the widest point. We then estimated how much of the original Amazon has been lost in each of these three sections.
References
(in chronological order)
Sampaio, G., Nobre, C., Costa, M. H., Satyamurty, P., Soares‐Filho, B. S., & Cardoso, M. (2007). Regional climate change over eastern Amazonia caused by pasture and soybean cropland expansion. Geophysical Research Letters, 34(17).
Hansen, M. C. et. al. (2013) High-Resolution Global Maps of 21st-Century Forest Cover Change. Science 342.
Nobre et al. (2016) Land-use and climate change risks in the Amazon and the need of a novel sustainable development paradigm. PNAS, 113 (39).
Turubanova S., Potapov P., Tyukavina, A., and Hansen M. (2018) Ongoing primary forest loss in Brazil, Democratic Republic of the Congo, and Indonesia. Environmental Research Letters.
Lovejoy, T. E., & Nobre, C. (2018). Amazon Tipping Point. Science Advances, 4(2).
Lovejoy, T. E., & Nobre, C. (2019). Amazon tipping point: Last chance for action. Science Advances, 5 (12).
Bullock et. al. (2019) Satellite-based estimates reveal widespread forest degradation in the Amazon. Glob Change Biol., 26.
Amigo, I. (2020) The Amazon’s fragile future. Nature, 578.
MapBiomas. 2020. MapBiomas Amazonia v2.0. https://amazonia.mapbiomas.org/.
Killeen (2021) A Perfect Storm in the Amazon Wilderness
Berenguer E. et. al. (2021) Ch 19. Drivers and ecological impacts of deforestation and forest degradation. In: Nobre C, Encalada et al. (Eds). Amazon Assessment Report 2021. United Nations Sustainable Development Solutions Network, New York, USA. Available from https://www.theamazonwewant.org/spa-reports
Hirota M et. al (2021) Science Panel for the Amazon, Ch 24. Resilience of the Amazon Forest to Global Changes: Assessing the Risk of Tipping Points. In: Nobre C, Encalada et al. (Eds). Amazon Assessment Report 2021. United Nations Sustainable Development Solutions Network, New York, USA. Available from https://www.theamazonwewant.org/spa-reports/
Wunderling et al (2022) Recurrent droughts increase risk of cascading tipping events by outpacing adaptive capacities in the Amazon rainforest. PNAS 119 (32) e2120777119.
Acknowledgements
This report is in memory of Tom Lovejoy, who helped launch the critical concept of an Amazon tipping point. Starting in 2019, we collaborated with Tom on the need assessment and background research behind this report.
We thank Carmen Thorndike for helping with the initial literature review, and Carlos Nobre for review of the final report. We also thank J. Beavers (ACA), A. Folhadella (ACA), M.E. Gutierrez (ACCA), and C. Josse (EcoCiencia) for additional comments.
This work was supported by NORAD (Norwegian Agency for Development Cooperation) and ICFC (International Conservation Fund of Canada).

Citation
Finer M, Mamani N (2022) Amazon Tipping Point – Where Are We?. MAAP: 164.
