MAAP #228: Illegal Gold Mining in the Puré and Cotuhé Rivers in the Colombian Amazon

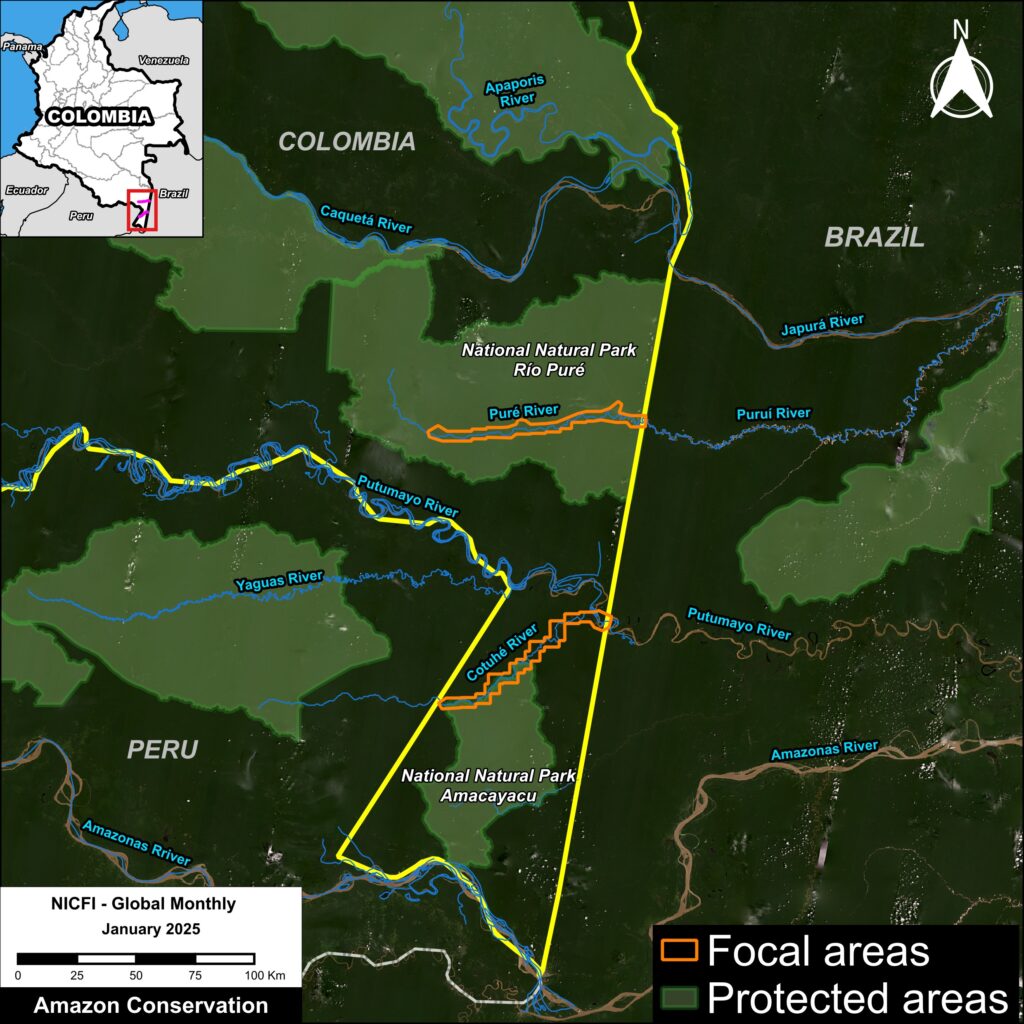
Base Map. Illegal gold mining in the Puré & Cotuhé Rivers, Colombian Amazon. Data: ACA/MAAP, FCDS, RAISG

Illegal gold mining poses a challenge to environmental sustainability, governance, and security for all nine countries of the Amazon. The high price of gold on the international market has fueled the growth of this activity, combined with other factors such as the scarcity of economic alternatives, the presence of illicit groups, corruption, and a lack of effective government action.

In the Amazon, illegal mining has generated massive deforestation (MAAP #226), contamination of water sources due to the use of mercury, and expansion of illicit economies, with gold becoming a key source of financing for organized armed groups (Note 1).

In a series of reports, MAAP has detailed and illustrated cases of illegal mining in many parts of the Amazon, including Peru, Ecuador, Brazil, and Venezuela. These reports include both forest-based mining causing deforestation, and river-based mining causing mercury contamination.

In this report, we focus on river-based mining in the northwestern Amazon, specifically the triple border region between Colombia, Brazil, and Peru (see Base Map).In this area, illegal mining activities impact several rivers that connect these countries: the Puré, Cotuhé, Caquetá, Amazonas, Apaporis, and Putumayo Rivers in Colombia; the Napo, Curaray, Putumayo, Yaguas, Nanay, and Mazán Rivers in Peru; and the Puruí and Japurá Rivers in Brazil.

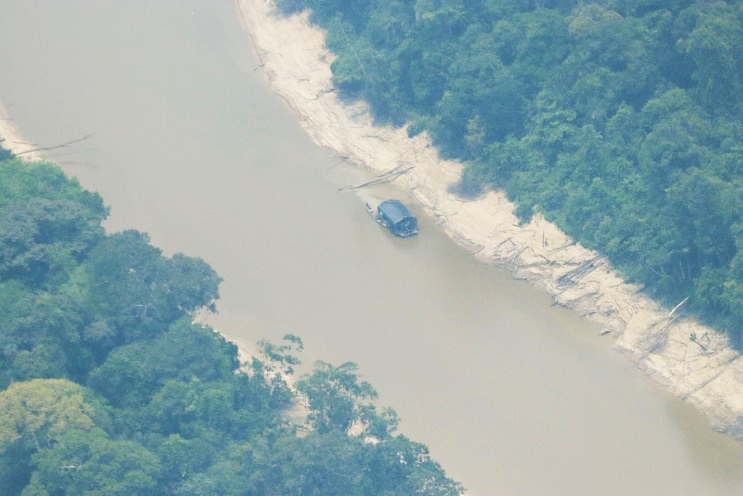
Although it doesn’t cause deforestation, this type of mining activity directly impacts not only the rivers but all ecosystems interconnected with them, due to the use of dredges and mercury. This mercury contamination spreads through the food chain, accumulating in species consumed by the local population, harming their health. This type of mining can extract up to three kilograms of gold per month, equivalent to approximately $275,000 per month (Notes 2-3).

Specifically, this report examines the current situation of the Puré and Cotuhé Rivers, in their southeastern reaches, located in the Colombian Amazon (see Base Map). These rivers are located in the department of Amazonas, along the borders of Brazil and Peru.

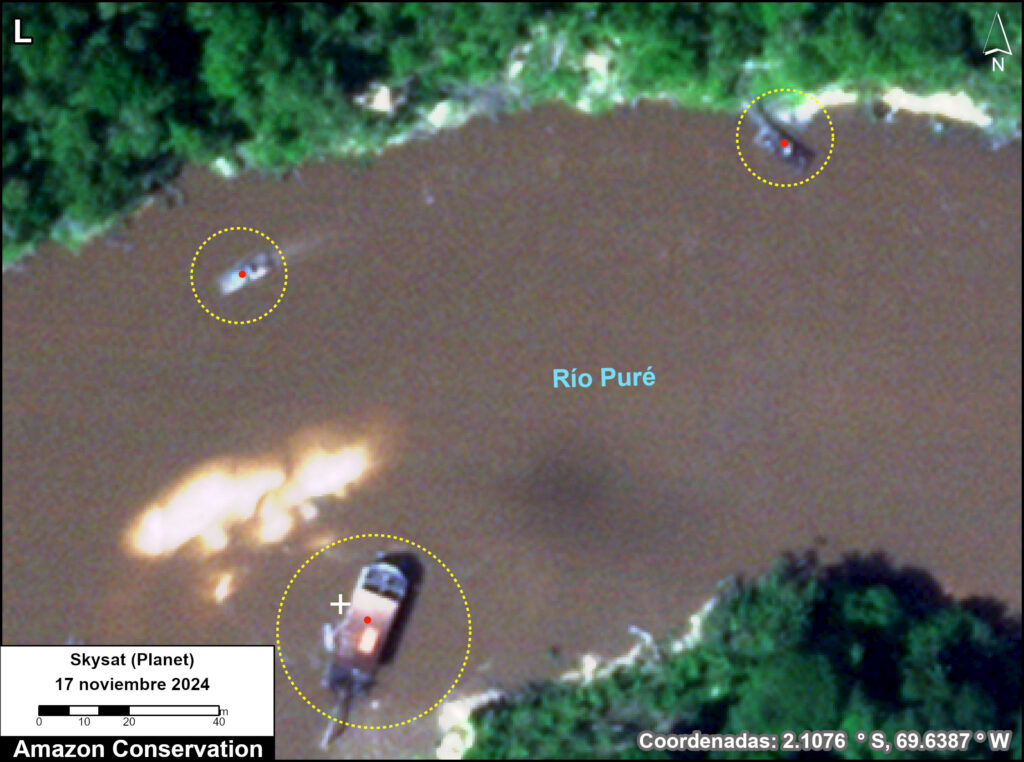
In both cases, we analyzed these river stretches using a combination of very high-resolution satellite images (0.5 meters, Planet/Skysat) and overflight photographs (courtesy of the Amazon Alliance for the Reduction of the Impacts of Gold Mining – AARIMO in Spanish).

This report was produced in collaboration with our Colombian partner, the Foundation for Conservation and Sustainable Development (FCDS), and with financial support from the Overbrook Foundation and Gordon and Betty Moore Foundation..

Detection of mining activity in the Puré River

The Puré River flows through the core of the Río Puré National Park in the southeastern Colombian Amazon (see Base Map).

This protected area, in addition to its extraordinary biodiversity and high carbon levels, also plays a role as a food source for Indigenous communities and is recognized as home to Indigenous peoples in voluntary isolation, including the Yurí–Passé, whose high vulnerability has been widely recognized internationally.

This protected area faces pressures and threats primarily associated with alluvial mining activities, which are increasingly occurring along the Puré River from the border with Brazil. The impacts of this activity include mercury contamination of water and fish, destruction of aquatic habitats and ecosystems, hunting, logging, and impacts on food security and the environment where communities in voluntary isolation live.

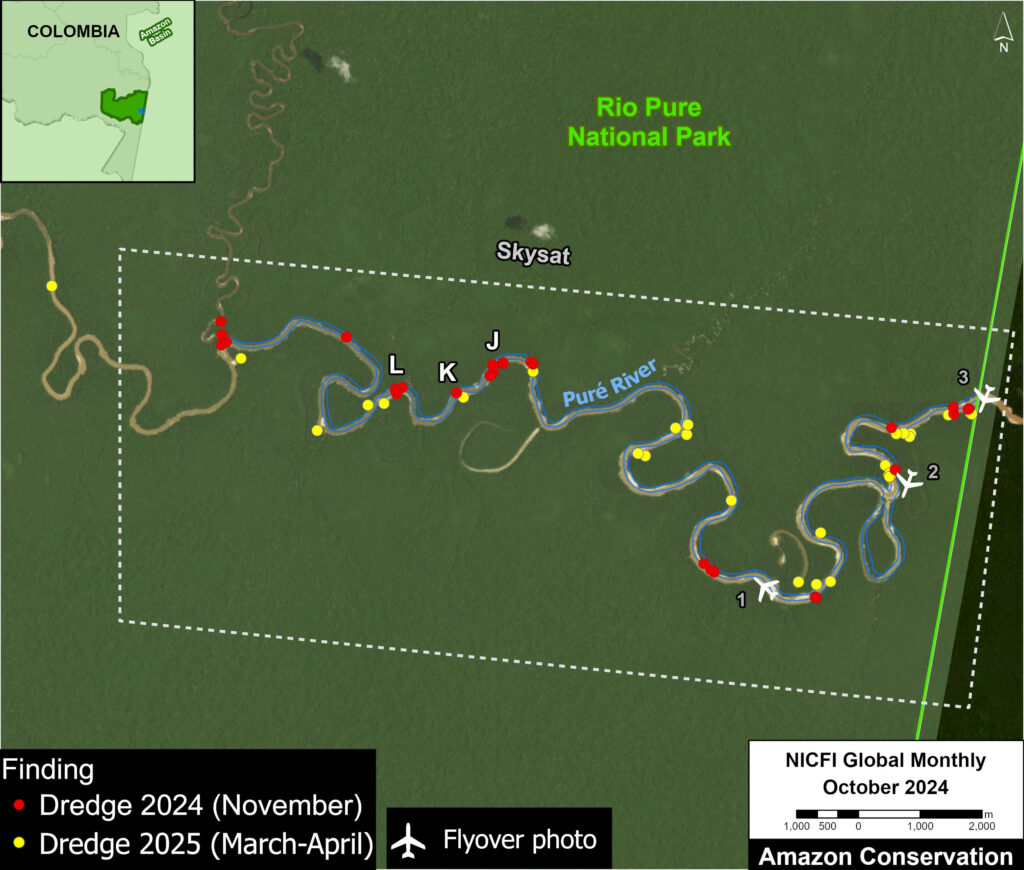
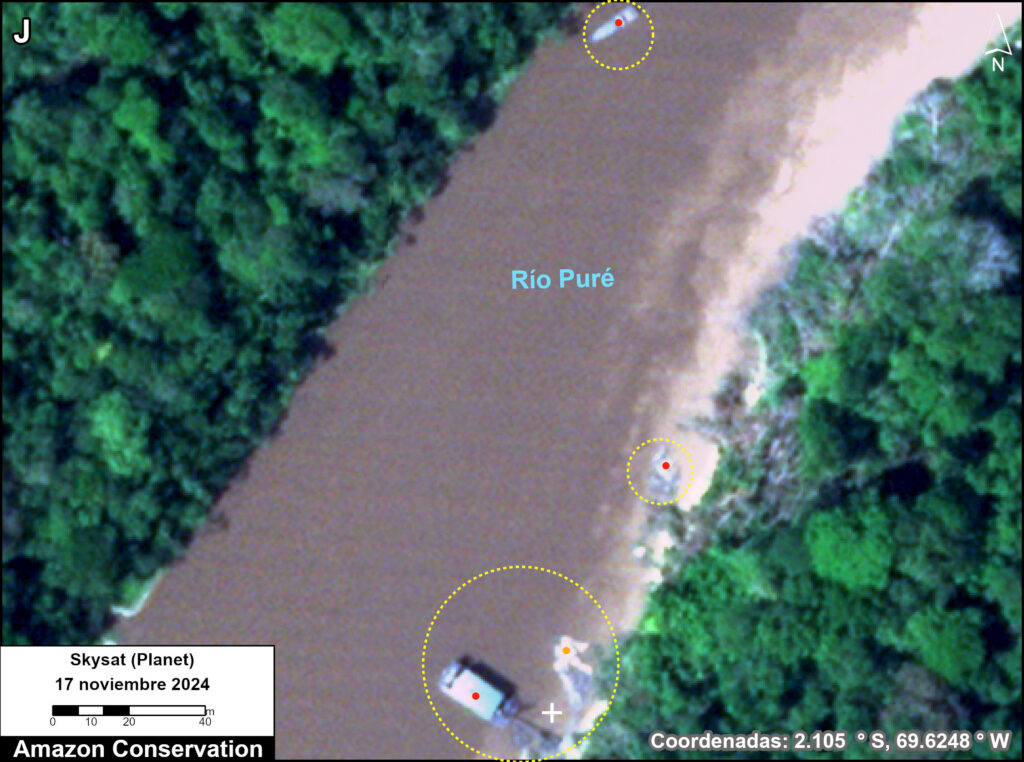
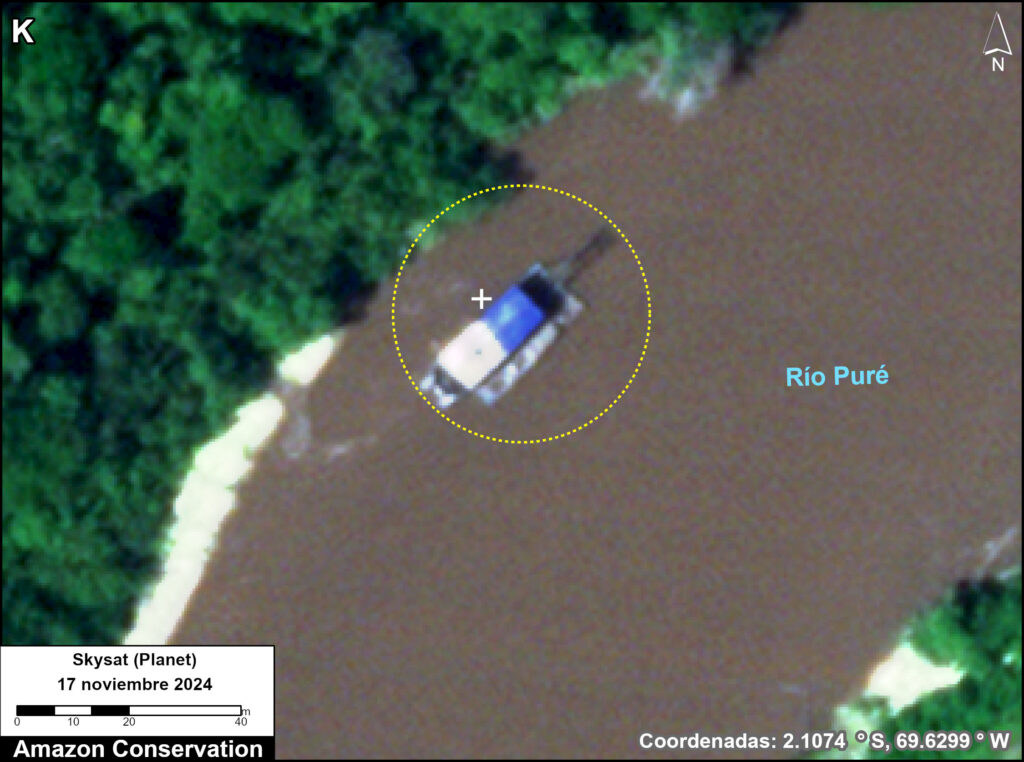
Despite interventions by the Colombian government and ongoing monitoring by organizations, mining activities continue, with increased intensity during periods when the river flow is lowest.Analyzing a Skysat image from November 2024, we found 29 dredges along the Puré River (see red dots in Figure 1). Figures 1J-L show examples of these findings. In other Skysat images from March and April 2025, we identified 27 dredges (see yellow dots in Figure 1).

Figure 1. Detected gold mining activity in the Puré River. Data: Amazon Conservation/MAAP, FCDS.

Overflight photos – Puré River

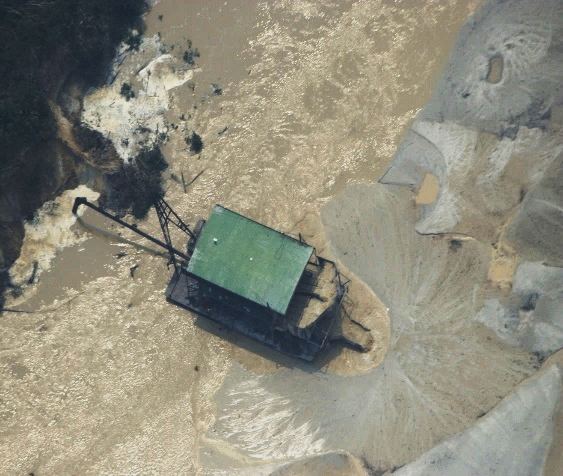
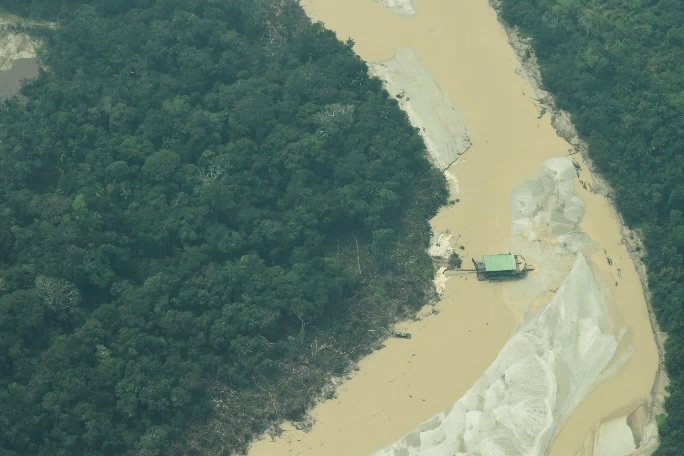
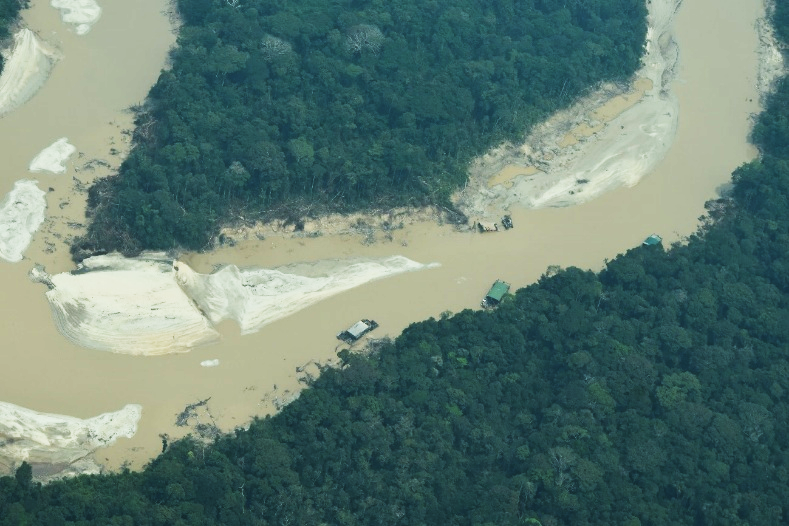
The following photos (corresponding to points 1-3 in Figure 1) were taken during a low-altitude overflight conducted by FCDS in September 2024. This additional resolution provides additional information on mining methods and their impacts (AARIMO 2024).

Punto 1

Overflight photo, Point 1. Green-roof dredger, with Starlink. Data: FCDS.

Punto 2

Overflight photo, Point 2. Three dredgers with barges and skidders. Data: FCDS.

Punto 3

Overflight photo. Point 3. Dredges and heavy machinery. Data: FCDS.

Detection of mining activity in the Cotuhé River

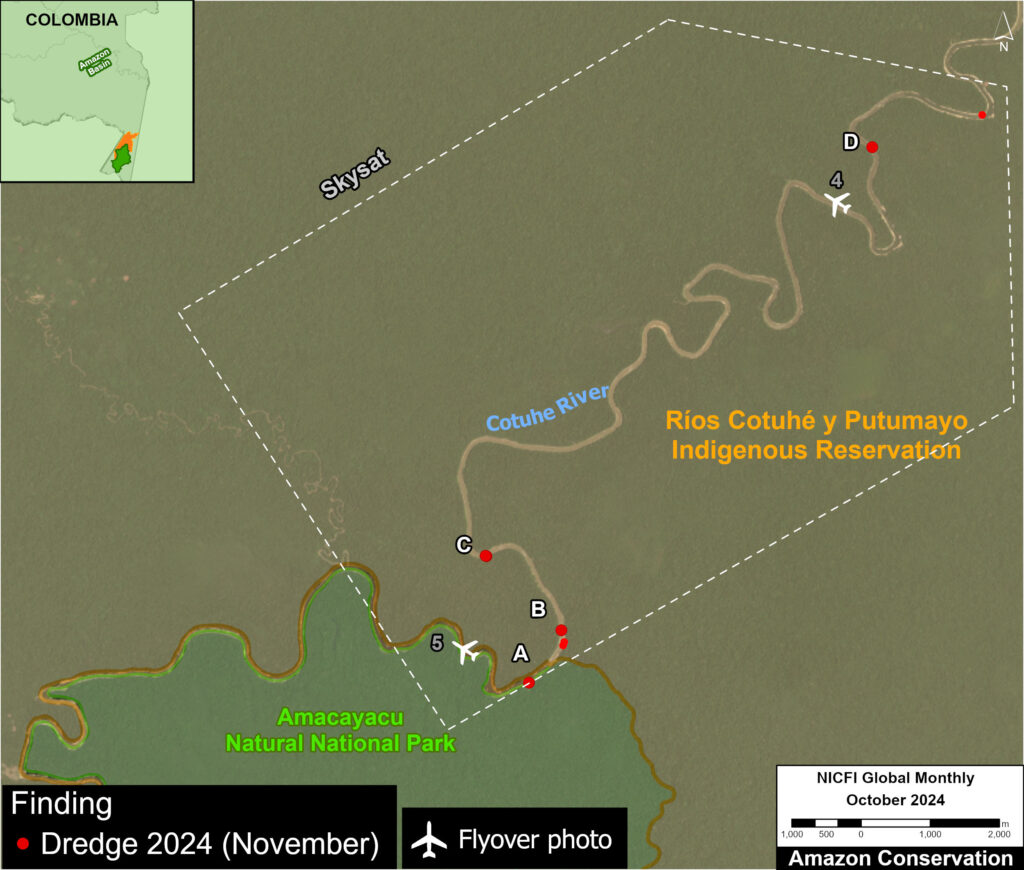
The Cotuhé River borders the north of Amacayacu National Park (see Base Map) and passes through the Cotuhé Putumayo Indigenous Reserve (see Figure 2), in the southeast Colombian Amazon, on the borders with Peru and Brazil.

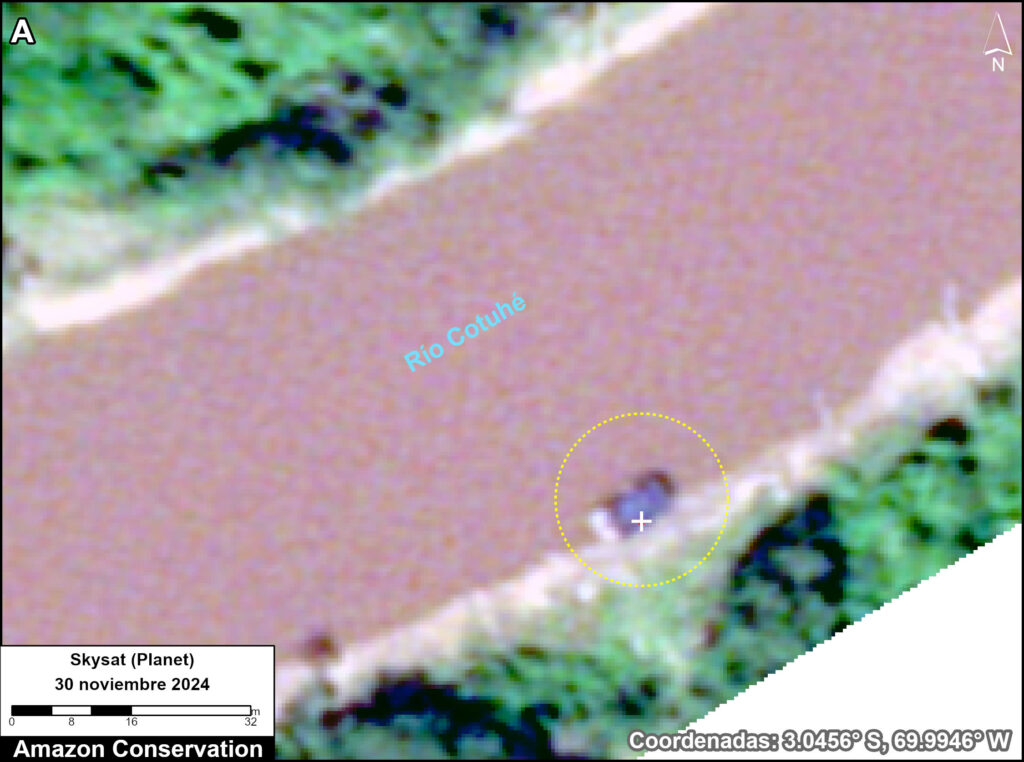
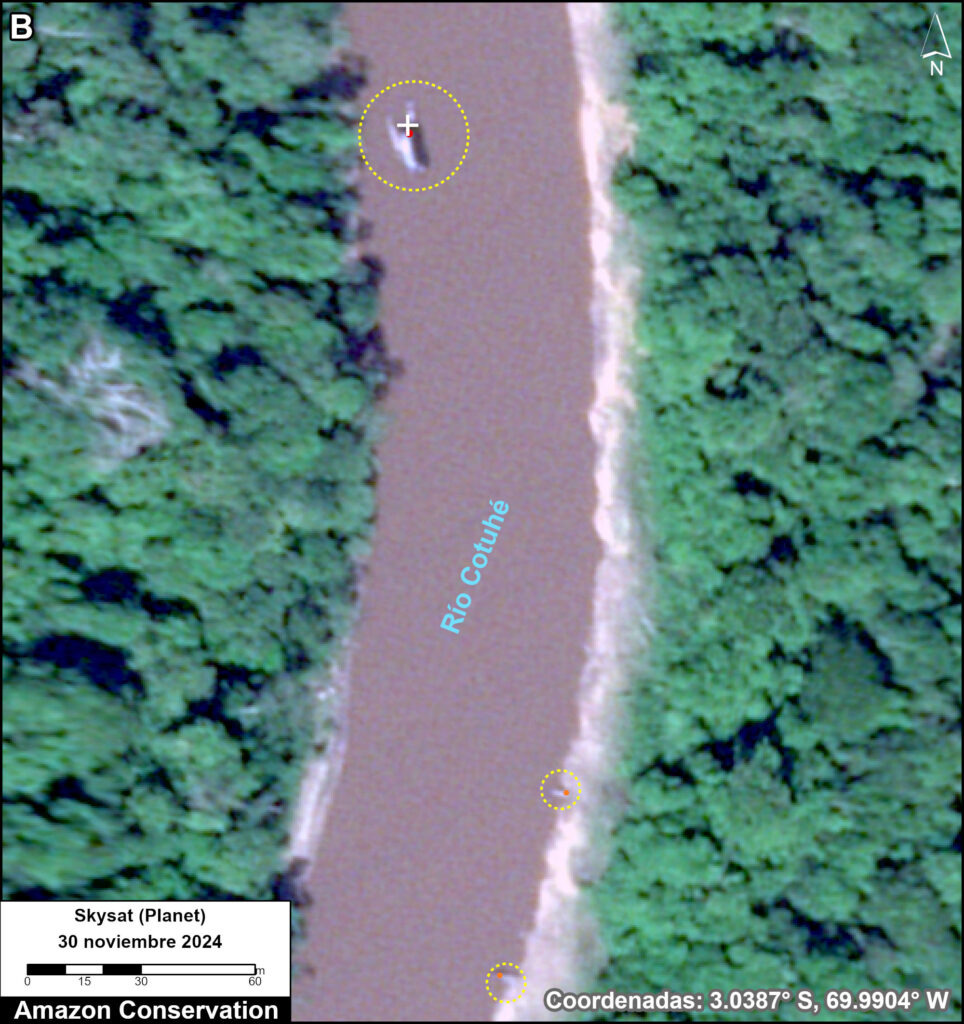
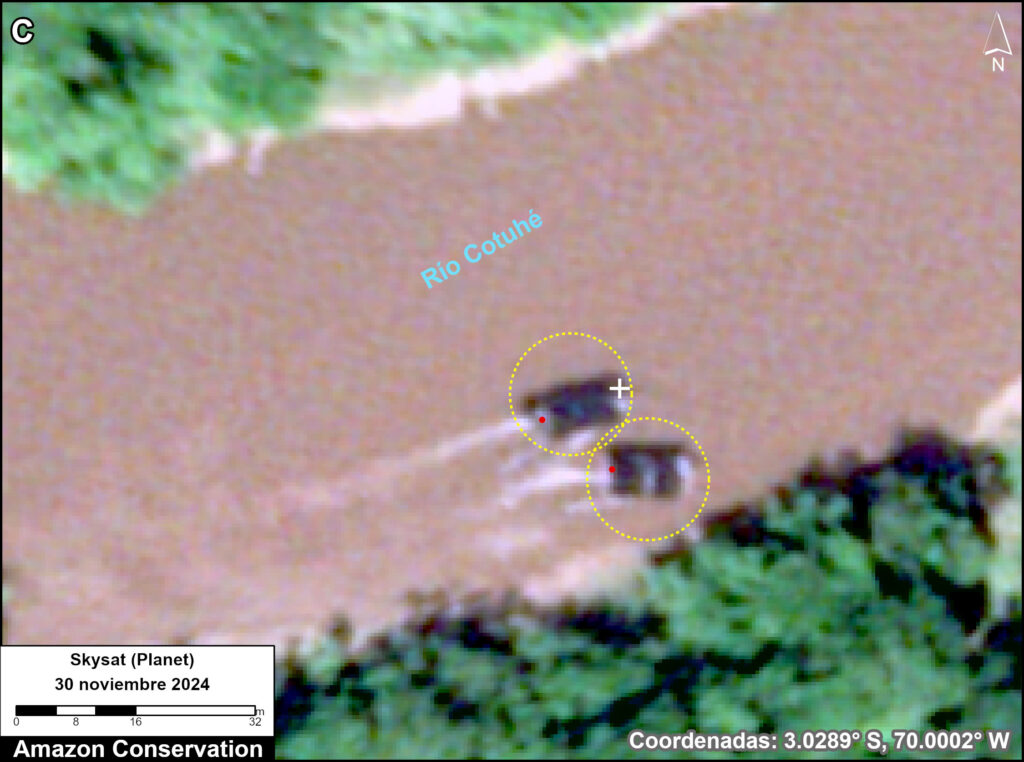
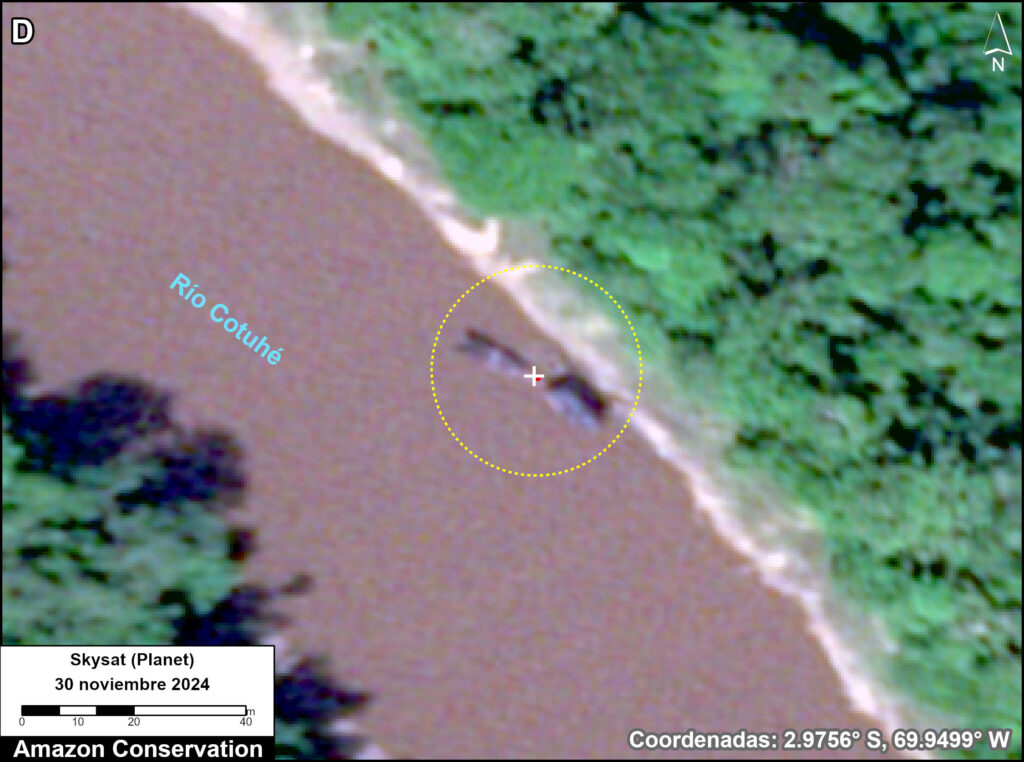
Analyzing a Skysat image from November 30, 2024, we found five dredges (Figure 2). Figures 2A-D show examples of these findings.

Figure 2. Detected gold mining activity in the Cotuhé River. Data: Amazon Conservation/MAAP, FCDS.

Overflight photos – Cotuhé River

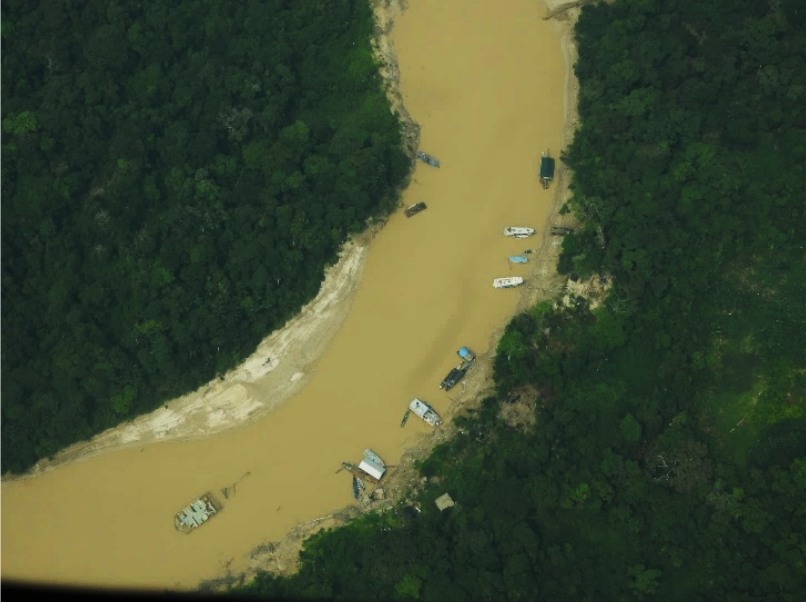
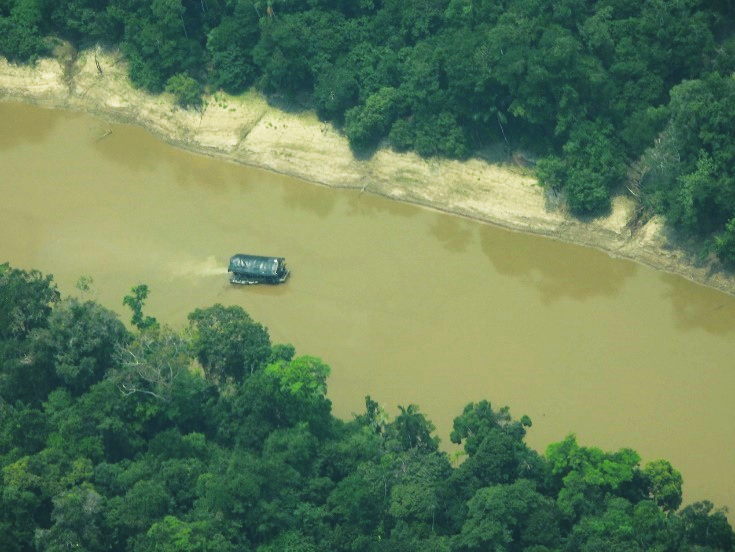
The following photos (corresponding to points 4-5 in Figure 2) were taken from a low-altitude overflight conducted by FCDS in September 2024 (AARIMO 2024).

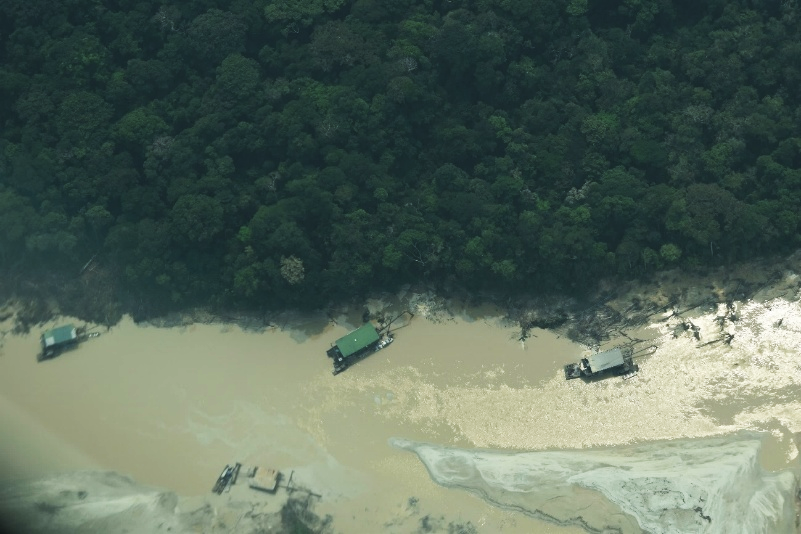
Punto 4

Overflight photo, Point 4. Dredger in operation with Starlink antenna. Data: FCDS
Overflight photo, Point 5. Dredger. Data: FCDS

Policy Implications

The illegal river-based mining analyzed here occurs within two important Colombian protected areas, Río Puré and Amacayacu National Parks. In these areas, no mining operations of any kind are permitted, due to impacts on biodiversity, Indigenous communities in voluntary isolation, and local Indigenous communities that depend on natural resources for their survival, putting their food security at risk.

An important factor that has intensified mining activity in the area has been the significant upward trend in the price of gold. In January 2008, an ounce of gold was quoted at around $812. By July 2024, this value reached $2,514, representing an increase of more than 200% over that period. Furthermore, recent changes in tariff policies have further boosted demand for gold (GoldMarket, 2024). Consequently, in February 2025, gold reached new highs, approaching $3,000 per ounce, substantially driven by central bank purchases (El País, 2025a).

Although Law 1658 of 2013 initiated the ban on the use of mercury in Colombia, it was not fully implemented until 2023. This ban includes the import and export of mercury to and from Colombia. However, despite the ban in Colombia, this element is used in considerable quantities for illegal gold mining in border areas, such as those observed in this report. Thus, Colombia, Brazil, and Peru face a significant challenge in complying with the law, as controls on the sale and use of this element in border areas are very complex due to the fact that these are difficult-to-access areas.

In general, a correlation has been observed between the granting of mining concessions in cross-border areas and the increase in informal mining in the Amazon subregion. For example, in the case of the Río Puré National Park, the presence of mining dredges has increased within protected areas. These dredges enter the Puré River from the Brazilian side, where therea area a large number of formal mining concessions.

A key challenge is to strengthen operational capacities and coordinate control actions among the three border countries (Colombia, Peru, and Brazil) to combat environmental crimes associated with illegal mining. These operations must be effective and not result in actions that harm the local communities and Indigenous peoples in voluntary isolation in the region, as this exacerbates the internal conflict in Colombia.

Notes

1 Ministerio de Minas y Energía, 2023

2 Ebus & Pedroso, 2023

3 Bullion Vault, 2025

Acknowledgments

This report was produced in collaboration with our Colombian partner, the Foundation for Conservation and Sustainable Development (FCDS), and with financial support from the Overbrook Foundation and Gordon and Betty Moore Foundation.

FCDS Logo

MAAP #227: Gold Mining in the Ecuadorian Amazon – Northern Sector

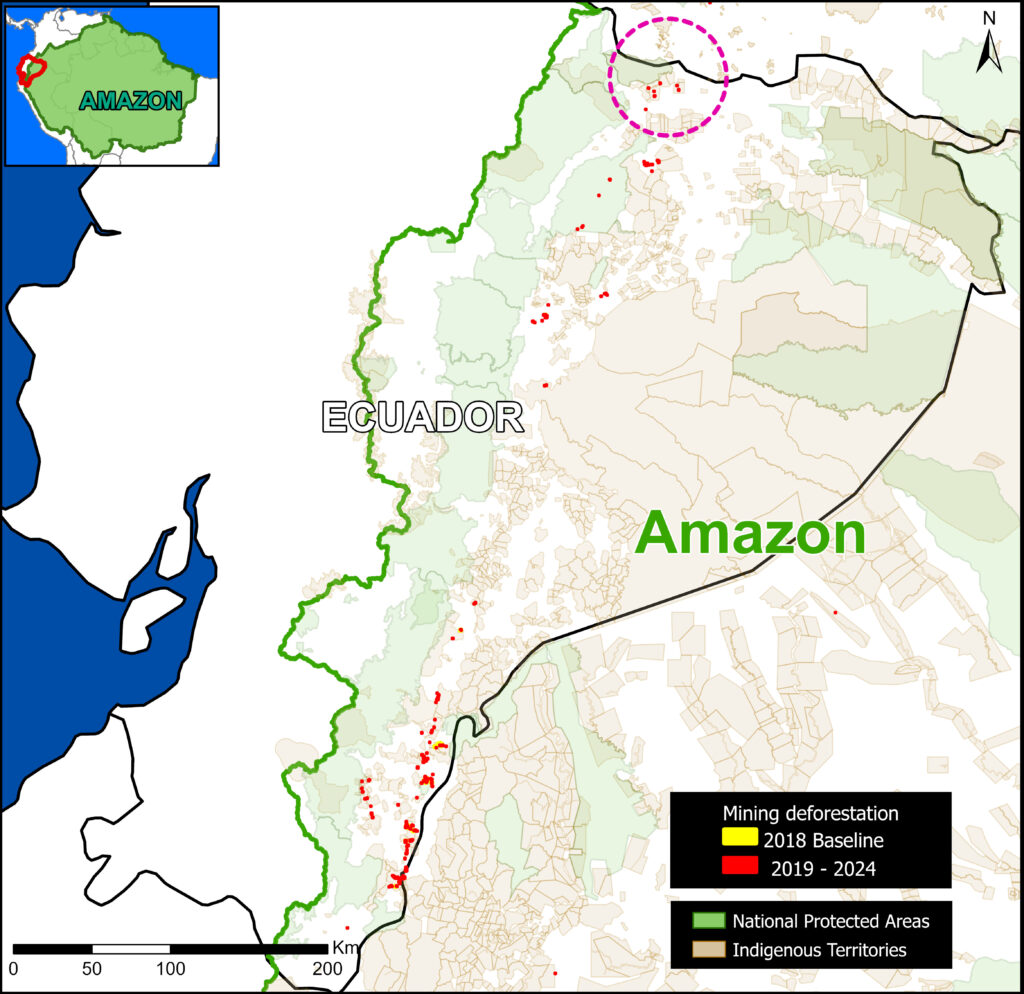
Base Map. Gold mining deforestation in the Ecuadorian Amazon. Data: Amazon Mining Watch, RAISG

In a recent report (MAAP #226), we presented data from Amazon Mining Watch (AMW), a collaboration between Amazon Conservation, Earth Genome, and the Pulitzer Center. This public resource uses AI (artificial intelligence) to detect gold mining deforestation across the Amazon, starting in 2018.

The Base Map illustrates the current data, highlighting the most recent mining deforestation (2019–2024) in red. Note the concentration of new mining activity in the western part of the Ecuadorian Amazon, along the transition with the Andes Mountains.

This is the first in a series of reports detailing gold mining in these areas. In this report, we focus on deforestation due to mining in the northern sector, around the Cofán Bermejo Ecological Reserve.

The Cofán Bermejo Ecological Reserve was one of the best-preserved protected areas in the province of Sucumbios until approximately 2020. In recent years, a rapid expansion of gold mining has been unfolding in the buffer zone of the southeastern edge of the reserve.

The vast majority of this activity has been identified as illegal mining, as it occurs outside designated mining areas, or is carried out in concession areas without proper authorization. The expansion of illegal gold mining in this sector is promoted by criminal groups located on the border with Colombia (Note 1).


Mining in the Ecuadorian Amazon – Northern Sector

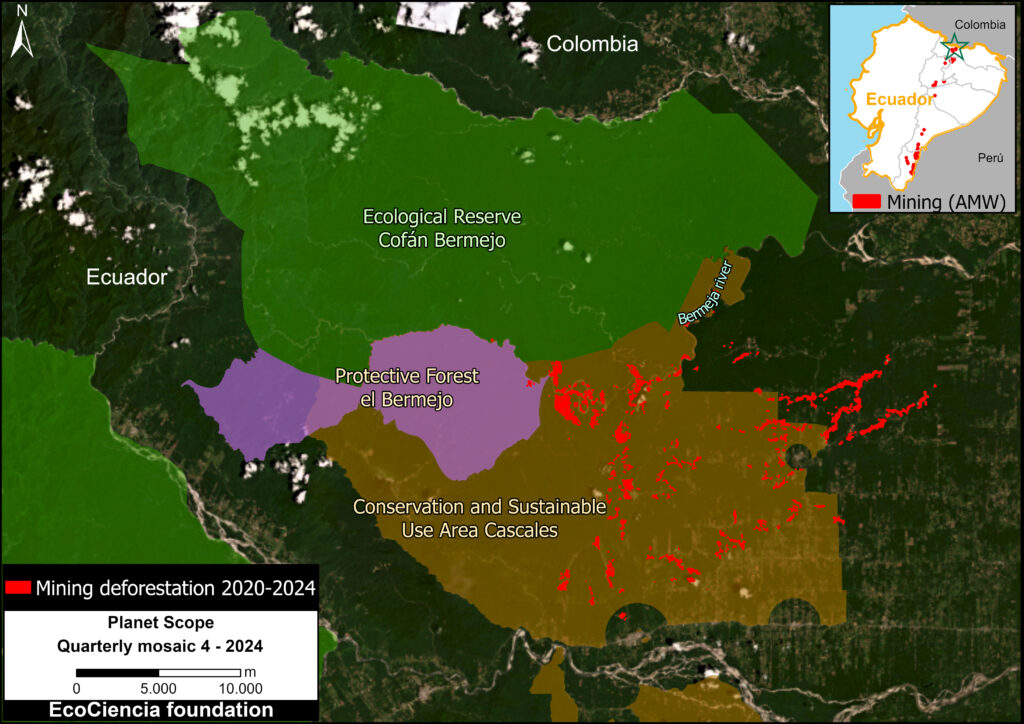
Figure 1. Mining to the southeast of Cofán-Bermejo Ecological Reserve. Data: AMW, ACA/MAAP; MAATE; NCI, Planet.

In a previous report, MAAP #186 analyzed mining activity just outside Cofán Bermejo Ecological Reserve, located in the northern Ecuadorian Amazon, in the province of Sucumbíos. Here, we update and expand this analysis around the reserve.

This expanded analysis incorporates additional conservation areas, such as El Bermejo Protective Forest and the Cascales Municipal Conservation and Sustainable Use Area (see Figure 1), as well as Shuar and Kichwa Indigenous territories (Figure 2).

Due to the development of this mining activity in several different land designation areas, it is worth emphasizing that there are two major factors determining its legality or illegality in Ecuador:

1) Express prohibition provided for by the Constitution or law, as in the case of metal mining activities in protected areas (Article 407 of the Constitution) or the prohibition on the use of mercury in mining operations (Article 86.1 of the Mining Law).

2) Lack of authorization, such as conducting exploration and exploitation activities without the corresponding permits.

In terms of social impact, Mongabay Latam (2023) contextualizes this area (References 1-2): “Indigenous communities and social and environmental organizations that work in the territory cannot openly denounce what is happening in this border area with Colombia, due to the presence of armed groups and the serious security problems that exist there.”

Considering that the largest area of ​​gold mining deforestation is located in the Cascales Conservation and Sustainable Use Area (Figure 1), it is important to note that this type of designation (Conservation and Sustainable Use Areas) are zones created by decentralized autonomous local governments, communities, or private landowners to conserve biodiversity and develop sustainable activities that maintain ecosystem services beneficial to human life. Activities such as conservation, research, restoration, education, culture, recreation, and tourism, as well as sustainable subsistence production activities, can be carried out in these protected areas. The declaration of these protected areas does not modify mining concessions granted by the National Environmental Authority that remain in force and may be renewed, as long as they are compatible with sustainable use.

Regarding El Bermejo Protective Forest, this designation type (Protective Forest) is natural vegetation formations (trees, shrubs, or herbs) found in areas with rugged topography, headwaters of watersheds, or zones unsuitable for agriculture or livestock farming. Their primary function is to conserve water, soil, flora, and wildlife. Activities permitted in these forests, with authorization from the National Environmental Authority, include the promotion of wildlife, the execution of priority public works, sustainable forest management, and scientific, tourism, and recreational activities.

Indigenous Territories

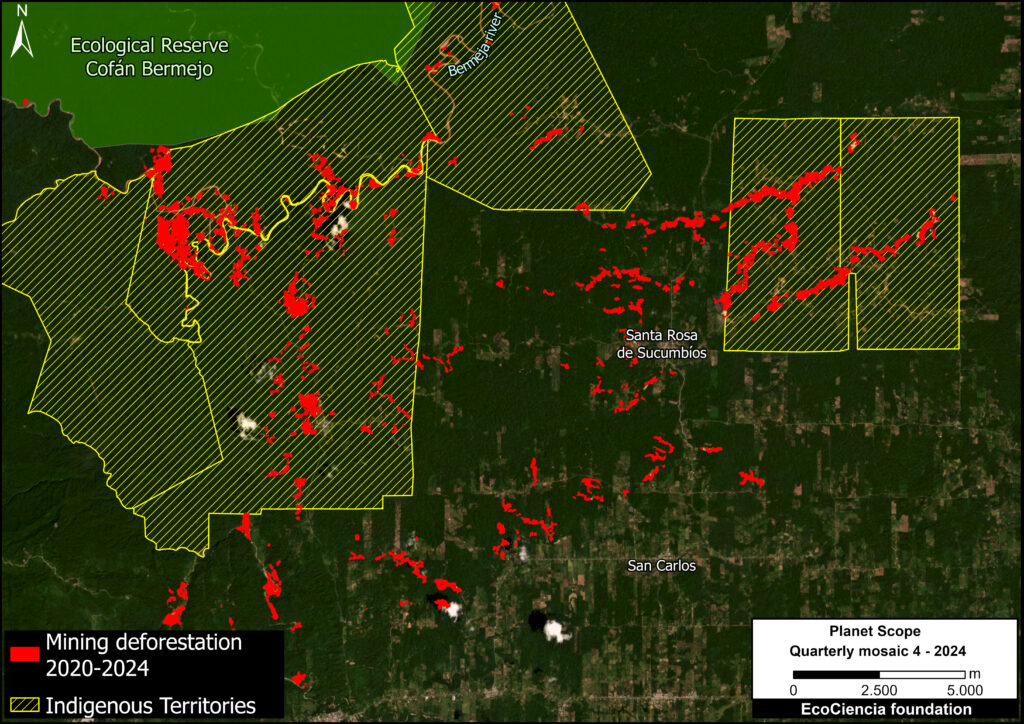
Figure 2. Gold mining deforestation in Indigenous territories (Shuar & Kichwa). Data: ACA/MAAP; EcoCiencia; Planet

In addition to  the Cofán Bermejo Indigenous Territory, which shares boundaries with the Ecological Reserve of the same name, gold mining deforestation threatens six surrounding Shuar and Kichwa Indigenous territories (Figure 2).

Note that these territories overlap with the conservation areas noted above.

In total, 68% of the mining deforestation detected in the study area was identified as occurring within these Indigenous territories.


Increase in Gold Mining Deforestation 2020 – 2024

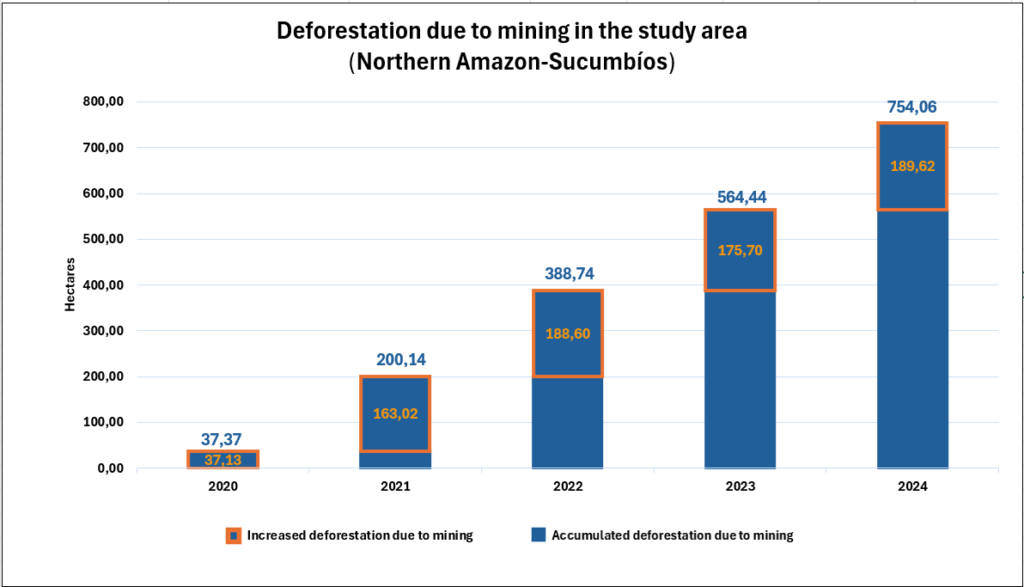
Using satellite imagery (Planet), we estimated the annual expansion of gold mining deforestation in this area between 2020 and 2024. The total forest area affected by mining by the end of 2024 is approximately 754 hectares, equivalent to 1,863 acres.

The vast majority of this mining occurred in the Cascales Conservation and Sustainable Use Area or Indigenous territories.

The analysis shows that the largest increase occurred in 2024, with an expansion of 189.62 hectares. Overall, we documented a trend of continual accumulated expansion of gold mining deforestation across the region (Graph 1).

Graph 1. Mining activity 2017-2024 outside the Ecological Reserve Cofanes – Bermejo. Data: ACA/MAAP; Fundación EcoCiencia.

Mining Concessions

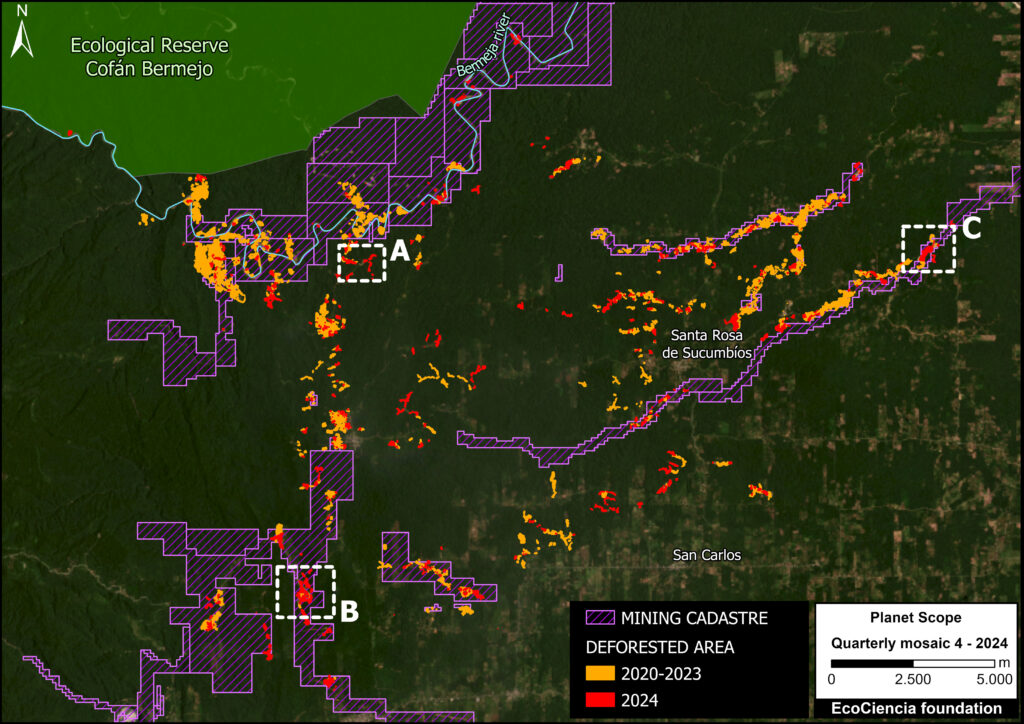
Figure 3. Overlay of mining activities with the mining cadastre. Data: ACA/MAAP; EcoCiencia; ARCOM; Planet

By adding the mining land designations, we determined that 59% of the mining deforestation (444 hectares) occured outside legal mining areas (Figure 3).

The Ecuadorian government, through the Ministry of Energy and Mines, grants mining rights for the exploitation of mineral resources in each of its phases (mining activity is divided into an exploration and development phase).

The exploration phase is further divided into three periods: initial exploration, advanced exploration, and economic evaluation.

Carrying out development activities prior to the granting of the right is illegal and may incur administrative or criminal sanctions.


Case Studies

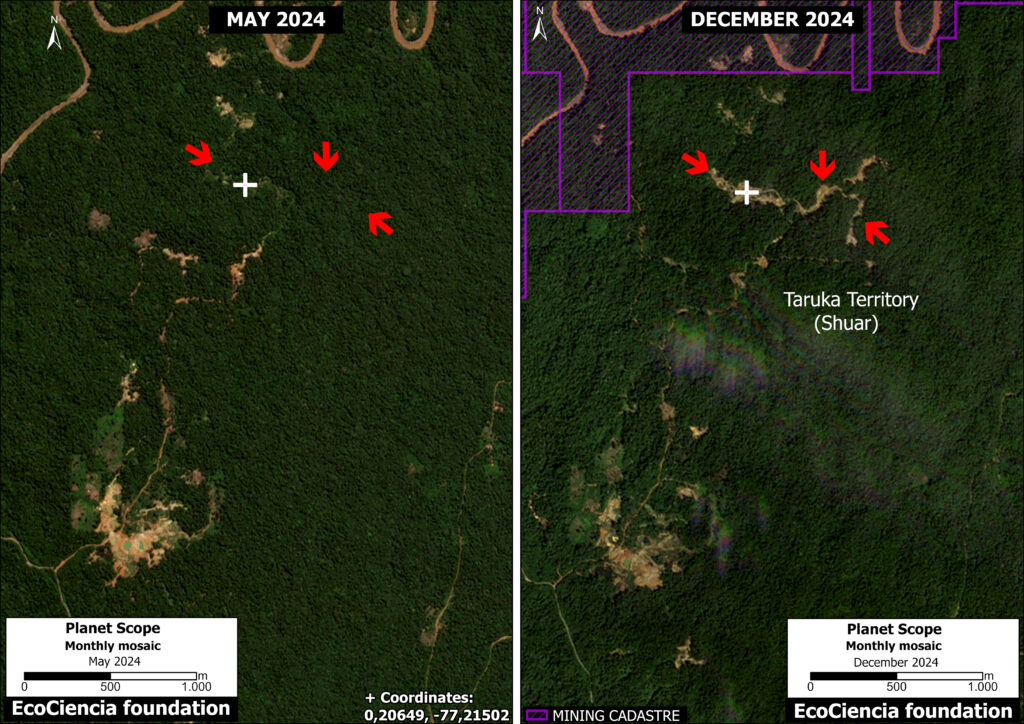
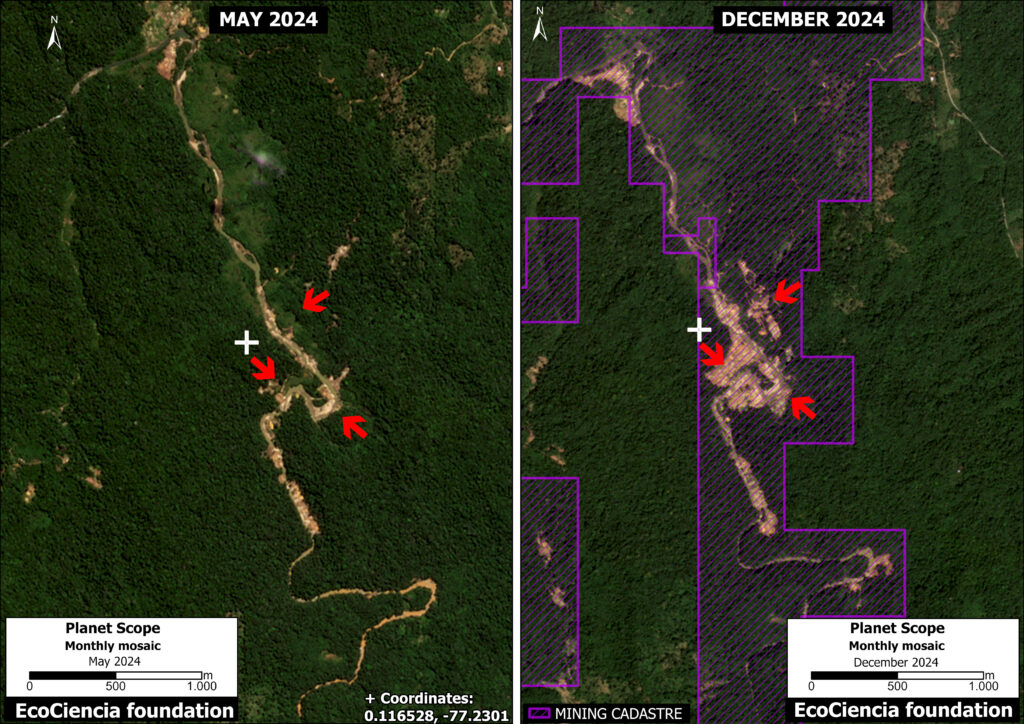
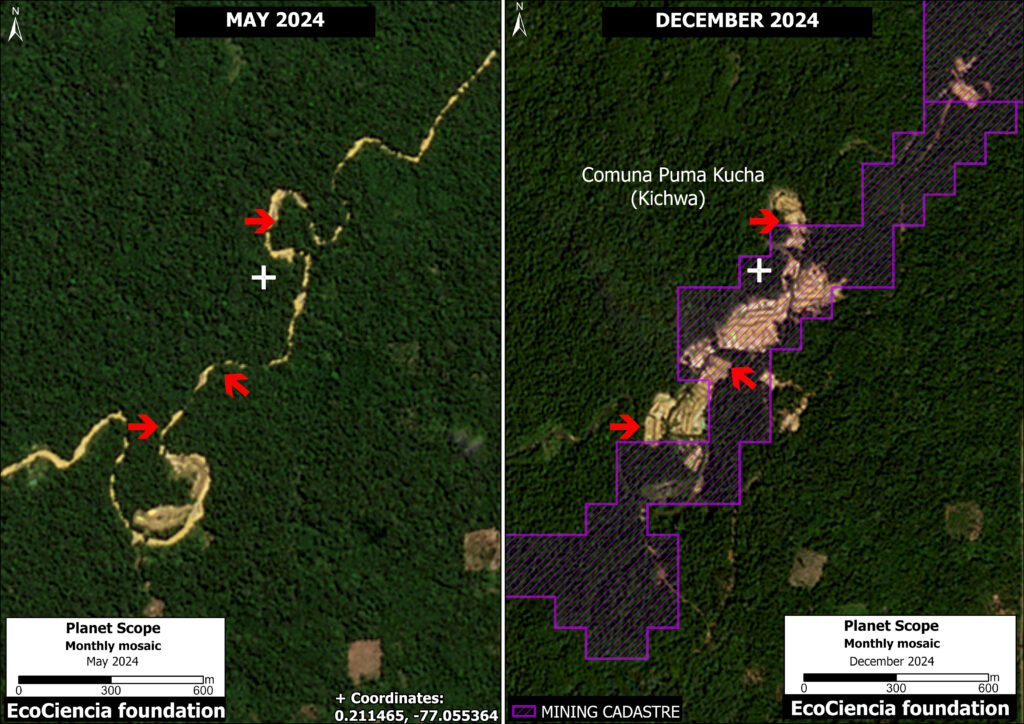
We selected three case studies within the monitoring area to illustrate the rapid expansion of mining activity (see Insets A-C in Figure 3). The comparative panels below demonstrate the expansion of mining activity between May 2024 (left panel) and December 2024 (right panel) in each case.

Zoom A.

Panel A shows mining deforestation taking place outside designated mining concession areas. Moreover, this activity is occurring within a Shuar Indigenous territory (Taruka Territory).

Panel Zoom A. Mining deforestation in Shuar Indigenous territory. Data: ARCOM (2025); Planet

Zoom B.

In Panel B, we identified 61.4 hectares of mining activity within the El Tuerto mining concession. However, this concession is currently in the initial exploration phase, meaning it has not yet been authorized for development.

Panel Zoom B. Data: ARCOM (2025); Planet

Zoom C.

In Panel C, we recorded 19.65 hectares of mining activity within the El Porvenir mining concession. It is also currently in the exploration phase, with no authorization for development. Furthermore, this activity takes place within the ancestral territory of the Puma Kucha Commune (Kichwa Indigenous territory).

Panel Zoom C. Data: ARCOM (2025); Planet

Policy Implications

The recent gold mining deforestation described above highlights several key policy needs:

  • Regulate public investment to ensure that the various conservation entities recognized by the national government have the necessary resources for oversight within their jurisdiction.
  • Strengthen investigation and oversight processes in institutions responsible for ensuring environmentally responsible mining activities.

Methodology

In addition to Amazon Mining Watch to create the Base Map, we used LandTrendR, a temporal segmentation algorithm that identifies changes in pixel values ​​over time, to detect forest loss at the edge of the Cofán-Bermejo Ecological Reserve between August 2017 and December 2024 using the Google Earth Engine platform. Importantly, this method was originally designed for moderate-resolution (30-meter) Landsat imagery (Reference 3), but was adapted for higher spatial resolution (4.7-meter) NICFI-Planet monthly mosaics (Reference 4).

References

  1. Antonio José Paz Cardona. (2023, 7 junio). Ecuador: minería ilegal sigue avanzando hacia el interior de la Reserva Ecológica Cofán Bermejo. Noticias Ambientales. https://es.mongabay.com/2023/06/mineria-ilegal-reserva-ecologica-cofan-bermejo-ecuador/
  2. Amazon Watch report ‘Oro, bandas y gobernanza: La crisis que enfrentan las comunidades indígenas amazónicas de Ecuador’ 
  3. Kennedy, R.E., Yang, Z., Gorelick, N., Braaten, J., Cavalcante, L., Cohen, W.B., Healey, S. (2018). Implementation of the LandTrendr Algorithm on Google Earth Engine. Remote Sensing. 10, 691.
  4. Erik Lindquist, FAO, 2021

Acknowledgments

This report is part of a series focused on the Ecuadorian Amazon through a strategic collaboration between the EcoCiencia Foundation and Amazon Conservation, with support from the Gordon and Betty Moore Foundation.

MAAP #226: AI to detect Amazon gold mining deforestation – 2024 update

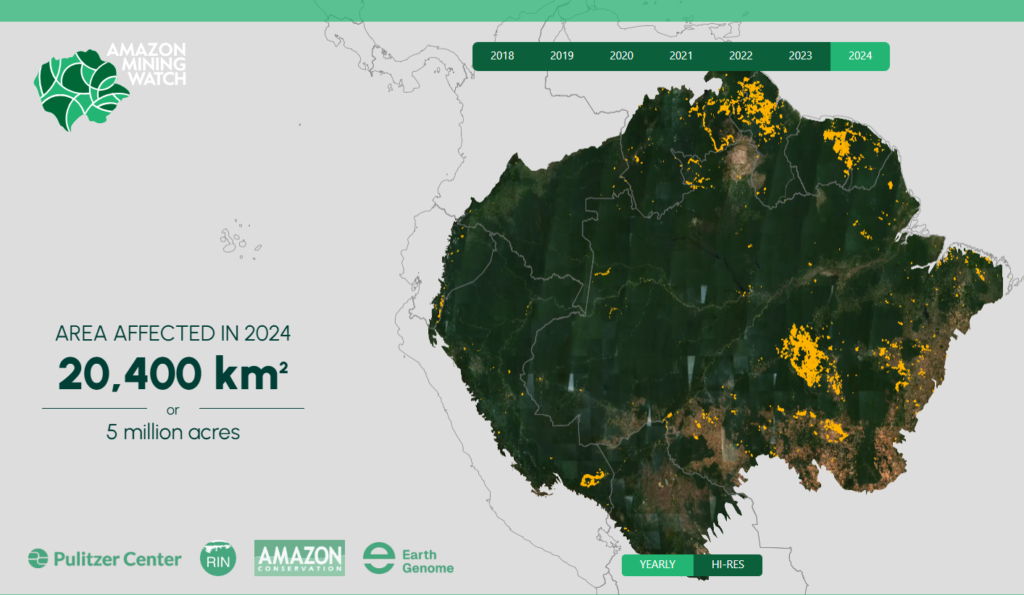
Intro Image. Amazon Mining Watch interactive map.

As gold prices continue to increase, small-scale gold mining activity also continues to be one of the major deforestation drivers across the Amazon

It often targets remote areas, thus impacting carbon-rich primary forests. Moreover, in many cases, we presume that this mining is illegal based on its location within conservation areas (such as protected areas and Indigenous territories) and outside mining concessions.

Given the vastness of the Amazon, however, it has been a challenge to accurately and regularly monitor mining deforestation across all nine countries of the biome, in order to better inform related policies in a timely manner.

In a previous report (MAAP #212) we presented the initial results of the new AI-based dashboard (known as Amazon Mining Watch) designed to address the issue of gold mining and related policy implications. Amazon Mining Watch (AMW) is a partnership between Earth Genome, the Pulitzer Center’s Rainforest Investigations Network, and Amazon Conservation.

This online tool (see Intro Image) analyzes satellite imagery archives to estimate annual mining deforestation footprints across the entire Amazon, from 2018 to 2024 (Note 1). Although the data is not designed for precise area measurements,  it can be used to give timely estimates needed for management and conservation purposes.  

For example, the cumulative data can be used to estimate and visualize the overall Amazon-wide mining deforestation footprint, and the annual data can be used to identify trends and emerging new mining areas. The algorithm is based on 10-meter resolution imagery from the European Space Agency’s Sentinel-2 satellite and produces 480-meter resolution pixelated mining deforestation alerts.

The only tool of this kind to be truly regional (Amazon-wide) in coverage, AMW can also help foster regional cooperation, in particular in transfrontier areas where a lack of interoperability between official monitoring systems might hamper interventions.

The Amazon Mining Watch partnership is currently working to enhance the functionality and conservation impact of the dashboard, AMW will be a one-stop shop platform including real-time visualization of: 1) AI-based detection of mining deforestation across all nine Amazonian countries, with quarterly updates; 2) Hotspots of urgent mining cases, including river-based mining; and 3) the socio-environmental costs of illegal gold mining with the Conservation Strategy Fund (CSF) Mining Impacts Calculator.

Here, we present an update focused on the newly added 2024 data and its context within the cumulative dataset (since 2018).

MAJOR FINDINGS

In  the following sections, we highlight several major findings:

  • Gold mining is actively causing deforestation in all nine countries of the Amazon. This impact is concentrated in three major areas: southeast Brazil, the Guyana Shield, and southern Peru. In addition, mining in Ecuador is escalating.
  • The cumulative mining deforestation footprint in 2024 was over 2 million hectares (nearly 5 million acres) and has increased by over 50% in the past six years.
  • Over half of all Amazon mining deforestation occurred in Brazil, followed by Guyana, Suriname, Venezuela, and Peru.
  • While the cumulative footprint continues to grow, the rate of increase slowed in 2023 and 2024 after peaking in 2022, likely due to increased enforcement in Brazil.
  • Over one-third of the mining deforestation has occurred within protected areas and Indigenous territories, where much of it is likely illegal. We highlight the most impacted areas.
  • These results have important policy implications.
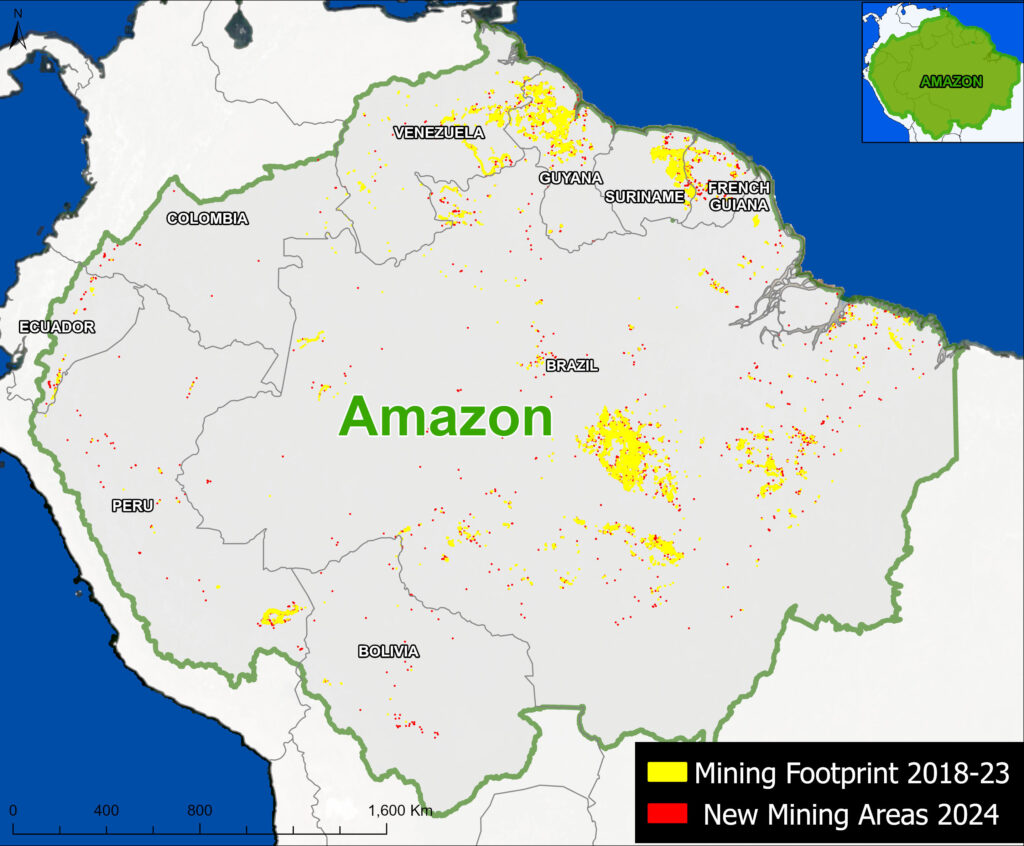
Base Map. Mining deforestation footprints, 2018-2024. Data: AMW, Amazon Conservation/MAAP.

Amazon & National Scale Patterns

The Base Map presents the gold mining footprint across the Amazon, as detected by the AMW algorithm. This data serves as our estimate of gold mining deforestation.

Yellow indicates the accumulated mining deforestation footprint for the years 2018- 2023; that is, all areas that the algorithm classified as a mining site vs other types of terrain, such as forest or agriculture. Red indicates the new mining areas detected in 2024.

Three major Amazon gold mining regions stand out: southeast Brazil (between the Tapajos, Xingu, and Tocantis Rivers), Guyana Shield (Venezuela, Guyana, Suriname, and French Guiana), and southern Peru (Madre de Dios).  In addition, Ecuador has emerged as an important mining deforestation front.
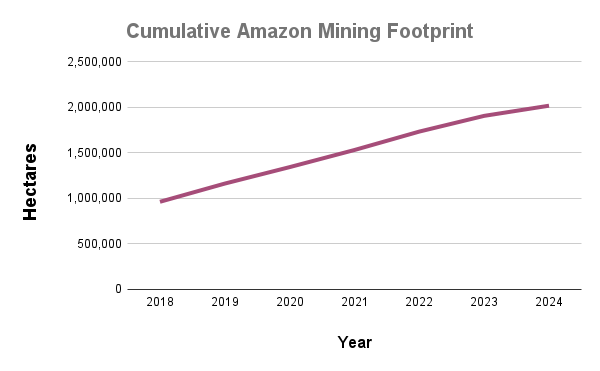


Graph 1. Amazon mining deforestation footprint. Data: AMW

Graph 1 quantifies the spatial data detected by the AMW algorithm

The cumulative mining deforestation footprint in 2024 was 2.02 million hectares (4.99 million acres)

For context, the initial mining deforestation footprint was around 970,000 hectares in 2018, the first year of Amazon Mining Watch data.

Between 2019 and 2024, we estimate that the gold mining deforestation grew by 1.06 million hectares (2.61 million acres).

Thus, over half (52.3%) of the cumulative footprint has occurred in just the past six years.

Note that while the cumulative footprint continues to grow, the rate of increase slowed in 2023 and 2024 after peaking in 2022.


Graph 2 shows that, of the total accumulated mining (2.02 million hectares), over half has occurred in Brazil (55.3%), followed by Guyana (15.4%), Suriname (12.4%), Venezuela (7.3%), and Peru (7.0%).
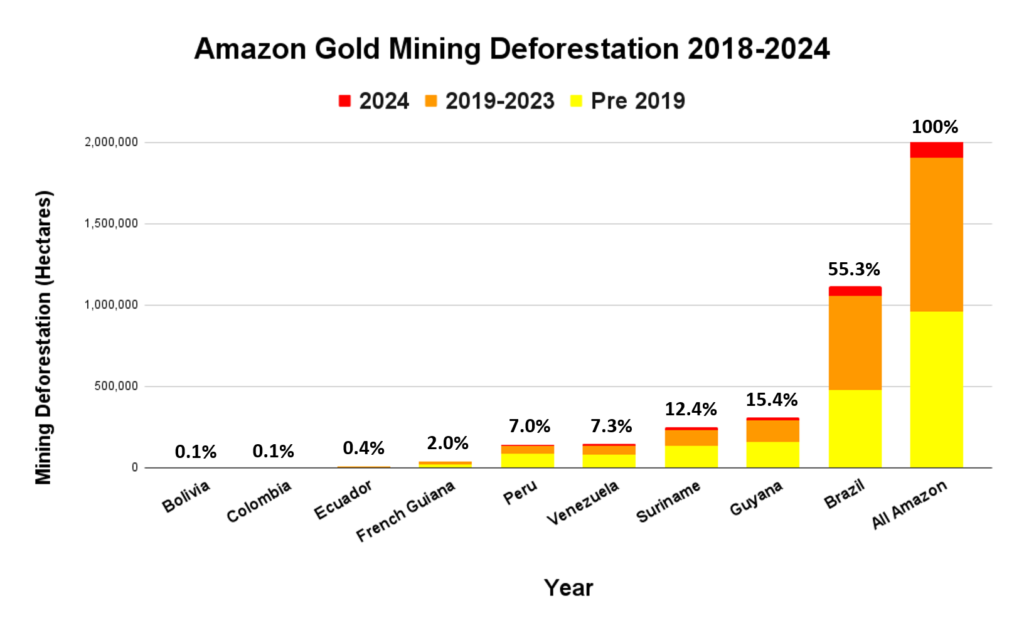
Graph 2. Gold mining deforestation across the Amazon, by country. Data: AMW, Amazon Conservation/MAAP

Graph 3 digs deeper into the AMW data, revealing additional trends between years. This data highlights the annual changes in detected mining deforestation. Note the trend across the entire Amazon at the top in green for overall context, followed by each country. Note that Brazil (orange line) accounts for much of the annual mining (over 50%).

In 2024, we documented the new gold mining deforestation of 111,603 hectares (275,777 acres). This total represents a decrease of 35% relative to the previous year 2023 and 45% relative to the peak year 2022.

The countries with the highest levels of new gold mining deforestation in 2024 were 1) Brazil (57,240 ha), 2) Guyana (19,372 ha), 3) Suriname (15,323 ha), 4) Venezuela (9,531 ha), and 5) Peru (6,020 ha). However, all five of these countries saw a major decrease in 2024, between 33% (Brazil and Suriname) and 46% (Peru).
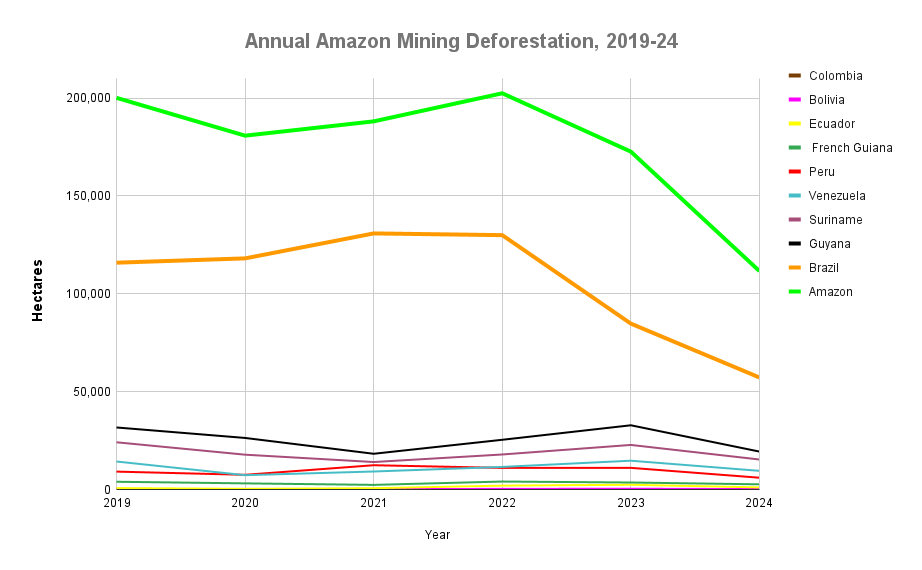
Graph 3. Annual changes in new mining deforestation. Data: AMW
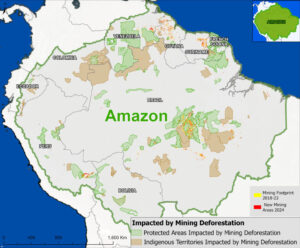
Figure 1. Protected areas & Indigenous territories impacted by mining deforestation. Data: AMW, ACA/MAAP.

Protected Areas & Indigenous Territories

We estimate that 36% of the accumulated mining deforestation in 2024 (over 725,000 hectares) occurred within protected areas and Indigenous territories (Figure 1; Note 2), where much of it is likely illegal.

Notably, the vast majority of this overall mining deforestation in protected areas and Indigenous territories has occurred in Brazil (88%).
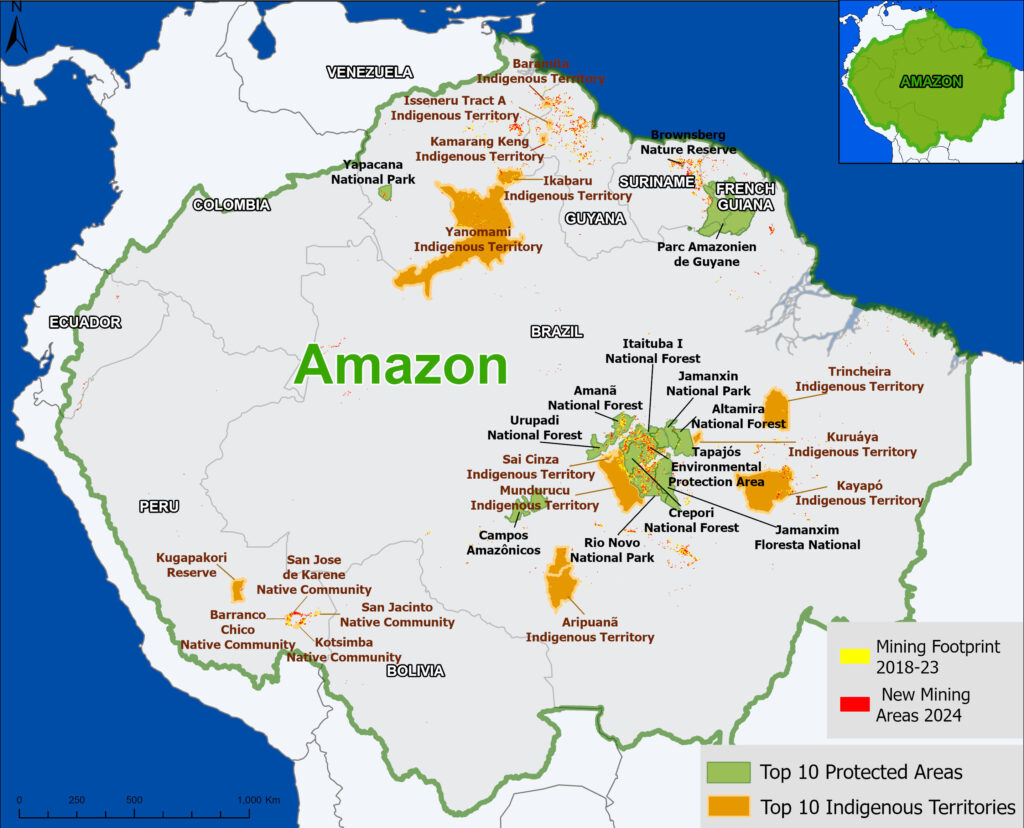


Figure 2a. Top 10 impacted protected areas & Indigenous territories. Data: AMW, ACA/MAAP.

Figure 2a illustrates the top ten for both protected areas and Indigenous territories, in terms of both accumulated mining deforestation footprint and new mining deforestation in 2024. Figures 2b-d show zooms of the three main mining areas: southeast Brazil (2b), Guyana Shield (2c), and southern Peru (2d).

The top nine most impacted protected areas (in terms of accumulated footprint) are all in Brazil, led by Tapajós Environmental Protection Area. This area has lost over 377,000 hectares, followed by Amanã and Crepori National Forests, Rio Novo National Park, Urupadi, Jamanxim, and Itaituba National Forests, Jamanxim National Park, and Altamira National Forest. The top ten is rounded out by Yapacana National Park in Venezuela.

The three most impacted Indigenous territories are also in Brazil: Kayapó, Mundurucu, and Yanomami. Together, these three territories had a mining footprint of nearly 120,000 hectares. Fourth on the list is Ikabaru in Venezuela, followed by three in southern Peru (San Jose de Karene, Barranco Chico, and Kotsimba) with mining impact of over 17,000 hectares. Rounding out the top ten are Sai Cinza and Trincheira/Bacajá in Brazil, and San Jacinto in Peru.

We also estimate the expansion of over 38,000 hectares of new mining deforestation in protected areas and Indigenous territories in 2024. The protected area with the highest levels of new mining deforestation in 2024 was Tapajós Environmental Protection Area (nearly 19,000 hectares), followed by Amanã and Urupadi National Forests in Brazil, Rio Novo and Jamanxim National Parks in Brazil, Crepori National Forest in Brazil, Campos Amazonicos National Park in Brazil, Yapacan National Park in Venezuela, Guyane Regional Park in French Guiana, and Brownsberg Nature Reserve in Suriname.

Finally, the Indigenous territory with the highest levels of new mining deforestation in 2024 was Kayapó in Brazil (over 2,100 hectares), followed by Ikabaru in Venezuela, Yanomami, Aripuana, and Mundurucu in Brazil, Baramita in Guyana, Kuruáya in Brazil, Isseneru and Kamarang Keng, San Jose de Karene in Peu. It is worth noting that Kayapó, Mundurucu, and Yanomami territories in Brazil all experienced declines in the mining deforestation rate in 2024. For example, Yanomami went from its peak in 2021 to the lowest on record in 2024.

Most impacted areas in eastern Brazilian Amazon
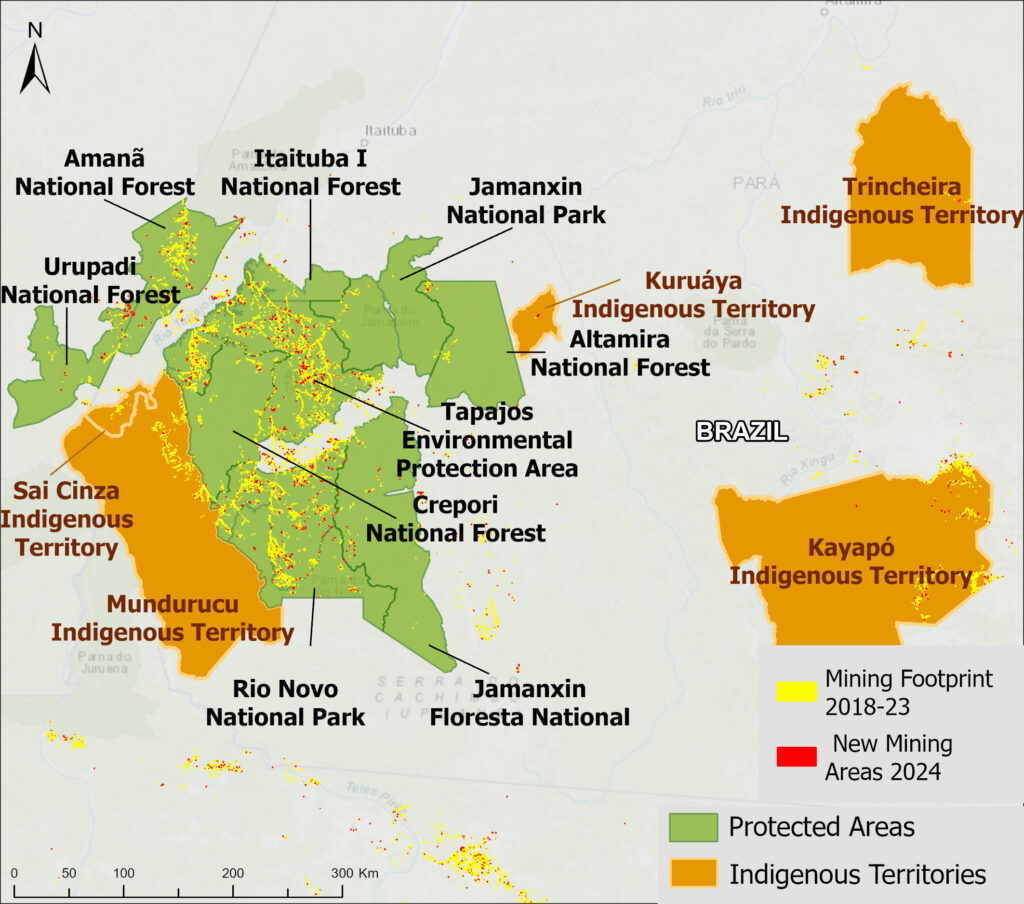
Figure 2b. Most impacted areas in eastern Brazilian Amazon. Data: AMW, Amazon Conservation/MAAP.

Most impacted areas in the Guyana Shield
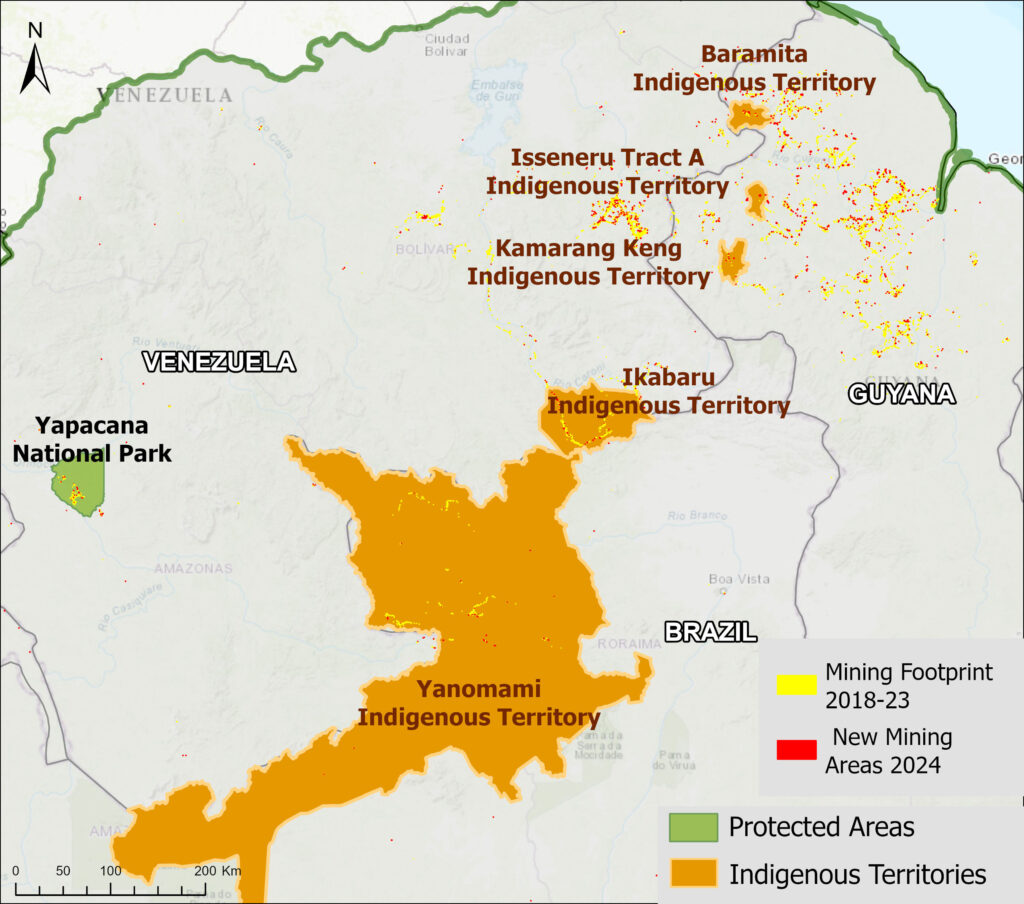
Figure 2c. Most impacted areas in the Guyana Shield. Data: AMW, Amazon Conservation/MAAP.

Most impacted areas in the southern Peruvian Amazon
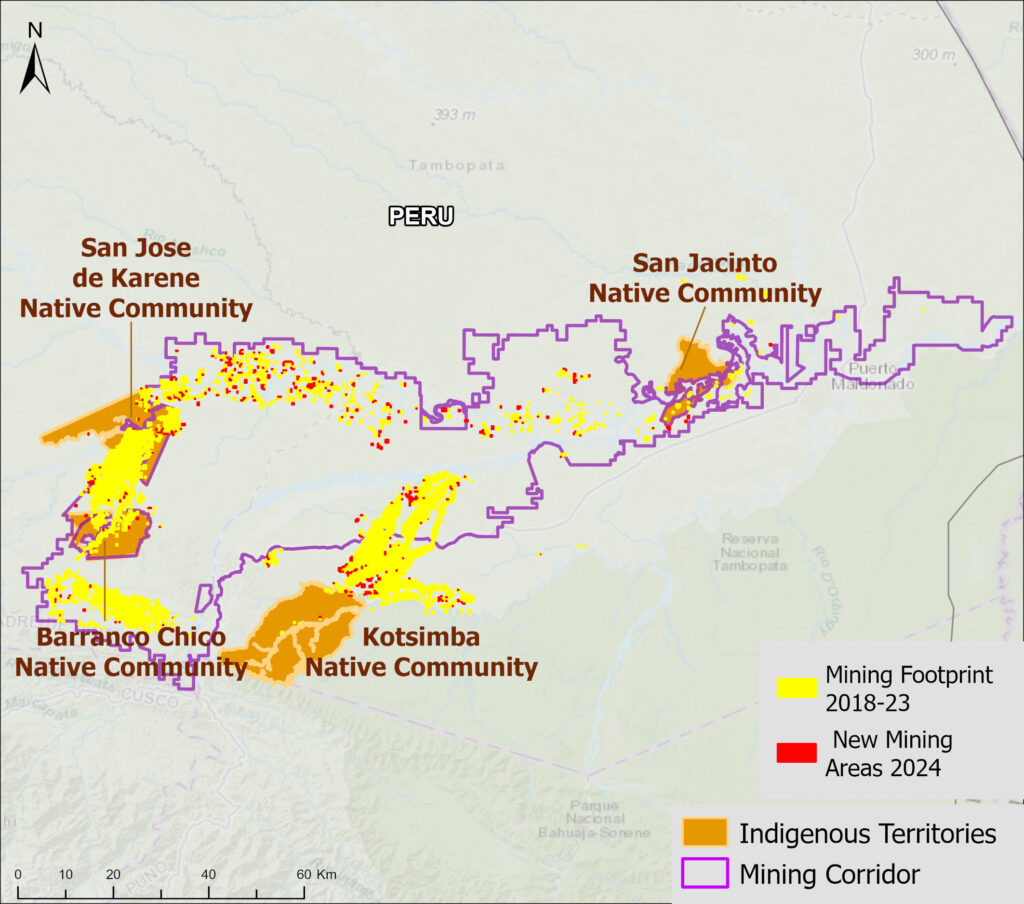
Figure 2d. Most impacted areas in the southern Peruvian Amazon. Data: AMW, Amazon Conservation/MAAP.

Conclusion & Policy Implications

Despite a recent downward trend in the rate of gold mining deforestation, the cumulative gold mining deforestation footprint continues to grow across the Amazon.

Our analysis shows that over one-third of this mining occurs within protected areas and Indigenous territories, the vast majority in Brazil. However, since the return of the Lula administration in 2023, Brazil has been ramping up enforcement efforts. This has contributed to the rapid decrease in area lost to mining across the Amazon, given Brazil’s outsized contribution to regional figures. This highlights again the importance of protected areas and Indigenous territories as a crucial policy instrument for the protection of the region’s ecosystems.

Although advances have been made in reducing illegal mining from protected areas in southern Peru, it continues to impact several Indigenous territories (MAAP #208, MAAP #196), particularly those surrounding the government-designated Mining Corridor. In fact, the most affected Indigenous territory in Peru, San Jose de Karene, has already lost over a third of its total area to illegal gold mining.  These territories are part of a regional organization known as FENAMAD, which has been supporting legal actions to help the government make decisions for a rapid response to illicit activities (such as illegal mining) that affect indigenous territories. This process led to five government-led operations between 2022 and 2024, in three communities: Barranco Chico, Kotsimba and San José de Karene (MAAP #208).

In Ecuador, mining deforestation continues to threaten numerous sites, including protected areas and Indigenous territories, along the Andes-Amazon transition zone (MAAP #206, MAAP #221, MAAP #219). An upcoming series of reports will detail these threats.

AMW is an emerging and powerful new tool, but it does have some caveats. One is that any mining activity less than 500 square meters may not be accurately detected. For example, we have been monitoring small-scale mining in several protected areas, such as Madidi National Park in Bolivia and Puinawai National Park in Colombia, that are not yet detected by the algorithm. In these cases, direct real-time monitoring with satellites is still needed. These areas will soon be added to the AMW as mining “Hotspots” (MAAP#197).

This is also the case for river-based mining that does not cause a large footprint on the ground. Imagery with very high resolution has revealed active river barge mining in northern Peru (MAAP #189) and along the Colombia/Brazil border (MAAP#197). These areas will also soon be added to the AMW as mining “Hotspots.”

Gold mining in the Amazon is certain to stay a major issue in the coming years as gold prices continue to skyrocket, reaching over $3,000 an ounce in April 2025, driven by global economic uncertainty. While there are encouraging signs of effective enforcement in Brazil, governments here and across the region will have to compete with this rising financial incentive for mining activities.

Tools such as the Amazon Mining Watch, which will eventually publish quarterly updates of newly detected mining deforestation areas, can help governments, civil society, and local community defenders spot new fronts of gold mining and take action in near real-time. In a feature developed by Conservation Strategy Fund (CSF), it will also evaluate the economic costs of socio-environmental mining damages necessary for communities and managers to declare punitive damages.

The only dashboard of this kind to be fully regional in coverage, the AMW can also help foster regional cooperation, in particular in transfrontier areas where a lack of interoperability between official monitoring systems might hamper interventions that are aimed at combating a phenomenon that is linked to other nature crimes and is mostly controlled by international organized crime. 

In the coming years, the MAAP and AMW teams will continue to publish both quarterly and annual reports of the dynamic mining situation in each country and across the Amazon, in addition to confidential reports directly to governments and community leaders on the most urgent cases.

Notes

1. Note that in this report, we focus on mining activity that causes deforestation. The vast majority is artisanal or small-scale gold mining, but other mining activities have also been detected, such as iron, aluminum, and nickel mines in Brazil and Colombia. Additional critical gold mining areas in rivers that are not yet causing deforestation (such as in northern Peru, southeast Colombia, and northwest Brazil; see MAAP #197), are not included in this report. This information is not yet displayed in Amazon Mining Watch, but future updates will include river-based mining hotspots. 

2. Our data source for protected areas and Indigenous territories is from RAISG (Amazon Network of Georeferenced Socio-Environmental Information), a consortium of civil society organizations in the Amazon countries. This source (accessed in December 2024) contains spatial data for 5,943 protected areas and Indigenous territories, covering 414.9 million hectares across the Amazon.

Acknowledgments

We thank colleagues from partner organizations around the Amazon for helpful comments on the report, including: Earth Genome, Conservación Amazónica (ACCA & ACEAA) & Federación Nativa del Río Madre de Dios y Afluentes (FENAMAD), Fundación EcoCiencia, Fundación para la Conservación y el Desarrollo Sostenible (FCDS), and Instituto Centro de Vida (ICV) & Instituto Socioambiental (ISA).

This report was made possible by the generous support of the Gordon and Betty Moore Foundation.