MAAP #212: Machine learning to detect mining deforestation across the Amazon

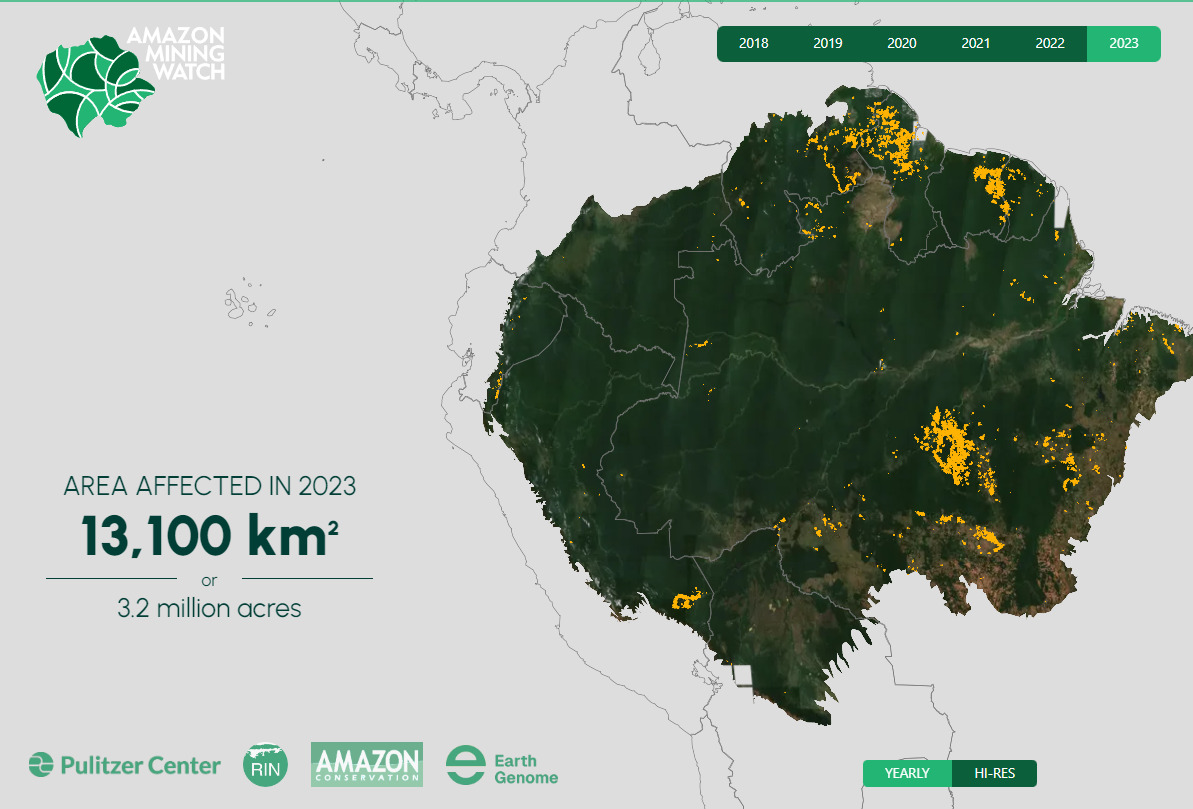
Amazon Mining Watch. Screen shot of the interactive mining deforestation map, displaying data for 2023.

Gold Mining is one of the major deforestation drivers across the Amazon.*

It often targets remote areas, thus impacting carbon-rich primary forests. Moreover, in most cases, this mining is illegal, given that it is occurring in protected areas and indigenous territories.

Given the vastness of the Amazon, however, it has been a challenge to accurately monitor mining deforestation across the entire biome in a timely manner.

Here we present, for the first time, the results of a new machine learning based tool (known as Amazon Mining Watch)  that analyzes satellite imagery archives to detect mining deforestation across the entire Amazon.

Specifically, the tool produces 10-meter resolution mining deforestation alerts based on the European Space Agency’s Sentinel-2 satellite imagery. The alerts currently cover each year annually from 2018 to 2023.

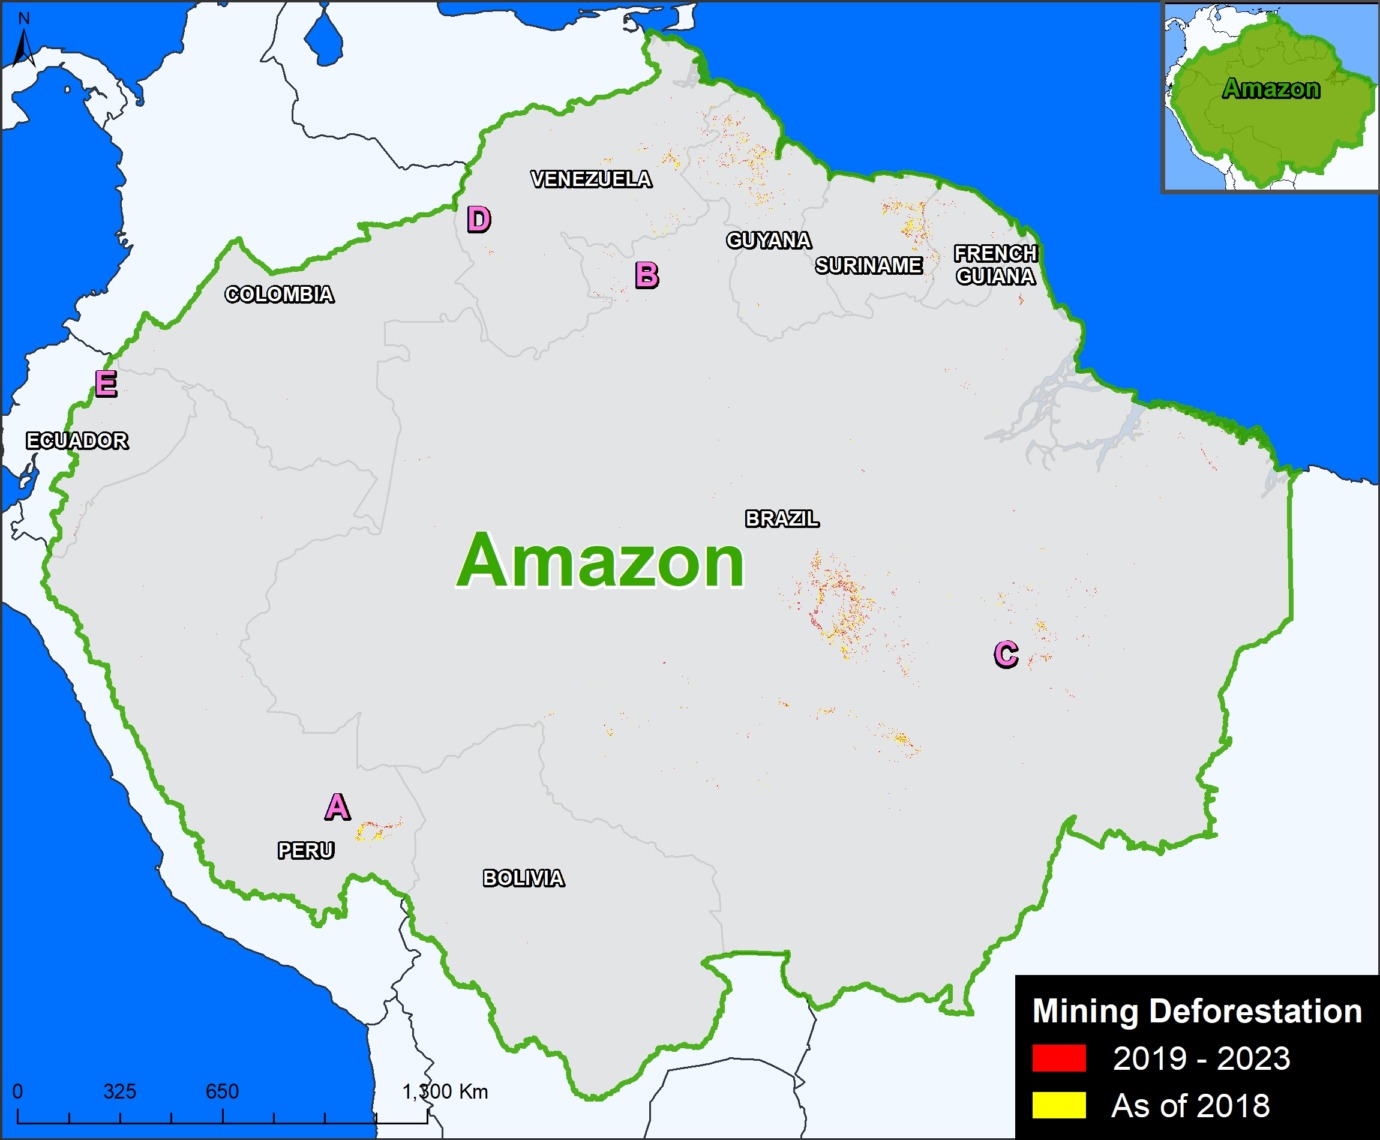
This data reveals that gold mining is actively causing deforestation in all nine countries of the Amazon Biome (see Base Map below). The countries with the most overall mining deforestation are 1) Brazil, 2) Guyana, 3) Suriname, 4) Venezuela, and 5) Peru.

*Note that in this report we focus on mining activity that is causing deforestation. Additional critical gold mining areas in rivers (such as in northern Peru, southeast Colombia, and northwest Brazil; see MAAP #197), are not included in this report or detected/displayed in Amazon Mining Watch.

Major Findings

The Base Map below presents the mining deforestation data across the entire Amazon. Note that yellow indicates the historical mining footprint as of 2018, while red indicates the more recent mining deforestation between 2019 and 2023.

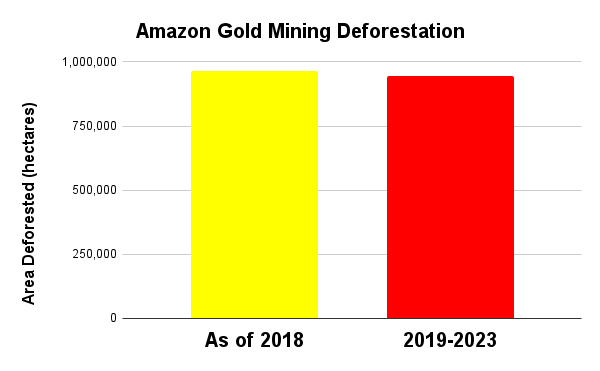
Although the alerts are pixels and not designed for precise area measurements, they can be used to give general estimates. For example, we estimate that as of 2018, there was a historical mining deforestation footprint of over 963,000 hectares across the entire Amazon. Between 2019 and 2023, we estimate that the mining deforestation footprint grew by over 944,000 hectares (2.3 million acres).

Thus, of the total accumulated mining deforestation footprint of over 1.9 million hectares (4.7 million acres), about half has occurred in just the past five years (see Annex).

In addition, we estimate that 38% (725,498 hectares) of the total mining deforestation occurred within protected areas and Indigenous territories.

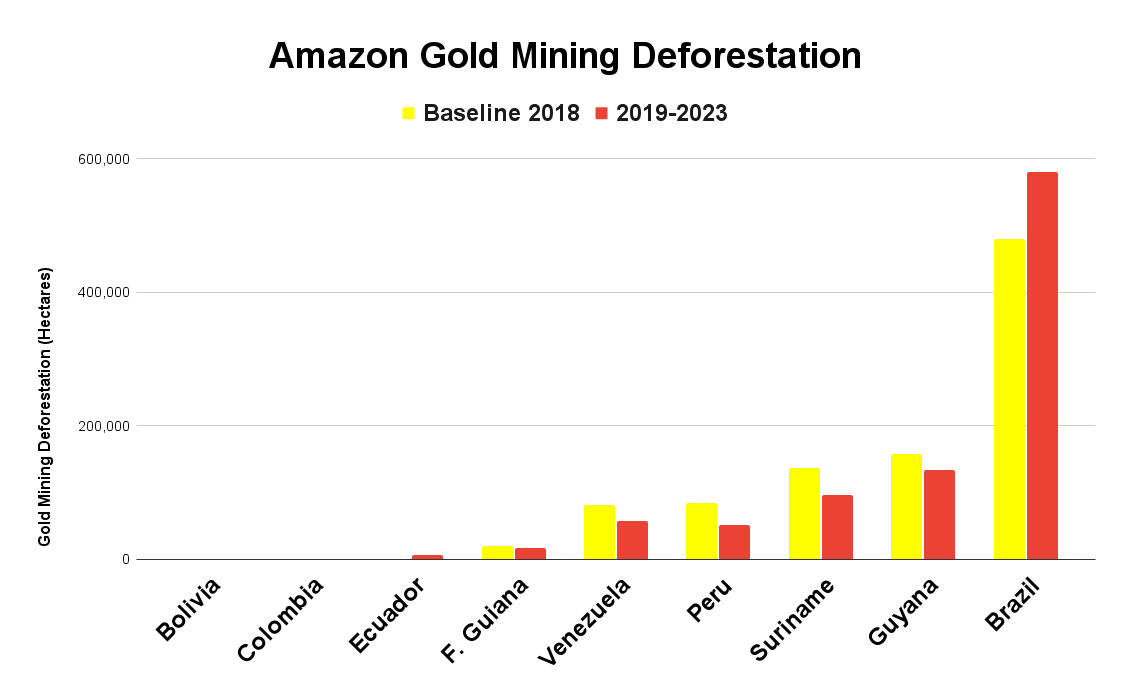
Graph 1 shows, of the total accumulated mining, over half has occurred in Brazil (55%, covering over 1 million hectares), followed by Guyana (15%), Suriname (12%), Venezuela (7%), and Peru (7%, covering 135,625 hectares).

Base Map. Mining deforestation across the Amazon, based on data from Amazon Mining Watch, for the years 2018-2023. Data: AMW, ACA/MAAP.
Graph 1. Mining deforestation across the Amazon, by country. Data: AMW, ACA/MAAP.

Case Studies

In this section, we show a number of case studies highlighting the power of this data to see the evolution of mining deforestation in the following critical areas (see Insets A-E on Base Map). In these examples, note that yellow indicates the historical mining footprint as of 2018, purple indicates the expansion from 2019-2021, and red indicates the more recent mining deforestation between 2022 and 2023.

A. Southern Peruvian Amazon
B. Brazilian Amazon – Yanomami Indigenous Territory
C. Brazilian Amazon – Kayapó Indigenous Territory
D. Venezuelan Amazon – Yapacana National Park
E. Ecuadorian Amazon – Punino zone

A. Southern Peruvian Amazon

In southern Peru is one of the largest, and likely most emblematic, mining sites in the Amazon (see Inset A in Base Map). Figure 1 shows the dynamic evolution in this area, from several large core mining zones as of 2018, with more recent concentration in the designated Mining Corridor (large area where small-scale mining is permitted by the government as part of a formalization process).

Overall, we recorded over 135,000 hectares (333,590 acres) of mining deforestation in this area. Of this total, 62% (84,000 ha) was present as of 2018, while 38% (51,000 ha) has occurred in just the past five years (2019-2023).

We also highlight that of the total mining deforestation (135,000 ha), 59% has occurred within the Mining Corridor, while 41% (55,000 hectares) is outside the corridor and likely illegal. Note how mining deforestation threatens several protected areas, especially Tambopata National Reserve and Amarakaeri Communal Reserve.

See MAAP #208 for more information about mining deforestation at this site, and how illegal mining also threatens Native Communities.
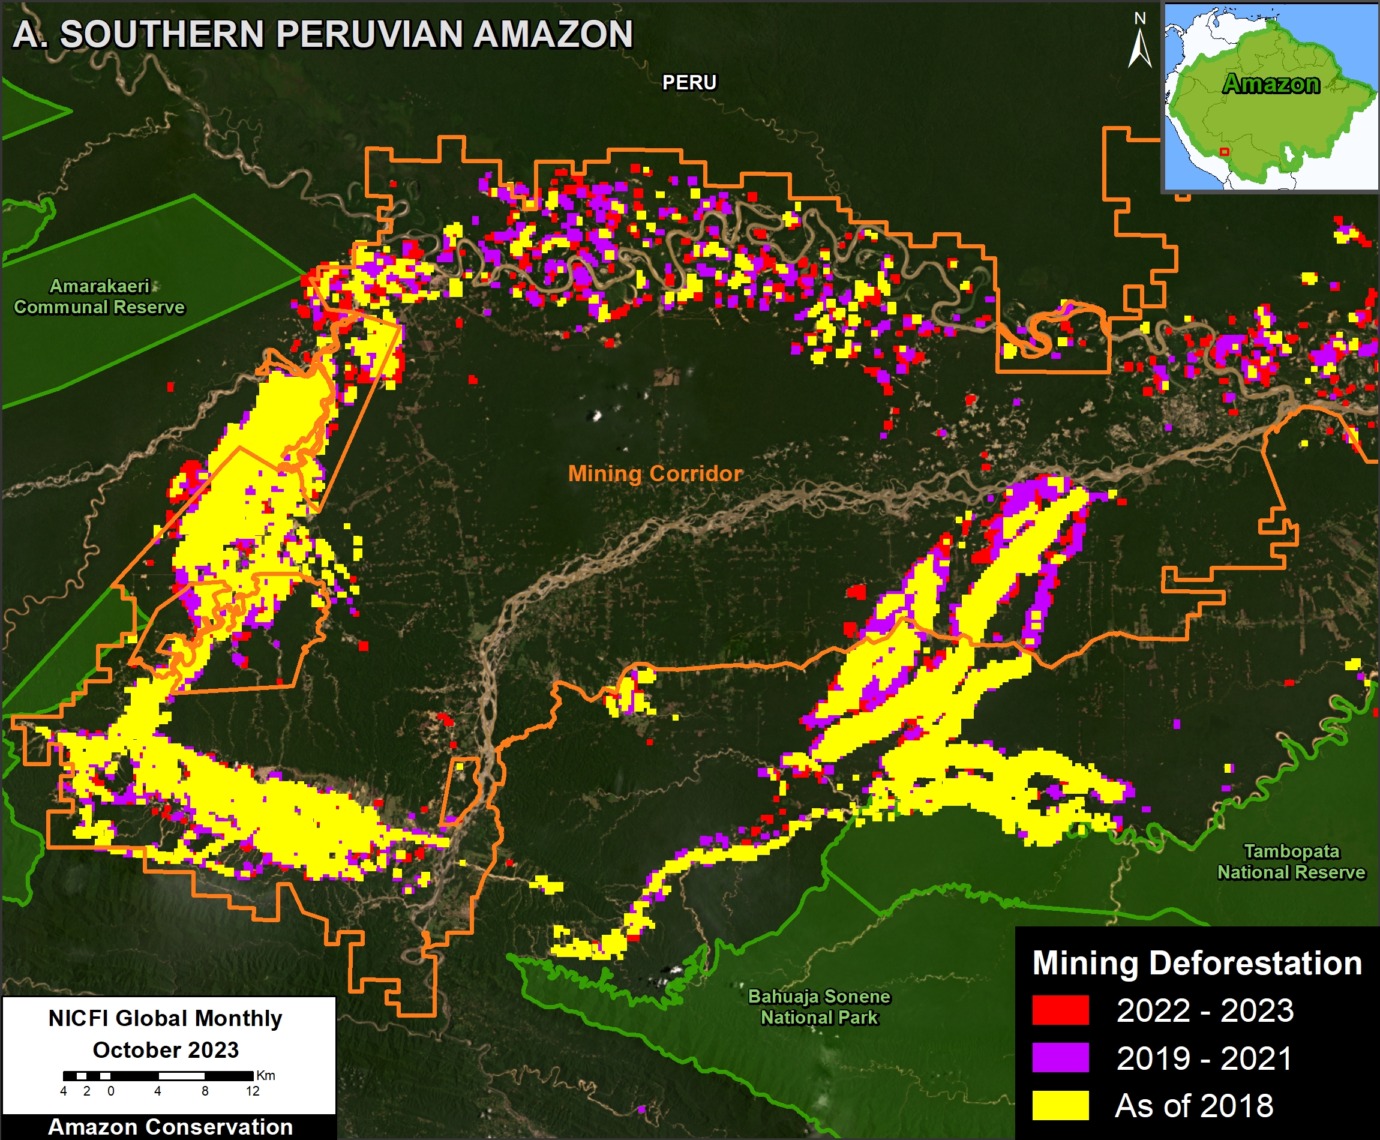
Figure 1. Evolution of mining deforestation in the southern Peruvian Amazon. Data: AMW, ACA/MAAP.

B. Brazilian Amazon – Yanomami Indigenous Territory

In the northern Brazilian Amazon, the national government recently launched a series of raids against illegal gold mining in Yanomami Indigenous Territory (see Inset B in Base Map). Figure 2 shows a major escalation and expansion of gold mining deforestation since 2018, especially along the Uraricoera and Mucajai Rivers.

Specifically, we documented the total mining deforestation of over 19,000 hectares (47,000 acres) in Yanomami Indigenous Territory. It is critical to emphasize that the vast majority (93%) has occurred in just the past five years (2019-2023).

See MAAP #181 for more information about mining deforestation at this site.
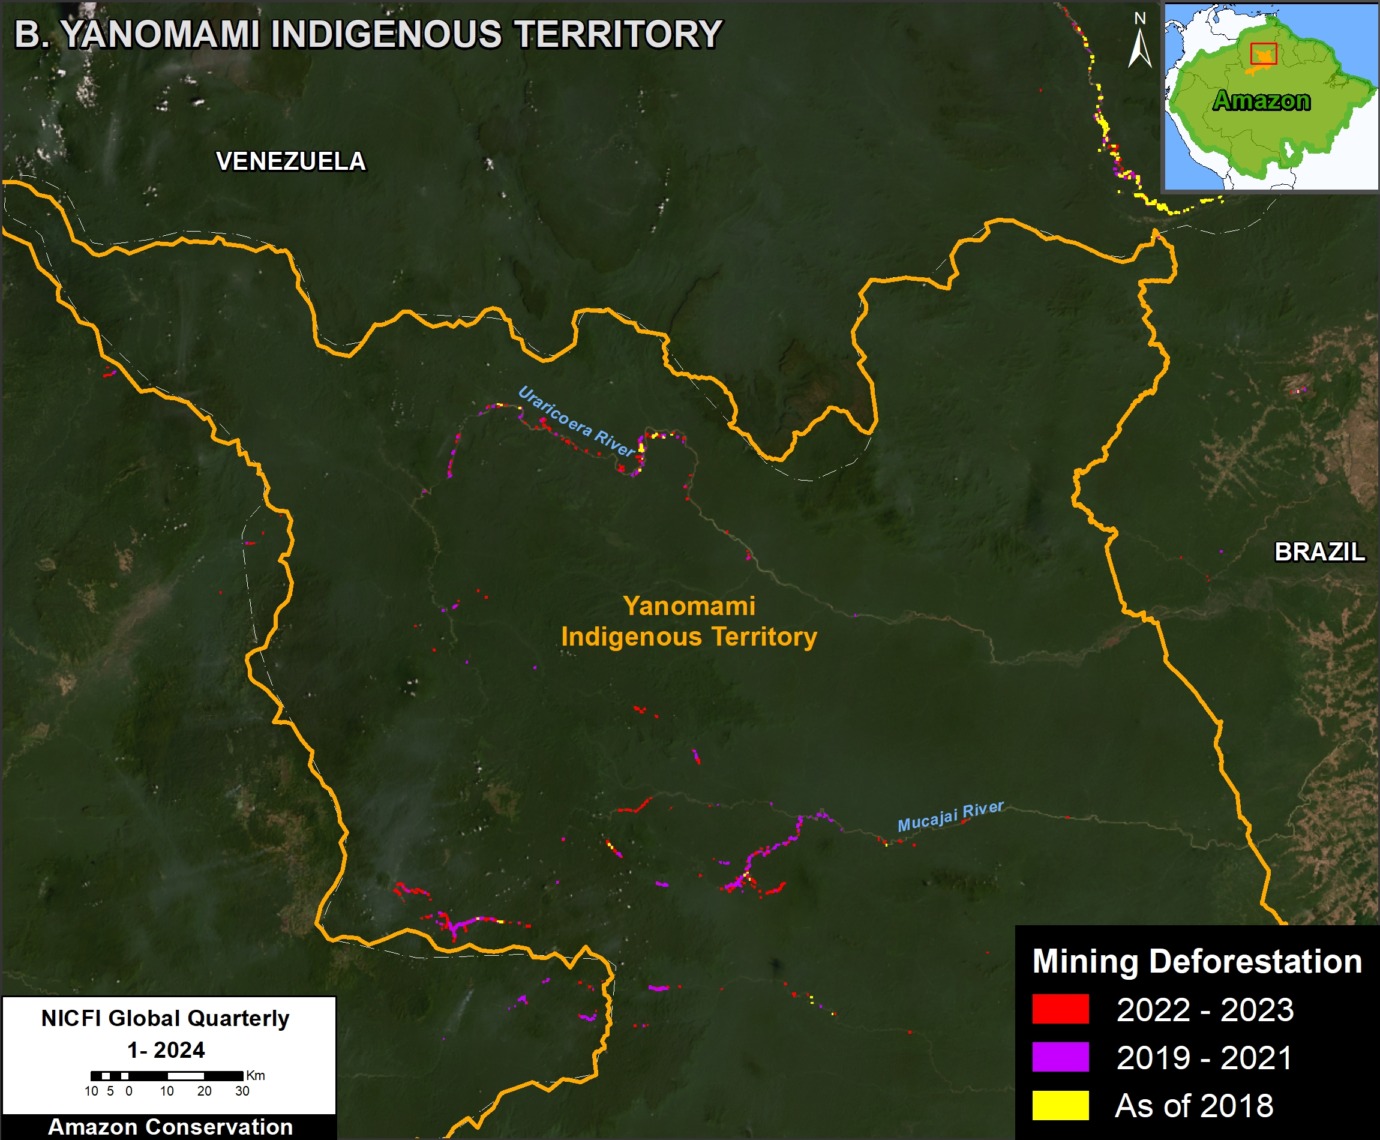
Figure 2. Evolution of mining deforestation in Yanomami Indigenous Territory in Brazil. Data: AMW, ACA/MAAP.

C. Brazilian Amazon – Kayapó Indigenous Territory

In the eastern Brazilian Amazon, the Kayapó Indigenous Territory is also facing ongoing illegal mining (see Inset C in Base Map). Figure 3 shows the continuing expansion of mining deforestation, mostly in the eastern section of the territory.

We documented the total mining deforestation of nearly 50,000 hectares (123,550 acres) in Kayapó Indigenous Territory. Of this total, 60% (30,000 has) has occurred in just the past five years (2019-2023).

See MAAP #116 for more information about mining deforestation at this site, along with nearby Munduruku Indigenous Territory.
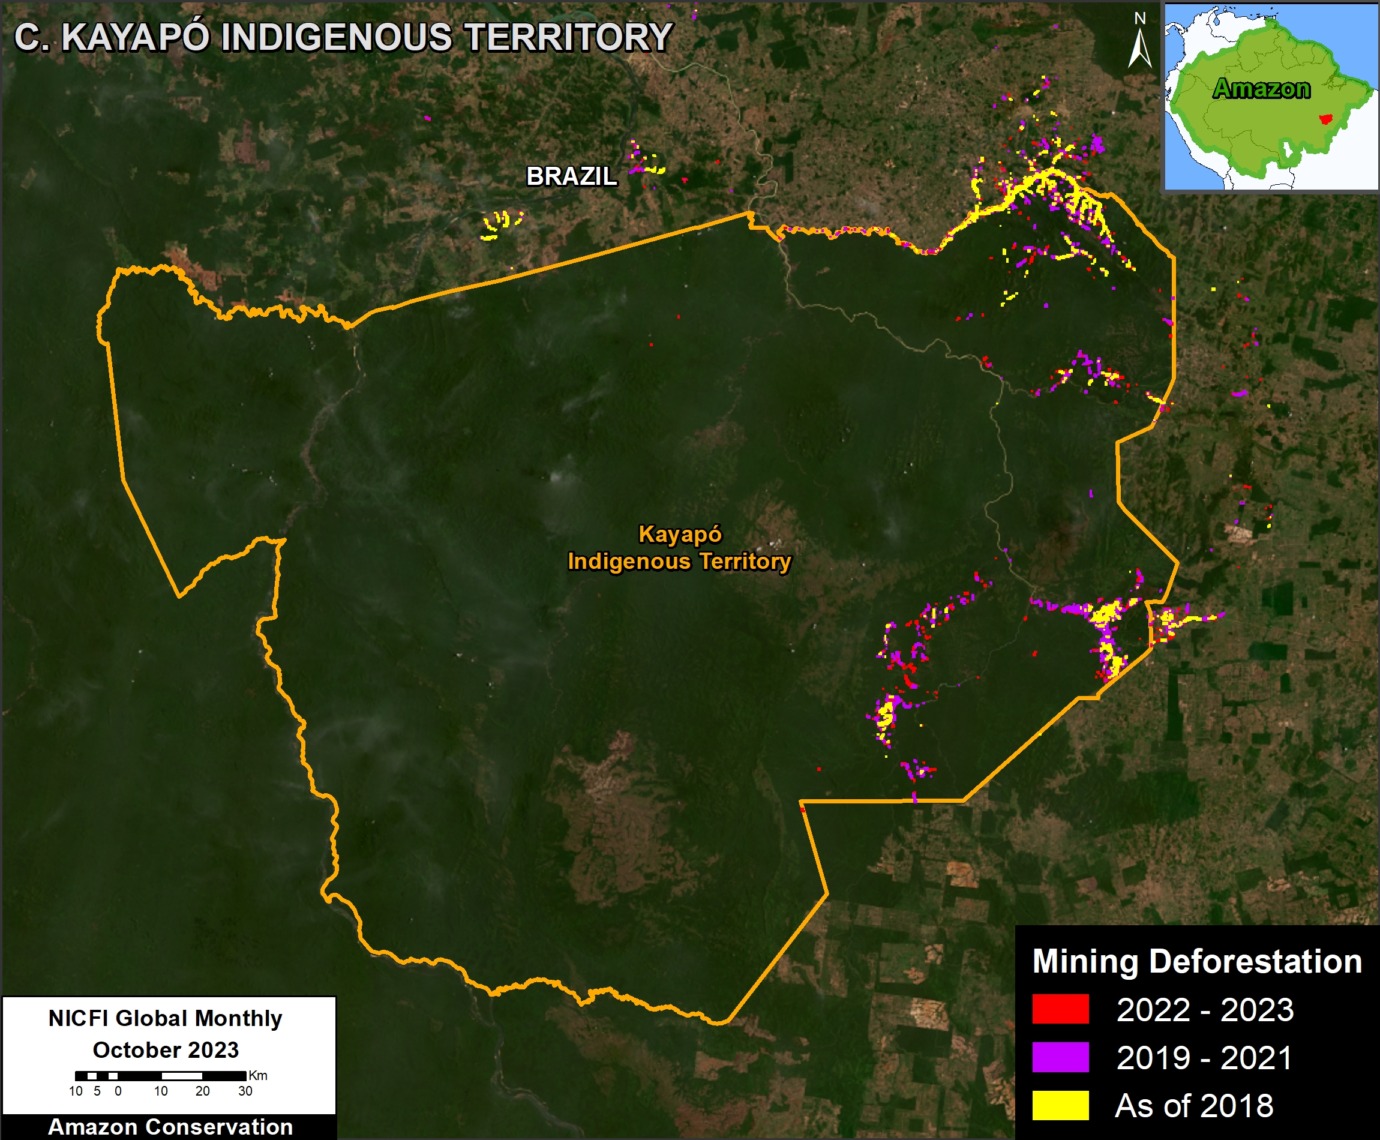
Figure 3. Evolution of mining deforestation in Kayapo Indigenous Territory in Brazil. Data: AMW, ACA/MAAP.

D. Venezuelan Amazon – Yapacana National Park

In Venezuela, we see the continued expansion of mining deforestation in Yapacana National Park (see Inset D in Base Map). Indeed, Figure 4 shows the steady expansion of gold mining deforestation at several sites in the southern section of the protected area.

We documented the total mining deforestation of over 6,000 hectares (14,800 acres) in Yapacana National Park. Of this total, just over half (52%; 3,000 has) has occurred in just the past five years (2019-2023).

See MAAP #173 and MAAP #207 for more information about mining deforestation at this site.
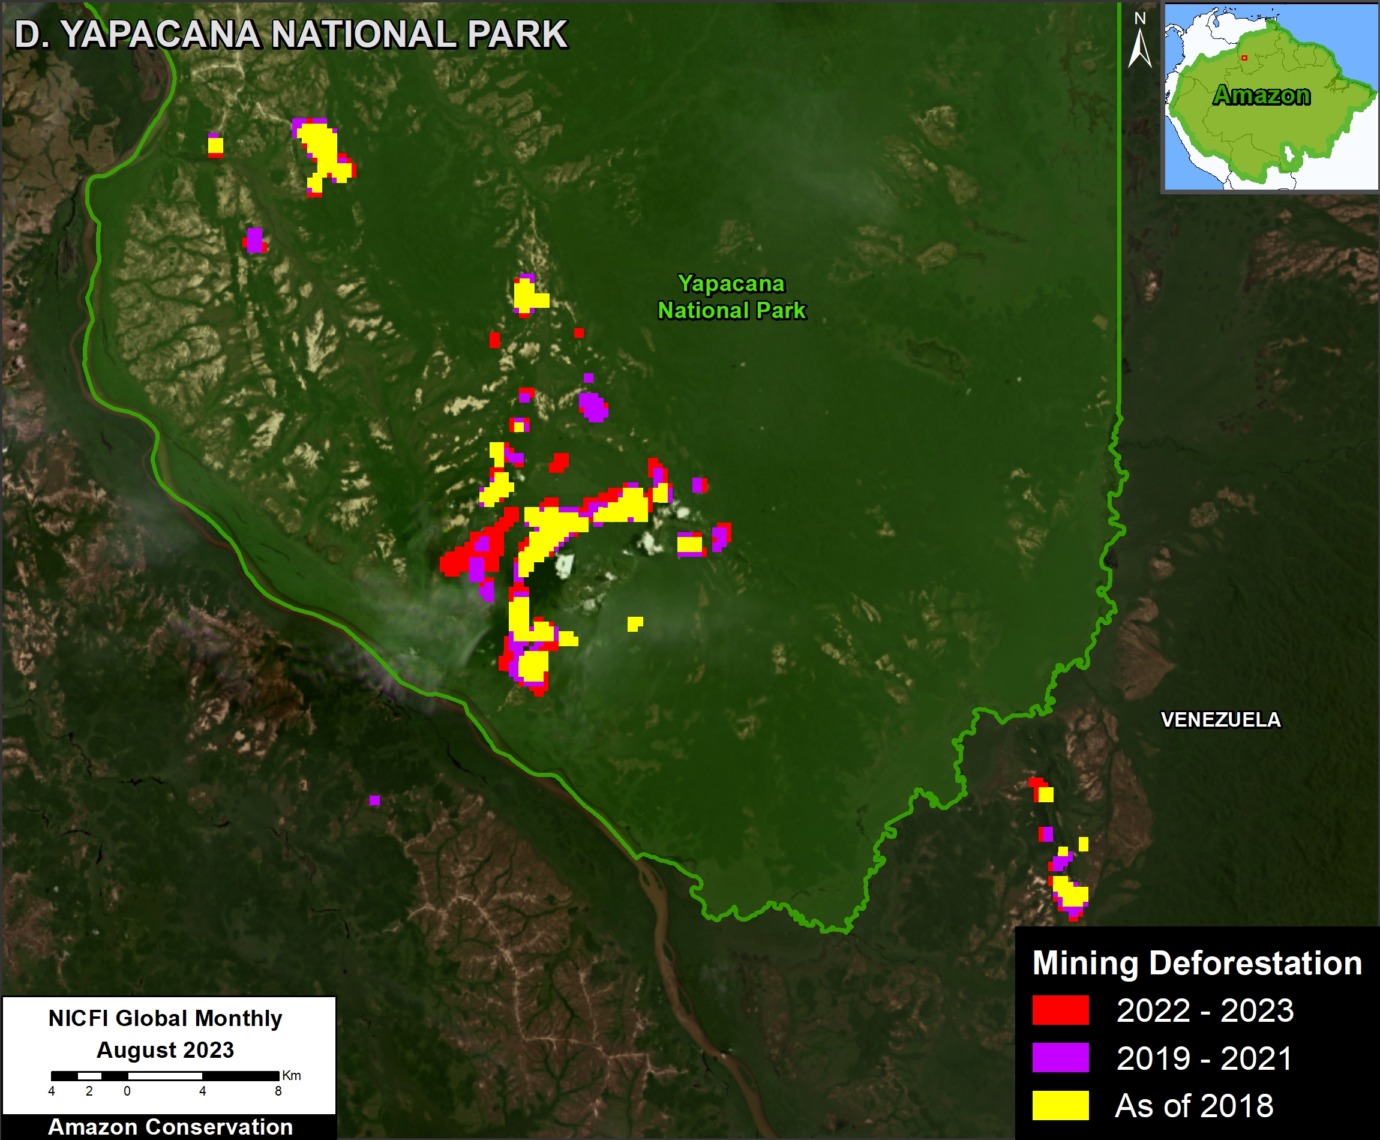
Figure 4. Evolution of mining deforestation in Yapacana National Park in Venezuela. Data: AMW, ACA/MAAP.

E. Ecuadorian Amazon – Punino River

In a series of reports, we have been showing the rapid increase in mining deforestation in the Ecuadorian Amazon (see MAAP #182). One of the main sites is around the Punino River in northern Ecuador (see Inset E in Base Map). Figure 5 shows the sudden emergence of gold mining deforestation near the river.

We documented the total mining deforestation of over 500 hectares (1,235 acres) in the Punino River area. Of this total, 100% is new, all starting in 2023.

See MAAP #206 for more information about mining deforestation at this site.
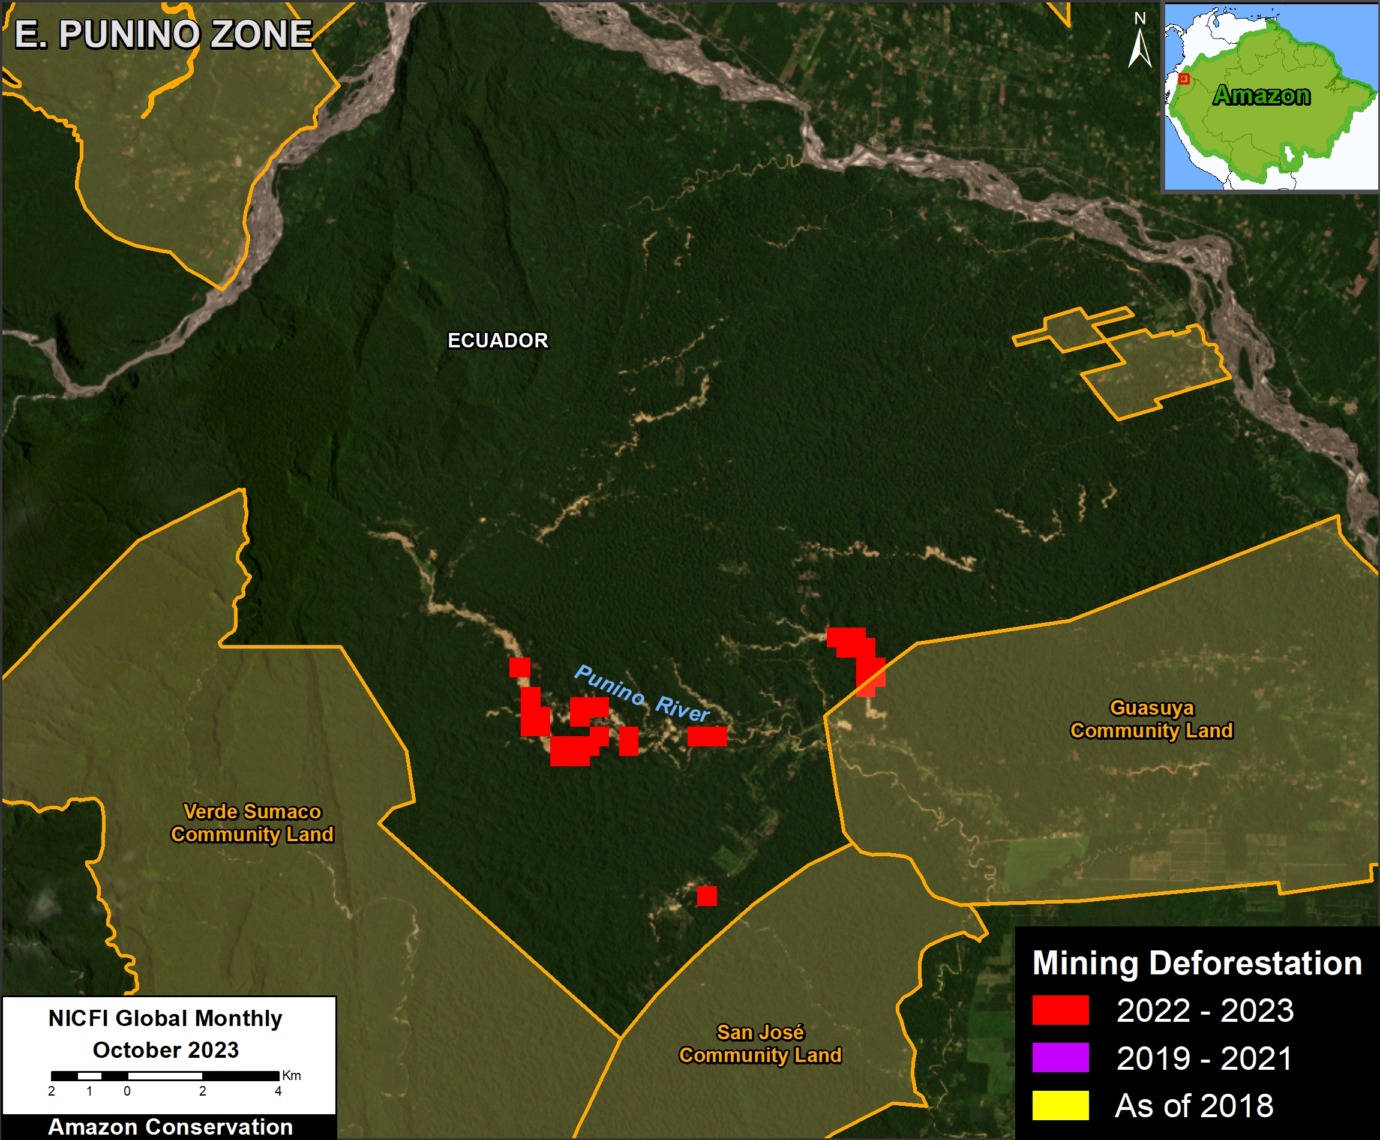
Figure 5. Evolution of mining deforestation in along the Punino River in Ecuador. Data: AMW, ACA/MAAP.

Annex

As noted above, of the total accumulated mining deforestation footprint of over 1.9 million hectares (4.7 million acres), about half has occurred in just the past five years.
Methods

All data for this report were obtained from Amazon Mining Watch. We only utilized patches with greater than 0.6 mean score. We used the 2018 data as our baseline. For 2019, we masked the previously reported 2018 data to only highlight the new mining that year. We then repeated this process for each subsequent year. For example, the 2023 data masked the 2018-2022 data, indicating only new mining deforestation that year.

Citation

Finer M, Ariñez A (2024) Machine learning to detect mining deforestation across the Amazon. MAAP: #212.
MAAP #196: Mining Impacts Calculator: Analysis in 3 Indigenous Communities of the Southern Peruvian Amazon

Website of the Gold Mining Impact Calculator developed by CSF.

Illegal gold mining has generated massive deforestation in the southern Peruvian Amazon (MAAP #208). This activity also affects several of the main rivers (such as the Madre de Dios, Inambari, Tambopata, Malinowski and Colorado), and also their tributaries and secondary bodies of water. All of them are contaminated by excess sediment and the presence of toxic substances such as mercury and arsenic, which are dumped during the mineral extraction process.

Thus, illegal mining activity generates large economic losses due to the direct impact on ecosystem services and other more sustainable economic activities.

Quantifying these impacts in monetary terms has been a challenge for national authorities lacking adequate instruments capable of establishing economic values of the impact generated by illegal mining activity in the Amazon. In this context, in 2021 the Mining Impacts Calculator was presented, a digital economic valuation tool developed by the organization Conservation Strategy Fund (CSF). This tool allows users to calculate the social and environmental impact of illegal gold mining in the Amazon1, in order to improve decision-making, and establish changes and/or improvements in the regulatory framework around this activity.

This report shows the results of the application of the Calculator in recent (2022 and 2023) illegal mining areas within 3 native communities, all located in the buffer zone of the Amarakaeri Communal Reserve in southern Peru. This is an effort to show from a comprehensive perspective (economic and environmental) the implications of deforestation due to illegal mining in the Peruvian Amazon.

The economic calculations of the socio-environmental impacts were carried out using the Gold Mining Impact Calculator. The results show that from the beginning of 2022 to August 2023, there was a total economic loss amounting to 593 million dollars ($593,786,943) for the socio-environmental impacts, generated by deforestation, sedimentation and contamination of rivers by mercury in three indigenous communities of Madre de Dios. The details about the data that was entered into this tool to obtain the results mentioned in the report are explained in the methodology section.

Base Map

The Base Map shows the location of the case studies of this report, which is focused on quantifying the impact of illegal mining, through economic valuation, in 3 native communities in the buffer zone of the Amarakaeri Communal Reserve: San José de Karene, Puerto Luz, and Barranco Chico, all located in the province of Manu, department of Madre de Dios. Additionally, on the map, you can see historical, recent, and current deforestation.

Base Map. Location of the 3 native communities of the Amarakaeri Communal Reserve that are part of the study. Data: ACA/ACCA.

Impact in the San José de Karene Native Community

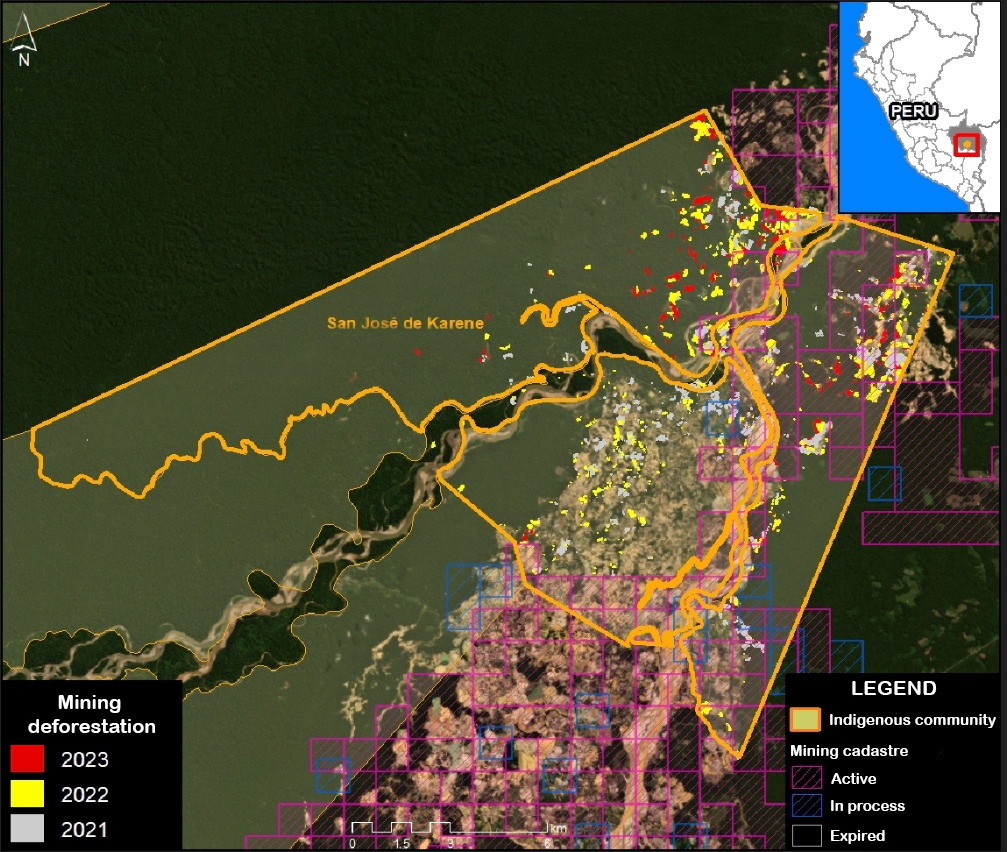
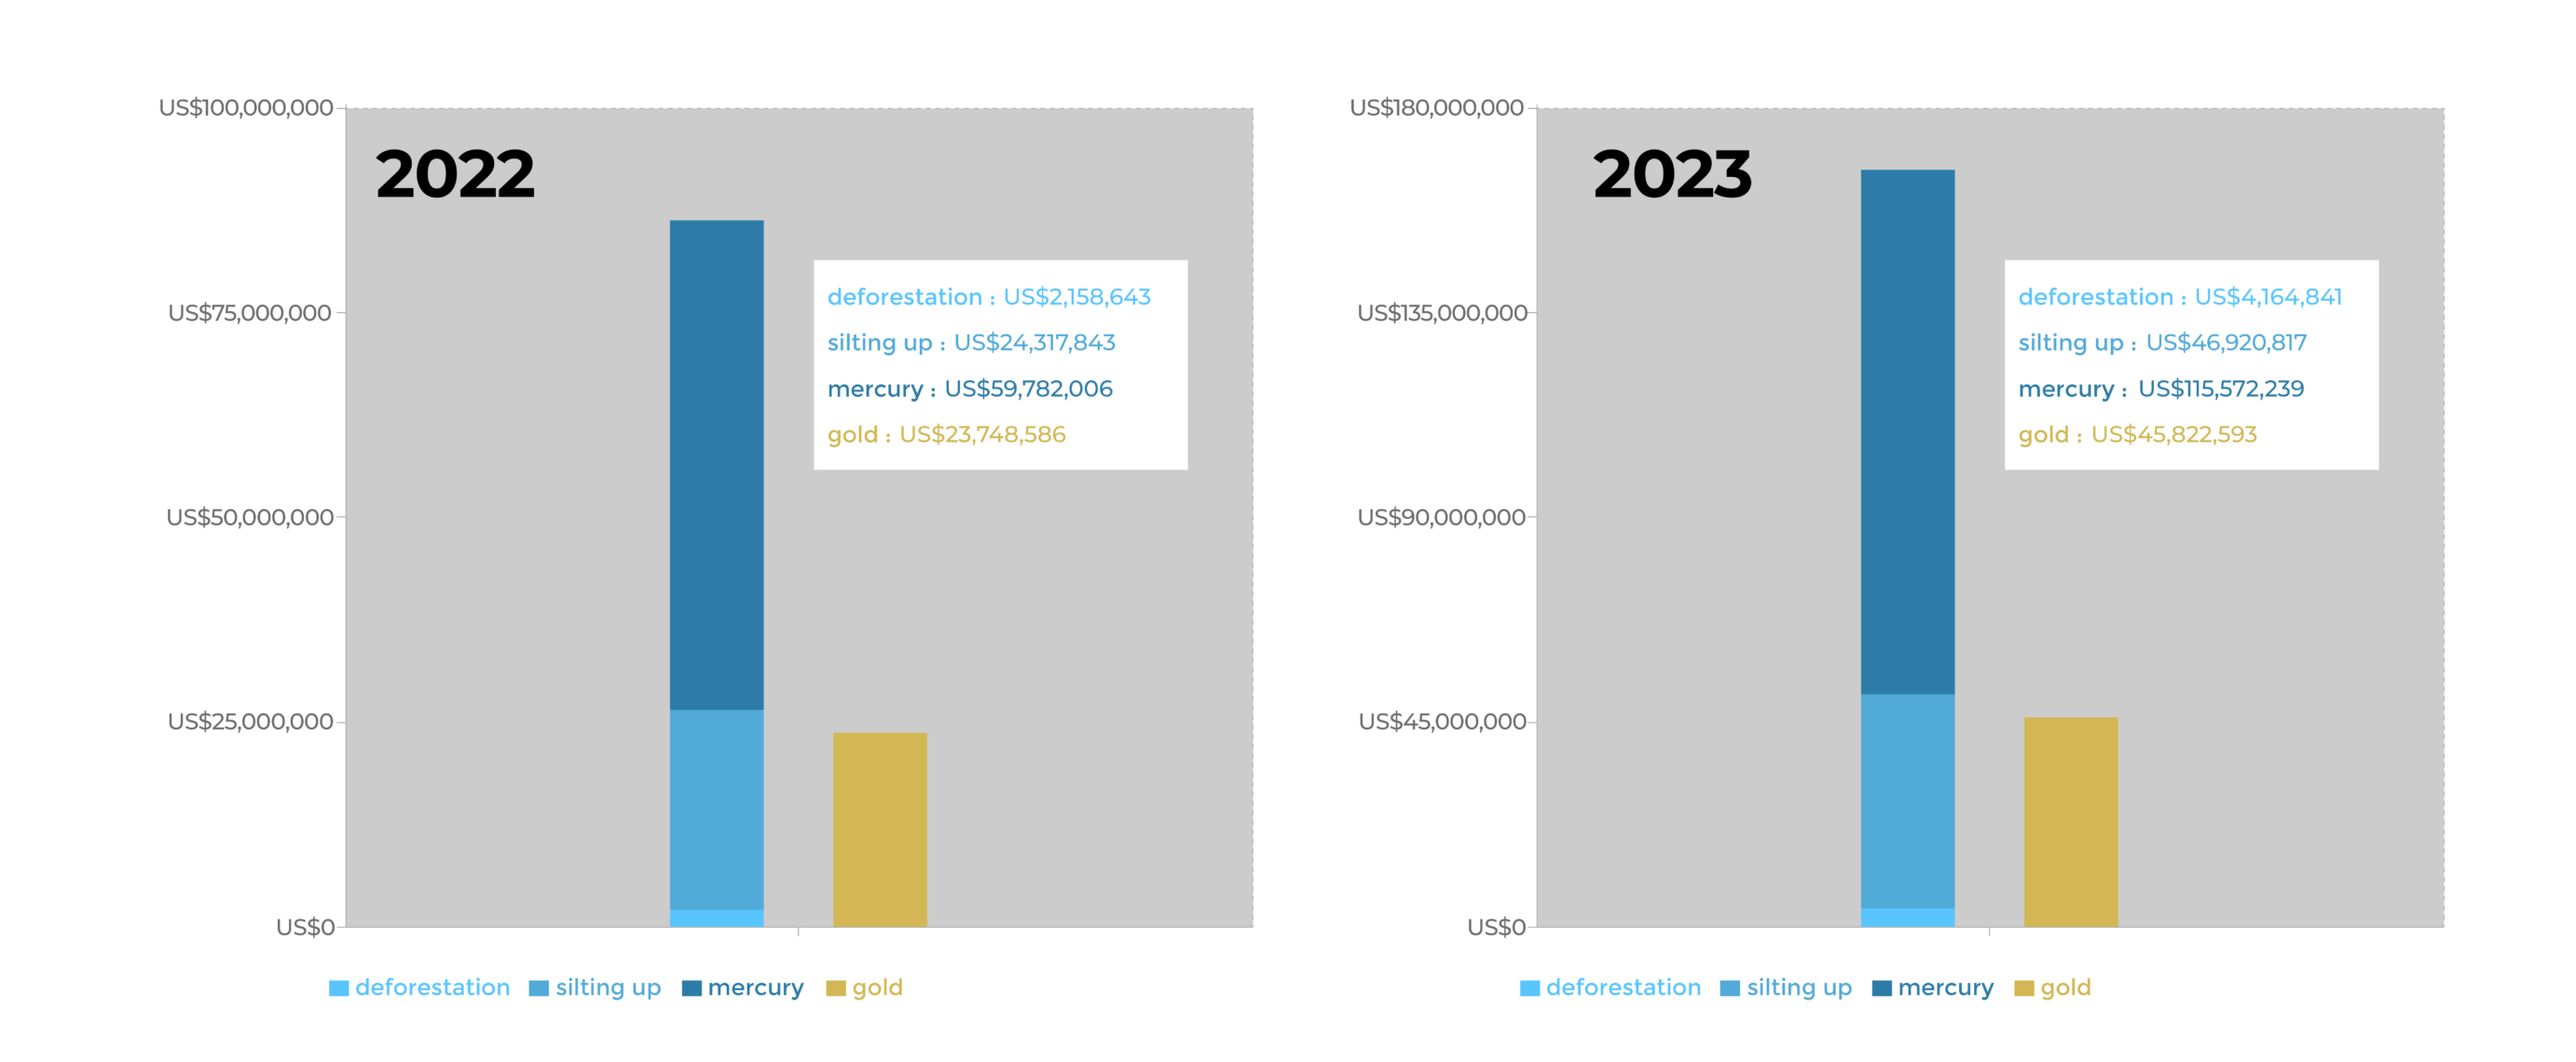
The native community of San José de Karene has lost 914 hectares from 2022 to August 2023 (See Map 2). In 2022, they lost 312 hectares and so far in 2023, until the month of August, 602 new hectares have been lost. It should be noted that the community currently has mining rights that overlap with its communal territory. When applying the Gold Mining Impact Calculator, it can be seen that the total socio-environmental impacts for 2022 were 86 million dollars ($86,258,492). On the other hand, so far in 2023, this figure increased significantly, reaching 166 million dollars ($166,657,897), as can be seen in Figure 1.

Map 2. Location of areas deforested by illegal mining in the San José de Karene native community (for 2022 and 2023, until August). Data: ACA.
Figure 1. Results of the Gold Mining Impact Calculator in the San José de Karene native community for the year 2022 and 2023 (until August). Source: Screenshot of the Gold Mining Impact Calculator.

Impact in the Puerto Luz Native Community

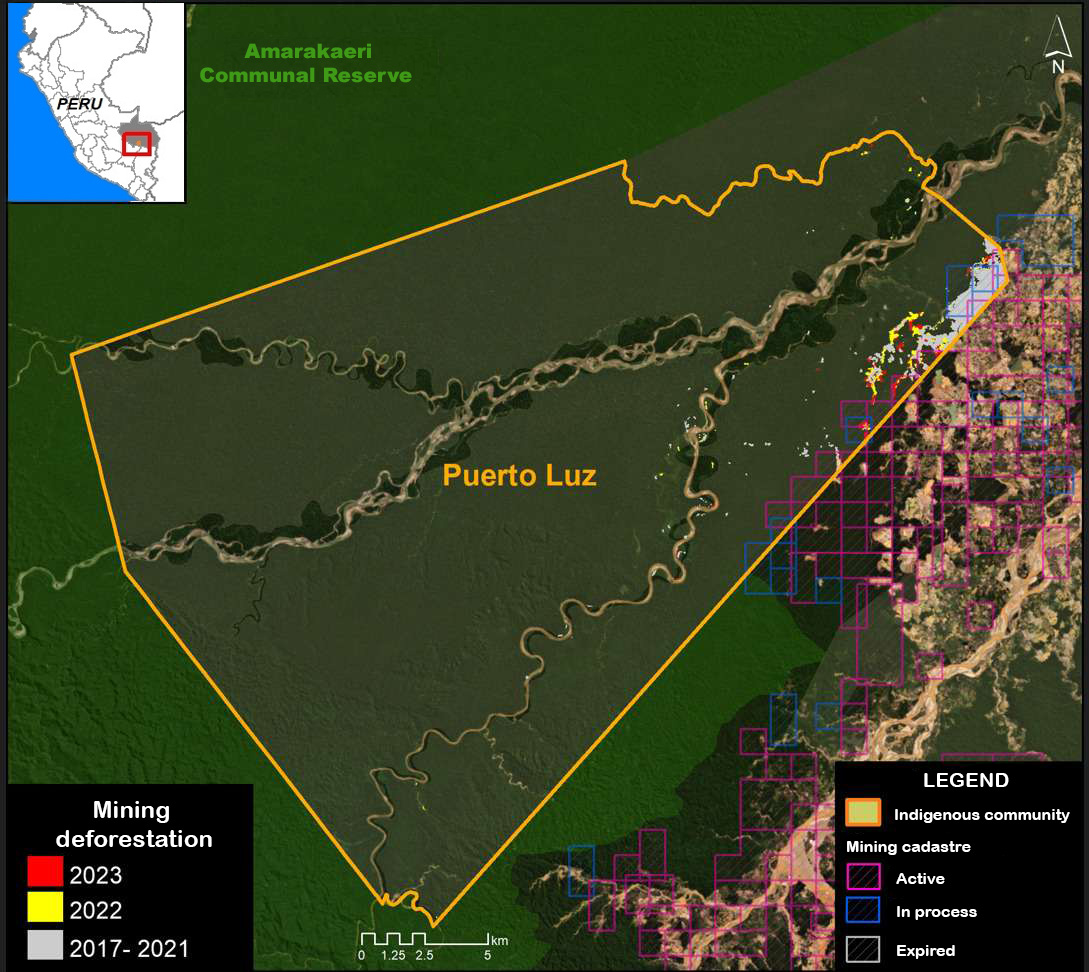
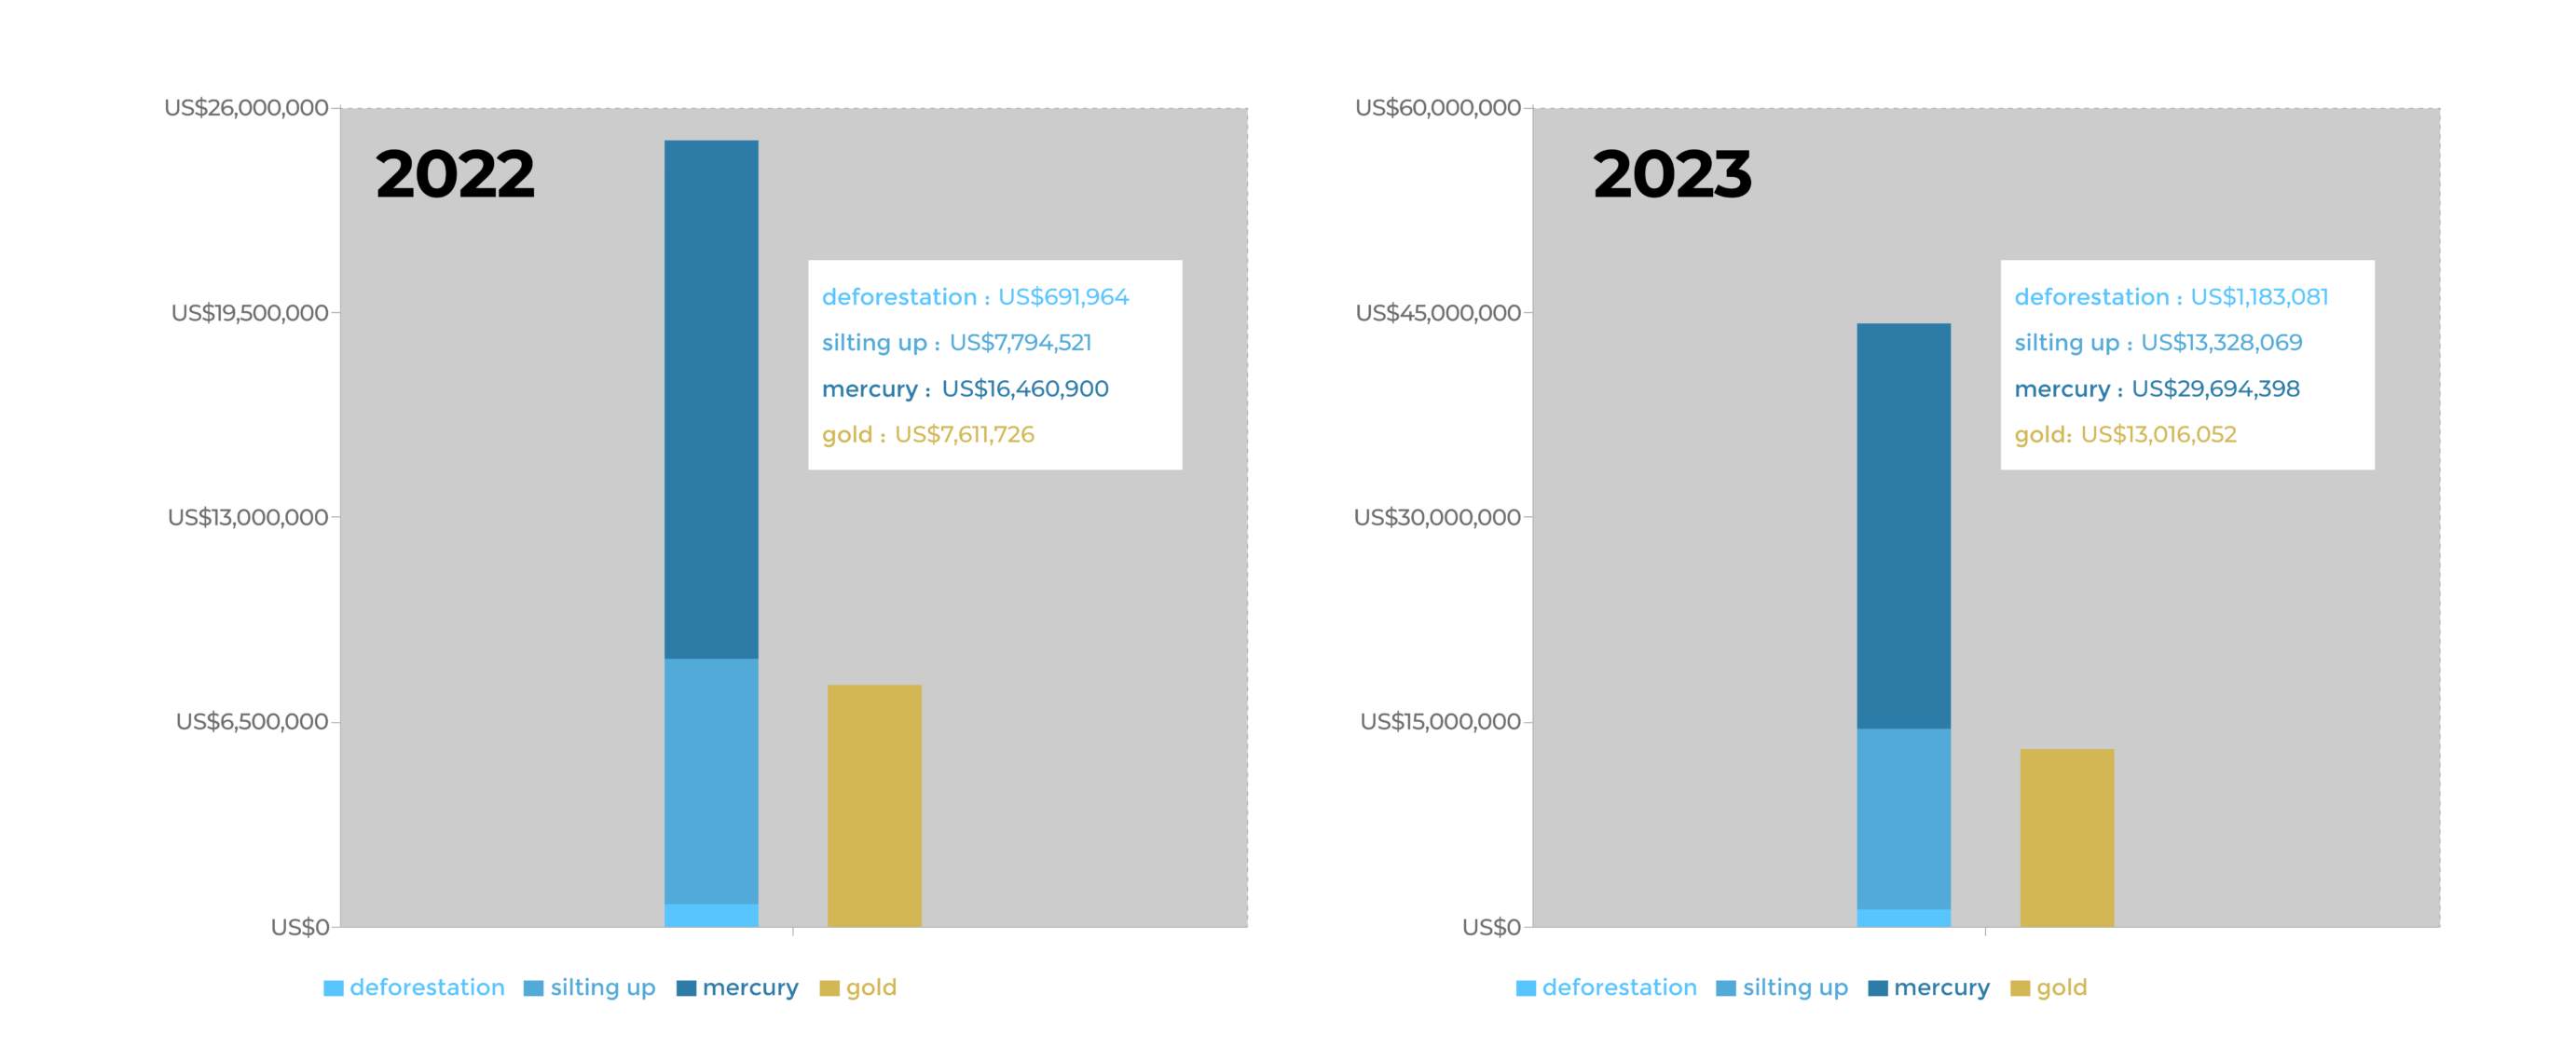
The native community of Puerto Luz has lost 270.6 hectares between 2022 and August 2023 (See Map 3). In 2022, they lost 100 hectares and so far from 2023 until the month of August they have lost 170.6 new hectares. The community currently has mining rights that overlap with its communal territory. Applying the tool, it is estimated that the total socio-environmental impacts for 2022 were 24 million dollars ($24,947,385), while so far in 2023 it was 44 million dollars ($44,205,548).

Map 3. Location of areas deforested by illegal mining in the Puerto Luz native community (for 2022 and 2023, until August). Data: ACA.

Figure 2. Results of the Calculator at the Puerto Luz native community for the year 2022 and the year 2023 (until August). Source: Screenshot of the Gold Mining Impact Calculator.

Impact in the Barranco Chico Native Community

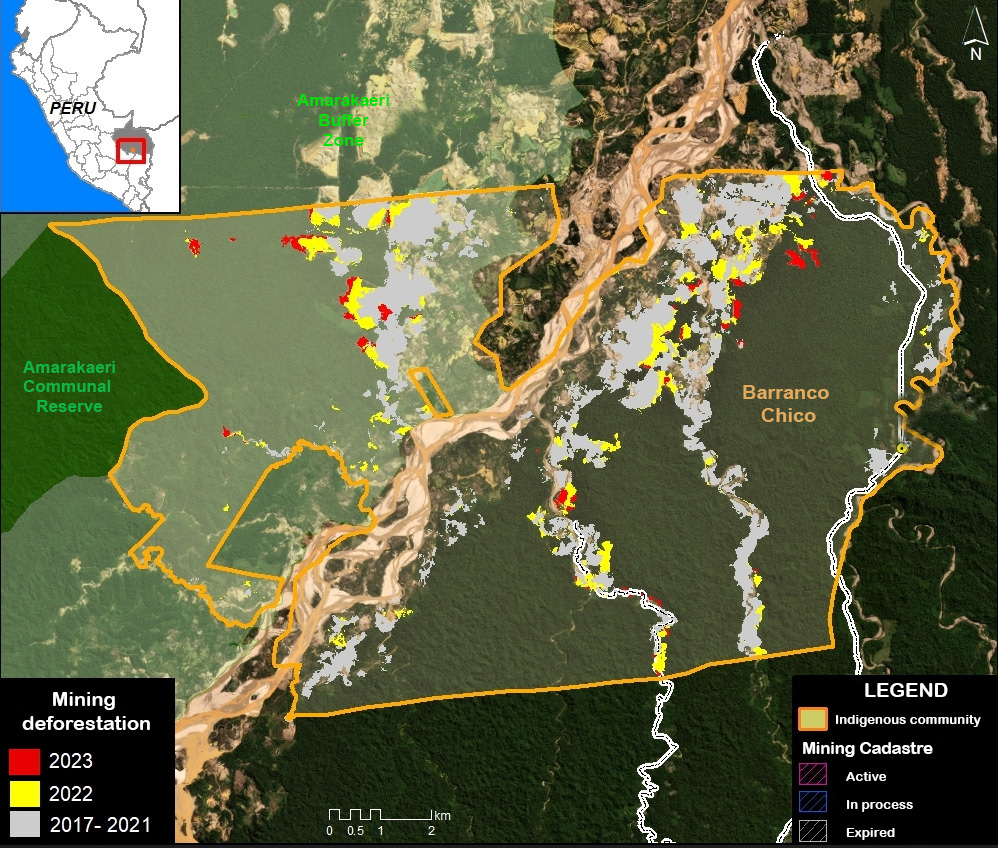
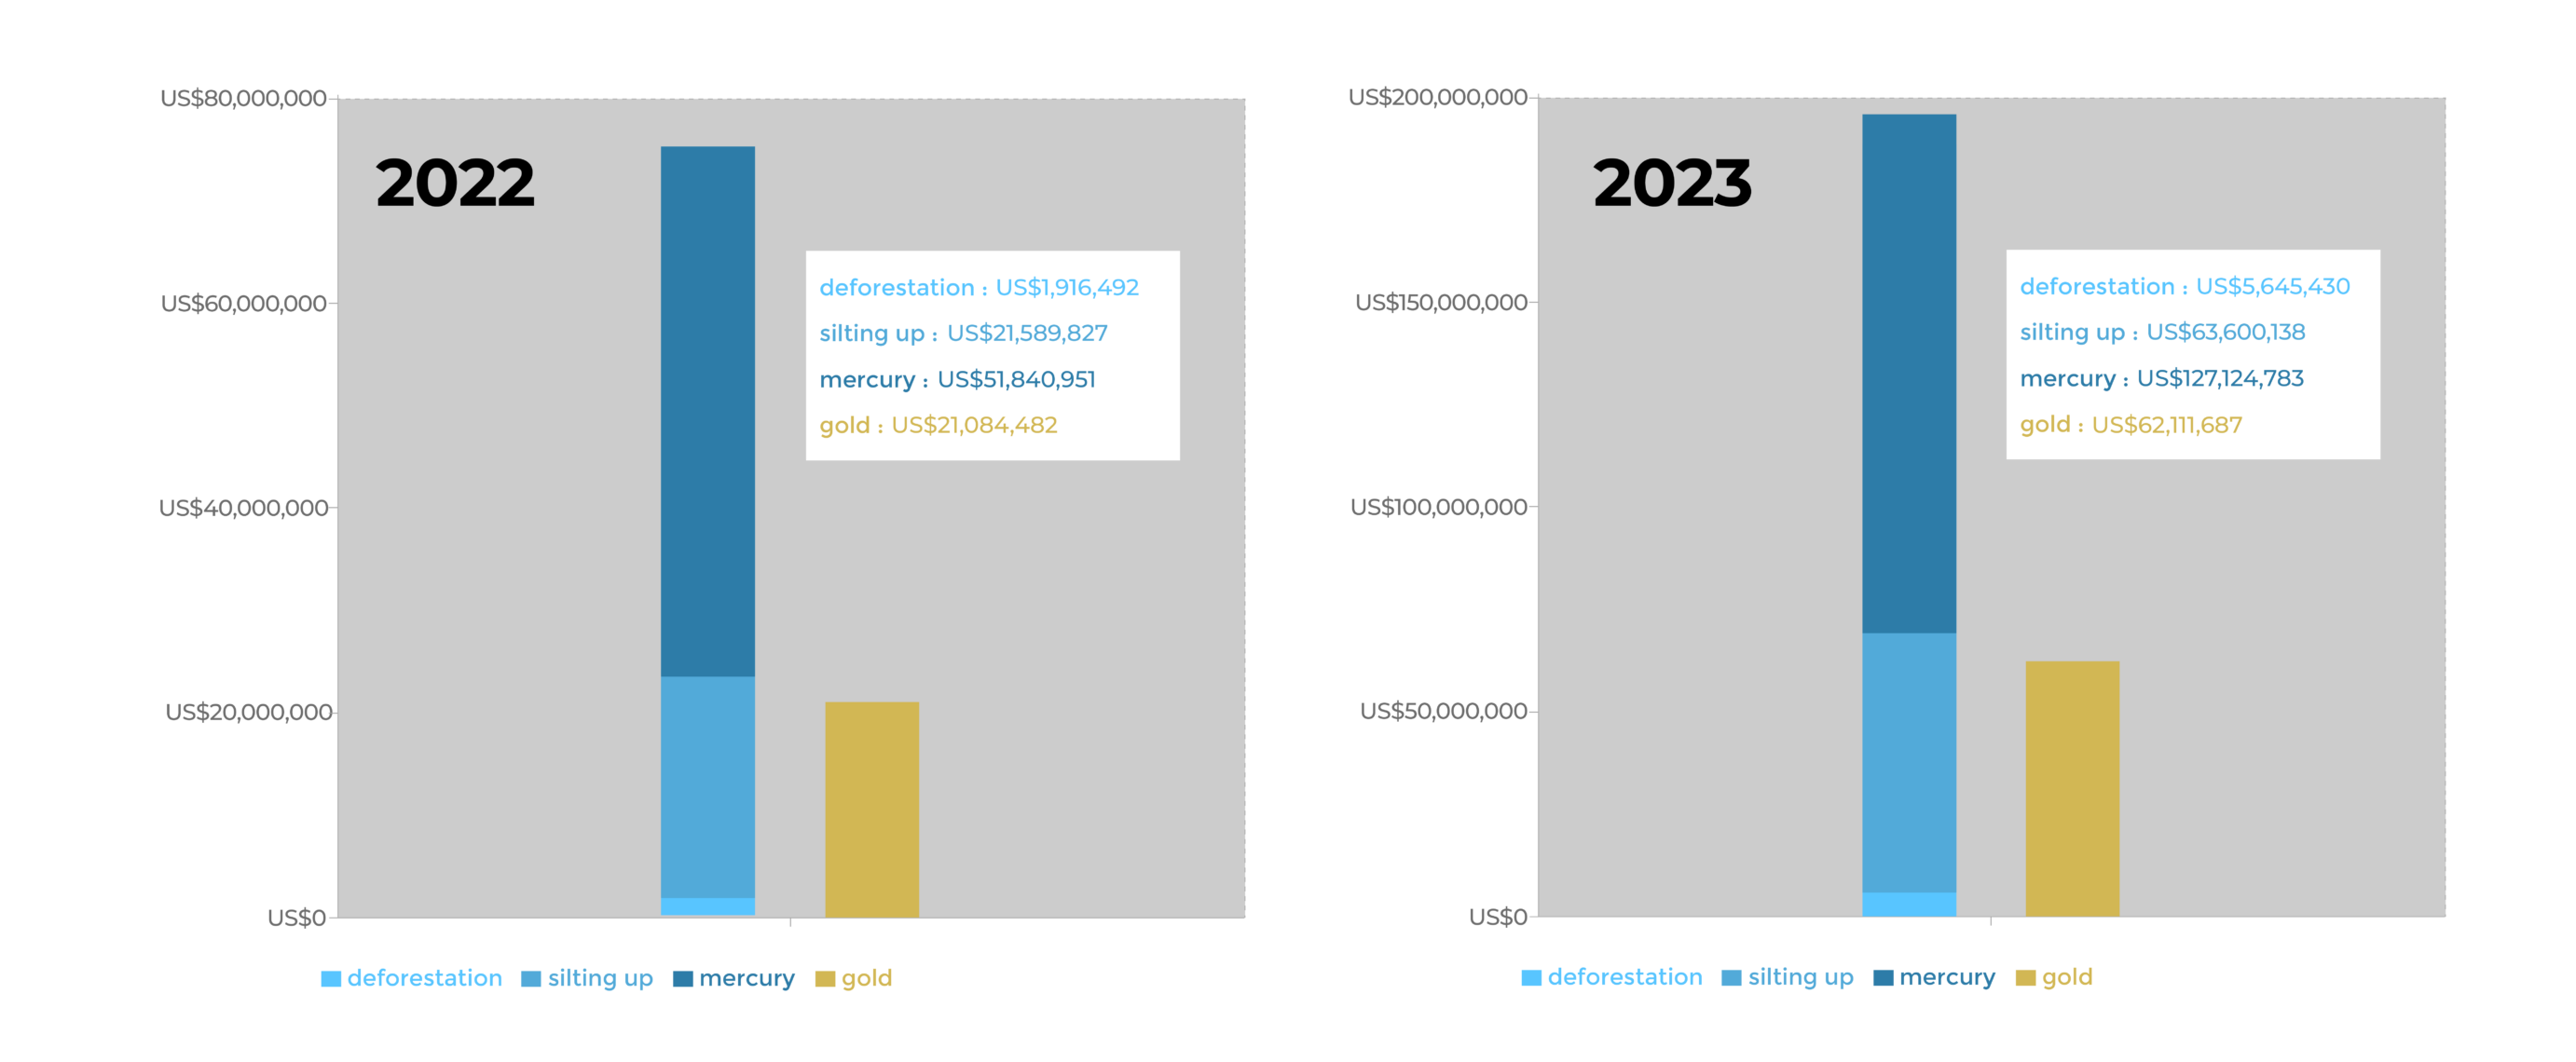
The native community of Barranco Chico has lost 1093.3 hectares from 2022 to August 2023 (See Map 4). In 2022, they lost 277.3 hectares and so far from 2023 until the month of August they have lost 816 new hectares. The community currently has mining rights that overlap with its communal territory. Applying the Gold Mining Impact Calculator, it is observed that the total socio-environmental impacts for 2022 were 75 million dollars ($75,347,270), while so far in 2023 (August) it was 196 million dollars ( $196,370,351).

Map 4. Location of areas deforested by illegal mining in the native community Barranco Chico, Data: ACA.
Figure 3. Results of the Calculator for the Barranco Chico native community for the year 2022 and the year 2023 (until August). Source: Screenshot of the Gold Mining Impact Calculator.

Metodology

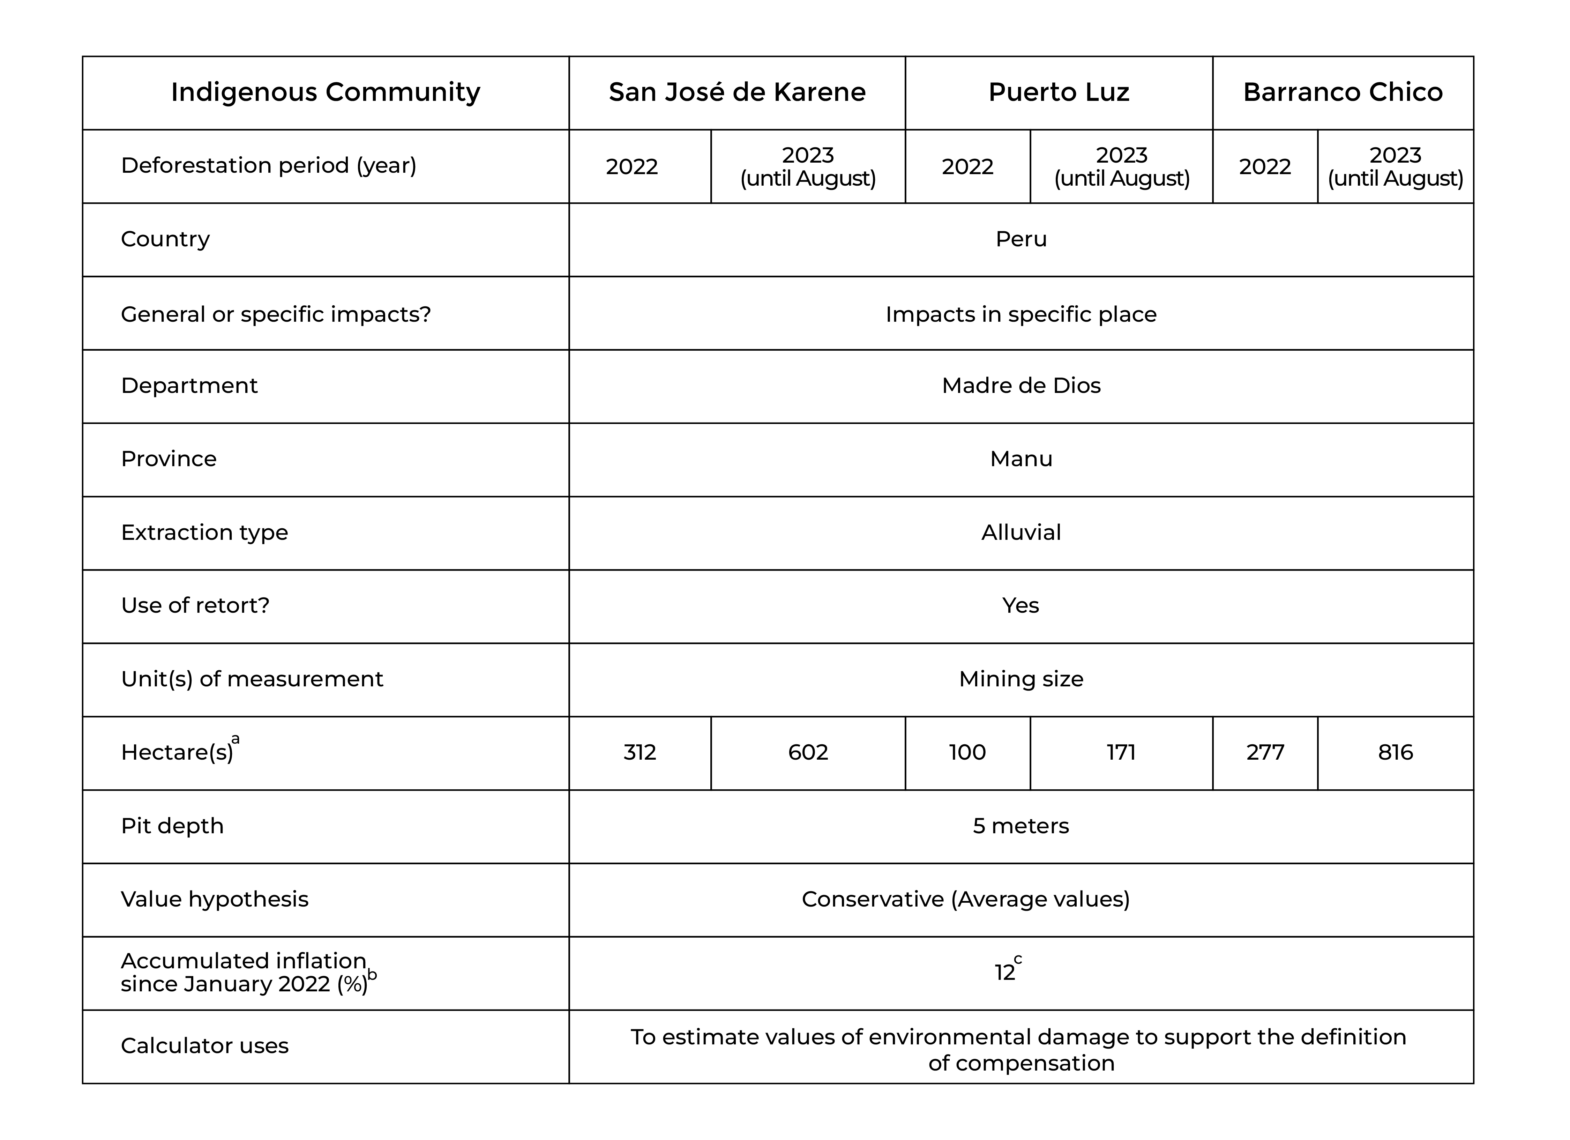
See the Spanish version of this report for full methodology and notes. The inputs to the calculator were as follows:

Acknowledgments

This report was prepared with the technical support of USAID through the Prevent Project. Prevent (Proyecto Prevenir in Spanish) works with the Government of Peru, civil society, and the private sector to prevent and combat environmental crimes for the conservation of the Peruvian Amazon, particularly in the regions of Loreto, Madre de Dios, and Ucayali.

Disclaimer: This publication is made possible by the generous support of the American people through USAID. The contents are the sole responsibility of the authors and do not necessarily reflect the views of USAID or the United States Government.

The CSF Gold Mining Impact Calculator is a tool based on scientific evidence. While CSF provides peer-validated information, it is not responsible for the consequences of using the calculator.

Citation

Mamani N, Huamán B, Novoa S, Morillo A, Torres M, Silva C, Finer M (2024) Gold Mining Impact Calculator: Analysis in 3 Indigenous Communities of the Southern Peruvian Amazon. MAAP: 196.

MAAP #208: Gold mining in the southern Peruvian Amazon, summary 2021-2024

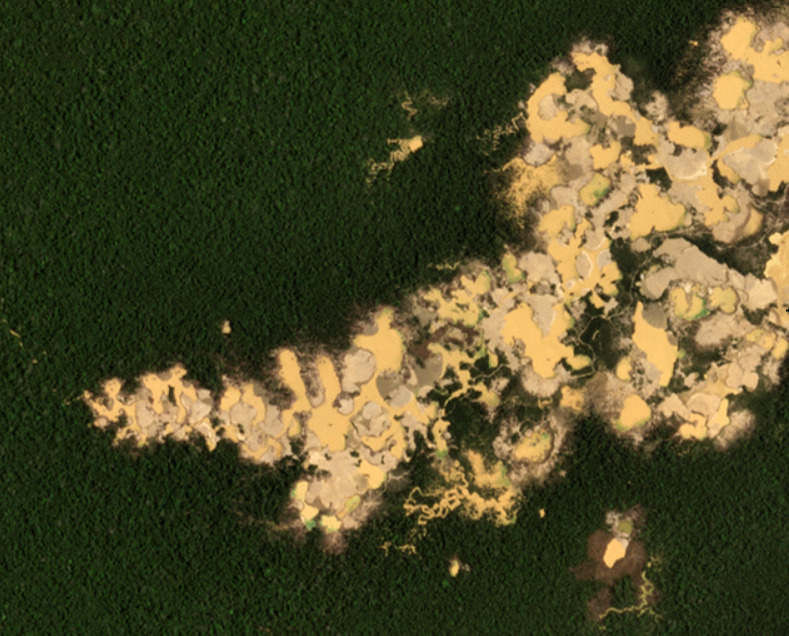
Figure 1. Recent expansion of illegal gold mining in the southern Peruvian Amazon. Data: Planet, NICFI

With the technical support of USAID (United States Agency for International Development) and Norad (Norwegian Agency for Development Cooperation),1 we have published a series of reports on the dynamic situation regarding gold mining in the southern Peruvian Amazon during recent years 2.

Illegal gold mining reached crisis levels between 2017 and 2018 in the area known as La Pampa (Madre de Dios region), eliminating thousands of hectares of primary forest in the buffer zone of the Tambopata National Reserve.

In early 2019, the Peruvian government implemented Operation Mercury, a multi-sectoral intervention against illegal mining, initially focusing on La Pampa. This operation was later replaced (in 2021) by the Restoration Plan, which included interventions in other critical mining areas of the Madre de Dios region in the southern Peruvian Amazon.

In this report, we offer a concise summary of the mining situation during the past three years (between January 2021 and March 2024) in the southern Peruvian Amazon, in the context of the Restoration Plan.

During this period, we recorded a total mining deforestation of 30,846 hectares (76,222 acres), equivalent to over 40,000 soccer fields.8

Of this total, three-quarters (74%) of the deforestation occurred within the official Mining Corridor, a large area (almost half a million hectares) where the government permits artisanal and small-scale mining to organize and promote this activity3. In other words, the vast majority of mining deforestation is not necessarily illegal, because it is in the corridor designated for this activity.

The remaining one-quarter (26%) of the deforestation corresponds to probable illegal mining. That is, mining activities carried out in prohibited areas outside the Mining Corridor, such as protected areas, their buffer zones, territories of Native Communities, and bodies of water.4

Base Map: Mining deforestation in the southern Peruvian Amazon

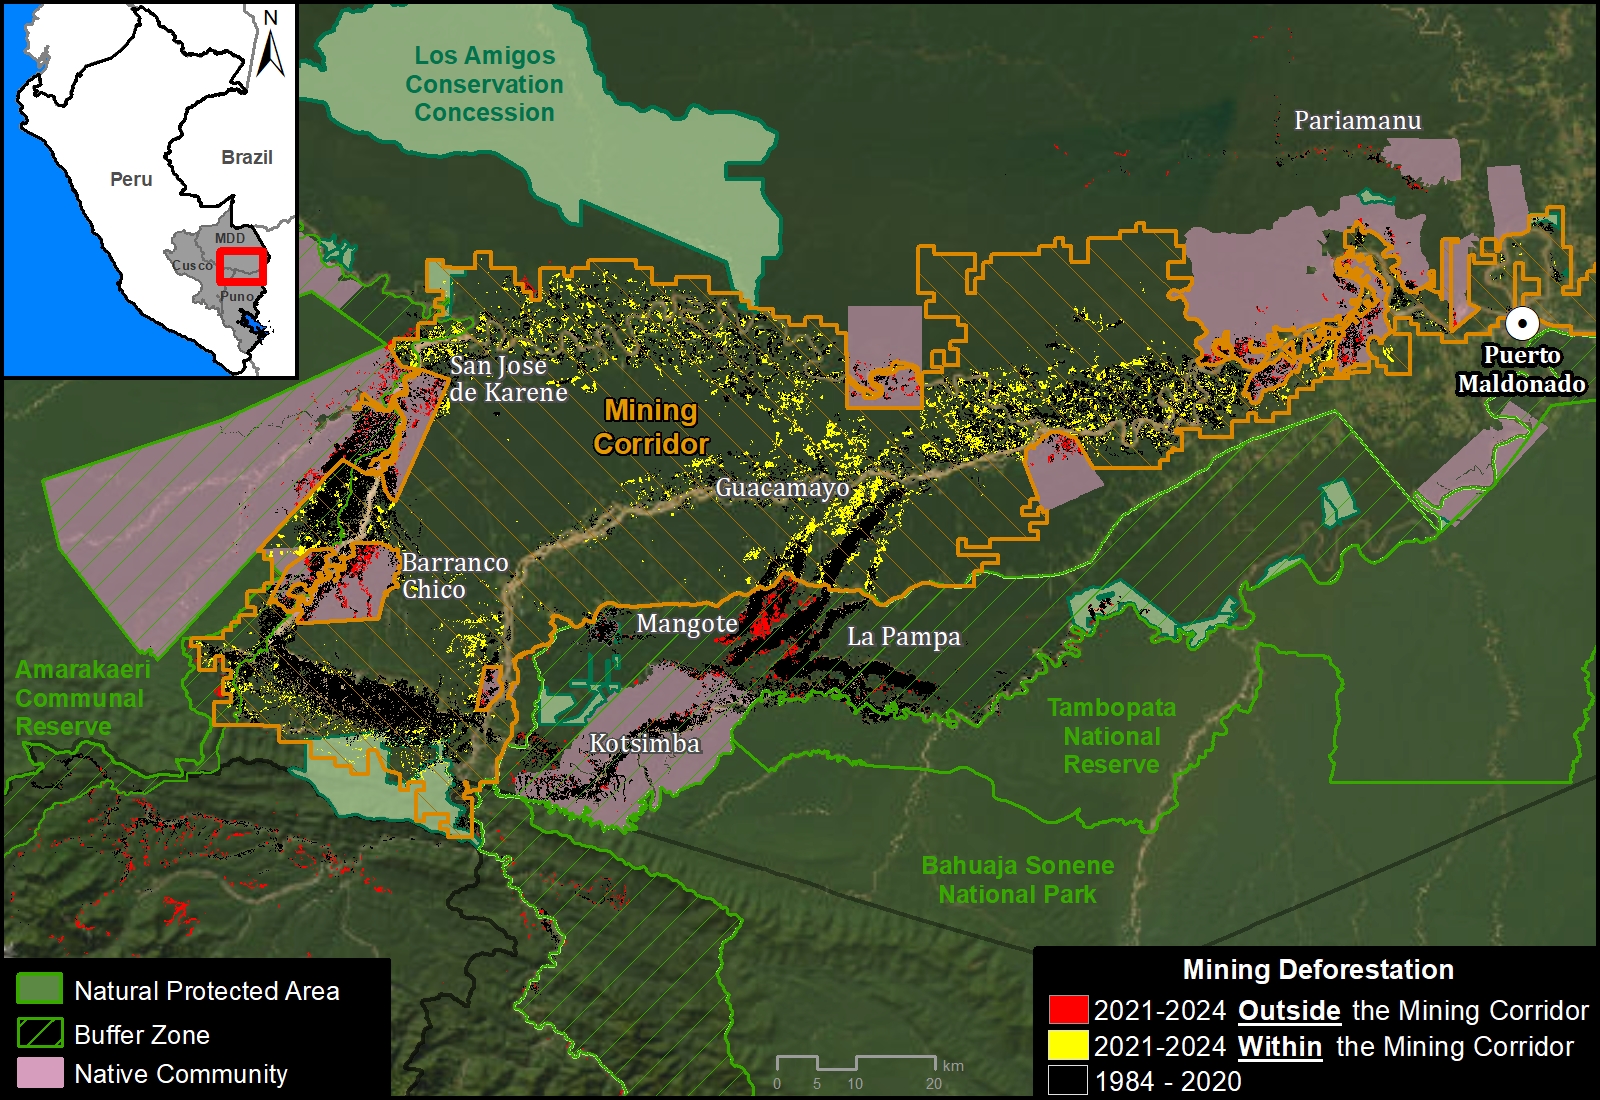
We highlight several important findings illustrated in the Base Map and Table 1, both presented below. In both cases, we highlight recent mining deforestation (between January 2021 and March 2024). Red indicates deforested areas outside of the Mining Corridor (representing our estimate of illegal mining), while yellow indicates recently deforested areas within the Mining Corridor.

Base Map. Mining deforestation inside and outside the Madre de Dios Mining Corridor, in the southern Peruvian Amazon, between January 2021 and March 2024. Data: ACCA/MAAP.

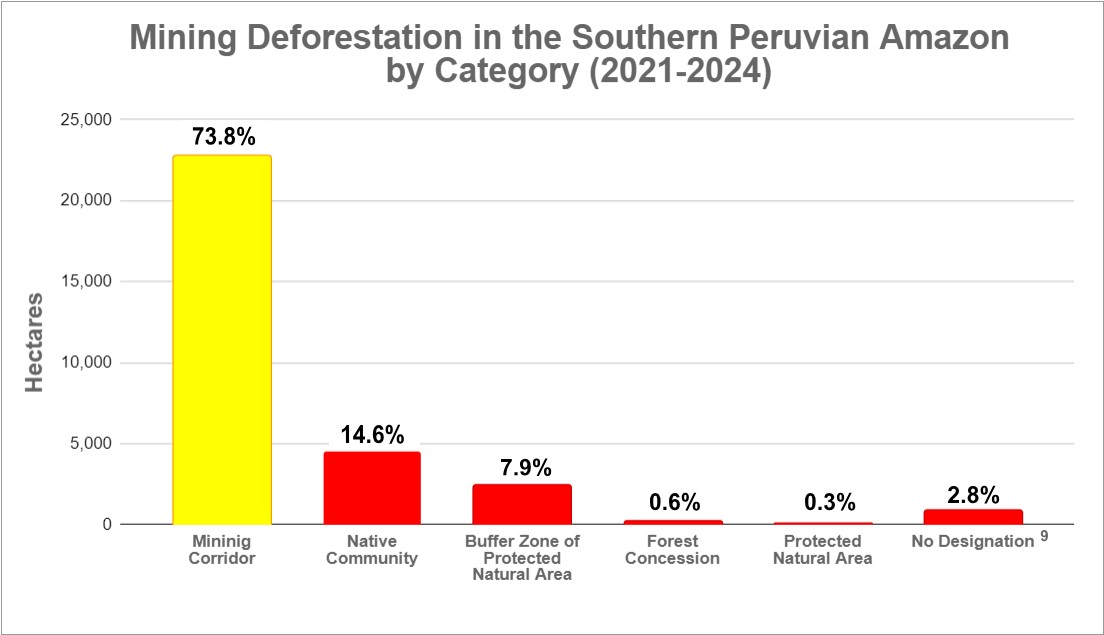
We found that mining deforestation is concentrated within the Mining Corridor, representing 73.8% of the total (22,756 hectares). This is especially evident in the Guacamayo mining area and along the Madre Dios River.

The rest of the mining deforestation (26.2%) is outside the Mining Corridor. The majority of this deforestation (14.6%) is occurring in the 10 Native Communities of the area, covering a total of 4,494 hectares. The most affected communities are San José de Karene (1,099 ha), Barranco Chico (1,008 ha) and Tres Islas (827 ha), followed by Puerto Luz (305 ha), Boca Inambari (305 ha), Kotsimba (297 ha), San Jacinto (269 ha), Shiringayoc (267 ha), Arazaire (78 ha) and El Pilar (40 ha). However, there are different trends. For example, mining deforestation between 2021 and 2024 has decreased in Barranco Chico, while it has increased in San José de Karene, Tres Islas and Boca Inambari.

We also identified mining deforestation of 2,439 hectares (7.9%) in buffer zones of Protected Areas. The most affected are Tambopata National Reserve (such as the Mangote area, see Figure 1), Bahuaja Sonene National Park, and Amarakaeri Communal Reserve. However, it must be emphasized that mining within the actual Protected Areas has been effectively controlled by the Peruvian government, through the National Service of Protected Natural Areas (SERNANP).

In addition, we detected some mining deforestation (198 hectares) in Brazil nut forestry concessions located in the Pariamanu area.

Finally, it is important to mention that in the critical area known as La Pampa (noted above), the expansion of mining deforestation has been effectively stopped after Operation Mercury. A recent report (MAAP #193), however, showed a large increase in mining activity in previously deforested areas of La Pampa.

Table 1. Mining deforestation by category in the southern Peruvian Amazon, between January 2021 and March 2024. Data: ACA/MAAP.

Monitoring & Control of Native Communities by FENAMAD

As noted above, a large portion of the illegal mining deforestation in the southern Peruvian Amazon is occurring within the territory of the Native Communities. These Native Communities are part of an articulated federation known as FENAMAD, which is the regional representative organization of the indigenous peoples of the Madre de Dios River basin. FENAMAD defends the fundamental and collective rights of indigenous peoples and native communities, including indigenous peoples in situations of isolation and initial contact.

1. First, FENAMAD identifies priority communities threatened by illegal mining and requiring urgent monitoring.

2. Subsequently, Amazon Conservation leads real-time satellite monitoring in these prioritized communities and delivers confidential reports to FENAMAD.

3. FENAMAD then reviews the reports together with the territory monitors and the results are shared with the affected native communities who decide whether these cases require a legal process.

4. FENAMAD formulates the Environmental Legal Complaint files and delivers them to the corresponding government institutions (Prosecutor’s Office Specialized in Environmental Matters of Madre de Dios –FEMA, National Police of Peru –PNP, Ecological Police of Peru, among others).

5. Finally, in selected cases, the government organizes and directs an on-the-ground operation against illegal mining activity and associated equipment.

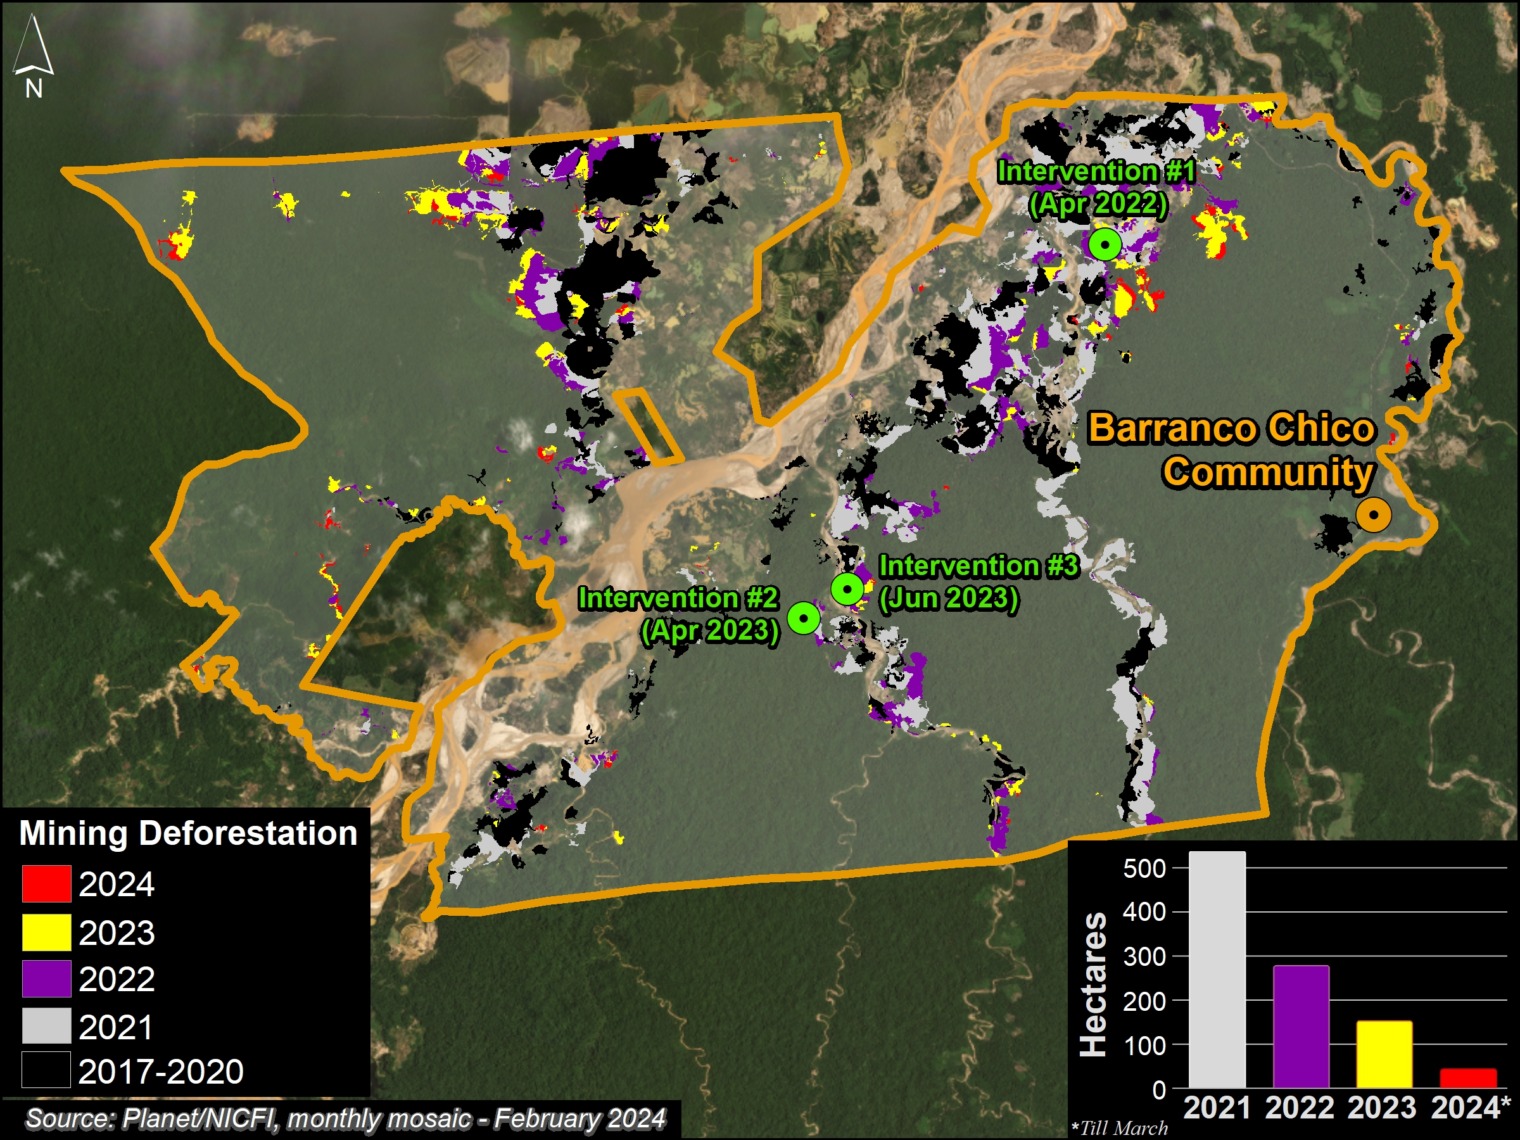
This process has led to the execution of 5 government-led operations between 2022 and 2024, in three communities: Barranco Chico, Kotsimba and San José de Karene (see Base Map).

Of these operations, 3 took place in the community of Barranco Chico,5 which has been especially affected by illegal mining deforestation (967 hectares in the last three years). Figure 2 indicates the location of these operations. It should be noted that mining deforestation in Barranco Chico has decreased between 2021 and 2024, likely due to these types of interventions.

Figure 2. Location of operations against illegal mining in the Barranco Chico Native Community.

The other operations occurred in the communities of Kotsimba6 and San José de Karene7.

It is worth noting that this collaboration between FENAMAD and Amazon Conservation, which is supported by the Norwegian Agency for Development Cooperation (NORAD), is currently expanding to additional native communities within the impacted region.

Notes

1 USAID Prevent works with the Government of Peru, civil society and the private sector to prevent and combat environmental crimes for the conservation of the Peruvian Amazon, particularly in the regions of Loreto, Madre de Dios and Ucayali. USAID’s Prevent Project also has support from the Norwegian Agency for Development Cooperation (NORAD).

2 Previous MAAP reports about gold mining in the southern Peruvian Amazon:

MAAP #195: GOLD MINING DEFORESTATION IN THE SOUTHERN PERUVIAN AMAZON, 2021-2023
https://www.maapprogram.org/2023/mining-deforest-peru
November 2023

MAAP #185: GOLD MINING DEFORESTATION IN THE SOUTHERN PERUVIAN AMAZON: 2021-2022 UPDATE
https://www.maapprogram.org/2023/peru-gold-mining-update/
June 2023

MAAP #171: DEFORESTATION IN MINING CORRIDOR OF PERUVIAN AMAZON (2021-2022)
https://www.maapprogram.org/2022/mining-corridor-peru/
December 2022

MAAP #154: ILLEGAL GOLD MINING IN THE PERUVIAN AMAZON – 2022 UPDATE
https://www.maapprogram.org/2022/gold-mining-peru-update/
May 2022

3 The Mining Corridor, named by Legislative Decree No. 1100, as the “Zone of small mining and artisanal mining in the department of Madre Dios”, catalogs mining activities as:

– Formal: It is carried out with authorization for exploration and exploitation in a specific area, with conditions and operations regulated by the legal framework of the mining sector. It has approved environmental, administrative and operational permits.

– Informal: Artisanal and small-scale mining operates in permitted areas for mineral extraction and uses permitted machinery. Although it does not have authorization to carry out mining activity, it is in the formalization process in accordance with the provisions of Legislative Decree No. 1105, which establishes provisions for the formalization process of small-scale mining and artisanal mining activities. Therefore, it is considered an administrative infraction, but not a crime.

– Illegal: Exploration, extraction and exploitation of mineral resources in prohibited areas (such as Protected Areas and bodies of water) and using prohibited machinery, failing to comply with administrative, technical and environmental requirements established in Peruvian legislation. This is a crime stipulated in article 207-A of the Penal Code, which carries a custodial sentence.

4 Although keep in mind that there may be mining concessions within the Native Community territories.

5 FEMA operations in the Barranco Chico community occurred in April 2022 (América Televisión video), April 2023 (El Comercio) and June 2023. There was an initial operation before the project in 2021.

6 FEMA operation in the Kotsimba community occurred in October 2023.

7 FEMA operation in the community of San José de Karene occurred in April 2024.

8 Of this total (30,846 hectares), 28,292 hectares occurred during 2021-2023, while 2,554 hectares occurred in the first quarter of 2024.

9 Undesignated refers to areas without a formal designation and not included in any of the other categories.

Methodology

We used LandTrendR, a temporal segmentation algorithm that identifies changes in pixel values over time, to detect forest loss within the mining corridor between January 2021 and March 2024 using the Google Earth Engine platform. Importantly, this method was originally designed for moderate resolution Landsat imagery (30 meters)1, but we adapted it for higher spatial resolution (4.7 meters) NICFI-Planet monthly mosaics.2

In addition, we created a baseline for the period 2016 – 2020 to eliminate previously deforested areas (pre 2021), to account for rapid changes in the natural revegetation process.

Finally, we manually separated forest loss from mining vs other causes, to report specifically on direct mining-related impacts between 2021 and 2024. We used several resources to help this manual process, such as alerts with radar images (RAMI) from the SERVIR Amazonía program, historical data from the Amazon Scientific Innovation Center – CINCIA (from 1985 to 2021), and forest loss data from the Peruvian state (National Forest Conservation Program for Climate Change Mitigation) and the University of Maryland.

  1. Kennedy, R.E., Yang, Z., Gorelick, N., Braaten, J., Cavalcante, L., Cohen, W.B., Healey, S. (2018). Implementation of the LandTrendr Algorithm on Google Earth Engine. Remote Sensing. 10, 691.
  2. Erik Lindquist, FAO, 2021

Acknowledgments

We especially thank FENAMAD for this important strategic collaboration.

This report was prepared with the technical support of USAID through the Prevent Project. Prevent (Proyecto Prevenir in Spanish) works with the Government of Peru, civil society, and the private sector to prevent and combat environmental crimes for the conservation of the Peruvian Amazon, particularly in the regions of Loreto, Madre de Dios, and Ucayali. USAID’s Prevent Project also has support from the Norwegian Agency for Development Cooperation (NORAD).

This publication is made possible by the generous support of the American people through USAID. The contents are the sole responsibility of the authors and do not necessarily reflect the views of USAID or the United States Government.

Citation

Finer M, Mamani N (2024) Gold mining in the southern Peruvian Amazon, summary 2021-2024. MAAP: 208.


MAAP #211: Illegal roads and Deforestation in Indigenous Reserves & National Parks of the Colombian Amazon

Illegal roads are a major threat to the Colombian Amazon, often opening remote primary forests to the main drivers of deforestation: cattle pastures, land grabbing and coca production.

Base Map. Illegal roads causing recent deforestation. Data: MAAP/ACA, FCDS.

These illegal roads threaten protected areas (including national parks) and indigenous territories (known as Resguardos in Colombia).

In 2024, in collaboration with our Colombian partner FCDS, we have documented these impacts in two important areas in the heart of the Colombian Amazon: the Llanos del Yari-Yaguara II Indigenous Reserve and the adjacent Chiribiquete National Park (see Base Map).

Most notably, in the Llanos del Yari-Yaguara II Indigenous Reserve, we see the construction of a new road, causing massive deforestation of primary forests, both within and adjacent to the territory (856 hectares, or 2,115 acres, in total).

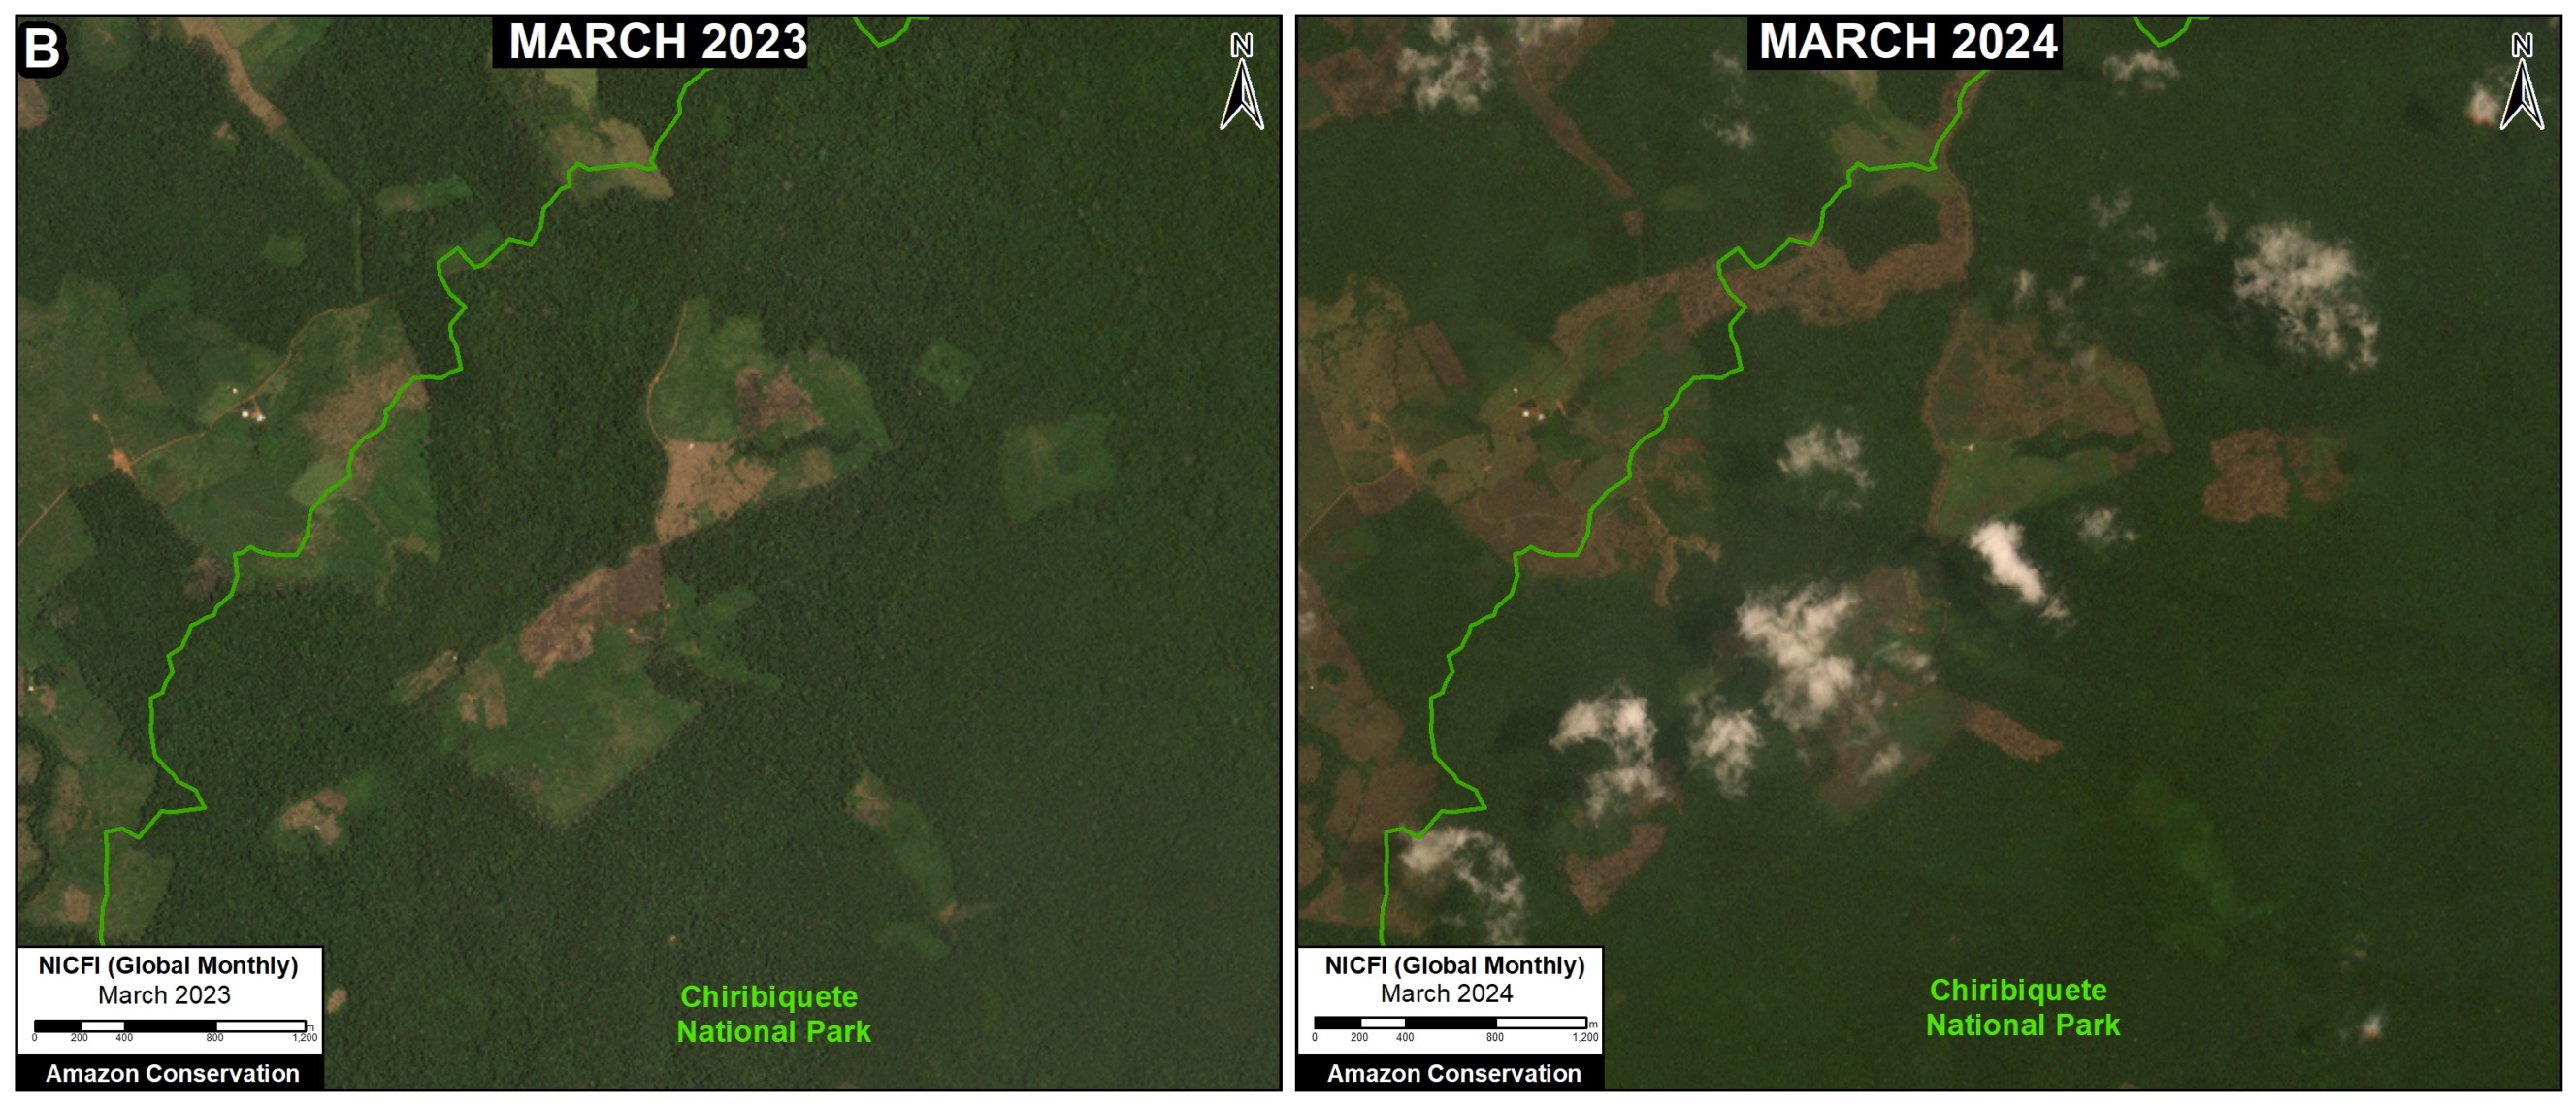
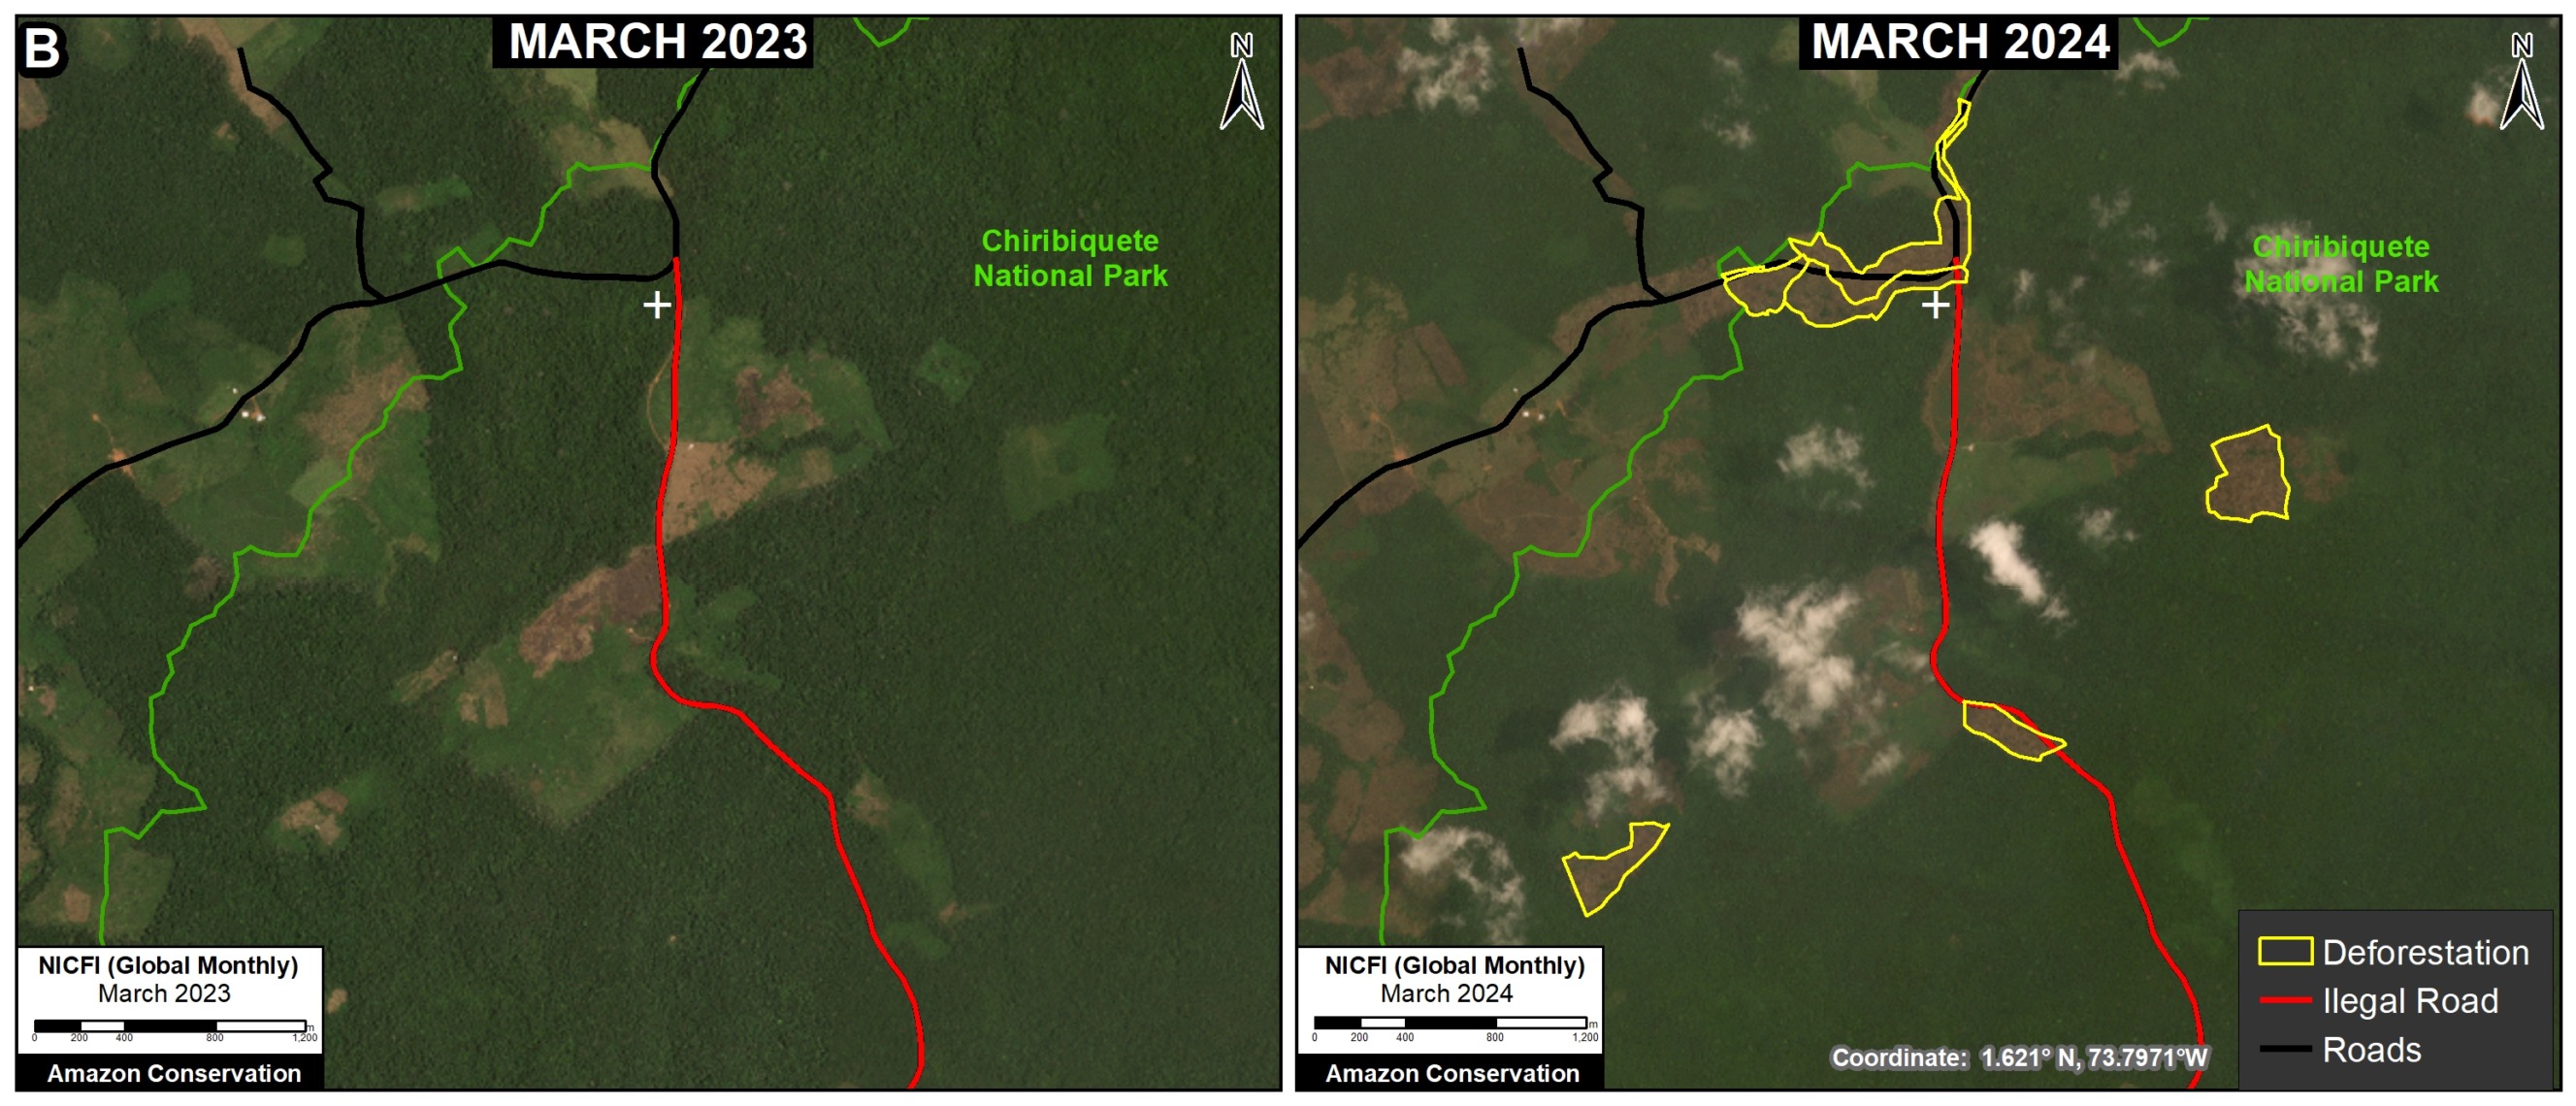
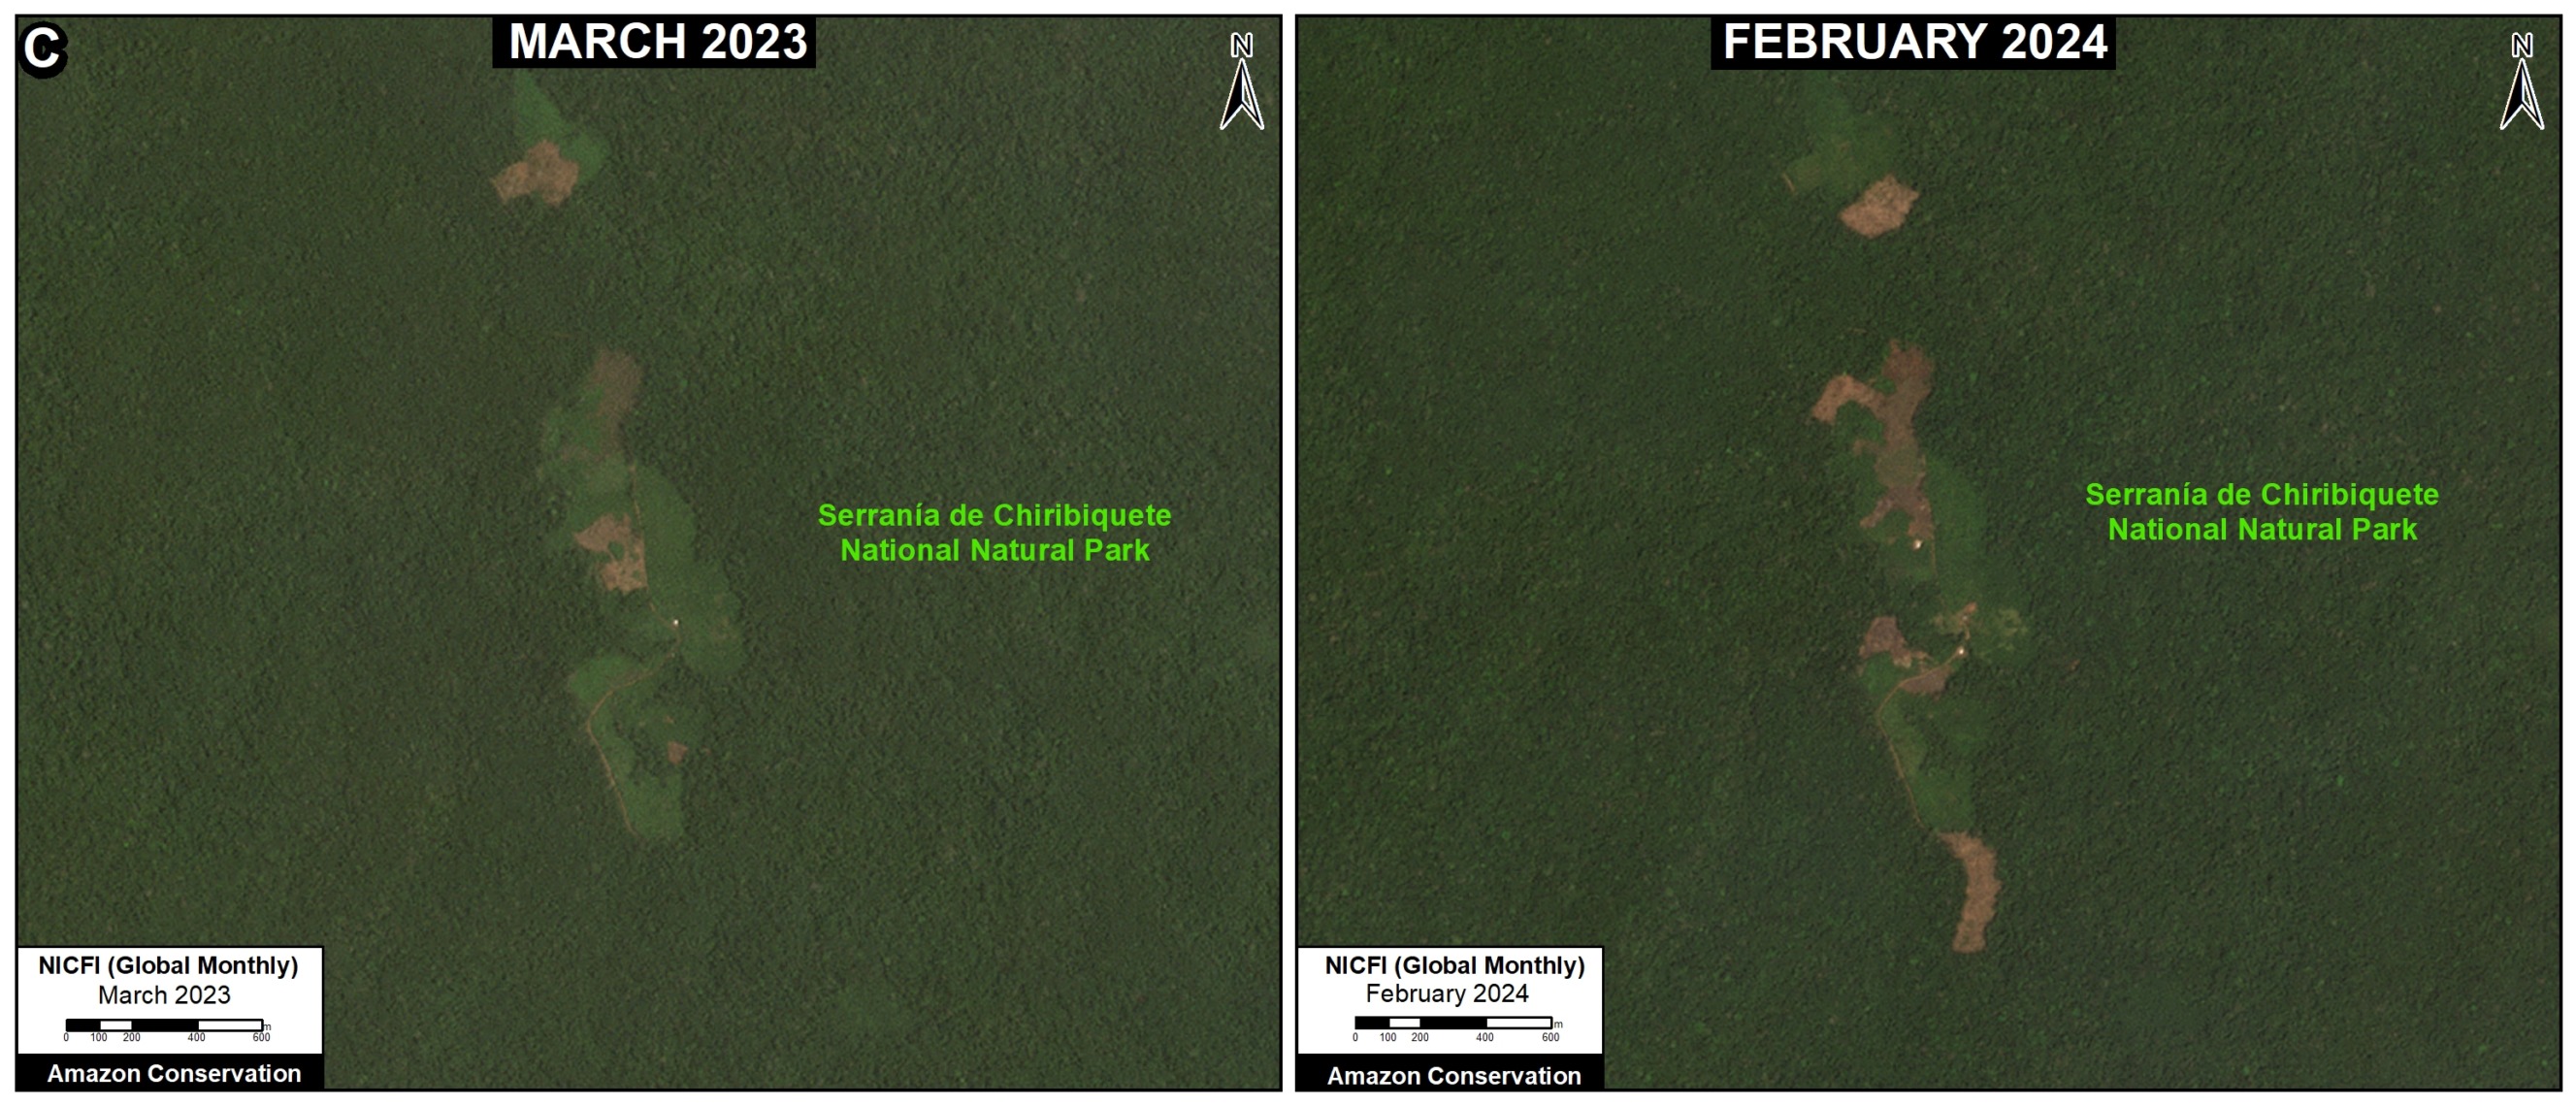
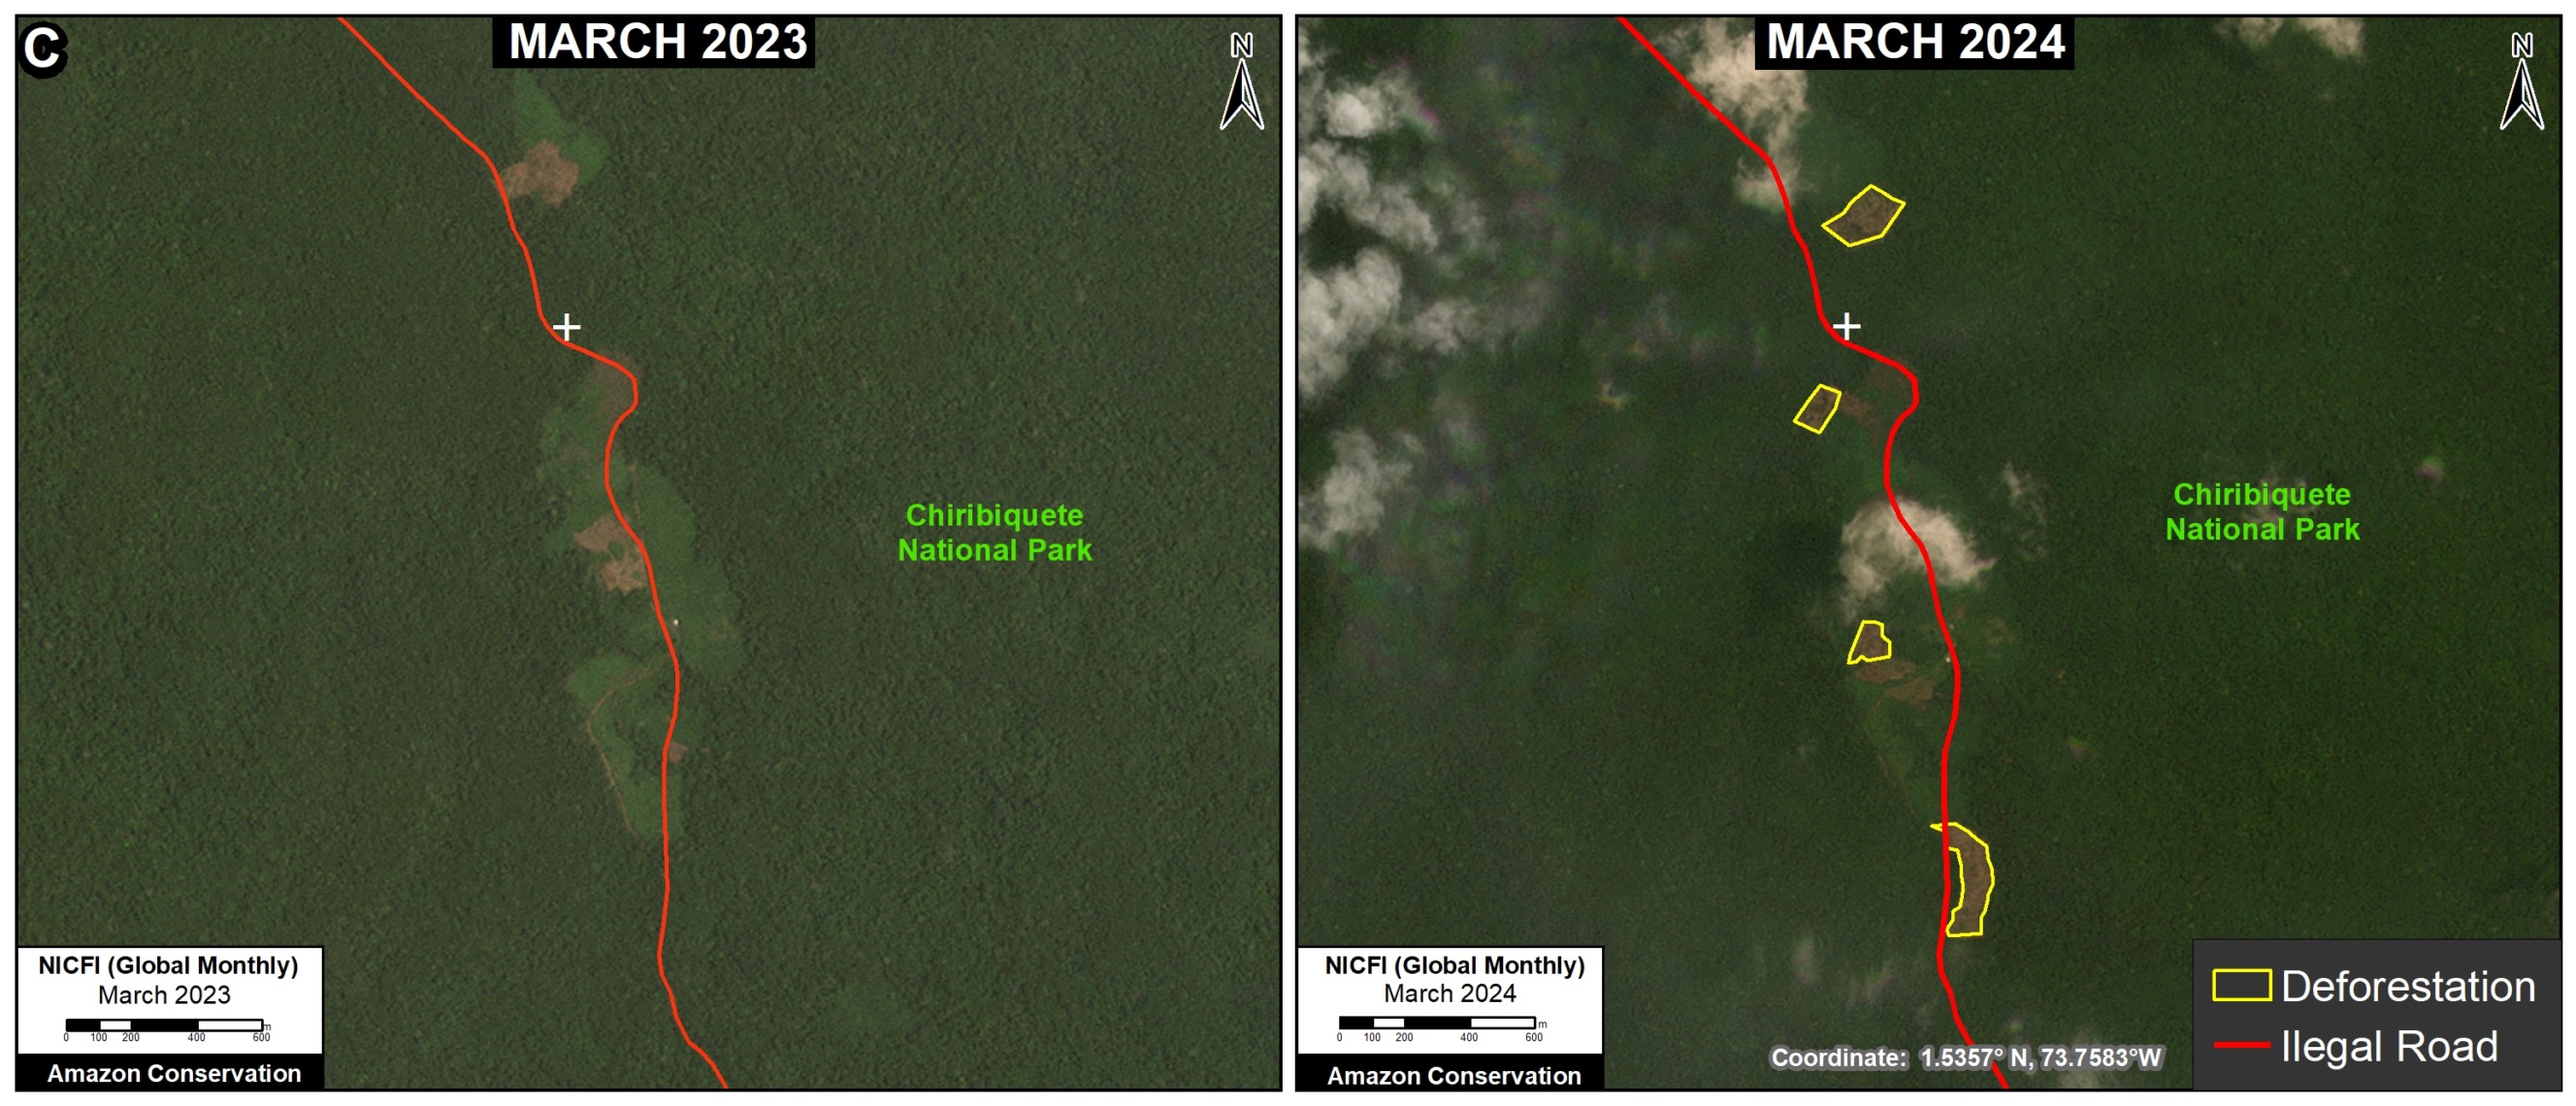
In Chiribiquete National Park, we see the expansion of deforestation of 64 hectares (158 acres) along an illegal road penetrating the northwest sector of this important protected area.

Below, we show satellite images for both cases.

Llanos del Yari- Yaguara II Indigenous Reserve

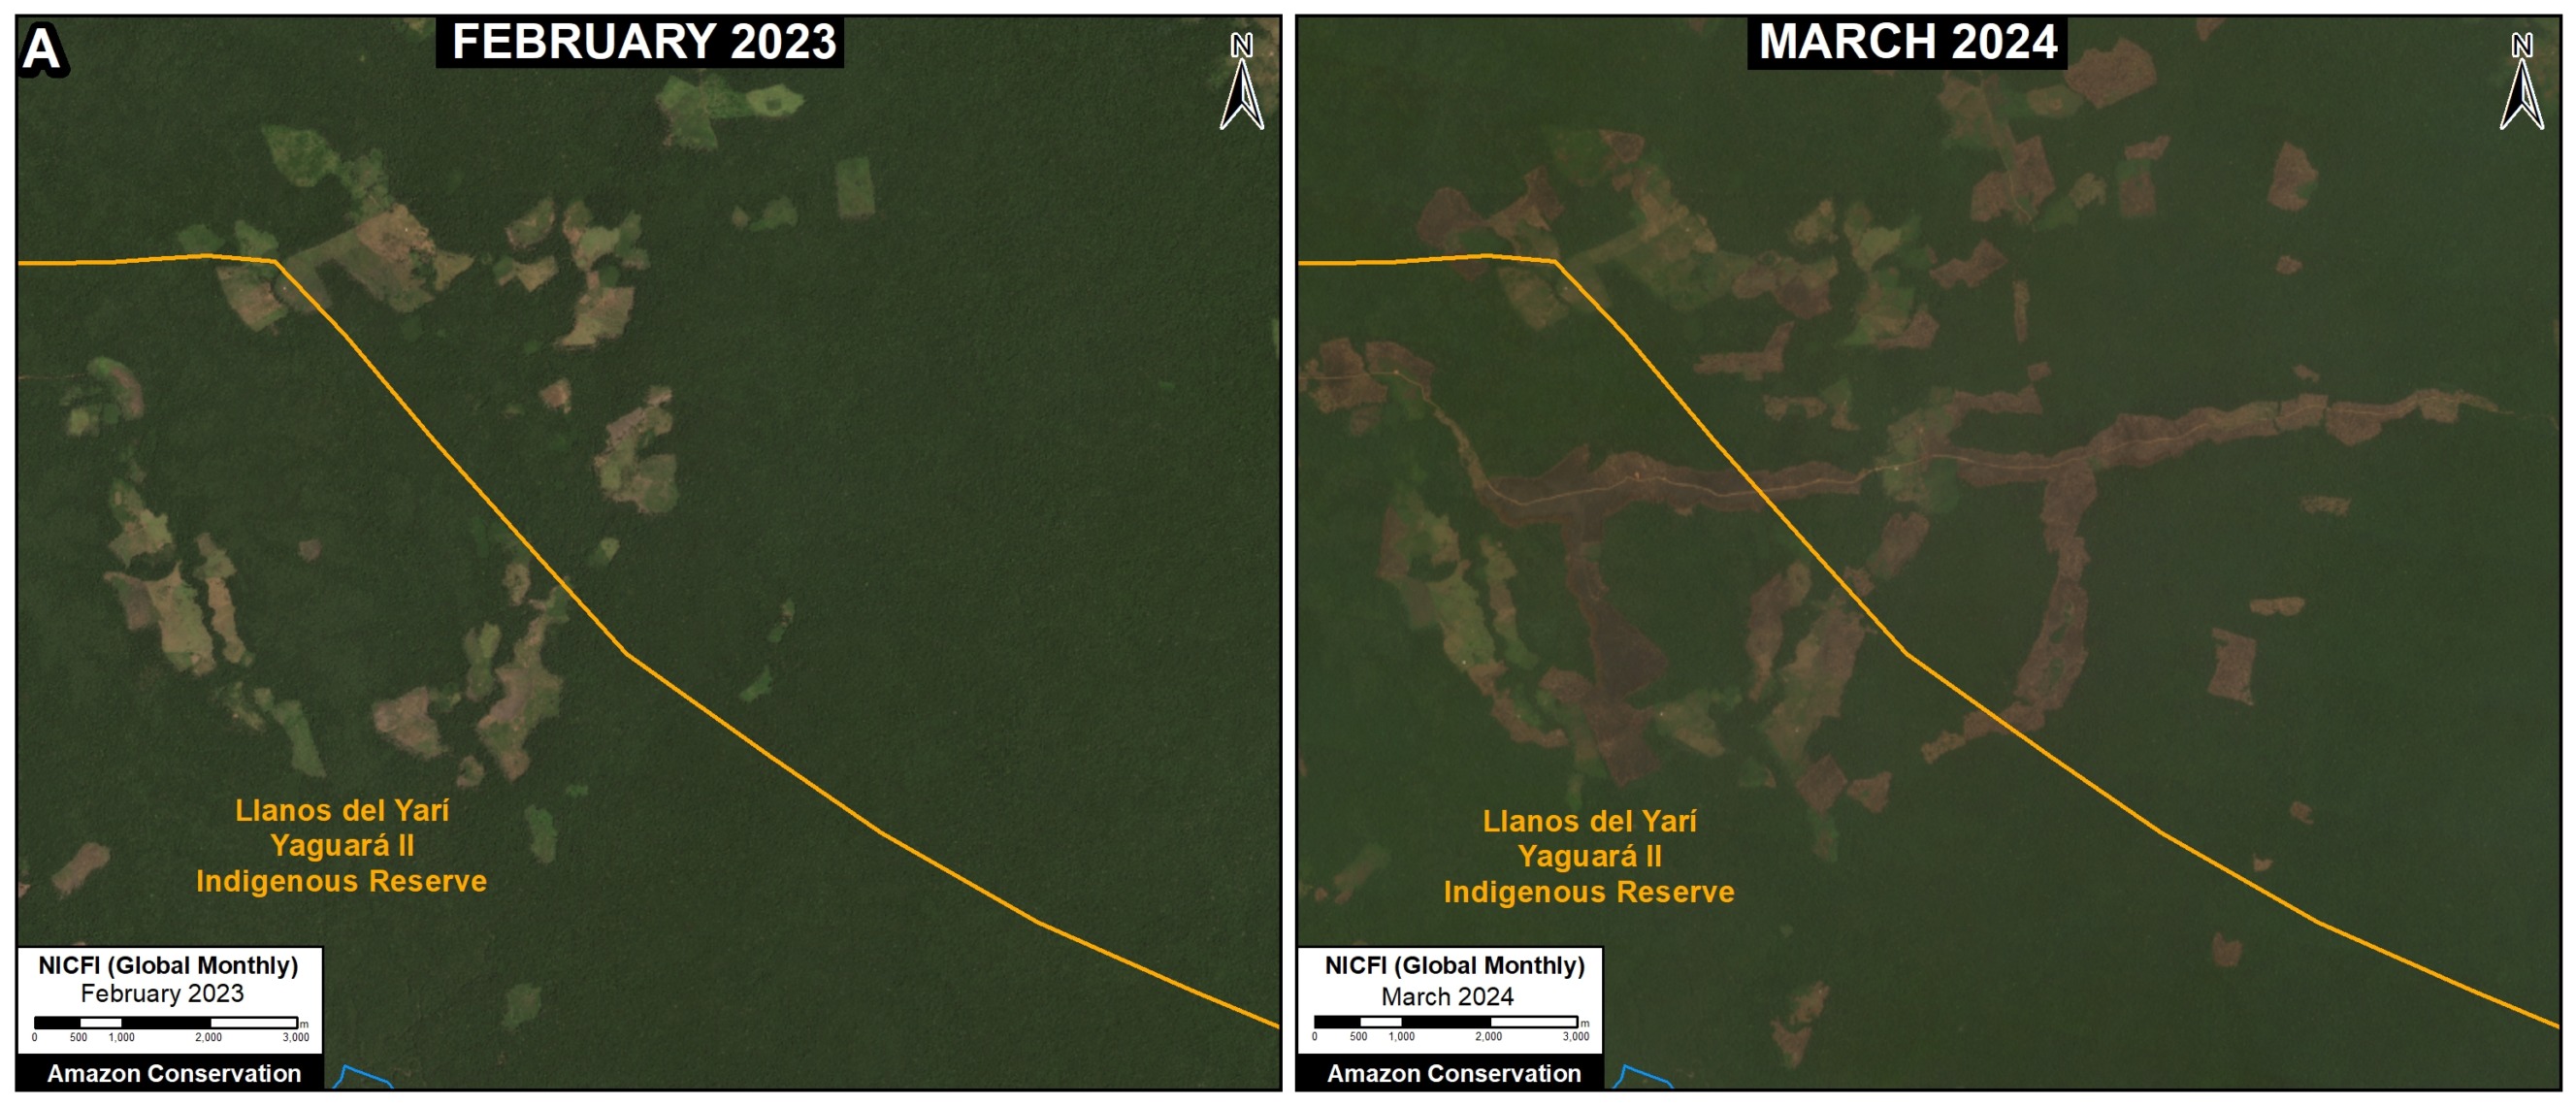
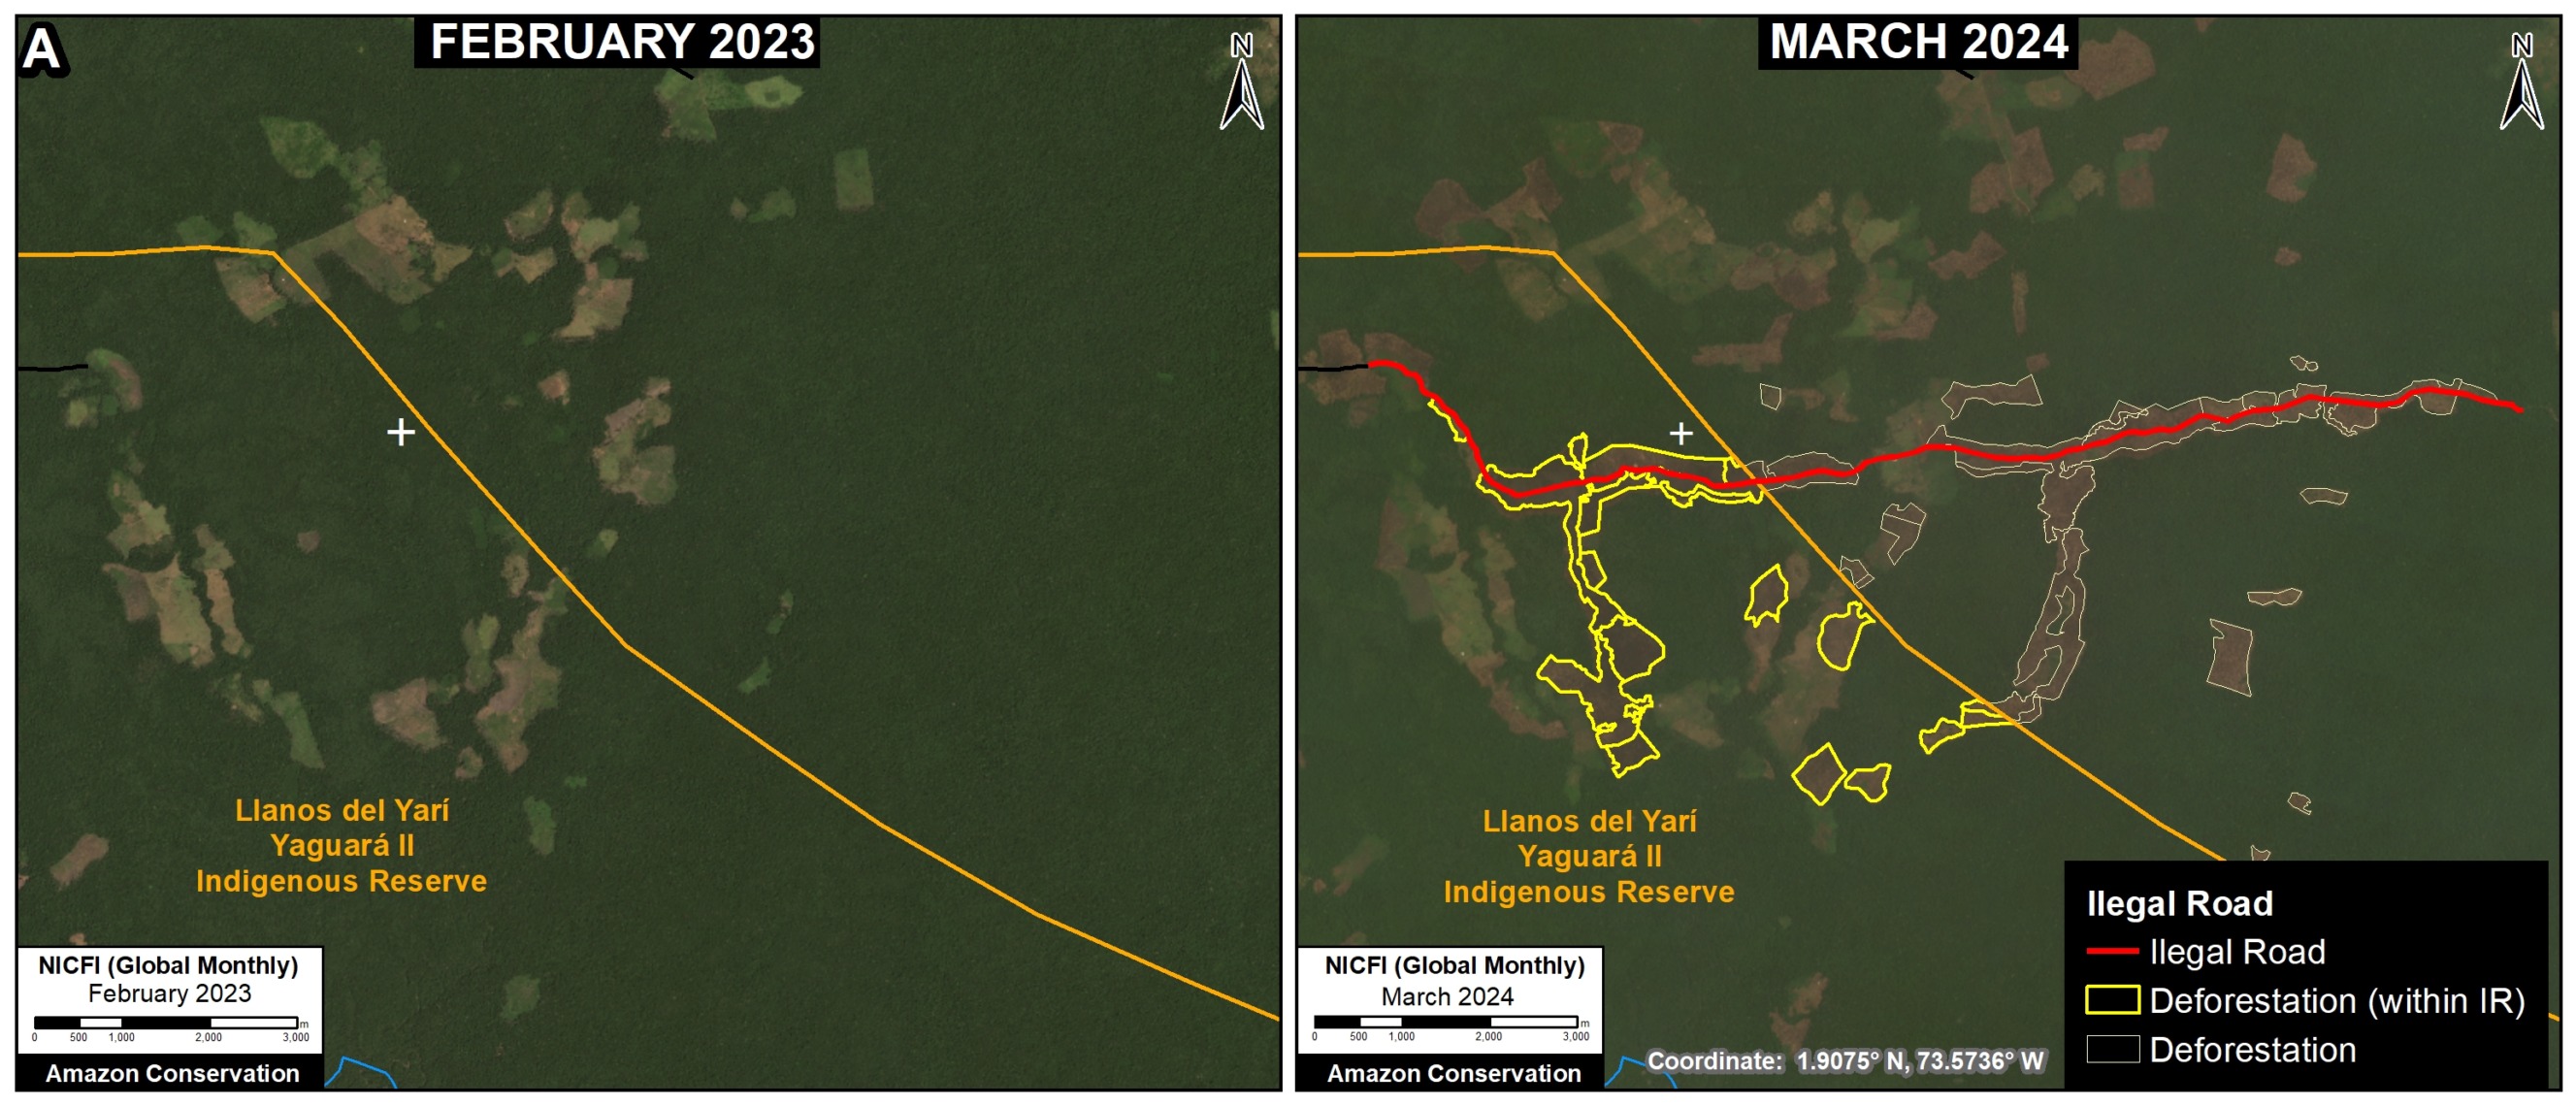
Since March 2023, a new 14-kilometer illegal road has been built in this area, of which 5.3 km is within the northeastern sector of the Llanos del Yari- Yaguara II Indigenous Reserve, located in the department of Guaviare. Figures 1 and 2 show that this construction has caused massive deforestation: 856 hectares (2,115 acres), of which 394 hectares are within the Reserve, between February 2023 (left panel) and March 2024 (right panel). This deforestation is presumably for new cattle pasture, facilitated by the new road. Note that Figure 1 shows the satellite images without markings, while Figure 2 adds markings for the illegal road construction and associated deforestation.

Figure 1. Deforestation along the new illegal road in the Llanos del Yari- Yaguara II Indigenous Reserve, without markings. Data: Planet, NICFI.
Figure 2. Deforestation along the new illegal road in the Llanos del Yari- Yaguara II Indigenous Reserve, with markings. Data: Planet, NICFI.

Chiribiquete National Park

In the adjacent northwest sector of Chiribiquete National Park, deforestation continues to expand along an existing illegal road, known as the Tunia-Ajaju road, located in the department of Caquetá. Figures 3-6 show the deforestation of 64 hectares (56 hectares in zone B and 8 hectares in zone C) along this road inside the national park, between March 2023 (left panel) and March 2024 (panel right). This deforestation is presumably for new cattle pastures, facilitated by the road. Note that Figures 3 and 5 show the satellite images without markings, while Figures 4 and 6 add markings for the illegal road construction and associated deforestation.

Figure 3. Deforestation along the new illegal road in Chiribiquete National Park (zone B), without markings. Data: Planet, NICFI.
Figure 4. Deforestation along the new illegal road in Chiribiquete National Park (zone B), with markings. Data: Planet, NICFI.
Figure 5. Deforestation along the new illegal road in Chiribiquete National Park (zone C), without markings. Data: Planet, NICFI.
Figure 6. Deforestation along the new illegal road in Chiribiquete National Park (zone C), with markings. Data: Planet, NICFI.

Citation

Finer M, Ariñez A (2024) Illegal roads and Deforestation in Indigenous Reserves & National Parks of the Colombian Amazon. MAAP: 211.


MAAP #207: Removing Illegal Mining from Sacred Tepui in Yapacana National Park (Venezuelan Amazon)

Last year,  in collaboration with the organization SOS Orinoco, we published an urgent report about illegal mining on top of a sacred tepui in the heart of Yapacana National Park in Venezuela (MAAP #169).
Tepuis are stunning table-top mountains found in northern South America. They are considered sacred by indigenous groups of the region; in fact, the word tepui means “house of the gods” in a local indigenous language. Tepuis also have high levels of endemism (unique species) since they are not connected to other ranges.

In that report, we documented 425 illegal mining data points (consisting of mining camps and machinery) on top of the tepui, indicating an organized and large-scale operation on top of this critically important biogeographical site.

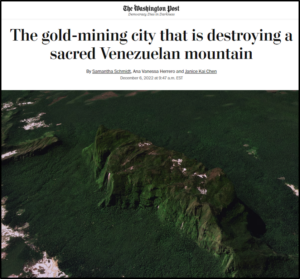
Given the importance of this finding, the Washington Post published a high-profile article on the subject (see right), further exposing the severity of the illegal mining on the tepui.

In response, the Venezuelan government conducted a military operation (led by the Operational Strategic Commander of the Armed Forces) against illegal mining activity on the tepui in December 2022.

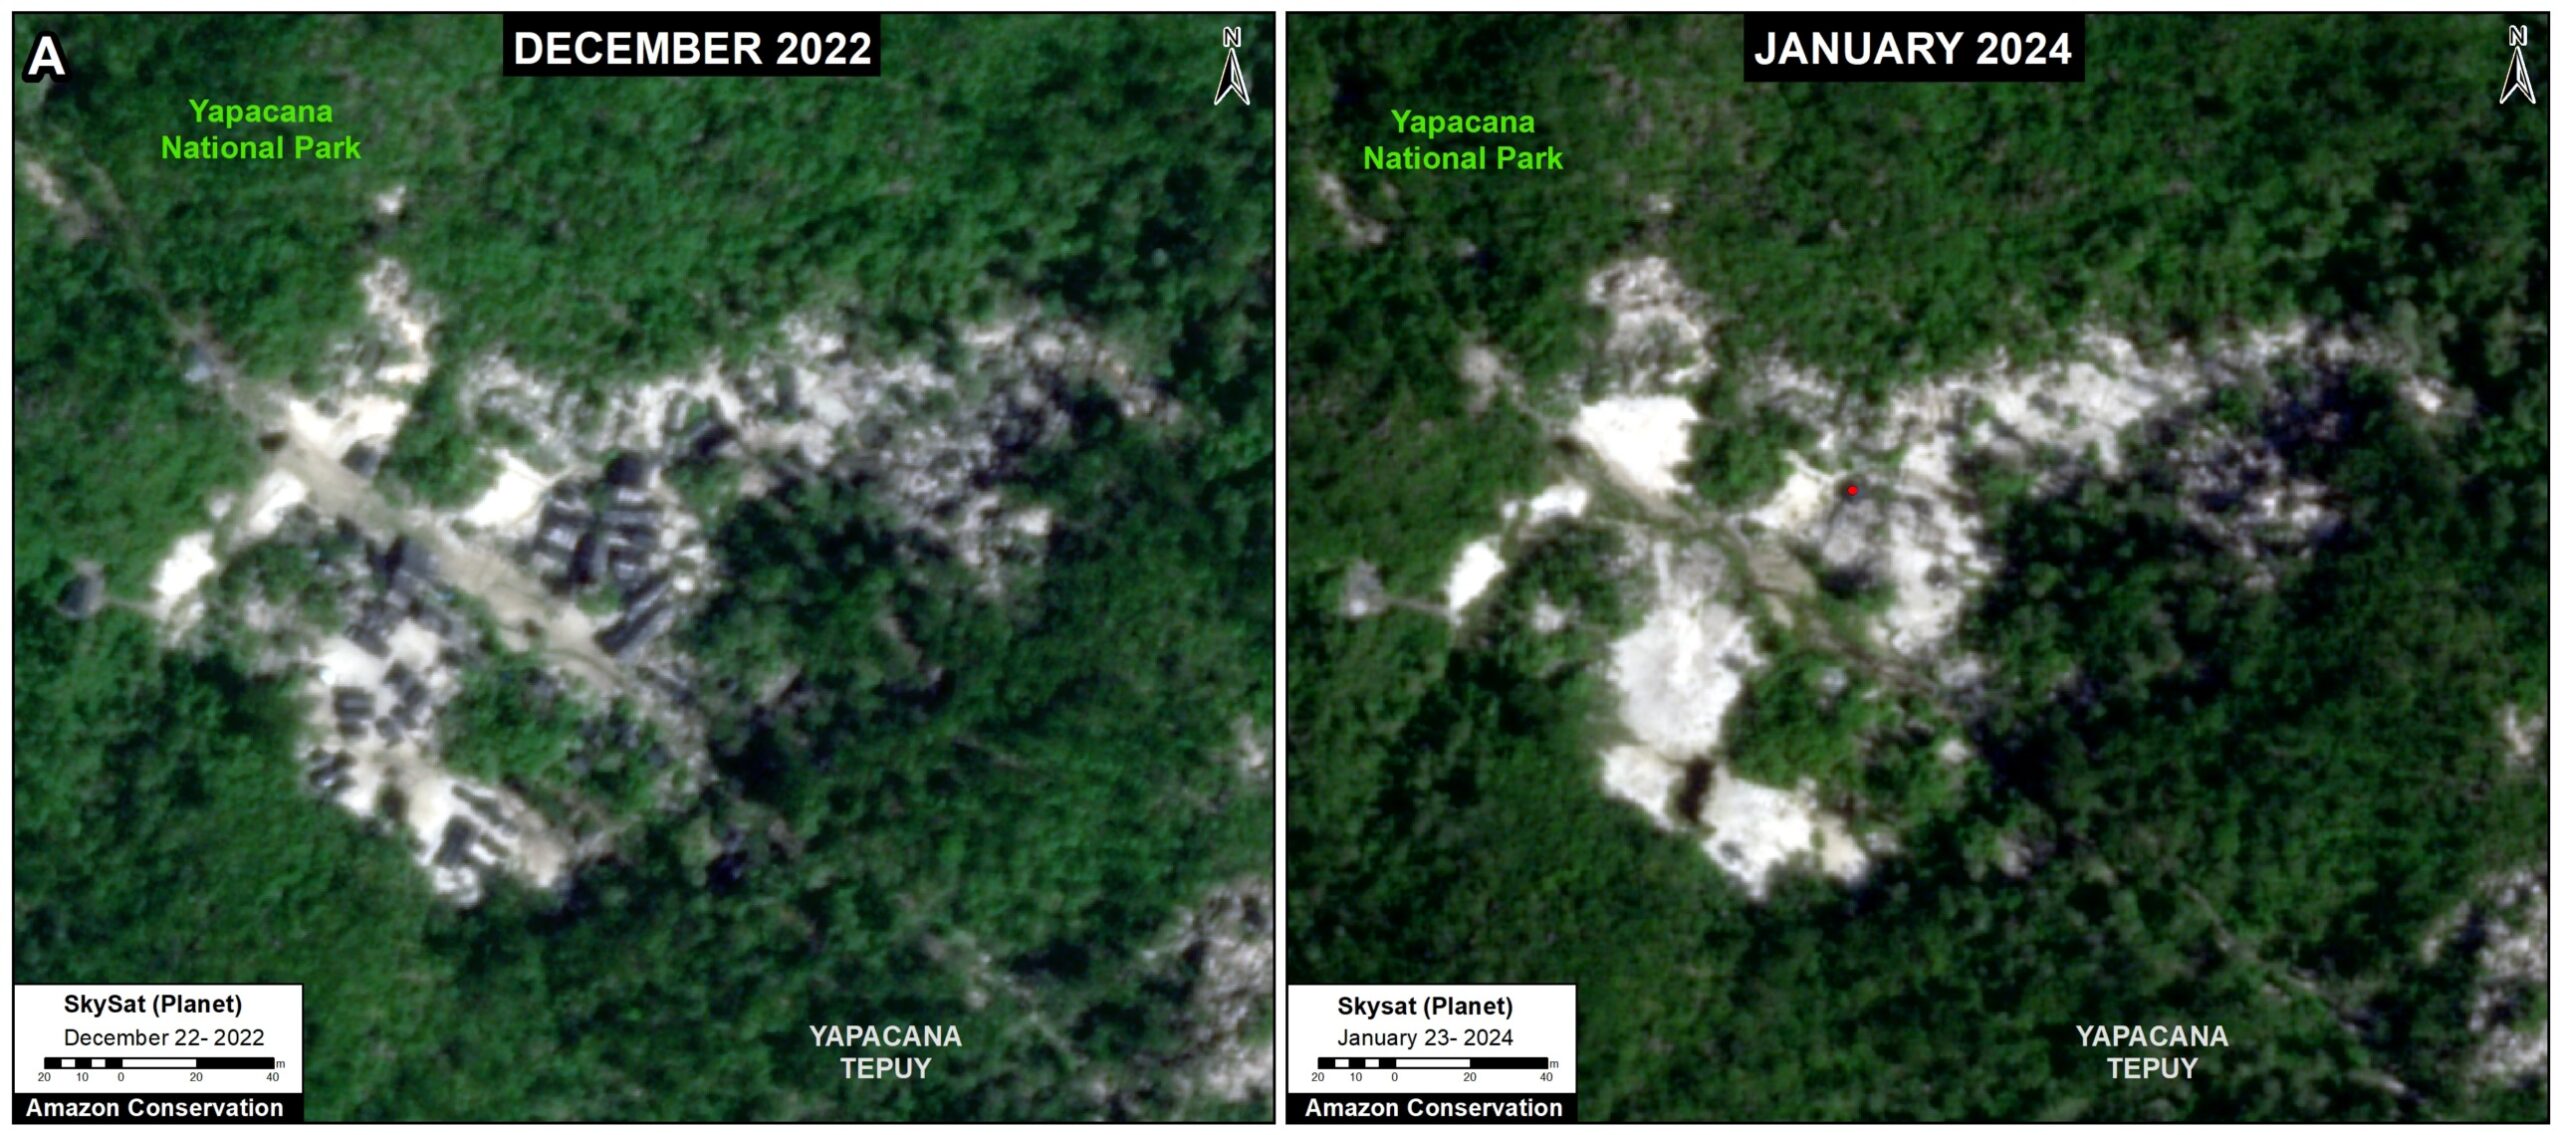
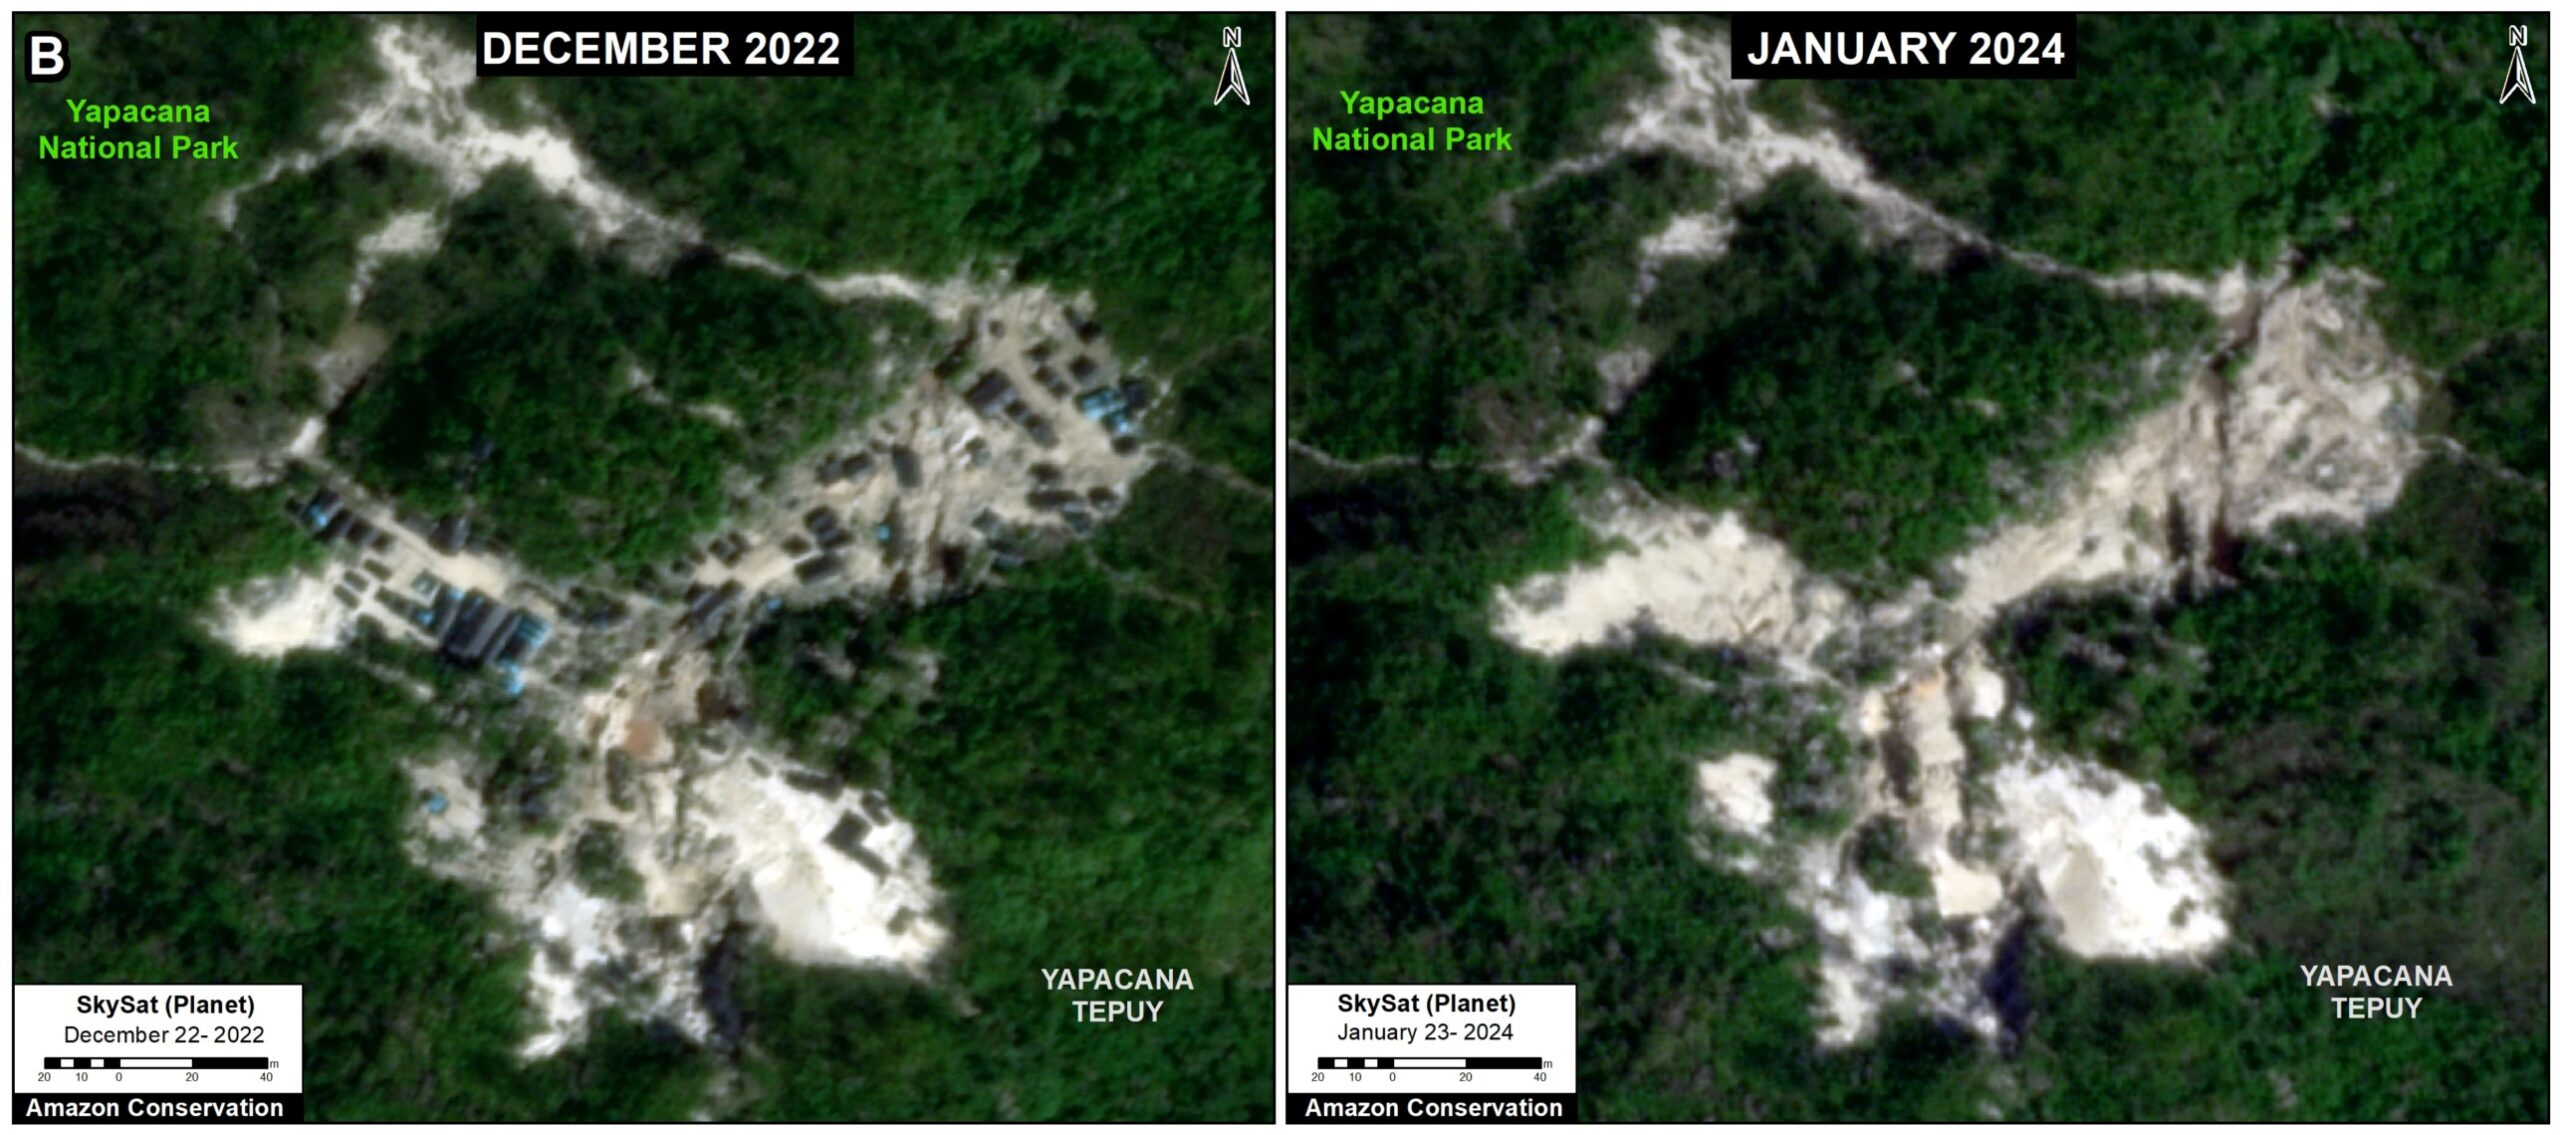
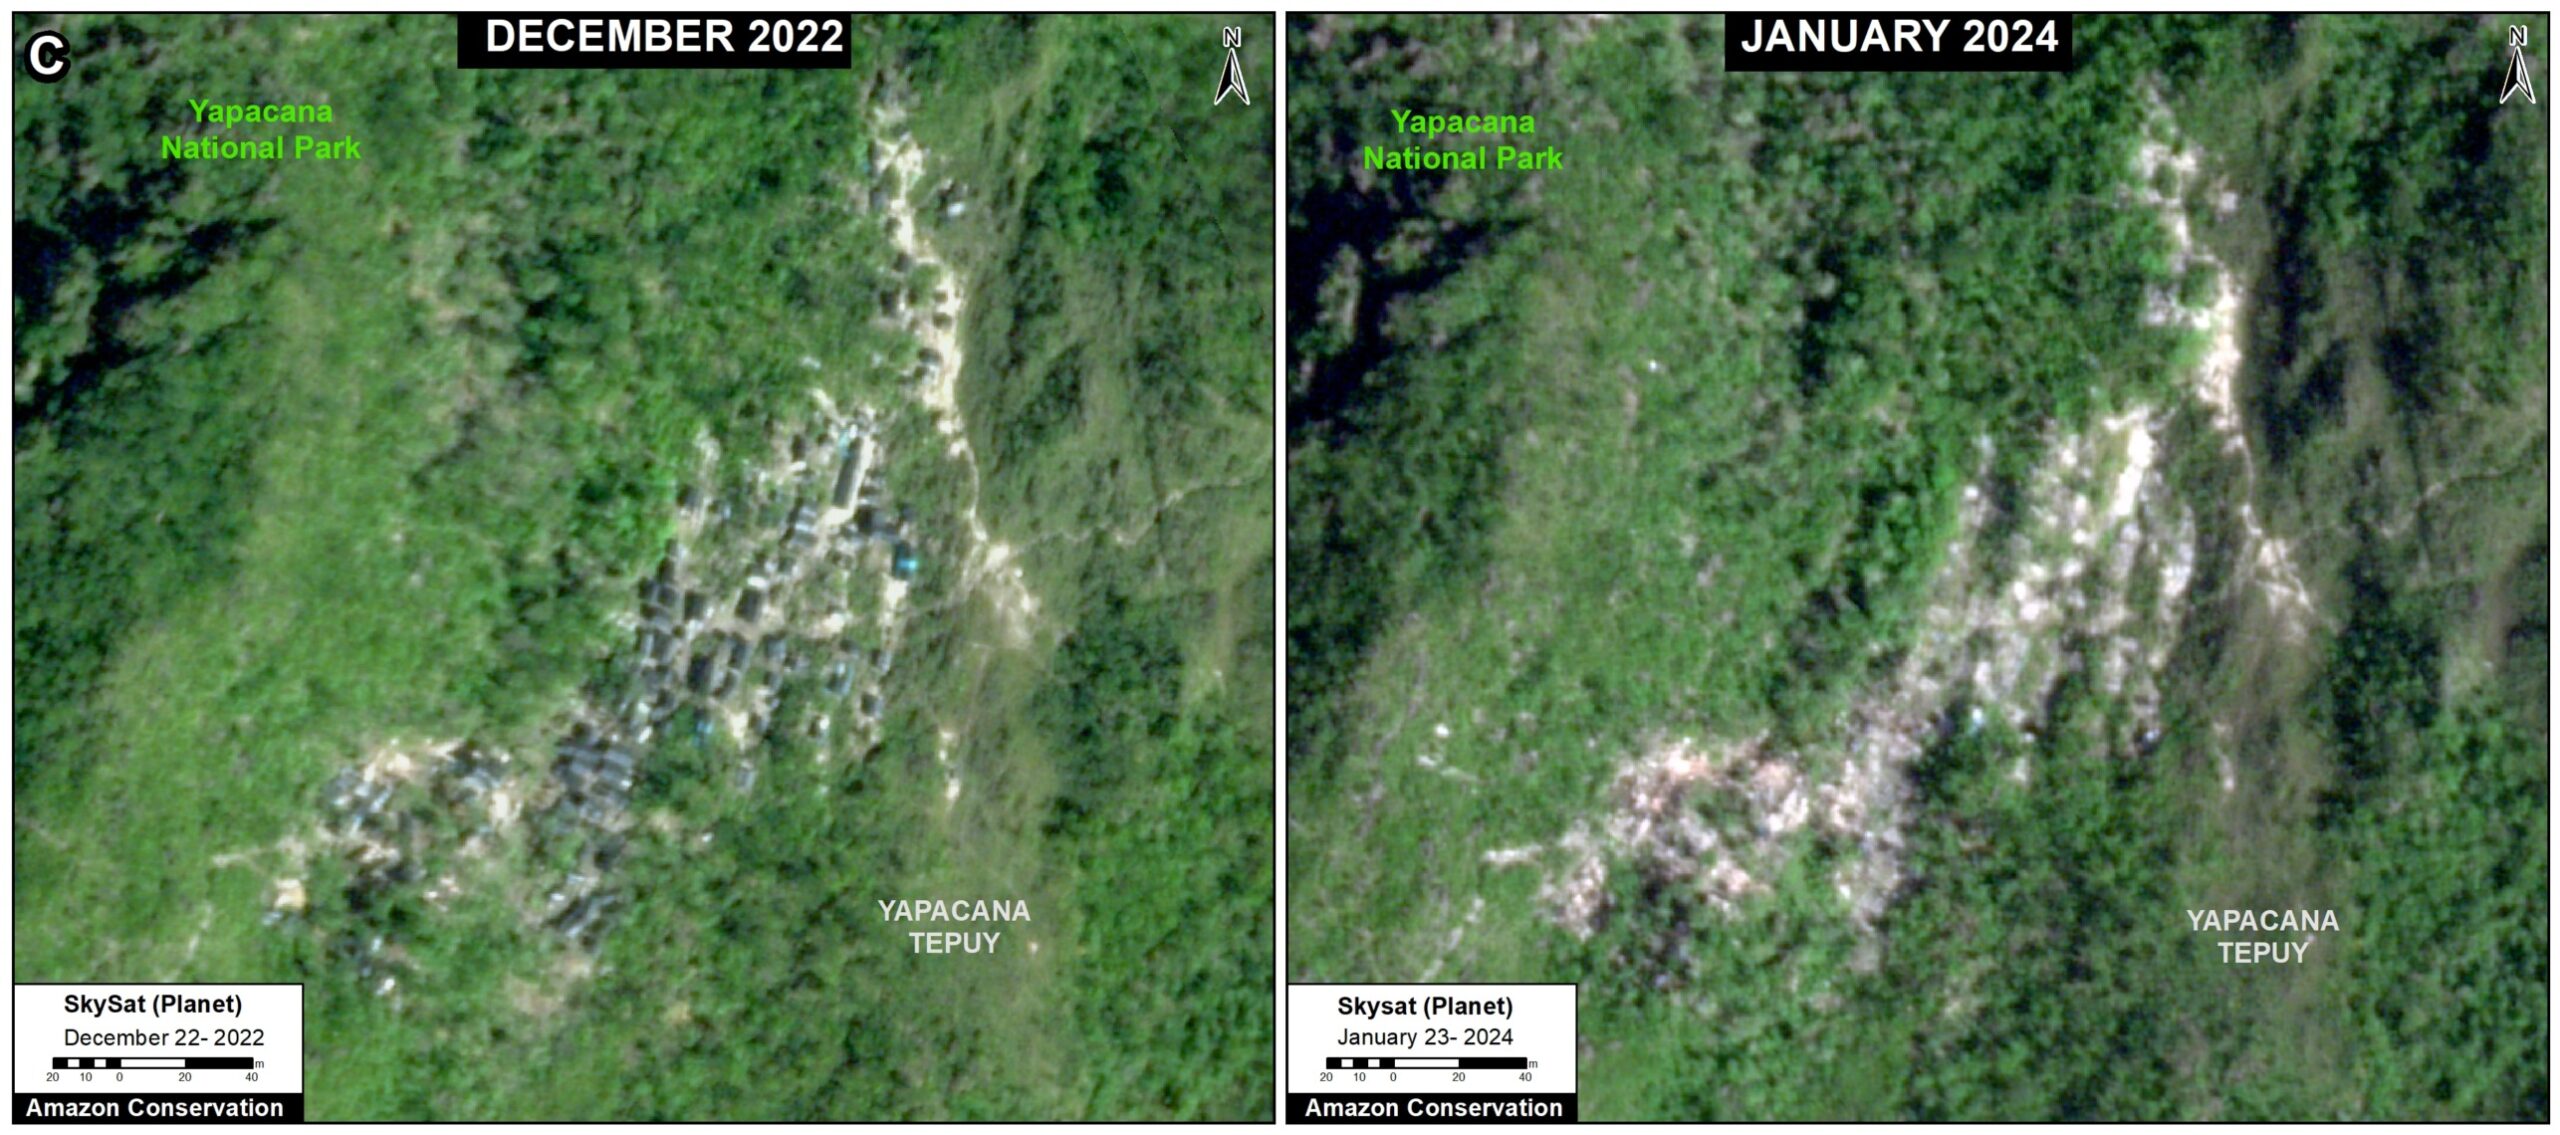
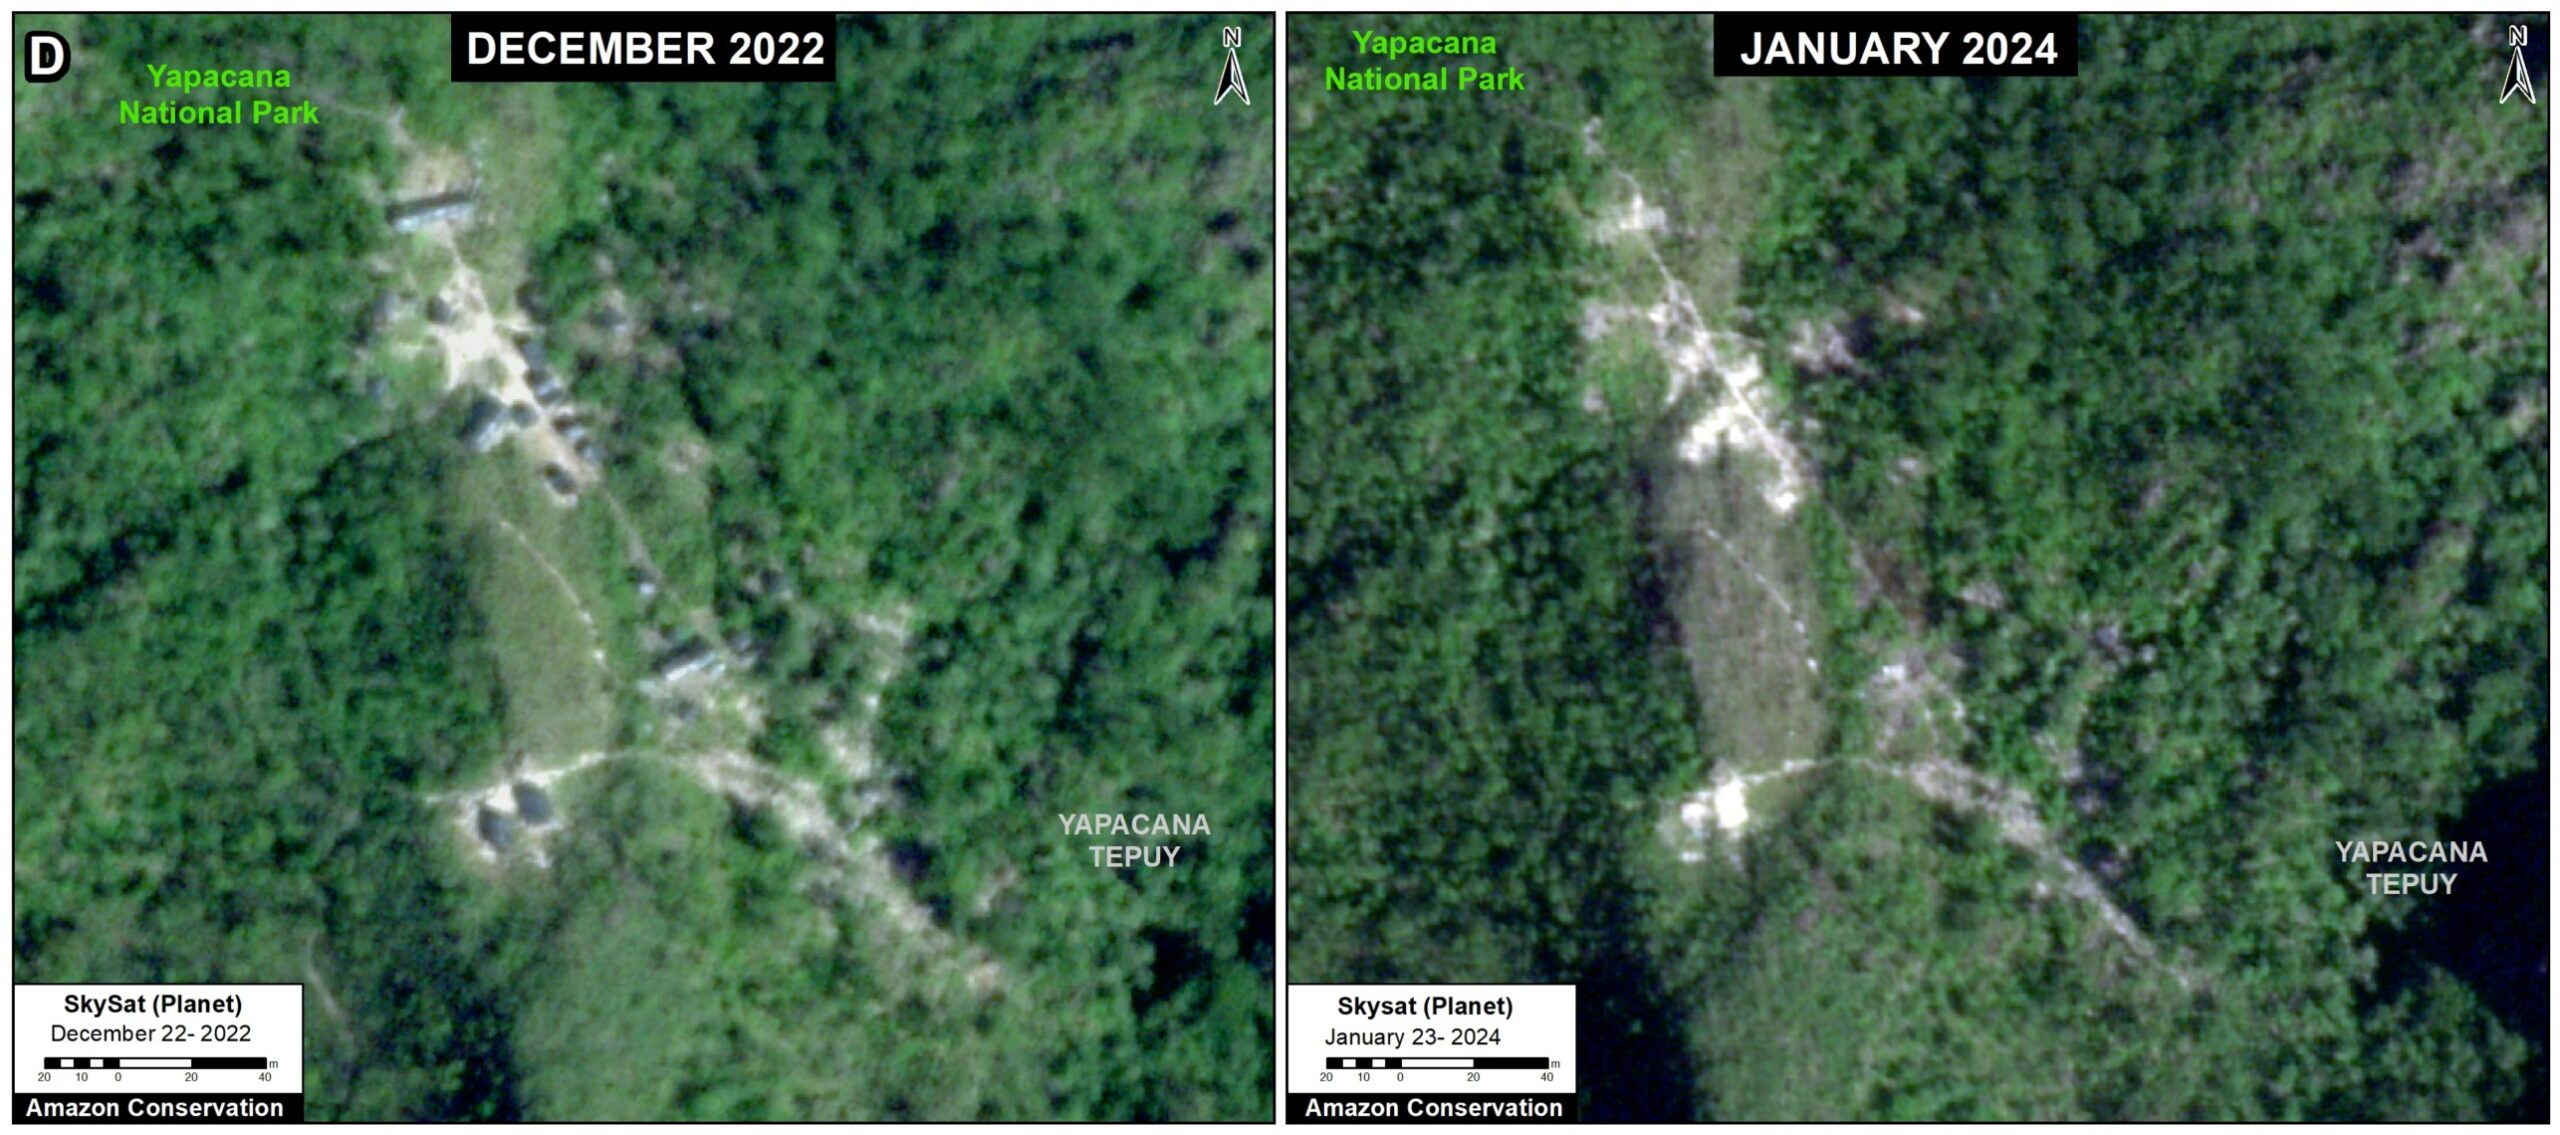
Here, we show a series of very high-resolution satellite images taken during the raid (December 2022) versus one year later (January 2024).

The images reveal that all illegal mining camps and equipment on top of the tepui have been effectively dismantled. That is, we went from 425 visible illegal mining camps and heavy equipment in December 2022 to zero in January 2024.

This removal of illegal mining activity from the tepui marks an important victory for Amazon conservation in Venezuela. However, as also detailed below, we show illegal mining continues in surrounding areas within and outside the Yapacana National Park.

Illegal Mining on the Tepui
Before vs After the Government Operation

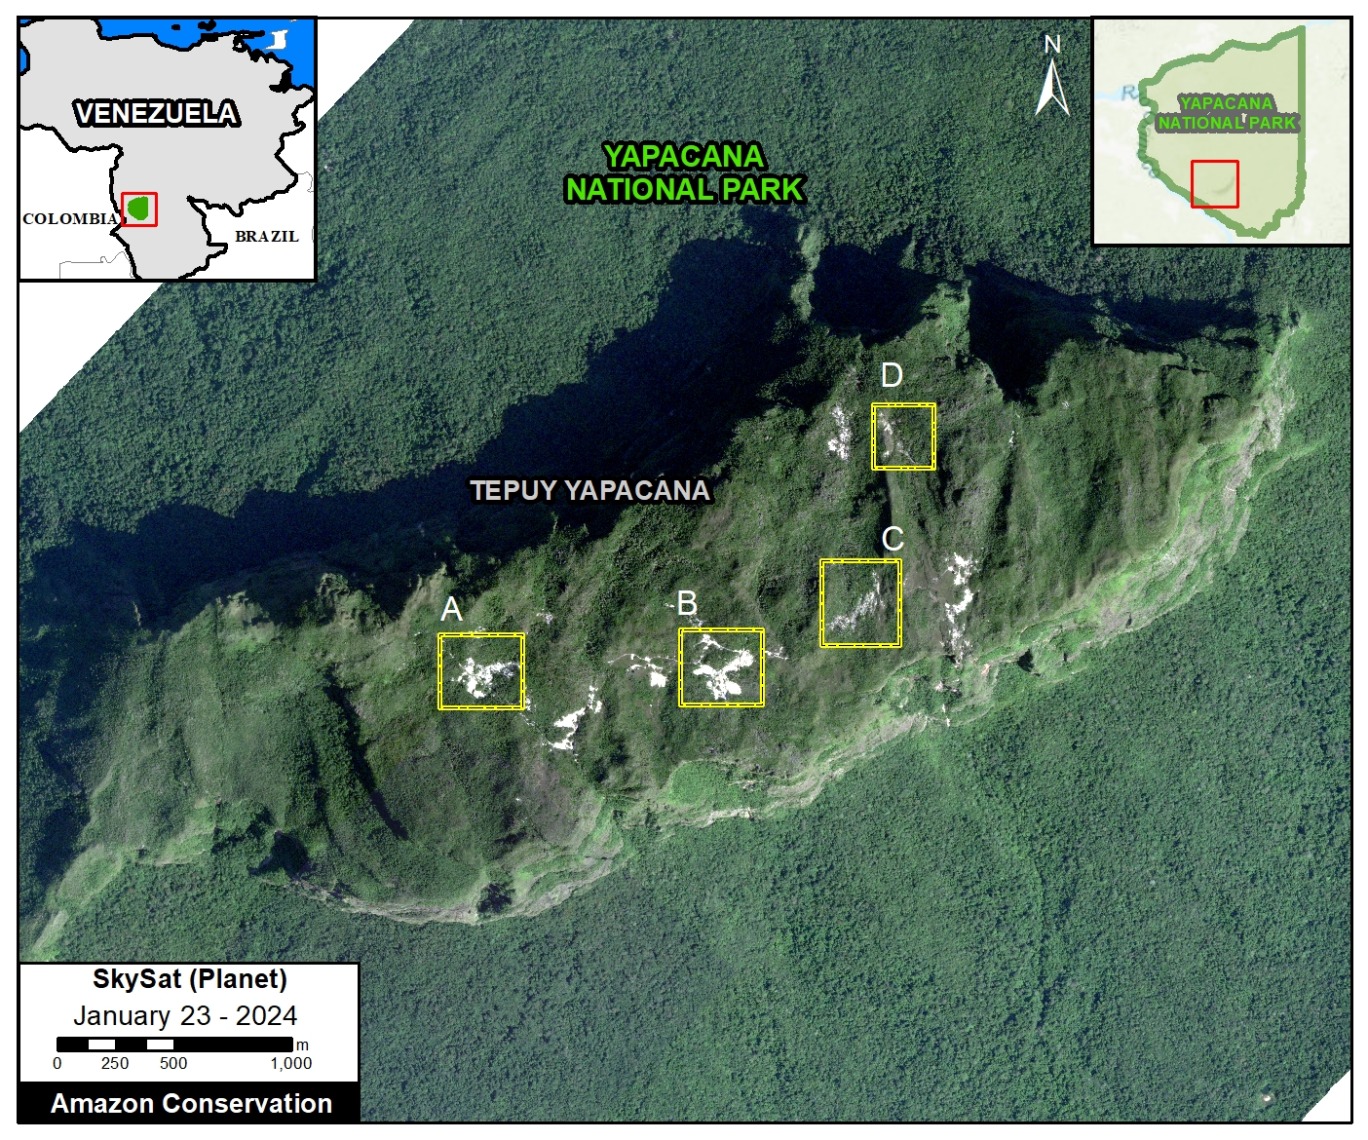
The Figure 1 (see below) shows an aerial view of the tepui as of December 2022, surrounded by the lowland rainforest of Yapacana National. The white indicates the illegal mining activity occurring on the tepui and in the park (not including the whispy clouds passing the tepui).

Insets A-D indicate the locations of the four zooms, where we show a series of very high-resolution satellite images taken during the raid (December 2022) versus one year later (January 2024). Note that in each image, there is clear evidence of mining camps in December 2022 (left image) vs. no remaining mining camps in January 2024 (right image).

Figure 1. Former active mining sites on top of tepui in Yapacana National Park. Data: Planet/Skysat, ACA/MAAP.

Yapacana Tepui, Zoom A.

Yapacana Tepui, Zoom B.

Yapacana Tepui, Zoom C.

Yapacana Tepui, Zoom D.

Mining Continues in Yapacana National Park

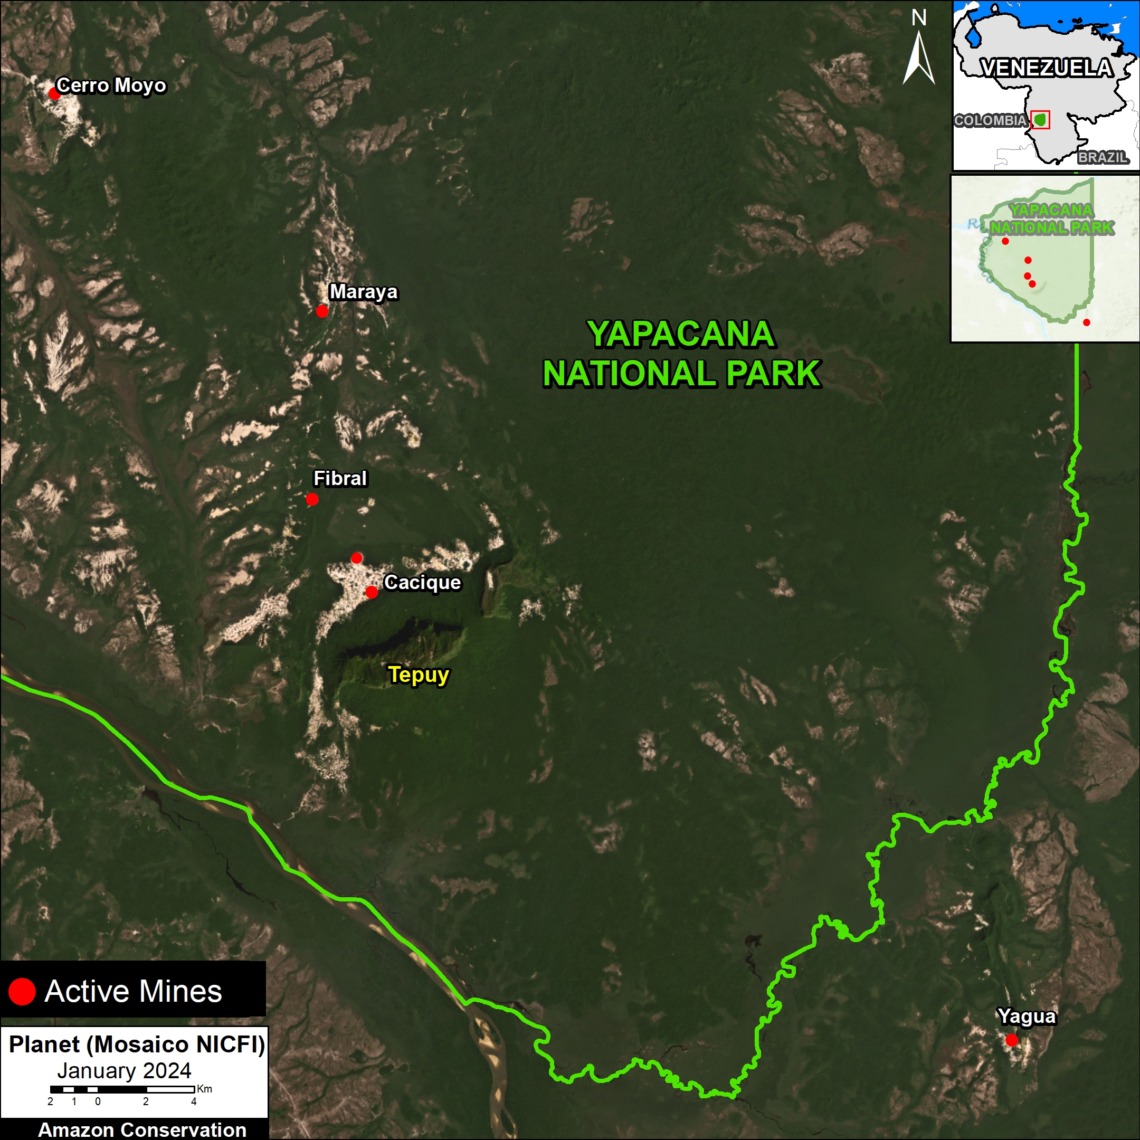
Figure 2. Active mines in and around Yapacana National Park. Data: Planet/NICFI, ACA/MAAP.

While above we credit the Venezuelan government for removing illegal mining activity from the top of the tepui, in this section we note that illegal mining is still occurring in multiple sites within and around Yapacana National Park (see Figure 2).

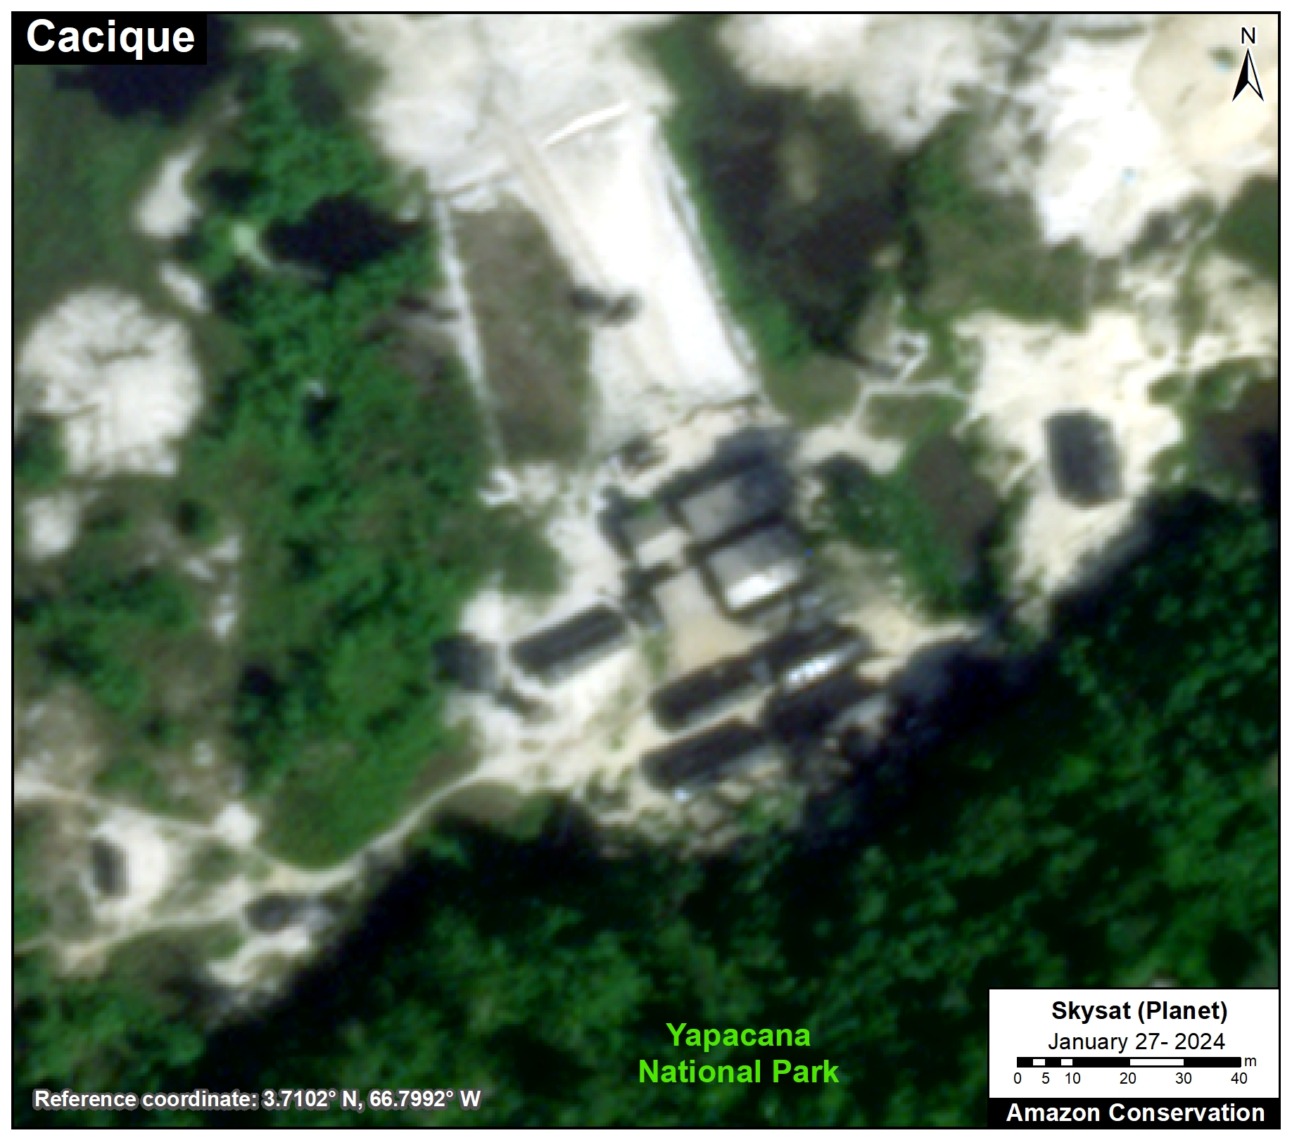
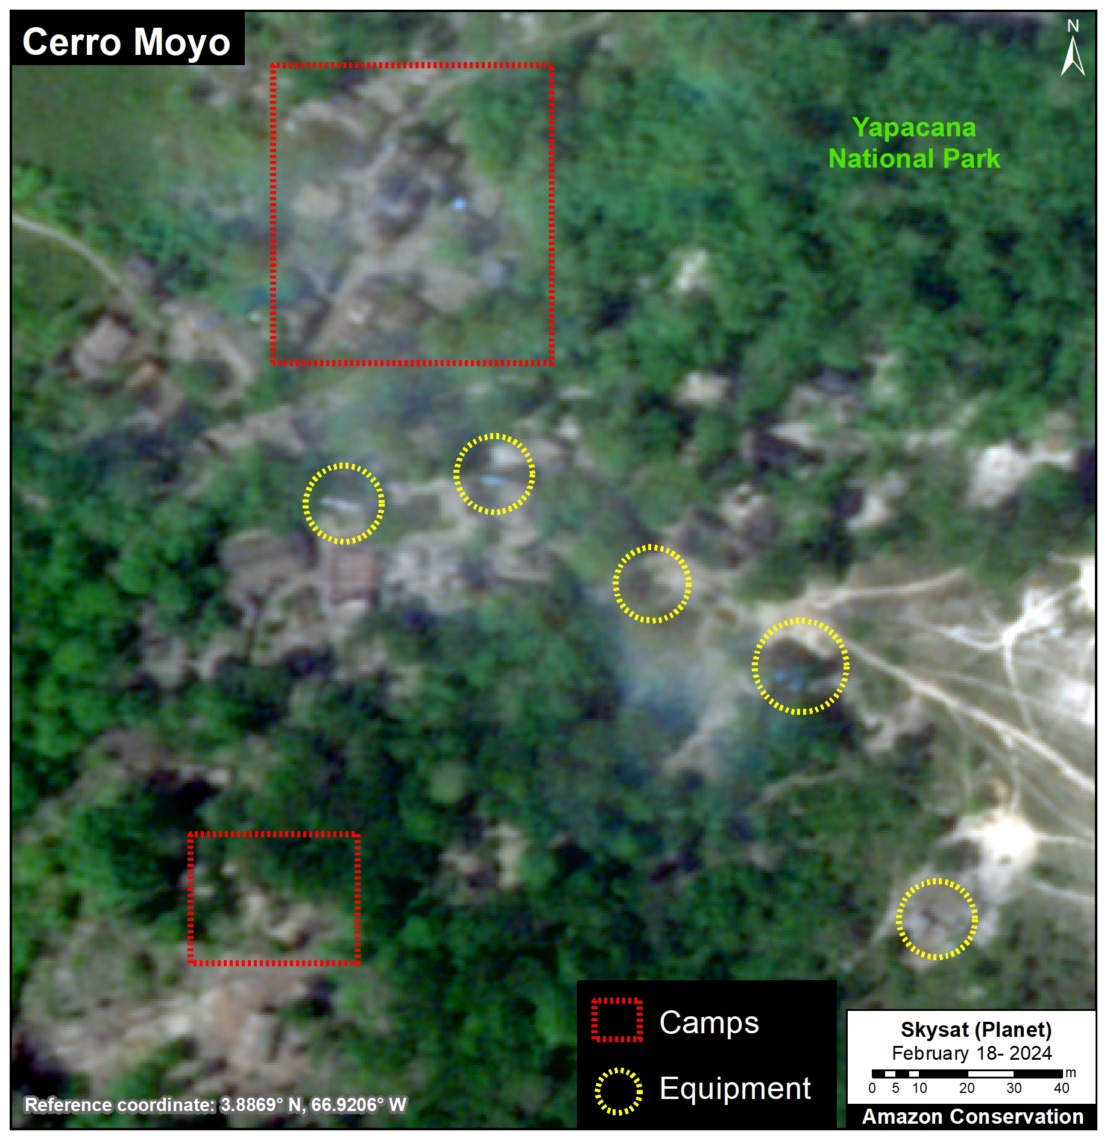
Below we show a series of satellite images of illegal mining camps and equipment in several of these continuing active sites: Cacique, Cerro Moyo, and Yagua.

Cacique

The Cacique site, located in the southern sector of Yapacana National Park close to the tepui, we recently observed what appears to be a cluster mining camps.

Figure 3. Zoom of Cacique mining site, within Yapacana National Park. Data: Planet/Skysat, ACA/MAAP.

Cerro Moyo

At the Cerro Moyo site, located in the northwest sector of Yapacana National Park, we see both mining camps and equipment.

Figure 4. Zoom of Cerro Moyo mining site, within Yapacana National Park. Data: Planet/Skysat, ACA/MAAP.

Yagua

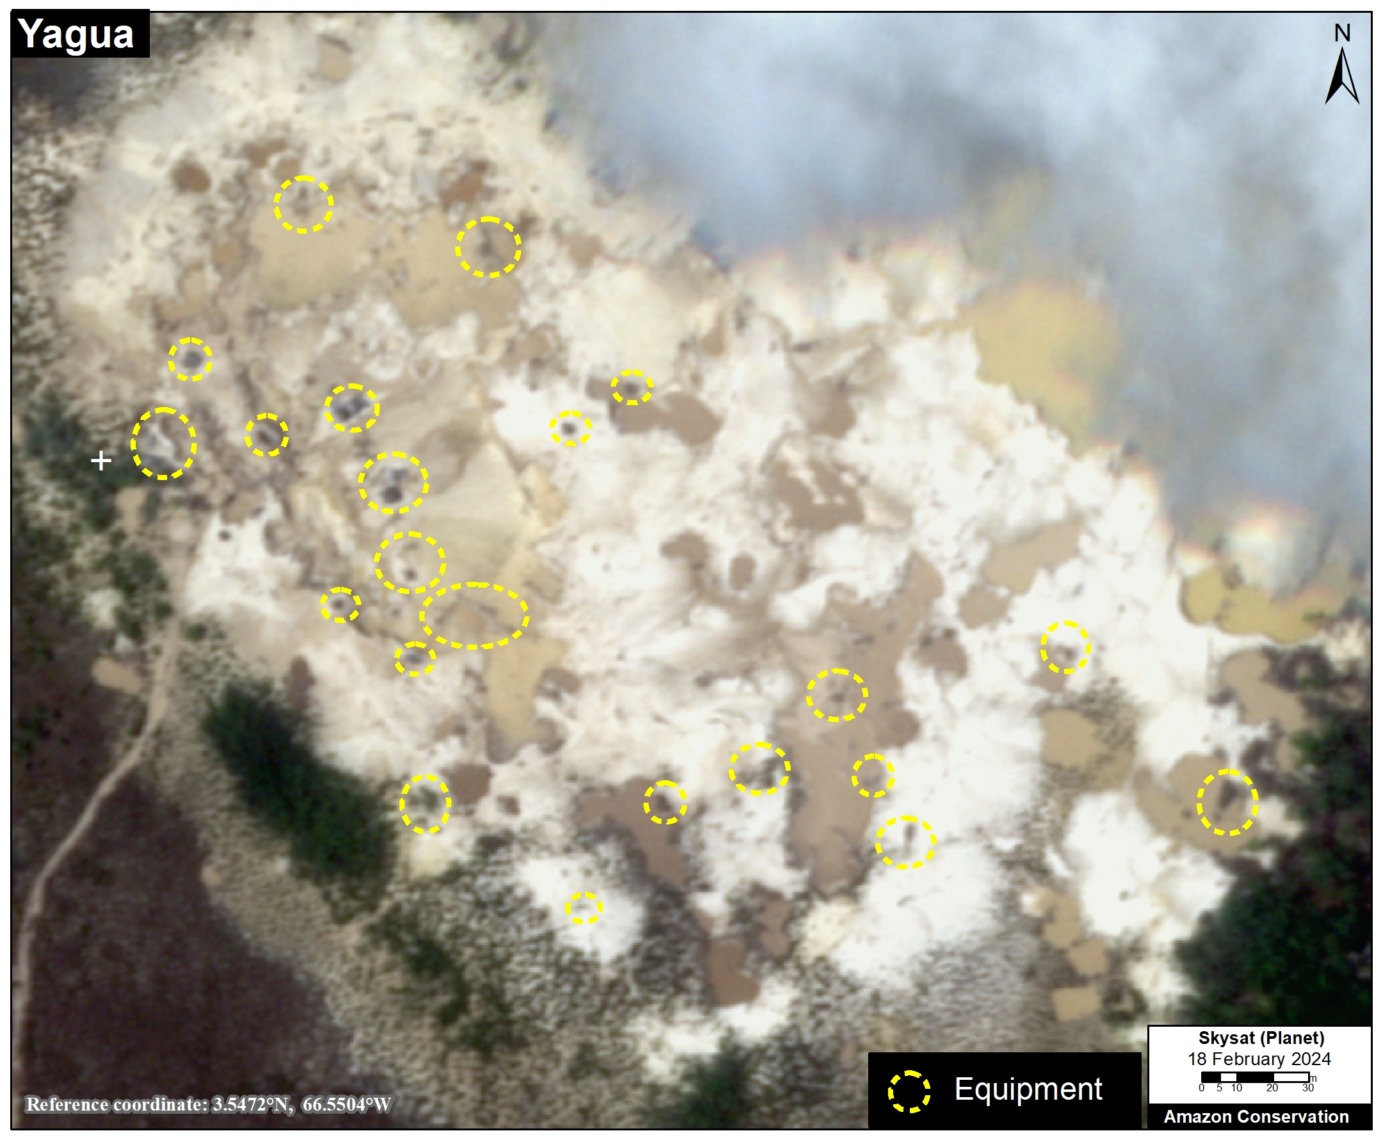
Note the Yagua site is located just outside the southeast sector of Yapacana National Park, but is also illegal (all mining within Amazonas province is prohibited by law). At this site we see abundant mining equipment.

Figure 5. Zoom of Yagua mining site, outside of Yapacana National Park. Data: Planet/Skysat, ACA/MAAP.

Reconhecimentos

We thank the organization  SOSOrinoco for important information and comments related to this report.

Citação

Finer M, Ariñez A (2024) Dismantling Illegal Mining from Sacred Tepui (Venezuelan Amazon). MAAP: 207.

MAAP #206: Rapid expansion of illegal mining in Ecuadorian Amazon

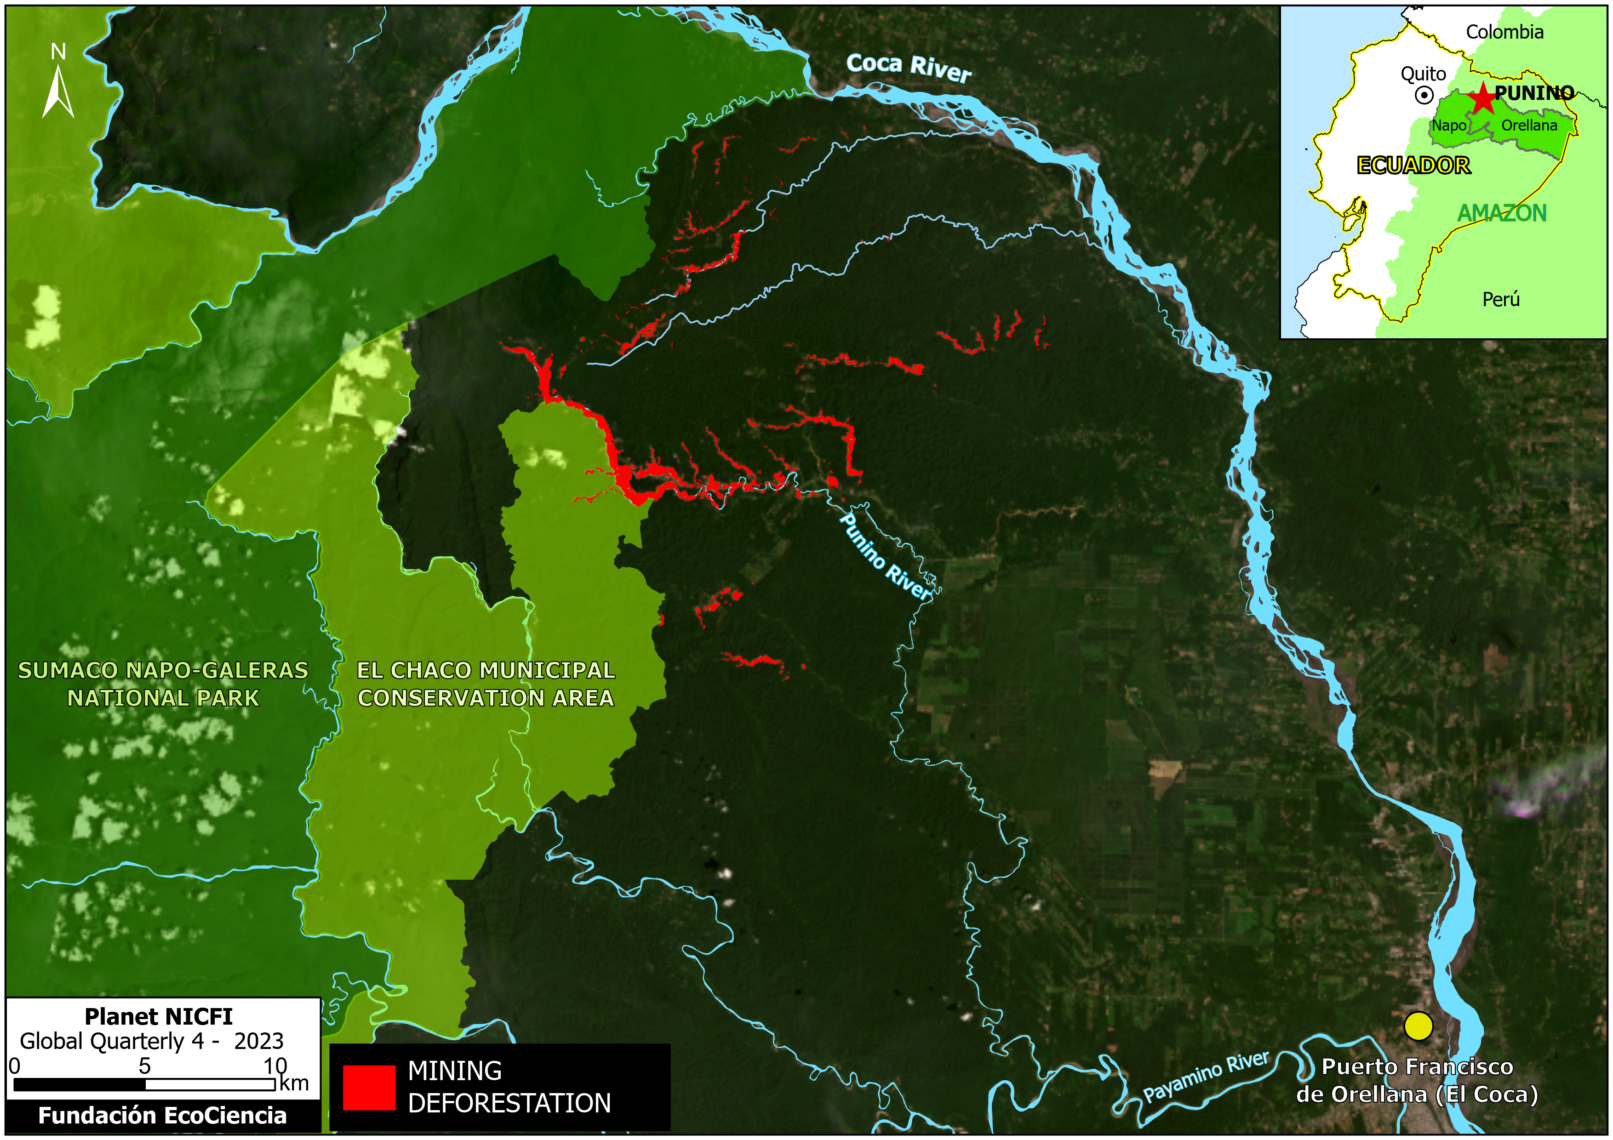
Base Map. Mining in the Punino area. Data: Planet-NICFI, EcoCiencia.

In a series of previous reports, we warned about the emergence of alluvial mining in the Ecuadorian Amazon, specifically in the area around the Punino River, located between the provinces of Napo and Orellana (MAAP #151, MAAP #182).

Here, we highlight the rapid growth of mining activity in the Punino area: 784 hectares in 2023, which represents a striking increase of 261%.

This mining activity is mainly dedicated to the extraction of gold.

The vast majority of the detected activity is illegal mining, as it is outside the limits of the areas authorized for mining. For example, note the threat that illegal mining represents for the newly created El Chaco Municipal Conservation Area (see Base Map).


Rapid expansion of mining deforestation in 2023

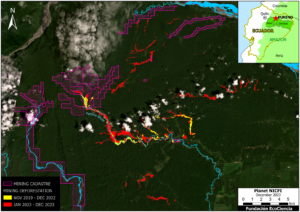
Image 1 emphasizes the rapid expansion of mining deforestation in the Punino area in 2023 (red), relative to the previous three years (yellow).

The yellow indicates the mining deforestation of 217 hectares between November 2019 and December 2022, while the red shows the rapid expansion of 784 hectares (1,937 acres) from January to December 2023.

Thus, in total, the forest area affected by mining activity is 1,001 hectares (2,474 acres), from 2019 to the present.

Moreover, Image 1 clearly shows that the majority of mining deforestation is located outside the limits of authorized mining areas (purple). Specifically, we estimate that 90.4% of the total affected area (904 hectares, or 2,234 acres) represent illegal mining.

Image 1. Dynamics of mining activity between 2019 and 2023 in the Punino area. Data: Planet-NICFI, EcoCiencia.

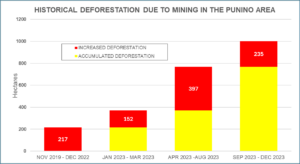
Graph 1 shows the rapid escalation of mining deforestation in 2023 (bars 2, 3 and 4) relative to the previous three years (bar 1).

Graph 1. Deforestation due to mining in the Punino area between 2019 and 2023

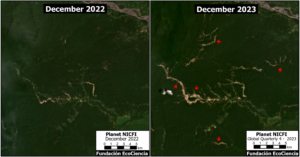
Image 2 shows, with high-resolution satellite images, the expansion of mining deforestation in the Punino area between December 2022 (left panel) and December 2023 (right panel). The red arrows indicate the main areas of mining expansion.

Acknowledgments

This report is part of a series focused on the Ecuadorian Amazon through a strategic collaboration between the organizations EcoCiencia Foundation and Amazon Conservation, with the support of the Norwegian Development Cooperation Agency (Norad).

Ecociencia Logo

MAAP #204: New Road Construction in Waorani Indigenous Territory (Ecuadorian Amazon)

We analyze a new road project that enters the western sector of the Waorani Indigenous Territory, located in the heart of the Ecuadorian Amazon (see Base Map, below).
The project, called “Construction of the Arajuno-Nushiño-Ishpingo-Toñampade Road”, has been designed in response to the mobility needs of eight Waorani communities in the area, including Toñampade, the most populated community in the territory.

This road would cross 42 kilometers of primary forest from the Nushiño River to the community of Toñampade. Therefore, there is great potential to open new deforestation fronts along the route.

This road project was managed, approved, and promoted through the Waorani Nationality of Ecuador (NAWE) and its construction is led by the Provincial Government of Pastaza.

The Environmental Impact Study and  Management Plan for this road was prepared in 2016 and approved in 2018 and mentions the importance of protecting the biodiversity of the area and the cultural importance of the Amazon rainforests in the Waorani Territory.

In March 2023, the Waorani Organization of Pastaza (OWAP) presented a complaint to the Ministry of the Environment, in which it requested to suspend the construction of the road until the protection of the ecosystems is ensured.

In July, an assembly convened by the NAWE was held to discuss the road project, in which a consensus was sought with the OWAP to restart construction. The agreement was obtained that both Waorani entities, and the communities of Pastaza, will provide monitoring and control so that the technical specifications of the Environmental Impact Study and  Management Plan are met.

The objective of this report is to analyze the current state of the road, focused on deforestation caused by the construction (see Image 1), and the actions carried out by Waorani organizations to monitor the project.

Base Map of the Road Project

The Base Map shows the location of the project “Construction of the Arajuno-Nushiño-Ishpingo-Toñampade Road”, located in the heart of the Ecuadorian Amazon.

Base Map. Nushiño-Toñampade satellite monitoring area. Data: Planet-NICFI, EcoCiencia.

Road Construction

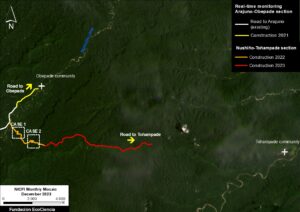
To document the current state of the road, we analyzed satellite imagery from September 2021 to January 2024. We found a total of 15.8 kilometers of construction (see Image 2).

In September 2021, the construction of the road section towards the community of Obepade was carried out, extending the previously built road from Arajuno (white line), with a new additio of 2.1 kilometers (yellow line).

From July 2022 to July 2023, construction was carried out from the Nunshiño River, reaching a total of 13.7 km towards Toñampade (orange and red lines). There is no evidence of new construction since July 2023, likely due to the above-noted complaint from OWAP.

Thus, the project still needs to construct 28.3 km through primary forest to reach Toñampade.

Image 2. Progress of the Nushiño-Toñampade road. Data: EcoCiencia; Planet-NICFI.

Territorial Monitoring of Road Construction

Image 3.

In 2022, the Waorani Nationality of Ecuador – NAWE, through its territorial technical team Kenguiwe, carried out the first territorial monitoring and surveillance tours to identify the environmental and social impacts of road construction.

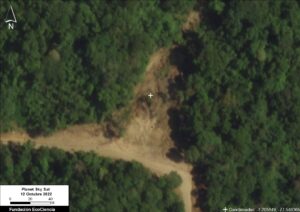
Two cases were discovered where the construction of the road has generated deforestation processes along the route. See the location of these two cases in Image 2.

In the first case, an area of 0.54 hectares was deforested as a consequence of the construction of the road (Image 3). Potentially this deforestation process occurred to find alternative routes to the road.


In the second case, 5.27 hectares was deforested, additionally leading to a mudslide.

Monitoring by  the Waorani Nationality of Ecuador

Here we present a series of photographs from the territorial monitoring by the Waorani Nationality of Ecuador, investigating the impacts of the new road construction. All photo credits to the NAWE monitoring program.


Acknowledgments

We thank NAWE for facilitating and authorizing the use of the information and images generated by the monitoring work carried out by its technical team called “Kenguiwe”, with financial support from the EcoCiencia Foundation and the French Development Agency (AFD)  through the TerrIndigena Project.

This report is part of a series focused on the Ecuadorian Amazon through a strategic collaboration between the organizations Fundación EcoCiencia and Amazon Conservation, with the support of the Norwegian Development Cooperation Agency (Norad).

Ecociencia Logo


MAAP #206: Direct Link Emerges between Mennonites and Potential Large-scale Deforestation in Suriname

In the recent MAAP #203, we reported that the government of Suriname is preparing to clear large tracts of Amazon rainforest for agriculture.

Specifically, we estimated that a shocking 451,000 hectares (1.1 million acres) of primary forest were threatened in the proposed agricultural plots.

Intertwined with this issue are additional reports indicating that groups of Mennonites are in the process of relocating to Suriname from Bolivia. This raised alarms given the extensive large-scale agriculture deforestation caused by Mennonites in the Amazon regions of both Peru and Bolivia.

Here we report the first evidence directly linking the Mennonites with potential large-scale deforestation in Suriname.

As background, the agricultural real estate company Terra Invest is responsible for all aspects of the project to bring select Mennonites families to Suriname from Bolivia1. As detailed in the Bolivian news outlet Nomadas, the Suriname government would grant the agriculture land to Terra Invest, who would then transfer the land to societies formed by Mennonites in Suriname. 

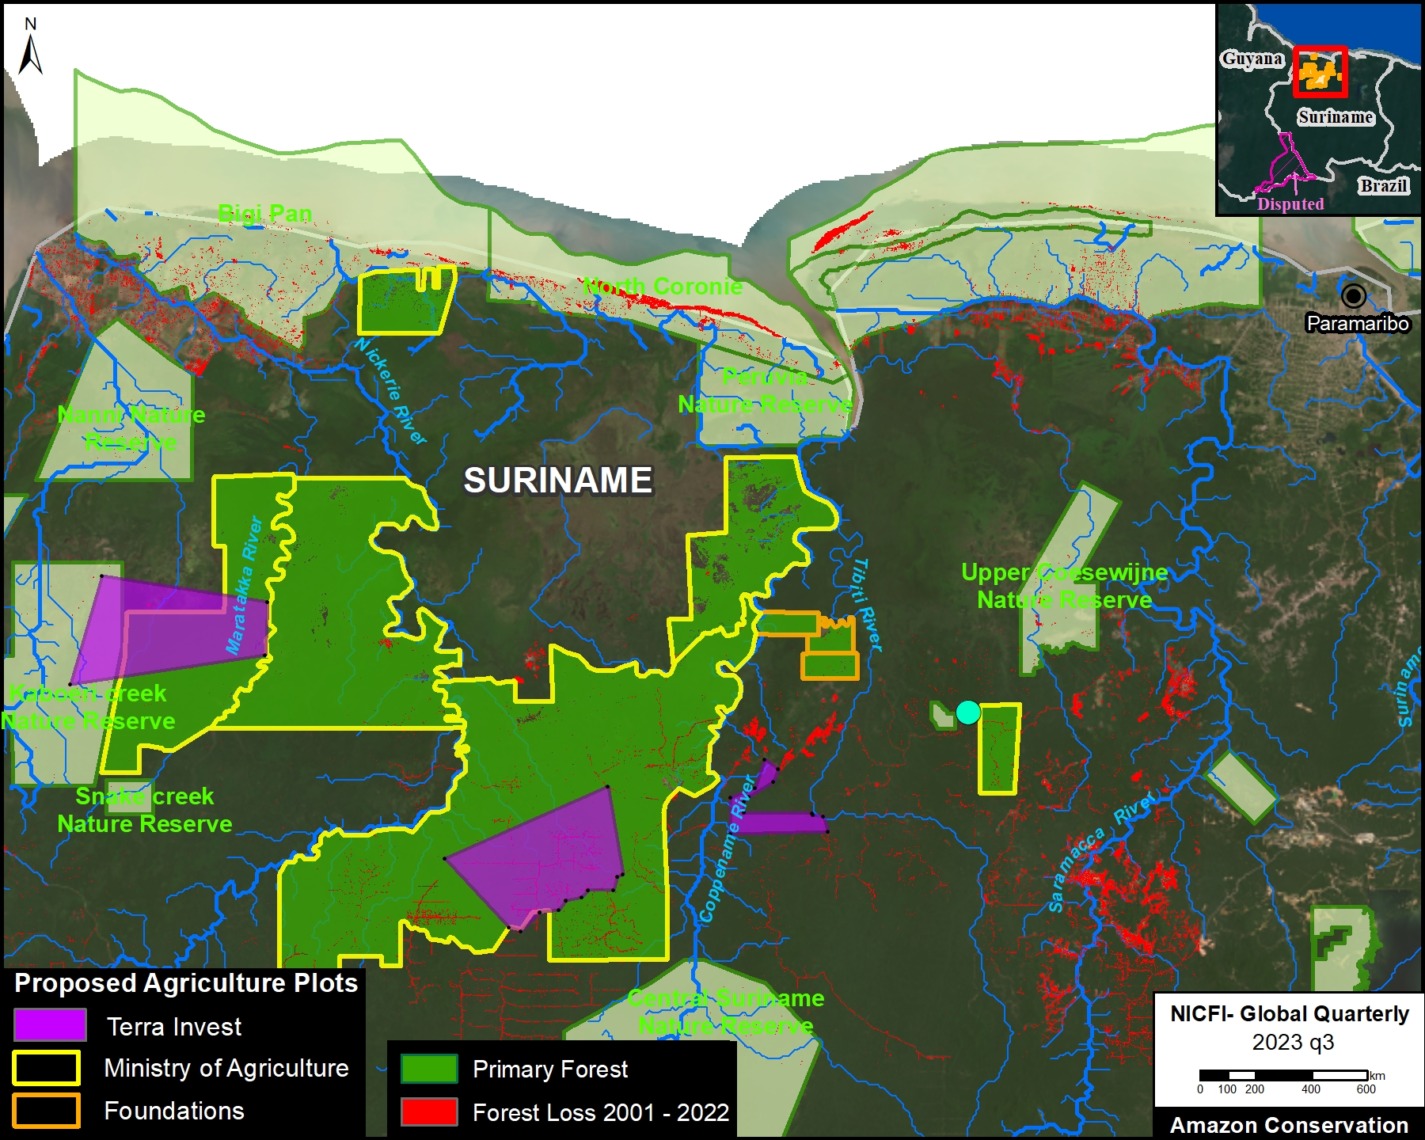
Newly leaked government documents, from Suriname’s Ministry of Land and Forest Management dated to February 2023, provide the first available spatial data on the location of proposed lands to Terra Invest.

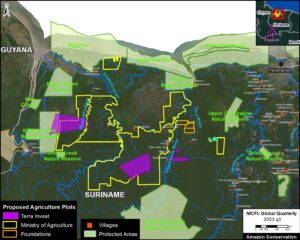
These lands are broken down into three separate areas, totaling 78,775 hectares.

The Base Map shows these Terra Invest request areas (purple) in relation to the previously published information on proposed agricultural plots to the Ministry of Agriculture and Foundations backed by private land developers.

Potential Primary Forest Loss

We performed an additional analysis looking at how much primary forest is contained and threatened in these proposed agriculture plots to Terra Invest. This analysis was based on data from the University of Maryland and Global Forest Watch.

In Figure 2, we show that the proposed Terra Invest plots threaten 76,932 hectares of primary forest. Note that 8,991 hectares of primary forest overlaps with Kaboeri Creek Nature Preserve.

We also that of the above total, 22,675 hectares of primary forest are in addition to what was previously calculated for the Ministry of Agriculture lands. Thus, we now estimate that 473,675 of primary forest are threatened across all three types of proposed agriculture plots (Terra Invest, Ministry of Agriculture, and Foundations).

Notes

  1. Bolivian mennonites bring the «hell» of deforestation to Suriname

Citation

Finer M, Goedschalk J, Arinez Z (2024). Direct Link Emerges between Mennonites and Potential Large-scale Deforestation in Suriname. MAAP: 206.

MAAP #203: Massive Planned Deforestation in Amazon of Suriname

In a recent article, the environmental science news platform Mongabay reported that, according to their review of official documents, the government of Suriname is preparing to clear large tracts of Amazon rainforest for agriculture.

Mongabay reported that a massive amount of land (365,704 hectares, or 903,674 acres) was being targeted for new agriculture plots being established for the Ministry of Agriculture (354,836 hectares) and private land developers (10,868 hectares).

This is additionally noteworthy because large-scale agriculture is not historically or currently a deforestation driver in Suriname, so these new plots would likely trigger unprecedented forest loss in one of the world’s few remaining countries dominated by primary rainforest.

Intertwined with this issue are additional reports indicating that groups of Mennonites are planning to relocate to Suriname. This news has also raised alarms given the extensive deforestation caused by Mennonites in the Amazon regions of both Peru (7,032 hectares) and Bolivia (210,980 hectares).

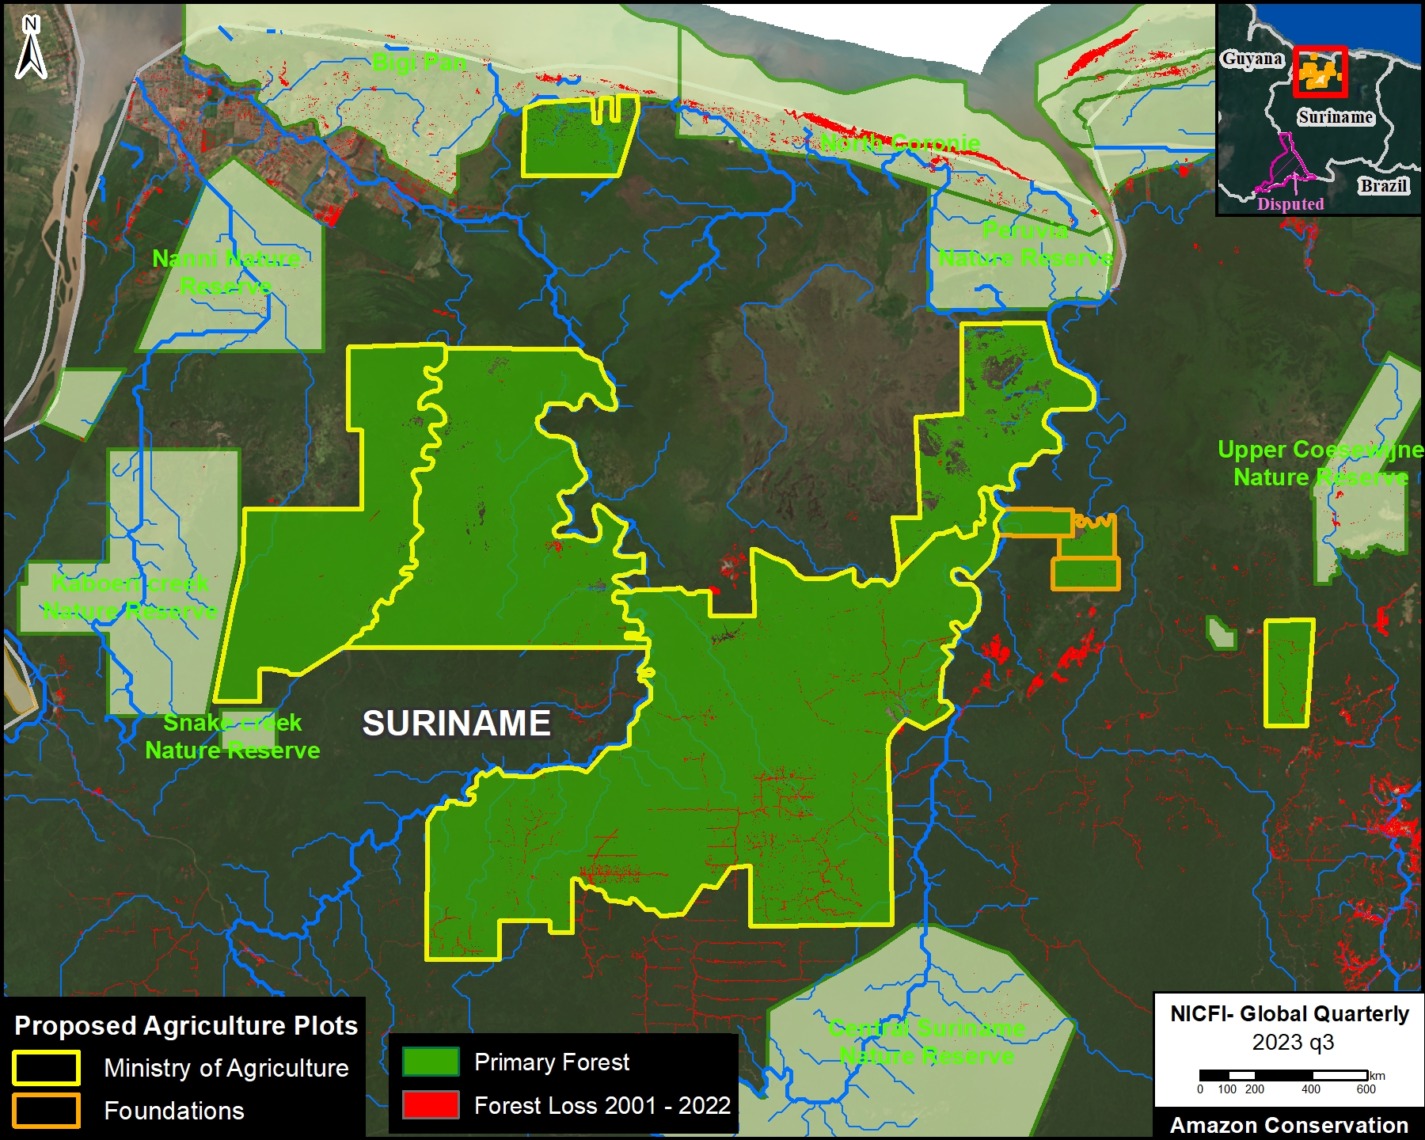
In their article, Mongabay gathered information from the government documents to create a map of the proposed agriculture plots. We then digitized this map, calibrated it with coordinates in the documents, and then conducted our own analysis.

The Base Map shows our digitized map of the agricultural plots, with the inclusion of protected areas and Indigenous & Tribal Peoples villages, all overlayed on top of a recent satellite image.

We estimate 467,000 hectares in the proposed new agricultural plots (456,238 ha for the Ministry of Agriculture and 10394 ha for Foundations backed by private land developers). Note this is substantially higher than the estimate reported by Mongabay. Additional analysis of the documents indicates that the actual total could rise to 560,000 hectares.

Potential Primary Forest Loss

We performed an additional analysis looking at how much primary forest is contained and threatened in these proposed agriculture plots. This analysis was based on data from the University of Maryland and Global Forest Watch.

In Figure 2, we estimate 451,000 hectares of threatened primary forest in the proposed agriculture plots (441,362 ha for the Ministry of Agriculture and 9,958 ha for Foundations backed by private land developers).

This would result in a shocking amount of primary forest loss for a country that has experienced an average annual deforestation of 6,560 hectares over the past 21 years (137,746 hectares in total since the year 2002).

Citation

Finer M, Goedschalk J, Arinez Z (2024) Massive Planned Deforestation in Amazon of Suriname. MAAP: 203.

MAAP #202: Protecting Strategic, Free-flowing River Corridors in the Ecuadorian Amazon

Photo credit: Wil Henkel

Here, we present a model river conservation strategy proposed by the Ecuadorian Rivers Institute, designed to protect strategic free-flowing river corridors with intact surrounding forests in the critical transition zone between the Andes mountains and the Amazon lowlands.

The vision is to conserve freshwater resources and their surrounding riparian forests, encourage sustainable economic alternatives, and preserve free-flowing ecological connectivity at the basin scale.

There are few remaining high-quality and ecologically intact Andean-Amazon watershed corridors in Ecuador, making their protection and management an urgent national priority, ideally as part of a larger global tropical river conservation strategy

The proposal targets strategic corridors that have three major characteristics:

  1. Free-flowing rivers with no dams, diversions, or channel modifications, and no mining or dredging.
    h
  2. High-quality rivers that are a reference for water quality and have exceptional natural and cultural values.
    j
  3. Forested riparian buffer zones to preserve the quality and integrity of the river corridor, enhance the ecological connectivity between protected areas, and preserve habitat throughout critical transition zones.

These core components provide the key elements that are needed to preserve, restore, and enhance the integrity of the freshwater biodiversity, aquatic ecosystems, and scenic landscapes of strategic, free-flowing river corridors in the tropical Andes.

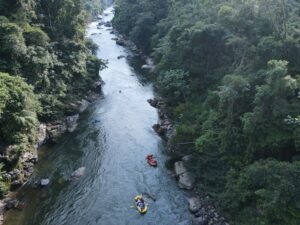
See aerial photo of a section of the proposed river conservation corridor, highlighting some of the key components of the proposal: free-flowing river, intact riparian forest, and sustainable, low-impact tourism.

Priorities for River Protection in Ecuador

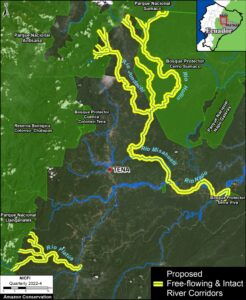
Base Map. Proposed free-flowing and intact riparian forest corridors (highlighted in yellow) in the northern Ecuadorian Amazon. Data: ERI.

The Base Map illustrates two proposed pilot projects in the northern Ecuadorian Amazon. Both represent key habitats for native fisheries and migratory birds and are important destinations for sustainable ecotourism activities. Following these two examples, national, regional (Amazon-scale), and global river protection programs could be created to include additional watershed corridors.

Jondachi-Hollín-Misahuallí-Napo River Corridor

The Jondachi and Hollín Rivers are major free-flowing tributaries of the Misahuallí River sub-basin in the Napo River watershed. These rivers drain from the Antisana and the Sumaco Napo Galeras National Parks, and provide strategic connectivity in a critical transition zone between montane cloudforests and lowland rainforest.

The proposed corridor would protect 200 km of free-flowing rivers and 19,050 hectares of riparian forest (with the application of 500m-wide buffers) within the Sumaco Biosphere Reserve. A significant portion of the corridor is within a forest reserve to provide enhanced connectivity and protection. The proposed corridor is an established destination for a variety of low-impact ecotourism activities that provide significant benefits to the local economy.

Piatúa River Corridor

The Piatúa River is another world-class paddle sports ecotourism destination that is renowned for its natural bathing areas with crystal clear water and sculpted granite boulders. The Piatúa River is a tributary of the Anzu River sub-basin of the Napo River watershed, which drains out of rugged paramo tundra and montane cloud forests deep within the Llanganates National Park, and provides critical ecosystem connectivity through a wide elevation range with high levels of endemic species.

The proposed corridor would protect 46 km of free-flowing rivers and tributaries and 947 hectares of riparian forest (with the application of a 100m-wide riparian buffer)

River Conservation Strategy

Guidelines for Protection

Legally binding frameworks are needed which restrict the development of intensive land-use activities and hydraulic infrastructure, and guarantee high-level, permanent protection of natural river corridors and natural instream flow regimes, with riparian buffer zones to preserve aquatic habitat and water quality. Ecuador has an existing framework which can be used to designate protected river corridors with the same status as national parks. However, until now it has only been applied to protect small catchment basin areas for sources of drinking water in headwater tributaries.

Management recommendations

Comprehensive management plans must be developed with meaningful public participation, and provisions for monitoring, control and enforcement of restricted activities. Independent monitoring and evaluation is necessary to ensure adequate compliance and implementation is achieved. Academic institutions should be encouraged to participate and develop research programs which reinforce the management objectives.

Social component

The successful implementation of the proposed river protection strategy depends on the active participation and endorsement by the local population and people who use the resource, along with adequate governance, and sufficient funding for management and incentives.

Protecting the river corridor ensures sustainable economic benefits for the inhabitants of the region through low-impact ecotourism activities (such as kayaking, rafting, mountain biking, bird watching, and hiking) which are compatible with the management of the resource.

However, additional financial incentives (such as land grants) are needed to reach other sectors of the population in order to take pressure off of the increasing encroachment into the forested riparian corridors for timber harvesting and subsistence-level agricultural expansion.

Ongoing support and guidance is also needed for local communities and landowners to identify employment opportunities and encourage other sustainable production activities in order to optimize the use of degraded areas outside of the protected riparian buffers.

In the case of plastic recycling, the population of Ecuador has responded favorably to adapting cultural and behavioral norms in response to small incentives created by a tax on plastic beverage containers, to address a significant waste management issue. This is a positive sign for what to expect if incentives are provided for protecting natural river corridors.

Financial mechanisms

Securing long-term financial commitments is a fundamental component to ensure the viability of any natural resource protection program. Most developing countries are burdened by foreign debt and are struggling to meet their fiscal obligations and priorities, which often lessens priorities for environmental management. However, experience has shown that the international community responds favorably to reinforce commitments made by host countries to preserve natural and cultural heritage of global significance, and debt forgiveness and debt reduction transactions for host country governments, from wealthy countries would be expected to provide some funding for the proposed strategy to protect strategic free-flowing river corridors in Ecuador.

The Government of Ecuador is facing a critical economic situation. However, water conservation funds have been successfully implemented to cover the cost of managing the protection of drinking water sources for metropolitan areas by including a small environmental management fee on monthly water bills. Some of these water conservation funds have generated substantial levels of endowment to the point where they could have the potential to provide funding for the protection of strategic river corridors, if that was authorized by the water fund consortium.

While the outcome of COP28 may have put a temporarily damper on the value of the nascent carbon credit market, once the programs are restructured to provide for improved accountability and implementation, the expectations for carbon credits to provide a source of long-term funding for the protection and management of strategic free-flowing river corridors as a climate mitigation strategy are quite encouraging, as are expectations for eventual funding allocations for river protection to be derived from the COP21 Paris Climate Accord, and the Global Environmental Facility (GEF).

Meanwhile, voluntary contributions from hydroelectric projects and extractive projects to offset their impacts by designating a percentage of annual income from the generation of electricity for the protection of free-flowing river corridors.

Likewise, voluntary contributions from international finance institutions based on a percentage of annual revenue disbursed through their investment portfolio could provide meaningful support for the protection of free-flowing river corridors, once these agreements are established.

Annex

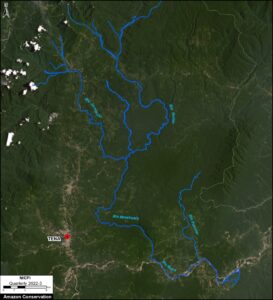
Herre is a recent satellite image of the Jondachi-Hollín-Misahuallí-Napo River Corridor. Note the intact river and forest core to the east of the major road network, and north of the Napo River.


Citation

Terry M, Finer M, Ariñez A (2023) Protecting Free-flowing & Intact River Corridors in the Ecuadorian Amazon. MAAP: 202.