Continuing our annual series, we present a detailed look at the major 2025 Amazon forest loss hotspots and trends, based on the annual data recently released by the University of Maryland and featured on Global Forest Watch. As in other reports of the series, we take this global dataset and analyze it specifically for the Amazon.
This dataset, which serves as a consistent source across all nine countries of the Amazon, distinguishes forest loss from fire and non-fire causes. We use the non-fire forest loss as a proxy for human-caused deforestation, although it also includes some natural loss. In addition, we apply a filter to focus just on primary forest loss.
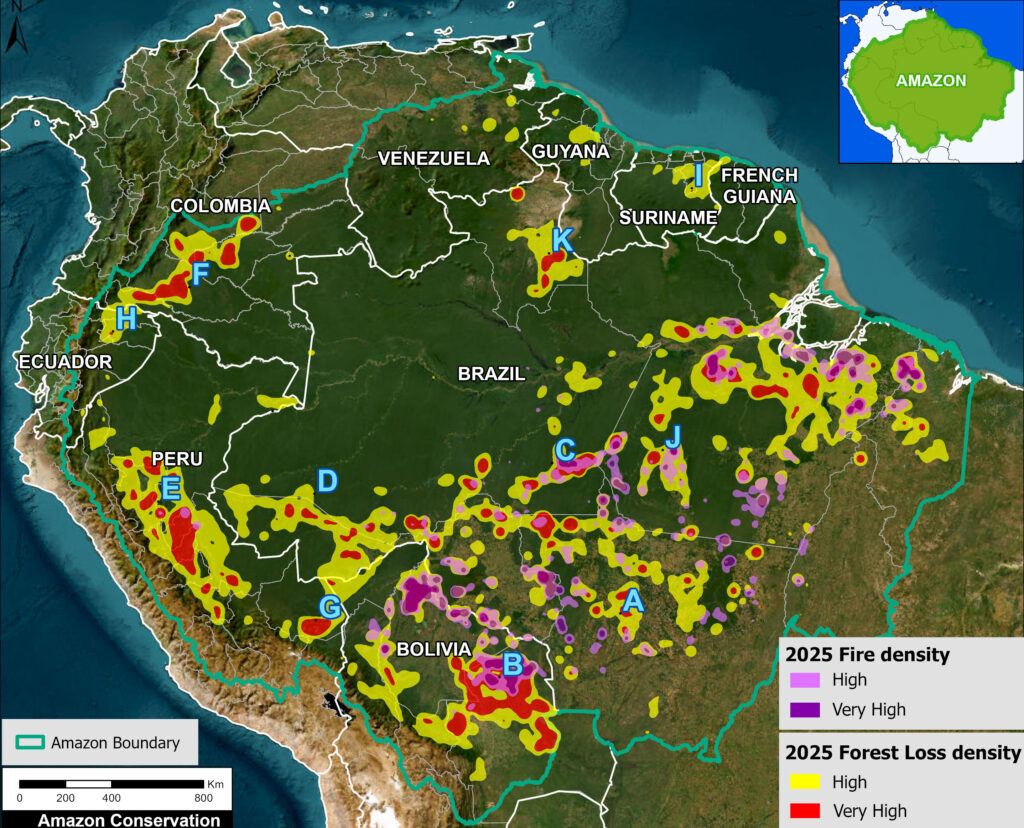
With this context, we are able to identify the primary forest loss hotspots from fire and non-fire (deforestation proxy) causes across the Amazon in 2025 (see Base Map).
The non-fire (proxy for deforestation) hotspots were largely due to agriculture and gold mining across the Amazon. These hotspots were concentrated in the:
- Soy frontiers of southeast Brazil (Area A; see MAAP #161) and southern Bolivia (Area B; MAAP #179),
. - Along major roads in Brazil, such as the Trans-Amazonian Highway (Area C) and BR-364 (Area D). There is also agricultural expansion along an expansive road network in northern Brazil (Area K).
. - Agricultural areas in central Peru (Area E), including lands occupied by Mennonite colonies (MAAP #222),
. - Arc of deforestation in northwest Colombia (Area F) associated with roads, land grabbing (and associated cattle pastures), and coca cultivation (MAAP #224),
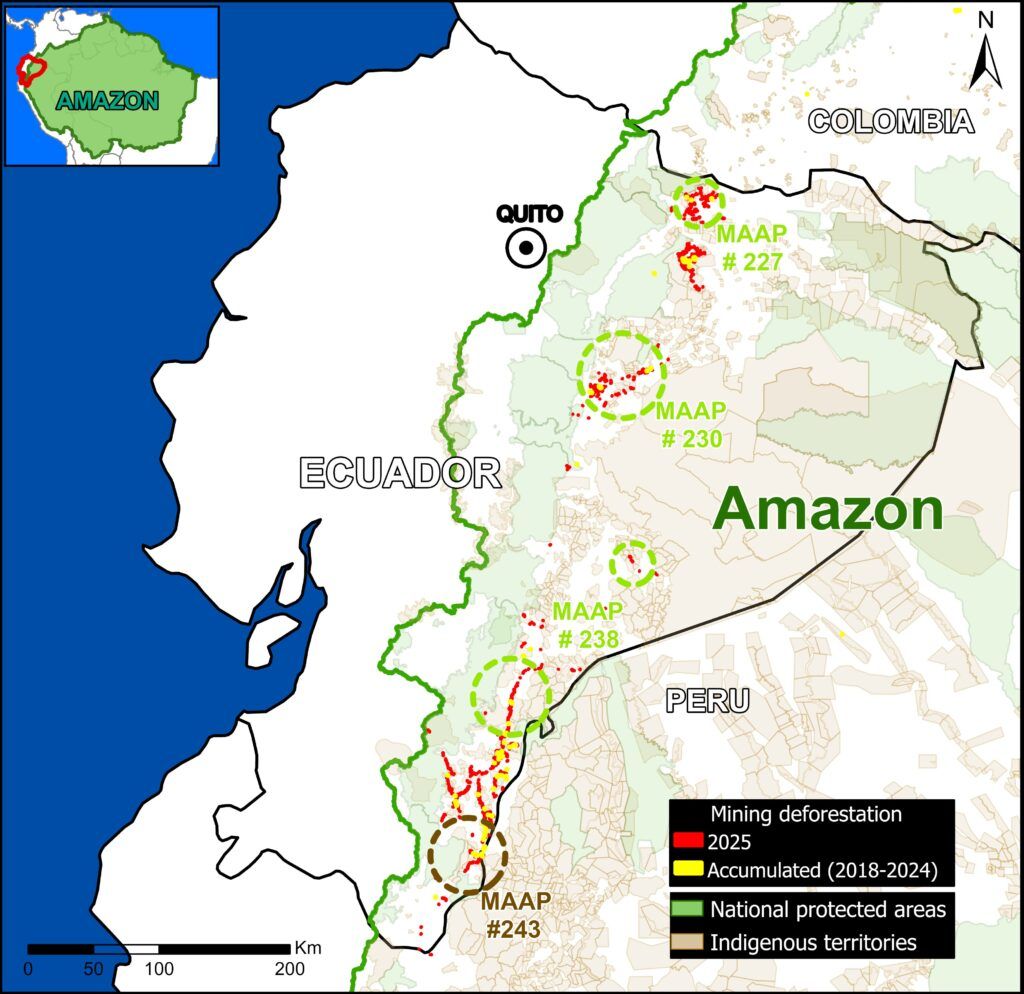
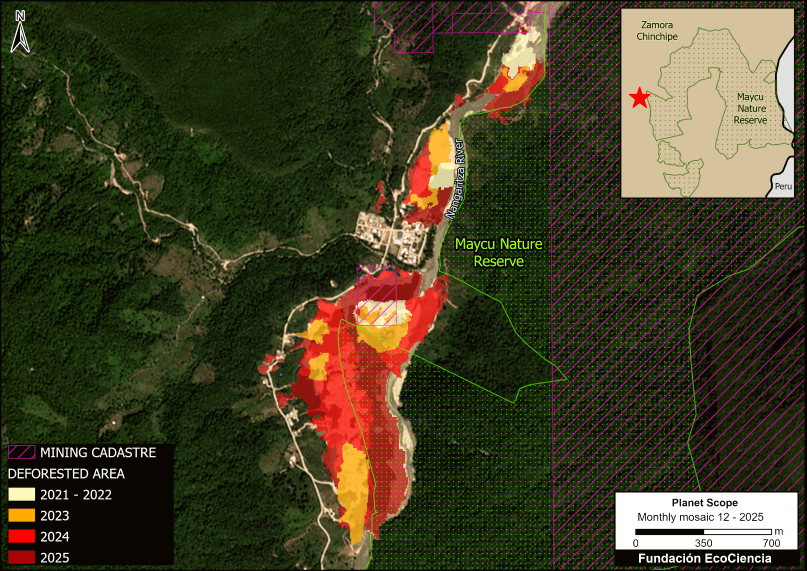
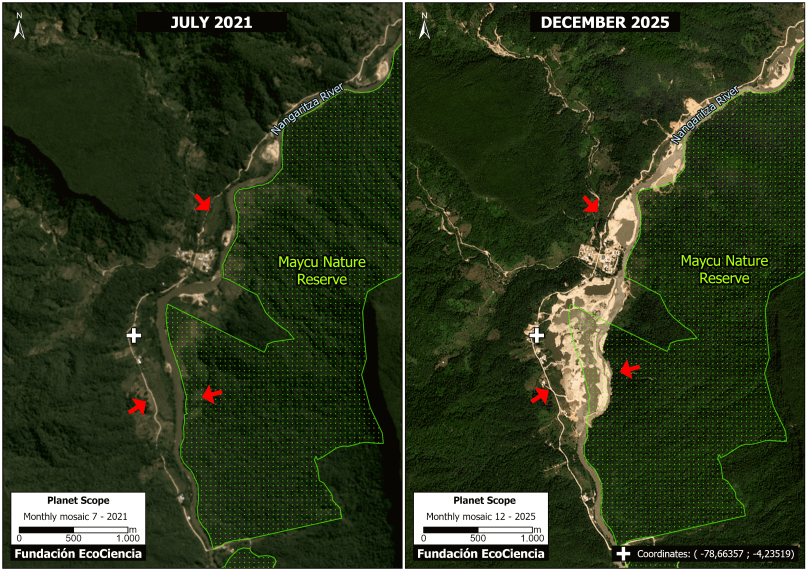
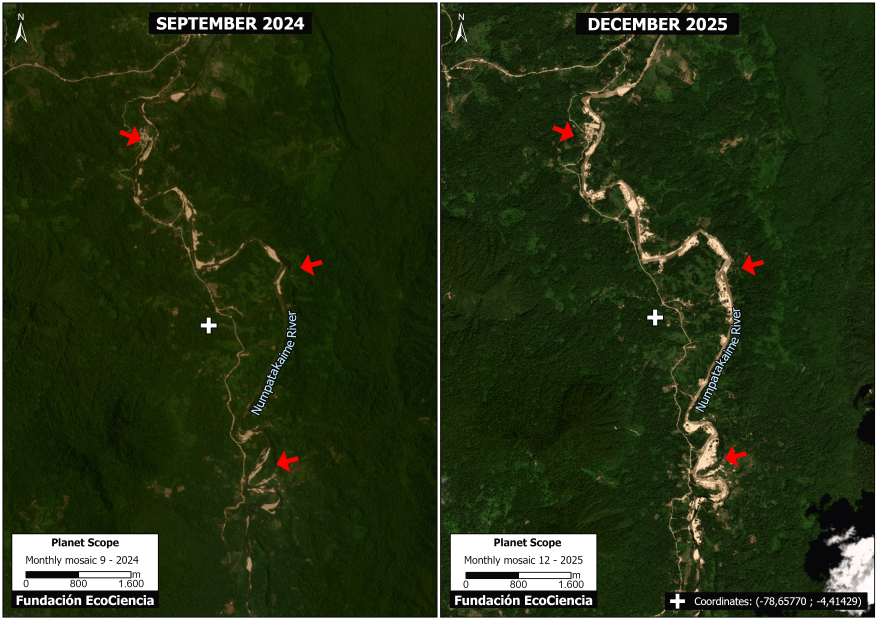
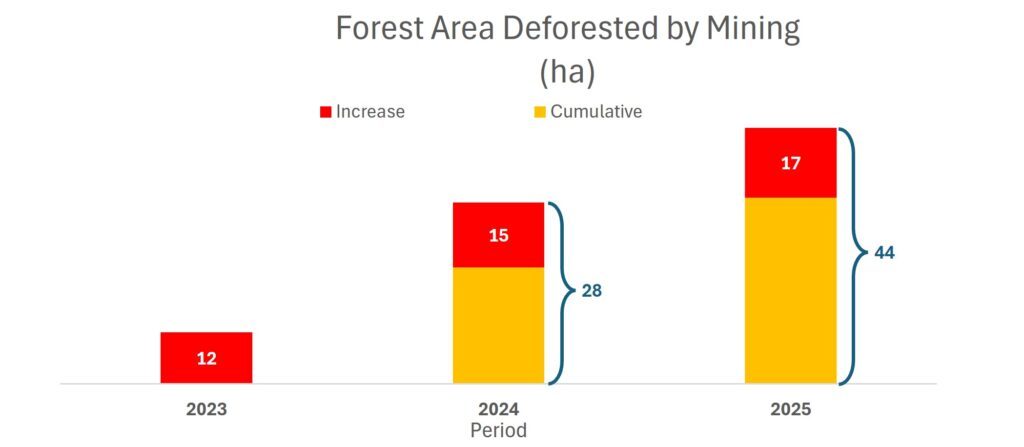
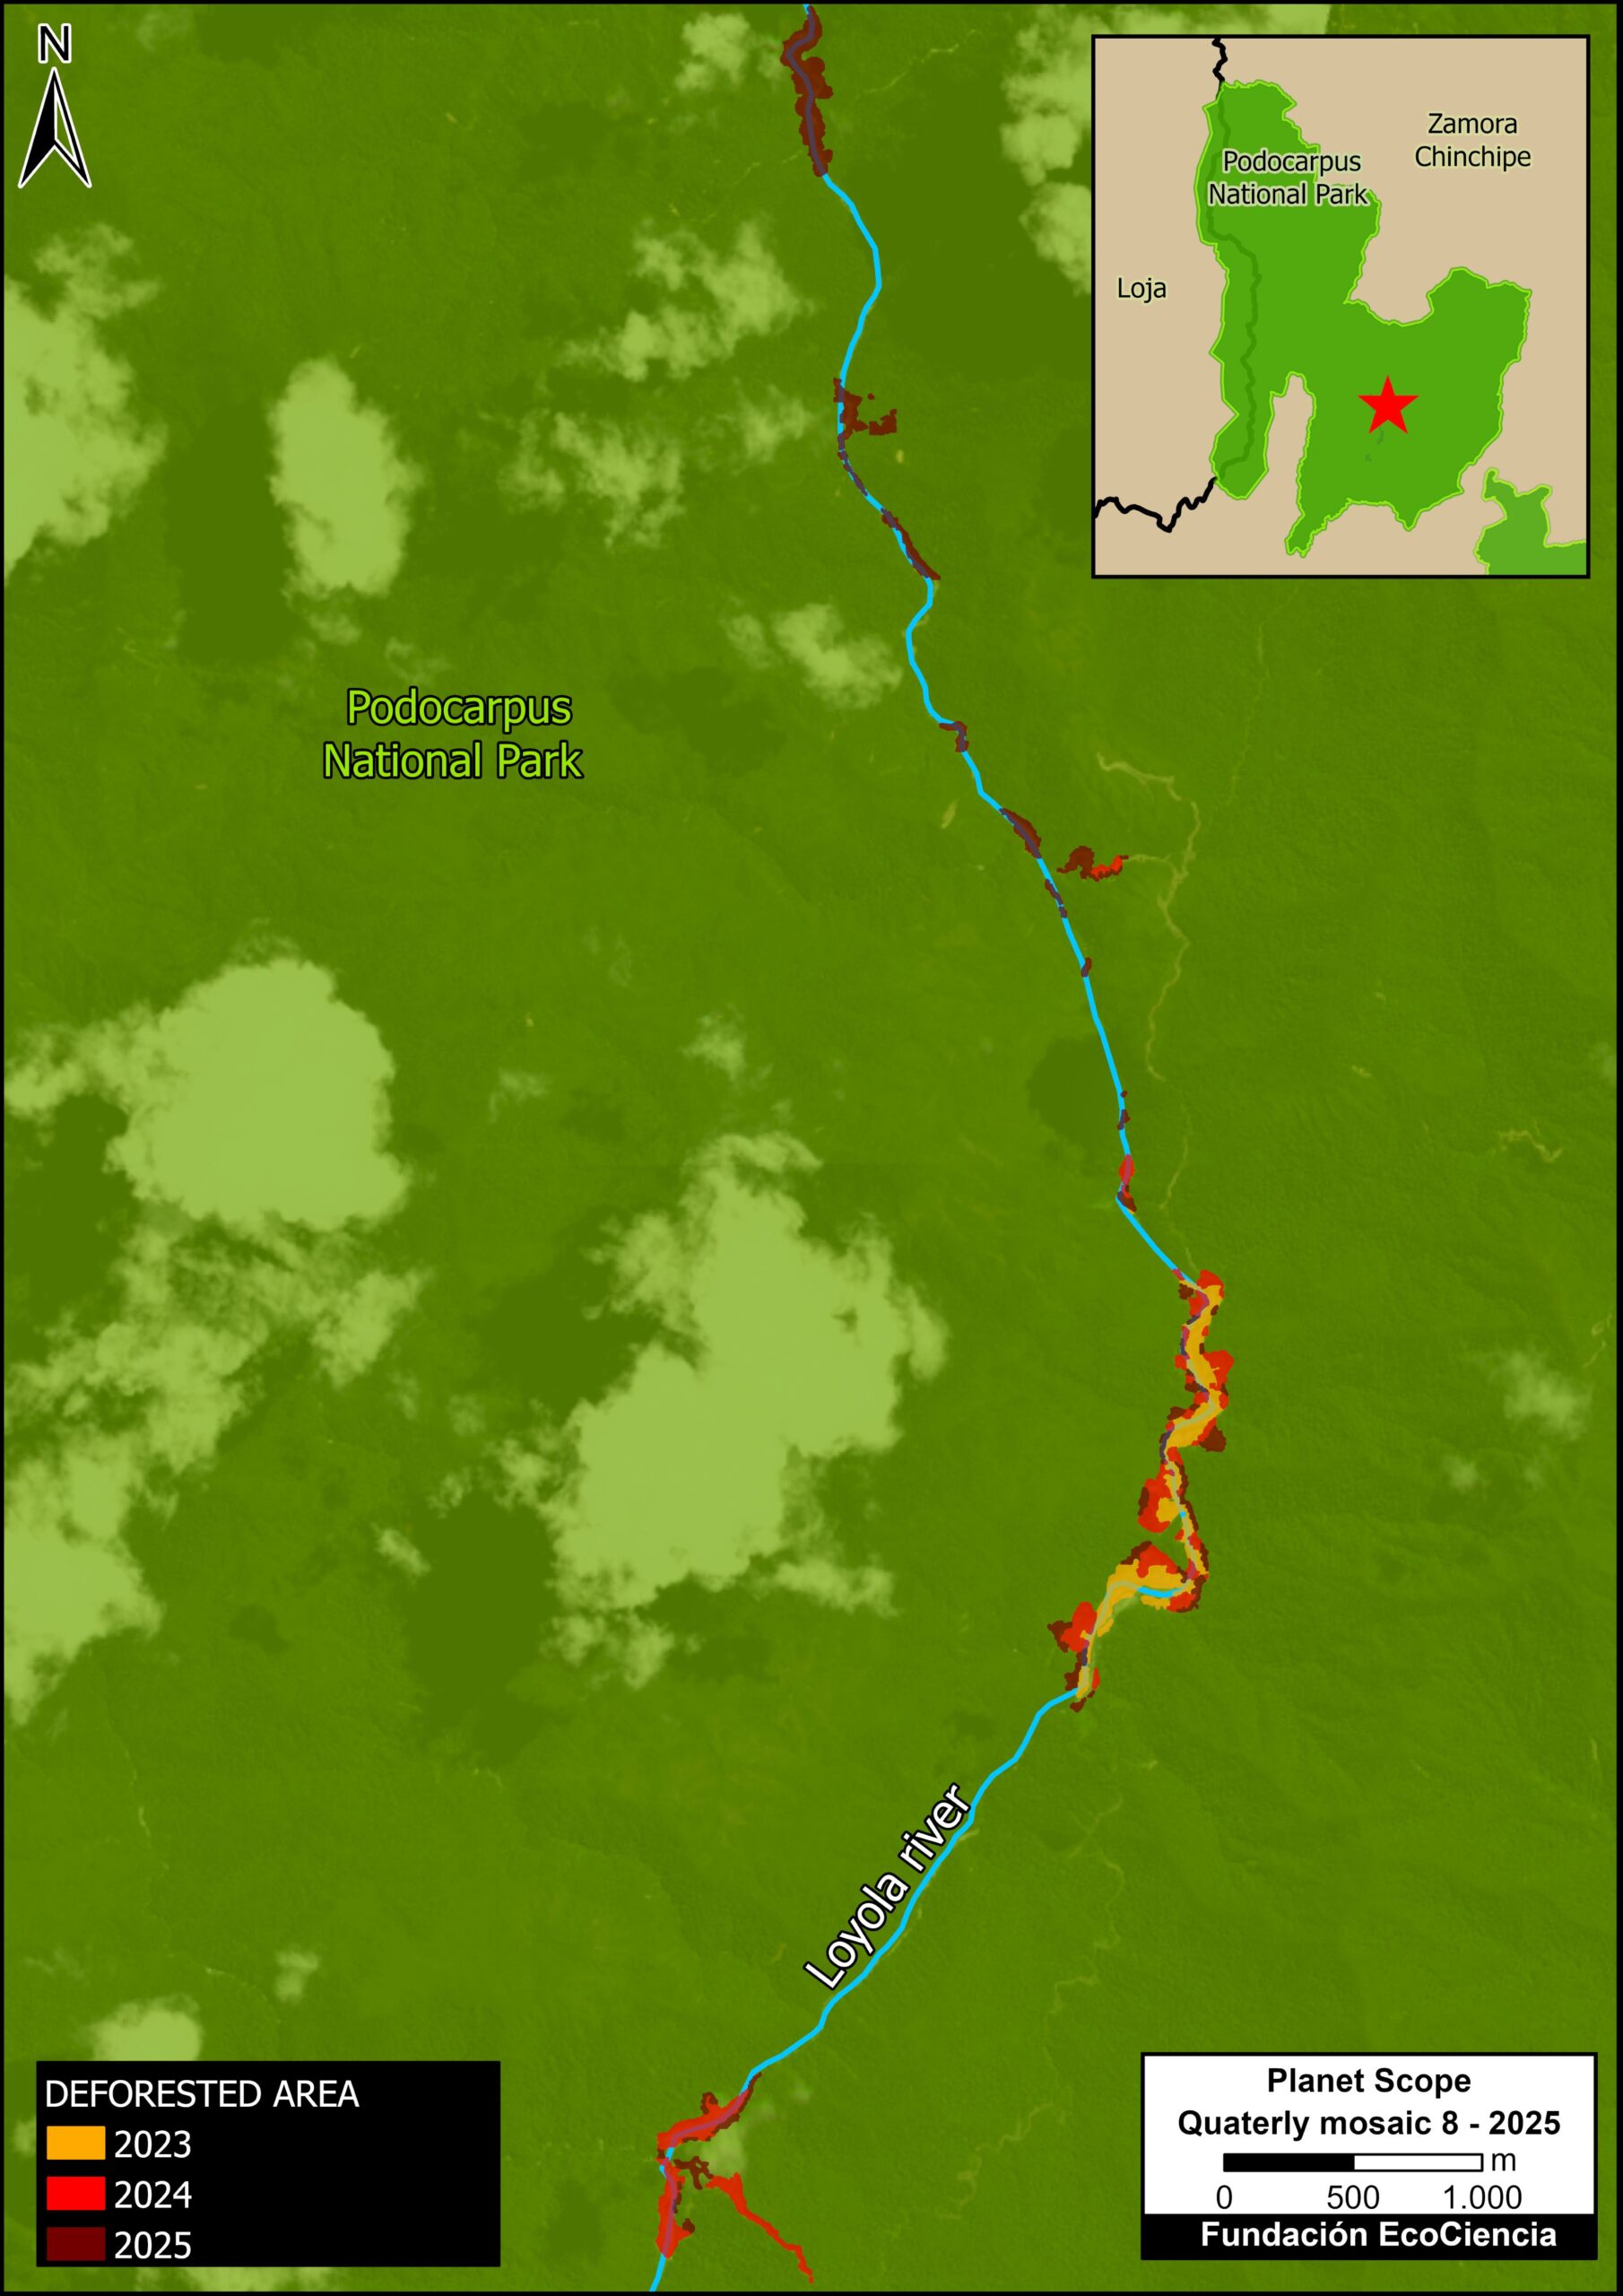
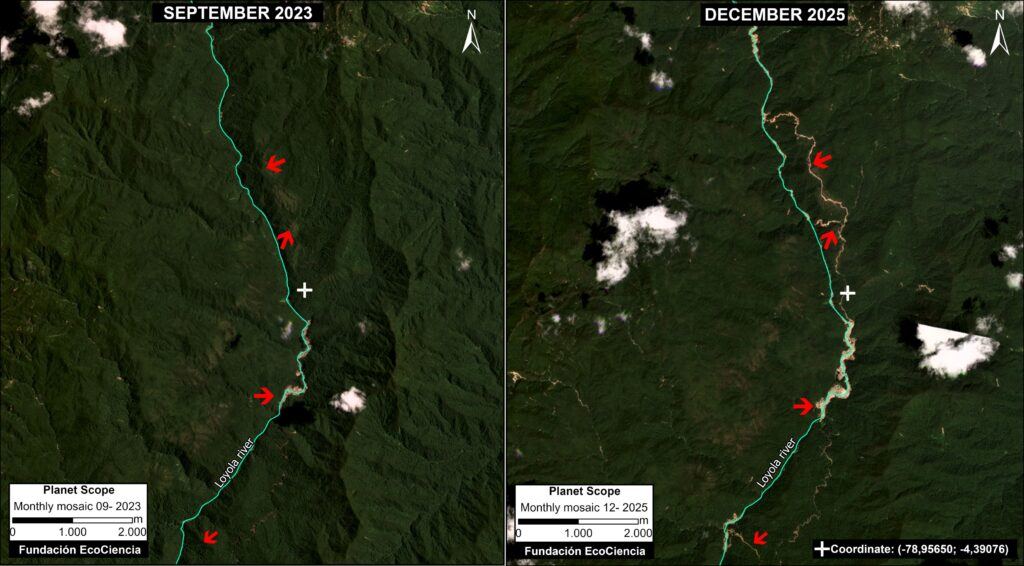
. - Gold mining areas in southern and central Peru (Area G; MAAP #233, MAAP #241), northern Ecuador (Area H) (MAAP #230, MAAP #227, MAAP #219), northeast Amazon (Venezuela, Guyana, Suriname – for example, Area I), and Indigenous territories in Brazil (for example, Area J; MAAP #239).
The fire hotspots were concentrated in the soy and cattle frontiers of the southeast Brazilian Amazon and southeast Bolivian Amazon (including the important ecosystem of the Chiquitano dry forests), and also northeast Bolivia. This fire data may be interpreted as forest degradation, in contrast to the more permanent impacts of deforestation.
Amazon Primary Forest Loss, 2002-2025
In 2025, the major story was that fires were down from the record-breaking year of 2024 (Graph 1). Fires were still historically high, however (1.5 million hectares), marking the 3rd-highest since 2002 (behind only the peak fire seasons of 2016 and 2024).
Non-fire forest loss was also down from 2024 (Graph 1). While still just above 1 million hectares, it was the lowest total over the past 10 years and the 5th-lowest since 2002.
Cumulatively, we estimate the non-fire forest loss of 34.8 million hectares of primary forest since 2002, about the size of Germany or the U.S. state of Montana. An additional 12.2 million hectares have been impacted by fires.
Note that Graph 1 is interactive: The reader can click items in the legend (Non-fire and Fire-caused forest loss), and on the circles for each year to visualize the data point.
Amazon Primary Forest Loss, 2025
In 2025, the majority of non-fire primary forest loss occurred in Brazil (55%), followed by Bolivia (20%), Peru (14%), and Colombia (6%) as the clear top four (Graph 2a; Annex 1).
Notably, Brazil had the lowest annual loss on record since 2002, at around 560,475 hectares.
Bolivia‘s non-fire primary forest loss (200,000 ha) was still historically high (4th highest on record), but lower than the previous peak three years of 2022-24.
Peru’s non-fire primary forest loss was the 5th highest on record (147,480 ha), and the highest over the past 5 years.
Colombia’s non-fire primary forest loss (66,310 ha) was the second lowest since the FARC peace agreement in 2016.
The vast majority (97%) of fire-caused primary forest loss occurred in just two countries: Brazil and Bolivia. Peru added 2% (26,580 ha). All three countries’ fire impact was much lower than last year’s record-breaking fire season.
Note that Graph 2a is interactive: The reader can click the bars for each country for non-fire forest loss (purple bars) and fire forest loss (orange bars). To see the data for the countries with less forest loss, click on the “Log” option in the upper right (or see Annex 1, further below).
Amazon Primary Forest Loss Rate, 2025
Standardizing for area, we show that Bolivia has the highest non-fire primary forest loss rate, followed by Peru, Colombia, then Brazil (Graph 2b).
Bolivia also has, by far, the highest fire-caused primary forest loss rate, followed by Brazil, and more distantly, Peru.
Note that Graph 2b is interactive: The reader can click the bars for each country for non-fire forest loss (purple bars) and fire forest loss (orange bars).
Amazon Deforestation 2025
In a novel analysis, we directly estimate Amazonian deforestation for the first time. As noted above, the primary forest loss data described above is a good proxy for deforestation, but also includes loss associated with natural events, such as landslides, windstorms, and meandering rivers.
Using the “WRI Google Drivers of Tree Cover Loss” dataset, we estimate the primary forest loss directly caused by agriculture, mining, and infrastructure. That is, directly estimate human-caused deforestation.
In 2025, we estimate the deforestation of 736,484 hectares across the Amazon (Graph 3). The vast majority (94.6%) of this deforestation came from agriculture (both permanent and shifting). An additional 5.3% came from hard commodities, mostly gold mining. The remaining 0.1% was caused by roads and infrastructure.
Over half (55.2%) of this deforestation occurred in Brazil, followed by Peru (16.8%), Bolivia (13.8%), and Colombia (8.5%).
Peru had the most mining deforestation, followed by Brazil, Guyana, Suriname, and Venezuela. However, we note that Amazon Mining Watch indicates that Brazil had higher mining deforestation than Peru in 2025.
Note that Graph 3 is interactive: The reader can click on the bars for each country. To see the data for the countries with less forest loss, click on the “Log” option in the upper right
Amazon Deforestation 2025 in Protected Areas & Indigenous Territories
Of the 2025 Amazon deforestation noted above, nearly 132,000 hectares (18%) occurred in protected areas and Indigenous territories (Graph 4). This may be considered a general estimate for illegal deforestation.
Agriculture accounted for 89% of this deforestation, and mining for the remaining 11%.
Brazil had the most deforestation in protected areas and Indigenous territories (33%), followed by Bolivia (25%), Peru (20%), Colombia (10%), Venezuela (6%), and Ecuador (4%).
Specifically for gold mining, Brazil had the most deforestation in protected areas and Indigenous territories, followed by Peru and Venezuela.
Note that Graph 4 is interactive: The reader can click items in the legend (Agriculture and Mining, by designation), and on the bars to visualize the data for each country.
Annex 1
Note that Annex 1 is interactive: The reader can click on the countries in the legend, and on the circles for each year to visualize the data point. To see the data for the countries with less forest loss, click on the “Log” option in the upper right.
Policy Implications
Following the record-breaking fire season of 2024, fire impact in 2025 was still historically high (3rd highest on record) but much reduced from the previous year’s peak. As detailed in MAAP #229, the 2024 fire season was associated with a strong El Niño event, creating extremely dry conditions across the Amazon. In contrast, 2025 was associated with the moister conditions of La Niña. This correlation has major implications for the predicted upcoming super El Niño season and will be the subject of an upcoming report.
Instead of fires, the major story in 2025 was relatively positive: the lowest non-fire primary forest loss over the past 10 years, and the 5th lowest on record.
However, in 2025 an additional 1 million hectares of primary forest was lost, bringing the cumulative total lost to 34.8 million hectares since 2002, the size of Germany or Montana.
As in previous years, the countries with the highest primary forest loss were Brazil, Bolivia, Peru, and Colombia, respectively.
Notably, Brazil had the lowest annual loss on record since 2002, and Colombia was the second lowest since the FARC peace agreement in 2016. In contrast, Bolivia and Peru were both relatively high, but with different trends: Bolivia was lower than the previous peak years, while Peru was the highest over the past 5 years.
Standardizing for area, Bolivia had the highest primary forest loss rate, followed by Peru, Colombia, and then Brazil.
In terms of spatial patterns, non-fire primary forest loss hotspots were detected in all countries. Major agricultural deforestation areas occurred in southeast Brazil, southern Bolivia, central Peru, and northwest Colombia. Major mining areas were detected in southern and central Peru, northern Ecuador, the northeast Amazon (Venezuela, Guyana, Suriname), and Indigenous territories in Brazil.
Finally, in a novel analysis, we directly estimate Amazonian deforestation for the first time using a new dataset from WRI and Google. In 2025, we estimate the deforestation of 736,484 hectares across the Amazon. The vast majority (94.6%) of this deforestation came from agriculture (both permanent and shifting). An additional 5.3% came from hard commodities, mostly gold mining. The remaining 0.1% was caused by roads and infrastructure.
Over half (55.2%) of this deforestation occurred in Brazil, followed by Peru, Bolivia, and Colombia. Peru had the most mining deforestation, followed by Brazil, Guyana, Suriname, and Venezuela.
While agriculture accounts for the greatest impact in terms of total number of hectares deforested, much of this impact occurs in expanding deforestation zones and along roads. Key examples include expanding deforestation along the major roads of the eastern and southern Brazilian Amazon, expanding soy deforestation in the southern Bolivian Amazon, expanding deforestation by Mennonite colonies in the central Peruvian Amazon, and the arc of deforestation in the northwest Colombian Amazon.
Gold mining, on the other hand, has the greatest impact in terms of targeting sensitive areas. In contrast to agricultural deforestation following roads, gold mining, particularly illegal gold mining, often targets the most remote and intact areas, such as protected areas and Indigenous territories. Key examples include the southern Peruvian Amazon, northern Ecuadorian Amazon, border between the Colombian and Brazilian Amazon, Indigenous territories of the Brazilian Amazon, and the northeast Amazon (Venezuela, Suriname, and Guyana).
It is important to note that the data presented here may differ from national data presented by governments. This difference may be due to methodology (we focus on impact on primary forests), spatial resolution (30 meters in our case), and Amazon boundaries (we employ a hybrid boundary designed for maximum inclusion of both watershed and biogeography). Due to these potential differences among sources, it is best to focus on the convergence of overall trends and patterns, and not overly focus on the absolute numerical difference.
Methodology
The analysis was based on 30-meter resolution annual forest loss data produced by the University of Maryland and also presented by Global Forest Watch.
This data was complemented with the Global Forest Loss due to fire dataset that is unique in terms of being consistent across the Amazon (in contrast to country specific estimates) and distinguishes forest loss caused directly by fire (note that virtually all Amazon fires are human-caused). The values included were ‘medium’ and ‘high’ confidence levels (code 3-4). This fire data may be interpreted as forest degradation, in contrast to the more permanent impacts of deforestation.
The remaining forest loss serves as a likely close proxy for deforestation, with the only remaining exception being natural events such as landslides, wind storms, and meandering rivers. The values used to estimate this category were ‘low’ certainty of forest loss due to fire (code 2), and forest loss due to other ‘non-fire’ drivers (code 1).
For the baseline, it was defined to establish areas with >30% tree canopy density in 2000. Importantly, we applied a filter to calculate only primary forest loss by intersecting the forest cover loss data with the additional dataset “primary humid tropical forests” as of 2001 (Turubanova et al 2018). For more details on this part of the methodology, see the Technical Blog from Global Forest Watch (Goldman and Weisse 2019).
Our geographic range for the Amazon is a hybrid designed for maximum inclusion: biogeographic boundary (as defined by RAISG) for all countries, except for Bolivia and Peru, where we use the watershed boundary, and Brazil, where we use the Legal Amazon boundary.
Protected areas and Indigenous territory data from RAISG and official sources. In case of an overlap, data was included in the protected areas category. Note that Suriname does not have titled Indigenous territories.
To identify the deforestation hotspots, we conducted a kernel density estimate. This type of analysis calculates the magnitude per unit area of a particular phenomenon, in this case, forest cover loss. We conducted this analysis using the Kernel Density tool from the Spatial Analyst Tool Box of ArcGIS. We used the following parameters:
Search Radius: 15000 layer units (meters)
Kernel Density Function: Quartic kernel function
Cell Size in the map: 50 x 50 meters (0.25 hectares)
Everything else was left to the default setting.
For the Base Map, we used the following concentration percentages: High: 3-14%; Very High: >14%. These percentages correspond to the concentration of forest loss pixels, with a pixel size of 50 x 50 meters (0.25 hectares).
Using the “WRI Google Drivers of Tree Cover Loss” dataset, we then estimated human-caused deforestation. The main challenge was analyzing this 1 km resolution dataset in relation to the 30 m resolution annual forest loss dataset described above.
Building upon the annual forest loss by confidence level )—from which fire-related loss was excluded based on confidence levels 3 and 4—a second layer, designated “Forest Loss Non-Fire” (confidence levels 1 and 2), was generated; onto this layer, the cumulative “Drivers” layer (2001–2025) was overlaid to analyze which underlying causes were associated with the recorded loss.
The result was an artificial scale 30 m resolution; it should be noted here that the spatial correlation is not exact. Since Driver’s original data has a resolution of 1 km—which encompasses multiple 30-meter pixels—this value has been replicated (downscaled). Through layer merging, a layer was obtained containing forest loss pixel values accompanied by a confidence level and an assigned driver—meaning the probable primary cause of the loss has been identified.
To estimate human-caused deforestation, we focused on just four of the drivers: agriculture (both permanent and shifting), hard commodities, and roads & infrastructure. In other words, we did not include Natural forest loss, Wildfires, or Logging.
Acknowledgements
We thank colleagues from the following organizations for helpful comments on the report: Conservación Amazónica – ACEAA in Bolivia, Conservación Amazónica – ACCA in Peru, and Fundación EcoCiencia in Ecuador.
This work was supported by Norad (Norwegian Agency for Development Cooperation).

Citation
Finer M, Ariñez A, Bodin B, Santana A (2026) Amazon Deforestation & Fire Hotspots 2025. MAAP: 244.