MAAP #139: Using Satellites to Detect Illegal Logging in Peruvian Amazon

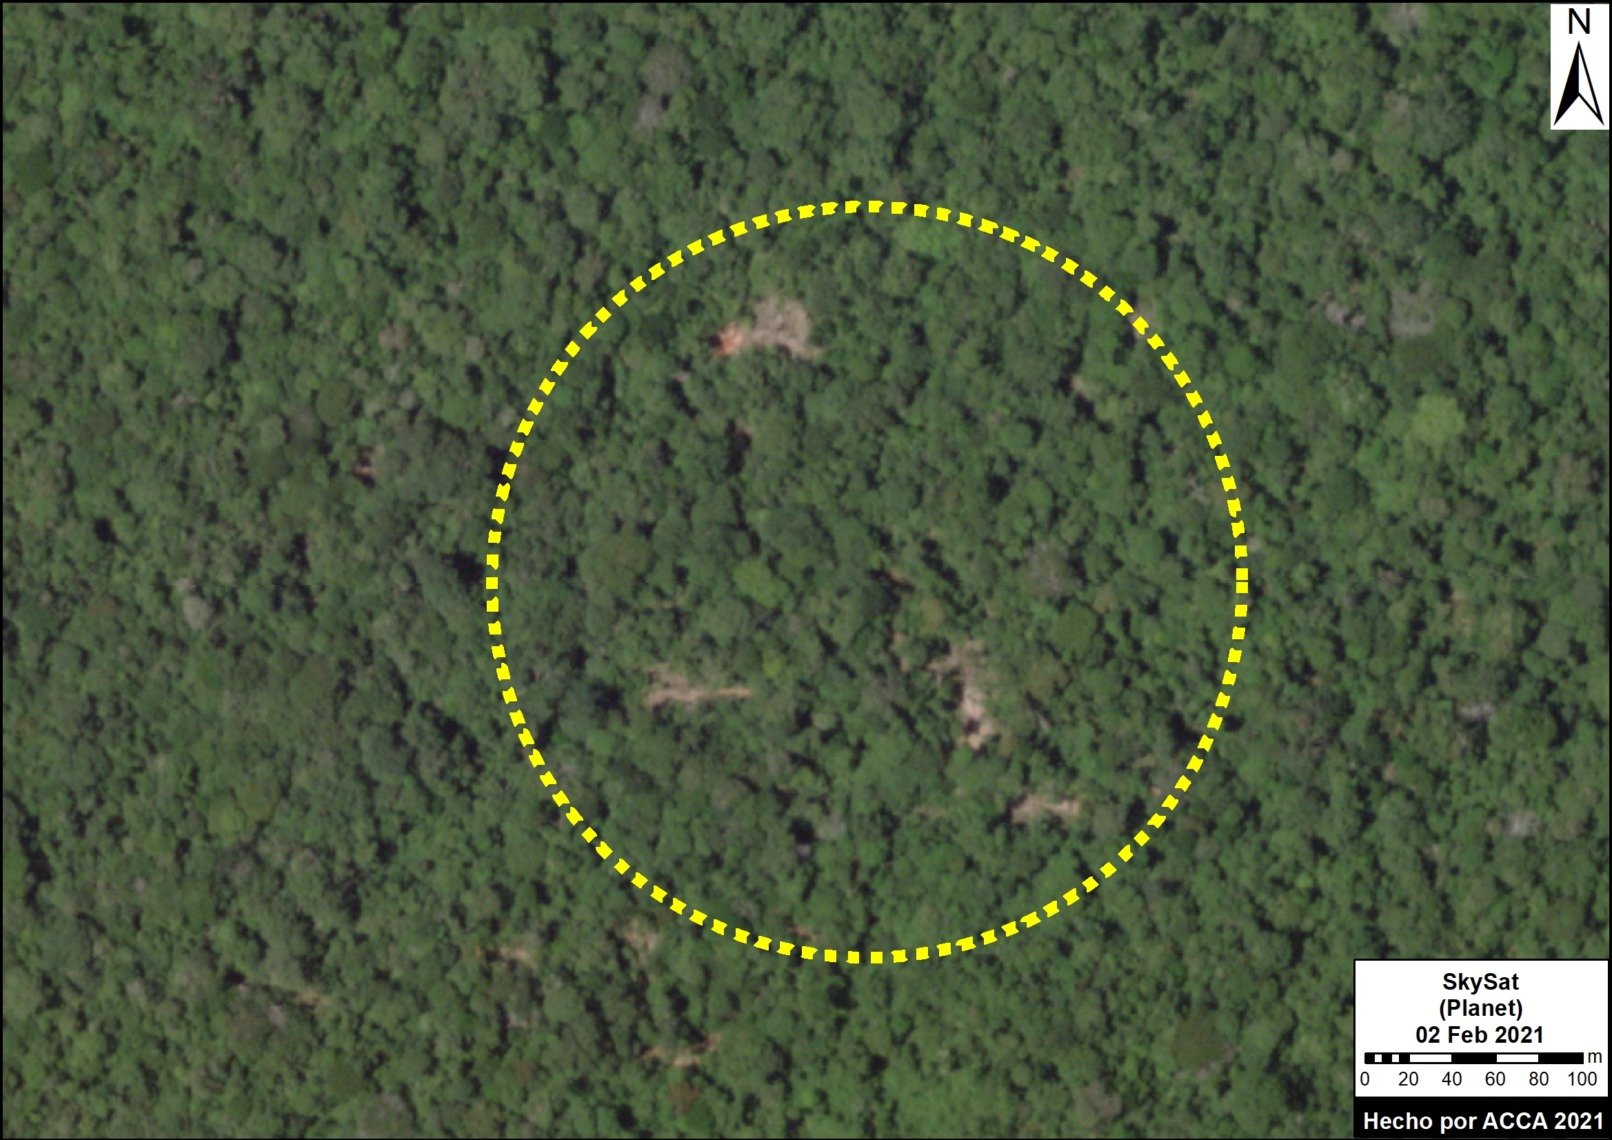
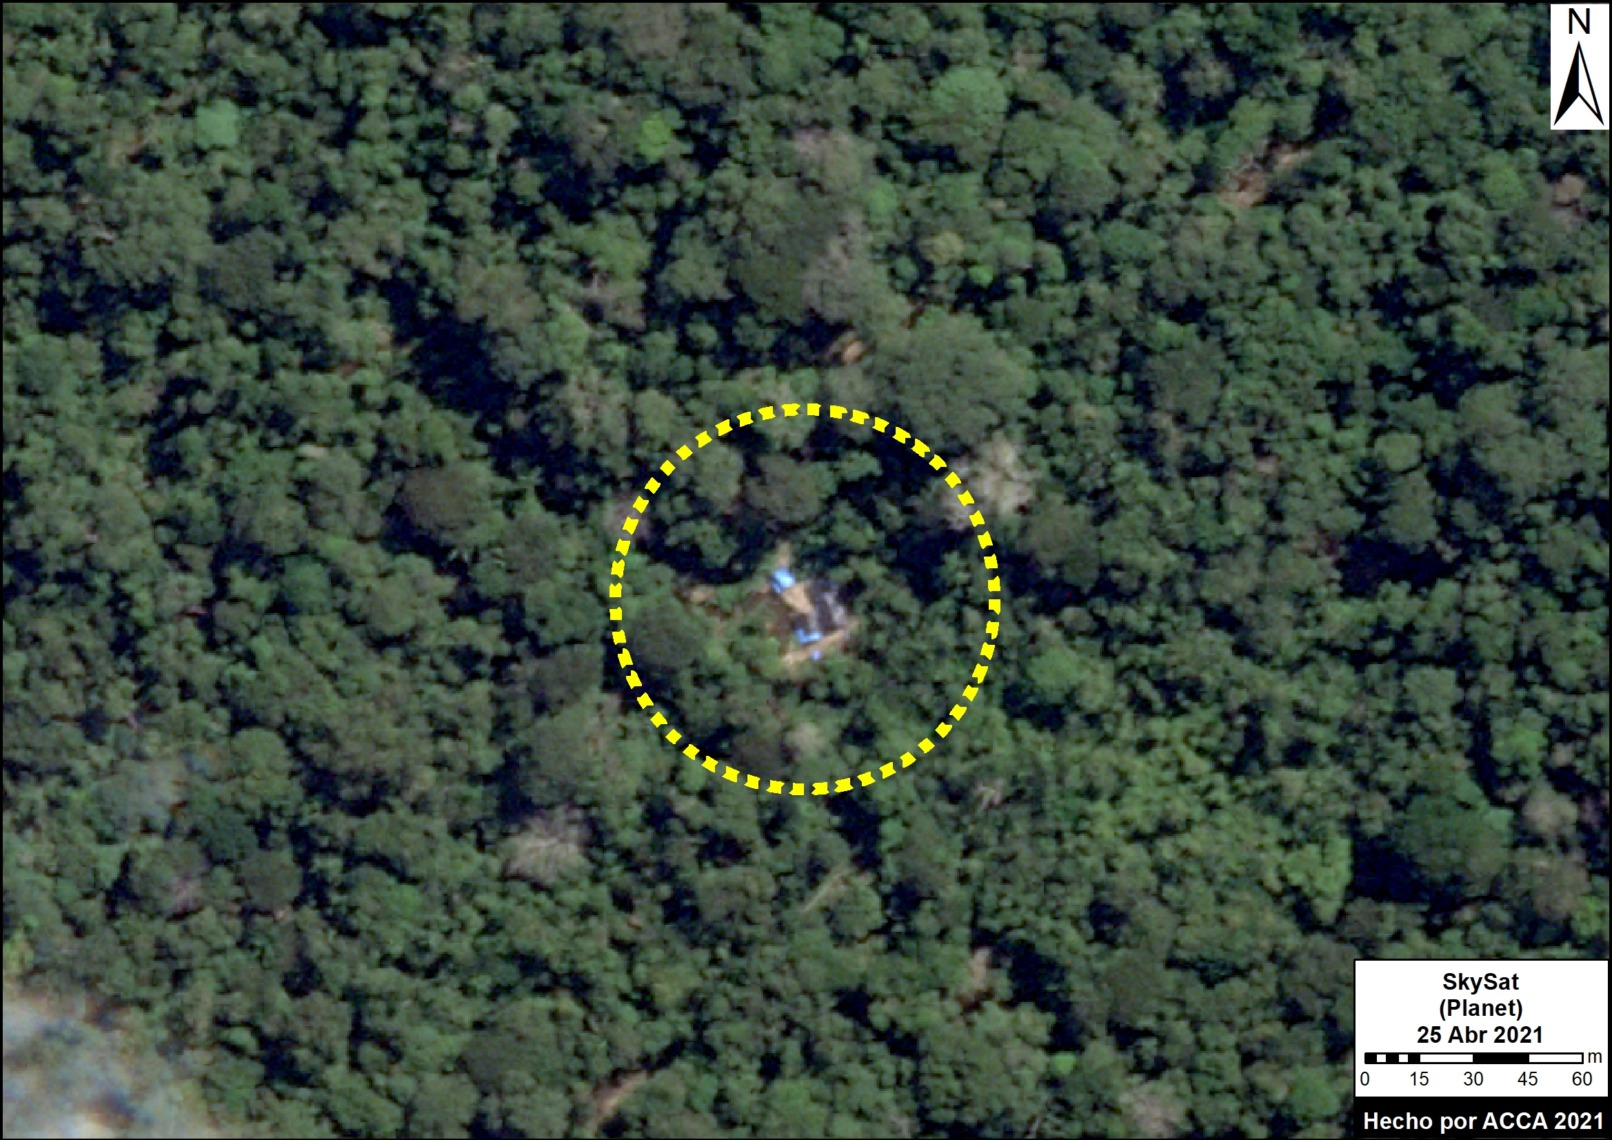
Image 1. Illegal logging camp. Data: Skysat, MAAP/ACCA.

Illegal logging, in addition to larger-scale deforestation, is a major problem impacting the Peruvian Amazon.

In 2019, a Global Witness report, based on official information from the Peruvian government, estimated that at least 60% of the inspected timber over the past 10 years had an illegal origin. This problem not only directly affects the forest and its biodiversity, but also contributes to carbon loss (Qin et al, 2021) and forest degradation.

Illegal logging often involves the selective cutting of high-value trees in prohibited areas (whereas deforestation clears an entire area).

While numerous satellites can detect deforestation, only specialized satellites that are very high-resolution (less than one meter) can detect illegal logging.

In this report, we present a new emblematic case of illegal logging in the southern Peruvian Amazon.

It is based on a novel technique of tasking and analyzing very high-resolution images (in this case, with the Skysat satellite fleet from Planet) for a specific target area. Thanks to this new technique, we can tackle the problem of illegal logging in real-time, previously one of the biggest obstacles (see “Conclusion” section below).


Emblematic case

We refer to this as an emblematic case given the strong indicators of illegality (see Legal Status section, below) combined with likely significant impacts on an area of Amazon primary forest important for both indigenous peoples and biodiversity.

First, it is often difficult to confirm illegal logging given the frequent lack of updated technical and administrative information. This case study overcomes both obstacles.

Second, the illegal activity would not only be affecting a forestry concession (operated by the company Wood Tropical Forest), but also threatening important surrounding areas. Adjacent to the concession (to the west) is the Madre de Dios Territorial Reserve, a critical area that protects the territory of indigenous peoples in voluntary isolation. And to the south is the renowned Los Amigos Conservation Concession, a key area for the conservation of biodiversity.

Base Map

As part of our core work of continually monitoring the Los Amigos Conservation Concession, we acquired a series of very high-resolution images that also covered the surrounding Wood Tropical Forest forestry concession. These images, taken between February and April 2021, were obtained by the Skysat constellation (with a spatial resolution of 0.5 meters), operated by the satellite company Planet.

Our analysis revealed a serious situation of probable illegal logging: at least 3 active logging camps and 37 recently cut trees within the Wood Tropical Forest concession and close to both the neighboring Territorial Reserve and Conservation Concession (see Base Map).
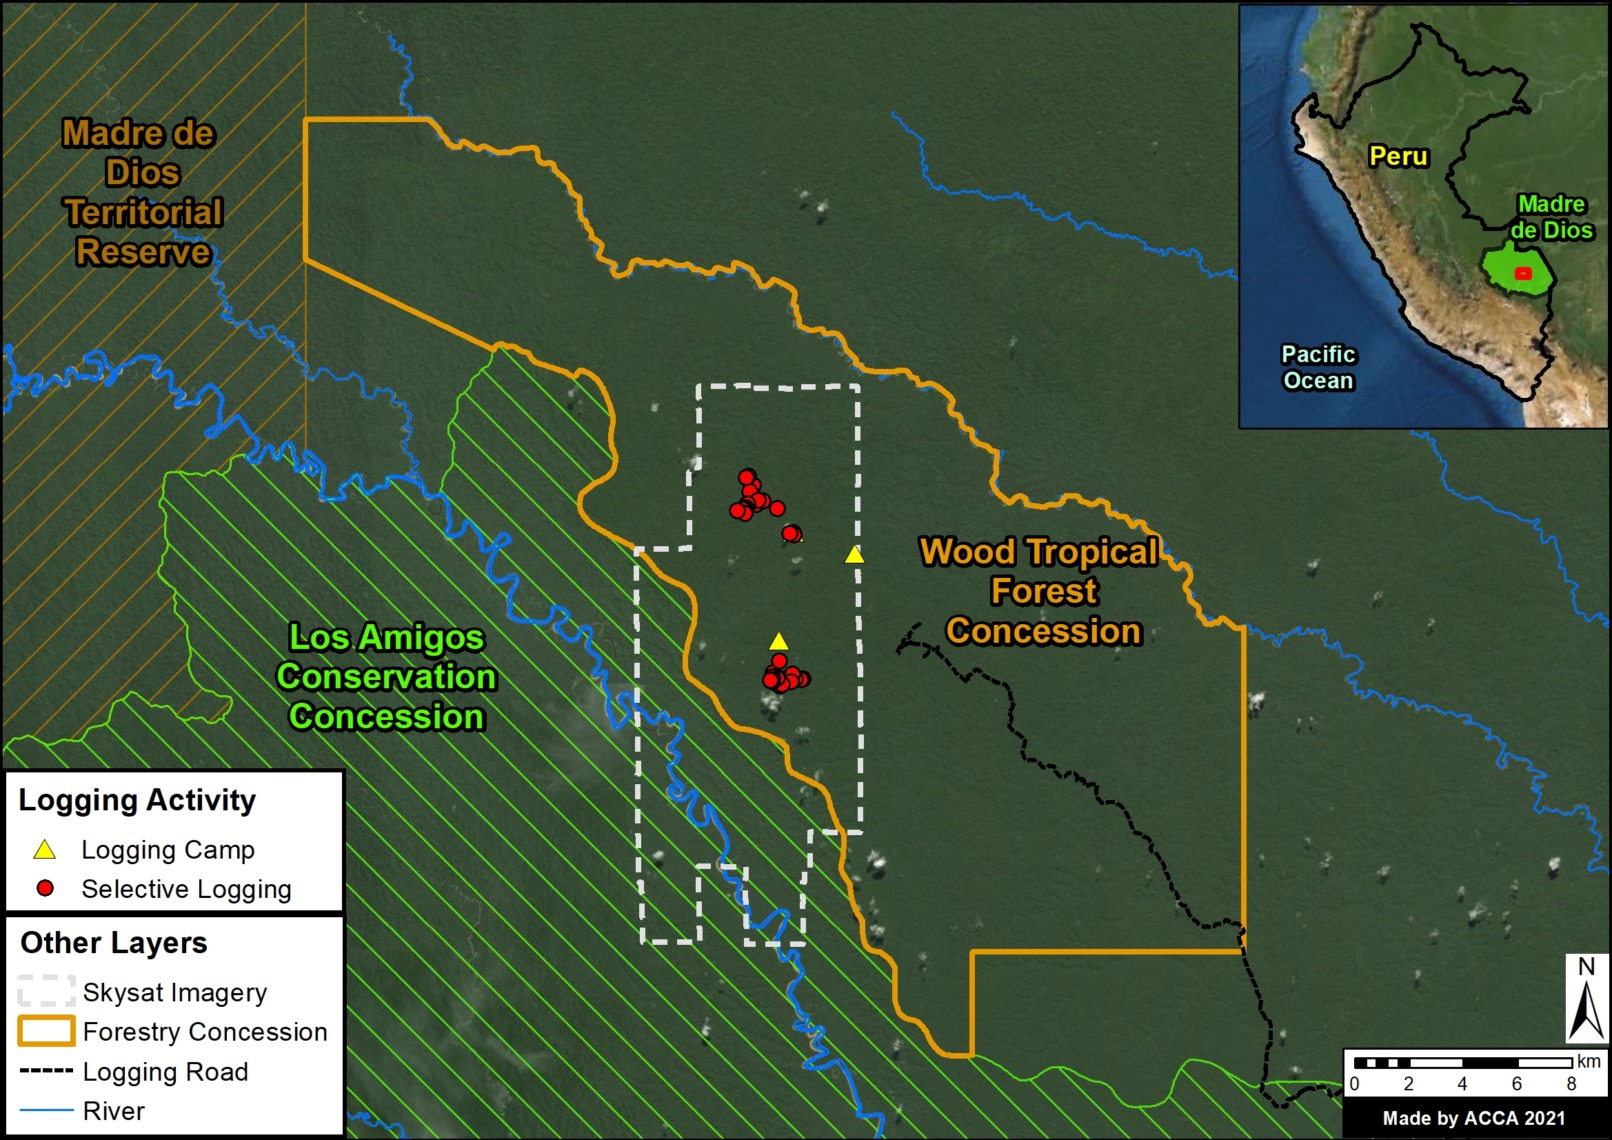
Base Map. Data: MAAP/ACCA.

Very High-Resolution Skysat Images

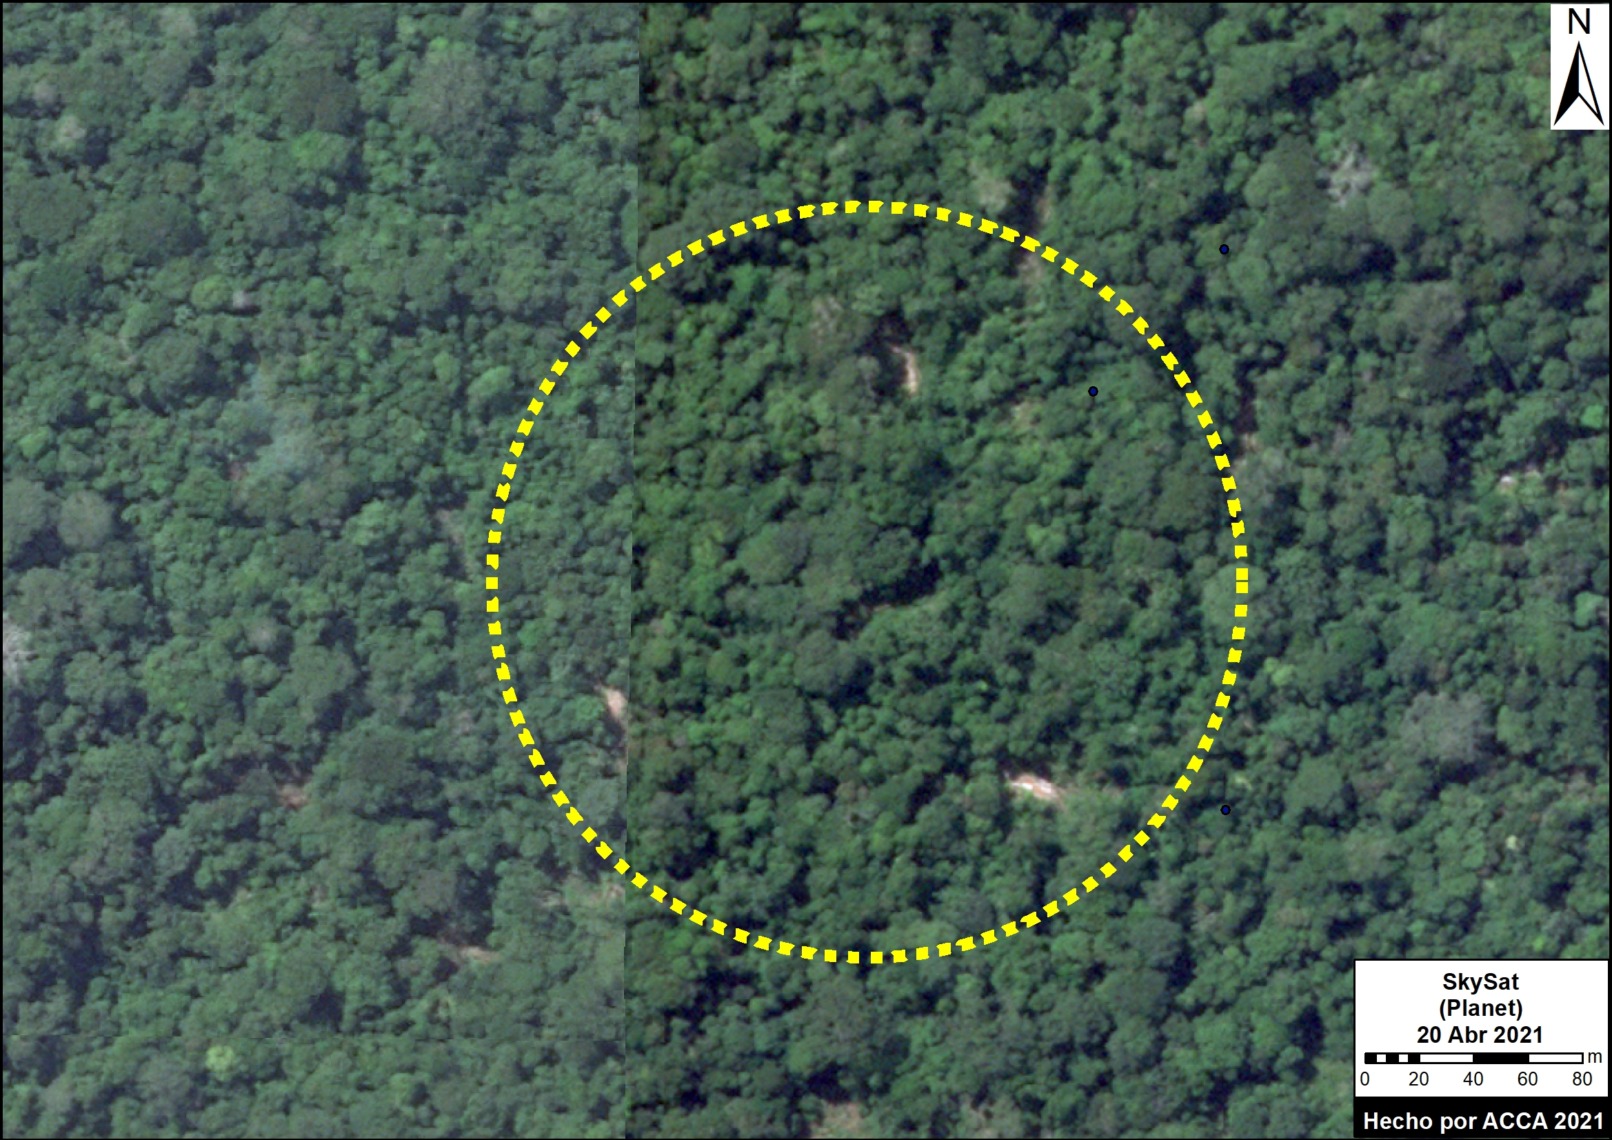
The following images show some of the major findings made by our analysis of the Skysat data. Images 1-2 show examples of the logging camps, and Images 3-5 show examples of the likely selective illegal logging of high-value trees.
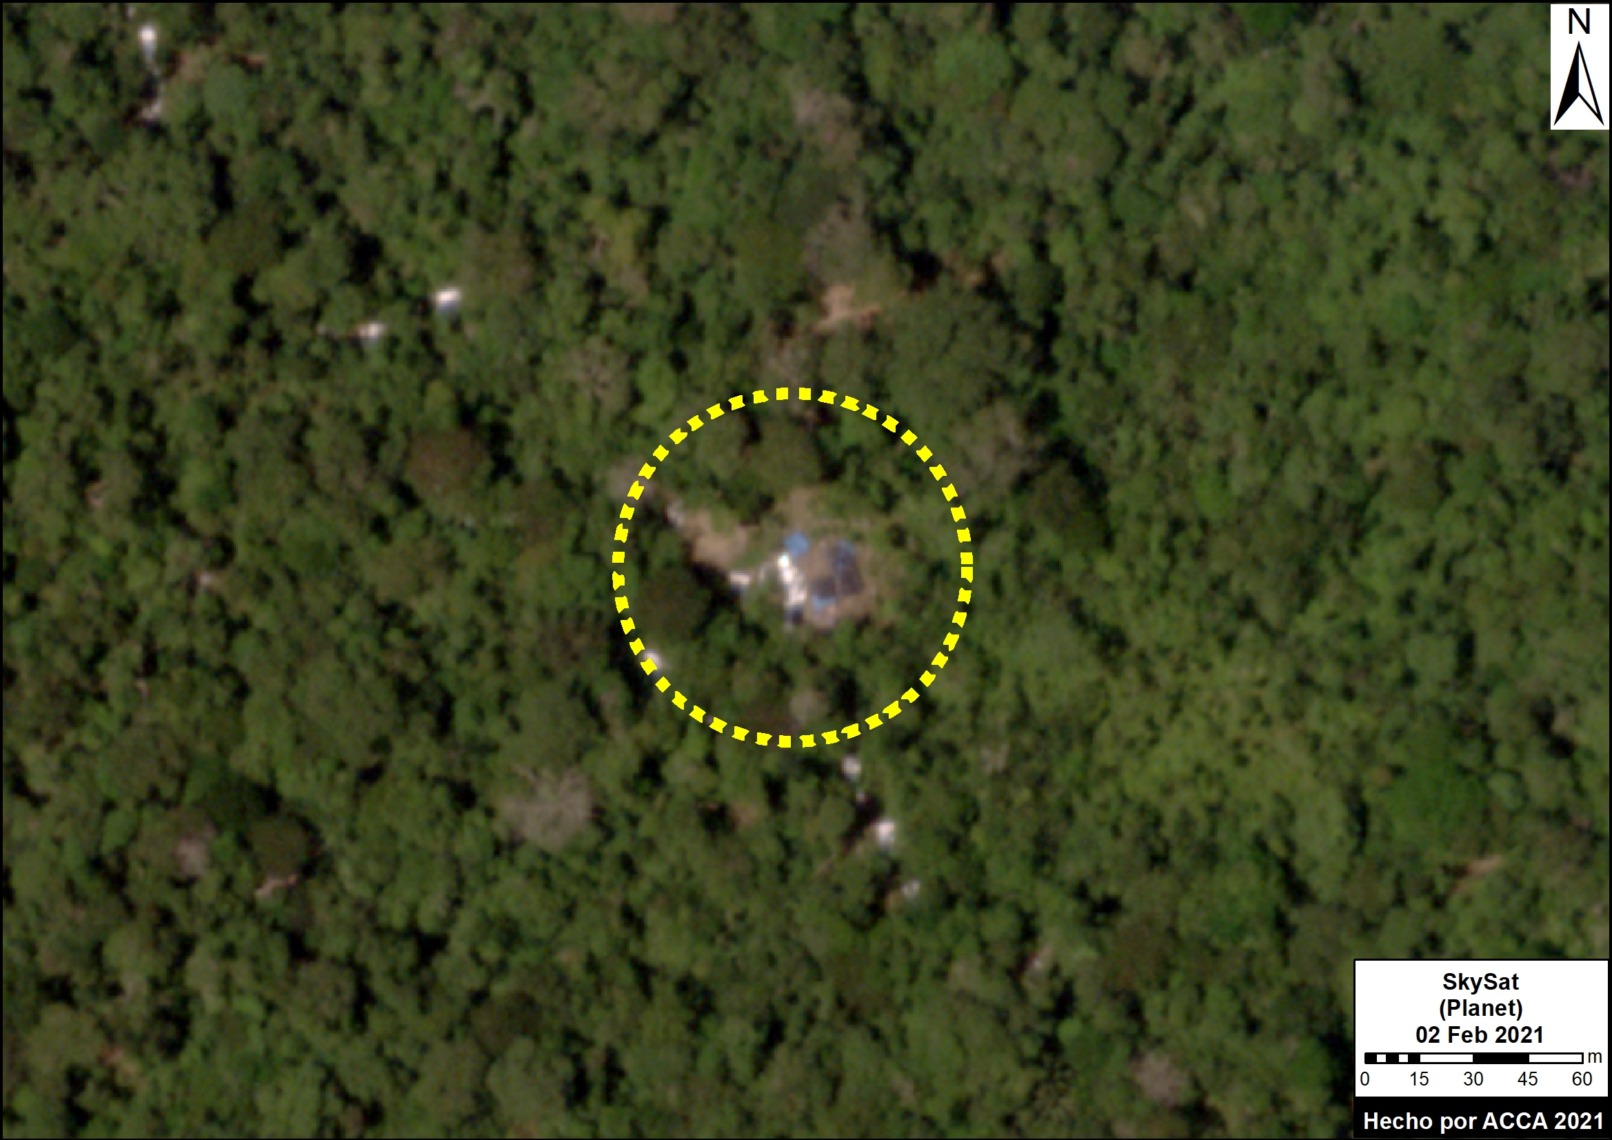
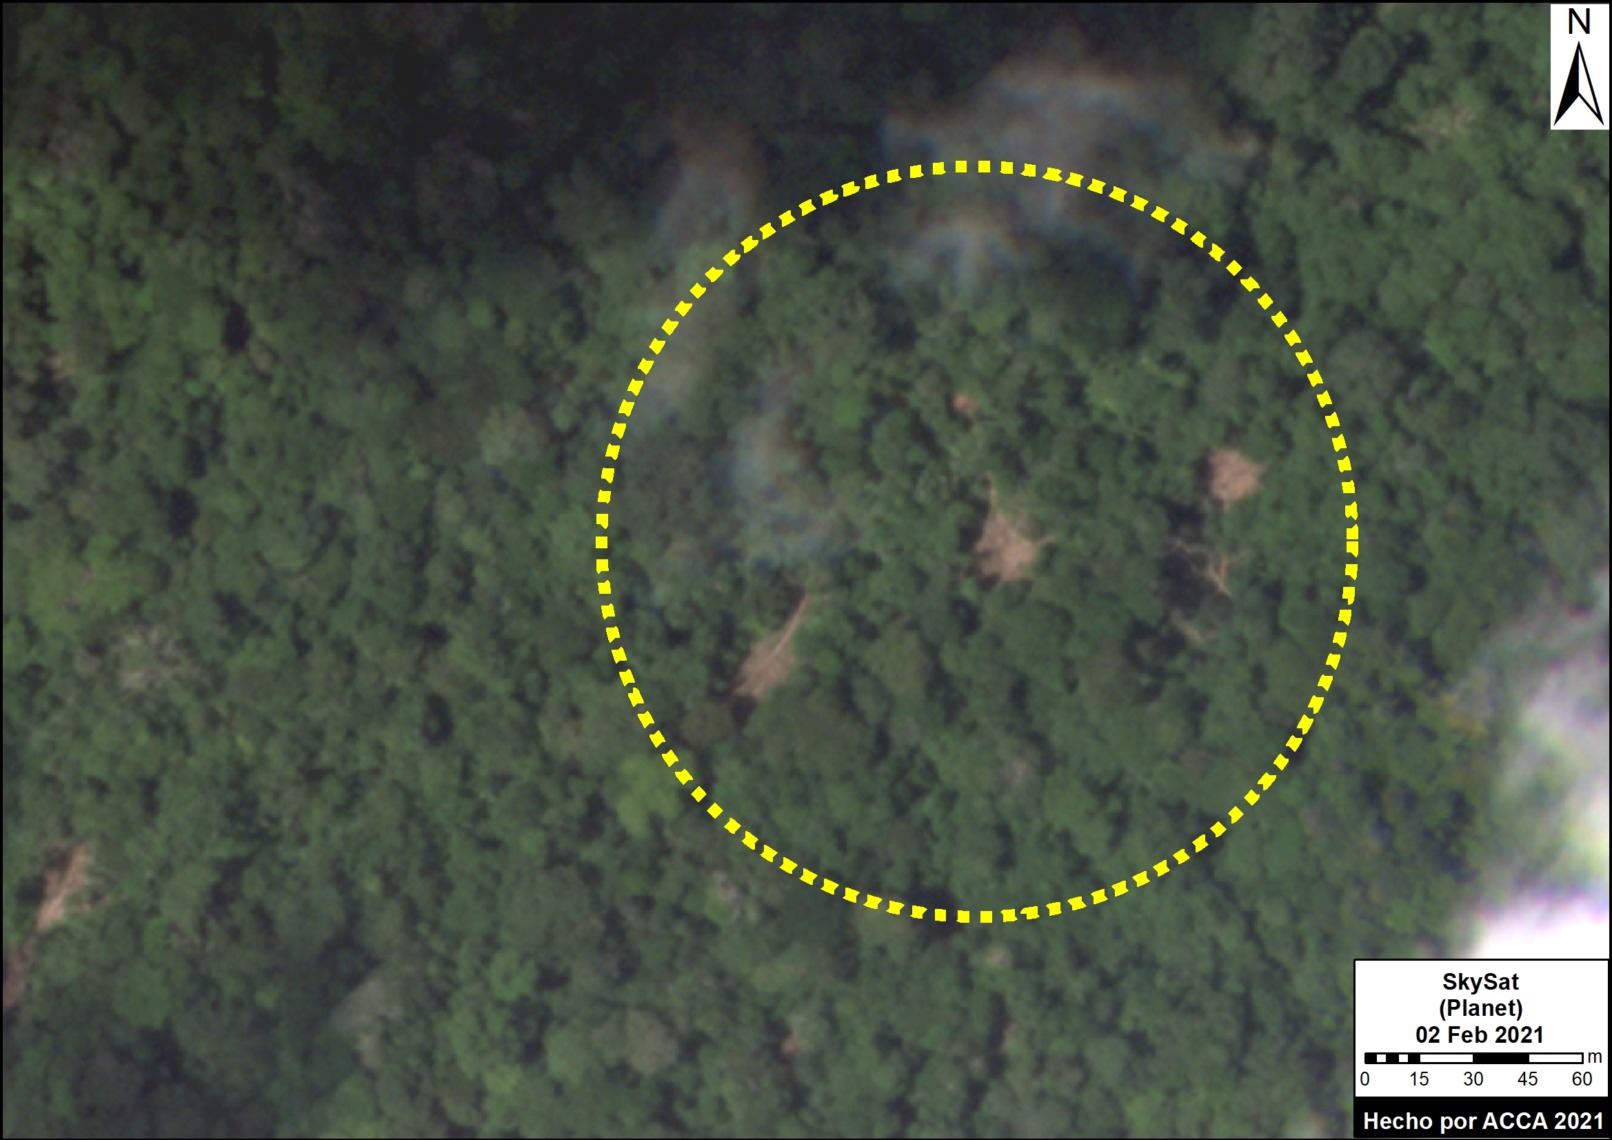
Image 2. Logging camp. Data: Skysat, MAAP/ACCA.
Image 3. Illegal logging. Data: Skysat, MAAP/ACCA.
Image 4. Illegal logging. Data: Skysat, MAAP/ACCA.
Image 5. Illegal logging. Data: Skysat, MAAP/ACCA.

Conclusion

This report presents a novel technique, based on the strategic capture of very high-resolution images (in this case, Skysat) and rapid analysis to detect selective illegal logging in real-time. Previously, one of the biggest obstacles to effectively addressing illegal logging was the inability of traditional monitoring methods to detect such small-scale, but widespread, illegal activity in the field. In this report, we demonstrate an important new capablility of detecting illegal logging activity in vast and remote areas in unprecedented detail, down to the level of a logging camp or individual cut trees.

Legal Situation (in Spanish)

La concesión forestal con Contrato N.° 17-TAM/C-J-007-02 fue otorgada en el año 2002 a la Empresa Shihuahuaco Timber S.A.C. y cedió su posición contractual a la empresa Wood Tropical Forestal en el año 2010, quien es titular del contrato de concesión hasta la actualidad.

La presunción de ilegalidad de la tala selectiva, evidenciada por nuestras imágenes satelitales, se debe a que la concesión forestal no se encontraría realizando actividades de aprovechamiento forestal enmarcadas en planes de manejo aprobados por el Gobierno Regional de Madre de Dios.

En efecto, tras realizar la consulta al Gobierno Regional de Madre de Dios, en su calidad de Autoridad Regional Forestal y de Fauna Silvestre (ARFFS), se advierte que la concesión se encuentra vigente. No obstante, no ha presentado a la ARFFS planes operativos para el aprovechamiento forestal desde hace más de ocho años. Incluso, desde el 30 de enero de 2020, cuenta con una resolución de la ARFFS que aprueba la suspensión del derecho de obligaciones contractuales (Resolución de Gerencia Regional N.° 065-2020-GOREMAD/GRFFS).

En ese sentido, y en tanto no se han presentado planes operativos en los últimos años, podemos inferir que en el área de la concesión forestal posiblemente no se estén realizando actividades lícitas de tala, por lo menos, desde hace ocho años.

Aunado a ello, en el Informe de Supervisión N.° 007-2019-OSINFOR/08.1.1, de acuerdo a una supervisión a la concesión para verificar obligaciones contractuales, el OSINFOR da cuenta de que la concesionaria presentó diversas denuncias entre los años 2016 al 2018 a la  Fiscalía Especializada en Materia Ambiental (FEMA), al Organismo de Supervisión de los Recursos Forestales y de Fauna Silvestre (OSINFOR) y al Gobierno Regional de Madre de Dios, en las cuales advirtió la presencia de terceras personas al interior de la concesión que estarían realizando tala ilegal, deforestación, instalación de campamentos ilegales, entre otros.

Acknowledgments

We thank E. Ortiz (AAF), Z. Romero (ACCA), G. Palacios (ACA), and A. Felix, J. Carlos Guerra, K. Nielsen, O. Liao, and R. Suarez from USAID’s PREVENT Project, and J. Jara for their helpful comments on this report.

This report was conducted with technical assistance from USAID, via the Prevent project. Prevent is an initiative that is working with the Government of Peru, civil society, and the private sector to prevent and combat environmental crimes in Loreto, Ucayali and Madre de Dios, in order to conserve the Peruvian Amazon.

This publication is made possible with the support of the American people through USAID. Its content is the sole responsibility of the authors and does not necessarily reflect the views of USAID or the US government.

This work was also supported by NORAD (Norwegian Agency for Development Cooperation), ICFC (International Conservation Fund of Canada), and EROL Foundation.
Citation

Finer M, Yupanqui O, Suarez D, Novoa S (2021) Using Satellites to Detect Illegal Logging in Peruvian Amazon. MAAP: 139.
Amazon Fire Tracker 2021: Brazilian Amazon Fire Season Intensifies

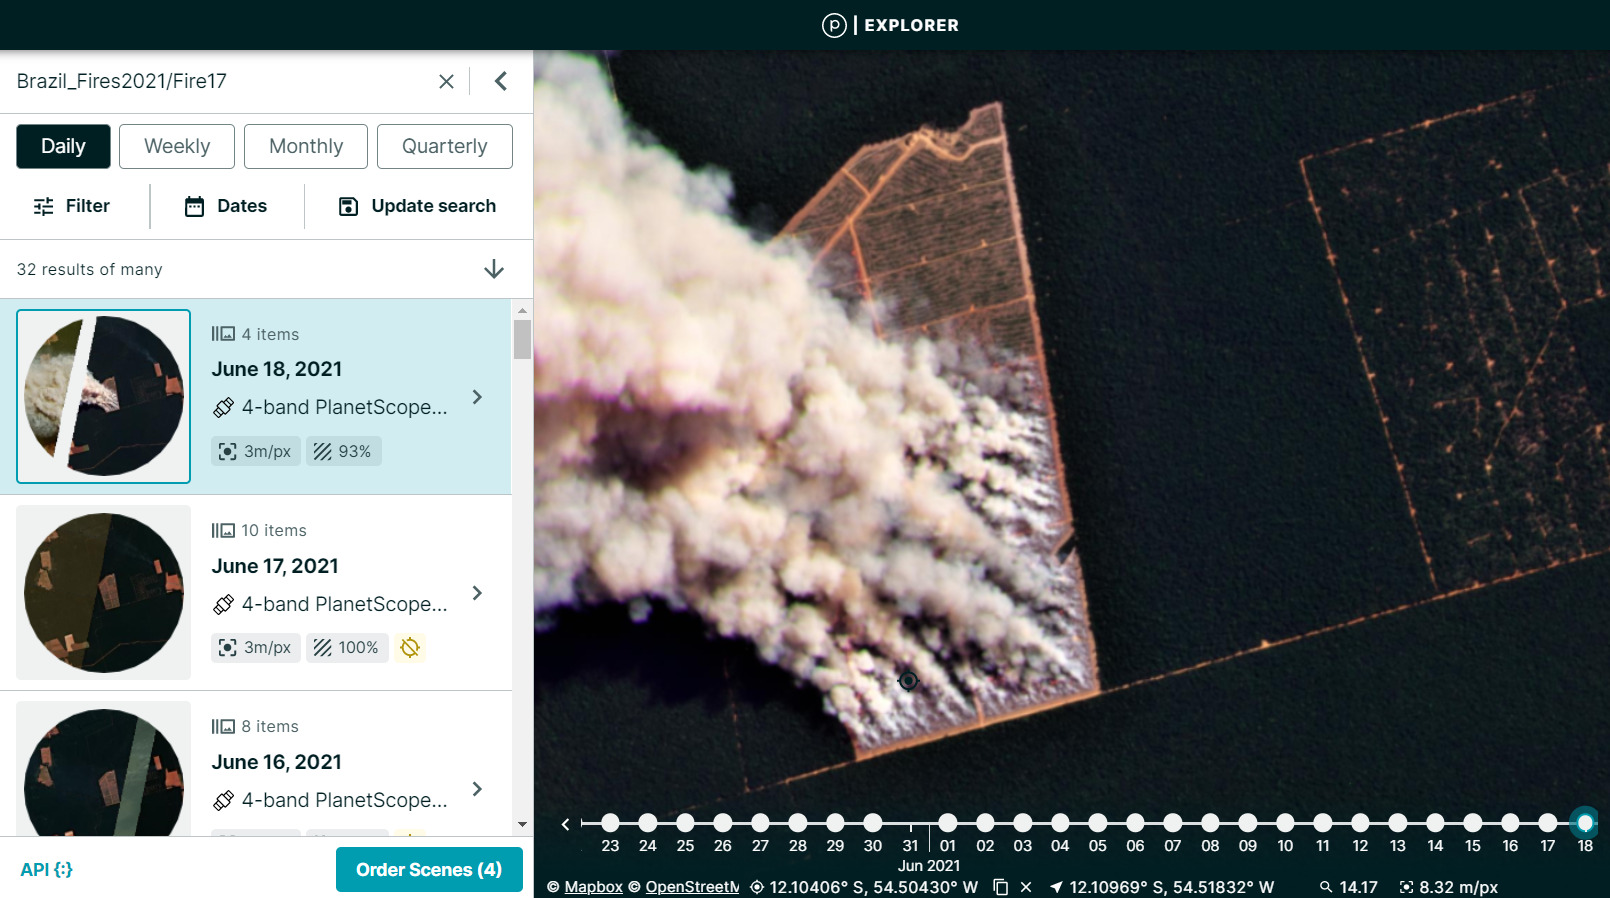
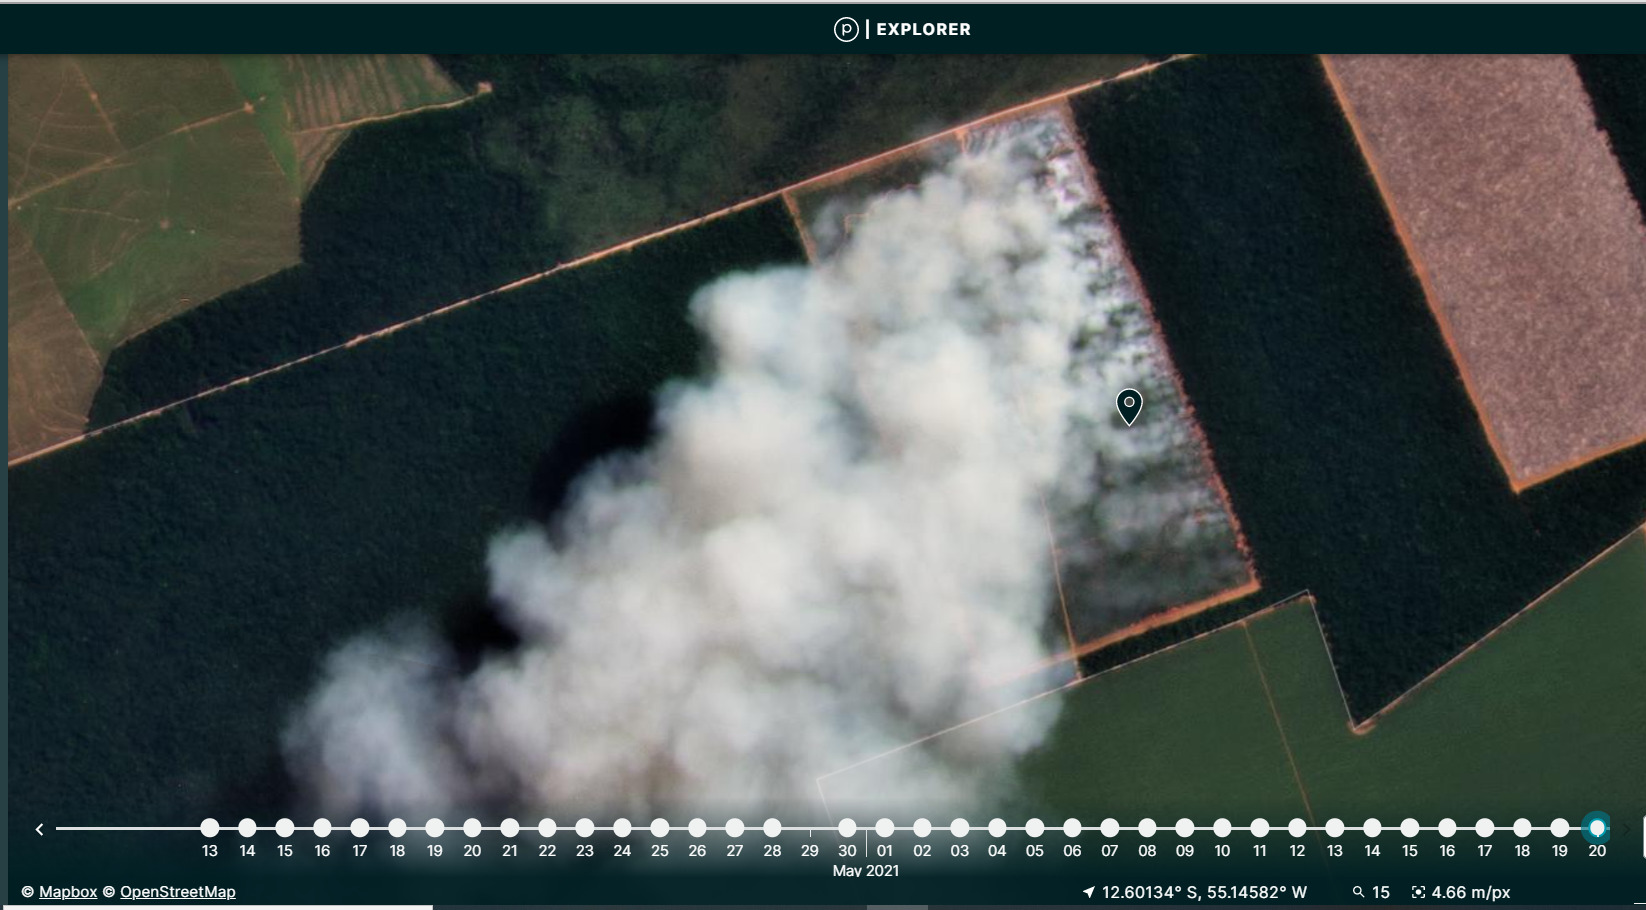
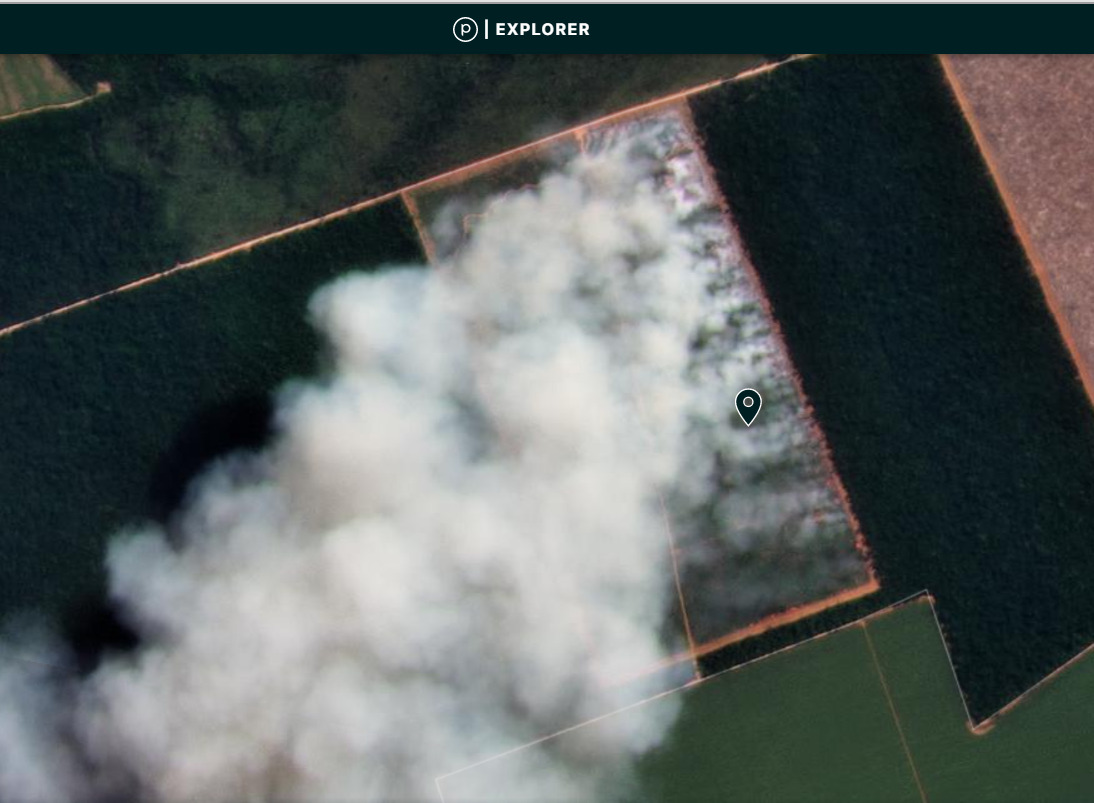
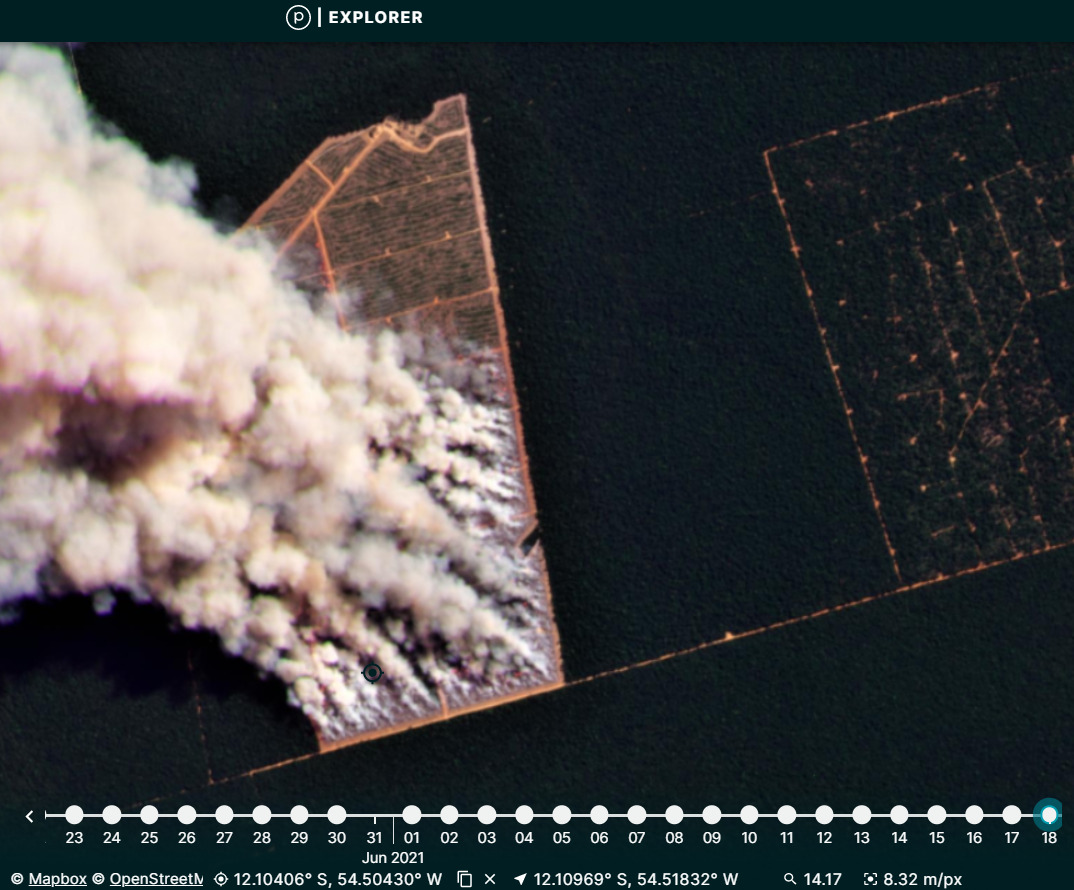
2021 Brazilian Amazon Fire #17 (June 18, Mato Grosso). Data: MAAP, Planet.

We have documented 24 major fires in the Brazilian Amazon thus far in 2021 (as of June 29), based on our unique real-time Amazon fire monitoring app,

In 2020, we demonstrated the power of the app, documenting over 2,500 major fires across the Bolivian, Brazilian, and Peruvian  Amazon (MAAP #129).

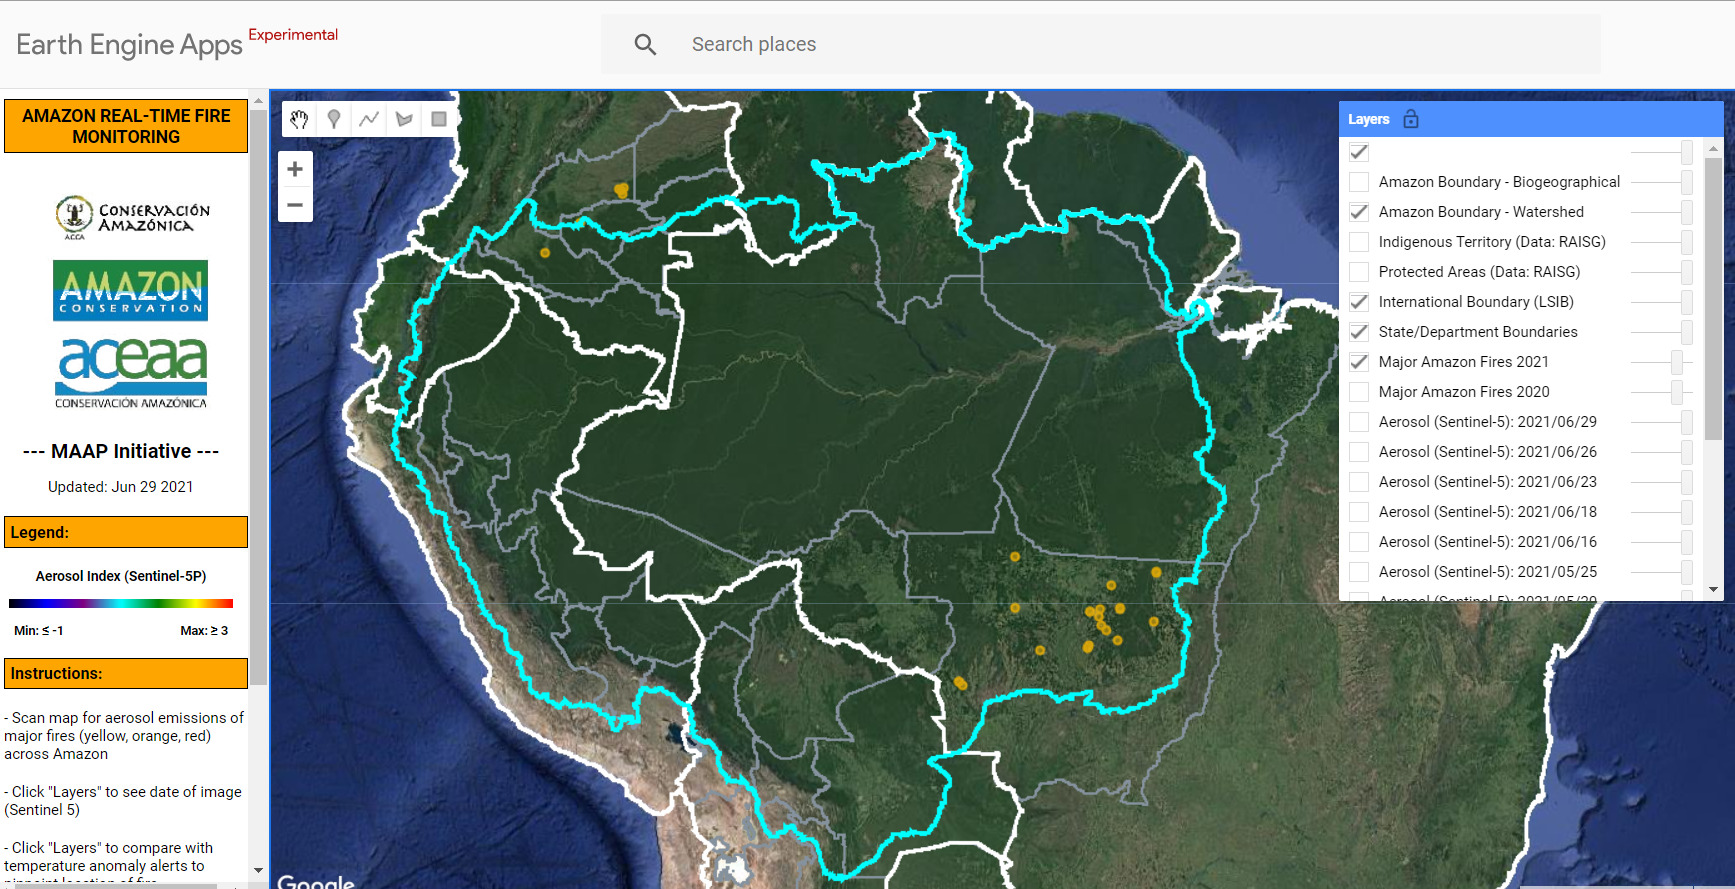
In a new and unique approach, the app combines data from both the atmosphere (aerosol emissions in smoke) and the ground (heat anomaly alerts) to quickly and precisely detect major Amazon fires (MAAP #118).*

We recently reported that the 2021 Brazilian Amazon fire season started on May 19-20, with a pair of major fires on the southern edge of the Amazon in the state of Mato Grosso. For comparison, the intense 2020 fire season started on May 28.

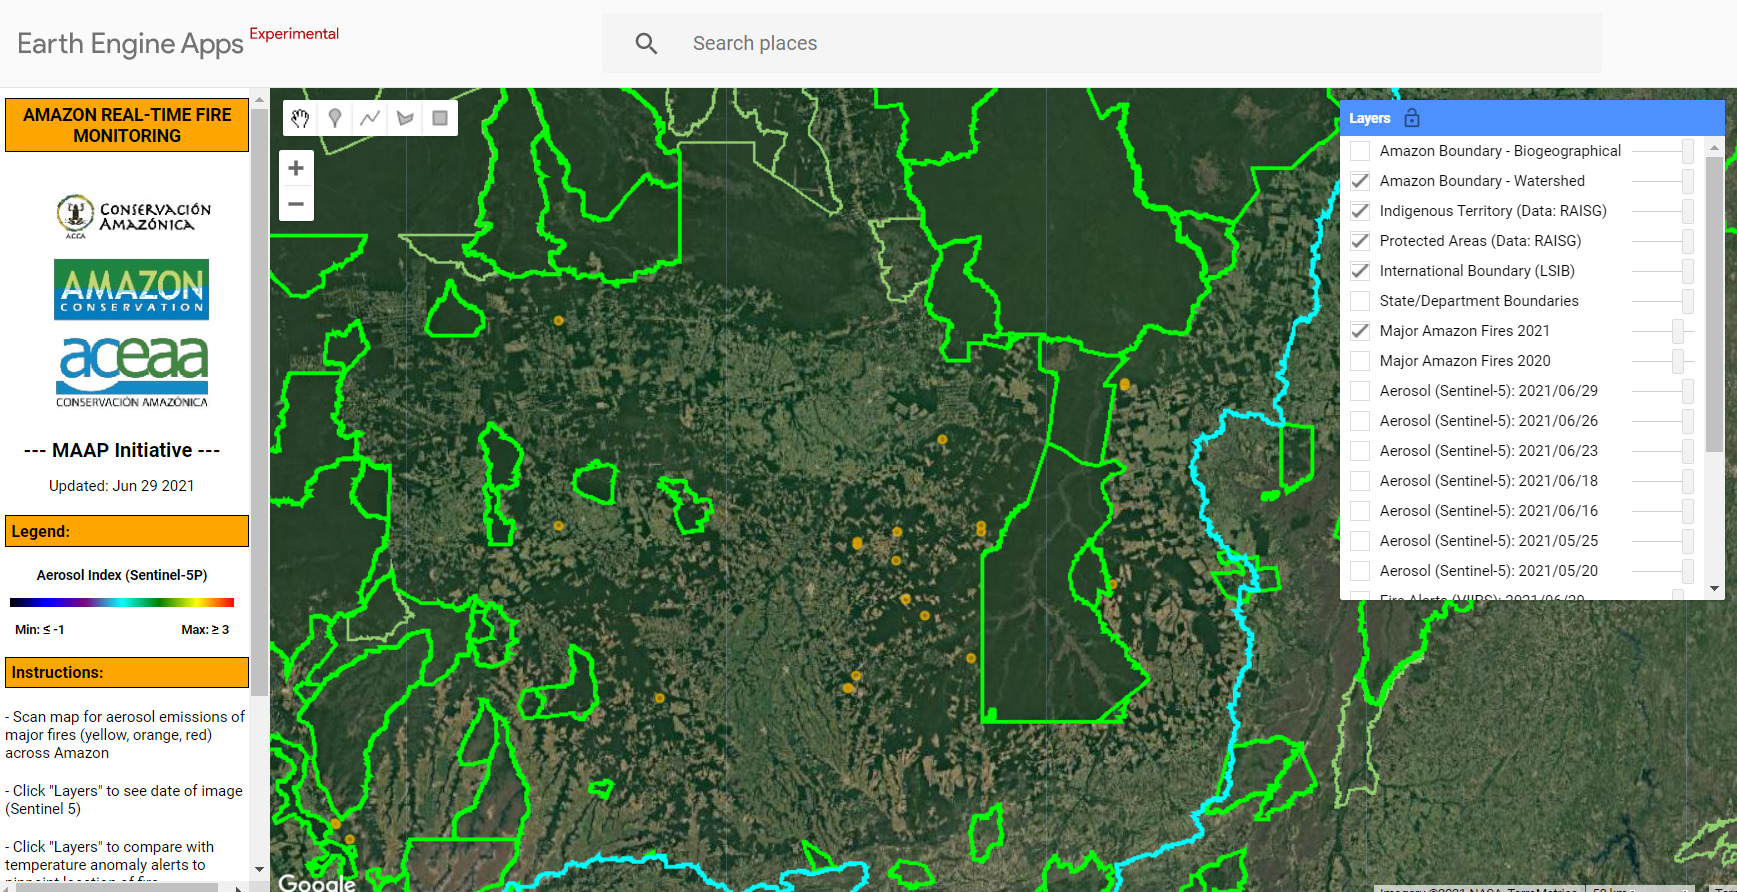
Here, we provide an update through the end of June: we have documented 24 major fires in the Brazilian Amazon, all of which have occurred in the state of Mato Grosso. See the Base Map below for major fire locations (orange dots indicate major 2021 Amazon fires).

Importantly, by analyzing an archive of satellite imagery from the company Planet, we have confirmed that all 24 major fires burned recently deforested areas.  That is, all of the fires were burning the abundant remaining biomass in areas freshly deforested in 2020 and even 2021 (over 7,000 hectares, or 17,000 acres, in total).

Thus, the critical pattern is Deforestation followed by Fire.

To clarify this important point, we have not yet documented “forest fires” impacting intact Amazon forest, but these types of fires are expected later in the fire season, as was the pattern documented in 2020 (see MAAP #129). Also, nearly all fires in the Amazon are assumed to be human-caused and not natural wildfire events.

Below, we present the Base Map along with a striking series of satellite imagery videos showing this critical process of Amazon deforestation followed by major fires. Note that for fire #22, the burning occurred in areas deforested as recently as May 2021.

Base Map: Major Amazon Fires 2021

The Base Map shows the location of the 2021 major Amazon fires (orange dots), as visualized in the app. Note the concentration of fires in the southeastern Brazilian state of Mato Grosso. Keep in mind all those dots also indicate major recent deforestation events. None of these fires directly impacted a protected area or indigenous territory (see Annex). Also note several major fires in the Colombian Amazon that we detected earlier in the year, during that region’s peak season of February -March.

Satellite Imagery Videos

Brazilian Amazon Fires #5 and #23

We detected this series of major fires on May 28 and June 27, in the state of Mato Grosso. As the satellite video shows, this area was deforested in 2020 prior to being burned in June 2021.

https://www.planet.com/stories/brazilian-amazon-fire-23-9yAJFJznR

Brazilian Amazon Fire #22

We detected this major fire on June 27, in the state of Mato Grosso. As the satellite video shows, this area was deforested quite recently (March-May 2021) immediately prior to being burned in June.

Brazilian Amazon Fire #17

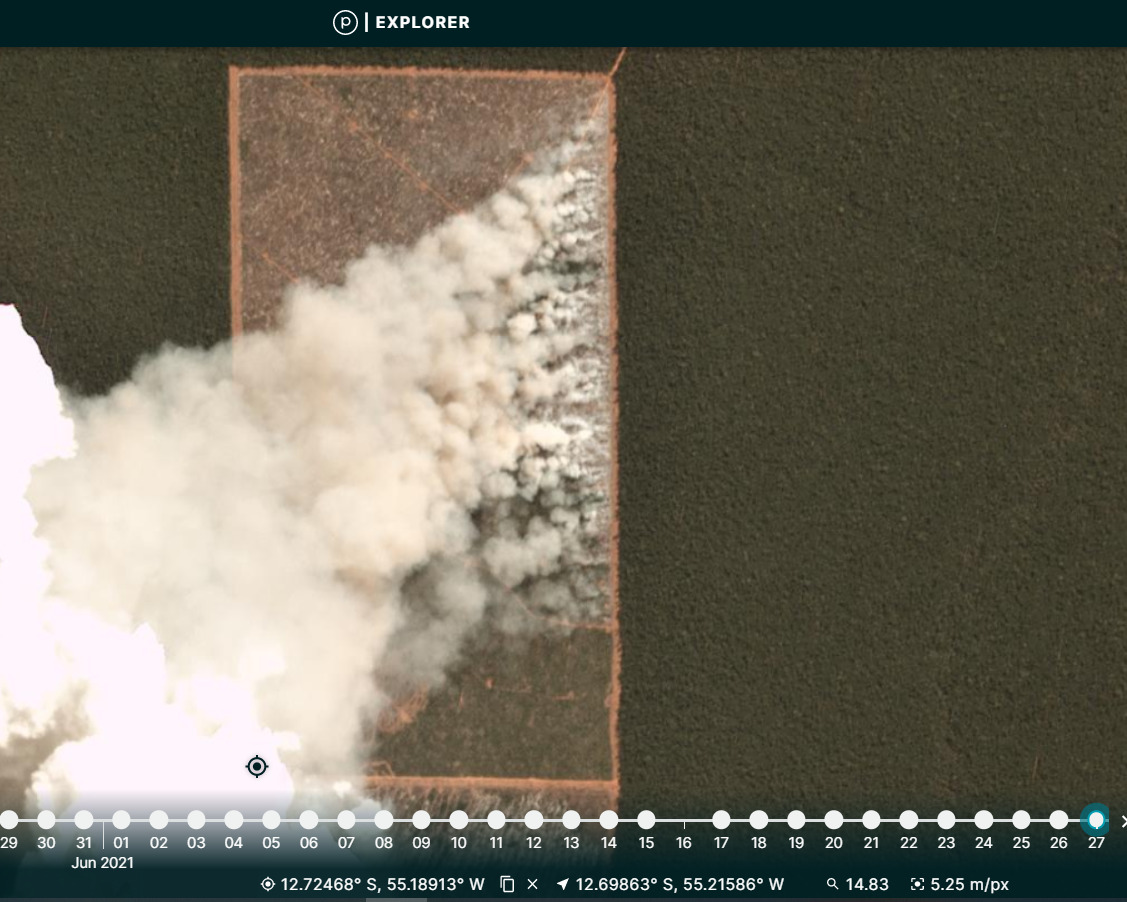
We detected this major fire on June 18, in the state of Mato Grosso. As the satellite video shows, this area was deforested in late 2020 and early 2021 prior to being burned in June 2021.

Brazilian Amazon Fire #2

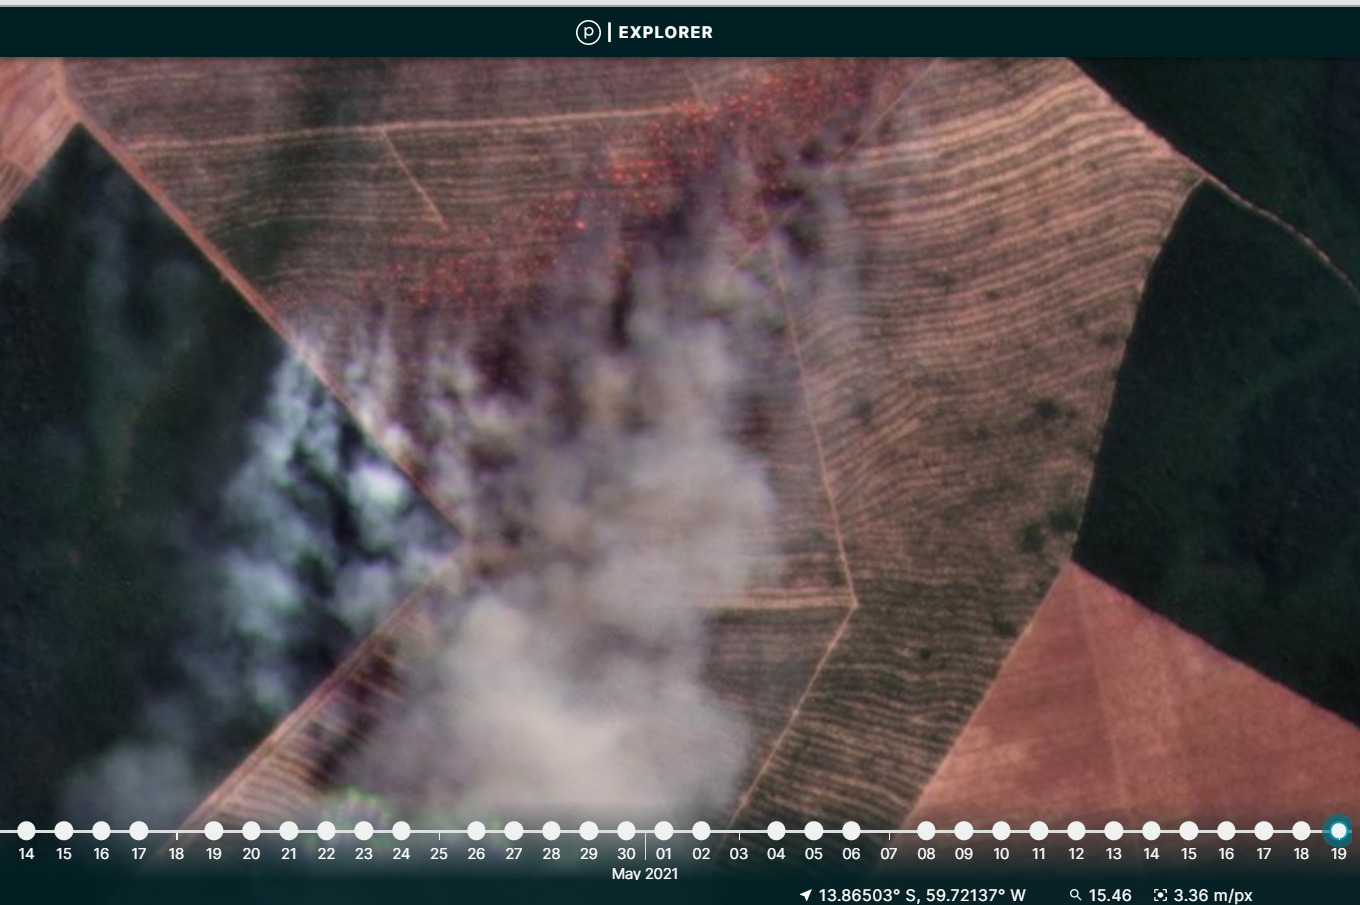
We detected the second major fire of the year in the Brazilian Amazon on May 20, also on the southern edge of the Amazon in the state of Mato Grosso. As the satellite video shows, this area was also first cleared in 2020 and then later burned in 2021.

2021 Brazilian Amazon Fire #2. Mato Grosso. Data: MAAP, Planet.

Annex

The Annex map shows a zoom of the southeastern Brazilian Amazon, as visualized in the app with the protected areas and indigenous territories layers activated. Note that none of the 24 major fires directly impacted a protected area or indigenous territory.


*App Background

We launched a new and improved version of the Amazon real-time fire monitoring app in May 2021. The app is hosted by Google Earth Engine and updated every day by the organization Conservación Amazónica, based in Peru.

The app displays aerosol emissions as detected by the European Space Agency’s Sentinel-5 satellite. Elevated aerosol levels indicate the burning of large amounts of biomass, defined here as a “major fire”. In a novel approach, the app combines data from the atmosphere (aerosol emissions in smoke) and the ground (heat anomaly alerts) to effectively detect and visualize major Amazon fires.

When fires burn, they emit gases and aerosols. A new satellite (Sentinel-5P from the European Space Agency) detects these aerosol emissions (aerosol definition: Suspension of fine solid particles or liquid droplets in air or another gas). Thus, the major feature of the app is detecting elevated aerosol emissions which in turn indicate the burning of large amounts of biomass. For example, the app distinguishes small fires clearing old fields (and burning little biomass) from larger fires burning recently deforested areas or standing forest (and burning lots of biomass). The spatial resolution of the aerosol data is 7.5 sq km. The high values in the aerosol indices (AI) may also be due to other reasons such as emissions of volcanic ash or desert dust so it is important to cross reference elevated emissions with heat data and optical imagery.

We define “major fire” as one showing elevated aerosol emission levels on the app, thus indicating the burning of elevated levels of biomass. This typically translates to an aerosol index of >1 (or cyan-green to red on the app). To identify the exact source of the elevated emissions, we reduce the intensity of aerosol data in order to see the underlying terrestrial heat-based fire alerts. Typically for major fires, there is a large cluster of alerts. The major fires are then confirmed, and burn areas estimated, using high-resolution satellite imagery from Planet Explorer.

Since the data updates daily and is not impacted by clouds, real-time monitoring really is possible. Our goal is to upload each day’s new image in the late afternoon/early evening.

Acknowledgements

The app was developed and updated daily by Conservación Amazónica (ACCA). The data analysis is led by Amazon Conservation in collaboration with SERVIR Amazonia.

The Amazon Fire Tracker series is supported by NORAD (Norwegian Agency for Development Cooperation) and ICFC (International Conservation Fund of Canada).

Citation

Finer M, Villa L (2021) Amazon Fire Tracker 2021: Brazilian Amazon Fire Season Intensifies. MAAP.

Amazon Fire Tracker 2021: Brazilian Amazon Fire Season Begins

2021 Brazilian Amazon Fire #2. Mato Grosso. Data: MAAP, Planet.

Last year (2020), we demonstrated the power of our real-time Amazon fire monitoring app (see MAAP #118 and MAAP #129).

In a novel approach, the app uniquely combines data from the atmosphere (aerosol emissions in smoke) and the ground (heat anomaly alerts) to quickly and precisely detect major Amazon fires.*

Using the app, we just detected the first two major fires in the Brazilian Amazon for 2021.

These fires occurred on May 19 and 20, respectively, both on the southern edge of the Amazon in the state of Mato Grosso. For comparison, last year’s intense fire season started on May 28.

We confirmed both fires using high-resolution imagery from the satellite company Planet.

Importantly, the imagery also revealed that both fires burned recently deforested areas. That is, instead of being actual “forest fires,” both areas were actually first deforested in 2020 and then burned in 2021. See MAAP #113 for background on this important point.

Below, we show a striking series of satellite imagery videos showing this critical process of Amazon deforestation followed by Amazon fires.

2021 Brazilian Amazon Fire #1

We detected the first major fire of the year in the Brazilian Amazon on May 19, on the southern edge of the Amazon in the state of Mato Grosso. As the satellite video shows, this area was first cleared in 2020 and then later burned in 2021.

2021 Brazilian Amazon Fire #1. Mato Grosso. Data: MAAP, Planet


2021 Brazilian Amazon Fire #2

We detected the second major fire of the year in the Brazilian Amazon the following day, on May 20, also on the southern edge of the Amazon in the state of Mato Grosso. As the satellite video shows, this area was also first cleared in 2020 and then later burned in 2021.

2021 Brazilian Amazon Fire #2. Mato Grosso. Data: MAAP, Planet.

*App Background

We launched a new and improved version of the Amazon real-time fire monitoring app in May 2021. The app is hosted by Google Earth Engine and updated every day by the organization Conservación Amazónica, based in Peru.

The app displays aerosol emissions as detected by the European Space Agency’s Sentinel-5 satellite. Elevated aerosol levels indicate the burning of large amounts of biomass, defined here as a “major fire”. In a novel approach, the app combines data from the atmosphere (aerosol emissions in smoke) and the ground (heat anomaly alerts) to effectively detect and visualize major Amazon fires.

When fires burn, they emit gases and aerosols. A new satellite (Sentinel-5P from the European Space Agency) detects these aerosol emissions (aerosol definition: Suspension of fine solid particles or liquid droplets in air or another gas). Thus, the major feature of the app is detecting elevated aerosol emissions which in turn indicate the burning of large amounts of biomass. For example, the app distinguishes small fires clearing old fields (and burning little biomass) from larger fires burning recently deforested areas or standing forest (and burning lots of biomass). The spatial resolution of the aerosol data is 7.5 sq km. The high values in the aerosol indices (AI) may also be due to other reasons such as emissions of volcanic ash or desert dust so it is important to cross reference elevated emissions with heat data and optical imagery.

We define “major fire” as one showing elevated aerosol emission levels on the app, thus indicating the burning of elevated levels of biomass. This typically translates to an aerosol index of >1 (or cyan-green to red on the app). To identify the exact source of the elevated emissions, we reduce the intensity of aerosol data in order to see the underlying terrestrial heat-based fire alerts. Typically for major fires, there is a large cluster of alerts. The major fires are then confirmed, and burn areas estimated, using high-resolution satellite imagery from Planet Explorer.

Since the data updates daily and is not impacted by clouds, real-time monitoring really is possible. Our goal is to upload each day’s new image in the late afternoon/early evening.

Acknowledgements

The app was developed and updated daily by Conservación Amazónica (ACCA). The data analysis is led by Amazon Conservation in collaboration with SERVIR Amazonia.

This work was mainly supported by NORAD (Norwegian Agency for Development Cooperation) and ICFC (International Conservation Fund of Canada).

Citation

Finer M, Villa L (2021) Amazon Fire Tracker 2021: Brazilian Amazon Fire Season Begins. MAAP.

MAAP #137: New Illegal Gold Mining Hotspot in Peruvian Amazon – Pariamanu

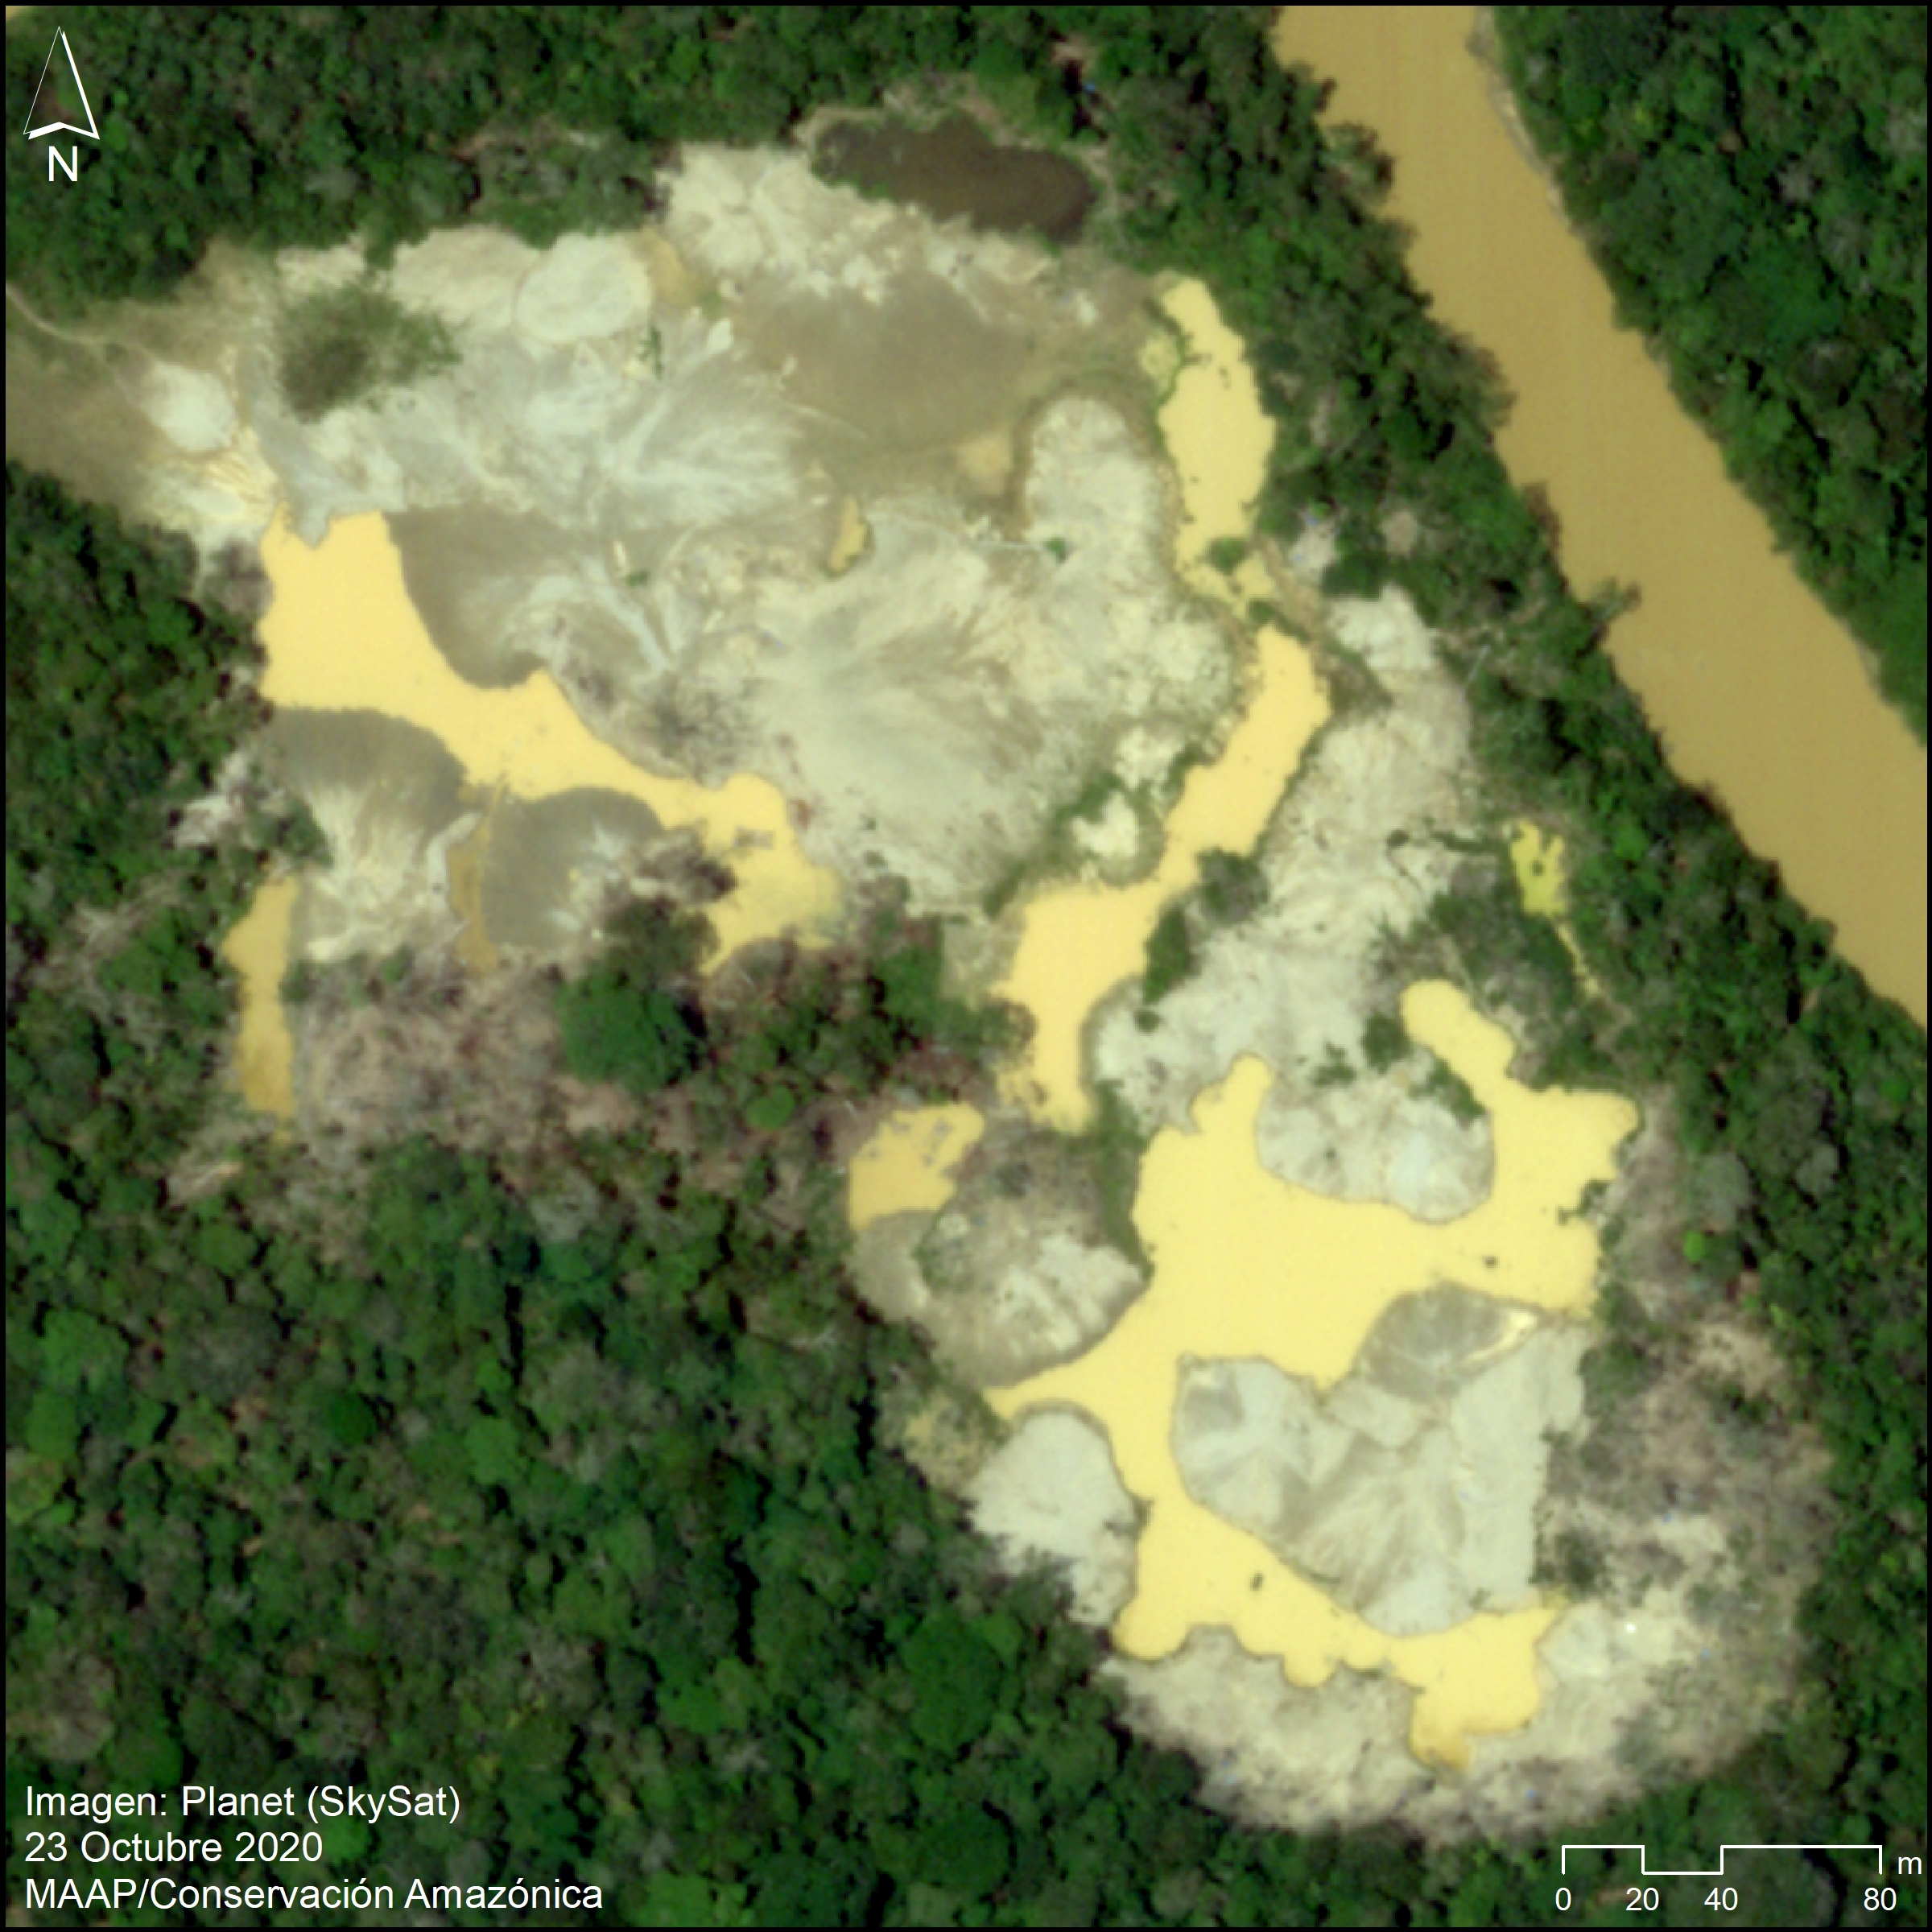
Image 1. Very high-resolution image of the recent gold mining deforestation (10 hectares) in the new hotspot around the Pariamanu river. Data: Planet (Skysat)

In 2019, the Peruvian government launched Operation Mercury to confront the illegal gold mining crisis in the southern Amazonian area known as La Pampa (Madre de Dios region).

As a result, deforestation decreased 90% in this critical area (MAAP# 130).

Some illegal gold mining, however, has moved to several new hotspots (Image 1), although at much lower levels.

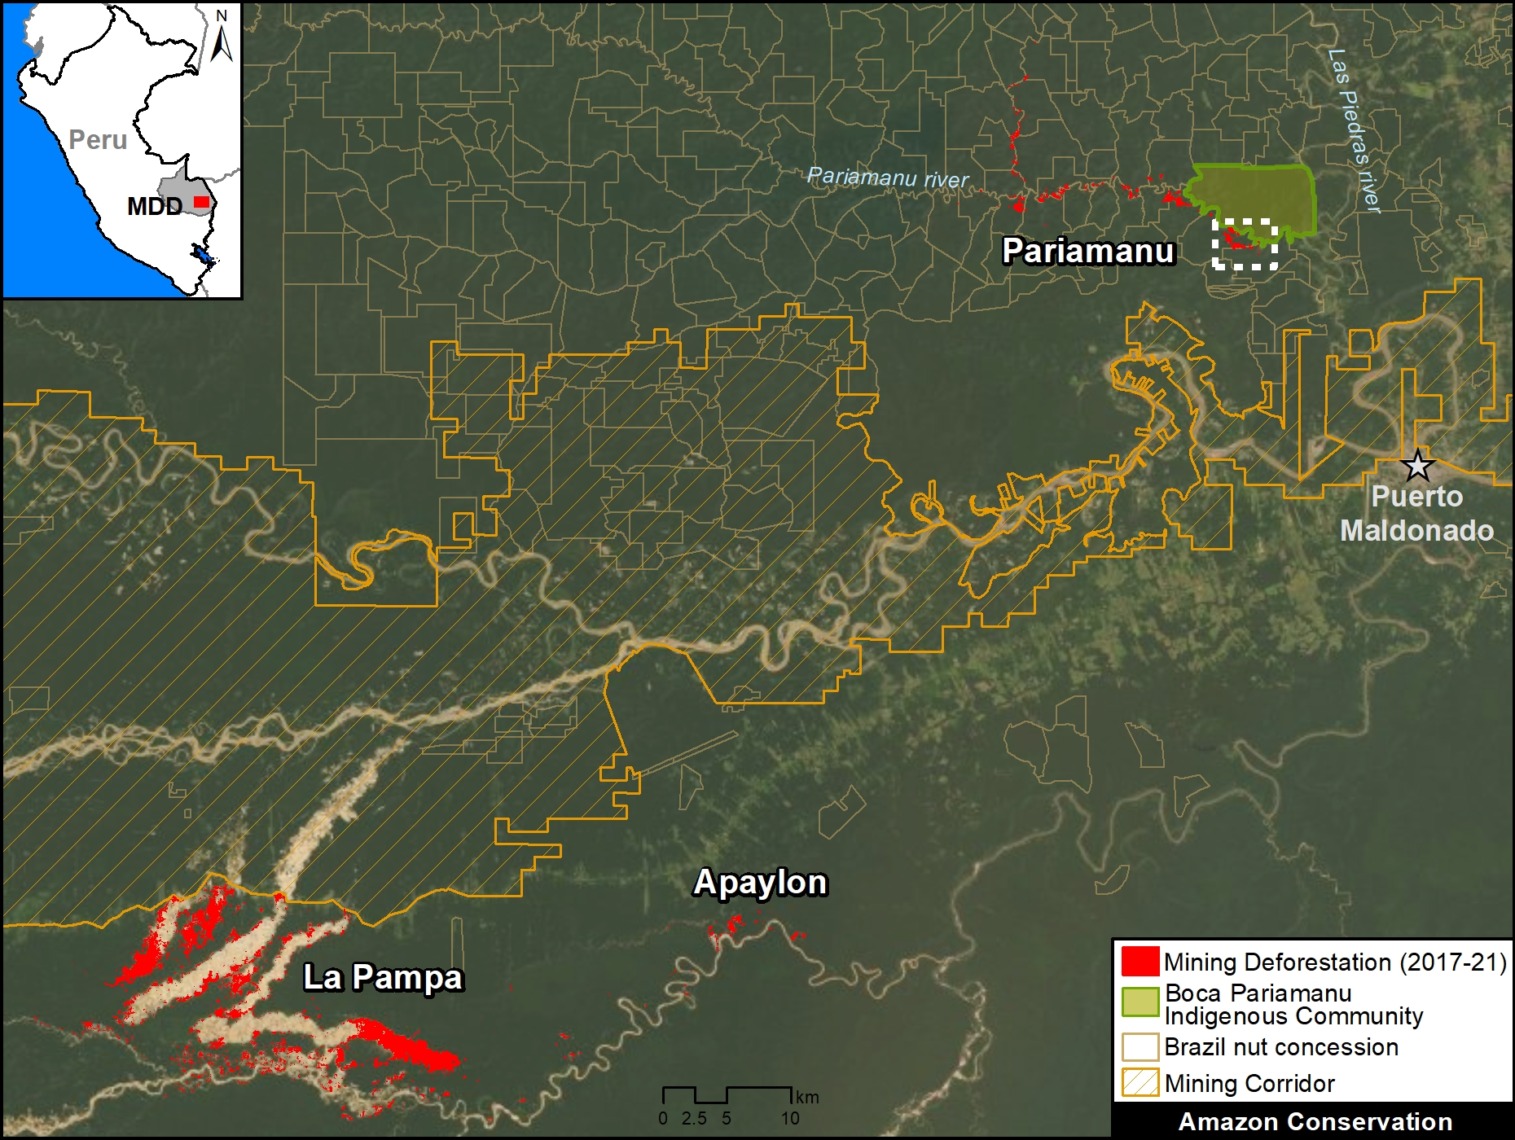
The most emblematic hotspot is located along the Pariamanu River, northeast of La Pampa in the Madre de Dios region (see Base Map, below).

We have documented the gold mining deforestation of 204 hectares (504 acres) in the Pariamanu area from 2017 to the present

This mining activity is clearly illegal because it is located within Brazil-nut forestry concessions, and is outside the permitted mining zone (commonly called the “mining corridor”).

Fortunately, a series of timely actions by the Peruvian Government has minimized the irreversible damage along the Pariamanu (see below).

The objective of this report is to present Pariamanu as an emblematic case that links technology with the rapid response action of public entities to address illegal activity in the Amazon.

It also represents a concrete case of strategic collaboration between civil society and the government to try and achieve zero illegal deforestation (and avoided deforestation).

Pariamanu

Base Map. Illegal gold mining deforestation along the Pariamanu river, in the context of La Pampa. Data: MAAP.

Base Map

The Base Map shows the location of illegal gold mining along the Pariamanu River, in the southern Peruvian Amazon (Madre de Dios region).

For context, La Pampa (the previous epicenter of illegal mining) and the regional capitol city of Puerto Maldonado are inlcuded. We also show another new illegal mining hotspot next to La Pampa, known as Apaylon.

In total, we have documented the deforestation of 204 hectares (504 acres) of primary forest caused by illegal gold mining in Pariamanu since 2017, indicated in red.

Note that this deforestation is located within Brazil nut forestry concessions and outside the “mining corridor,” thus clearly indicating its illegality.

Satellite Video: Illegal Gold Mining Deforestation in Pariamanu

We present a satellite image video showing an example of illegal gold mining in the Pariamanu area. These images show the deforestation of 71 hectares (175 acres) between 2016 (first image) and 2021 (last image), in the area indicated by the white inset box in the Base Map above. Note that each image is from July of each year (2016-20), with the exception of 2021 which shows January and March. Press the “play” button (lower left) to start the video. Click on the box (lower right) to view in full screen.

Satellite image video. Data: Planet.

Planet link: https://www.planet.com/stories/illegal-gold-mining-in-southern-peruvian-amazon-pa-6DfO4KuGg

MAAP Reports & Government Action

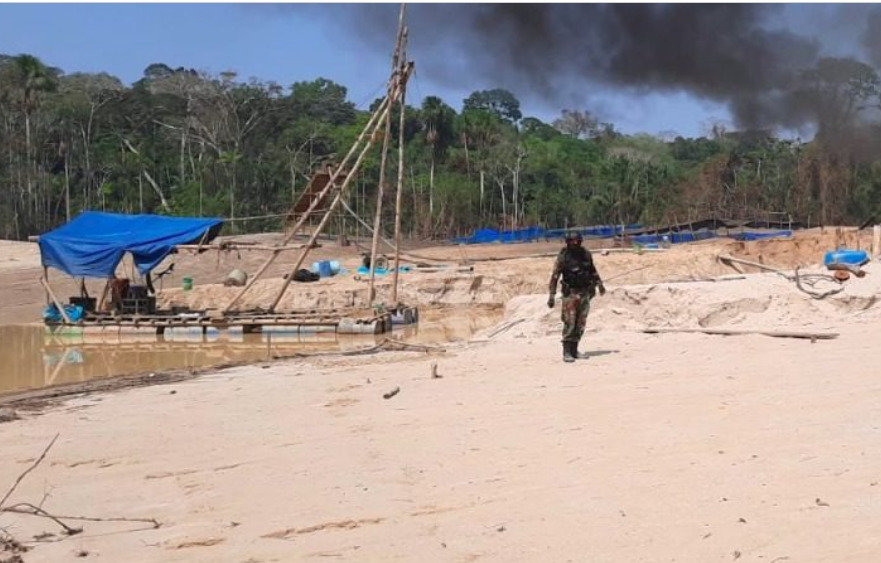
Operativo en Pariamanu, septiembre del 2020. Foto: FEMA Madre de Dios.

The first MAAP report about Pariamanu was published in November 2016, where we described “the start of mining in a new area” (MAAP #50). We found the mining-caused deforestation of 69 hectares (170 acres) on the banks of the Pariamanu river.

In January 2020, we published the second MAAP report about Pariamanu, documenting that the mining deforestation increased to 99 hectares (245 acres) (MAAP # 115). In this report, we warned that there were indications that some miners displaced by Operation Mercury (in February 2019) have moved to this area.

In response to this situation, the Peruvian Government, led by the Special Prosecutor for Environmental Matters (known as FEMA), carried out a series of field operations in 2020 (May, August and September, respectively), as an extension of Operation Mercury focused on cracking down on the illegal mining in Pariamanu.

The operations were effective in destroying mining equipment and sending a strong message that the government was engaged in this area.

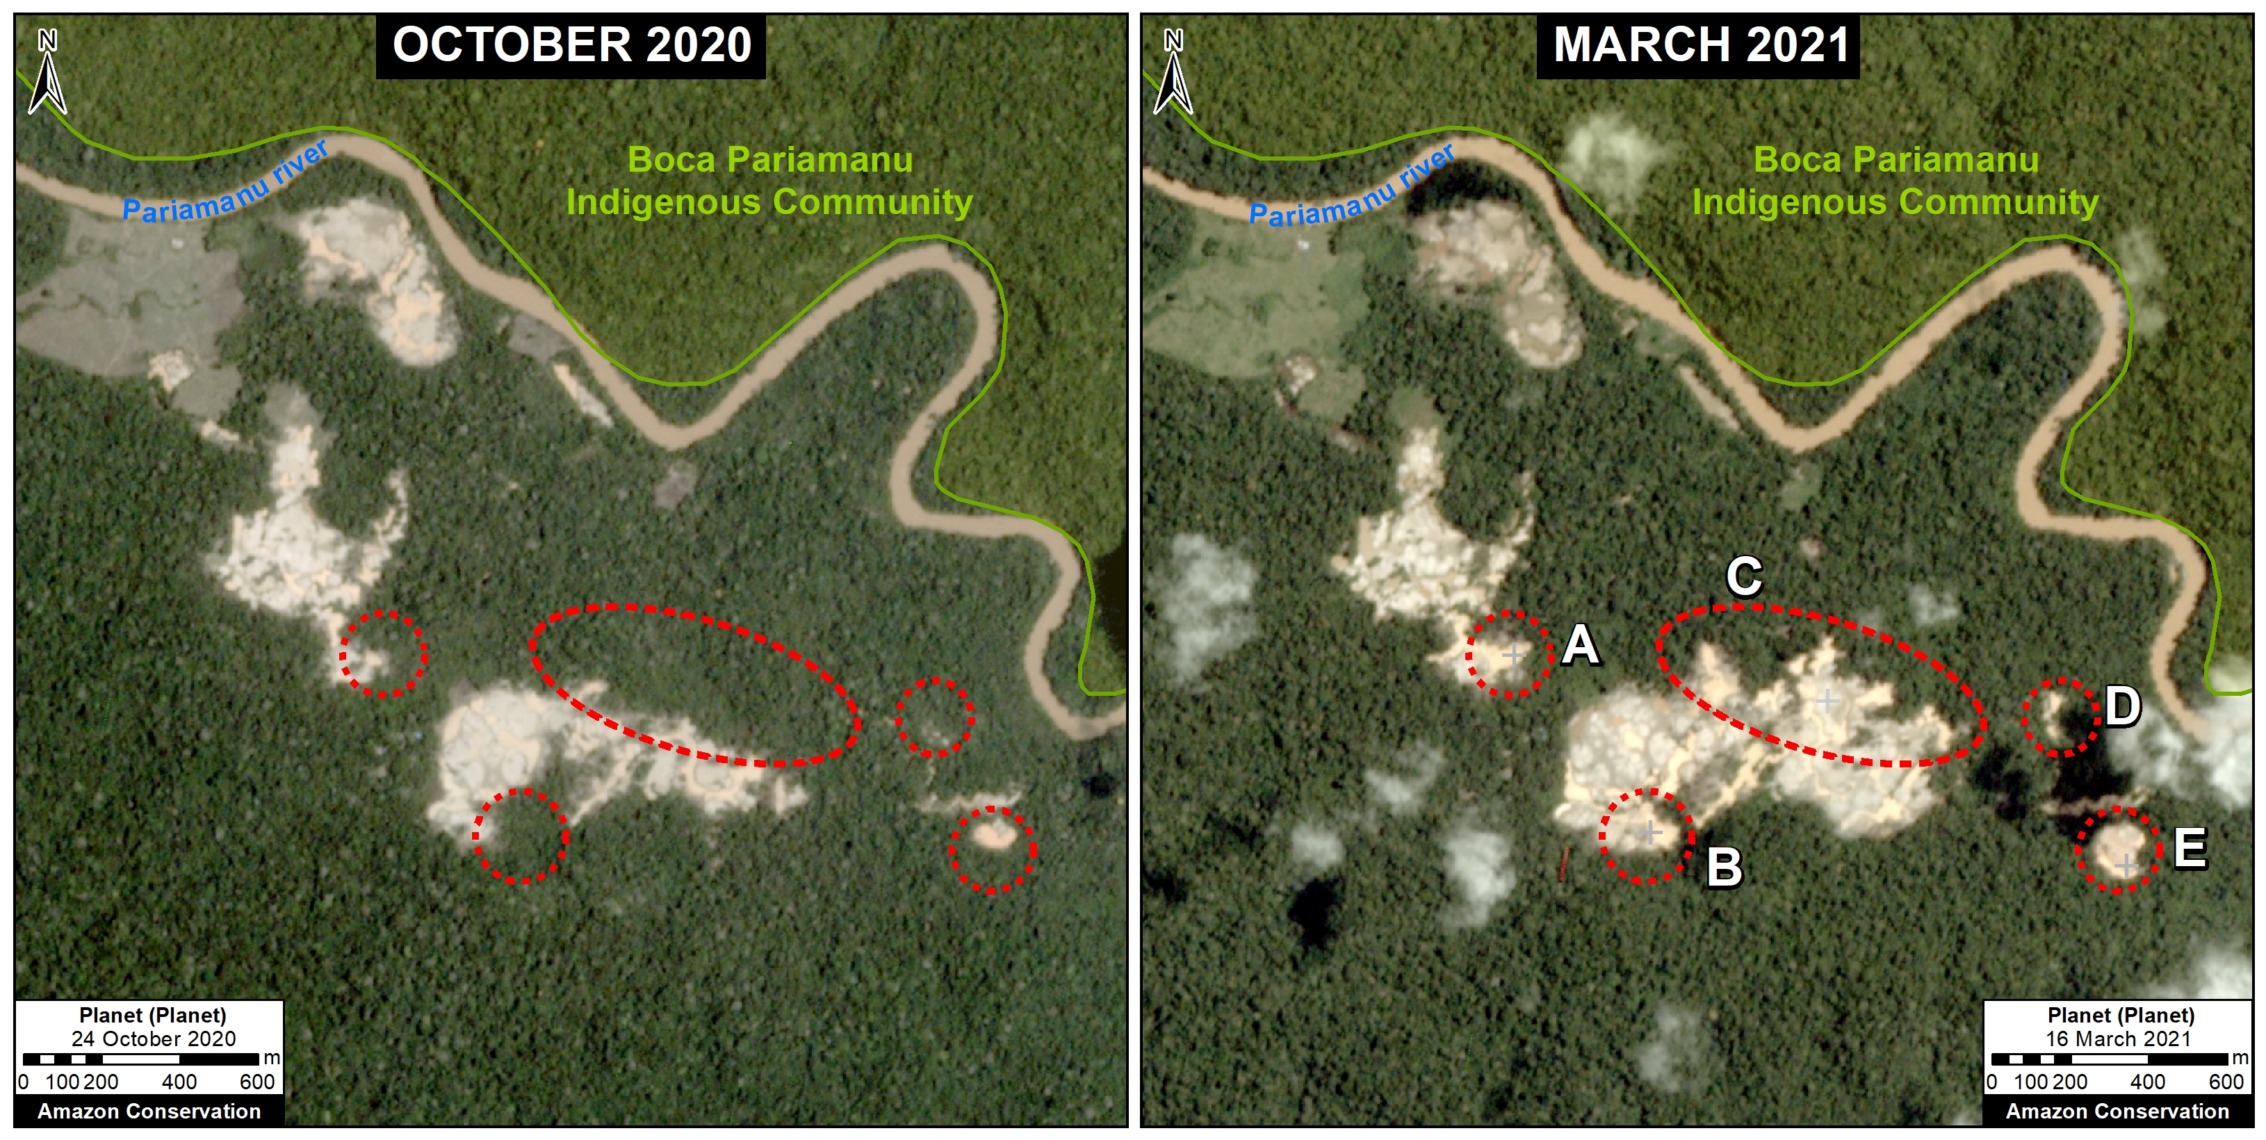
However, we found that gold mining deforestation continued in several small areas between October 2020 and March 2021 (see Image 2), reaching the new total of 204 hectares (504 acres).

Fortunately, the government continues to respond effectively. Most recently (March 19, 2021), FEMA and the Peruvian Coast Guard carried out a new operation in Pariamanu, finding an illegal mining camp and equipment.

As mentioned above, the objective of this section (and this report) is to present Pariamanu as an emblematic case that links technology with the rapid response action of public entities to address illegal activity in the Amazon. It also represents a concrete case of strategic collaboration between civil society and the government to try and achieve zero illegal deforestation (and avoided deforestation).

Image 2. Data: Planet, MAAP.

Acknowledgments

We thank S. Novoa (ACCA), G. Palacios (ACA), and A. Felix, K. Nielsen, A. Caceres, I. Canelo, J. Carlos Guerra, O. Liao, y H. Che Piu from USAID’s PREVENT Project, for their helpful comments on this report.

This report was conducted with technical assistance from USAID, via the Prevent project. Prevent is an initiative that is working with the Government of Peru, civil society, and the private sector to prevent and combat environmental crimes in Loreto, Ucayali and Madre de Dios, in order to conserve the Peruvian Amazon.

This publication is made possible with the support of the American people through USAID. Its content is the sole responsibility of the authors and does not necessarily reflect the views of USAID or the US government.

This work was also supported by NORAD (Norwegian Agency for Development Cooperation), ICFC (International Conservation Fund of Canada), and EROL Foundation.

Citation

Finer M, Mamani N (2021) New Illegal Gold Mining Hotspot in Peruvian Amazon – Pariamanu. MAAP: 137.

MAAP #138: As Brazil negotiates with world, Amazon deforestation continues in 2021

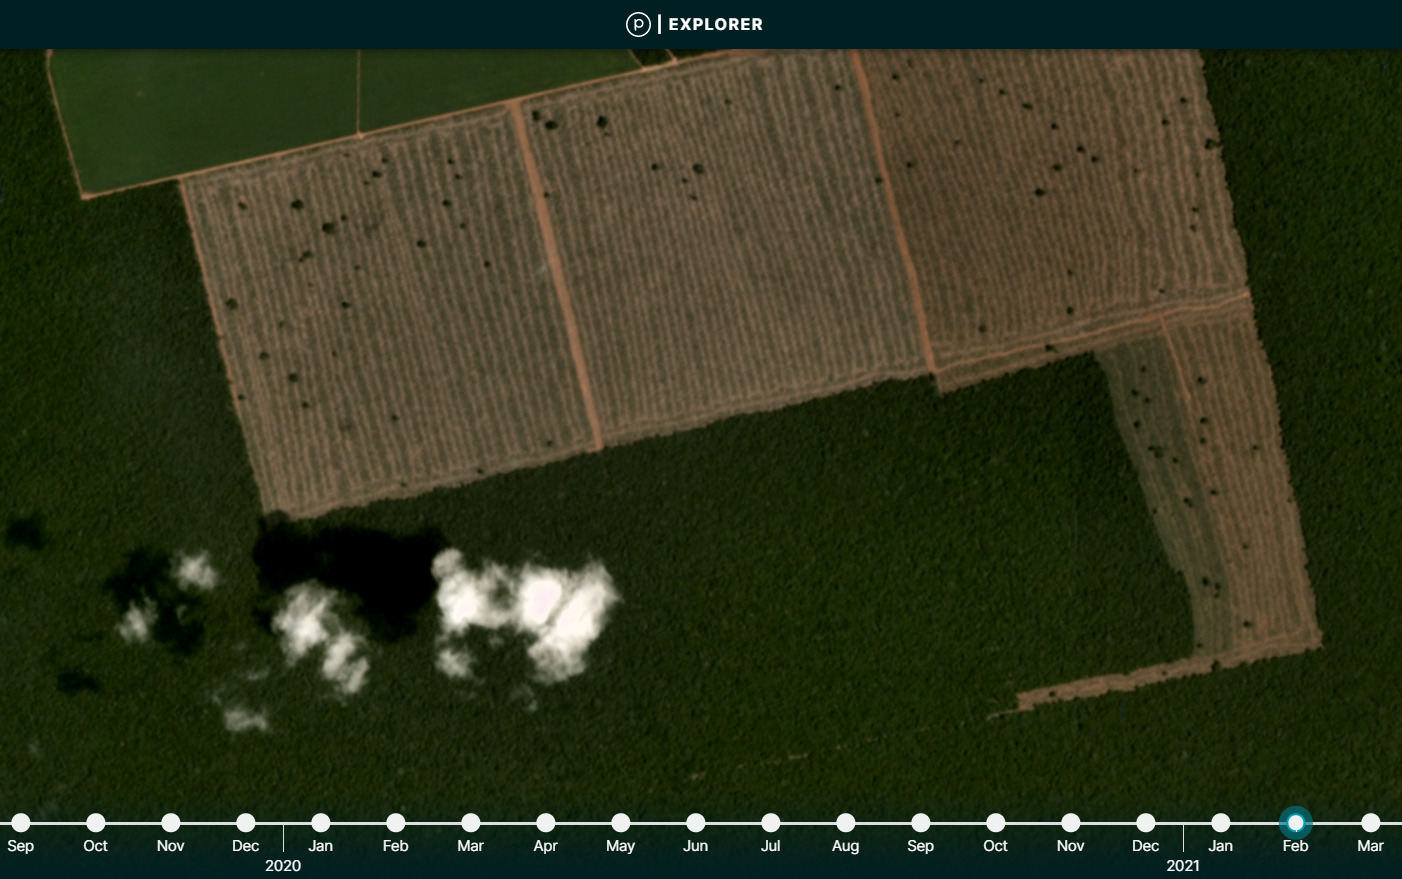
Expanding new 2021 deforestation in the Brazilian Amazon (Mato Grosso). Data: Planet. Click to enlarge image.

Brazil is currently in high-profile negotiations with countries such as the United States and Norway for international compensation in exchange for improved action to address Amazon deforestation.*

While this may be a positive development diplomatically, on the ground extensive deforestation continues.

We recently reported that, in 2020, Brazil had the sixth-highest primary forest loss on record (1.5 million hectares) and a 13% increase from 2019 (MAAP #136).

Here we present a first look at 2021 Brazilian Amazon deforestation.

This early analysis is important because a) it provides real-time context for the negotiations, and b) these are the first areas that are likely to be burned in the upcoming fire season (see MAAP #129).

We first analyzed a new generation of early warning forest loss alerts, based on 10-meter resolution imagery (a major upgrade from the previous 30-meter alerts).* These alerts indicate the loss of over 175,000 hectares of primary forest thus far in 2021.

We then investigated the most urgent (large alert clusters) with even higher resolution (3 meters) satellite imagery from Planet.

Below, we present a series of high-resolution imagery videos showing key examples of 2021 Brazilian Amazon deforestation.

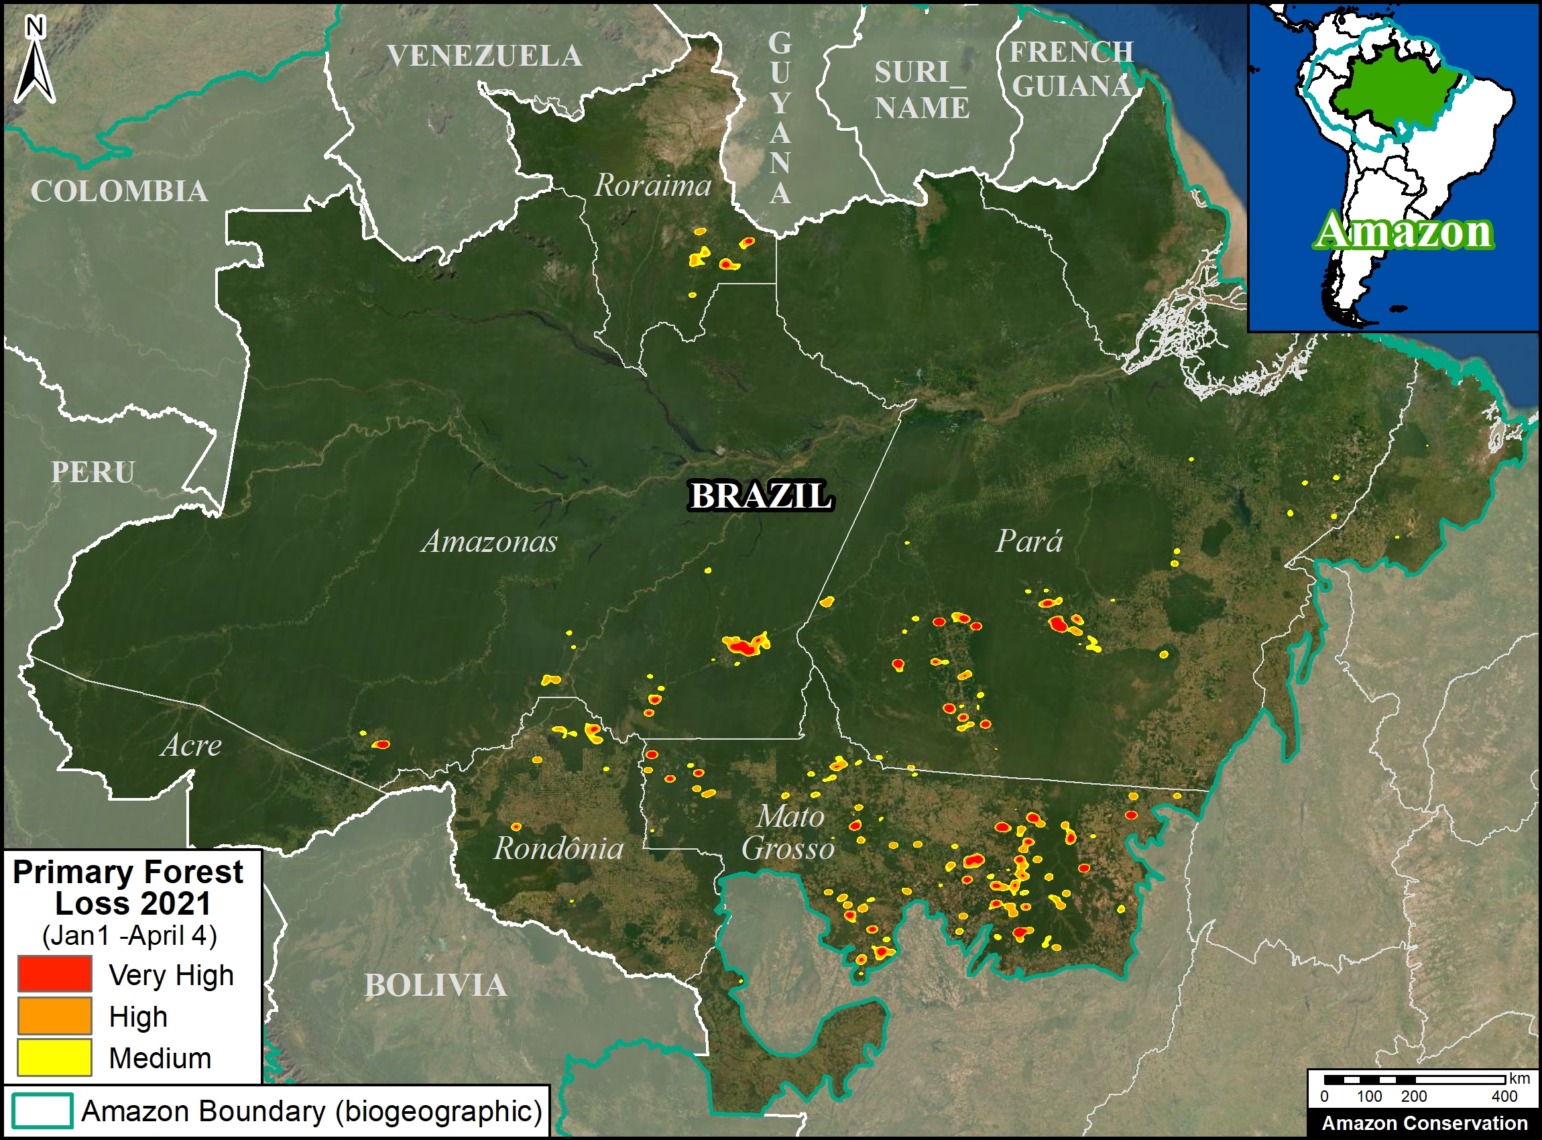
Primary forest hotspots 2021 (thru April 4). Data: UMD/GLAD, MAAP.

Forest Loss Alerts

The alerts indicate the loss of 175,330 hectares of primary forest in the Brazilian Amazon between January 1 and April 4, 2021.

The Base Map illustrates where this deforestation has been concentrated.

Note the heavy concentrations in the states of Mato Grosso, Pará, and Amazonas, followed by Rondônia and Roraima.


High-resolution Imagery Videos

Mato Grosso

Planet Link

Pará

Planet Link

Mato Grosso

Planet Link

Rondônia

Planet Link

Munduruku Indigenous Territory (Pará)

Planet Link

*Notes

For more information on the negotiations between Brazil and both the United States and Norway, see the following links:

As climate summit unfolds, no Biden-Bolsonaro Amazon deal forthcoming
Mongabay

Brazil’s Bolsonaro, under U.S. pressure, vows climate neutrality by 2050
Reuters

Joe Biden’s billions won’t stop Brazil destroying the Amazon rainforest
Guardian

Brazil demand for U.S. to pay upfront stalls deal to save Amazon forest
Reuters

Brazil needs $10 bln a year in aid for carbon neutrality by 2050, minister says
Reuters

‘Negotiating with your worst enemy’: Biden in risky talks to pay Brazil to save Amazon
Guardian

Brazil’s promises to slash forest losses ’empty’, researchers say ahead of Biden summit
Reuters

Brazil must cut deforestation 15-20% a year to reach 2030 goal, says vice president
Reuters

Norway nixes support until Brazil reduces Amazon deforestation
Business Day


*Methods

The early warning forest loss alerts used in this report are produced by the University of Maryland (GLAD).  They are the first alerts based on 10-meter resolution imagery obtained from the European Space Agency’s Sentinel-2 satellite. Previous alerts were based on 30-meter resolution imagery obtained from NASA/USGS Landsat satellites.

To identify the deforestation hotspots, we conducted a kernel density estimate. This type of analysis calculates the magnitude per unit area of a particular phenomenon, in this case forest cover loss. We conducted this analysis using the Kernel Density tool from Spatial Analyst Tool Box of ArcGIS. We used the following parameters:

Search Radius: 15000 layer units (meters)
Kernel Density Function: Quartic kernel function
Cell Size in the map: 200 x 200 meters (4 hectares)
Everything else was left to the default setting.

For the Base Map, we used the following concentration percentages: Medium: >10%; High: >15%; Very High: >25%.

Acknowledgments

We thank A. Folhadella (ACA) for their helpful comments on this report.

This work was supported by NORAD (Norwegian Agency for Development Cooperation) and ICFC (International Conservation Fund of Canada).

Citation

Finer M, Mamani N (2021) As Brazil negotiates with world, Amazon deforestation continues in 2021. MAAP: 138.

MAAP #136: Amazon Deforestation 2020 (Final)

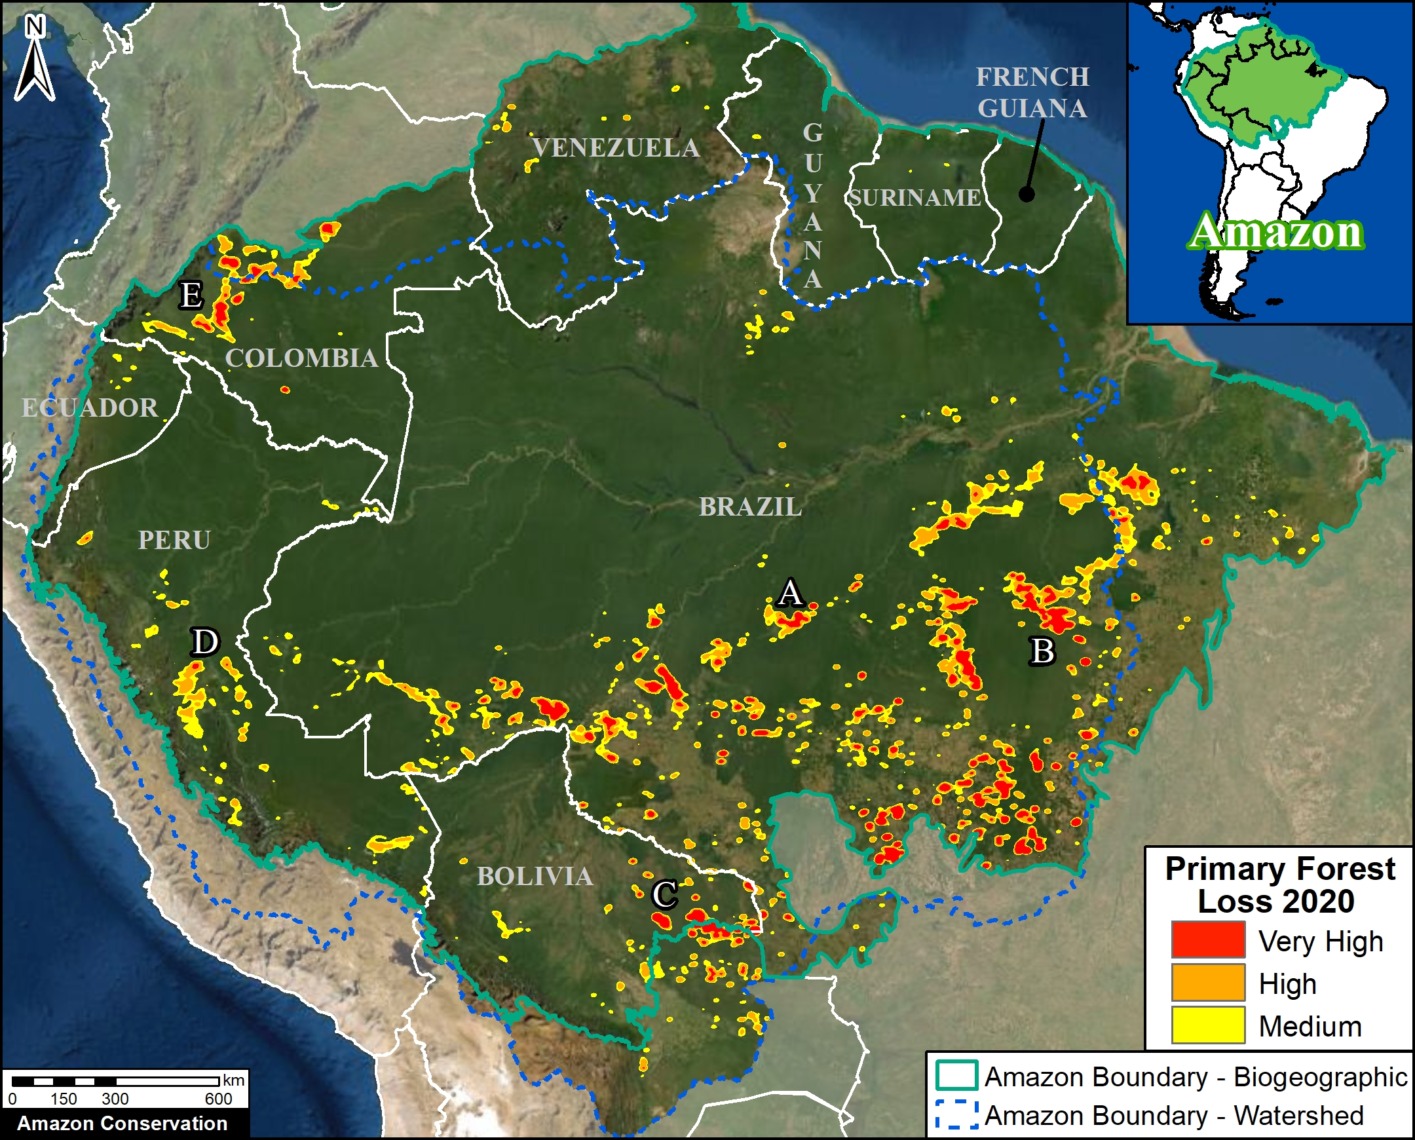
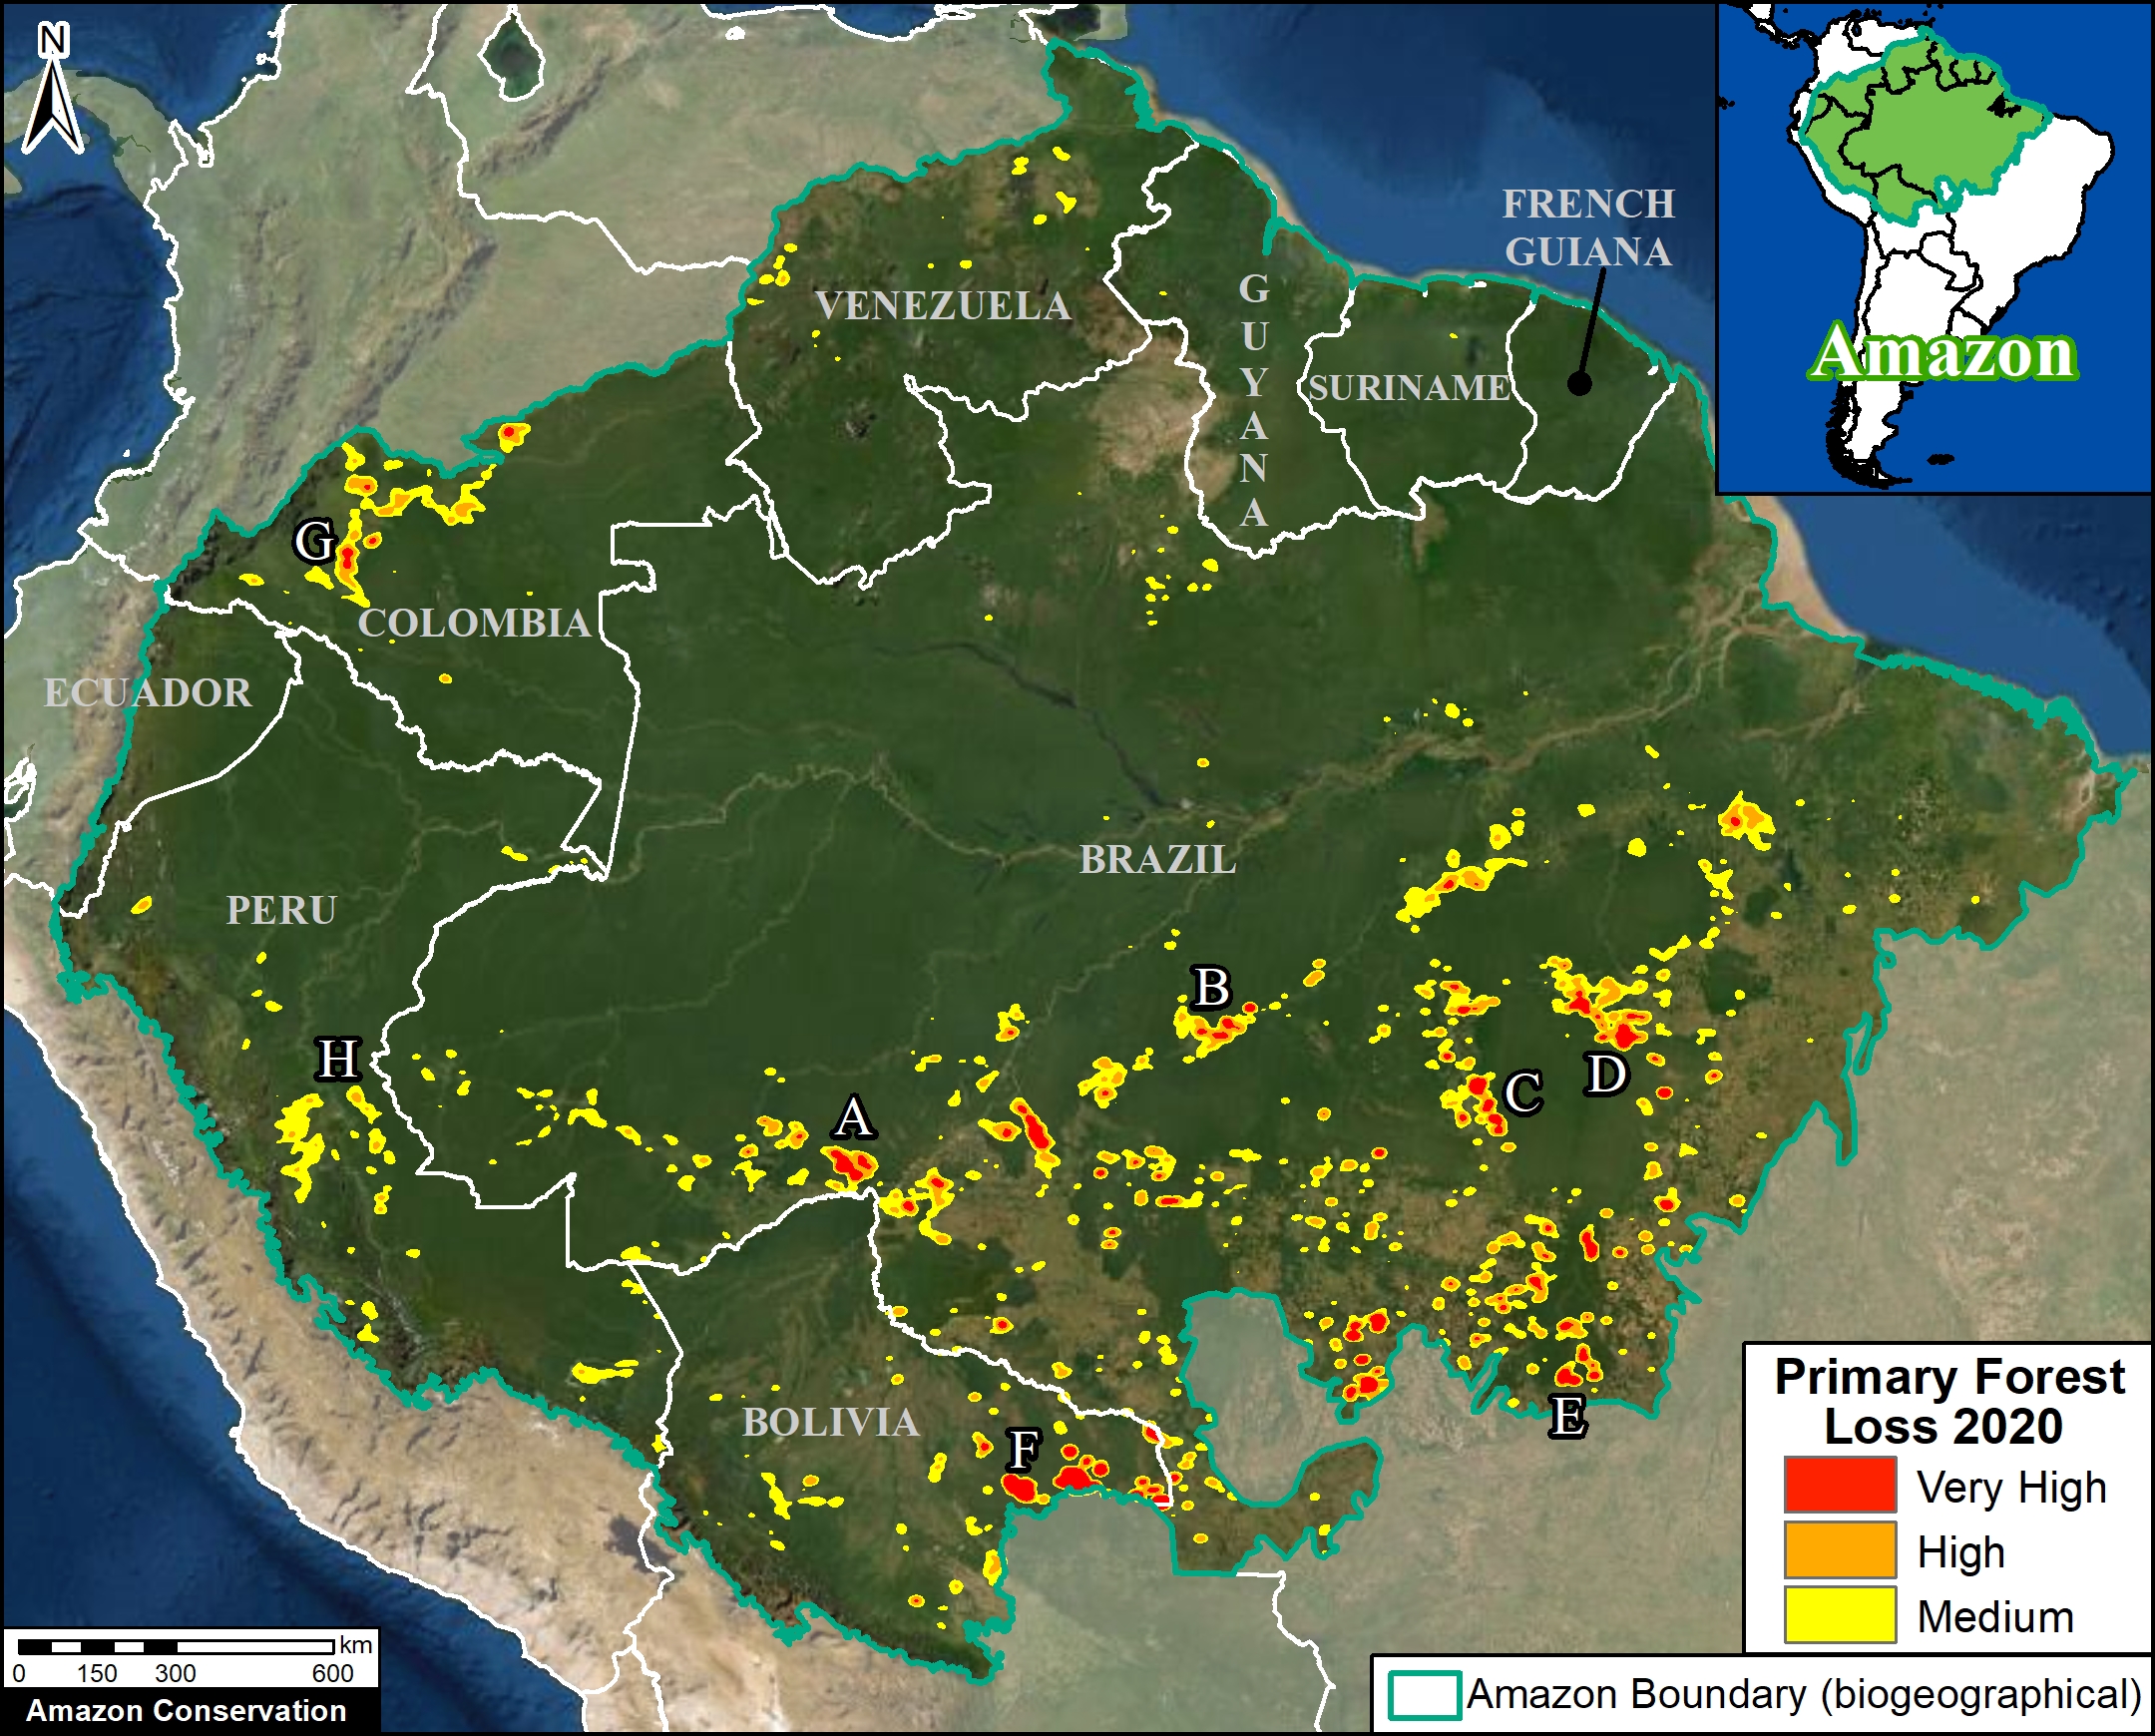
Base Map. Forest loss hotspots across the Amazon in 2020. Data: Hansen/UMD/Google/USGS/NASA, RAISG, MAAP.

*To download the report, click “Print” instead of “Download PDF” at the top of the page.

In January, we presented the first look at 2020 Amazon deforestation based on early warning alert data (MAAP #132).

Here, we update this analysis based on the newly released, and more definitive, annual data.*

The Base Map illustrates the final results and indicates the major hotspots of primary forest loss across the Amazon in 2020.

We highlight several key findings:

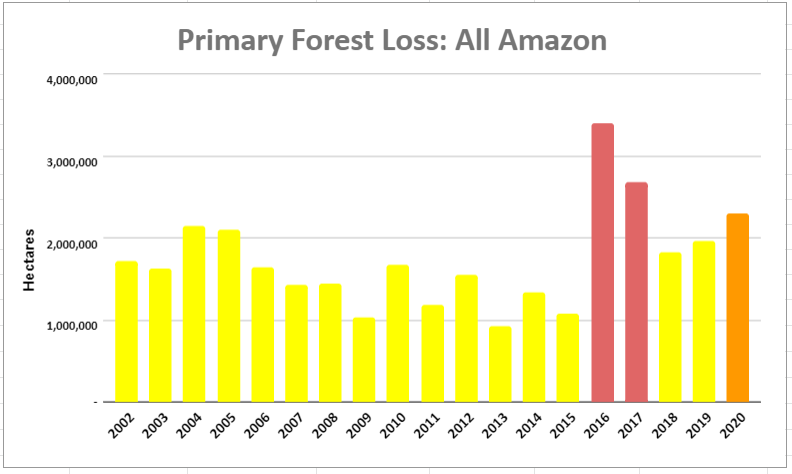
  • The Amazon lost nearly 2.3 million hectares (5.6 million acres) of primary forest loss in 2020 across the nine countries it spans.
    g
  • This represents a 17% increase in Amazon primary forest loss from the previous year (2019), and the third-highest annual total on record since 2000 (see graph below).
    j
  • The countries with the highest 2020 Amazon primary forest loss are 1) Brazil, 2) Bolivia, 3) Peru, 4) Colombia, 5) Venezuela, and 6) Ecuador.
    h
  • 65% occurred in Brazil (which surpassed 1.5 million hectares lost), followed by 10% in Bolivia, 8% in Peru, and 6% in Colombia (remaining countries all under 2%).
    k
  • For Bolivia, Ecuador, and Peru, 2020 recorded historical high Amazon primary forest loss. For Colombia, it was the second highest on record.

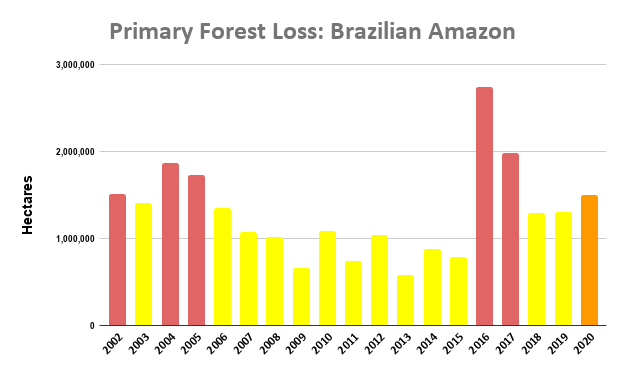
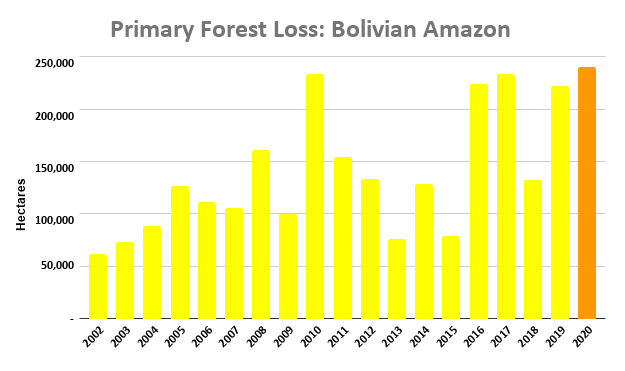
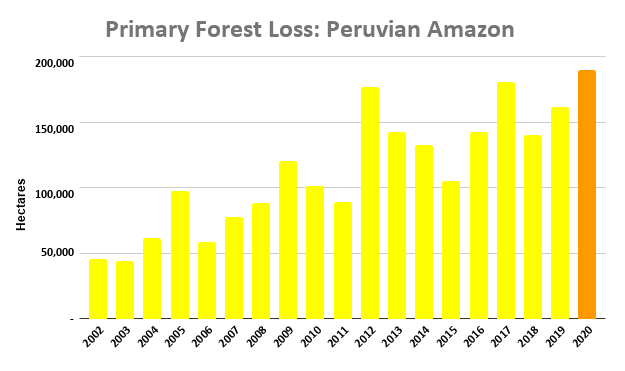
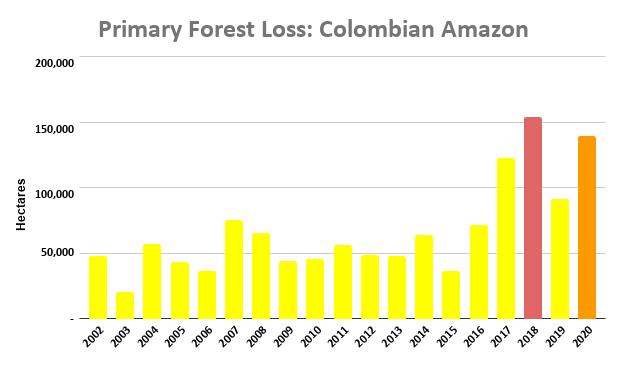
In all of the data graphs, orange indicates the 2020 primary forest loss and red indicates all years with higher totals than 2020.

For example, the Amazon lost nearly 2.3 million hectares in 2020 (orange), the third highest on record behind only 2016 and 2017 (red).

Note that the three highest years (2016, 2017, and 2020) had one major thing in common: uncontrolled forest fires in the Brazilian Amazon.

See below for country-specific graphs, key findings, and satellite images for the top four 2020 Amazon deforestation countries (Brazil, Bolivia, Peru, and Colombia).


Brazilian Amazon

2020 had the sixth-highest primary forest loss on record (1.5 million hectares) and a 13% increase from 2019.
Many of the 2020 hotspots occurred in the Brazilian Amazon, where massive deforestation stretched across nearly the entire southern region.
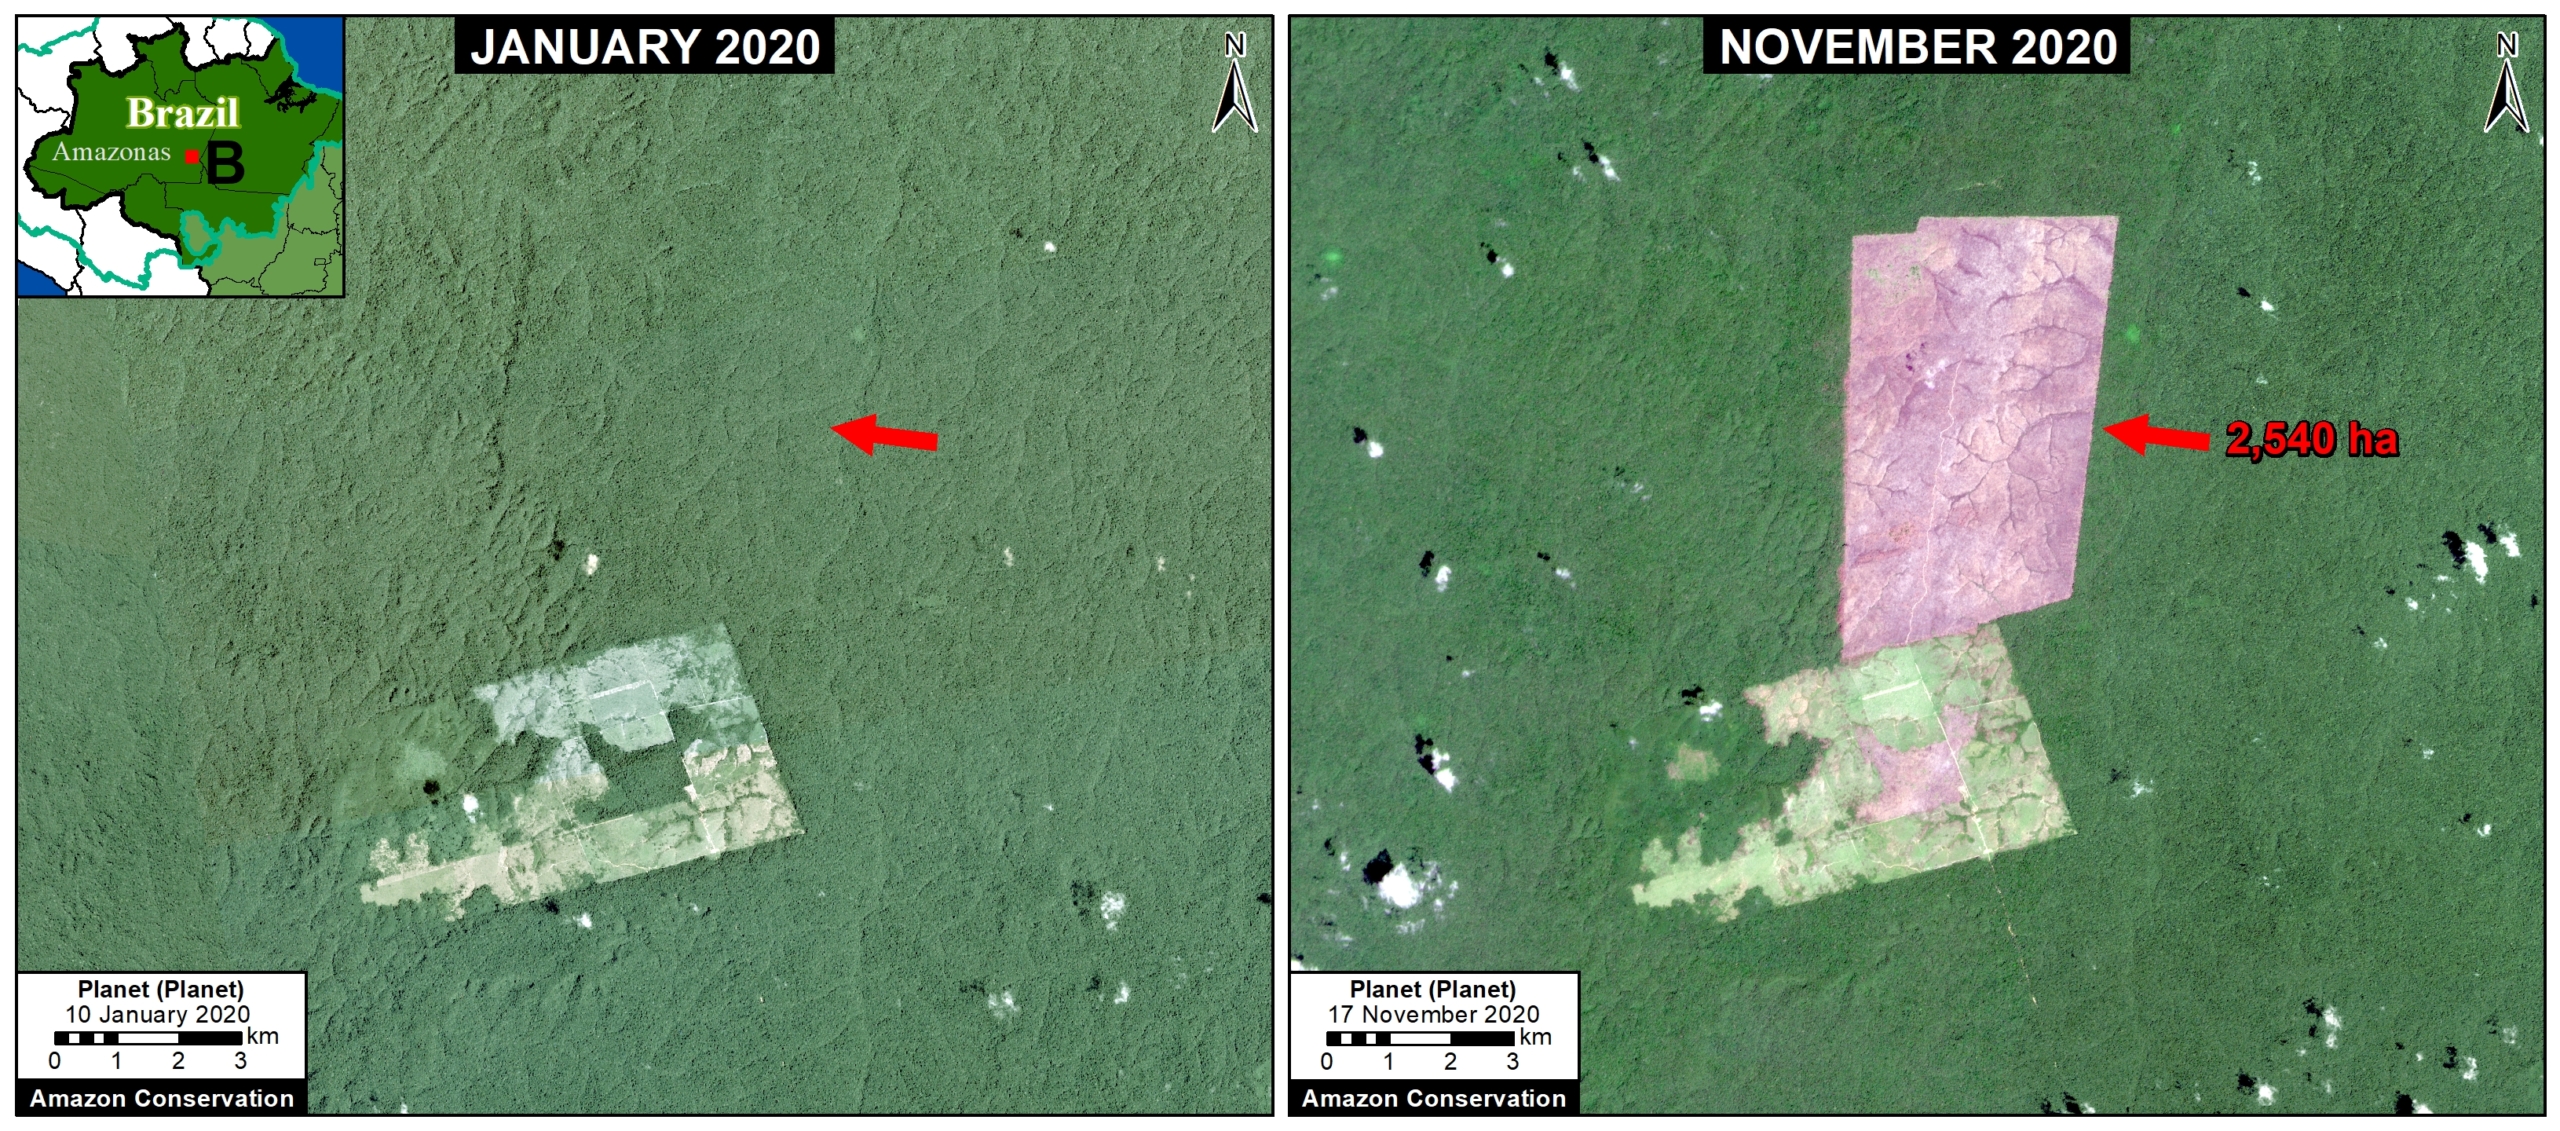
A common phenomenon observed in the satellite imagery through August was that rainforest areas were first deforested and then later burned, causing major fires due to the abundant recently-cut biomass (Image A). This was also the pattern observed in the high-profile 2019 Amazon fire season. Much of the deforestation in these areas appears to associated with expanding cattle pasture areas.

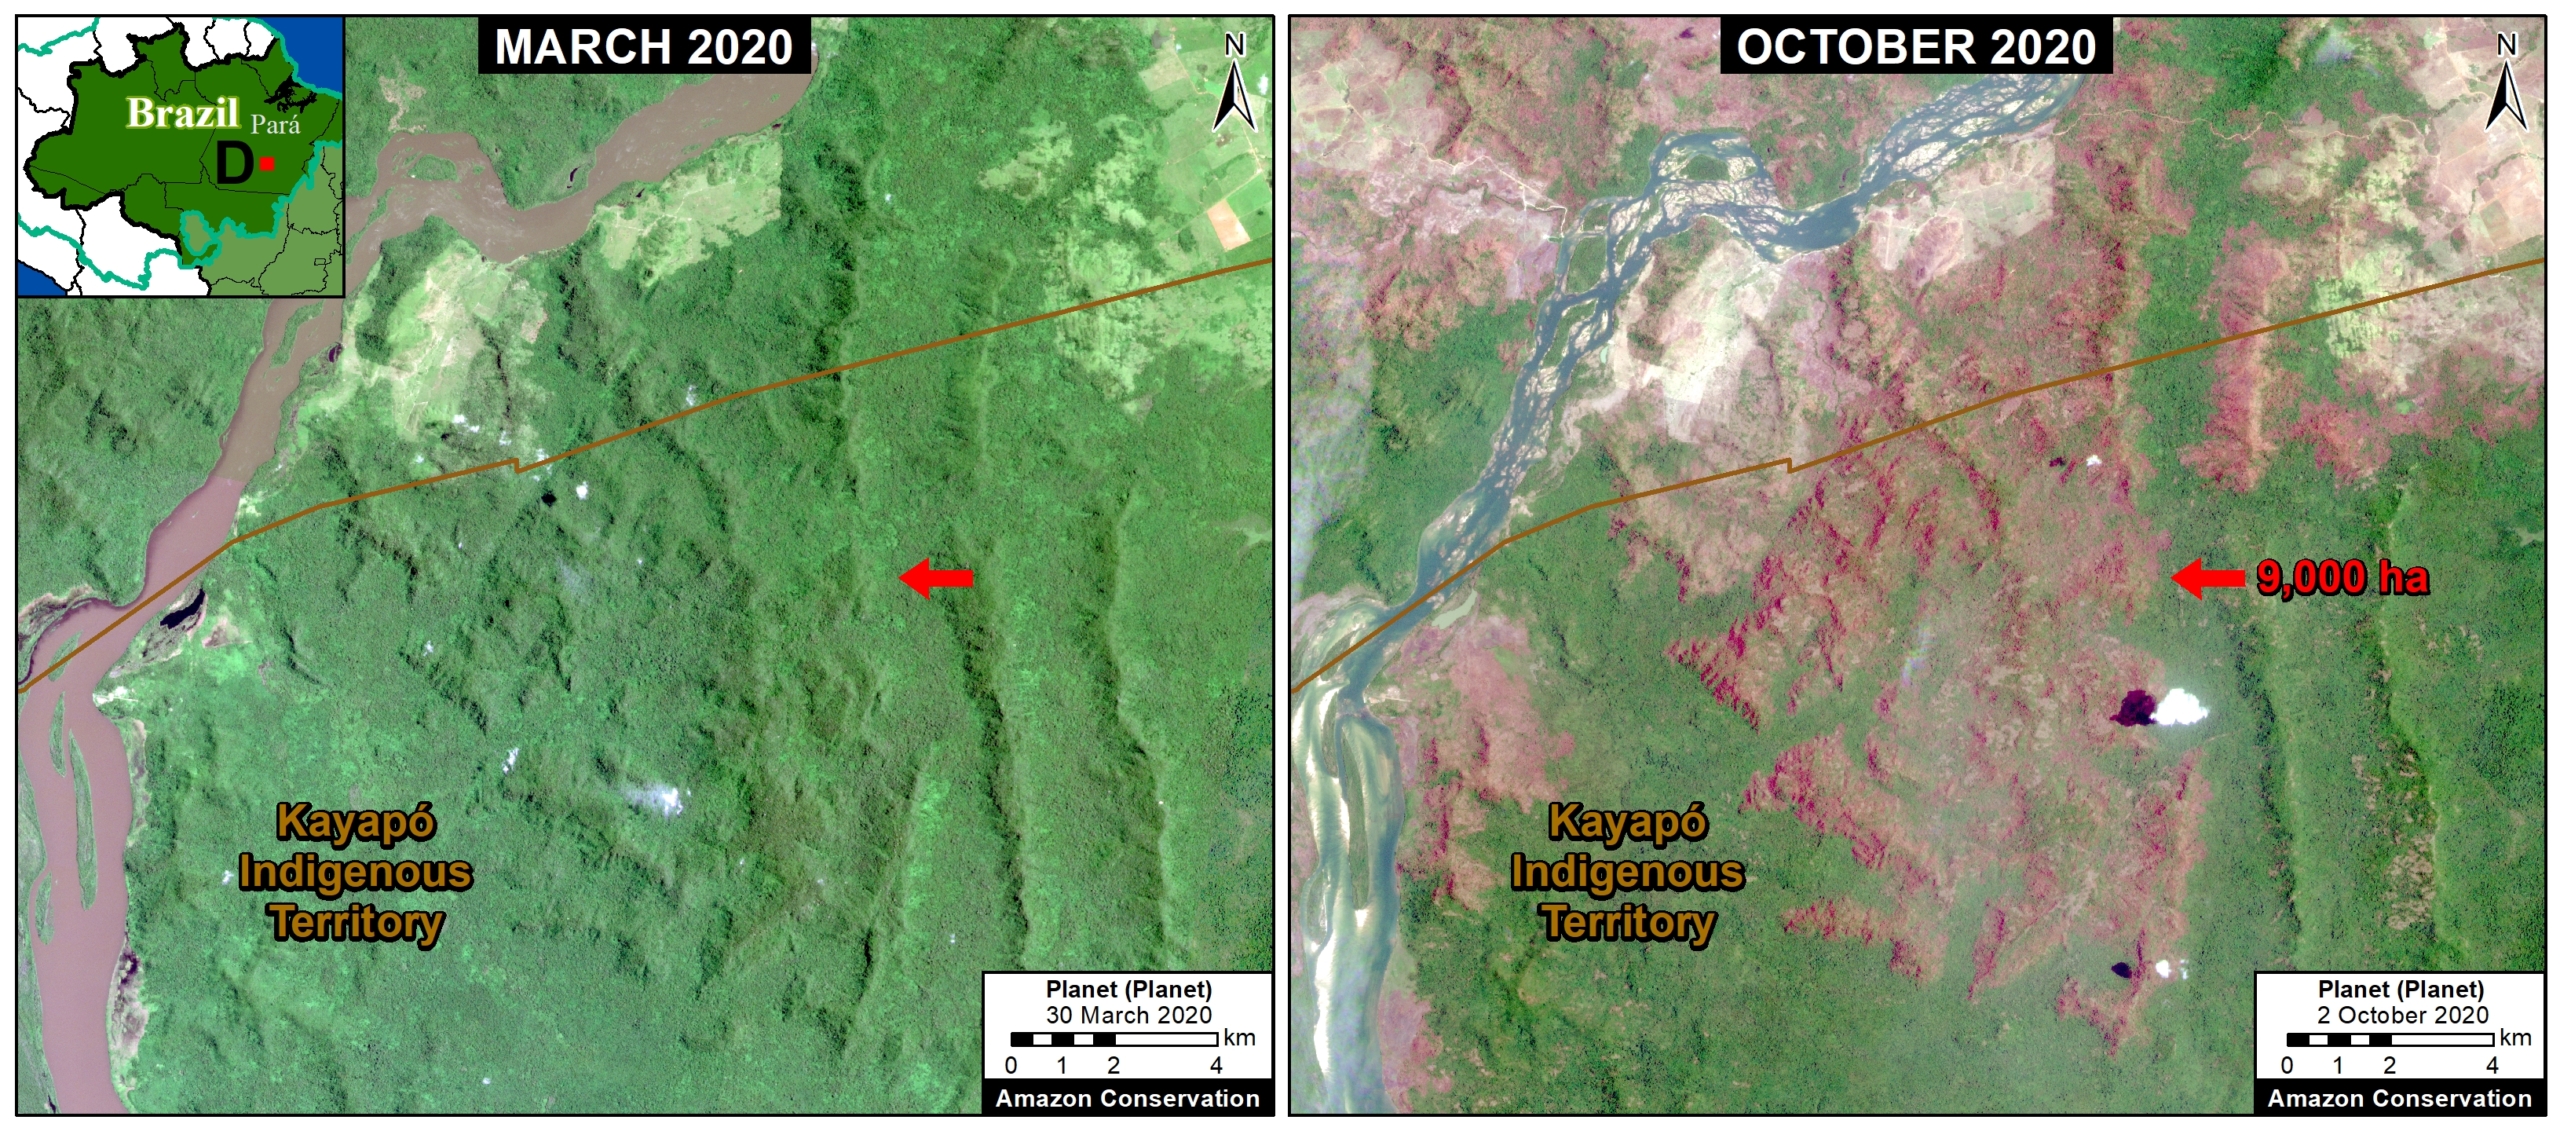
In September 2020 (and unlike 2019), there was a shift to actual Amazon forest fires (Image B). See MAAP #129 for more information on the link between deforestation and fire in 2020.

Note that the three highest years (2016, 2017, and 2020) had one major thing in common: uncontrolled forest fires in the Brazilian Amazon.

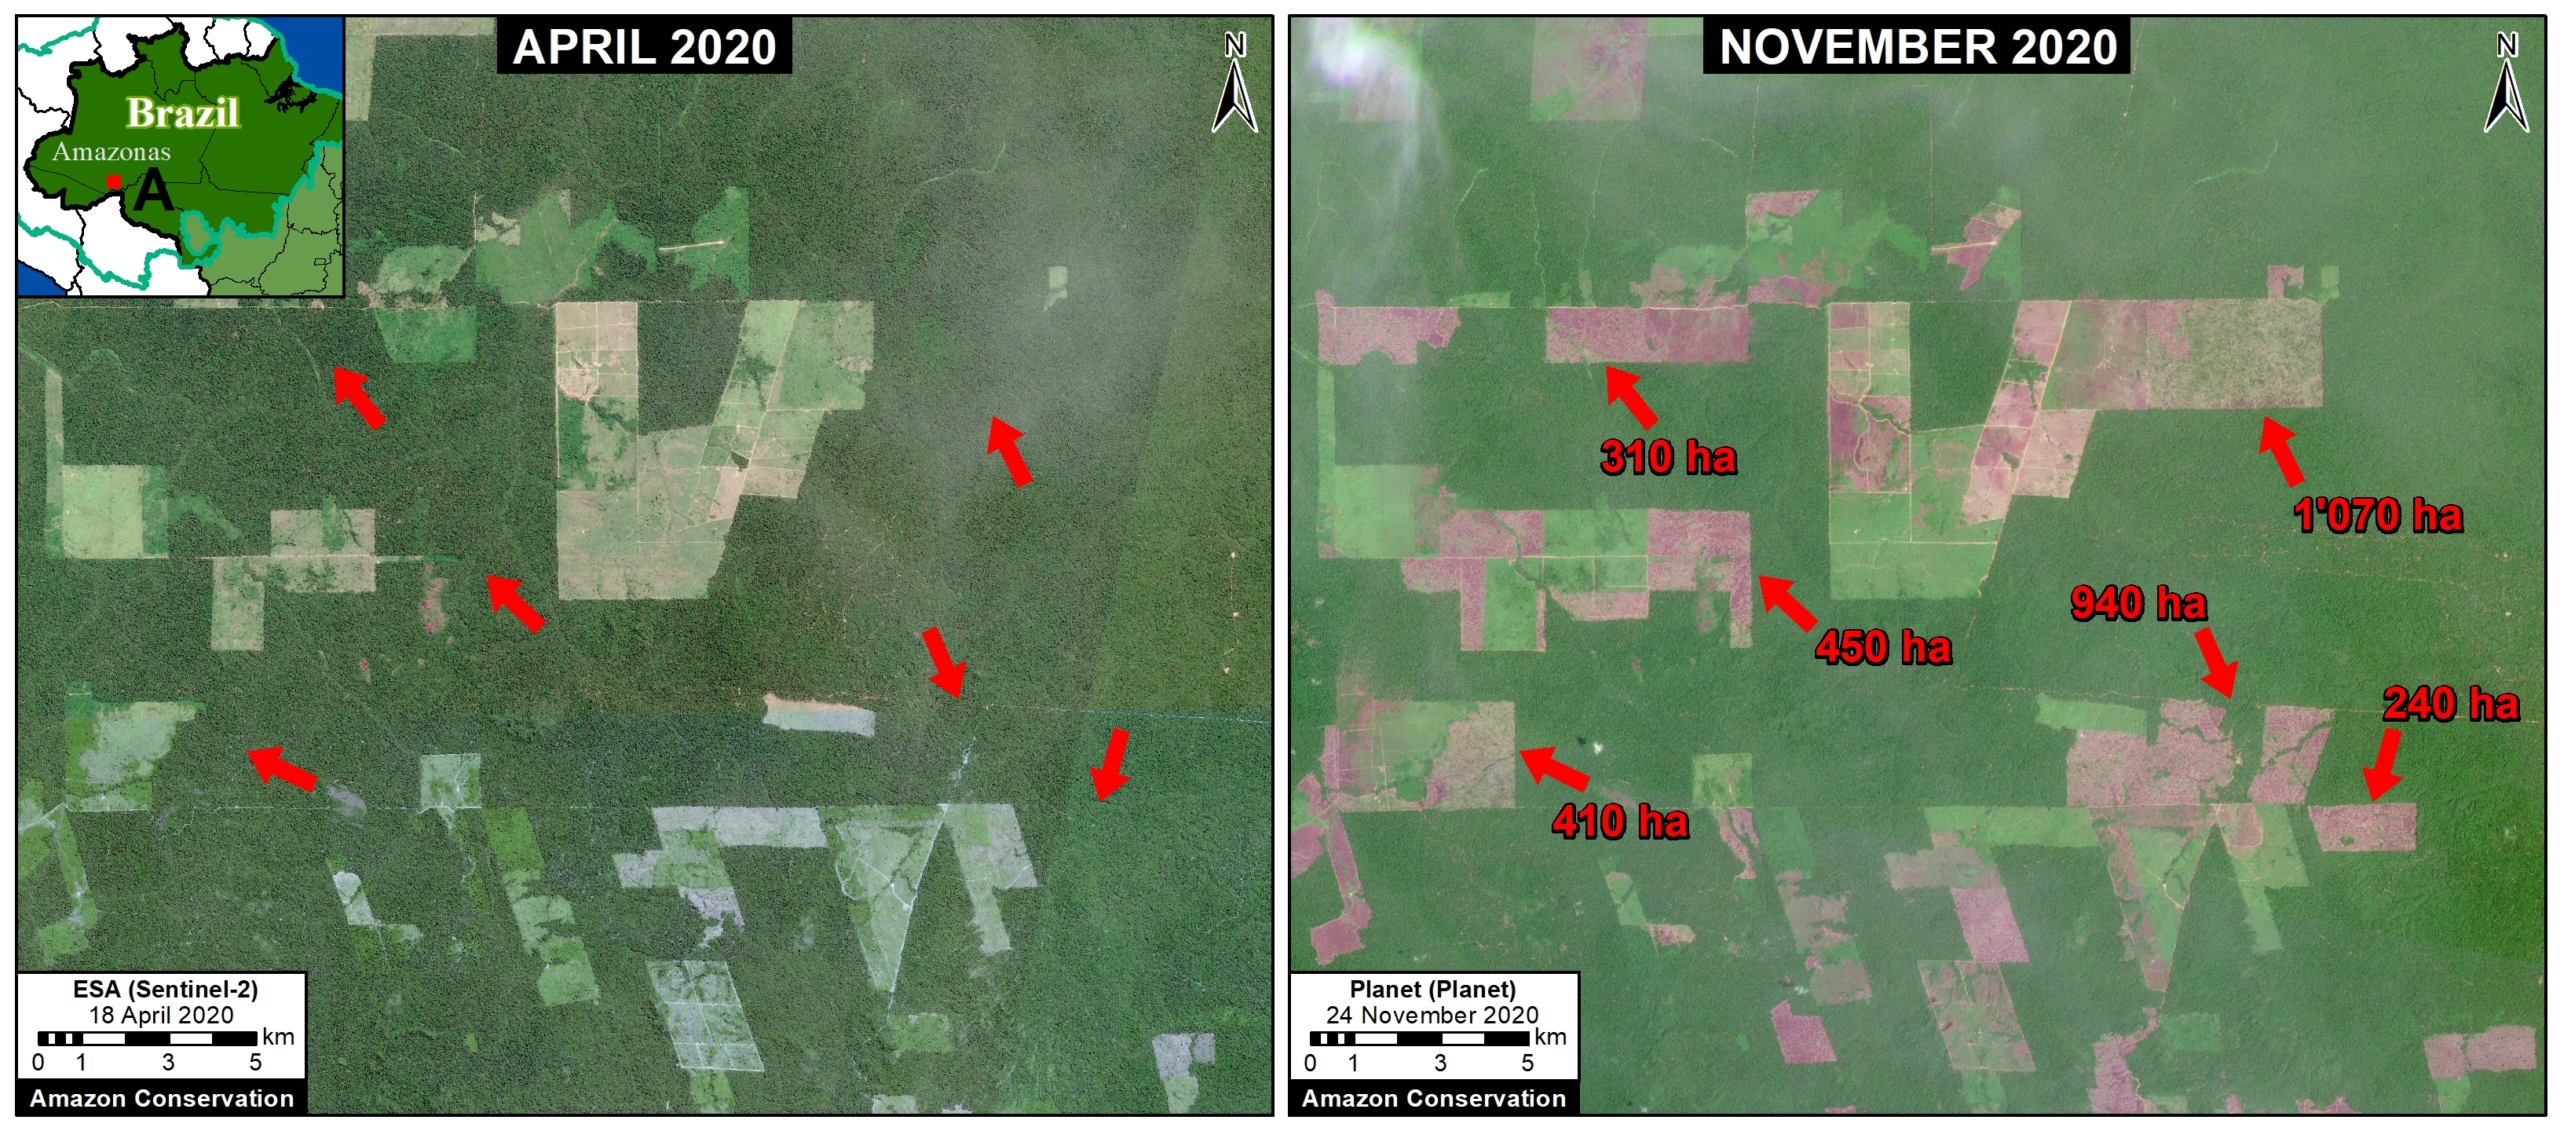
Image A. Deforestation in Brazilian Amazon (Amazonas state) of 2,540 hectares between January (left panel) and November (right panel) 2020. Data: Planet.

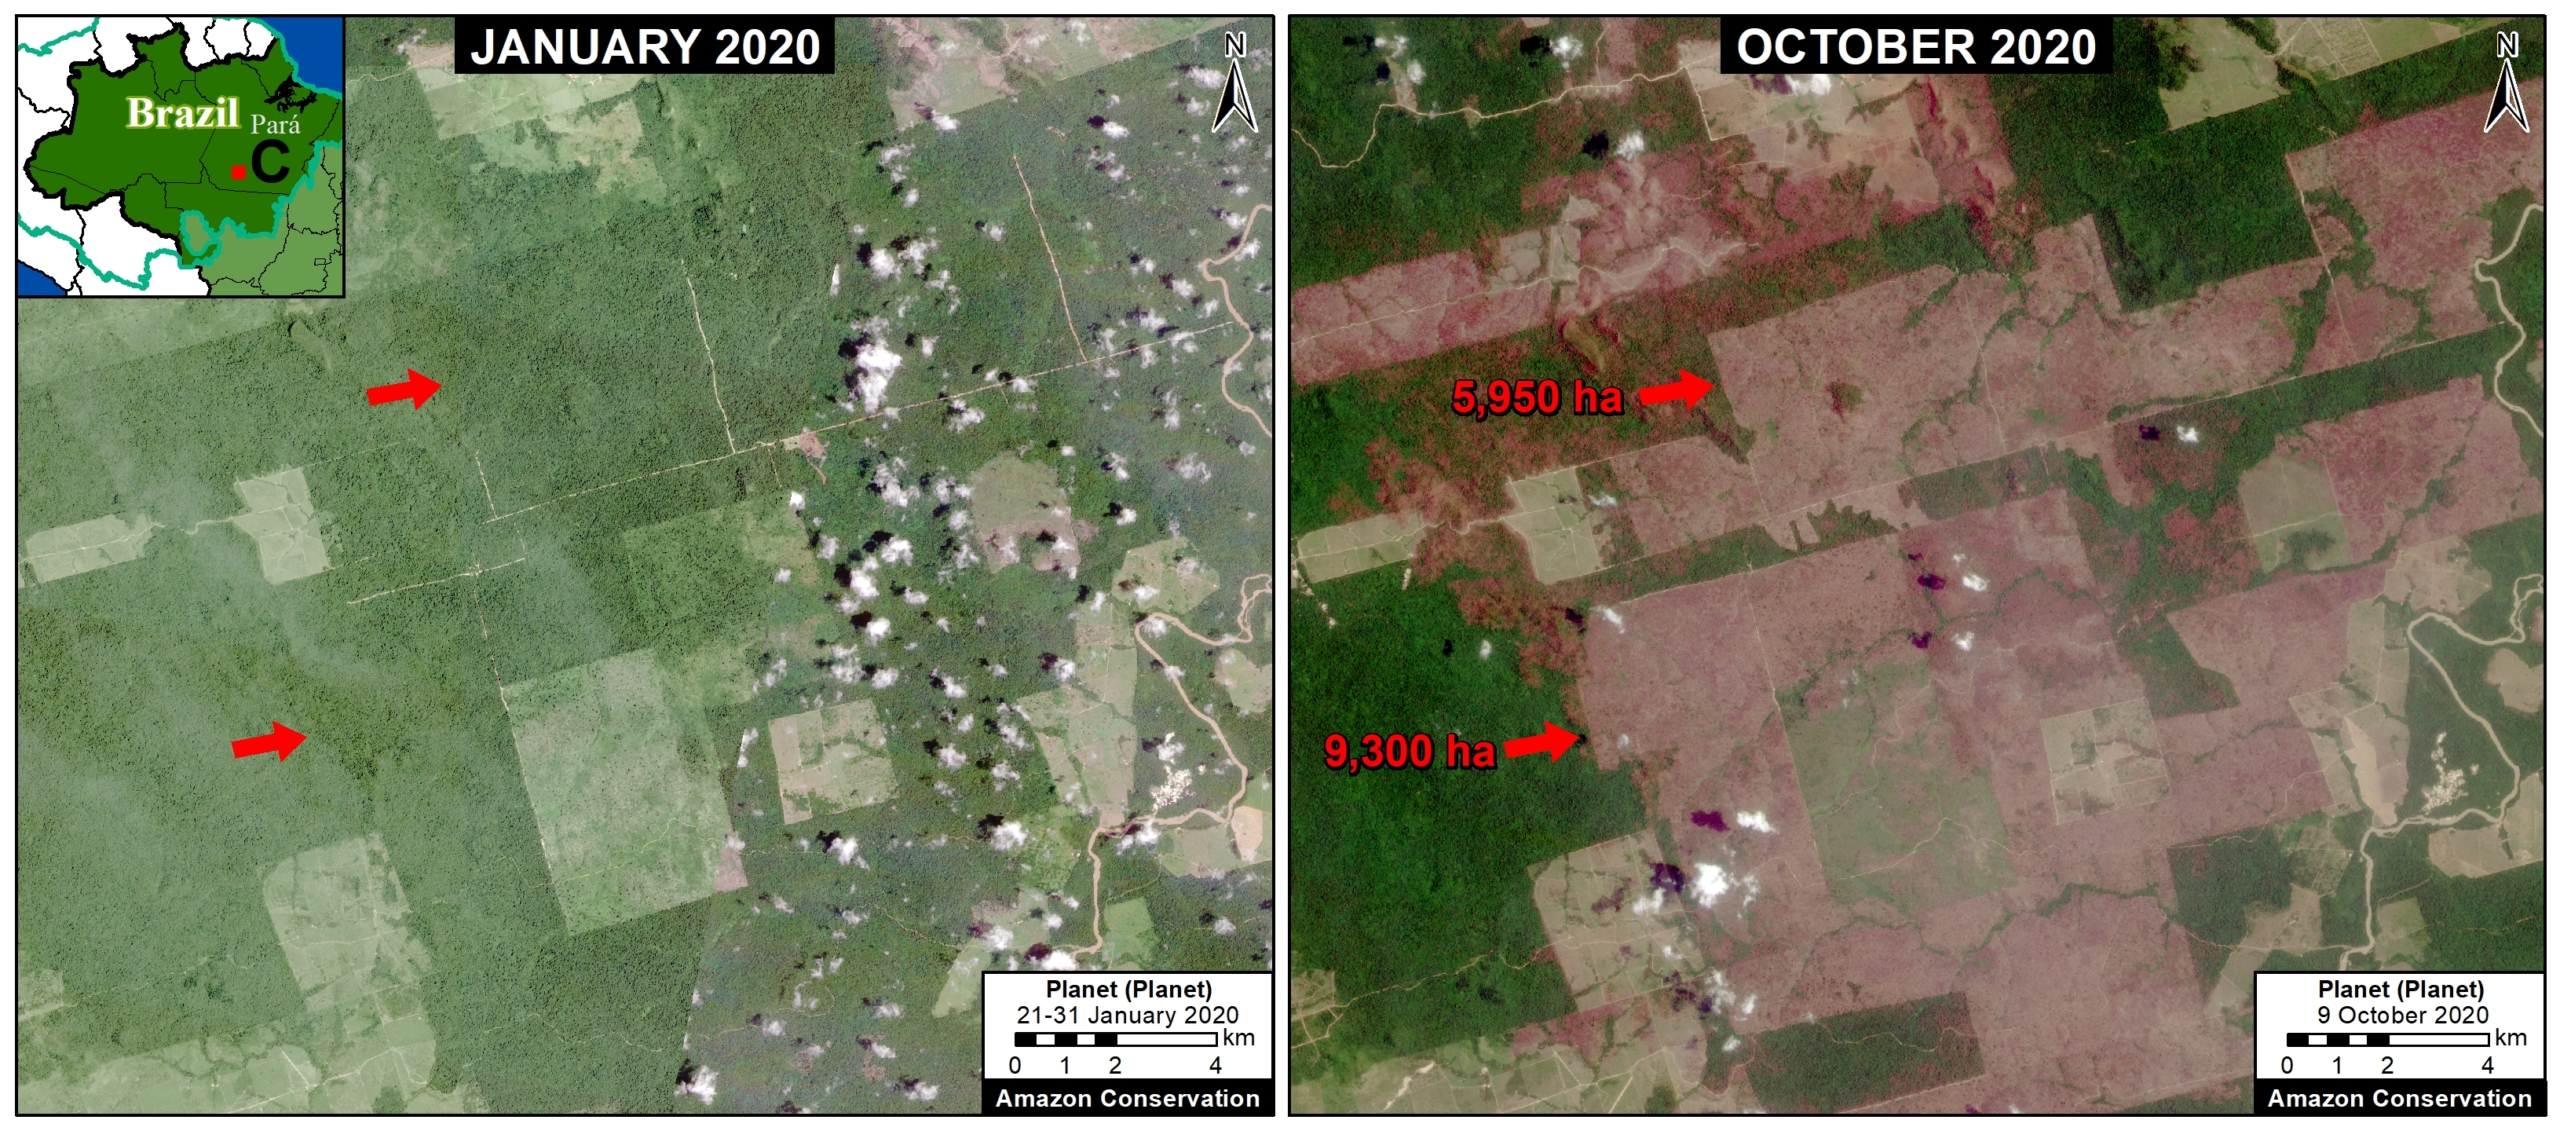
Image B. Forest fire in Brazilian Amazon (Para state) that burned 9,000 hectares between March (left panel) and October (right panel) 2020. Data: Planet.

Bolivian Amazon

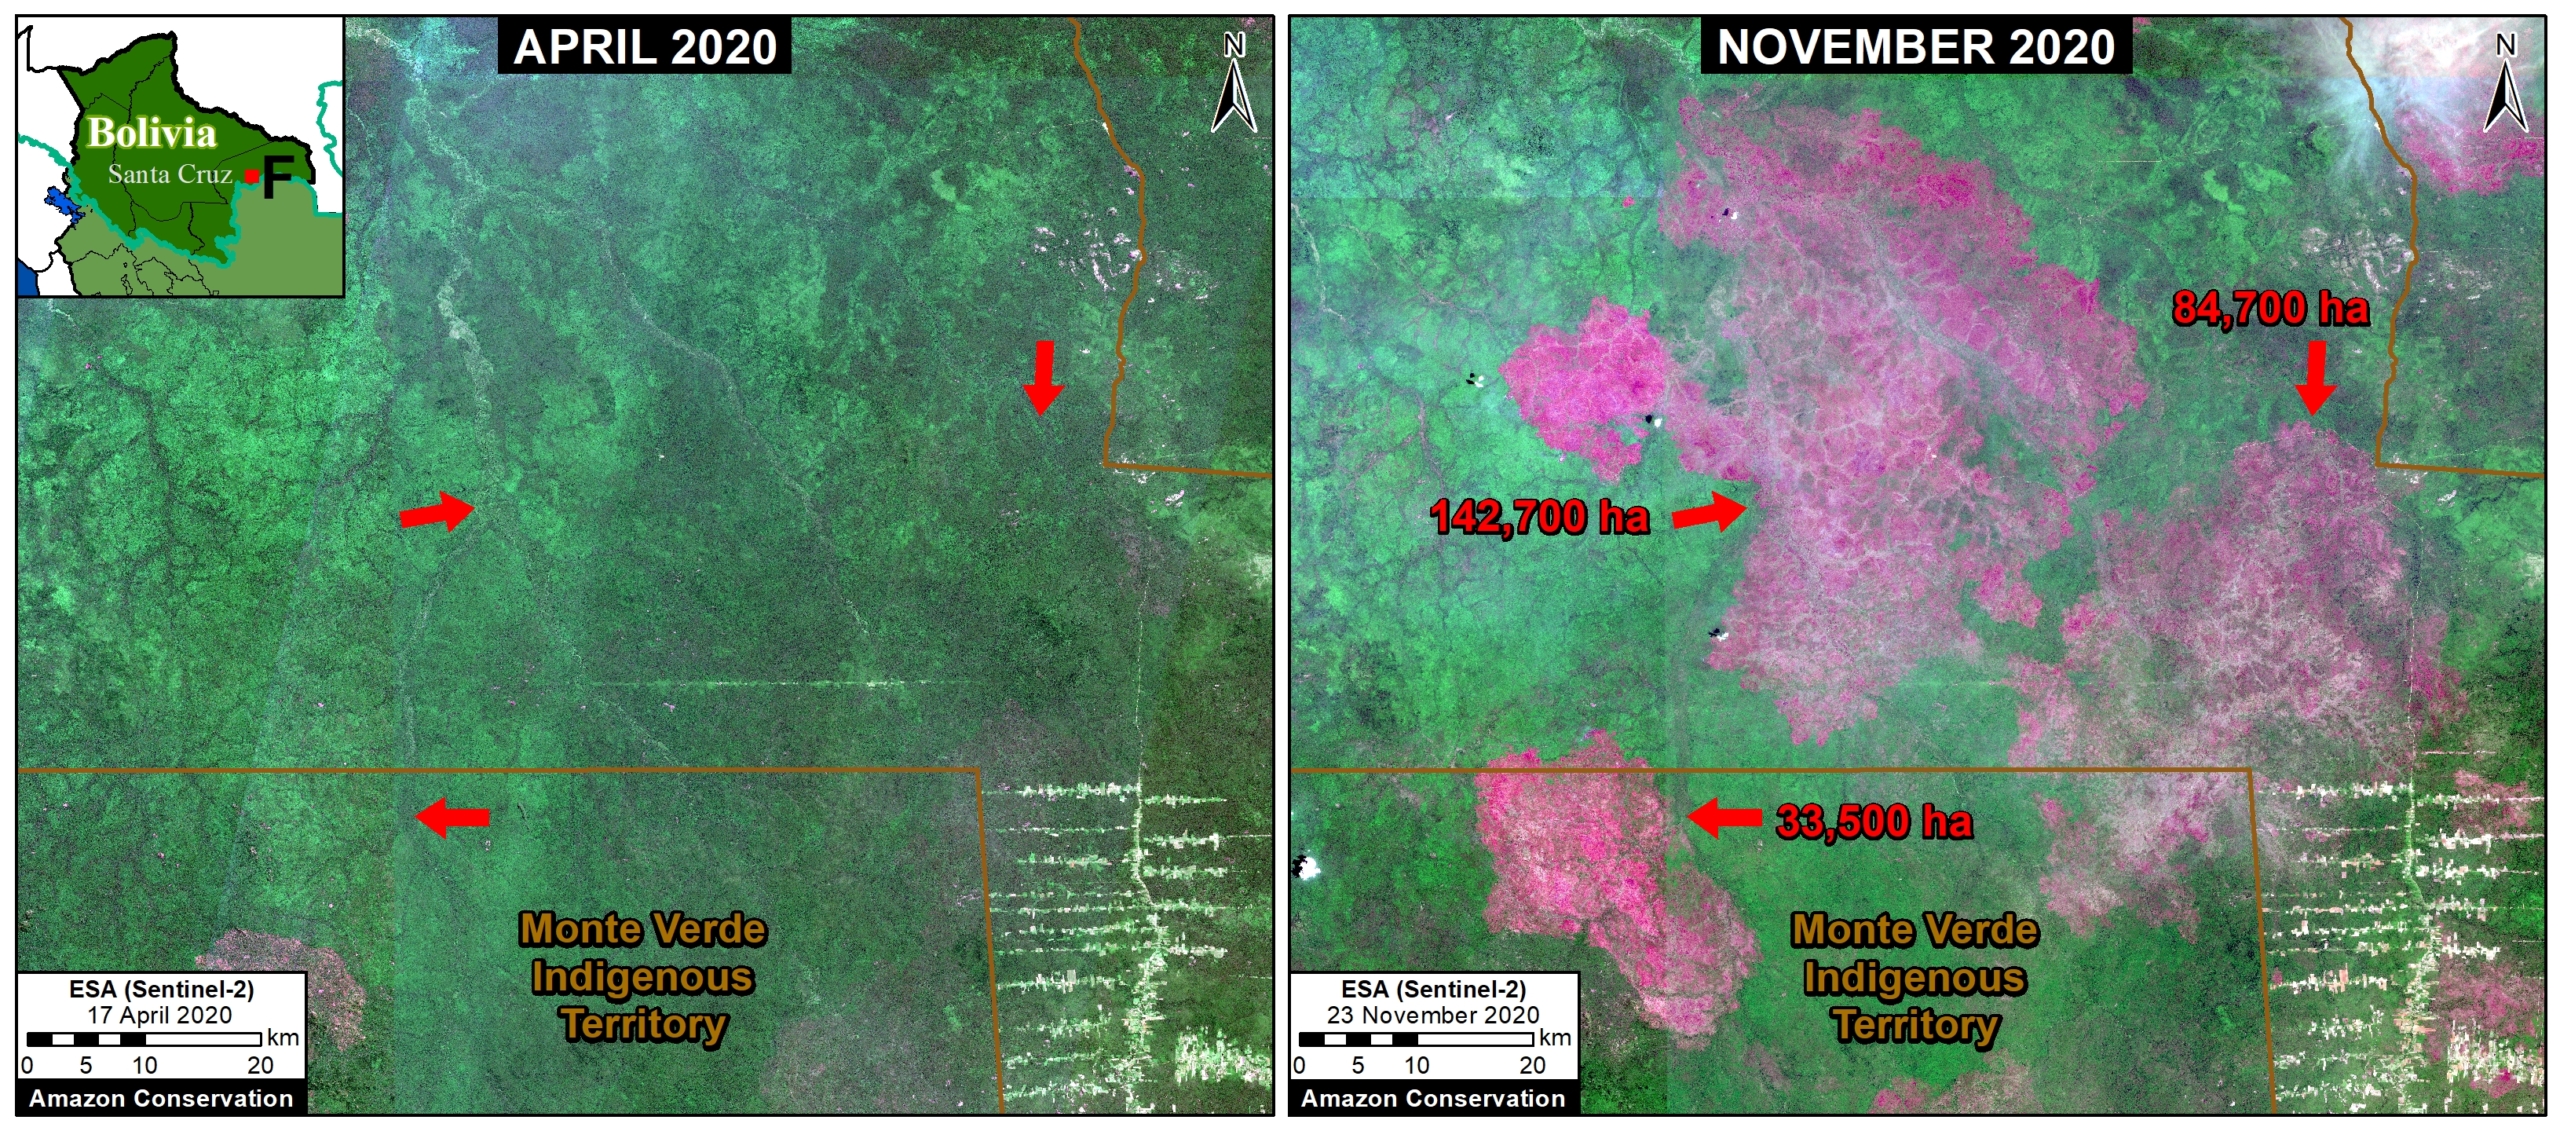
2020 had the highest primary forest loss on record in the Bolivian Amazon, surpassing 240,000 hectares.

Indeed, the most intense hotspots across the entire Amazon ocurred in southeast Bolivia, where fires raged through the drier Amazon forests (known as the Chiquitano and Chaco ecosystems).

Image C shows the burning of a massive area (over 260,000 hectares) in the Chiquitano dry forests (Santa Cruz department).


Image C. Forest fire in Bolivian Amazon (Santa Cruz) that burned over 260,000 hectares between April (left panel) and November (right panel) 2020. Data: ESA.

Peruvian Amazon

2020 also had the highest primary forest loss on record in the Peruvian Amazon, surpassing 190,000 hectares.

This deforestation is concentrated in the central region. On the positive, the illegal gold mining that plagued the southern region has decreased thanks to effective government action (see MAAP #130).

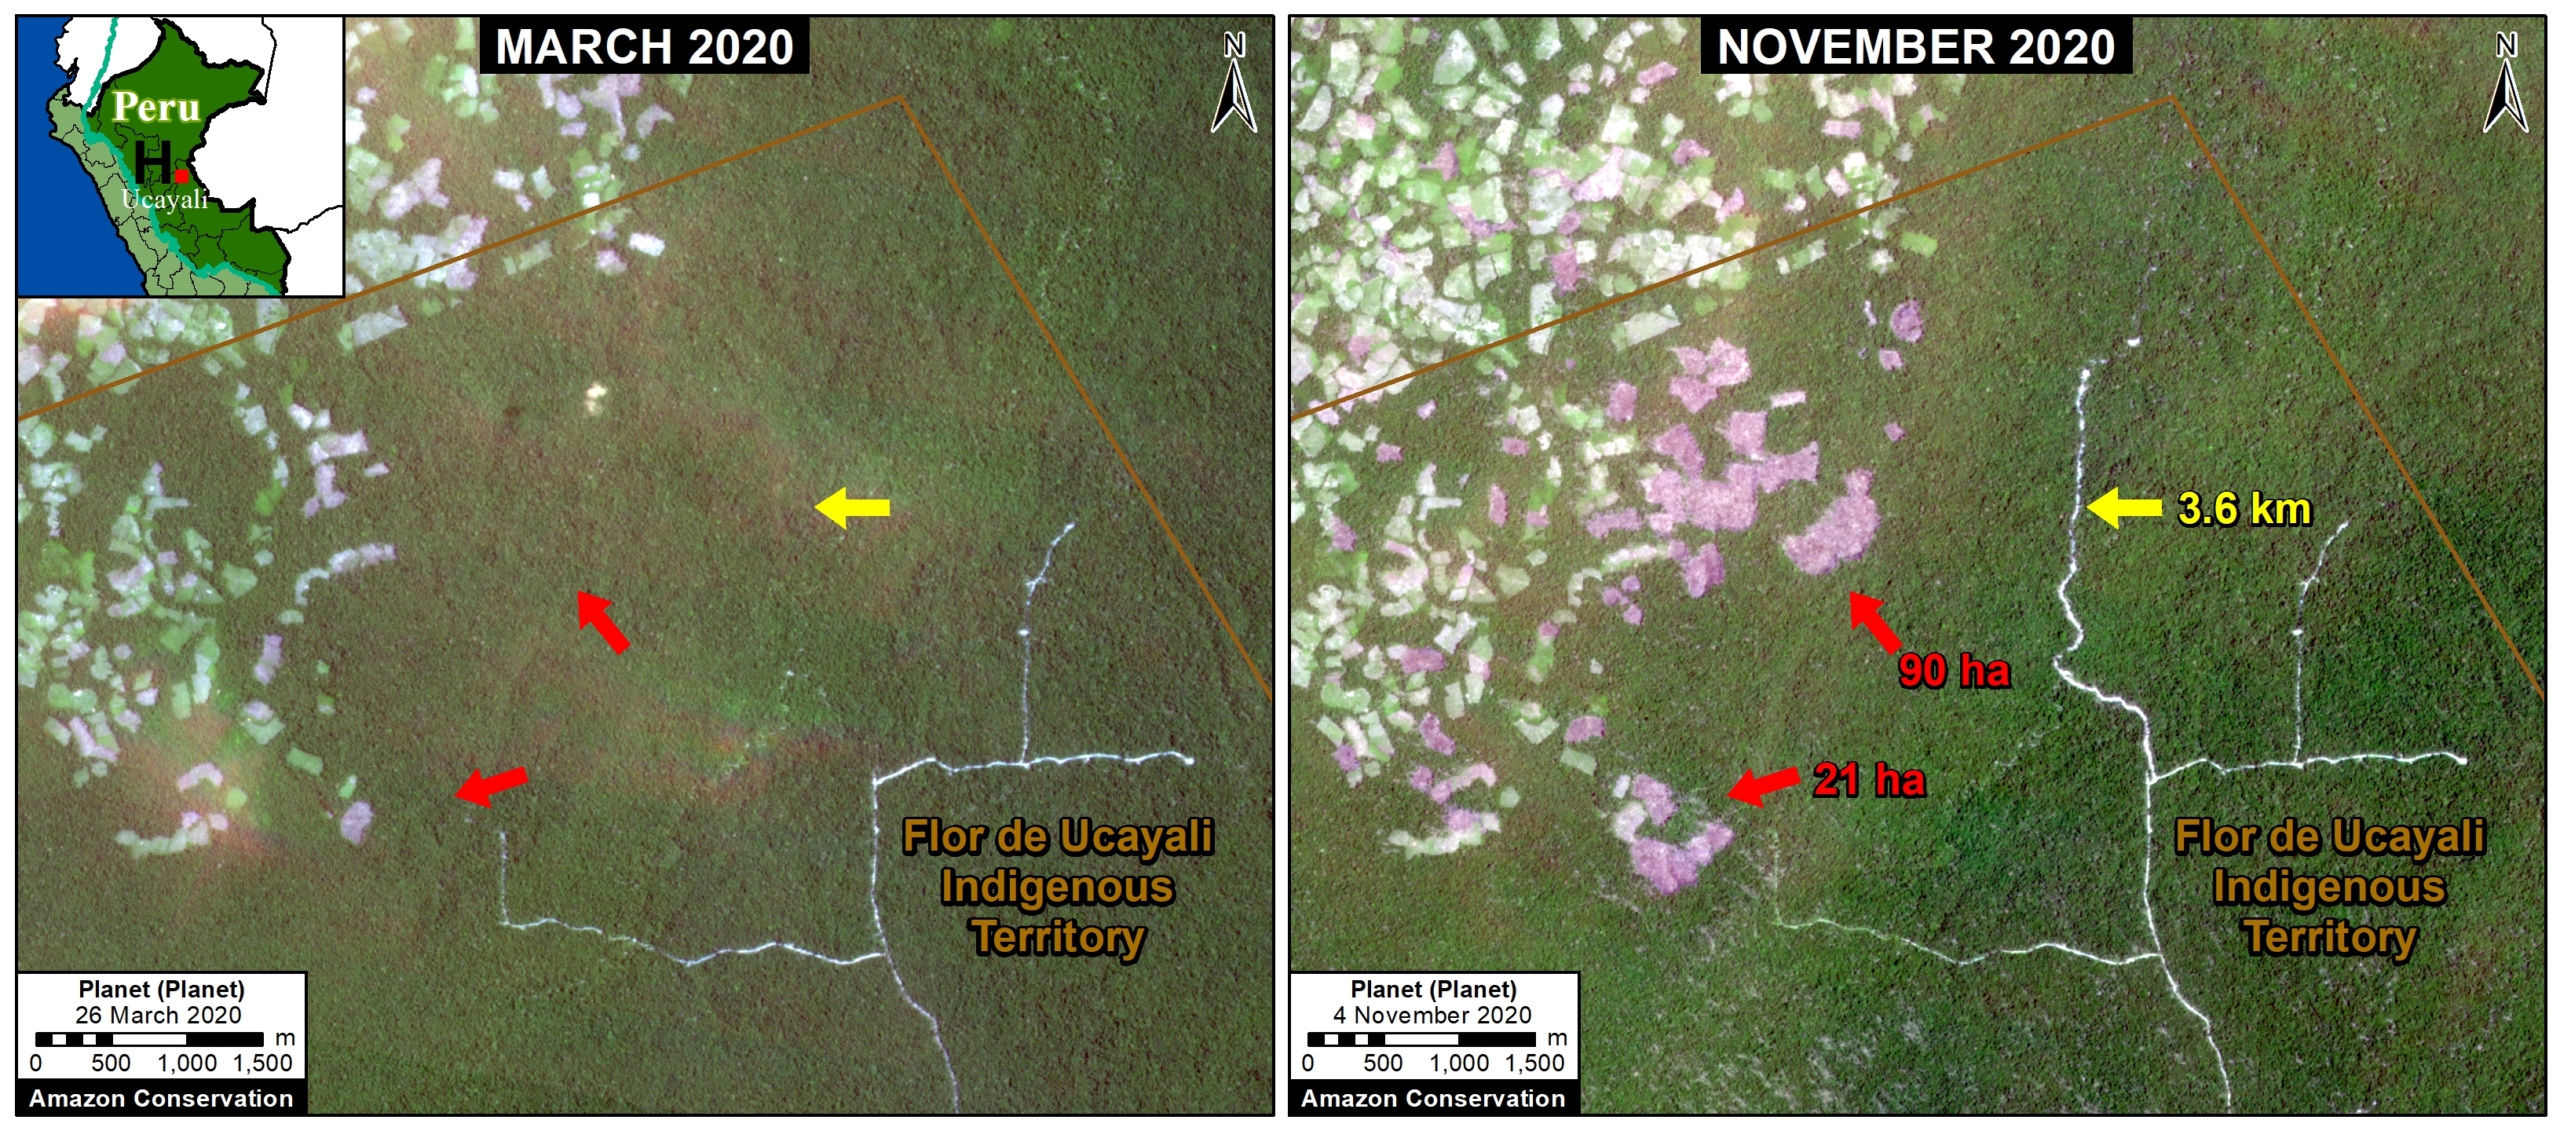
Image D shows expanding deforestation (over 110 hectares), and logging road construction (3.6 km), in an indigenous territory south of Sierra del Divisor National Park in the central Peruvian Amazon (Ucayali region). The deforestation appears to be associated with an expanding small-scale agriculture or cattle pasture frontier.


Image D. Deforestation and logging road construction in Peruvian Amazon (Ucayali region) between March (left panel) and November (right panel) 2020. Data: Planet.

Colombian Amazon

2020 had the second-highest primary forest loss on record in the Colombian Amazon, nearly 140,000 hectares.

As described in previous reports (see MAAP #120), there is an “arc of deforestation” concentrated in the northwest Colombian Amazon. This arc impacts numerous protected areas (including national parks) and Indigenous Reserves.

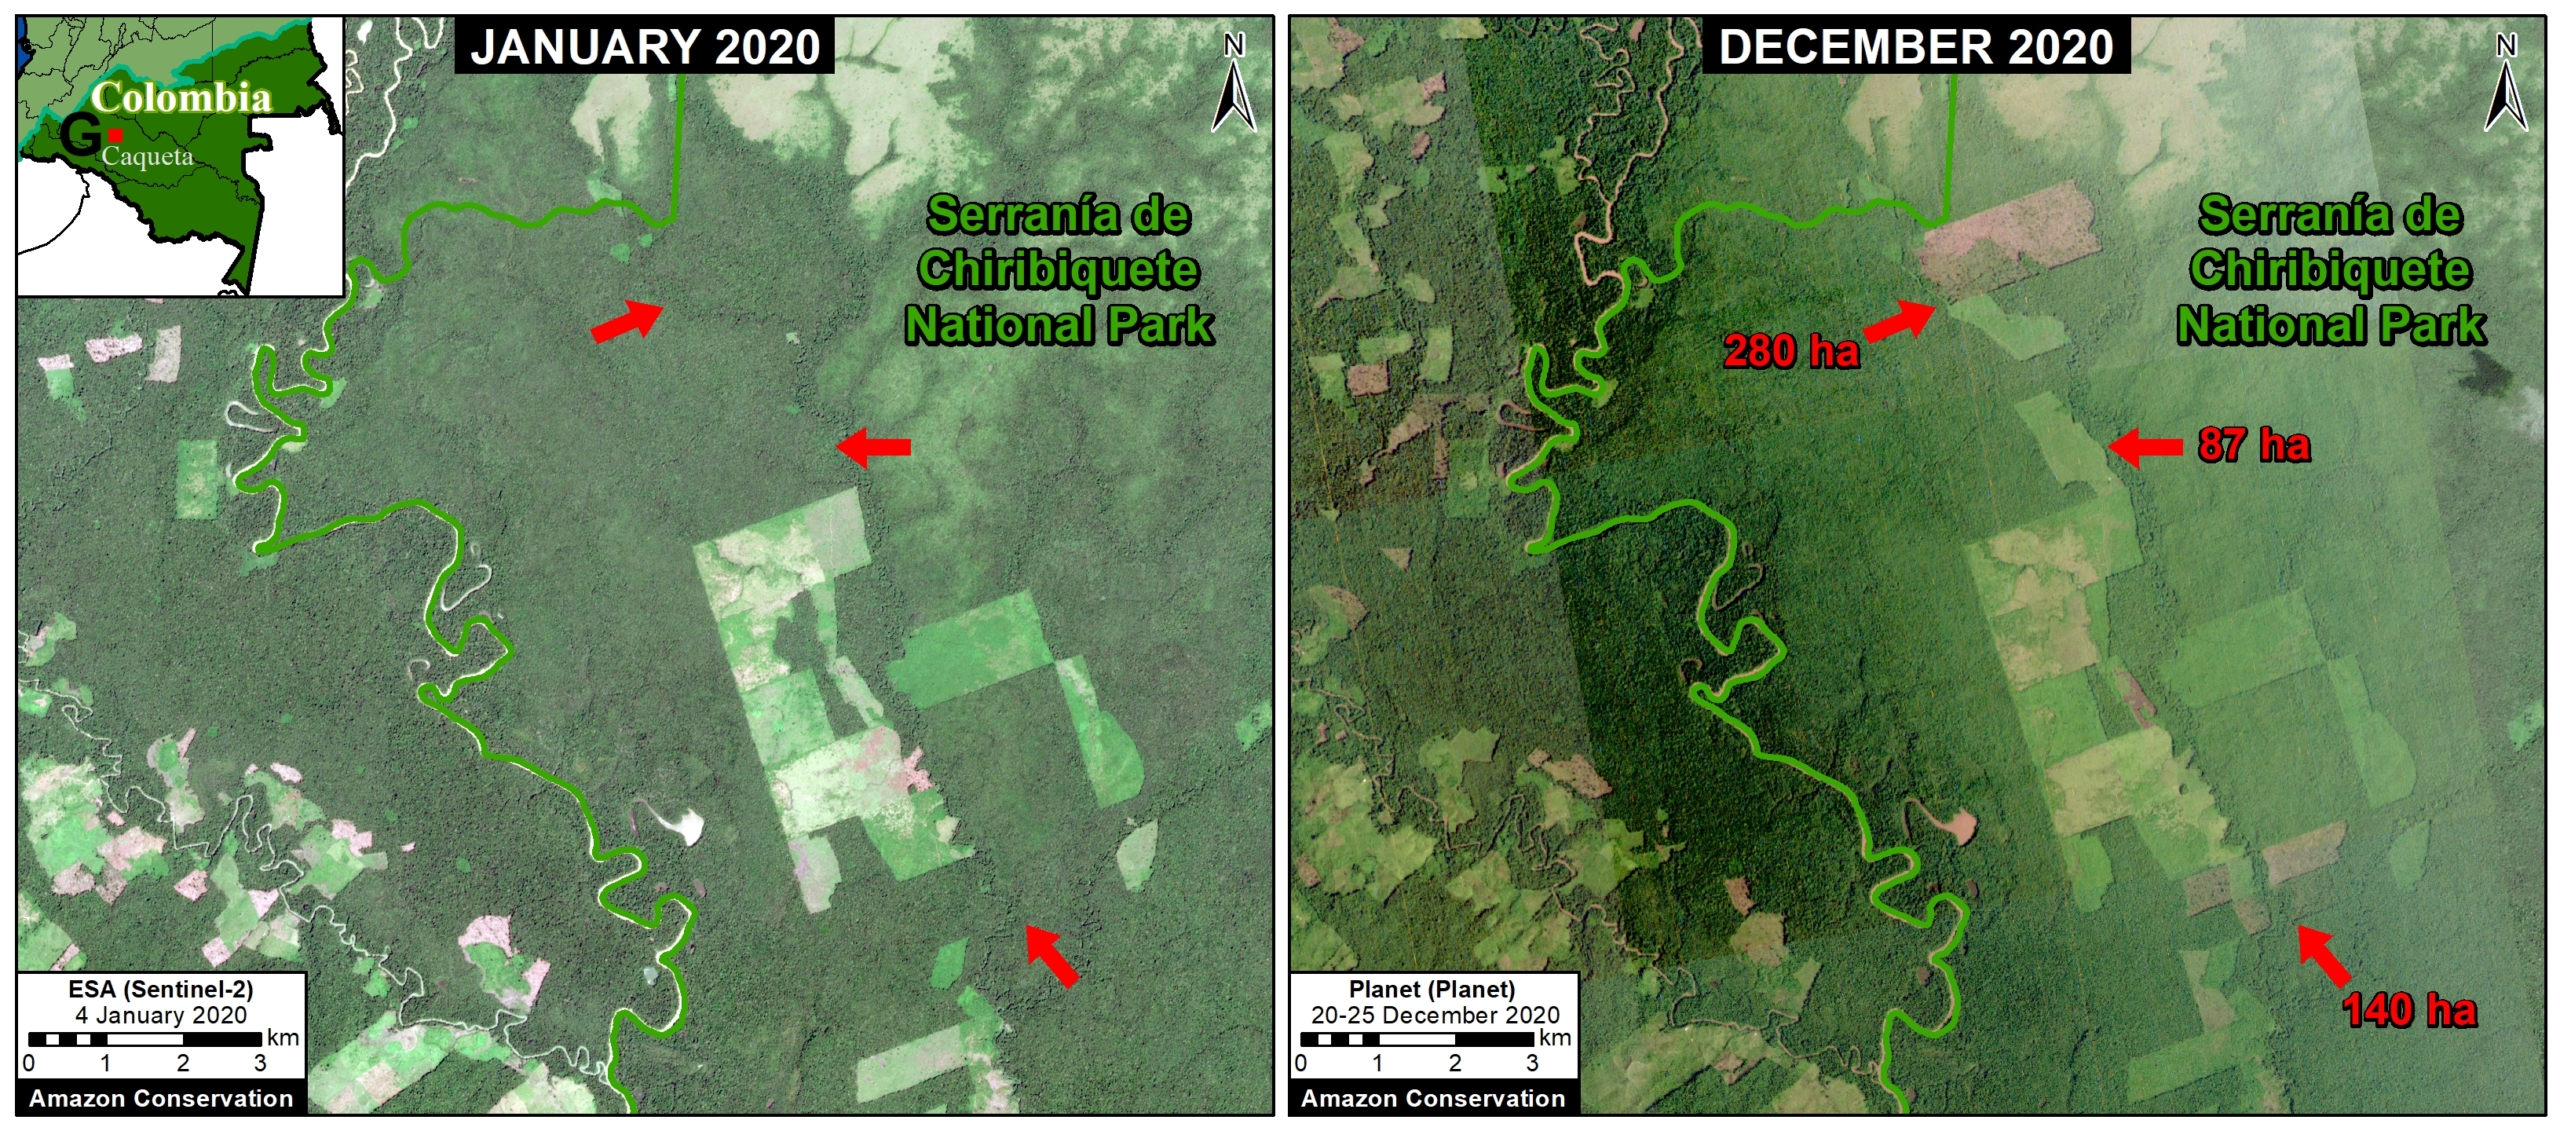
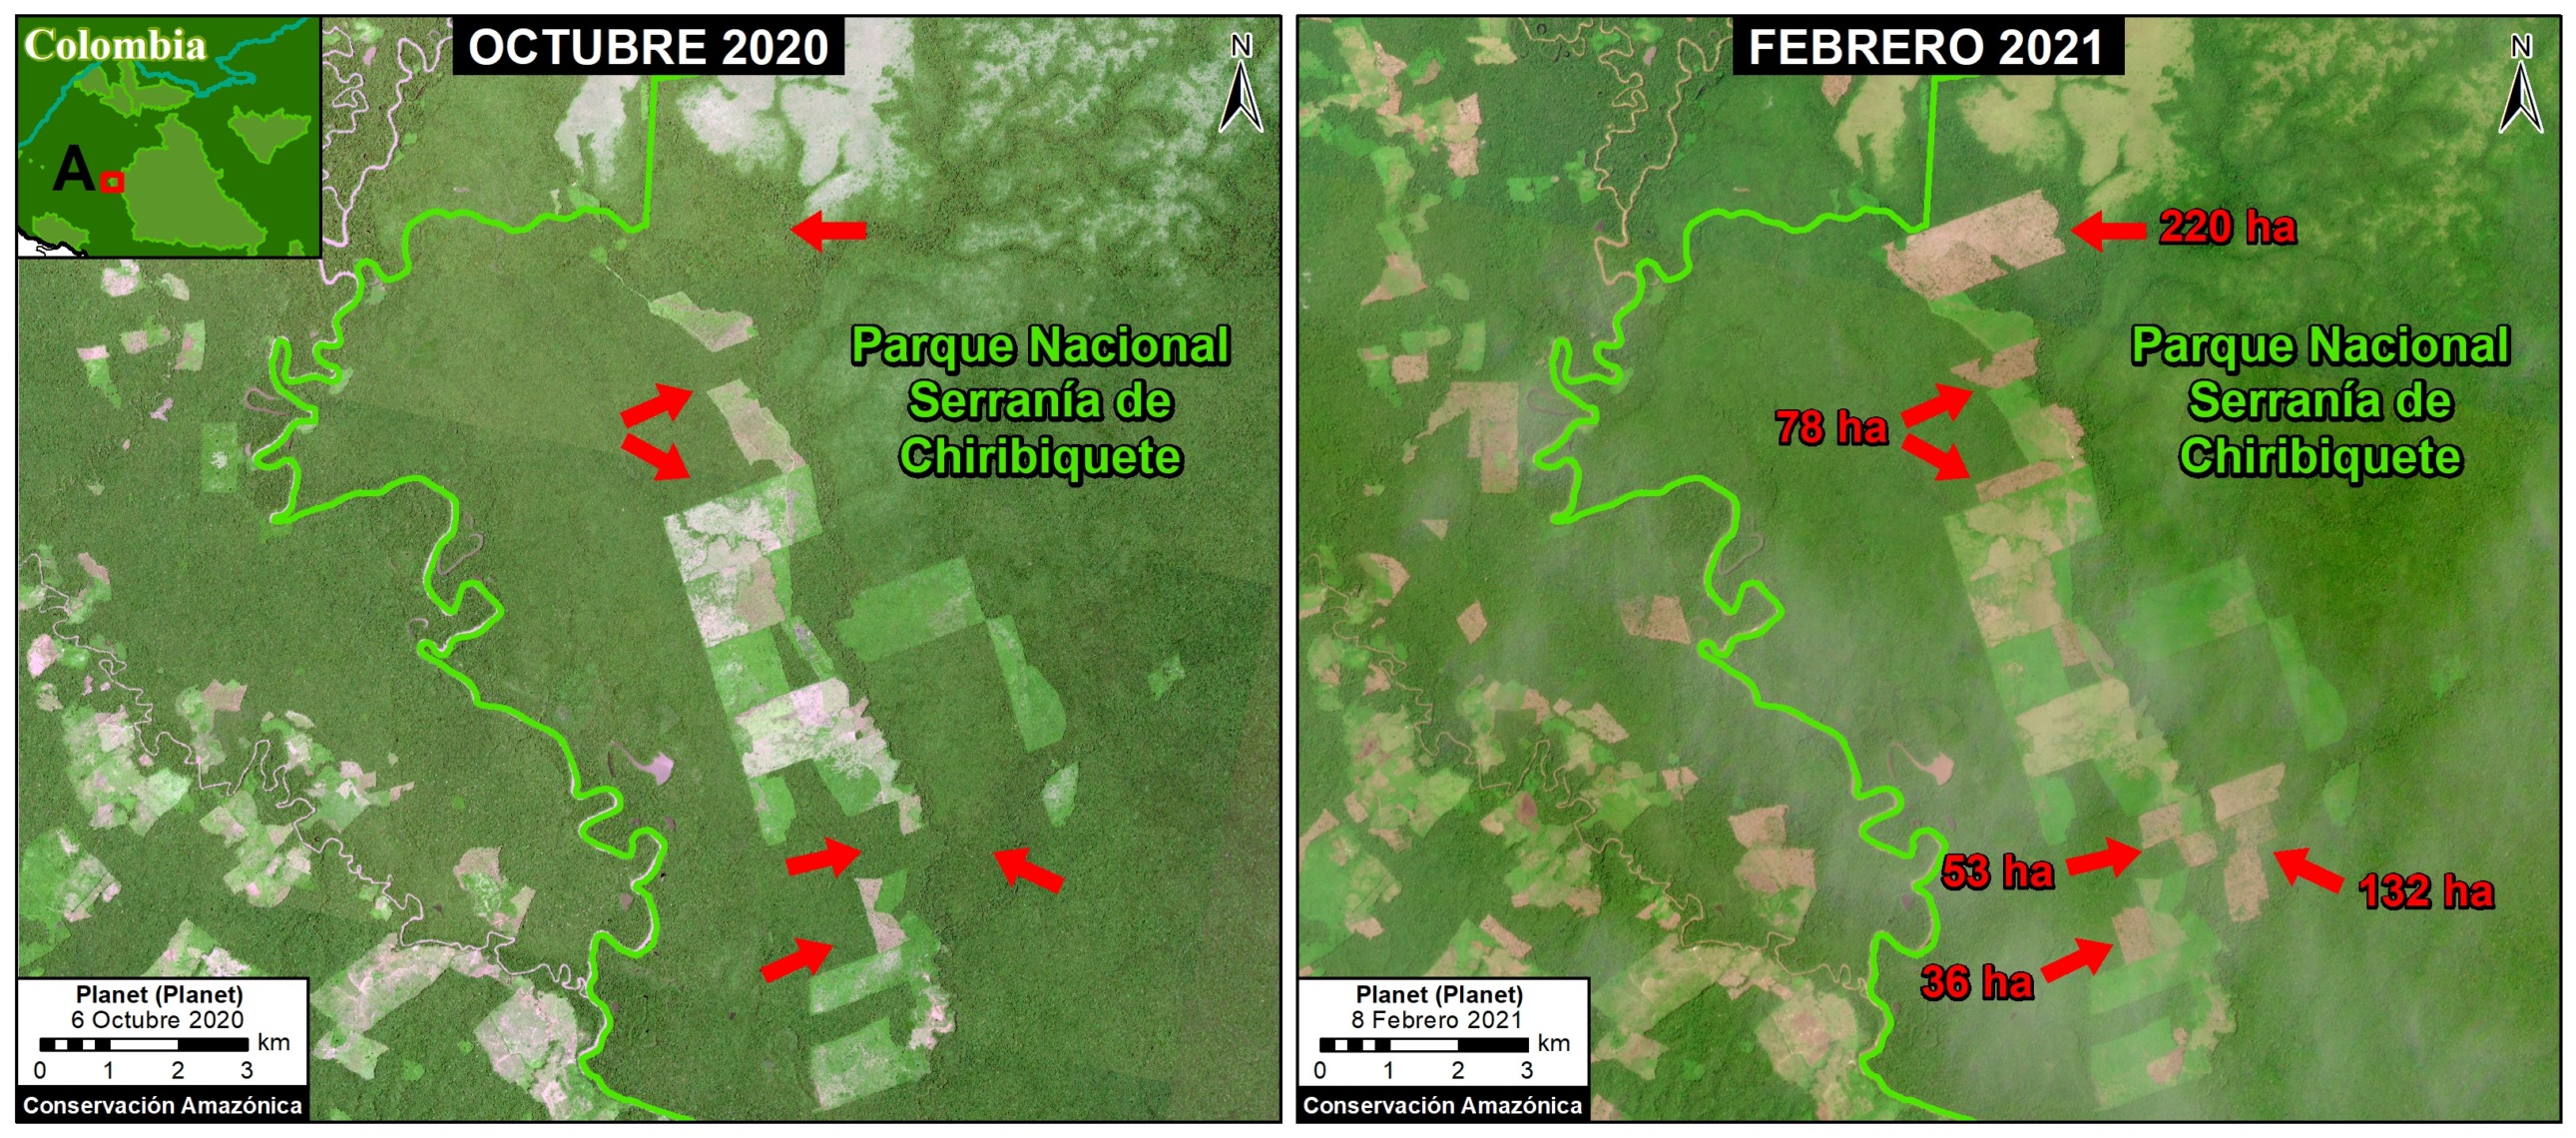
For example, Image E shows the recent deforestation of over 500 hectares in Chiribiquete National Park. Similar deforestation in that sector of the park appears to be conversion to cattle pasture.


Image E. Deforestation in Colombian Amazon of over 500 hectares in Chiribiqete National Park between January (left panel) and December (right panel) 2020. Data: ESA, Planet.

*Notes and Methodology

To download the report, click “Print” instead of “Download PDF” at the top of the page.

The analysis was based on 30-meter resolution annual data produced by the University of Maryland (Hansen et al 2013), obtained from the “Global Forest Change 2000–2020” data download page. It is also possible to visualize and interact with the data on the main Global Forest Change portal.

Importantly, this data detects and classifies burned areas as forest loss. Nearly all Amazon fires are human-caused. Also, this data does include some forest loss caused by natural forces (landslides, wind storms, etc…).

Note that when comparing 2020 to early years, there are several methodological differences from the University of Maryland introduced to data after 2011. For more details, see “User Notes for Version 1.8 Update.”

It is worth noting that we found the early warning (GLAD) alerts to be a good (and often conservative) indicator of the final annual data.

Our geographic range includes nine countries and consists of a combintion of the Amazon watershed limit (most notably in Bolivia) and Amazon biogeographic limit (most notably in Colombia) as defined by RAISG. See Base Map above for delineation of this hybrid Amazon limit, designed for maximum inclusion. Inclusion of the watershed limit in Bolivia is a recent change incorporated to better include impact to the Amazon dry forests of the Chaco.

We applied a filter to calculate only primary forest loss. For our estimate of primary forest loss, we intersected the forest cover loss data with the additional dataset “primary humid tropical forests” as of 2001 (Turubanova et al 2018). For more details on this part of the methodology, see the Technical Blog from Global Forest Watch (Goldman and Weisse 2019).

To identify the deforestation hotspots, we conducted a kernel density estimate. This type of analysis calculates the magnitude per unit area of a particular phenomenon, in this case forest cover loss. We conducted this analysis using the Kernel Density tool from Spatial Analyst Tool Box of ArcGIS. We used the following parameters:

Search Radius: 15000 layer units (meters)
Kernel Density Function: Quartic kernel function
Cell Size in the map: 200 x 200 meters (4 hectares)
Everything else was left to the default setting.

For the Base Map, we used the following concentration percentages: Medium: 7-10%; High: 11-20%; Very High: >20%.


Hansen, M. C., P. V. Potapov, R. Moore, M. Hancher, S. A. Turubanova, A. Tyukavina, D. Thau, S. V. Stehman, S. J. Goetz, T. R. Loveland, A. Kommareddy, A. Egorov, L. Chini, C. O. Justice, and J. R. G. Townshend. 2013. “High-Resolution Global Maps of 21st-Century Forest Cover Change.” Science 342 (15 November): 850–53.

Acknowledgements

We thank E. Ortiz (AAF), M. Silman (WFU), M. Weisse (WRI/GFW) for their helpful comments on this report.

This work was supported by NORAD (Norwegian Agency for Development Cooperation) and ICFC (International Conservation Fund of Canada).

Citation

Finer M, Mamani N (2020) Amazon Deforestation Hotspots 2020 (Final). MAAP: 136.

MAAP #134: Agriculture and Deforestation in the Peruvian Amazon

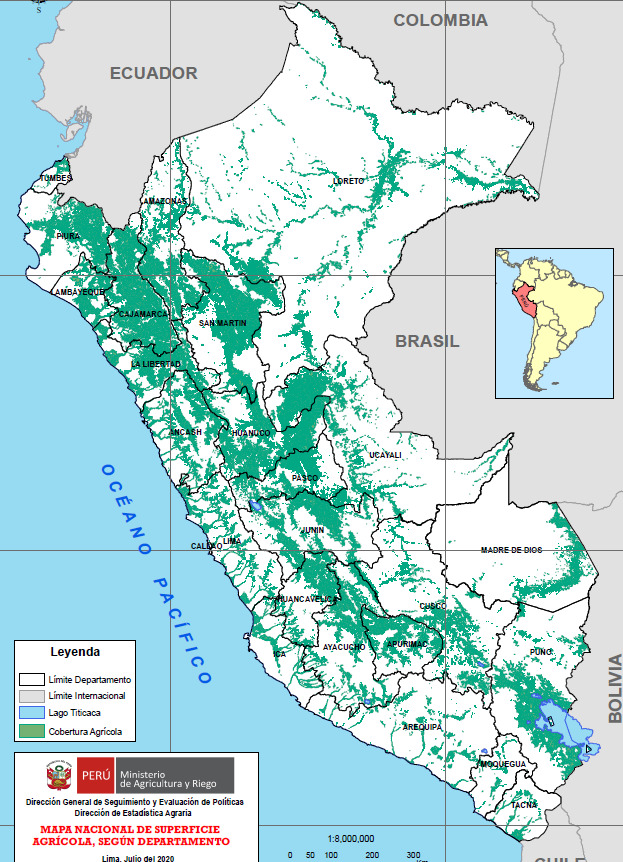
Peru’s first National Agricultural Area Map. Source: MIDAGRI.

For the first time, Peru has a detailed National Agricultural Area Map.

This unique map, produced with high-resolution satellite imagery, was published by the Peruvian Ministry of Agrarian Development (MIDAGRI) in January.*

This map reveals that the agricultural area at the national level is 11.6 million hectares, as of 2018.

Here, we analyze this new information in relation to annual forest loss data, generated by the Peruvian Environment Ministry (Geobosques).

The goal is to better understand the critical link between agriculture and deforestation in the Peruvian Amazon.

Specifically, we analyze the agricultural area of 2018 in relation to the preceding forest loss between 2001 and 2017.

Below are two main sections:

First, we present our Base Map that illustrates the major results.

Second, we show a series of zoomed images of select areas to illustrate key results in detail. These areas include major deforestation events related to oil palm, cacao, and other crops.


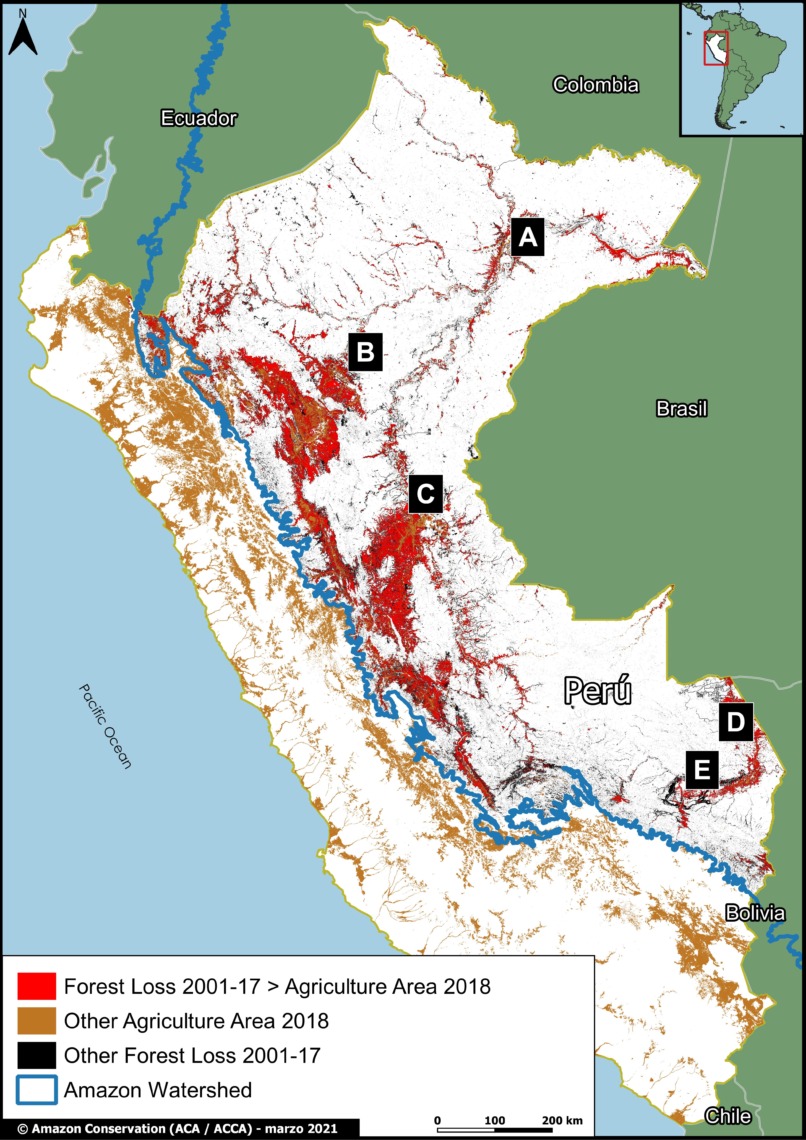
Base Map showing our major results. Data: MAAP, MIDAGRI, MINAM/Geobosques. Double click to enlarge.

Major Results

  • We found that 43% (4.9 million hectares) of Peru’s total agricultural area in 2018 was located in the Amazon basin.
    j
  • Of these Amazonian agricultural areas, more than 1.1 million hectares (24%) came from forest lost between 2001 and 2017 (indicated in red on the Base Map).
    k
  • Expressed another way, over half (56%) of the forest loss in the Peruvian Amazon between 2001 and 2017 corresponds to an agricultural area in 2018.
    l
  • The Base Map also shows, in brown, the agricultural area that is not linked to recent forest loss. The vast majority is located outside the Amazon basin (western Peru).
    l
  • Finally, the Base Map shows, in black, the recent forest loss not linked to agriculture. Much of this loss corresponds to gold mining (southeastern Peru), logging roads, and natural loss such as landslides.


Zooms of Key Areas

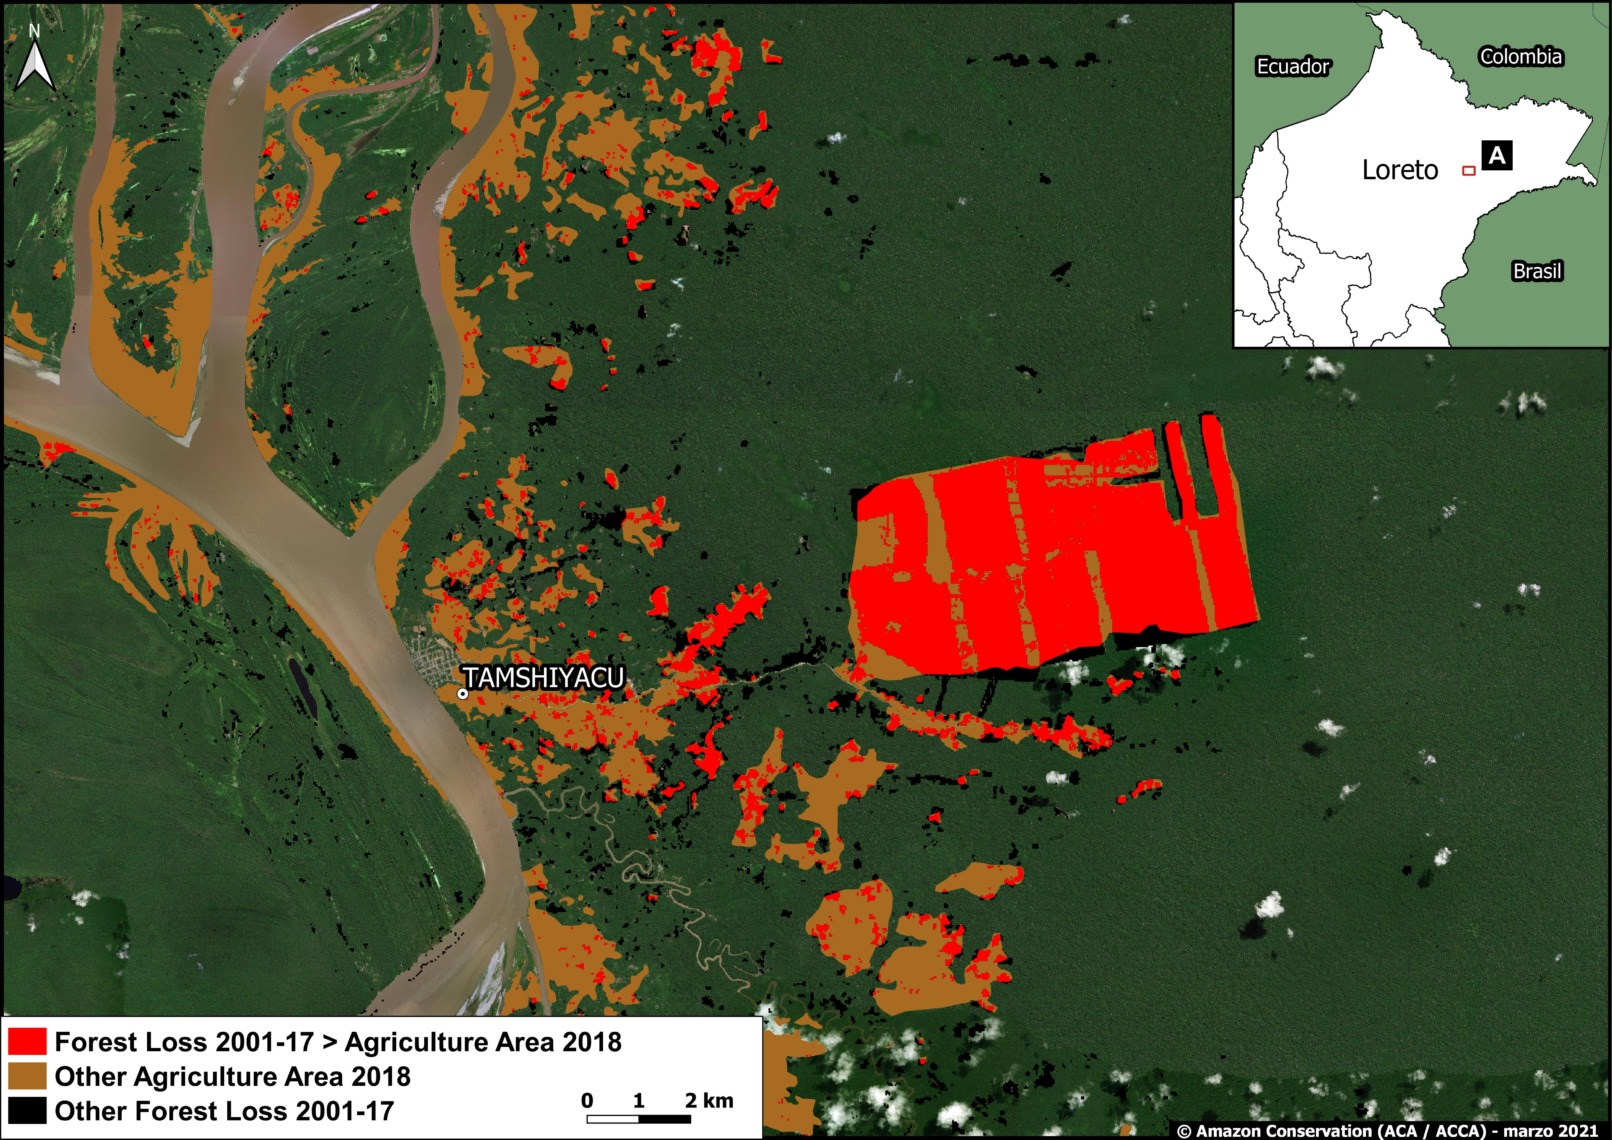
A. United Cacao (Loreto)

Image A shows the large-scale deforestation associated with the company United Cacao between 2013 and 2016, in the Loreto region  (MAAP # 128). The clearing, as the name indicates, was for the installation of Peru’s first and only industrial-style cacao plantation. In total, the deforestation for the plantation reached 2,380 hectares.

Zoom A. United Cacao (Loreto region). Data: MAAP, MIDAGRI, MINAM/Geobosques.

B. Oil Palm (Shanusi, Loreto)

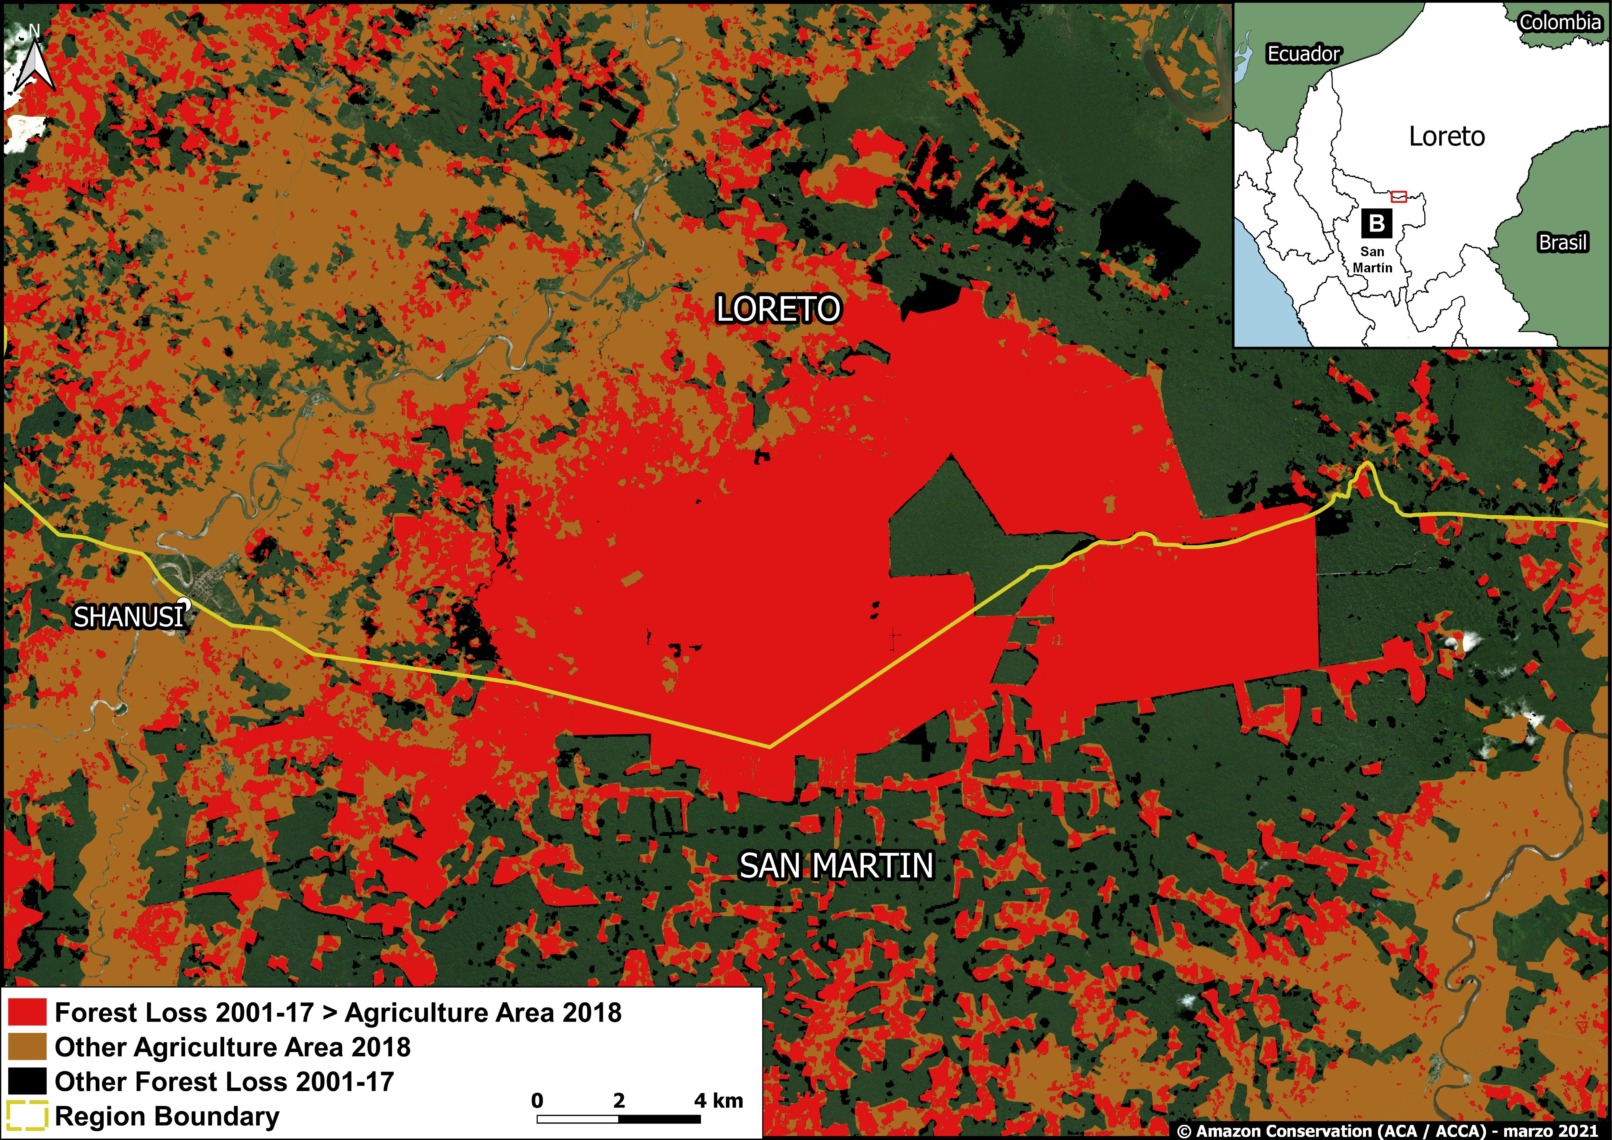
Image B shows the large-scale deforestation of more than 16,800 hectares associated with oil palm plantations between 2006 and 2015, along the border of the Loreto and San Martin regions (MAAP #116). Of this total, the deforestation of 6,975 hectares was linked to two plantations managed by the company Grupo Palmas company. The remainder occurred in the private areas surrounding the company’s plantations.

Zoom B. Oil palm deforestation around Shanusi (Loreto region). Data: MAAP, MIDAGRI, MINAM/Geobosques.

C. Oil Palm (Ucayali)

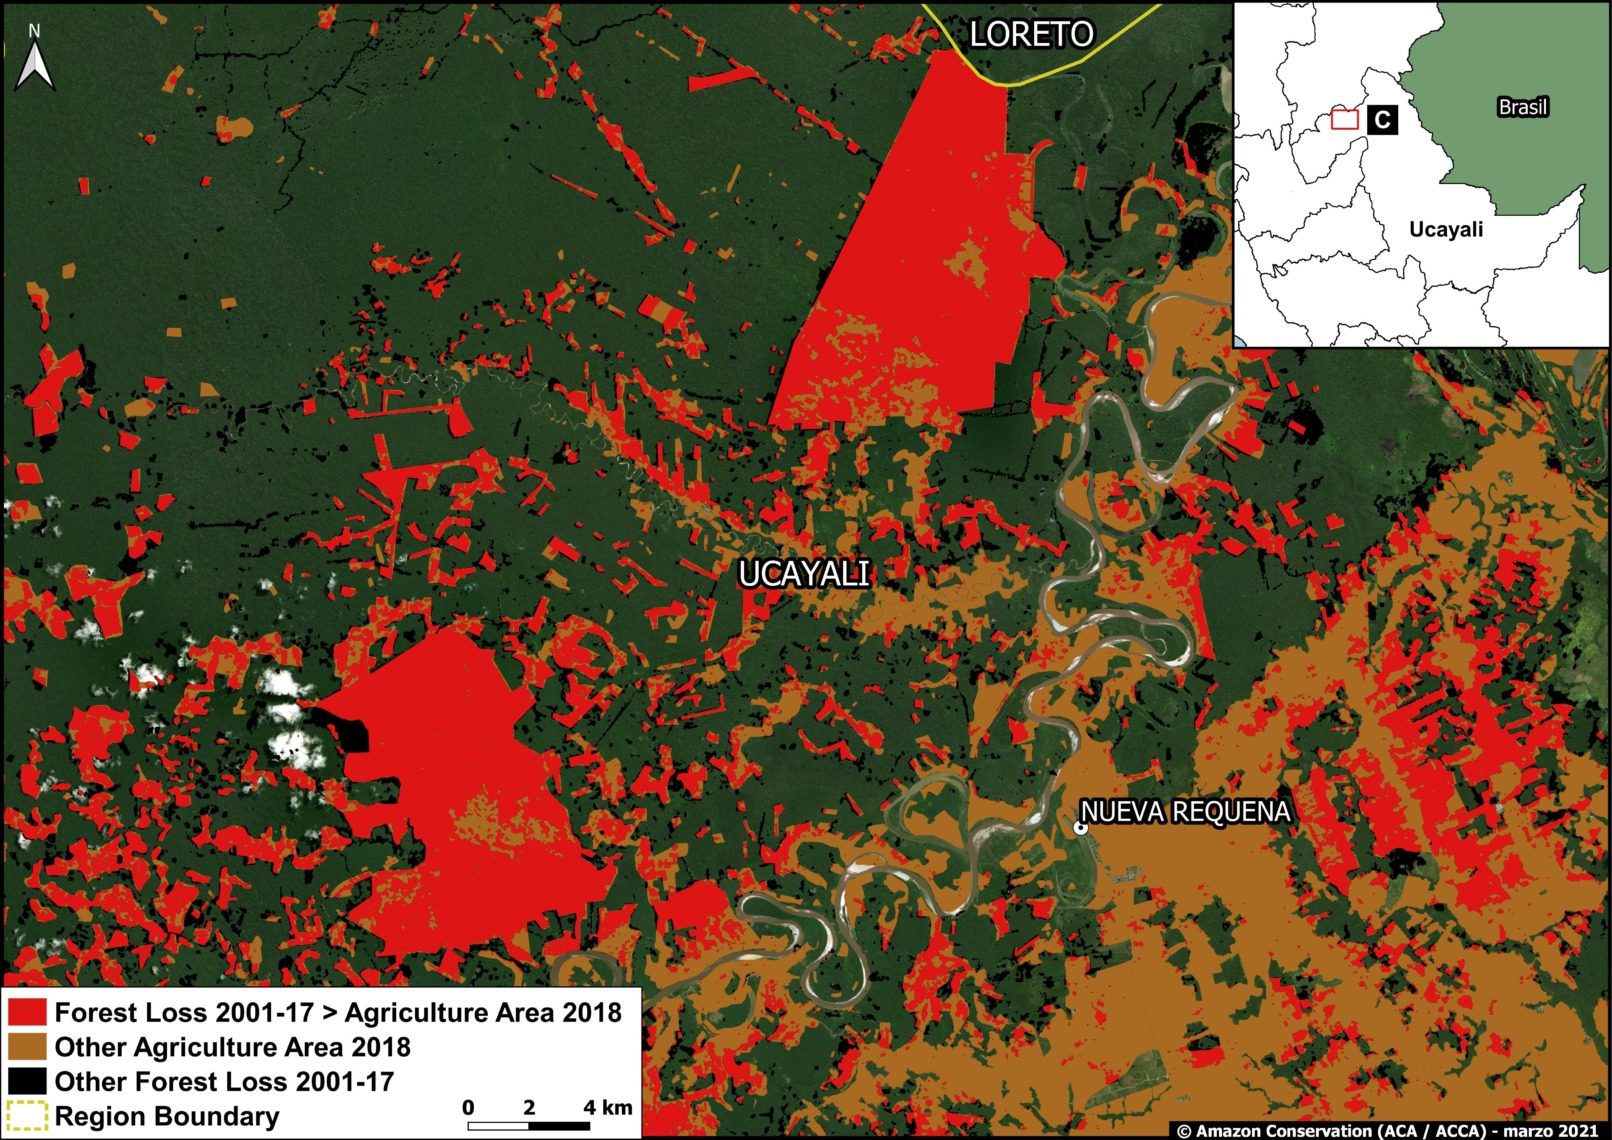
Image C shows the large-scale deforestation of more than 12,000 hectares for two oil palm plantations between 2011 and 2015, in the Ucayali region (MAAP #41).

Zoom C. Oil palm deforestation (Ucayali region). Data: MAAP, MIDAGRI, MINAM/Geobosques.

D. Iberia (Madre de Dios)

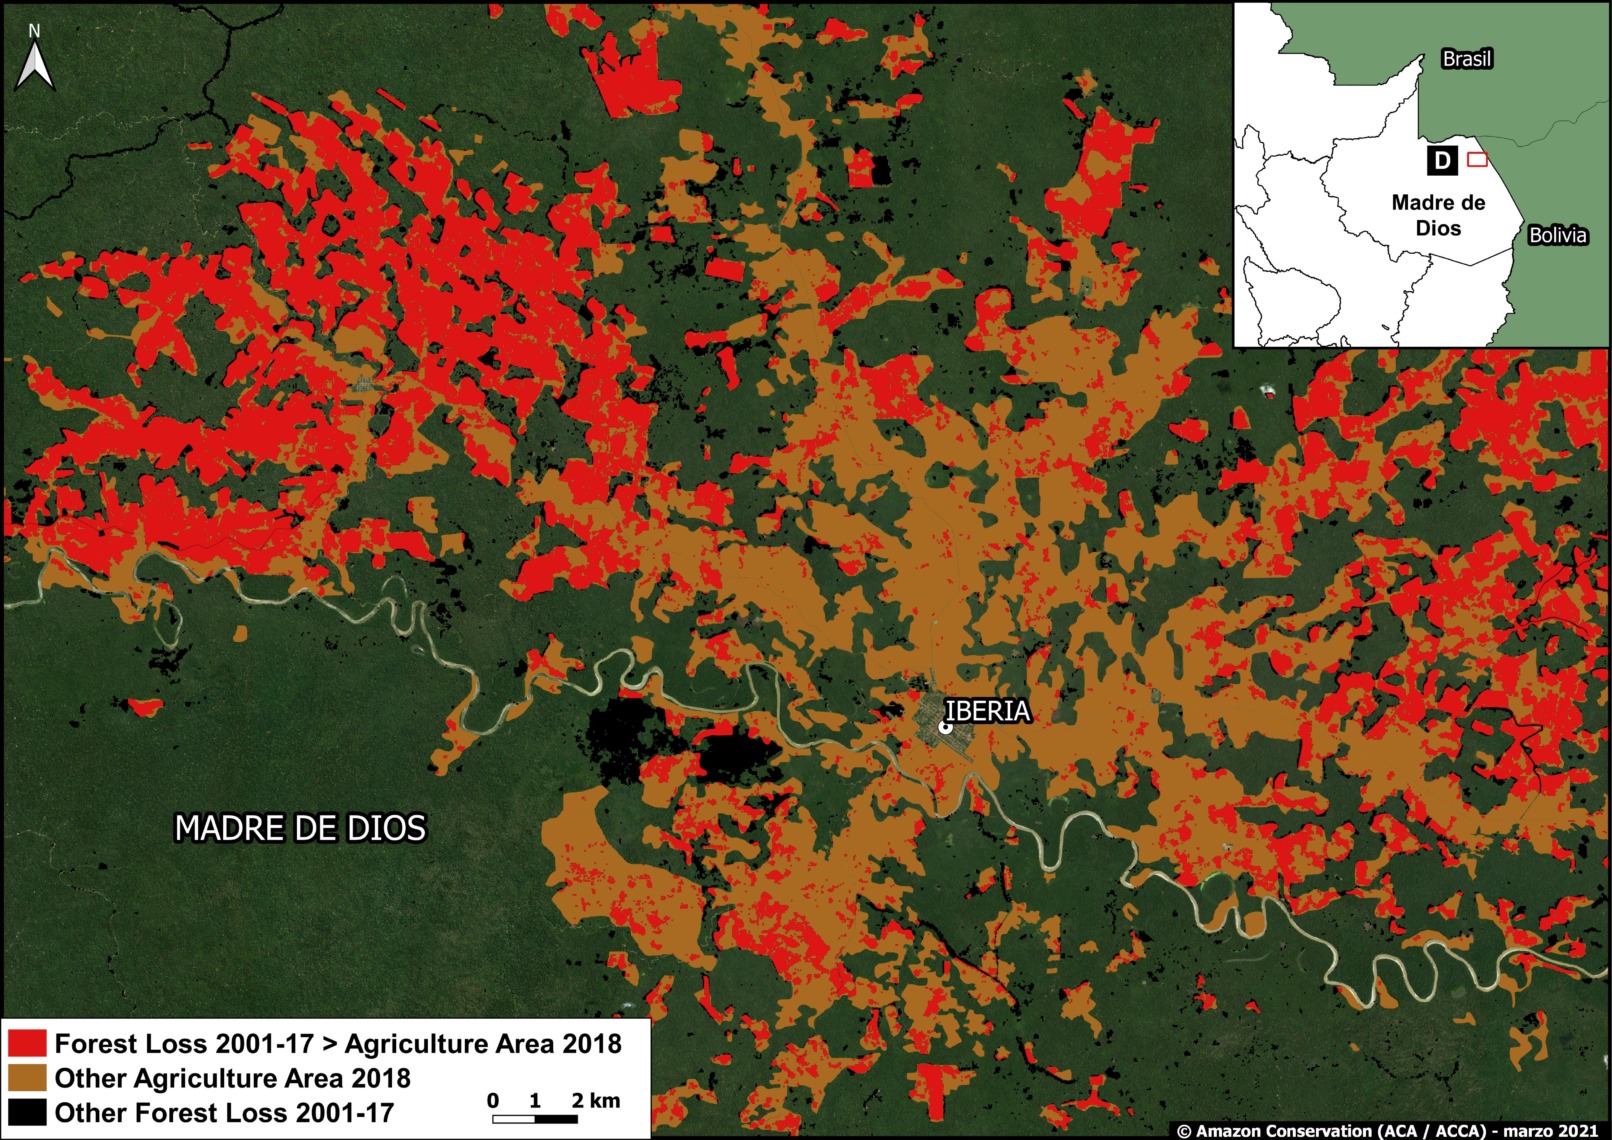
Image D shows the expanding agriculture-related deforestation around the town of Iberia, near the border with Brazil and Bolivia (MAAP #75). The major cause, according to local sources, is the increase in corn, papaya, and cacao plantations. We have documented the deforestation of more than 3,000 hectares in this area since 2014.

Zoom D. Agriculture related deforestation around Iberia (Madre de Dios region). Data: MAAP, MIDAGRI, MINAM/Geobosques.

E. Zona Minera (Madre de Dios)

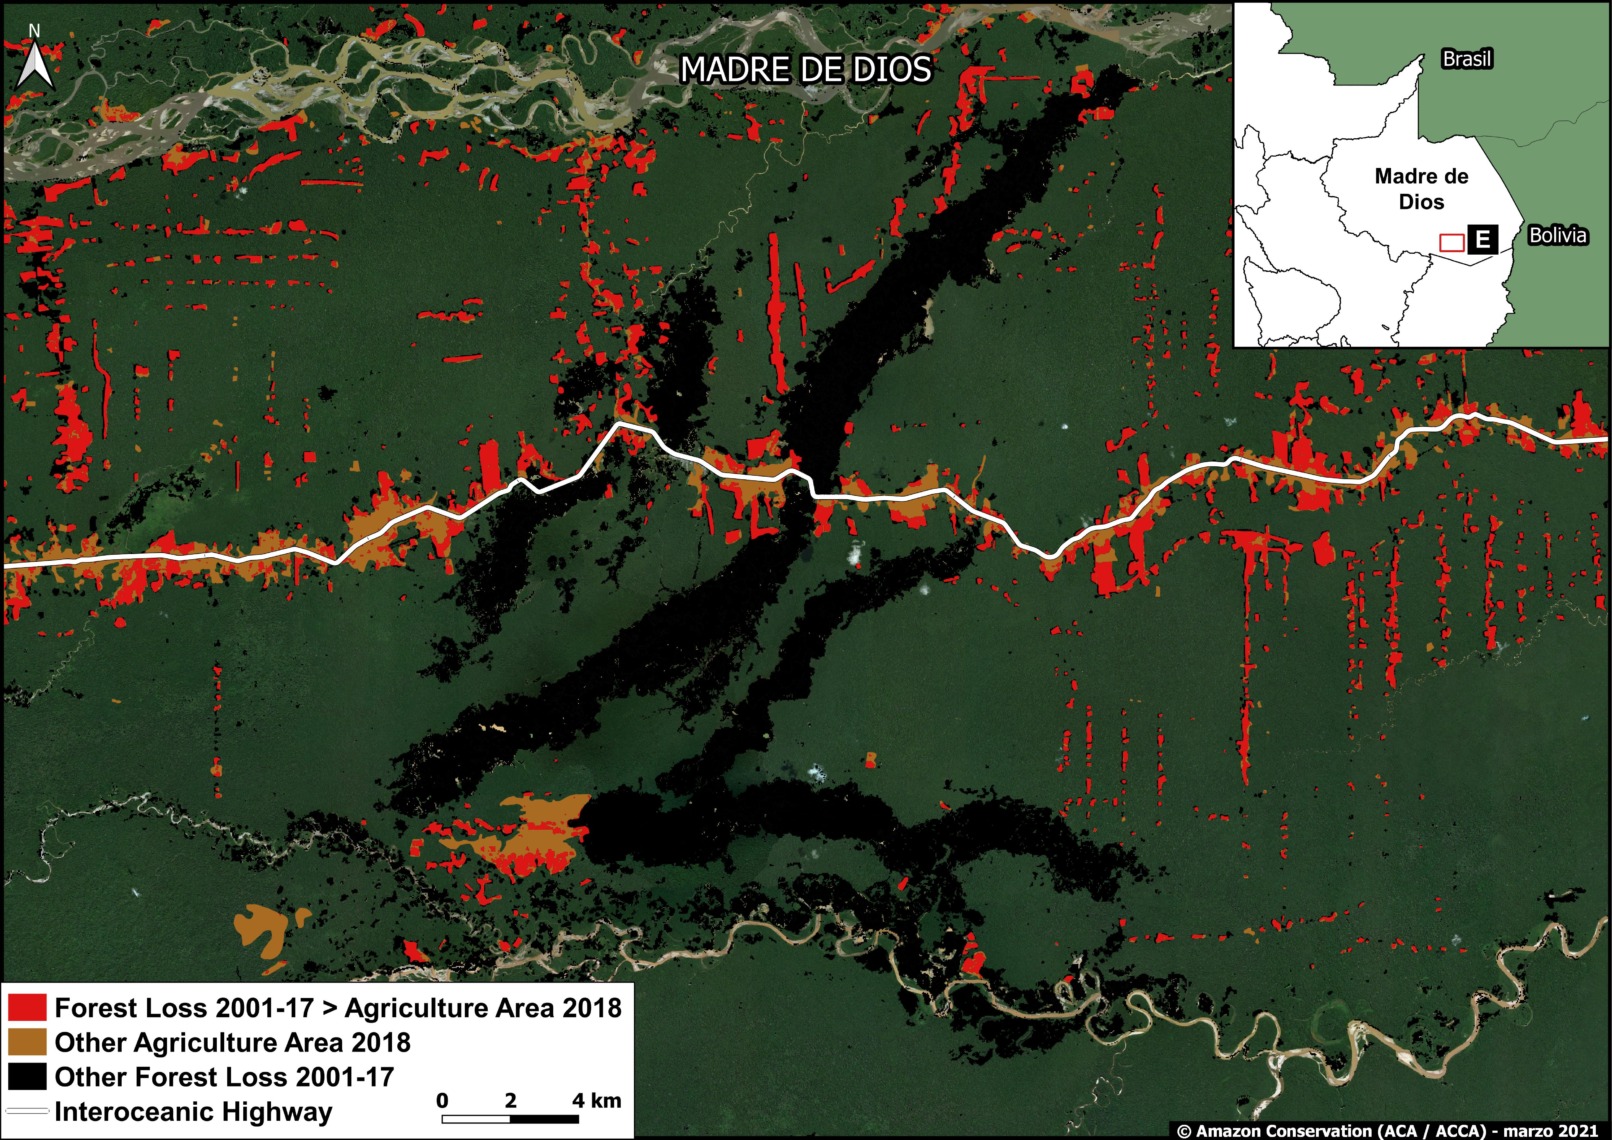
Finally, Image E shows deforestation in the gold mining hotspot known as La Pampa, in the Madre de Dios region. The non-agricultural deforestation in the center is the major illegal gold mining front. Around that area, and along the Interoceanic Highway, there is extensive agriculture-related deforestation.

Zoom E. Mining and agriculture deforestation in southern Peru (Madre de Dios region). Data: MAAP, MIDAGRI, MINAM/Geobosques.

*Notes and Methodology

According to MIDAGRI, the National Agricultural Area Map was “generated based on satellite images from RapidEye and later updated with satellite images from Sentinel-2 and the Google Earth platform, which allowed the mapping and precise measurement of the agricultural surface throughout the national territory.”

The data include “agricultural land with cultivation and without cultivation.” We assume that these data include cattle pasture.

The identification and quantification of deforested areas (2001-2017) that correspond to agricultural area in 2018 results from the analysis carried out in GIS by the superposition of both geospatial layers (MINAM and MIDAGRI).

Amazonian agricultural areas that came from forest lost between 2001 and 2017 = 1,185,722 hectares (indicated in red on the Base Map).

Acknowledgments

We thank E. Ortiz (AAF), S. Novoa (ACCA) and G. Palacios for their helpful comments on this report.

This work was supported by NORAD (Norwegian Agency for Development Cooperation), ICFC (International Conservation Fund of Canada), and EROL Foundation.

Citation

Vale Costa H, Finer M (2021) Agriculture and Deforestation in the Peruvian Amazon. MAAP: 134.

MAAP #133: Deforestation Continues in National Parks of Colombian Amazon

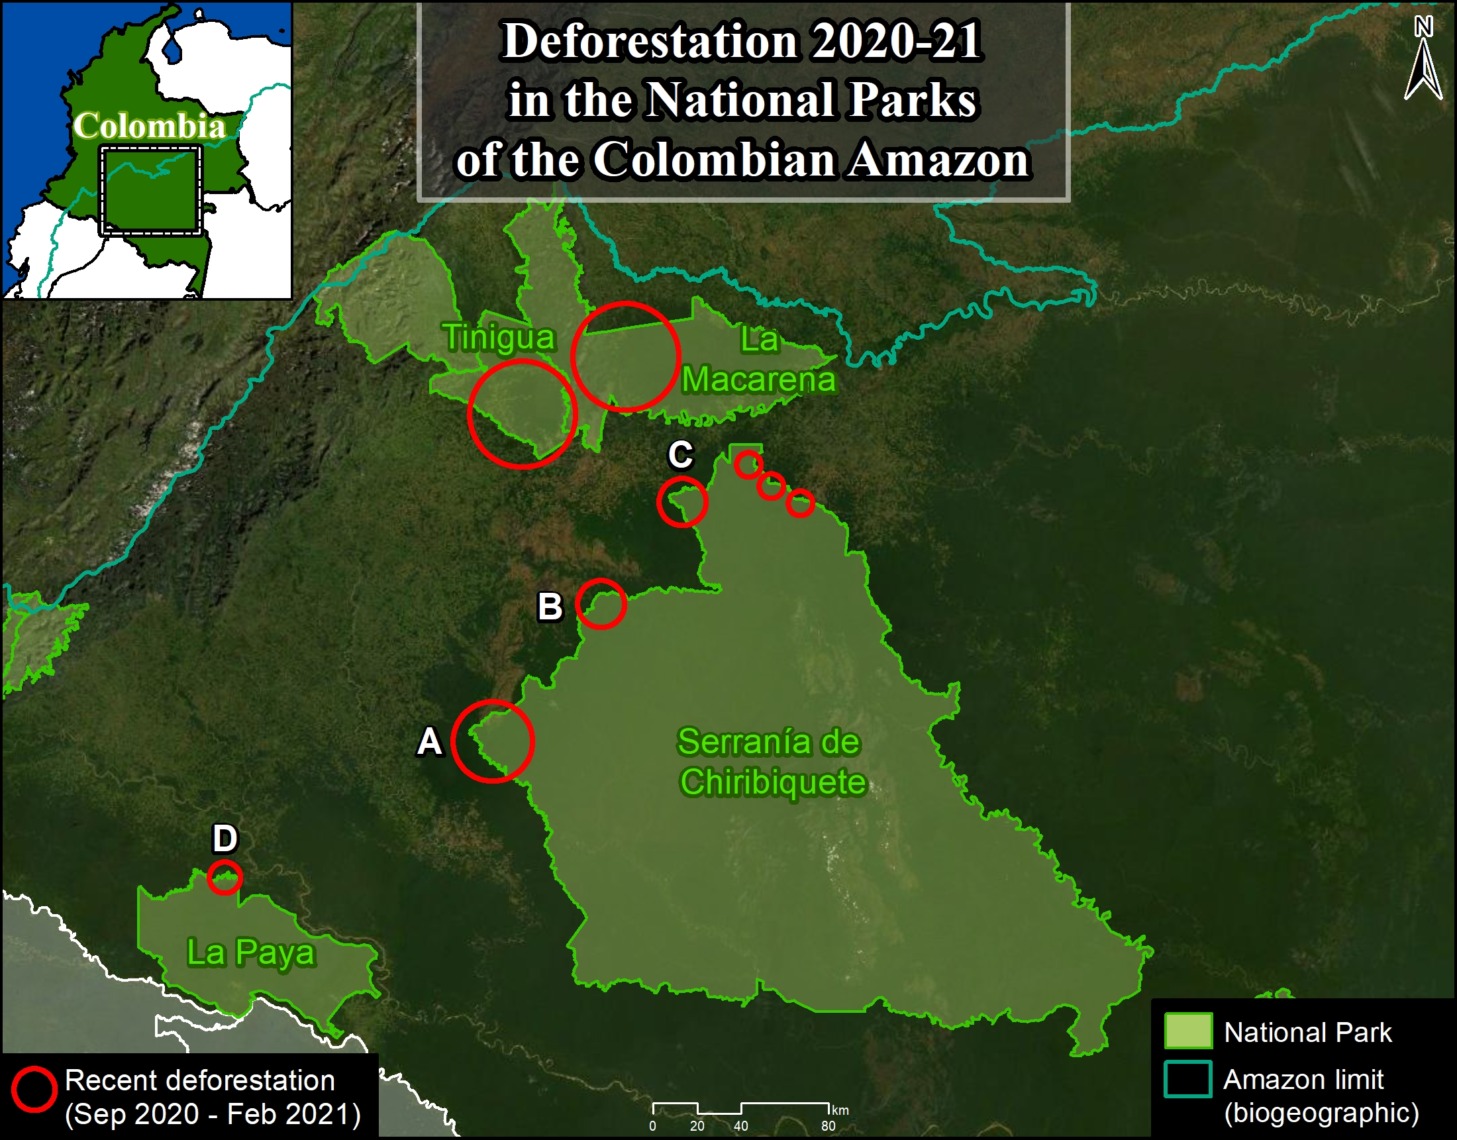
Base Map. Deforestation 2020-21 in the National Parks of the Colombian Amazon. Data: MAAP.

As we have indicated in previous reports (MAAP #120), there is an “arc of deforestation” in the northwest Colombian Amazon, impacting numerous protected areas and indigenous reserves.

Here, we emphasize that this deforestation currently impacts four National Parks: Tinigua, Macarena, Chiribiquete and La Paya.

In the Base Map, the red circles indicate the areas most impacted by recent deforestation within these parks.

The letters (A-D) indicate the location of the high-resolution satellite images (Planet) below.

While Tinigua and Macarena continue as the most impacted National Parks, below we focus on the new deforestation fronts in Chiribiquete and La Paya.

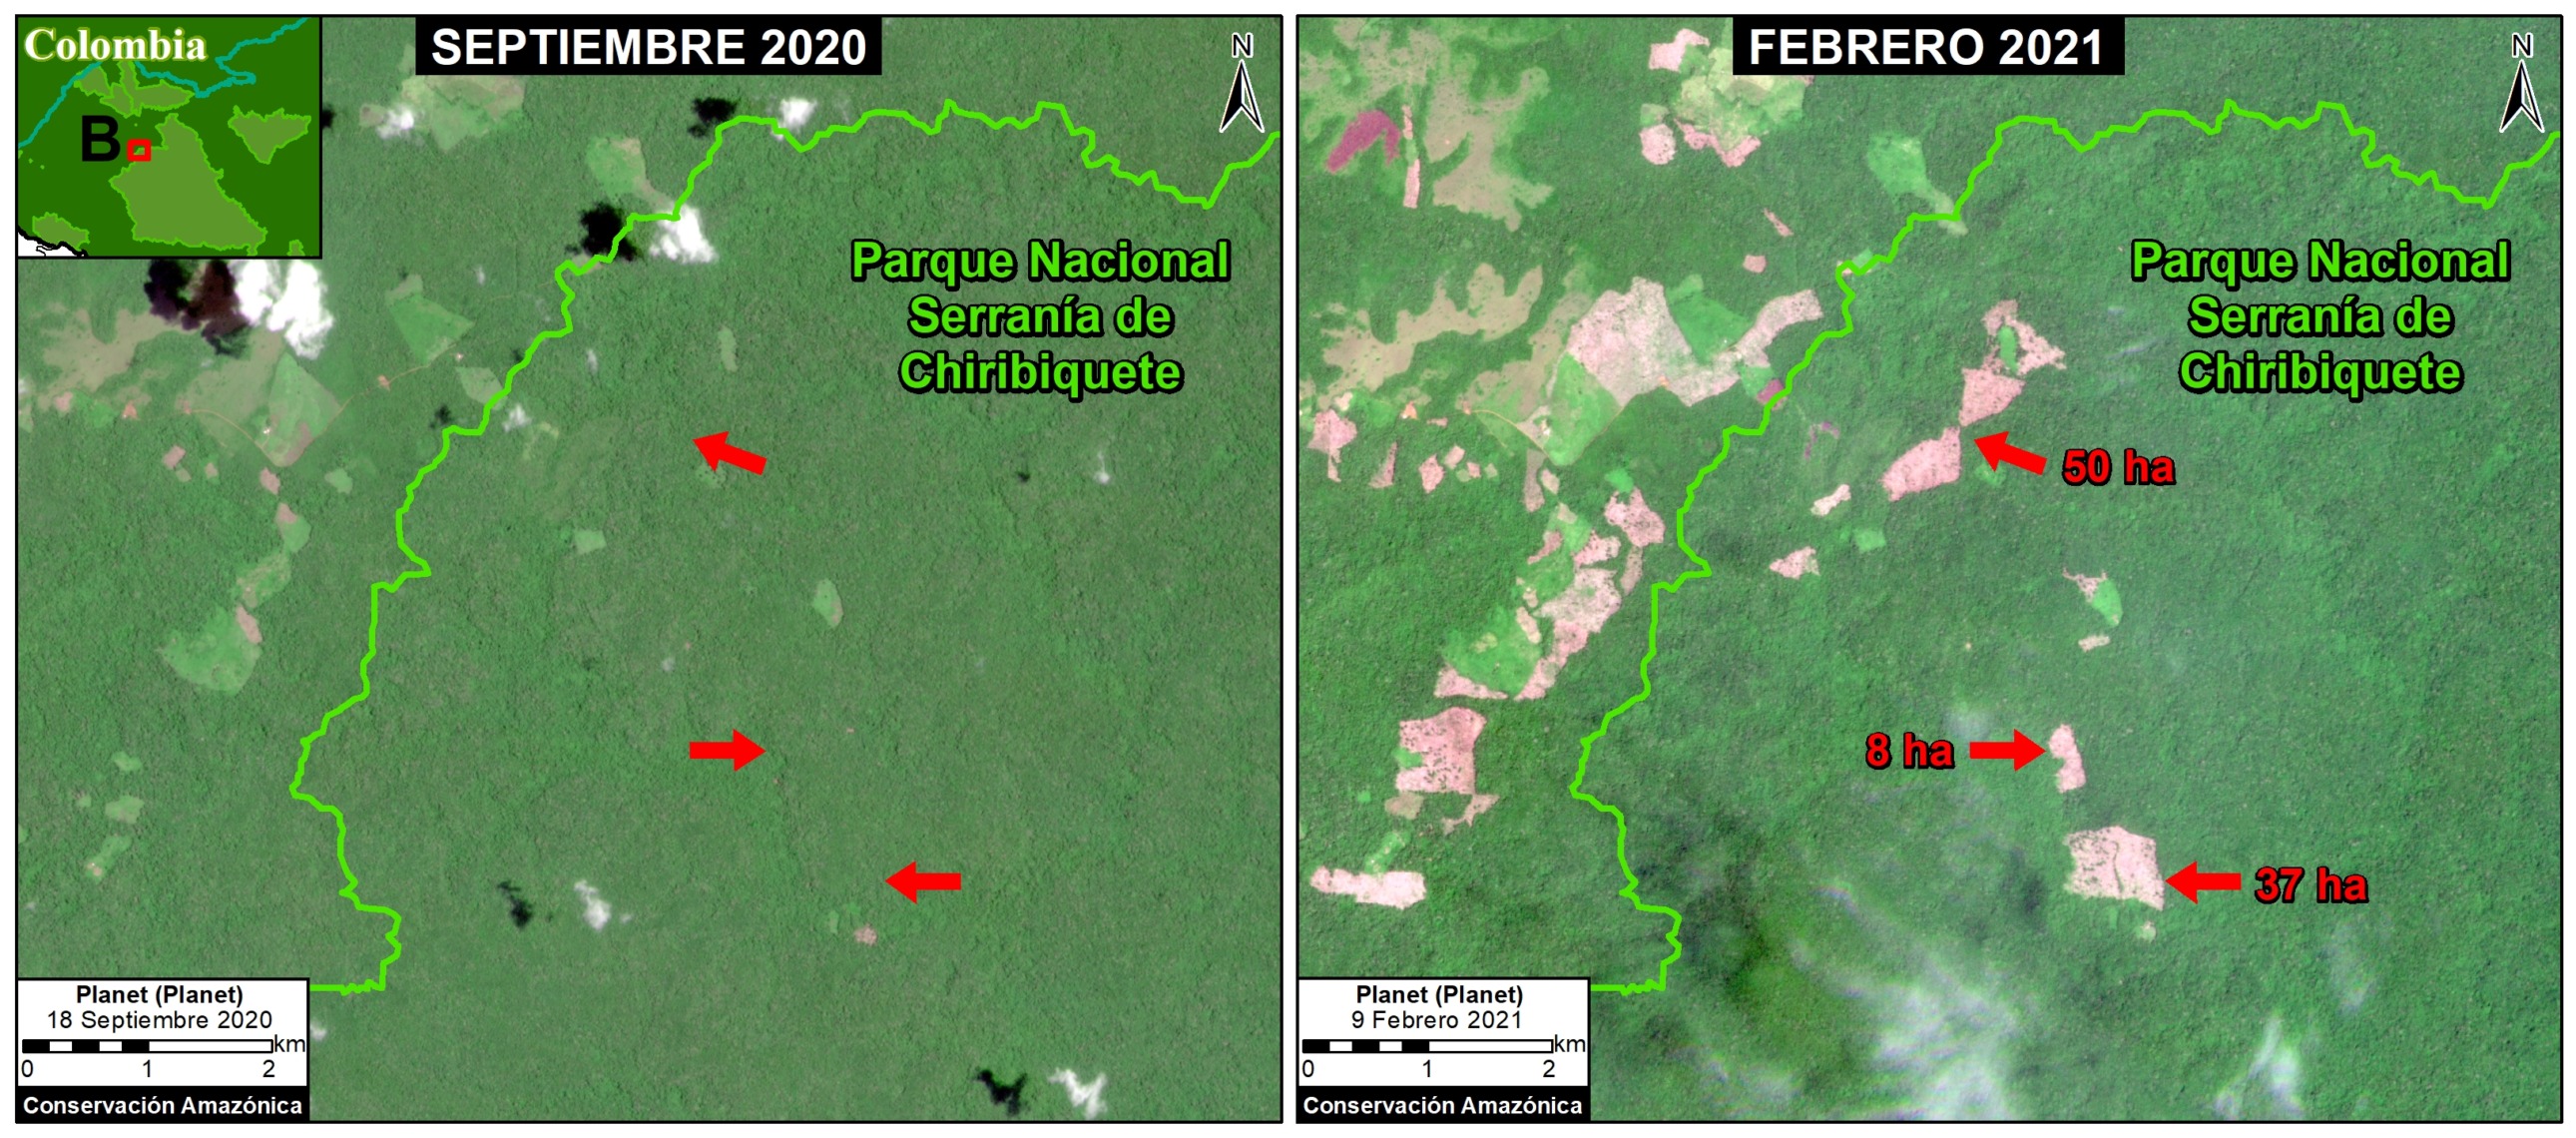
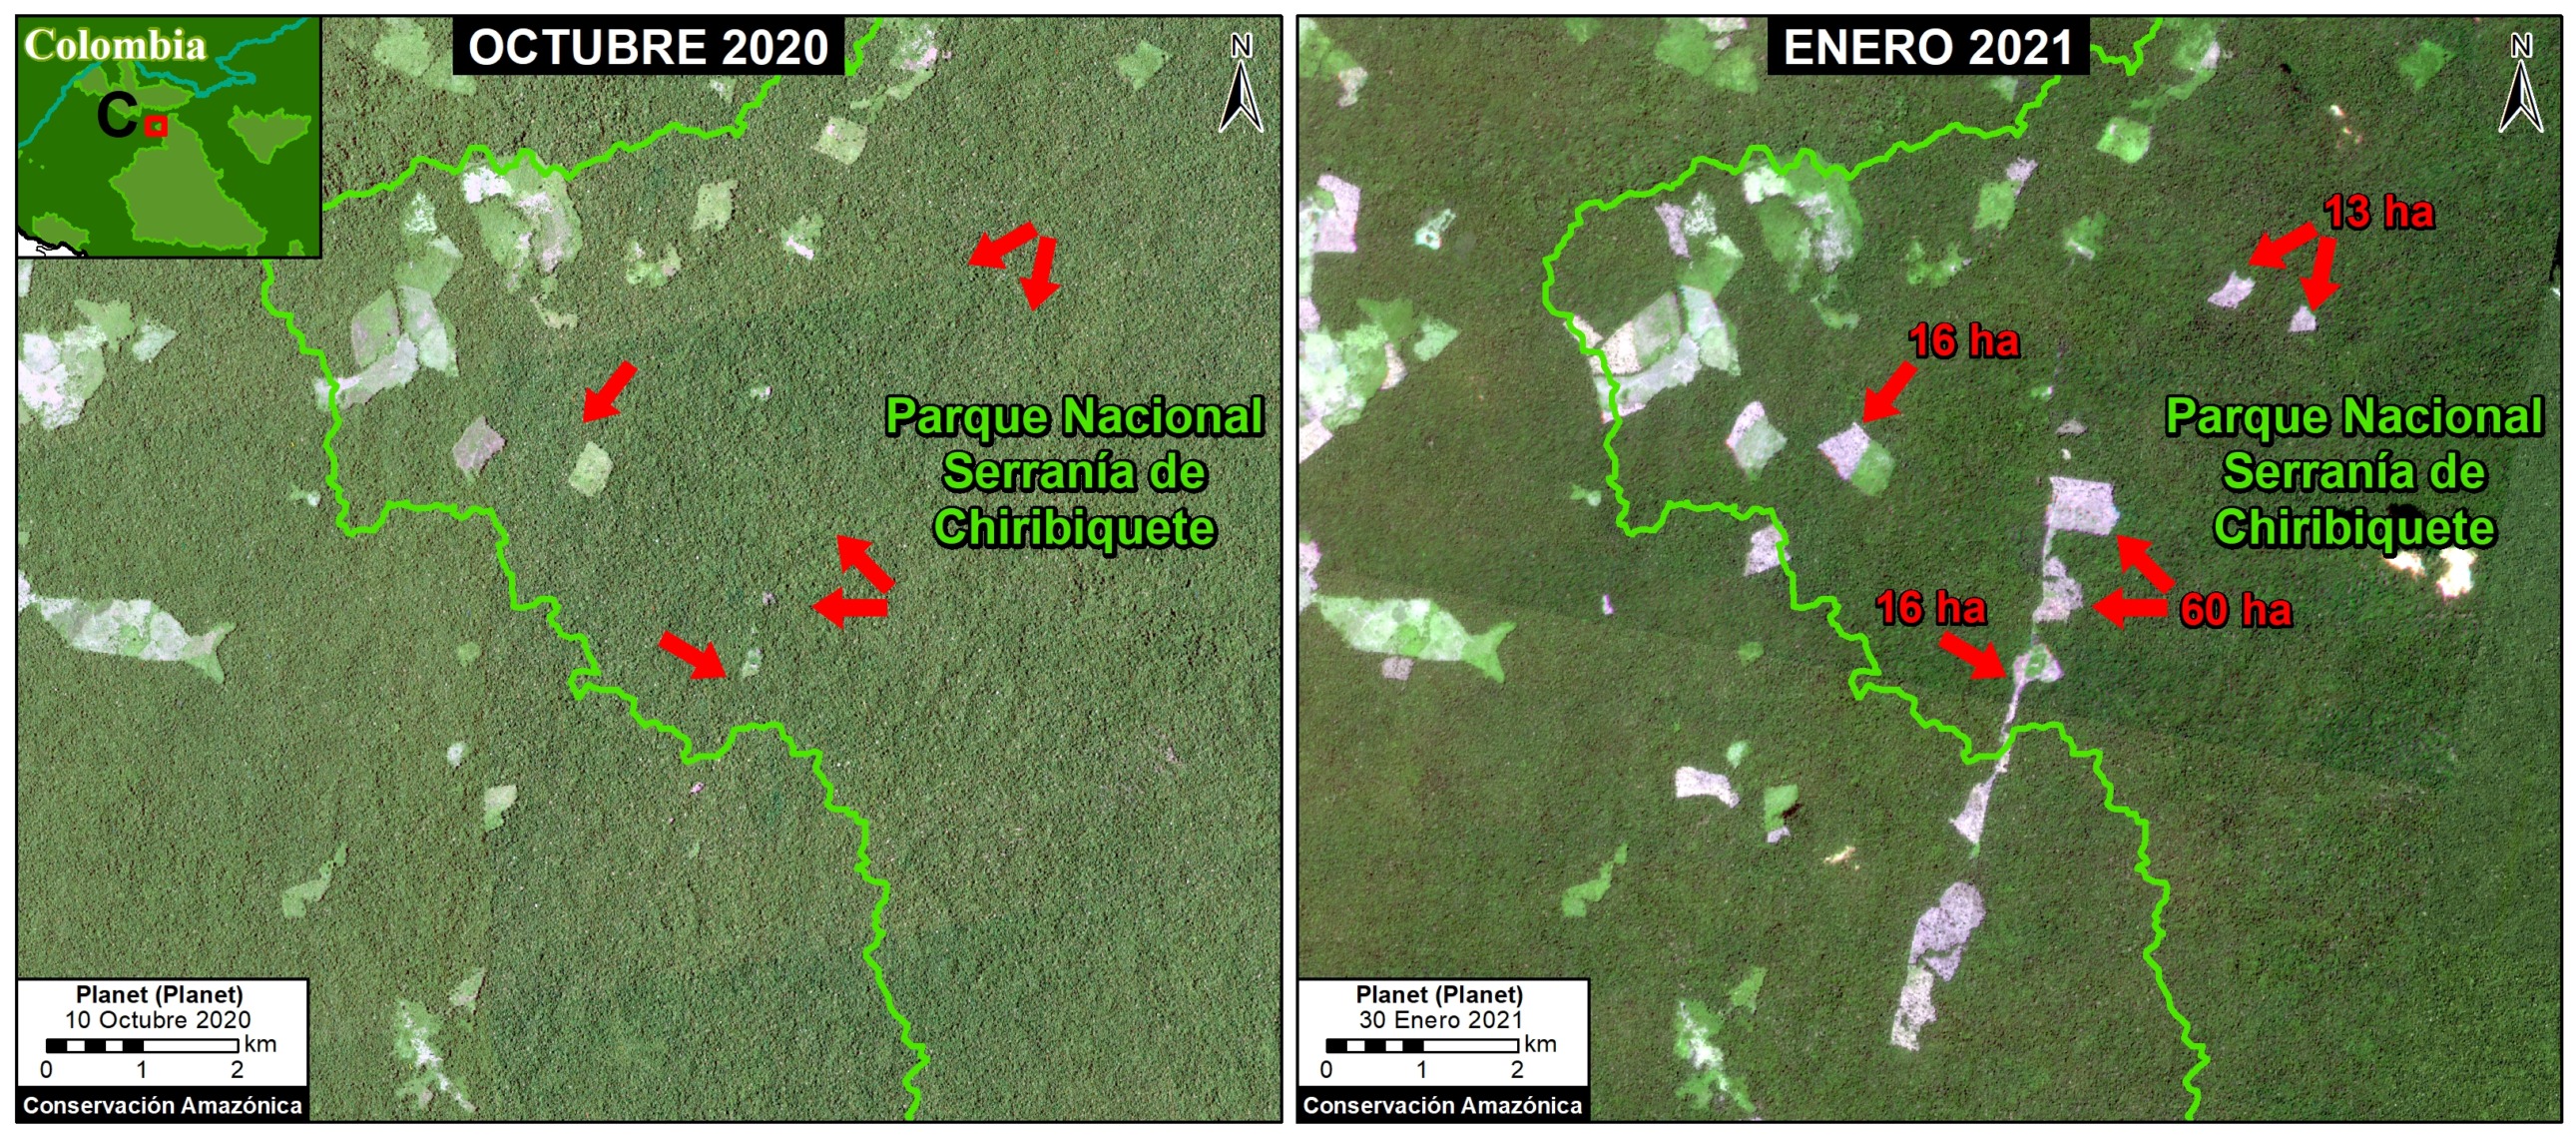
Specifically, we show the most recent and urgent deforestation, since September 2020 to the present (February 2021).


Chiribiquete National Park

Chiribiquete National Natural Park lost more than 1,000 hectares (2,500 acres) in the last six months, in six different areas of the park (see Base Map above). Much of this deforestation appears to be associated with the conversion of primary forest to illegal cattle pasture. The following satellite images show deforestation in three of these areas (A-C) between September 2020 (left panel) and February 2021 (right panel). *It is important to note that immediately prior to this publication authorities carried out a major intervention to crack down on the illegal activity within the park (see news here).

Image A. Deforestation in Chiribiquete National Park, western sector 1. Reference coordinate: 1.05497 ° N, 74.26465 ° W. Data: Planet, MAAP.

Image B. Deforestation in Chiribiquete National Park, western sector 2. Reference coordinate: 1.57990 ° N, 73.78689 ° W. Data: Planet, MAAP.

Image C. Deforestation in Chiribiquete National Park, northern sector 1. Reference coordinate: 2.00975, -73.45541. Data: Planet, MAAP.

La Paya National Park

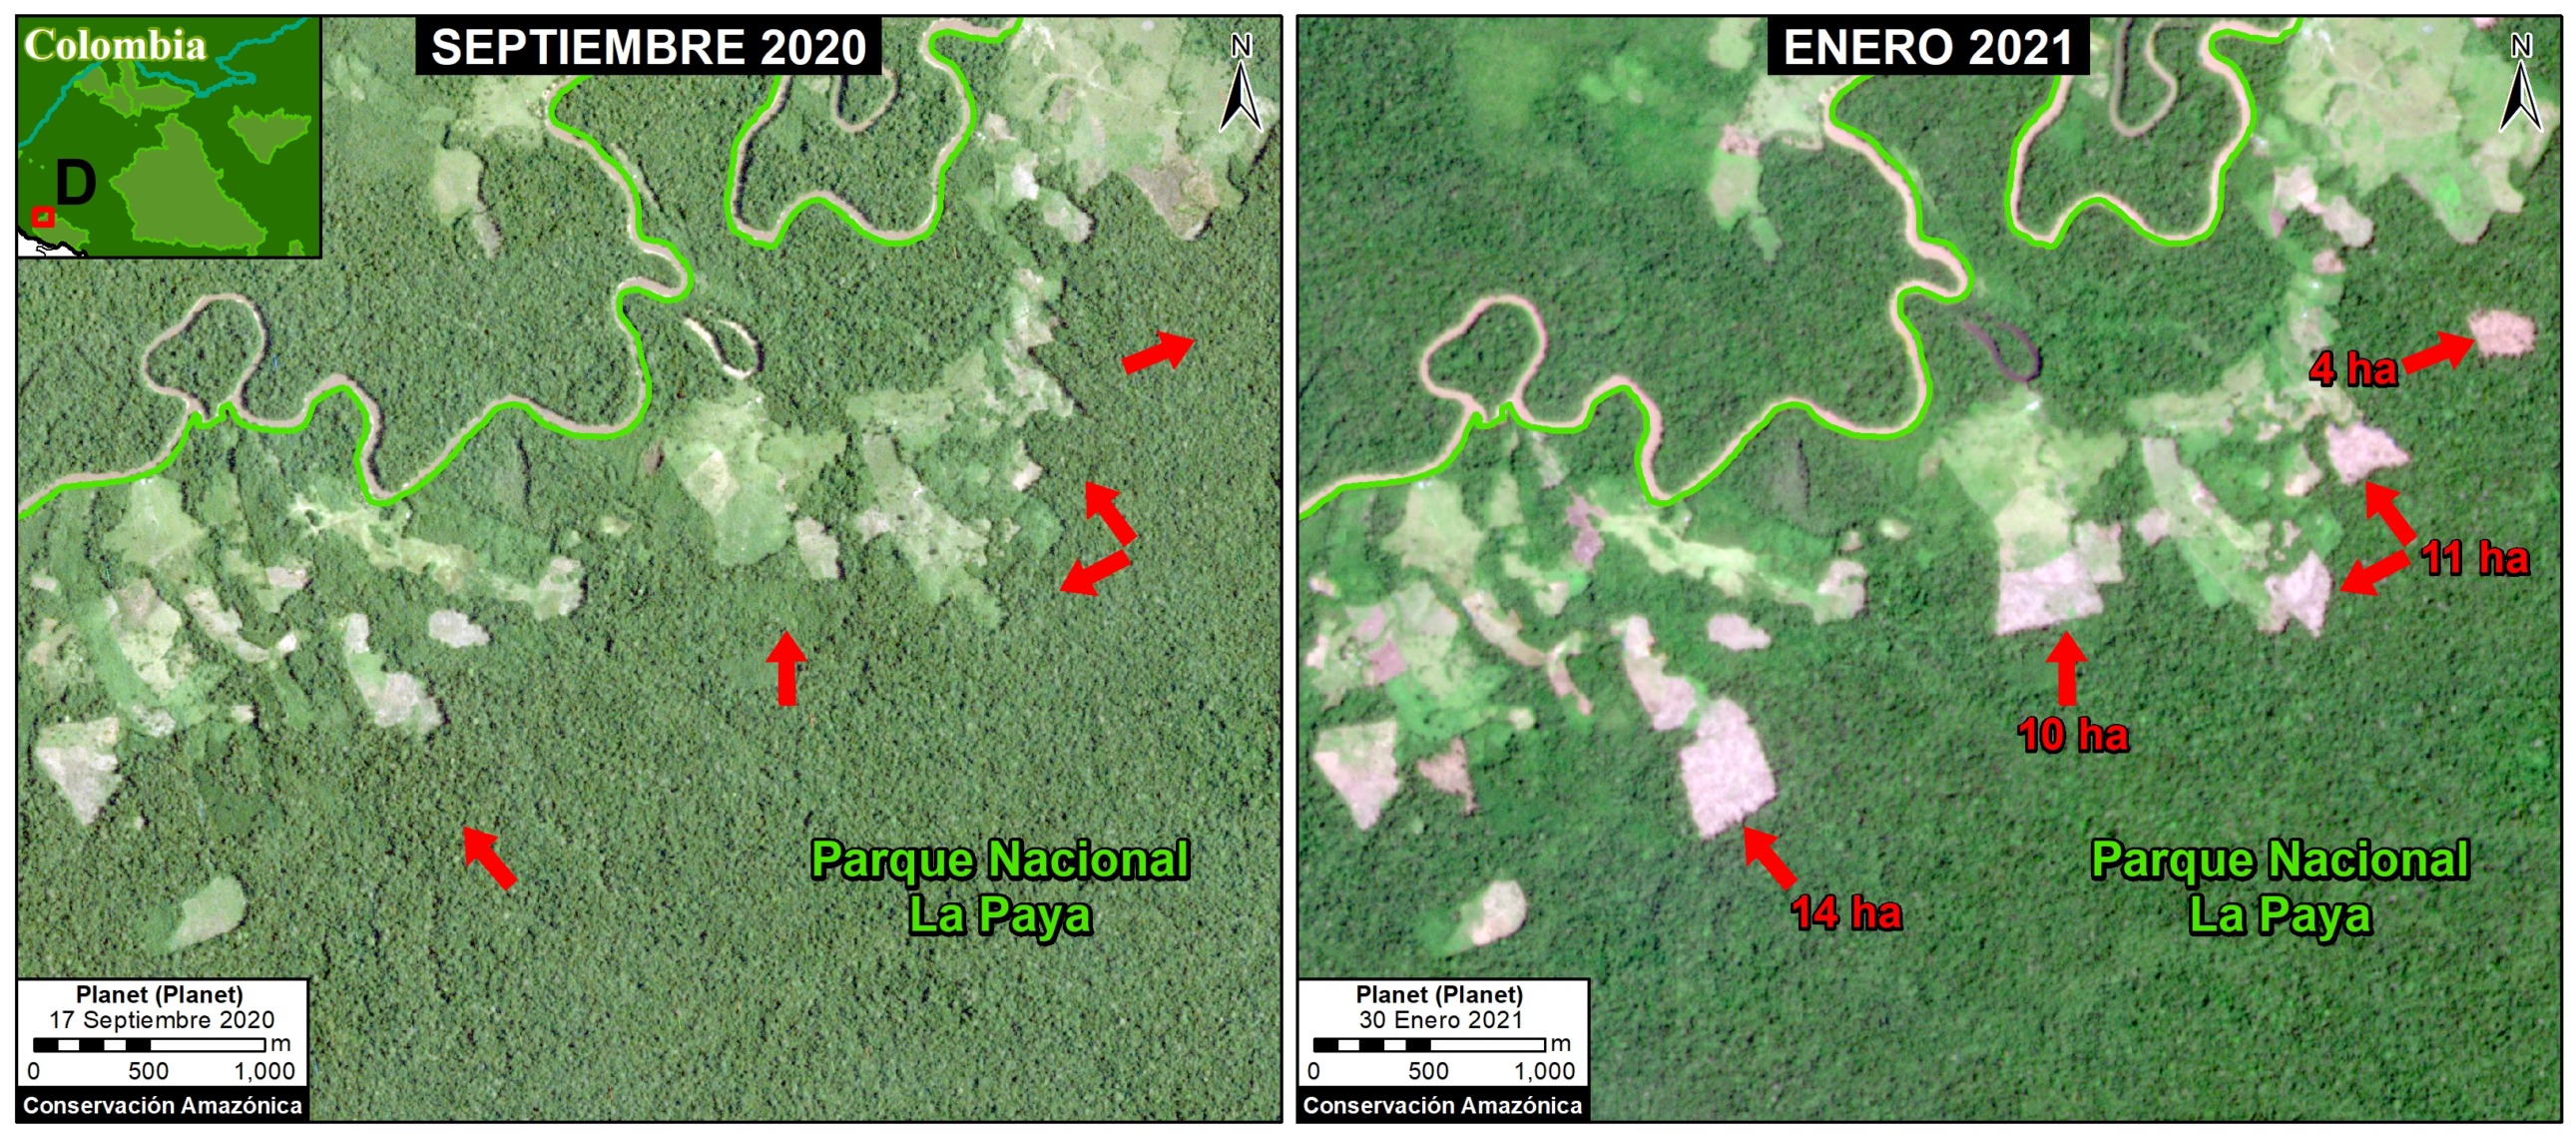
La Paya National Park lost more than 150 hectares (370 acres) in the last six months, in the northwest sector of the park (see Base Map above).
.
The following image shows an example of deforestation in this sector of the park between September 2020 (left panel) and January 2021 (right panel).

Image D. Deforestation in La Paya National Park, northern sector. Reference coordinate: 0.39677 ° N, 75.48505 ° W. Data: Planet, MAAP.

Fire Season

In addition, the fire season has started in the Colombian Amazon. Interestingly, now (February to March) is typically Colombia’s peak deforestation and fire season, in contrast with Brazil, Bolivia, and Peru, whose seasons peak between June and October.
l
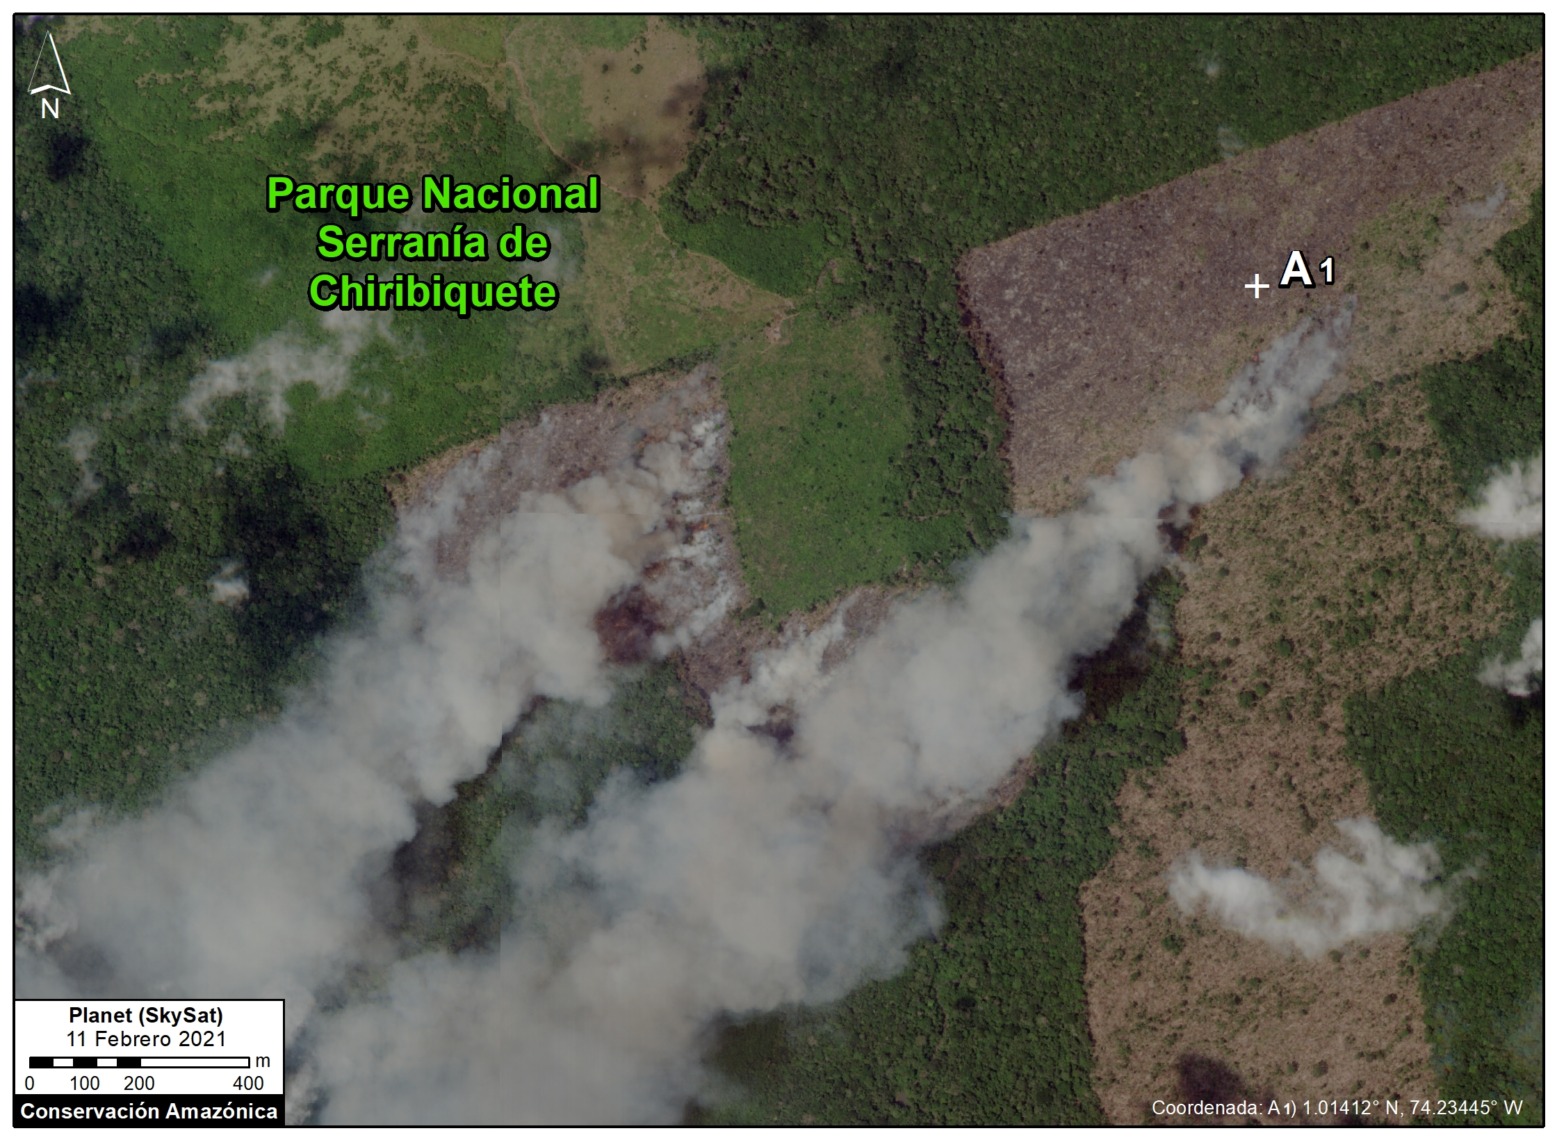
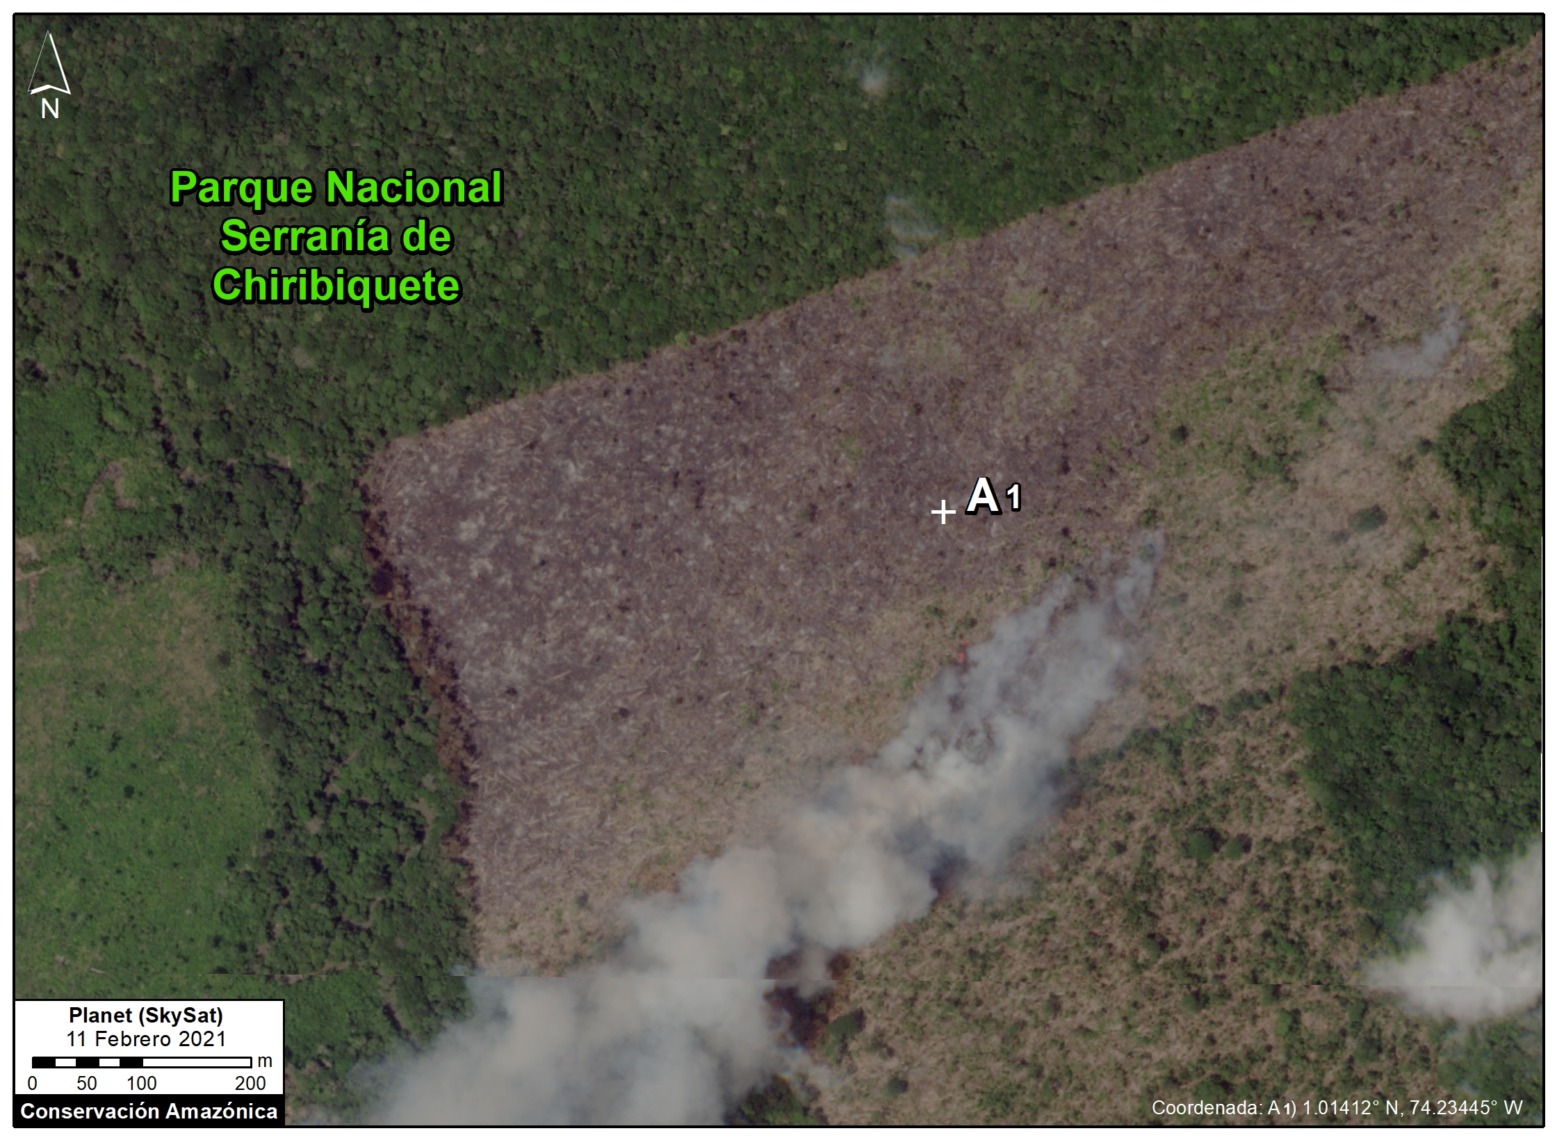
The following very high-resolution images (Skyat) reveal the burning of recently deforested areas within Chiribiquete National Park.

Fire inside Chiribuete National Park (February 11, 2021) burning recently deforested areas. Data: Planet (Skysat).

Zoom of fire inside Chiribuete National Park (February 11, 2021) burning recently deforested areas. Data: Planet (Skysat).

Acknowledgmens

We thank R. Botero (FCDS) and G. Palacios for their helpful comments on this report.

This work was supported by NORAD (Norwegian Agency for Development Cooperation) and ICFC (International Conservation Fund of Canada).

Citation

Finer M, Mamani N (2021) Deforestation Continues in National Parks of Colombian Amazon. MAAP: 133.

MAAP #132: Amazon Deforestation Hotspots 2020

Base Map. Forest loss hotspots across the Amazon in 2020. Data: UMD/GLAD, RAISG, MAAP. The letters A-G correspond to the zoom examples below.

We present a first look at the major hotspots of primary forest loss across the Amazon in 2020 (see Base Map).*

There are several major headlines:

  • We estimate over 2 million hectares (5 million acres) of primary forest loss across the nine countries of the Amazon in 2020.*
    p
  • The countries with the highest 2020 primary forest loss are 1) Brazil, 2) Bolivia, 3) Peru, 4) Colombia, 5) Venezuela, and 6) Ecuador.
    p
  • The majority of the hotspots occurred in the Brazilian Amazon, where massive deforestation stretched across nearly the entire southern region. Many of these areas were cleared in the first half of the year and then burned in July and August. In September, there was a shift to actual forest fires (see MAAP #129).
    p
  • Several of the most intense hotspots were in the Bolivian Amazon, where fires raged through the dry forests (known as the Chiquitano) in the southeast region.
    p
  • There continues to be an arc of deforestation in the northwestern Colombian Amazon, impacting numerous protected areas.
    p
  • In the Peruvian Amazon, deforestation continues to impact the central region. On the positive, the illegal gold mining that plagued the southern region has decreased thanks to effective government action (see MAAP #130).

Below, we show a striking series of high-resolution satellite images that illustrate some of the major deforestation events across the Amazon in 2020 (indicated A-G on the Base Map).

Widespread Deforestation in the Brazilian Amazon

Zooms A-C show examples of a troublingly common phenomenon in the Brazilian Amazon: large-scale deforestation events in the first half of the year that are later burned in July and August, causing major fires due to the abundant recently-cut biomass. Much of the deforestation in these areas appears to associated with clearing rainforests for cattle pastures. The three examples below show the striking loss of over 21,000 hectares of primary forest in 2020.

Zoom A. Deforestation in the Brazilian Amazon (Amazonas state) of 3,400 hectares between April (left panel) and November (right panel) 2020. Data: ESA, Planet.

Zoom B. Deforestation in Brazilian Amazon (Amazonas state) of 2,540 hectares between January (left panel) and November (right panel) 2020. Data: Planet.

Zoom C. Deforestation in Brazilian Amazon (Para state) of 15,250 hectares between January (left panel) and October (right panel) 2020. Data: Planet.

Forest Fires in the Brazilian Amazon

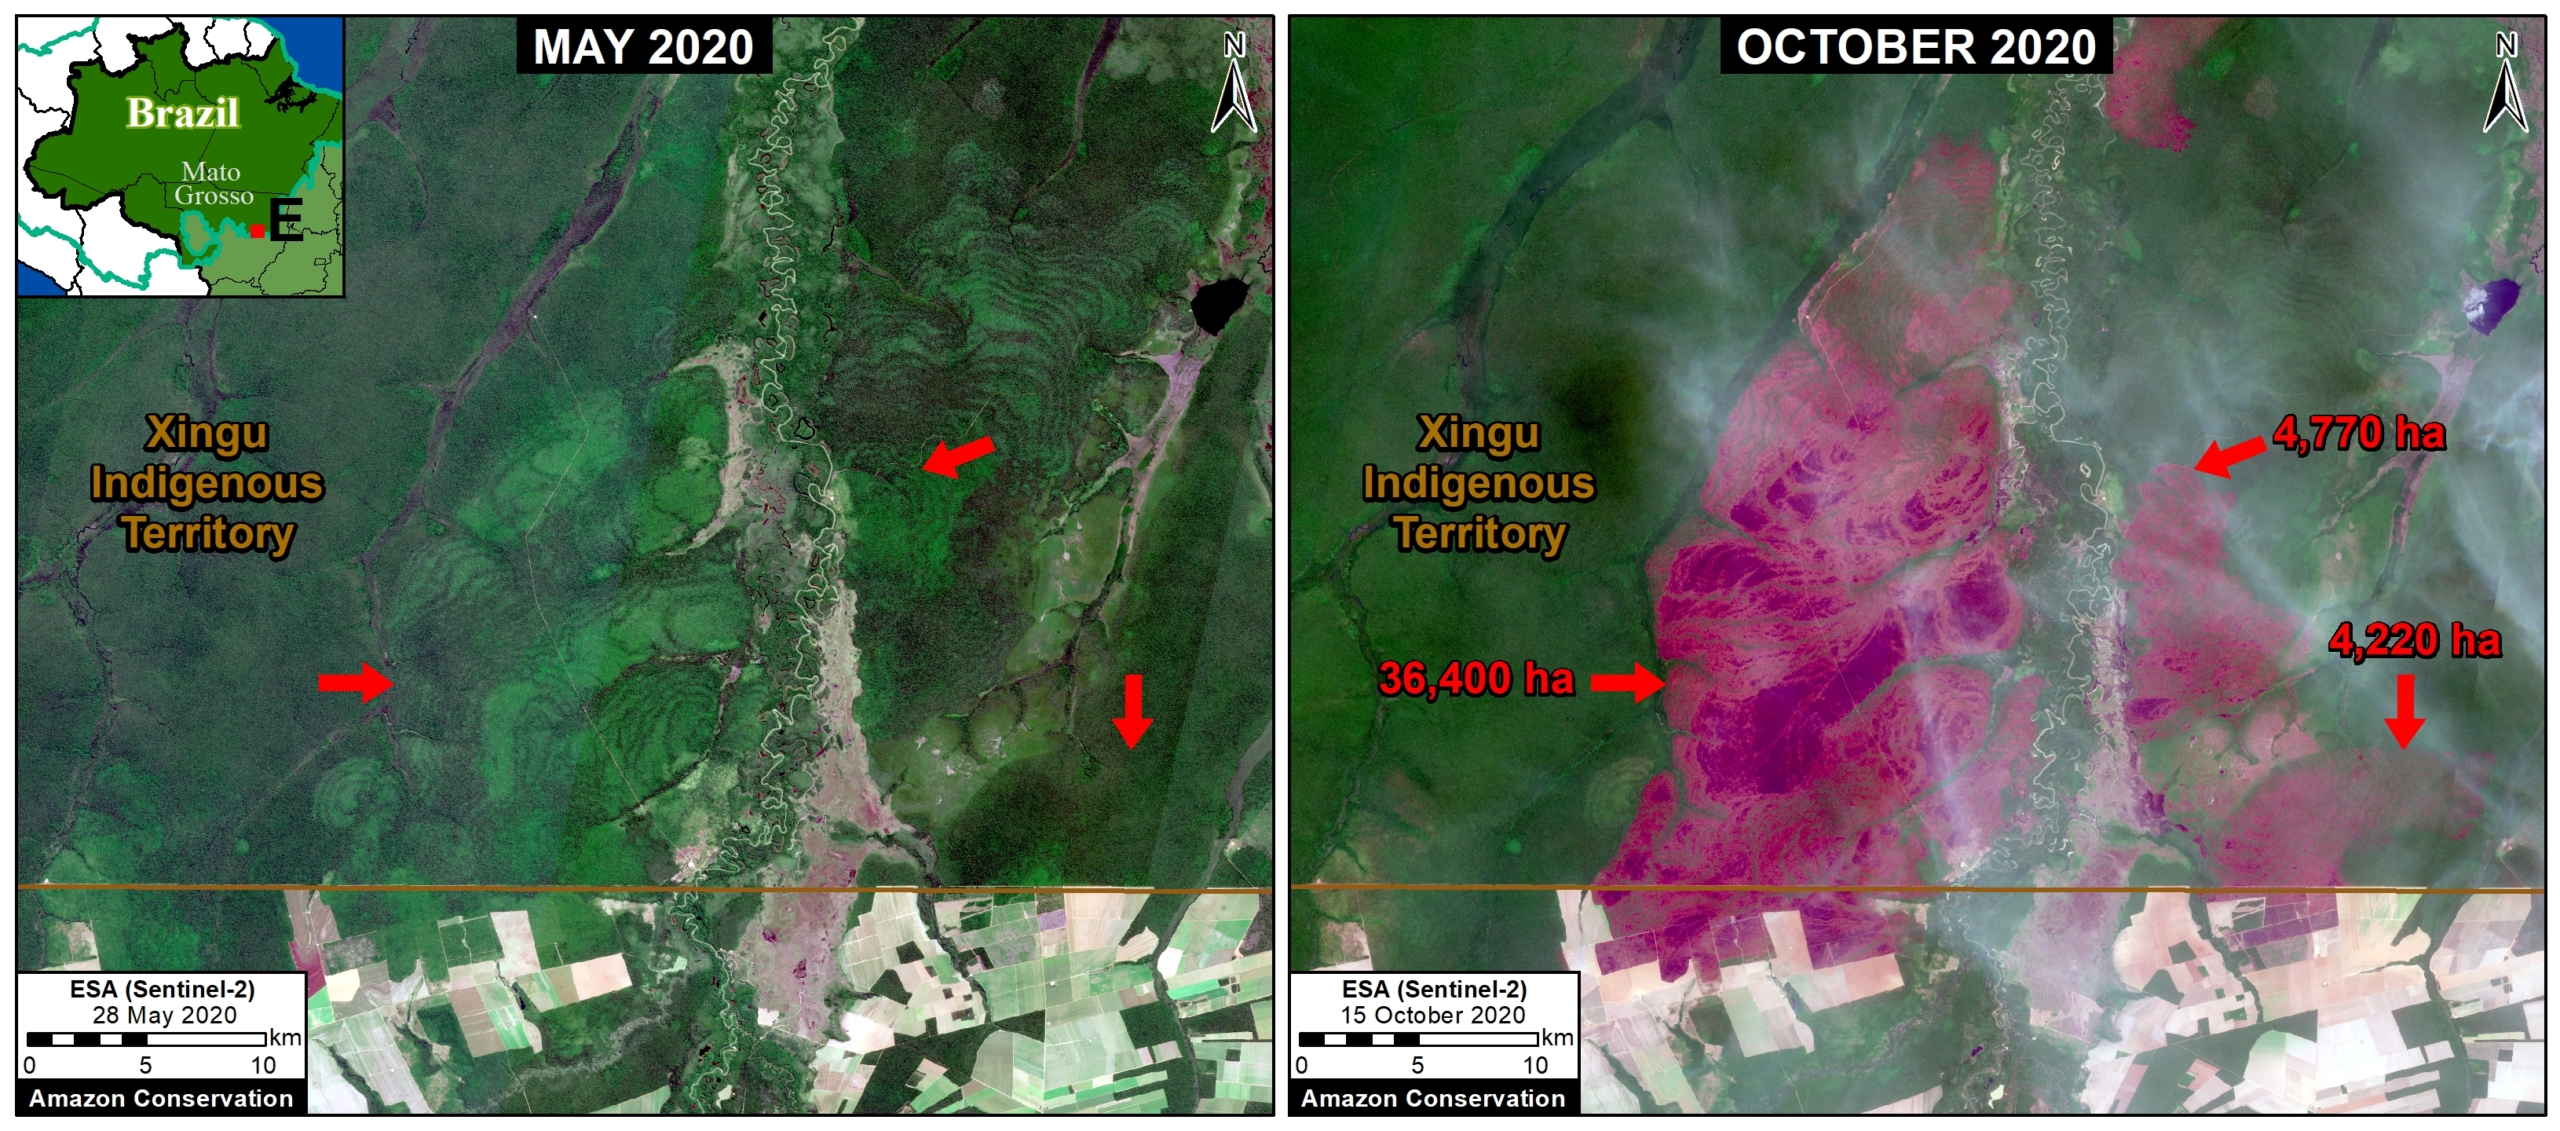
In September, there was a shift to actual forest fires in the Brazilian Amazon (see MAAP #129). Zoom D and E show examples of these major forest fires, which burned over 50,000 hectares in the states of Pará and Mato Grosso. Note both fires impacted indigenous territories (Kayapo and Xingu, respectively).

Zoom D. Forest fire in Brazilian Amazon (Para state) that burned 9,000 hectares between March (left panel) and October (right panel) 2020. Data: Planet.

Zoom E. Forest fire in Brazilian Amazon (Mato Grosso state) that burned over 44,000 hectares between May (left panel) and October (right panel) 2020. Data: Planet.

Forest Fires in the Bolivian Amazon

The Bolivian Amazon also experienced another intense fire season in 2020. Zoom F shows the burning of a massive area (over 260,000 hectares) in the Chiquitano dry forests (Santa Cruz department).

Zoom F. Forest fire in Bolivian Amazon (Santa Cruz) that burned over 260,000 hectares between April (left panel) and November (right panel) 2020. Data: ESA.

Arc of Deforestation in the Colombian Amazon

As described in previous reports (see MAAP #120), there is an “arc of deforestation” concentrated in the northwest Colombian Amazon. This arc impacts numerous protected areas (including national parks) and Indigenous Reserves. For example, Zoom G shows the recent deforestation of over 500 hectares in Chiribiquete National Park. Similar deforestation in that sector of the park appears to be conversion to cattle pasture.

Zoom G. Deforestation in Colombian Amazon of over 500 hectares in Chiribiqete National Park between January (left panel) and December (right panel) 2020. Data: ESA, Planet.

Deforestation in the central Peruvian Amazon

Finally, Zoom H shows expanding deforestation (over 110 hectares), and logging road construction (3.6 km), in an indigenous territory south of Sierra del Divisor National Park in the central Peruvian Amazon (Ucayali region). The deforestation appears to be associated with an expanding small-scale agriculture or cattle pasture frontier.

Zoom H. Deforestation and logging road construction in Peruvian Amazon (Ucayali region) between March (left panel) and November (right panel) 2020. Data: Planet.

*Notes and Methodology

The analysis was based on early warning forest loss alerts known as GLAD alerts (30-meter resolution) produced by the University of Maryland and also presented by Global Forest Watch. It is critical to highlight that this data represents a preliminary estimate and more definitive data will come later in the year. For example, our estimate does include some forest loss caused by natural forces. Note that this data detects and classifies burned areas as forest loss. Our estimate includes both confirmed (1,355,671 million hectares) and unconfirmed (751,533 ha) alerts.

Our geographic range is the biogeographic boundary of the Amazon as defined by RAISG (see Base Map above). This range includes nine countries.

We applied a filter to calculate only primary forest loss. For our estimate of primary forest loss, we intersected the forest cover loss data with the additional dataset “primary humid tropical forests” as of 2001 (Turubanova et al 2018). For more details on this part of the methodology, see the Technical Blog from Global Forest Watch (Goldman and Weisse 2019).

To identify the deforestation hotspots, we conducted a kernel density estimate. This type of analysis calculates the magnitude per unit area of a particular phenomenon, in this case forest cover loss. We conducted this analysis using the Kernel Density tool from Spatial Analyst Tool Box of ArcGIS. We used the following parameters:

Search Radius: 15000 layer units (meters)
Kernel Density Function: Quartic kernel function
Cell Size in the map: 200 x 200 meters (4 hectares)
Everything else was left to the default setting.

For the Base Map, we used the following concentration percentages: Medium: 7-10%; High: 11-20%; Very High: >20%.

Acknowledgements

We thank E. Ortiz (AAF), M.E. Gutierrez (ACCA), and S. Novoa for their helpful comments on this report.

This work was supported by NORAD (Norwegian Agency for Development Cooperation) and ICFC (International Conservation Fund of Canada).

Citation

Finer M, Mamani N (2020) Amazon Deforestation Hotspots 2020. MAAP: 132.

MAAP #131: Power of Free High-resolution Satellite Imagery from Norway Agreement

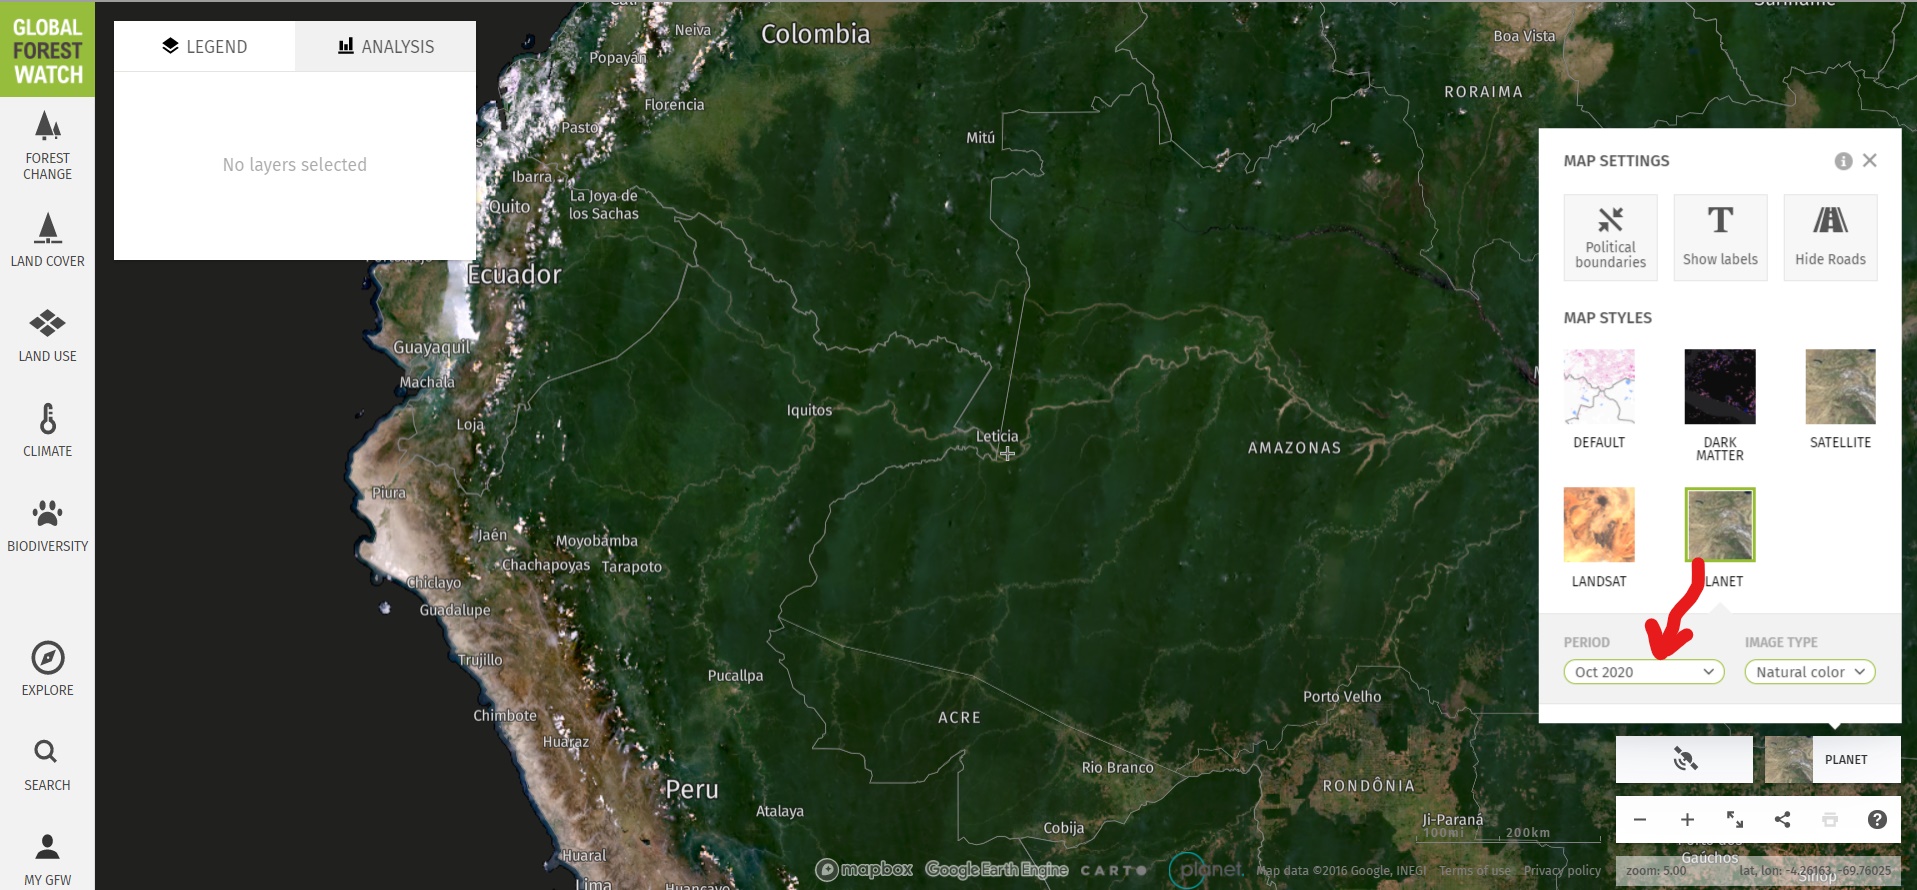
Image 1. Monthly Planet basemap for October 2020 across the Amazon, as seen on Global Forest Watch.

This report demonstrates the powerful application of freely available, high-resolution satellite imagery recently made possible thanks to an agreement between the Government of Norway and several satellite companies.*

This unprecedented agreement will bring commercial satellite technology, previously out of reach to many, to all working in tropical forest conservation around the world.

Here we show how MAAP (an initiative of Amazon Conservation) will use this information to enhance our real-time monitoring program and quickly share timely findings to partners in the field.

Specifically, we highlight the importance of the monthly basemaps (4.7-meter Planet imagery) available under the Norway agreement.* For example, Image 1 shows the stunning, nearly cloud-free October 2020 basemap across the Amazon.

l
Moreover, we show the power of this imagery visualized on Global Forest Watch, where it can be combined with early warning forest loss alerts.
p
Below, we highlight three examples where we combined this data to quickly detect and confirm deforestation in the Colombian, Ecuadorian, and Peruvian Amazon, respectively.

Colombian Amazon

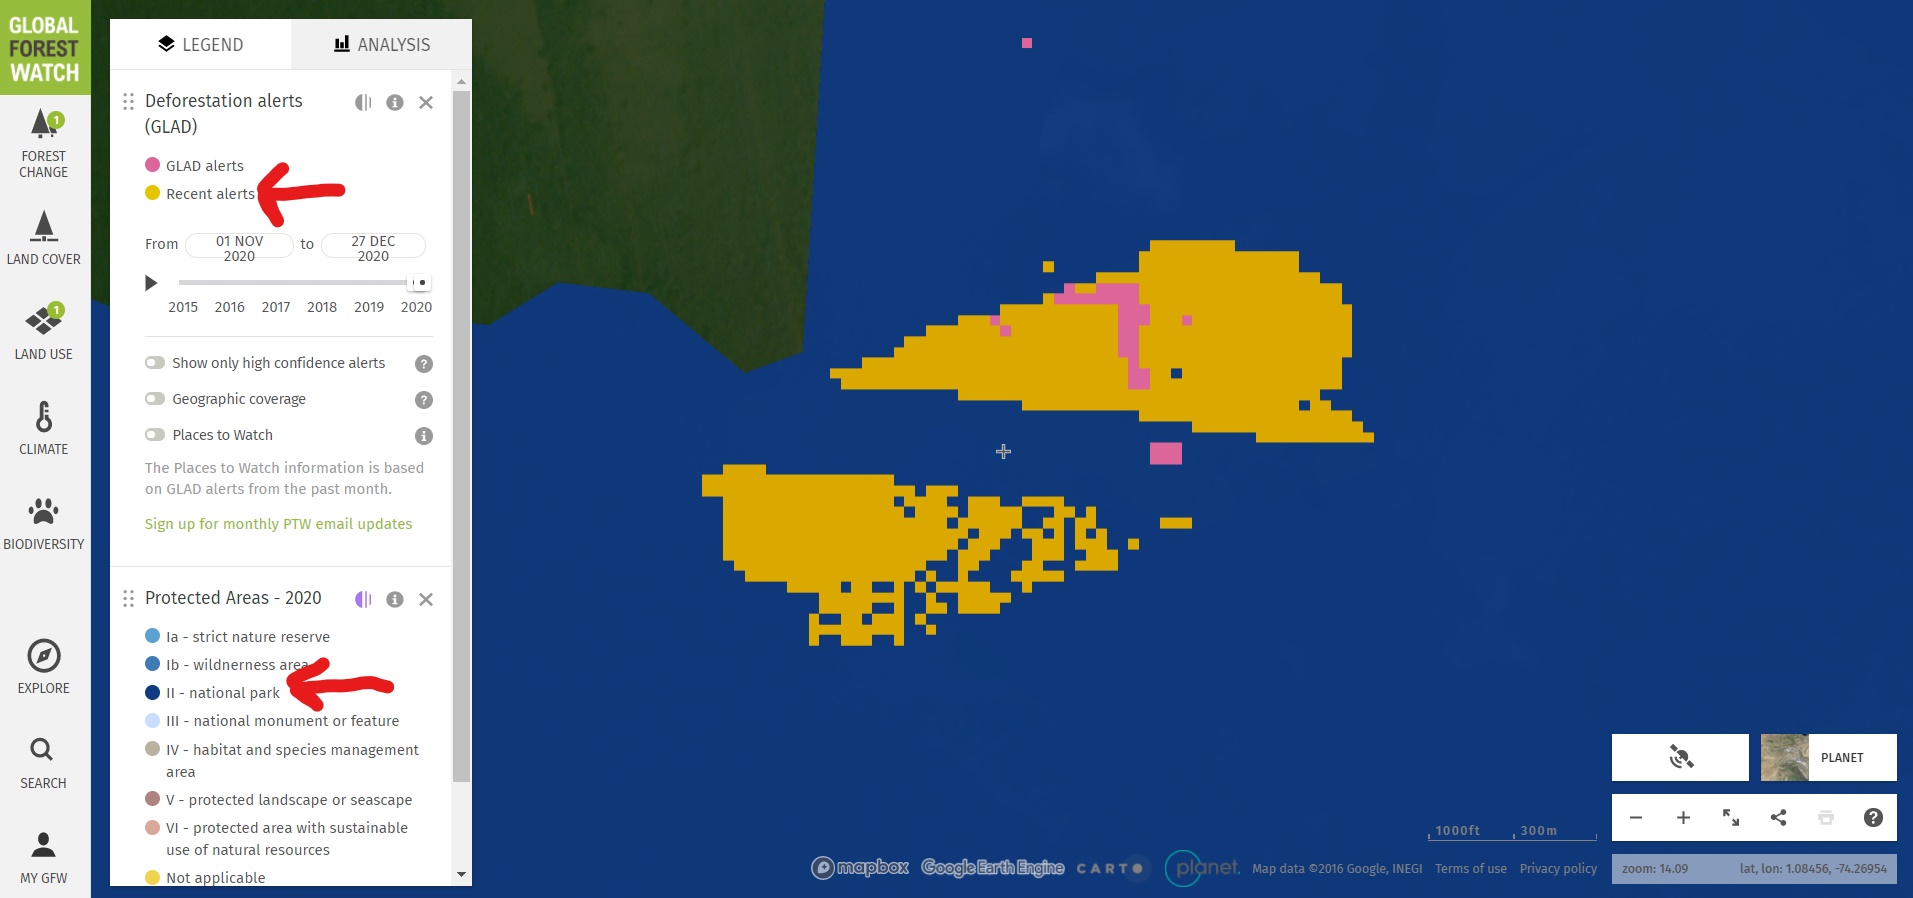
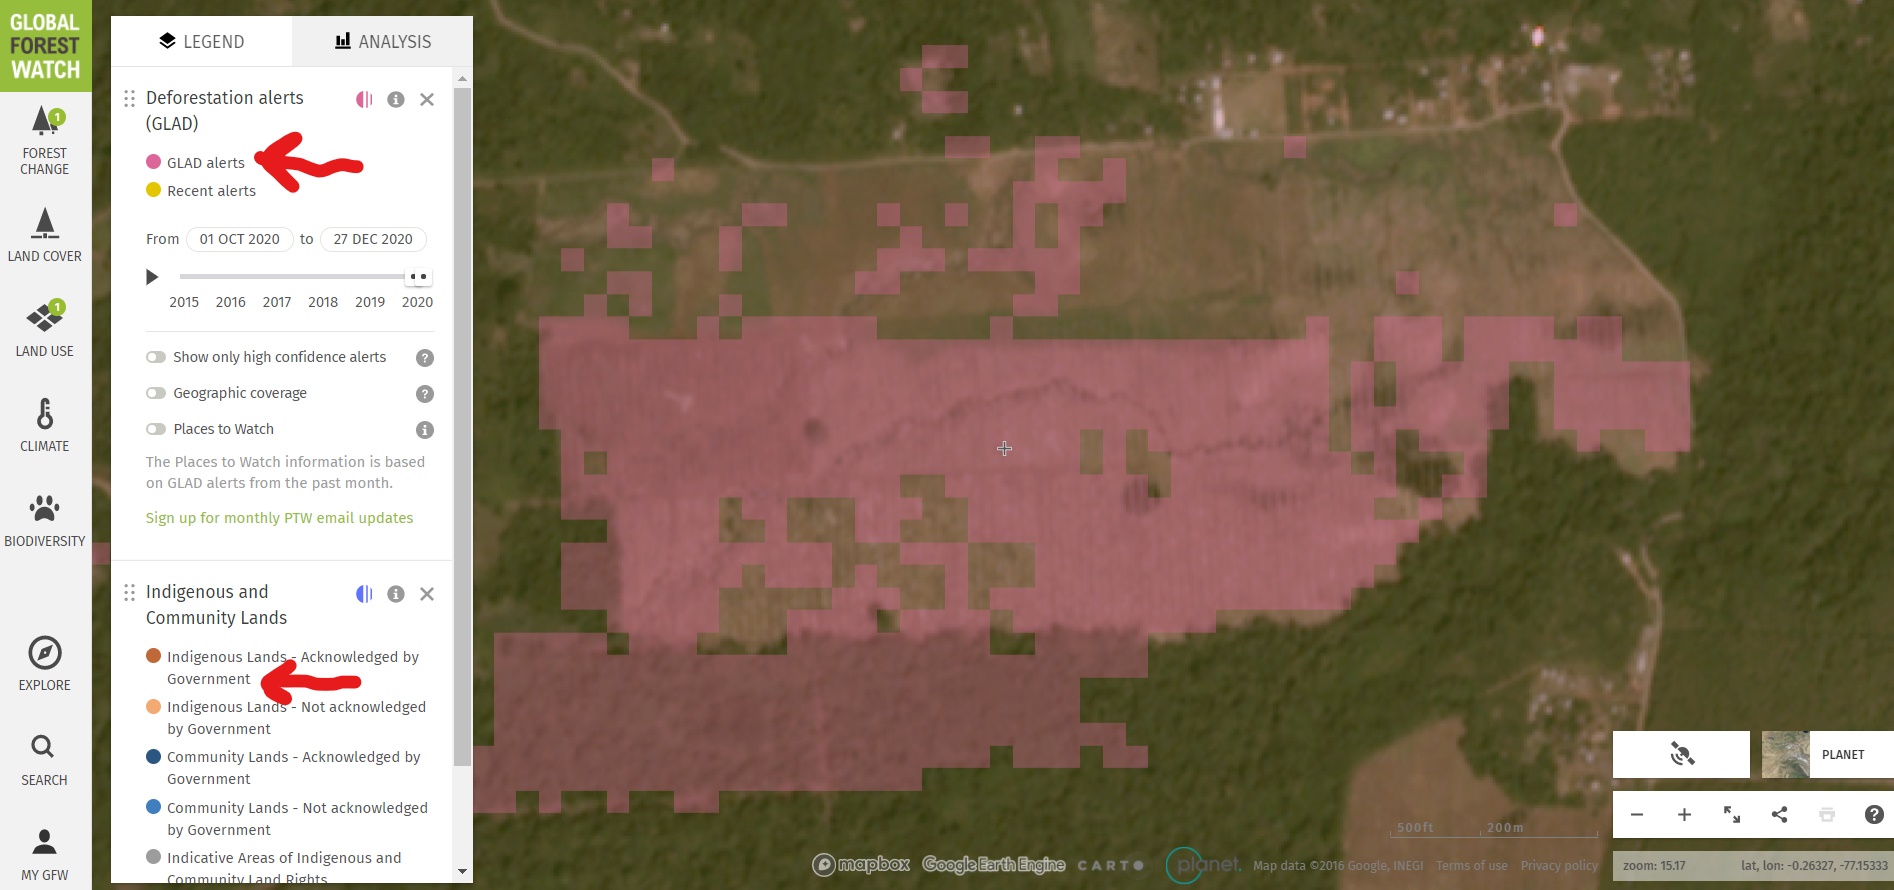
First, we detected recent forest loss alerts (known as GLAD alerts), in the northwestern sector of Chiribiquete National Park. Image 2 is a screen shot of our monitoring search in Global Forest Watch (link here).

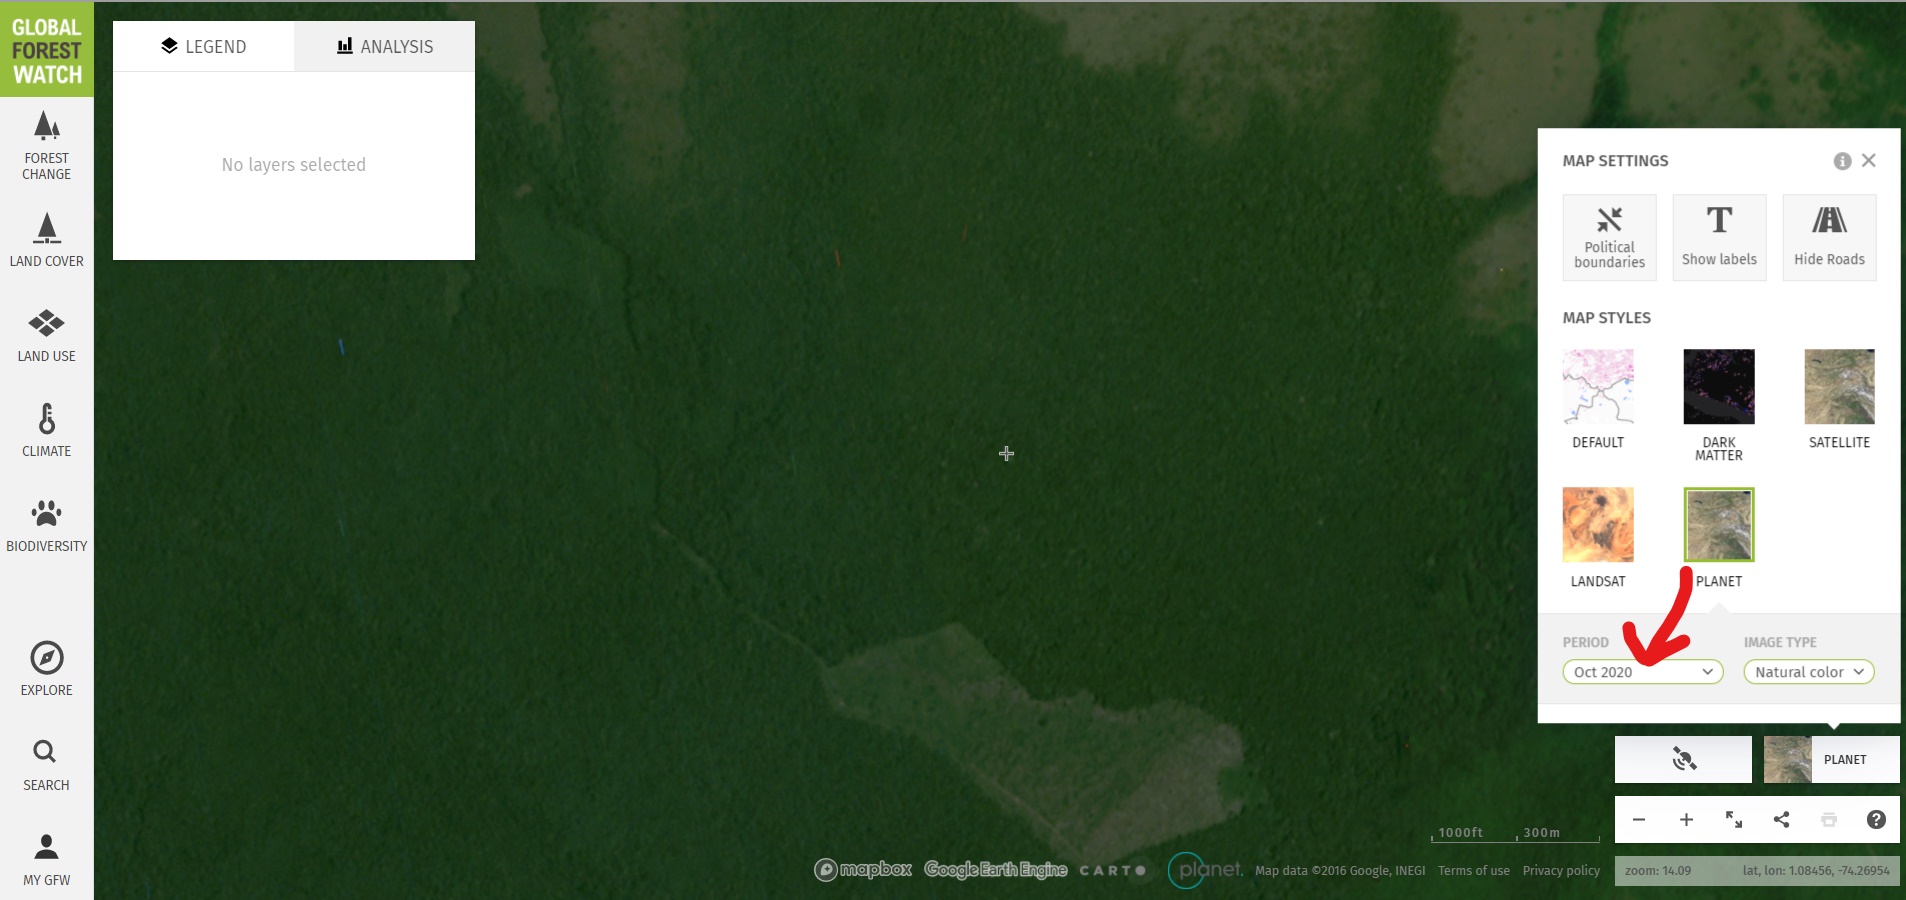
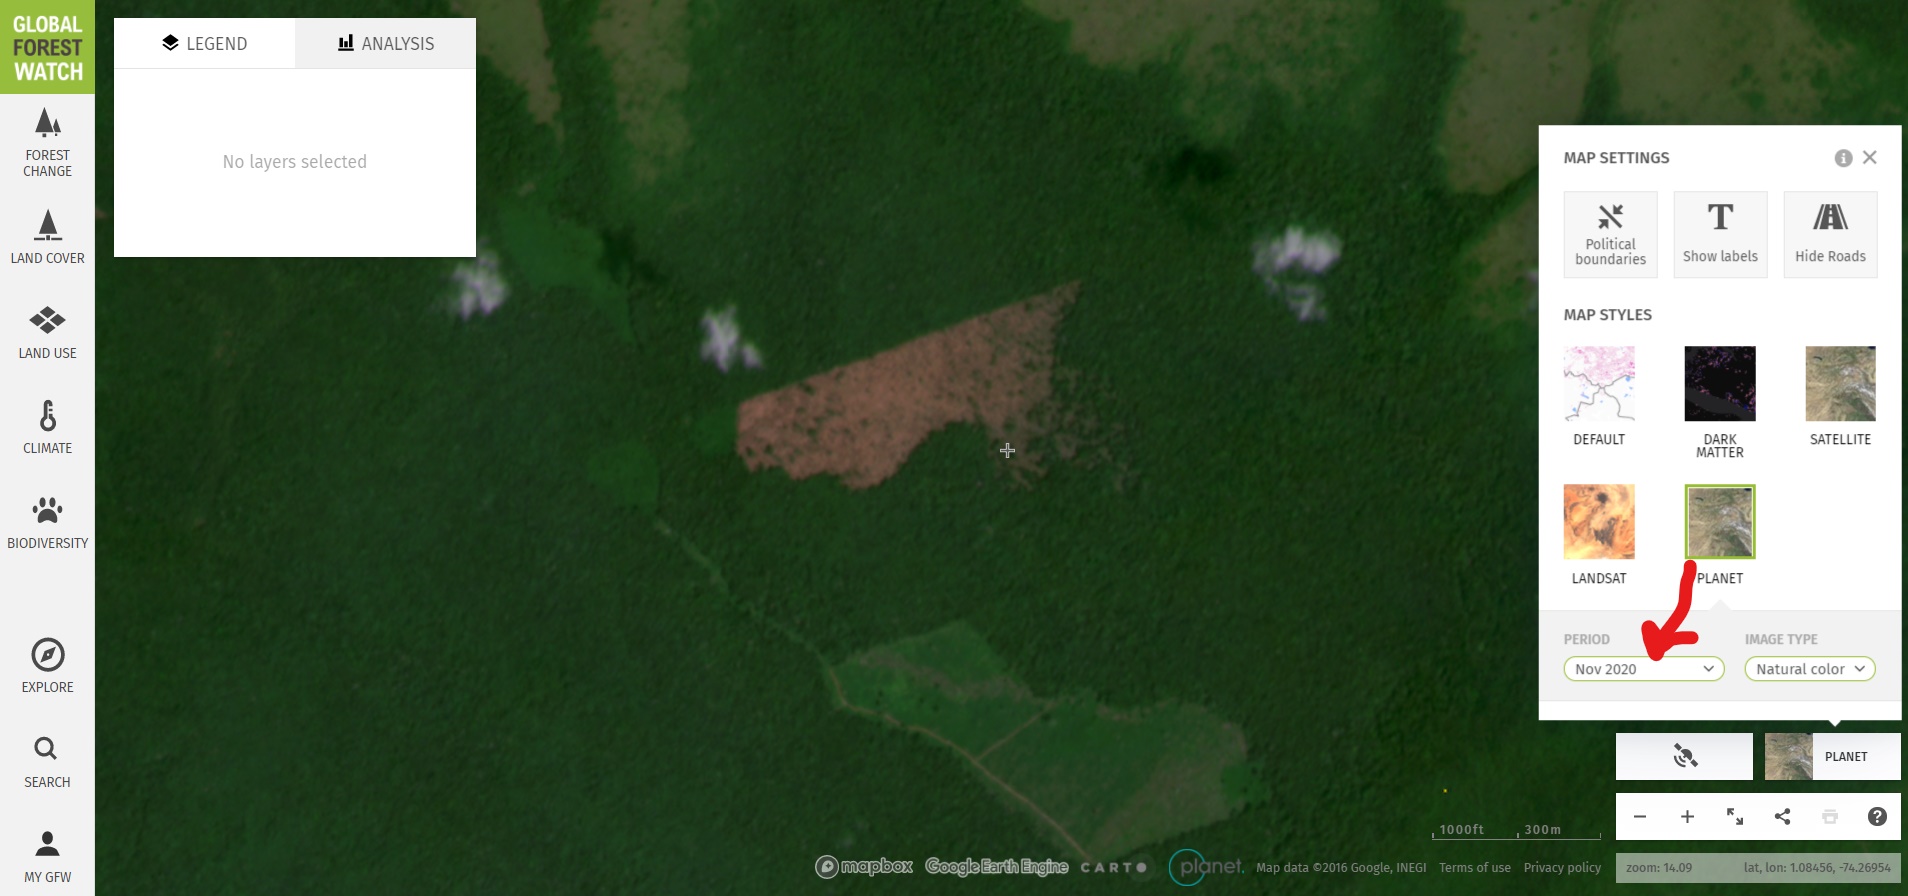
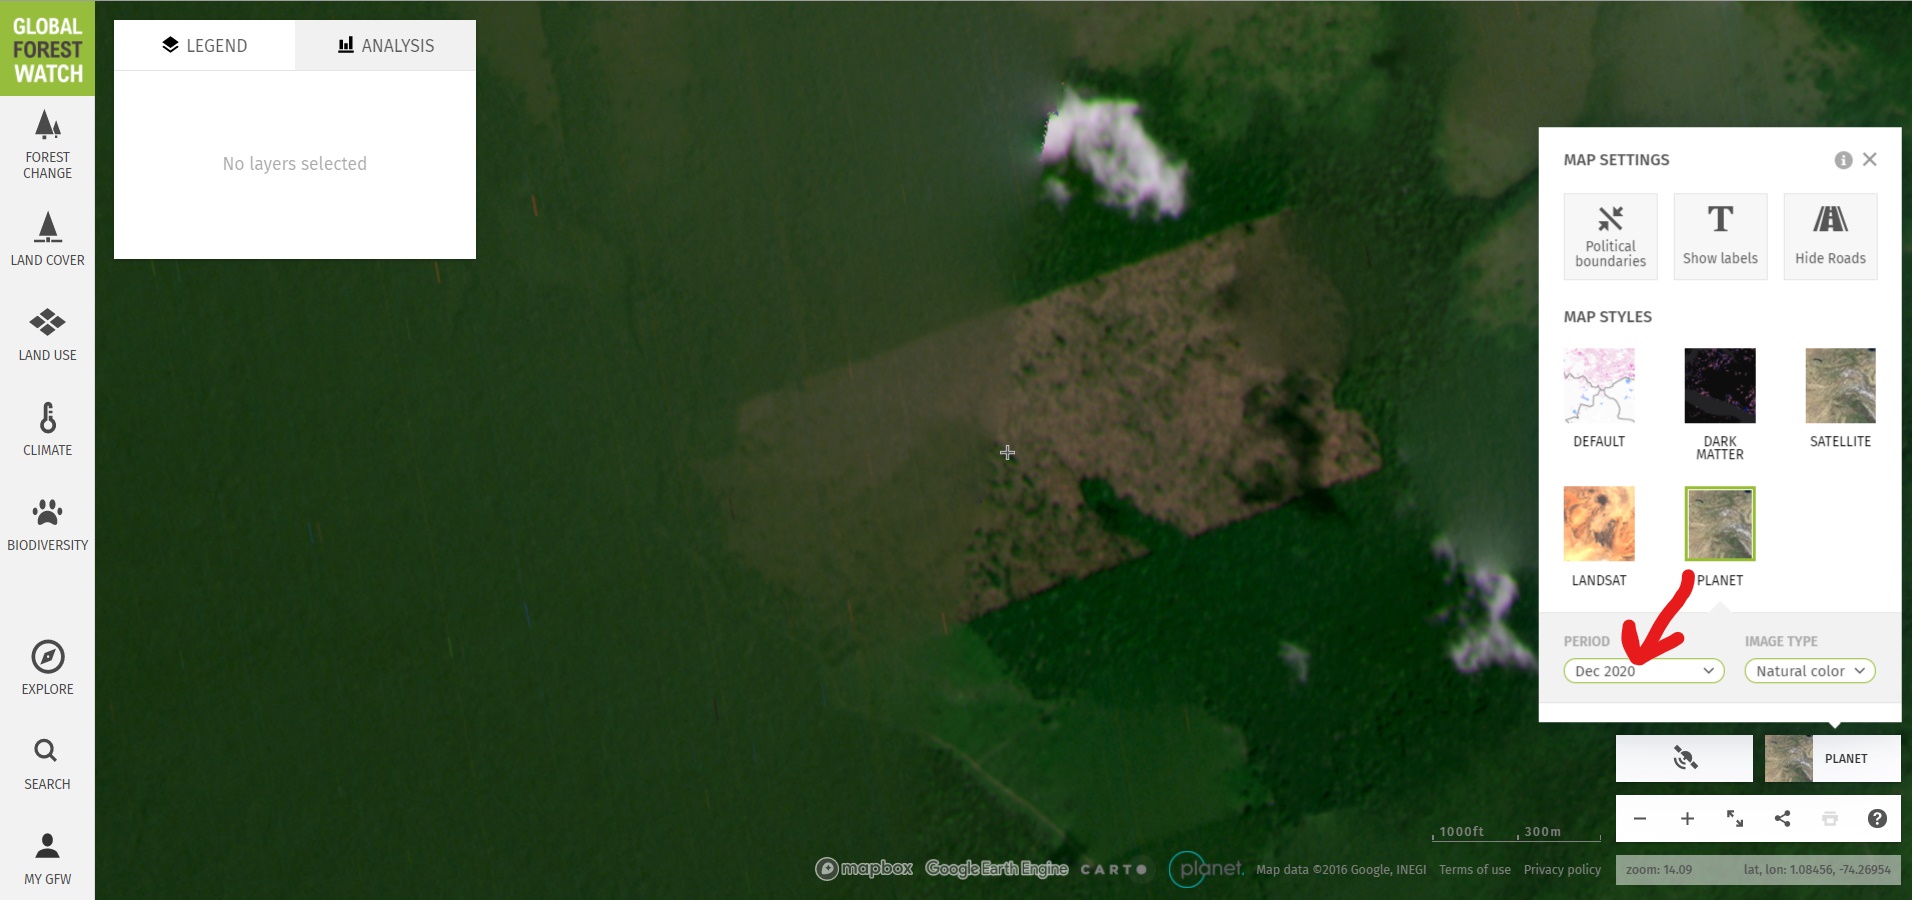
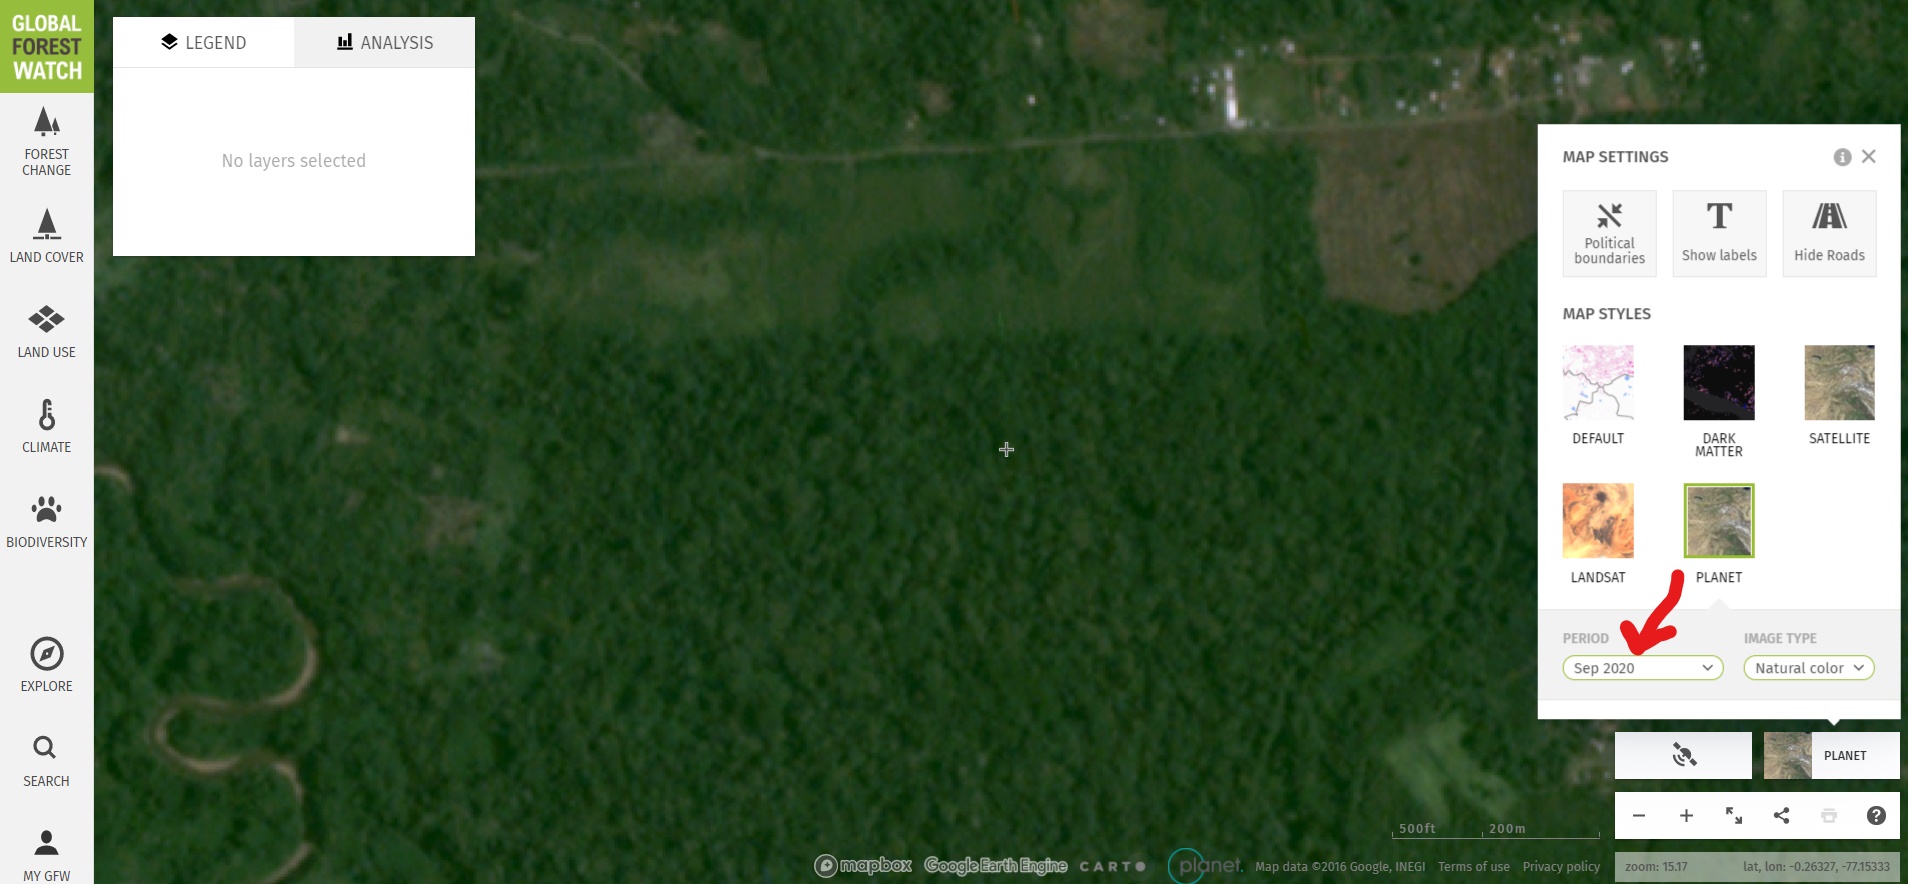
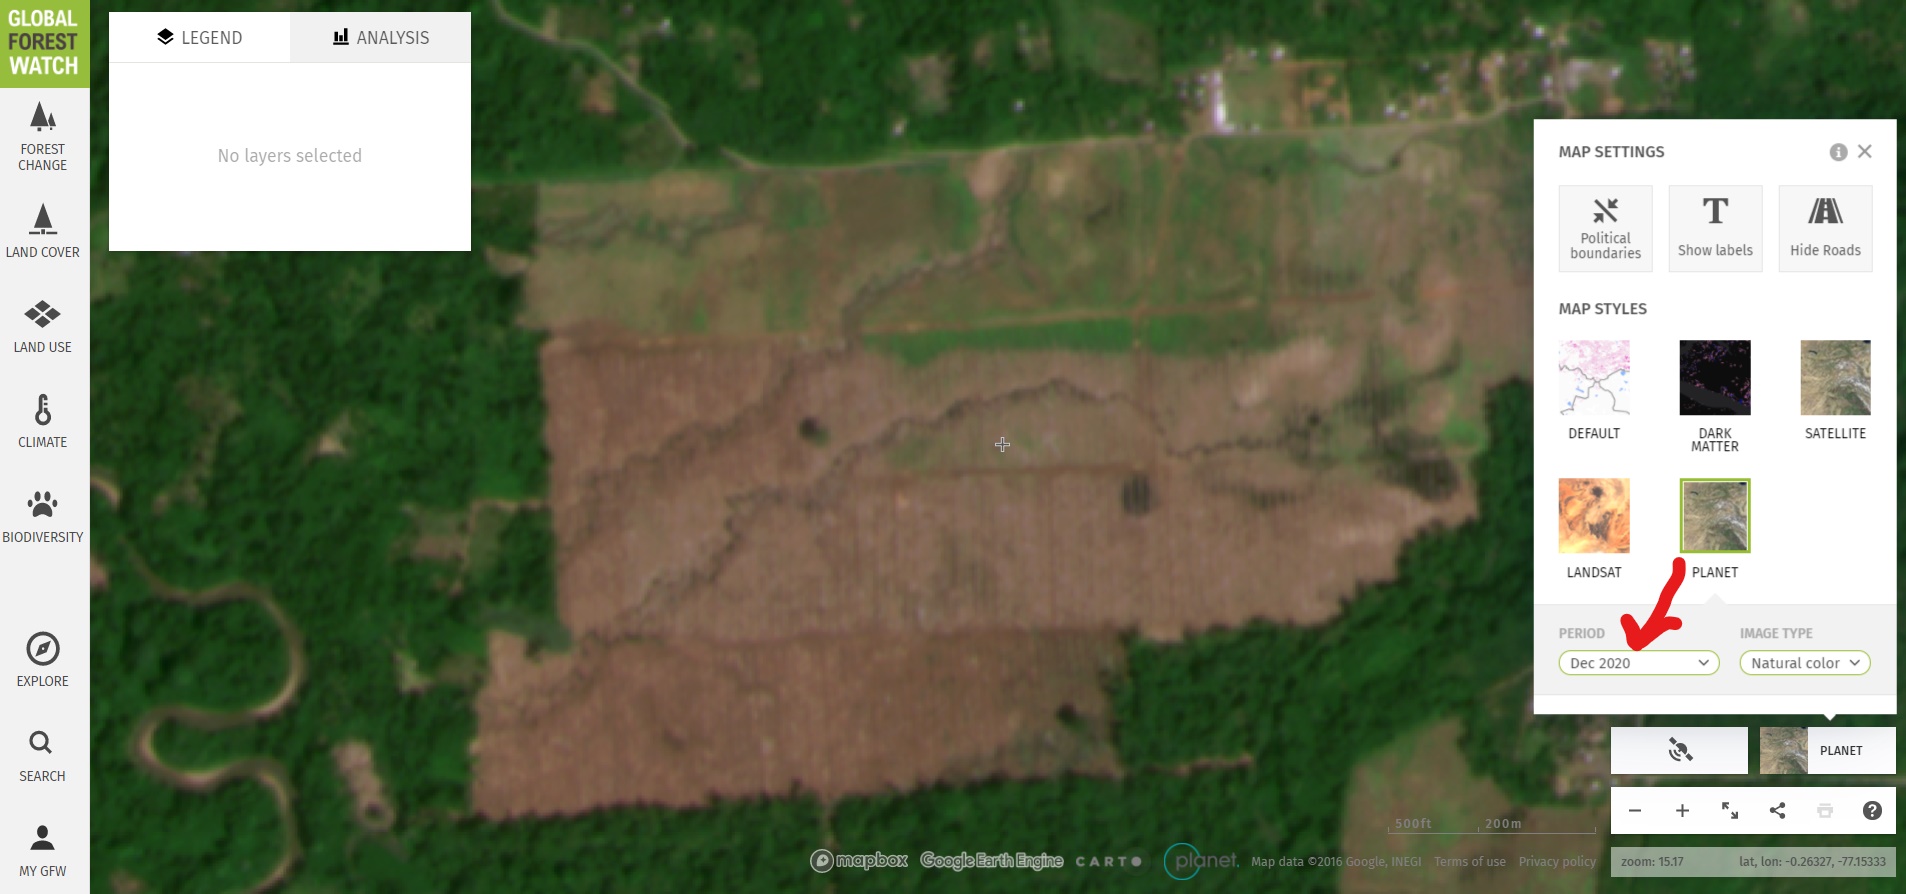
Second, we investigated the alerts with the freely available monthly Planet basemaps. Images 3-5 show the basemaps from October to December 2020. These images confirm that the area was covered in intact (likely primary) Amazon rainforest in October, and then experienced a major deforestation event (225 hectares) in November and December. Similar deforestation in the area appears to be conversion to cattle pasture. Note the crosshairs (+) represent the same point in all four images.

Image 2. Forest loss alerts in Chiribiquete National Park

Image 3. Monthly Planet basemap for October 2020 in Chiribiquete National Park.

Image 4. Monthly Planet basemap for November 2020 in Chiribiquete National Park.

Image 5. Monthly Planet basemap for December 2020 in Chiribiquete National Park.

Peruvian Amazon

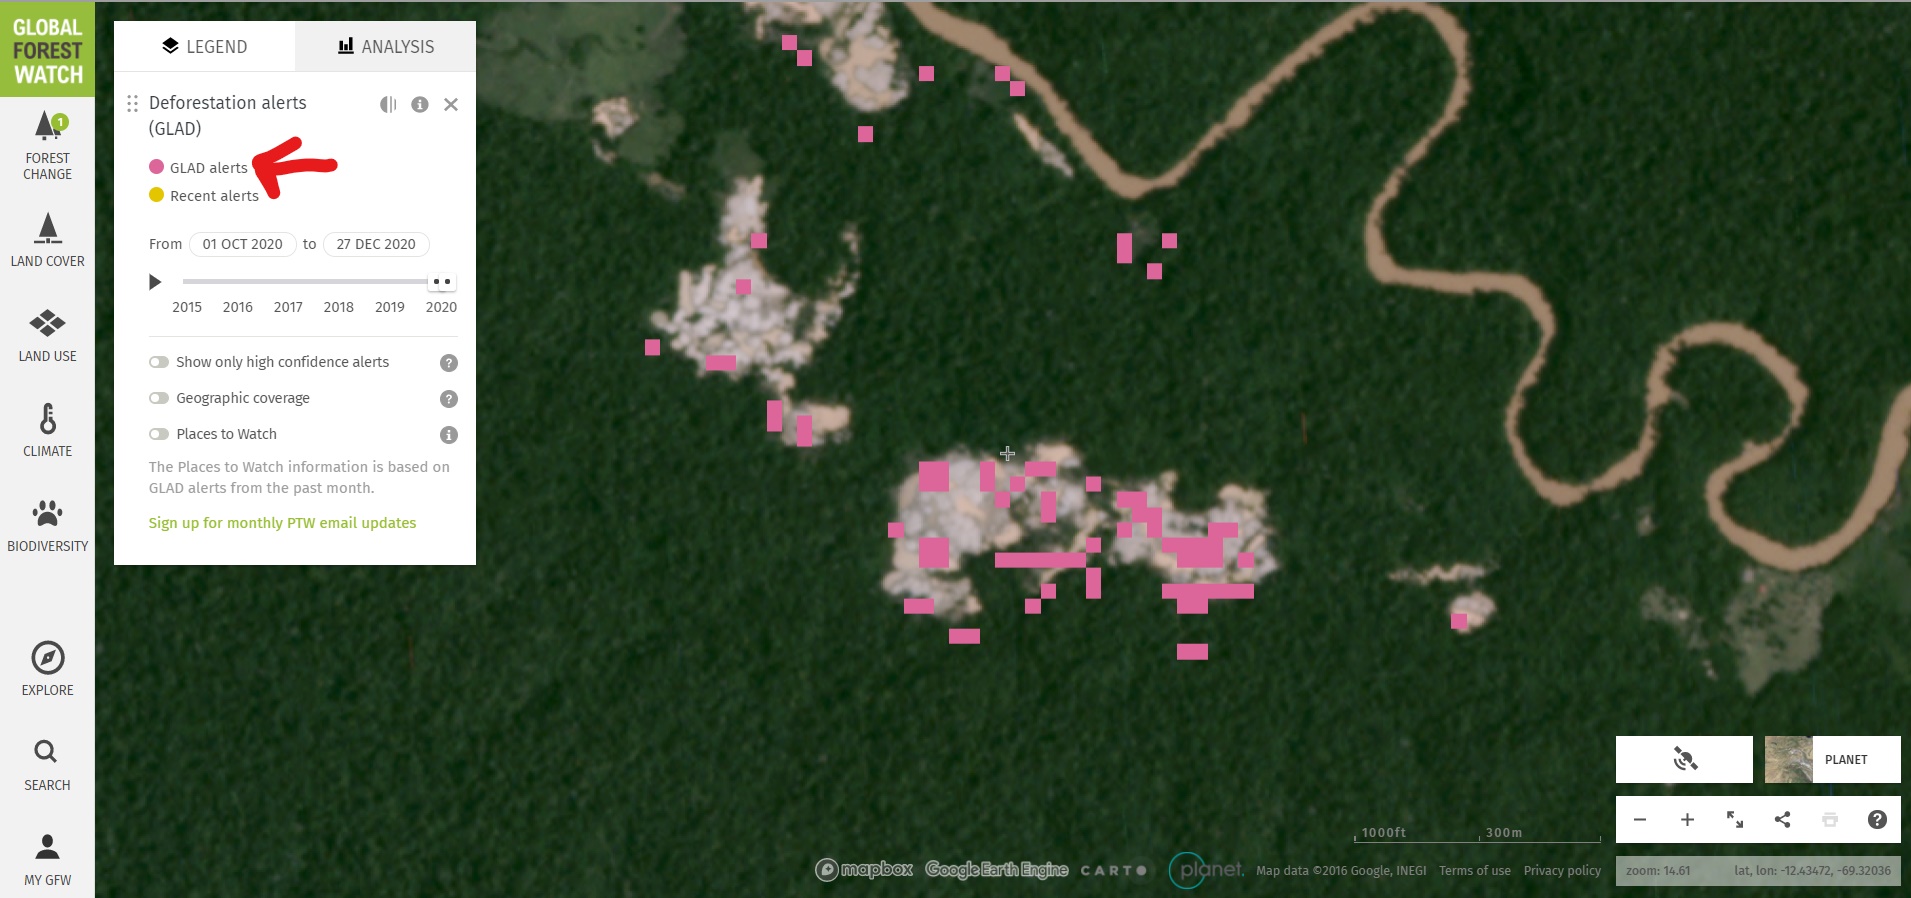
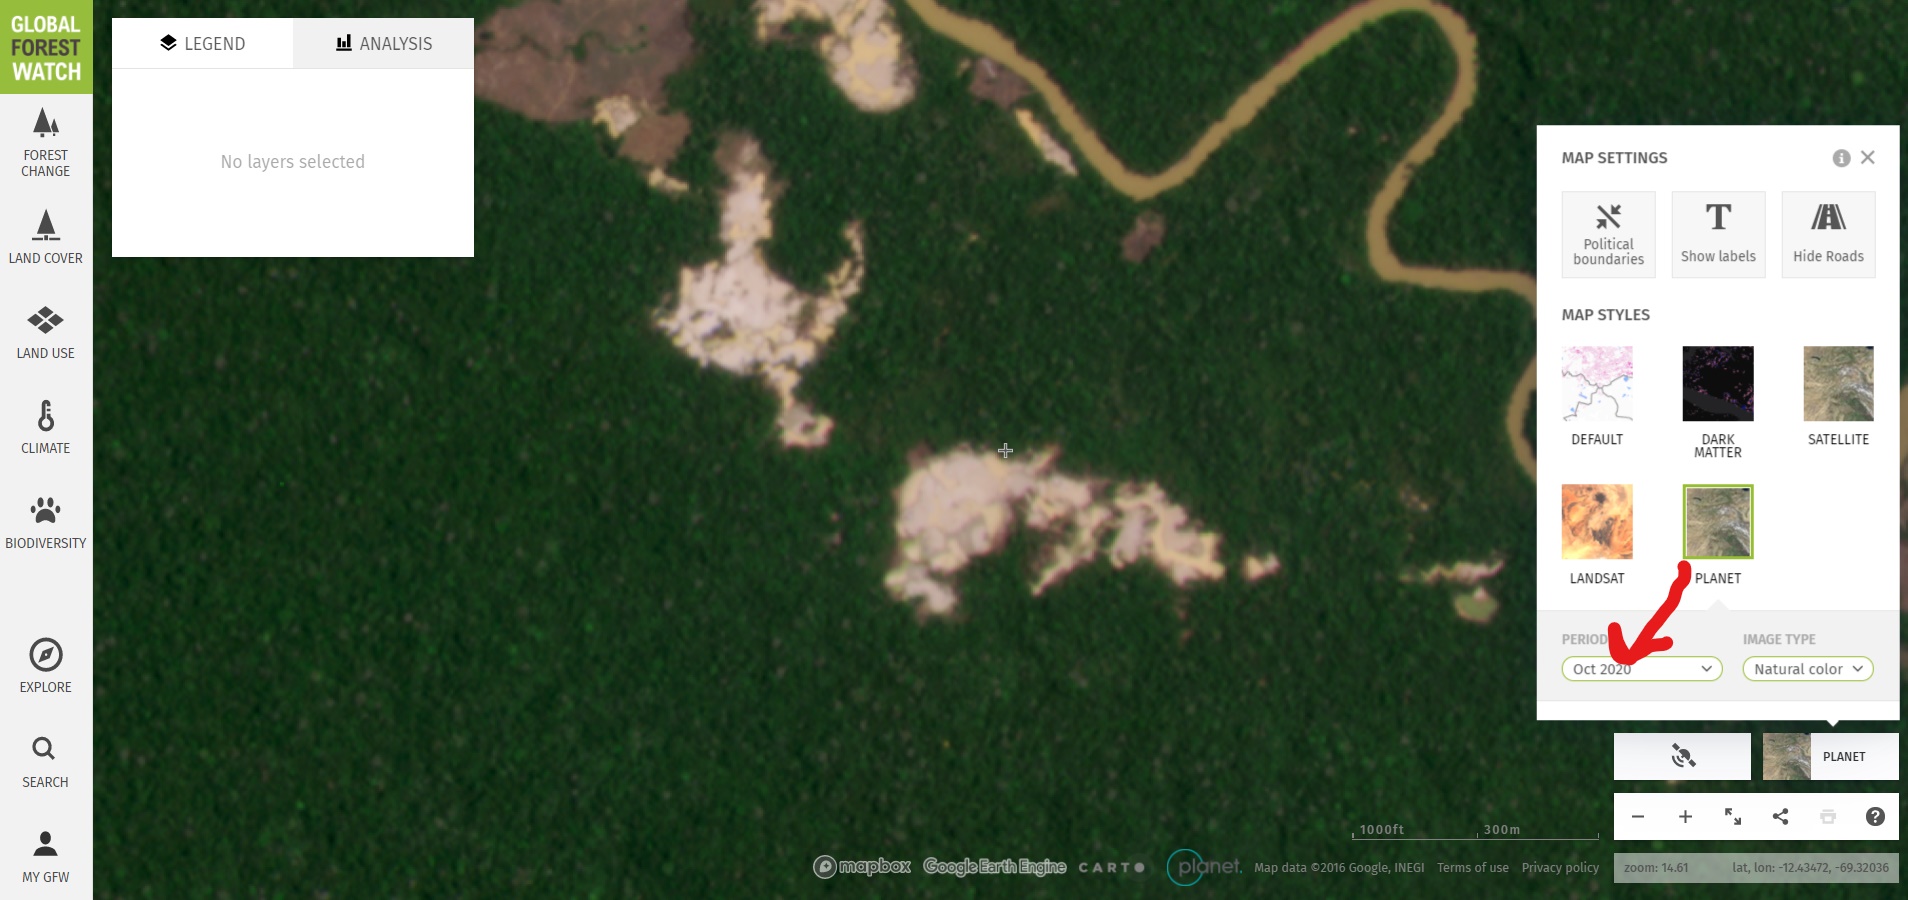
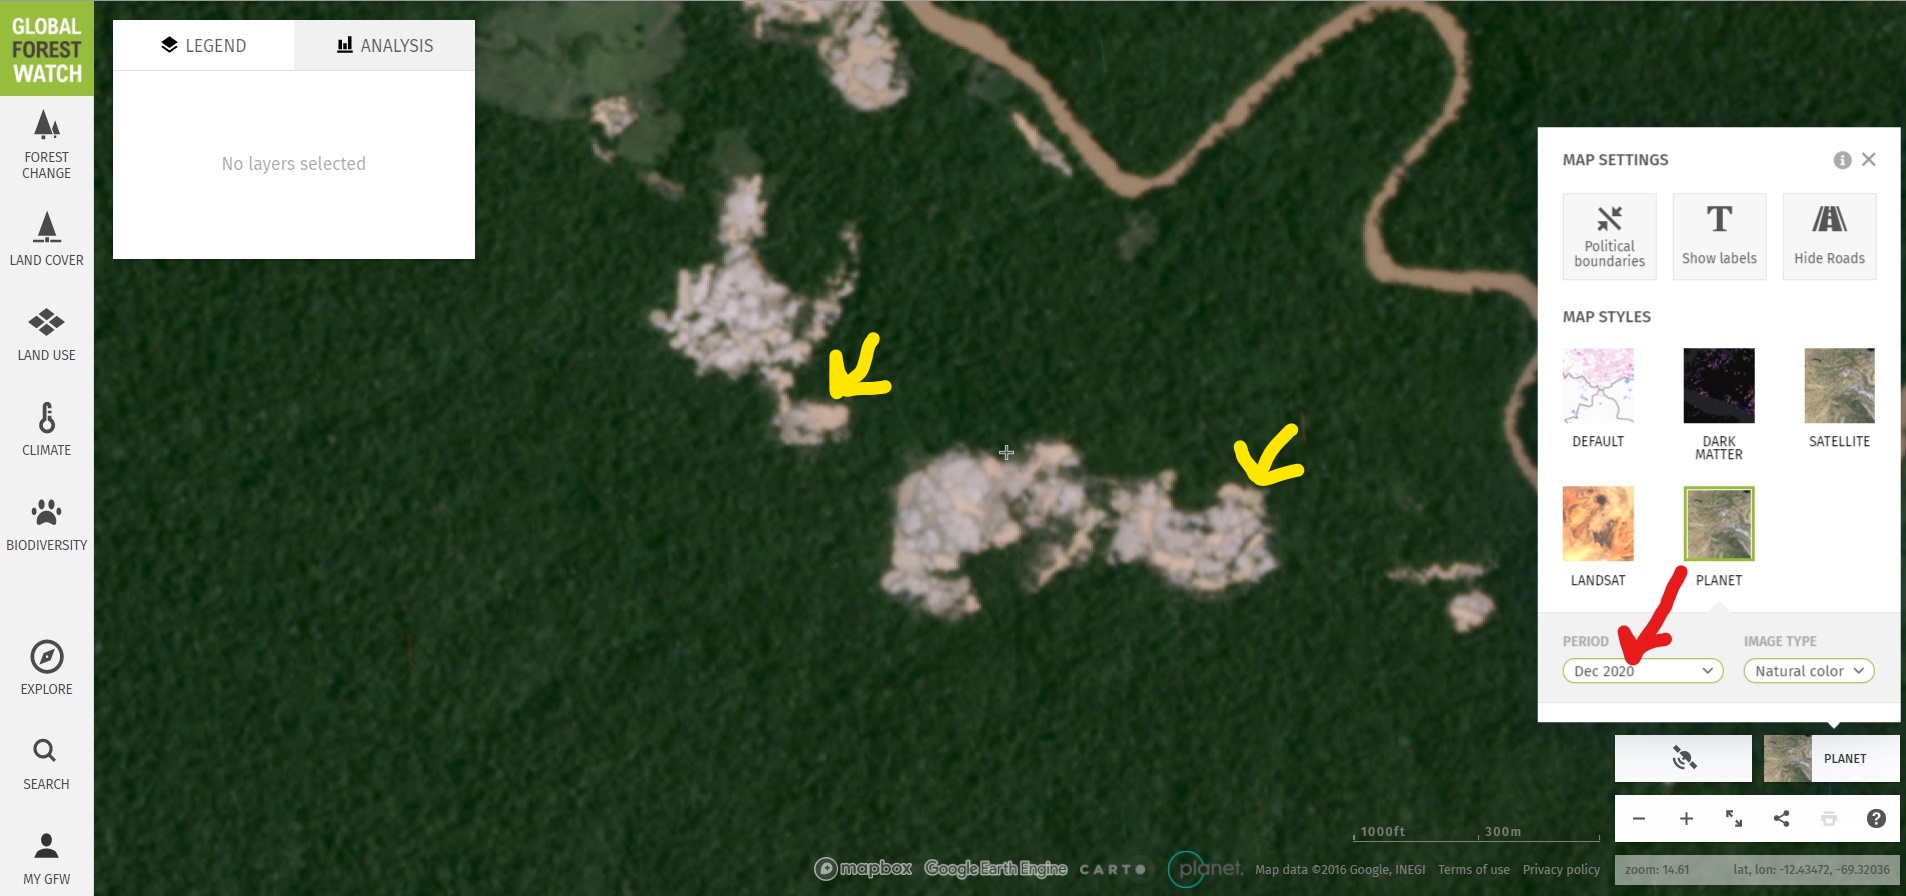
Similarly, we detected recent forest loss alerts in an illegal gold mining area in the southern Peruvian Amazon known as Pariamanu (Image 6). Images 7 & 8 show the monthly basemaps confirming the expansion of illegal mining deforestation between October and December (see yellow arrows). Global Forest Watch link here.

Image 6. Forest loss alerts in illegal gold mining zone (Pariamanu).

Image 7. Monthly Planet basemap for October 2020 in Pariamanu.

Image 8. Monthly Planet basemap for October 2020 in Pariamanu.

Ecuadorian Amazon

Finally, we detected recent forest loss alerts of 100 hectares in an indigenous territory (Kichwa) surrounding an oil palm plantation in the Ecuadorian Amazon (Image 9). Images 10 & 11 show the monthly basemaps confirming large-scale deforestation between September and December, likely for the expansion of the plantation. Note the crosshairs (+) represents the same point in all three images. Global Forest Watch link here.

Image 9. Forest loss alerts in the Ecuadorian Amazon.

Image 10. Monthly Planet basemap for September 2020 in Ecuadorian Amazon.

Image 11. Monthly Planet basemap for December 2020 in Ecuadorian Amazon.

Summary

In summary, we show a major advance for free and real-time deforestation monitoring thanks to an agreement between the Government of Norway and satellite companies.* A key aspect of this agreement is making publically available (such as on Global Forest Watch) monthly basemaps created by the innovative satellite company Planet. Thus, users can now freely visualize recent forest loss alerts and then investigate them with high-resolution monthly basemaps on On Global Forest Watch. MAAP illustrated this process with three examples in the Colombian, Peruvian, Ecuadorian Amazon, respectively.

*Notes 

In September 2020, Norway’s Ministry of Climate and Environment entered into a contract with Kongsberg Satellite Services (KSAT) and its partners Planet and Airbus, to provide universal access to high-resolution satellite monitoring of the tropics in order to support efforts to stop the destruction of the world’s rainforests. This effort is led by Norway’s International Climate and Forest Initiative (NICFI). The basemaps are mosaics of the best cloud-free pixels each month. In addition to viewing the monthly basemaps on Global Forest Watch, users can sign up with Planet directly at this link: https://www.planet.com/nicfi/

Acknowledgements

We thank M. Cohen (ACA), M. Weisse (WRI/GFW), E. Ortiz (AAF) and G. Palacios for their helpful comments on this report.

This work was supported by NORAD (Norwegian Agency for Development Cooperation).

Citation

Finer M, Mamani N (2020) Power of Freely Available, High-resolution Satellite Imagery from Norway Agreement. MAAP: 131.