In part 1 of this series (MAAP #215), we introduced a critical new dataset (Planet’s Forest Carbon Diligence) with wall-to-wall estimates for aboveground carbon at an unprecedented 30-meter resolution between 2013 and 2022. This data uniquely merges machine learning, satellite imagery, airborne lasers, and a global biomass dataset from GEDI, a NASA mission.
In part 2 (MAAP #217), we highlighted which parts of the Amazon are currently home to the highest (peak) aboveground carbon levels and the importance of protecting these high-integrity forests (see Annex 1).
Here, in part 3, we focus on aboveground carbon loss and gain across the Amazon over the 10 years for which we have data (2013-22; see Base Map below).
The Amazon loses carbon to the atmosphere due to deforestation, logging, human-caused fires, and natural disturbances, while it gains carbon from forest regeneration and old-growth forests continuing to sequester atmospheric carbon.4
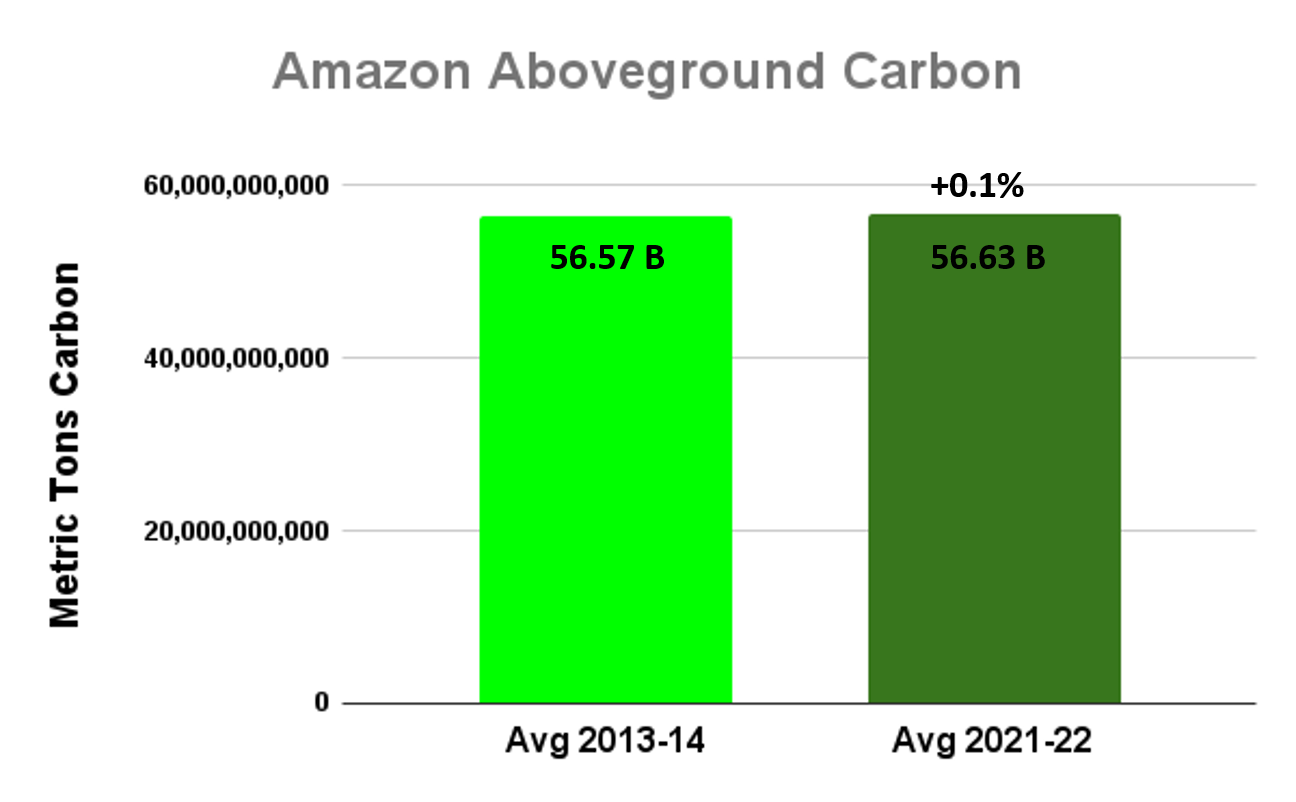
Overall, we find that the Amazon still narrowly functions as a carbon sink (meaning the carbon gain is greater than the loss) during this period, gaining 64.7 million metric tons of aboveground carbon between 2013 and 2022 (see Graph 1).
This finding underscores the importance of both primary and secondary forests in countering widespread deforestation. Moreover, it highlights the critical potential of primary forests to continue accumulating carbon if left undisturbed.
This gain, however, is quite small relative to the total 56.8 billion metric tons of aboveground carbon contained in the Amazon biome (that is, a gain of just +0.1%), reinforcing concerns that the Amazon could flip to a carbon source in the coming years (with carbon loss becoming greater than its gain) due to increasing deforestation, degradation, and fires.1 See Annex 2 for more details, including how the Amazon became a carbon sink following the 2015 drought, but since rebounded.
The countries with the largest carbon gain are 1) Brazil, 2) Colombia, 3) Suriname, 4) Guyana, and 5) French Guiana. In contrast, the countries with the greatest carbon loss are 1) Bolivia, 2) Venezuela, 3) Peru, and 4) Ecuador.
Zooming in to the site level yields additional insights. For example, we can now estimate the carbon loss from major deforestation events across the Amazon from 2013 to 2022. On the flip side, we can also calculate the carbon gain from both secondary and primary forests.
Areas with carbon gain in intact areas indicate excellent candidates for the High Integrity Forest (HIFOR) initiative, a new financing instrument uniquely focused on maintaining intact tropical forests.2 Importantly, a HIFOR unit represents a hectare of high-integrity tropical forest within a high-integrity landscape that has been “well-conserved” for over a decade.3 Intact areas with carbon gain between 2013-22 may indicate decadally “well-conserved” areas that can be overlapped with areas of high ecological integrity.
Below, we illustrate these findings with a series of novel maps zooming in on emblematic cases of large carbon loss and gain across the Amazon from 2013 – 2022. These cases include forest loss driven by agriculture, gold mining, and roads, as well as forest gain in remote primary forests.
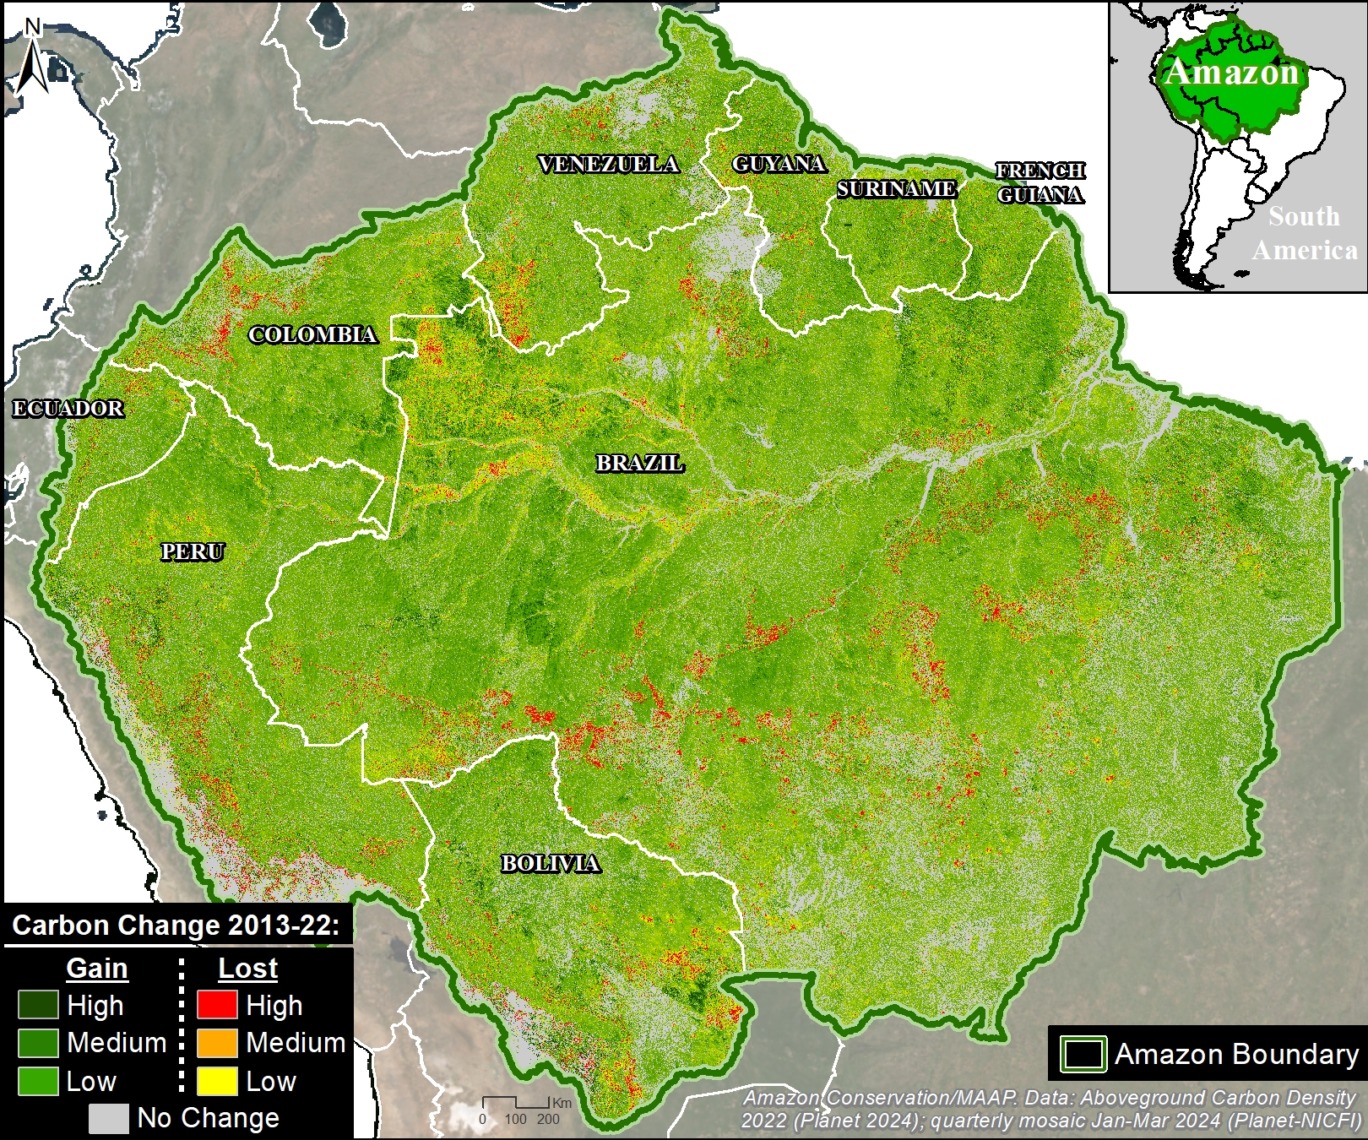
Base Map – Amazon Carbon Loss & Gain (2013-2022)
The Base Map shows wall-to-wall estimates of aboveground carbon loss and gain across the Amazon between 2013 and 2022.
Carbon loss is indicated by yellow to red, indicating low to high carbon loss. Carbon gain is indicated by light to dark green, indicating low to high carbon gains.
Below, we present a series of notable cases of high carbon loss and gain indicated in Insets A-I.
Emblematic Cases of Carbon Loss & Gain
Figure 1 highlights emblematic cases of carbon loss (Insets A-F in red) and carbon gain (Insets G-I in green). Below we highlight a series of emblematic cases.
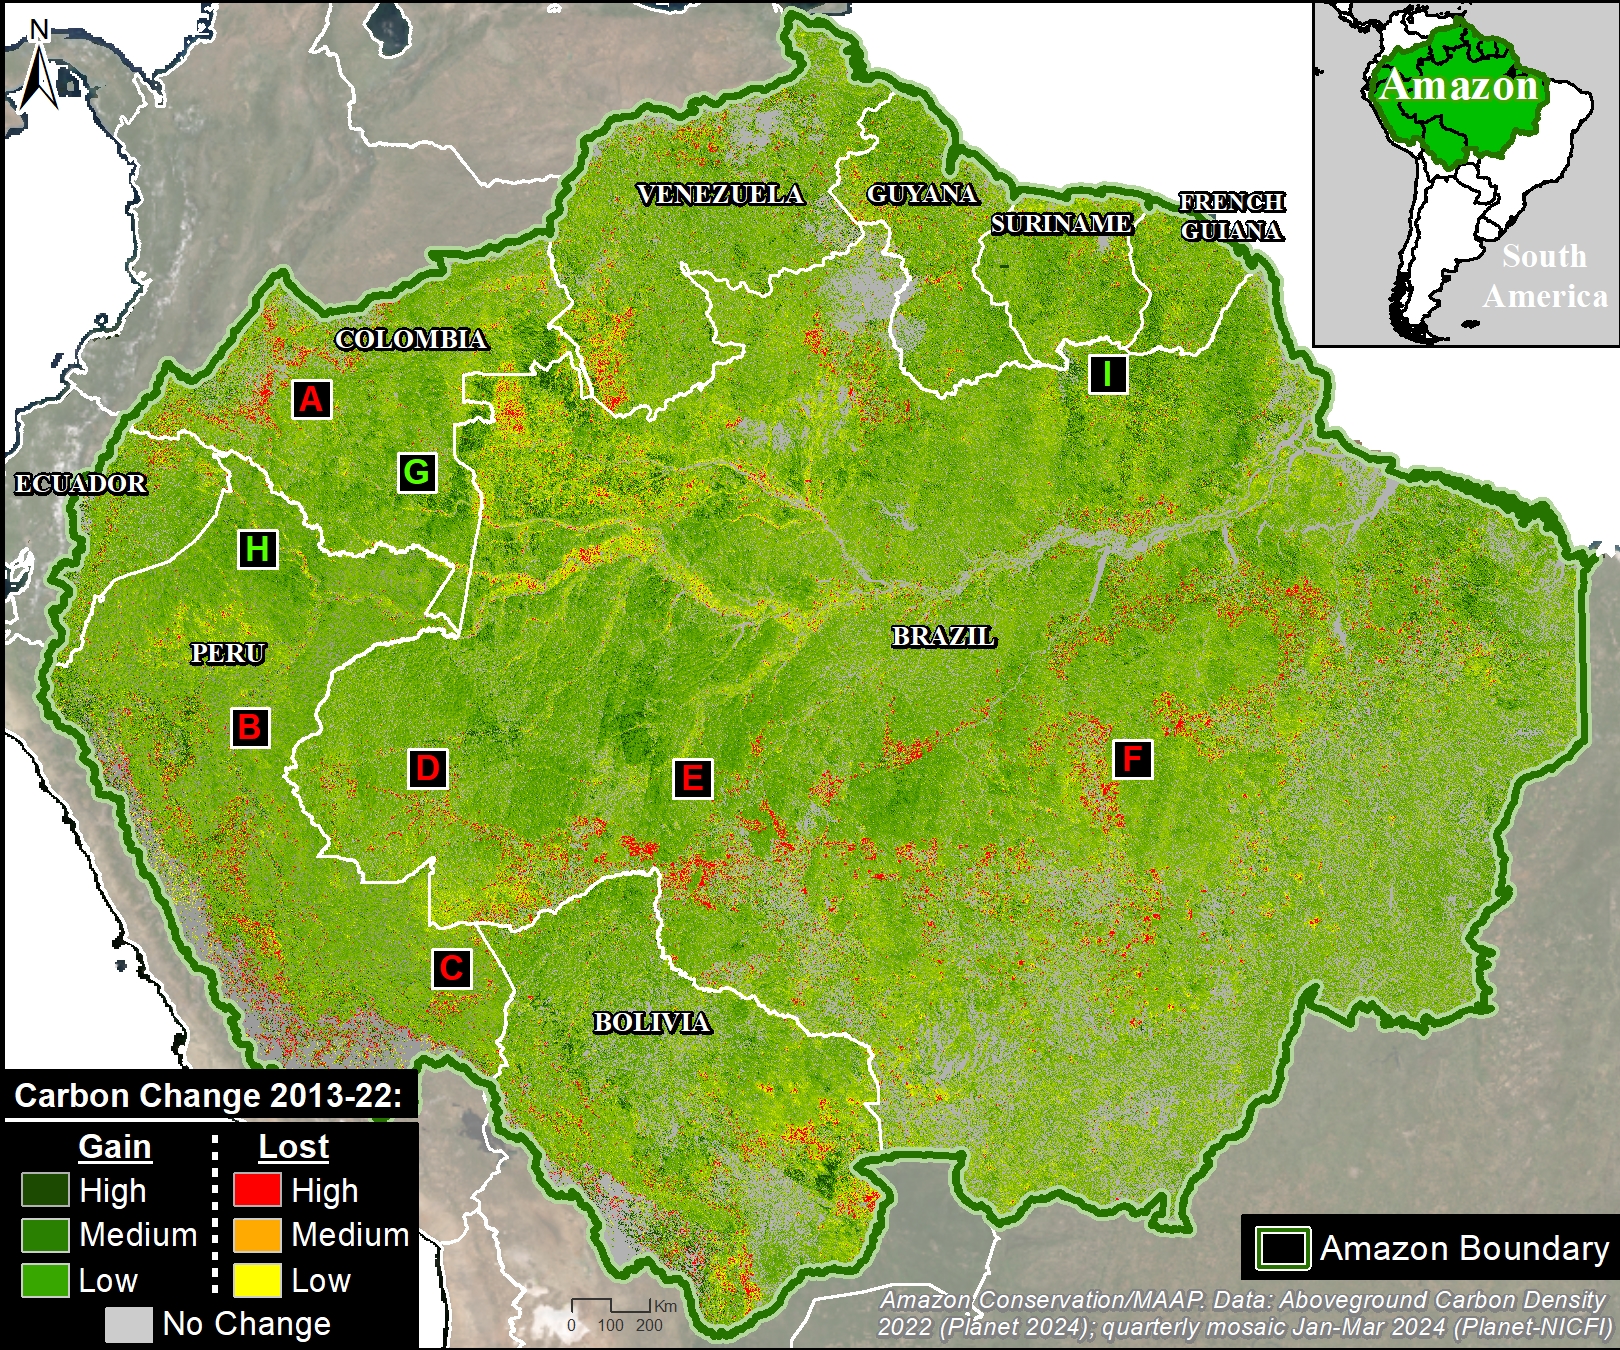
Carbon Loss
We can now estimate the carbon loss from major deforestation events across the Amazon during the past ten years, directly from a single dataset. These cases include forest loss from agriculture, gold mining, and roads. Note that the presented values represent just the carbon loss featured in the selected area.
A. Colombia – Arc of Deforestation
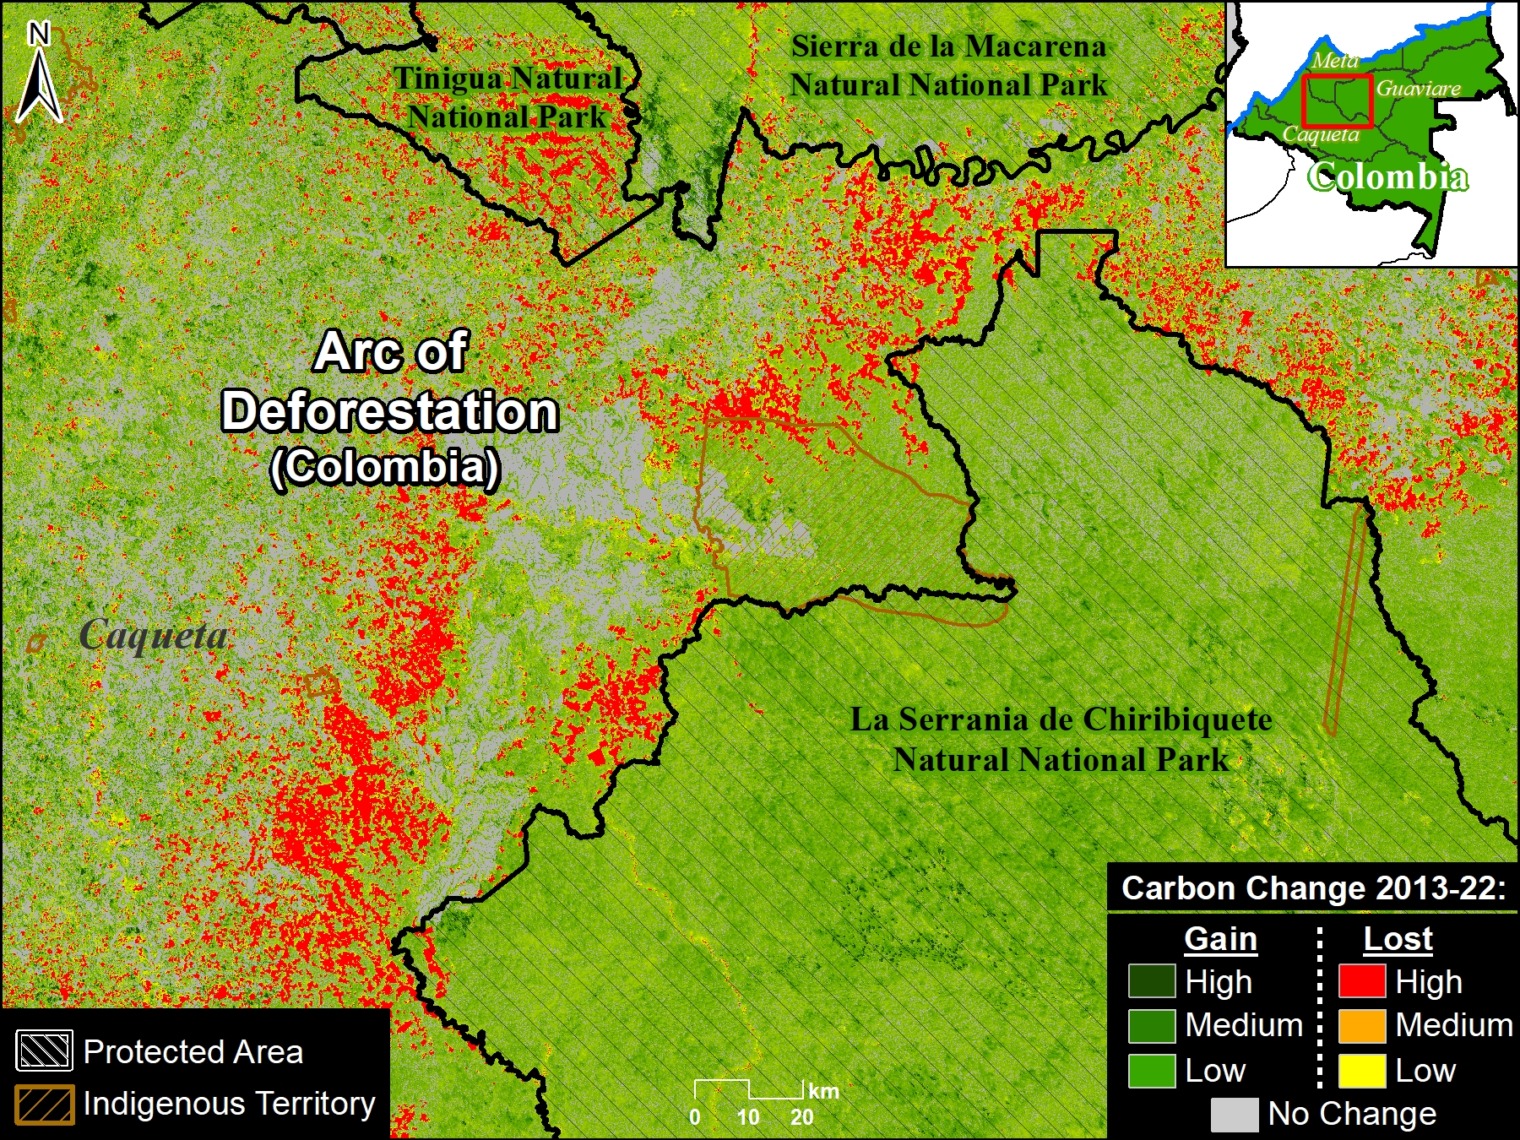
Figure 1A shows the extensive carbon emissions (39.5 million metric tons) associated with the major deforestation within and surrounding protected areas and Indigenous territories in the Colombian Amazon‘s arc of deforestation.
The carbon loss within the protected areas and Indigenous territories is likely from illegal deforestation.
See MAAP #211 for more details.
B. Peru – Mennonite Colonies
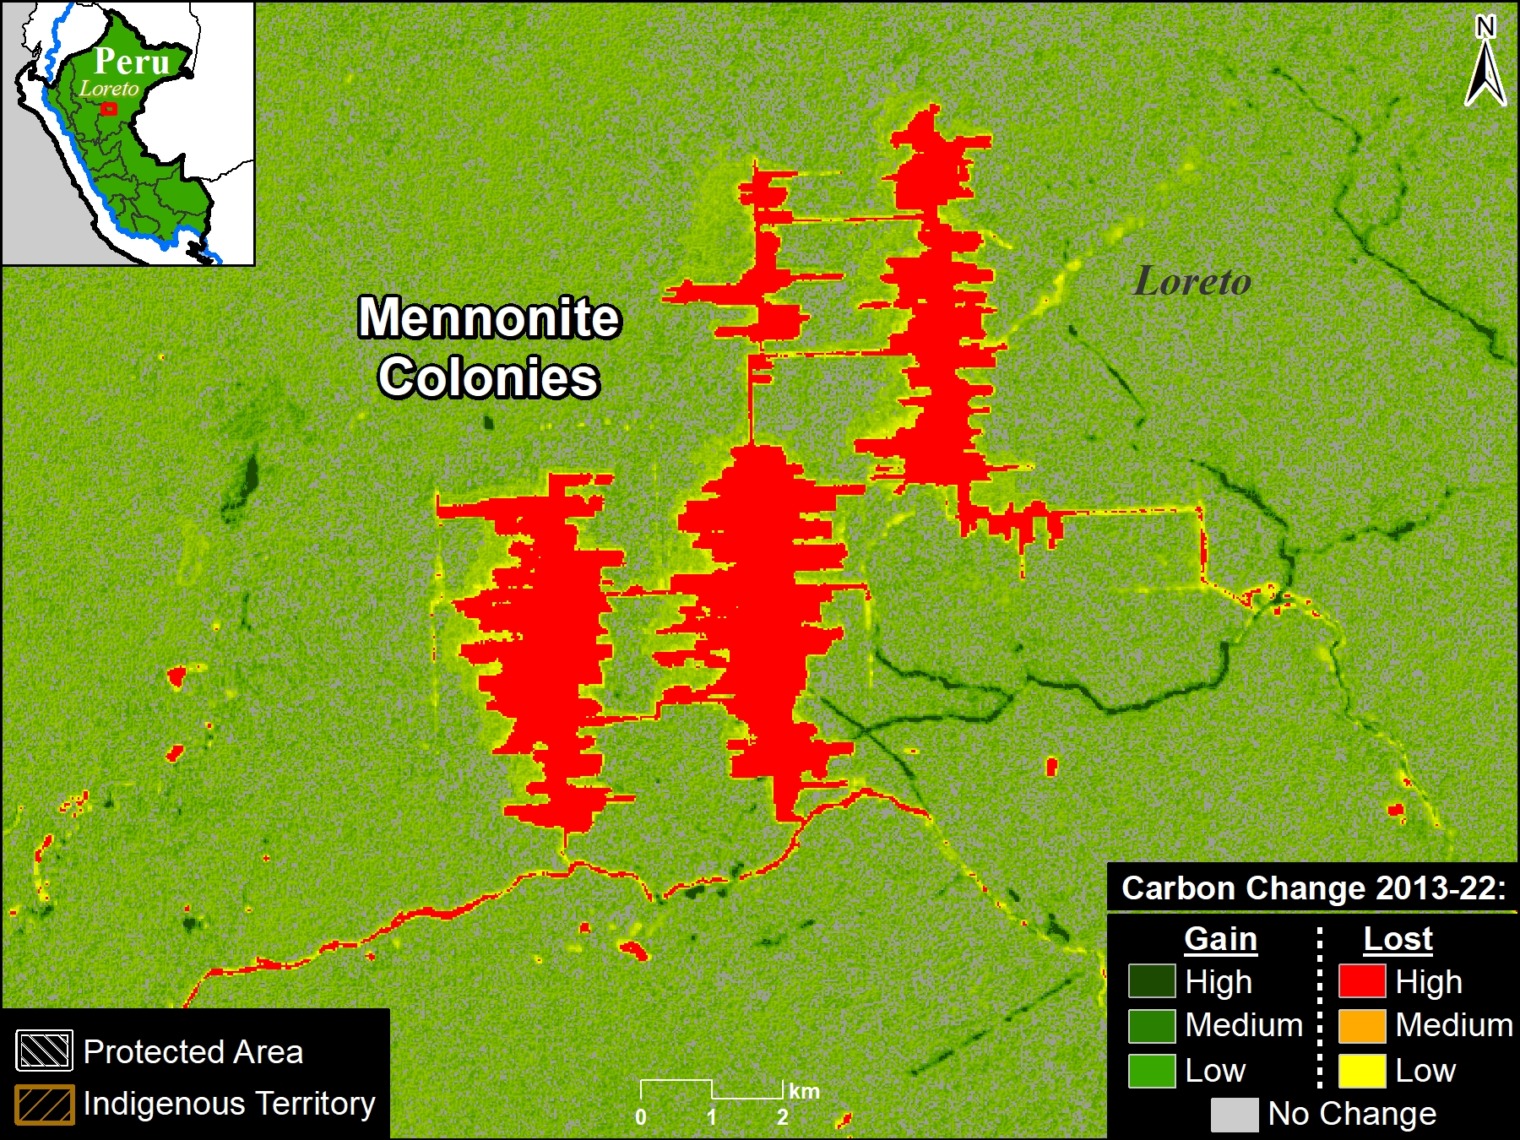
Figure 1B shows the carbon emissions of 224,300 metric tons associated with the recent deforestation carried out by new Mennonite colonies arriving in the central Peruvian Amazon starting in 2017.
See MAAP #188 for more details, including information regarding the legality of the deforestation causing the carbon loss.
C. Peru – Gold Mining
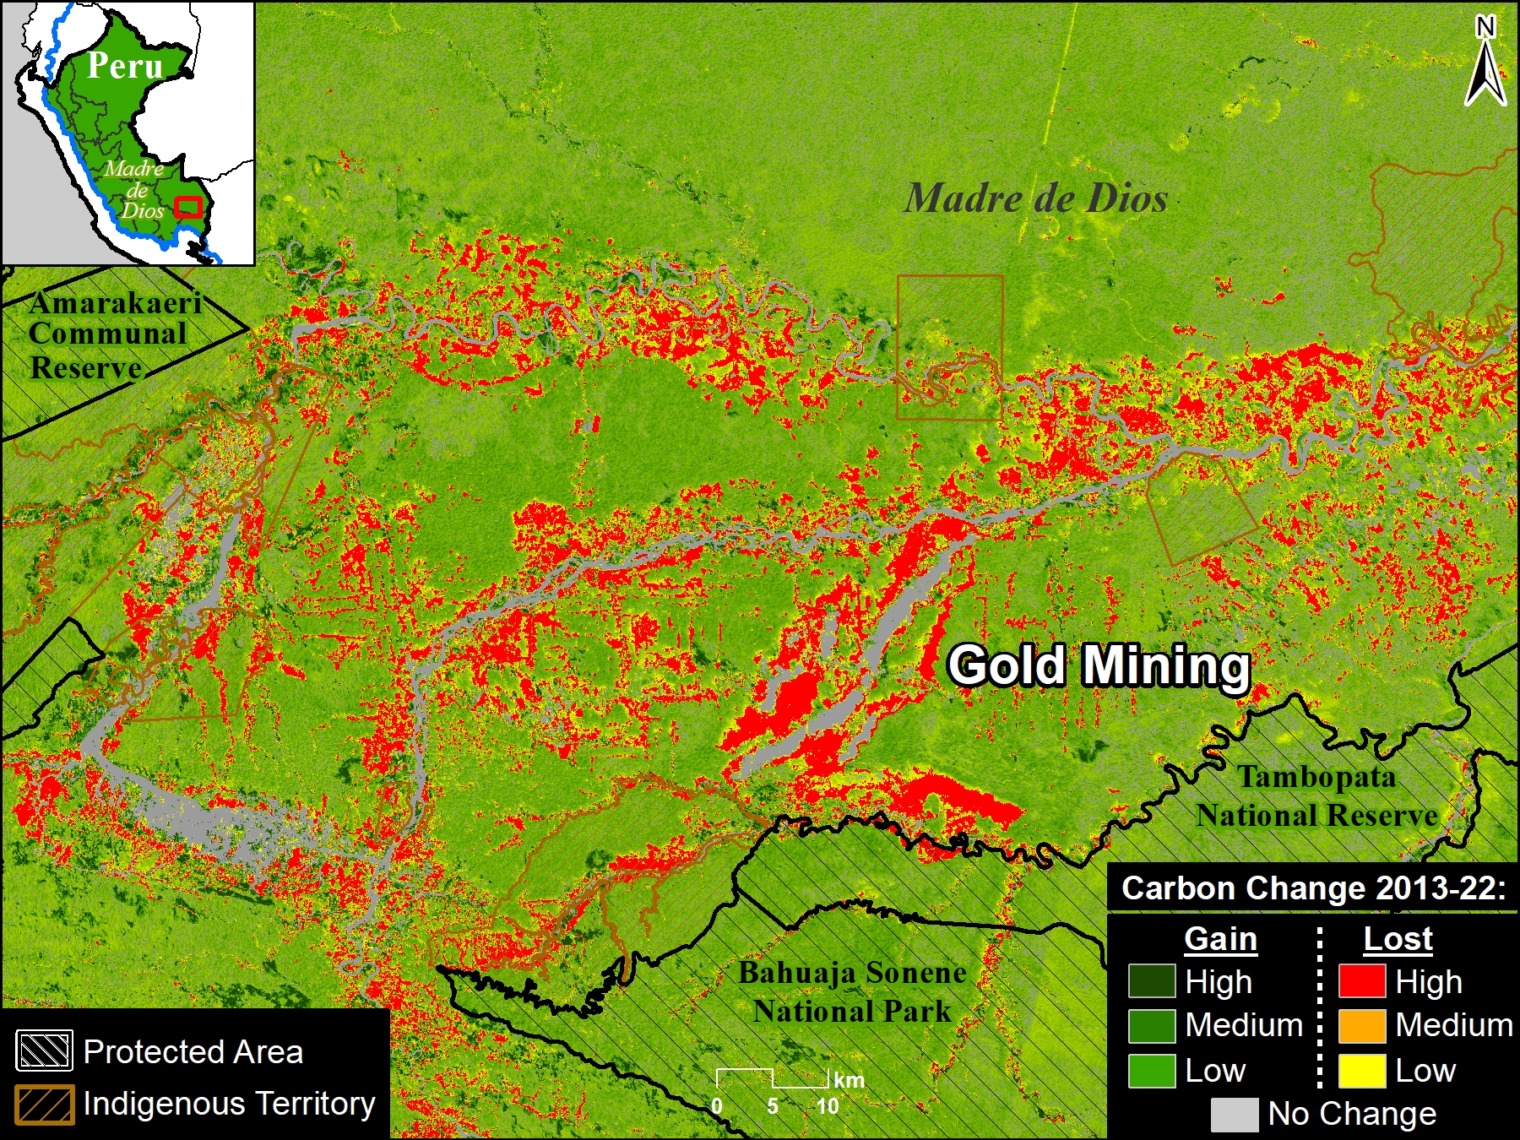
Figure 1C shows the extensive carbon emissions (11.3 million metric tons) associated with gold mining deforestation in the southern Peruvian Amazon.
Most of the carbon loss within the protected areas (and their buffer zones) and Indigenous territories is likely from illegal deforestation.
See MAAP #208 for more information, including details regarding the legality of the deforestation causing the carbon loss.
D. Brazil – Road BR-364
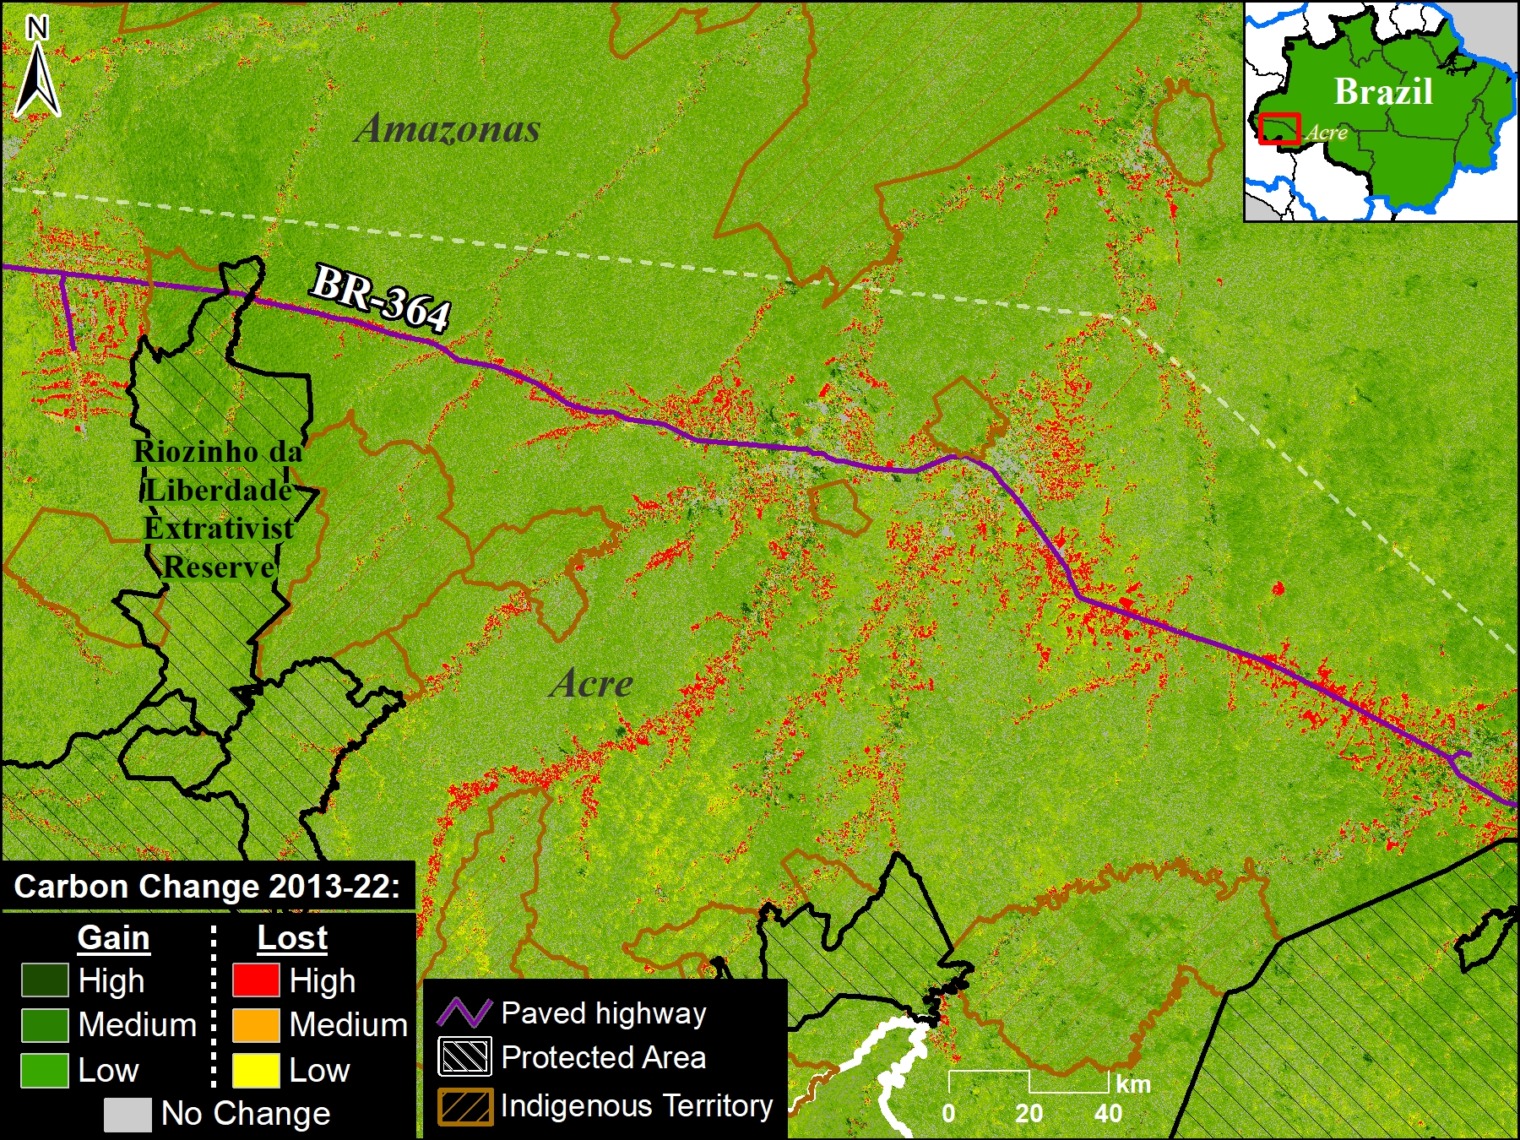
Figure 1D shows the carbon emissions along road BR-364 that crosses the state of Acre in the southwest Brazilian Amazon.
This road was opened in the 1960s and paved in the 1980s.
E. Brazil – Road BR-319
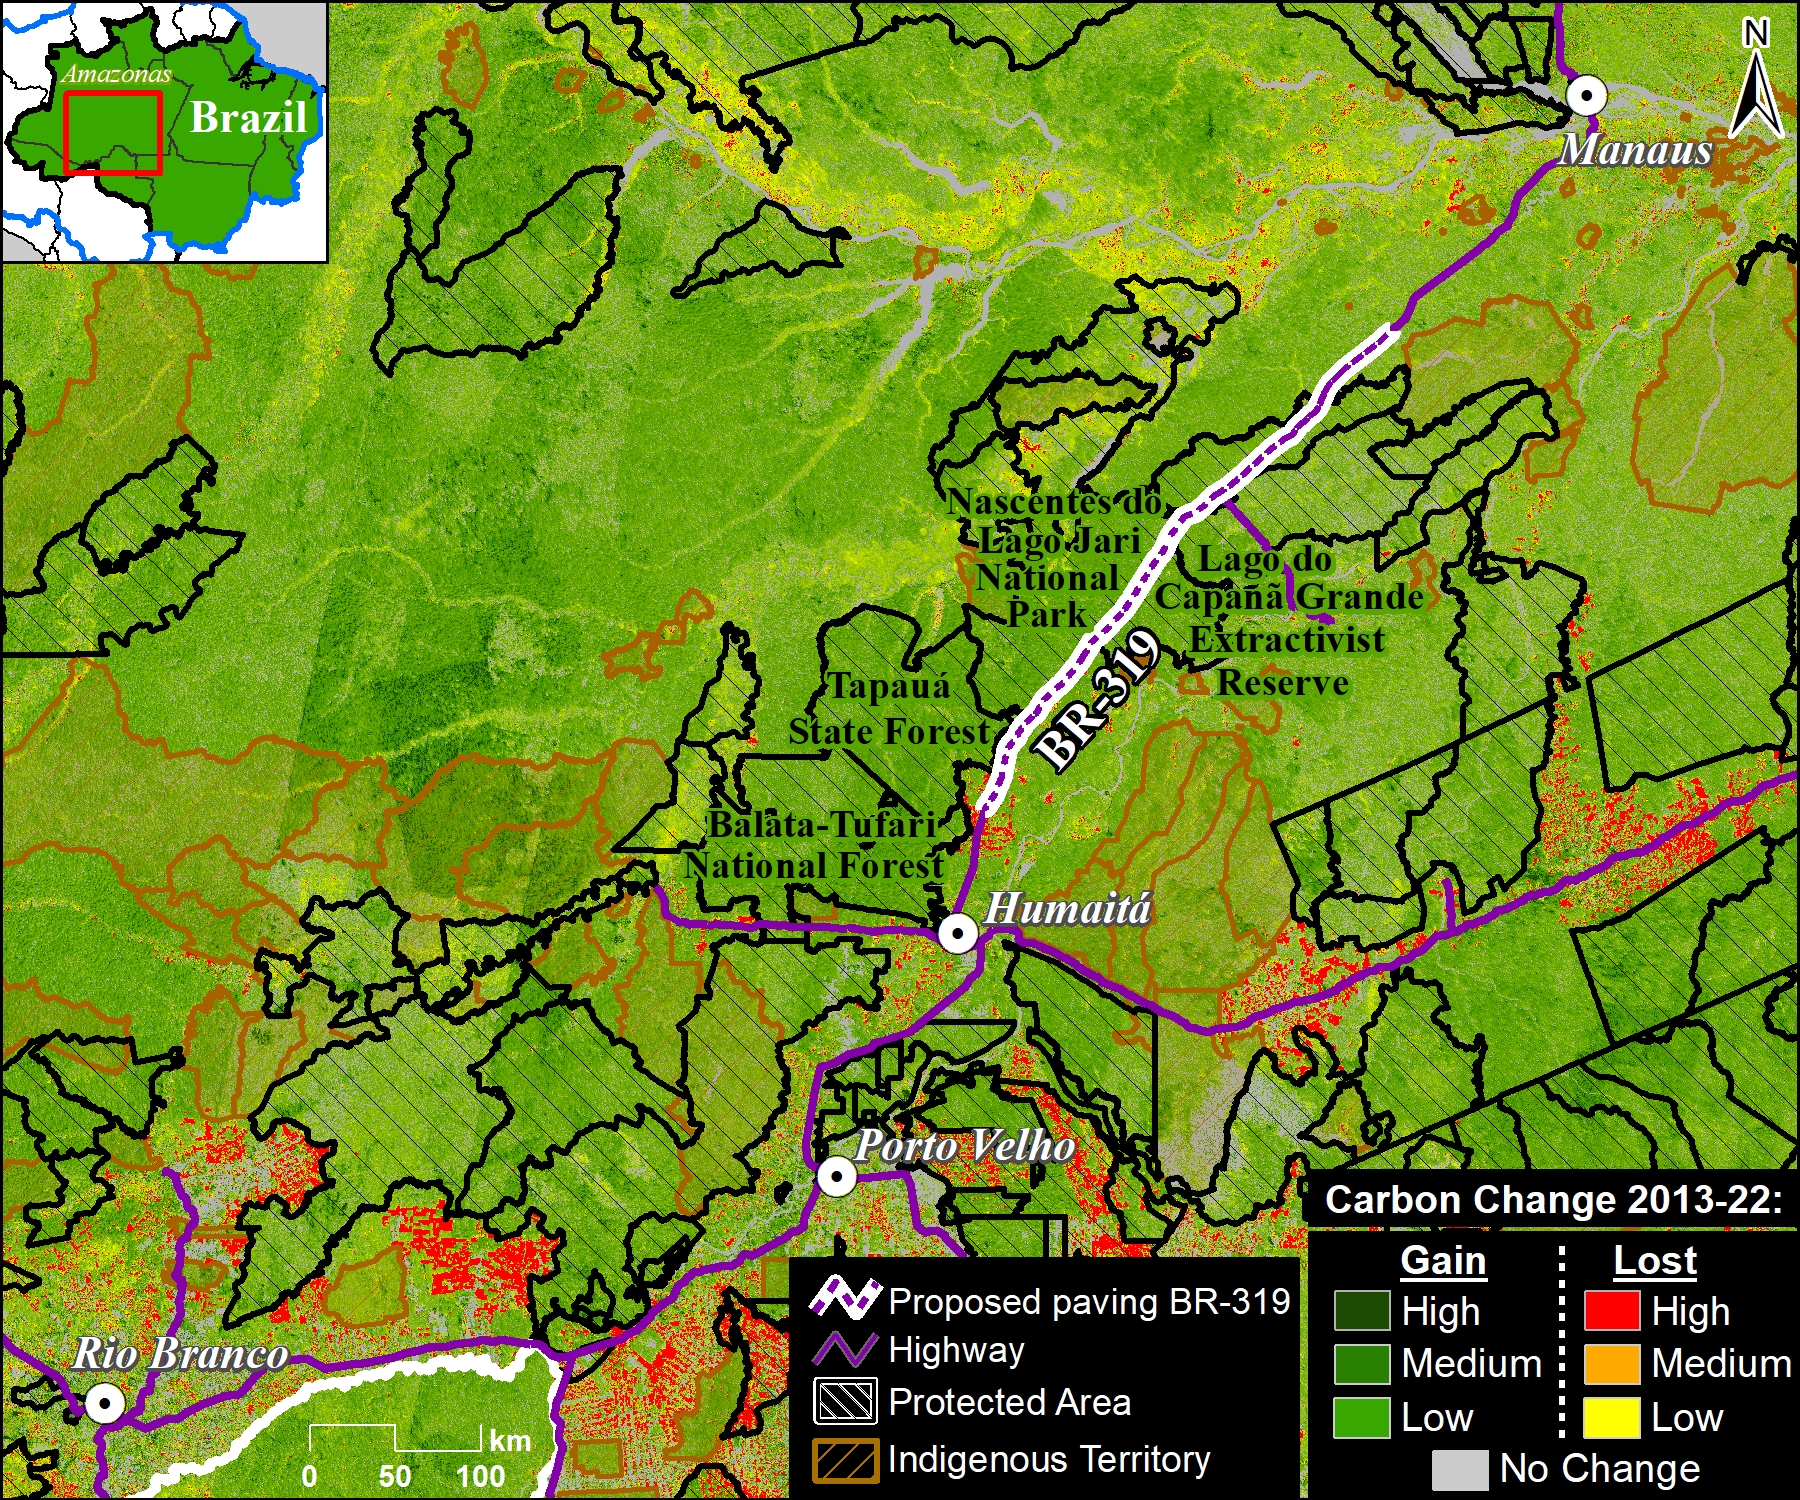
Figure 1E shows a controversial road paving project that would effectively link the arc of deforestation to the south with more intact forests to the north in Amazonas and Roraima states.
Note that the current carbon loss is concentrated along the paved roads.
The paving of road BR-319 has recently caused headlines as President Luiz Inácio Lula da Silva recently authorized the paving of 20 km of the road and plans to bid for an additional 32 km (thus, paving of 52 km in total).
Modeling studies predict extensive new deforestation from this road construction, and thus additional associated carbon loss.
F. Brazil – Road BR-163
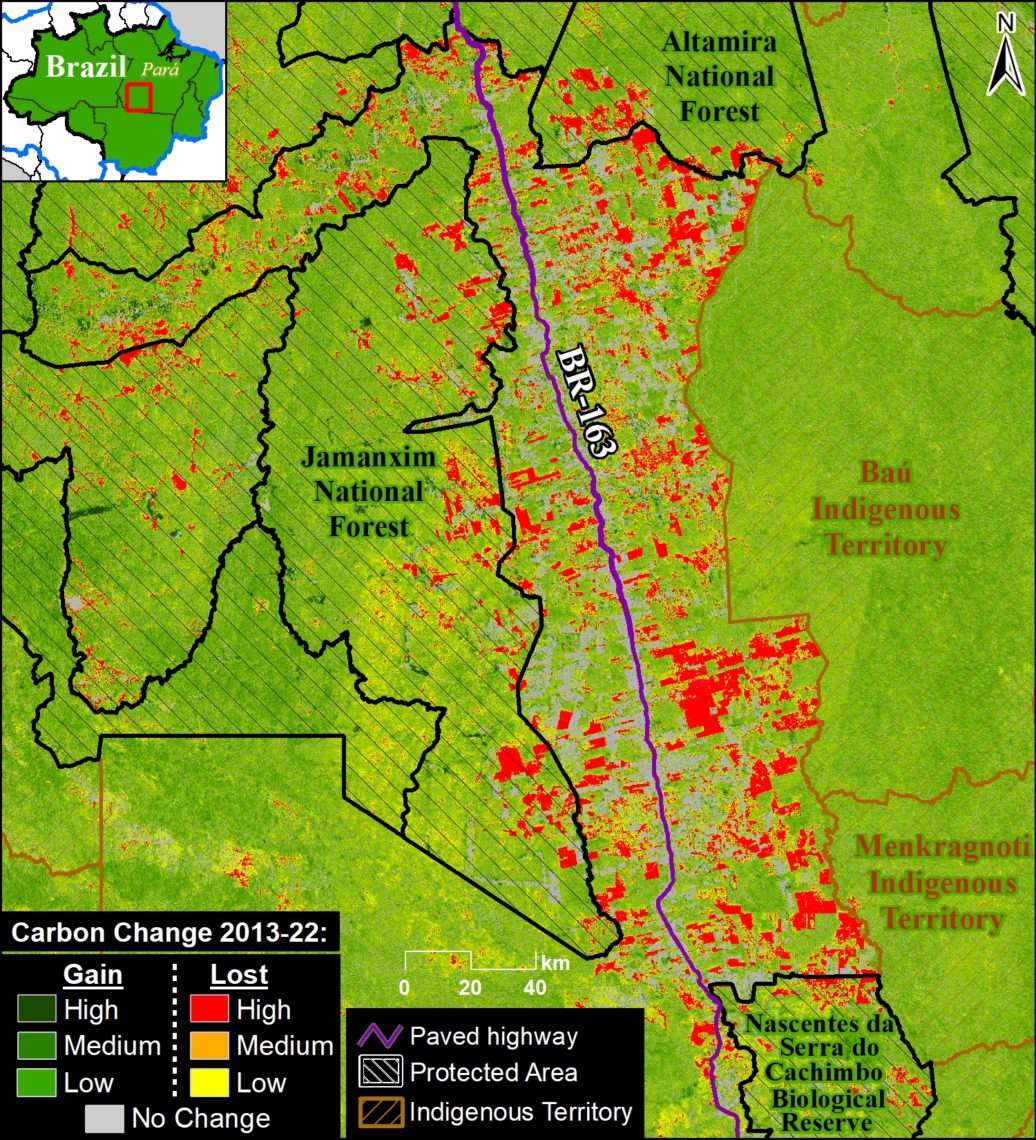
Figure 1F shows the extensive carbon emissions (71.4 million metric tons) along a recently paved stretch of road BR-163 which crosses the state of Pará in the eastern Brazilian Amazon.
Importantly, this stretch of road has been presented as a case study of what may happen along road BR-319 if it is paved.
Carbon Gain
We can also calculate the carbon gain from both secondary and primary forests. These cases include forest gain from remote primary forests that may be good candidates for the HIFOR initiative.
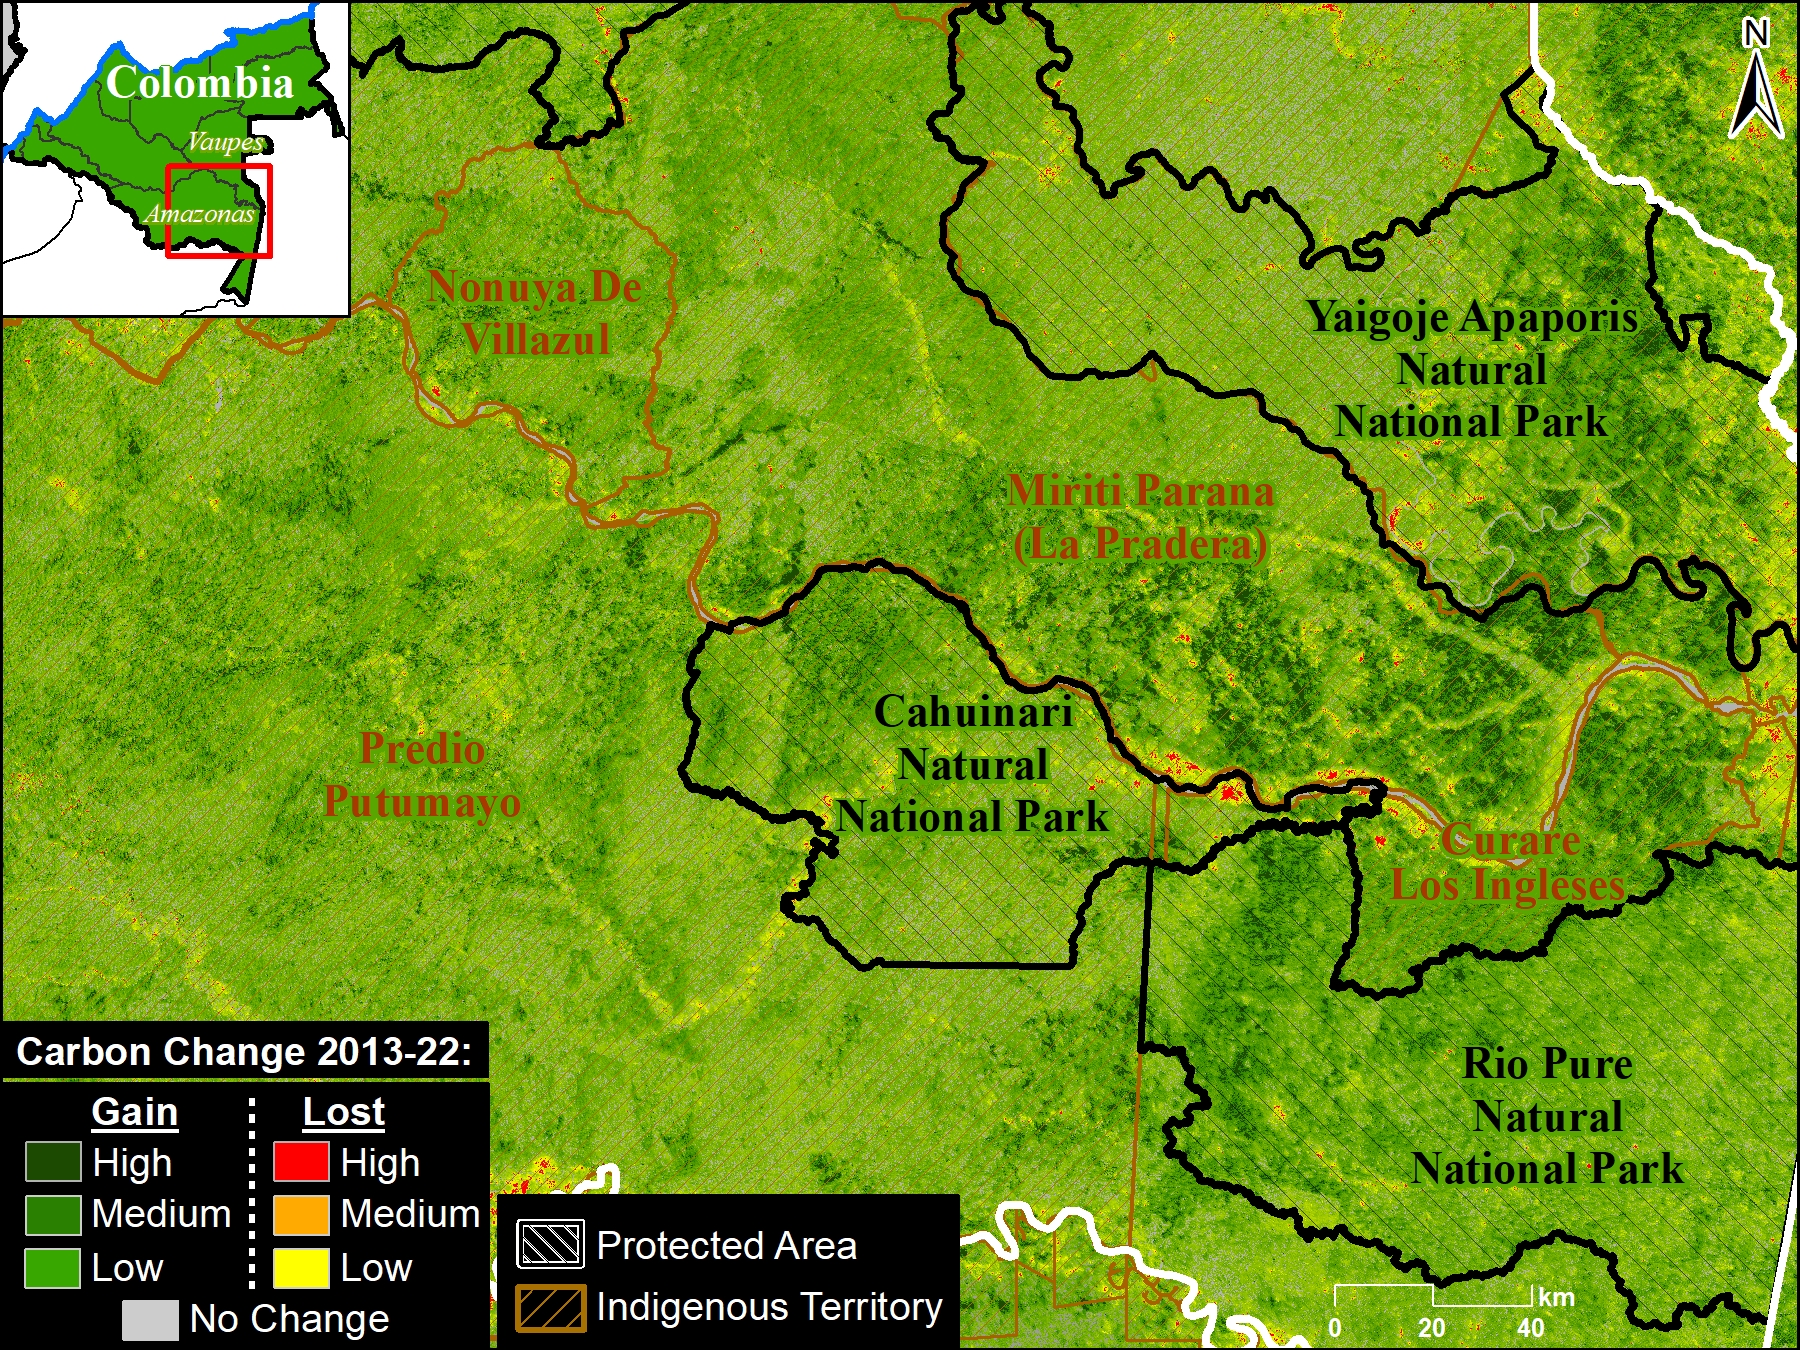
G. Southeast Colombia
Figure 1G shows the carbon gain of over 52.5 million metric tons in the remote southeast Colombian Amazon.
This area is anchored by three national parks and several large indigenous territories.
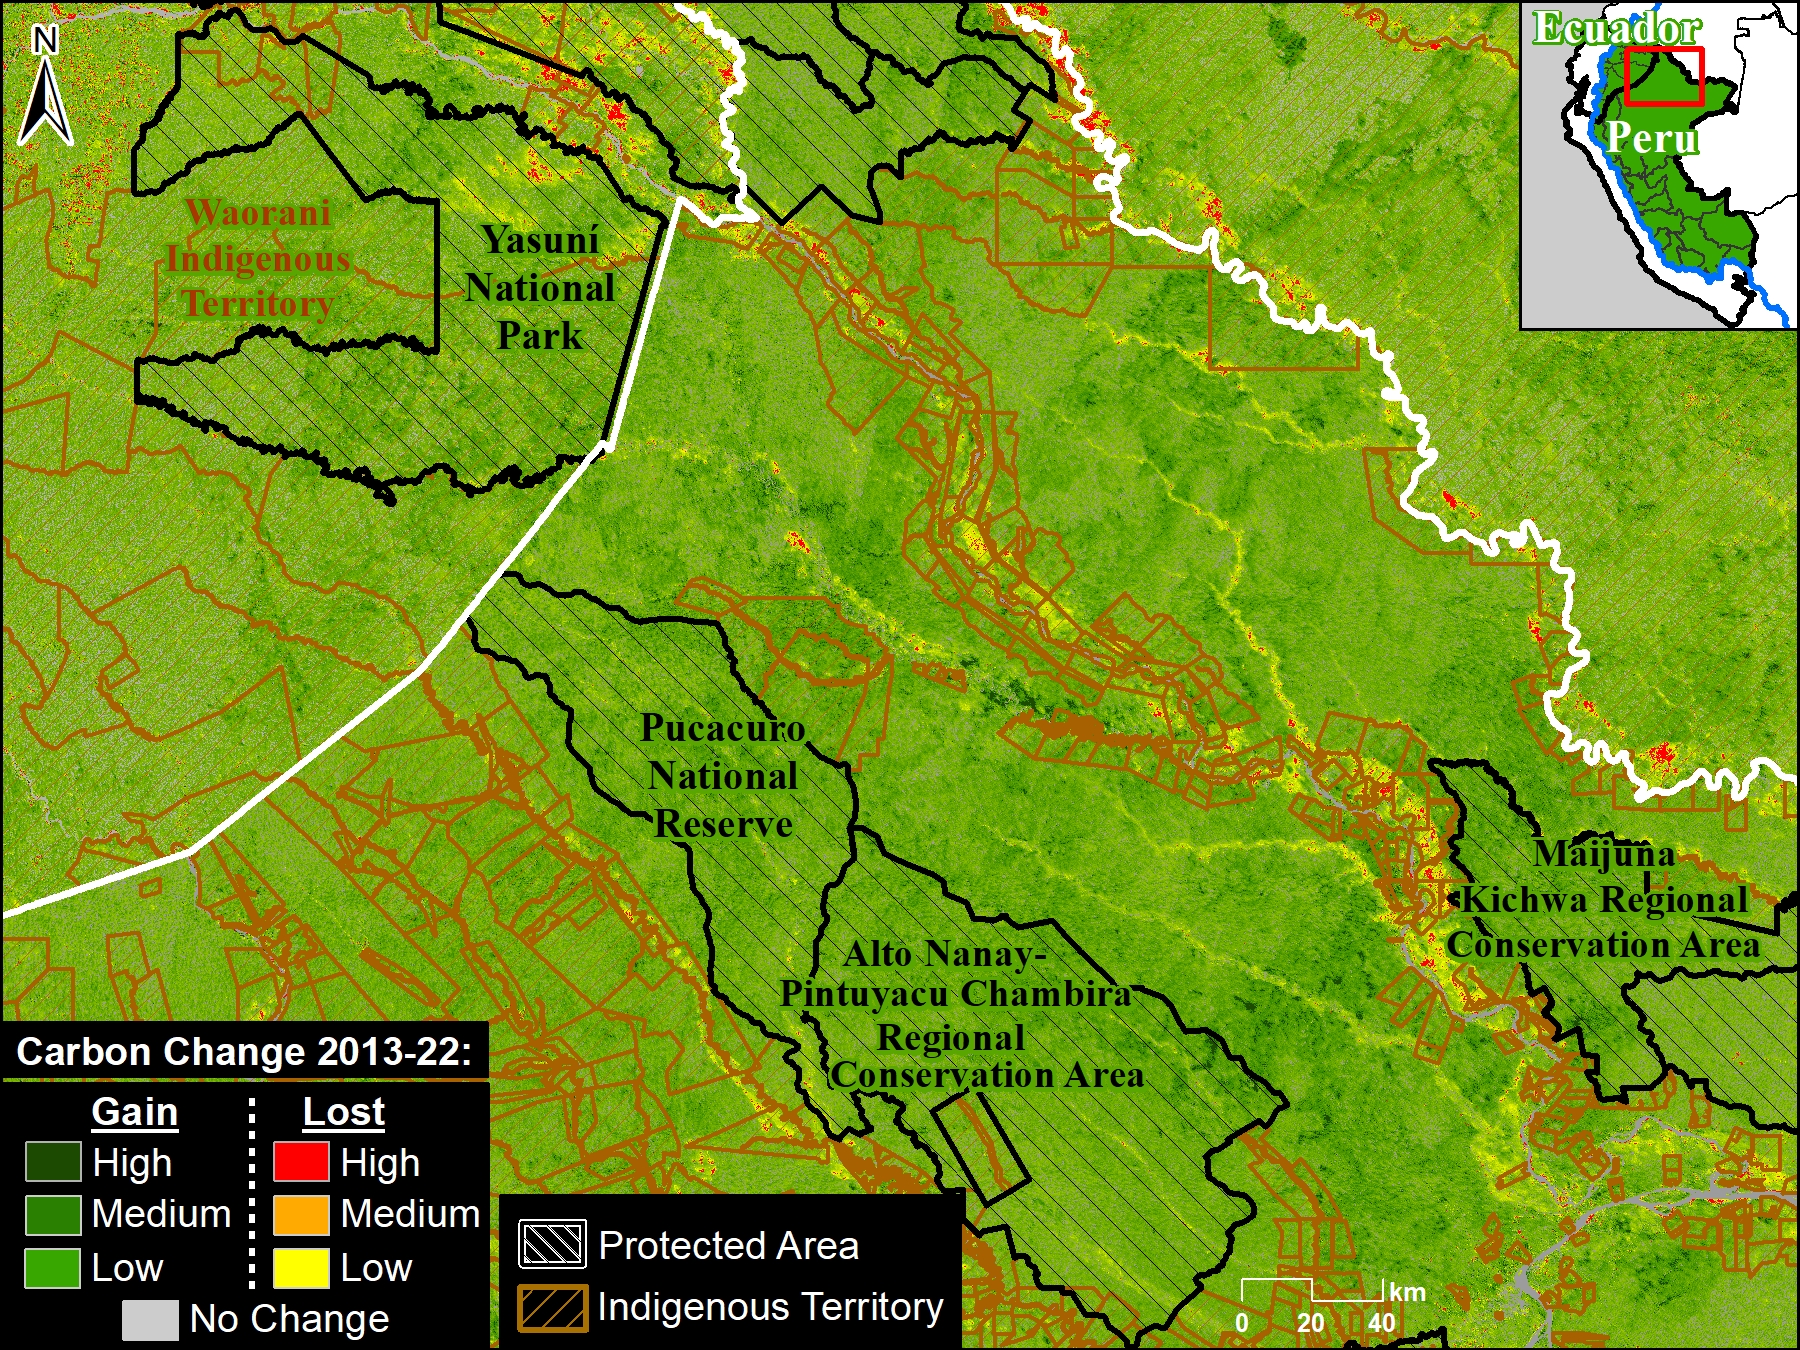
H. Ecuador – Peru border
Figure 1H shows the carbon gain of nearly 40 million metric tons along the border in eastern Ecuador and northern Peru.
Note this area is anchored by numerous protected areas, including Yasuni National Park in Ecuador and Pucacuro National Reserve in Peru, and Indigenous territories.
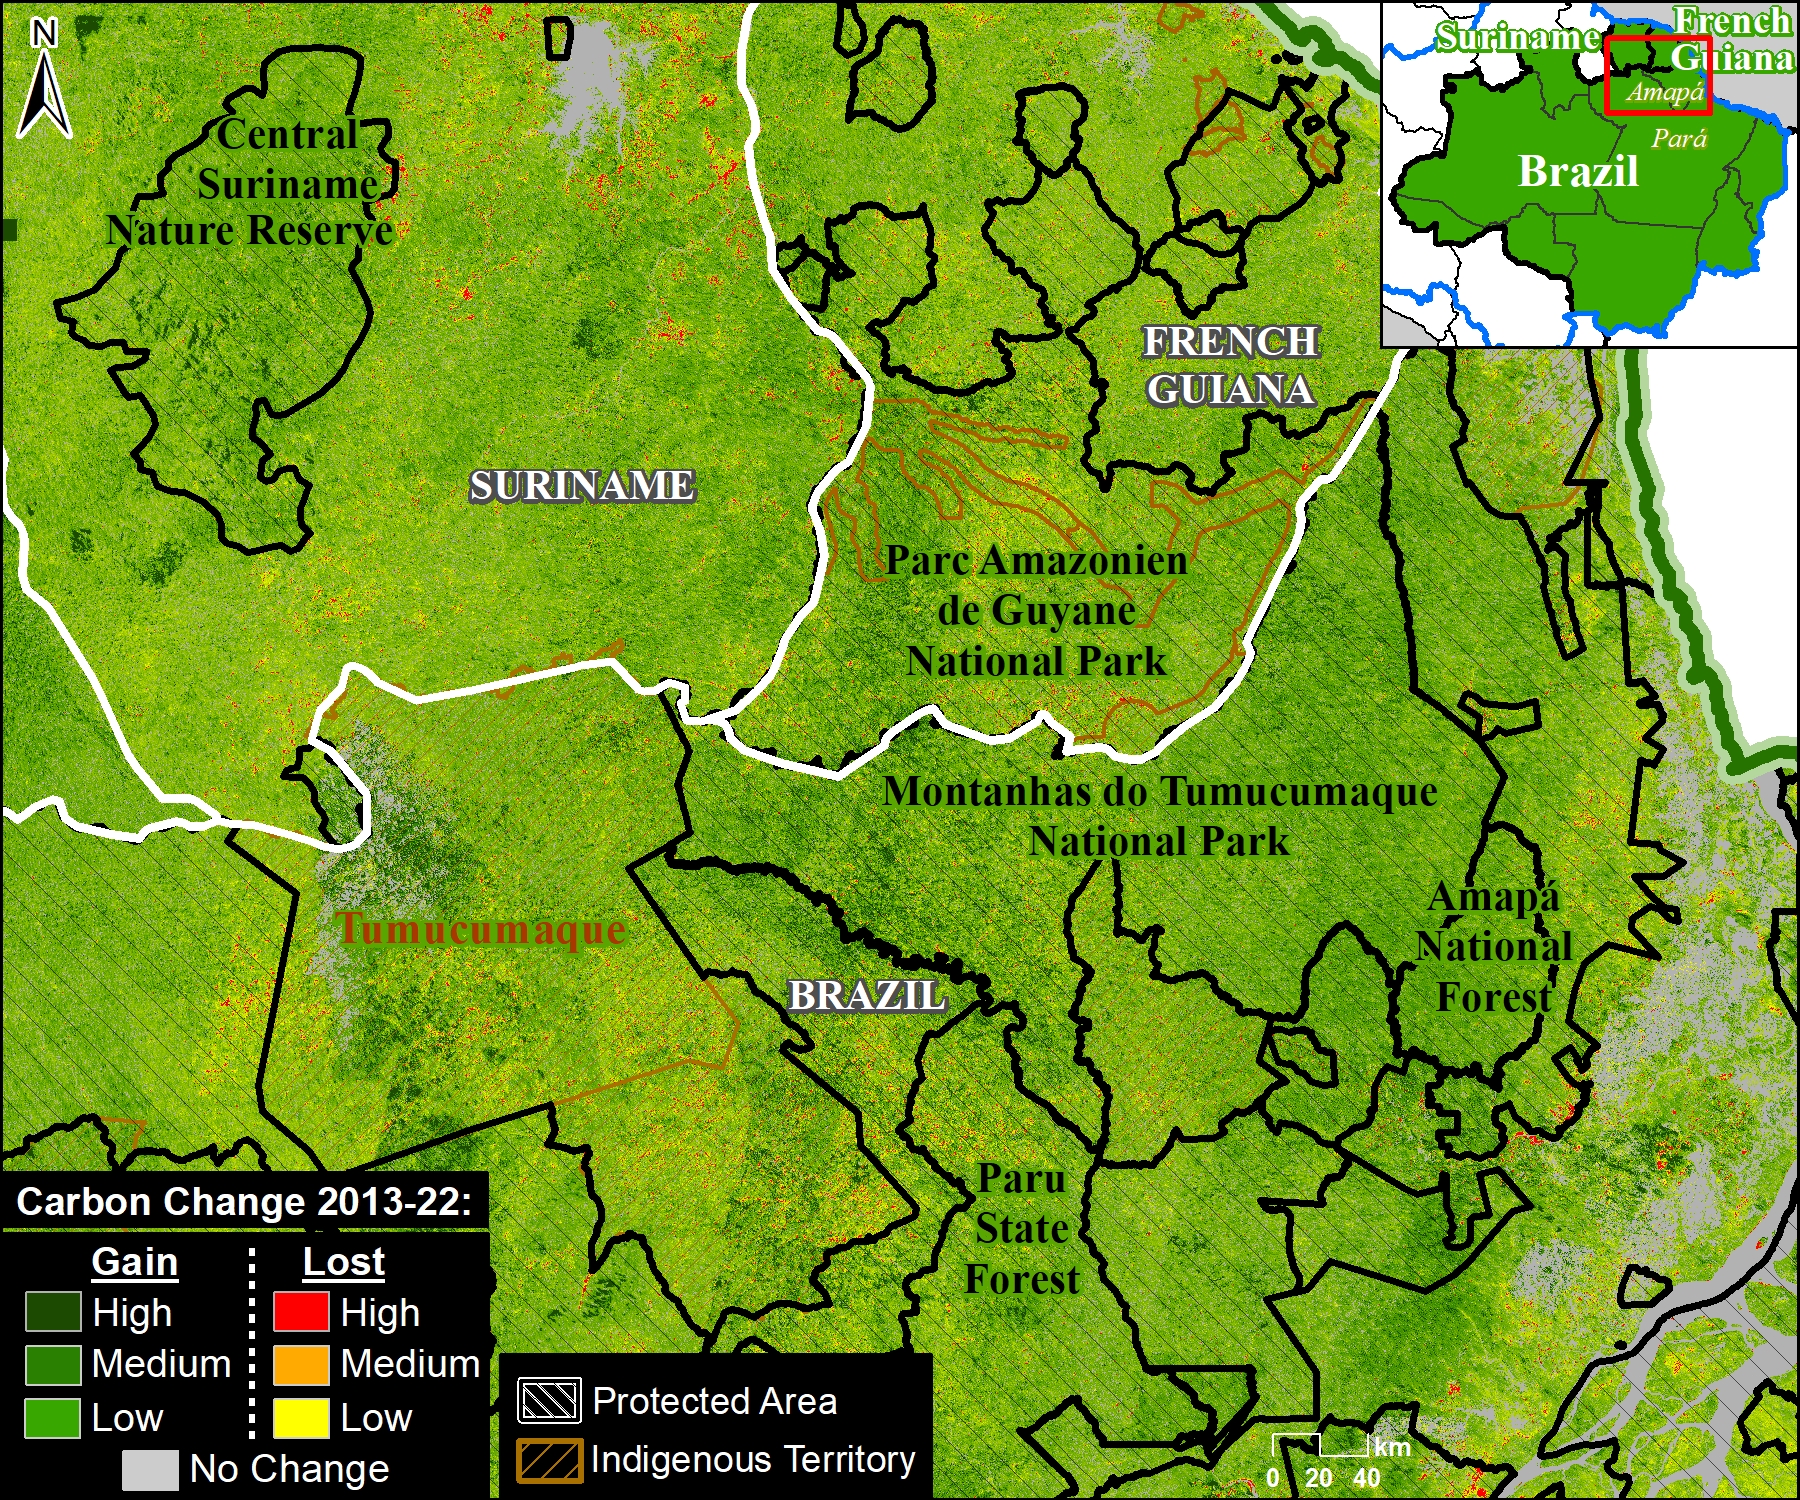
I. Northeast Amazon
Figure 1I shows the carbon gain of 164.7 million metric tons in the tri-border region of the northeast Amazon (northern Brazil, French Guiana, and Suriname).
For example, note the carbon gains in Montanhas do Tumucumaque National Park and Tumucumaque Indigenous territory in northeast Brazil.
Also note that this was an Amazonian “peak carbon area,” as described in MAAP #217.
Annex 1
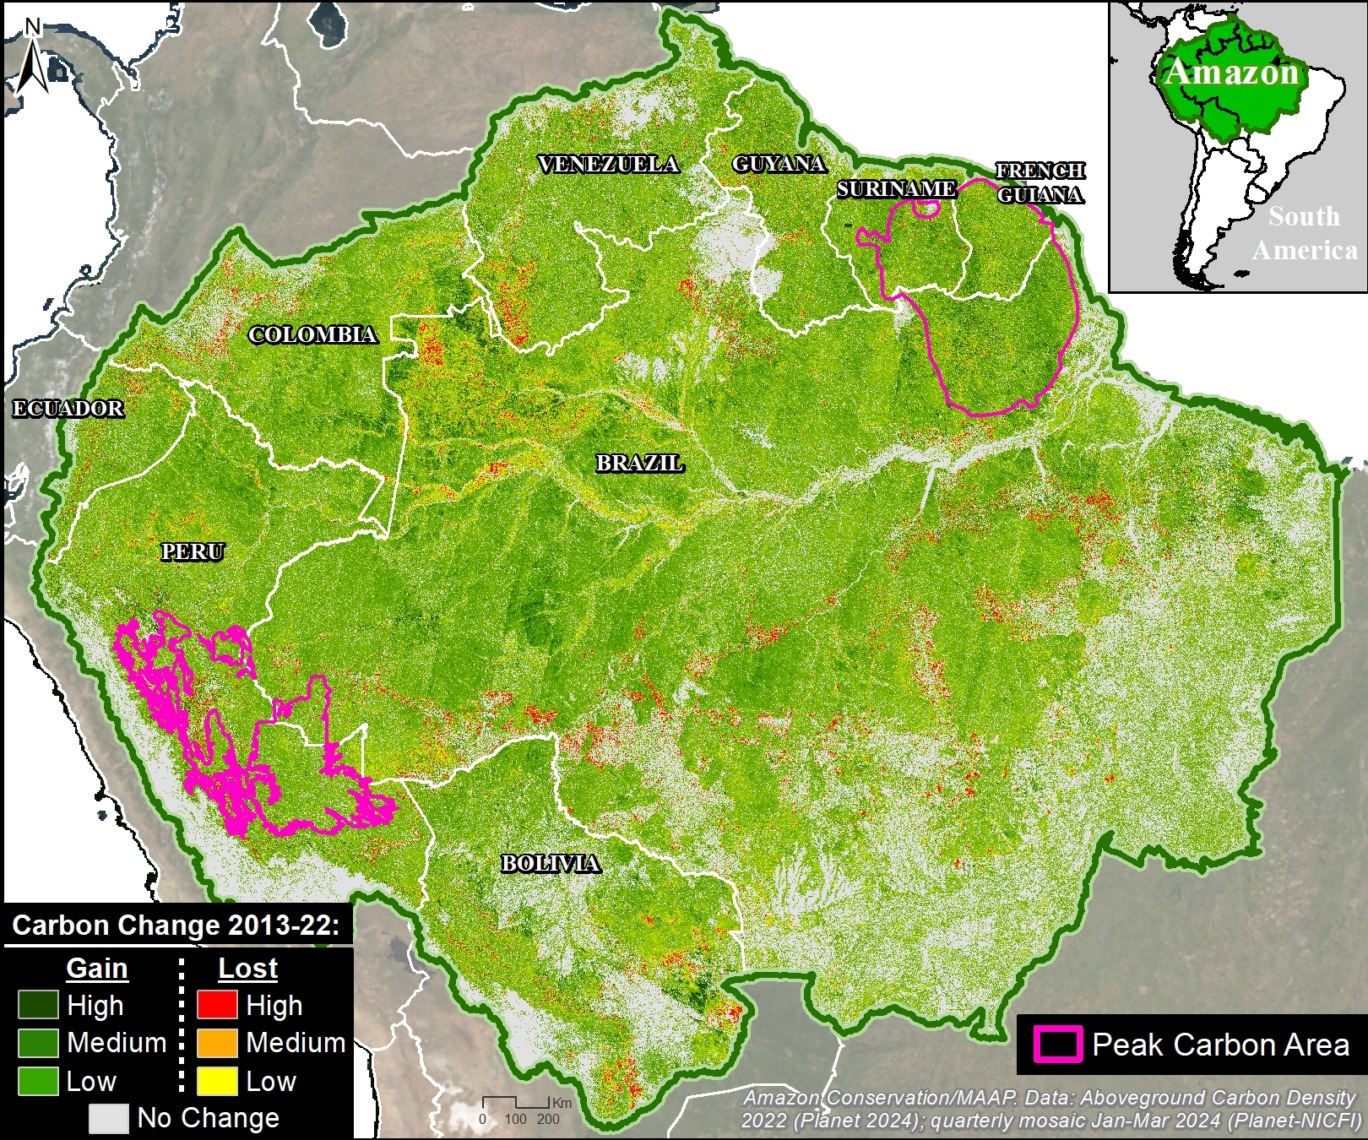
In part 2 of this series (MAAP #217), we highlighted which parts of the Amazon are currently home to the highest (peak) aboveground carbon levels.
Annex 1 shows these peak carbon areas in relation to the carbon loss and gain data presented above.
Note that both peak carbon areas (southeast and northeast Amazon) are largely characterized by carbon gain.
Annex 2
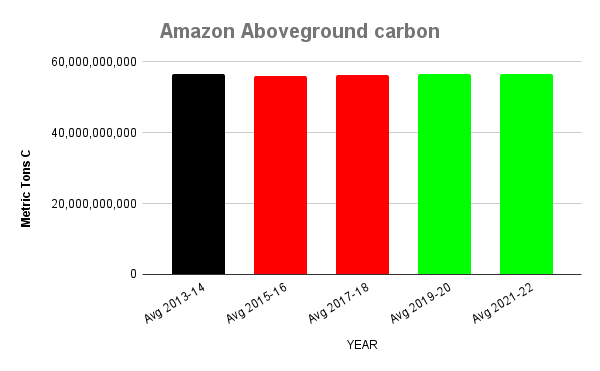
Annex 2 shows all ten years of aboveground carbon data grouped by two-year intervals (thus, it is an extension of Graph 1 above, adding data for the intermediate years).
In this context, black indicates our baseline of 2013-14, red indicates a decrease from the baseline (carbon source), and green indicates an increase from the baseline (carbon sink).
Importantly, there was a decrease in aboveground carbon from 2015-18, which likely reflects the severe droughts of 2015 and 2016 and subsequent severe fire seasons of 2016 and 2017. Aboveground carbon rebounded from 2019-22.
This trend supports the hypothesis that the Amazon biome is teetering on being an aboveground carbon source vs sink.
It also raises the possibility that the Amazon may return to being a carbon source following the intense drought and fires of 2024.
.
.
Notes
1 In part 1 of this series (MAAP #215), we found the Amazon “is still functioning as a critical carbon sink”. As pointed out in a companion blog by Planet, however, the net carbon sink of +64 million metric tons is quite small relative to the total estimate of 56.8 billion metric tons of aboveground carbon across the Amazon. That is a net positive change of just +0.1%. As the blog notes, that’s a “very small buffer” and there’s “reason to worry that the biome could flip from sink to source with ongoing deforestation.”
2 High Integrity Forest (HIFOR) units are a new, non-offset asset that recognizes and rewards the essential climate services and biodiversity conservation that intact tropical forests provide, including ongoing net removal of CO2 from the atmosphere. HIFOR rewards the climate services that intact tropical forests provide, including ongoing net carbon removal from the atmosphere, and complements existing instruments to reduce emissions from deforestation and degradation (REDD+) by focusing on tropical forests that are largely undegraded. A HIFOR unit represents a hectare of well-conserved, high-integrity tropical forest where ‘well-conserved’ means that high ecological integrity is maintained over a decade of monitoring as part of equitable, effective management of a site and ‘high ecological integrity’ means a score of >9.6 on the Forest Landscape Integrity Index. For more information see https://www.wcs.org/our-work/climate-change/forests-and-climate-change/hifor
3 Two additional important references regarding HIFOR methodology and application:
High Integrity Forest Investment Initiative, Methodology for HIFOR units, April 2024. Downloaded from https://www.wcs.org/our-work/climate-change/forests-and-climate-change/hifor
Forest Landscape Integrity Index metric used by HIFOR: www.forestintegrity.com
4 In Planet’s Forest Carbon Diligence product, carbon loss and gain are detected via changes in canopy cover and canopy height during the given periods (in this case, 2013 vs 2022).
Acknowledgments
Through a generous sharing agreement with the satellite company Planet, we have been granted access to this data across the entire Amazon biome for the analysis presented in this series.
We also thank D. Zarin (WCS) for helpful comments regarding the implications of our findings for the HIFOR initiative.
This report was made possible by the generous support of the Norwegian Agency for Development Cooperation (NORAD)
![]()
Citation
Finer M, Mamani N, Anderson C, Rosenthal A (2024) Carbon across the Amazon (part 3): Key Cases of Carbon Loss & Gain. MAAP: 220.


