MAAP #147: Amazon Deforestation Hotspots 2021 (1st Look)

Base Map. Deforestation hotspots across the Amazon in 2021 (as of September 18). Data: UMD/GLAD, ACA/MAAP.

We present a first look at the major deforestation hotspots across all nine countries of the Amazon in 2021 (as of September 18).*

The Base Map illustrates several key findings thus far in 2021:p

  • We estimate the loss of over 860,000 hectares (2.1 million acres) of primary forest loss across the nine countries of the Amazon.
    p
  • Amazon deforestation has been concentrated in three countries: Brazil (79%), Peru (7%), Colombia (6%).
    p
  • The vast majority of deforestation (79%) occurred in the Brazilian Amazon, where massive hotspots stretched across the major road networks. Many of these areas were also burned following the deforestation.
    p
  • There continues to be an arc of deforestation in the northwestern Colombian Amazon, impacting numerous protected areas and indigenous territories.
    p
  • In the Peruvian Amazon, deforestation continues to impact the central region, most notably from a new Mennonite colony and large-scale rice plantation.
    p
  • In Bolivia, fires are once again impacting several important ecosystems, including the Beni grasslands and Chiquitano dry forests of the Amazon, and Chaco scrub forest outside the Amazon.

Below, we zoom in on the three countries with the highest deforestation (Brazil, Colombia, and Peru) and show a series of high-resolution satellite images that illustrate some of the major 2021 deforestation events.

Widespread Deforestation in the Brazilian Amazon

The Brazil Base Map shows the notable concentration of deforestation hotspots along the major roads (especially roads 163, 230, 319, and 364). Zooms A-C show high-resolution examples of this deforestation, which largely appears to be associated with clearing rainforests for pasture.

Brazil Base Map. Deforestation hotspots in Brazilian Amazon (as of September 18). Data: UMD/GLAD, ACA/MAAP.
Zoom A. Deforestation in the Brazilian Amazon near road 230 (TransAmazian Highway) between February (left panel) and September (right panel) of 2021. Data: Planet.
Zoom B. Deforestation in the Brazilian Amazon along road 319 in Amazonas state between May (left panel) and September (right panel) of 2021. Data: Planet, ESA.
Zoom C. Deforestation in the Brazilian Amazon along road 163 between November 2020 (left panel) and September 2021 (right panel). Data: Planet, ESA.
Colombia Base Map. Deforestation hotspots in northwest Colombian Amazon (as of September 18). Data: UMD/GLAD, ACA/MAAP.

Arc of Deforestation in the Colombian Amazon

As described in previous reports (see MAAP #120), the Colombia Base Map shows there continues to be an “arc of deforestation” in the northwest Colombian Amazon (Caqueta, Meta, and Guaviare departments).

This arc impacts numerous protected areas (particularly Tinigua and Chiribiquete National Parks) and Indigenous Reserves (particularly Yari-Yaguara II and Nukak Maku).

Zooms D & E show high-resolution examples of this deforestation, which largely appears to be associated with clearing rainforests for pasture.

Zoom D. Deforestation in the Colombian Amazon (Caqueta) between December 2020 (left panel) and September 2021 (right panel). Data: Planet.
Zoom E. Deforestation in the Colombian Amazon between January (left panel) and September (right panel) of 2021. Data: Planet, ESA.
Peru Base Map. Deforestation hotspots in the Peruvian Amazon (as of September 18). Data: UMD/GLAD, ACA/MAAP.

Deforestation in the central Peruvian Amazon

The Peru Base Map shows the concentration of deforestation in the central Peruvian Amazon (Ucayali, Huanuco, and southern Loreto regions).

Zooms F & G show two notable examples of this deforestation: the rapid deforestation in 2021 for a new Mennonite colony (299 hectares) and large-scale rice plantation (382 hectares), respectively.

Also note some additional hotspots in the south (Madre de Dios region) from gold mining and medium-scale agriculture.

The hotspot in the north (Loreto region) is natural forest loss from a windstorm.

Zoom F. Deforestation (299 hectares) in the Peruvian Amazon for a new Mennonite colony between January (left panel) and September (right panel) of 2021 in southern Loreto region. Data: Planet.
Zoom G. Deforestation (382 ha) in the Peruvian Amazon for a new large-scale rice plantation between January (left panel) and September (right panel) of 2021 in Ucayali region. Data: Planet.

*Notes and Methodology

The analysis was based on 10-meter resolution primary forest loss alerts (GLAD+) produced by the University of Maryland and also presented by Global Forest Watch. These alerts are derived from the Sentinel-2 satellite operated by the European Space Agency.

We emphasize that this data represents a preliminary estimate and more definitive annual data will come later next year.

We also note that this data does include forest loss caused by natural forces and burned areas.

Our geographic range for the Amazon is a hybrid between both the biogeographic boundary (as defined by RAISG) and watershed  boundary, designed for maximum inclusion.

To identify the deforestation hotspots, we conducted a kernel density estimate. This type of analysis calculates the magnitude per unit area of a particular phenomenon, in this case forest cover loss. We conducted this analysis using the Kernel Density tool from Spatial Analyst Tool Box of ArcGIS. We used the following parameters:

Search Radius: 15000 layer units (meters)
Kernel Density Function: Quartic kernel function
Cell Size in the map: 200 x 200 meters (4 hectares)
Everything else was left to the default setting.

For the Base Map, we used the following concentration percentages: Medium: 7-10%; High: 11-20%; Very High: >20%.

Acknowledgements

We thank E. Ortiz and A. Ariñez for their helpful comments on this report.

This work was supported by NORAD (Norwegian Agency for Development Cooperation) and ICFC (International Conservation Fund of Canada).

Citation

Finer M, Mamani N, Spore J (2020) Amazon Deforestation Hotspots 2021. MAAP: 147.

MAAP #144: The Amazon & Climate Change: Carbon Sink vs Carbon Source

Base Map. Forest Carbon Flux across the Amazon, 2001-2020. Data: Harris et al 2021. Analysis: Amazon Conservation/MAAP.

A pair of recent scientific studies revealed that parts of the Amazon now emit more carbon into the atmosphere than they absorb (Gatti et al 2021, Harris et al 2021).

Here, we dig deeper and highlight the key finding: the Brazilian Amazon has become a net carbon source over the past 20 years, whereas the total Amazon is still a net carbon sink.

We also show that protected areas and indigenous territories are crucial carbon sinks, showing once again their importance and effectiveness for overall conservation across the Amazon (MAAP #141).

One of the noted studies (Harris et al 2021) presented a new global monitoring system for forest carbon flux based on satellite data.

Here, we independently analyze this data with a focus on the Amazon.*

The flux is the crucial difference between forest carbon emissions (such as deforestation) and removals from the atmosphere (such as intact forests and regrowth).

A negative flux indicates that removals exceed emissions and the area is a carbon sink, thus buffering climate change. The Base Map illustrates these sinks in green.

A positive flux indicates that emissions exceed removals and the area has become a carbon source, thus exacerbating climate change. The Base Map illustrates these sources in red.

Below, we illustrate the carbon flux results and then zoom in on some of the key carbon sinks (such as protected areas and indigenous territories) and carbon sources (high deforestation areas) across the Amazon.

Amazon Carbon Flux

The two graphs below show levels of carbon removals in green and carbon emissions in red across the western Amazon (Bolivia, Colombia, Ecuador, and Peru), northeastern Amazon (French Guiana, Guyana, Suriname, and Venezuela), Brazilian Amazon, and total Amazon. The resulting carbon flux is highlighted in pink.

The arrows highlight three critical results:

  • The Brazilian Amazon has become a net carbon source (positive flux indicated by yellow arrow in Graph 1). That is, emissions now exceed removals (3,600 million tonnes of carbon dioxide equivalent over the past 20 years), exacerbating climate change.
    l
  • The total Amazon is still a net carbon sink (negative flux indicated by blue arrow in Graph 1). That is, removals still exceed emissions (-1,700 million tonnes of carbon dioxide equivalent over the past 20 years), helping mitigate climate change, mainly thanks to the role of the western and northeastern Amazon.
    j
  • Protected areas and indigenous territories are effective carbon sinks, while other areas outside these key designations are the major carbon source (positive flux indicated by orange arrow in Graph 2).
Graph 1. Carbon Flux in the Amazon, 2001-20. Data: Harris et al 2021. Analysis: Amazon Conservation/MAAP.
Graph 2. Carbon Flux in the Amazon, 2001-20. Data: Harris et al 2021. Analysis: Amazon Conservation/MAAP.

Key Amazon Carbon Sinks: Protected Areas & Indigenous Territories

Zooms 1 and 2 show two major carbon sinks in the western Amazon.

Zoom 1 focuses in on the northwestern Amazon, stretching across four countries (Brazil, Peru, Colombia, and Ecuador). This region includes large protected areas (such as Yasuni National Park in Ecuador, Chiribiquete National Park in Colombia, and Yaguas National Park in Peru) and indigenous territories (such as Vale do Javari in Brazil).

Zoom 2 focuses in on the southwestern Amazon, stretching across three countries (Brazil, Peru, and Bolivia). This region also includes large protected areas (such as Alto Purus, Manu, and Bahuaja Sonene National Parks in Peru and Madidi National Park in Bolivia).

Base Map: Amazon carbon sinks, indicated by insets 1 and 2. Data: Harris et al 2021.


Key Amazon Carbon Sources: High Deforestation Areas

Zooms A-H show eight major carbon sources in the western Amazon.

Zooms A and B show two of the major deforestation fronts in the Brazilian Amazon. Zoom A shows the massive deforestation around the city of Porto Velho, in the state of Rondônia and near the border with the state of Amazonas. Zoom B shows the massive deforestation along the BR-163 highway in the state of Pará.

Base Map: Amazon carbon sources, indicated by letters A-G. Data: Harris et al 2021.

Moving to the western Amazon, Zoom C shows the arc of deforestation in the northwestern Colombian Amazon and Zoom D shows the major deforestation front in the northern Ecuadorian Amazon.

Zooms E and F show two of the major deforestation fronts in the Peruvian Amazon. Zoom E shows large-scale deforestation from oil palm plantations and a new Mennonite colony in the north. Zoom F shows the major deforestation front in the south, along the Interoceanic Highway, surrounded by gold mining and small-scale agriculture.


Finally, Zoom G shows the deforestation along the road connecting Rurrenabaque and Ixiamas, including the new large-scale sugar cane plantation.


*Methodology & Notes

Base Map, Figure 1, and Zoom maps are based on 30-meter, satellite-based data obtained from Harris et al (2021). Our geographic range included nine countries and consists of a combination of the Amazon biogeographic limit (as defined by RAISG) plus the Amazon watershed limit in Bolivia. See Base Map above for delineation of this hybrid Amazon limit, designed for maximum inclusion.

References

Gatti, LV et al (2021) Amazonia as a carbon source linked to deforestation and climate change. Nature 595, 388–393.

Harris NL et al (2021) Global maps of twenty-first century forest carbon fluxes. Nature Climate Change 11, 234-240.

Acknowledgements

We thank M. Silman (Wake Forest University), D. Gibbs (WRI), M.E. Gutierrez (ACCA), D. Larrea (ACEAA), J. Beavers (ACA), and A. Folhadella (ACA) for their helpful comments on this report.

This work was supported by the Norwegian Agency for Development Cooperation (NORAD), and International Conservation Fund of Canada (ICFC).

Citation

Finer M, Mamani N (2021) The Amazon & Climate Change: Carbon Sink vs Carbon Source. MAAP: 144.

MAAP #141: Protected Areas & Indigenous Territories Effective Against Deforestation in the Western Amazon

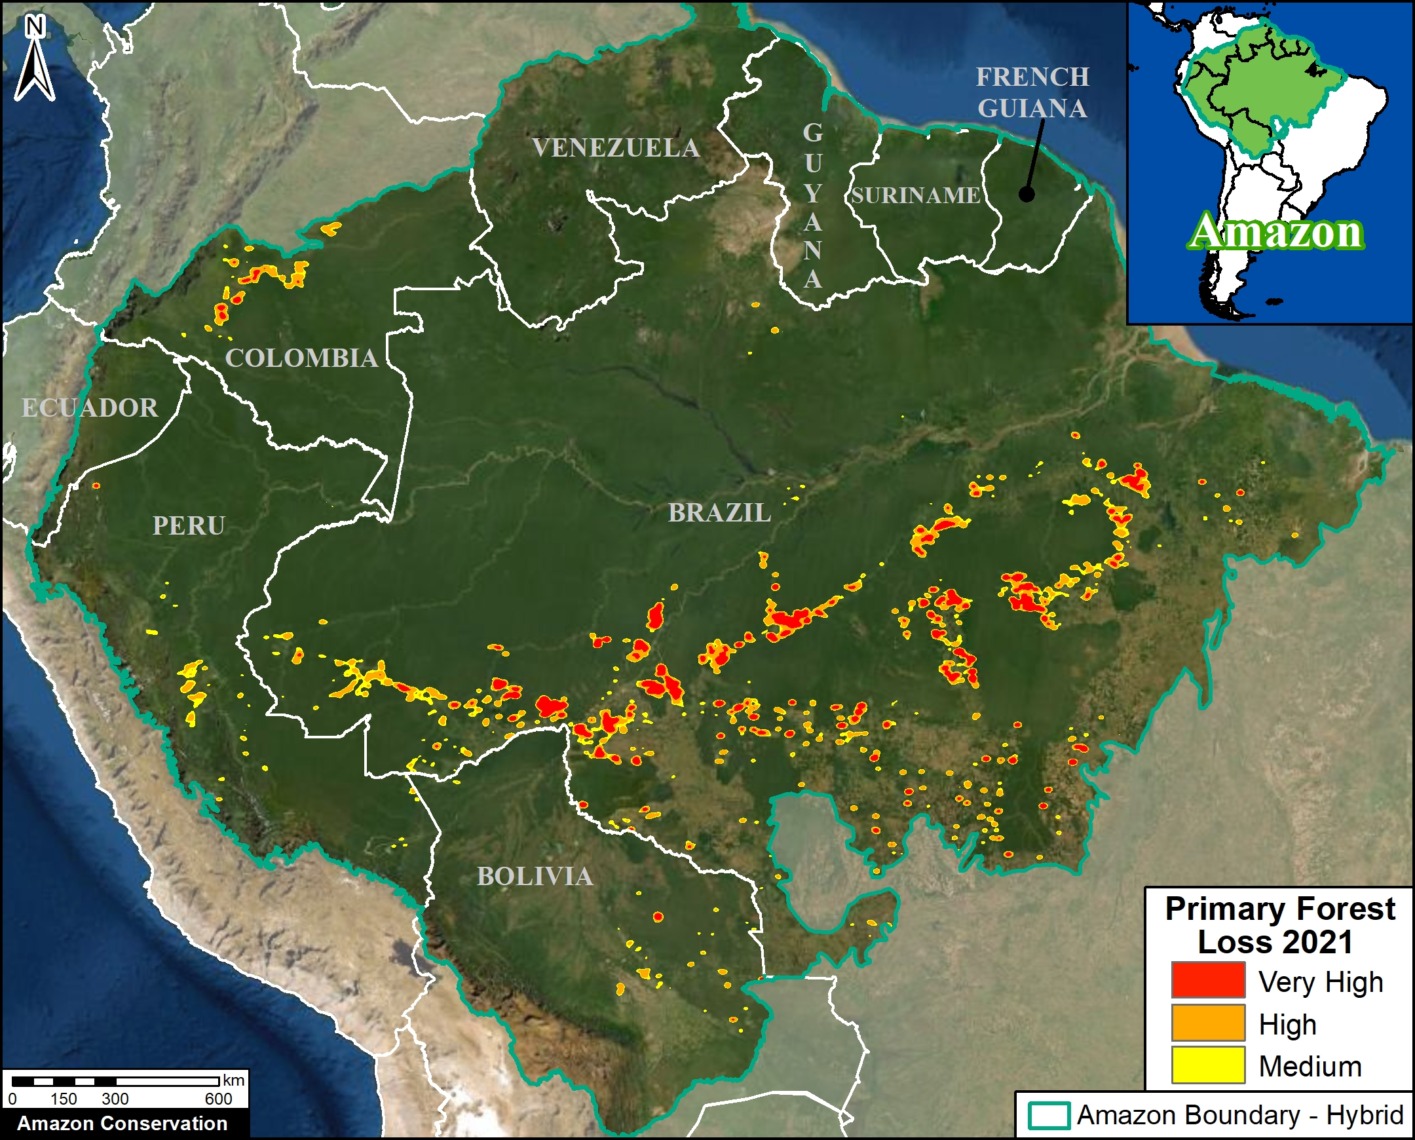
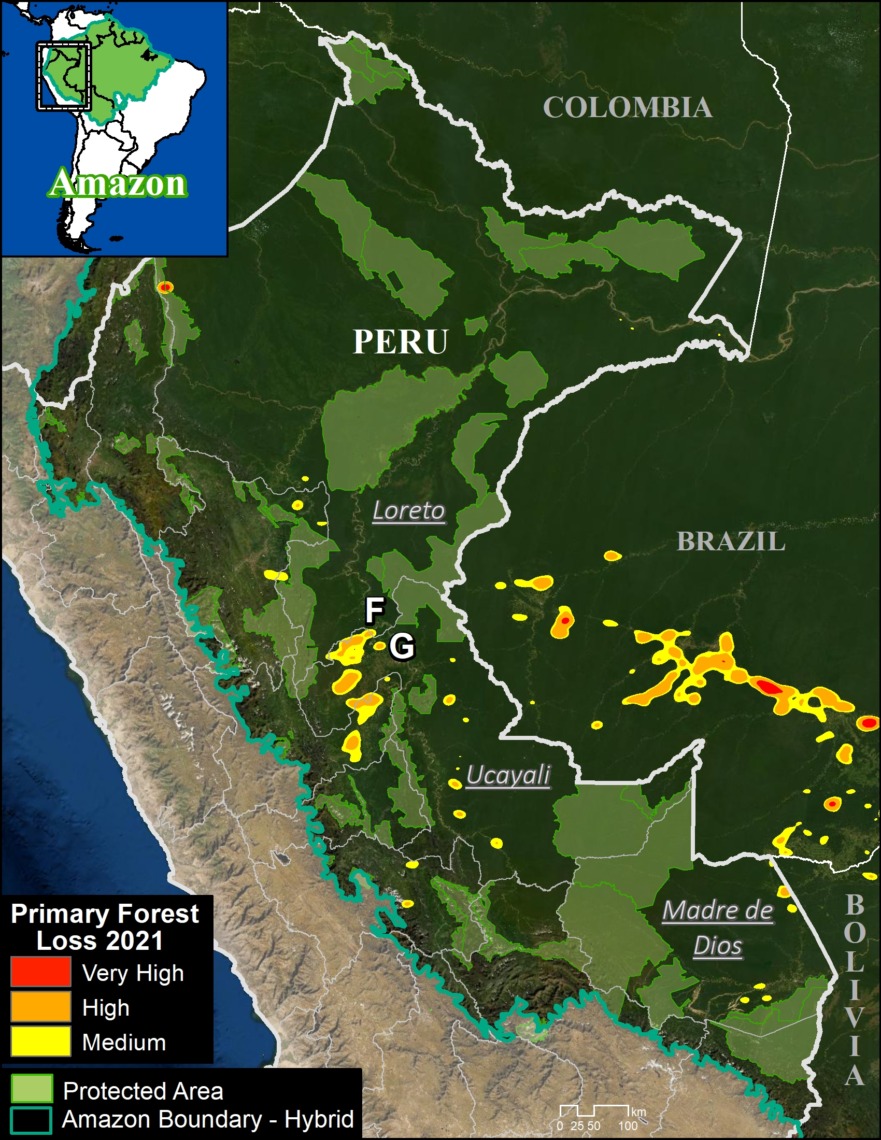
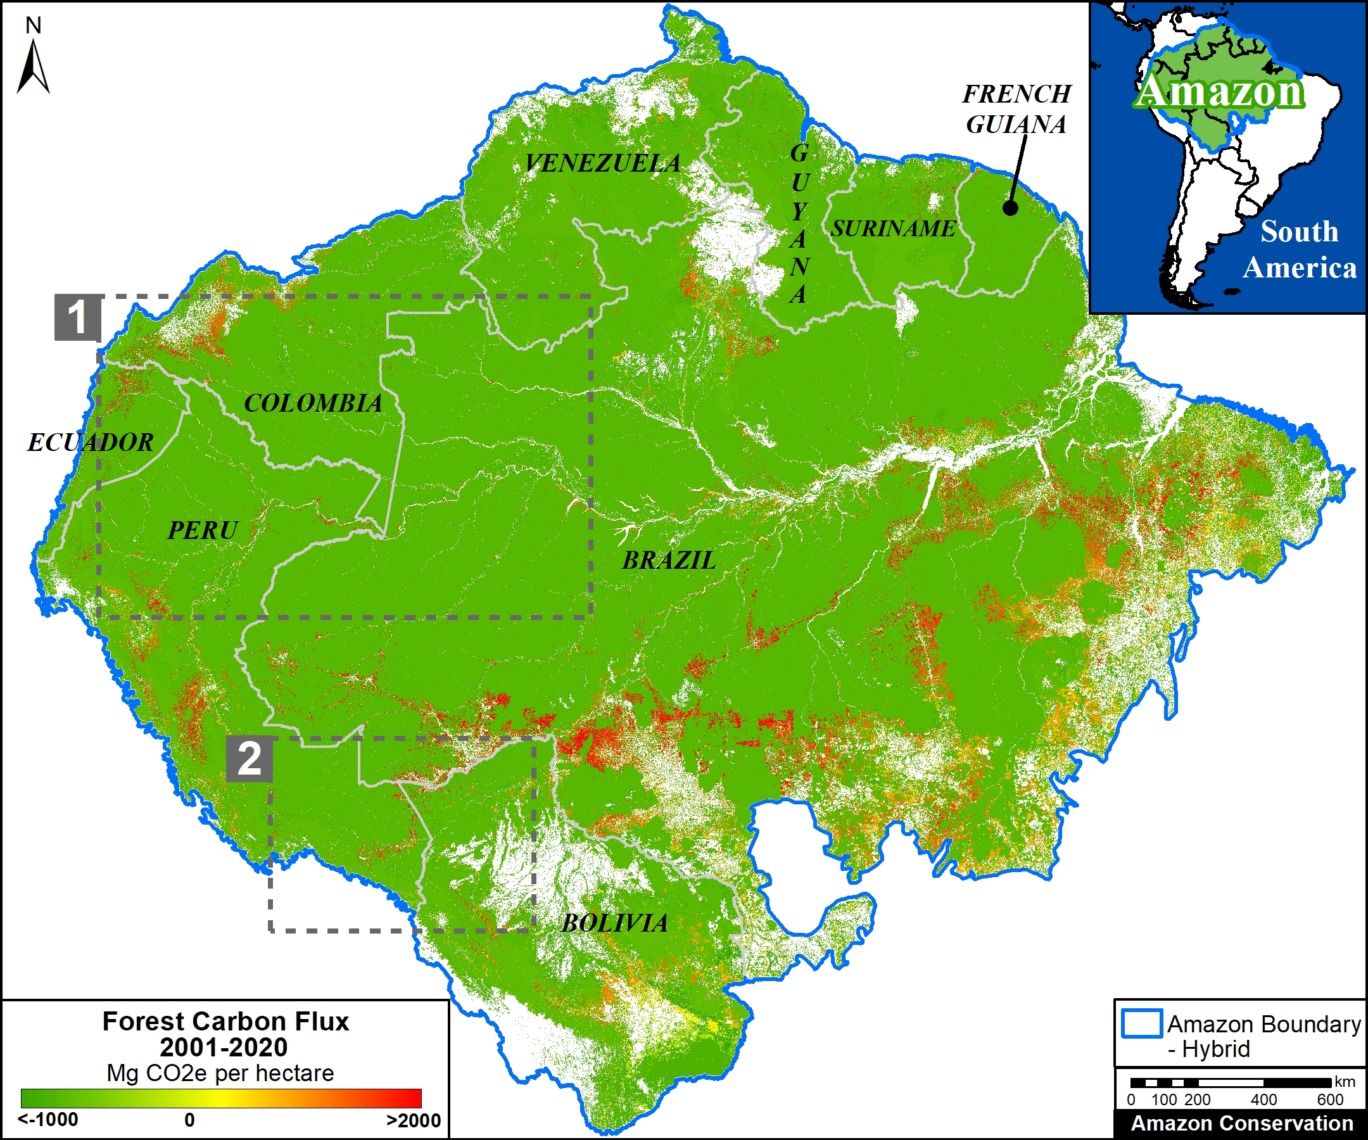
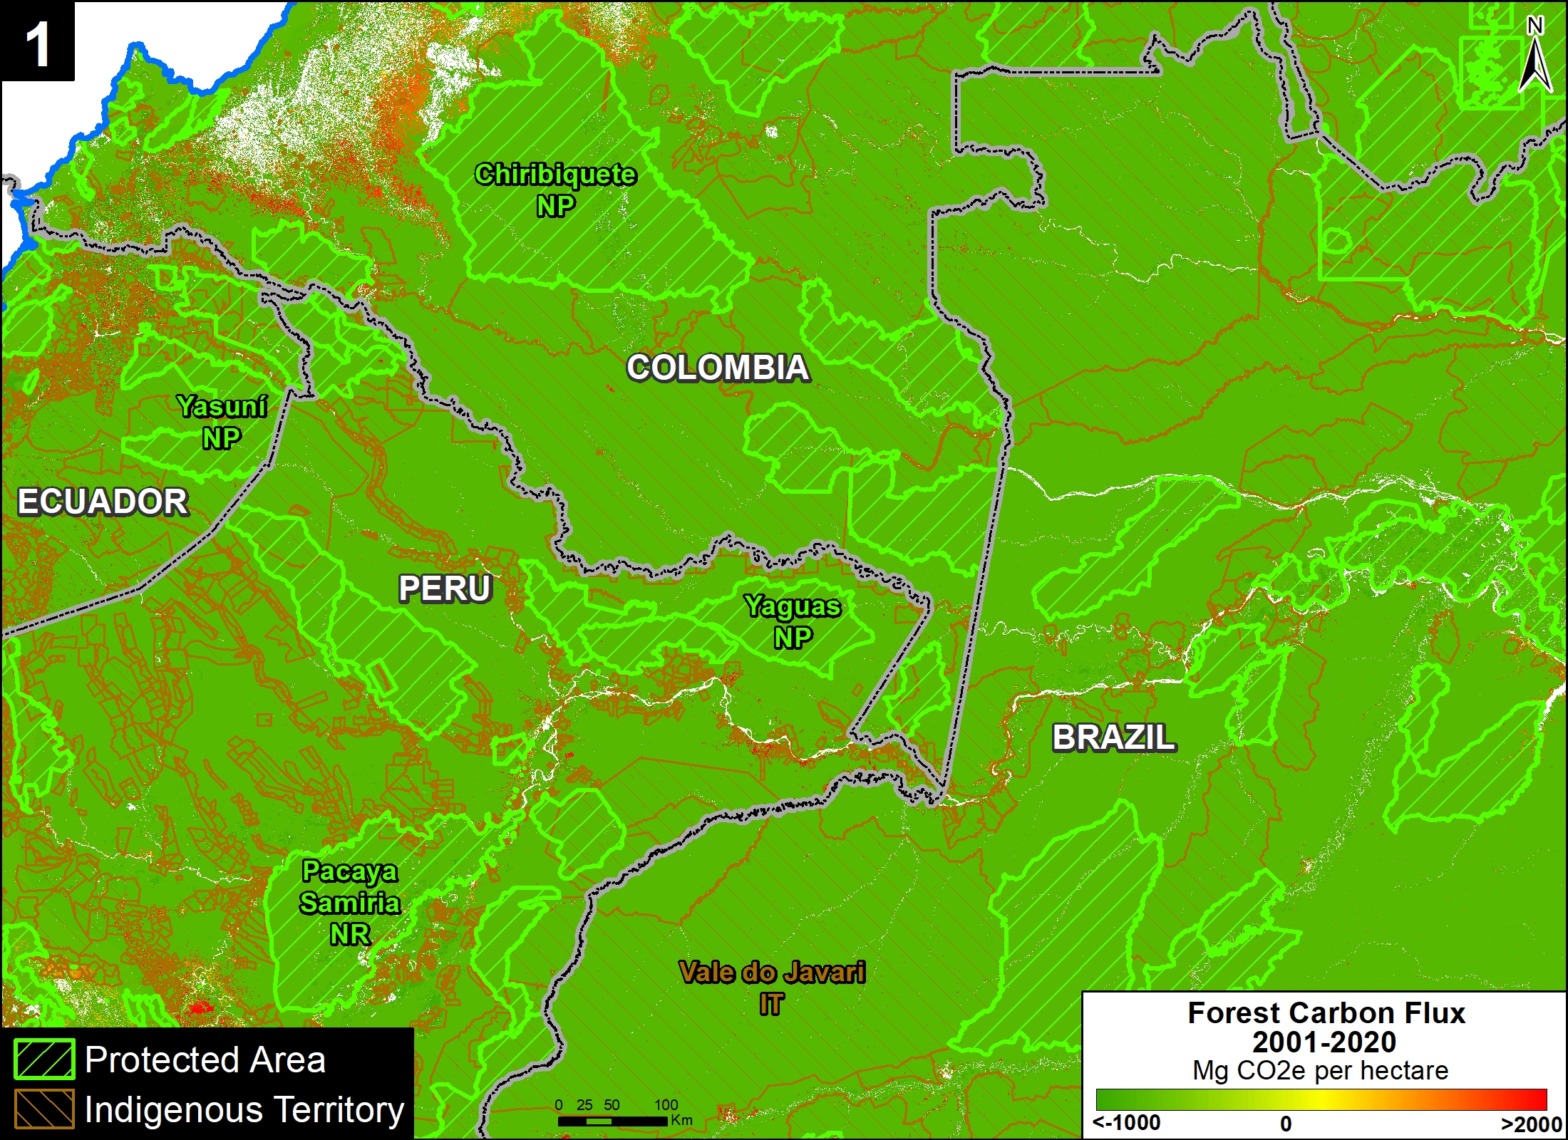
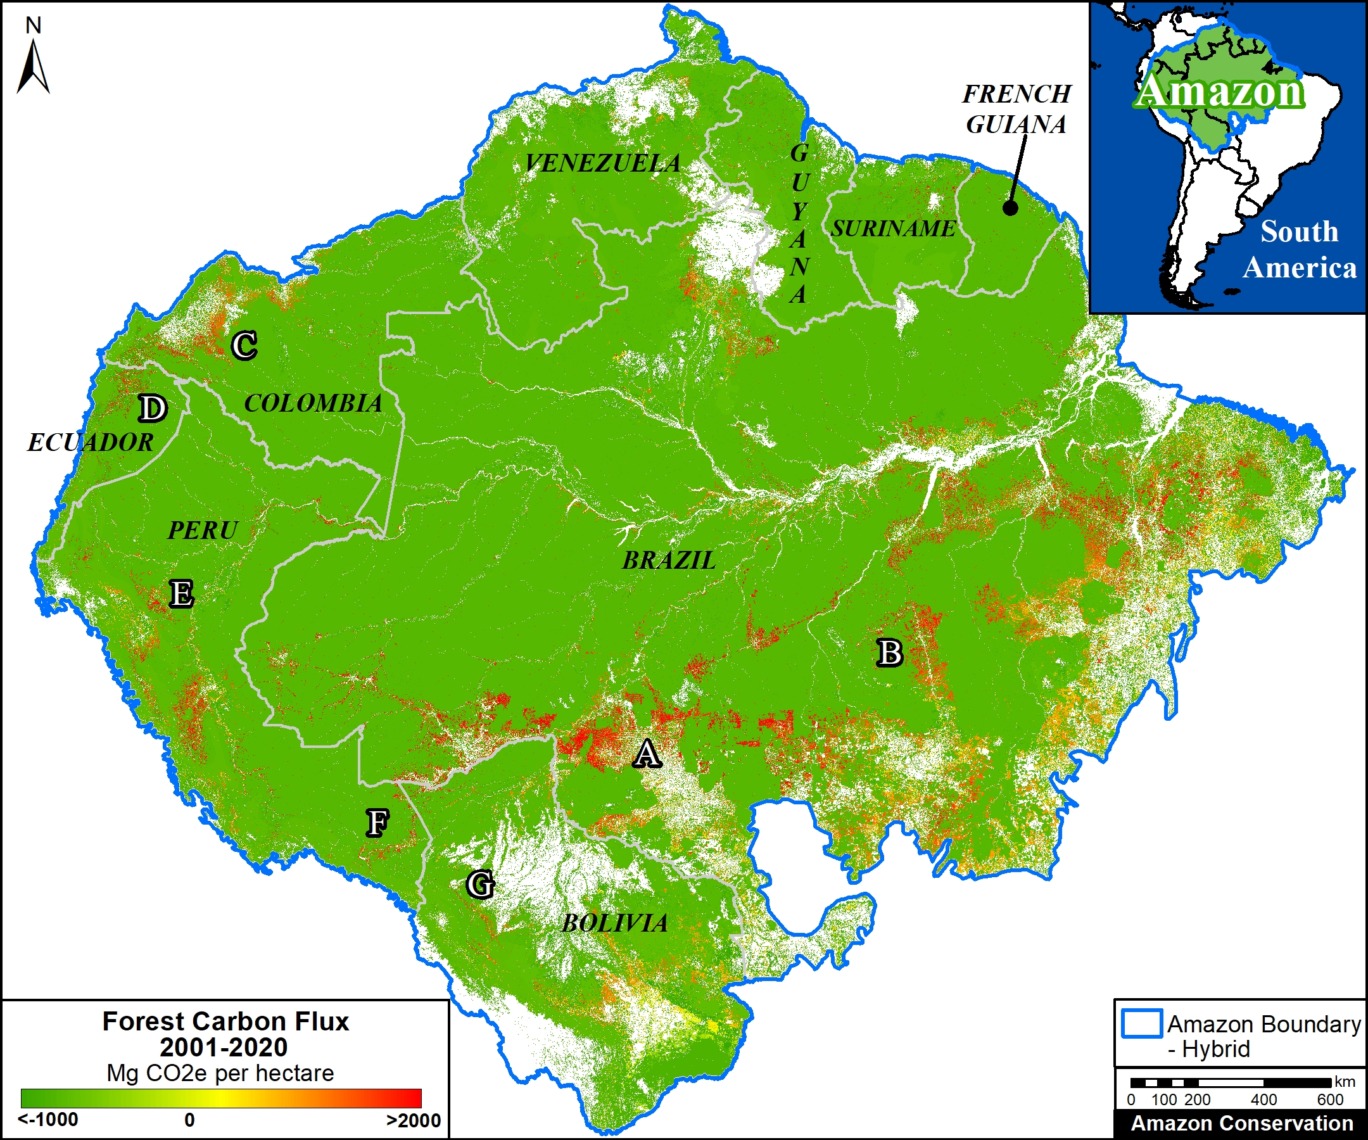
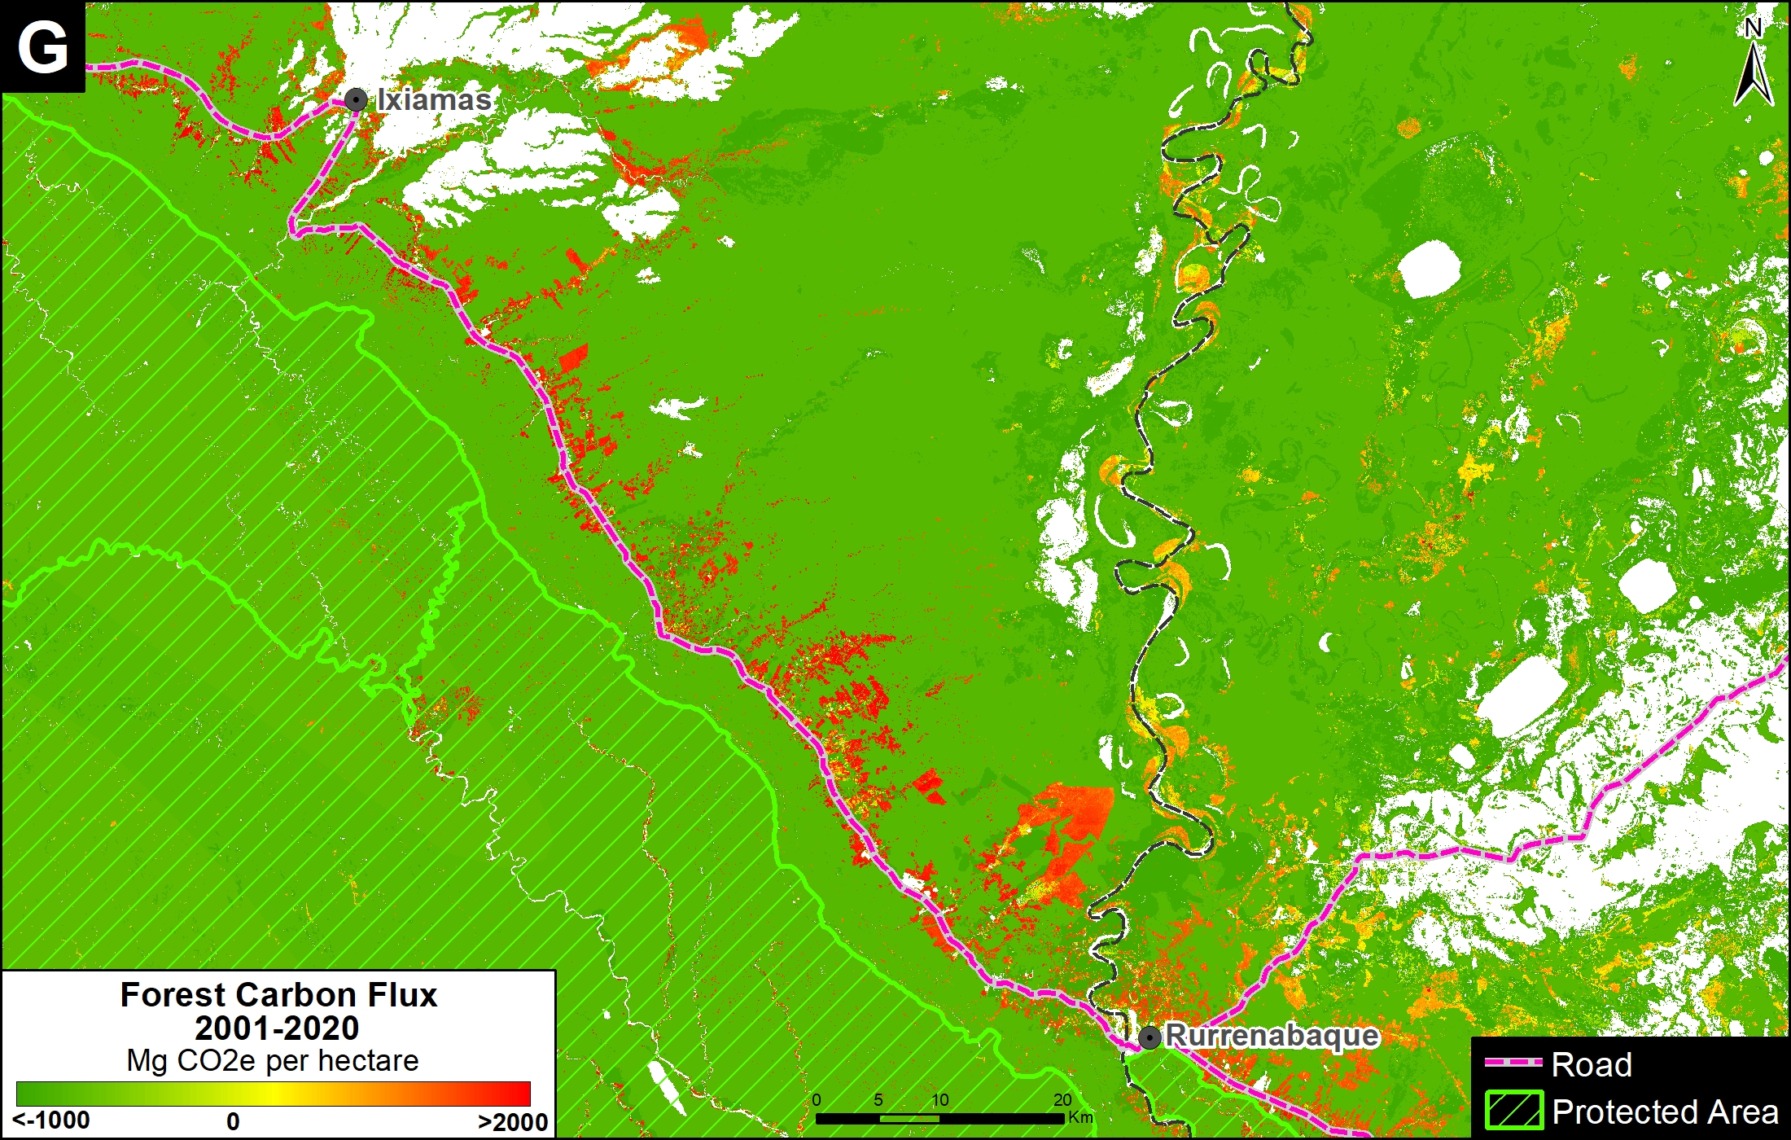
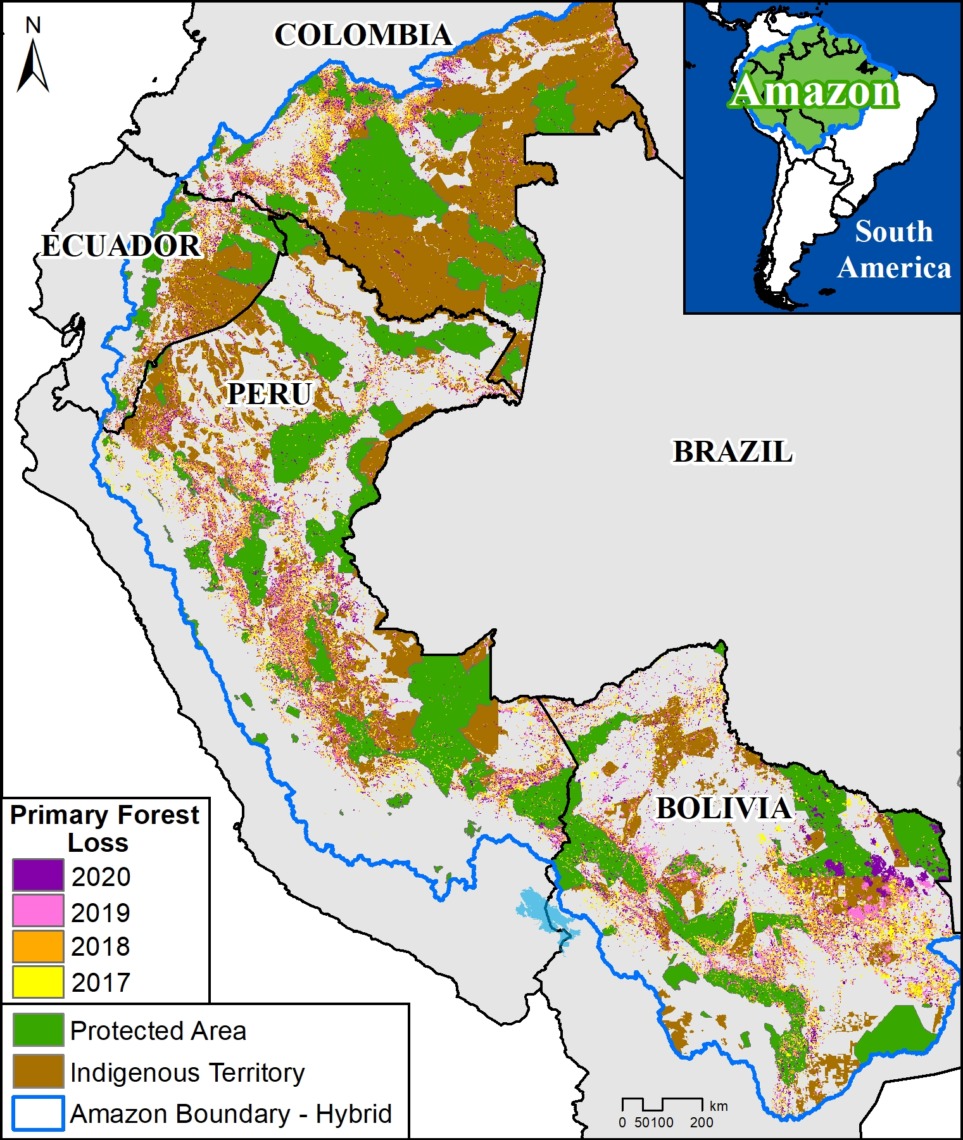
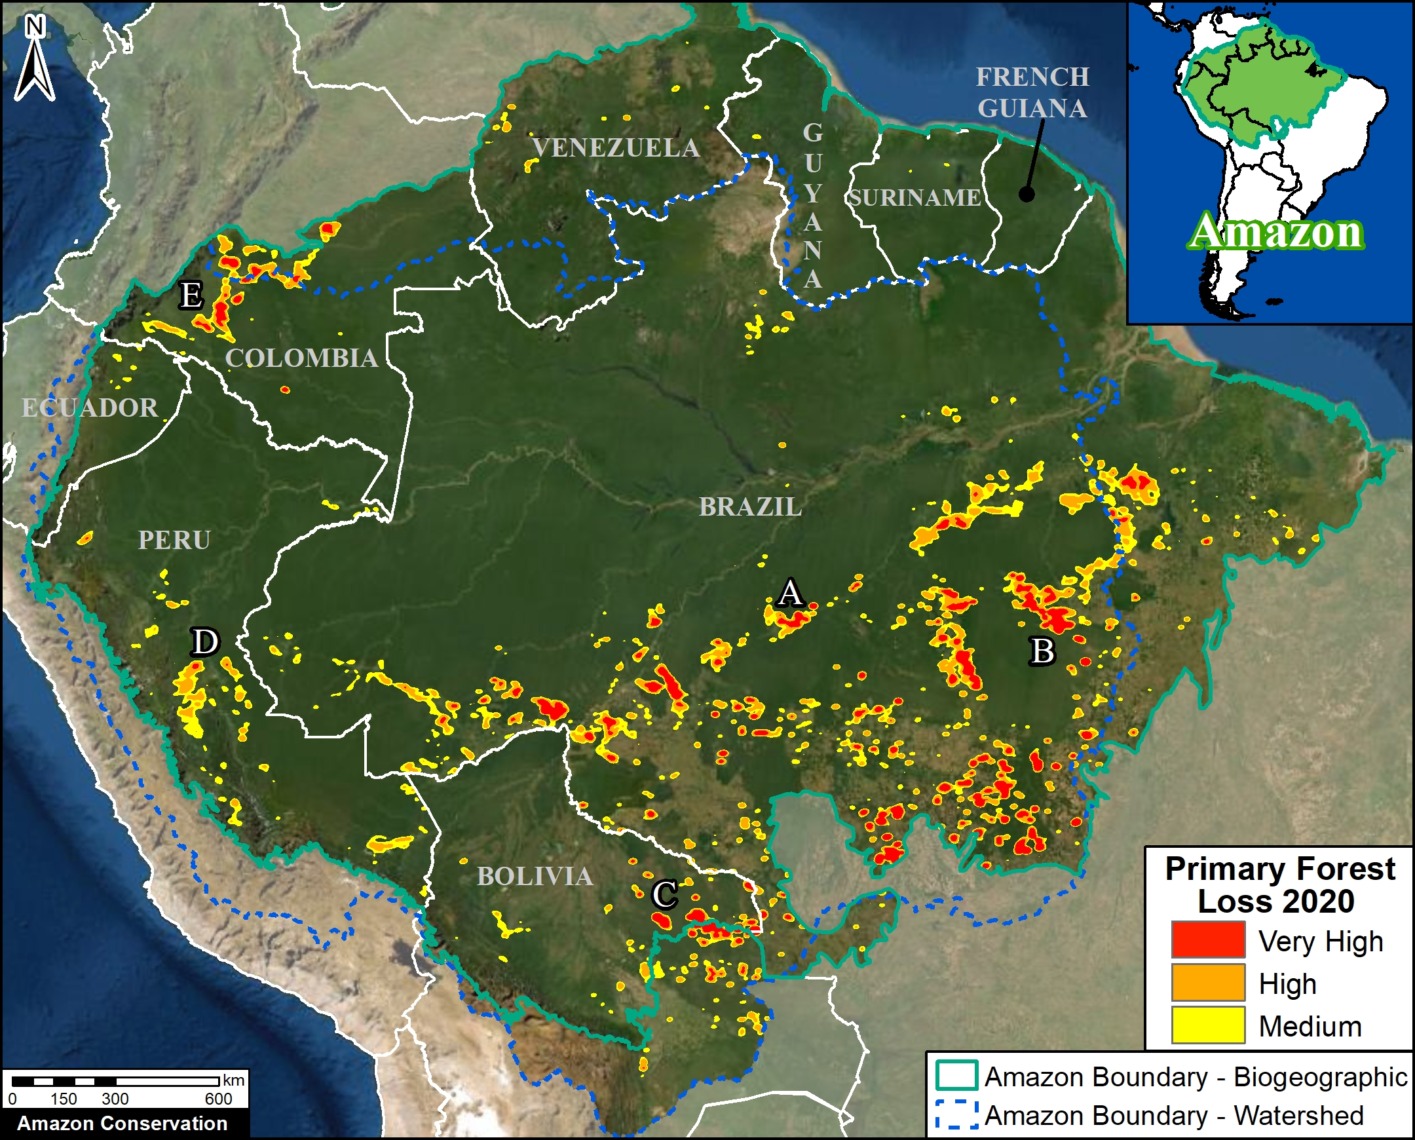
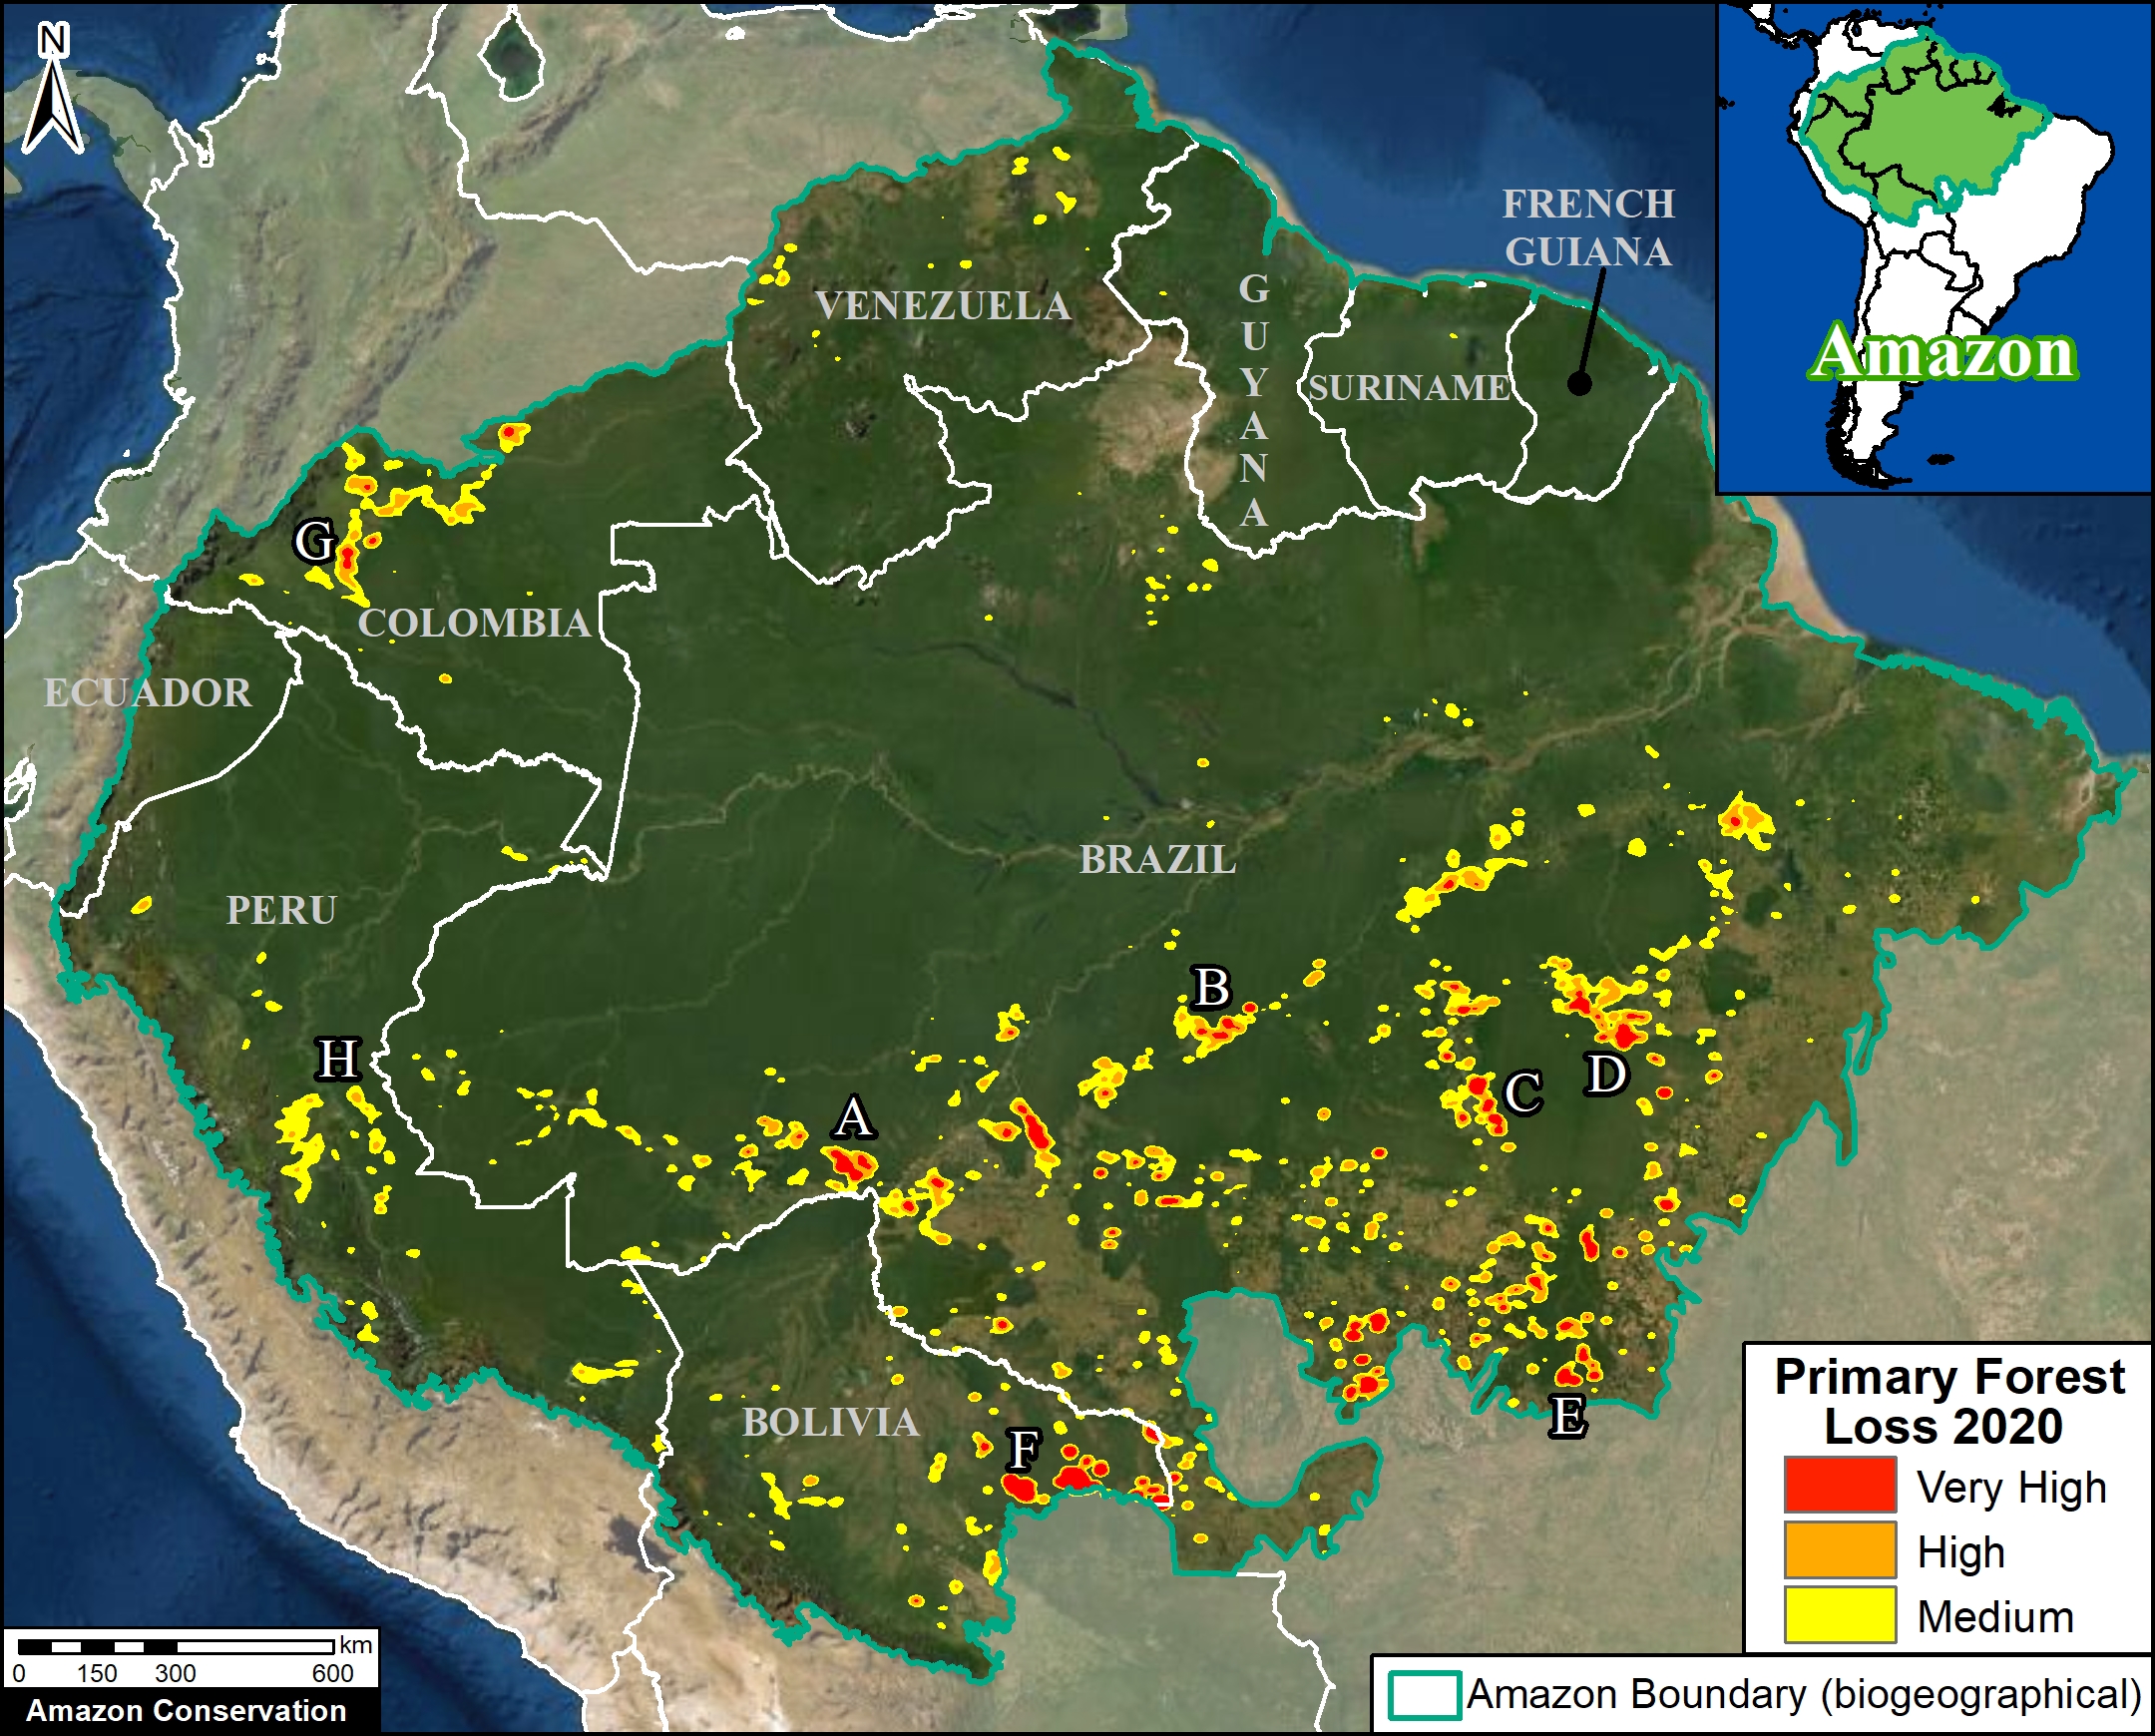
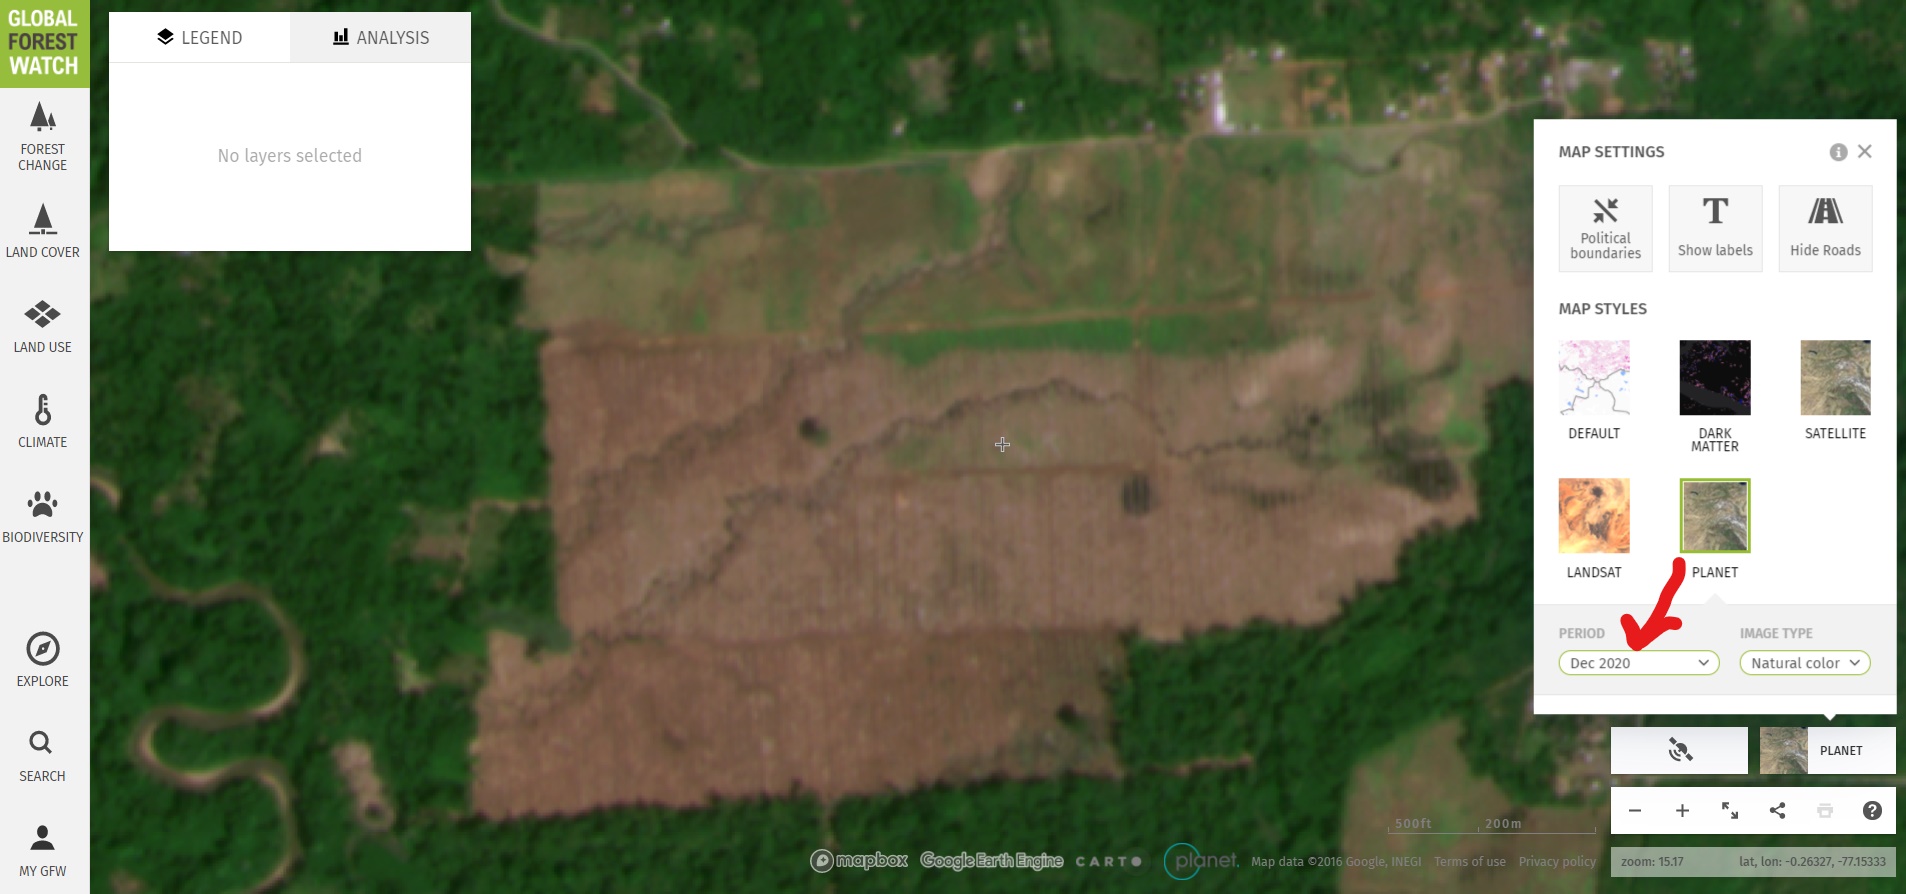
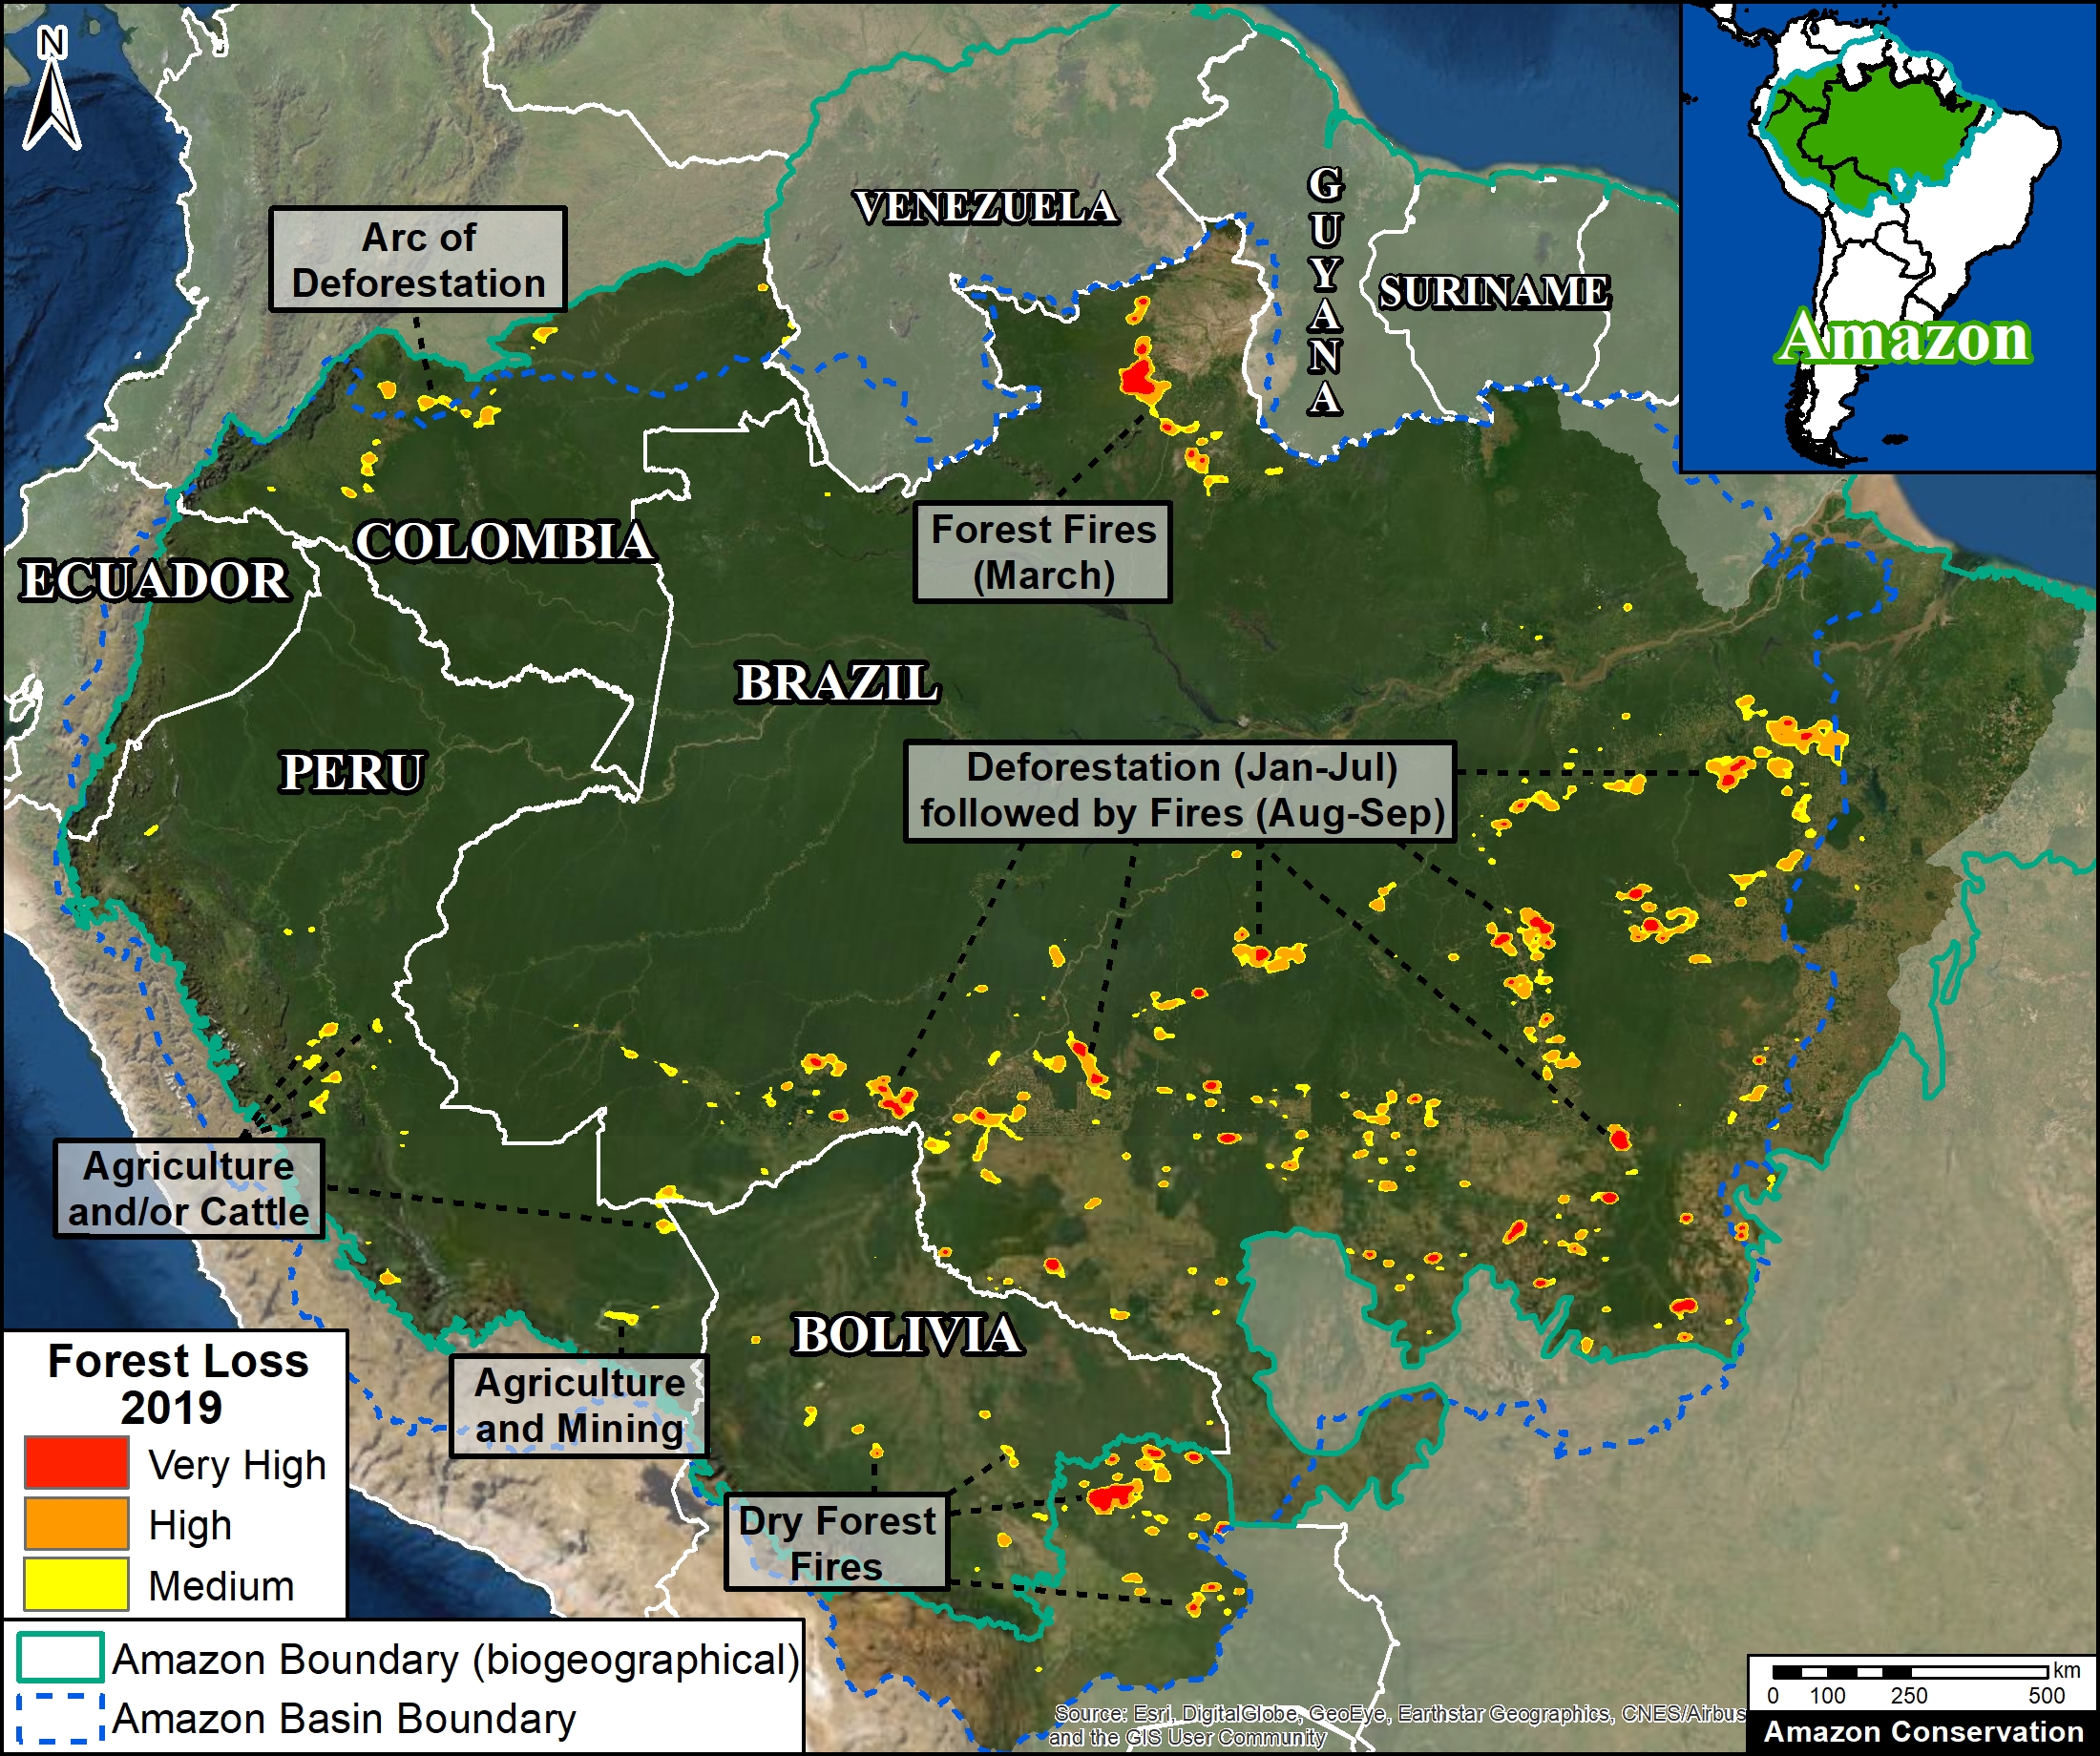
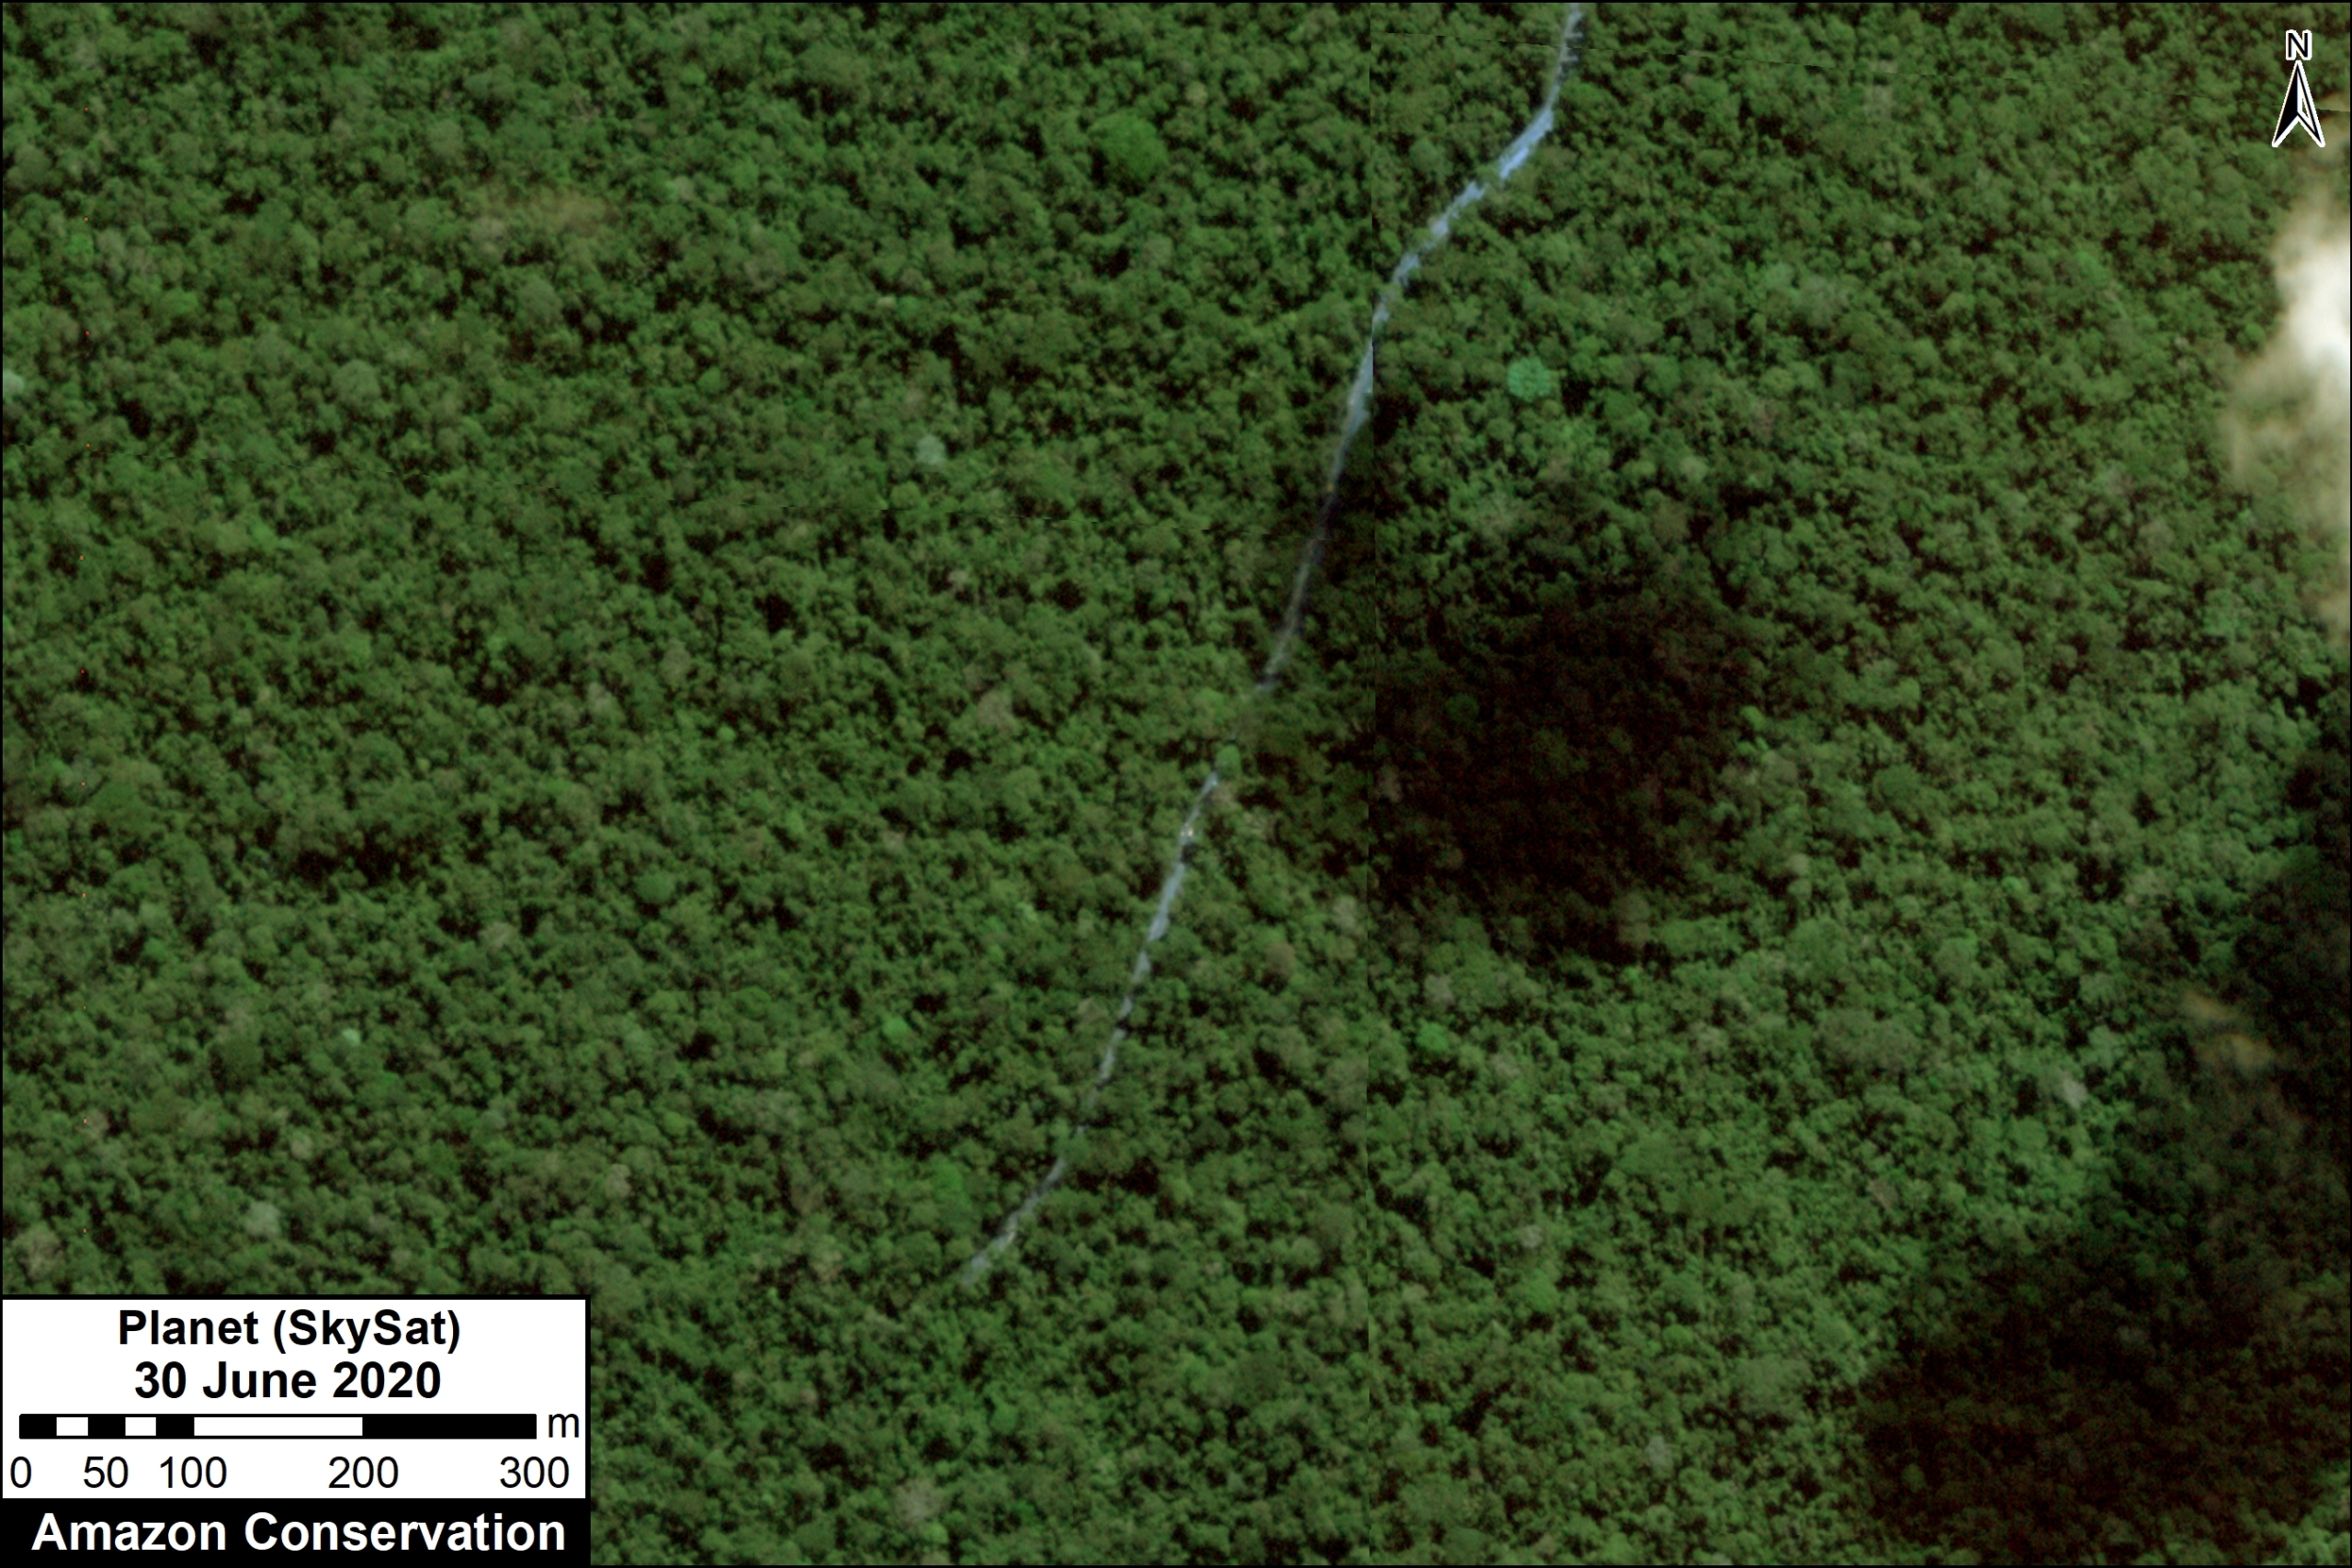
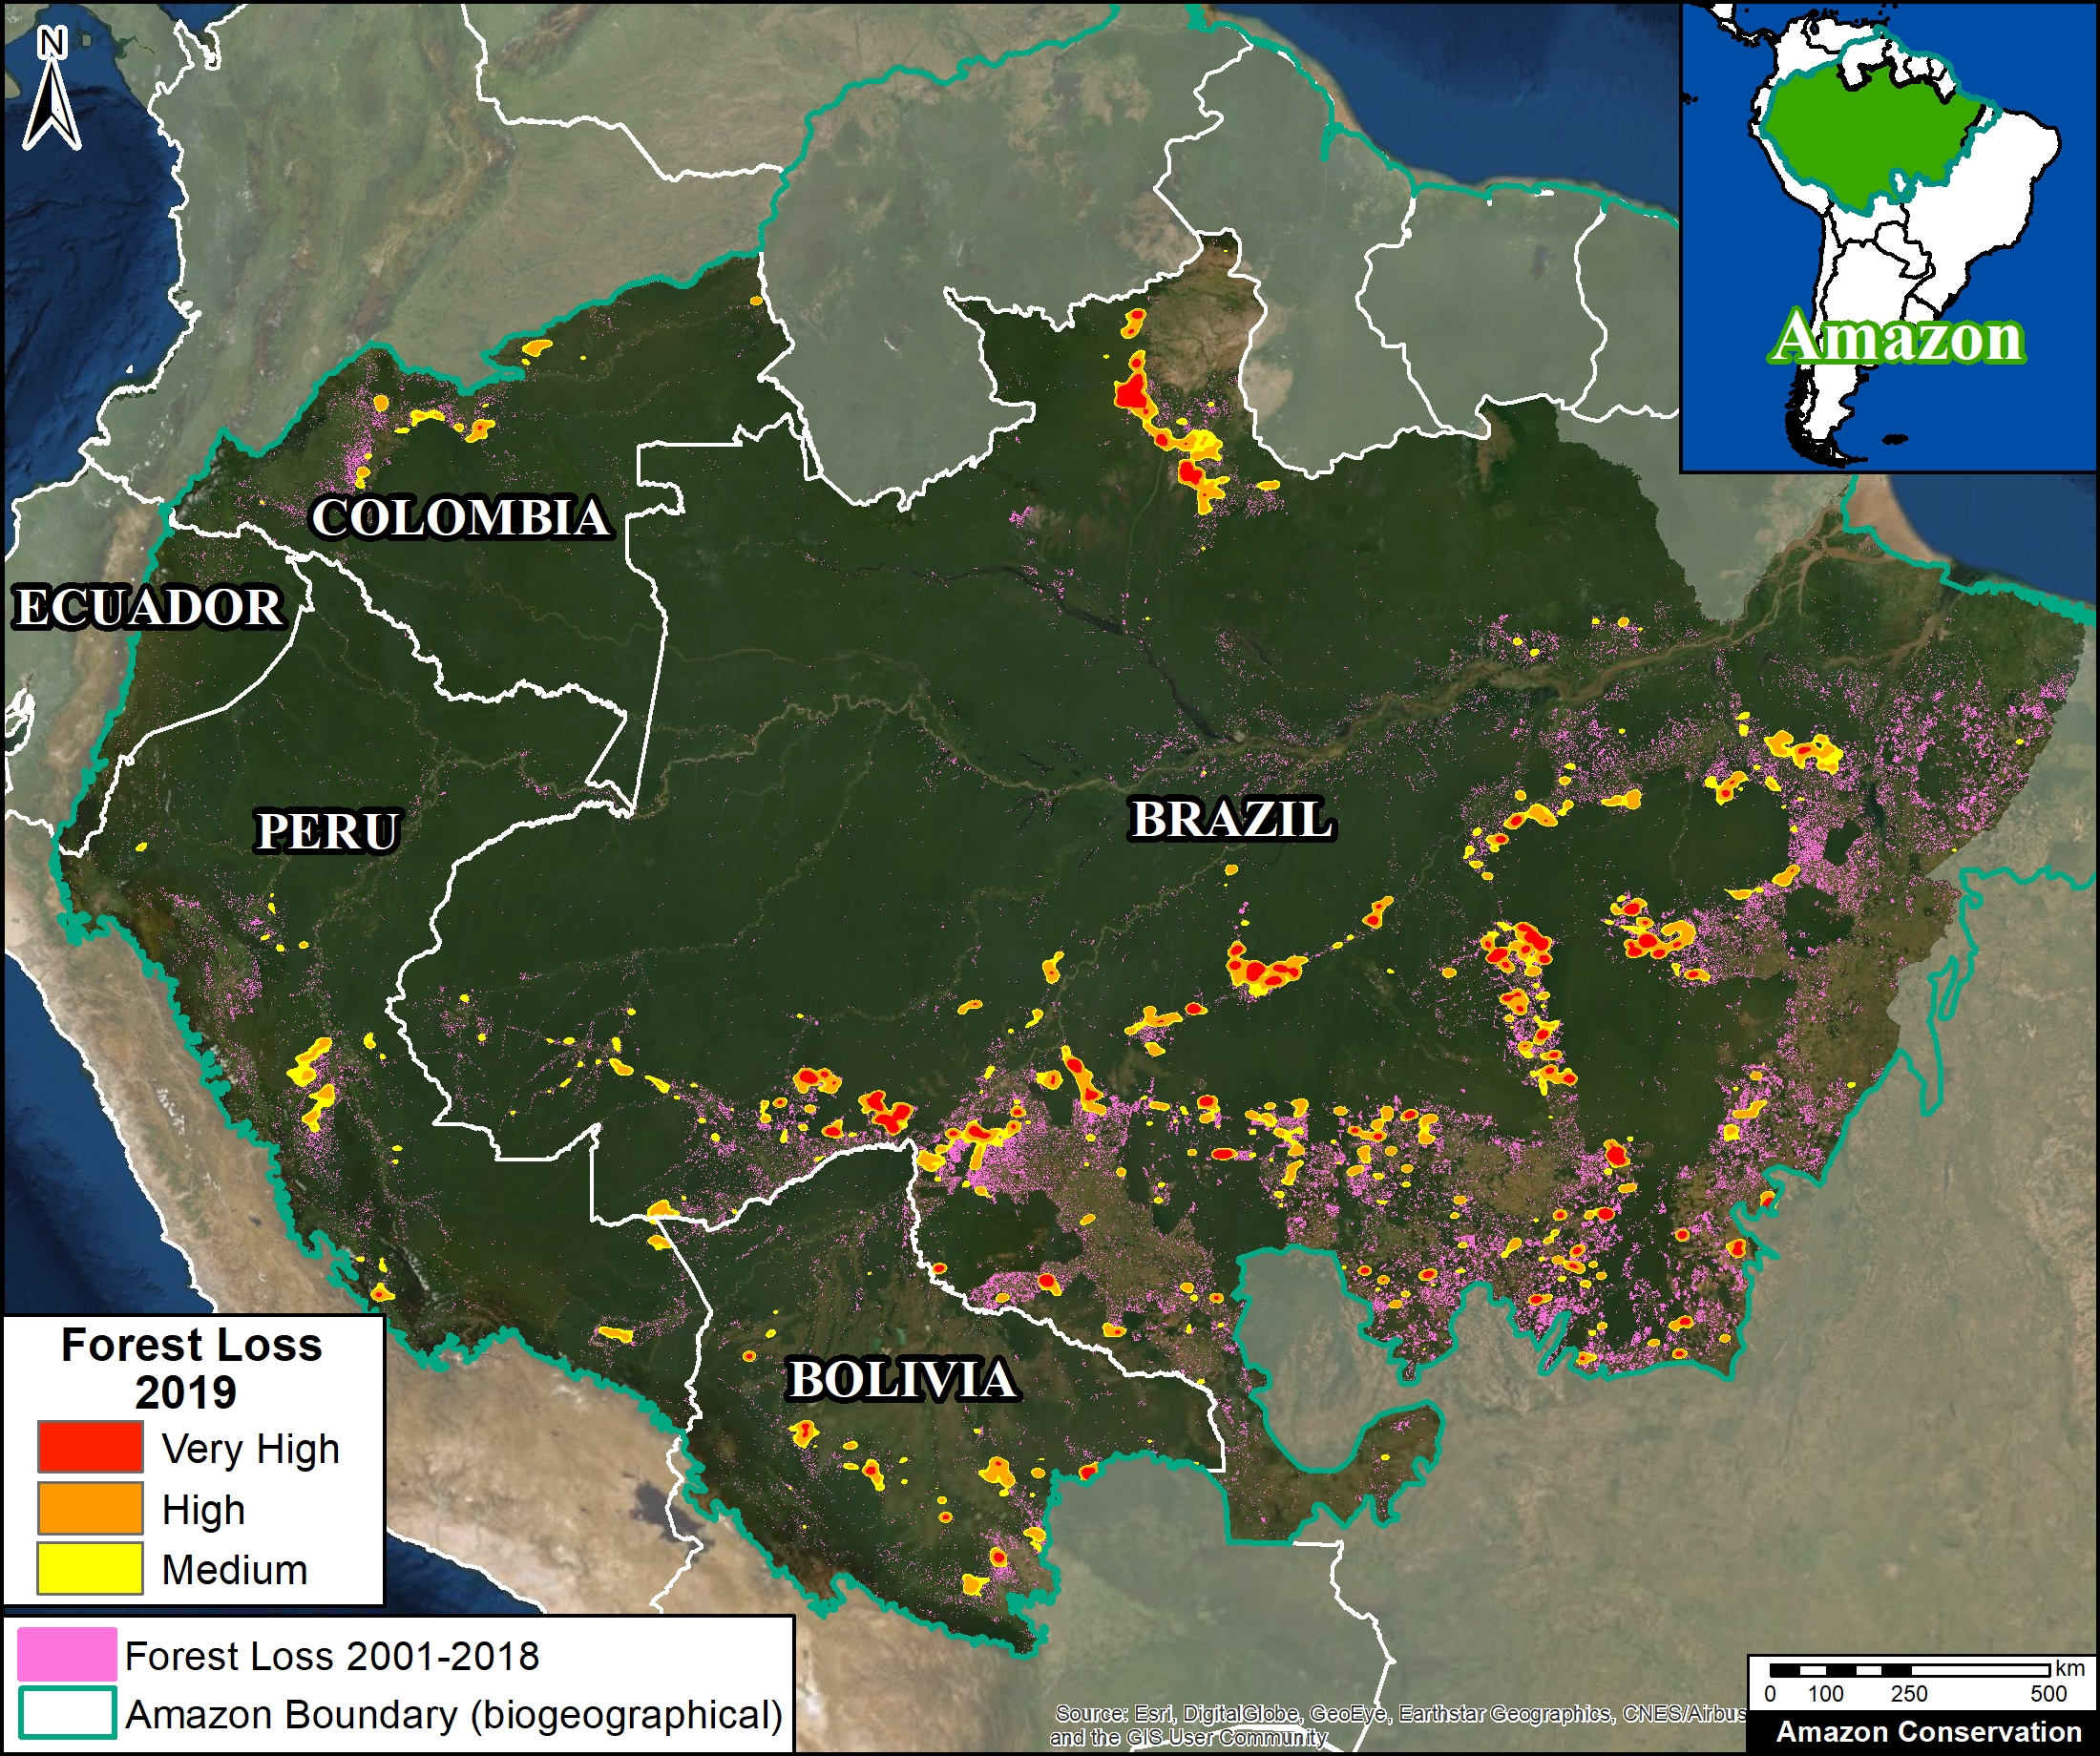
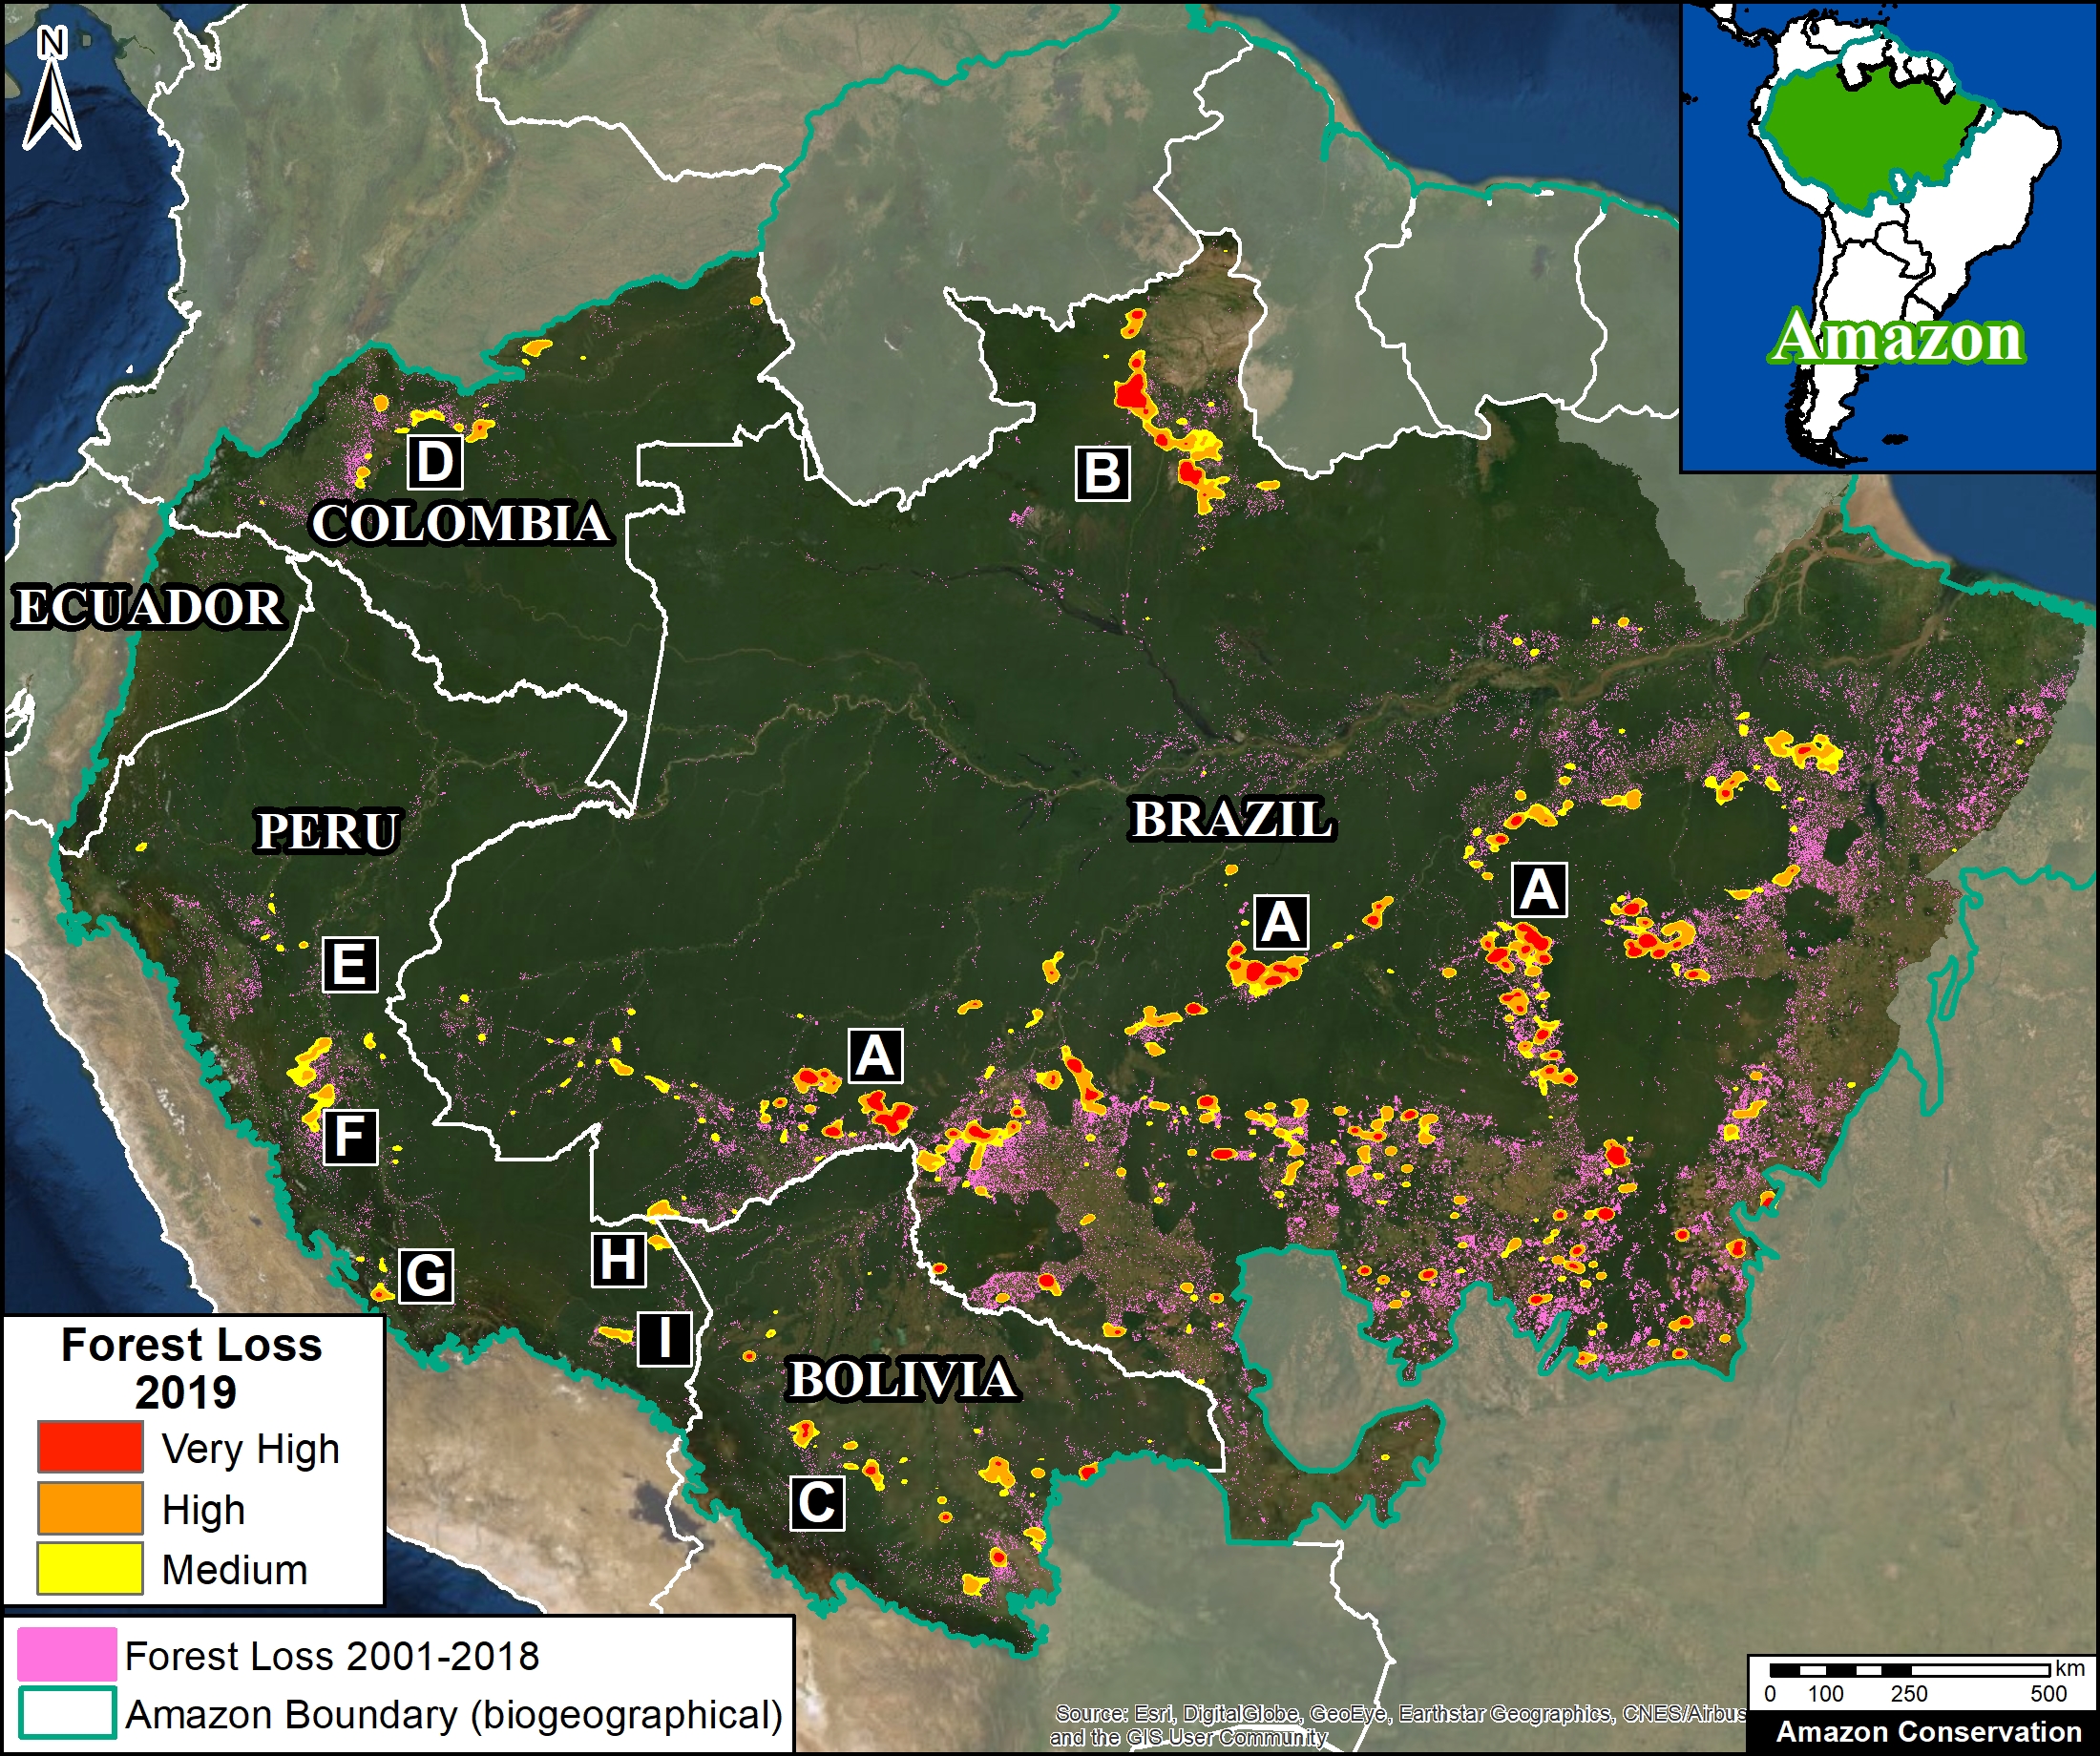
Base Map. Primary forest loss across the western Amazon, with magnified visualization of the data. Click to enlarge. See Methodology for data sources.

As deforestation continues to threaten primary forest across the Amazon, key land use designations are one of the best hopes for the long-term conservation of critical remaining intact forests.

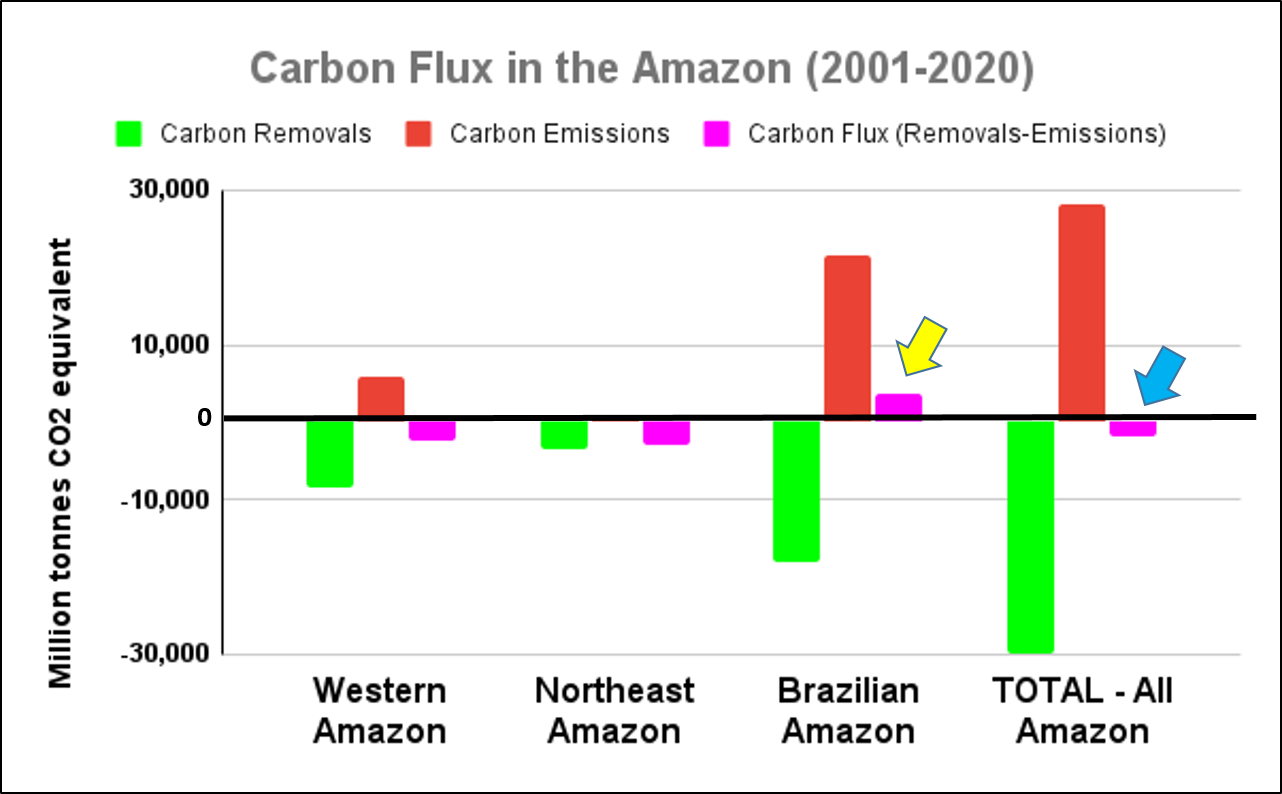
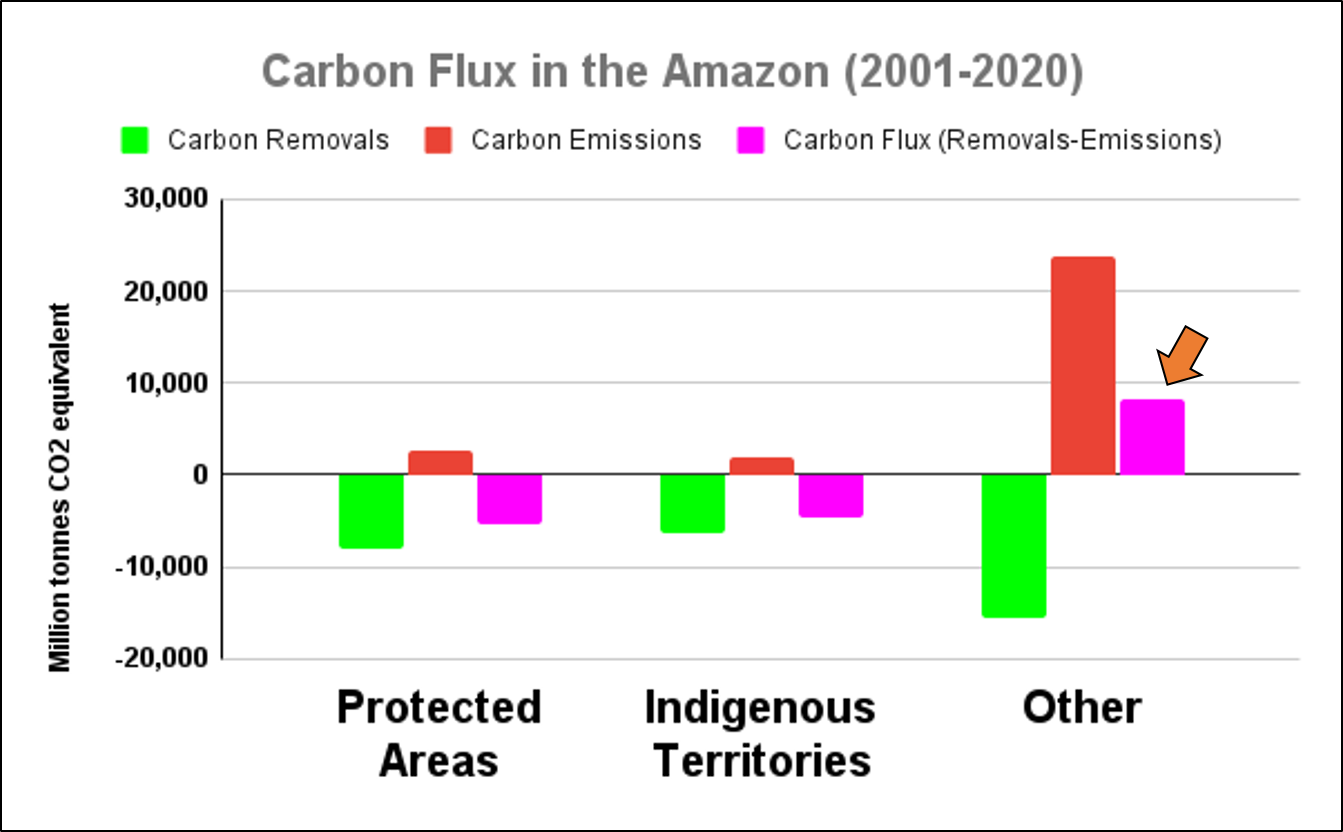
Here, we evaluate the impact of two of the most important land use designations: protected areas and indigenous territories.

Our study area focused on the four mega-diverse countries of the western Amazon (Bolivia, Colombia, Ecuador, & Peru), covering a vast area of over 229 million hectares (see Base Map).

We calculated primary forest loss over the past four years (2017-2020) across the western Amazon and analyzed the results across three major land use categories:

1) Protected Areas (national and state/department levels), which covered 43 million hectares as of 2020.

2) Indigenous Territories (official), which covered over 58 million hectares as of 2020.

3) Other (that is, all remaining areas outside protected areas and indigenous territories), which covered the remaining 127 million hectares as of 2020.

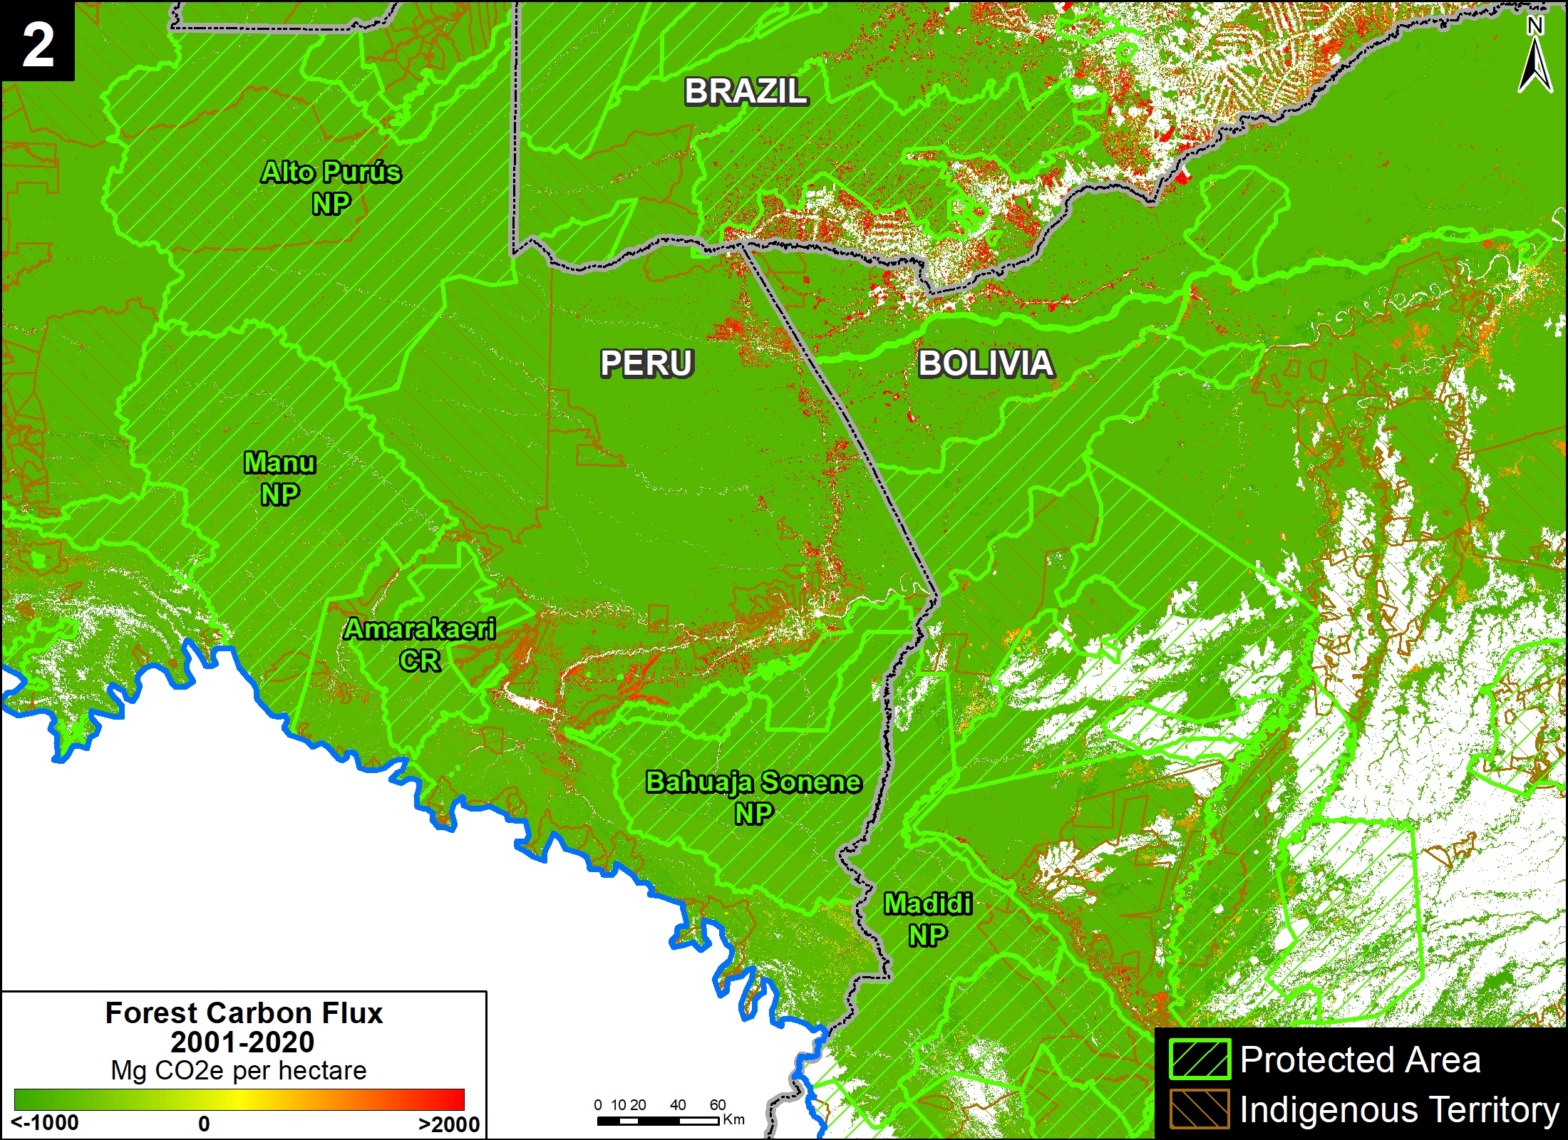
In addition, we took a deeper look at the Peruvian Amazon and also included long-term forestry lands.

In summary, we found that, averaged across all four years, protected areas had the lowest primary forest loss rate, closely followed by indigenous territories (see Figure 1). Outside of these critical areas, the primary forest loss rate was more than double.

Below, we describe the key results in greater detail, including a detailed look at each country.


Key Findings – Western Amazon

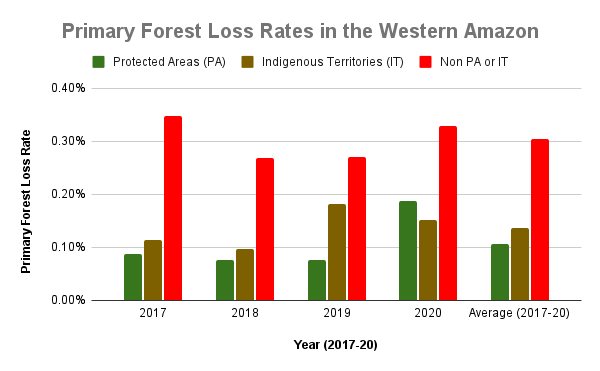
Figure 1. Primary forest loss rates in the western Amazon.

Overall, we documented the loss of over 2 million hectares of primary forests across the four countries of the western Amazon between 2017 and 2020. Of the four years, 2020 had the most forest loss (588,191 ha).

Of this total, 9% occurred in protected areas (179,000 ha) and 15% occurred in indigenous territories (320,000 ha), while the vast majority (76%) occurred outside key these land use designations (1.6 million ha).

To standardize these results for the varying area coverages, we calculated primary forest loss rates (loss/total area of each category). Figure 1 displays the combined results for these rates across all four countries.

From 2017-19, protected areas (green) had the lowest primary forest loss rates across the western Amazon (less than 0.10%).

Indigenous territories (brown) also had low primary forest loss rates from 2017-18 (less than 0.11%), but this rose in 2019 (0.18%) due to fires in Bolivia.

In the intense COVID pandemic year of 2020, this overall pattern flipped, with elevated primary forest loss in protected areas, again largely due to major fires in Bolivia. Thus, indigenous territories had the lowest primary forest loss rate followed by protected areas (0.15% and 0.19%, respectively) in 2020.

Averaged across all four years, protected areas had the lowest primary forest loss rate (0.11%), closely followed by indigenous territories (0.14%). Outside of these critical areas (red), the primary forest loss rate was more than double (0.30%). The lowest primary forest loss rates (less than 0.10%) occurred in the protected areas of Ecuador and Peru (0.01% and 0.03%, respectively), and indigenous territories of Colombia (0.07%).

Country Results

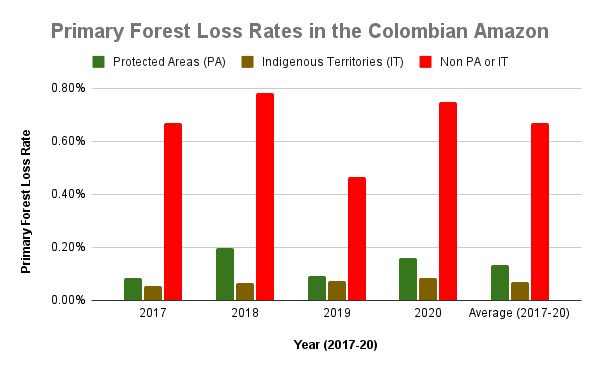
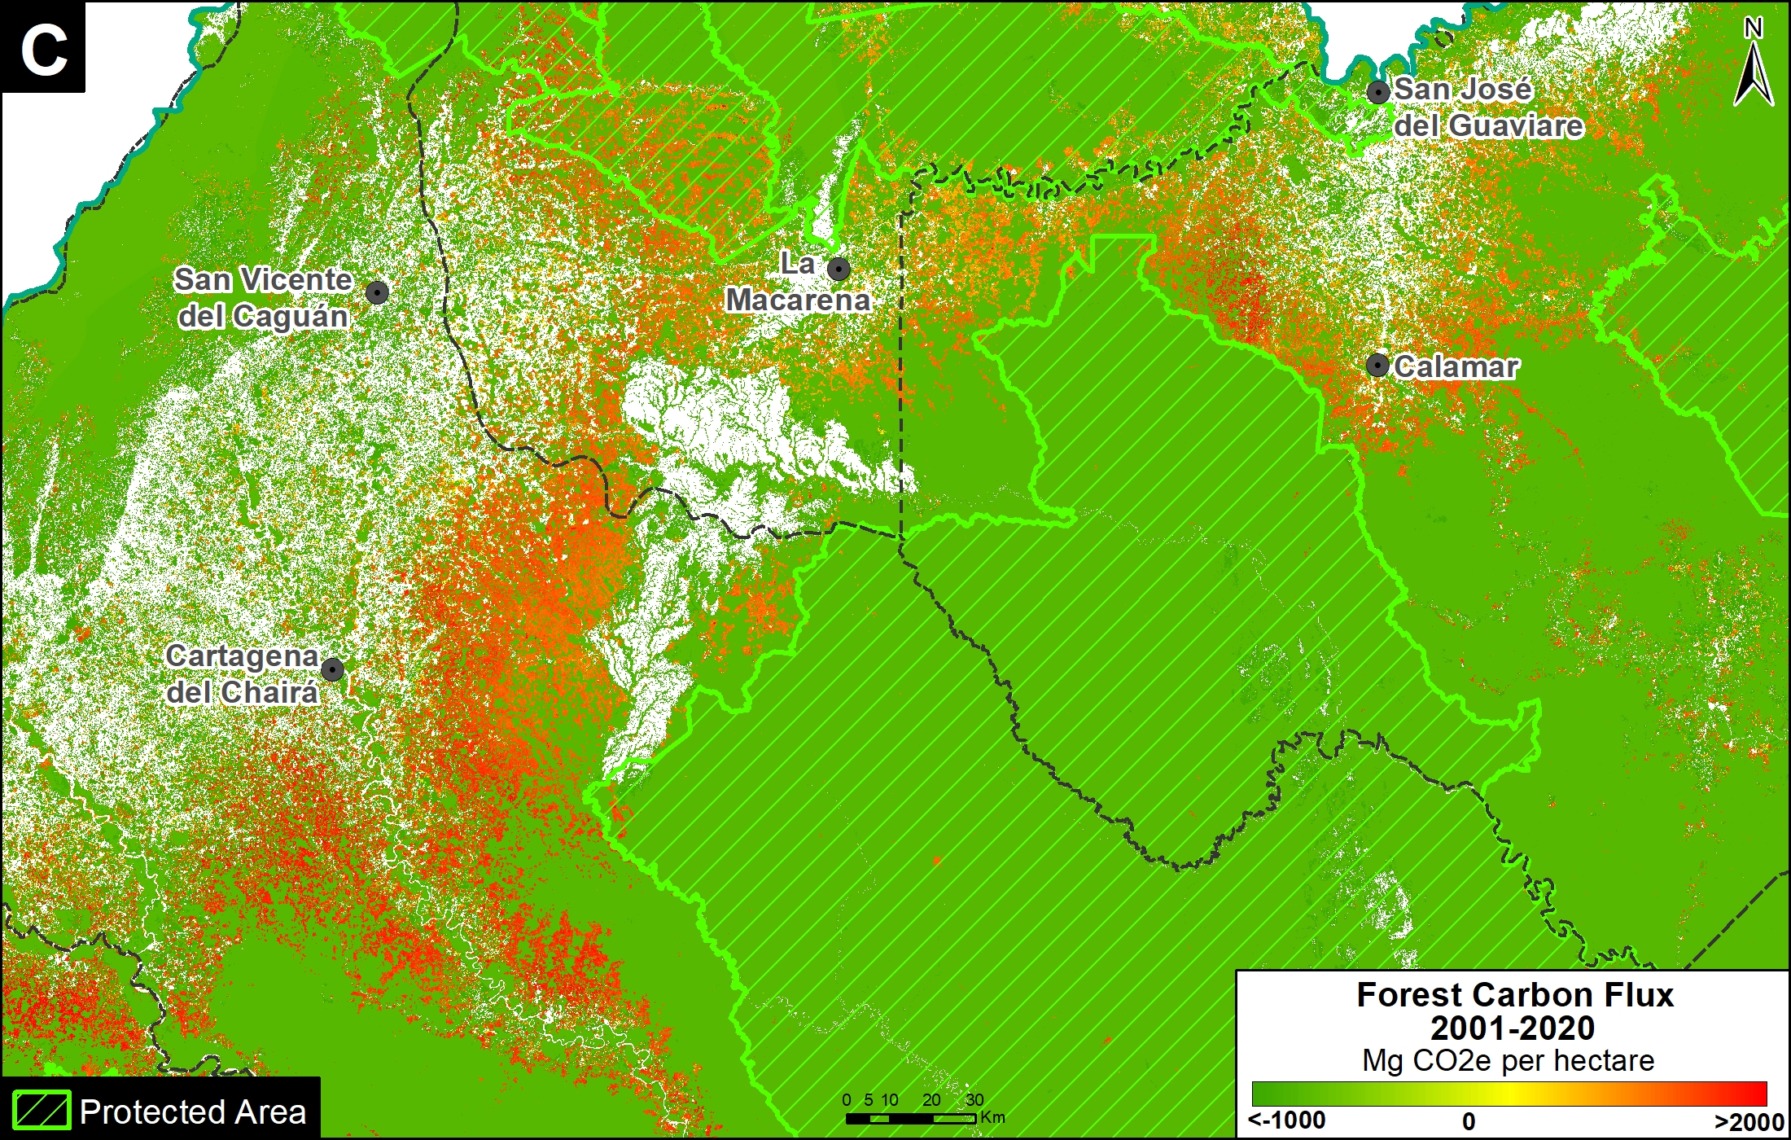
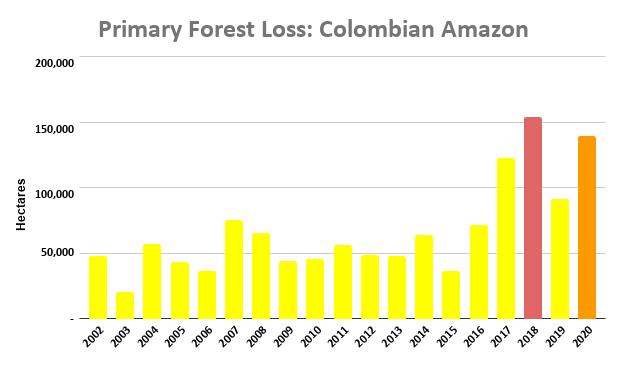
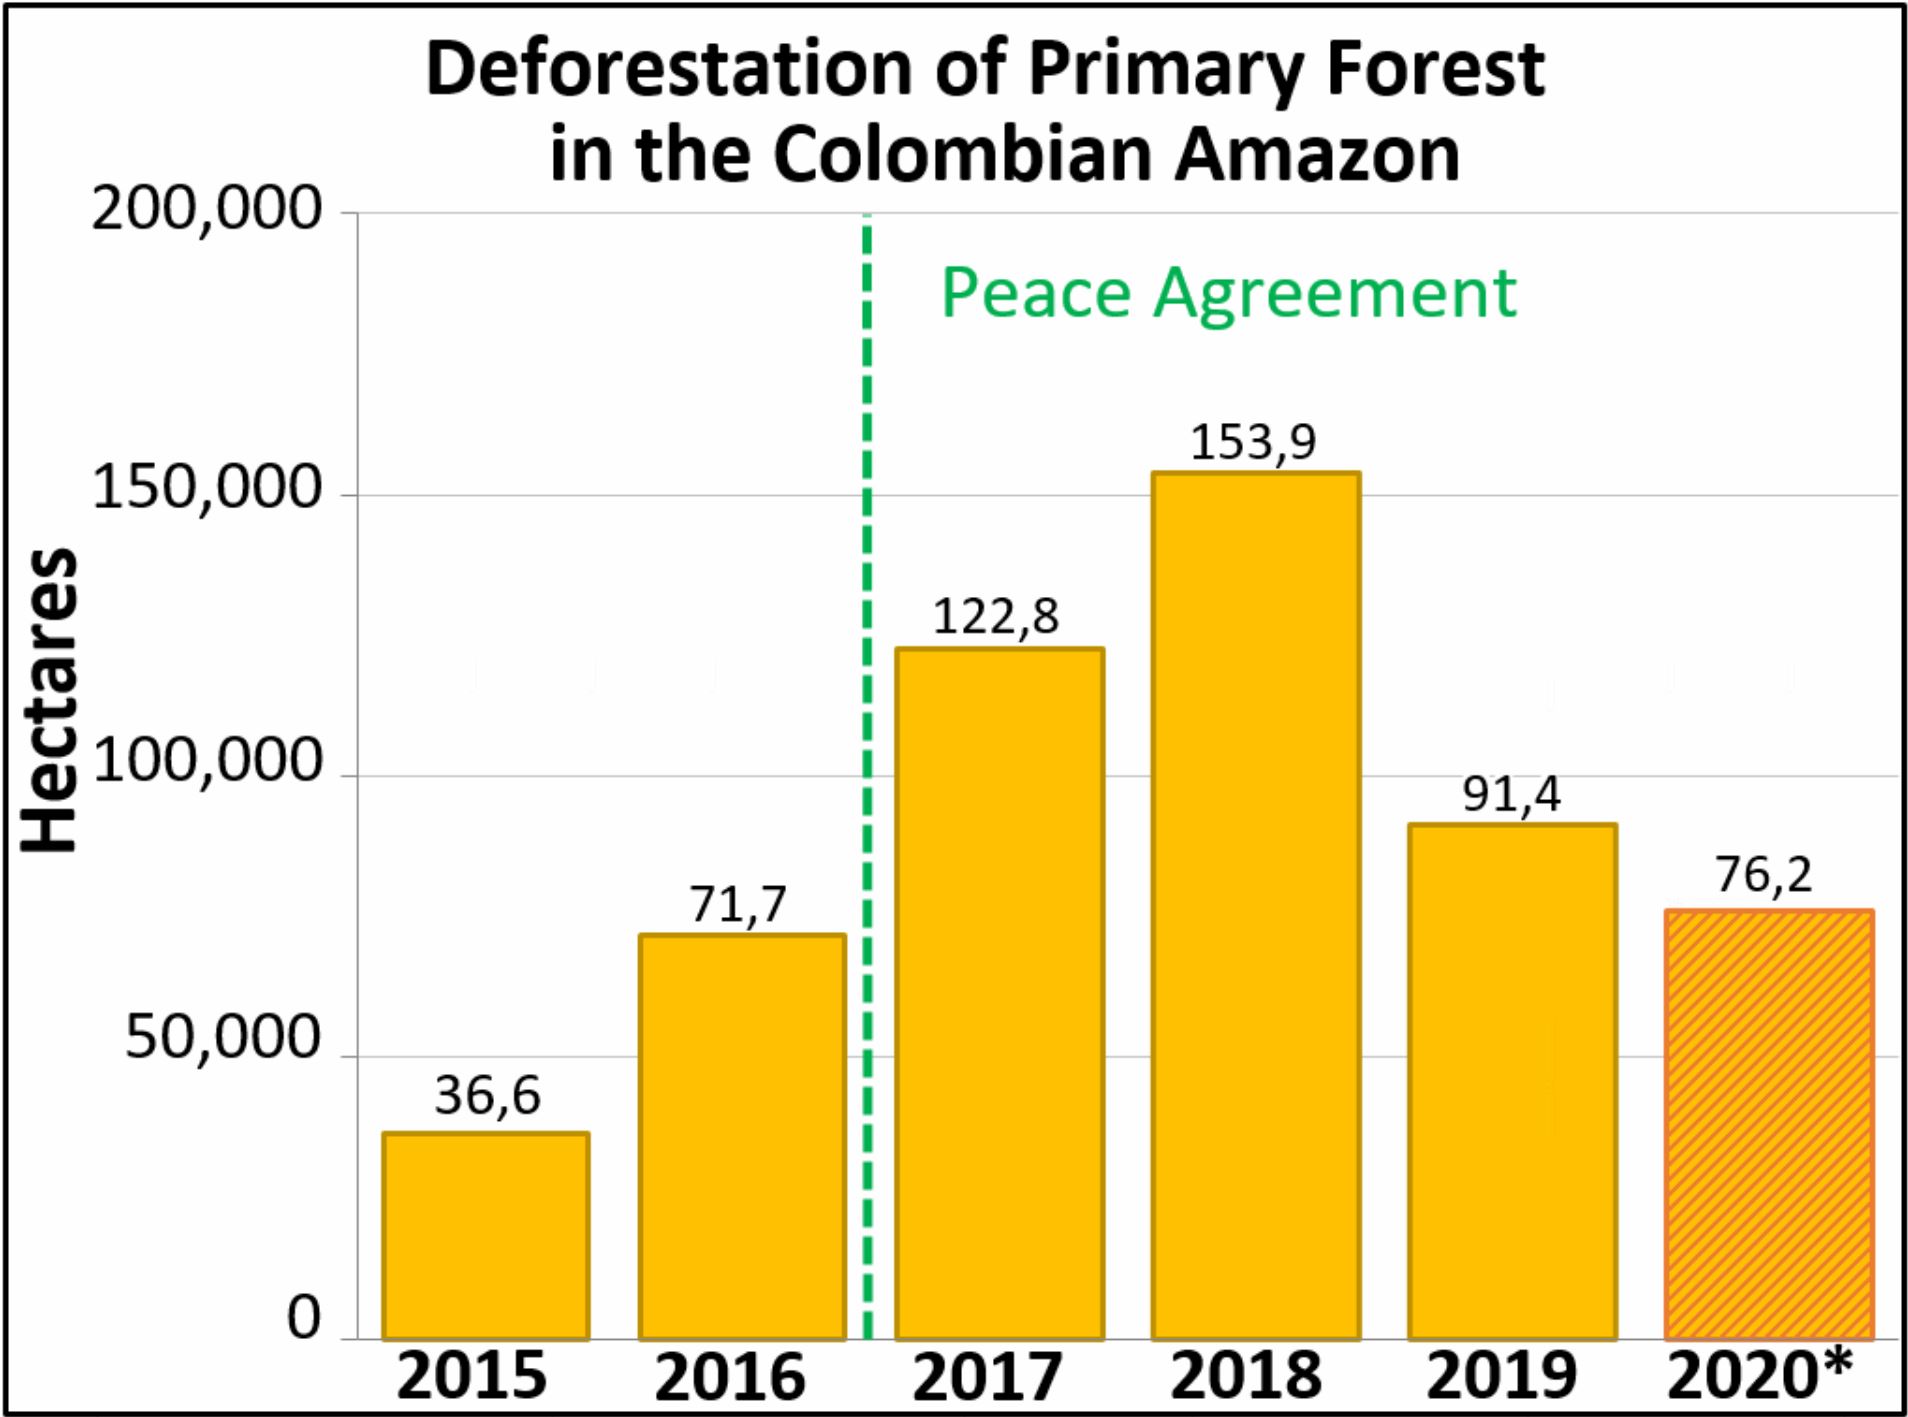
Figure 2. Primary forest loss rates in the Colombian Amazon.

Colombian Amazon

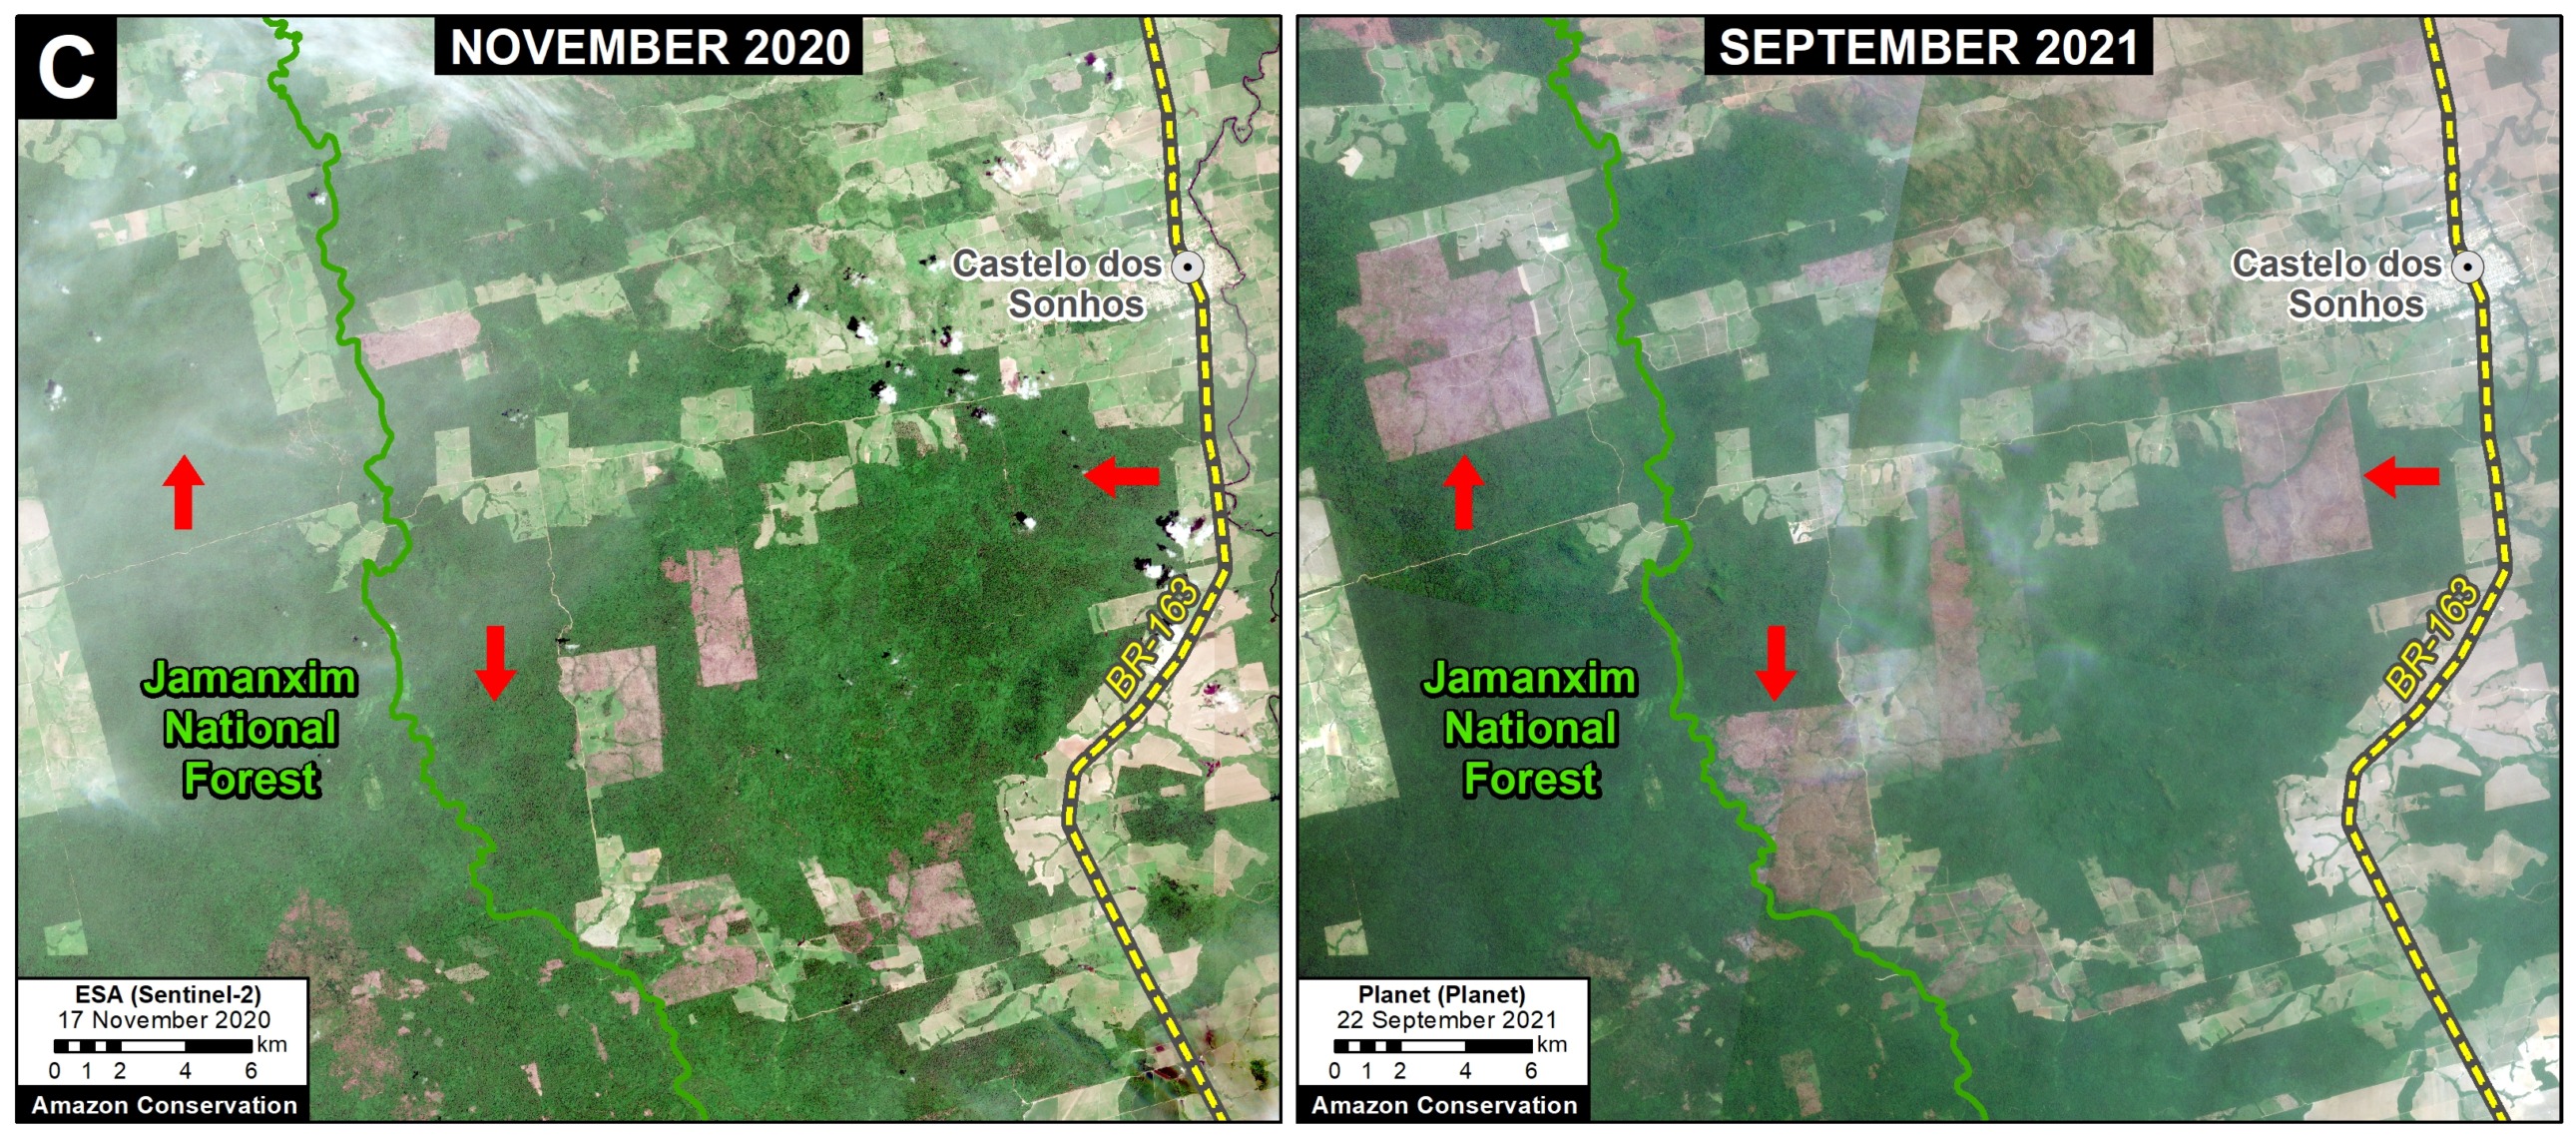
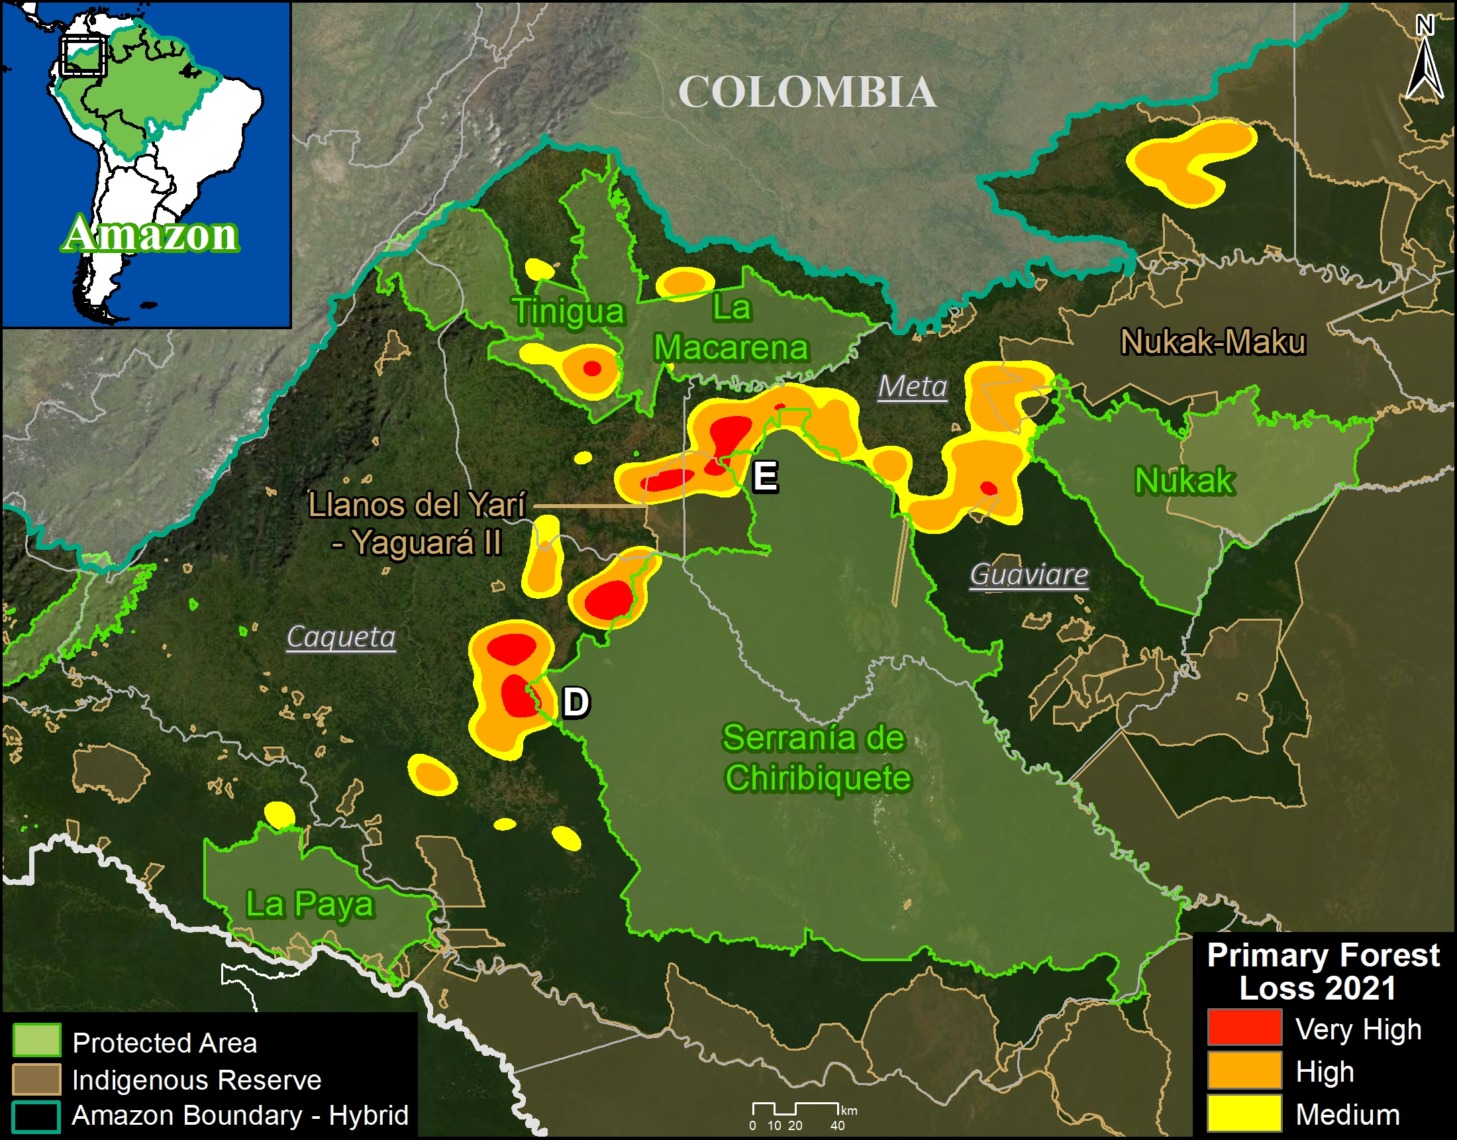
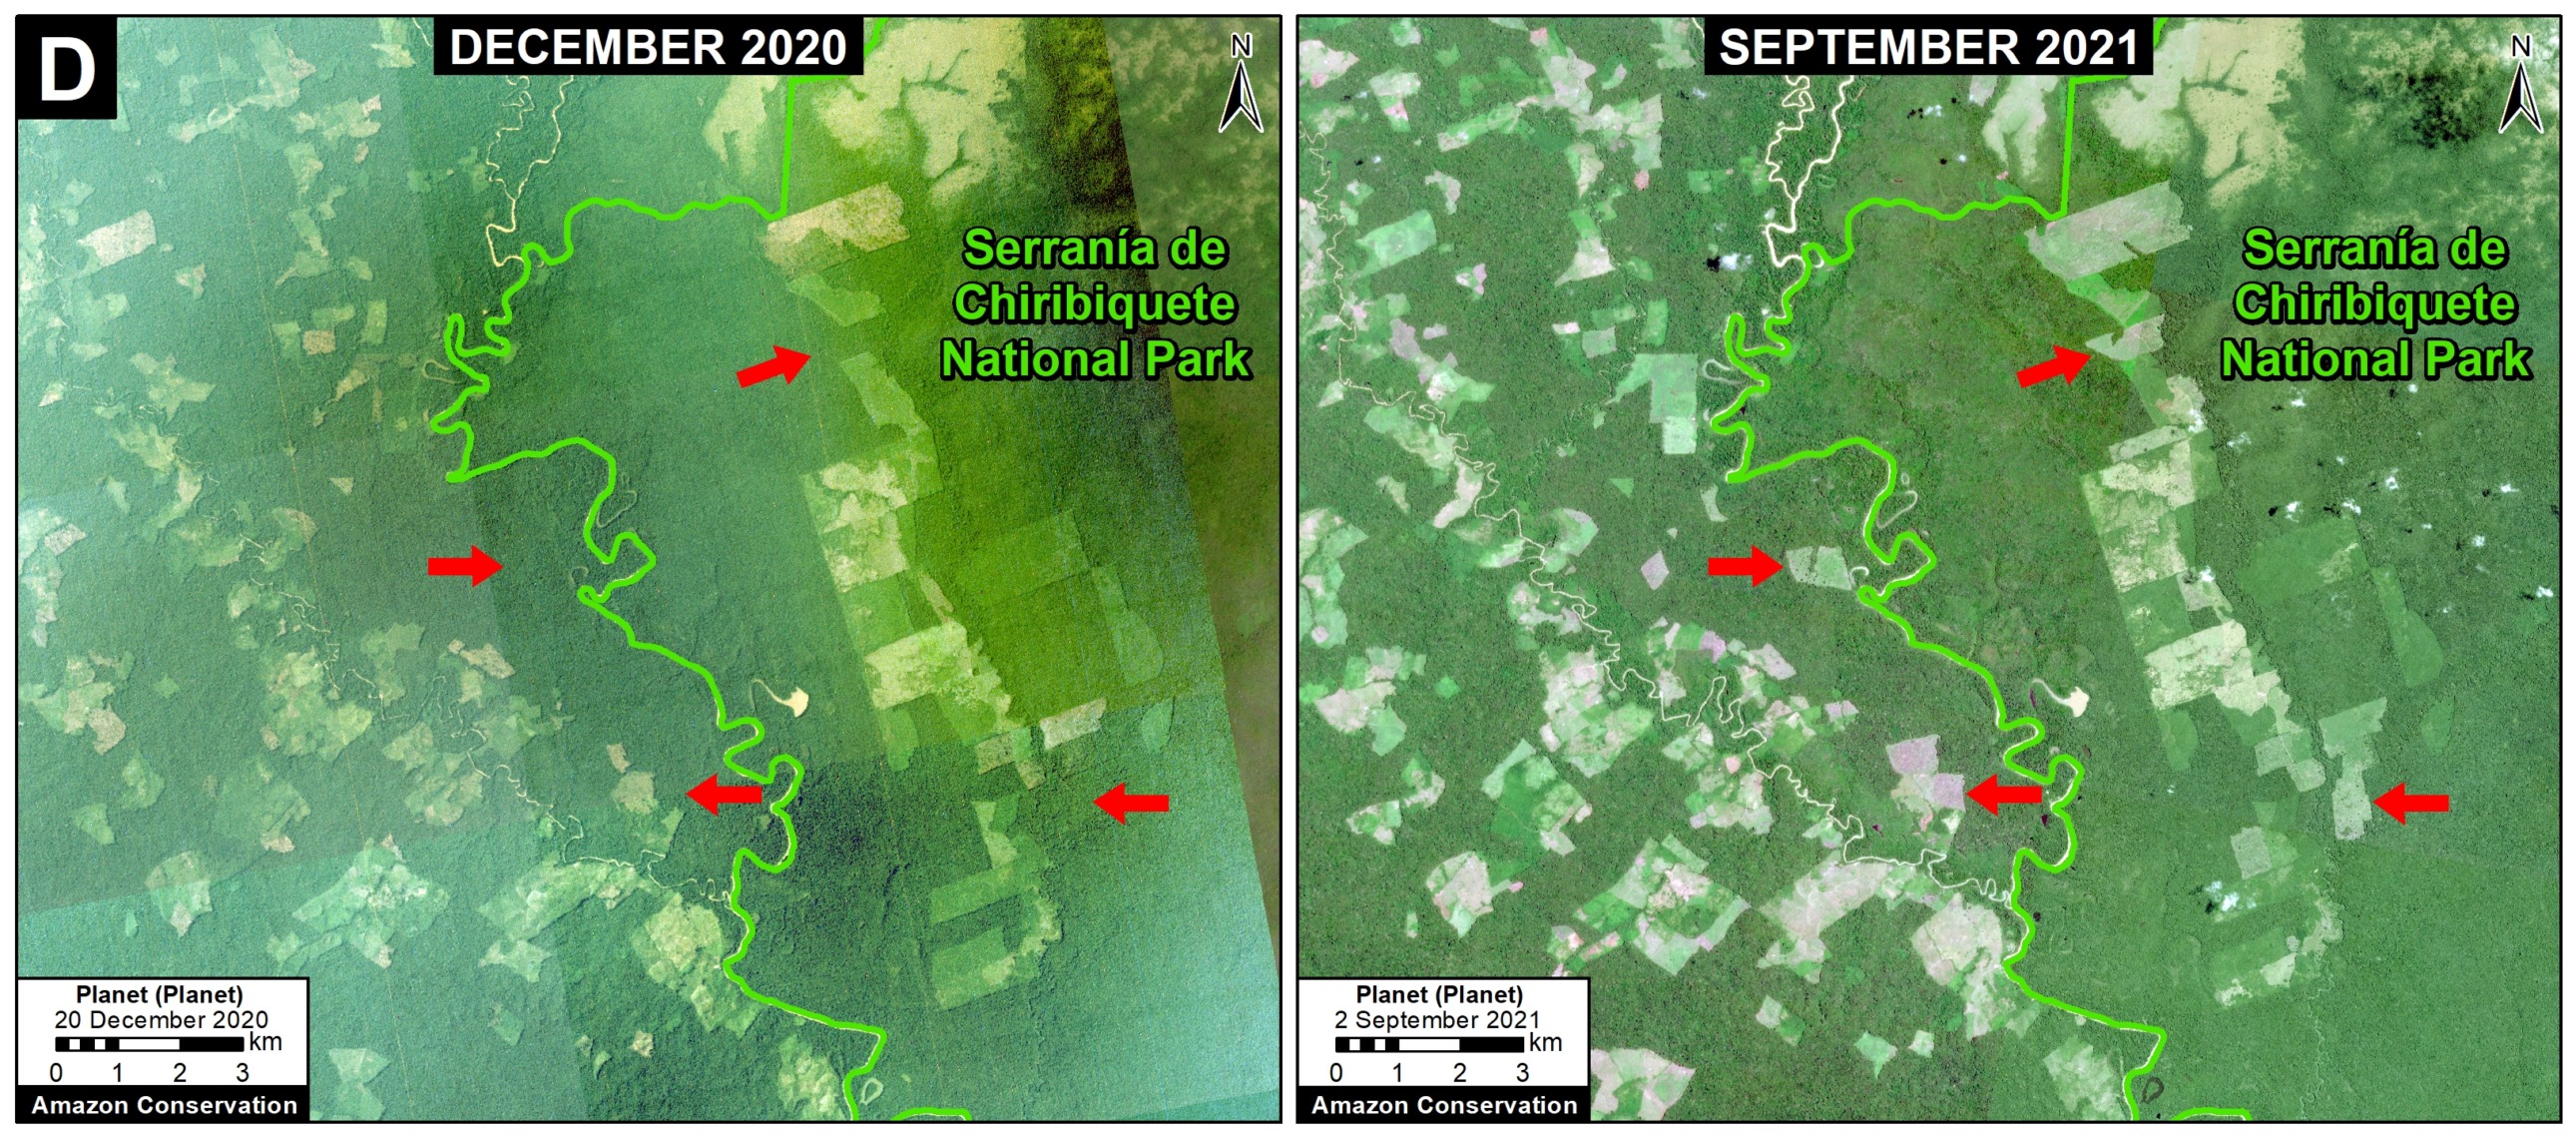
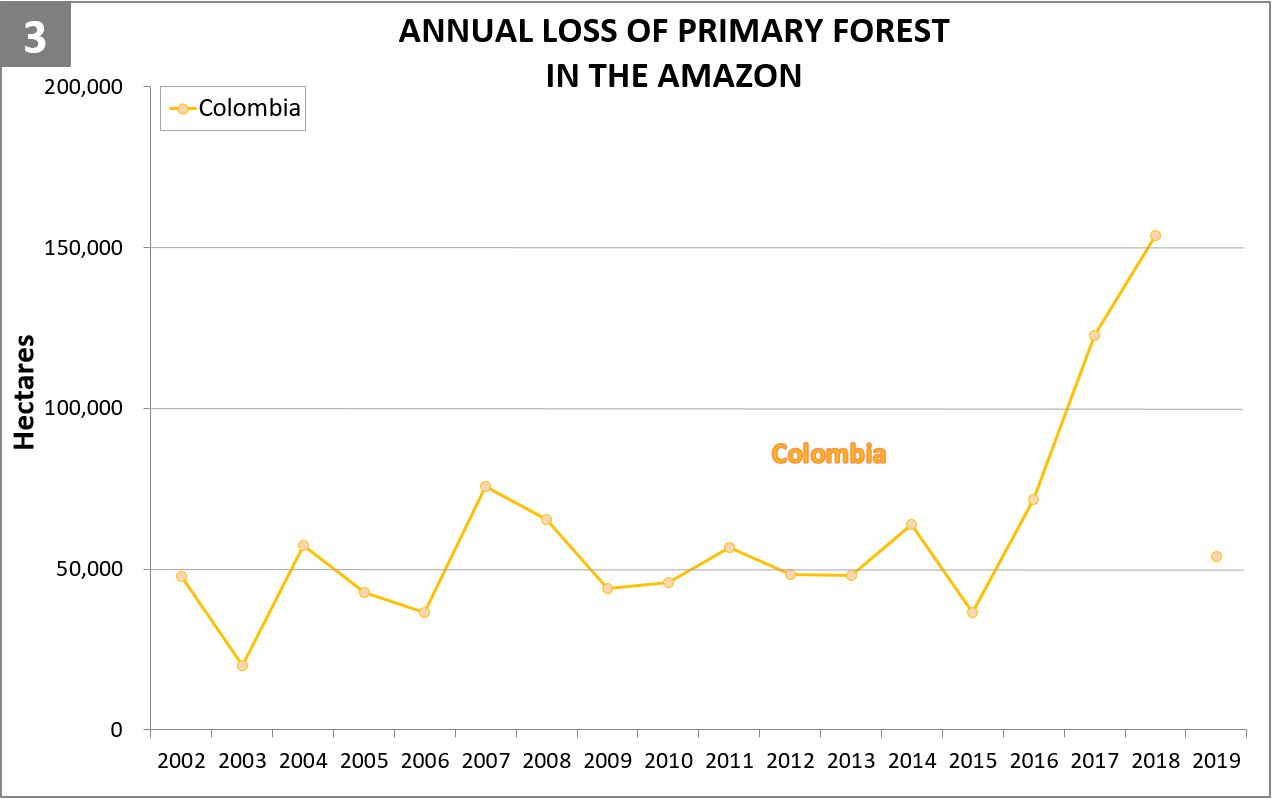
Colombia had, by far, the highest primary forest loss rates outside protected areas and indigenous territories (averaging 0.67% across all four years).

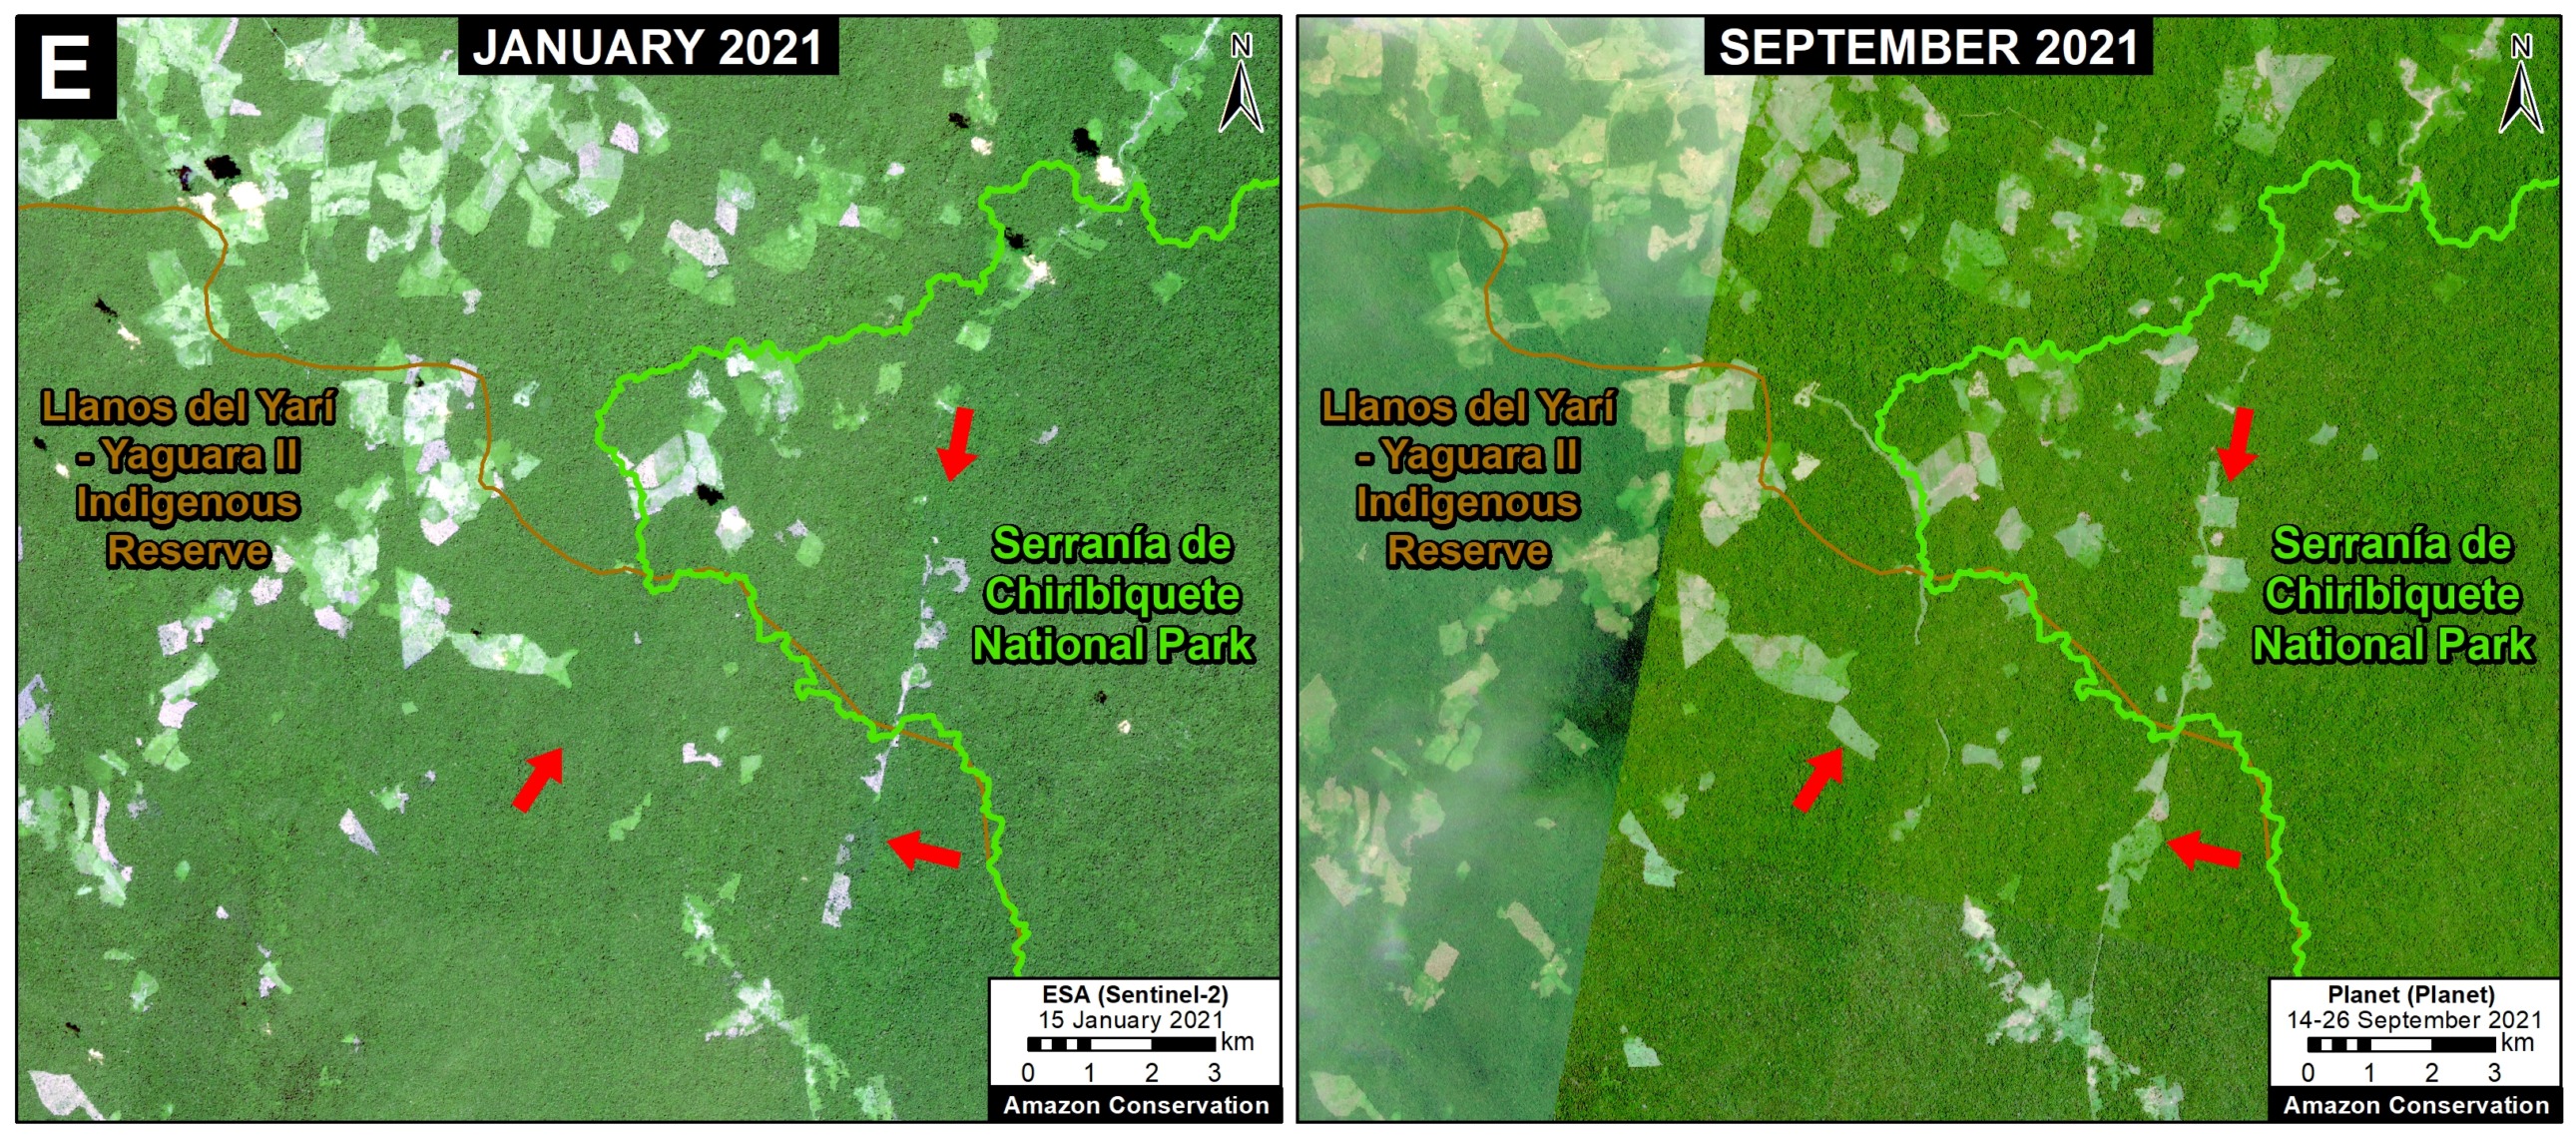
By contrast, Colombian indigenous territories had one of the lowest primary forest loss rates across the western Amazon (averaging 0.07% across all four years).

The primary forest loss rates for protected areas were on average nearly double that of indigenous territories (mostly due to the high deforestation in Tinigua National Park), but still much lower than non-protected areas.


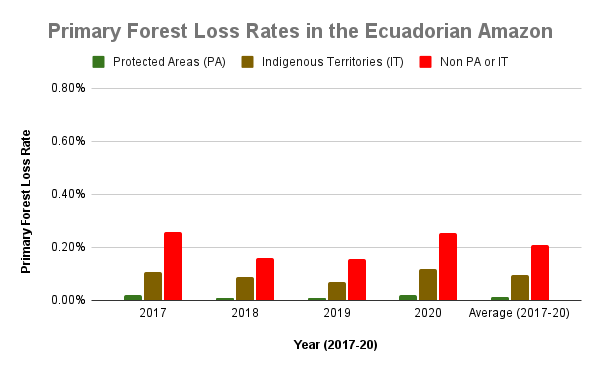
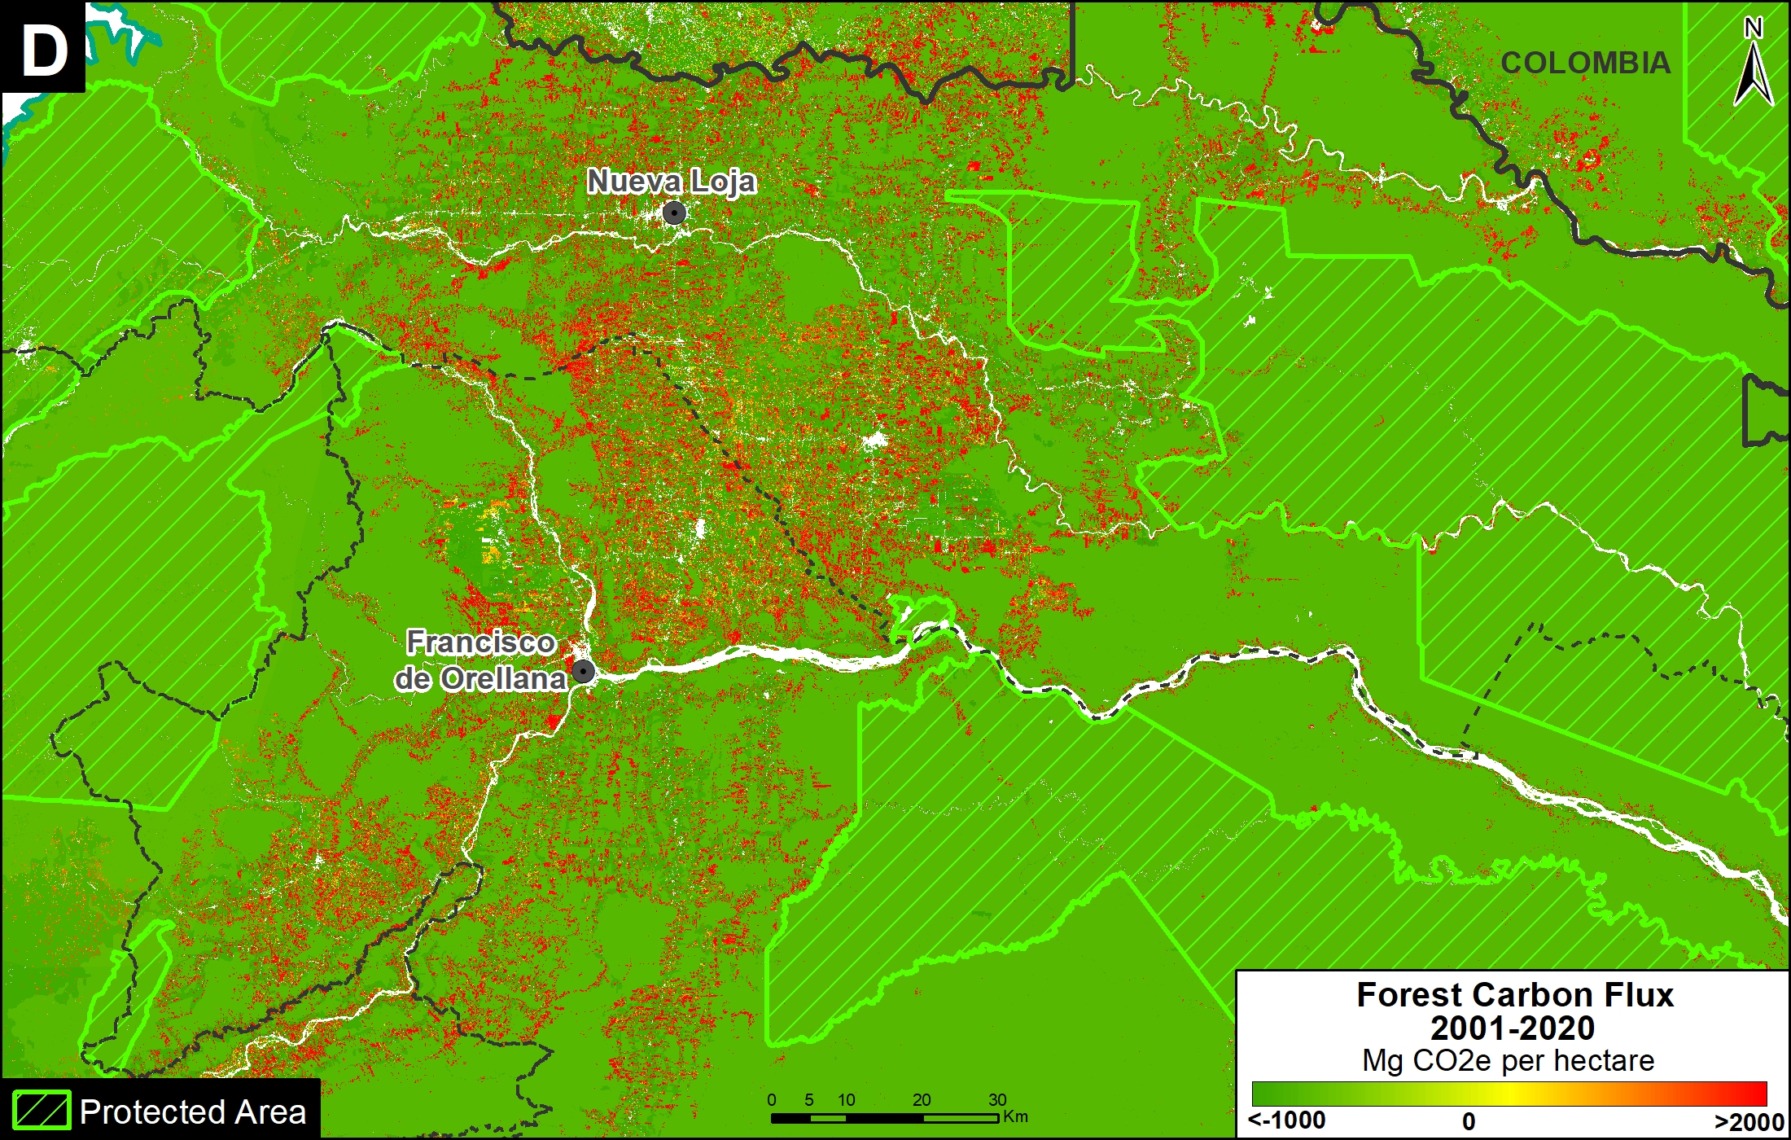
Figure 3. Primary forest loss rates in the Ecuadorian Amazon.

Ecuadorian Amazon

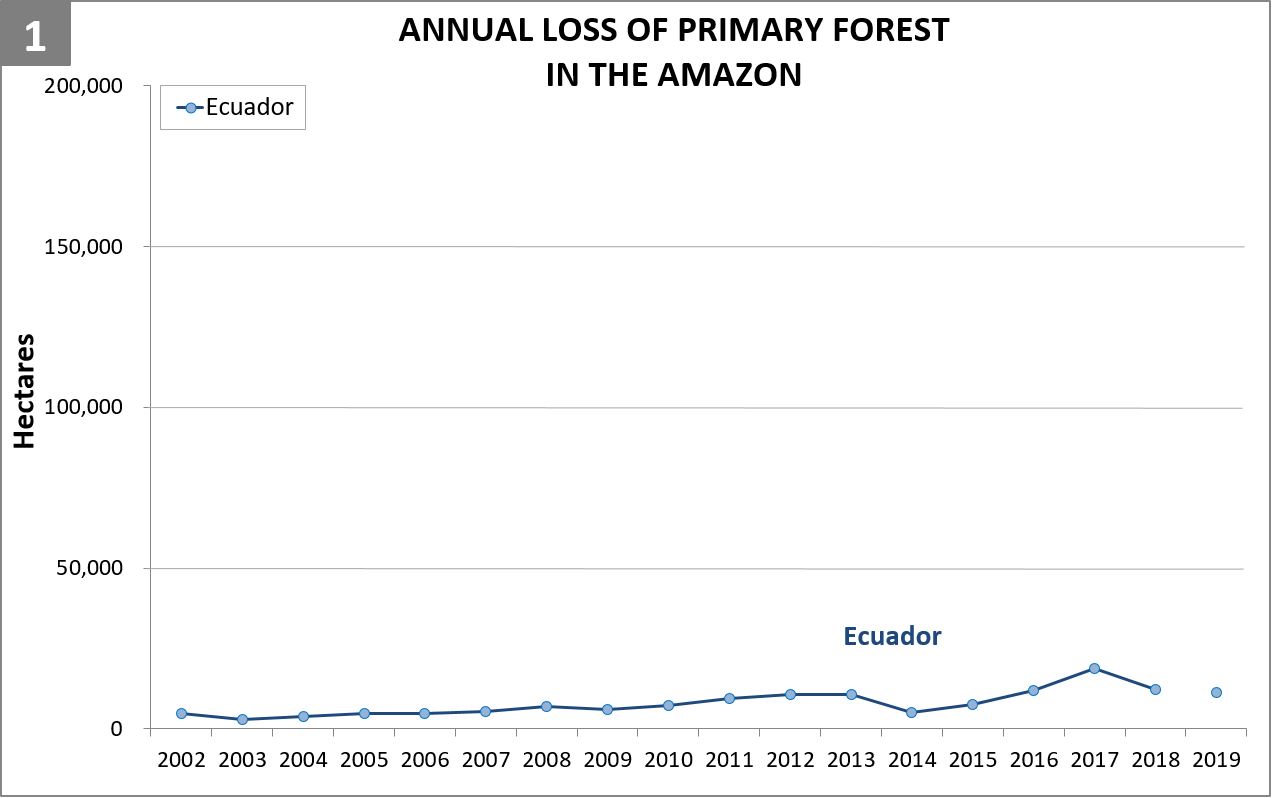
Overall, Ecuador had the lowest primary forest loss rates across all three categories.

Protected areas had the lowest primary forest loss rate of any category across the western Amazon (averaging 0.01% across all four years).

Indigenous territories also had relatively low primary forest loss rates, averaging half that of outside protected areas and indigenous territories (0.10% vs 0.21%, respectively).


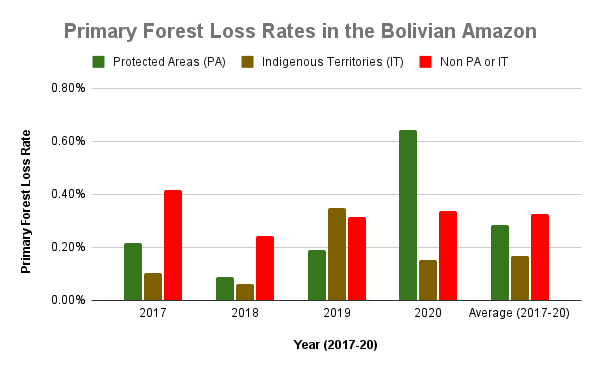
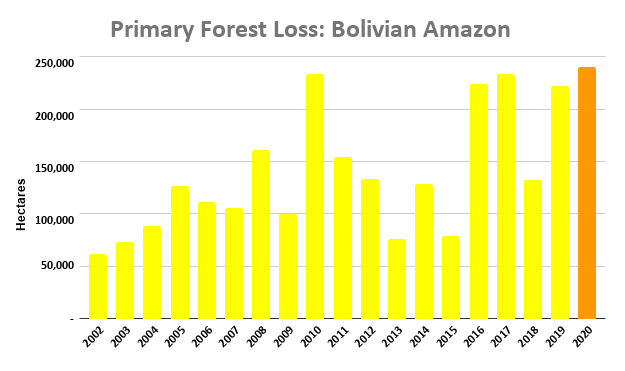
Figure 4. Primary forest loss rates in the Bolivian Amazon.

Bolivian Amazon

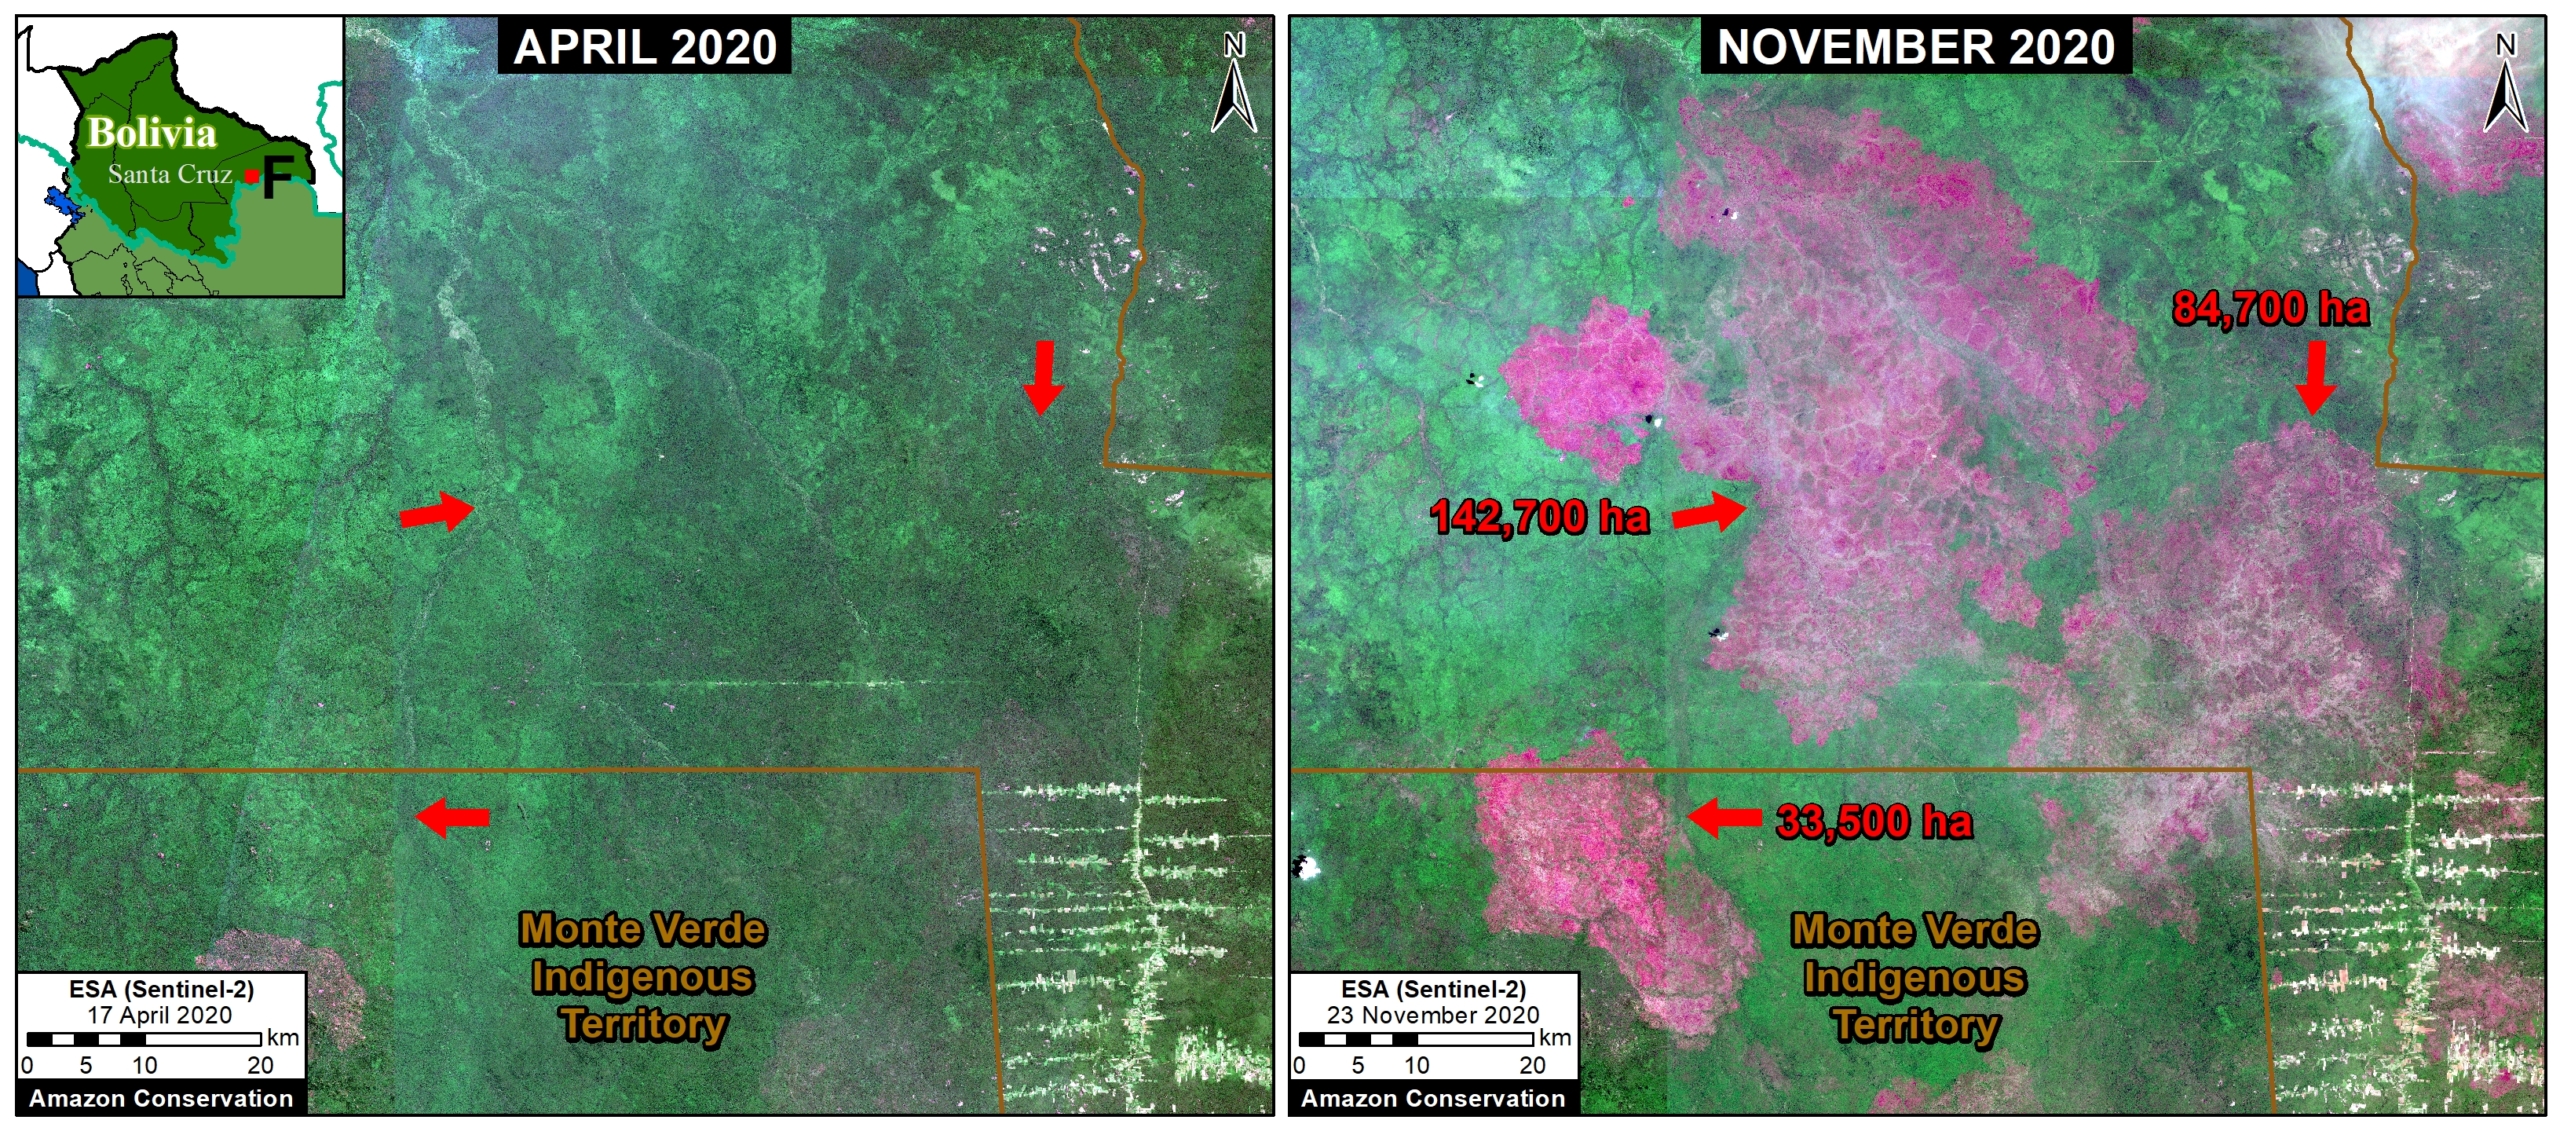
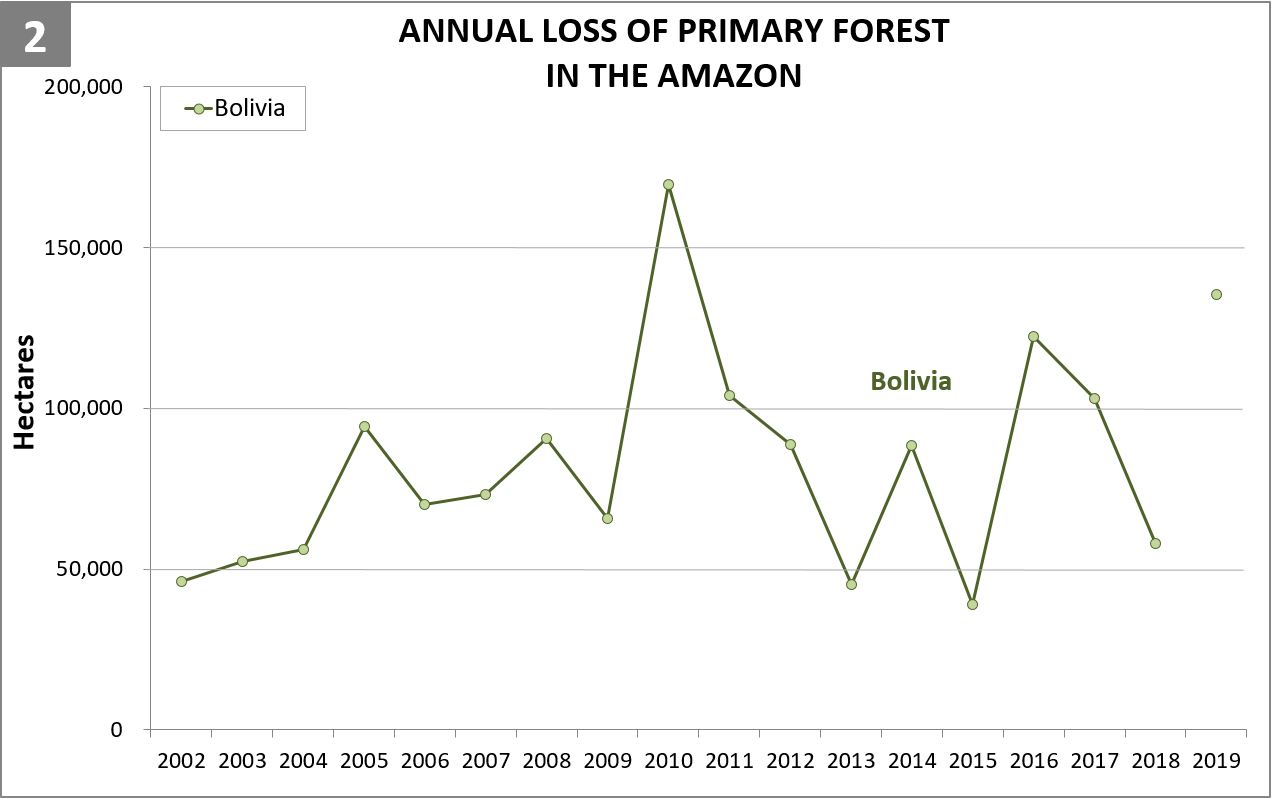
Bolivia had the most dynamic results, largely due to intense fire seasons in 2019 and 2020. Indigenous territories had the lowest primary forest loss rates, with 2019 being the only exception, due to large fires in the Santa Cruz department that affected the Monte Verde indigenous territory.

Protected areas had the lowest primary forest loss rate in 2019, but in extreme contrast, the highest the following year in 2020, also due to large fires in the Santa Cruz department that affected Noel Kempff Mercado National Park.

Overall, primary forest loss was highest outside protected areas and indigenous territories (averaging 0.33% across all four years).


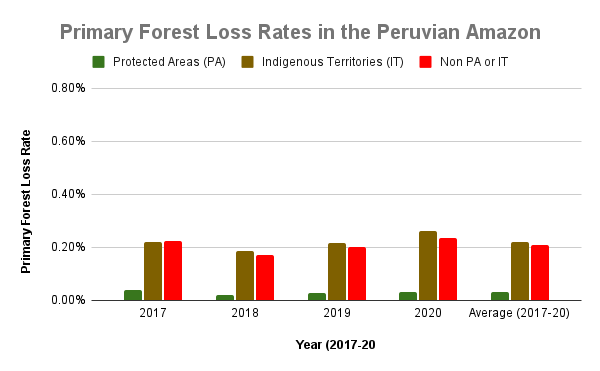
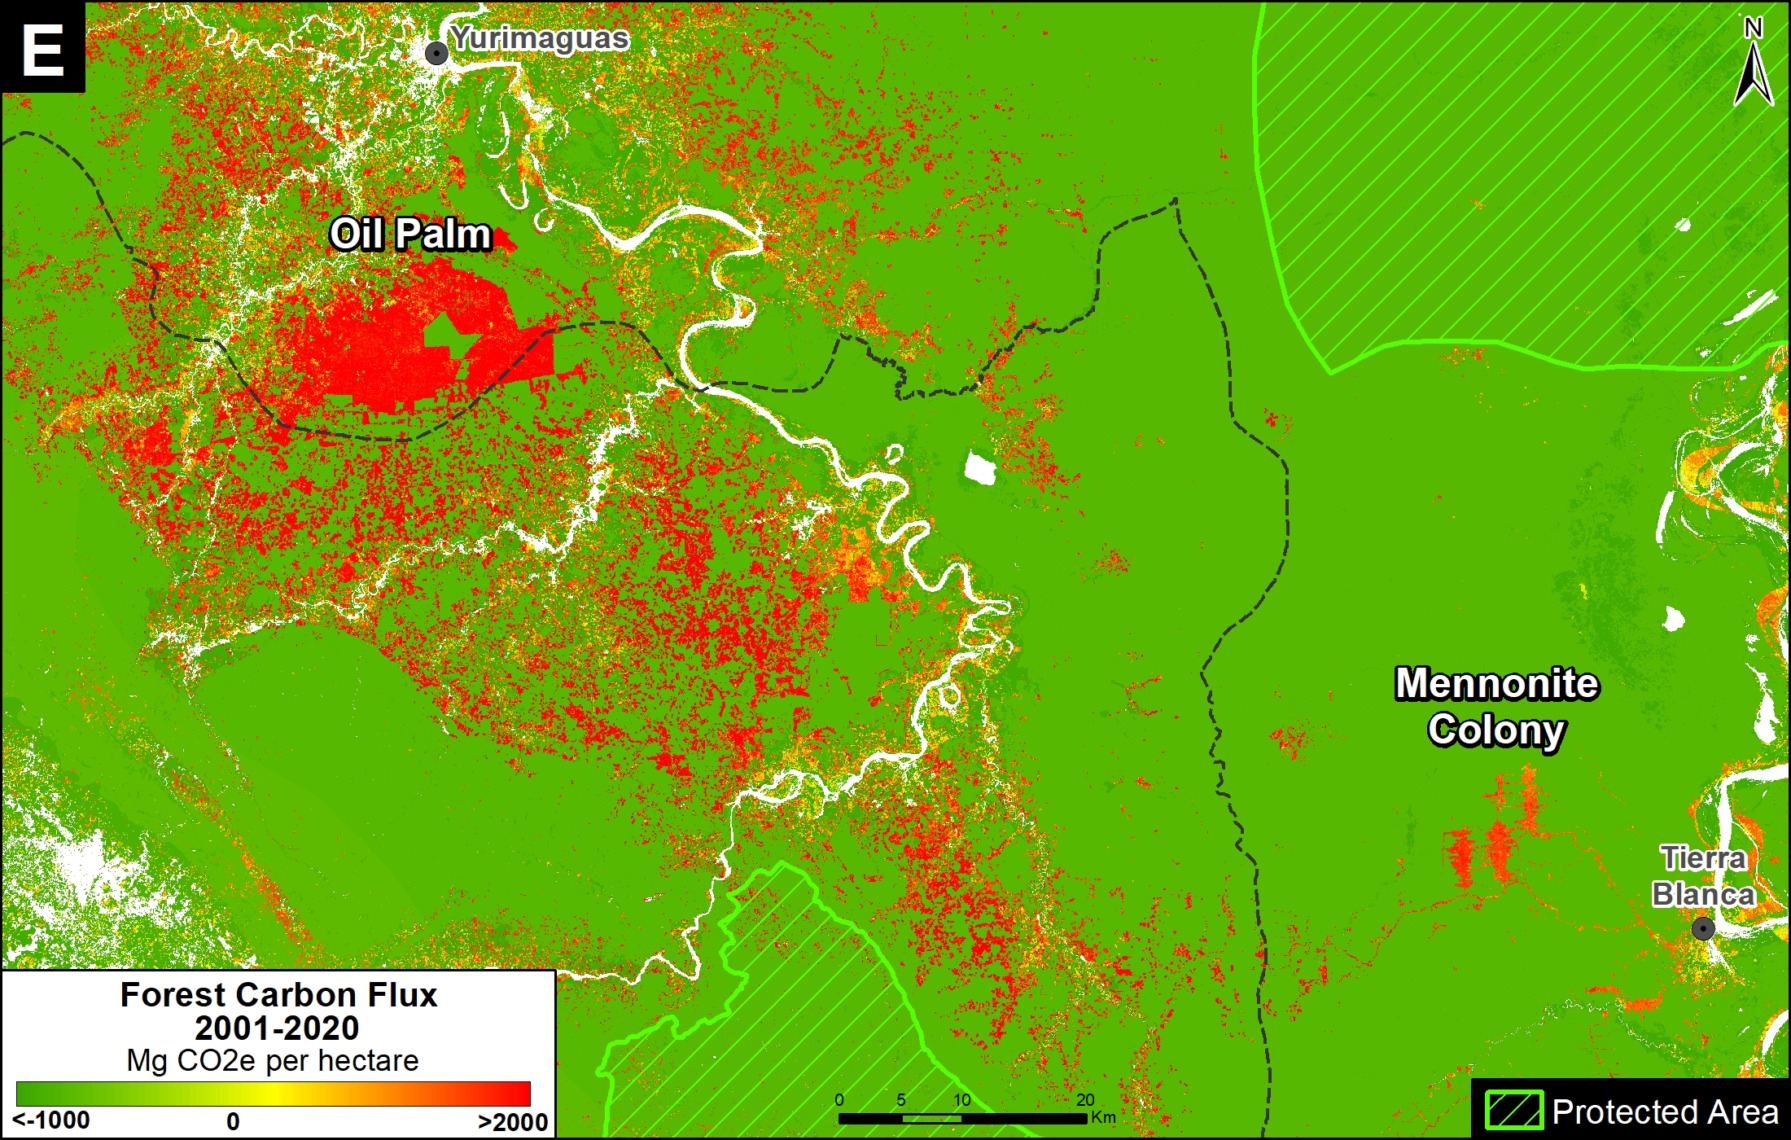
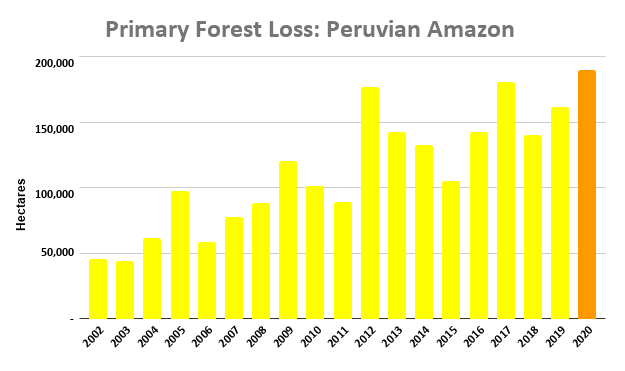
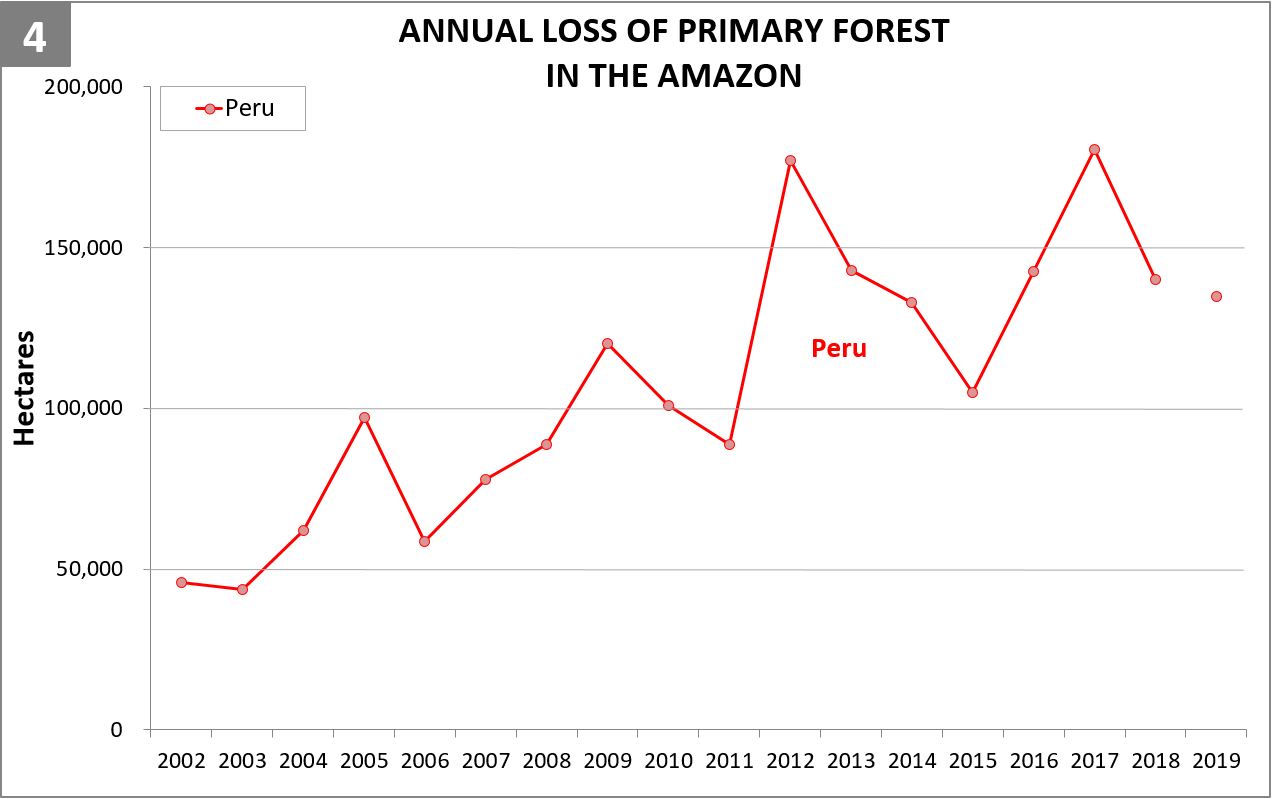
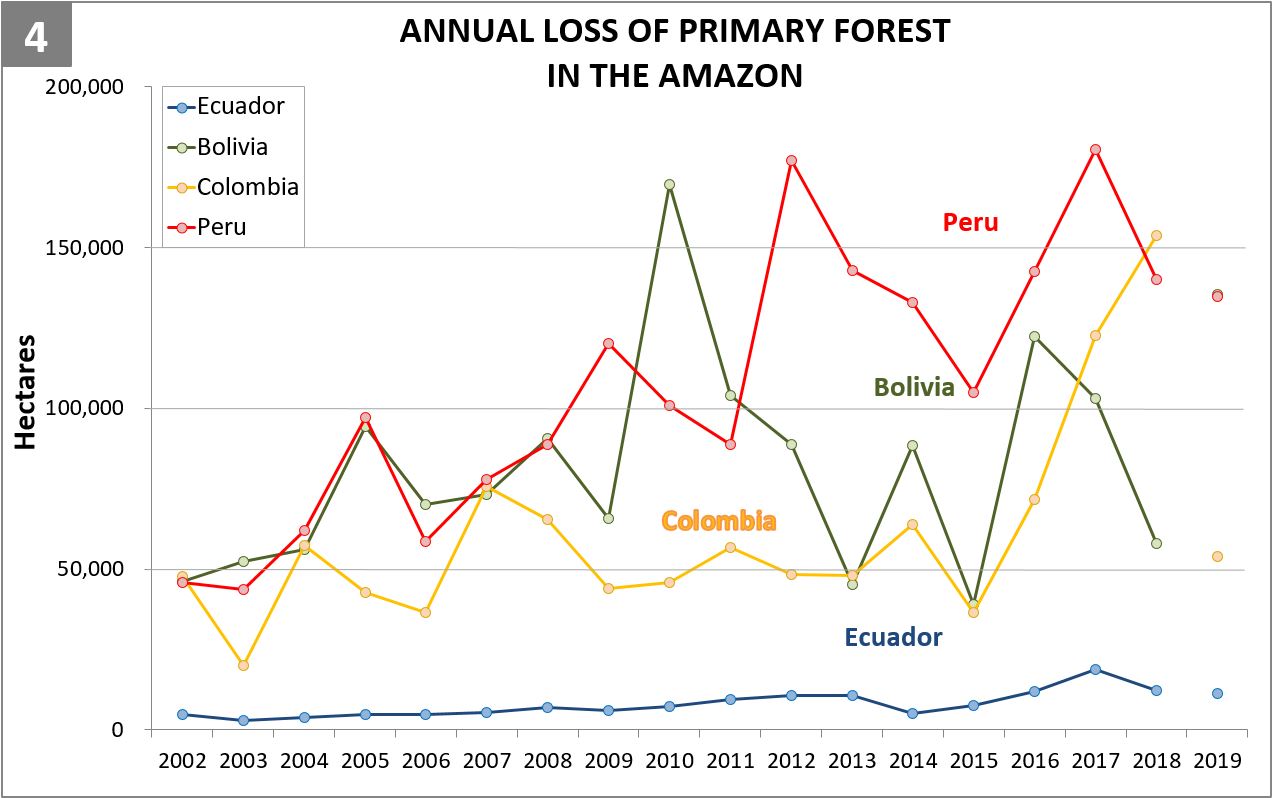
Figure 5a. Primary forest loss rates in the Peruvian Amazon. Data: UMD.

Peruvian Amazon

Following Ecuador, Peru also had relatively low primary forest loss rates, particularly in protected areas (averaging 0.03% across all four years).

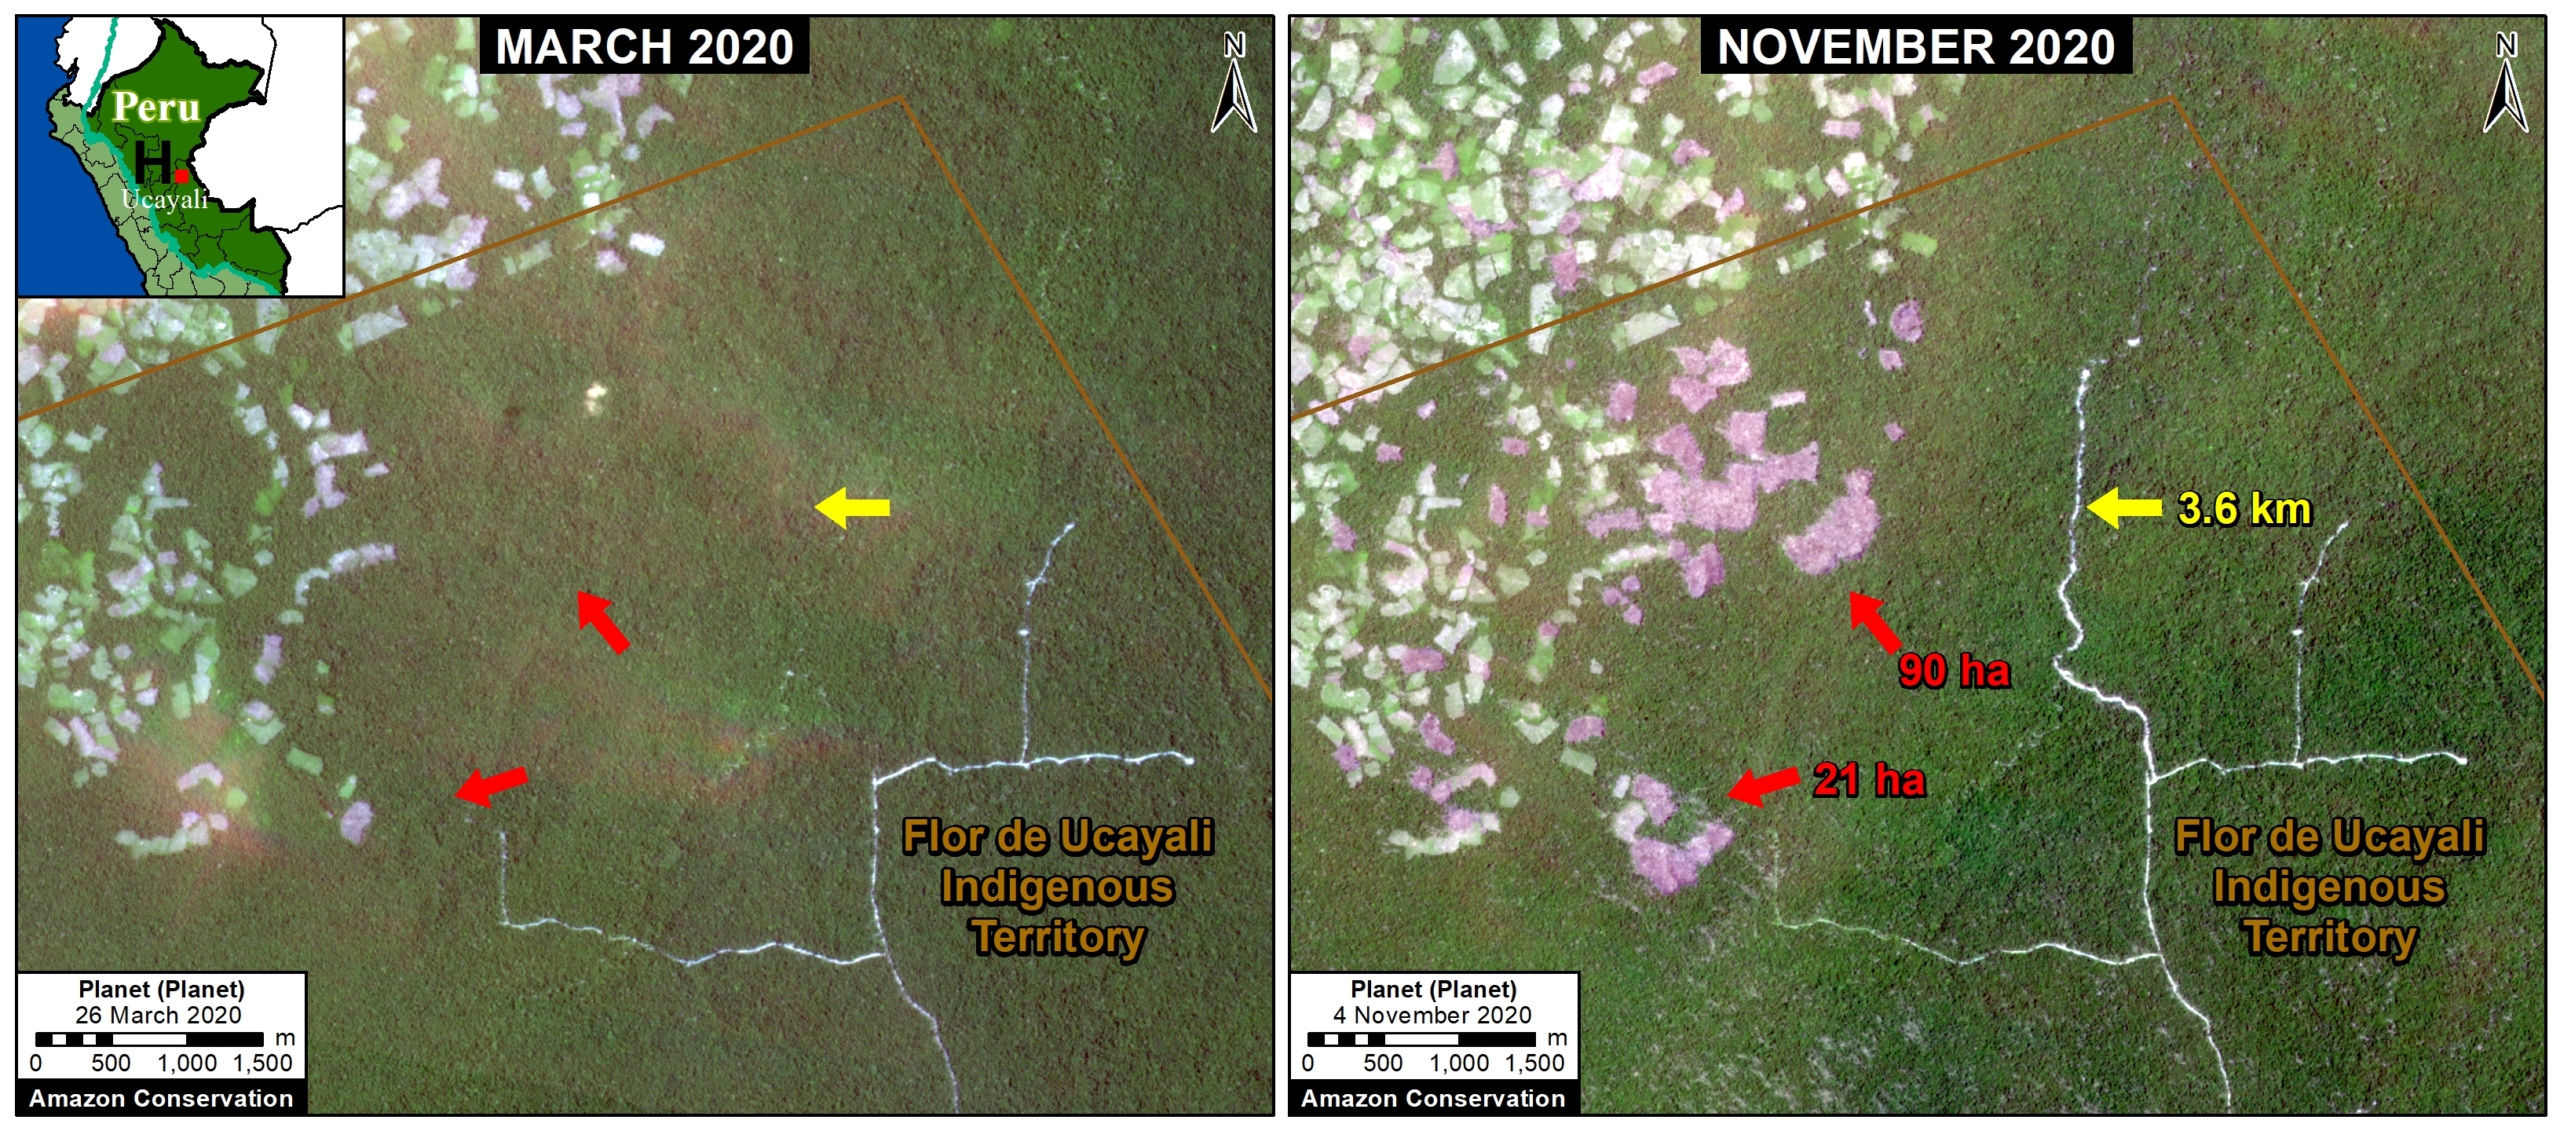
Primary forest loss in indigenous territories (that is, combined data for native communities and Territorial/Indigenous Reserves for groups in voluntary isolation) was surprisingly high, similar to that of areas outside protected areas across all four years. For example, in 2020, elevated primary forest loss was concentrated in several titled native communities in the regions of Amazonas, Ucayali, Huánuco, and Junín.


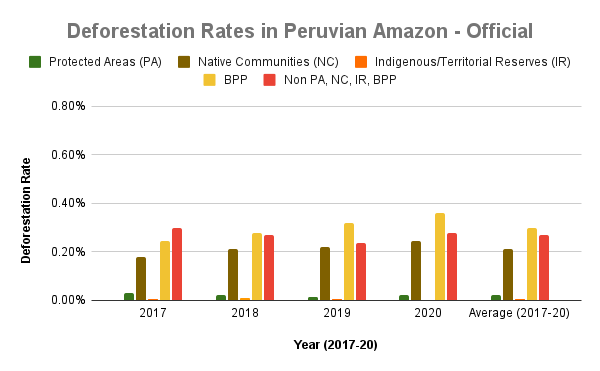
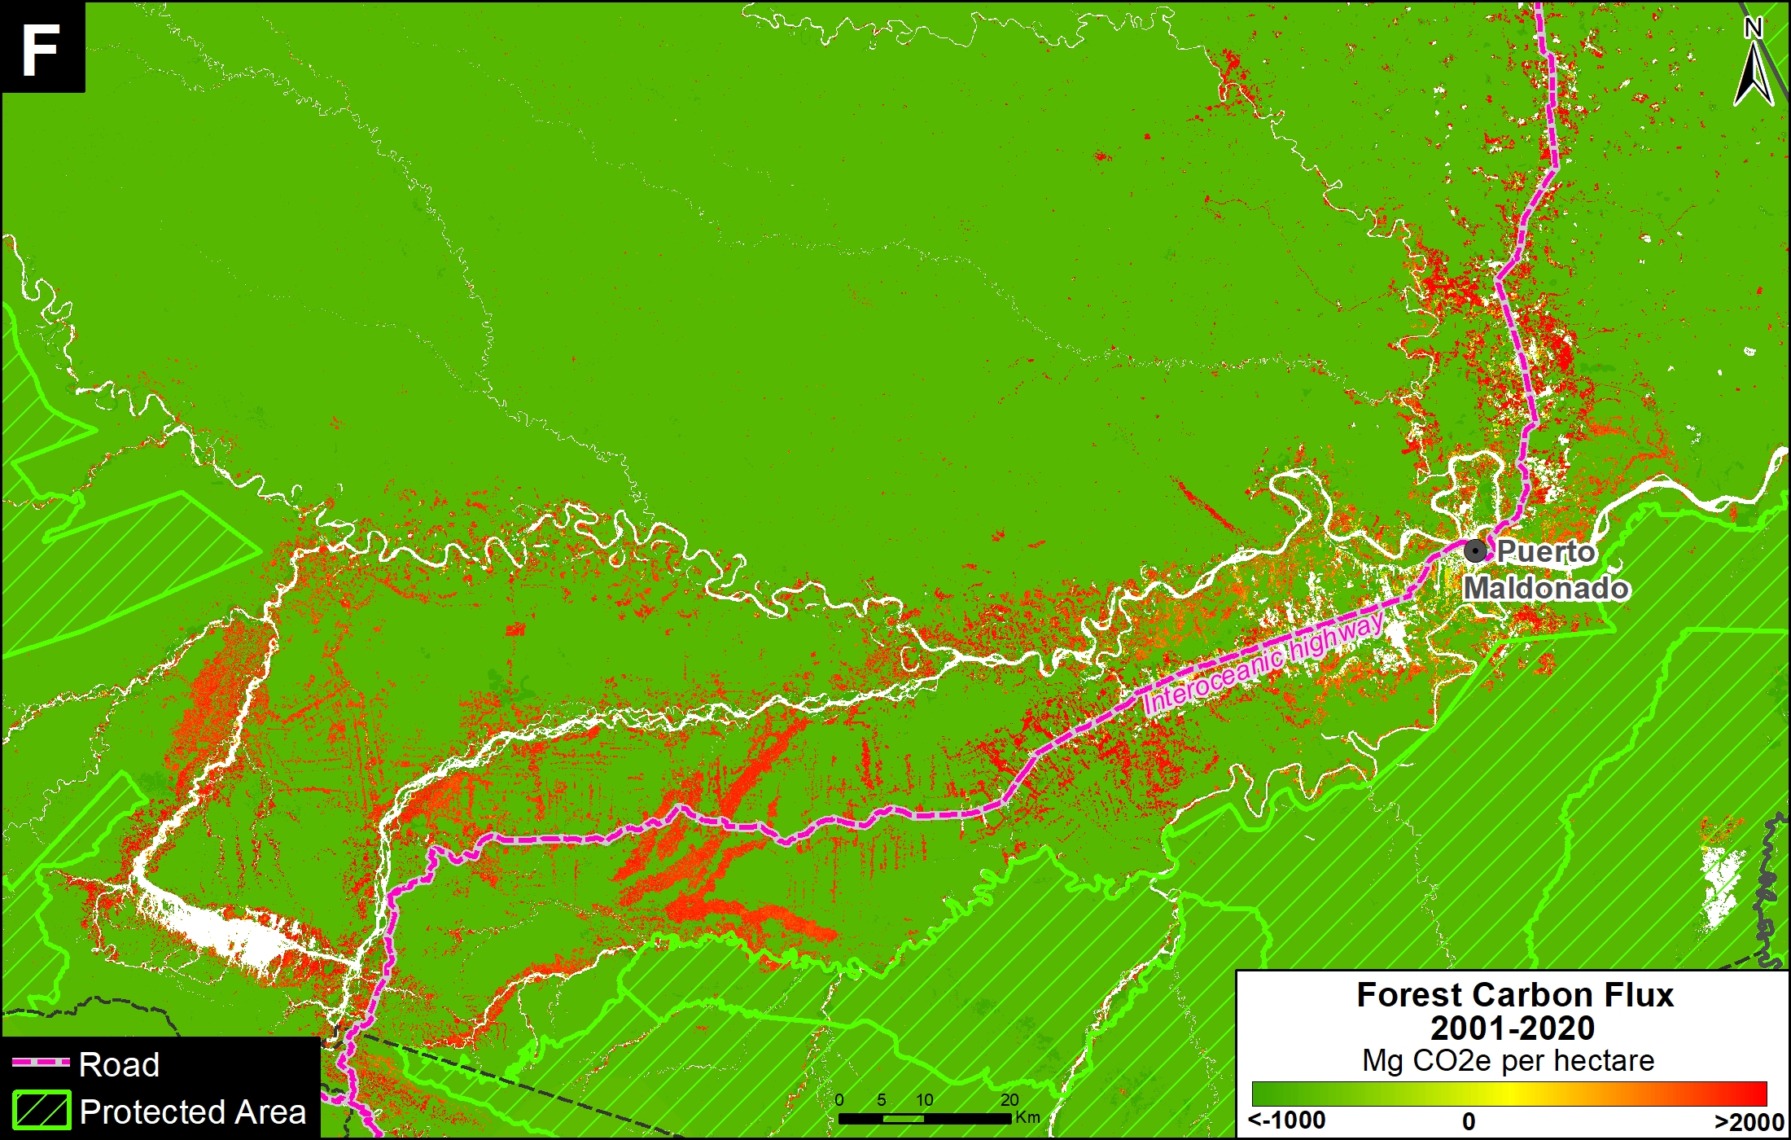
Figure 5b. Deforestation rates in the Peruvian Amazon. Data: MINAM/Geobosques.

As noted above, we conducted a deeper analysis for the Peruvian Amazon, using deforestation data produced by the Peruvian government and adding the additional category of long-term forestry lands (known as Permanent Production Forests, or BPP in Spanish) (see Annex map).

We also separated the data for indigenous territories into native communities and Territorial/Indigenous Reserves for groups in voluntary isolation, respectively.

These data also show that deforestation was lowest in the remote Territorial/Indigenous Reserves, closely followed by protected areas (0.01% vs 0.02% across all four years, respectively). Deforestation in titled native communities was 0.21% across all four years. Surprisingly, deforestation was higher in the forestry lands than areas outside protected areas and indigenous territories (0.30% vs 0.27% across all four years).


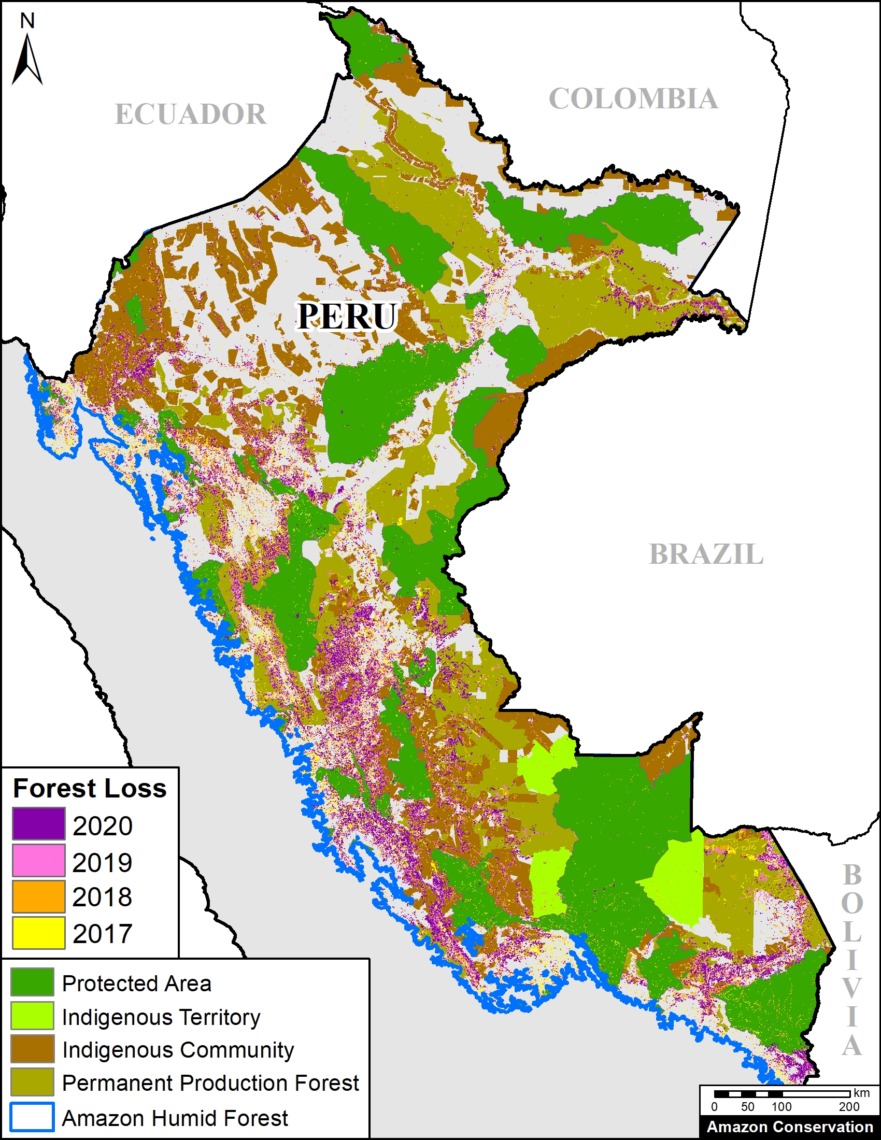
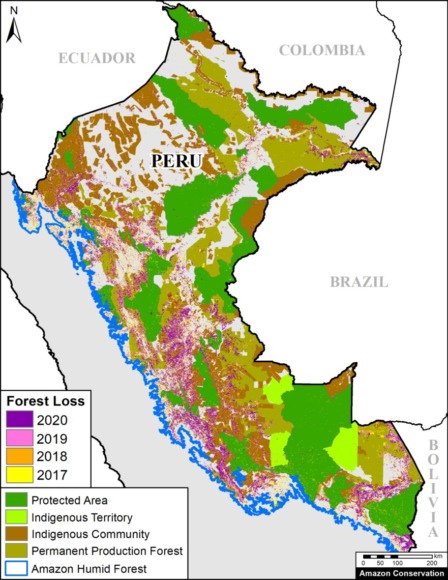
Annex – Peruvian Amazon

The following map shows added detail for Peru, most notably the inclusion of long-term forestry lands (known as Permanent Production Forests, or BPP in Spanish).


*Methodology

To estimate deforestation across all three categories, we used annual forest loss data (2017-20) from the University of Maryland (Global Land Analysis and Discovery GLAD laboratory) to have a consistent source across all four countries (Hansen et al 2013).

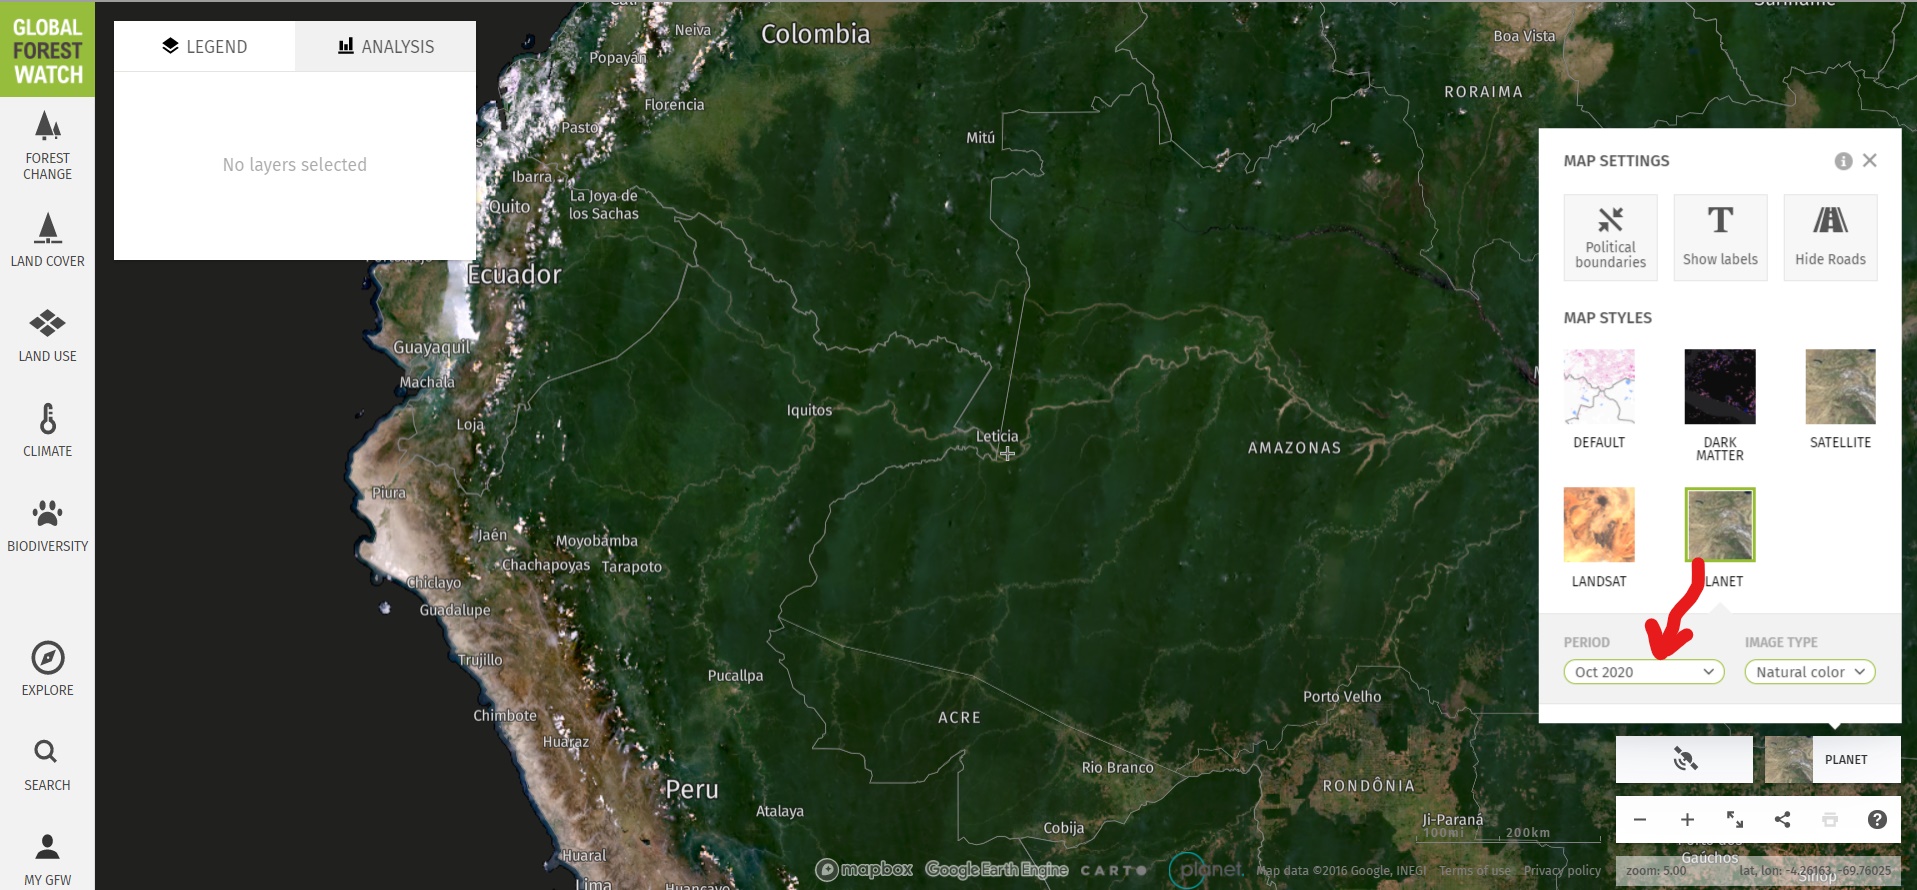
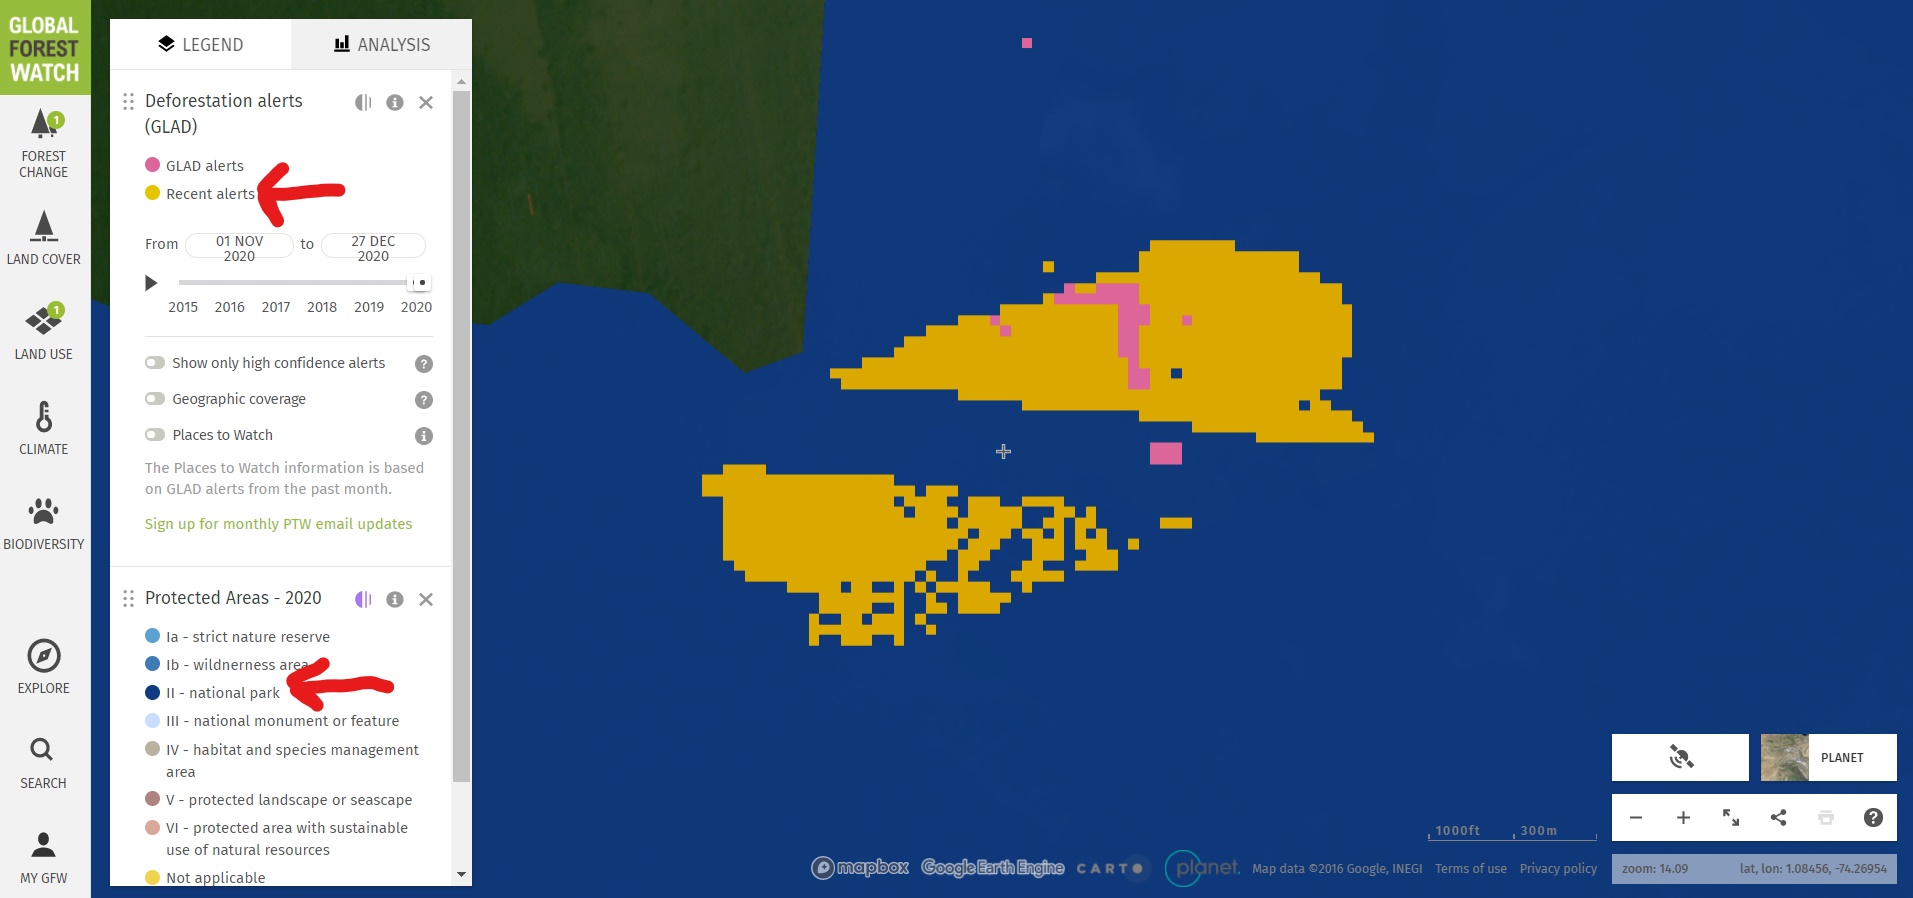
We obtained this data, which has a 30-meter spatial resolution, from the “Global Forest Change 2000–2020” data download page. It is also possible to visualize and interact with the data on the main Global Forest Change portal.

It is important to note that these data include both human-caused deforestation and forest loss caused by natural forces (landslides, wind storms, etc…).

We also filtered this data for only primary forest loss, following the established methodology of Global Forest Watch. Primary forest is generally defined as intact forest that has not been previously cleared (as opposed to previously cleared secondary forest, for example). We applied this filter by intersecting the forest cover loss data with the additional dataset “primary humid tropical forests” as of 2001 (Turubanova et al 2018). For more details on this part of the methodology, see the Technical Blog from Global Forest Watch (Goldman and Weisse 2019).

Thus, we often use the term “primary forest loss” to describe the data.

Data presented as primary forest loss or deforestation rate is standardized per the total area covered of each respective category. For example, to properly compare raw forest loss data in areas that are 100 hectares vs 1,000 hectares total size respectively, we divide by the area to standardize the result.

Our geographic range included four countries of the western Amazon and consists of a combination of the Amazon watershed limit (most notably in Bolivia) and Amazon biogeographic limit (most notably in Colombia) as defined by RAISG. See Base Map above for delineation of this hybrid Amazon limit, designed for maximum inclusion.

Additional data sources include: National and state/deprartment level protected areas: RUNAP 2020 (Colombia), SNAP 2017 & RAISG 2020 (Ecuador), SERNAP & ACEAA 2020 (Bolivia), and SERNANP 2020 (Peru).

Indigenous Territories: RAISG 2020 (Colombia, Ecuador, and Bolivia), and MINCU & ACCA 2020 (Peru). For Peru, this includes titled native communities and Indigenous/Territorial Reserves for indigenous groups in voluntary isolation.

For the additional analysis in Peru, we used deforestation data from MINAM/Geobosques (note this is actual deforestation and not primary forest loss) and BPP data from SERFOR. We also separated data from titled native communities and Territorial/Indigenous Reserves for groups in voluntary isolation.

Acknowledgements

We thank M. MacDowell (AAF) A. Folhadella (ACA), J. Beavers (ACA), S. Novoa (ACCA), and D. Larrea (ACEAA) for their helpful comments on this report.

This work was supported by the Andes Amazon Fund (AAF), Norwegian Agency for Development Cooperation (NORAD), and International Conservation Fund of Canada (ICFC).


Citation

Finer M, Mamani N, Silman M (2021) Protected Areas & Indigenous Territories Effective Against Deforestation in the Western Amazon. MAAP: 141.

MAAP #136: Amazon Deforestation 2020 (Final)

Base Map. Forest loss hotspots across the Amazon in 2020. Data: Hansen/UMD/Google/USGS/NASA, RAISG, MAAP. The letters A-E correspond to the zoom examples below.

*To download the report, click “Print” instead of “Download PDF” at the top of the page.

In January, we presented the first look at 2020 Amazon deforestation based on early warning alert data (MAAP #132).

Here, we update this analysis based on the newly released, and more definitive, annual data.*

The Base Map illustrates the final results and indicates the major hotspots of primary forest loss across the Amazon in 2020.

We highlight several key findings:

  • The Amazon lost nearly 2.3 million hectares (5.6 million acres) of primary forest loss in 2020 across the nine countries it spans.
    g
  • This represents a 17% increase in Amazon primary forest loss from the previous year (2019), and the third-highest annual total on record since 2000 (see graph below).
    j
  • The countries with the highest 2020 Amazon primary forest loss are 1) Brazil, 2) Bolivia, 3) Peru, 4) Colombia, 5) Venezuela, and 6) Ecuador.
    h
  • 65% occurred in Brazil (which surpassed 1.5 million hectares lost), followed by 10% in Bolivia, 8% in Peru, and 6% in Colombia (remaining countries all under 2%).
    k
  • For Bolivia, Ecuador, and Peru, 2020 recorded historical high Amazon primary forest loss. For Colombia, it was the second highest on record.

In all of the data graphs, orange indicates the 2020 primary forest loss and red indicates all years with higher totals than 2020.

For example, the Amazon lost nearly 2.3 million hectares in 2020 (orange), the third highest on record behind only 2016 and 2017 (red).

Note that the three highest years (2016, 2017, and 2020) had one major thing in common: uncontrolled forest fires in the Brazilian Amazon.

See below for country-specific graphs, key findings, and satellite images for the top four 2020 Amazon deforestation countries (Brazil, Bolivia, Peru, and Colombia).


Brazilian Amazon

2020 had the sixth-highest primary forest loss on record (1.5 million hectares) and a 13% increase from 2019.

Many of the 2020 hotspots occurred in the Brazilian Amazon, where massive deforestation stretched across nearly the entire southern region.

A common phenomenon observed in the satellite imagery through August was that rainforest areas were first deforested and then later burned, causing major fires due to the abundant recently-cut biomass (Image A). This was also the pattern observed in the high-profile 2019 Amazon fire season. Much of the deforestation in these areas appears to associated with expanding cattle pasture areas.

In September 2020 (and unlike 2019), there was a shift to actual Amazon forest fires (Image B). See MAAP #129 for more information on the link between deforestation and fire in 2020.

Note that the three highest years (2016, 2017, and 2020) had one major thing in common: uncontrolled forest fires in the Brazilian Amazon.

Image A. Deforestation in Brazilian Amazon (Amazonas state) of 2,540 hectares between January (left panel) and November (right panel) 2020. Data: Planet.
Image B. Forest fire in Brazilian Amazon (Para state) that burned 9,000 hectares between March (left panel) and October (right panel) 2020. Data: Planet.

Bolivian Amazon

2020 had the highest primary forest loss on record in the Bolivian Amazon, surpassing 240,000 hectares.

Indeed, the most intense hotspots across the entire Amazon ocurred in southeast Bolivia, where fires raged through the drier Amazon forests (known as the Chiquitano and Chaco ecosystems).

Image C shows the burning of a massive area (over 260,000 hectares) in the Chiquitano dry forests (Santa Cruz department).


Image C. Forest fire in Bolivian Amazon (Santa Cruz) that burned over 260,000 hectares between April (left panel) and November (right panel) 2020. Data: ESA.

Peruvian Amazon

2020 also had the highest primary forest loss on record in the Peruvian Amazon, surpassing 190,000 hectares.

This deforestation is concentrated in the central region. On the positive, the illegal gold mining that plagued the southern region has decreased thanks to effective government action (see MAAP #130).

Image D shows expanding deforestation (over 110 hectares), and logging road construction (3.6 km), in an indigenous territory south of Sierra del Divisor National Park in the central Peruvian Amazon (Ucayali region). The deforestation appears to be associated with an expanding small-scale agriculture or cattle pasture frontier.


Image D. Deforestation and logging road construction in Peruvian Amazon (Ucayali region) between March (left panel) and November (right panel) 2020. Data: Planet.

Colombian Amazon

2020 had the second-highest primary forest loss on record in the Colombian Amazon, nearly 140,000 hectares.

As described in previous reports (see MAAP #120), there is an “arc of deforestation” concentrated in the northwest Colombian Amazon. This arc impacts numerous protected areas (including national parks) and Indigenous Reserves.

For example, Image E shows the recent deforestation of over 500 hectares in Chiribiquete National Park. Similar deforestation in that sector of the park appears to be conversion to cattle pasture.


Image E. Deforestation in Colombian Amazon of over 500 hectares in Chiribiqete National Park between January (left panel) and December (right panel) 2020. Data: ESA, Planet.

*Notes and Methodology

To download the report, click “Print” instead of “Download PDF” at the top of the page.

The analysis was based on 30-meter resolution annual data produced by the University of Maryland (Hansen et al 2013), obtained from the “Global Forest Change 2000–2020” data download page. It is also possible to visualize and interact with the data on the main Global Forest Change portal.

Importantly, this data detects and classifies burned areas as forest loss. Nearly all Amazon fires are human-caused. Also, this data does include some forest loss caused by natural forces (landslides, wind storms, etc…).

Note that when comparing 2020 to early years, there are several methodological differences from the University of Maryland introduced to data after 2011. For more details, see “User Notes for Version 1.8 Update.”

It is worth noting that we found the early warning (GLAD) alerts to be a good (and often conservative) indicator of the final annual data.

Our geographic range includes nine countries and consists of a combintion of the Amazon watershed limit (most notably in Bolivia) and Amazon biogeographic limit (most notably in Colombia) as defined by RAISG. See Base Map above for delineation of this hybrid Amazon limit, designed for maximum inclusion. Inclusion of the watershed limit in Bolivia is a recent change incorporated to better include impact to the Amazon dry forests of the Chaco.

We applied a filter to calculate only primary forest loss. For our estimate of primary forest loss, we intersected the forest cover loss data with the additional dataset “primary humid tropical forests” as of 2001 (Turubanova et al 2018). For more details on this part of the methodology, see the Technical Blog from Global Forest Watch (Goldman and Weisse 2019).

To identify the deforestation hotspots, we conducted a kernel density estimate. This type of analysis calculates the magnitude per unit area of a particular phenomenon, in this case forest cover loss. We conducted this analysis using the Kernel Density tool from Spatial Analyst Tool Box of ArcGIS. We used the following parameters:

Search Radius: 15000 layer units (meters)
Kernel Density Function: Quartic kernel function
Cell Size in the map: 200 x 200 meters (4 hectares)
Everything else was left to the default setting.

For the Base Map, we used the following concentration percentages: Medium: 7-10%; High: 11-20%; Very High: >20%.


Hansen, M. C., P. V. Potapov, R. Moore, M. Hancher, S. A. Turubanova, A. Tyukavina, D. Thau, S. V. Stehman, S. J. Goetz, T. R. Loveland, A. Kommareddy, A. Egorov, L. Chini, C. O. Justice, and J. R. G. Townshend. 2013. “High-Resolution Global Maps of 21st-Century Forest Cover Change.” Science 342 (15 November): 850–53.

Acknowledgements

We thank E. Ortiz (AAF), M. Silman (WFU), M. Weisse (WRI/GFW) for their helpful comments on this report.

This work was supported by NORAD (Norwegian Agency for Development Cooperation) and ICFC (International Conservation Fund of Canada).

Citation

Finer M, Mamani N (2020) Amazon Deforestation Hotspots 2020 (Final). MAAP: 136.

MAAP #132: Amazon Deforestation Hotspots 2020

Base Map. Forest loss hotspots across the Amazon in 2020. Data: UMD/GLAD, RAISG, MAAP. The letters A-G correspond to the zoom examples below.

We present a first look at the major hotspots of primary forest loss across the Amazon in 2020 (see Base Map).*

There are several major headlines:

  • We estimate over 2 million hectares (5 million acres) of primary forest loss across the nine countries of the Amazon in 2020.*
    p
  • The countries with the highest 2020 primary forest loss are 1) Brazil, 2) Bolivia, 3) Peru, 4) Colombia, 5) Venezuela, and 6) Ecuador.
    p
  • The majority of the hotspots occurred in the Brazilian Amazon, where massive deforestation stretched across nearly the entire southern region. Many of these areas were cleared in the first half of the year and then burned in July and August. In September, there was a shift to actual forest fires (see MAAP #129).
    p
  • Several of the most intense hotspots were in the Bolivian Amazon, where fires raged through the dry forests (known as the Chiquitano) in the southeast region.
    p
  • There continues to be an arc of deforestation in the northwestern Colombian Amazon, impacting numerous protected areas.
    p
  • In the Peruvian Amazon, deforestation continues to impact the central region. On the positive, the illegal gold mining that plagued the southern region has decreased thanks to effective government action (see MAAP #130).

Below, we show a striking series of high-resolution satellite images that illustrate some of the major deforestation events across the Amazon in 2020 (indicated A-G on the Base Map).

Widespread Deforestation in the Brazilian Amazon

Zooms A-C show examples of a troublingly common phenomenon in the Brazilian Amazon: large-scale deforestation events in the first half of the year that are later burned in July and August, causing major fires due to the abundant recently-cut biomass. Much of the deforestation in these areas appears to associated with clearing rainforests for cattle pastures. The three examples below show the striking loss of over 21,000 hectares of primary forest in 2020.

Zoom A. Deforestation in the Brazilian Amazon (Amazonas state) of 3,400 hectares between April (left panel) and November (right panel) 2020. Data: ESA, Planet.
Zoom B. Deforestation in Brazilian Amazon (Amazonas state) of 2,540 hectares between January (left panel) and November (right panel) 2020. Data: Planet.
Zoom C. Deforestation in Brazilian Amazon (Para state) of 15,250 hectares between January (left panel) and October (right panel) 2020. Data: Planet.

Forest Fires in the Brazilian Amazon

In September, there was a shift to actual forest fires in the Brazilian Amazon (see MAAP #129). Zoom D and E show examples of these major forest fires, which burned over 50,000 hectares in the states of Pará and Mato Grosso. Note both fires impacted indigenous territories (Kayapo and Xingu, respectively).

Zoom D. Forest fire in Brazilian Amazon (Para state) that burned 9,000 hectares between March (left panel) and October (right panel) 2020. Data: Planet.
Zoom E. Forest fire in Brazilian Amazon (Mato Grosso state) that burned over 44,000 hectares between May (left panel) and October (right panel) 2020. Data: Planet.

Forest Fires in the Bolivian Amazon

The Bolivian Amazon also experienced another intense fire season in 2020. Zoom F shows the burning of a massive area (over 260,000 hectares) in the Chiquitano dry forests (Santa Cruz department).

Zoom F. Forest fire in Bolivian Amazon (Santa Cruz) that burned over 260,000 hectares between April (left panel) and November (right panel) 2020. Data: ESA.

Arc of Deforestation in the Colombian Amazon

As described in previous reports (see MAAP #120), there is an “arc of deforestation” concentrated in the northwest Colombian Amazon. This arc impacts numerous protected areas (including national parks) and Indigenous Reserves. For example, Zoom G shows the recent deforestation of over 500 hectares in Chiribiquete National Park. Similar deforestation in that sector of the park appears to be conversion to cattle pasture.

Zoom G. Deforestation in Colombian Amazon of over 500 hectares in Chiribiqete National Park between January (left panel) and December (right panel) 2020. Data: ESA, Planet.

Deforestation in the central Peruvian Amazon

Finally, Zoom H shows expanding deforestation (over 110 hectares), and logging road construction (3.6 km), in an indigenous territory south of Sierra del Divisor National Park in the central Peruvian Amazon (Ucayali region). The deforestation appears to be associated with an expanding small-scale agriculture or cattle pasture frontier.

Zoom H. Deforestation and logging road construction in Peruvian Amazon (Ucayali region) between March (left panel) and November (right panel) 2020. Data: Planet.

*Notes and Methodology

The analysis was based on early warning forest loss alerts known as GLAD alerts (30-meter resolution) produced by the University of Maryland and also presented by Global Forest Watch. It is critical to highlight that this data represents a preliminary estimate and more definitive data will come later in the year. For example, our estimate does include some forest loss caused by natural forces. Note that this data detects and classifies burned areas as forest loss. Our estimate includes both confirmed (1,355,671 million hectares) and unconfirmed (751,533 ha) alerts.

Our geographic range is the biogeographic boundary of the Amazon as defined by RAISG (see Base Map above). This range includes nine countries.

We applied a filter to calculate only primary forest loss. For our estimate of primary forest loss, we intersected the forest cover loss data with the additional dataset “primary humid tropical forests” as of 2001 (Turubanova et al 2018). For more details on this part of the methodology, see the Technical Blog from Global Forest Watch (Goldman and Weisse 2019).

To identify the deforestation hotspots, we conducted a kernel density estimate. This type of analysis calculates the magnitude per unit area of a particular phenomenon, in this case forest cover loss. We conducted this analysis using the Kernel Density tool from Spatial Analyst Tool Box of ArcGIS. We used the following parameters:

Search Radius: 15000 layer units (meters)
Kernel Density Function: Quartic kernel function
Cell Size in the map: 200 x 200 meters (4 hectares)
Everything else was left to the default setting.

For the Base Map, we used the following concentration percentages: Medium: 7-10%; High: 11-20%; Very High: >20%.

Acknowledgements

We thank E. Ortiz (AAF), M.E. Gutierrez (ACCA), and S. Novoa for their helpful comments on this report.

This work was supported by NORAD (Norwegian Agency for Development Cooperation) and ICFC (International Conservation Fund of Canada).

Citation

Finer M, Mamani N (2020) Amazon Deforestation Hotspots 2020. MAAP: 132.

MAAP #131: Power of Free High-resolution Satellite Imagery from Norway Agreement

Image 1. Monthly Planet basemap for October 2020 across the Amazon, as seen on Global Forest Watch.

This report demonstrates the powerful application of freely available, high-resolution satellite imagery recently made possible thanks to an agreement between the Government of Norway and several satellite companies.*

This unprecedented agreement will bring commercial satellite technology, previously out of reach to many, to all working in tropical forest conservation around the world.

Here we show how MAAP (an initiative of Amazon Conservation) will use this information to enhance our real-time monitoring program and quickly share timely findings to partners in the field.

Specifically, we highlight the importance of the monthly basemaps (4.7-meter Planet imagery) available under the Norway agreement.* For example, Image 1 shows the stunning, nearly cloud-free October 2020 basemap across the Amazon.

l
Moreover, we show the power of this imagery visualized on Global Forest Watch, where it can be combined with early warning forest loss alerts.
p
Below, we highlight three examples where we combined this data to quickly detect and confirm deforestation in the Colombian, Ecuadorian, and Peruvian Amazon, respectively.

Colombian Amazon

First, we detected recent forest loss alerts (known as GLAD alerts), in the northwestern sector of Chiribiquete National Park. Image 2 is a screen shot of our monitoring search in Global Forest Watch (link here).

Second, we investigated the alerts with the freely available monthly Planet basemaps. Images 3-5 show the basemaps from October to December 2020. These images confirm that the area was covered in intact (likely primary) Amazon rainforest in October, and then experienced a major deforestation event (225 hectares) in November and December. Similar deforestation in the area appears to be conversion to cattle pasture. Note the crosshairs (+) represent the same point in all four images.

Image 2. Forest loss alerts in Chiribiquete National Park
Image 3. Monthly Planet basemap for October 2020 in Chiribiquete National Park.
Image 4. Monthly Planet basemap for November 2020 in Chiribiquete National Park.
Image 5. Monthly Planet basemap for December 2020 in Chiribiquete National Park.

Peruvian Amazon

Similarly, we detected recent forest loss alerts in an illegal gold mining area in the southern Peruvian Amazon known as Pariamanu (Image 6). Images 7 & 8 show the monthly basemaps confirming the expansion of illegal mining deforestation between October and December (see yellow arrows). Global Forest Watch link here.

Image 6. Forest loss alerts in illegal gold mining zone (Pariamanu).
Image 7. Monthly Planet basemap for October 2020 in Pariamanu.
Image 8. Monthly Planet basemap for October 2020 in Pariamanu.

Ecuadorian Amazon

Finally, we detected recent forest loss alerts of 100 hectares in an indigenous territory (Kichwa) surrounding an oil palm plantation in the Ecuadorian Amazon (Image 9). Images 10 & 11 show the monthly basemaps confirming large-scale deforestation between September and December, likely for the expansion of the plantation. Note the crosshairs (+) represents the same point in all three images. Global Forest Watch link here.
Image 9. Forest loss alerts in the Ecuadorian Amazon.
Image 10. Monthly Planet basemap for September 2020 in Ecuadorian Amazon.
Image 11. Monthly Planet basemap for December 2020 in Ecuadorian Amazon.

Summary

In summary, we show a major advance for free and real-time deforestation monitoring thanks to an agreement between the Government of Norway and satellite companies.* A key aspect of this agreement is making publically available (such as on Global Forest Watch) monthly basemaps created by the innovative satellite company Planet. Thus, users can now freely visualize recent forest loss alerts and then investigate them with high-resolution monthly basemaps on On Global Forest Watch. MAAP illustrated this process with three examples in the Colombian, Peruvian, Ecuadorian Amazon, respectively.

*Notes 

In September 2020, Norway’s Ministry of Climate and Environment entered into a contract with Kongsberg Satellite Services (KSAT) and its partners Planet and Airbus, to provide universal access to high-resolution satellite monitoring of the tropics in order to support efforts to stop the destruction of the world’s rainforests. This effort is led by Norway’s International Climate and Forest Initiative (NICFI). The basemaps are mosaics of the best cloud-free pixels each month. In addition to viewing the monthly basemaps on Global Forest Watch, users can sign up with Planet directly at this link: https://www.planet.com/nicfi/

Acknowledgements

We thank M. Cohen (ACA), M. Weisse (WRI/GFW), E. Ortiz (AAF) and G. Palacios for their helpful comments on this report.

This work was supported by NORAD (Norwegian Agency for Development Cooperation).

Citation

Finer M, Mamani N (2020) Power of Freely Available, High-resolution Satellite Imagery from Norway Agreement. MAAP: 131.

MAAP #122: Amazon Deforestation 2019

Table 1. Amazon 2019 primary forest loss for 2019 (red) compared to 2018 (orange). Data: Hansen/UMD/Google/USGS/NASA, MAAP.

Newly released data for 2019 reveals the loss of over 1.7 million hectares (4.3 million acres) of primary Amazon forest in our 5 country study area (Bolivia, Brazil, Colombia, Ecuador, and Peru).* That is twice the size of Yellowstone National Park.

Table 1 shows 2019 deforestation (red) in relation to 2018 (orange).

Primary forest loss in the Brazilian Amazon (1.29 million hectares) was over 3.5 times higher than the other four countries combined, with a slight increase in 2019 relative to 2018. Many of these areas were cleared in the first half of the year and then burned in August, generating international attention.

Primary forest loss rose sharply in the Bolivian Amazon (222,834 hectares), largely due to uncontrolled fires escaping into the dry forests of the southern Amazon.

Primary forest loss rose slightly in the Peruvian Amazon (161,625 hectares) despite a relatively successful crackdown on illegal gold mining, pointing to small-scale agriculture (and cattle) as the main driver.

On the positive side, primary forest loss decreased in the Colombian Amazon (91,400 hectares) following a major spike following the 2016 peace accords (between the government and FARC). It is worth noting, however, that we have now documented the loss of 444,000 hectares (over a million acres) of primary forest in the Colombian Amazon in the past four years since the peace agreement (see Annex).

*Two important points about the data. First, we use annual forest loss from the University of Maryland to have a consistent source across all five countries. Second, we applied a filter to only include loss of primary forest (see Methodology).

2019 Deforestation Hotspots Map

The Base Map below shows the major 2019 deforestation hotspots across the Amazon.

2019 deforestation hotspots across the Amazon. Data: Hansen/UMD/Google/USGS/NASA, MAAP.

Many of the major deforestation hotspots were in Brazil. Early in the year, in March, there were uncontrolled fires up north in the state of Roraima. Further south, along the Trans-Amazonian Highway, much of the deforestation occurred in the first half of the year, followed by the high profile fires starting in late July. Note that many of these fires were burning recently deforested areas, and were not uncontrolled forest fires (MAAP #113).

The Brazilian Amazon also experienced escalating gold mining deforestation in indigenous territories (MAAP #116).

Bolivia also had an intense 2019 fire season. Unlike Brazil, many were uncontrolled fires, particularly in the Beni grasslands and Chiquitano dry forests of the southern Bolivian Amazon (MAAP #108).

In Peru, although illegal gold mining deforestation decreased (MAAP #121), small-scale agriculture (including cattle) continues to be a major driver in the central Amazon (MAAP #112) and an emerging driver in the south.

In Colombia, there is an “arc of deforestation” in the northwestern Amazon. This arc includes four protected areas (Tinigua, Chiribiquete and Macarena National Parks, and Nukak National Reserve) and two Indigenous Reserves (Resguardos Indígenas Nukak-Maku and Llanos del Yari-Yaguara II) experiencing substantial deforestation (MAAP #120). One of the main deforestation drivers in the region is conversion to pasture for land grabbing or cattle ranching.

Annex – Colombia peace accord trend

Annex 1. Deforestation of primary forest in the Colombian Amazon, 2015-20. Data: Hansen/UMD/Google/USGS/NASA, UMD/GLAD. *Until May 2020

Methodology

The baseline forest loss data presented in this report were generated by the Global Land Analysis and Discovery (GLAD) laboratory at the University of Maryland (Hansen et al 2013) and presented by Global Forest Watch. Our study area is strictly what is highlighted in the Base Map.

For our estimate of primary forest loss, we used the annual “forest cover loss” data with density >30% of the “tree cover” from the year 2001. Then we intersected the forest cover loss data with the additional dataset “primary humid tropical forests” as of 2001 (Turubanova et al 2018). For more details on this part of the methodology, see the Technical Blog from Global Forest Watch (Goldman and Weisse 2019).

For boundaries, we used the biogeographical limit (as defined by RAISG) for all countries except Bolivia, where we used the Amazon watershed limit (see Base Map).

All data were processed under the geographical coordinate system WGS 1984. To calculate the areas in metric units, the projection was: Peru and Ecuador UTM 18 South, Bolivia UTM 20 South, Colombia MAGNA-Bogotá, and Brazil Eckert IV.

Lastly, to identify the deforestation hotspots, we conducted a kernel density estimate. This type of analysis calculates the magnitude per unit area of a particular phenomenon, in this case forest cover loss. We conducted this analysis using the Kernel Density tool from Spatial Analyst Tool Box of ArcGIS. We used the following parameters:

Search Radius: 15000 layer units (meters)
Kernel Density Function: Quartic kernel function
Cell Size in the map: 200 x 200 meters (4 hectares)
Everything else was left to the default setting.

For the Base Map, we used the following concentration percentages: Medium: 7%-10%; High: 11%-20%; Very High: >20%.

References

Goldman L, Weisse M (2019) Explicación de la Actualización de Datos de 2018 de Global Forest Watch. https://blog.globalforestwatch.org/data-and-research/blog-tecnico-explicacion-de-la-actualizacion-de-datos-de-2018-de-global-forest-watch

Hansen, M. C., P. V. Potapov, R. Moore, M. Hancher, S. A. Turubanova, A. Tyukavina, D. Thau, S. V. Stehman, S. J. Goetz, T. R. Loveland, A. Kommareddy, A. Egorov, L. Chini, C. O. Justice, and J. R. G. Townshend. 2013. “High-Resolution Global Maps of 21st-Century Forest Cover Change.” Science 342 (15 November): 850–53. Data available on-line from: http://earthenginepartners.appspot.com/science-2013-global-forest.

Turubanova S., Potapov P., Tyukavina, A., and Hansen M. (2018) Ongoing primary forest loss in Brazil, Democratic Republic of the Congo, and Indonesia. Environmental Research Letters  https://doi.org/10.1088/1748-9326/aacd1c 

Acknowledgements

We thank G. Palacios for helpful comments to earlier versions of this report.

This work was supported by the following major funders: Norwegian Agency for Development Cooperation (NORAD), Gordon and Betty Moore Foundation, International Conservation Fund of Canada (ICFC), Metabolic Studio, Erol Foundation, MacArthur Foundation, and Global Forest Watch Small Grants Fund (WRI).

Citation

Finer M, Mamani N (2020) 2019 Amazon Deforestation. MAAP: 122.

MAAP #117: New Oil Road Deeper into Yasuni National Park (Ecuador), Towards Uncontacted Indigenous Reserve

Yasuní National Park, located in the heart of the Ecuadorian Amazon, is one of the most biodiverse spots in the world and overlaps ancestral Waorani territory. In the recent MAAP #114, we showed the construction of four new oil drilling platforms (and access road) in the controversial ITT oil block, located in the heart of Yasuní.

Here, we show that, beginning in mid-March 2020, we detected the construction of a new access road heading further south from the last platform (Image 1). As of early May, this road construction was 4.7 km through primary forest.

Updated: June 30 (4.7 km); June 14 (3.7 km); May 17 (2.2 km).

Image 1. Construction of a new 4.7 km oil access road deeper into Yasuni National Park between March (left panel) and June (right panel) 2020. Click to enlarge.

Implications of the New Oil Road

This finding is concerning because it brings oil development closer to the “Zona Intangible,” a reserve created to protect the territory of indigenous people in voluntary isolation (Tagaeri, Taromenane), isolated relatives of the Waorani.

In Image 2, the location of the new road (indicated in red) is shown approaching several planned oil drilling platforms just outside the buffer zone of the Zona Intangible. Image 3 shows a zoom of this area.

It is also concerning because construction is occurring during the coronavirus pandemic.

Image 2. The new oil acces road (in red) approaching the Zona Intangible.

Very High Resolution Image

We have also obtained a very high resolution satellite image (Skysat, 0.8 meters) of the new oil access road. Below are two examples of this image; the first shows the complete route of the new highway and the second is a zoom of the most recent expansion to the south. Click to enlarge.

Finer M, Mamani N (2020) New Oil Road Deeper into Yasuni National Park. MAAP: 116.

MAAP Synthesis: 2019 Amazon Deforestation Trends and Hotspots

Base Map. Amazon Deforestation, 2001-2019. Data: UMD/GLAD, Hansen/UMD/Google/USGS/NASA, MAAP. Click to see image in high resolution.

MAAP, an initiative of Amazon Conservation, specializes in satellite-based, real-time deforestation monitoring of the Amazon. Our geographic focus covers five countries: Bolivia, Brazil, Colombia, Ecuador, and Peru (see Base Map).

We found that, since 2001, this vast area lost 65.8 million acres (26.6 million hectares) of primary forest, an area equivalent to the size of the United Kingdom (or the U.S. state of Colorado).

In 2019, we published 18 high-impact reports on the most urgent cases of deforestation. 2019 highlights include:

  • Fires in the Brazilian Amazon actually burned freshly deforested areas (MAAP #113);
  • Effective illegal gold mining crackdown in the Peruvian Amazon as a result of the government’s Operation Mercury (MAAP #104);
  • Illegal invasion of protected areas in the Colombian Amazon (MAAP #106);
  • Construction of oil-drilling platforms in the mega-diverse Yasuni National Park of the Ecuadorian Amazon (MAAP #114).

Here, in our annual Synthesis Report, we go beyond these emblematic cases and look at the bigger picture for 2019, describing the most important deforestation trends and hotspots across the Amazon.

*Note: to download a PDF, click the “Print” button below the title.

Synthesis Key Findings

Trends: We present a GIF comparing deforestation trends for each country since 2001. The preliminary 2019 estimates have several important headlines:
  • Possible major deforestation decrease in the Colombian Amazon following a dramatic increase over the previous three years;
  • Likely major deforestation increase in the Bolivian Amazon due to forest fires;
  • Downward deforestation trend continues in the Peruvian Amazon, but still historically high;
  • Deforestation of 2.4 million acres in the Brazilian Amazon, but the trend depends on the data source.
Hotspots: We present a Base Map highlighting the major deforestation hotspots in 2019. Results emphasize the deforestation and fires in the Brazilian Amazon, along with several key areas in Colombia, Peru, and Bolivia.
.

Deforestation Trends 2001-2019

The following GIF shows deforestation trends for each country between 2001 and 2019 (see descriptive notes below). Click here for static versions of each graph.

Three important points about the data: First, as a baseline, we use annual forest loss from the University of Maryland to have a consistent source across all five countries (thus it may differ from official national data). Second, we applied a filter to only include loss of primary forest (see Methodology). Third, the 2019 data represents a preliminary estimate based on early warning alerts.

  1. Deforestation in the Ecuadorian Amazon is relatively low, reaching a maximum of 18,800 hectares (46,500 acres) in 2017. The estimate for 2019 is 11,400 hectares (28,000 acres).
    .
  2. In the Bolivian Amazon, deforestation decreased in 2018 to 58,000 hectares (143,000 acres) after a peak in 2016 of 122,000 hectares (302,000 acres). However, with the recent widespread forest fires, deforestation increased again in 2019, to 135,400 hectares (334,465 acres).
    .
  3. The Colombian Amazon experienced a deforestation boom starting in 2016 (coinciding with the FARC peace accords), reaching an historical high of 153,800 hectares (380,000 acres) in 2018. However, the deforestation estimate for 2019 is back to pre-boom levels at 53,800 hectares (133,000 acres).
    .
  4. Deforestation in the Peruvian Amazon declined in 2018 (compared to 2017) to 140,000 hectares (346,325 acres), but remained relatively high compared to historical data. The official deforestation data from the Peruvian government for 2018 is slightly higher at 154,700 hectares (382,272 acres), but also represents an important reduction compared to 2017. The deforestation estimate for 2019 indicates the continued downward trend to 134,600 hectares (332,670 acres).
    .
  5. Deforestation in the Brazilian Amazon is on another level compared to the other four countries. The 2019 deforestation estimate of 985,000 hectares (2.4 million acres) is consistent with the official data of the Brazilian government. The trend, however, is quite different; we show a decrease in deforestation compared to the previous three years, but the official data indicates an increase. To better understand the differences between data sources (including spatial resolution, inclusion of burned areas, and timeframe), consult this blog by Global Forest Watch.

Deforestation Hotspots 2019

Base Map. Deforestation Hotspots 2019. Data: MAAP, UMD/GLAD, Hansen/UMD/Google/USGS/NASA. Click to see image in high resolution.

The Base Map shows the most intense deforestation hotspots during 2019.

Many of the major deforestation hotspots were in Brazil. The letters A indicate areas deforested between March and July, and then burned starting in August, covering over 735,000 acres in the states of Rondônia, Amazonas, Mato Grosso, Acre, and Pará (MAAP #113). They also indicate areas where fire escaped into the surrounding primary forest, impacting an additional 395,000 acres. There is a concentration of these hotspots along the Trans-Amazonian Highway. The letter B indicates uncontrolled forest fires earlier in the year (March) in the state of Roraima (MAAP #109).

Bolivia also had an intense 2019 fire season. Letter C indicates the area where fires in Amazonian savanna ecosystems escaped to the surrounding forests.

In Colombia, the letter D indicates an area of high deforestation surrounding and within four protected areas: Tinigua, Chiribiquete, and Macarena National Parks, and the Nukak National Reserve (MAAP #106).

In Peru, there are several key areas to highlight. Letter E indicates a new Mennonite colony that has caused the deforestation of 2,500 acres in 2019, near the town of Tierra Blanca in the Loreto region (MAAP #112). Letter F indicates an area of high concentration of small-scale deforestation in the central Amazon (Ucayali and Huánuco regions), with cattle ranching as one of the main causes (MAAP #37). Letter G indicates an area of high concentration of deforestation along the Ene River (Junín and Ayacucho regions). In the south (Madre de Dios region), letter H indicates expanding agricultural activity around the town of Iberia (MAAP #98) and letter I indicates deforestation caused by a combination of gold mining and agricultural activity.

Methodology

As noted above, there are three important considerations about the data in our analysis: First, as a baseline, we use annual forest loss from the University of Maryland to have a consistent source across all five countries. Thus, the values may differ from official national data. Second, we applied a filter to only include loss of primary forest in order to better approximate the official methodology and data. Third, the 2019 data represents a preliminary estimate based on early warning alerts.

The baseline forest loss data presented in this report were generated by the Global Land Analysis and Discovery (GLAD) laboratory at the University of Maryland (Hansen et al 2013) and presented by Global Forest Watch. Our study area is strictly what is highlighted in the Base Map.

Specifically, for our estimate of forest cover loss, we multiplied the annual “forest cover loss” data by the density percentage of the “tree cover” from the year 2001 (values >30%).

For our estimate of primary forest loss, we intersected the forest cover loss data with the additional dataset “primary humid tropical forests” as of 2001 (Turubanova et al 2018). For more details on this part of the methodology, see the Technical Blog from Global Forest Watch (Goldman and Weisse 2019).

All data were processed under the geographical coordinate system WGS 1984. To calculate the areas in metric units the UTM (Universal Transversal Mercator) projection was used: Peru and Ecuador 18 South, Colombia 18 North, Western Brazil 19 South and Bolivia 20 South.

Lastly, to identify the deforestation hotspots, we conducted a kernel density estimate. This type of analysis calculates the magnitude per unit area of a particular phenomenon, in this case forest cover loss. We conducted this analysis using the Kernel Density tool from Spatial Analyst Tool Box of ArcGIS. We used the following parameters:

Search Radius: 15000 layer units (meters)
Kernel Density Function: Quartic kernel function
Cell Size in the map: 200 x 200 meters (4 hectares)
Everything else was left to the default setting.

For the Base Map, we used the following concentration percentages: Medium: 10%-20%; High: 21%-35%; Very High: >35%.

References

Goldman L, Weisse M (2019) Explicación de la Actualización de Datos de 2018 de Global Forest Watch. https://blog.globalforestwatch.org/data-and-research/blog-tecnico-explicacion-de-la-actualizacion-de-datos-de-2018-de-global-forest-watch

Hansen, M. C., P. V. Potapov, R. Moore, M. Hancher, S. A. Turubanova, A. Tyukavina, D. Thau, S. V. Stehman, S. J. Goetz, T. R. Loveland, A. Kommareddy, A. Egorov, L. Chini, C. O. Justice, and J. R. G. Townshend. 2013. “High-Resolution Global Maps of 21st-Century Forest Cover Change.” Science 342 (15 November): 850–53. Data available on-line from: http://earthenginepartners.appspot.com/science-2013-global-forest.

Planet Team (2017). Planet Application Program Interface: In Space for Life on Earth. San Francisco, CA. https://api.planet.com

Turubanova S., Potapov P., Tyukavina, A., and Hansen M. (2018) Ongoing primary forest loss in Brazil, Democratic Republic of the Congo, and Indonesia. Environmental Research Letters  https://doi.org/10.1088/1748-9326/aacd1c 

Acknowledgements

Agradecemos a S. Novoa (ACCA), R. Botero (FCDS), A. Condor (ACCA) y G. Palacios por sus útiles comentarios a este reporte.

Acknowledgements

We thank S. Novoa (ACCA), R. Botero (FCDS), A. Condor (ACCA), A. Folhadella (Amazon Conservation), M. Cohen, and G. Palacios for helpful comments to earlier versions of this report.

This work was supported by the following major funders: NASA/USAID (SERVIR), Norwegian Agency for Development Cooperation (NORAD), Gordon and Betty Moore Foundation, International Conservation Fund of Canada (ICFC), Metabolic Studio, Erol Foundation, MacArthur Foundation, and Global Forest Watch Small Grants Fund (WRI).

Citation

Finer M, Mamani N (2020) MAAP Synthesis: 2019 Amazon Deforestation Trends and Hotspots. MAAP Synthesis #4.