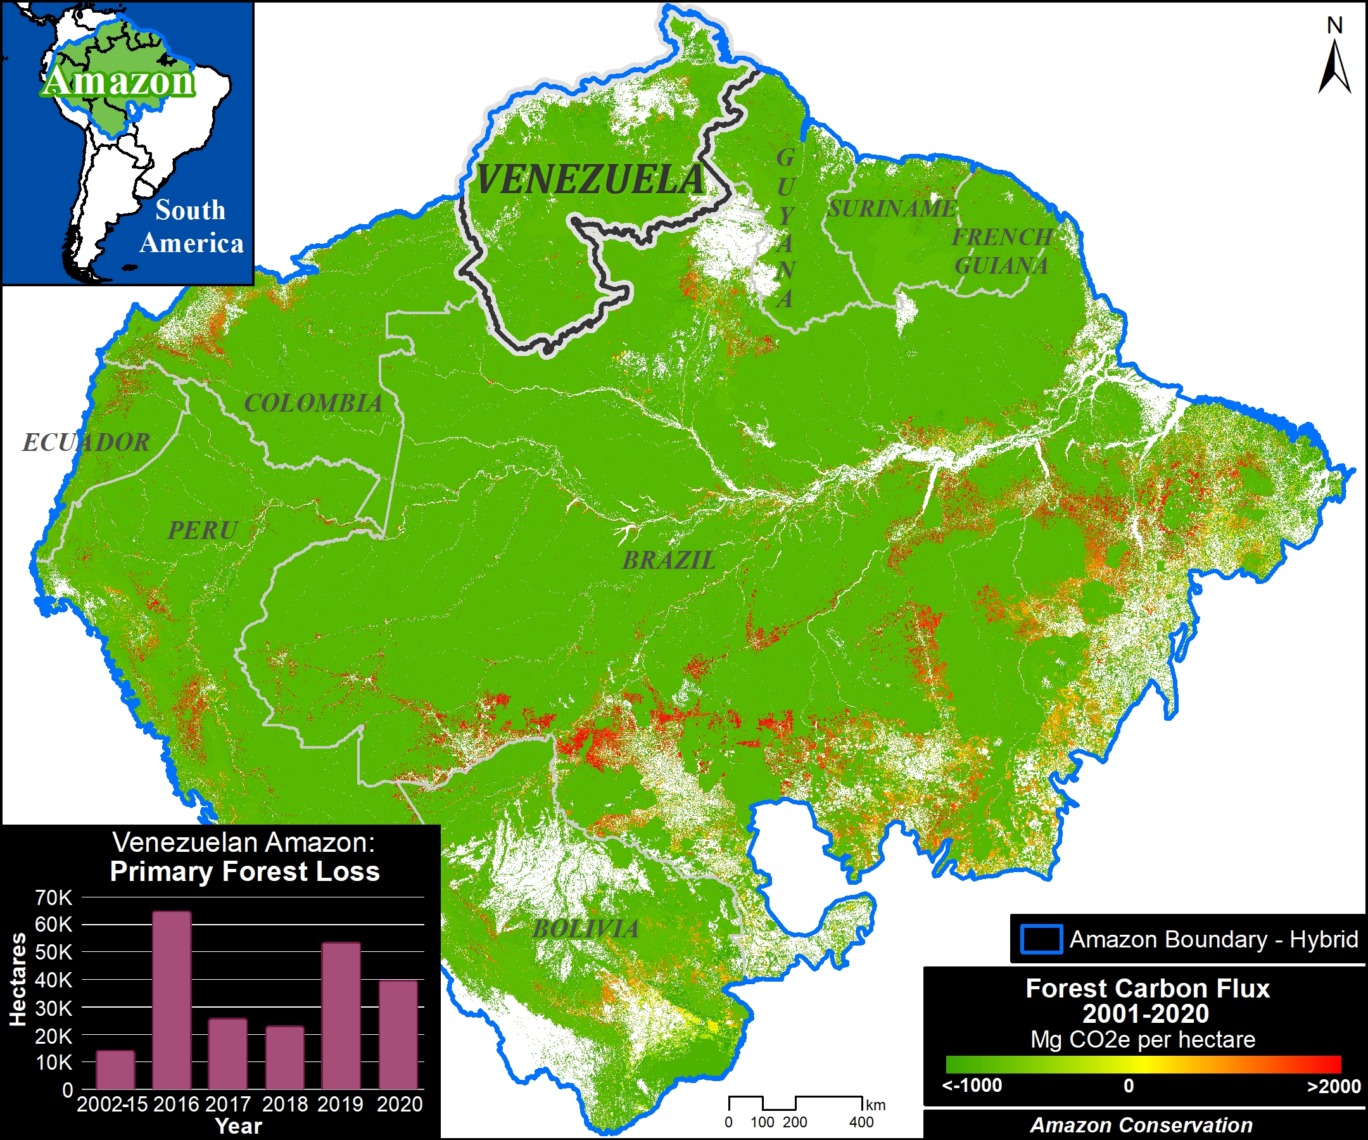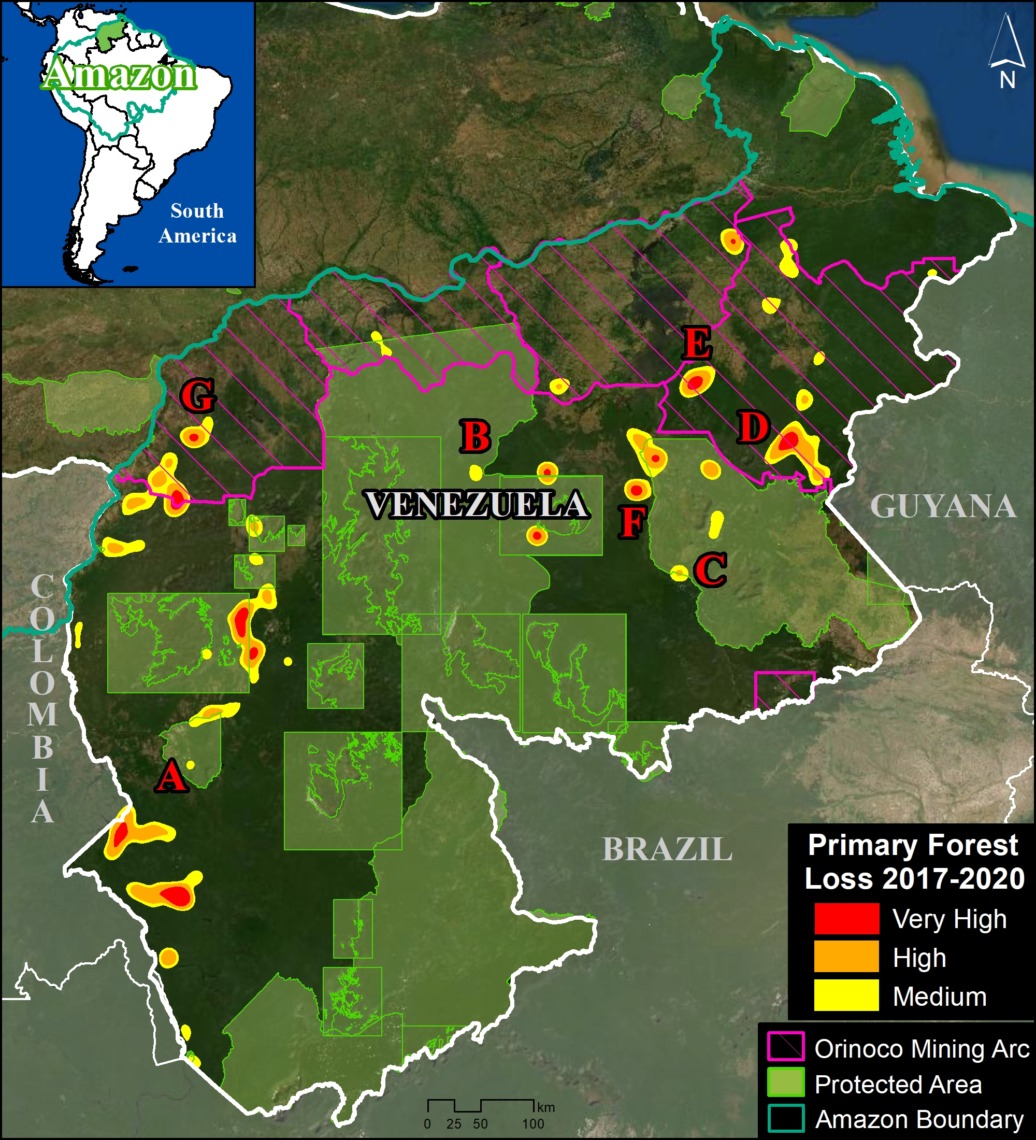
Gold mining is one of the major deforestation drivers across the Amazon, with well-known cases in Peru, Brazil, and Venezuela.
In a recent series of technical articles*, in collaboration with the Ecuadorian organization Foundation EcoCiencia, we have also shown that gold mining is escalating in the Ecuadorian Amazon.
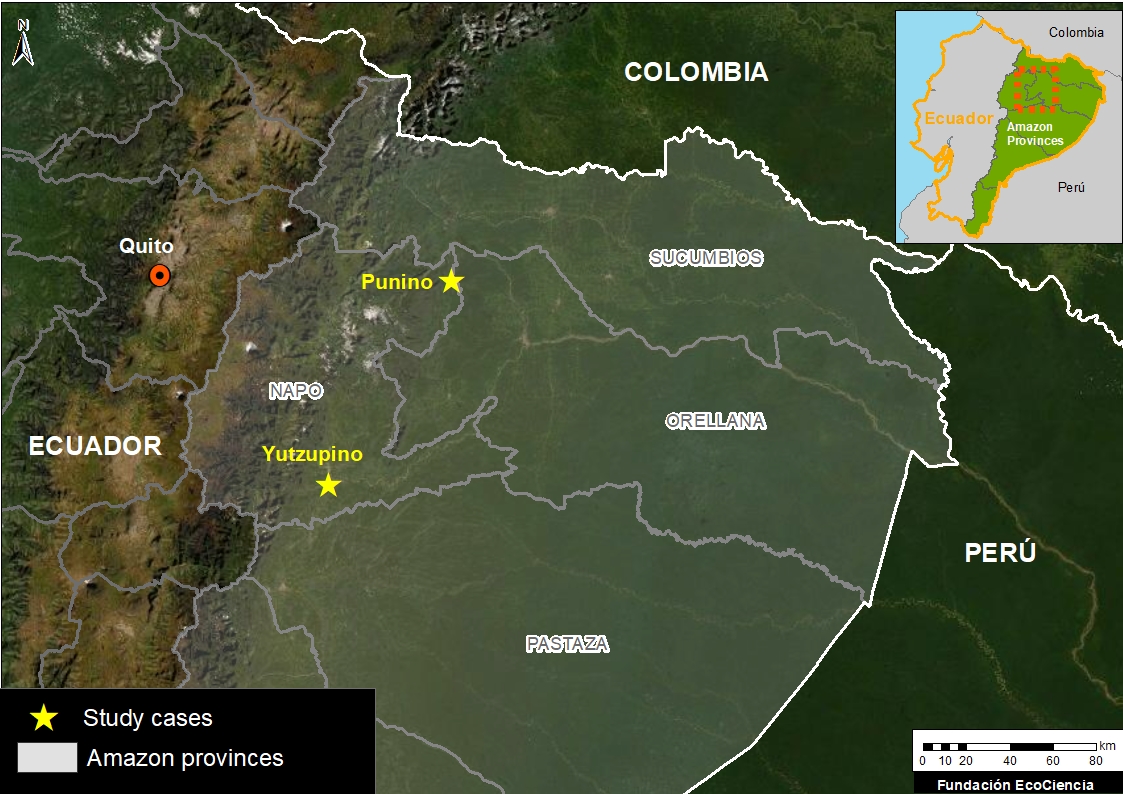
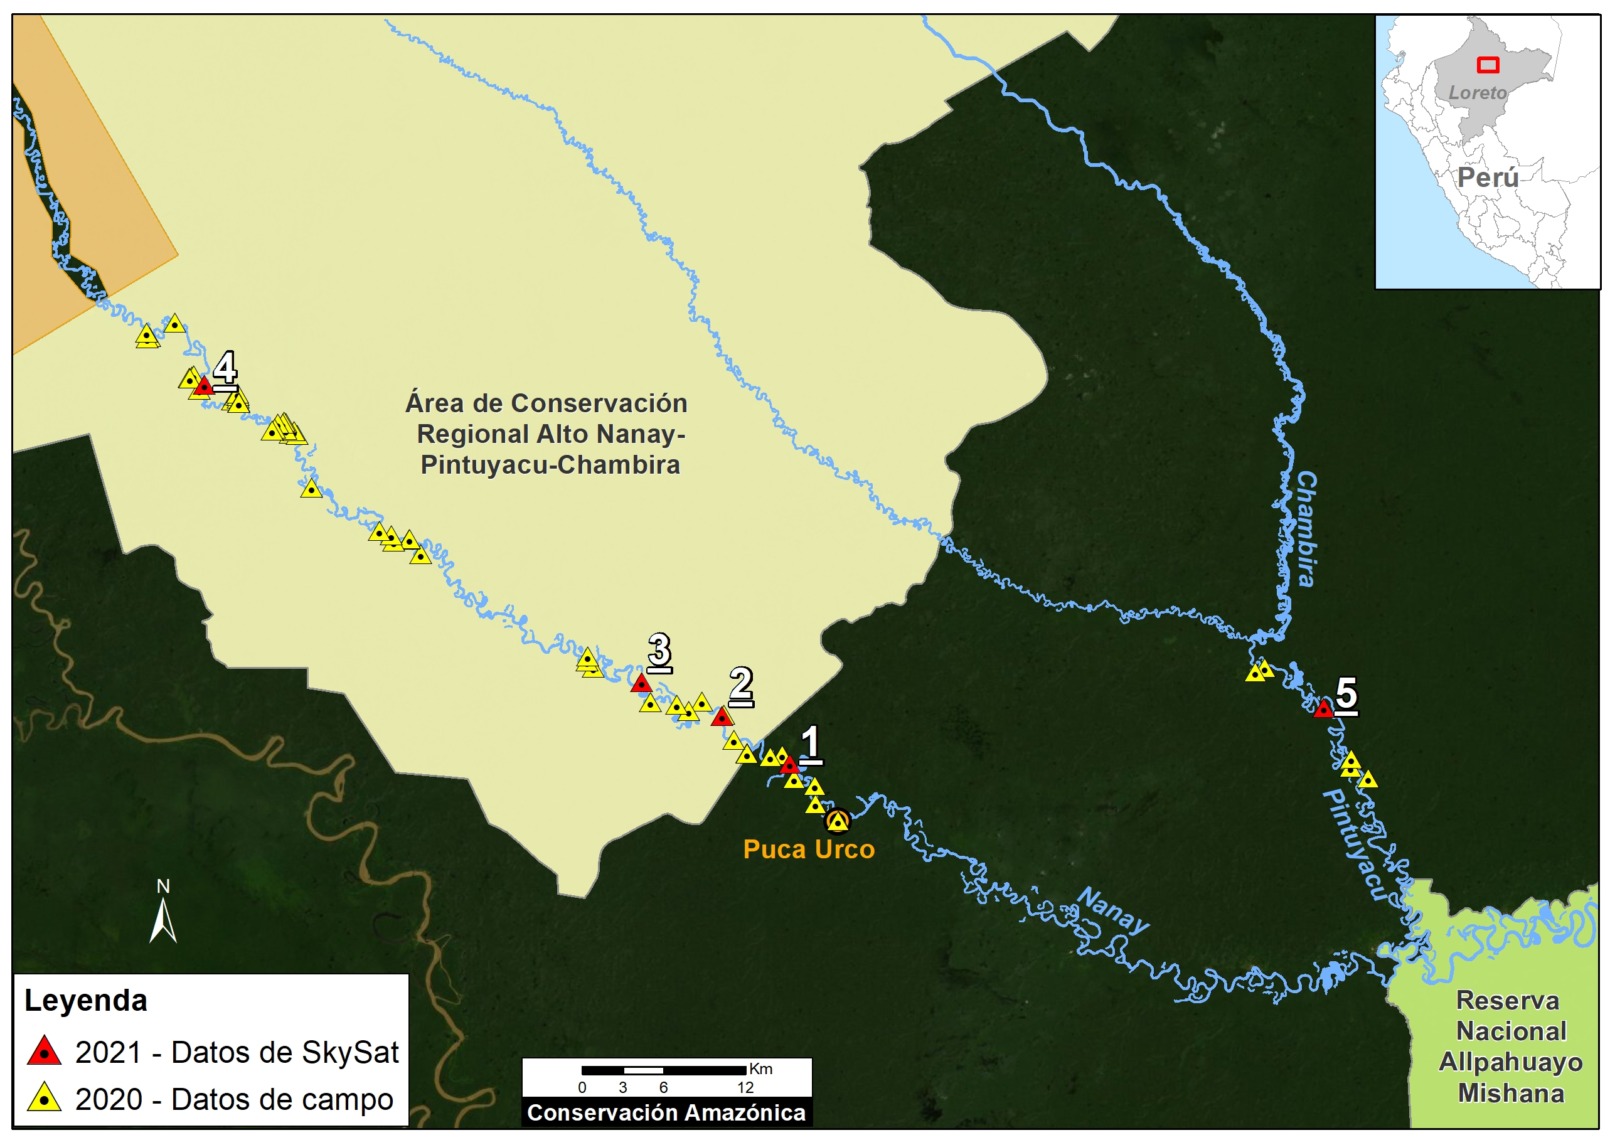
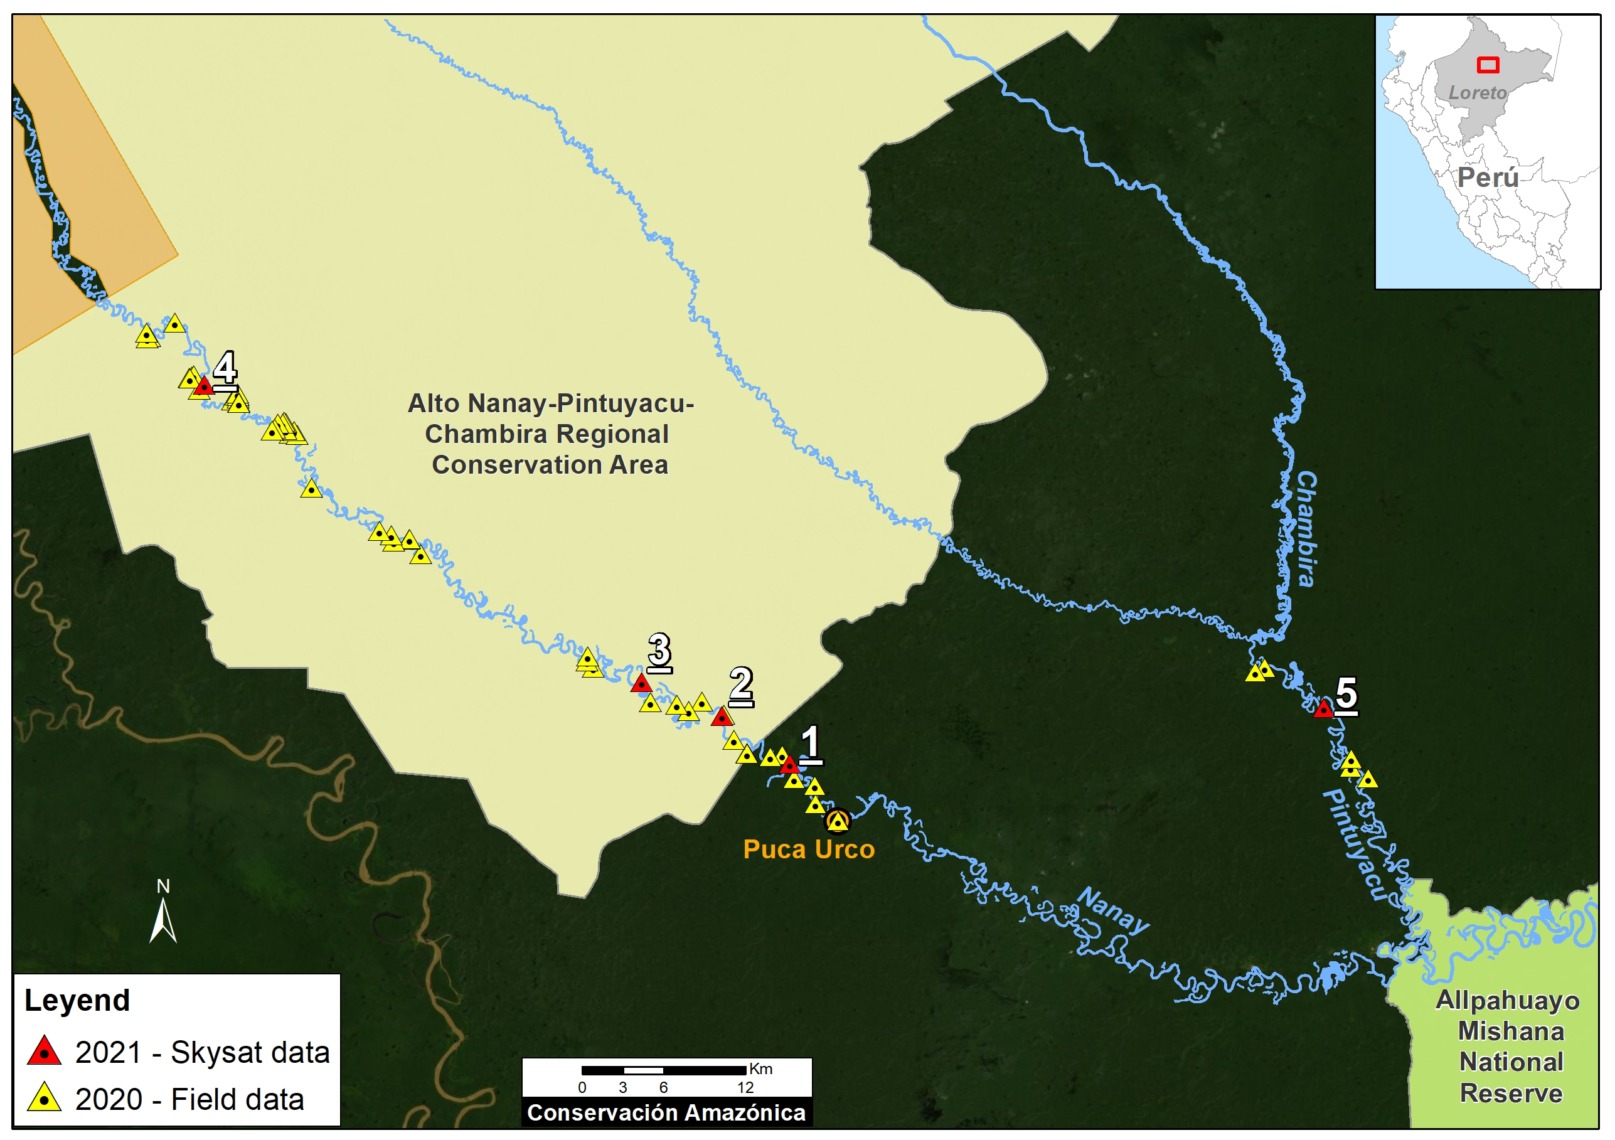
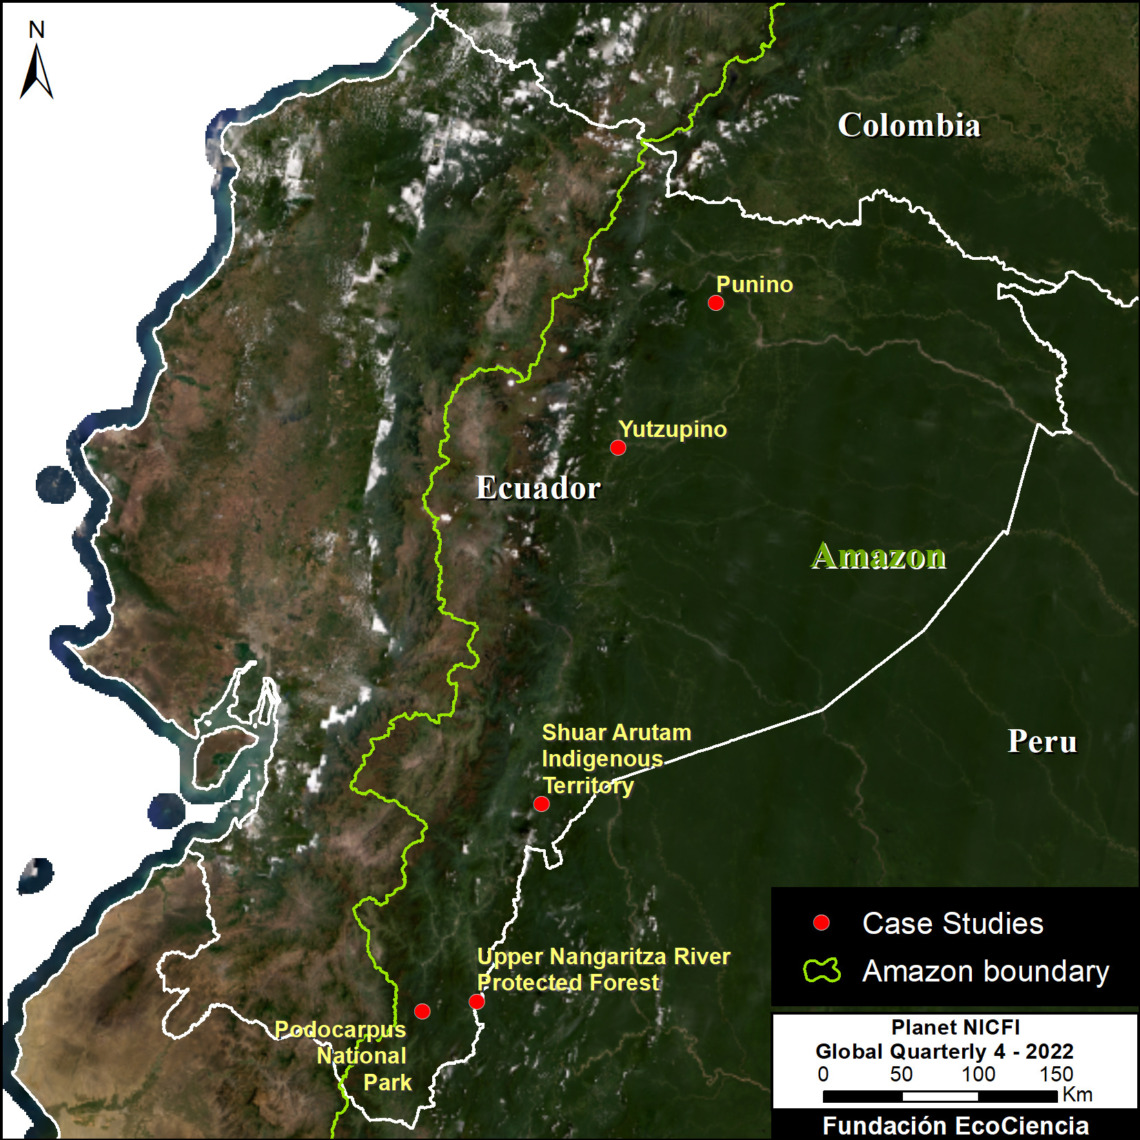
Here, we summarize the results from the series and present 5 major cases of recent gold mining deforestation in Ecuador (see Base Map).
These cases, which include gold mining expansion in protected areas, indigenous territories, and primary forests, are:
- Punino River, located between Napo and Orellana provinces, has experienced the rapid mining deforestation expansion of 217 hectares since 2019.
l - Yutzupino, located in Napo province, has experienced mining deforestation of 125 hectares since 2021. Surrounding sites in Napo have added 490 hectares since 2017.
l - Shuar Arutam Indigenous Territory, located in Morona Santiago province, has experienced 257 hectares of mining deforestation since 2021.
l - Podocarpus National Park, located in Zamora Chinchipe province, has experienced 25 hectares of mining deforestation within the park since 2019.
k - Upper Nangaritza River Protected Forest, also located in Zamora Chinchipe has experienced 545 hectares of mining deforestation since 2018.
In total, we have documented the recent gold mining deforestation of 1,660 hectares (4,102 acres) in the Ecuadorian Amazon. This is equivalent to 2,325 soccer fields.
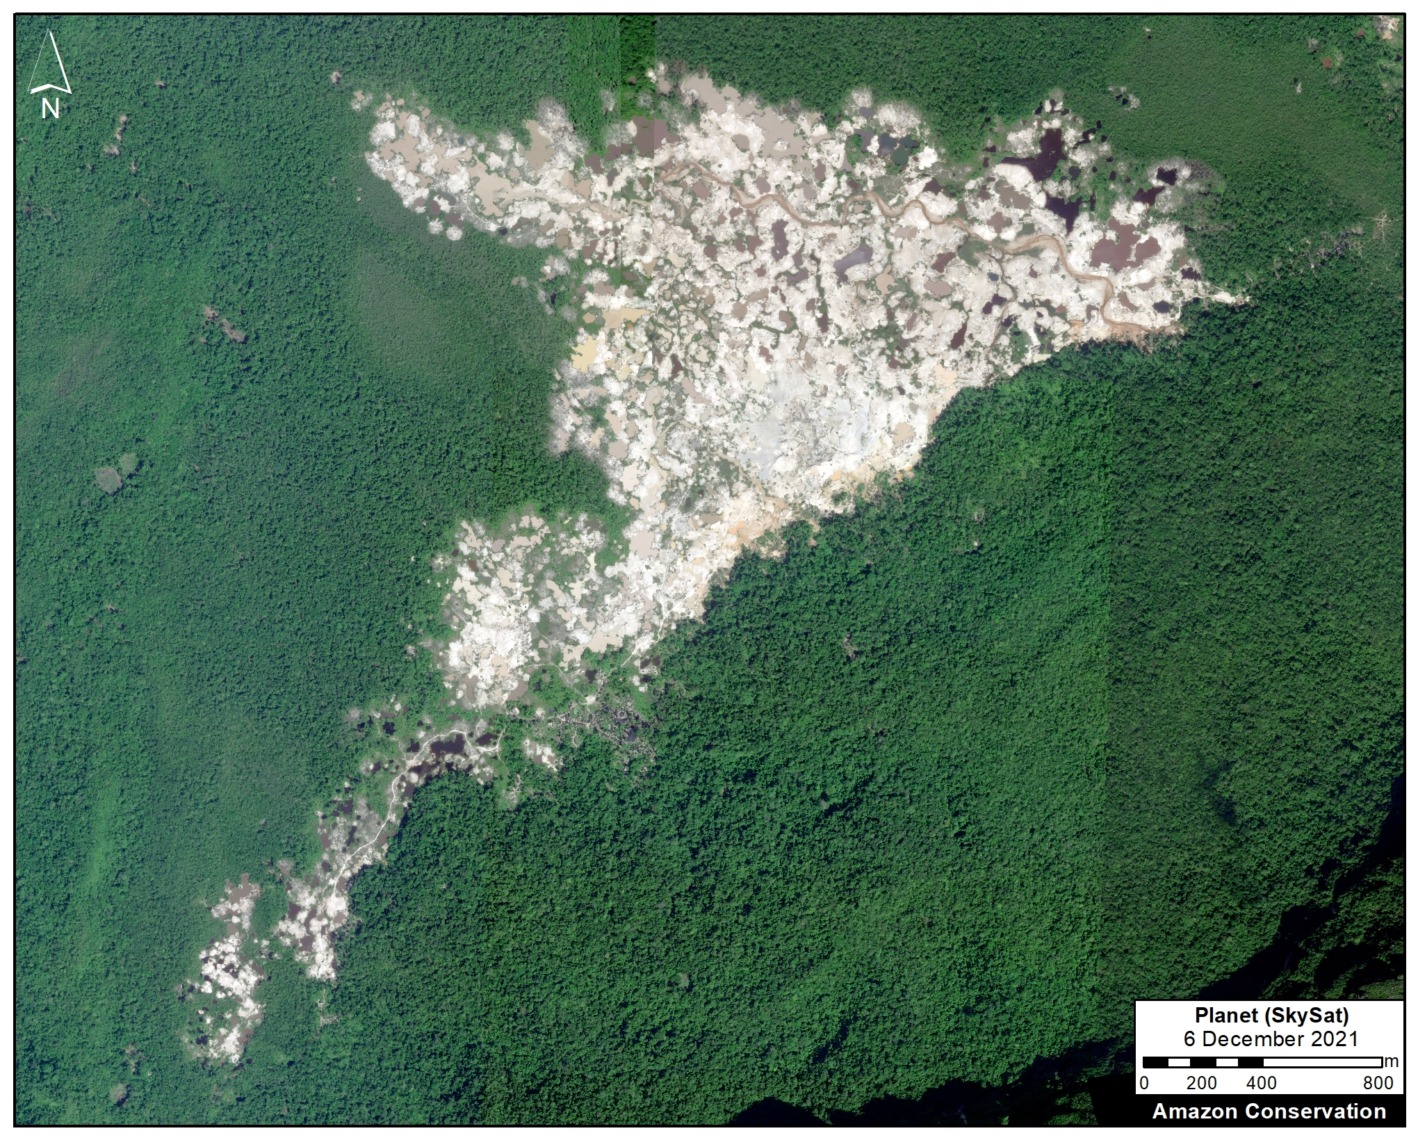
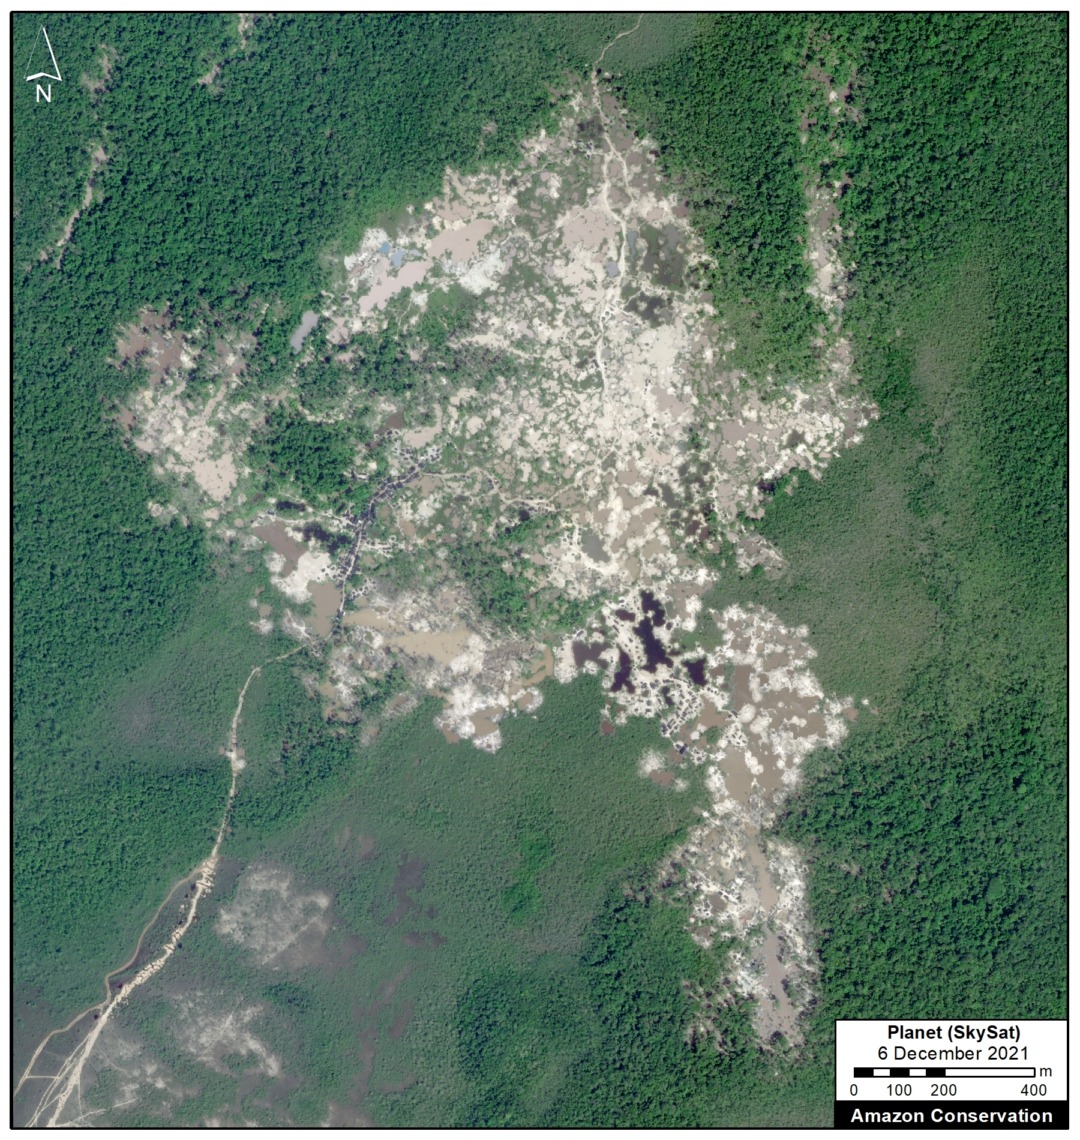
For each case, we show high-resolution satellite images of the recent gold mining deforestation.
Case Studies – Recent Gold Mining Deforestation in the Ecuadorian Amazon
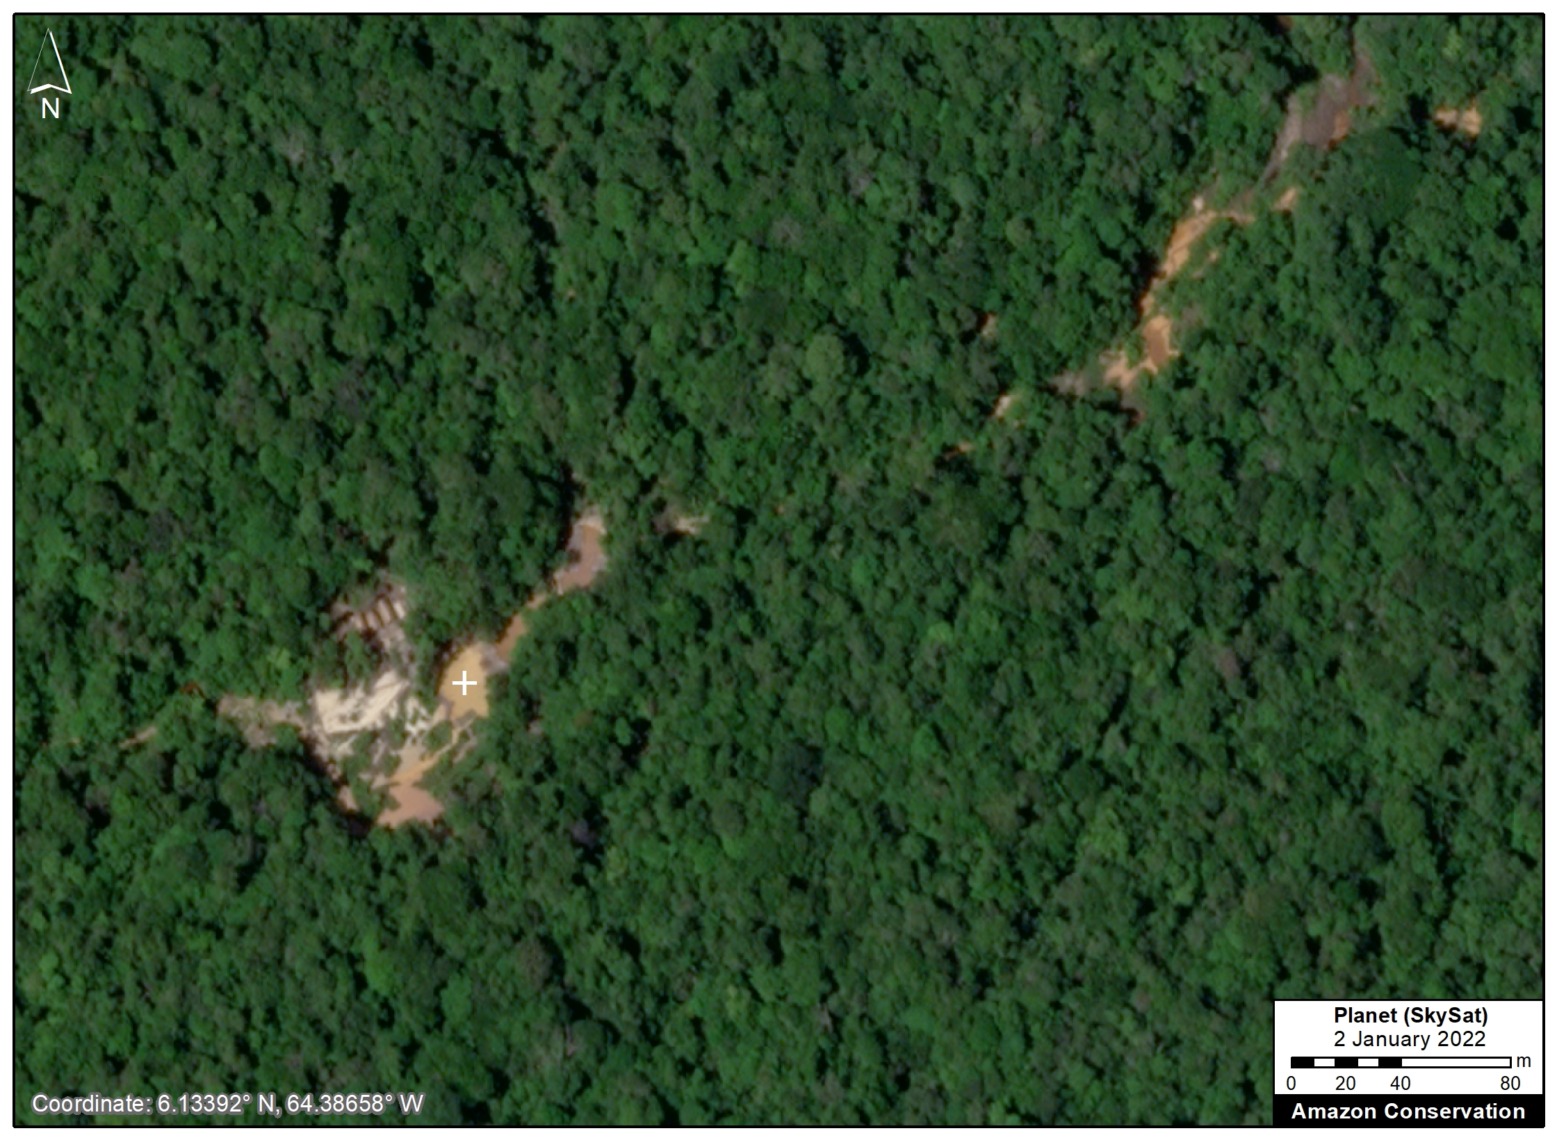
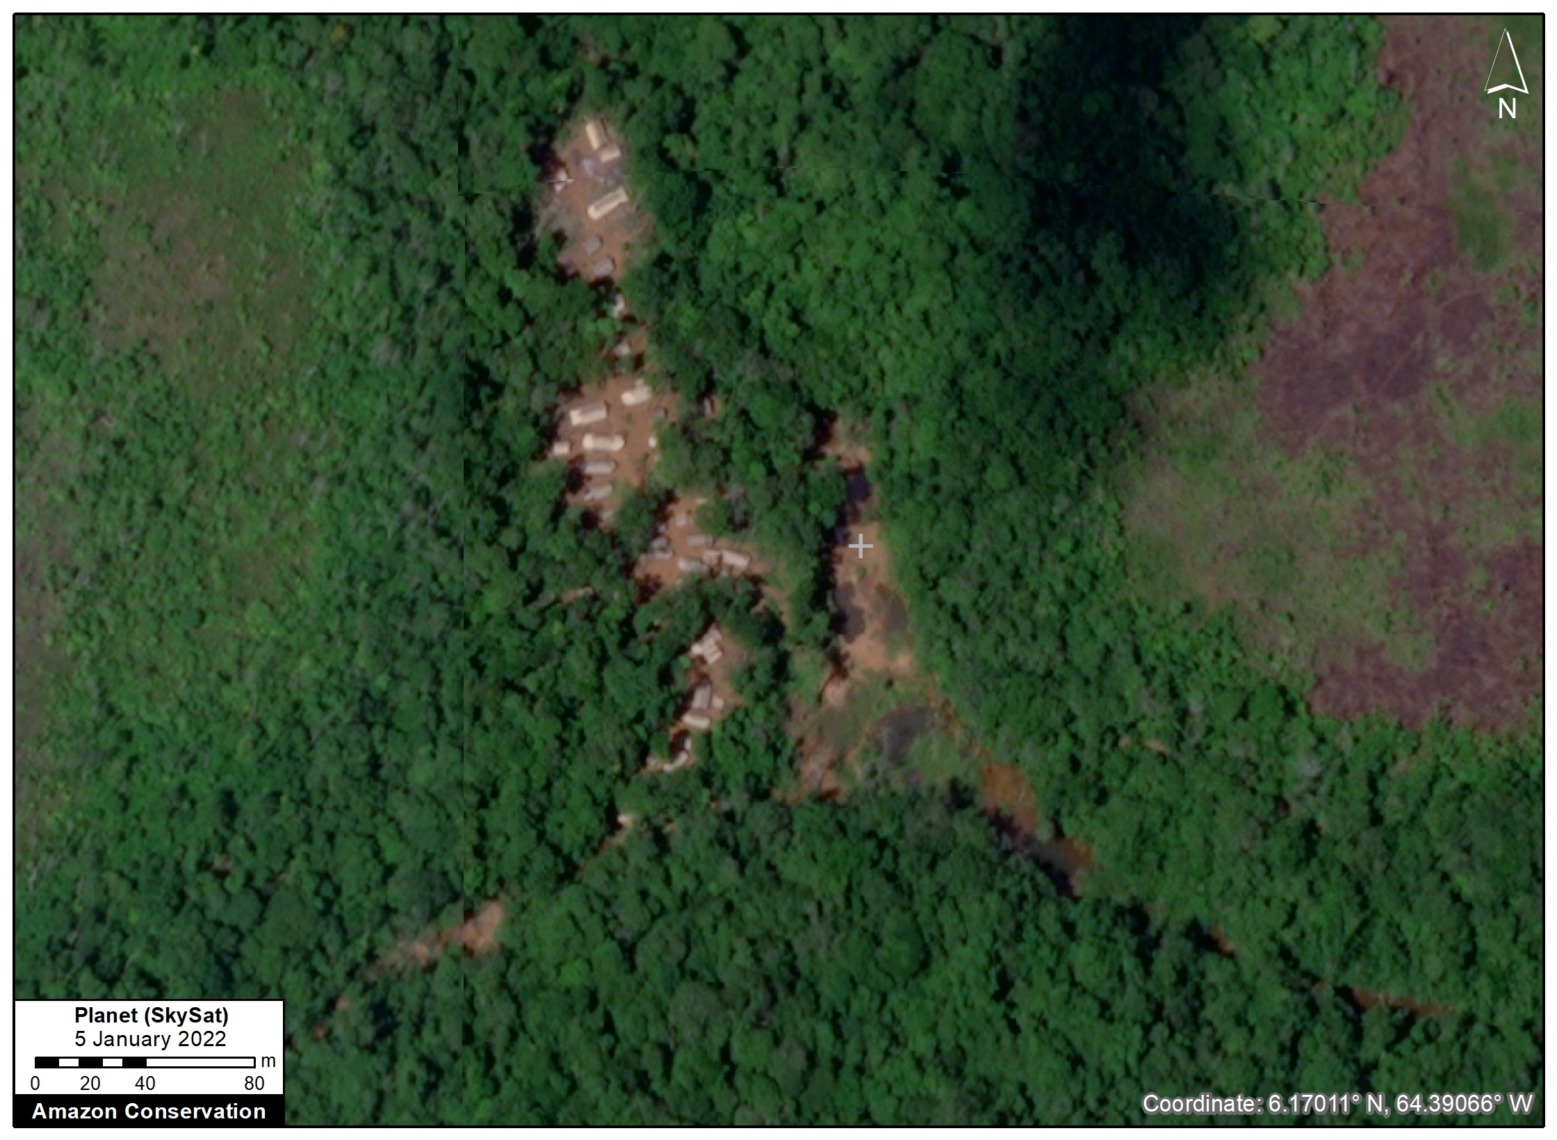
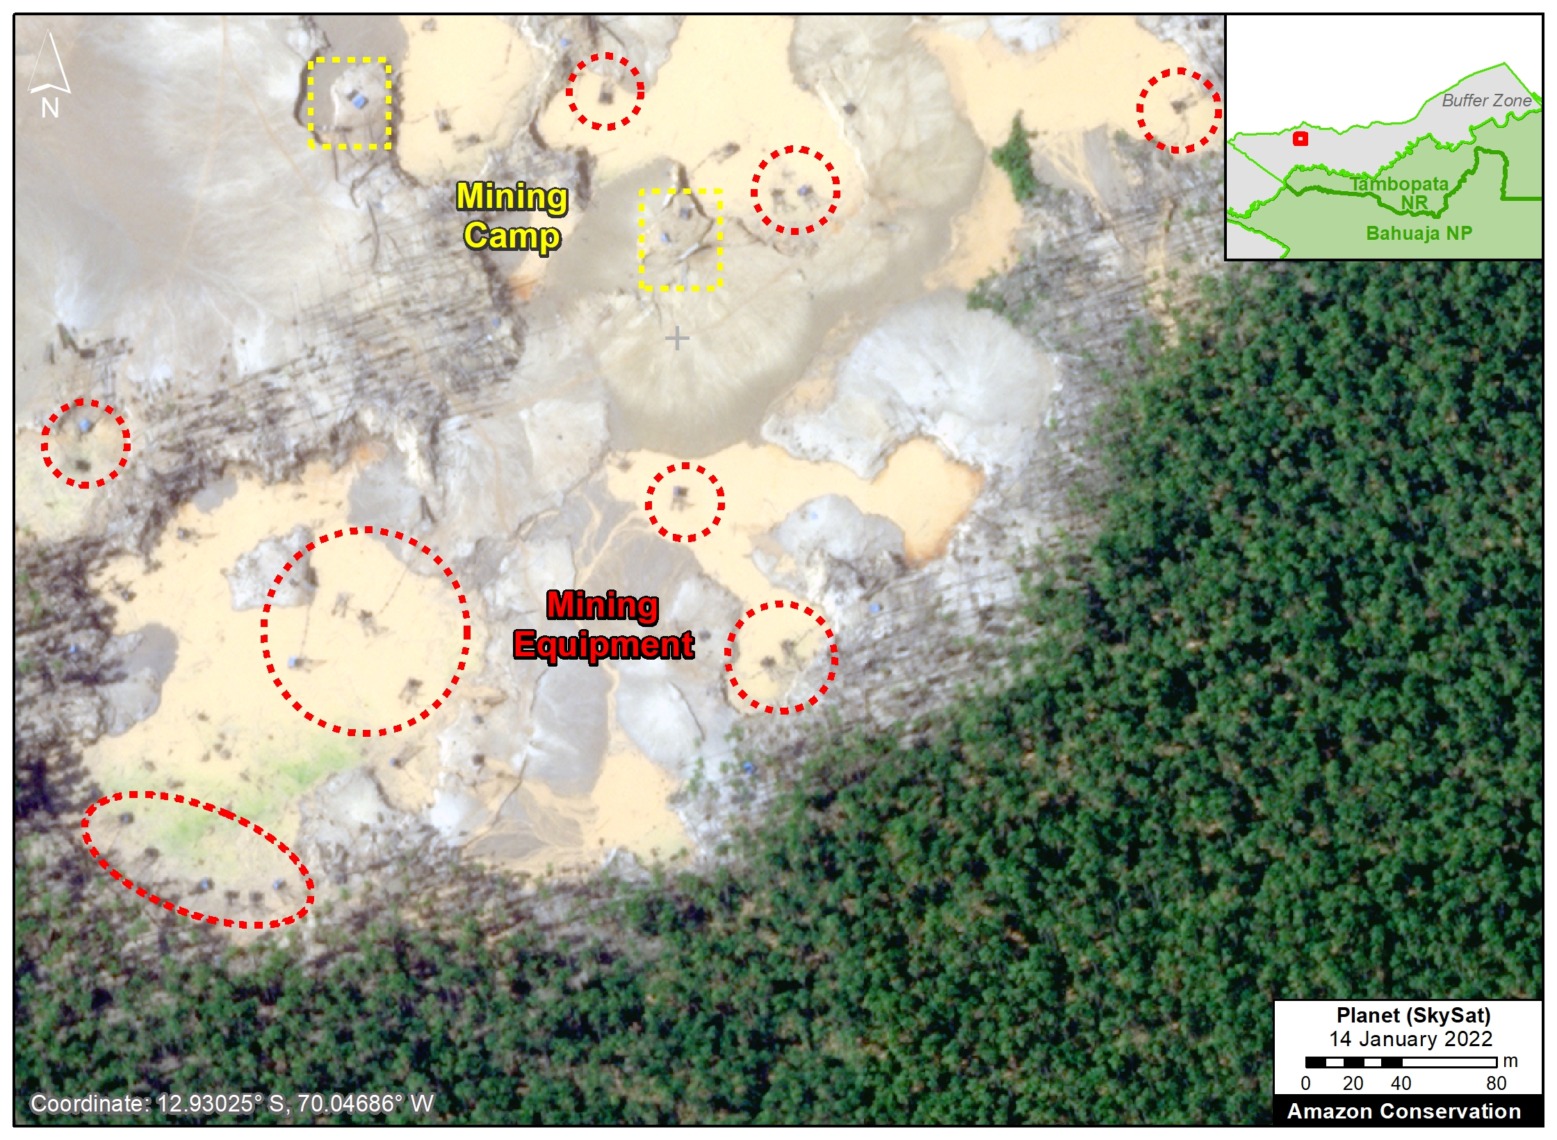
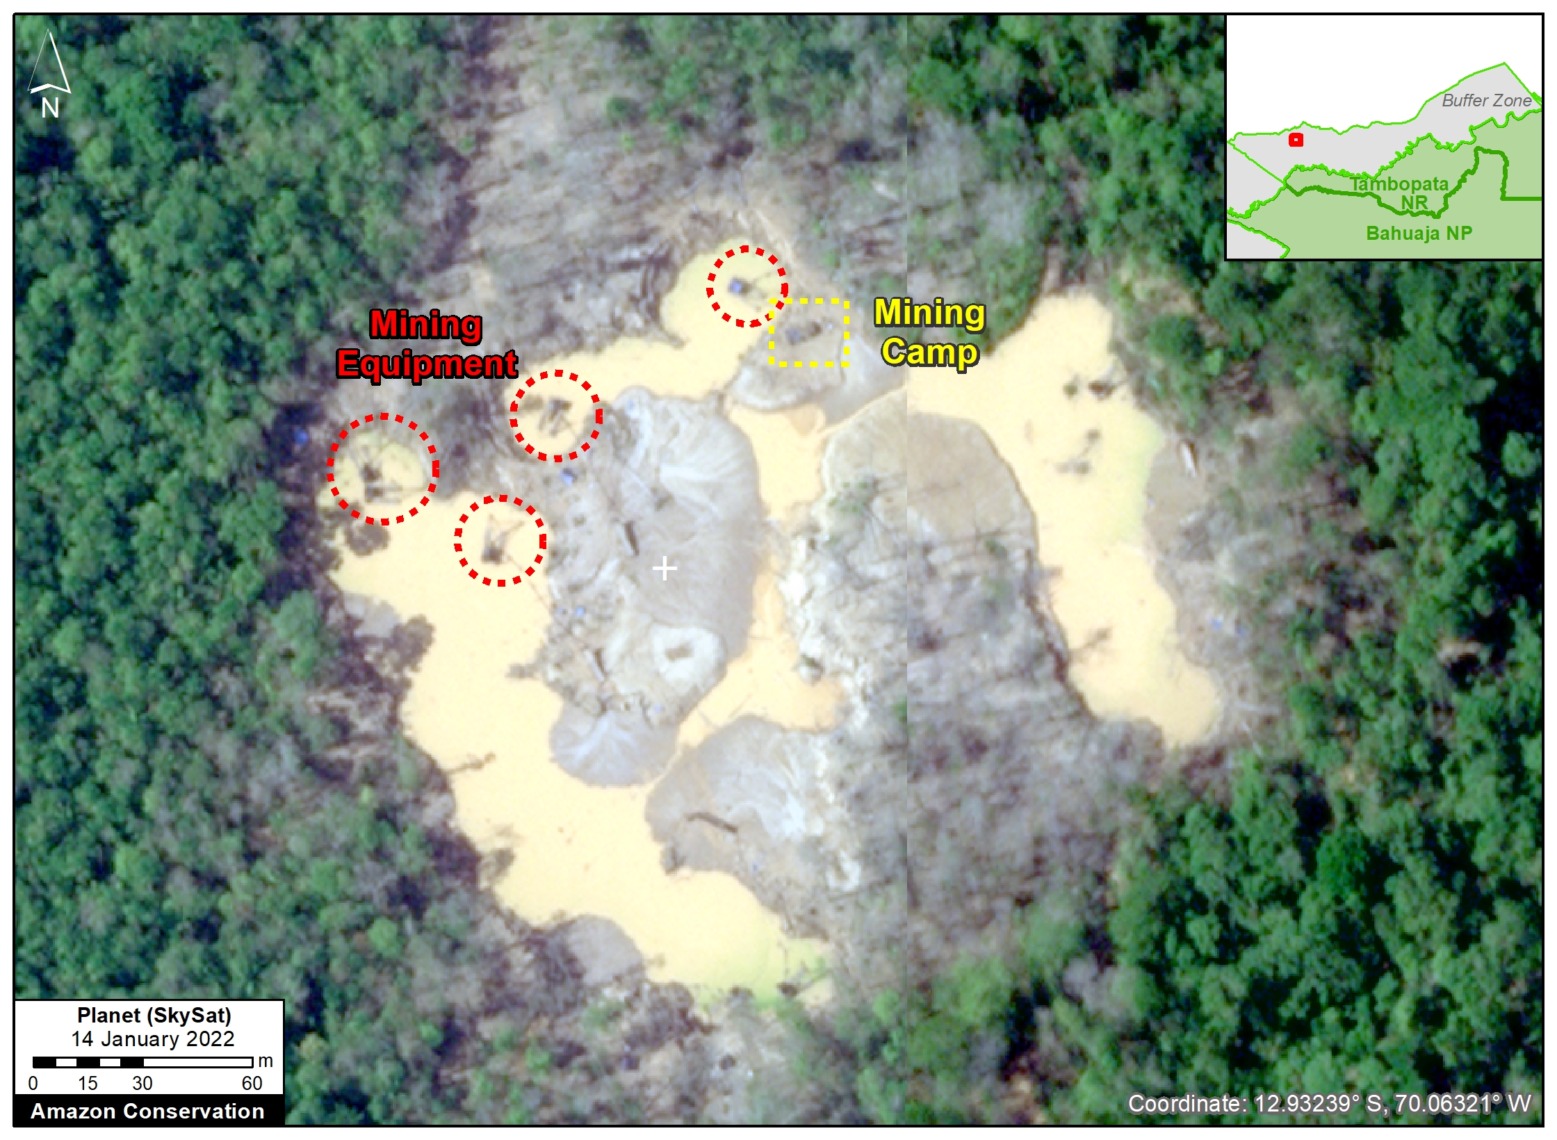
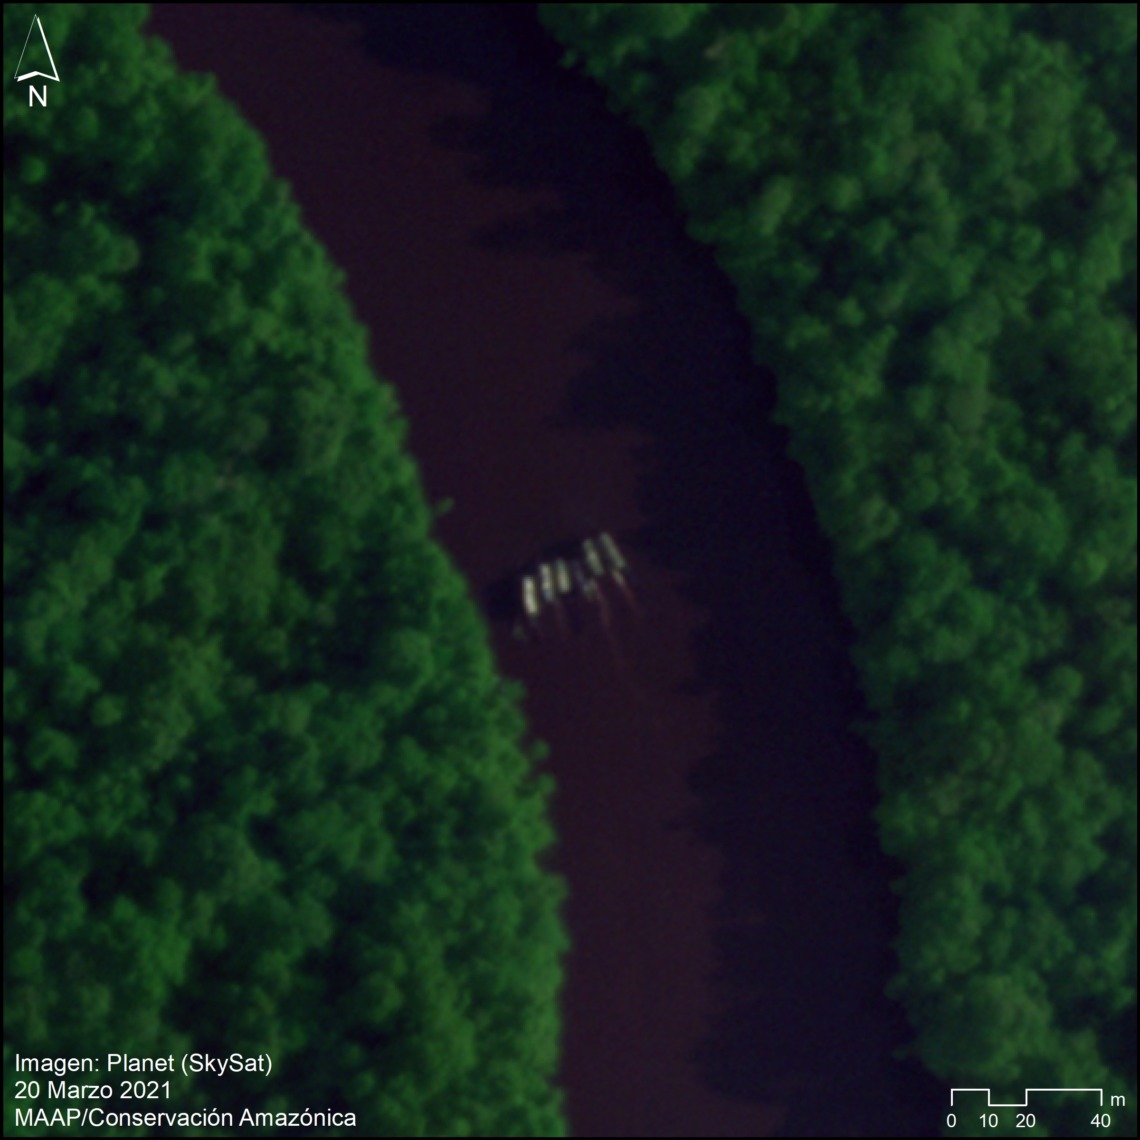
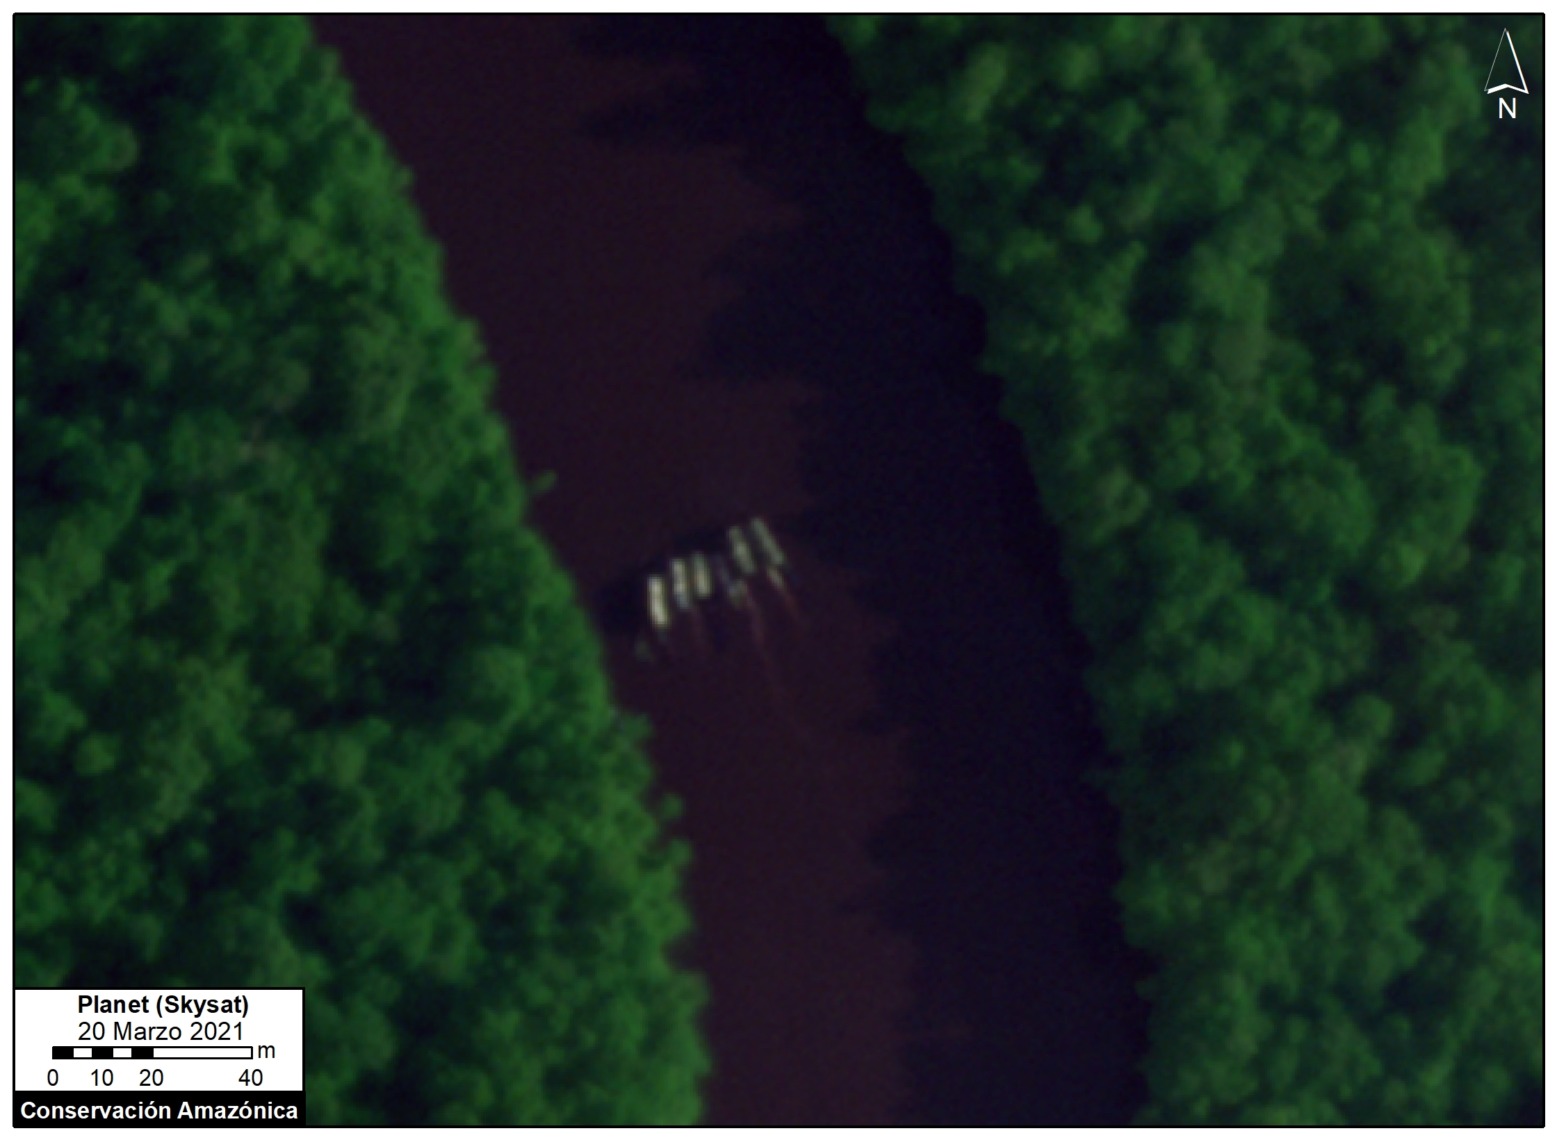
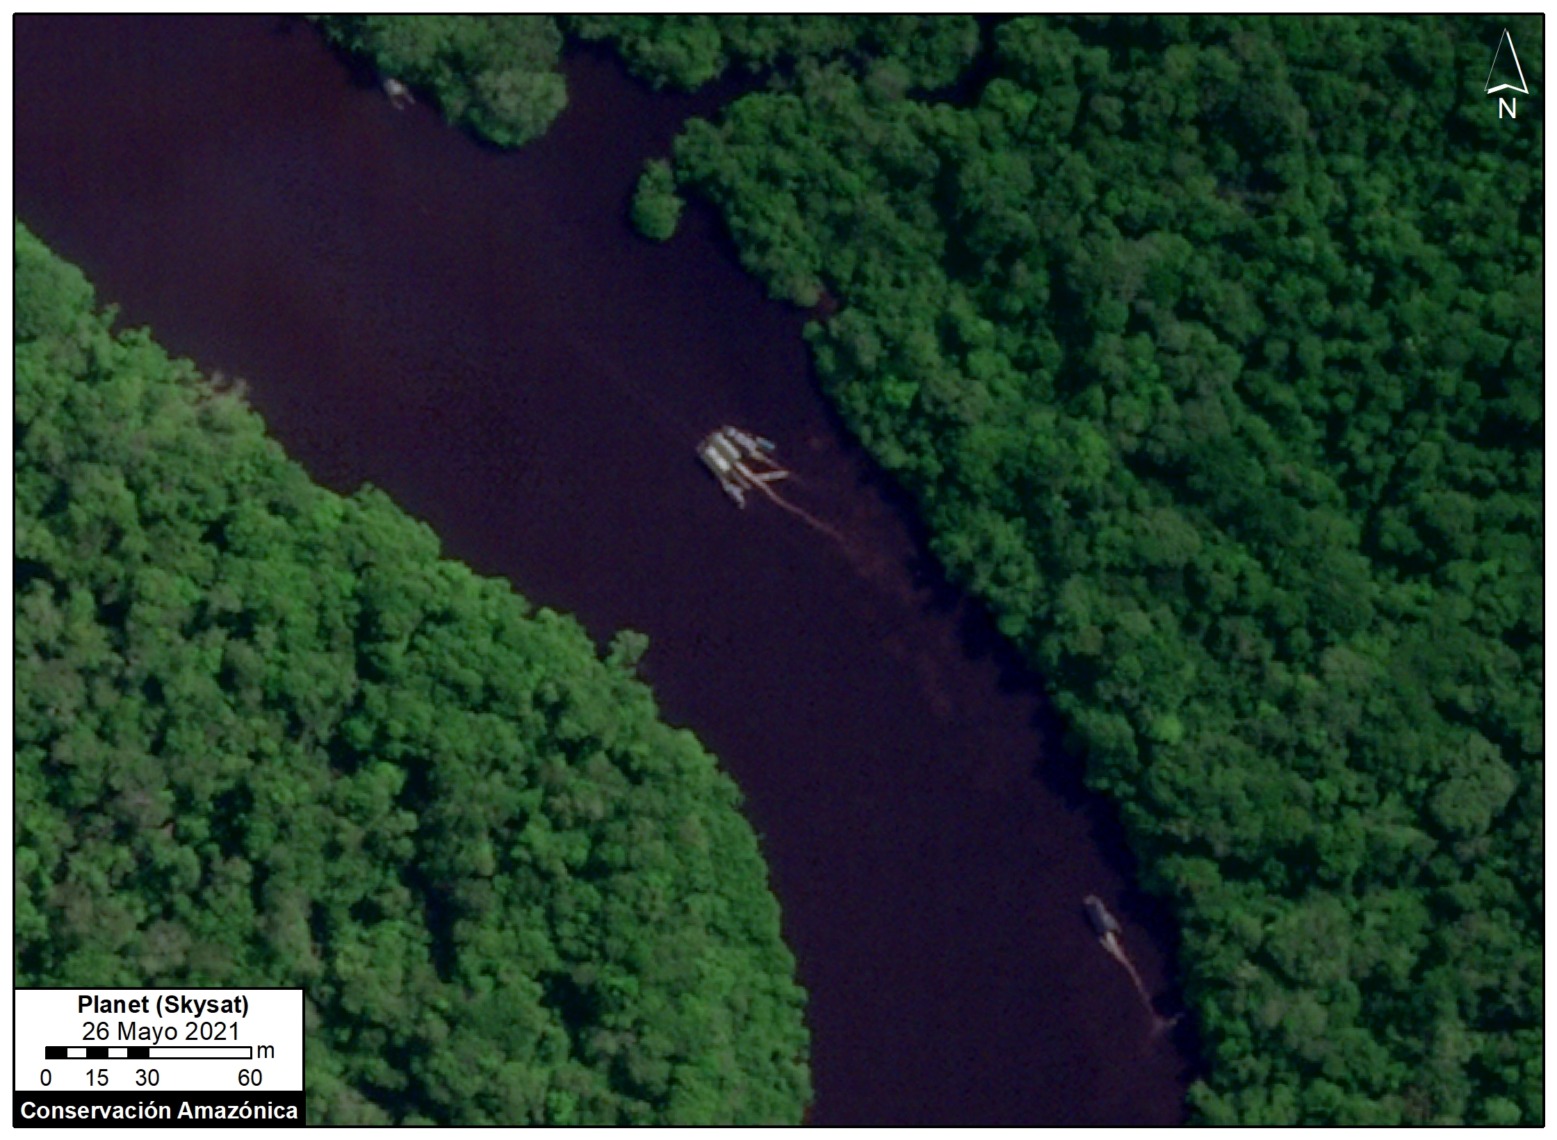
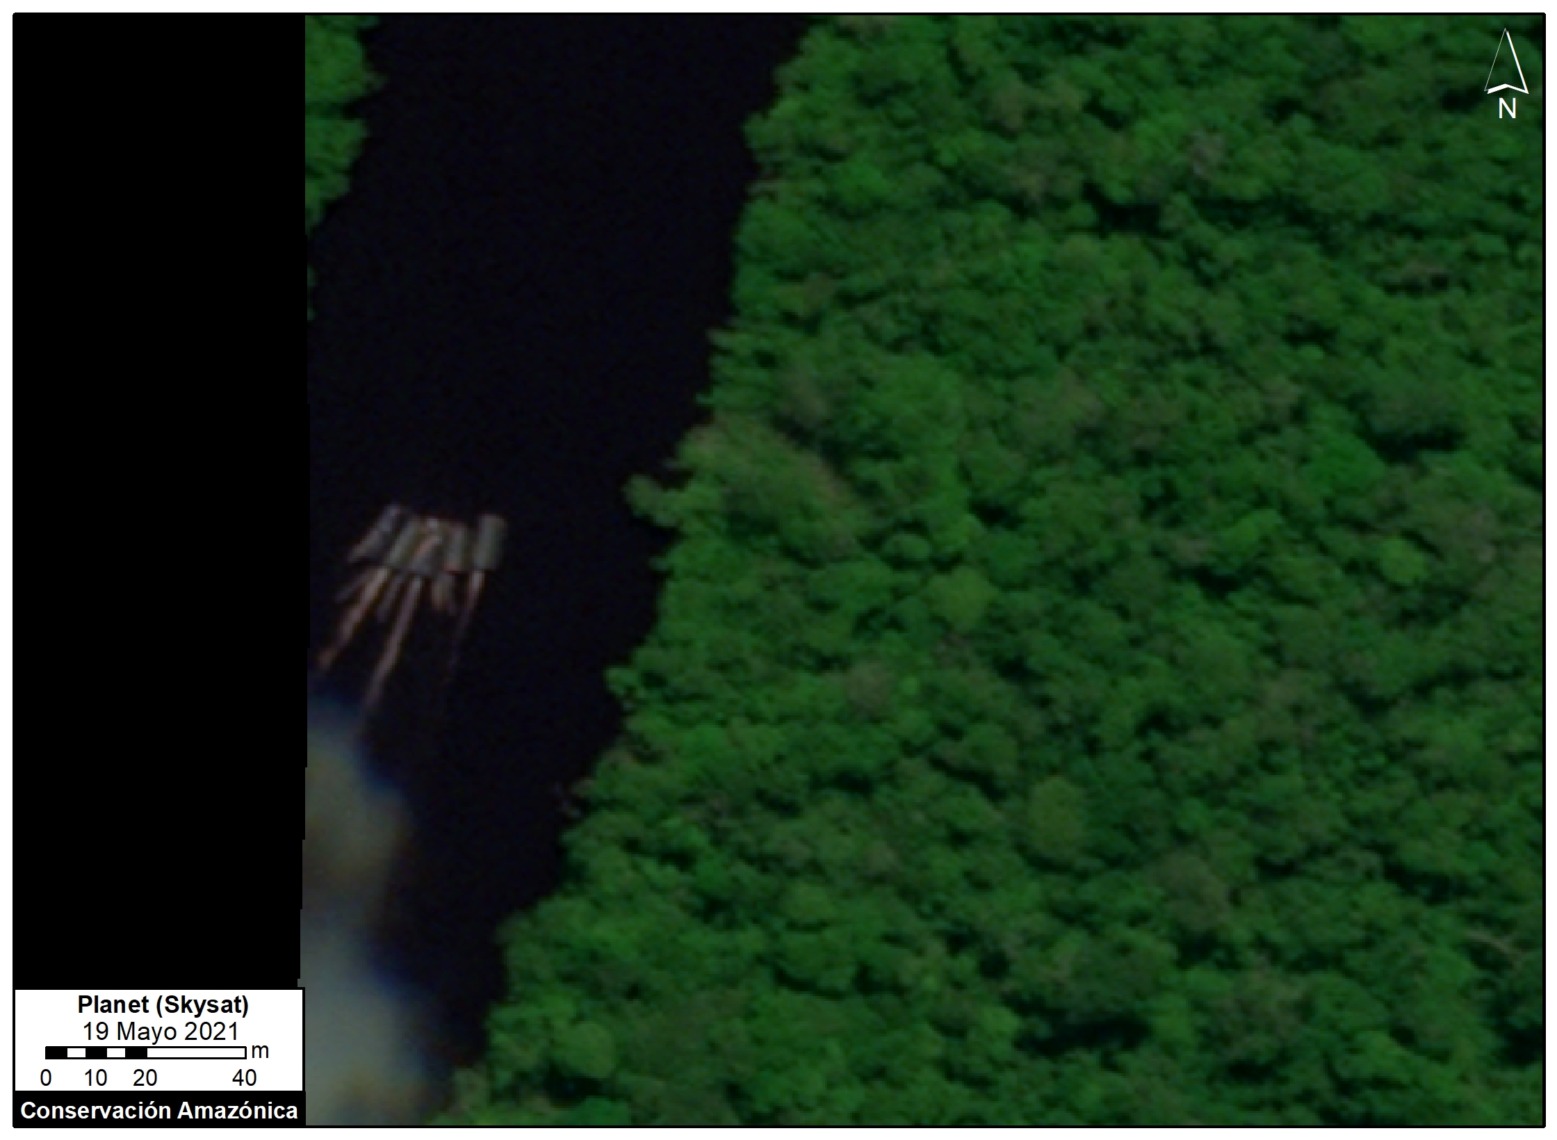
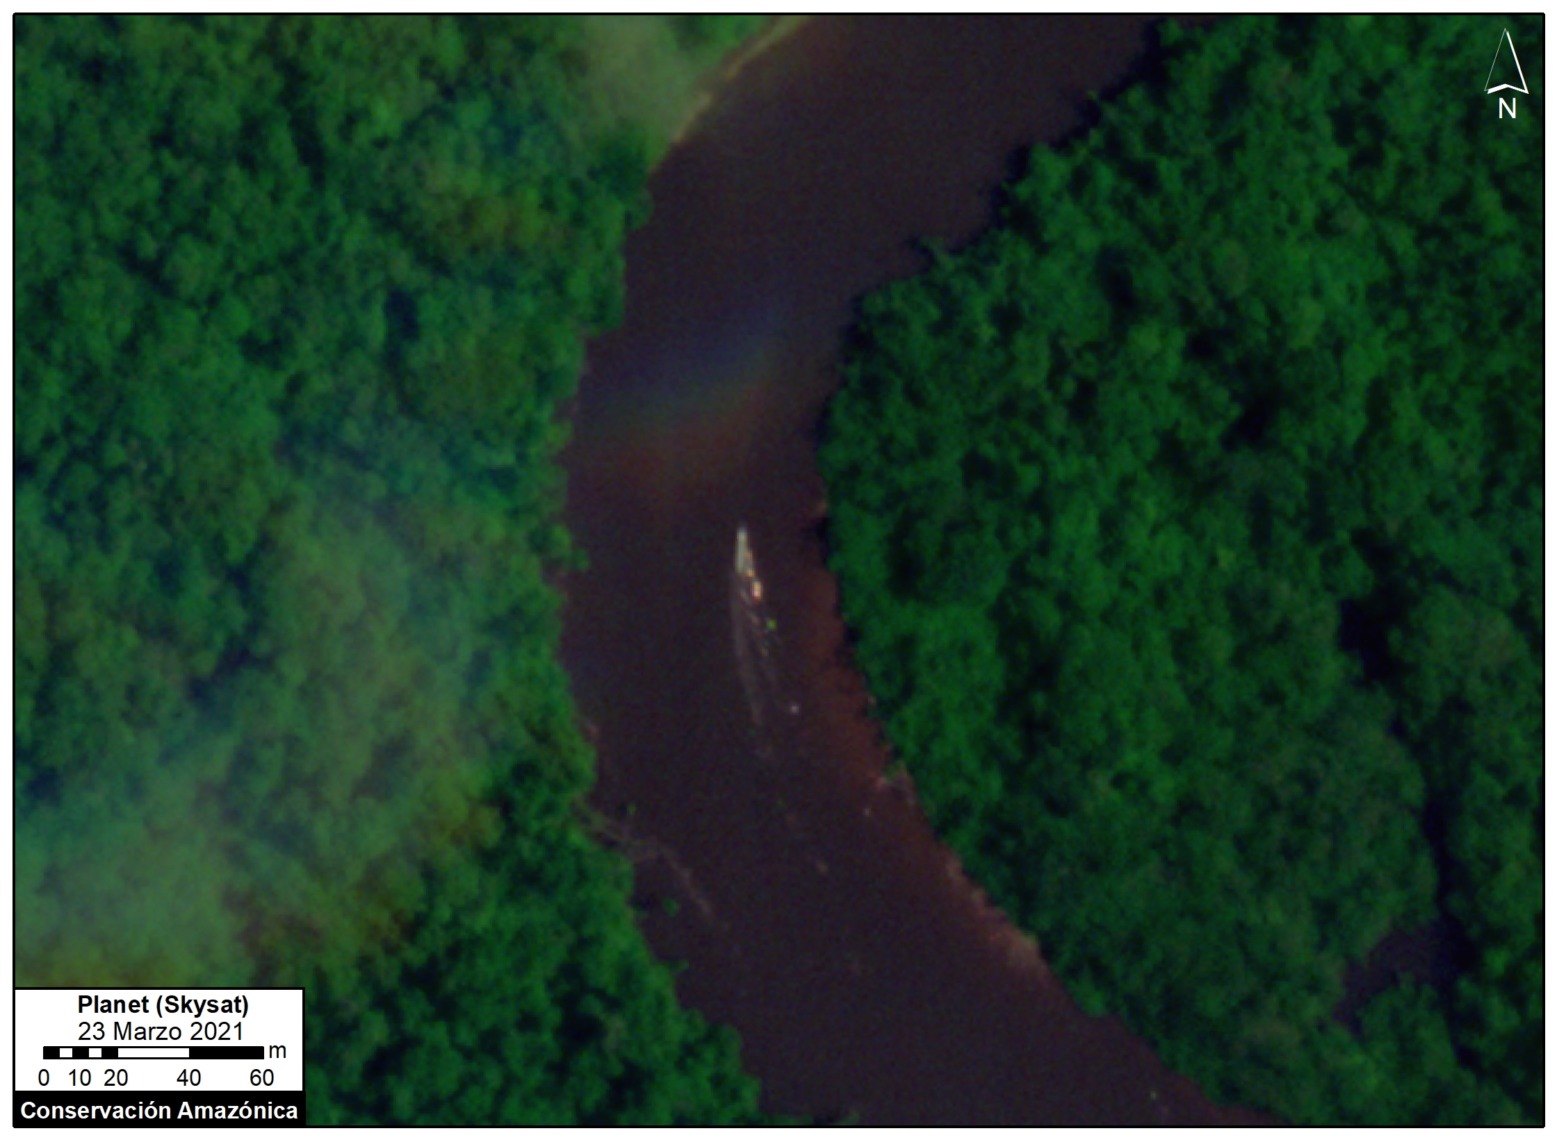
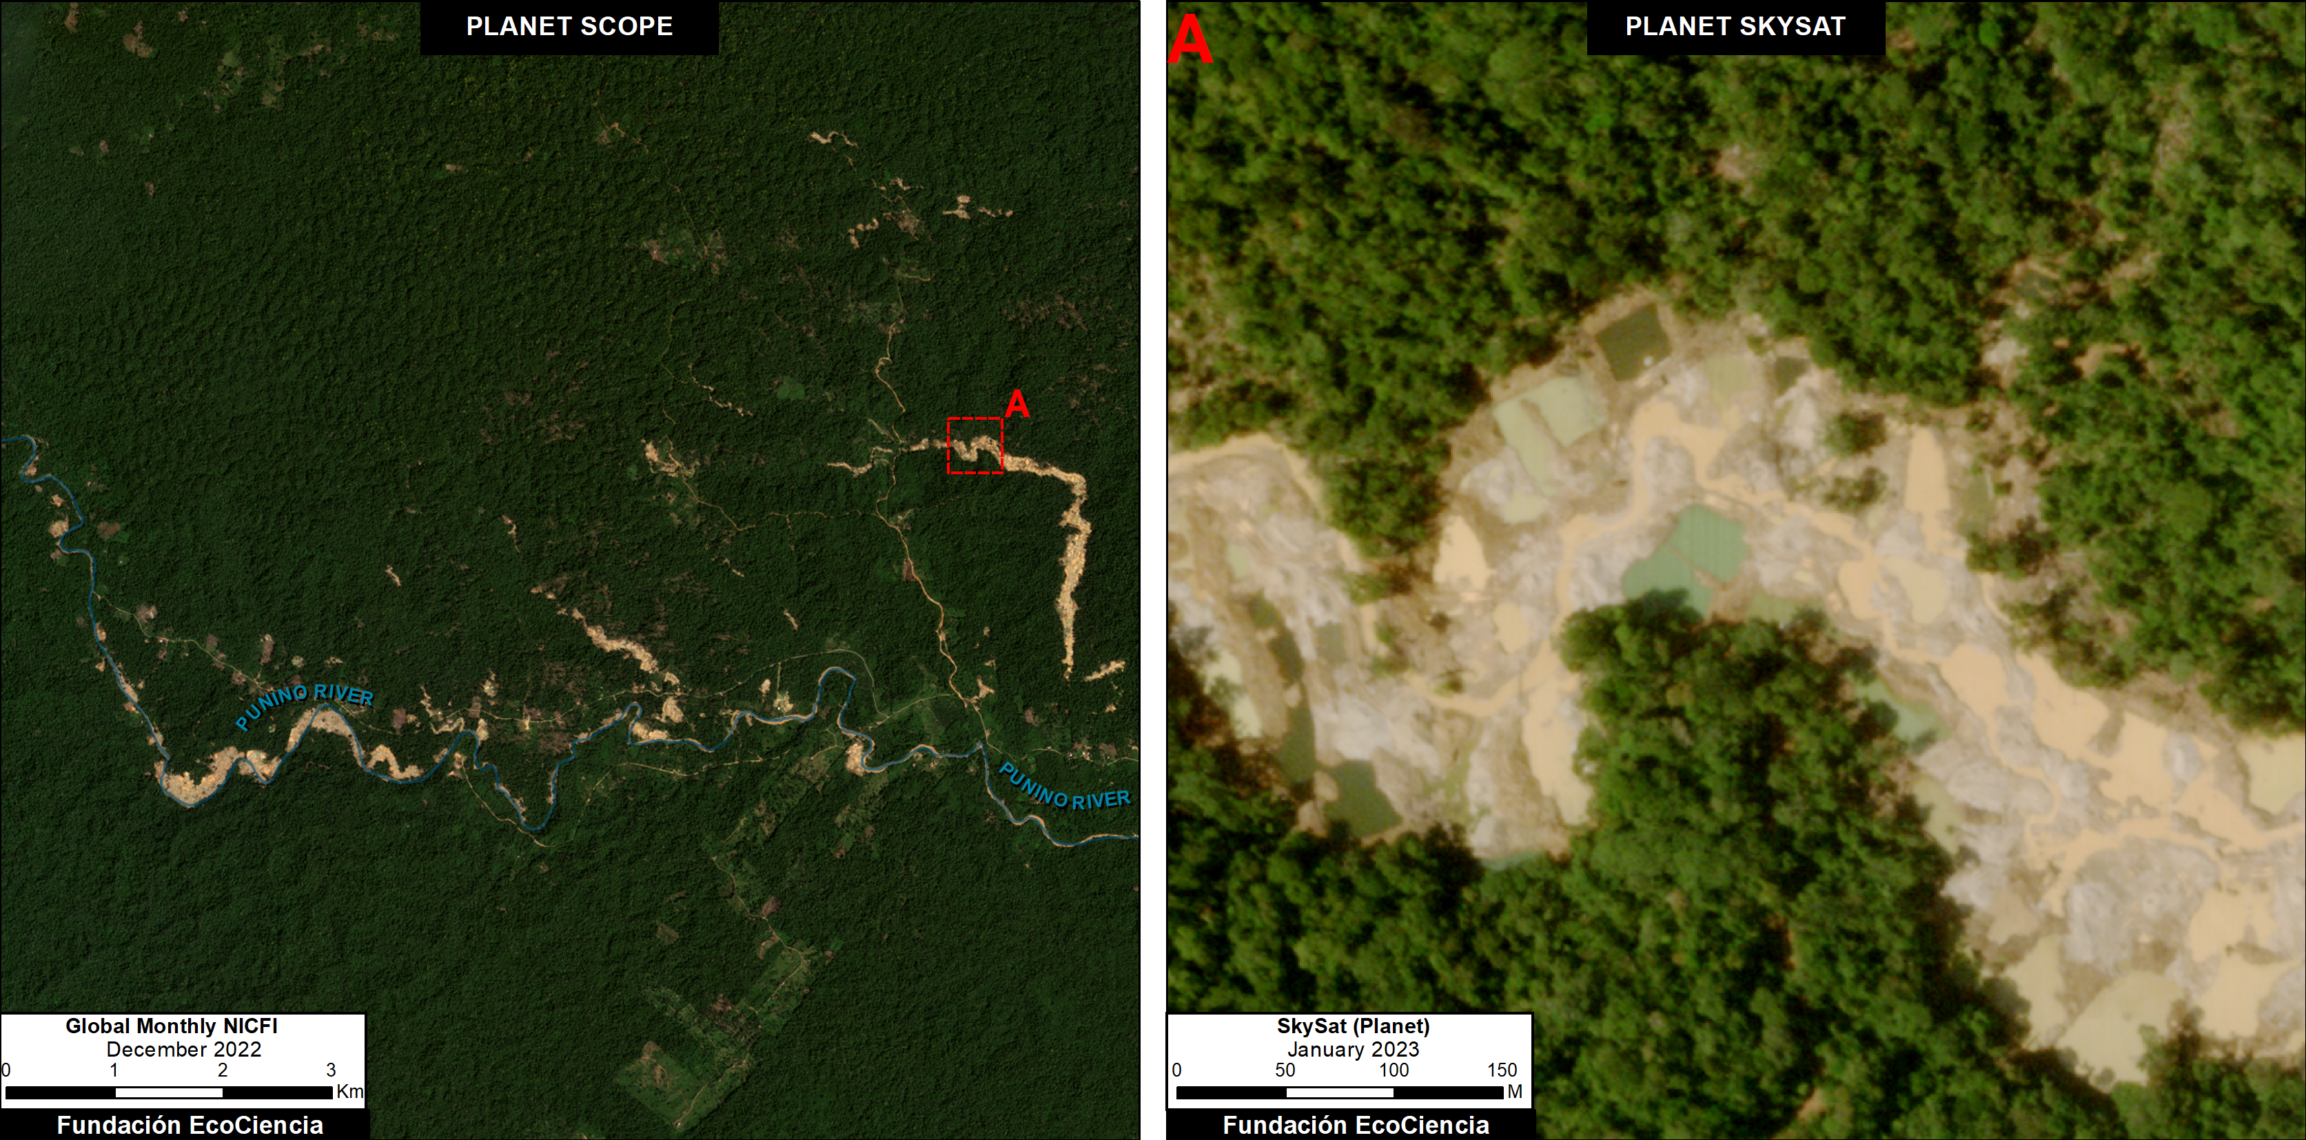
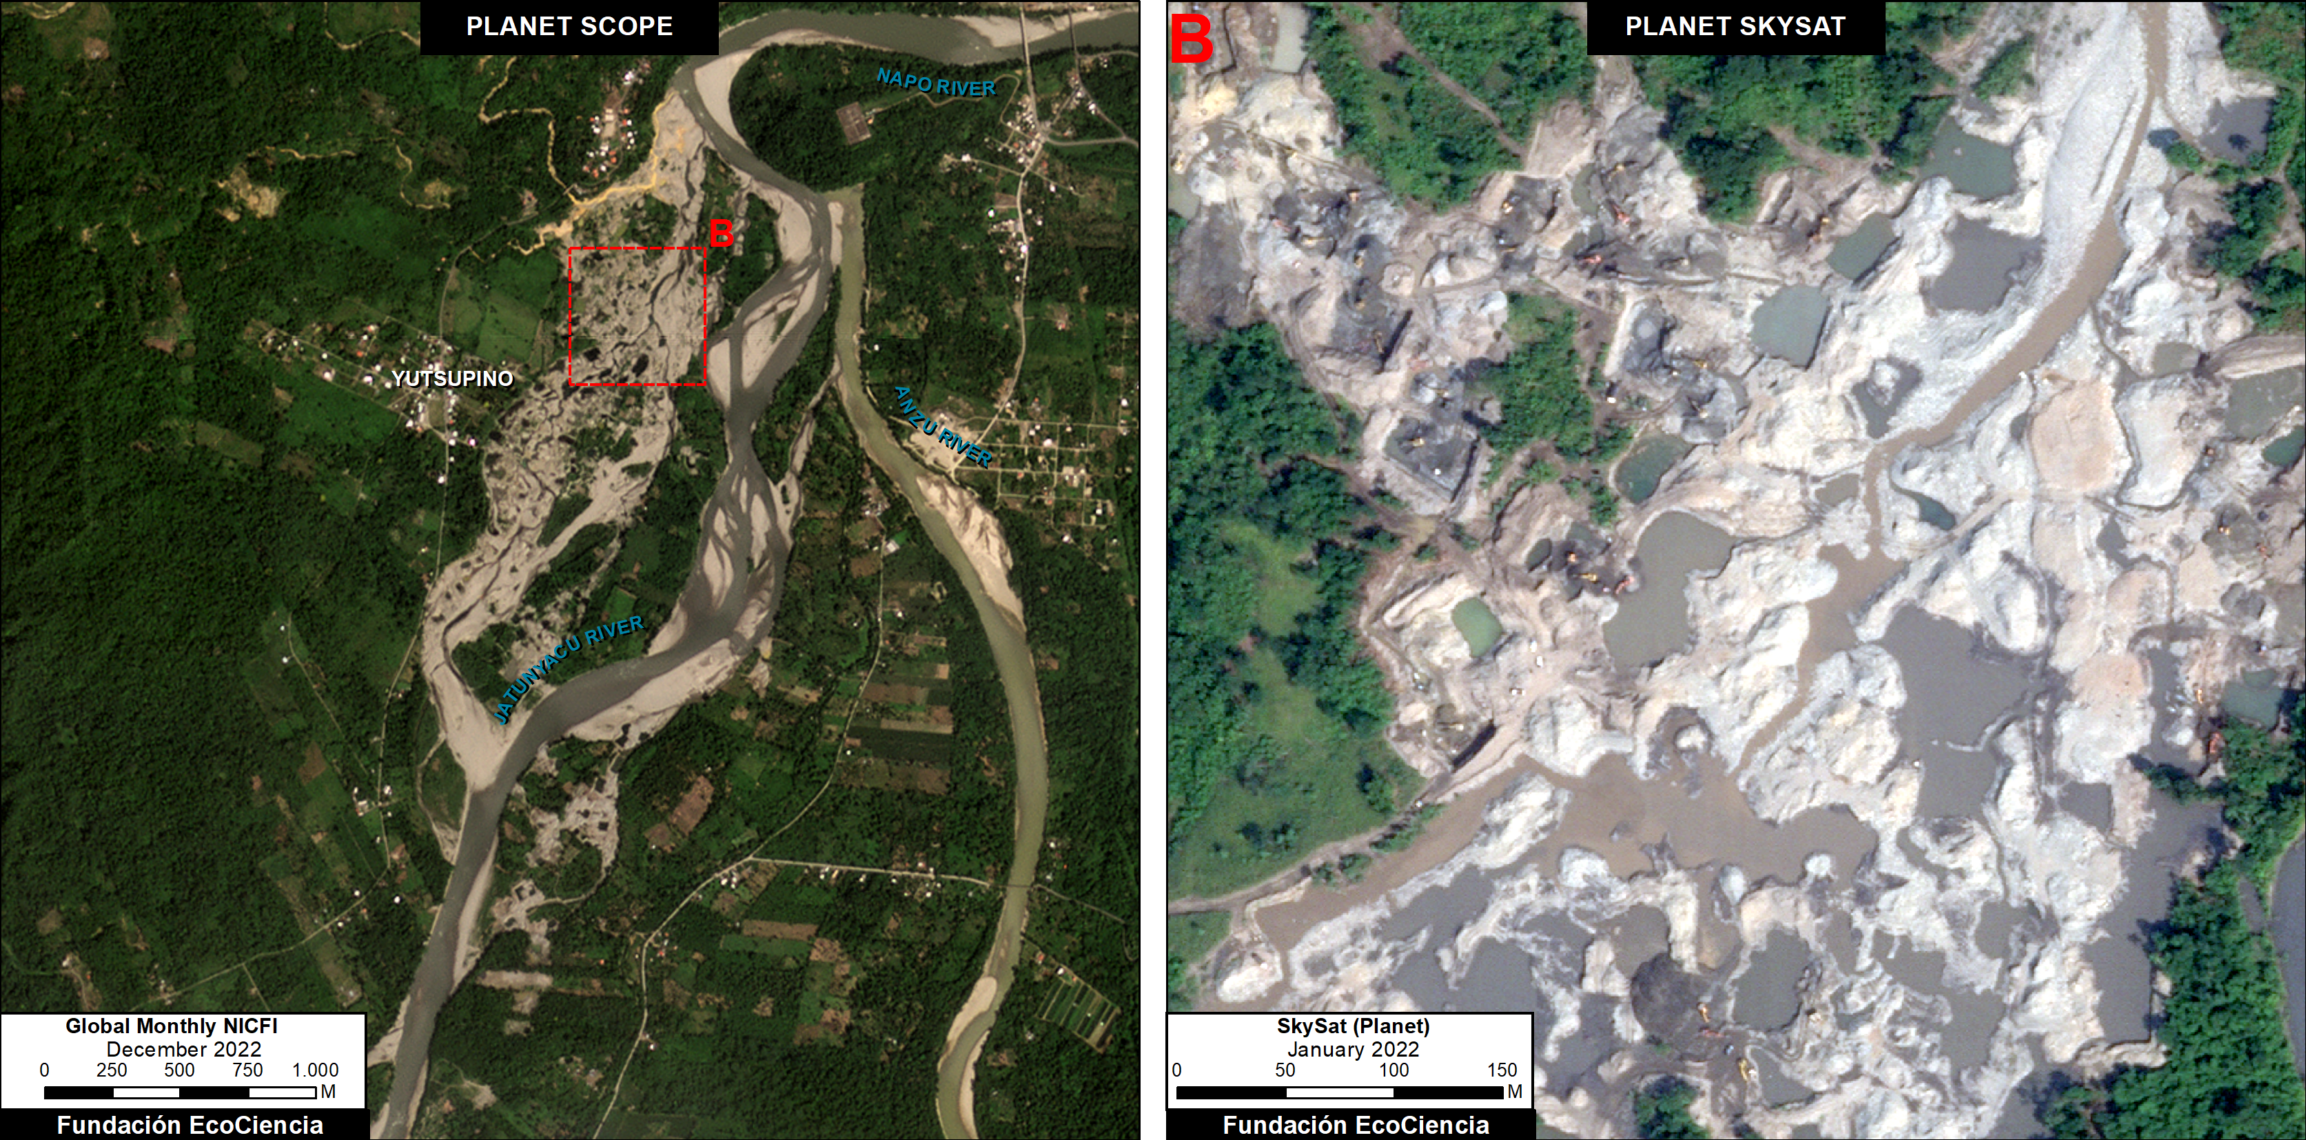
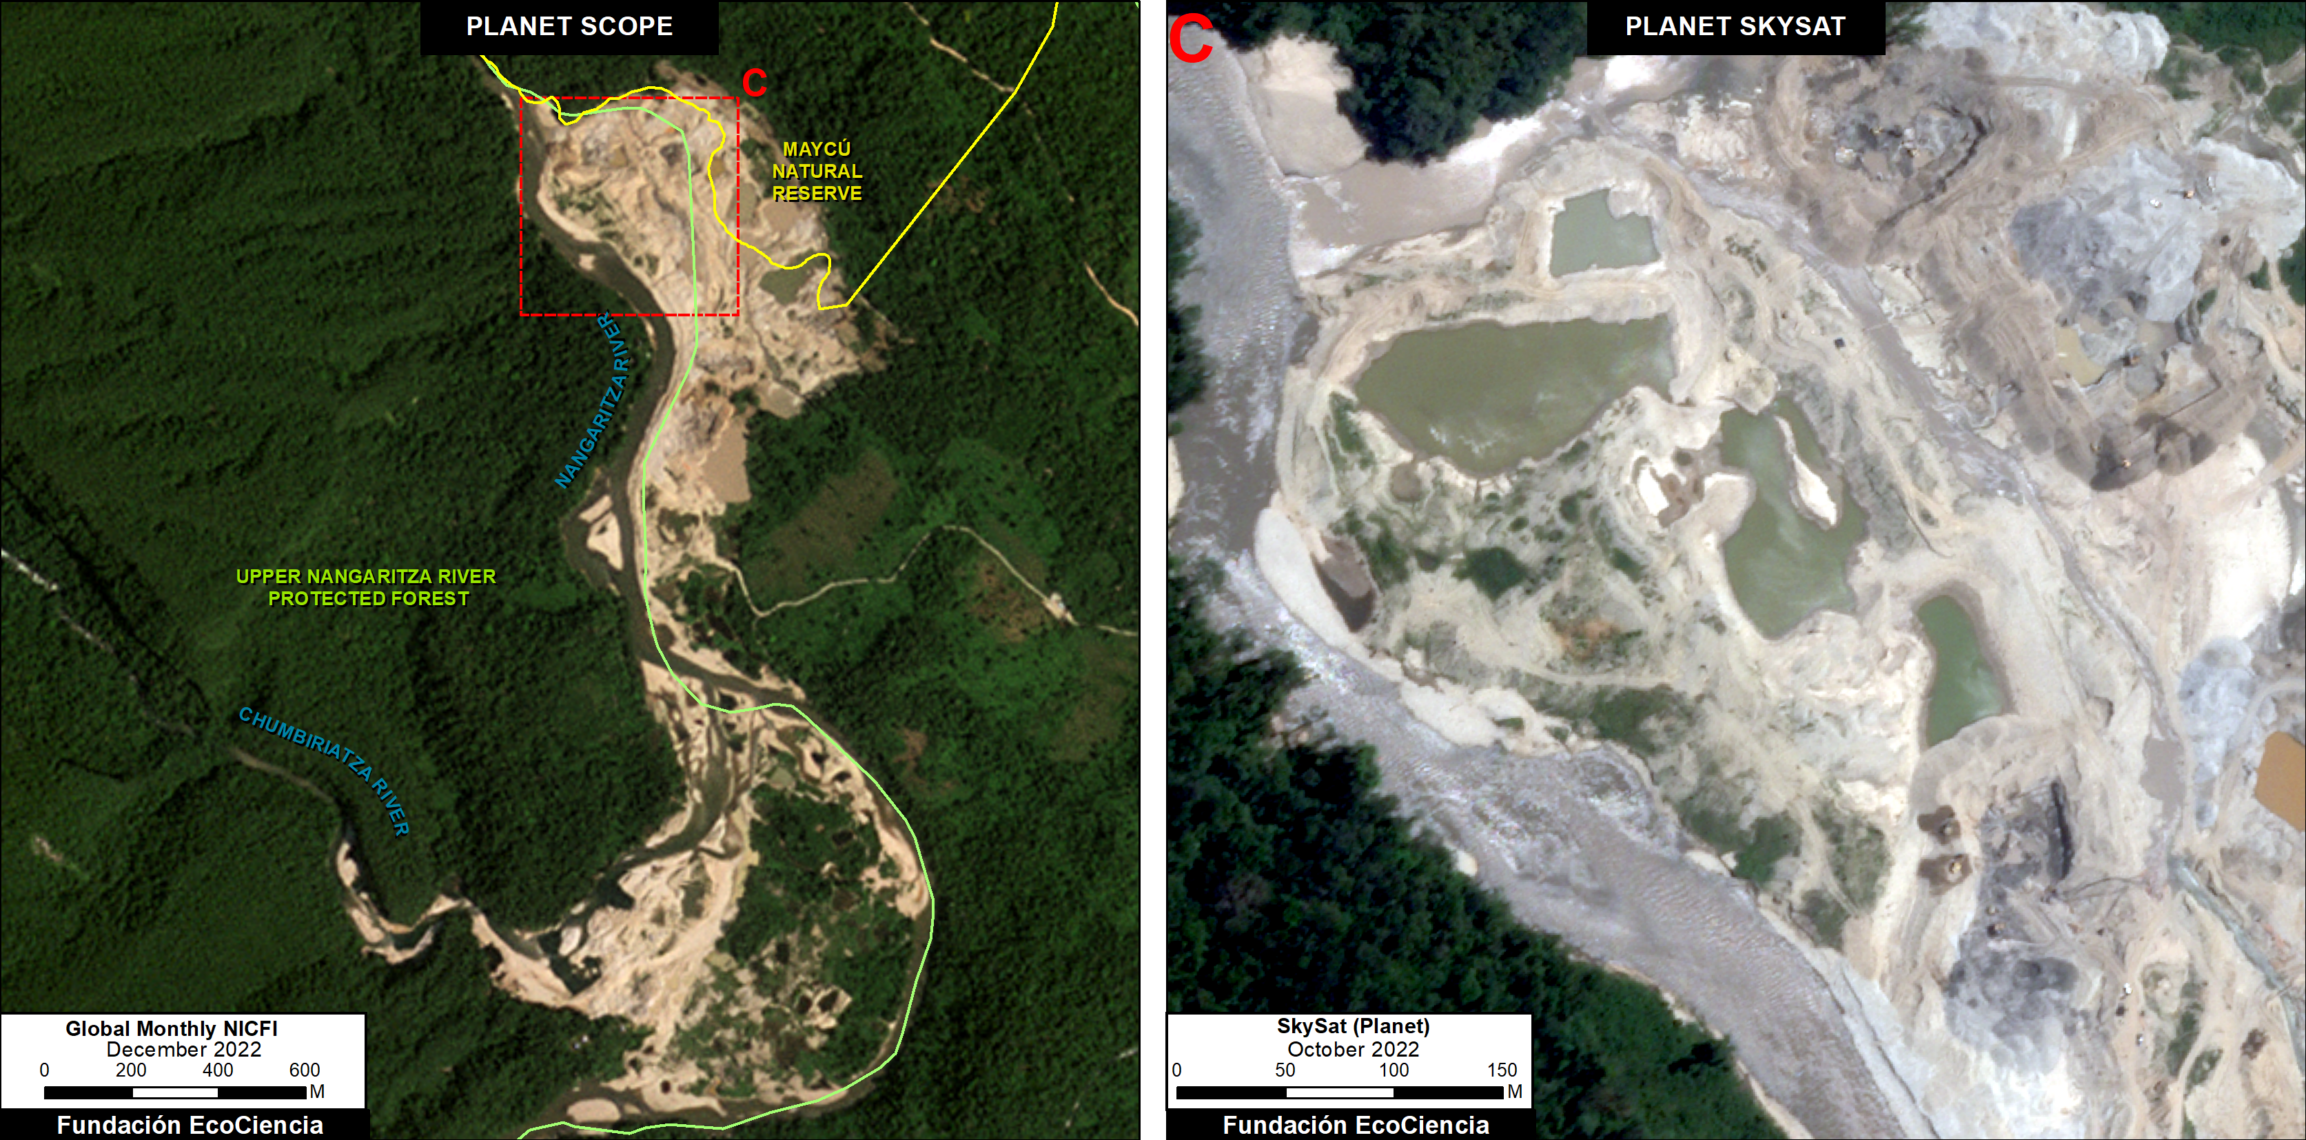
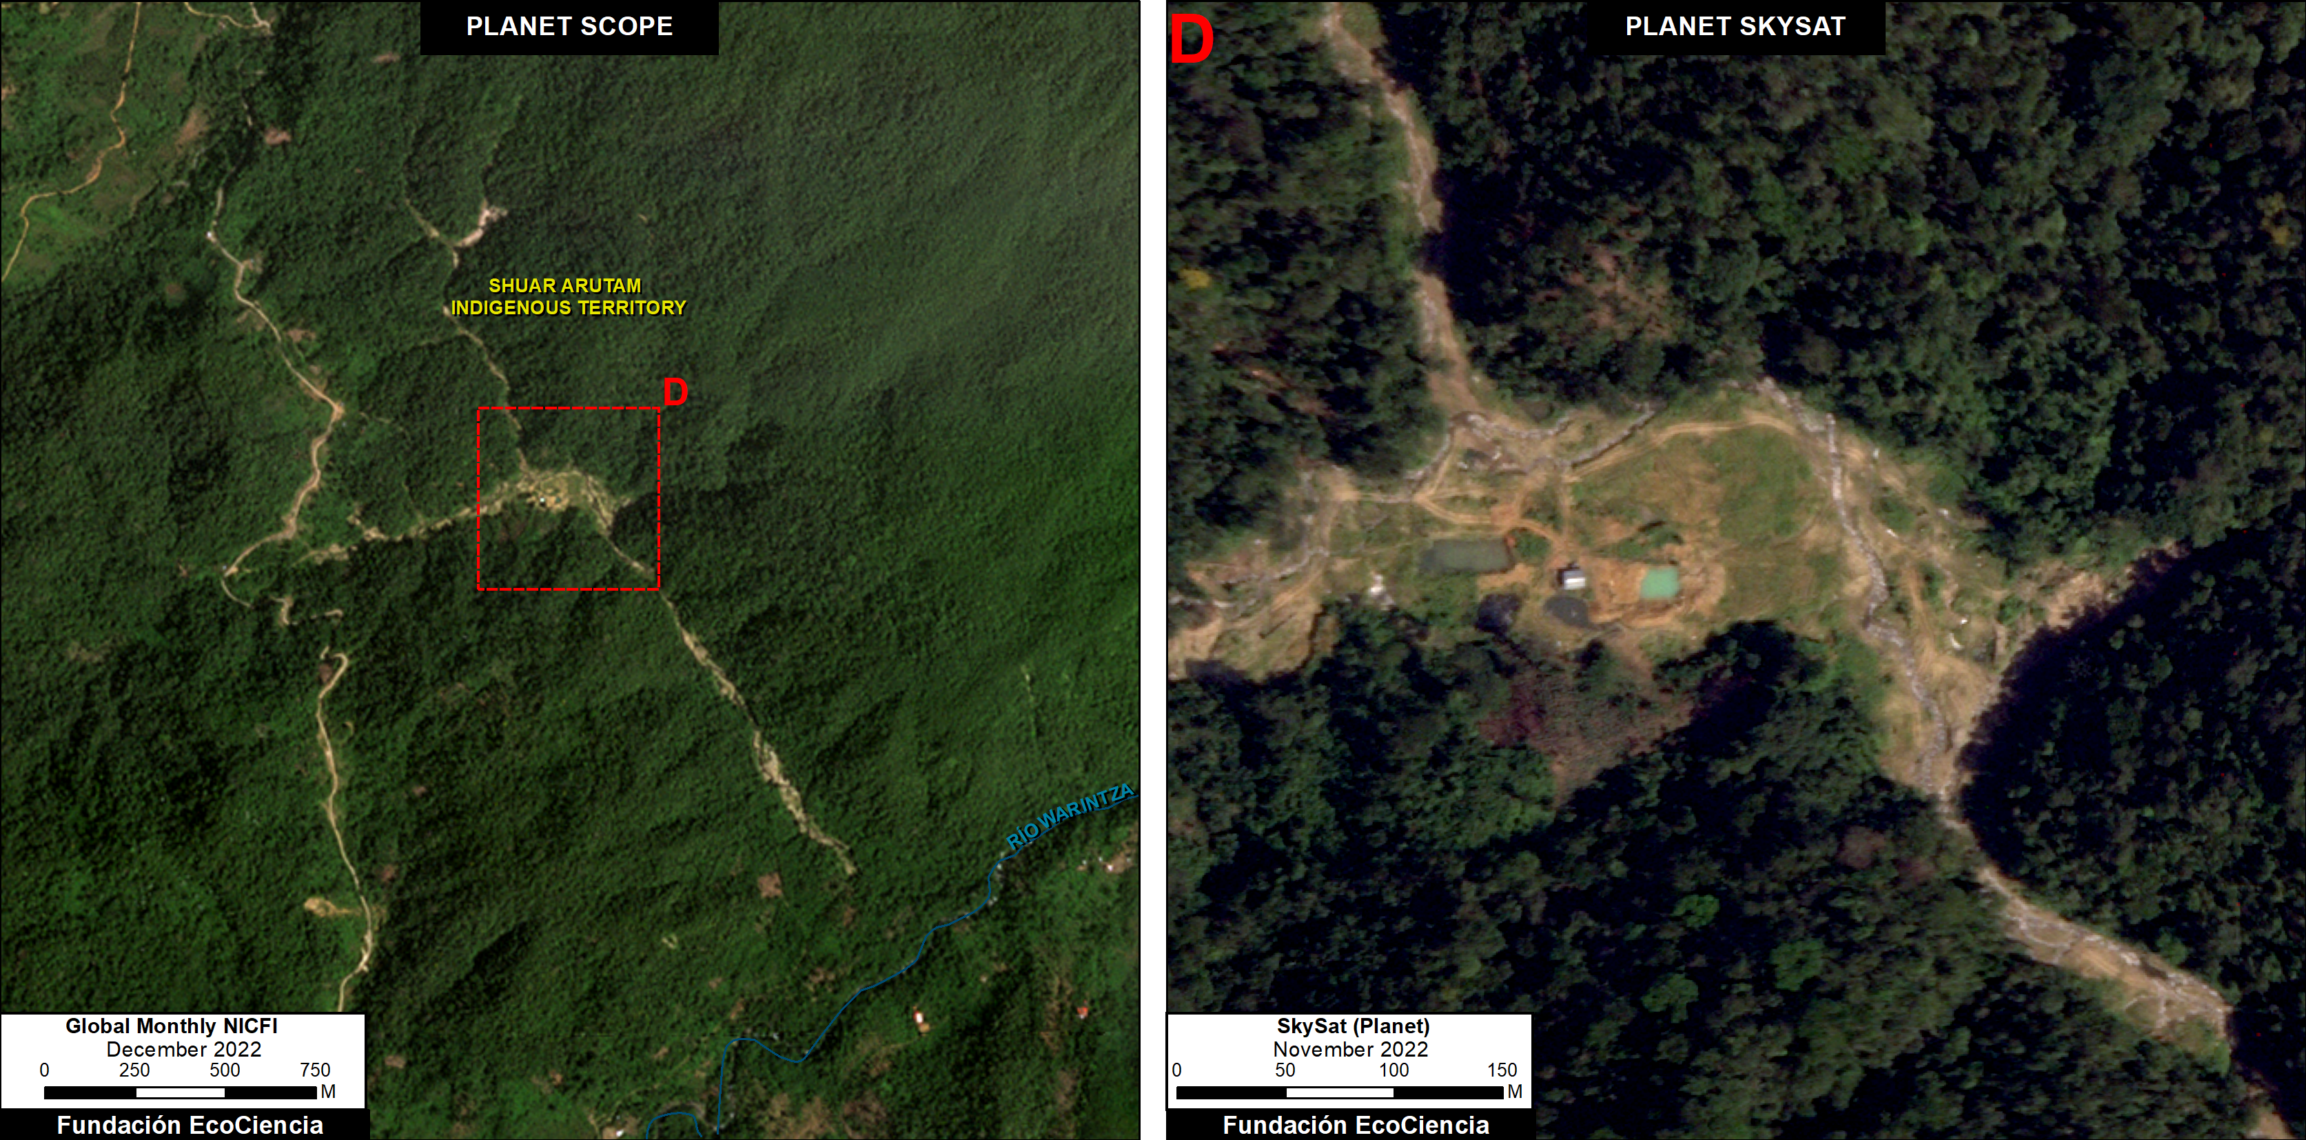
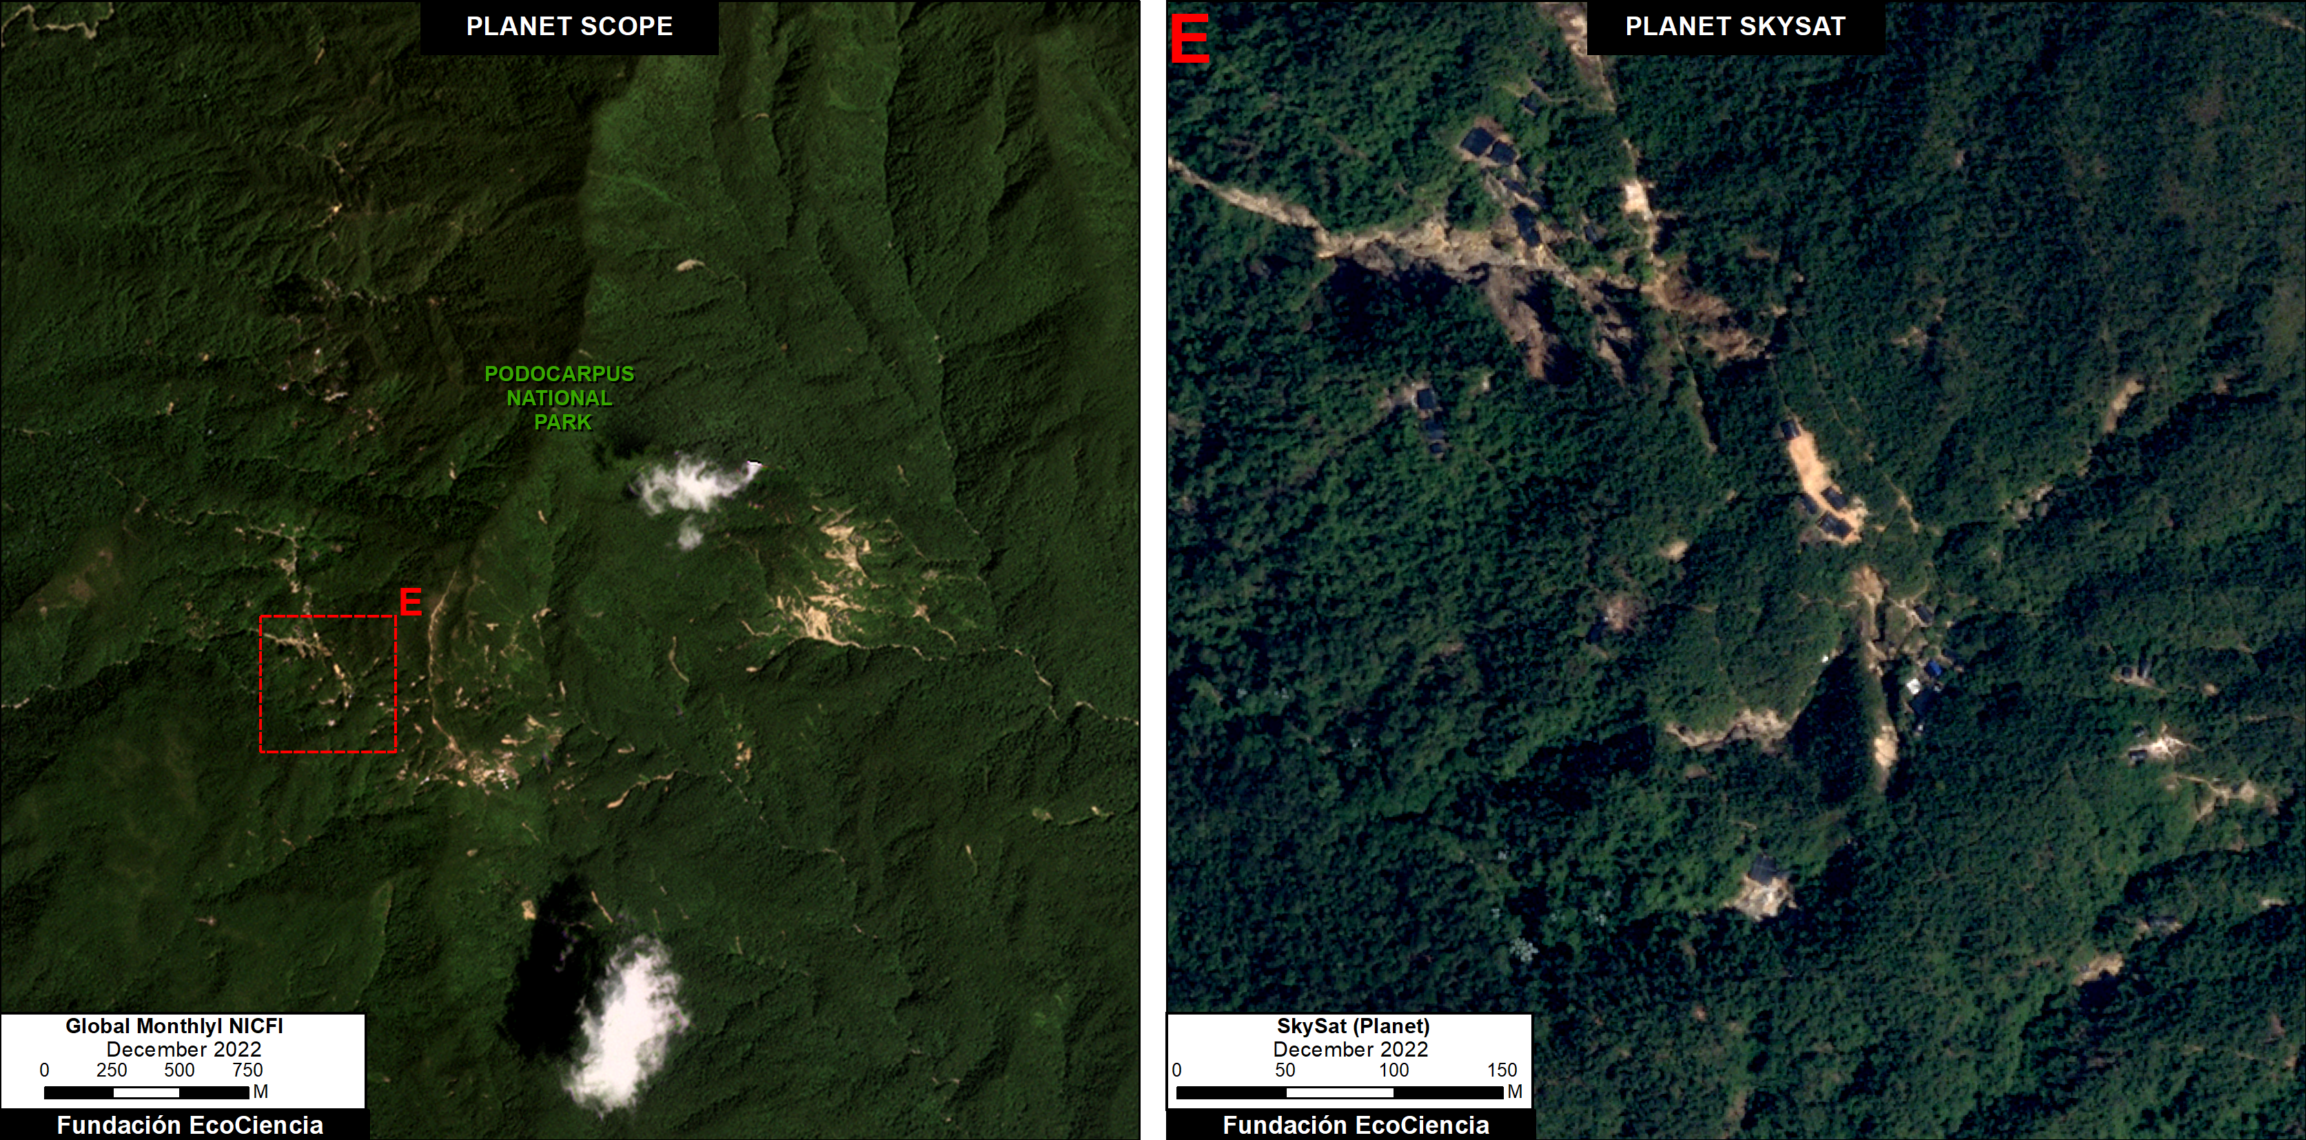
For each of the five cases presented below, we show both a high-resolution (3 meters) example of the recent mining deforestation (left panel) and very-high resolution (0.5 meters) zoom of the mining activity (right panel).
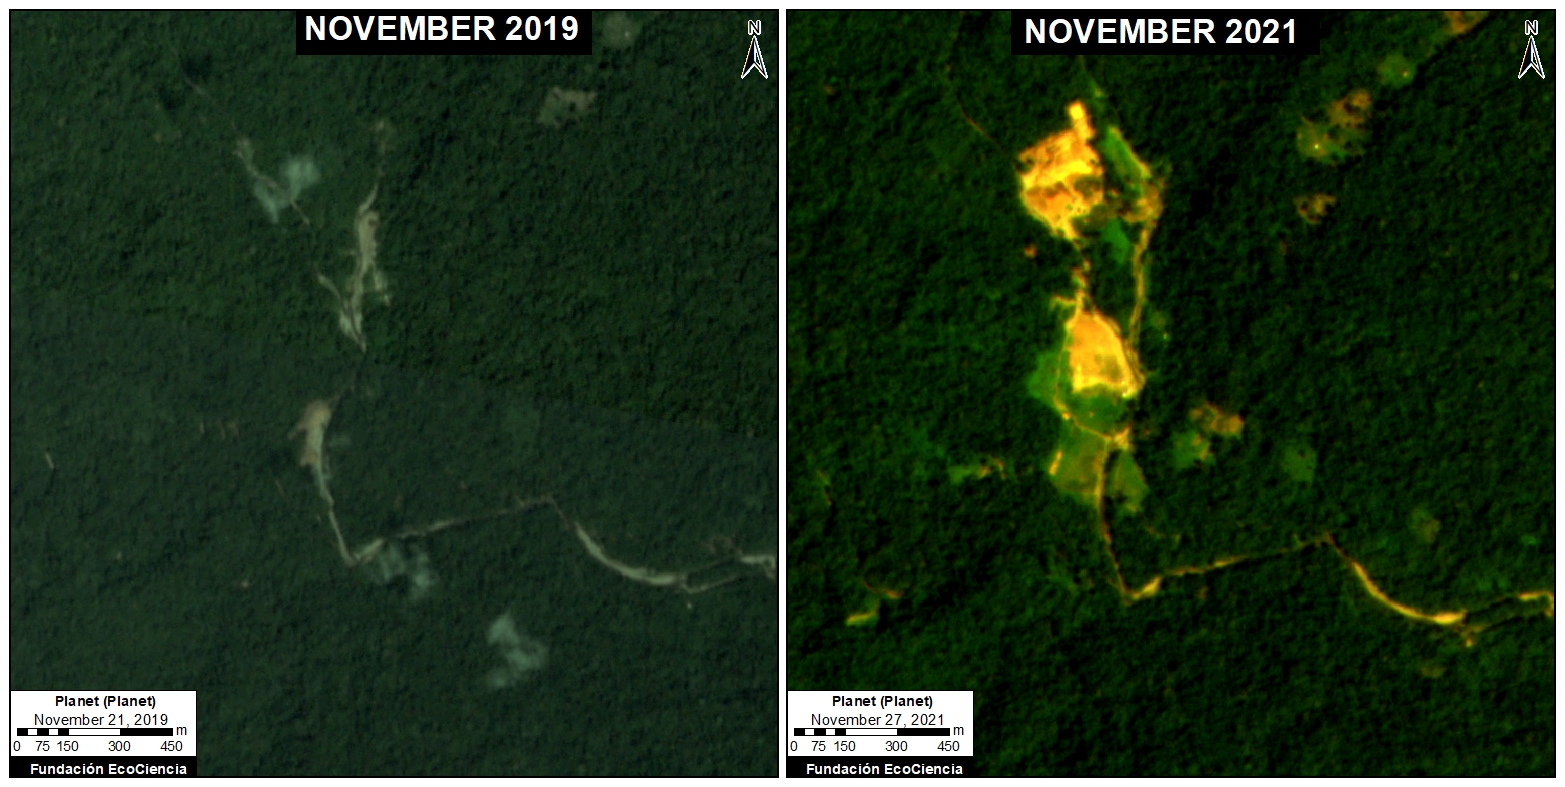
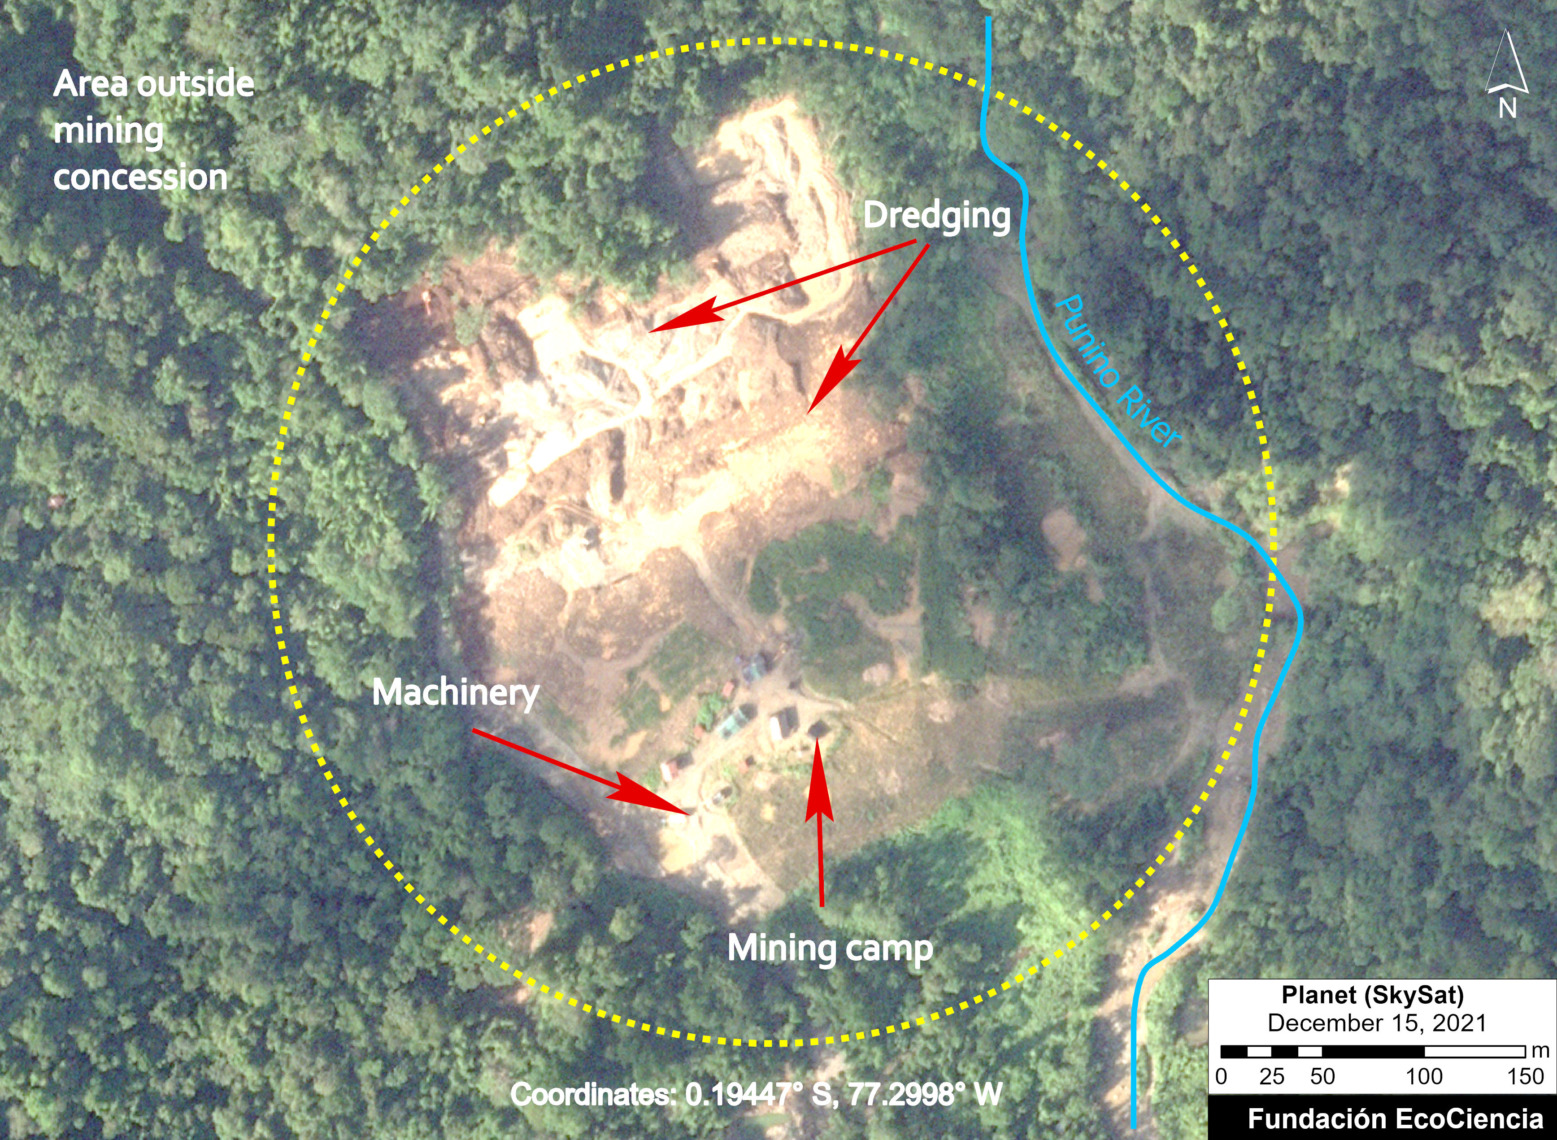
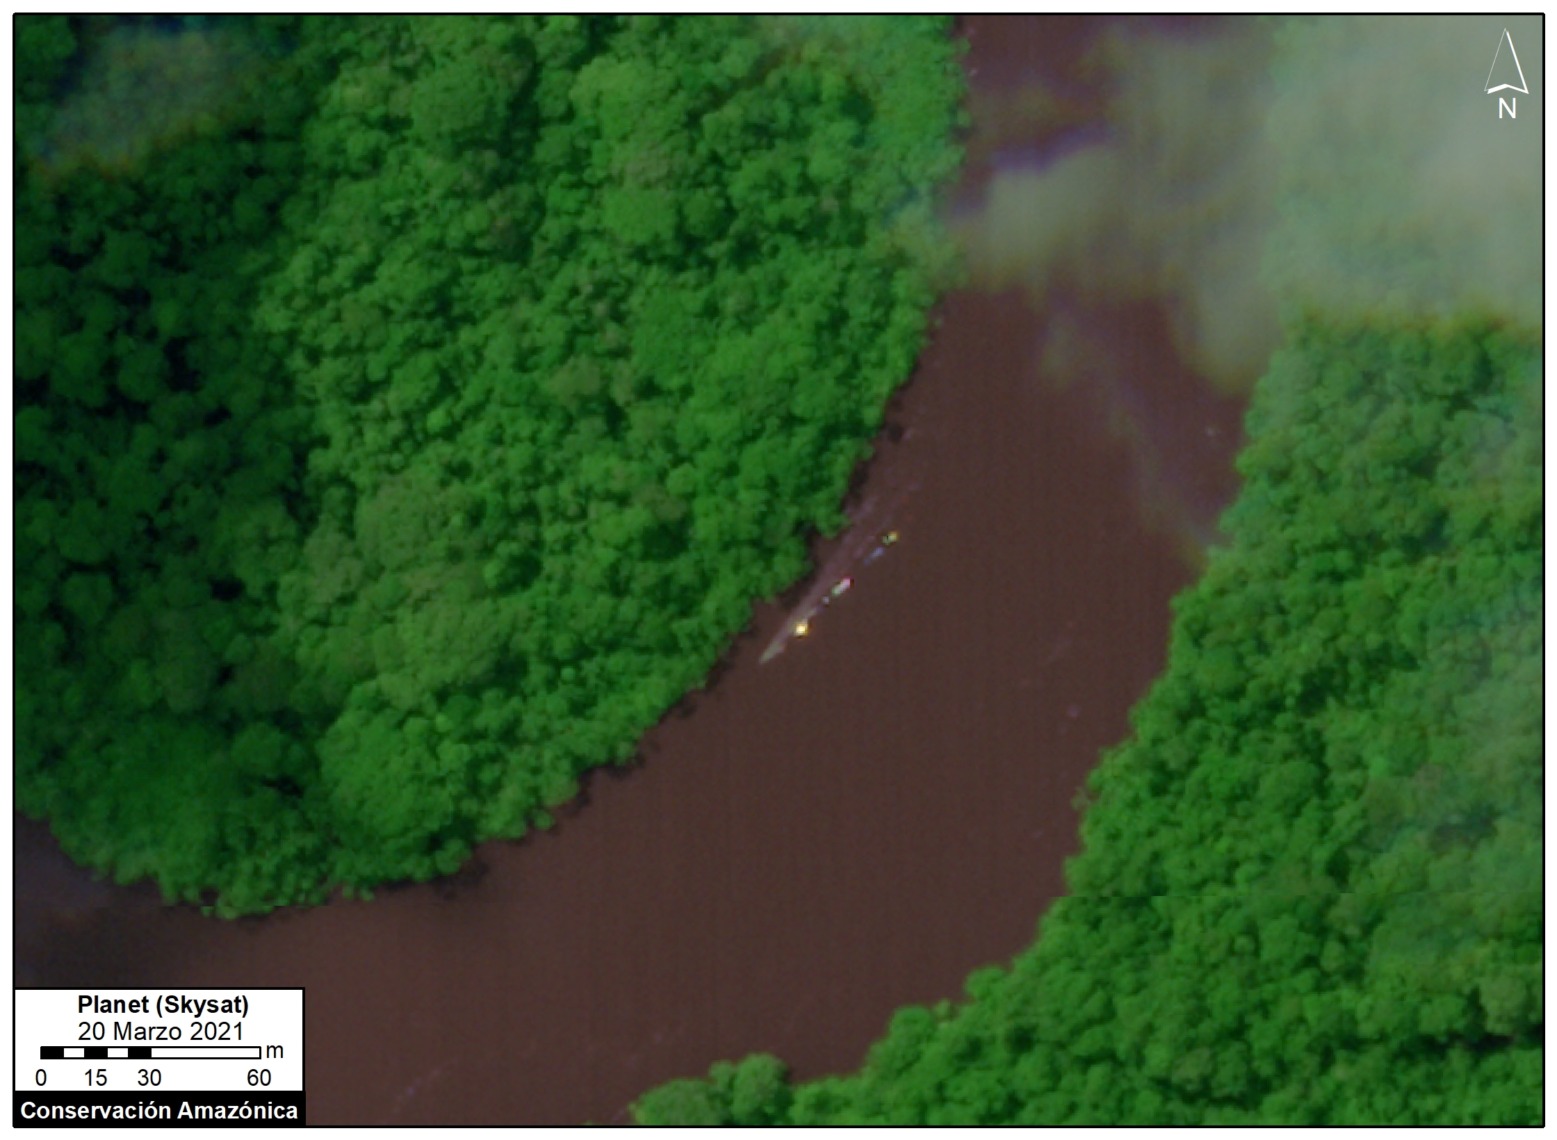
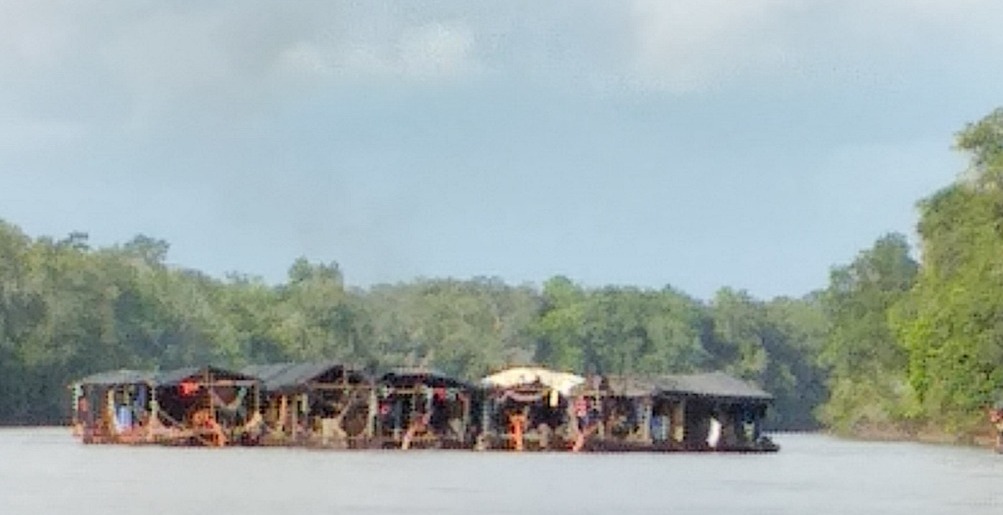
Punino River
Along the Punino River, located between Napo and Orellana provinces, we have documented the rapid mining deforestation expansion of 217 hectares since November 2019. Alarmingly, much of this activity (85%) occurred most recently in 2022. See MAAP #176 for more details.
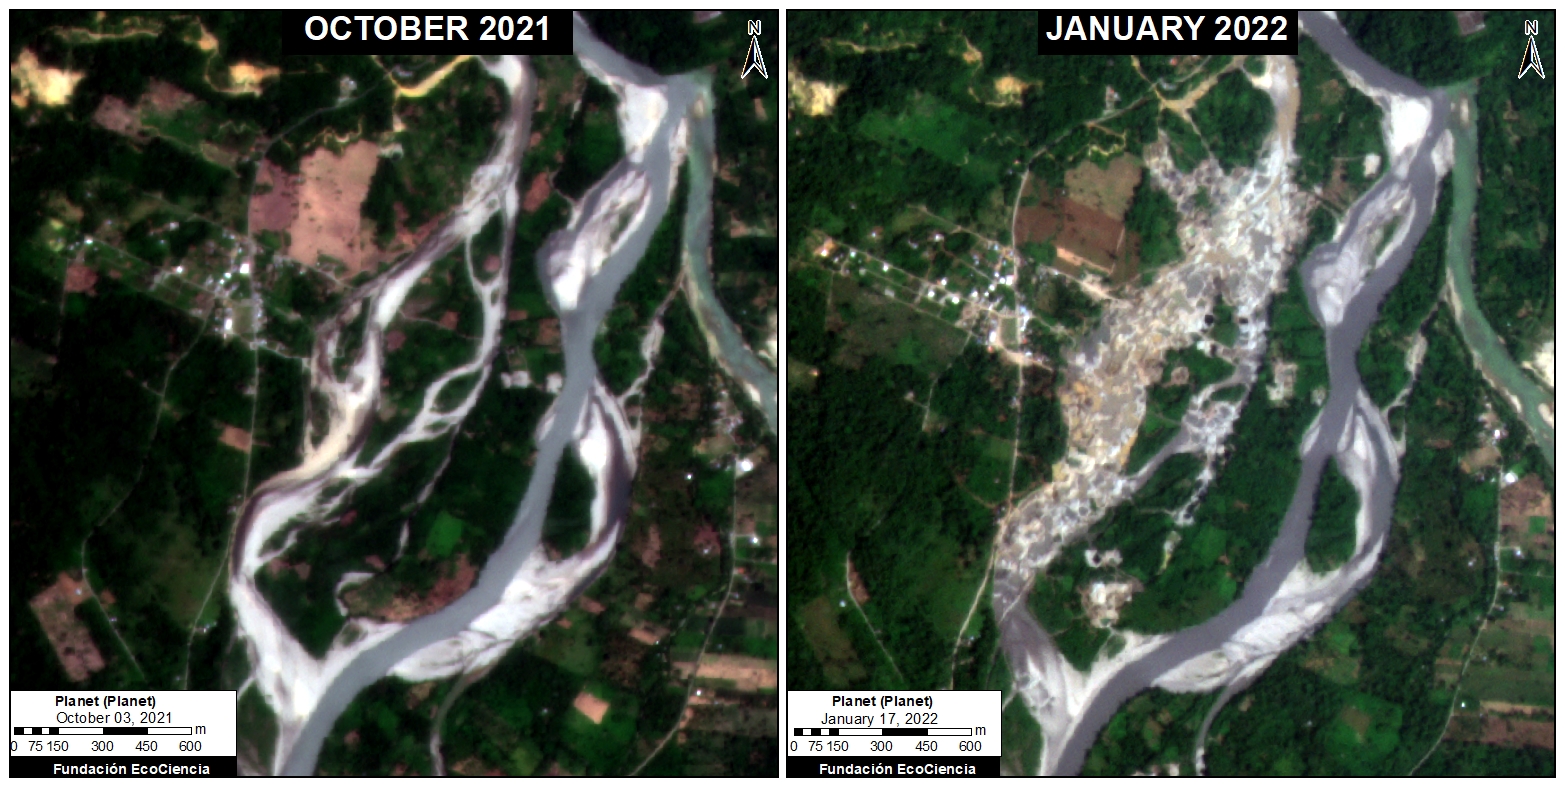
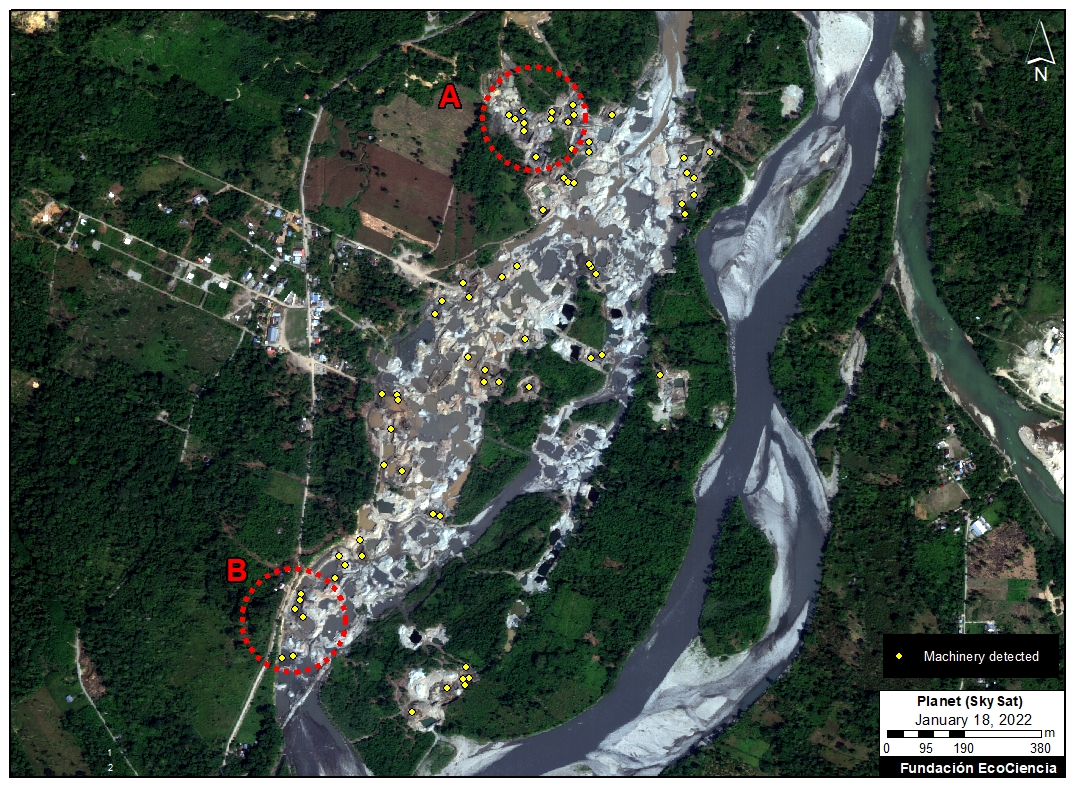
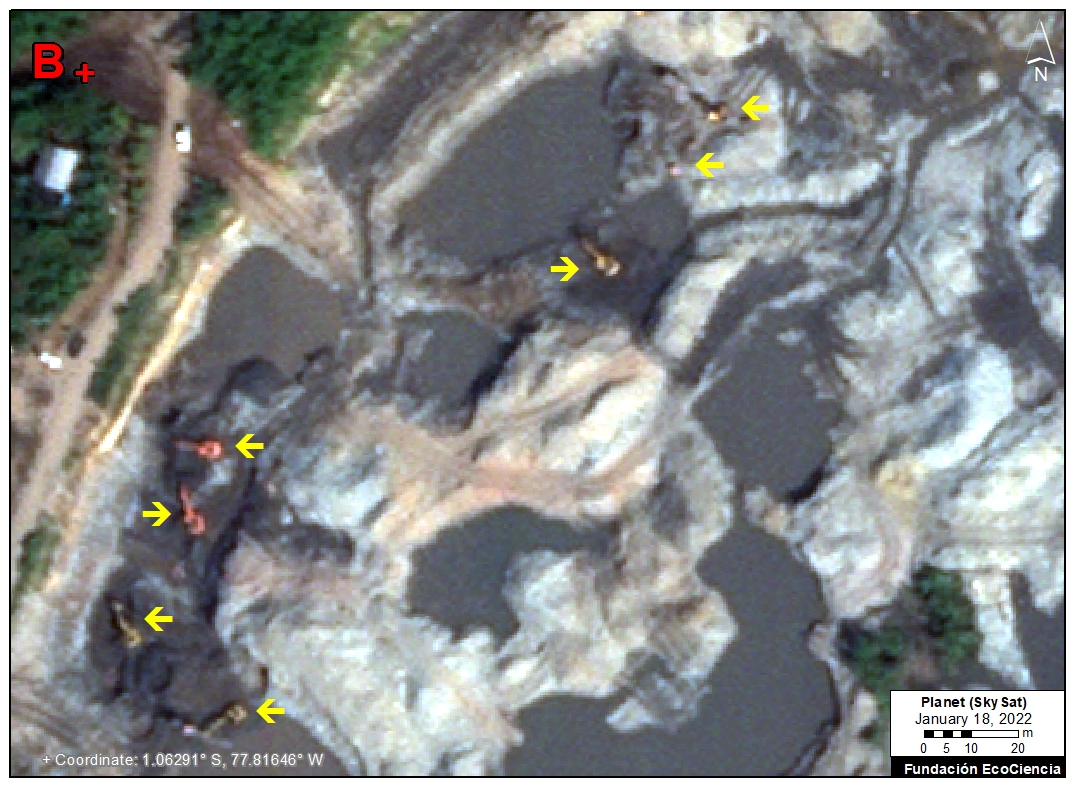
Yutzupino/Napo
In this area, located in Napo province, we have documented the mining deforestation of 125 hectares since October 2021, including major impacts along the Jatunyacu River. Surrounding sites in Napo have added 490 hectares since 2017. See MAAP #151 and MAAP #162 for more details.
Upper Nangaritza River Protected Forest
In Upper Nangaritza River Protected Forest, also located in Zamora Chinchipe province, we have documented the mining deforestation of 545 hectares since 2018 along the Nangaritza River. See MAAP #167 for more details.
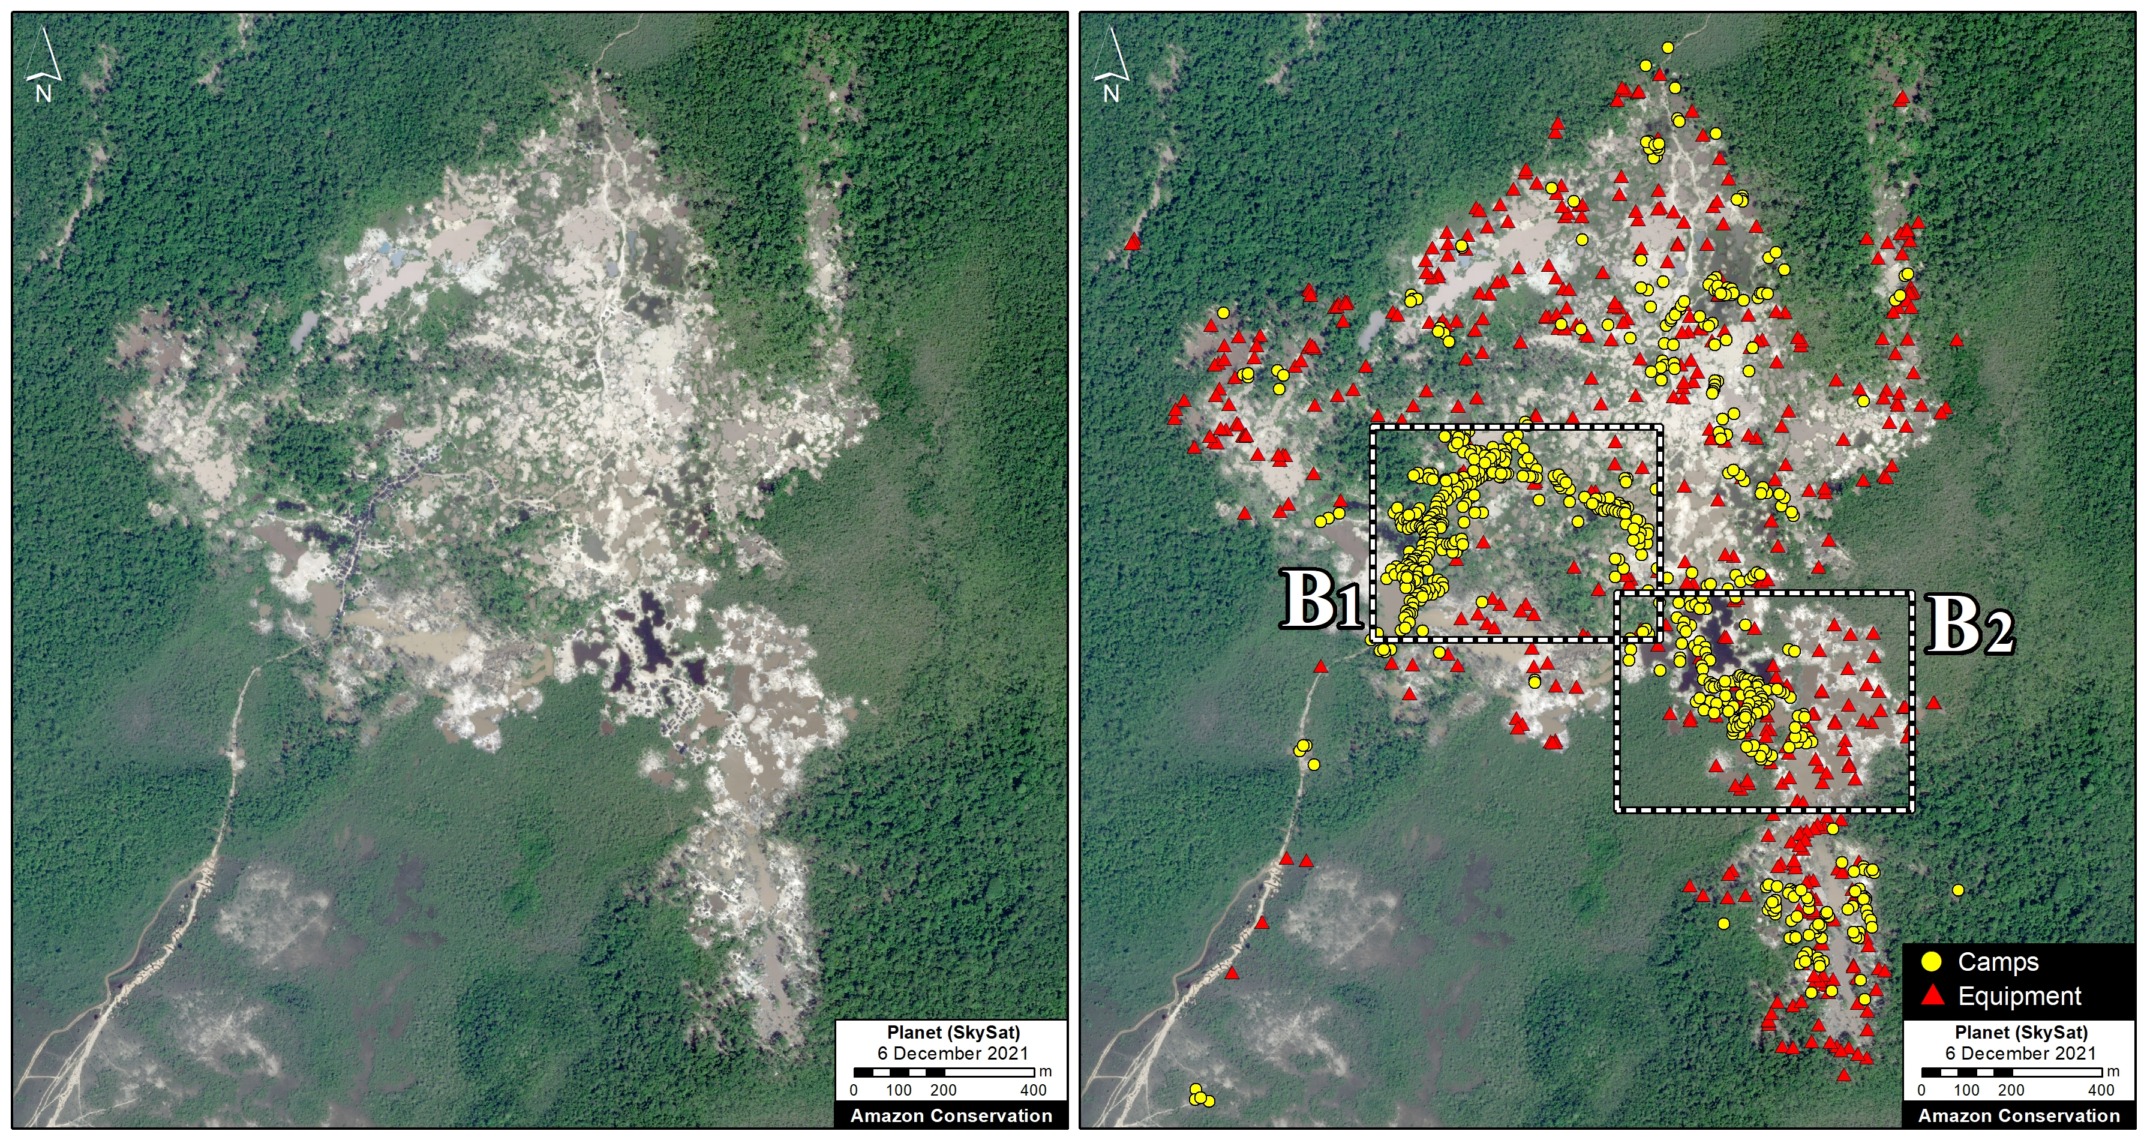
Shuar Arutam Indigenous Territory
In the Shuar Arutam Indigenous Territory, located in Morona Santiago province, we have documented the mining deforestation of 257 hectares since 2021. See MAAP #170 for more details.
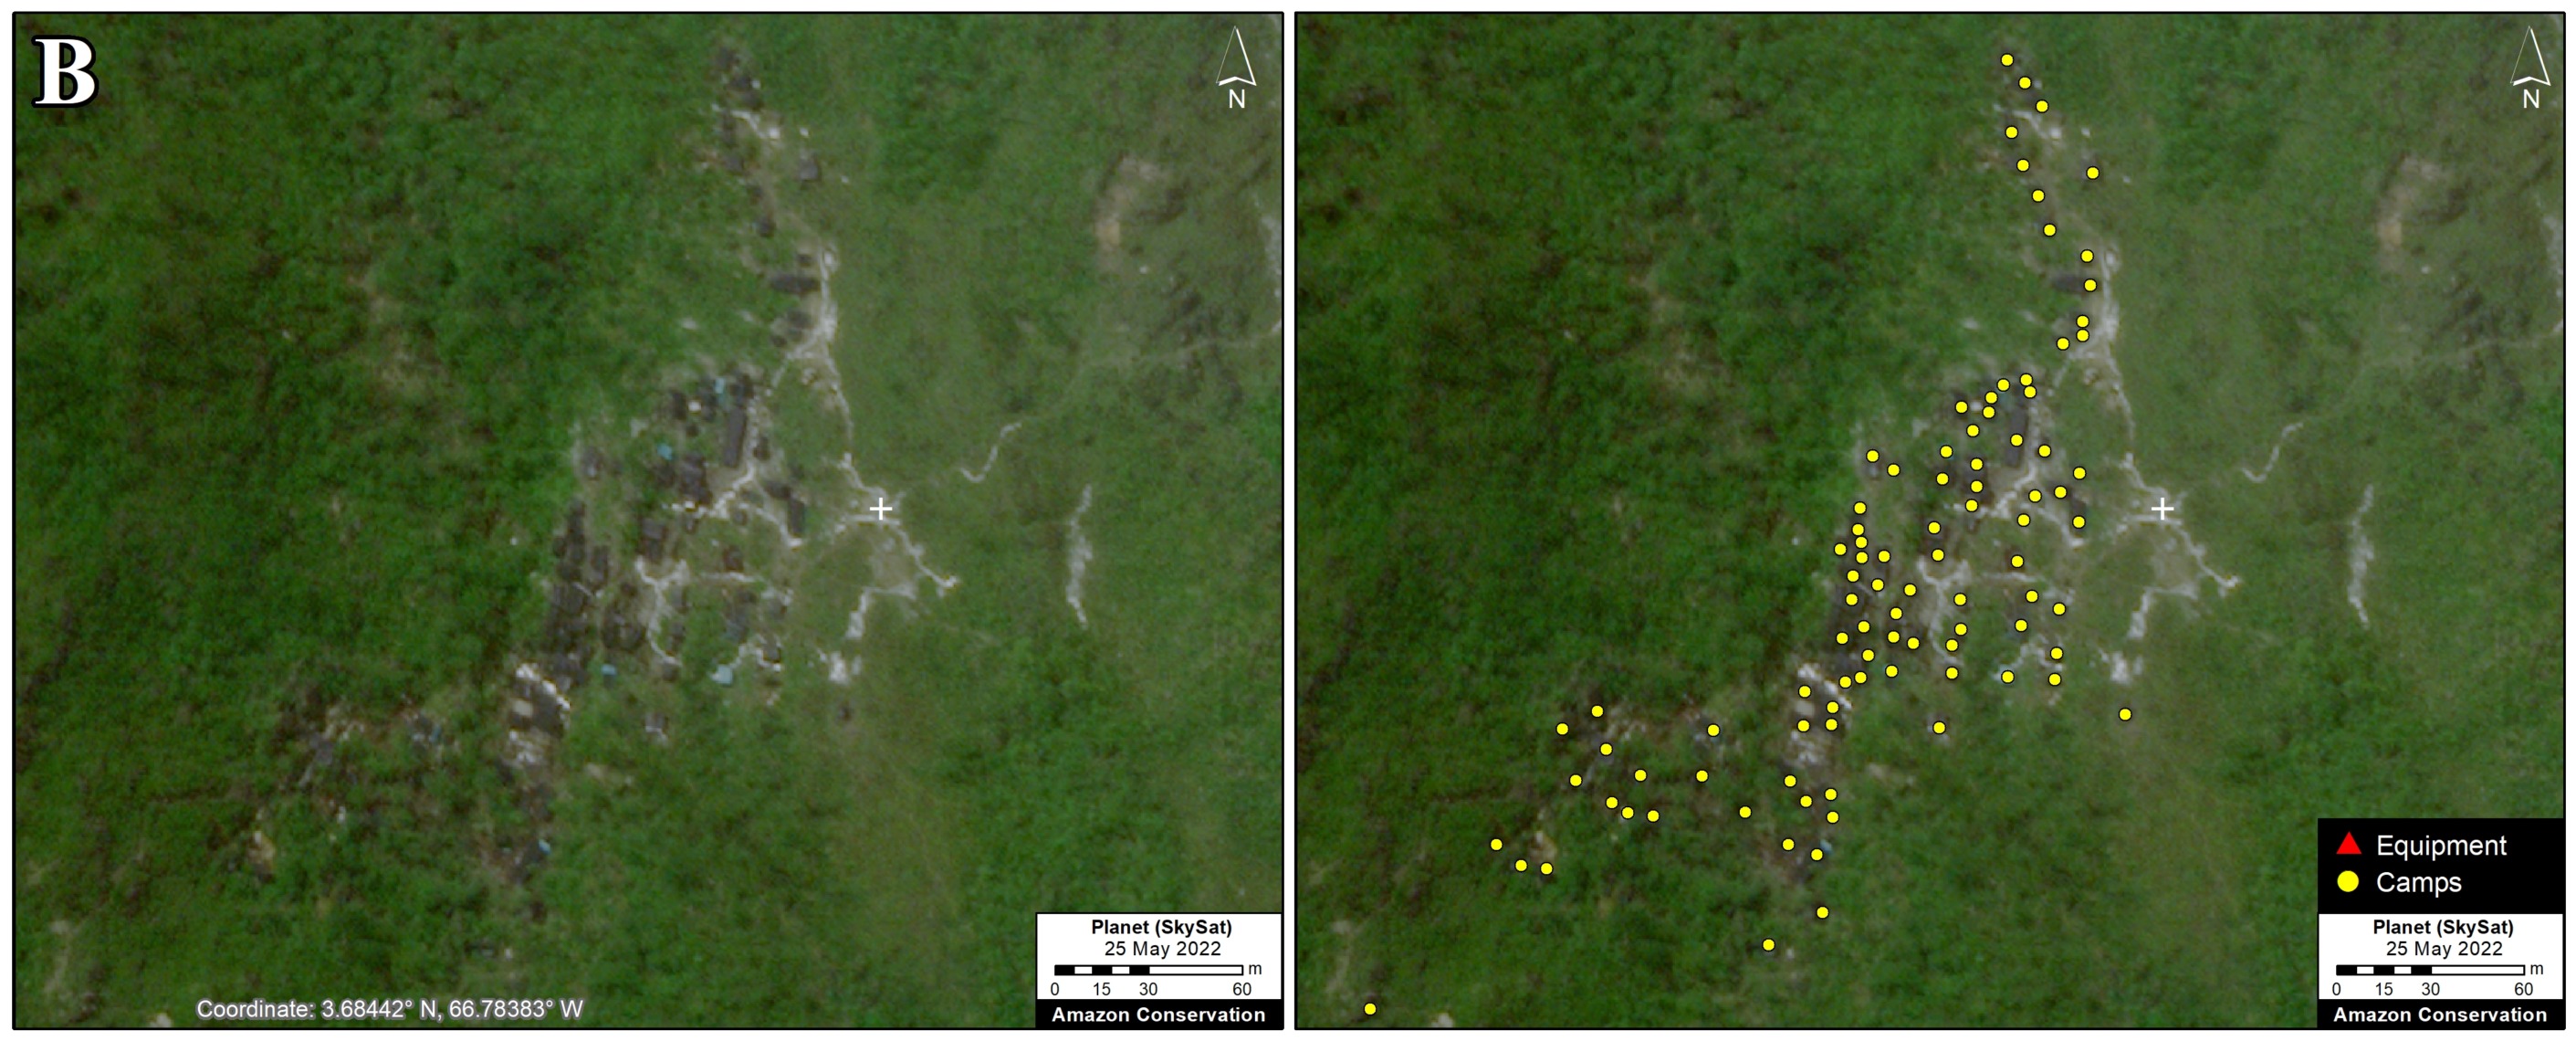
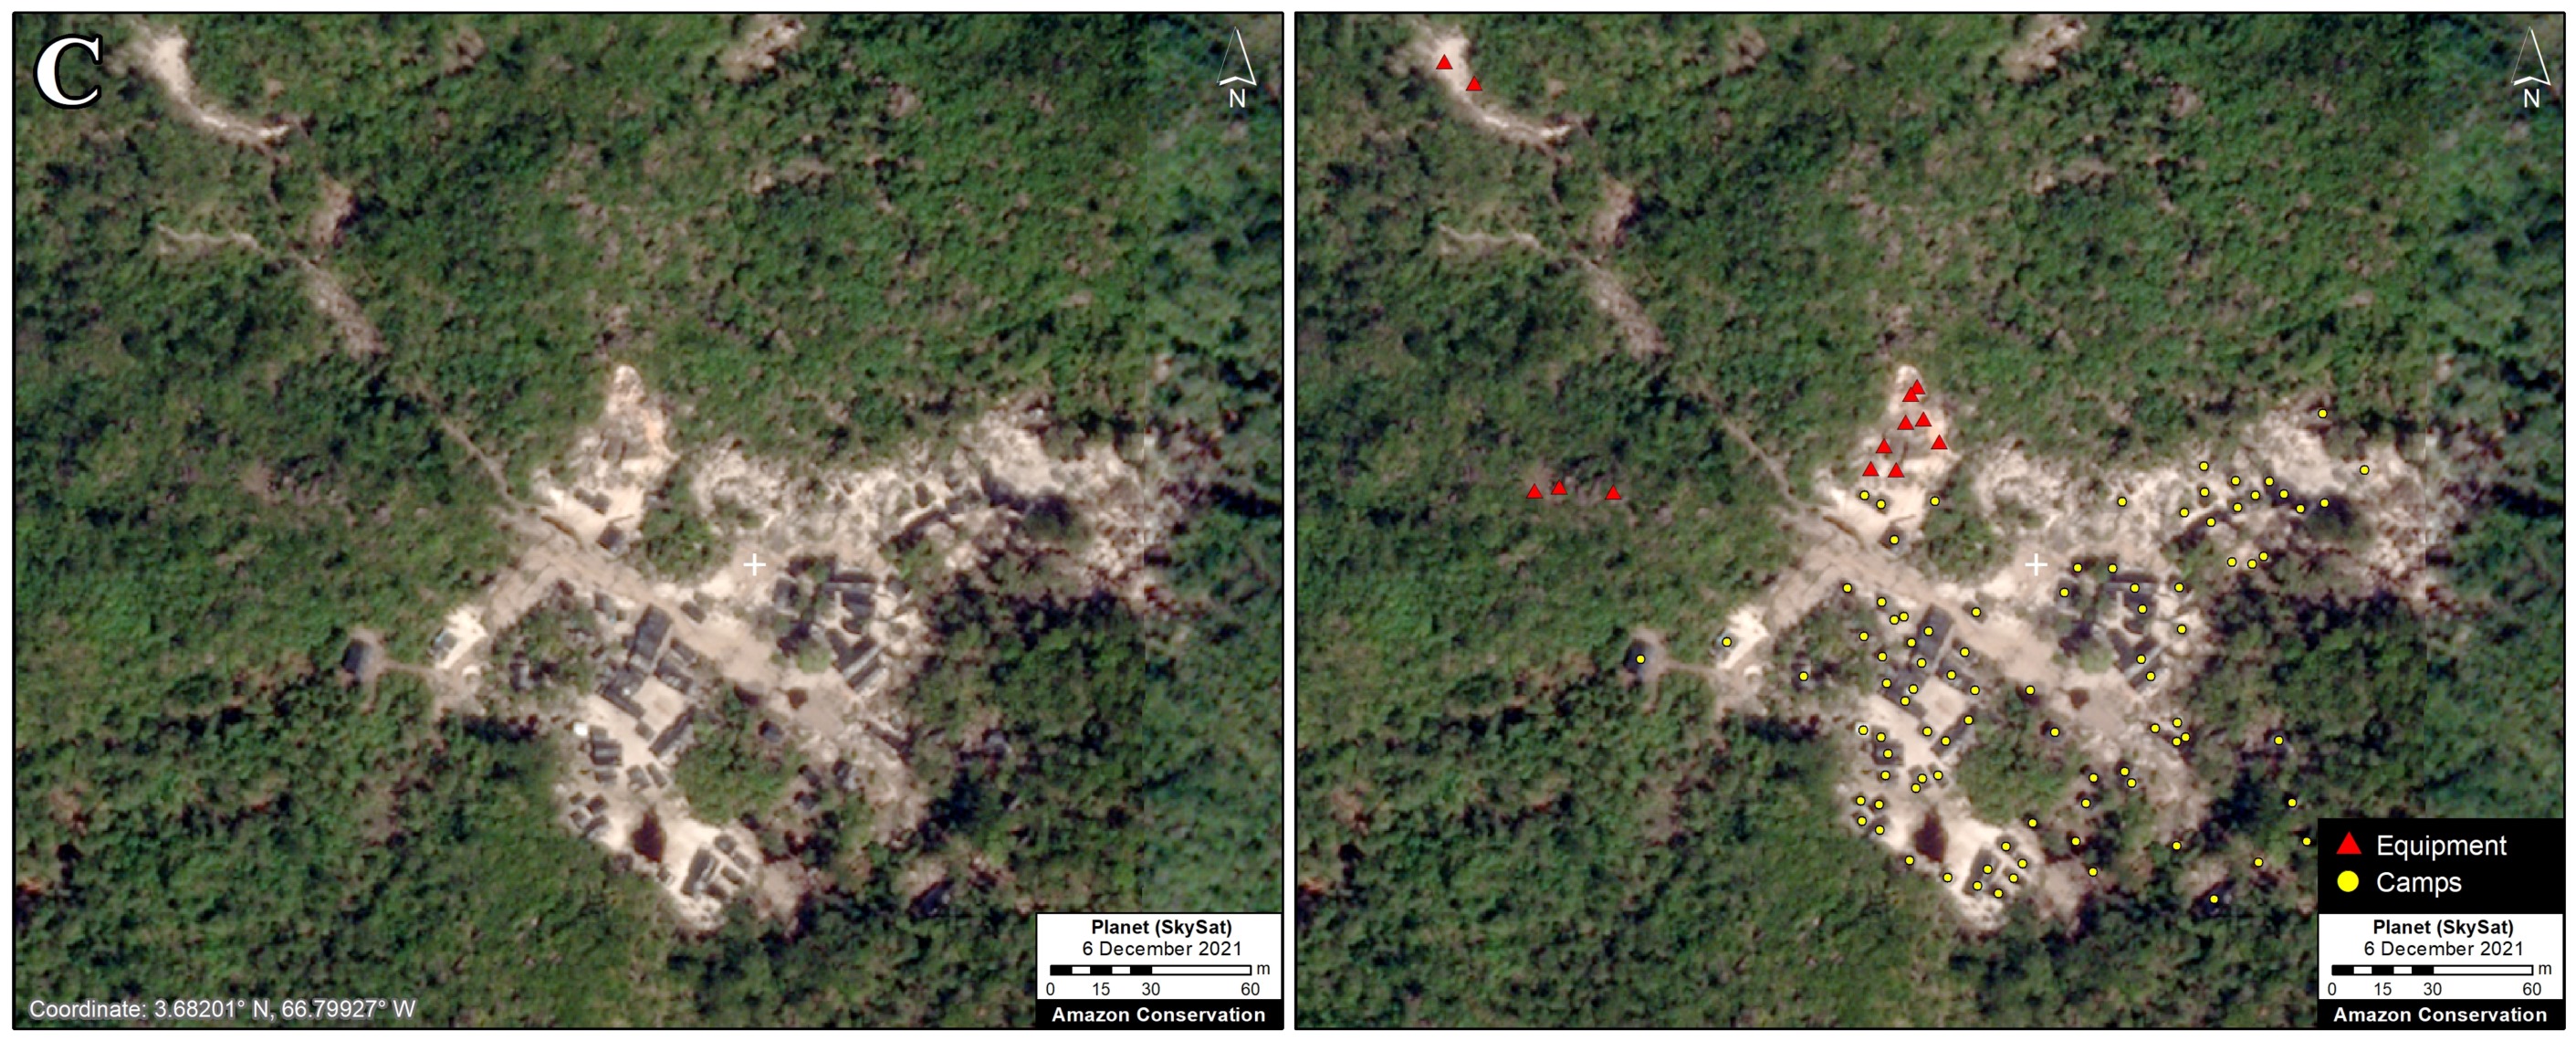
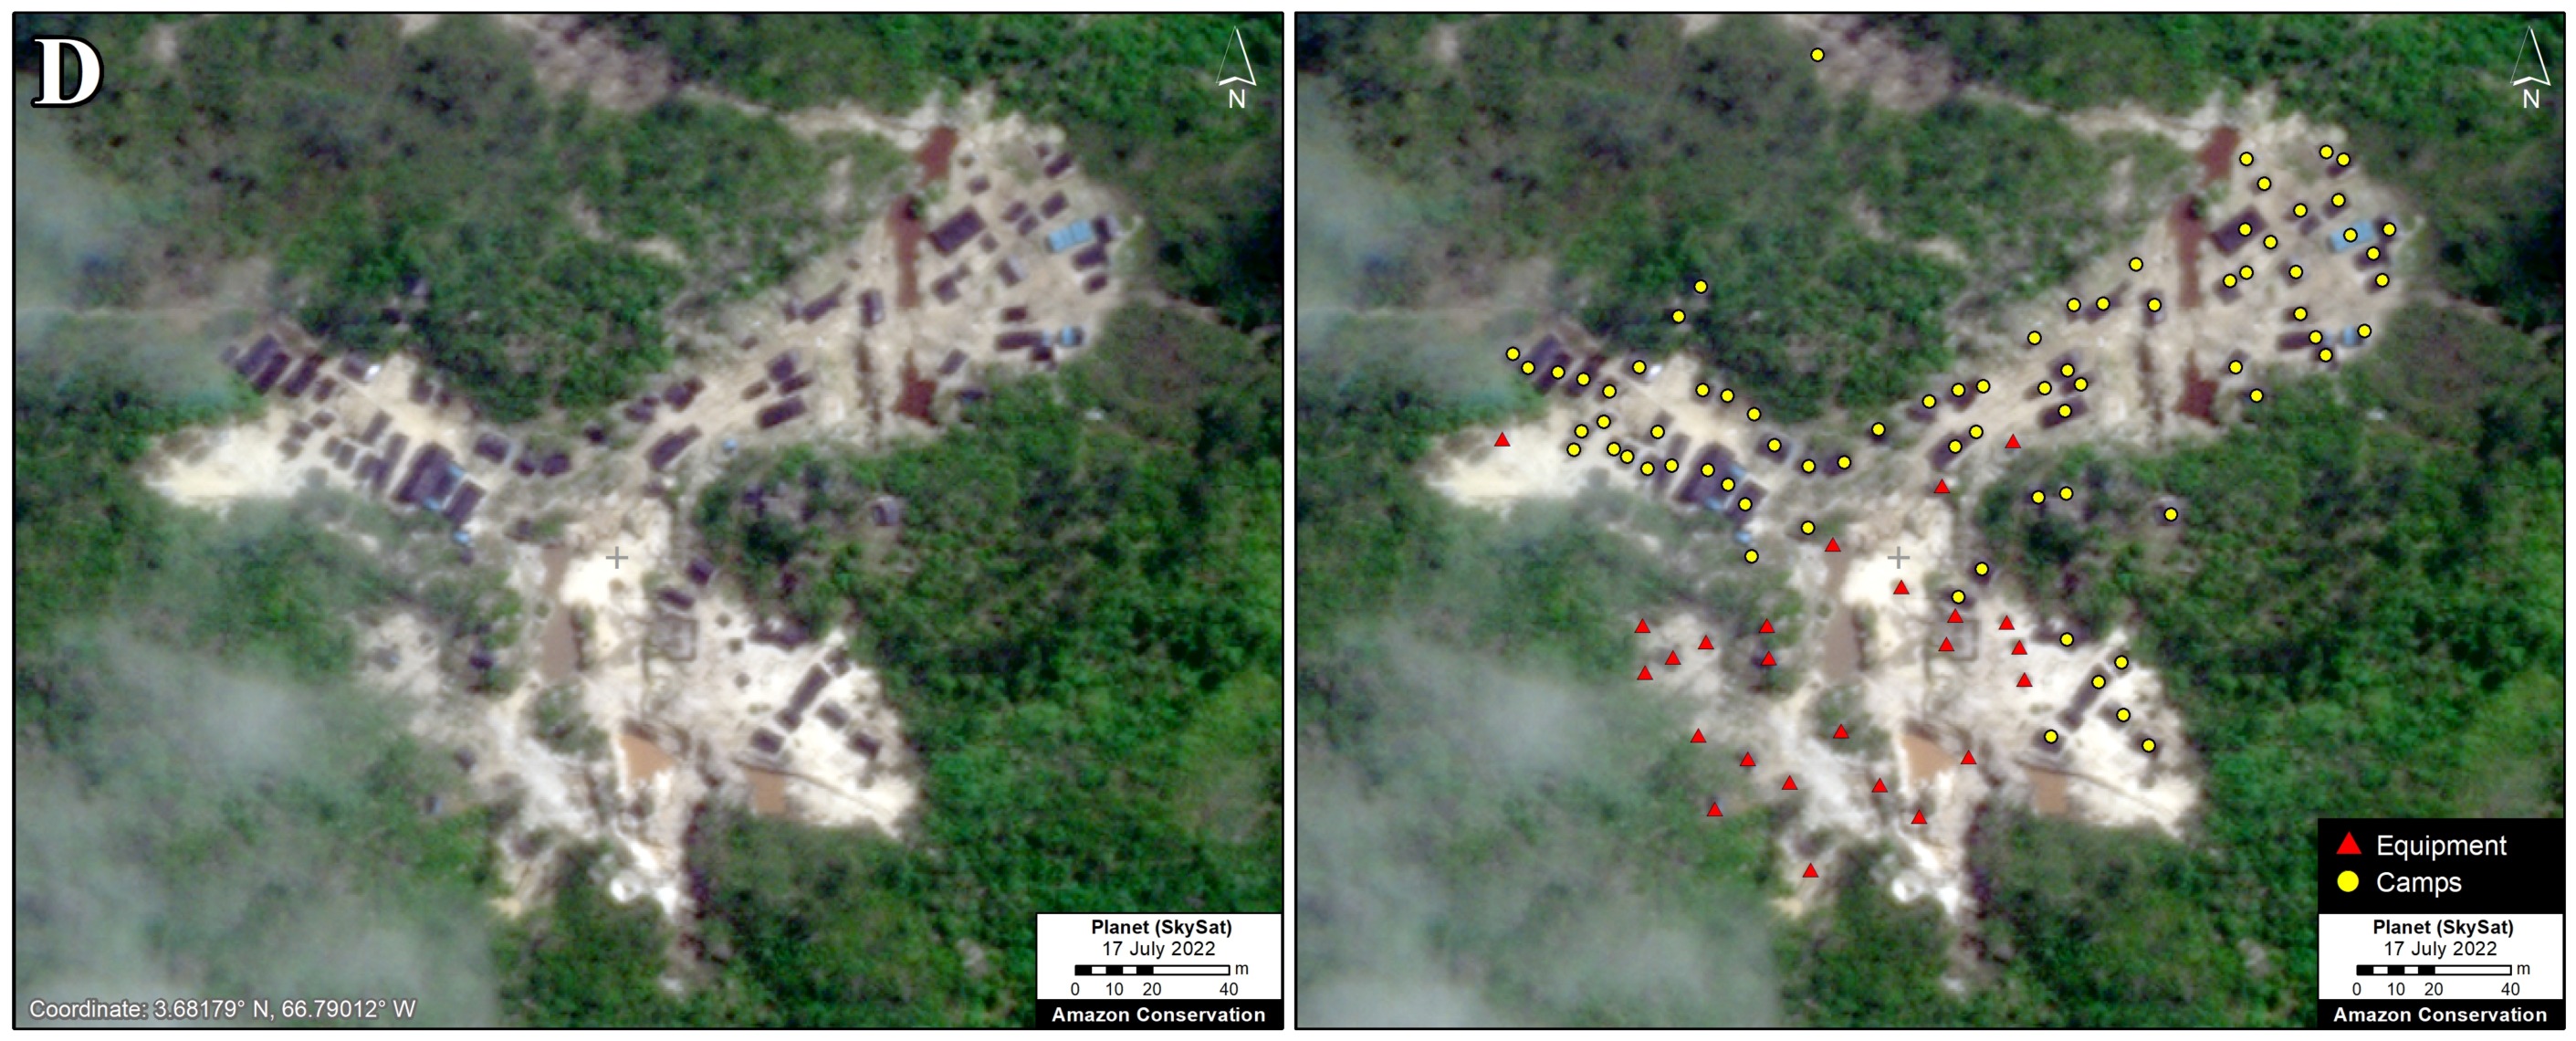
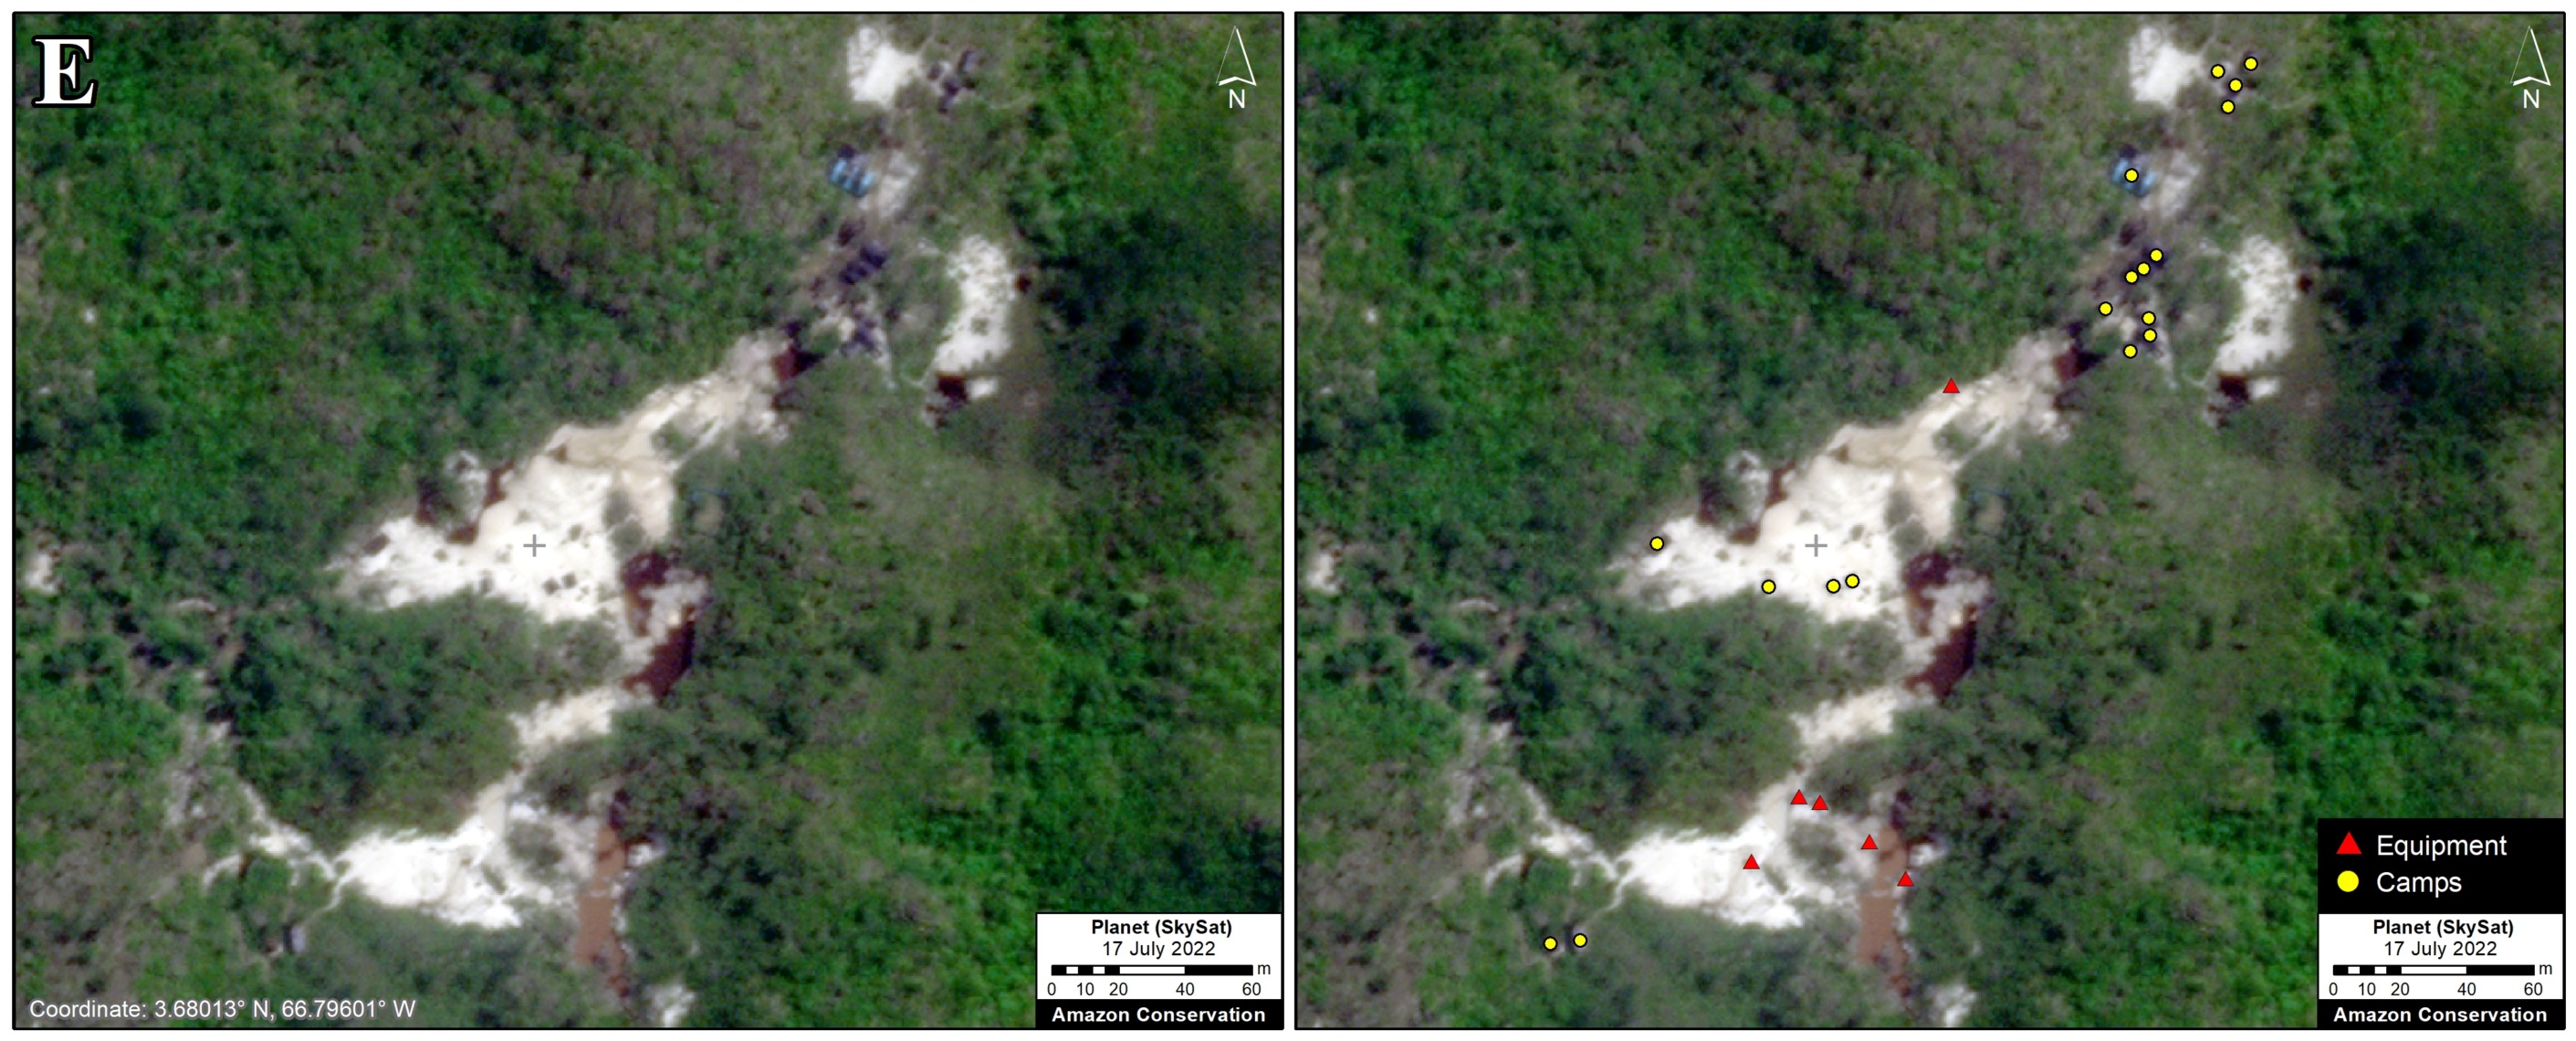
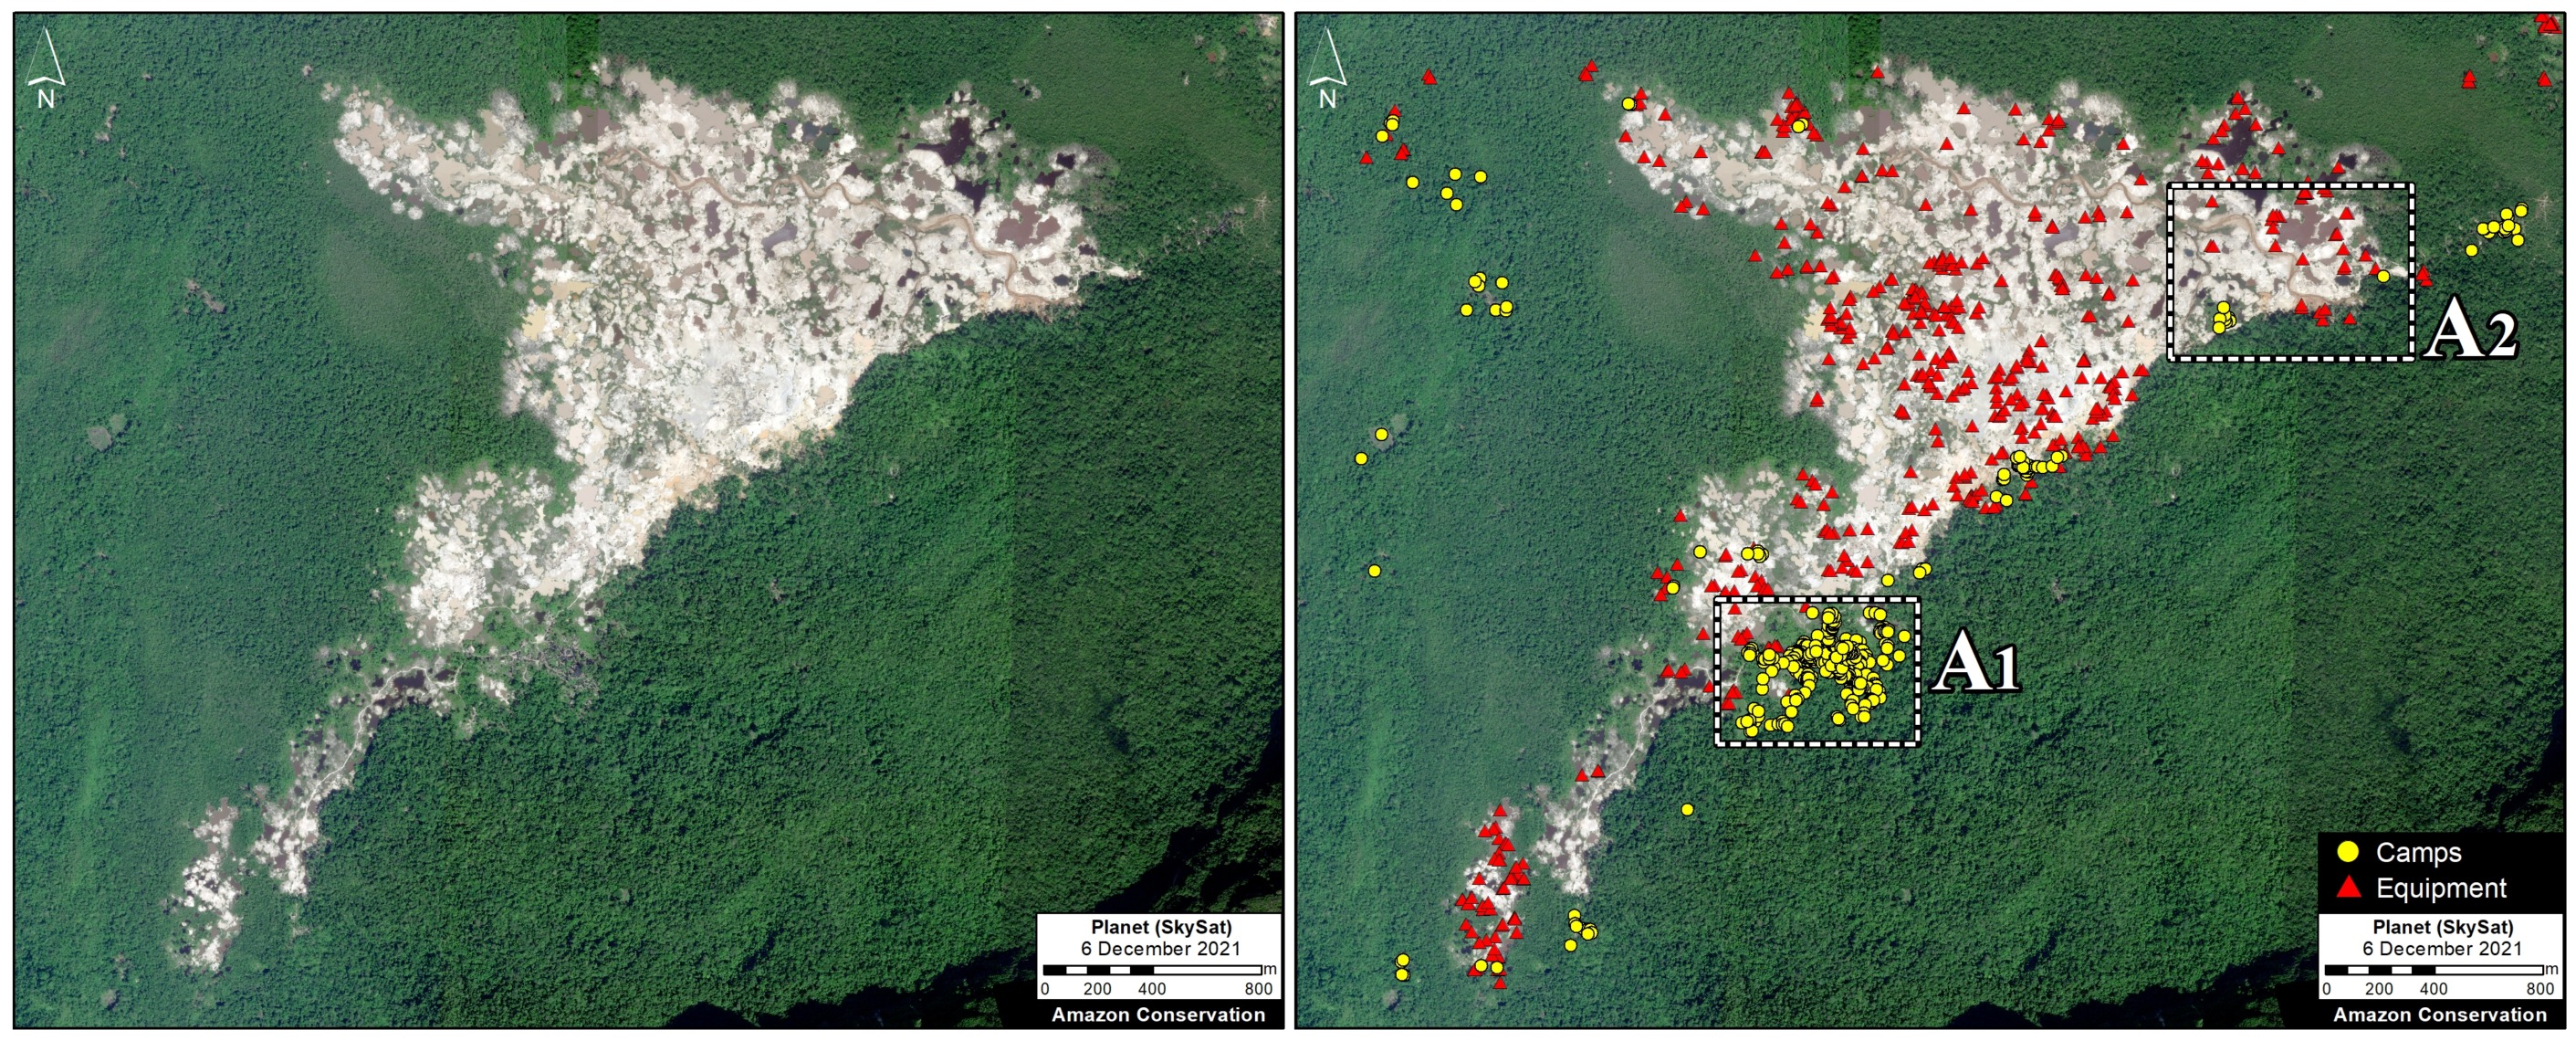
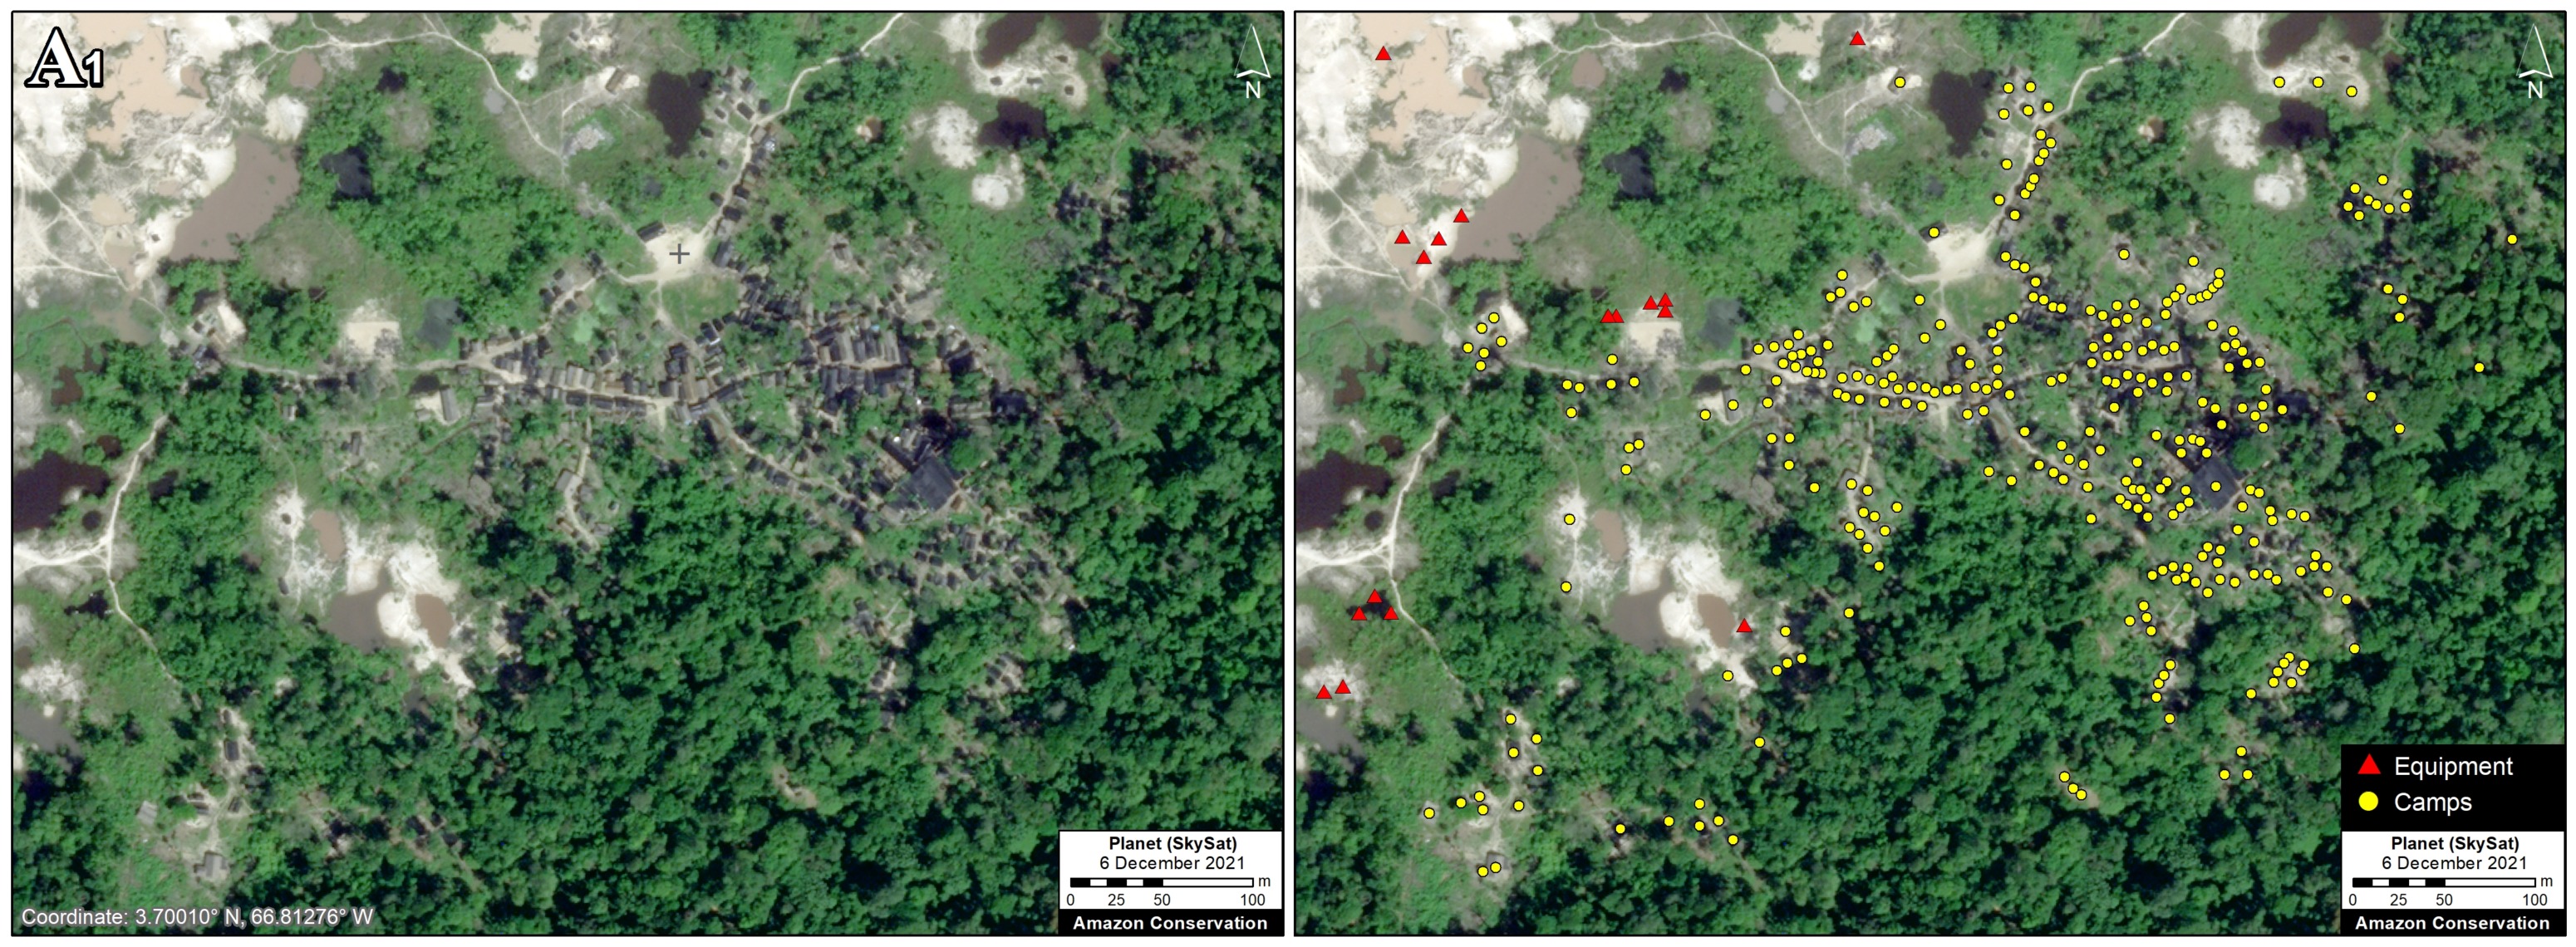
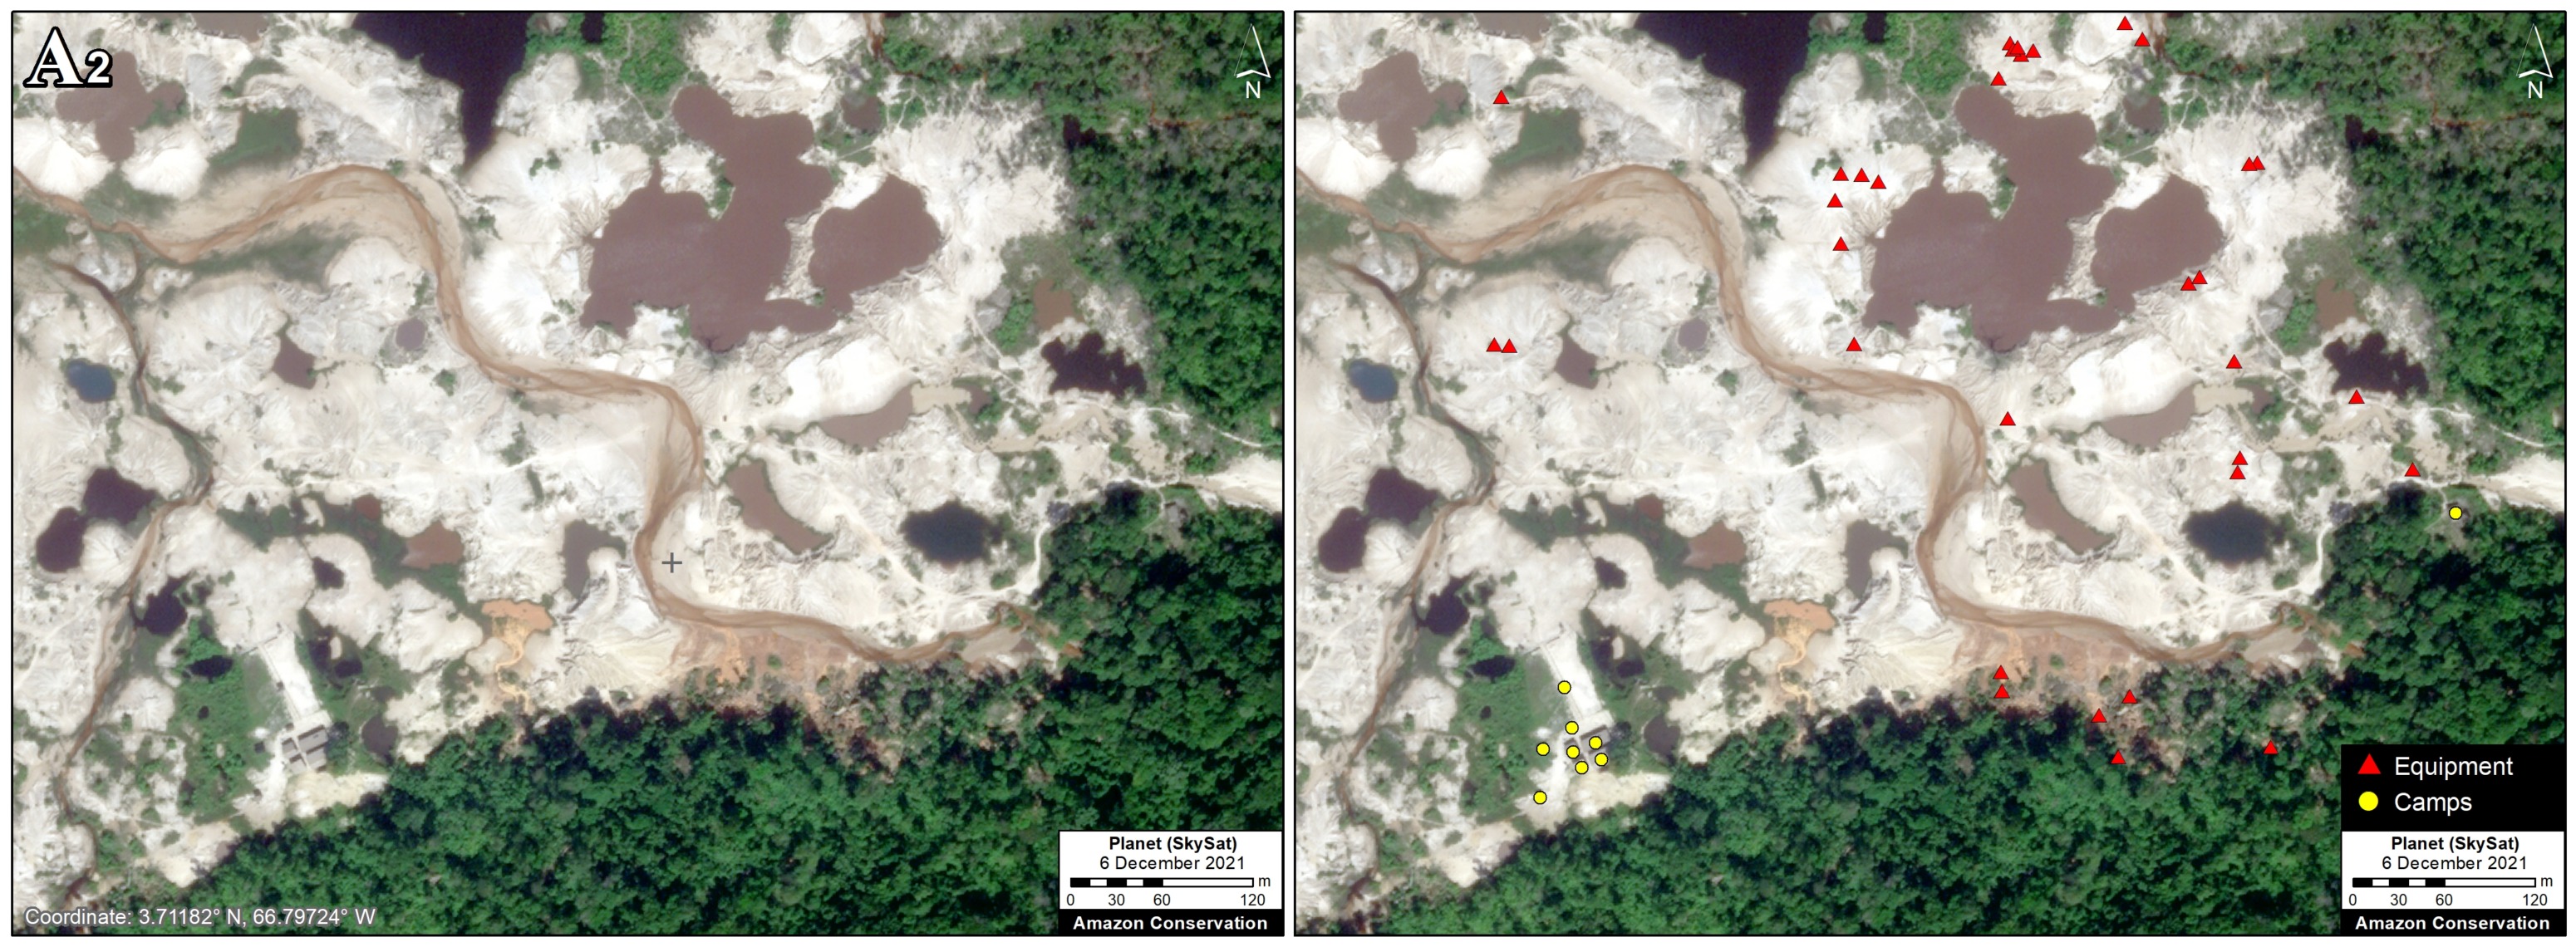
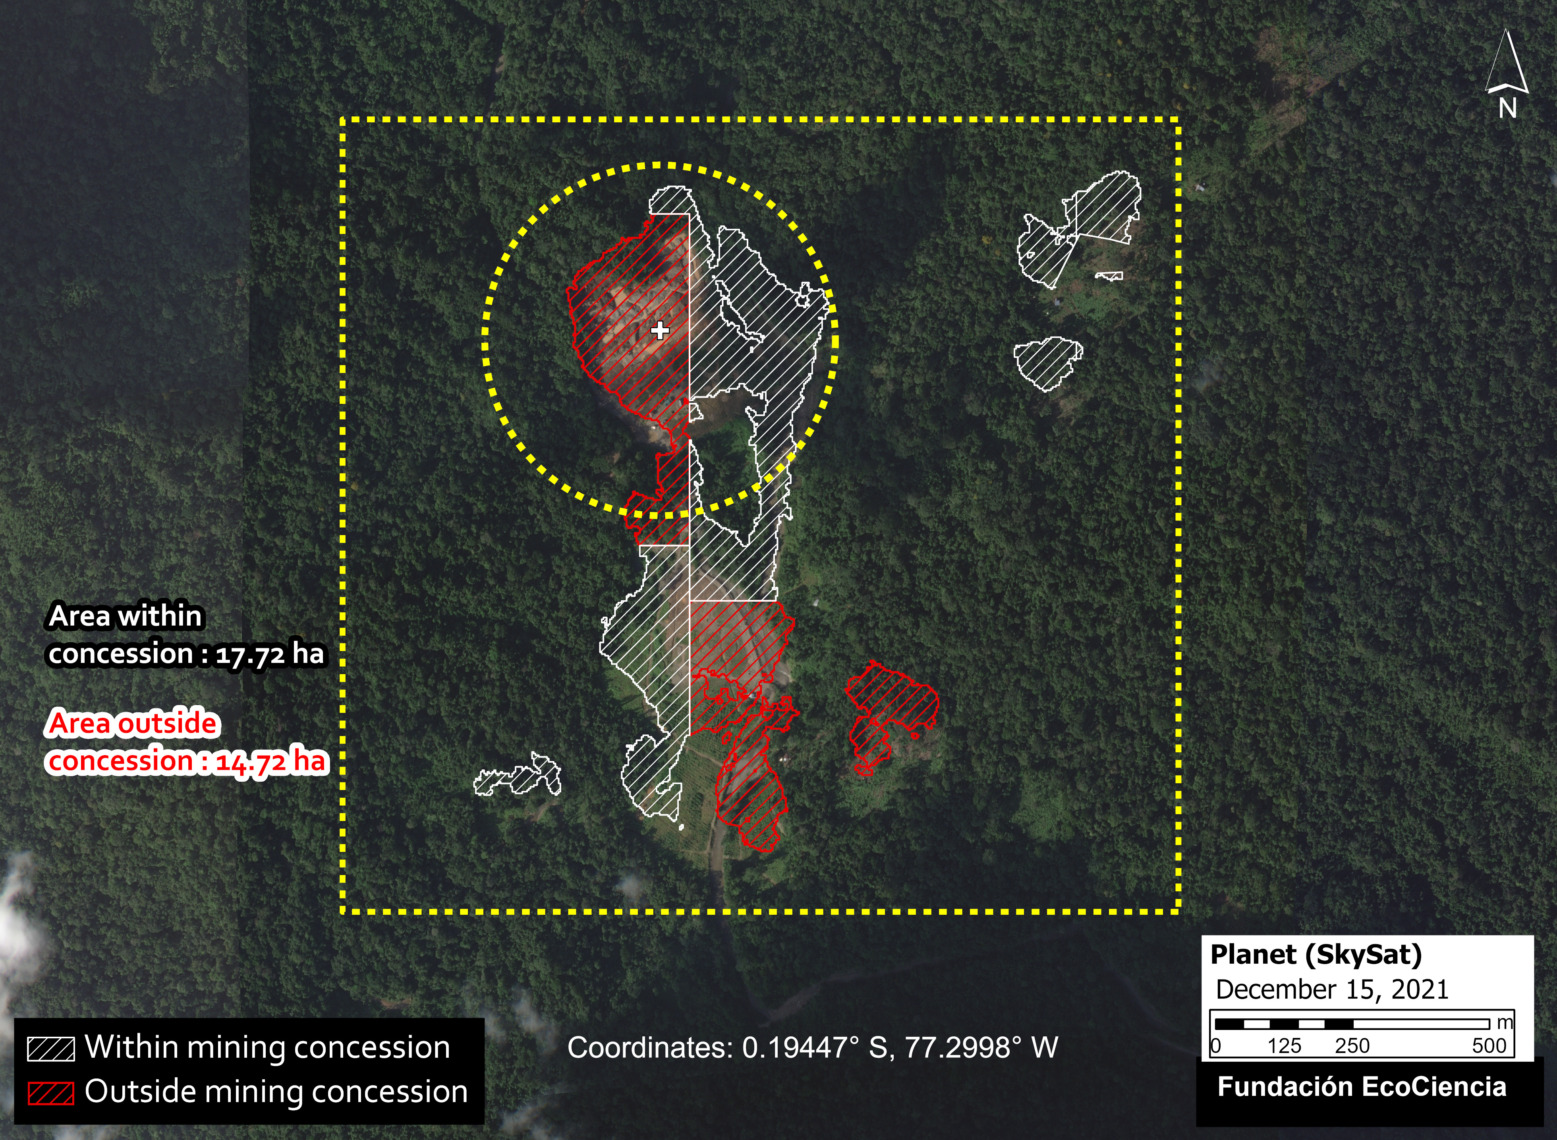
Podocarpus National Park
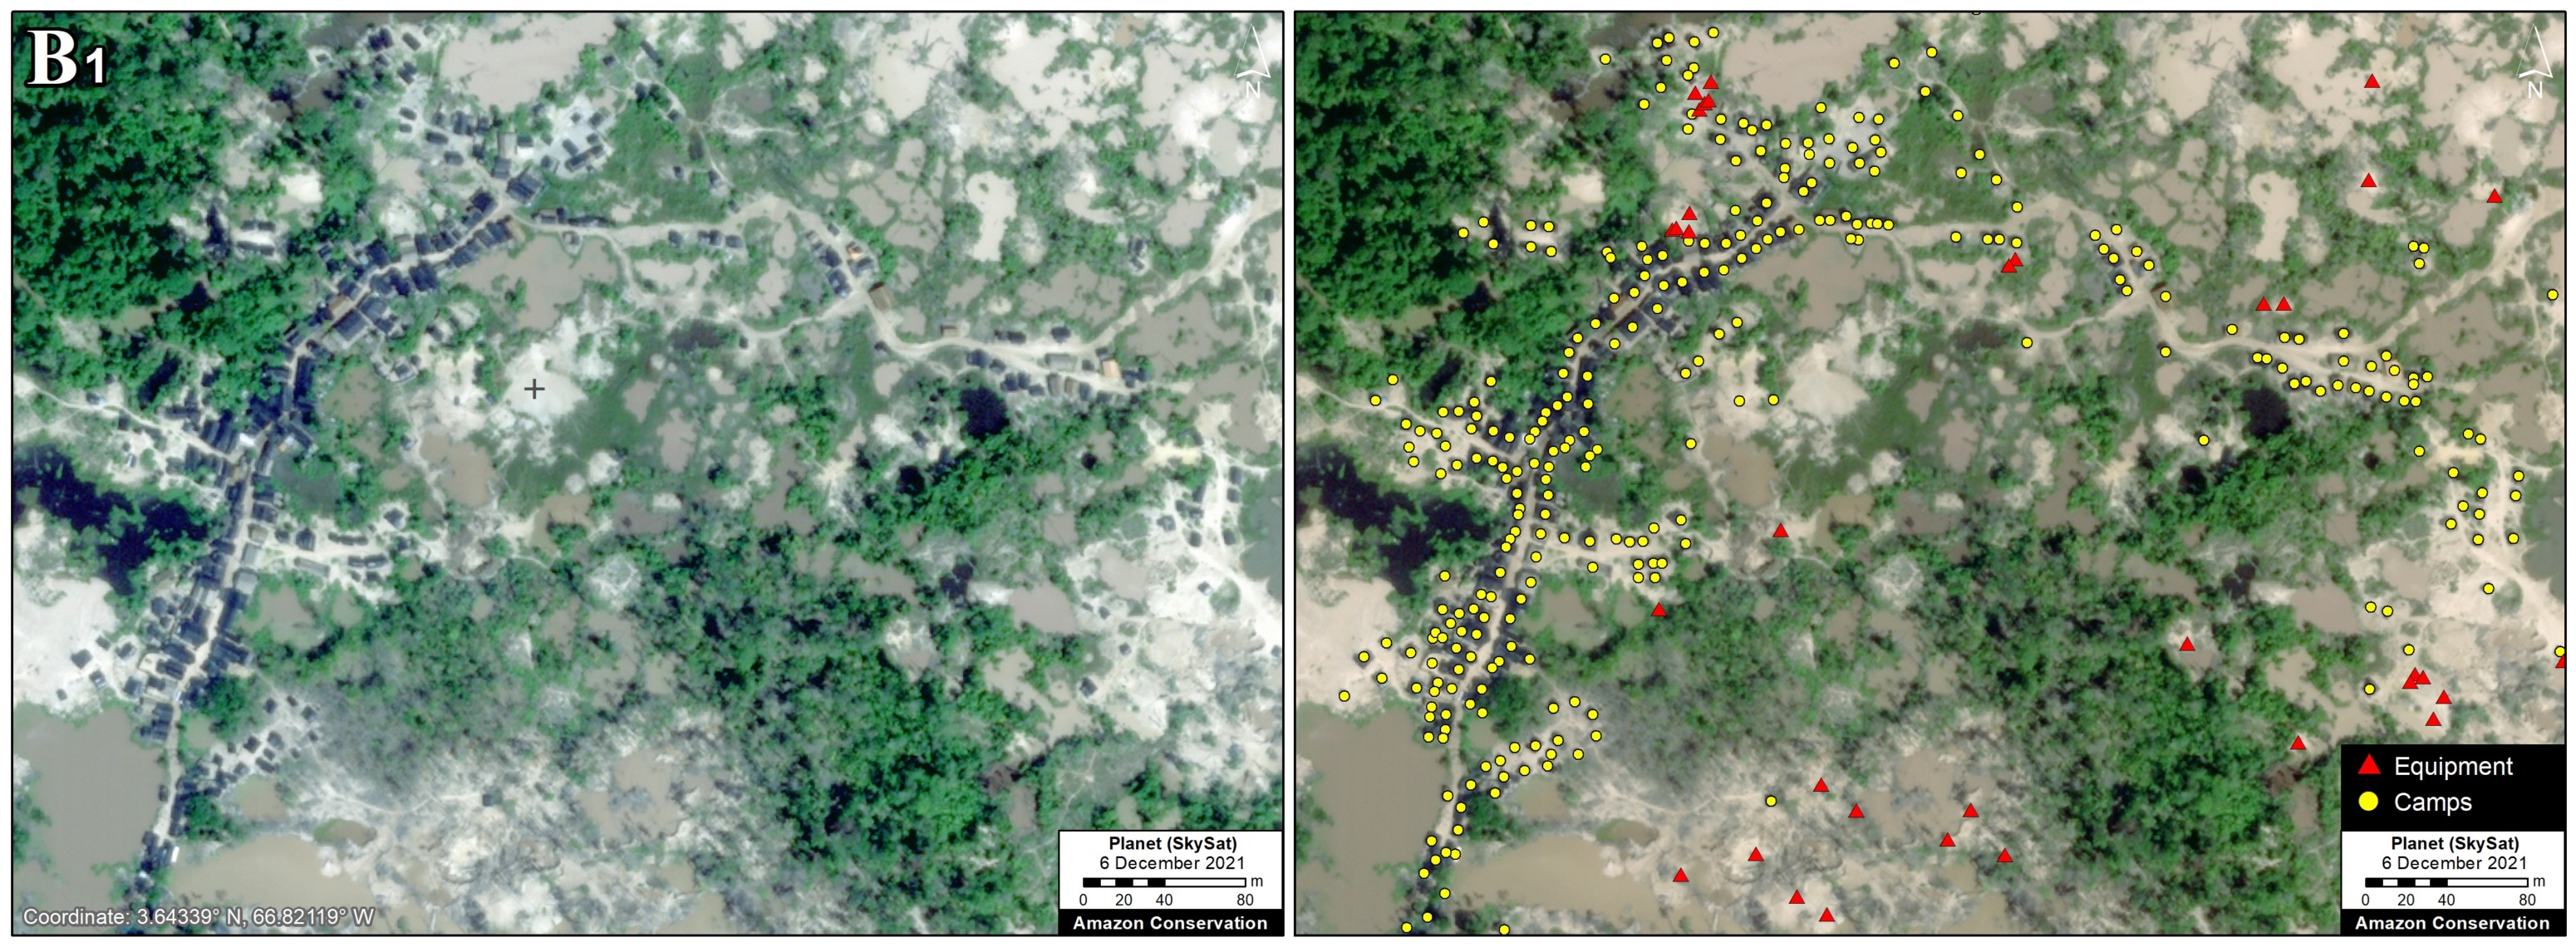
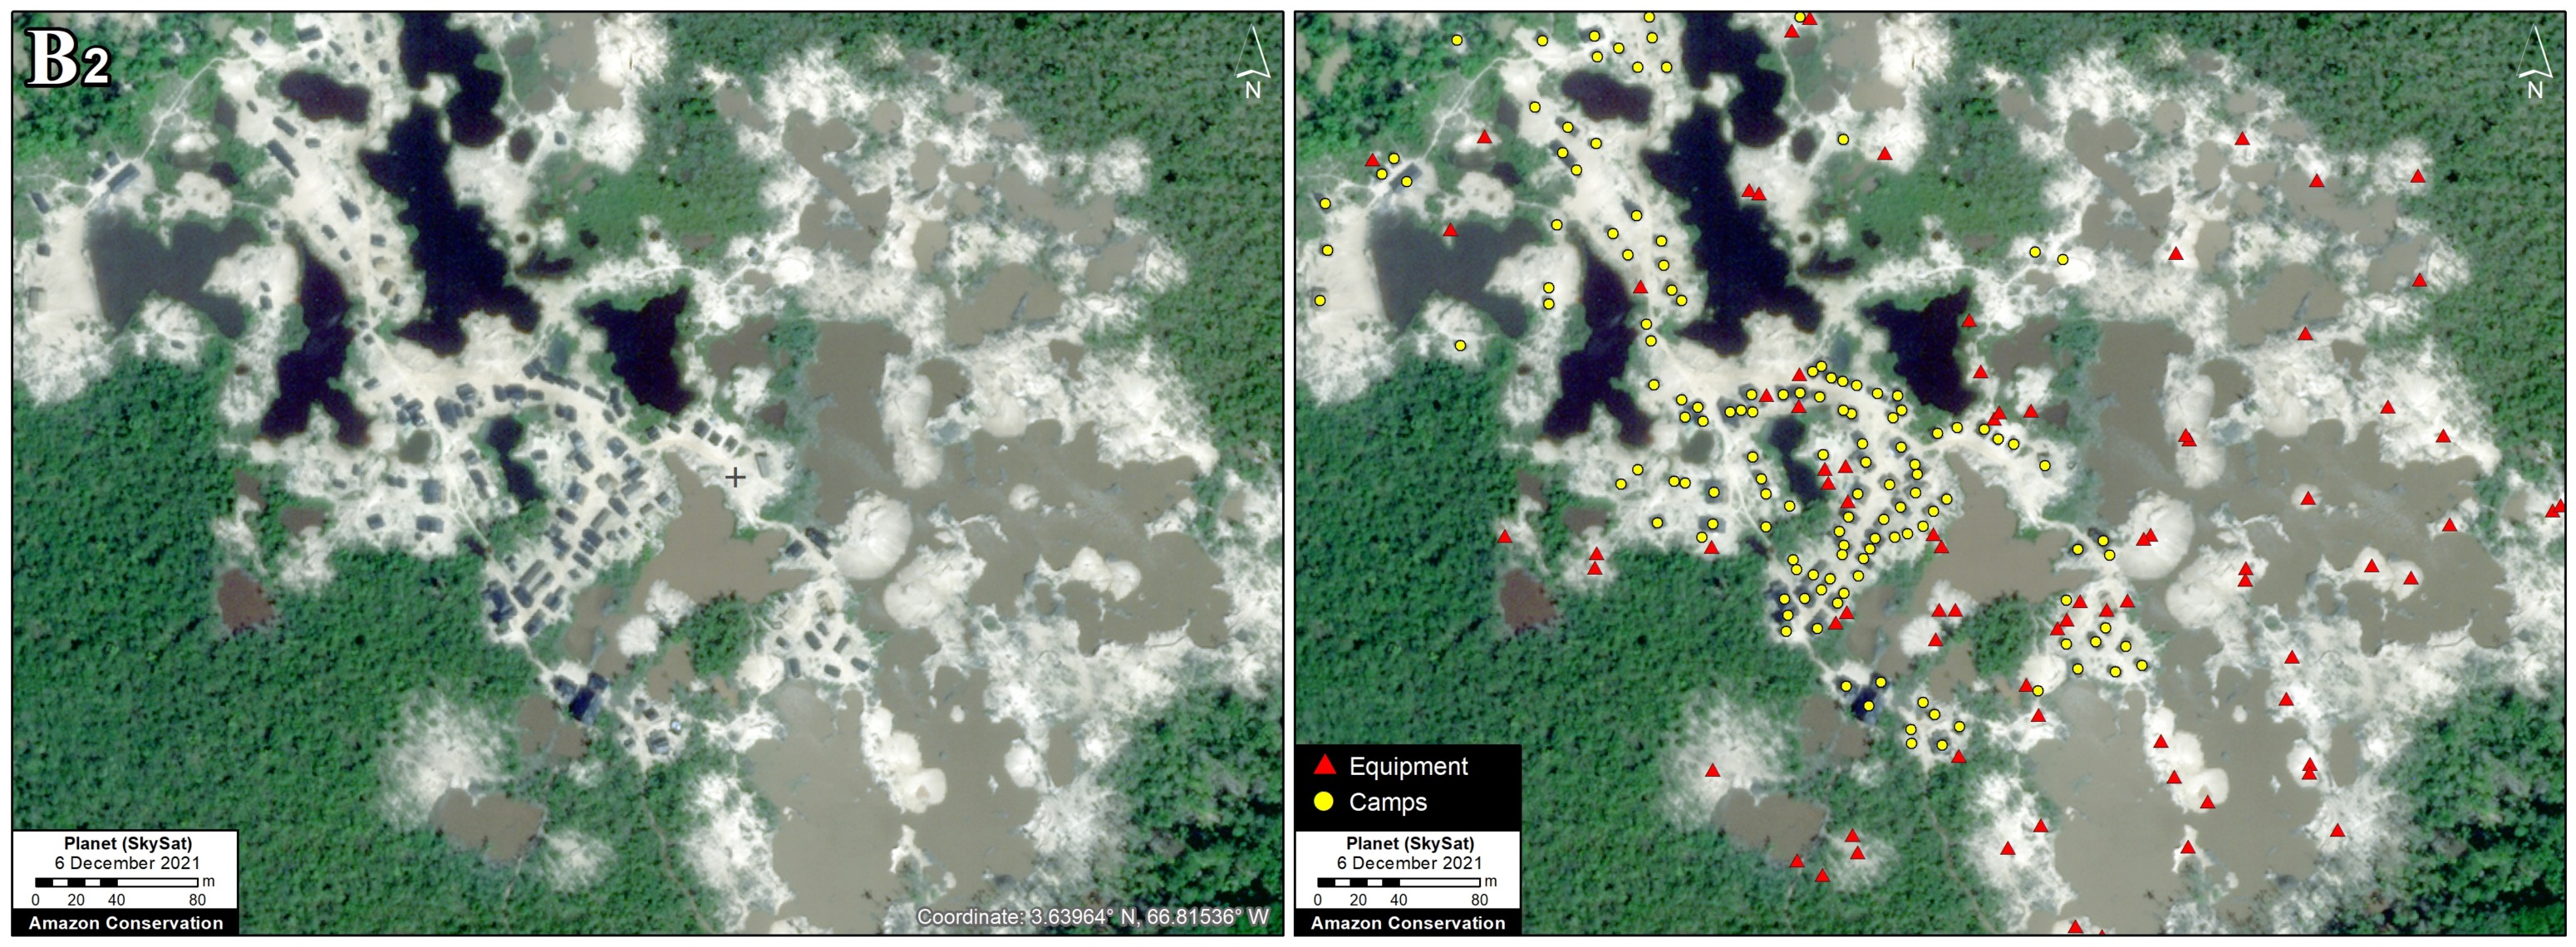
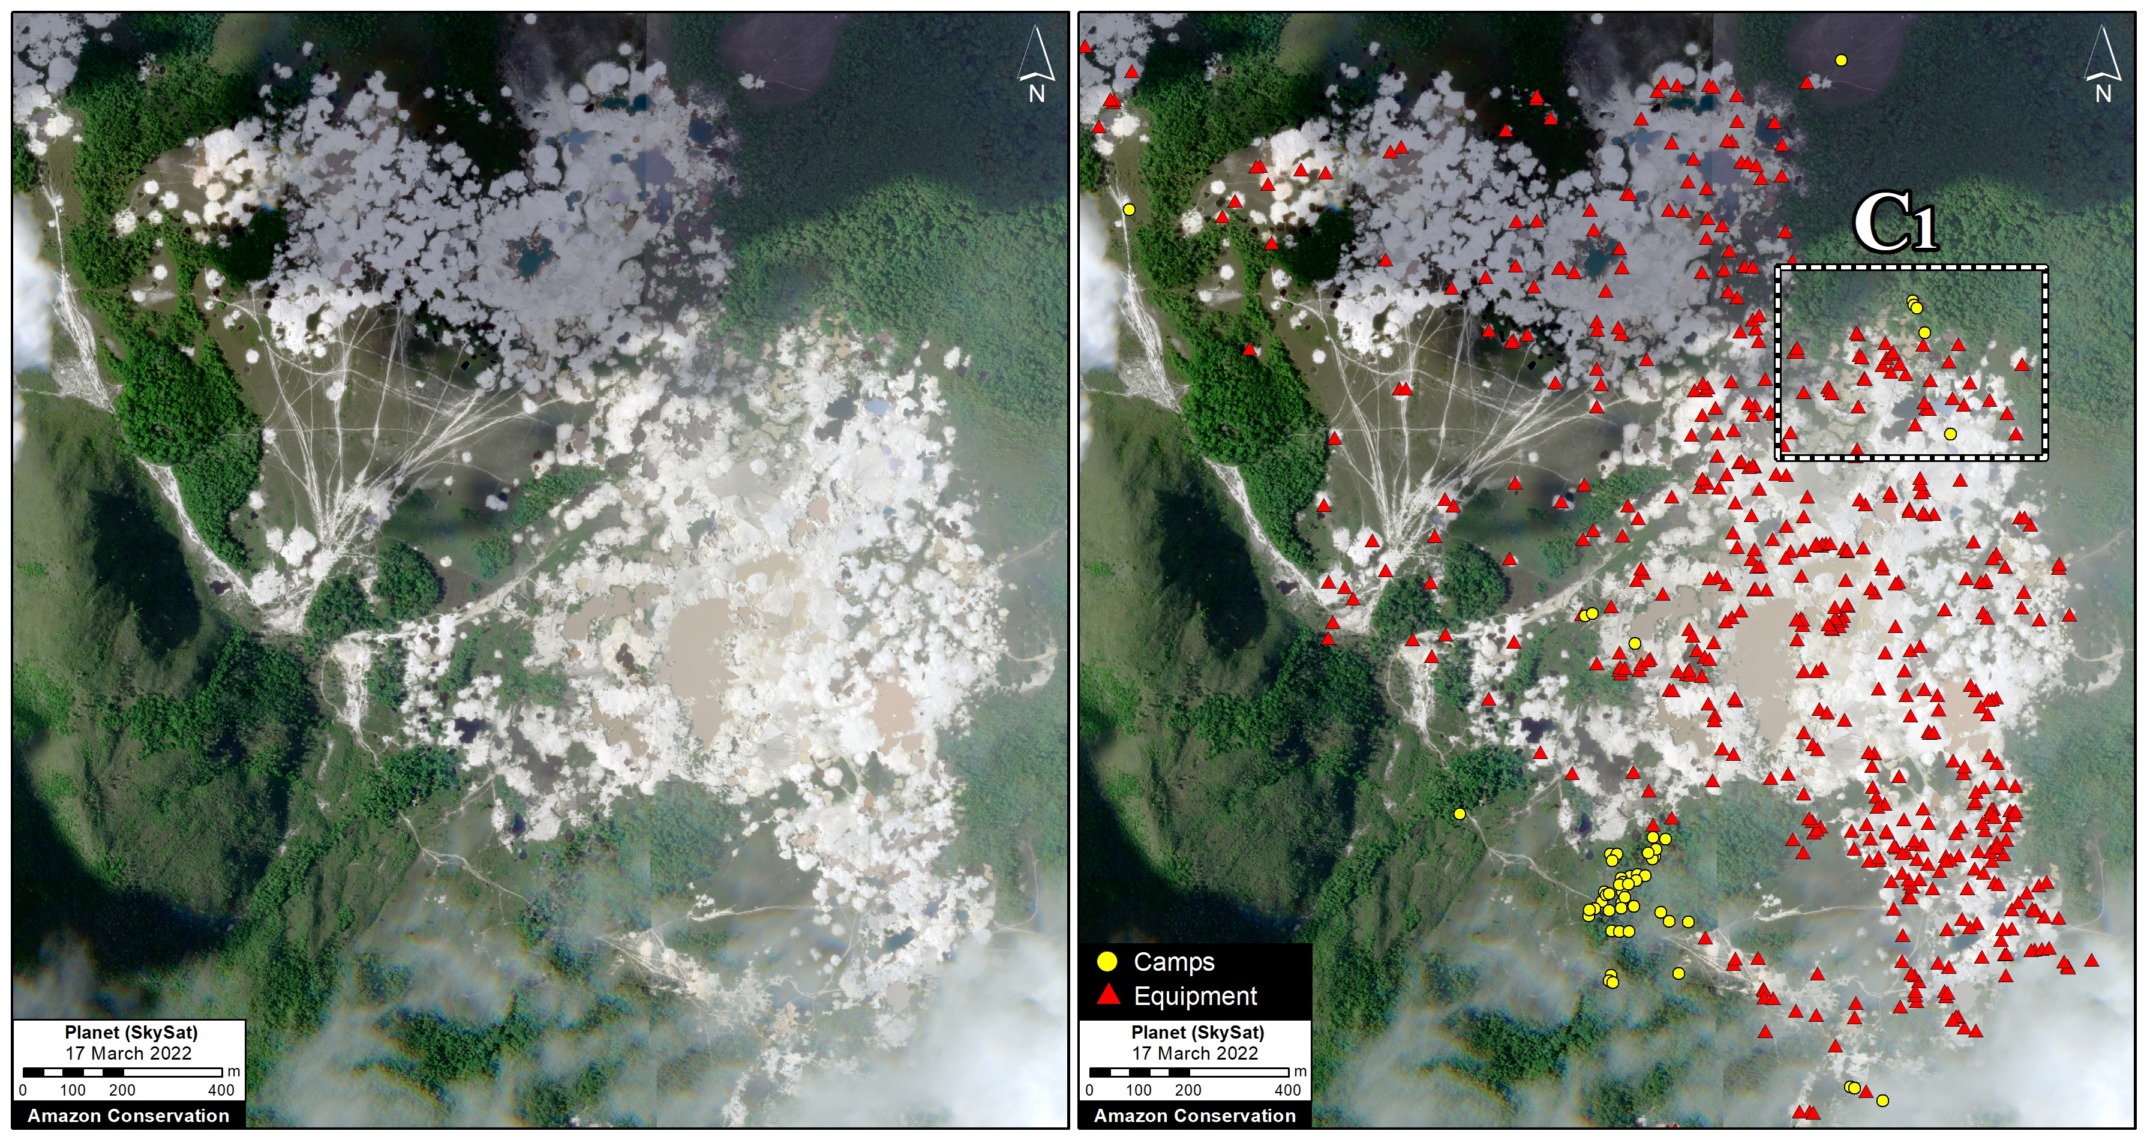
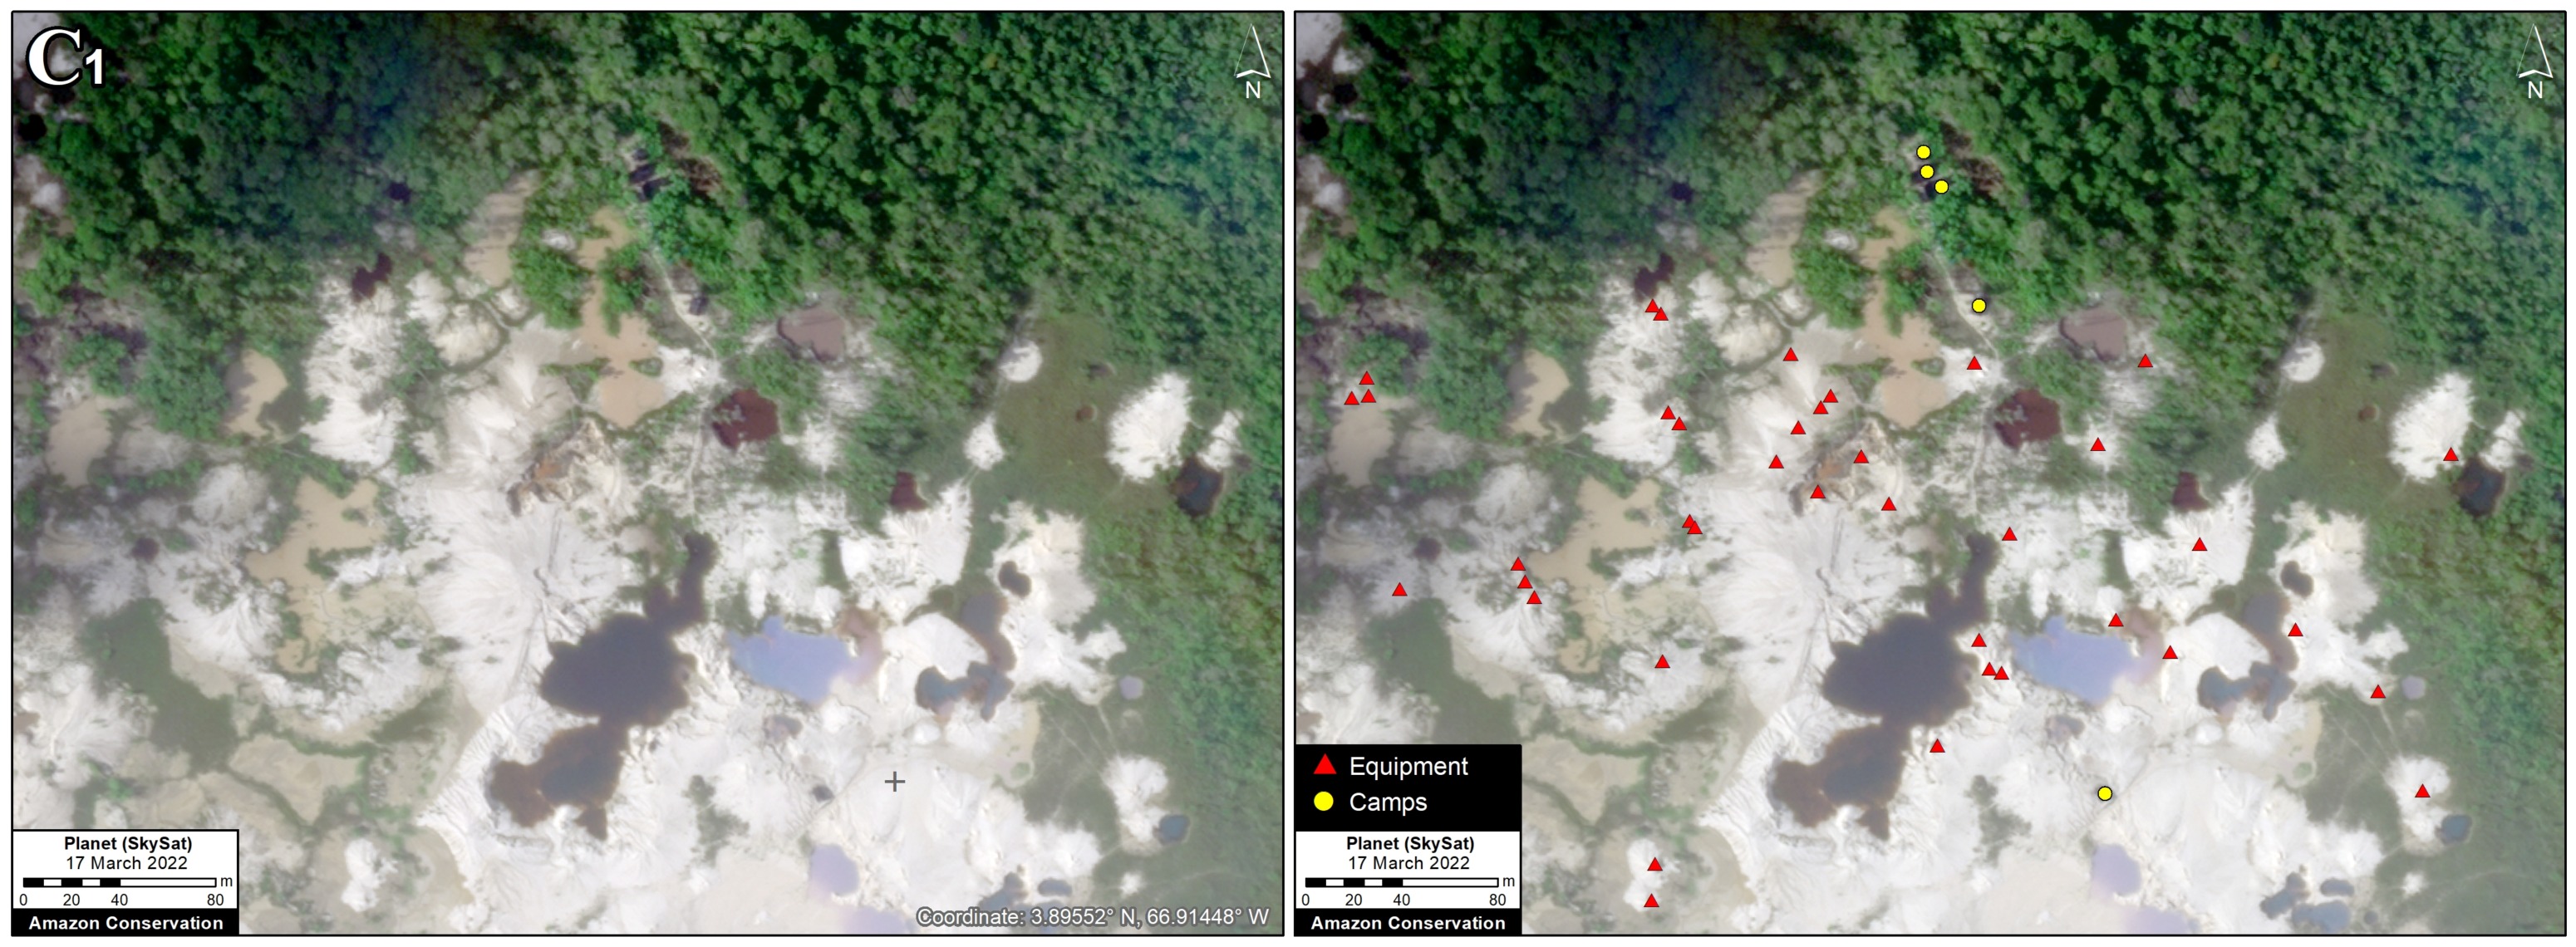
In Podocarpus National Park, located in Zamora Chinchipe province, we have documented the mining deforestation of 25 hectares since 2019 within the park, including the presence of over 200 mining camps. See MAAP #172 for more details.
*MAAP Technical Reports
MAAP #176: Expansión Alarmante de Minería en la Amazonía Ecuatoriana (Caso Punino)
https://www.maapprogram.org/2023/mineria-ecuador-punino/
MAAP #172: Minería ilegal de oro en el Parque Nacional Podocarpus, Ecuador
https://www.maapprogram.org/2023/mineria-podocarpus-ecuador/
MAAP #170: Actividad Minera en Territorio Shuar Arutam (Amazonia Ecuatoriana)
https://www.maapprogram.org/2022/mineria-shuar-arutam-ecuador/
MAAP #167: Actividad Minera en el Bosque Protector Cuenca Alta del Río Nangaritza (Ecuador)
https://www.maapprogram.org/2022/minera-nangaritza-ecuador/
MAAP #162: Dinámica de la actividad minera en la provincia de Napo (Ecuador)
https://www.maapprogram.org/2022/mineria-napo-ecuador/
MAAP #151: Minería Ilegal en la Amazonía Ecuatoriana
https://www.maapprogram.org/2022/mineria-ecuador/
Acknowledgments
This report is part of a series focused on the Ecuadorian Amazon through a strategic collaboration between the organizations Fundación EcoCiencia and Amazon Conservation, with the support of the Norwegian Agency for Development Cooperation (Norad).
![]()