MAAP #101: Deforestation Continues in Colombian Amazon (2019)

Overflight photo of recent deforestation in Chiribiquete National Park. Credit: FCDS/RFN/AAF.

A major deforestation surge continues in the northwest Colombian Amazon (MAAP #97).

In 2018, it resulted in the loss of 199,000 hectares (491,700 acres)*, making it the most concentrated deforestation hotspot in the entire western Amazon (MAAP #100).

Here, we provide a real-time update for 2019 based on early warning GLAD alerts.** The alerts indicate the loss of 56,300 hectares (139,100 acres) in the first five months of 2019 (January to May) in the Colombian Amazon.

The Base Map (see below) shows the deforestation hotspots are again concentrated in the northwest Colombian Amazon.

We focus on Chiribiquete National Park, showing satellite imagery and overflight photos for two sections of the park experiencing recent deforestation.***

We estimate the deforestation of 2,200 hectares (5,400 acres) inside the Park since its expansion in July 2018.

As described below, one of the main deforestation drivers in the region is conversion to pasture for land grabbing or cattle ranching.


Base Map. 2019 deforestation hotspots in the Colombian Amazon. Data: UMD/GLAD, RUNAP, RAISG.

Zoom 1: Western Chiribiquete (Llanos de Yari)

Zoom 1 shows the deforestation in the recently expanded western section of Chiribiquete National Park between February 2018 (left panel) and May 2019 (right panel). The white inset boxes indicate the areas of the overflight photos shown below.

We estimate the deforestation of 555 hectares (1,300 acres) in this section of the park since July 2018, the date of the expansion of Chiribiquete National Park in this area.

Zoom 1. Western Chiribiquete National Park (Llanos de Yari). Data: Planet.
Inset A1. Overflight photo over Chiribiquete National Park, courtesy of FCDS/RFN/AAF.
Inset A2. Overflight photo over Chiribiquete National Park, courtesy of FCDS/RFN/AAF.

A recent report by the Colombian government agency charged with monitoring deforestation (IDEAM 2019) characterizes the situation as follows:

“In this area, the process of colonization is accelerated, causing a growing demand for resources and new lands, which is encouraged by the reconfiguration of organized armed groups and the absence of state control at the local level. The main conversion of the forest is to pasture, destined for cattle ranching or land grabbing. This transformation is advanced by the area’s tertiary road network, which allows access to new areas of forest and burning as a method of rapid removal of coverage. This area is also used for illicit crops.”

Zoom 2: Northern Chiribiquete

Zoom 2 shows the deforestation in the recently expanded northern section of Chiribiquete National Park between February 2018 (left panel) and April 2019 (right panel). The white inset boxes indicate the areas of the overflight photos shown below.

We estimate the deforestation of 1,650 hectares (4,100 acres) in this section of the park since 2018, the date of the expansion of Chiribiquete National Park in this area.

Zoom 2. Northern Chiribiquete National Park. Data: ESA.
Inset B1. Overflight photo over Chiribiquete National Park, courtesy of FCDS/RFN/AAF.
Inset B2. Overflight photo over Chiribiquete National Park, courtesy of FCDS/RFN/AAF.
Inset B3. Overflight photo over Chiribiquete National Park, courtesy of FCDS/RFN/AAF.
Inset B4. Overflight photo over Chiribiquete National Park, courtesy of FCDS/RFN/AAF.


A recent report by the Colombian government agency charged with monitoring deforestation (IDEAM 2019) characterizes the situation as follows:

“As is common in the Amazon region, the main activity driving the transformation of forests in this area is the establishment of pastures, with the purpose of land grabbing or cattle ranching. This transformation is generally financed by external actors, whose primary motivation is speculation and income generation. The armed actors present in the area promote the development of illicit agricultural activities, as well as the expansion of informal road infrastructure, which affects forests by facilitating access.”

Notes

*Including 154,000 hectares (380,5000 acres) of primary forests. The surge started in 2016.

**GLAD alerts, produced by the University of Maryland and presented by Global Forest Watch, are based on Landsat imagery. To generate the deforestation hotspots map, we conducted a kernel density analysis on GLAD alert data from January 1 to May 31, 2019.

***Overflight was March 22, 2019, carried out by Fundación Conservación y Desarrollo, with funding from Rain Forest Norway and Andean Amazon Fund.

References

IDAEM-SMBYC (2019) BOLETÍN DE DETECCIÓN TEMPRANA DE DEFORESTACIÓN #17. Link: http://documentacion.ideam.gov.co/openbiblio/bvirtual/023856/17_BoletinAT-D.pdf

Planet Team (2017). Planet Application Program Interface: In Space for Life on Earth. San Francisco, CA. https://api.planet.com

Acknowledgments

We thank A. Rojas (FCDS) and R. Botero (FCDS) for helpful comments to this report.

MAAP #100: Western Amazon – Deforestation Hotspots 2018 (a regional perspective)

Base Map. Deforestation Hotspots in the western Amazon. Data: Hansen/UMD/Google/USGS/NASA, GFW, SERNANP, SNAP, SINAP, SERNAP, RAISG

For the 100th MAAP report, we present our first large-scale western Amazon analysis: Colombia, Peru, Ecuador, Bolivia, and western Brazil (see Base Map).

We use the new 2018 data for forest cover loss, generated by the  University of Maryland (Hansen et al 2013) and presented by Global Forest Watch.

These data indicate 2.5 million acres of forest cover loss in the western Amazon in 2018.*

We conducted an additional analysis that indicates, of this total, 1.9 million acres were primary forest.*

To identify deforestation hotspots consistently across this vast landscape, we conducted a kernel density analysis (see Methodology).

The Base Map shows the hotspots in yellow, orange and red, indicating areas with medium, high, and very high forest loss concentrations, respectively.

Next, we focus on five zones of interest (Zooms A-E) in Colombia, Brazil, Bolivia, and Peru. For all images, please click to enlarge.

*Forest Cover Loss: 5 acres per minute. Almost half (49%) occurred in Brazil, followed by Peru (20%), Colombia (20%), Bolivia (8%), and Ecuador (3%). see Annex.

**Primary Forest Loss: 3.5 acres per minute. Over half (53%) occurred in Brazil, followed by Peru (20%), Colombia (18%), Bolivia (7%), and Ecuador (2%). see Annex.

Colombia

The largest concentration of 2018 forest loss is in the northeast Colombian Amazon (494,000 acres). Out of this total, 11% (56,800 acres) occurred in national parks. National experts indicate that land grabbing has emerged as a leading direct driver of deforestation (Arenas 2018). See MAAP #97 for more information.

Zoom A shows the forest loss expanding towards western Chiribiquete National Park, including distinct deforestation in this protected area during 2018.

Zoom B shows the extensive 2018 deforestation (30,000 acres) within Tinigua National Park. A recent news report indicates that cattle ranching is one of the factors related to this deforestation.

Zoom A. Colombia-Chiribiquete. Data: Hansen/UMD/Google/USGS/NASA, SINAP, Planet, ESA
Zoom B. Colombia – Tinigua. Data: Hansen/UMD/Google/USGS/NASA, SINAP, Planet, ESA

Brazil (border with Bolivia)

Another important result is the contrast between northern Bolivia (Pando department) and adjacent side Brazil (states of Acre, Amazonas, and Rondônia). Zoom C shows several deforestation hotspots on the Brazilian side, while the Bolivian side is much more intact.

Zoom C. Brazil, Bolivia border. Data: Hansen/UMD/Google/USGS/NASA, ESA, RAISG

Bolivia

In Bolivia, the major forest loss hotspots are further south. Zoom D shows the recent deforestation (5,000 acres in 2018) due to agricultural activity associated with one of the first major Mennonite settlements in Beni department (Kopp 2015). The other Mennonite settlements are located further south.

Zoom D. Bolivia, Black River Mennonite settlement. Data: Hansen/UMD/Google/USGS/NASA, SERNAP, Planet

Peru

The Hansen data indicates over 200,000 acres of forest loss during 2018 in the Peruvian Amazon. One of the most important deforestation drivers, especially in southern Peru, is gold mining. We estimate 23,000 acres of gold mining deforestation during 2018 in the southern Peruvian Amazon (see MAAP #96).

Zoom E shows the most emblematic case of gold mining deforestation: the area known as La Pampa.

It is important to emphasize, however, that in February 2019 the Peruvian government launched “Operation Mercury 2019” (Operación Mercurio 2019), a multi-sectoral and comprehensive mega-operation aimed at eradicating illegal mining and associated crime in La Pampa, as well as promote development in the region.

Zoom D. Peru – La Pampa. Data: Hansen/UMD/Google/USGS/NASA, SERNAP, Planet

Annex

Annex. Forest cover and primary forest loss in the western Amazon.  Data: Hansen/UMD/Google/USGS/NASA, Global Forest Watch.

Methods

The 2018 forest loss data presented in this report were generated by the Global Land Analysis and Discovery (GLAD) laboratory at the University of Maryland (Hansen et al 2013) and presented by Global Forest Watch. Our study area is strictly what is presented in the Base Map: the areas within the Amazonian biogeographic boundary of the western Amazon.

Specifically, for our estimate of forest cover loss, we multiplied the annual “forest cover loss” data by the density percentage of the “tree cover” from the year 2000 (values >30%).

For our estimate of primary forest loss, we intersected the forest cover loss data with the additional dataset “primary humid tropical forests” as of 2001 (Turubanova et al 2018). For more details on this part of the methodology, see the Technical Blog from Global Forest Watch (Goldman and Weisse 2019).

All data were processed under the geographical coordinate system WGS 1984. To calculate the areas in metric units the UTM (Universal Transversal Mercator) projection was used: Peru and Ecuador 18 South, Colombia 18 North, Western Brazil 19 South and Bolivia 20 South.

Lastly, to identify the deforestation hotspots, we conducted a kernel density estimate. This type of analysis calculates the magnitude per unit area of a particular phenomenon, in this case forest cover loss. We conducted this analysis using the Kernel Density tool from Spatial Analyst Tool Box of ArcGIS. We used the following parameters:

Search Radius: 15000 layer units (meters)
Kernel Density Function: Quartic kernel function
Cell Size in the map: 200 x 200 meters (4 hectares)
Everything else was left to the default setting.

For the Base Map, we used the following concentration percentages: Medium: 10%-20%; High: 21%-35%; Very High: >35%.

References

Arenas M (2018) Acaparamiento de tierras: la herencia que recibe el nuevo gobierno de Colombia. Mongabay, 2 AGOSTO 2018. https://es.mongabay.com/2018/08/acaparamiento-de-tierras-colombia-estrategias-gobierno/

Goldman L, Weisse M (2019) Technical Blog: Global Forest Watch’s 2018 Data Update Explained. https://blog.globalforestwatch.org/data-and-research/blog-tecnico-explicacion-de-la-actualizacion-de-datos-de-2018-de-global-forest-watch

Hansen, M. C., P. V. Potapov, R. Moore, M. Hancher, S. A. Turubanova, A. Tyukavina, D. Thau, S. V. Stehman, S. J. Goetz, T. R. Loveland, A. Kommareddy, A. Egorov, L. Chini, C. O. Justice, and J. R. G. Townshend. 2013. “High-Resolution Global Maps of 21st-Century Forest Cover Change.” Science 342 (15 November): 850–53. Data available on-line from: http://earthenginepartners.appspot.com/science-2013-global-forest.

Kopp Ad (2015) Las colonias menonitas en Bolivia. Tierra. http://www.ftierra.org/index.php/publicacion/libro/147-las-colonias-menonitas-en-bolivia

Planet Team (2017). Planet Application Program Interface: In Space for Life on Earth. San Francisco, CA. https://api.planet.com

Turubanova S., Potapov P., Tyukavina, A., and Hansen M. (2018) Ongoing primary forest loss in Brazil, Democratic Republic of the Congo, and Indonesia. Environmental Research Letters  https://doi.org/10.1088/1748-9326/aacd1c 

Acknowledgements

We thank M. Terán (ACEAA), M. Weisse (GFW/WRI), A. Thieme (UMD), R. Catpo (ACCA) and A. Cóndor (ACCA) for helpful comments to this report.

Citation

Finer M, Mamani N (2019) Western Amazon – Deforestation Hotspots 2018 (a regional perspective). MAAP: 100.

MAAP #99: Detecting Illegal Logging in the Peruvian Amazon

New logging road in the Peruvian Amazon. Data: Planet.

In the Peruvian Amazon, most of the logging is selective (not clearcutting), with the targets being higher-value species. Thus, illegal logging is difficult to detect with satellite imagery.

In MAAP #85, however, we presented the potential of satellite imagery in identifying logging roads, which are one of the main indicators of logging activity in the remote Amazon.

Here, we go a step further and show how to combine logging road data with additional land use data, such as forestry licenses and concessions, to identify possible illegal logging.

This analysis, based in the Peruvian Amazon, has two parts. First, we identify the construction of new logging roads in 2018, updating our previous dataset from 2015-17 (see Base Map).

Second, we analyze these new logging roads in relation to addition spatial information now available on government web portals,* in order to identify possible illegality.

*We analyzed information on several websites now available from national and regional authorities, such as SISFOR (OSINFOR), GEOSERFOR (SERFOR), and IDERs (Spatial Data Infrastructure of Regional governments). These new resources provide valuable information, however may have limitations in ability to constantly update information on the status of concessions and forest permits.


Base Map. Logging roads. Data: MAAP, SERNANP

Base Map

The Base Map illustrates the precise location of logging roads built in the Peruvian Amazon over the last four years.

Previously (MAAP #85), we estimated the construction of 2,200 kilometers of logging roads during 2015-17 (yellow).

Here, we estimate the construction of an additional 1,100 km in 2018 (pink).

Thus, in total, we have documented the construction of 3,300 km of logging roads over the last four years (2015-18).

Note that these logging roads are concentrated mainly in the regions of Ucayali, Madre de Dios (northeast), and Loreto (south).


Cases of Possible Illegal Logging

A. Logging roads in non-forestry areas

Zoom A shows the construction of a logging road past the border of a forestry permit, into a non-forestry area. In this case, the road extends close (200 meters) to the border of a protected area (Ashaninka Communal Reserve). It is important to point out that this type of analysis requires frequently updated information from the entities that grant forest permits, such as regional governments.  

Zoom A. Data: Planet, MAAP, SERNANP, OSINFOR, IBC


B. Logging roads in canceled concessions

Zoom B shows the construction of logging roads within logging concessions classified as “Caducado,” or cancelled (no longer active). This type of analysis also requires frequently updated information on the status of forestry concessionaries.

Zoom B. Data: Planet, MAAP, OSINFOR, GOREU

C. Logging Roads in Brazil nut concessions

Zoom C shows the construction of logging roads within a Brazil nut forestry concession. While some managed timber extraction is allowed in Brazil nut concessions, the extensive construction of two logging roads, along with the irregular logging area boundaries, drew attention. A detailed investigation by the Peruvian Forestry Service (SERFOR) and environmental prosecutor (FEMA) revealed the illegality of this logging activity (see this article from Mongabay for more information).

Zoom C. Data: Planet, MAAP, OSINFOR


D. Logging roads in protected areas

Zoom D shows part of a logging road entering a protected area (El Sira Communal Reserve). It appears that this section of the reserve overlaps with a forestry permit obtained after the creation of the protected area. It is worth emphasizing that according to Peruvian law, timber extraction is not permitted within protected areas such as El Sira.

Zoom D. Data: Planet, MAAP, SERNANP, OSINFOR, GOREU, IBC

SERNANP (the Peruvian National Service of Natural Protected Areas) has communicated these facts to the region of Ucayali’s Provincial Prosecutor’s Office Specialized in Environment (Atalaya headquarters). Also, SERNANP is managing the process of nullifying the permit, given that it doesn’t have the technical opinion of SERNANP, a requirement as stated by the current regulation.

References

Planet Team (2017). Planet Application Program Interface: In Space for Life on Earth. San Francisco, CA. https://api.planet.com

Acknowledgments

We thank OSINFOR, SERNANP Alfredo Cóndor (ACCA) and Lorena Durand (ACCA) for helpful comments to this report.

Citation

Villa L, Finer M (2019) Detecting Illegal Logging in the Peruvian Amazon. MAAP: 99.

MAAP #98: Deforestation Hotspots in the Peruvian Amazon, 2018

Base Map. 2018 Deforestación Hotspots. Data: PNCB/MINAM, SERNANP

Thanks to early warning forest loss alerts,* we are able to make an initial assessment of the 2018 deforestation hotspots in the Peruvian Amazon.

The Base Map highlights the medium (yellow) to high (red) hotspots. In this context, hotspots are the areas with the highest density of forest loss alerts.

Note that the most intense hotspots are concentrated in the southern Peruvian Amazon, particularly the Madre de Dios region. In previous years, intense hotspots were also concentrated in the central Peruvian Amazon.

Next, we focus on 5 hotspots of interest (Zooms A-E).

A. La Pampa (Madre de Dios)
B. Bahuaja Sonene National Park (surroundings) (Madre de Dios, Puno)
C. Iberia (Madre de Dios)
D. Organized Deforestation (Ucayali, Loreto)
E. Central Amazon (Ucayali, Huánuco)

*The data presented in this report is an estimate based on early warning data generated by the National Program of Forest Conservation for the Mitigation of Climate Change of the Ministry of the Environment of Peru (PNCB/MINAM). We also analyzed University of Maryland GLAD alerts, obtained from Global Forest Watch.


A. La Pampa (Madre de Dios)

Zoom A shows two important cases in the southern Peruvian Amazon (Madre de Dios region). First, gold mining deforestation south of the Interoceanic Highway in the area known as La Pampa. It is important to emphasize that the Peruvian government just started “Operation Mercury 2019” (Operación Mercurio 2019), a multi-sectoral and comprehensive mega-operation aimed at eradicating illegal mining and associated crime in La Pampa, as well as promote development in the region. Second, deforestation due to agricultural activity north of the highway. As in all the zoom maps below, pink indicates forest loss in 2018.

Zoom A. La Pampa. Data: PNCB/MINAM, SERNANP, ACCA, ESA

B. Bahuaja Sonene National Park (surroundings) (Madre de Dios, Puno)

Zoom B also shows two important cases in the southern Peruvian Amazon (regions of Madre de Dios and Puno), surrounding Bahuaja Sonone National Park. First, to the north of the park, is gold mining deforestation along the upper Malinowski River. The Peruvian protected areas agency (SERNANP) points out that they have limited the deforestation south of the river (direction towards the national park) due to their intensified patrols on that side. Second, to the south of the park, is non-mining (partly agricultural) deforestation.

Zoom B. Bahuaja Sonene (surroundings). Data: PNCB/MINAM, SERNANP, Planet

C. Iberia (Madre de Dios)

Zoom C takes us to the other side of Madre de Dios, around the town of Iberia, near the border with Brazil and Bolivia. This area is experiencing extensive deforestation due to agricultural activity. There most intense deforestation is just of Iberia, where a religious community of farmers (Arca Pacahuara) is reportedly establishing large corn plantations (References 1-2). Much of the 2018 (and 2017) deforestation is occurring within forest concessions, where agriculture is not permitted.

Zoom C. Iberia. Data: PNCB/MINAM, SERNANP, Planet

D. Organized Deforestation (Ucayali, Loreto)

In 2018 we documented two similar cases in the central Peruvian Amazon. Both have similar forms of organized deforestation, characterized by what seems to be agricultural plots arranged along new access roads. Zoom D shows the Masisea case (left panel, zoom D1) and the Sarayaku case (right panel, zoom D2). See MAAP #92 for more information.

Zoom D. Organized deforestation. Data: PNCB/MINAM, SERNANP, ESA

E. Central Amazon (Ucayali, Huánuco)

As in previous years, there was extensive deforestation in the central Peruvian Amazon (Ucayali and Huánuco regions). Zoom E shows an example: small and medium-scale deforestation surrounding a pair of large-scale oil palm plantations. Some of the recent deforestation is occurring within “Permanent Production Forests,” forestry-zoned areas where agriculture is not permitted. This area also corresponds to the proposed territorial title of the indigenous Shipibo community of Santa Clara de Uchunya (see here for more information).

Zoom E. Central Amazon. Data: PNCB/MINAM, SERNANP, ESA

Methodology

We conducted this analysis using the Kernel Density tool from Spatial Analyst Tool Box of ArcGIS, using the following parameters:

Search Radius: 15000 layer units (meters)
Kernel Density Function: Quartic kernel function
Cell Size in the map: 200 x 200 meters (4 hectares)
Everything else was left to the default setting.

The data presented in this report is an estimate based on early warning data generated by the National Program of Forest Conservation for the Mitigation of Climate Change of the Ministry of the Environment of Peru (PNCB/MINAM). We also analyzed University of Maryland GLAD alerts, obtained from Global Forest Watch.

References

1. CIFOR 2016

2. GOREMAD 2016

Planet Team (2017). Planet Application Program Interface: In Space for Life on Earth. San Francisco, CA. https://api.planet.com

Citation

Finer M, Mamani N (2018) Deforestation Hotspots in the Peruvian Amazon, 2018. MAAP: 98.

MAAP #97: Deforestation Surge in the Colombian Amazon, 2018 update

Deforestation trends in the Colombian Amazon. Data: UMD/GLAD, Hansen/UMD/Google/USGS/NASA, RAISG


The Colombian Amazon is currently experiencing a deforestation surge (see graph).

The surge started three years ago (2016) and peaked in 2017 with the highest annual deforestation on record (214,744 hectares).*

Deforestation remains high in 2018: 156,722 hectares (based on early warning alert data).* If this estimate is confirmed, it would be the second highest on record (behind just 2017).

National experts indicate that land grabbing (acaparamiento de tierras) is an increasingly dominant direct driver of deforestation.

*Data from the University of Maryland. Annual data from Hansen et al (2013) [citation below] and 2018 data from GLAD alerts.

MAAP Colombia is a collaboration between Amazon Conservation and Amazon Conservation Team., funded by the MacArthur Foundation.


We also present a Base Map that shows the 2018 deforestation hotspots. Note that the deforestation is concentrated in three departments located in the transition area between the Amazon and Andes: Guaviare, Caqueta, and Meta.

We highlight the location of three critical areas that are examined in greater detail below: 1) Llanos de Yari, 2) Chiribiquete- La Macarena, and 3) Tinigua National Park.

For the Base Map and Zooms below, please click on the image to enlarge or download.

Base Map. Deforestation hotspots in the Colombian Amazon. Click to enlarge. Data: UMD/GLAD, Hansen/UMD/Google/USGS/NASA, PNN, SIAC, RAISG

Zoom 1: Llanos de Yari

Zoom 1 shows deforestation expanding towards western Chiribiquete National ParkIn fact, in 2017-18 (purple and pink on map), deforestation has occurred well within the park. 

Zoom 1. Llanos de Yari. Click to enlarge. Data: DigitalGlobe, UMD/GLAD, Hansen/UMD/Google/USGS/NASA, PNN, SIAC, RAISG

Zoom 2: Chiribiquete – La Macarena

As we first reported in MAAP #86, the area between Chiribiquete and La Macarena National Parks is currently experiencing one of the most intense deforestation surges. Zoom 2 shows the most recent deforestation (indicated in red and pink) is entering the newly expanded section of Chiribiquete National Park. 

Zoom 2. Chiribiquete – La Macarena. Click to enlarge. Data: Planet, UMD/GLAD, Hansen/UMD/Google/USGS/NASA, PNN, SIAC, RAISG.

Zoom 3: Tinigua National Park

Zoom 3 shows how 2018 has seen a surge of deforestation deep within Tinigua National Park (see pink). 

Zoom 3. Tinigua National Park. Click to enlarge. Data: Planet, UMD/GLAD, Hansen/UMD/Google/USGS/NASA, PNN, SIAC, RAISG

References

Planet Team (2017). Planet Application Program Interface: In Space for Life on Earth. San Francisco, CA. https://api.planet.com
Hansen, M. C., P. V. Potapov, R. Moore, M. Hancher, S. A. Turubanova, A. Tyukavina, D. Thau, S. V. Stehman, S. J. Goetz, T. R. Loveland, A. Kommareddy, A. Egorov, L. Chini, C. O. Justice, and J. R. G. Townshend. 2013. “High-Resolution Global Maps of 21st-Century Forest Cover Change.” Science 342 (15 November): 850–53. Data available on-line from:http://earthenginepartners.appspot.com/science-2013-global-forest.

Citation

Hettler B, Thieme A, Finer M (2018) Deforestation Surge in the Colombian Amazon: 2018 update. MAAP: #96.

MAAP #96: Gold Mining Deforestation at Record High Levels in Southern Peruvian Amazon

Gold mining deforestation has been at record high levels in both 2017 and 2018 in the southern Peruvian Amazon.

Based on an analysis of nearly 500 high-resolution satellite images (from Planet and DigitalGlobe), we estimate the deforestation of 18,440 hectares across southern Peru during these last two years. That is equivalent to 45,560 acres (or 34,400 American football fields) in just two years.

The Base Map highlights this recent deforestation, with 2017 in red and 2018 in pink. The Reference Map in Annex 1 shows our full study area.

Base Map. Gold mining deforestation in southern Peruvian Amazon. Data: USGS/NASA, MAAP, SERNANP.

2017 had the highest gold mining deforestation on record at the time: 9,160 hectares (22,635 acres). According to recent research led by CINCIA (Centro de Innovación Científica Amazónica), this was the highest annual total on record dating back to 1985*.

In 2018, we found the gold mining deforestation was even higher: 9,280 hectares (22,930 acres).

Thus, combined, 2017-18 had the highest two-year deforestation total on record: 18,440 hectares (45,565 acres).

Note the location of Zooms (A-C) shown in greater detail below. These zooms represent three of the most threatened areas: A) La Pampa, B) Upper Malinowski, and C) Camanti.

Click (or right click) to enlarge (or download) images.

*CINCIA reports 9,860 hectares of gold mining deforestation in 2017 (CINCIA 2018, Caballero Espejo et al 2018), an estimate even higher than ours.

Zoom A: La Pampa

Image A shows the gold mining deforestation of 1,685 hectares (4,164 acres) between 2017 (left panel) and 2018 (right panel) in an area known as La Pampa (Madre de Dios region). Red indicates the major deforestation fronts.

Image A. La Pampa. Data: Planet, MAAP

As seen in the Land Use Map below (Annex 2), most of the recent mining deforestation in La Pampa is clearly illegal, concentrated in reforestation concessions and the buffer zone of Tambopata National Reserve.

According to the web portal GEOCATMIN (Geological Information System and Mining Register), developed by INGEMMET (Geological Mining and Metallurgical Institute of Peru), all titled mining concessions in the area are currently “without mining activity.” None are in authorized Exploration or Exploitation phase. Most of the mining activity is outside these concessions and in areas not authorized for mining.

Zoom B: Upper Malinowski

Image B shows the gold mining deforestation of 760 hectares (1,878 acres) between 2017 (left panel) and 2018 (right panel) along the upper stretches of the Malinowski River in the Madre de Dios region. Red indicates the major deforestation fronts.

Image B. Upper Malinowski. Data: Planet, MAAP.

As seen in the Land Use Map below (Annex 2), the recent gold mining deforestation along the Upper Malinowski is advancing in the Kotsimba Native Community and within the buffer zone of Bahuaja Sonene National Park.

According to GEOCATMIN, all titled mining concessions in the area are currently “without mining activity.” None are in authorized Exploration or Exploitation phase. Most of the mining activity is outside these concessions and in areas not authorized for mining.

Zoom C: Camanti

Image 4 shows the gold mining deforestation of 335 hectares (828 acres) between 2016 (left panel) and 2018 (right panel) in the Camanti area of the Cusco region. Red indicates the major deforestation fronts. Note the increasing proximity of the mining to Amarakaeri Communal Reserve.

Image C. Camanti. Data: Planet, MAAP.

As seen in the Land Use Map below (Annex 2), the recent gold mining in the Camanti area is advancing in mining concessions that are “in process” of titling. According to GEOCATMIN, there are no titled concessions in the area that are in Exploration or Exploitation phase.

Annex 1: Reference Map

Annex 1 features a Reference Map of our full study area. The background is white to better indicate the mining deforestation areas. It also serves as a reference map with additional labels.

Reference Map. Gold mining deforestation in southern Peruvian Amazon. Data: MAAP, SERNANP

Annex 2: Land Use Map

Annex 2 features a Land Use Map with detailed data on mining concessions and other important land designations. The mining concession data comes from the web portal GEOCATMIN (Geological Information System and Mining Register), developed by INGEMMET (Geological Mining and Metallurgical Institute of Peru). We downloaded the data on January 2, 2019.

Land use Map. Data: INGEMMET, IBC, MINAGRI, SERNANP, Planet, UMD/GLAD, MINAM/PNCB

Methodology

We analyzed high-resolution satellite imagery (DigitalGlobe and Planet) for both 2017 and 2018 and digitized all new gold mining deforestation. Given the widespread mining across a large area, we also used automated forest loss alerts based on medium resolution Landsat imagery (PNCB/MINAM) to guide our analysis.

References

Centro de Innovación Científica Amazónica (CINCIA) (2018) Tres décadas de deforestación por minería aurífera en la Amazonía suroriental peruana. Resumen de Investigación No. 1.

Caballero Espejo et al. (2018) Deforestation and Forest Degradation Due to Gold Mining in the Peruvian Amazon: A 34-Year Perspective.  Remote Sens. 2018, 10 (12), 1903; https://doi.org/10.3390/rs10121903

Asner GP and Tupayachi R (2016) Environ. Res. Lett. 12 094004.

Planet Team (2017). Planet Application Program Interface: In Space for Life on Earth. San Francisco, CA. https://api.planet.com

Acknowledgements

We thank the following colleagues for helpful comments: Miles Silman (Wake Forest Univ), Sidney Novoa (ACCA), Ronald Catpo (ACCA), Efrain Samochuallpa (ACCA), Daniela Pogliani (ACCA), Alfredo Cóndor (ACCA), and Lorena Durand (ACCA).

Citation

Finer M, Mamani N (2018) Gold Mining Deforestation at Record High Levels in Southern Peruvian Amazon. MAAP: 96.

MAAP Synthesis #3: Deforestation in the Andean Amazon (Trends, Hotspots, Drivers)

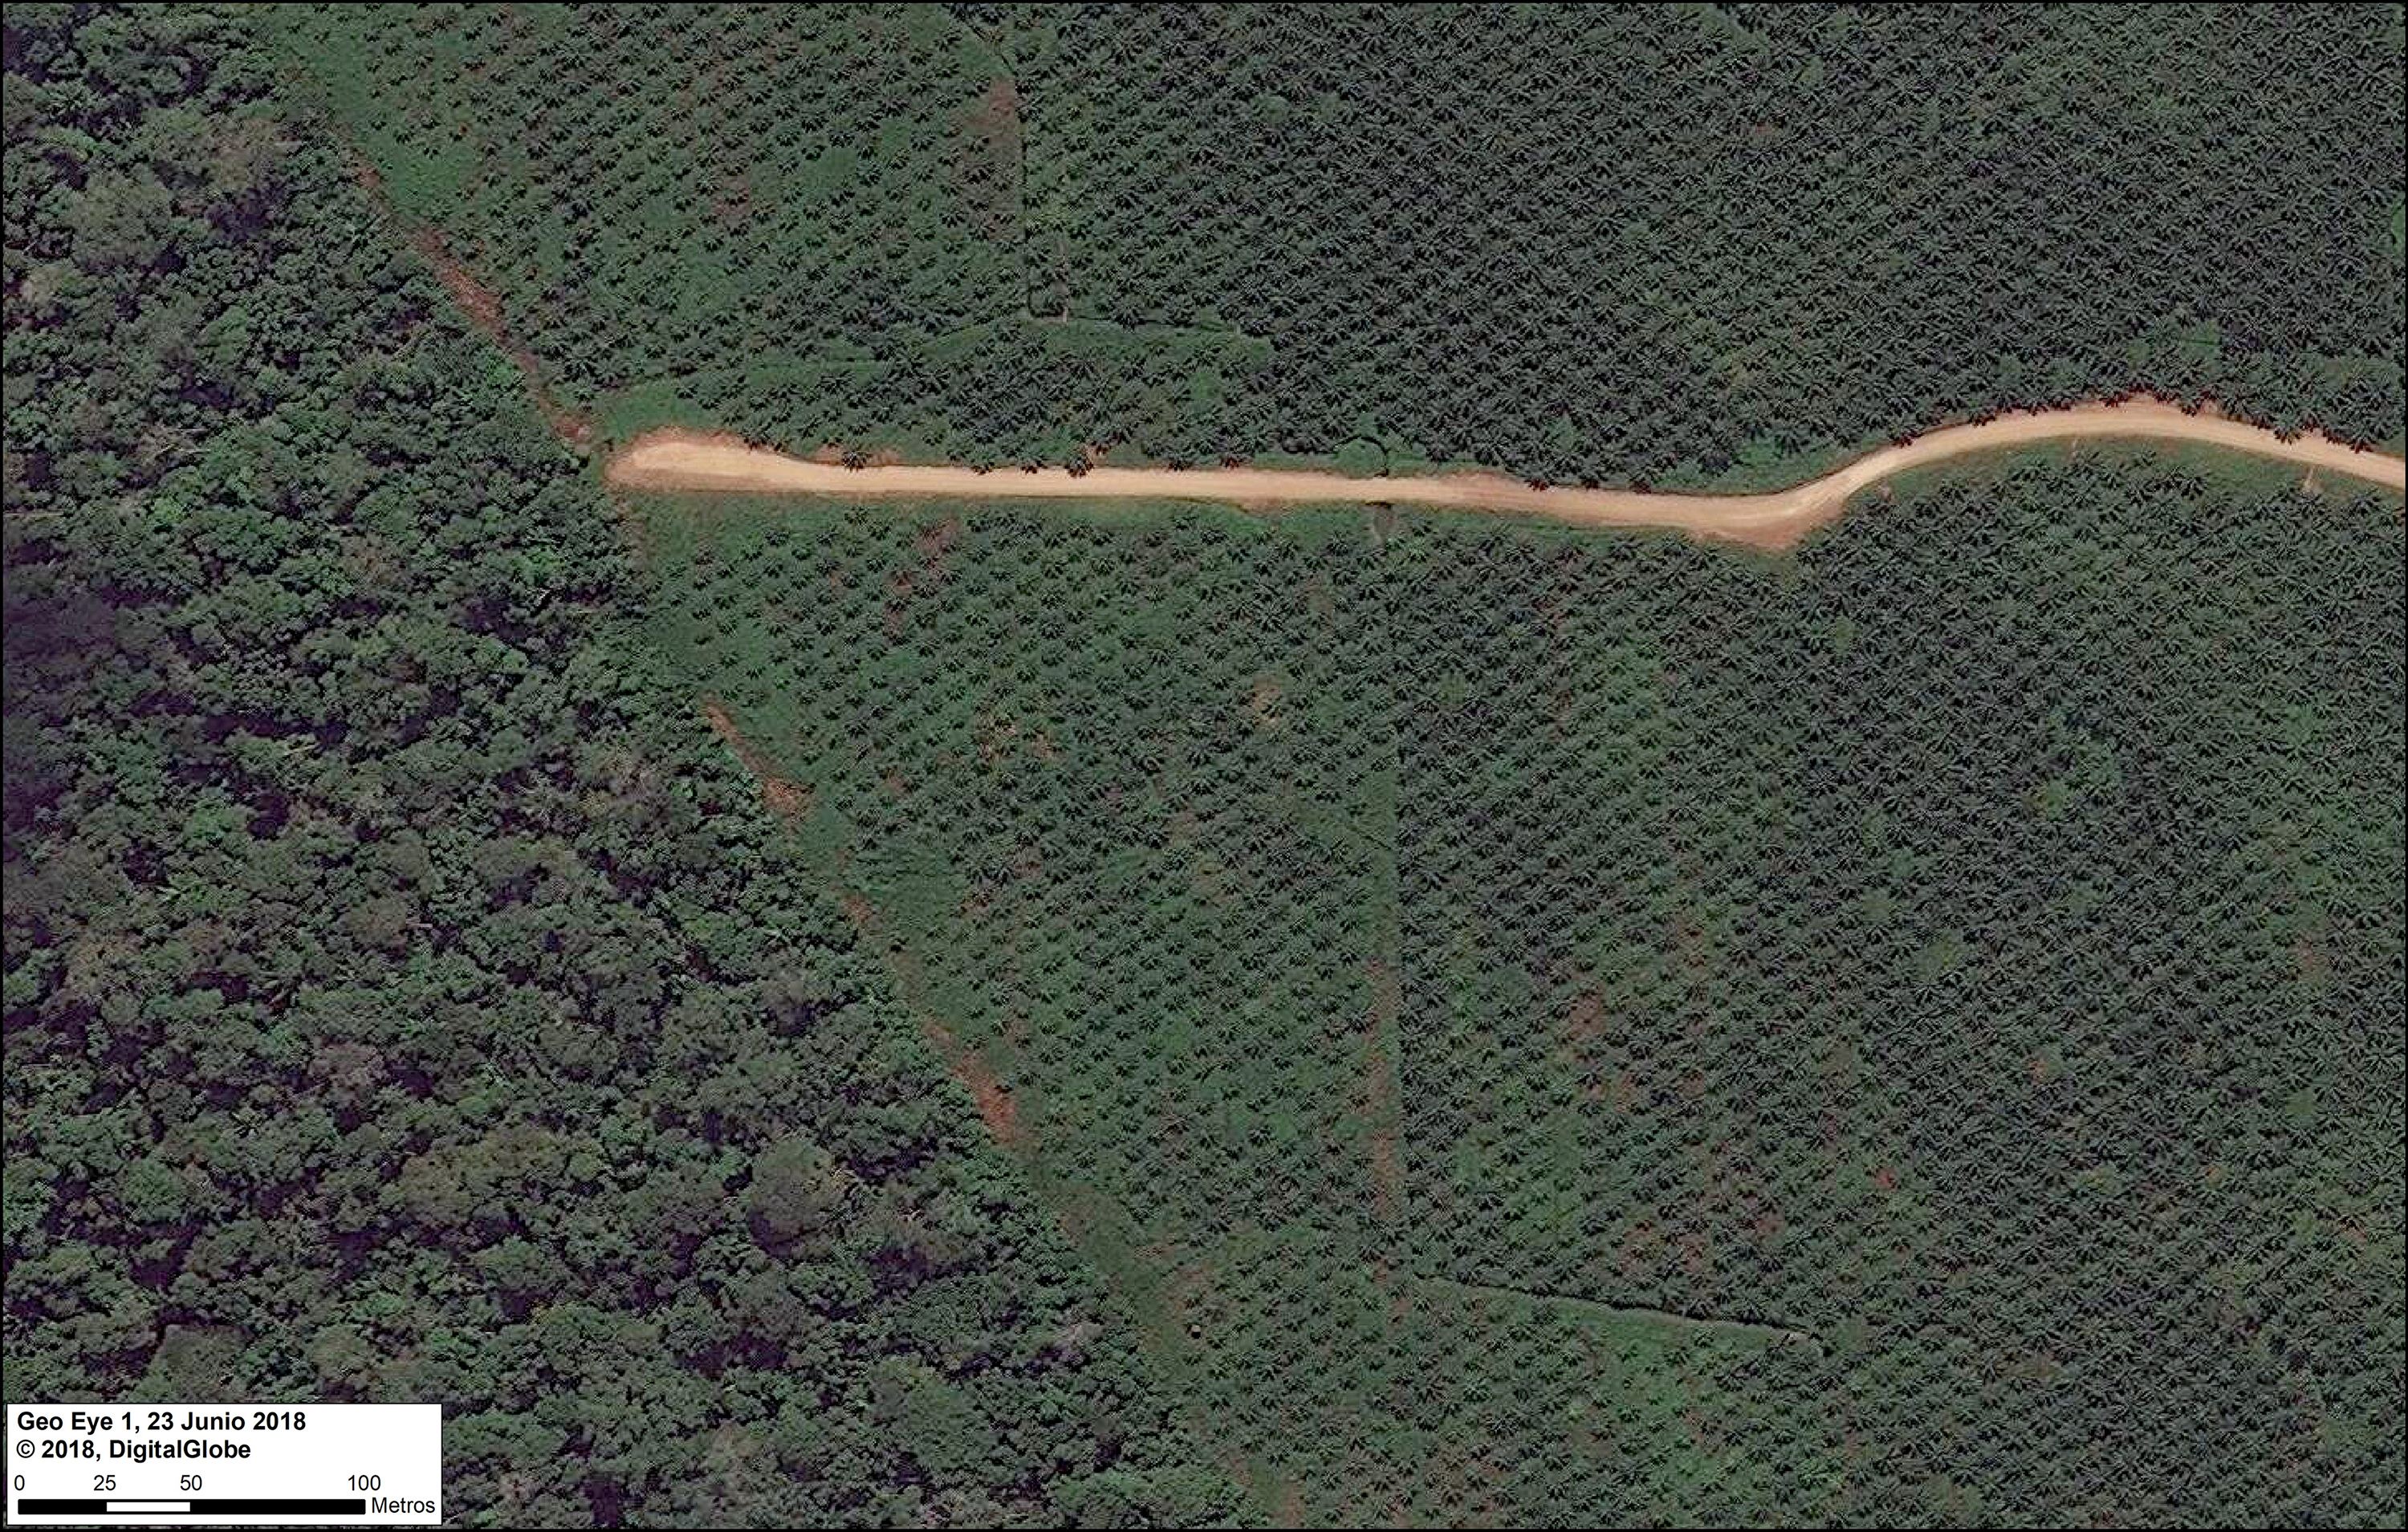
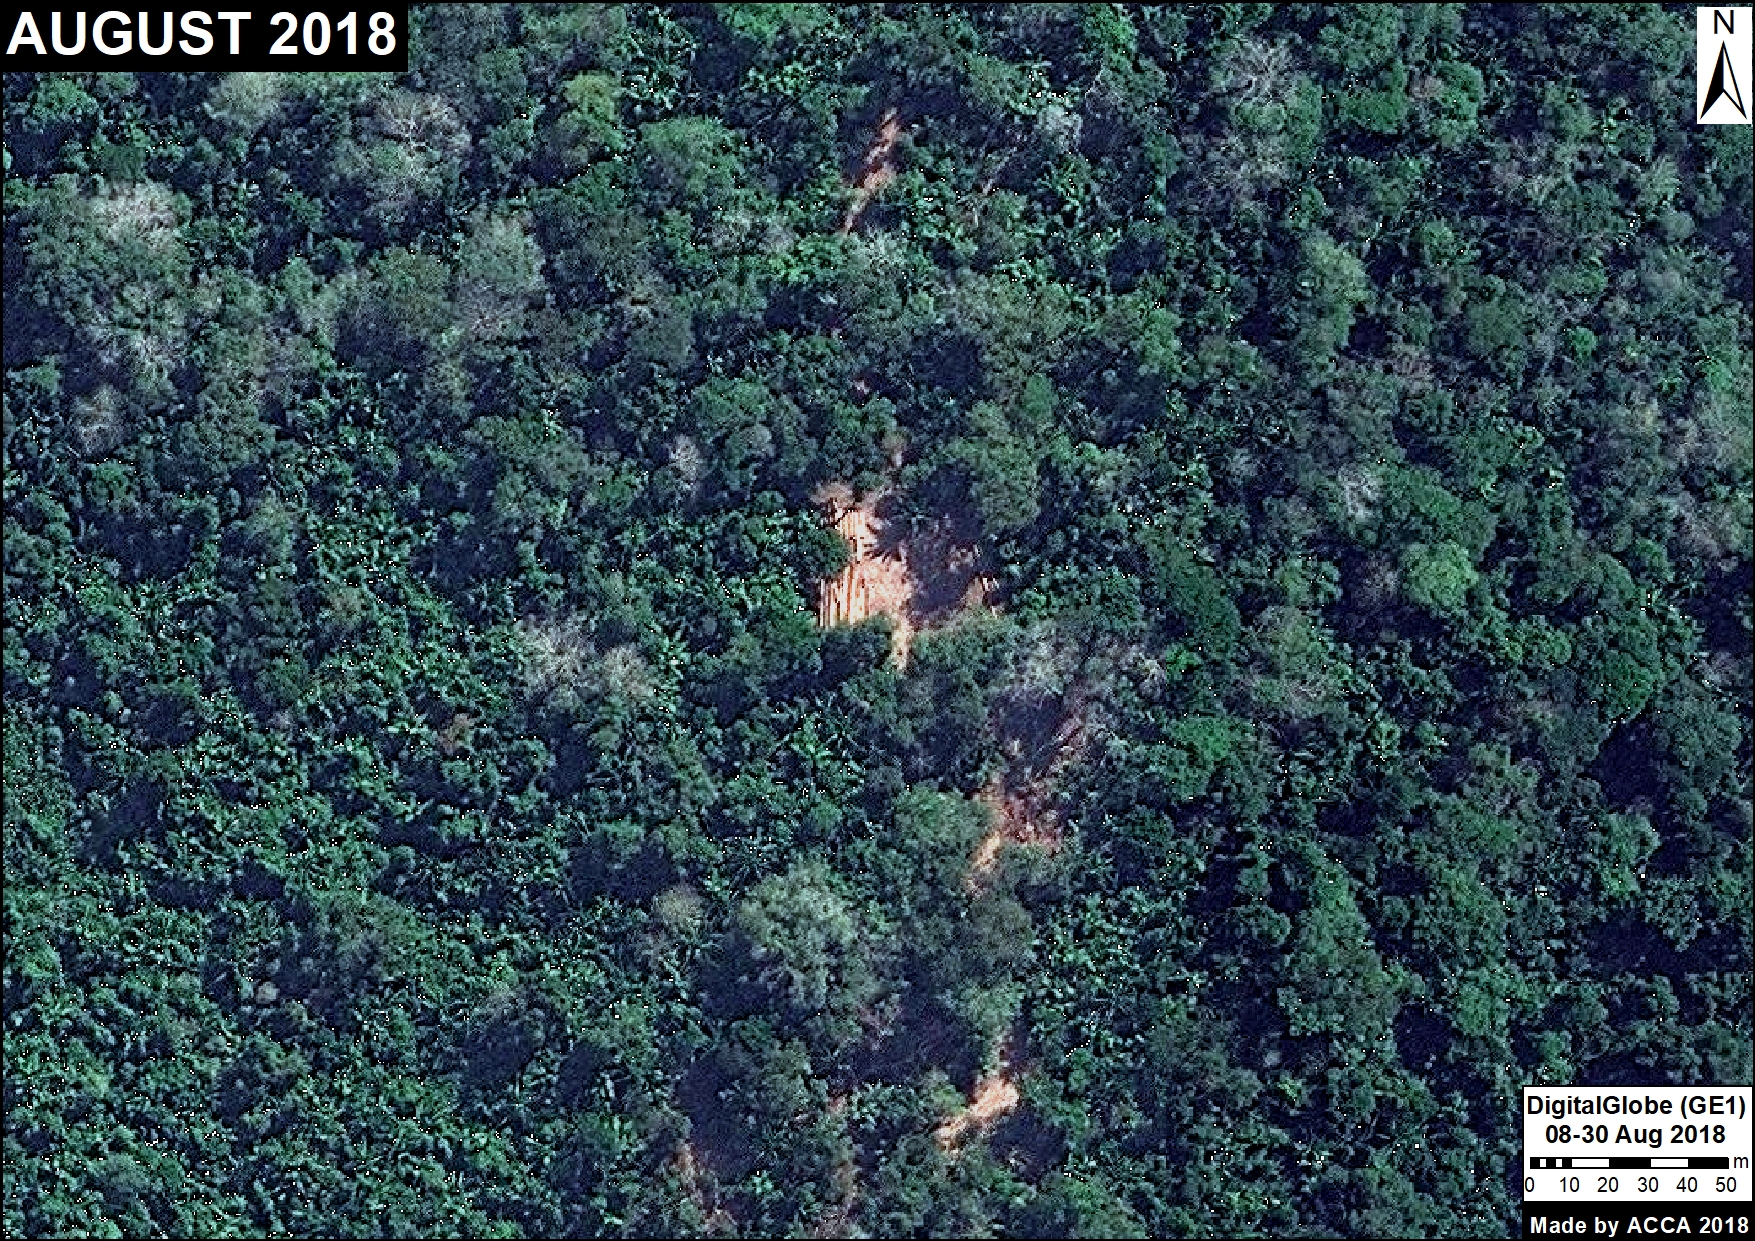
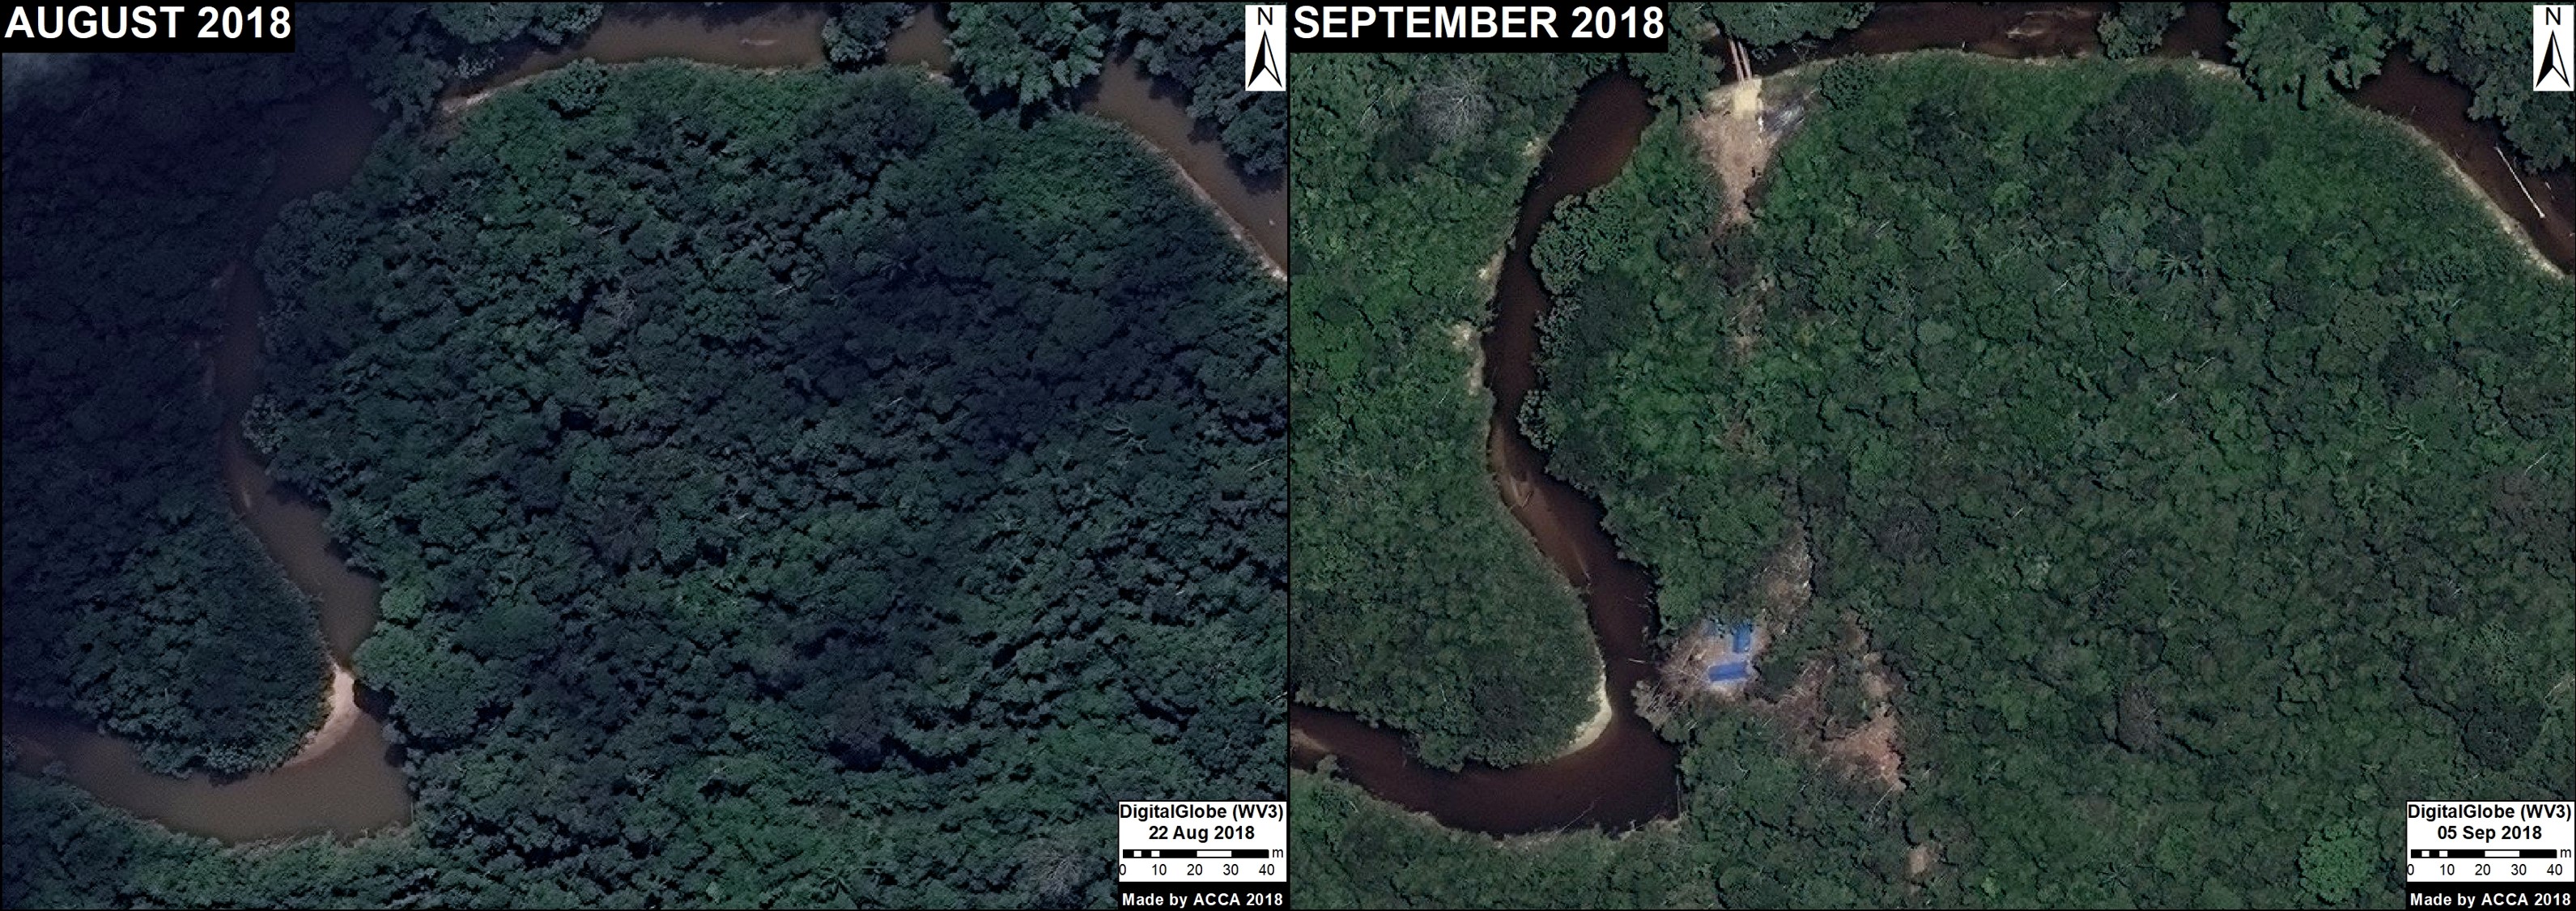
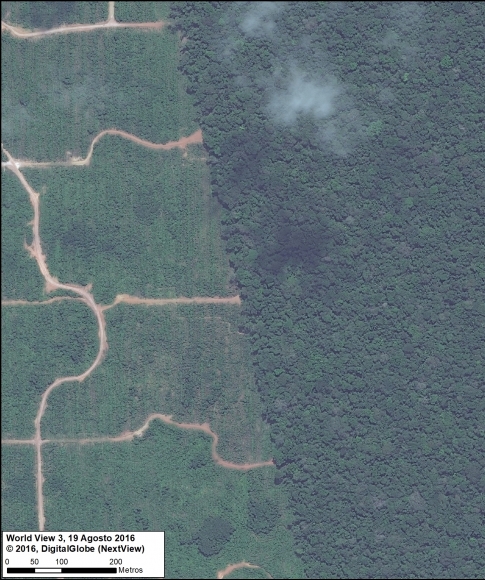
Satellite image of the deforestation produced by United Cacao. Source: DigitalGlobe (Nextview)

MAAP, an initiative of the organization Amazon Conservation, uses cutting-edge satellite technology to monitor deforestation in near real-time in the megadiverse Andean Amazon (Peru, Colombia, Ecuador, and Bolivia).

The monitoring is based on 5 satellite systems: Landsat (NASA/USGS), Sentinel (European Space Agency), PeruSAT-1, and the companies Planet and DigitalGlobe. For more information about our innovative methodology, see this recent paper in Science Magazine.

Launched in 2015, MAAP has published nearly 100 high-impact reports on the major Amazonian deforestation issues of the day.

Here, we present our third annual synthesis report with the objective to concisely describe the bigger picture: Deforestation trends, patterns, hotspots and drivers across the Andean Amazon.

Our principal findings include:

Trends: Deforestation across the Andean Amazon has reached 4.2 million hectares (10.4 million acres) since 2001. Annual deforestation has been increasing in recent years, with a peak in 2017 (426,000 hectares). Peru has had the highest annual deforestation, followed by surging Colombia (in fact, Colombia surpassed Peru in 2017). The vast majority of the deforestation events are small-scale (‹5 hectares).

Hotspots: We present the first regional-scale deforestation hotspots map for the Andean Amazon, allowing for spatial comparisons between Peru, Colombia, and Ecuador.  We discuss six of the most important hotspots.

Drivers: We present MAAP Interactive, a dynamic map with detailed information on the major deforestation drivers: gold mining, agriculture (oil palm and cacao), cattle ranching, logging, and dams. Agriculture and ranching cause the most widespread impact across the region, while gold mining is most intense southern Peru.

Climate Change. We estimated the loss of 59 million metric tons of carbon in the Peruvian Amazon during the last five years (2013-17) due to forest loss. In contrast, we also show that protected areas and indigenous lands have safeguarded 3.17 billion metric tons of carbon.

I. Deforestation Trends

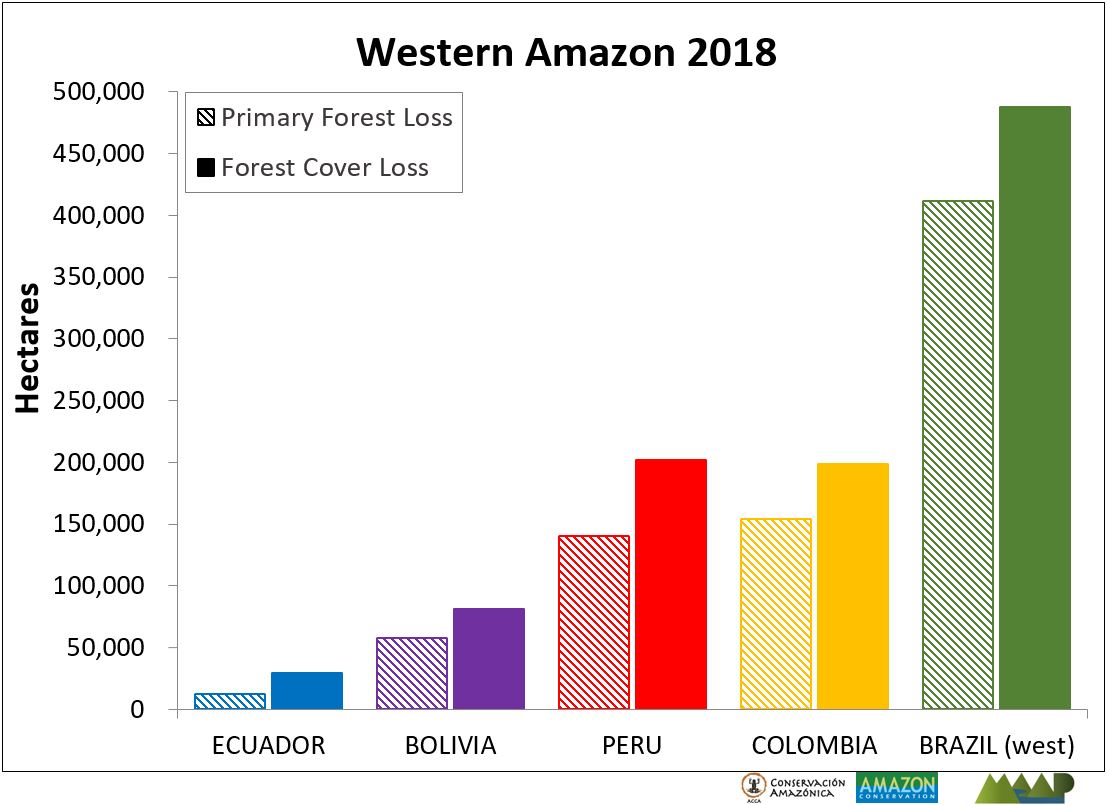
Image 1 shows forest loss trends in the Andean Amazon between 2001 and 2017.*  The left graph shows data by country, while the right graph shows data by forest loss event size.

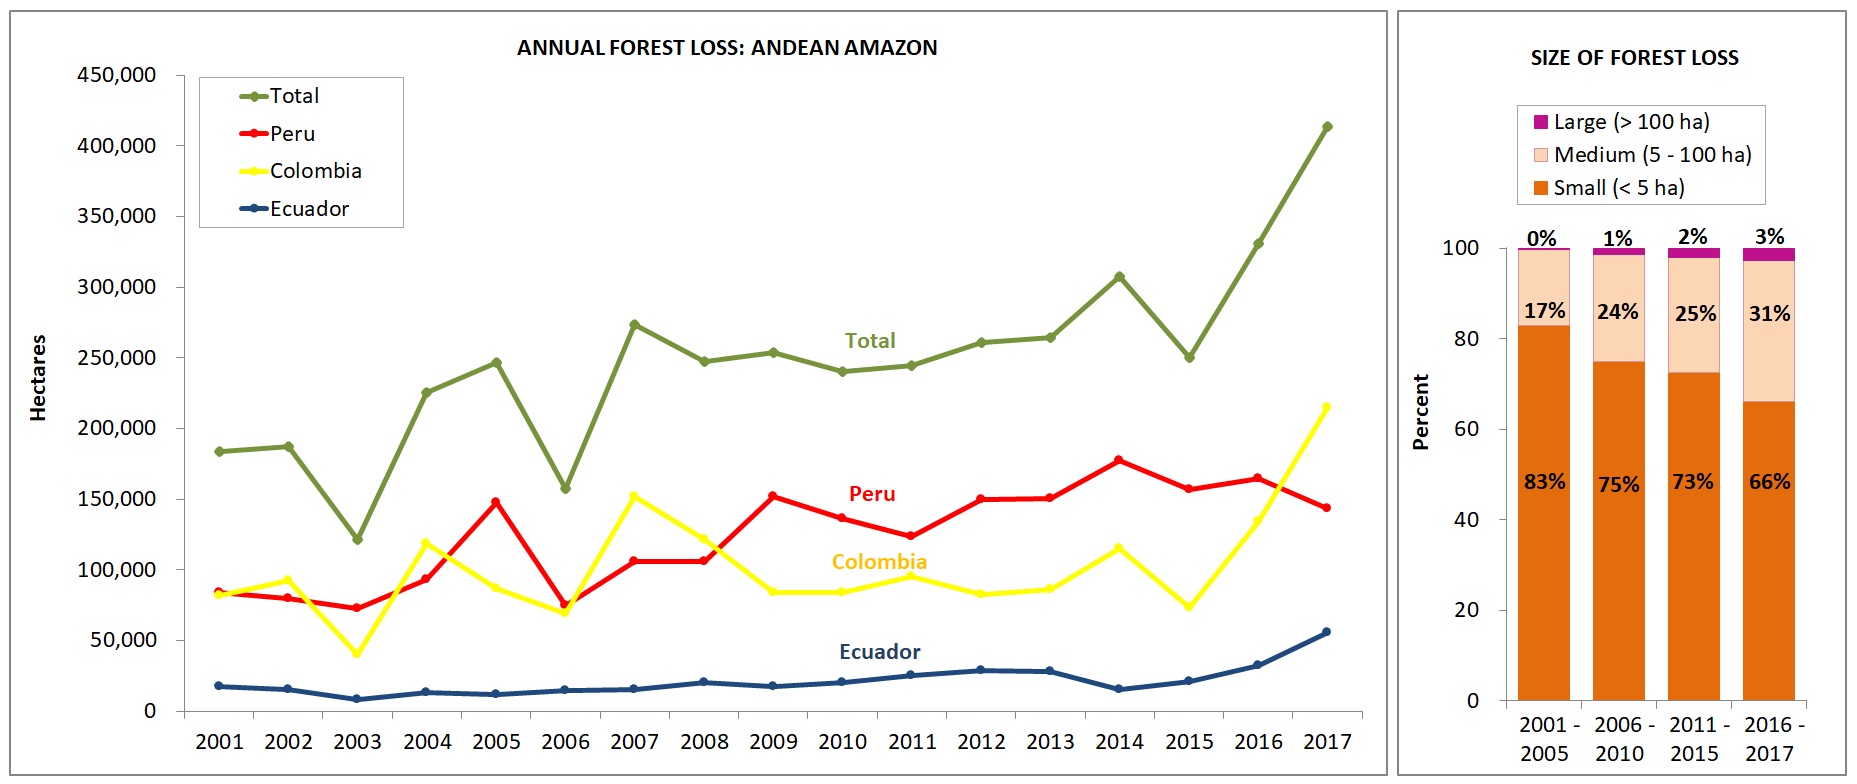
Image 1. Annual forest loss by country and size. Data: Hansen/UMD/Google/USGS/NASA, UMD/GLAD, Global Forest Watch, MINAM/PNCB, RAISG.

Trends by Country

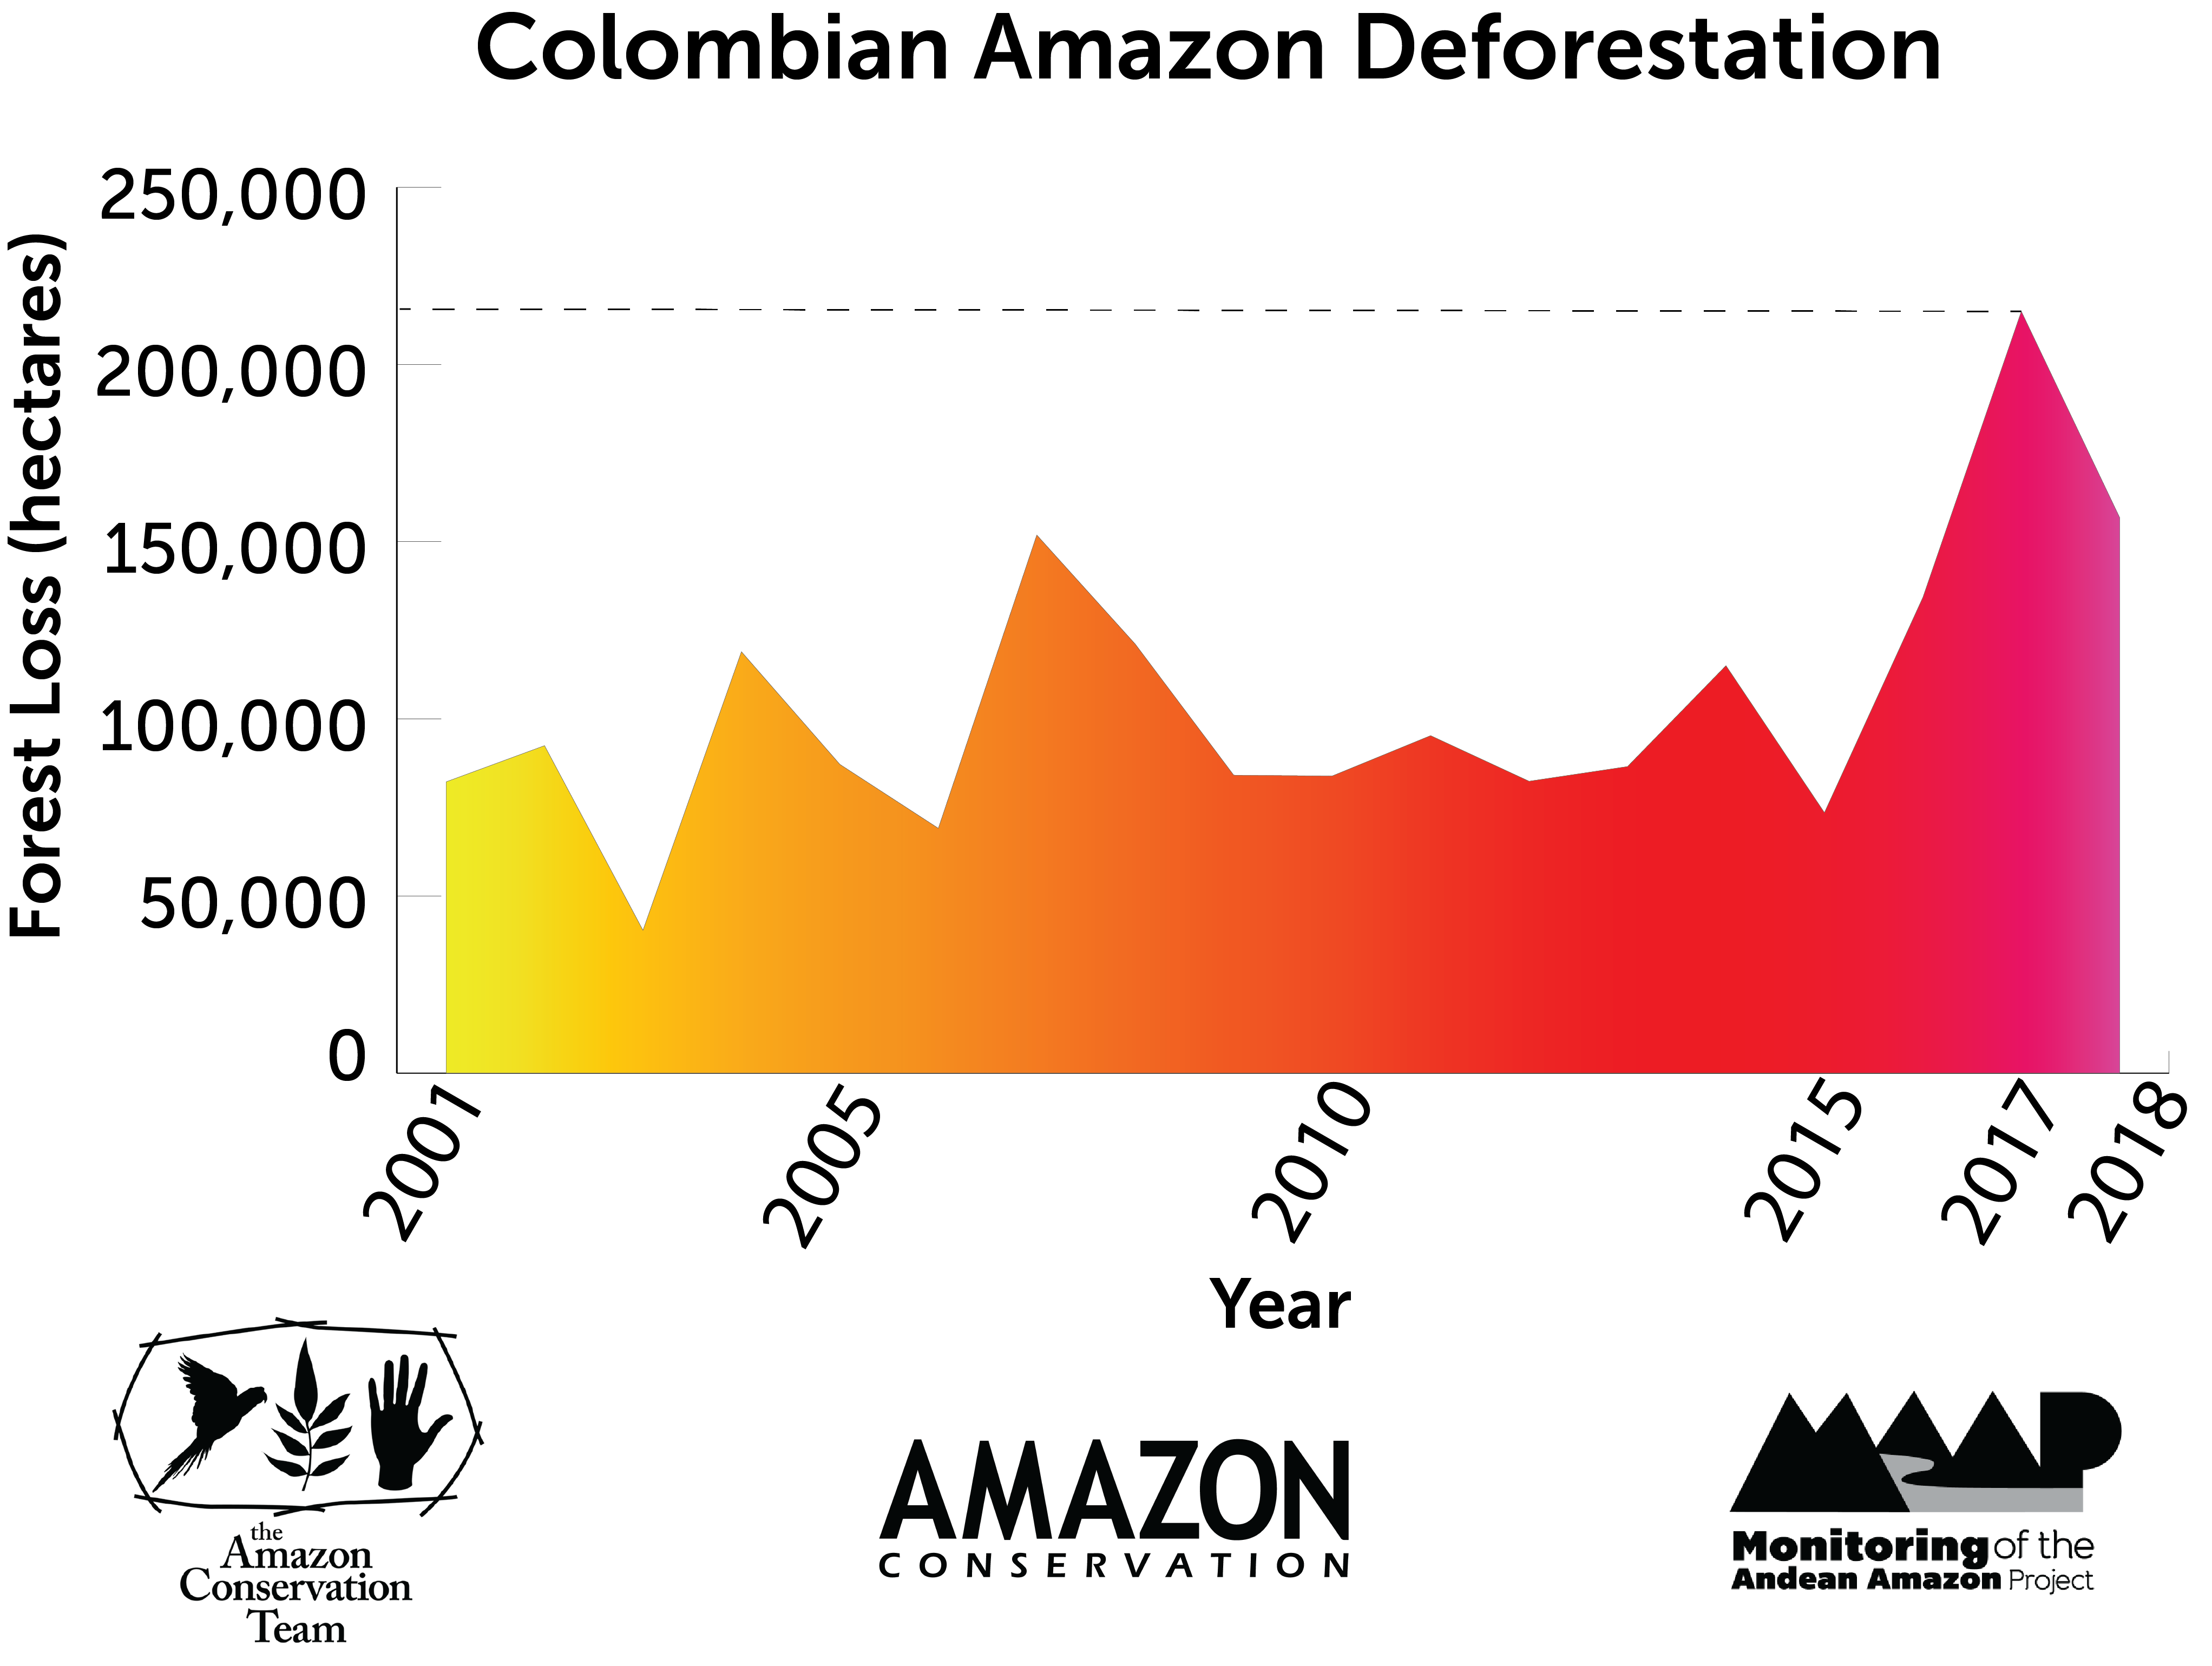
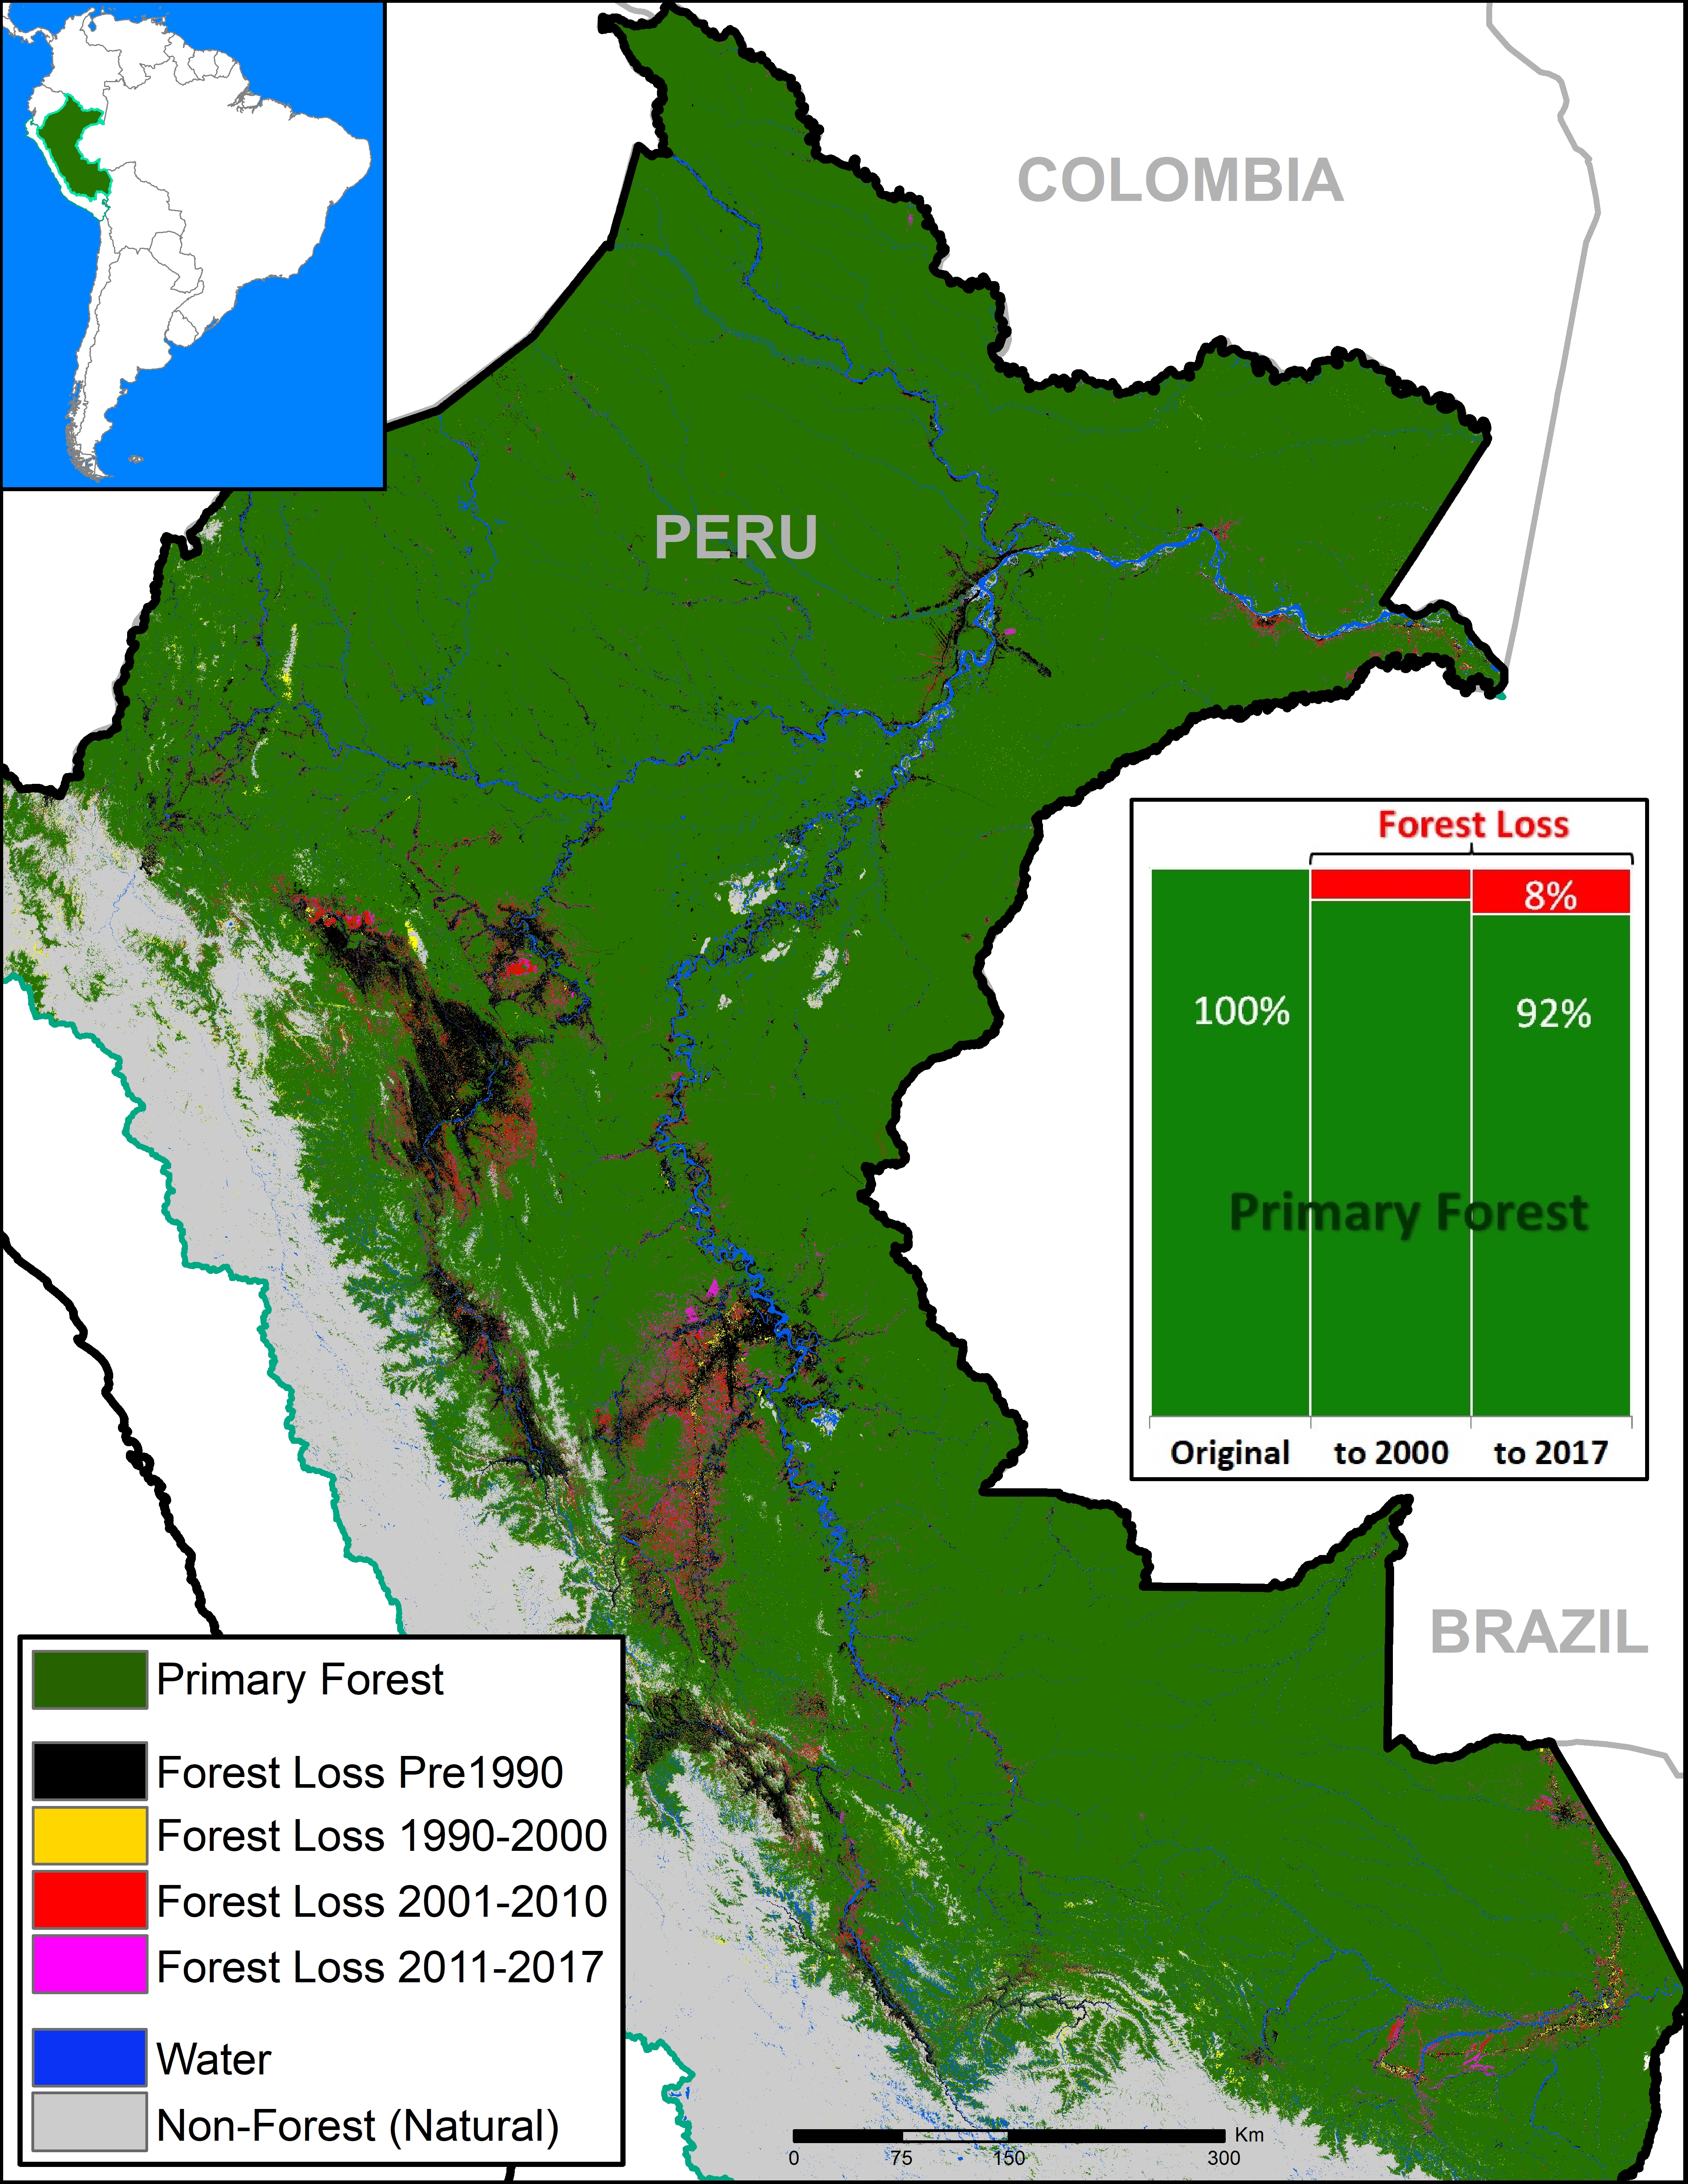
Over the past 17 years (2001-2017), deforestation has surpassed 4.2 million hectares (10.4 million acres) in the Andean Amazon (see green line). Of this total, 50% is Peru (2.1 million hectares/5.2 million acres), 41% Colombia (1.7 million hectares/4.27 million acres), and 9% Ecuador (887,000 acres/359,000 hectares). This analysis did not include Bolivia.

Since 2007, there has been an increasing deforestation trend, peaking during the past two years (2016-17). In fact, 2017 has the highest annual forest loss on record with 426,000 hectares (over one million acres), more than double the total forest loss in 2006.

Peru had the highest average annual Amazonian deforestation between 2009 and 2016. The past four years have the highest annual deforestation totals on record in the country, with peaks in 2014 (177,566 hectares/439,000 acres) and 2016 (164,662 hectares/406,888 acres). According to new data from the Peruvian Environment Ministry, there was an important decline in 2017 (155,914 hectares/385,272 acres), but it is still the fourth highest annual total on record.

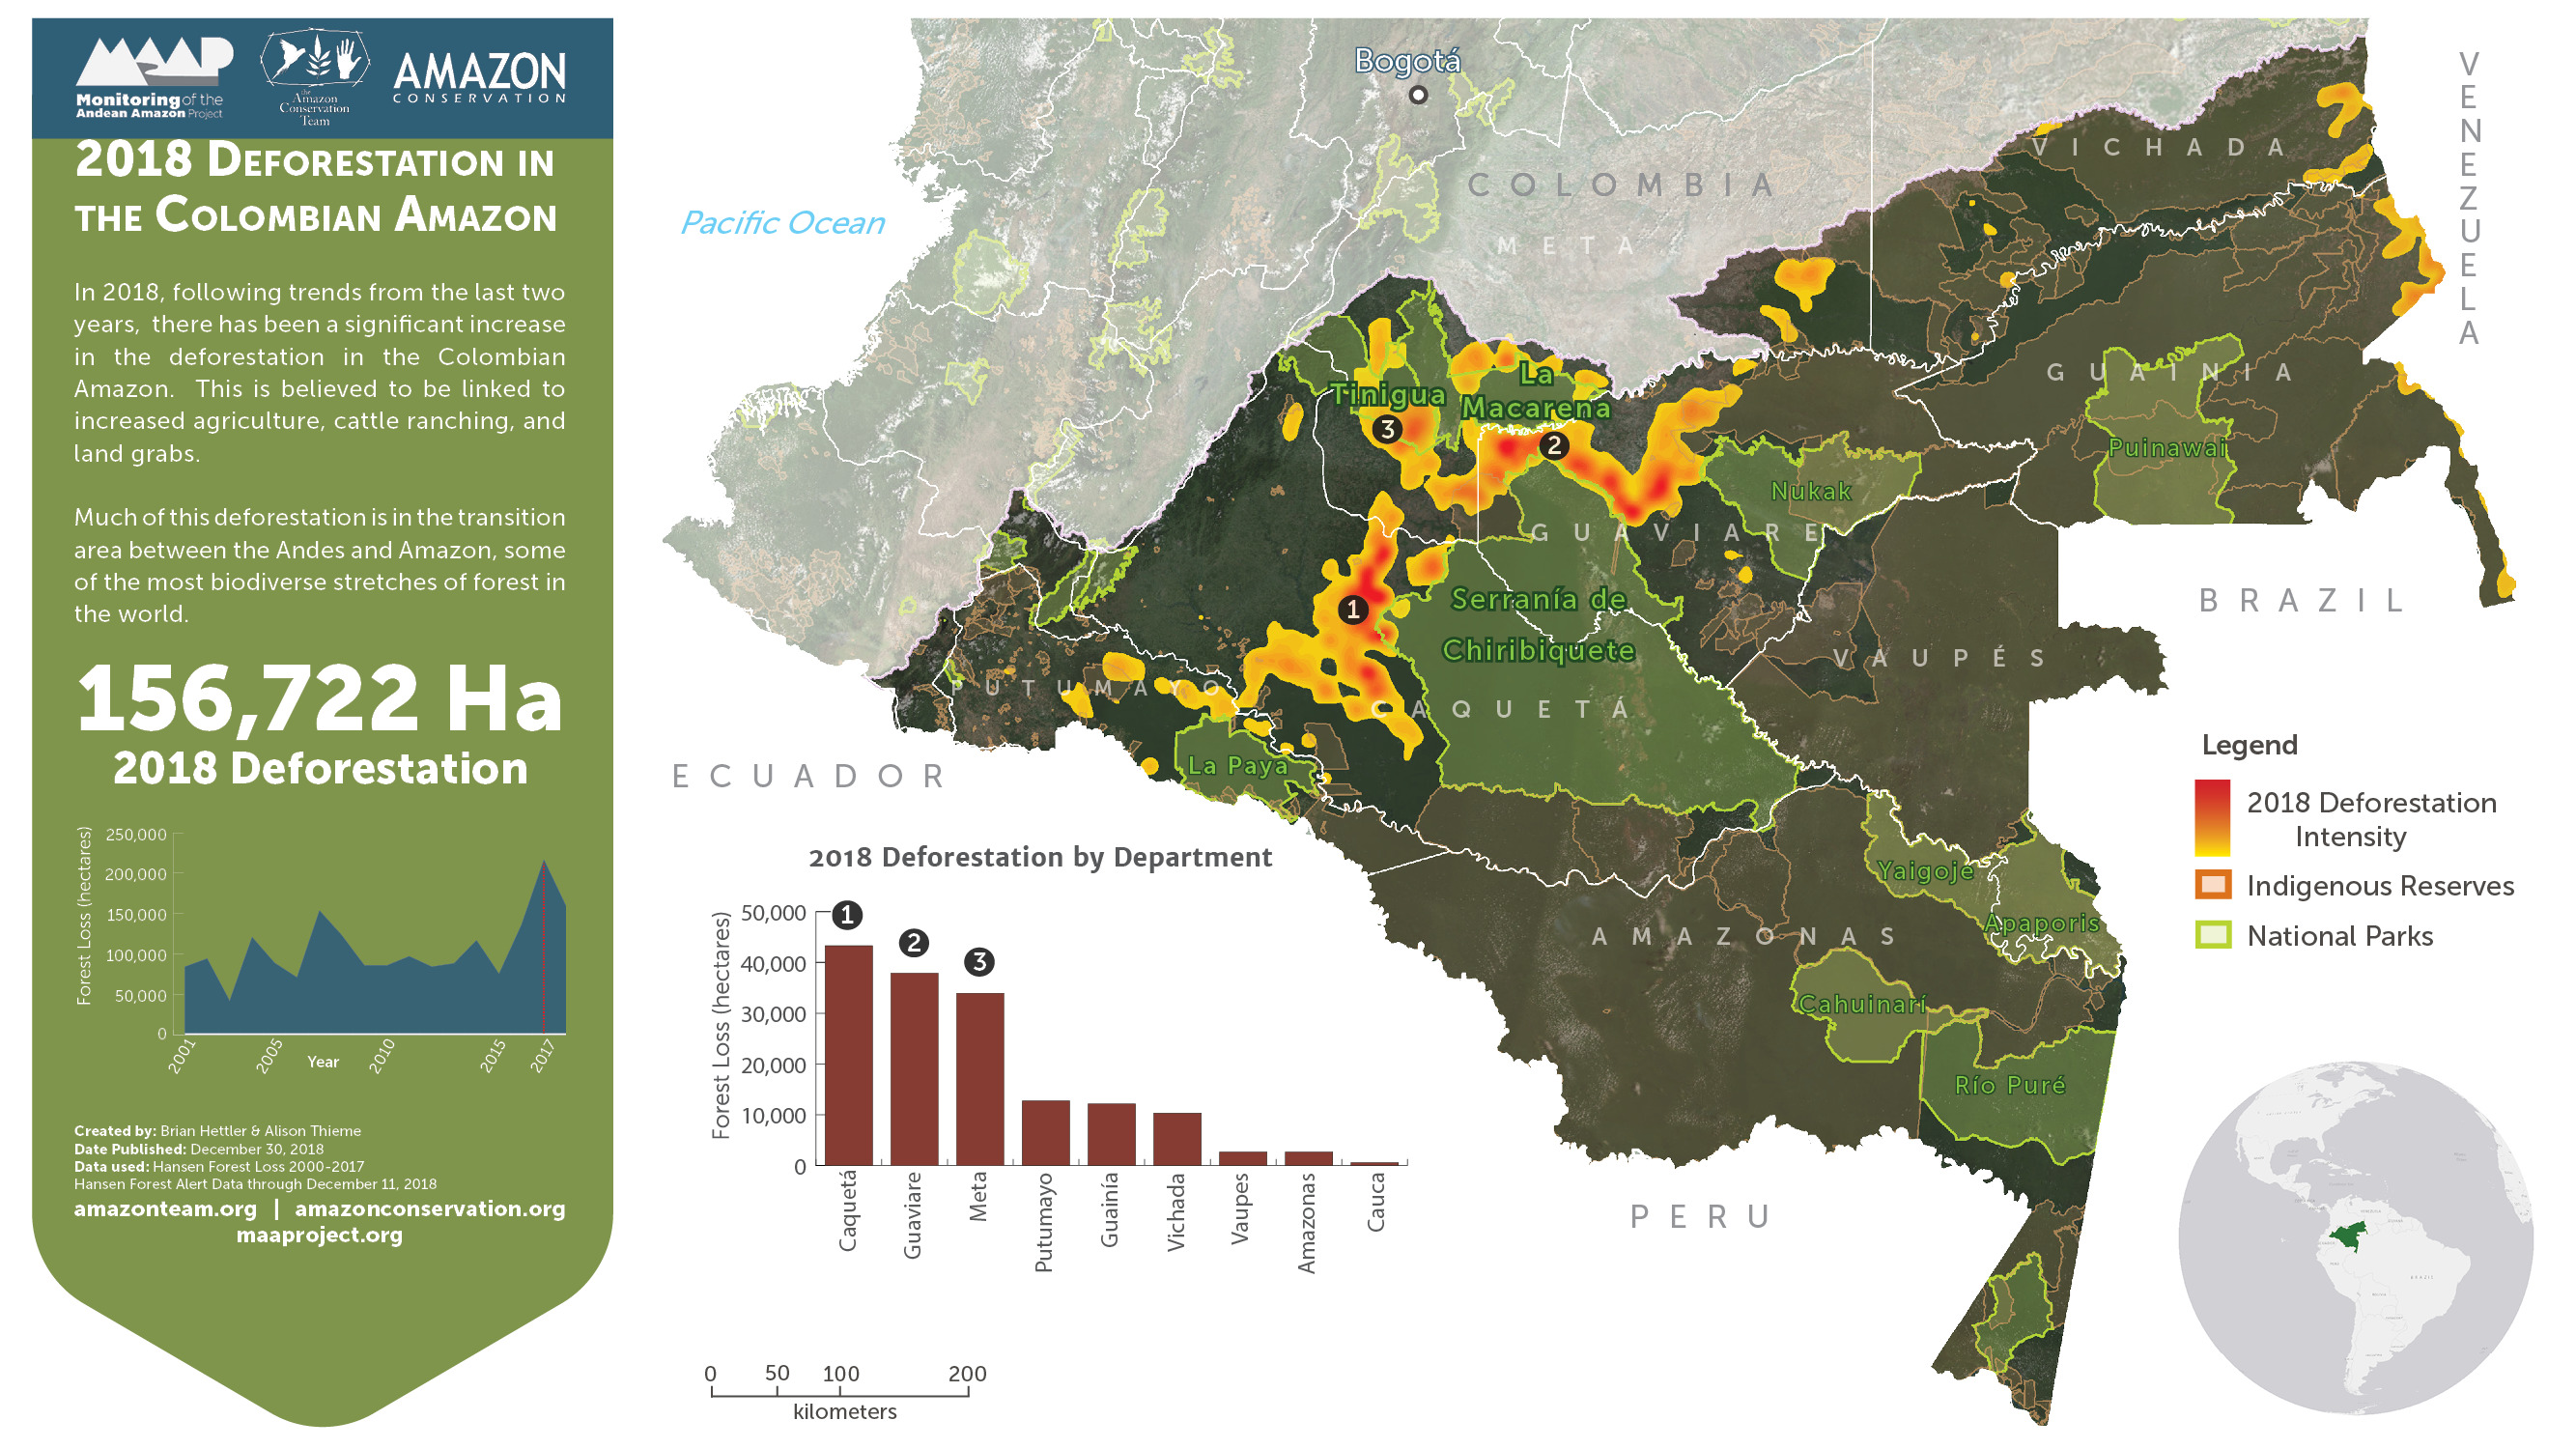
There has been a surge of deforestation in Colombia during the past two years. Note that in 2017, Colombia surpassed Peru with a record high of 214,700 hectares (530,400 acres) deforested.

Deforestation is also increasing in Ecuador, with highs of 32,000 hectares (79,000 acres) in 2016 and 55,500 hectares (137,000) acres in 2017.

For context, Brazil has had an average deforestation loss rate of 639,403 hectares (1.58 million acres) over the past several years.

* Data: Colombia & Ecuador: Hansen/UMD/Google/USGS/NASA; Peru: MINAM/PNCB, UMD/GLAD. While this information includes natural forest loss events, it serves as our best estimate of deforestation resulting from anthropogenic causes.  It is estimated that the non-anthropic loss comprises approximately 3.5% of the total loss. Note that the analysis does not include Bolivia.

Trends by Size

The pattern related to the size of deforestation events in the Andean Amazon remained relatively consistent over the last 17 years. Most noteworthy: the vast majority (74%) of the deforestation events are small-scale (‹5 hectares). Only 2% of deforestation events are large-scale (>100 hectares). The remaining 24% are medium-scale (5-100 hectares).

These results are important for conservation efforts.  Addressing this complex situation – in which most of the deforestation events are small-scale – requires significantly more attention and resources.  In addition, while large-scale deforestation (usually associated with agro-industrial practices) is not that common, it nonetheless represents a serious latent threat, due to the fact that only a small number of agro-industrial projects (for example, oil palm) are able to rapidly destroy thousands of acres of primary forest.

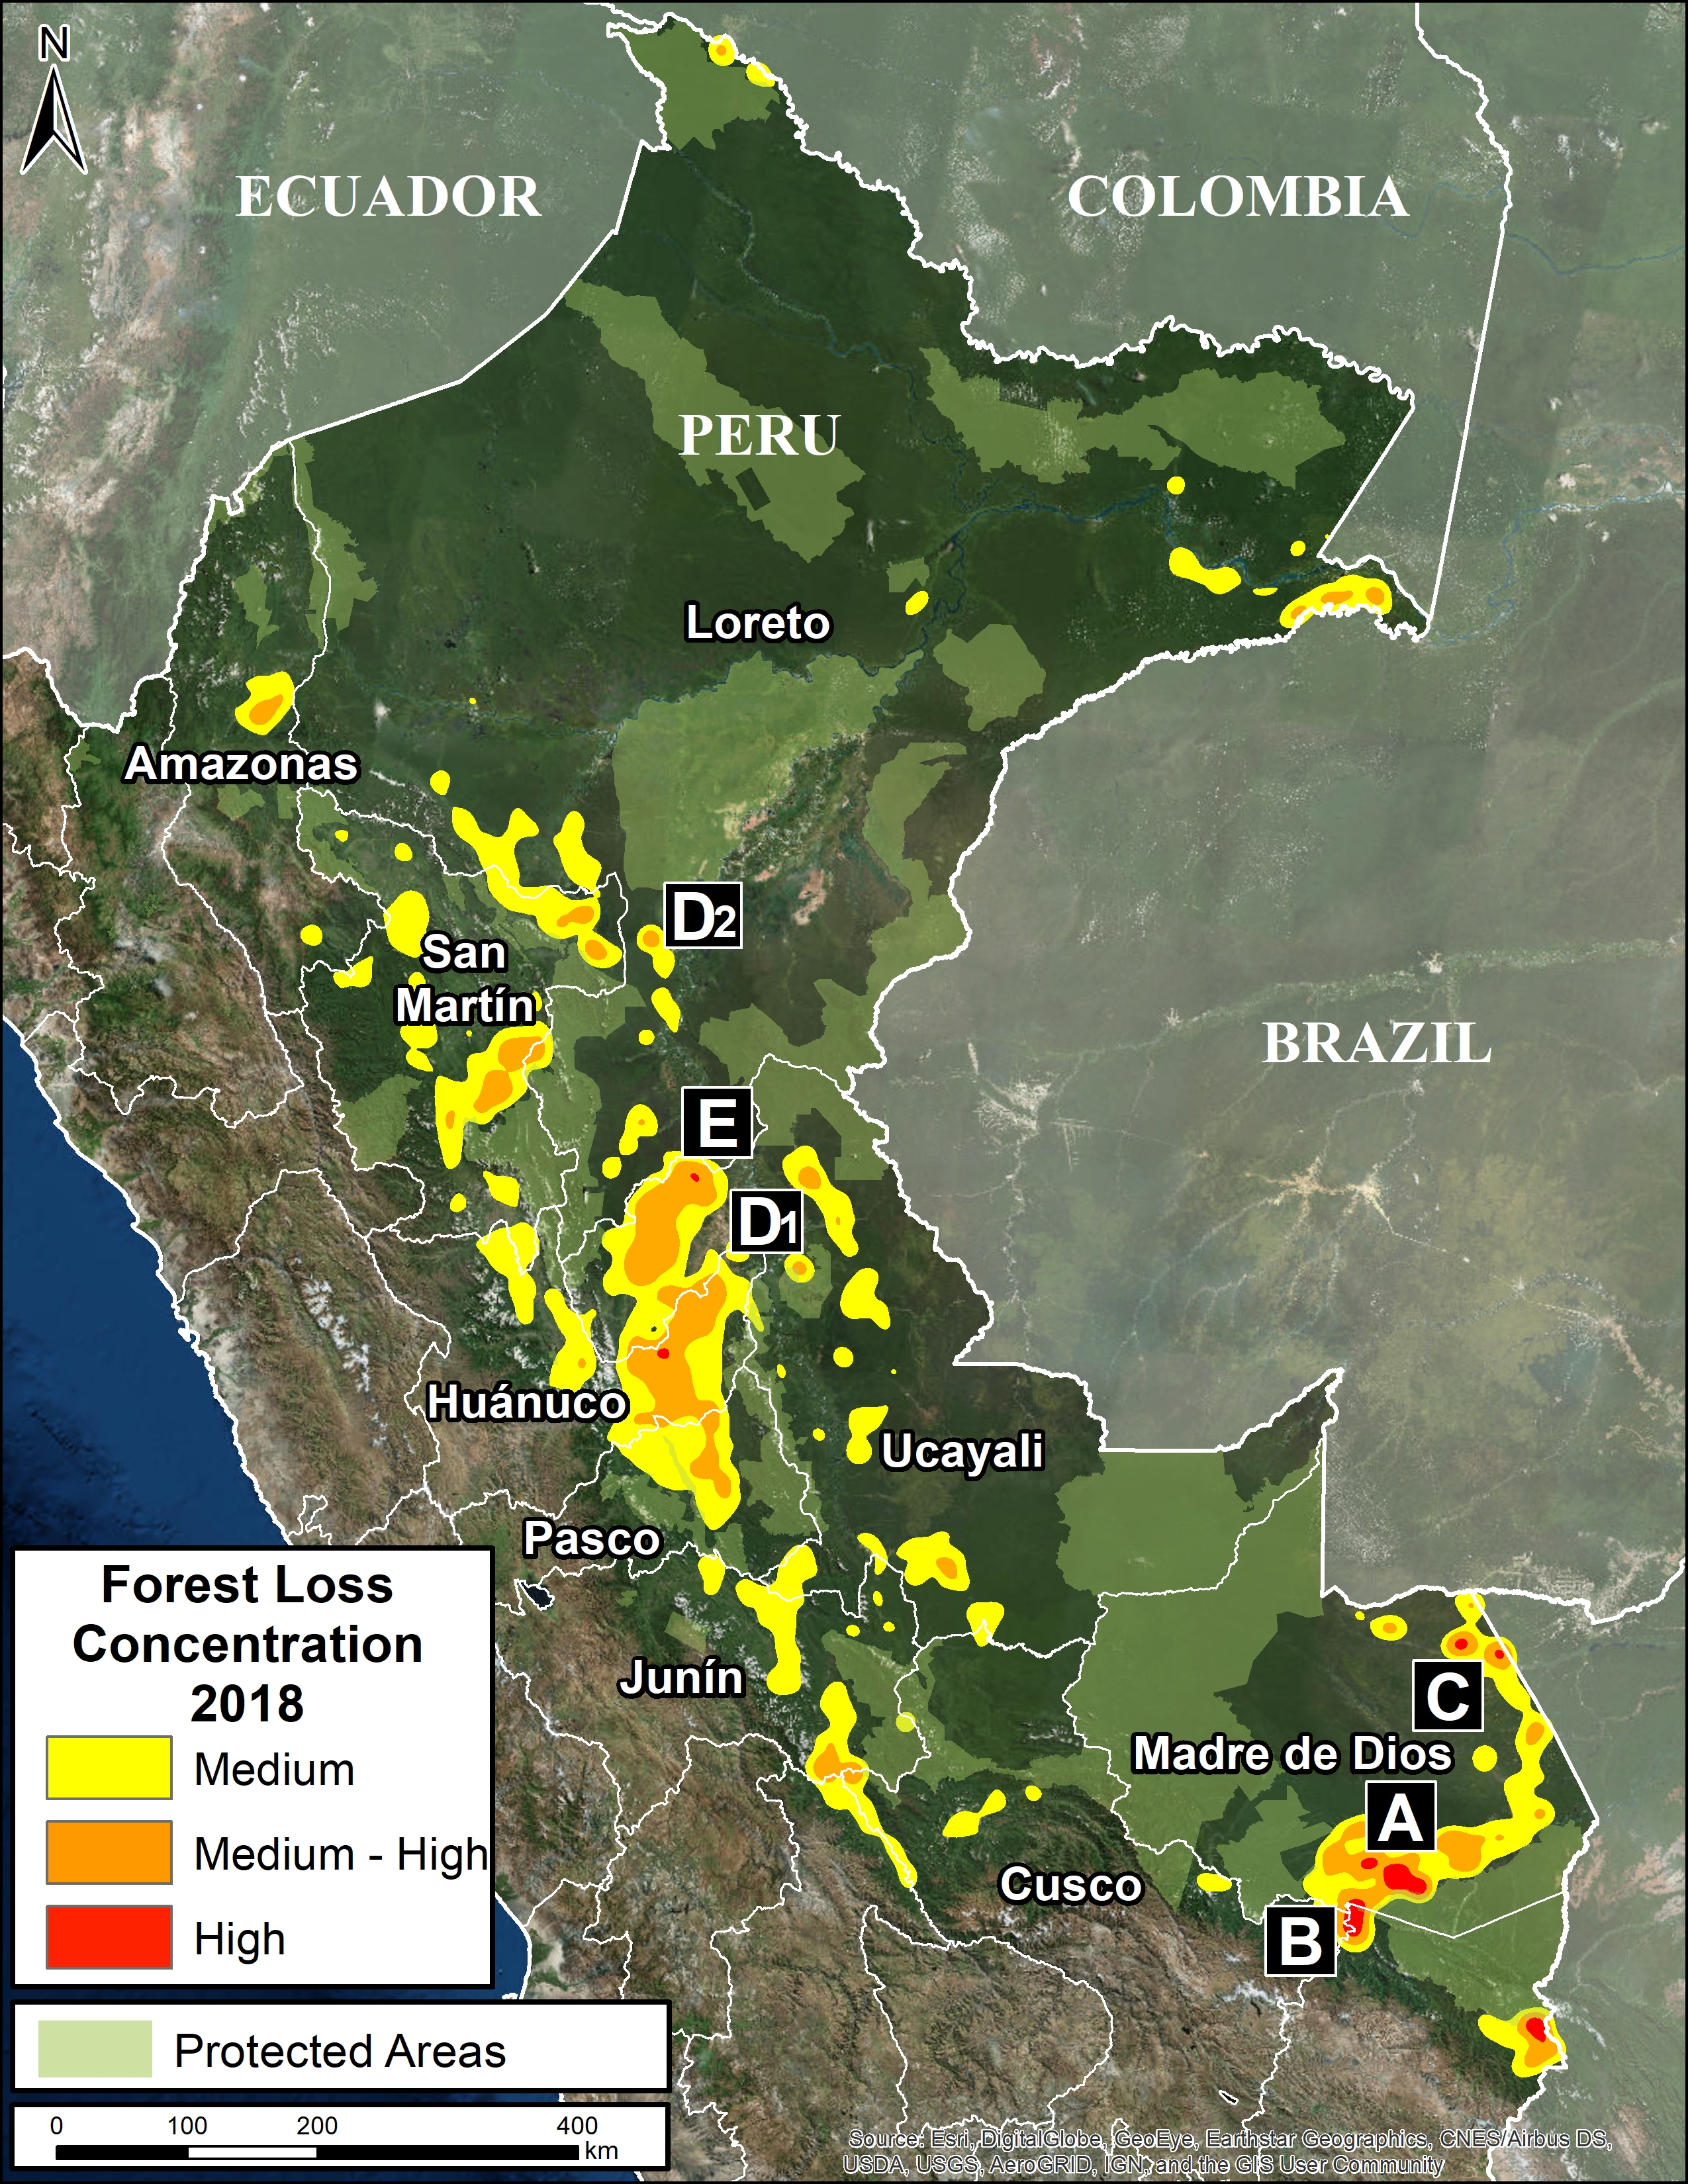
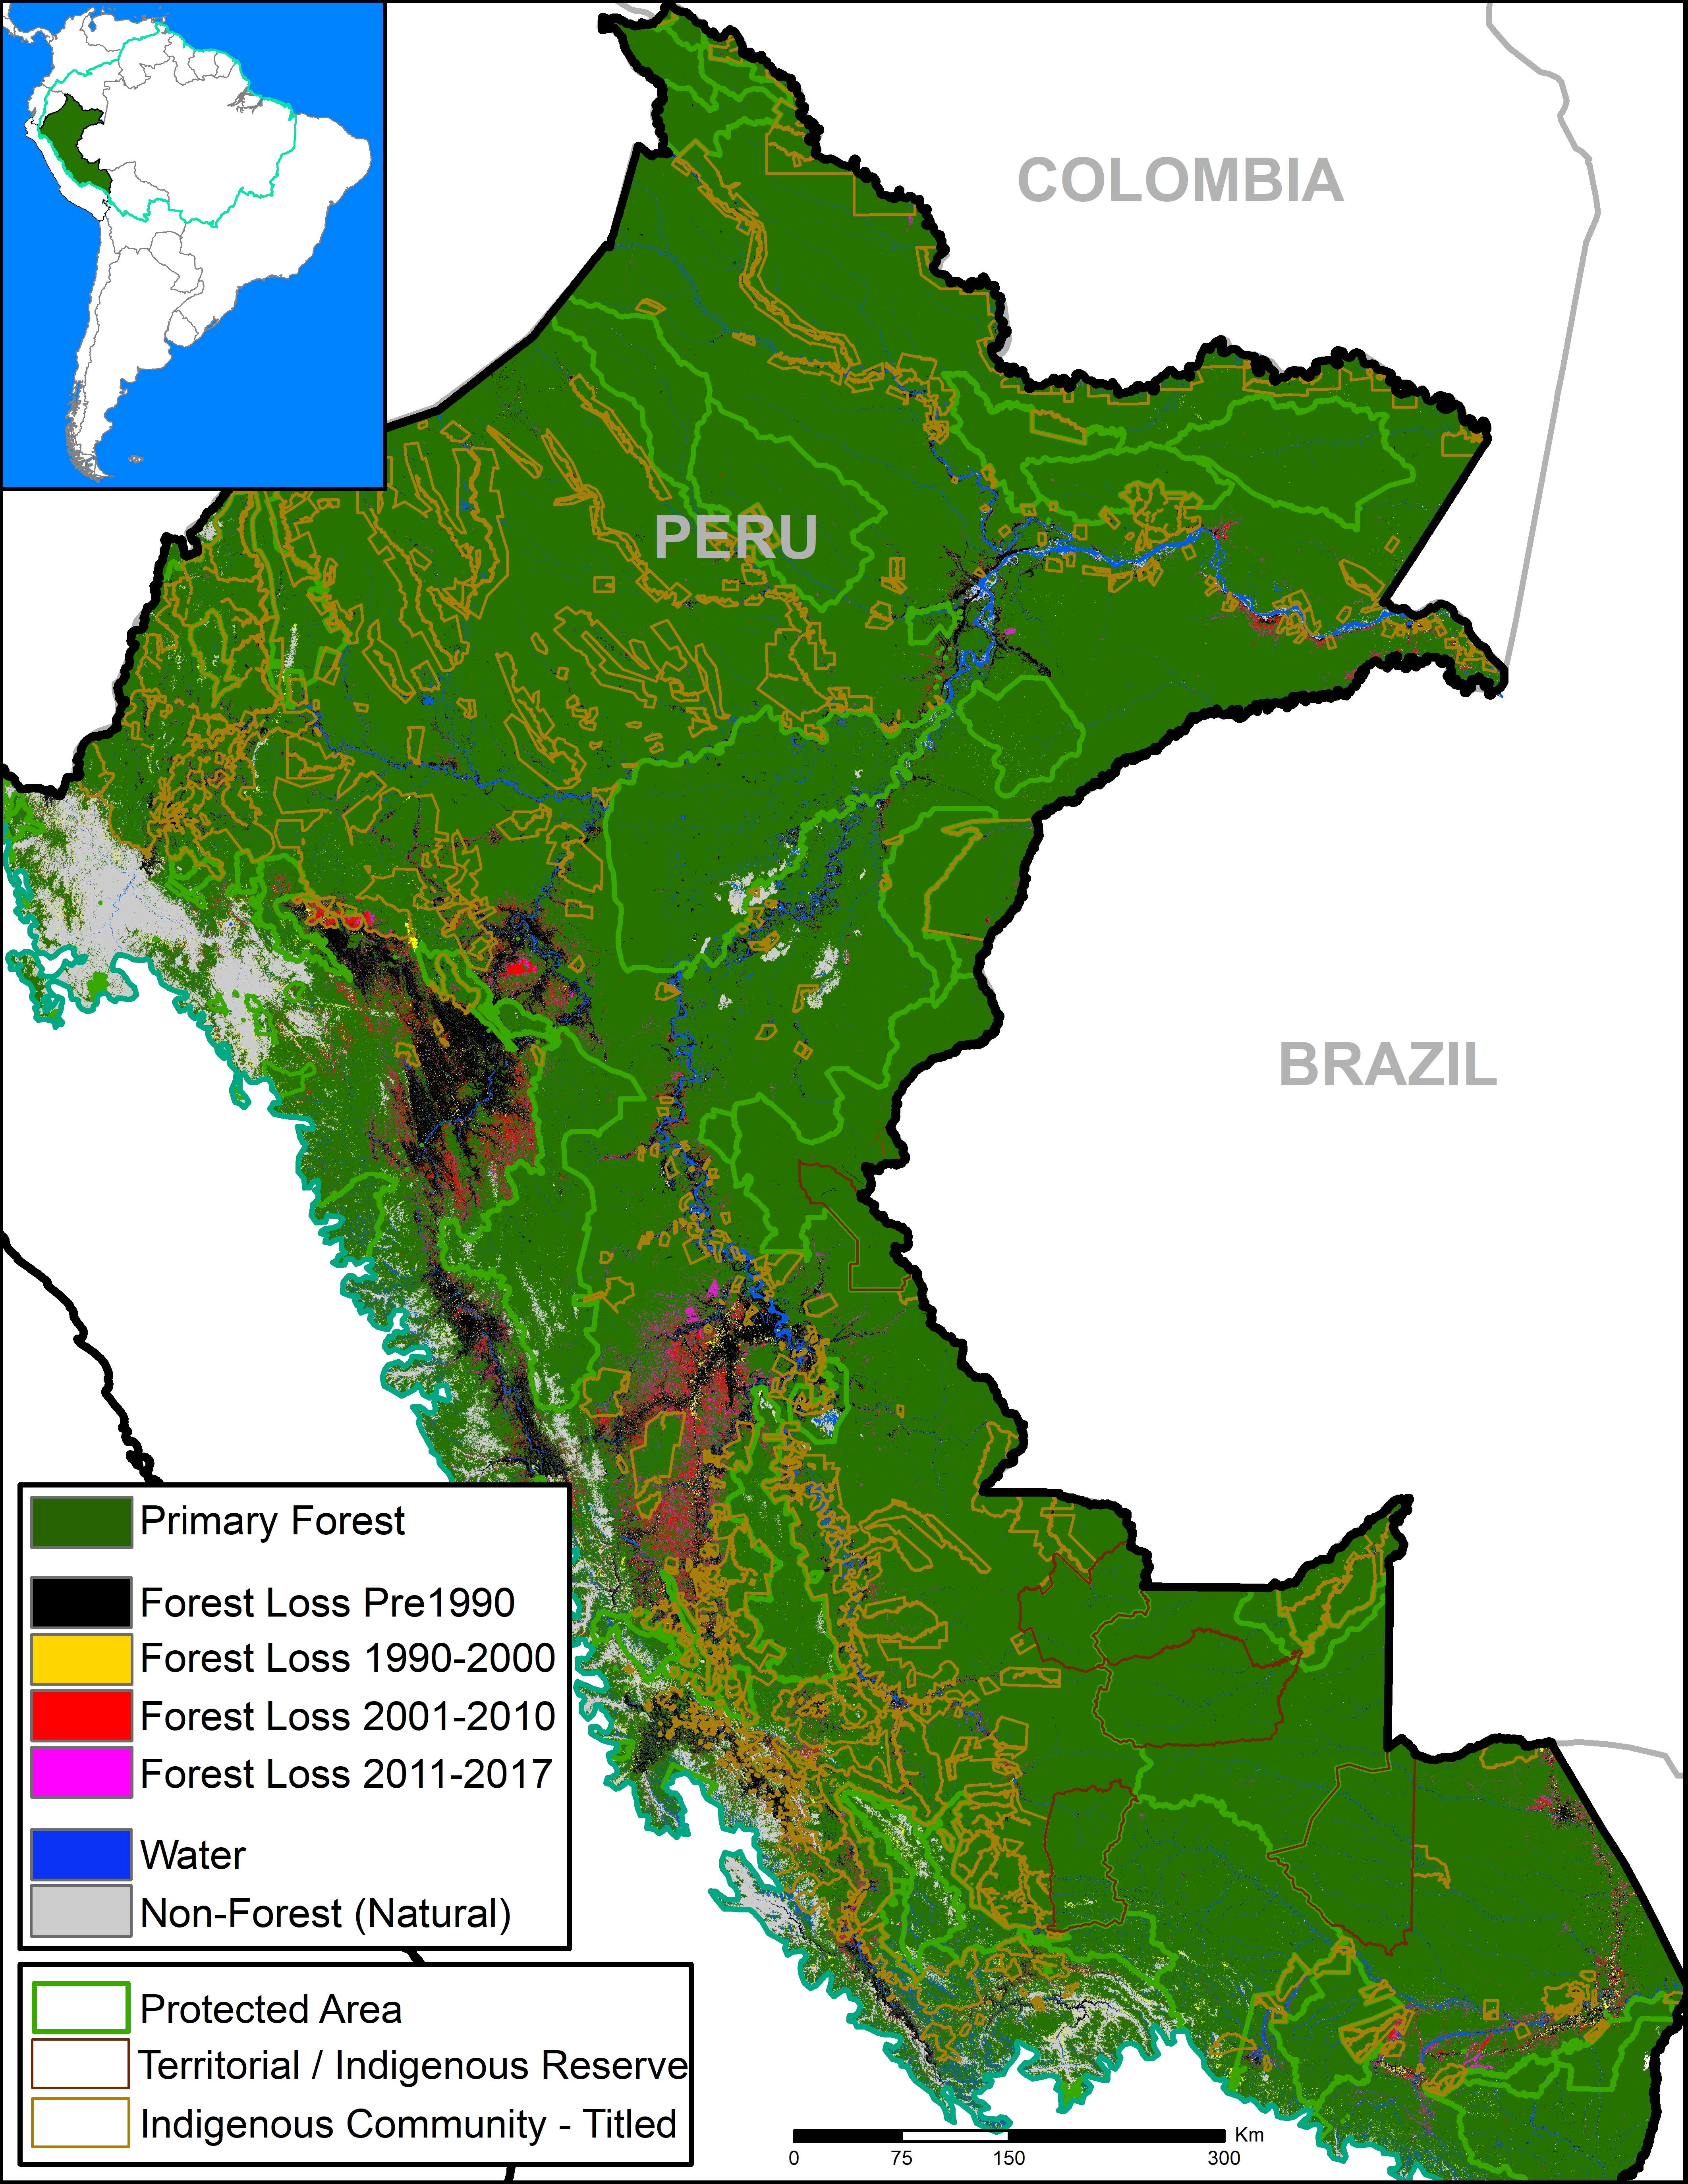
II. Deforestation Hotspots

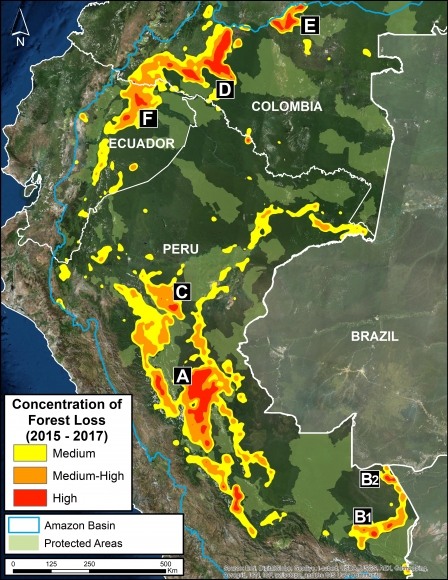
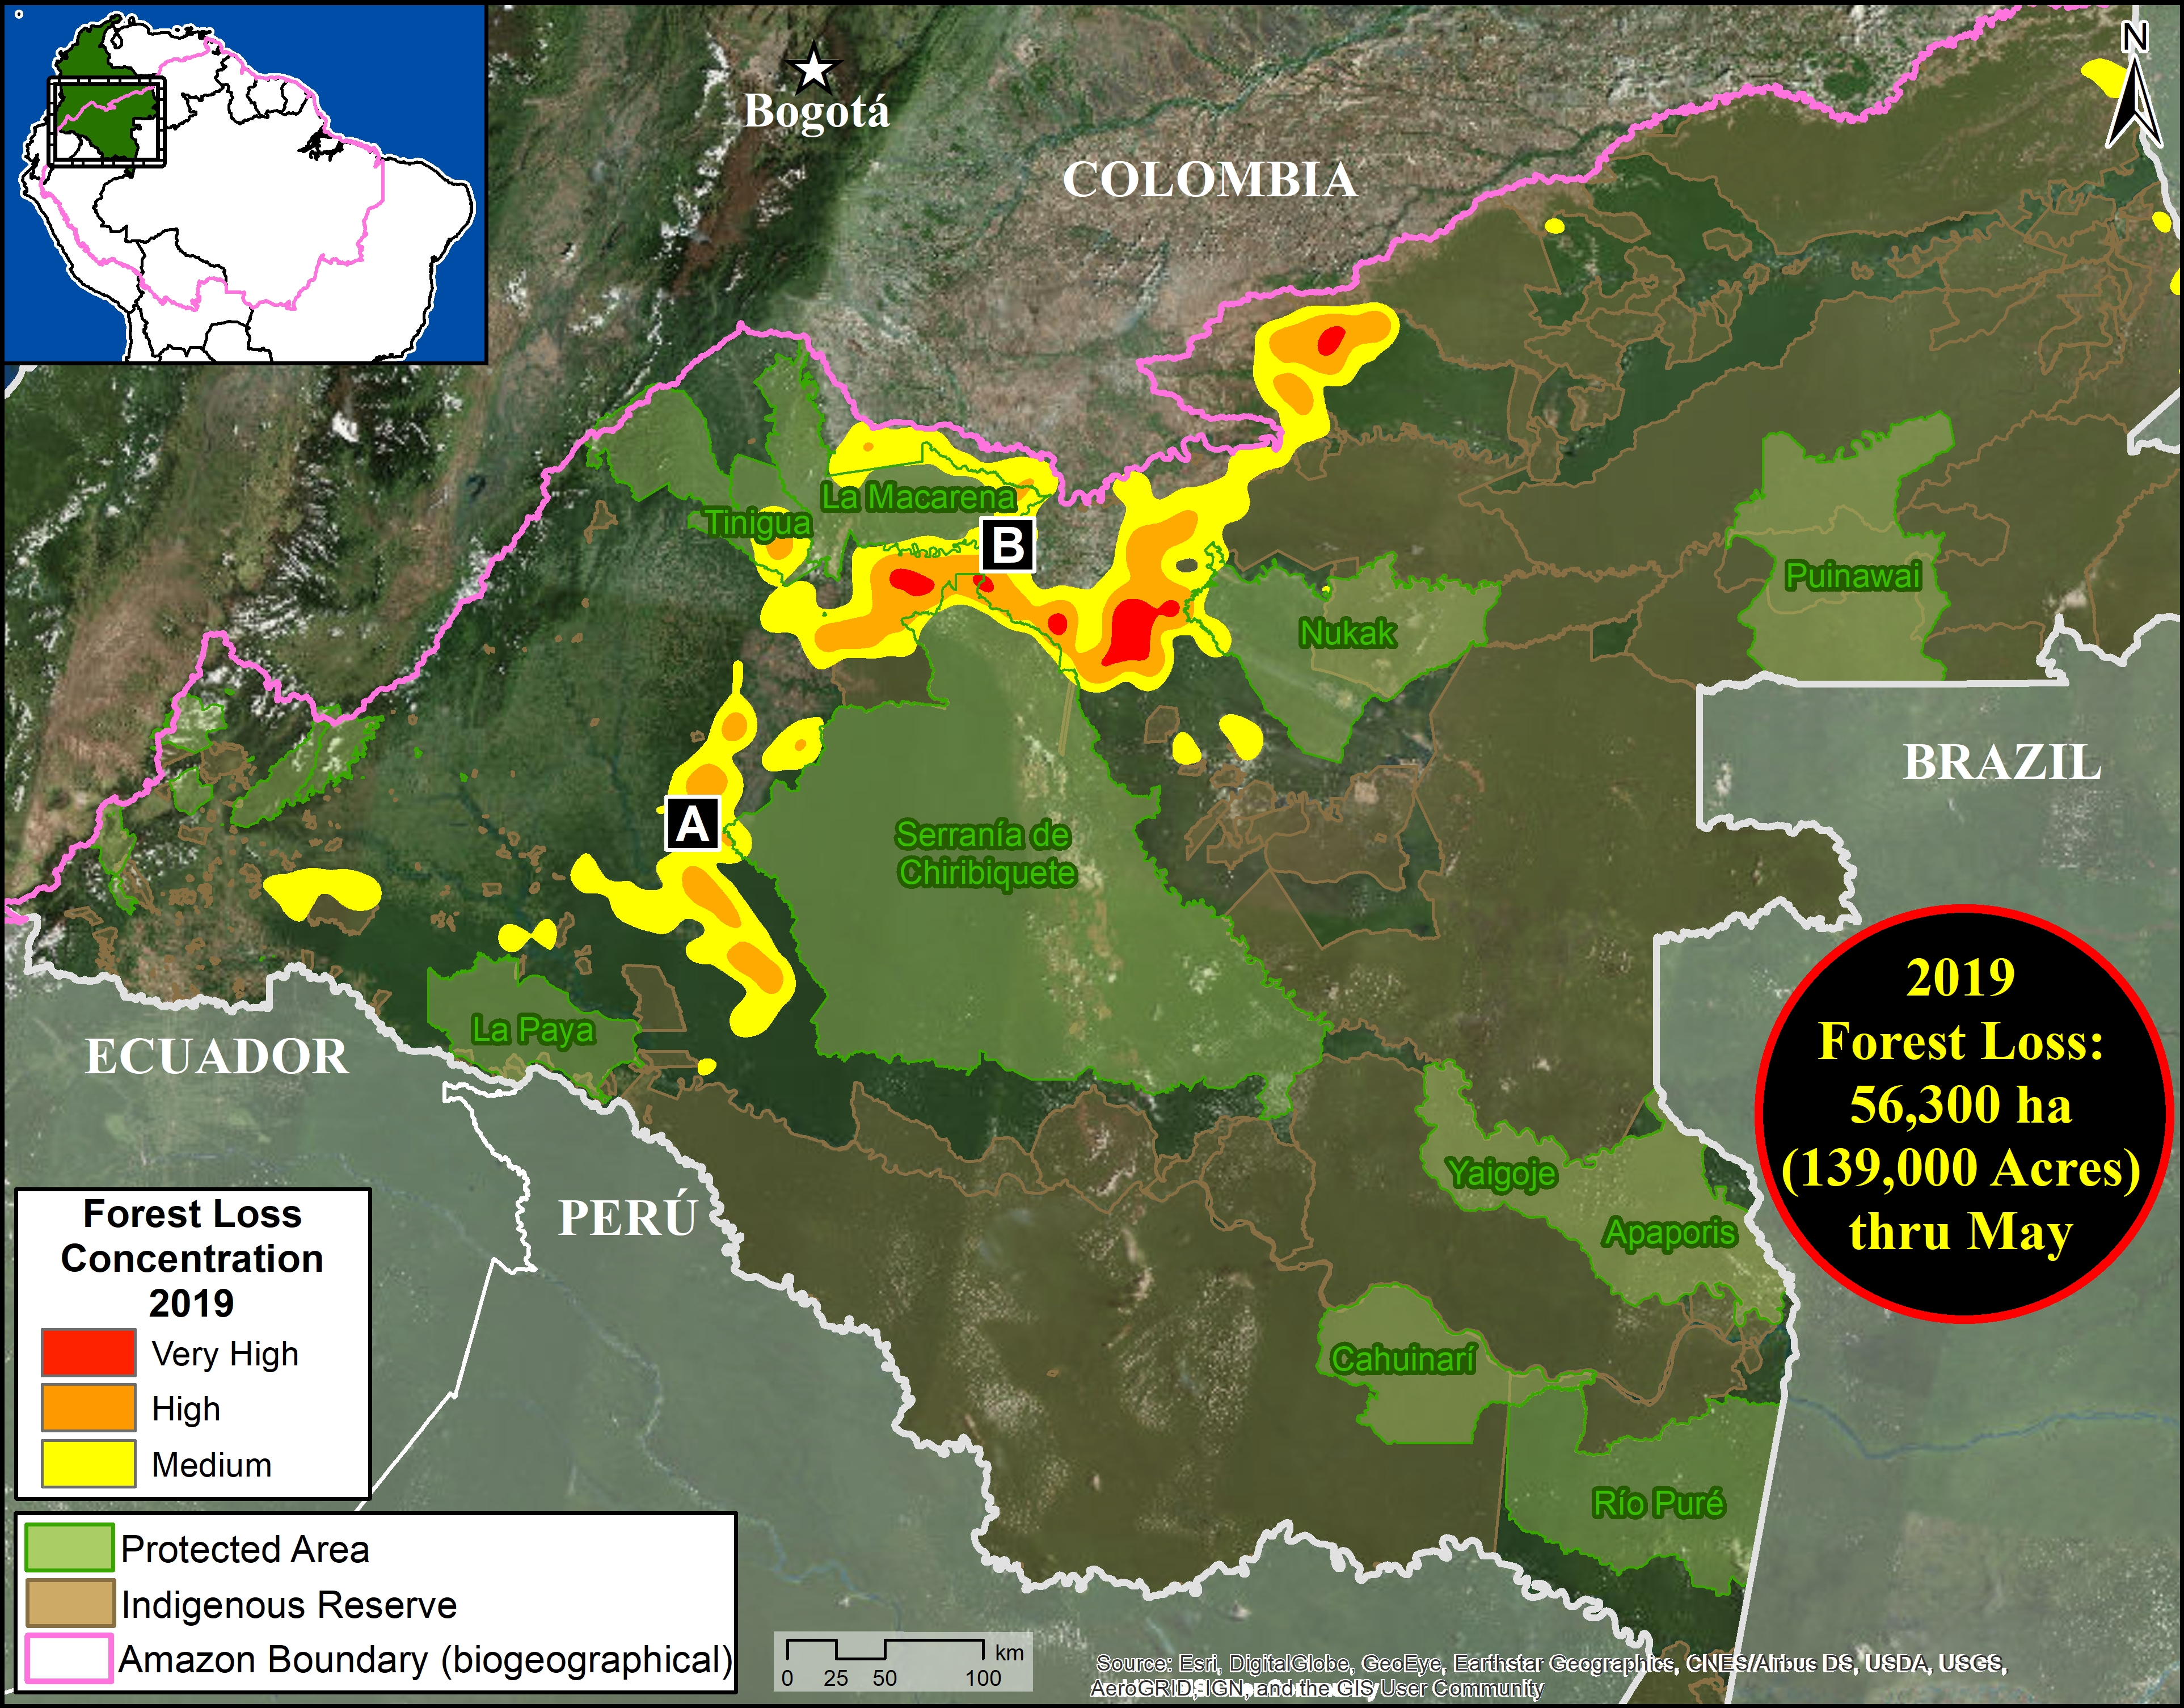
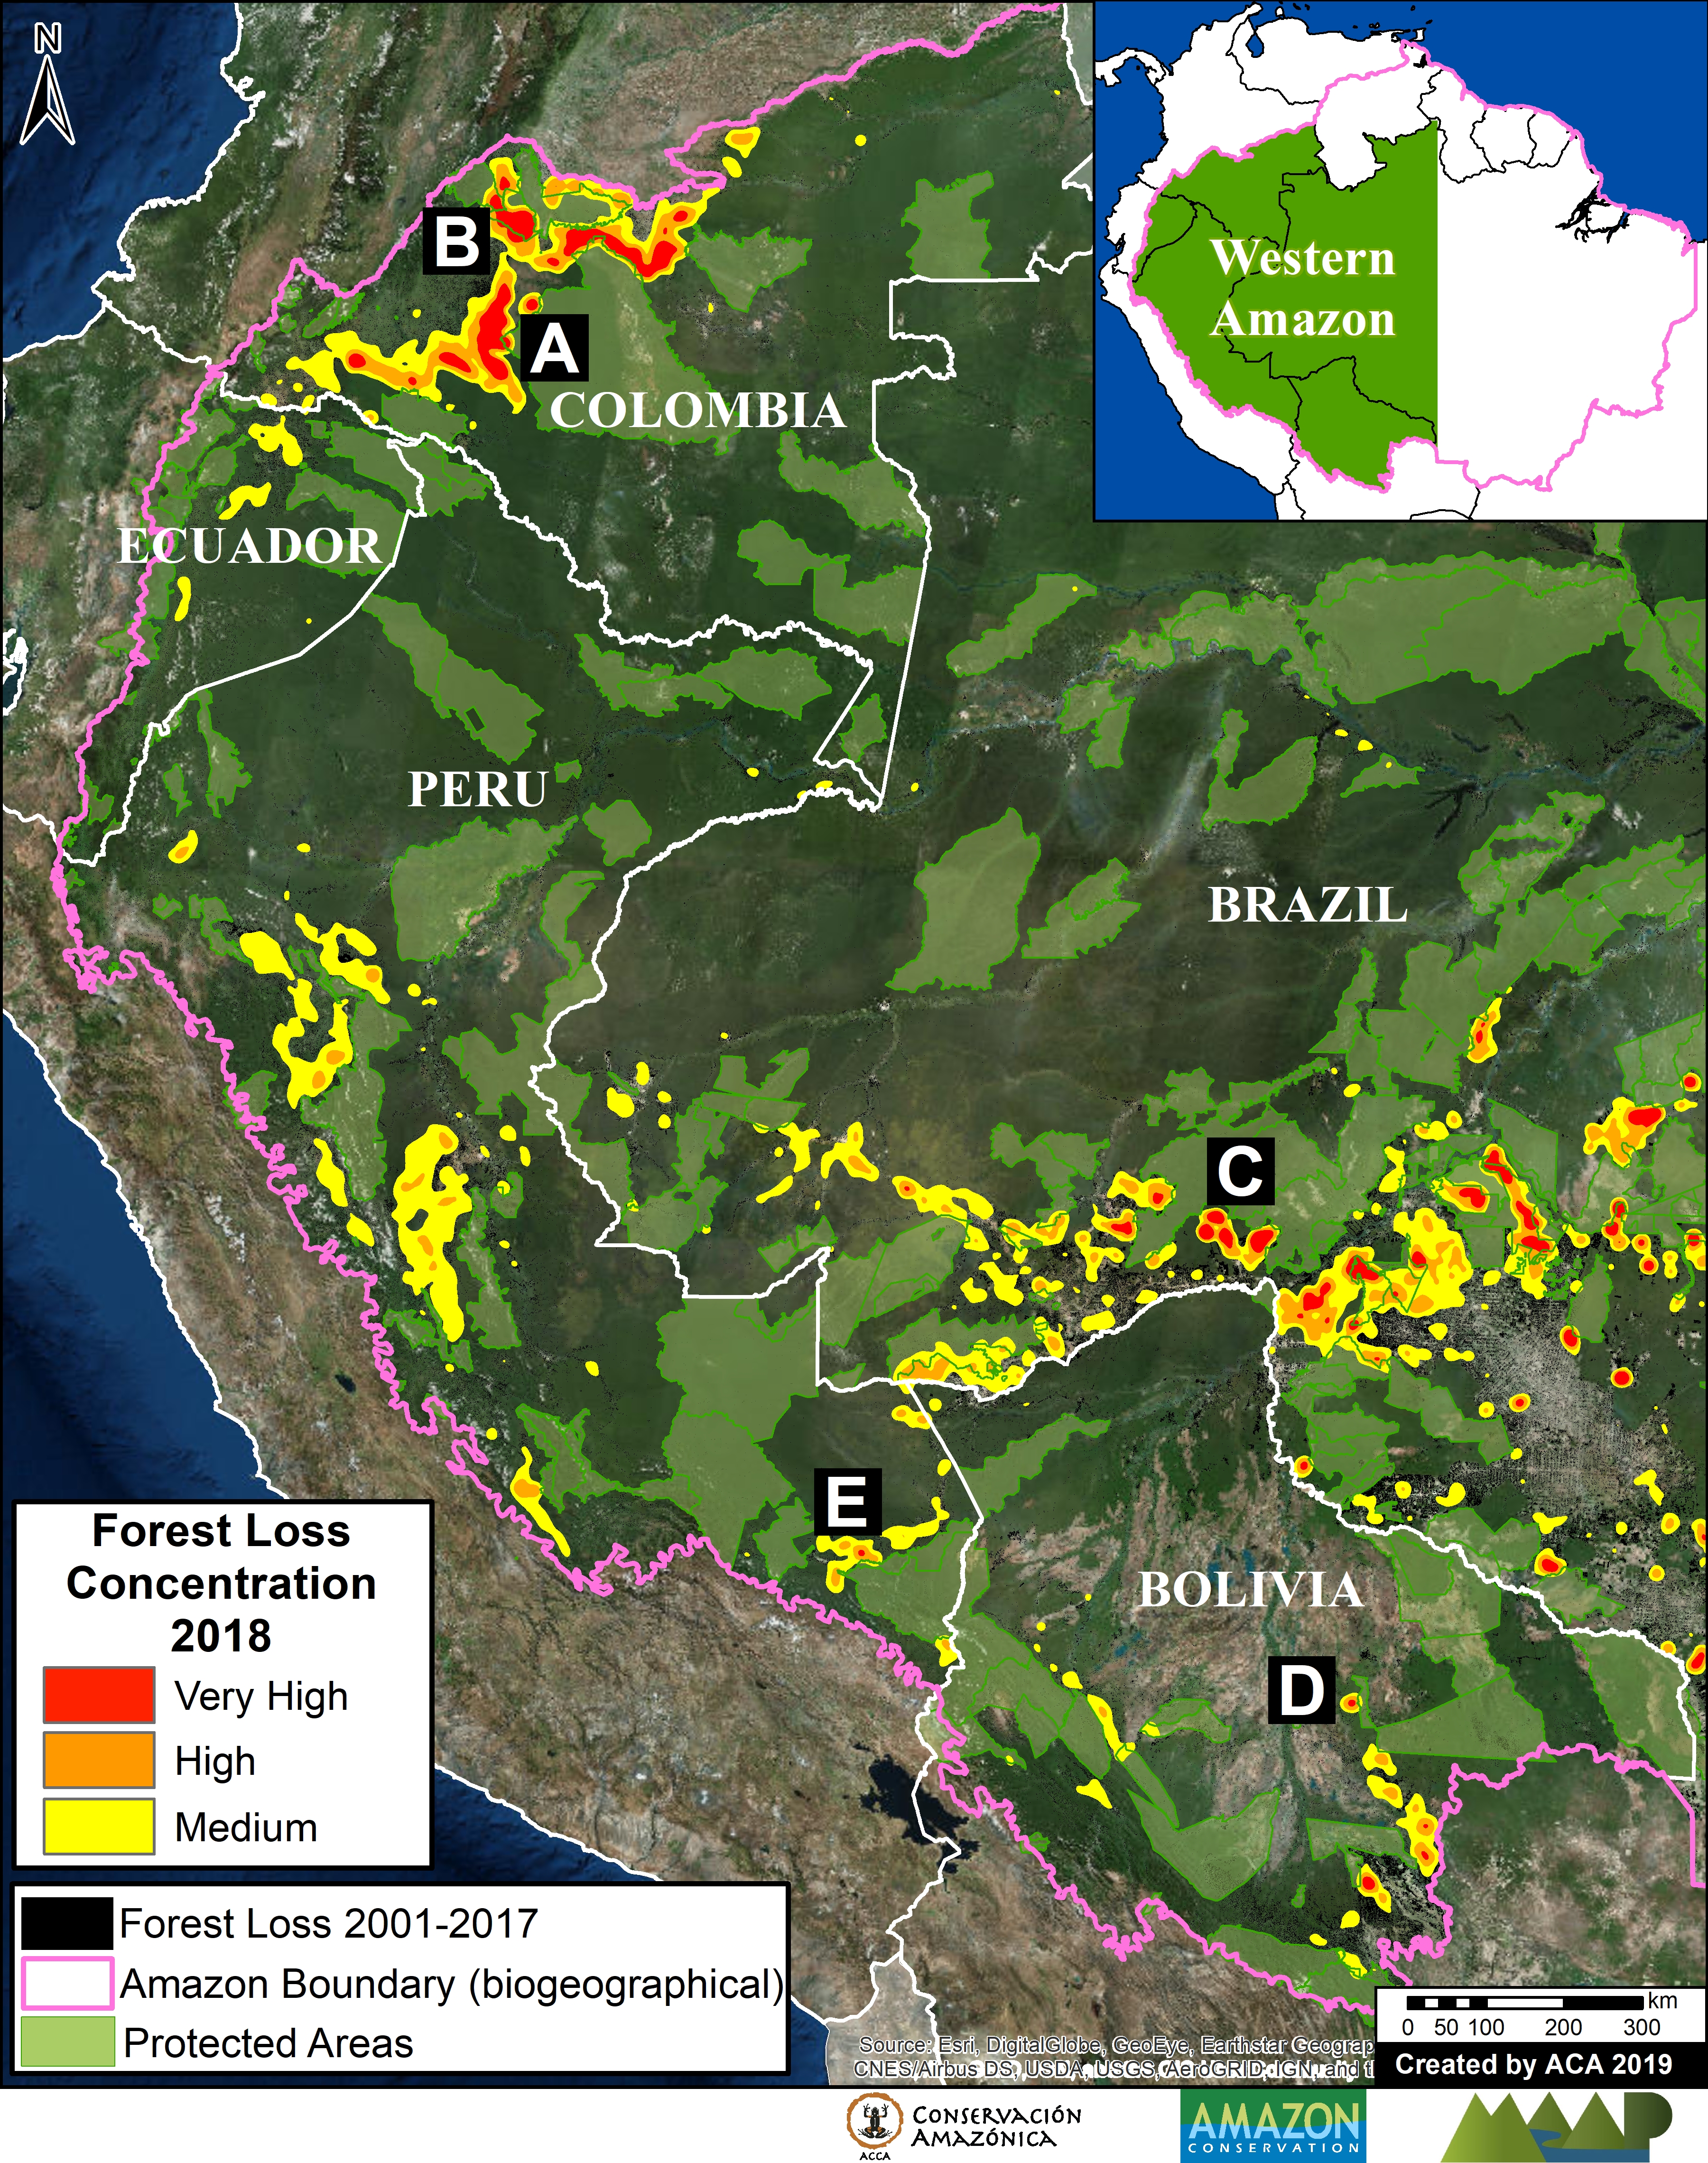
Image 2: Deforestation hotspots 2015-2017. Data: Hansen/UMD/Google/USGS/NASA.

We present the first regional-scale deforestation hotspots map across the Andean Amazon (Colombia, Ecuador, Peru).  Image 2 shows the results for the past three, 2015 – 2017.

The most critical zones (“high” deforestation density) are indicated in red. They include:

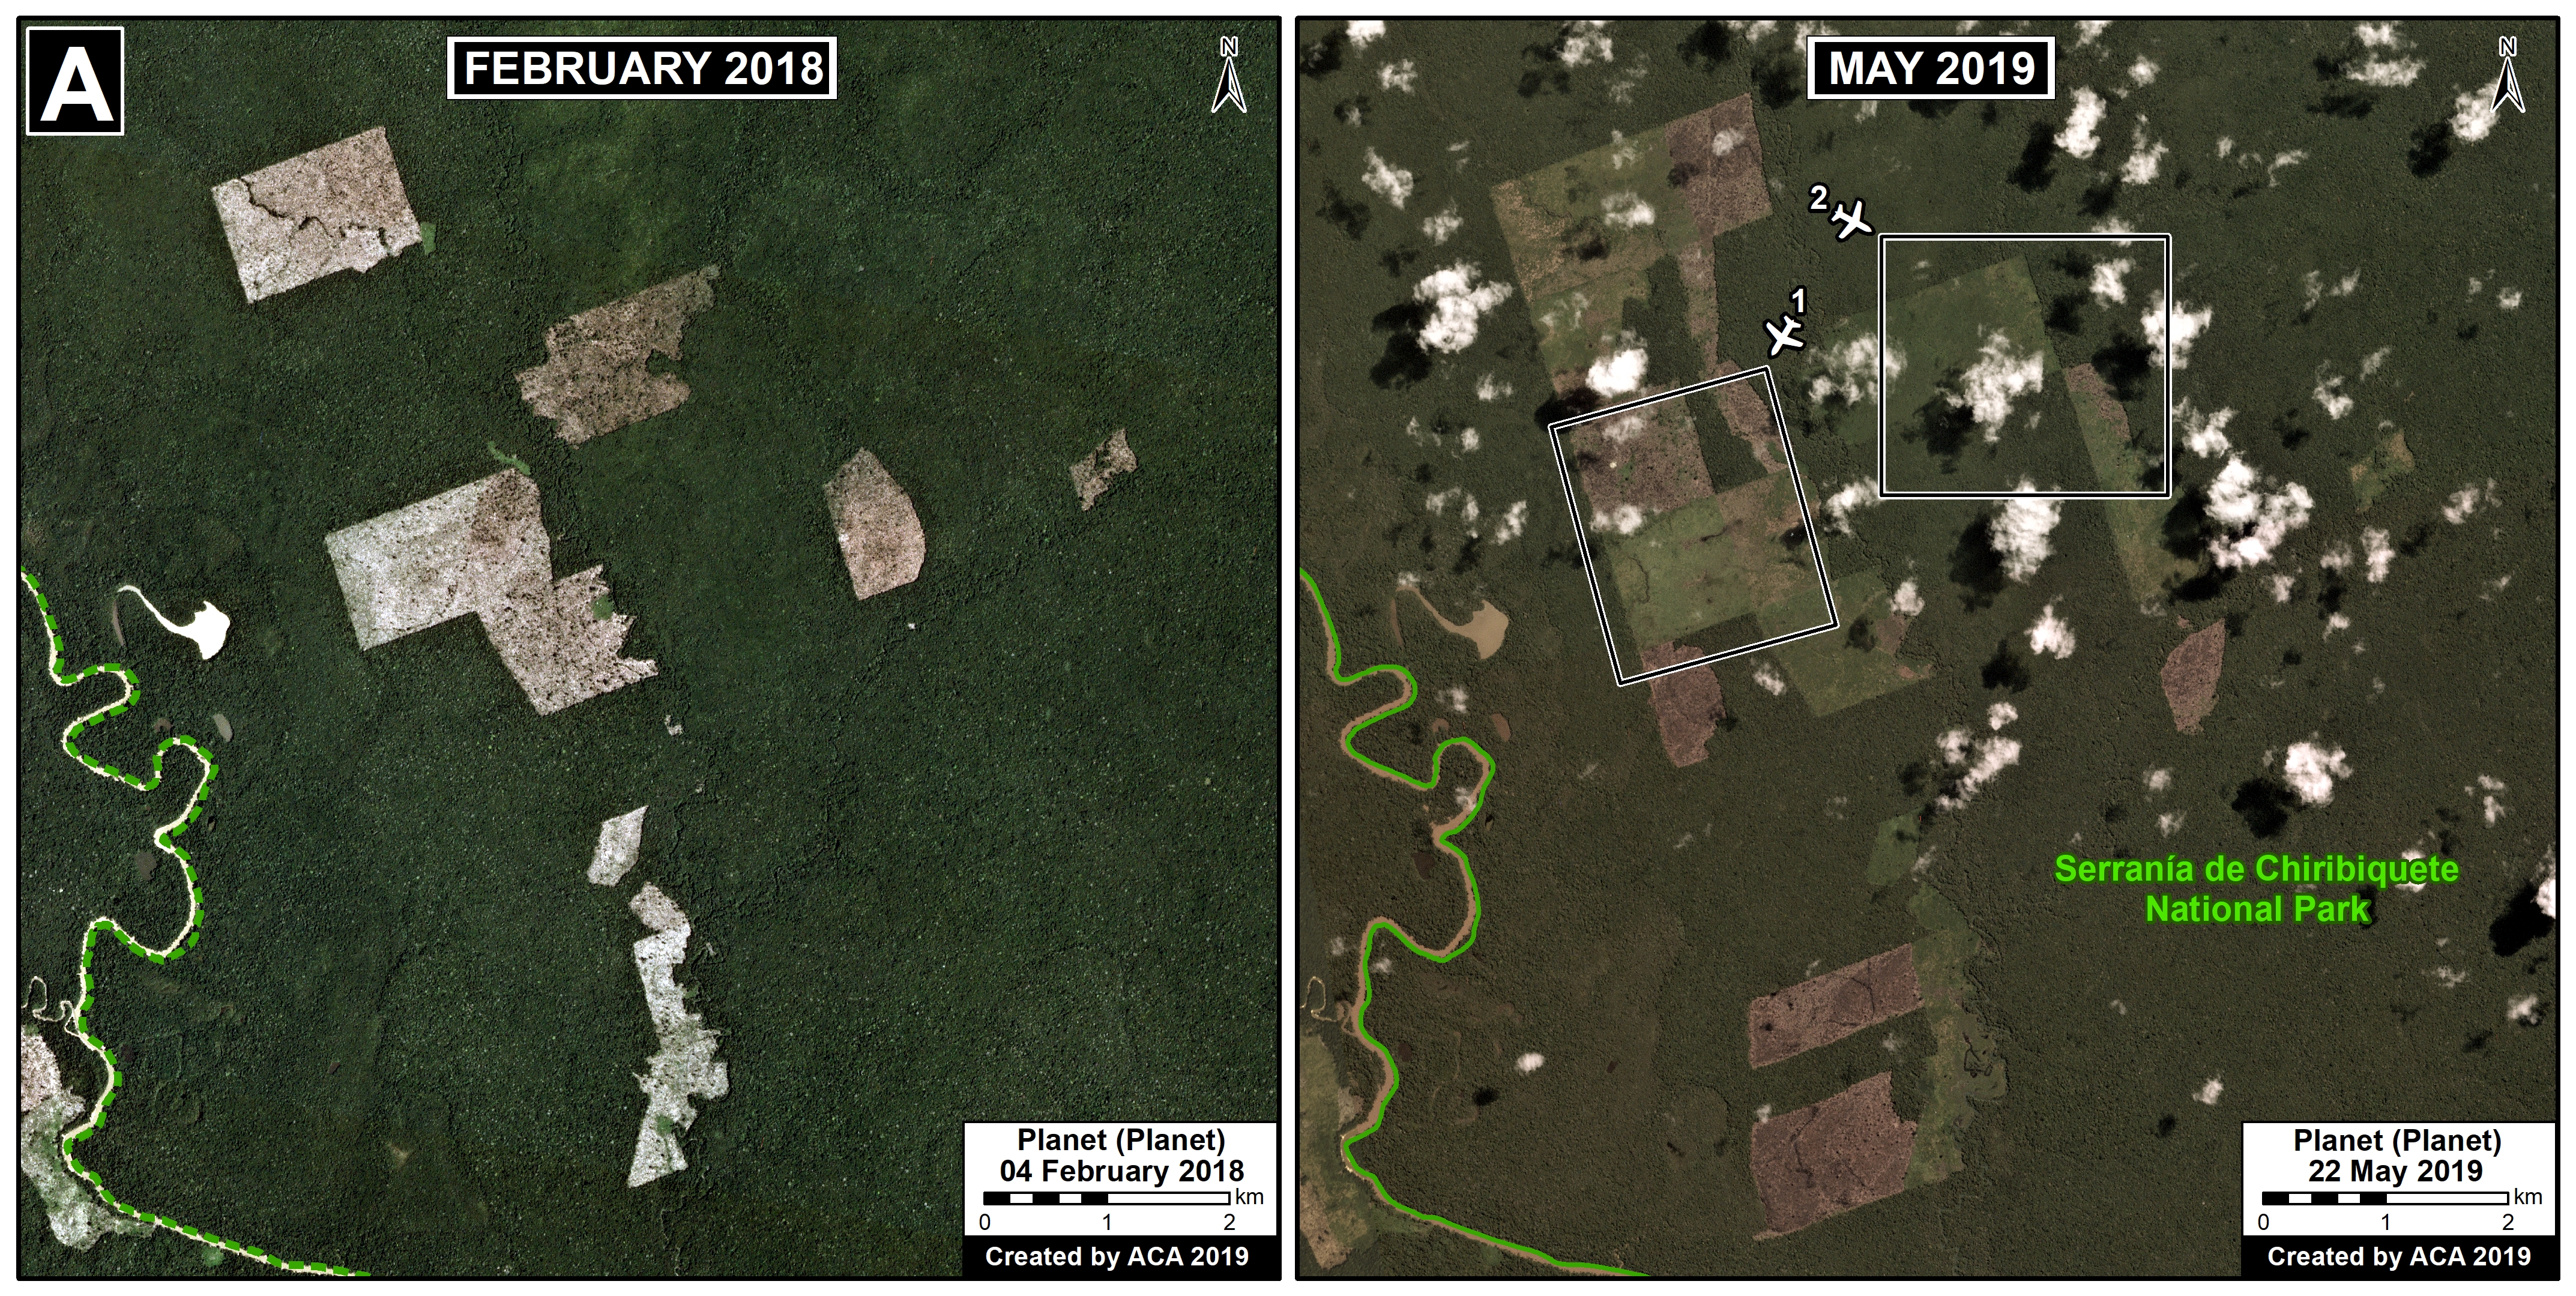
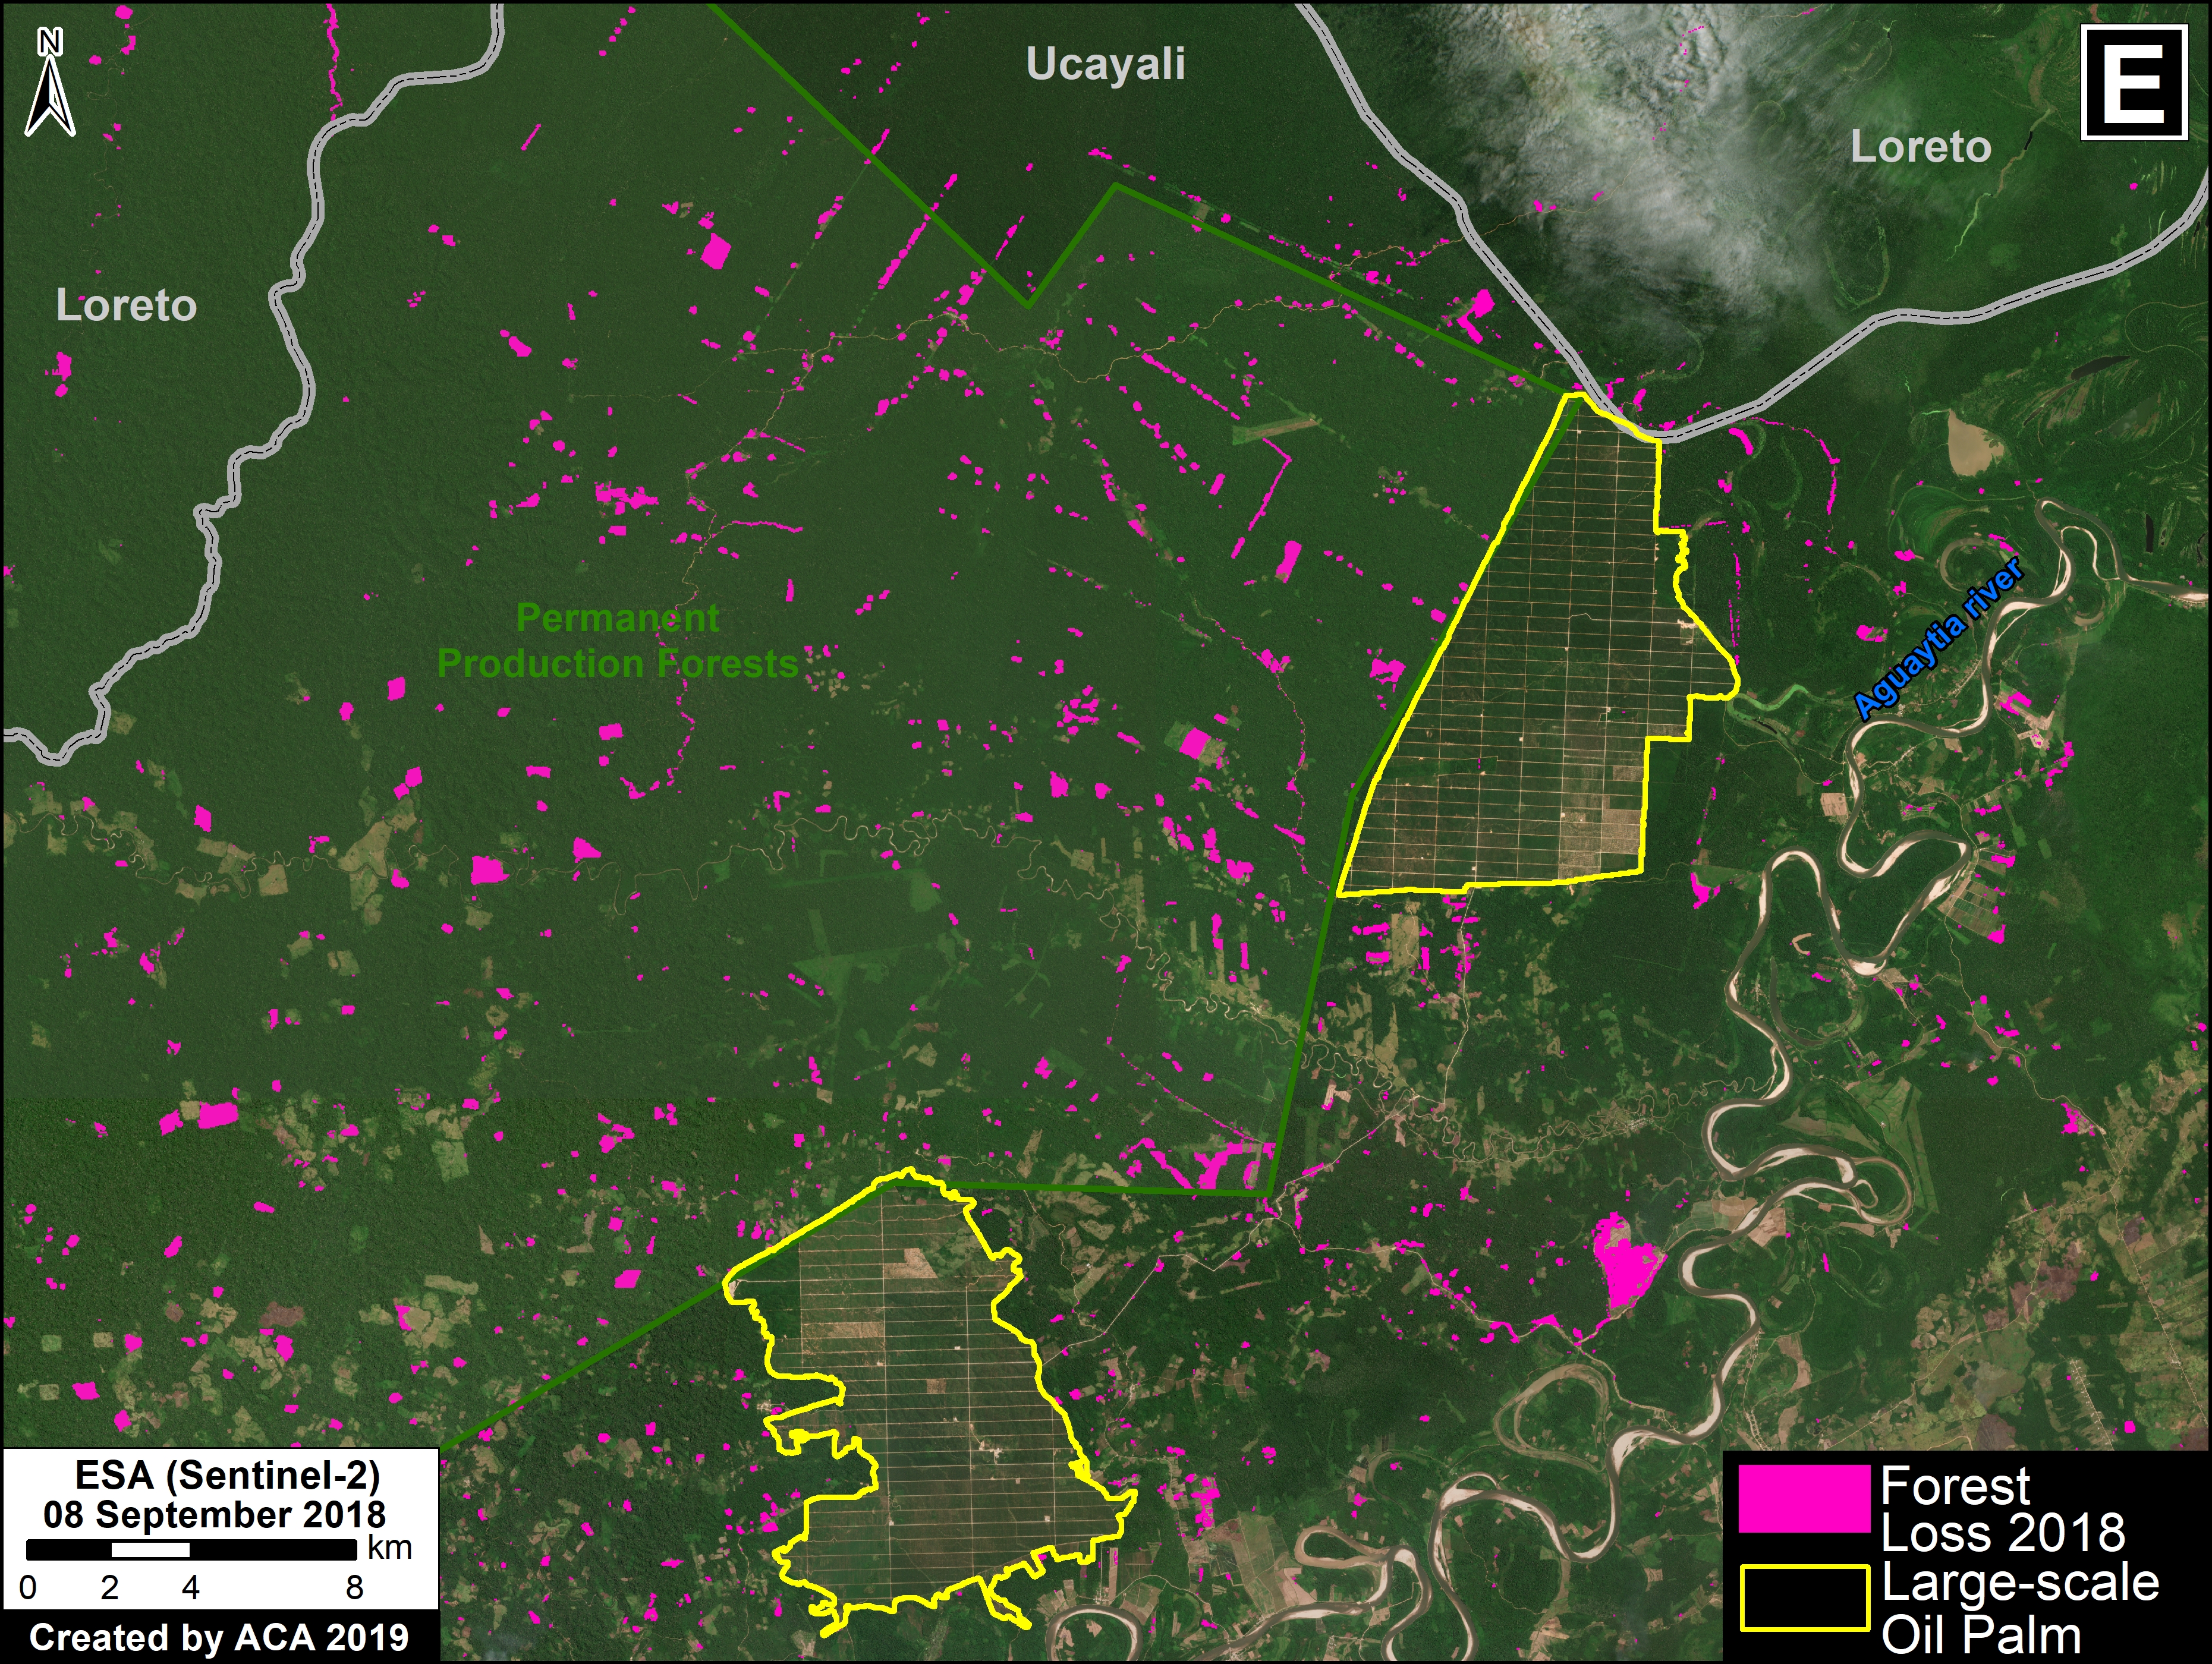
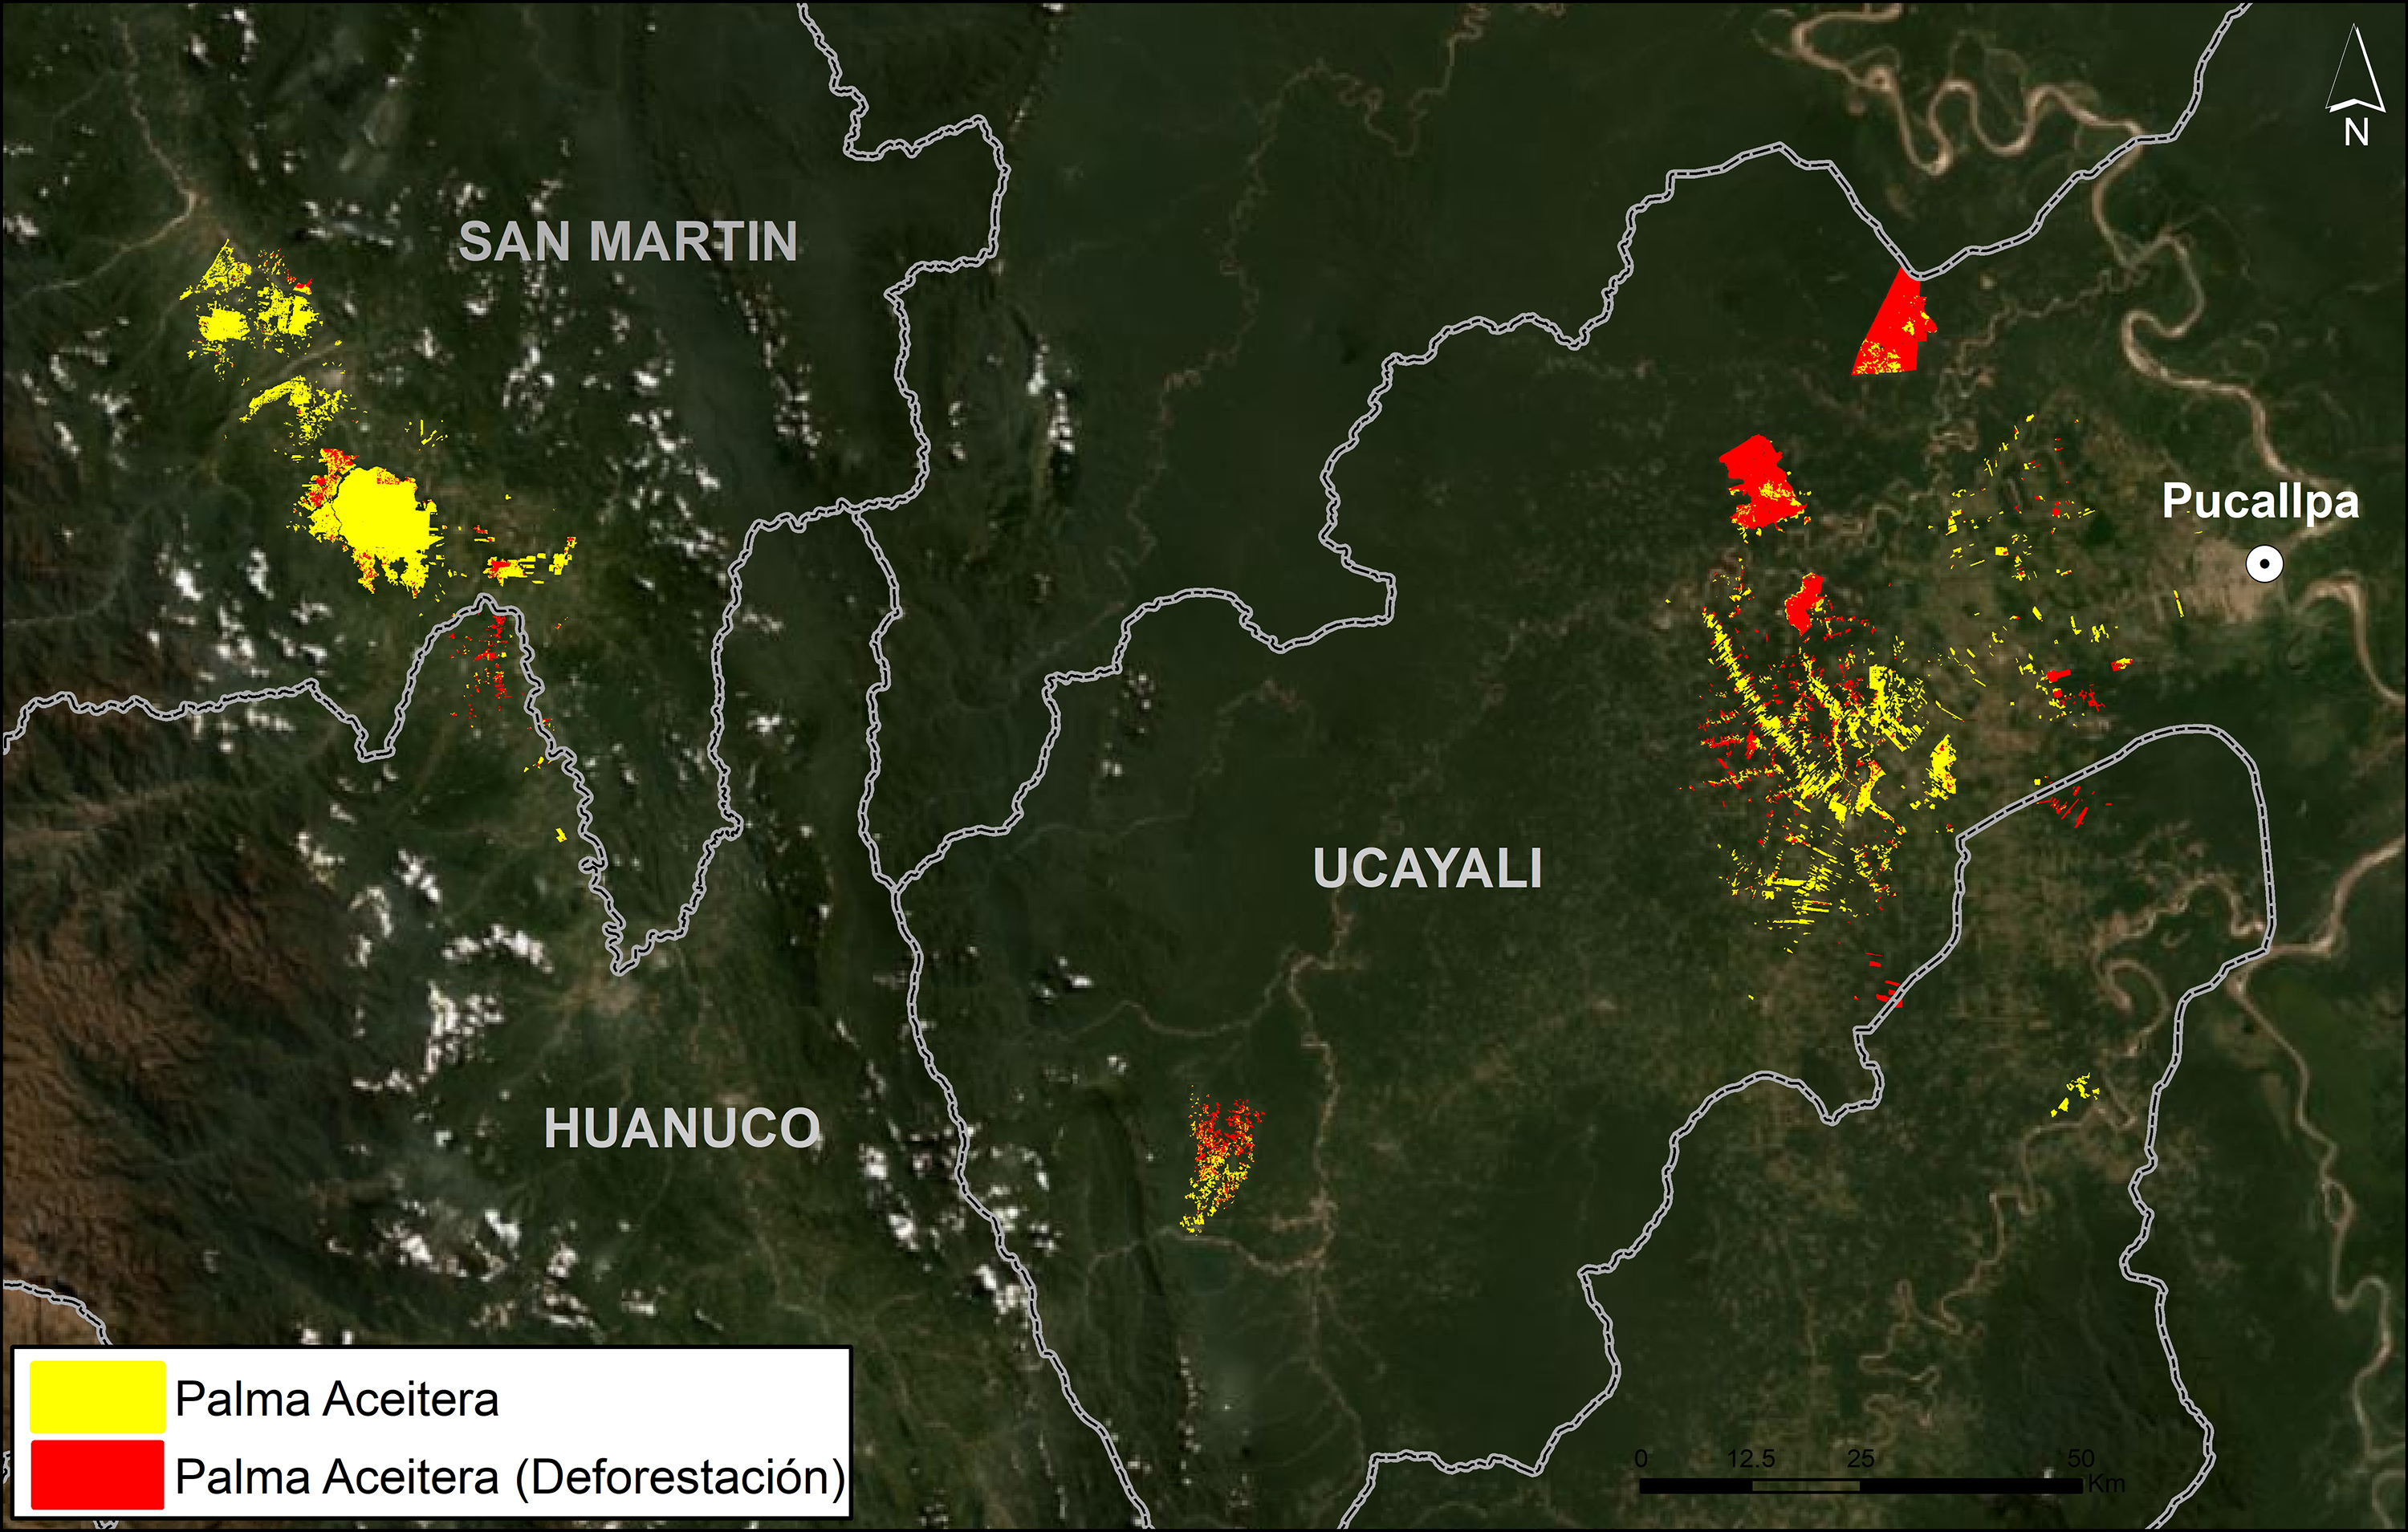
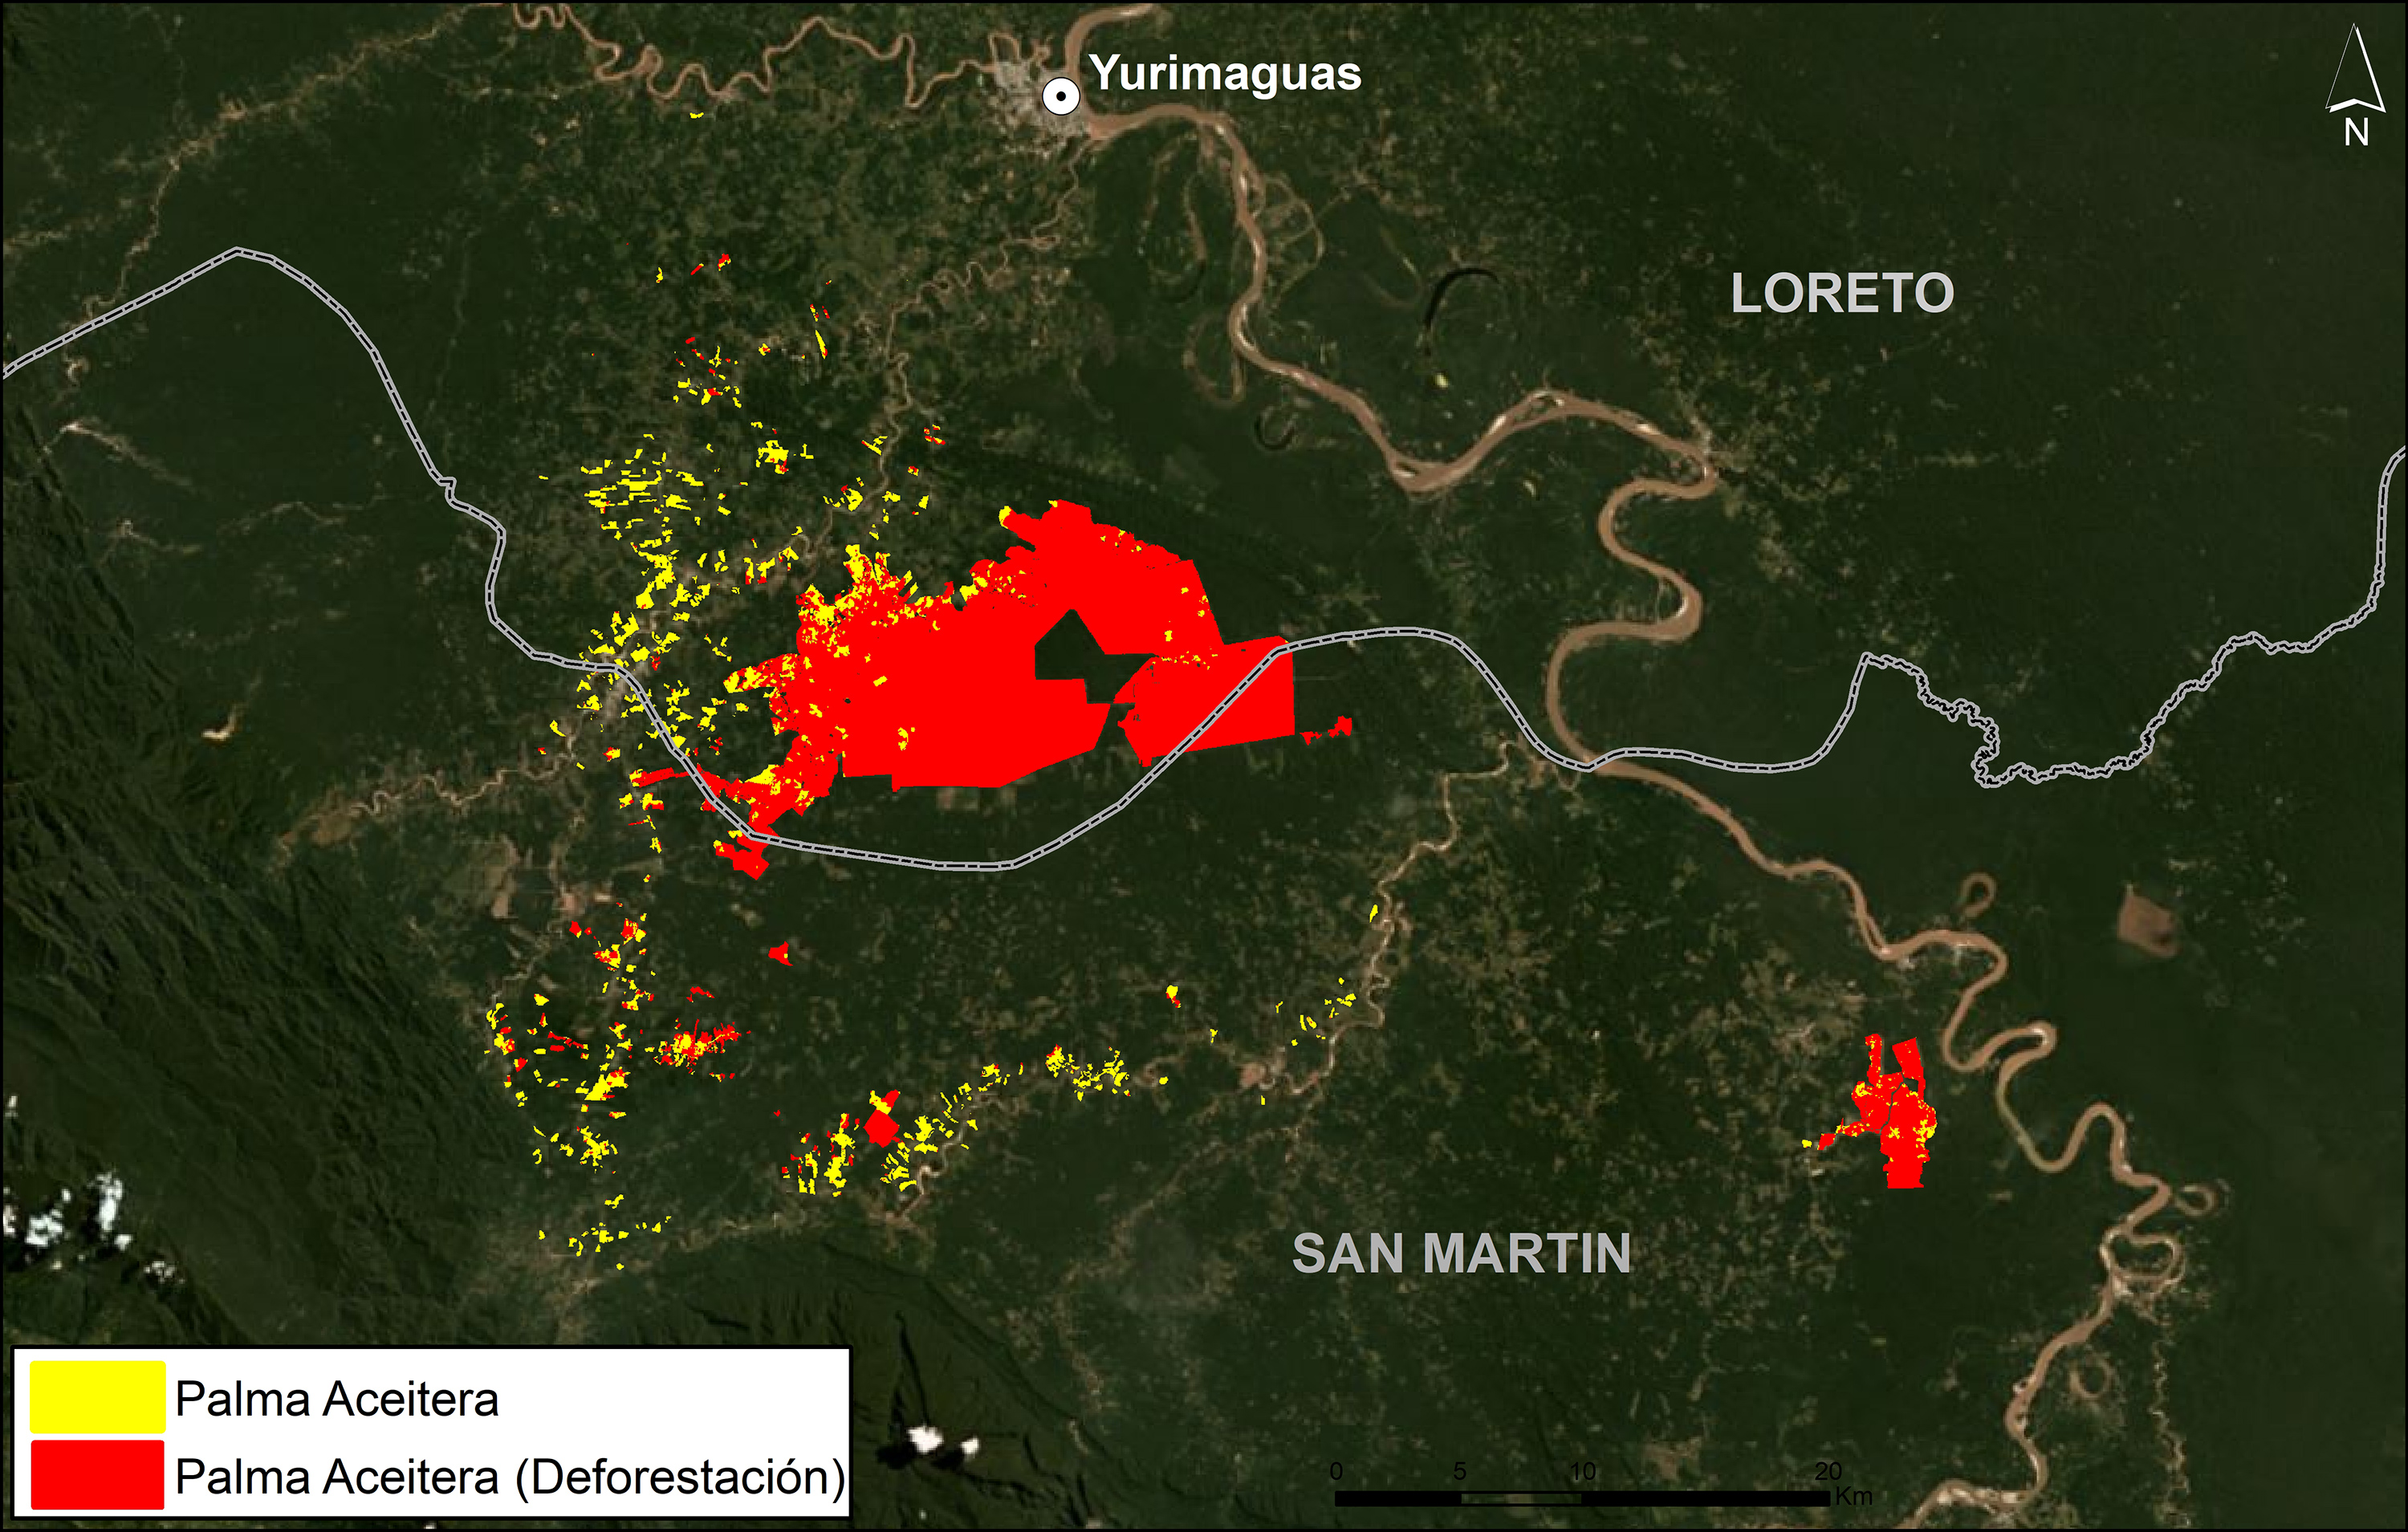
A. Central Peruvian Amazon: Over the last 10 years, this zone, located in the Ucayali and Huánuco regions, has consistently had one of the largest concentrations of deforestation in Peru (Inset A).  Its principal drivers include oil palm and cattle grazing.

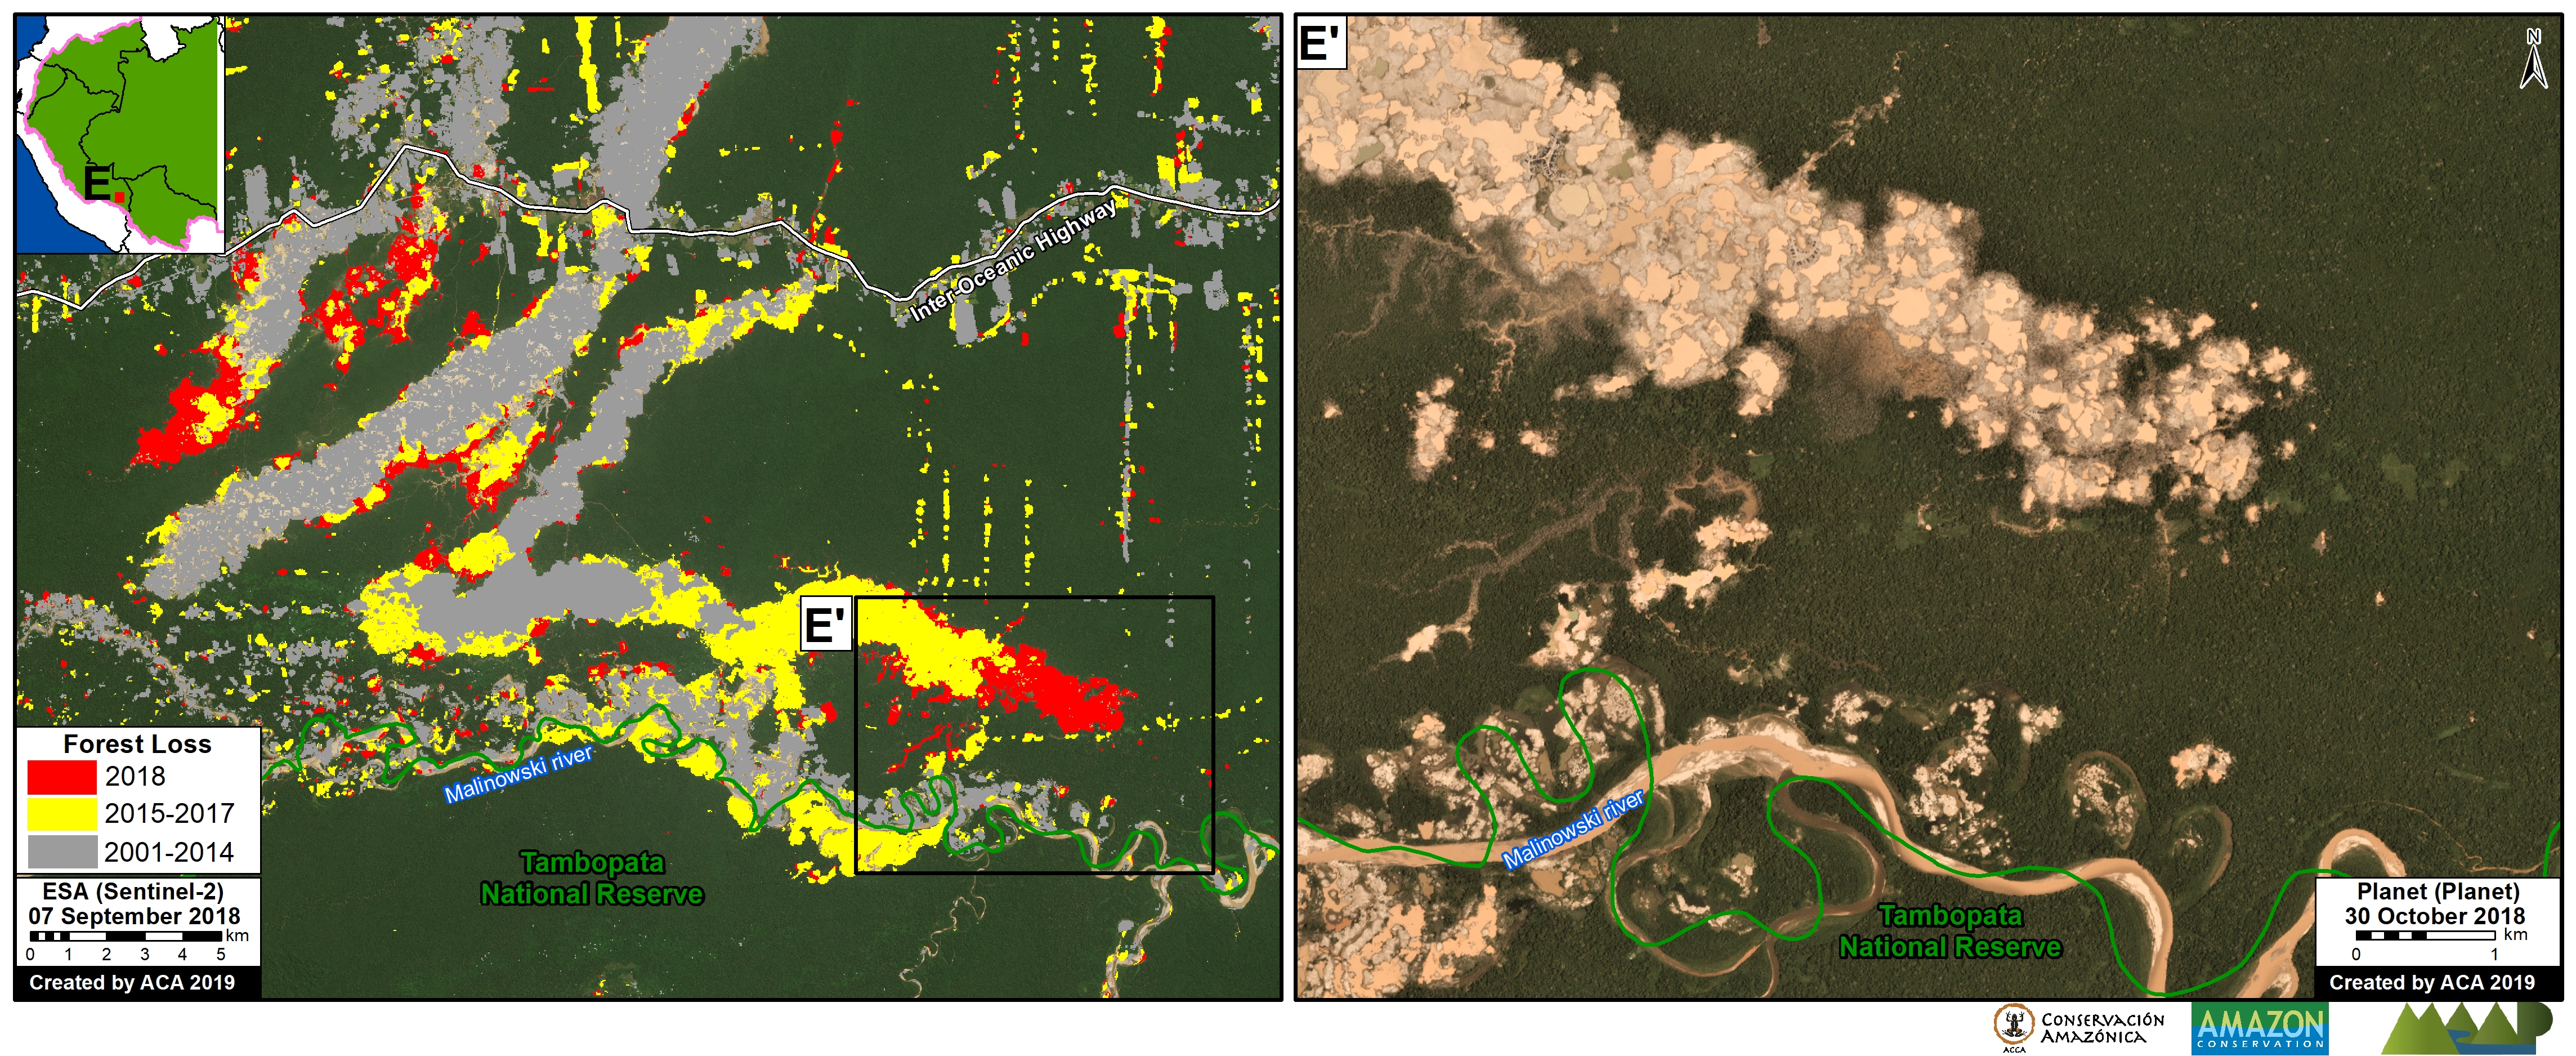
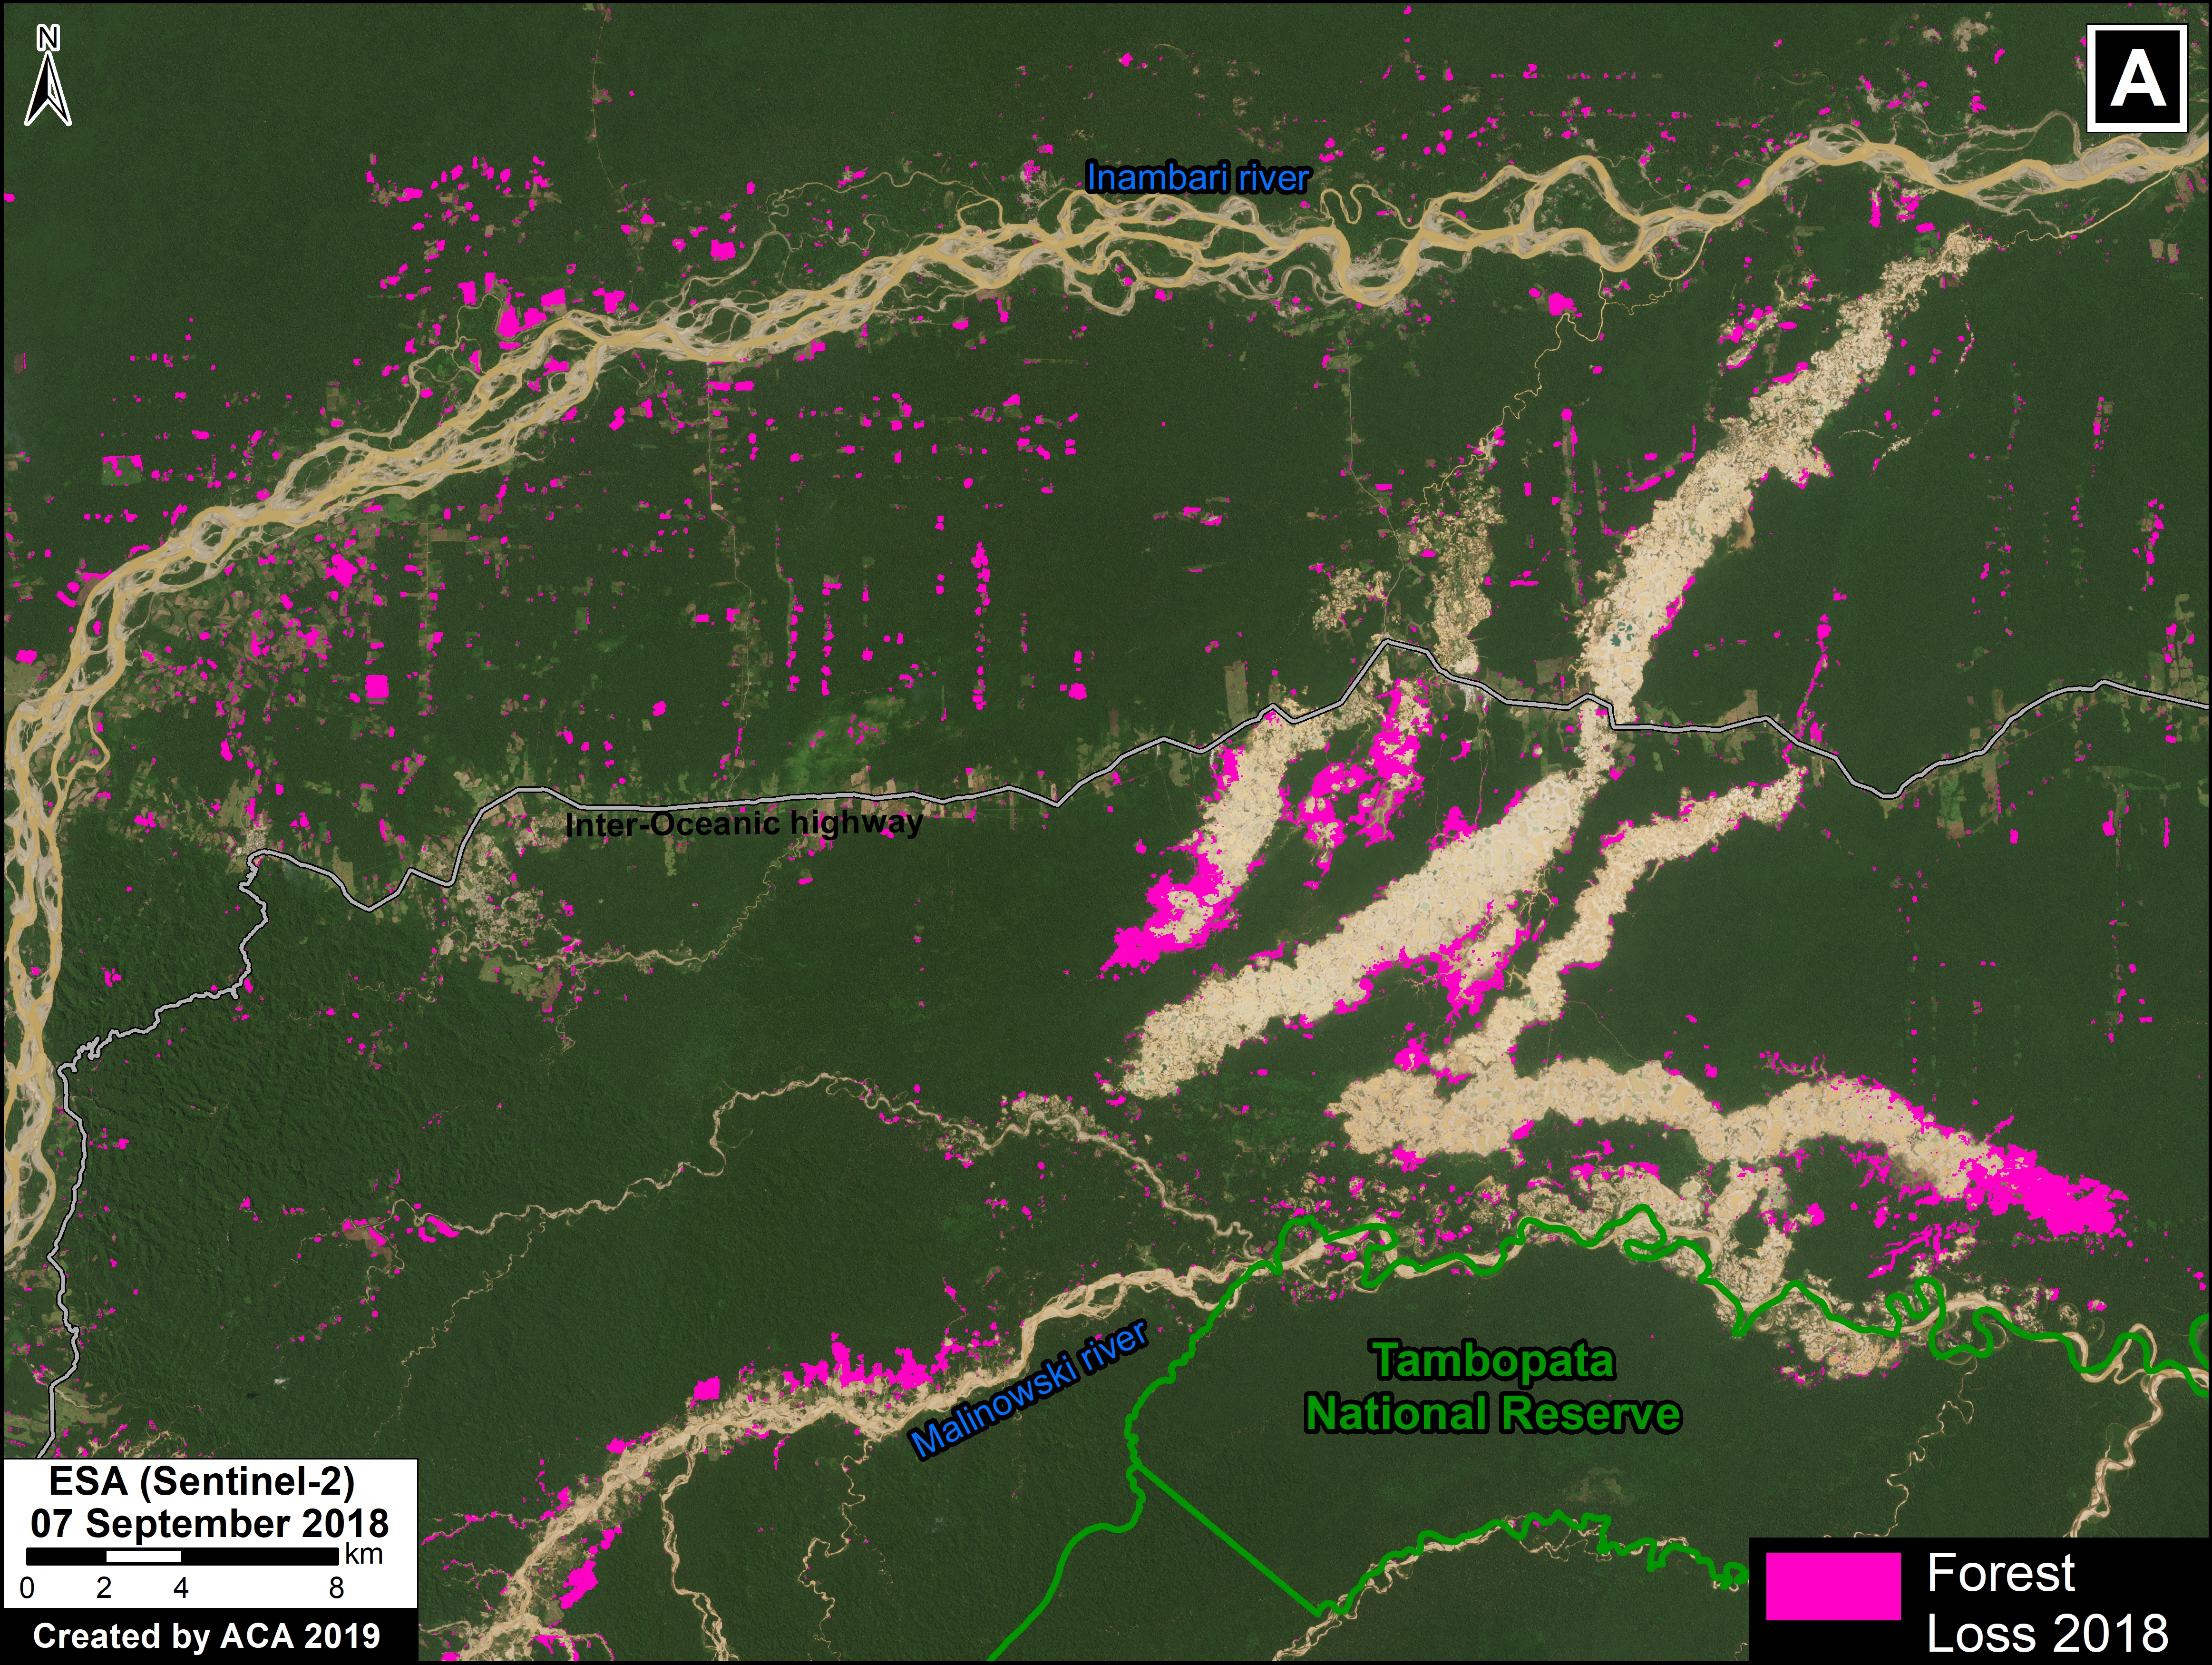
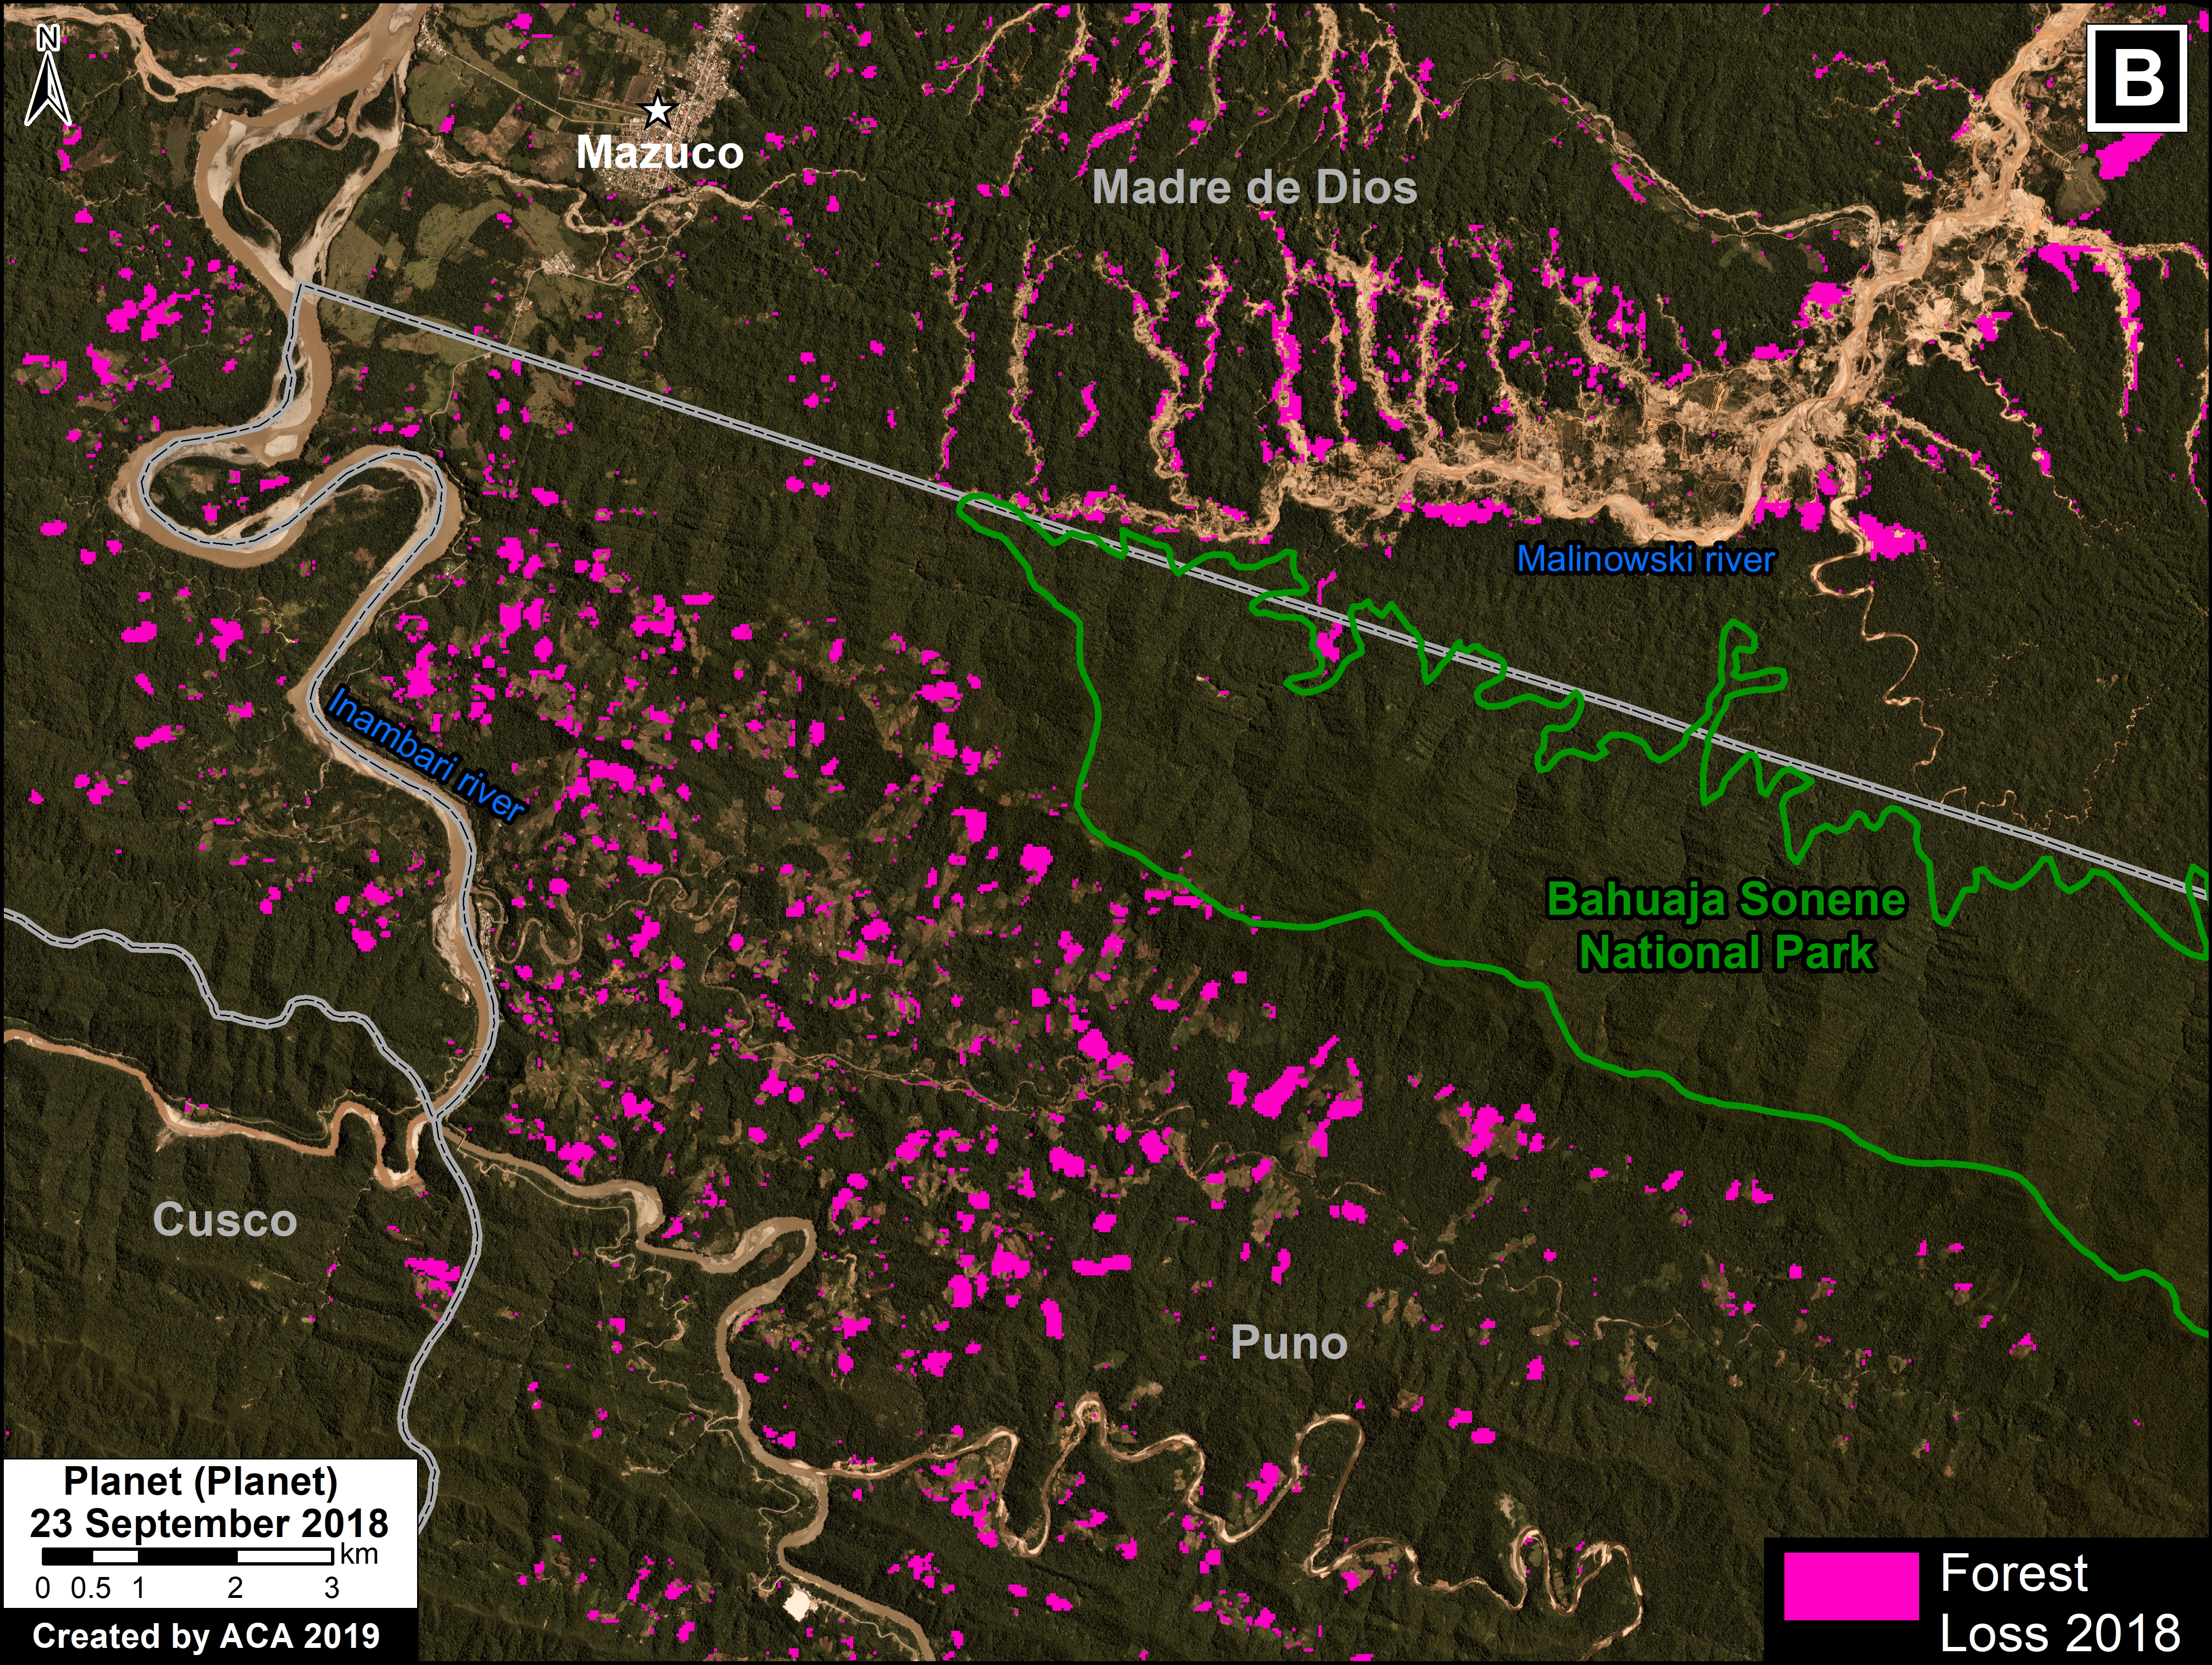
B. Southern Peruvian Amazon: This zone, located in the Madre de Dios region, is impacted by gold mining (Inset B1), and increasingly by small- and medium-scale agriculture along the Interoceanic Highway (Inset B2).

C. Central Peruvian Amazon: A new oil palm plantation located in the San Martín region has been identified as a recent large-scale deforestation event in this zone (Inset C).

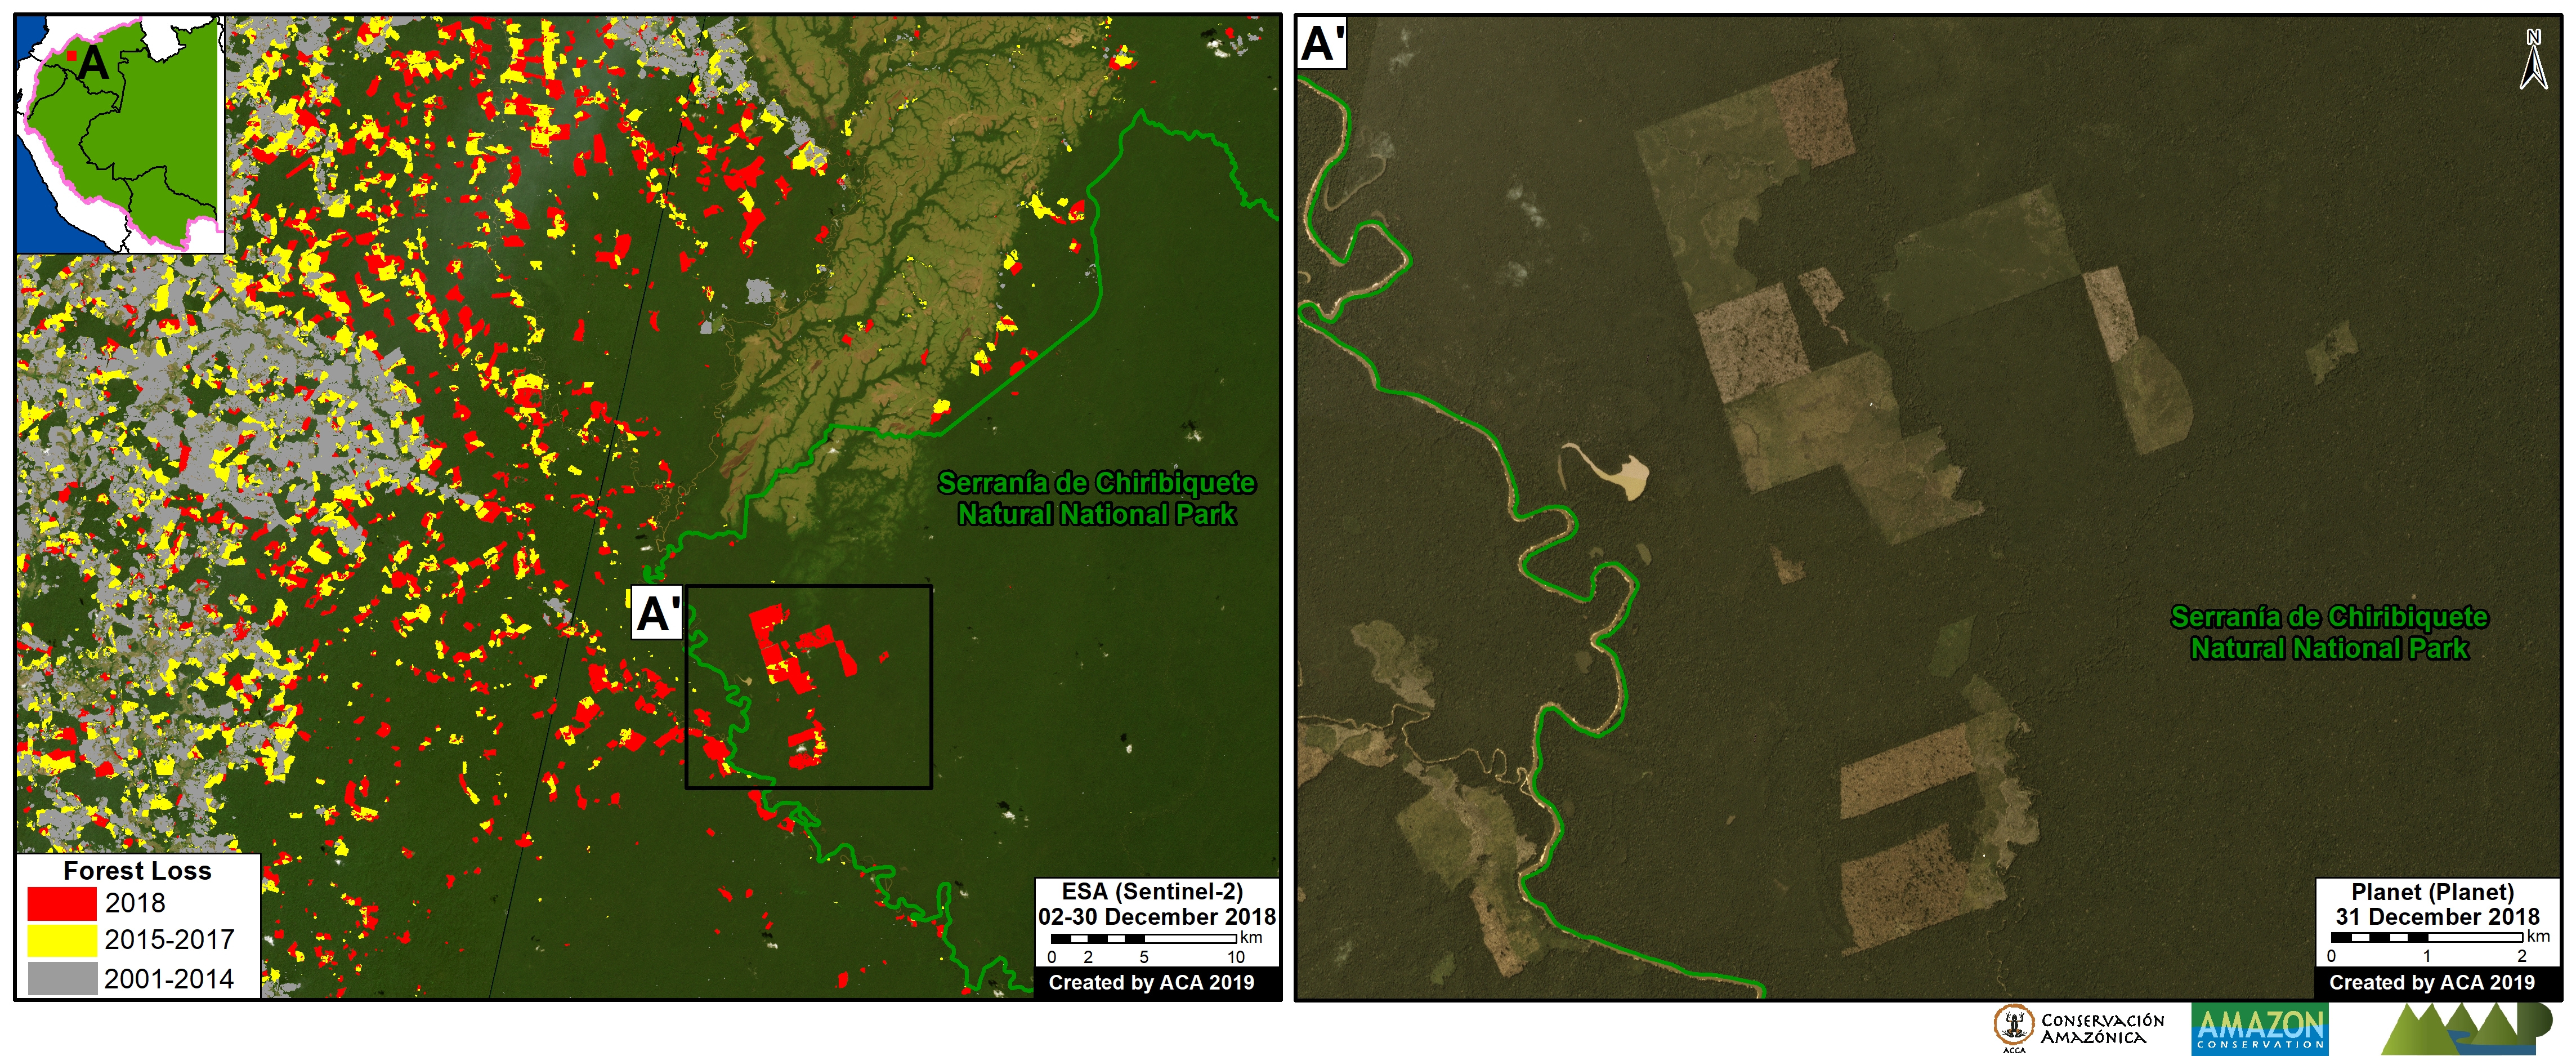
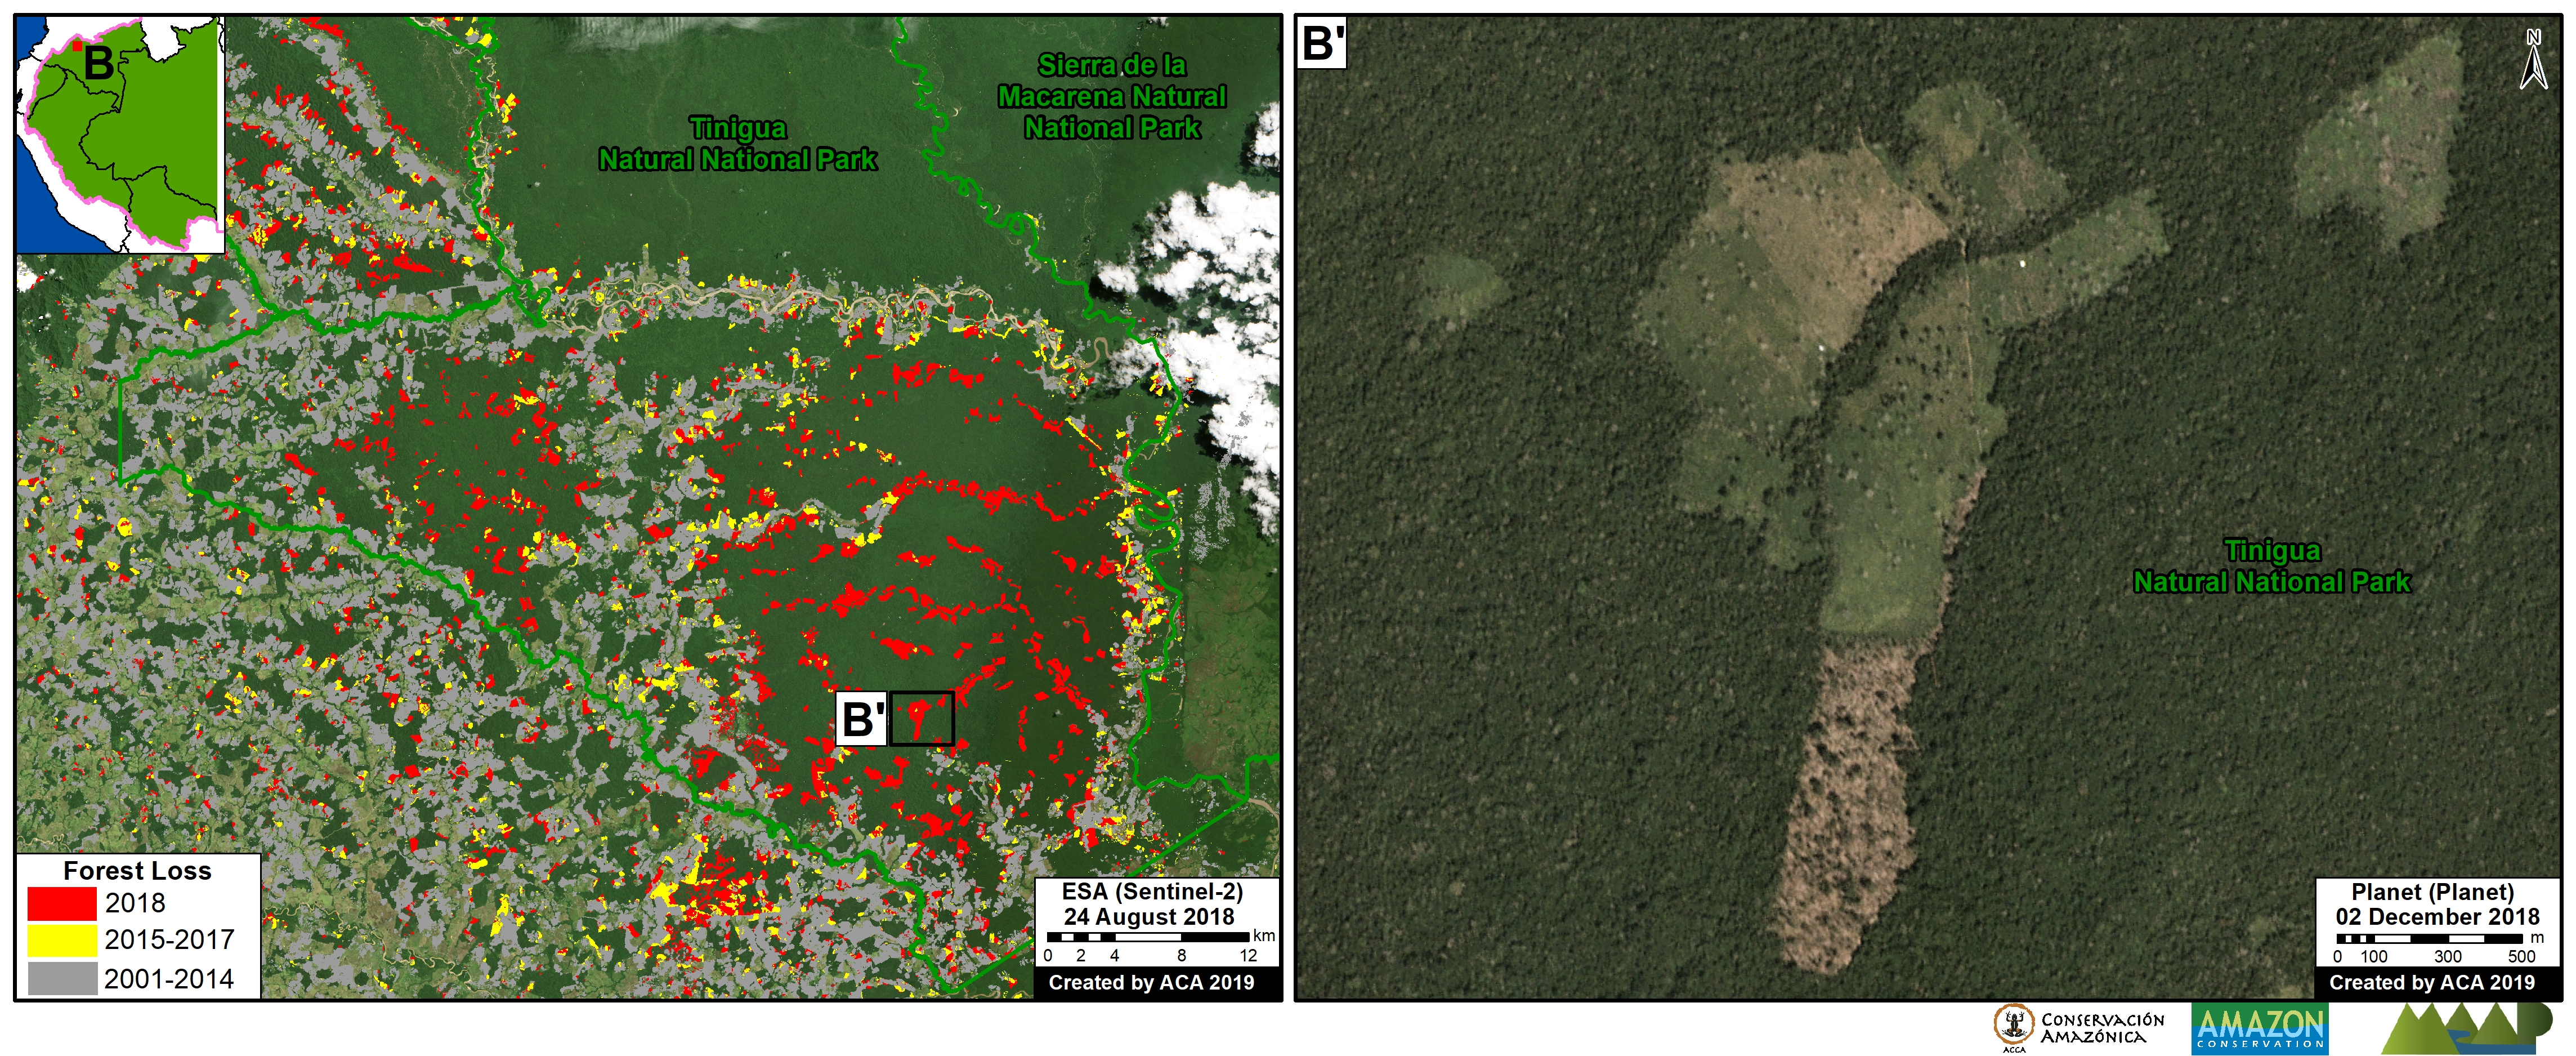
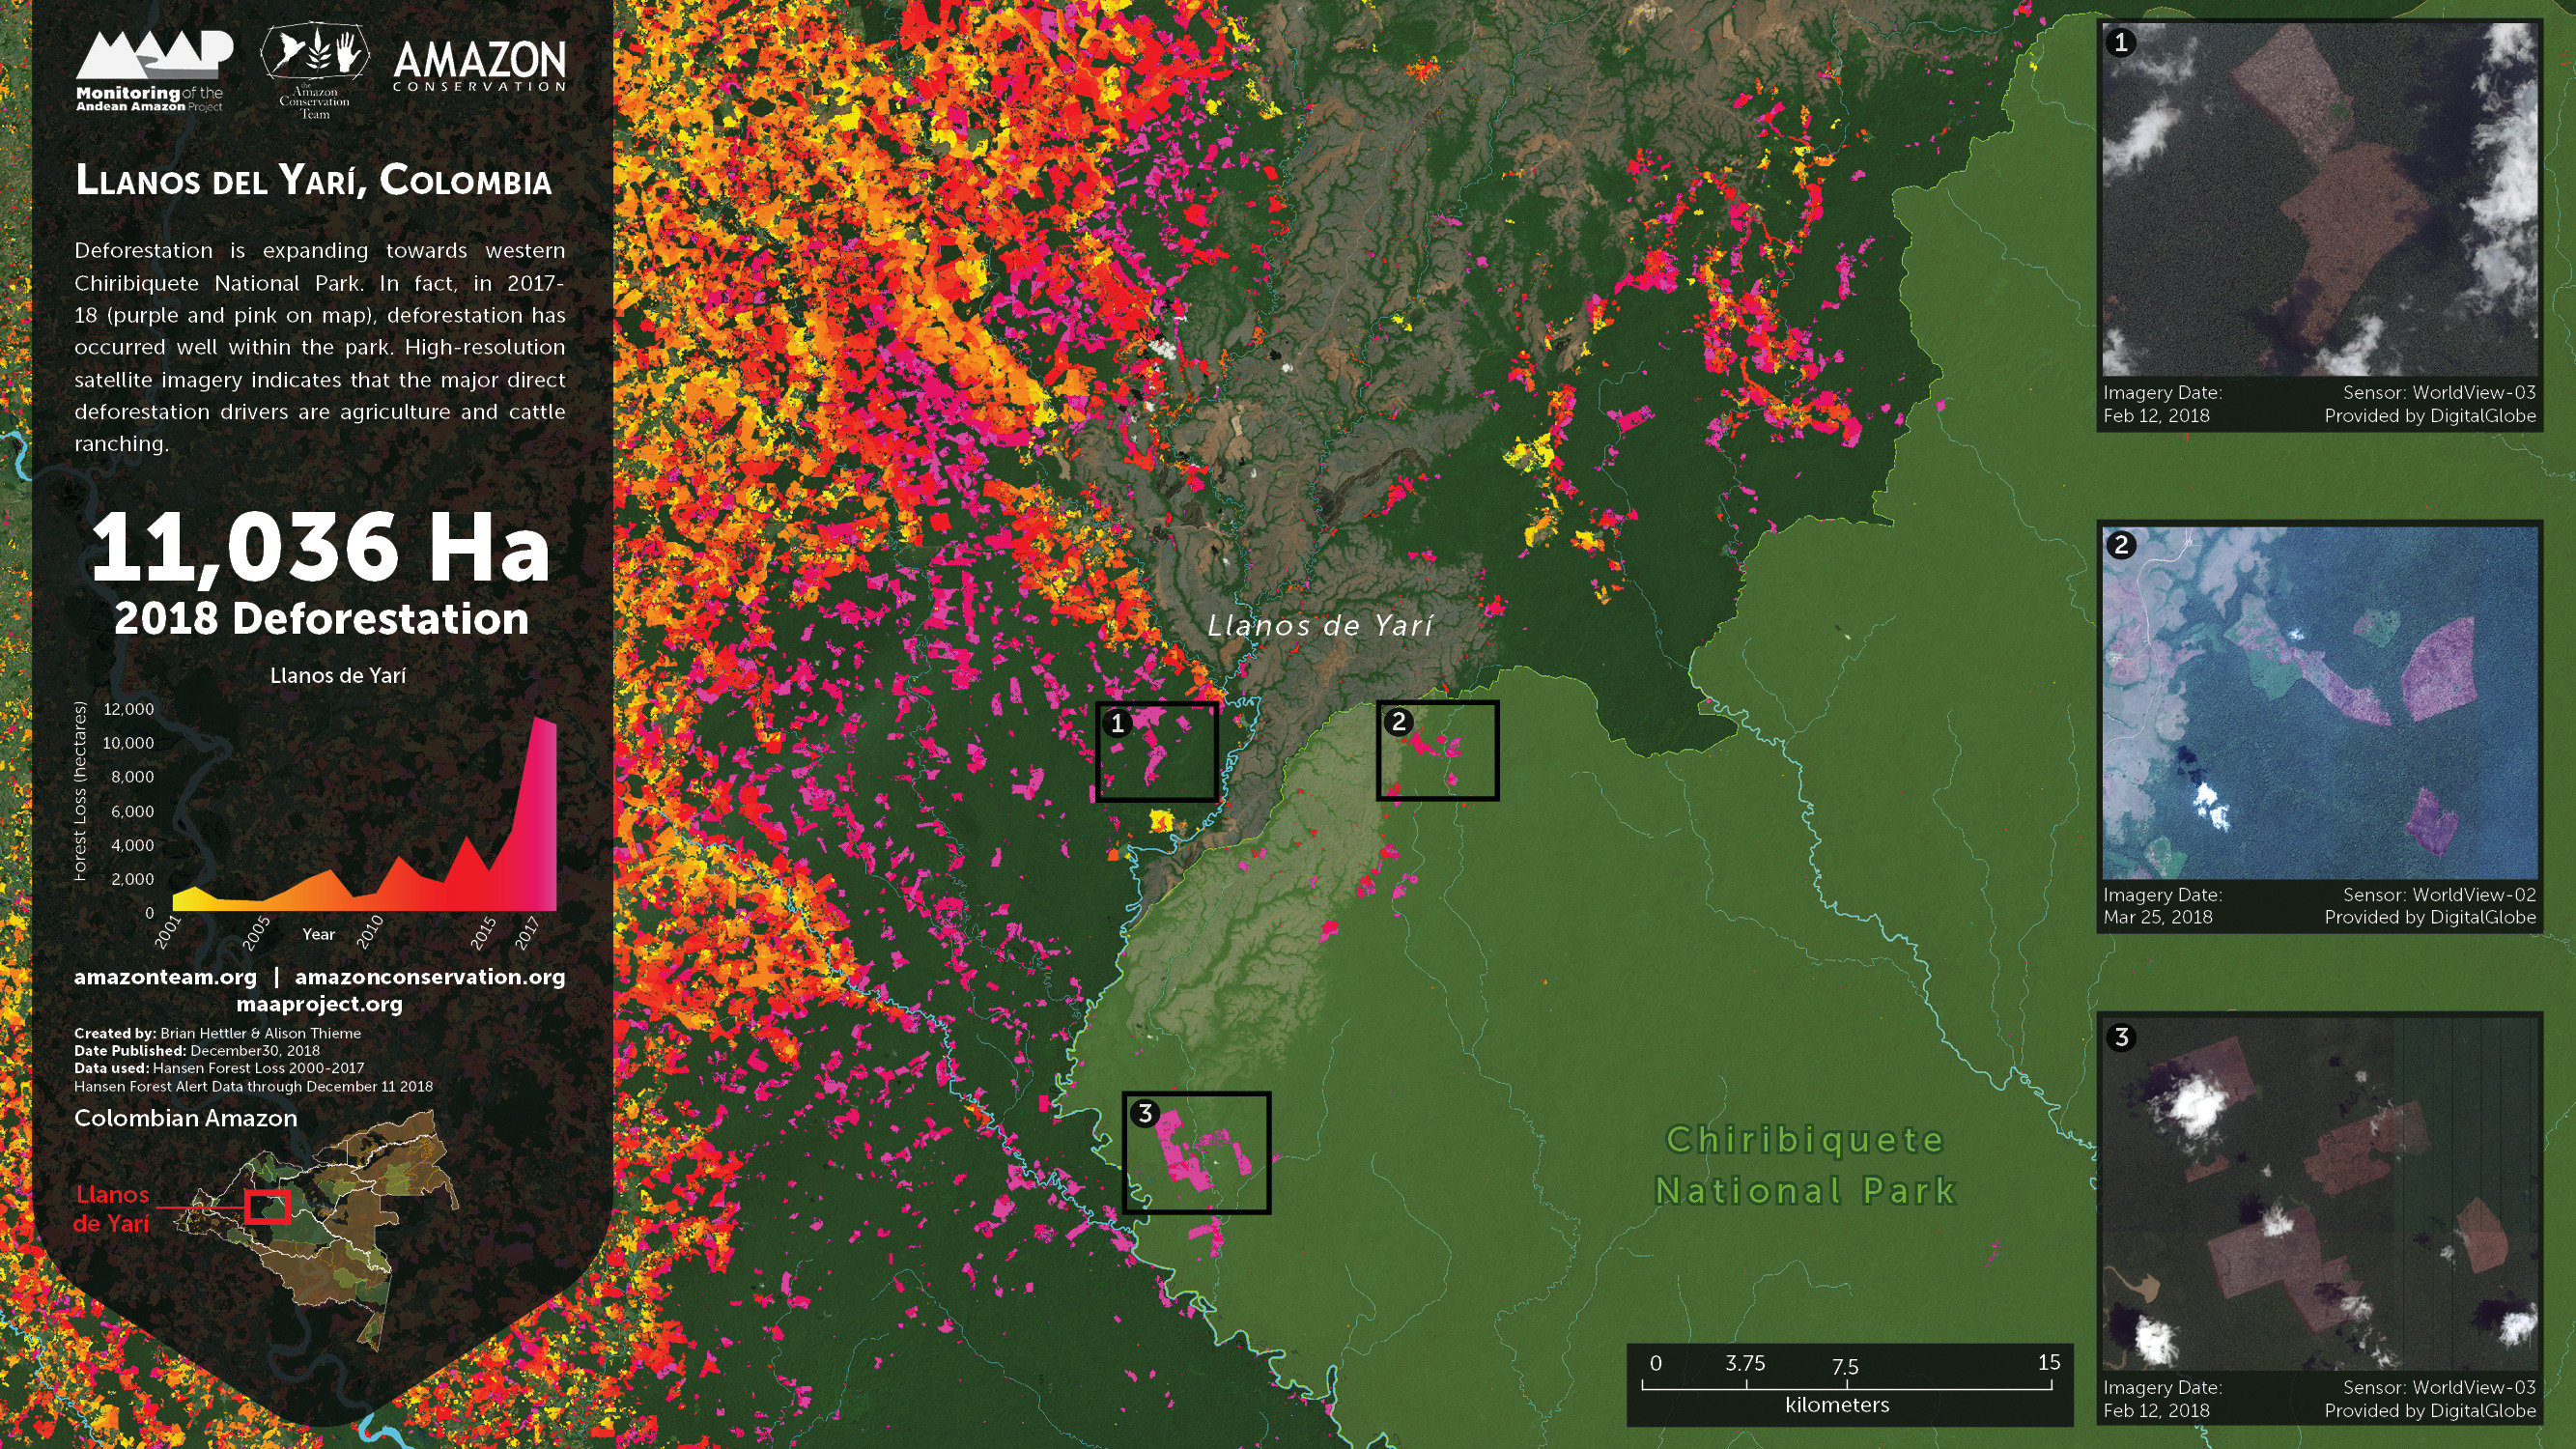
D. Southwestern Colombian Amazon: Cattle grazing is the principal deforestation driver documented in this zone, located in the departments of Caquetá and Putumayo (Inset D).

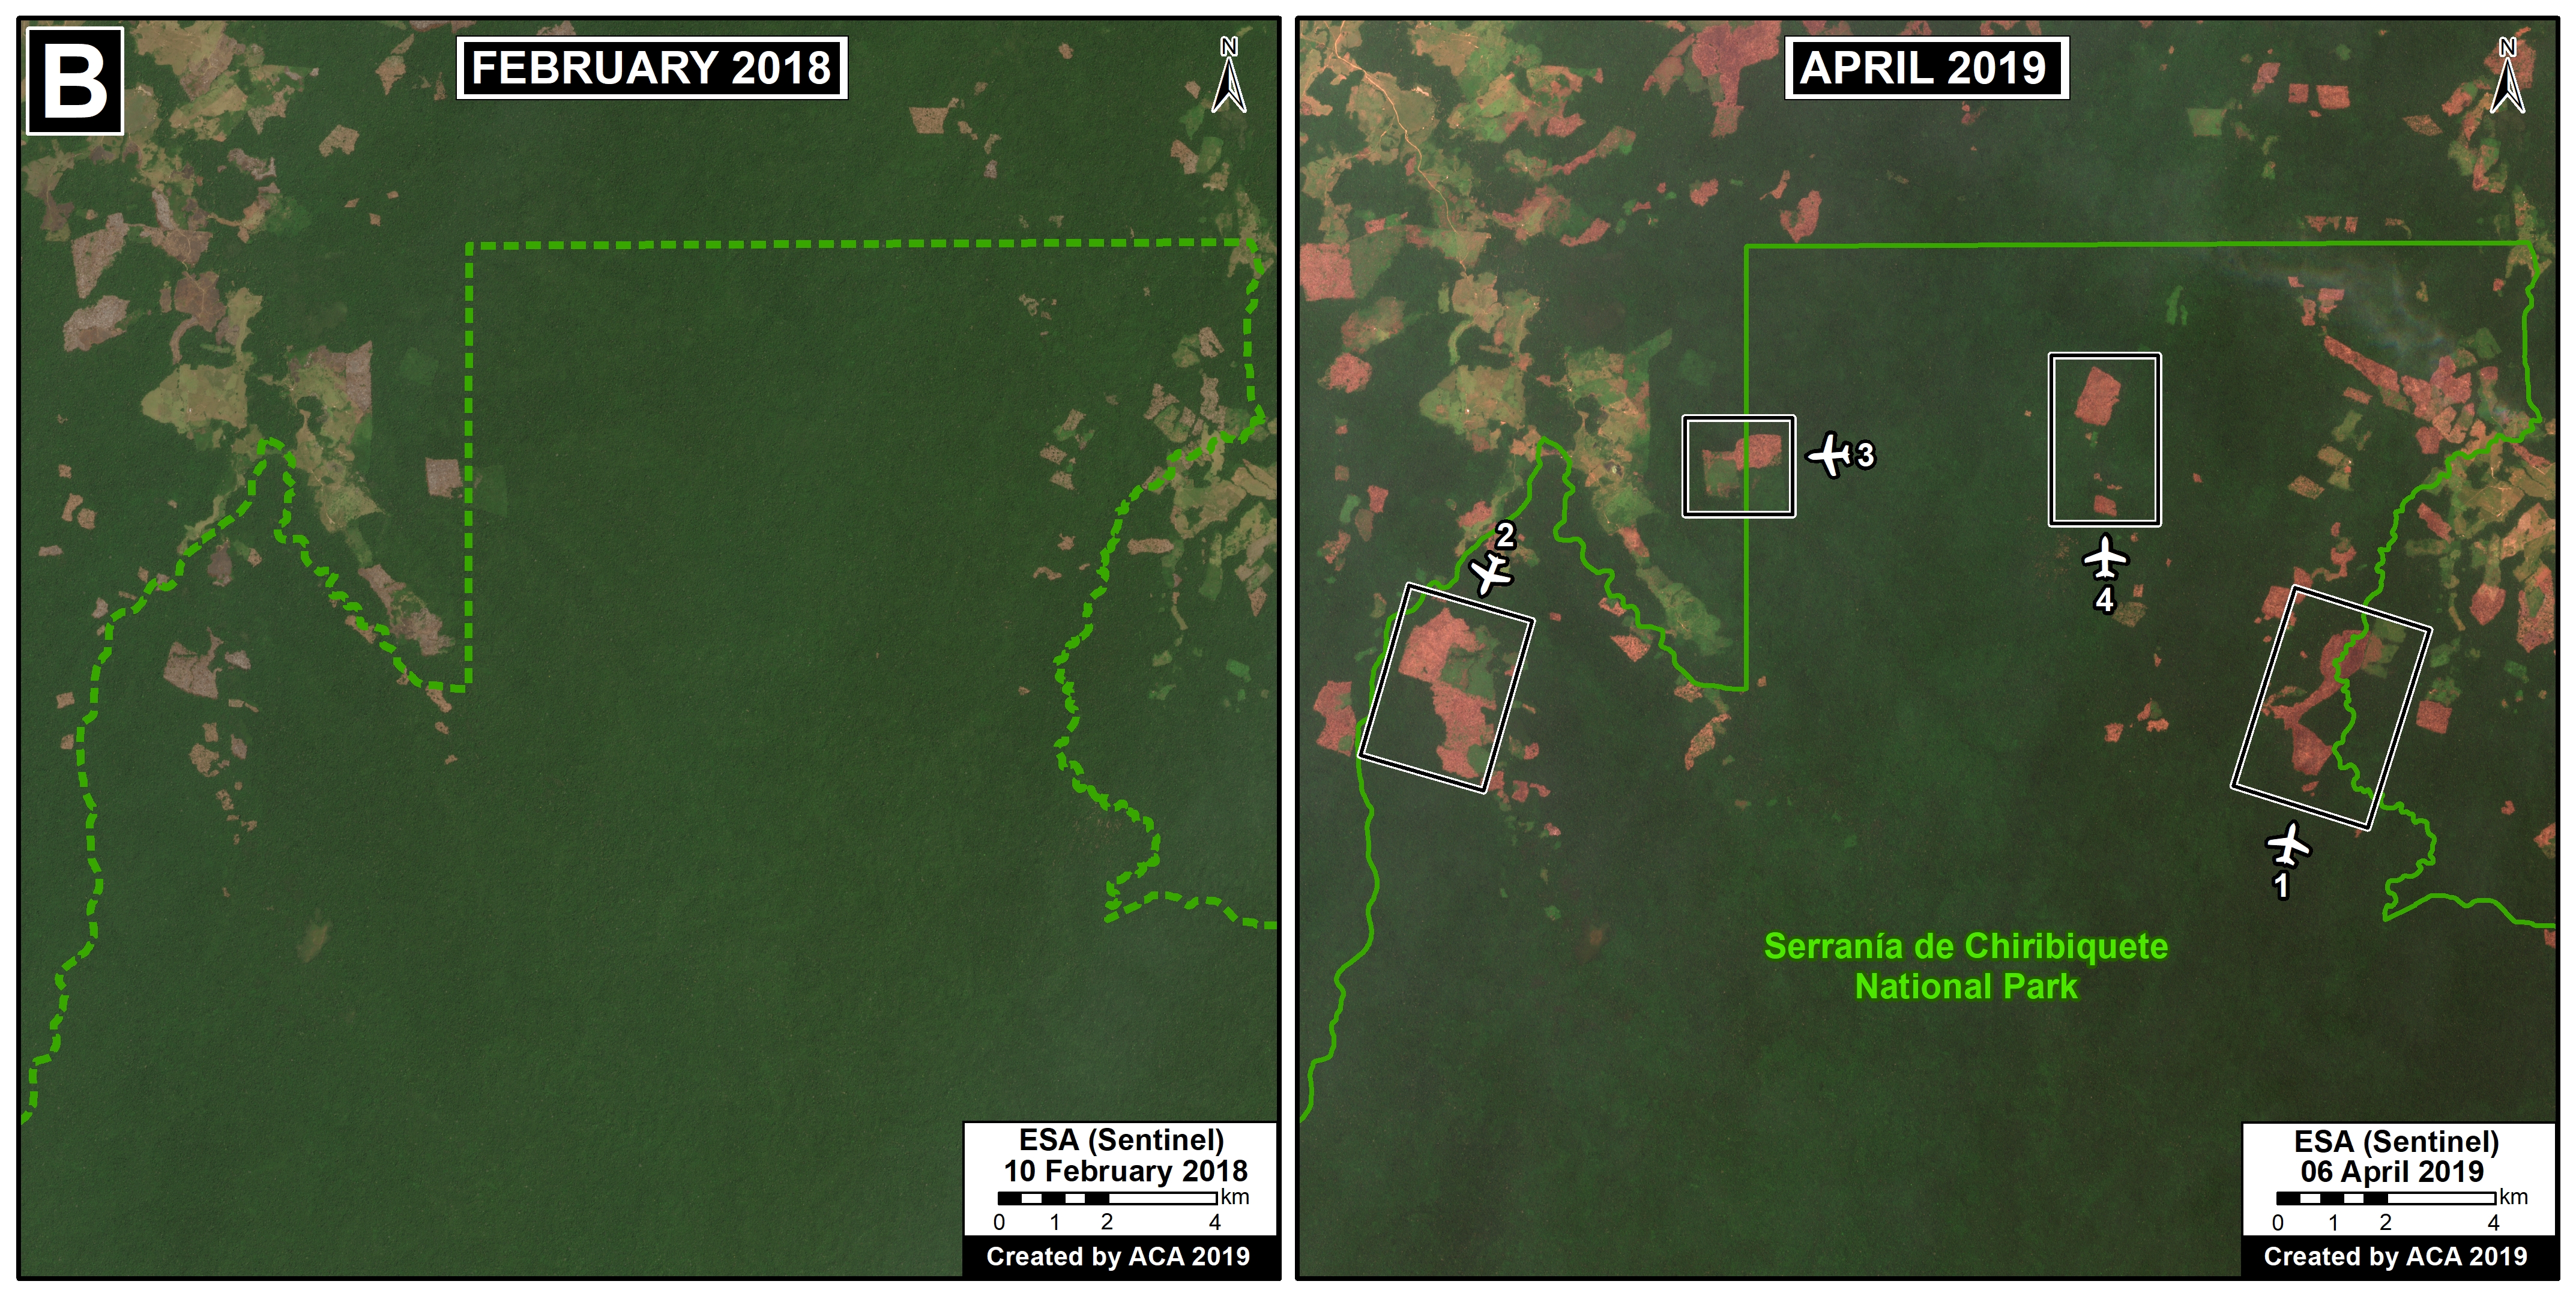
E. Northern Colombian Amazon: There is expanding deforestation along a new road in this zone, located in the department of Guaviare (Inset E).

F. Northern Ecuadoran Amazon: This zone is located in the Orellana province, where small- and medium-scale agriculture, including oil palm, is the principal driver of deforestation (Inset F).


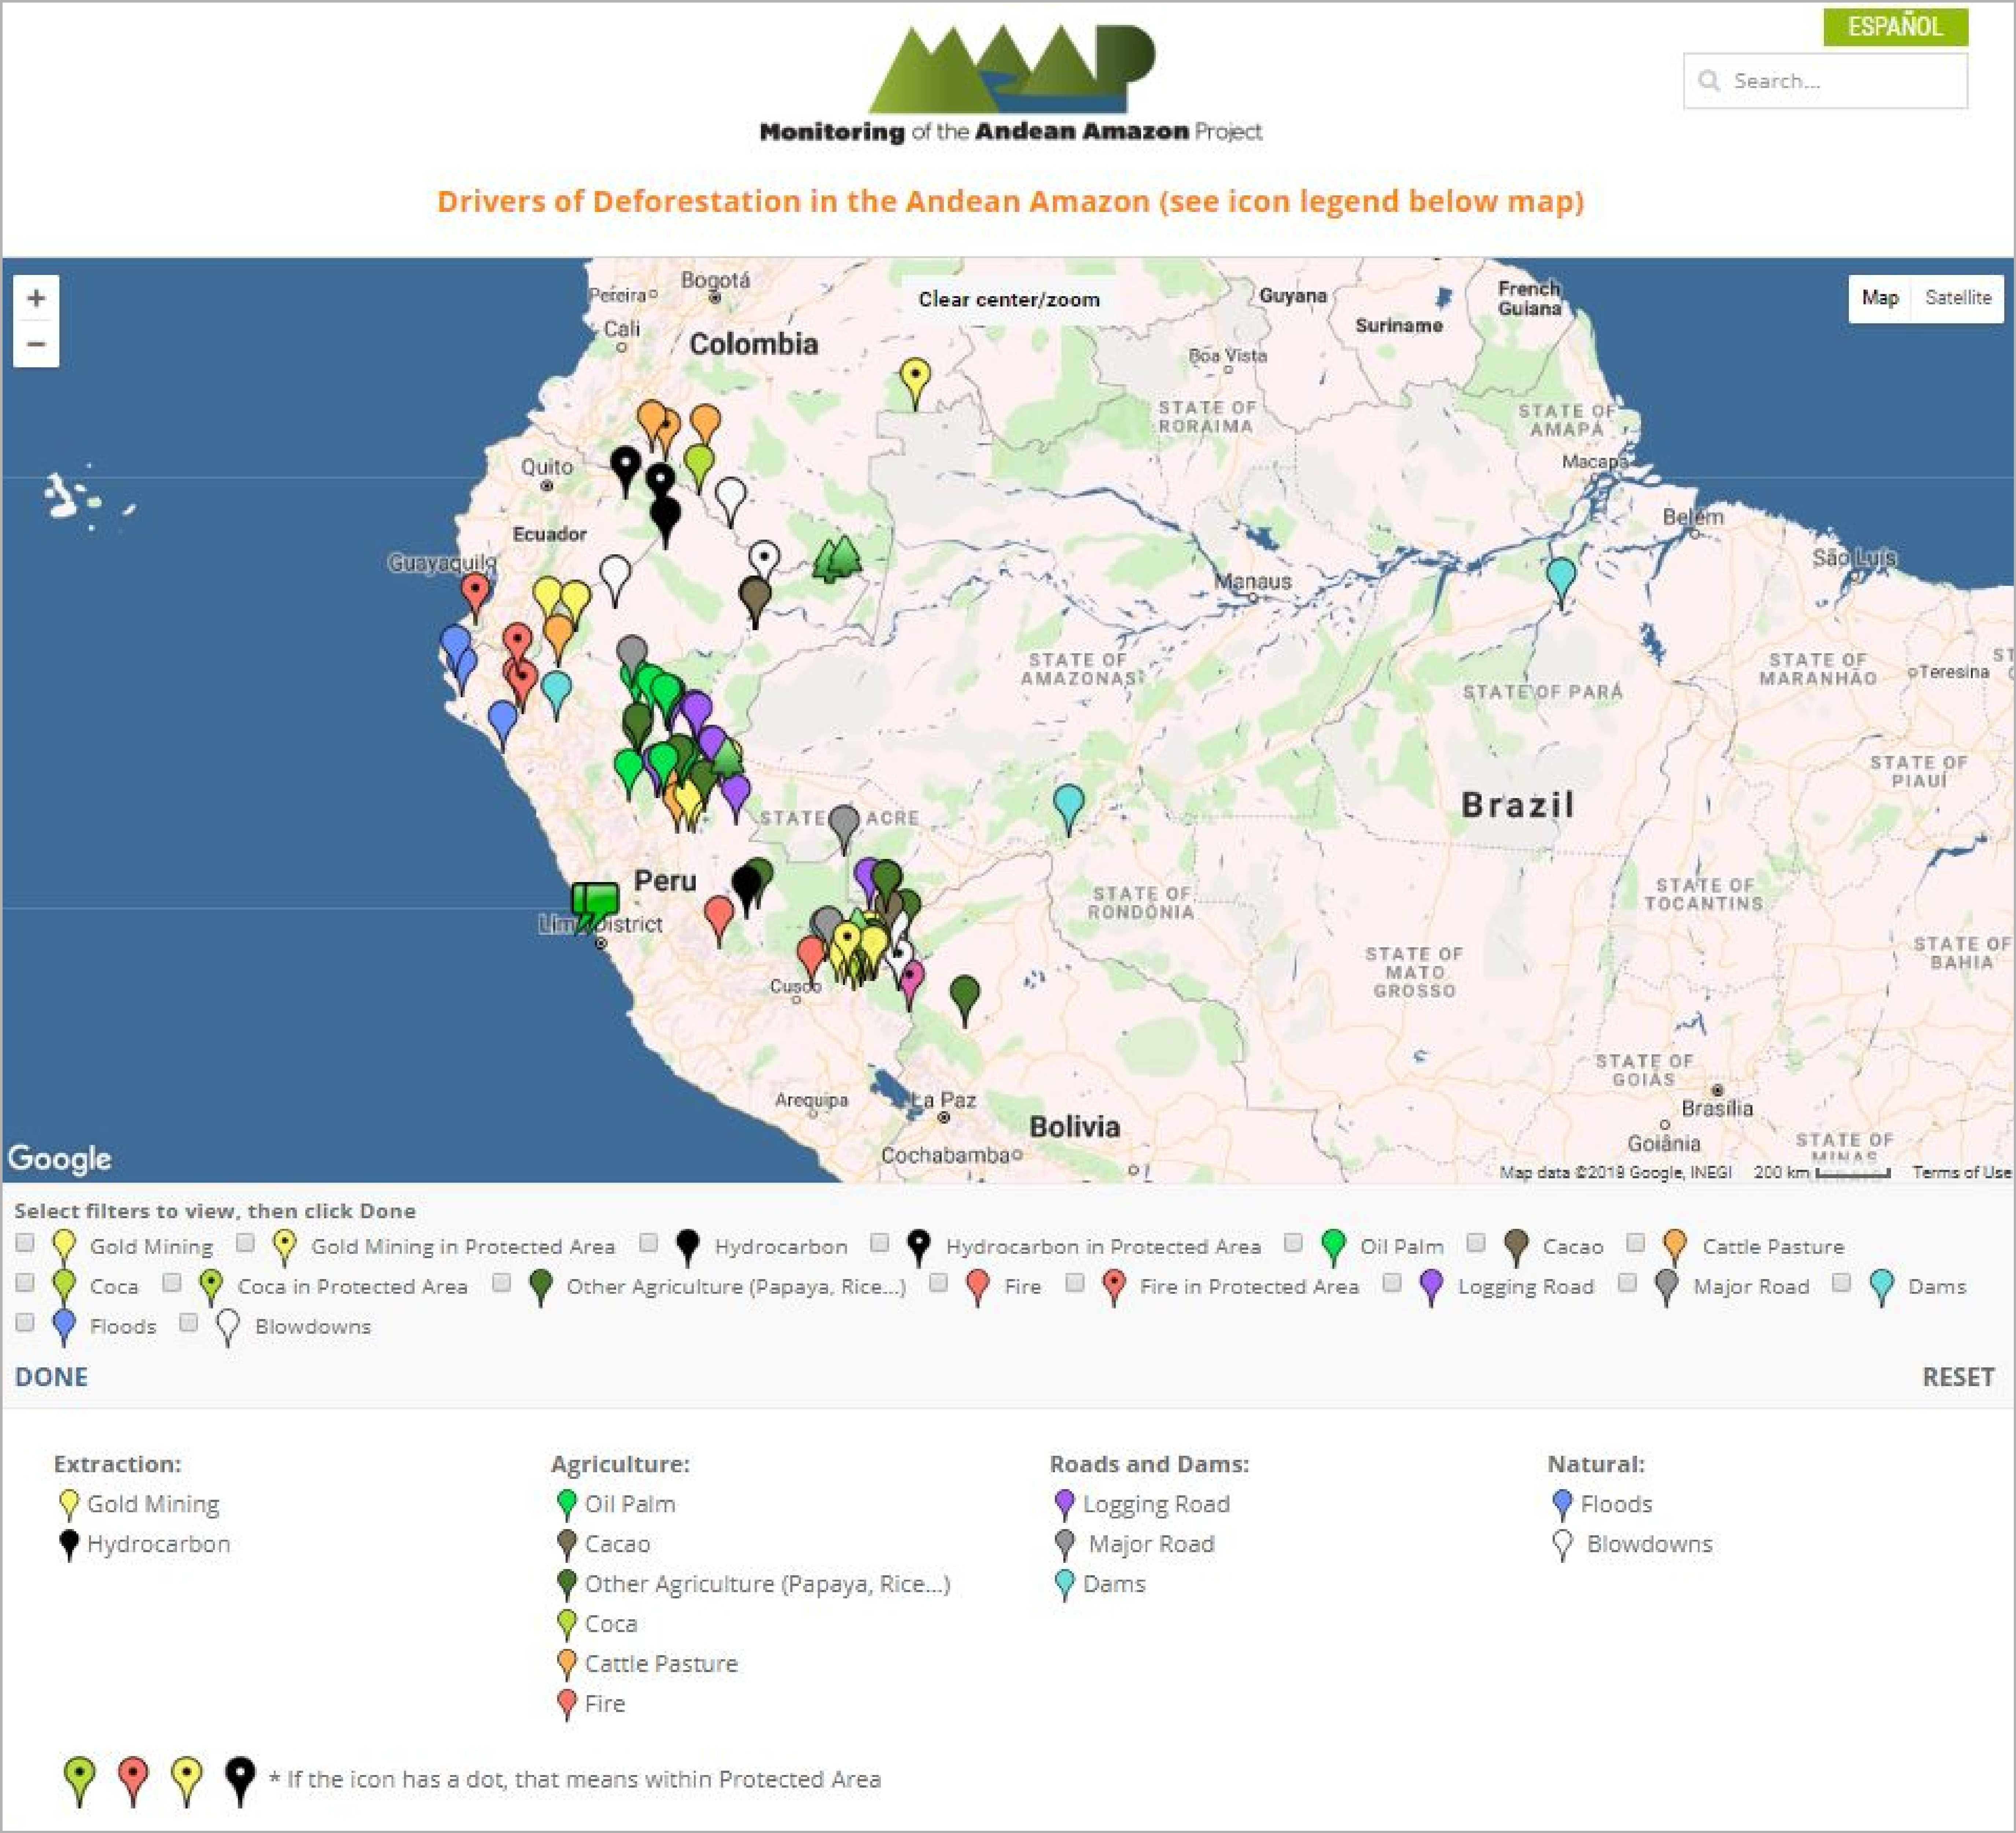
III. Drivers of Deforestation     

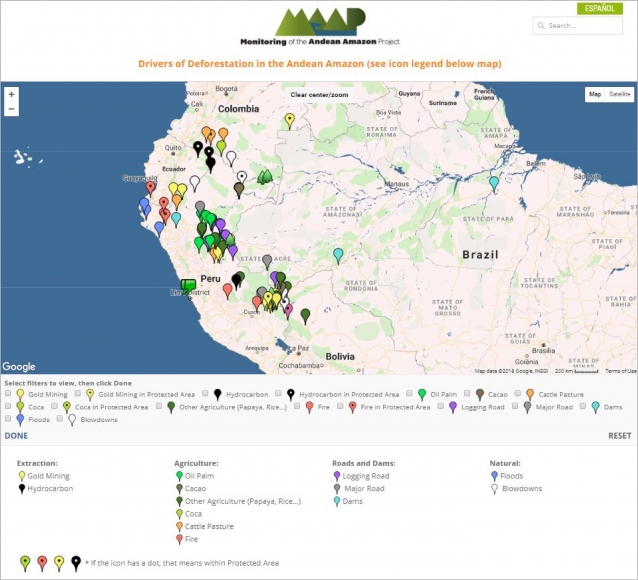
MAAP Interactive (screenshot)

One of the main objectives of MAAP is to improve the availability of precise and up-to-date information regarding the current drivers (causes) of deforestation in the Andean Amazon.  Indeed, one of our most important advances has been the use of high-resolution imagery to identify current deforestation drivers.

In order to improve the analysis and understanding of the identified drivers, we have created an Interactive Map that displays the spatial location of each driver associated with every MAAP report.  An important characteristic of this map is the ability to filter the data by driver, by selecting the boxes of interest.

Image 3 shows a screenshot of the Interactive Map.  Note that it contains detailed information on these principal drivers: gold mining, oil palm, cacao, small-scale agriculture, cattle pasture, logging roads, and dams.  It also includes natural causes such as floods, forest fires, and blowdowns.  In addition, it highlights deforestation events in protected areas.

Below, we discuss the principal drivers of deforestation and degradation in greater detail.


Agriculture  oil palm, cacao, and other crops

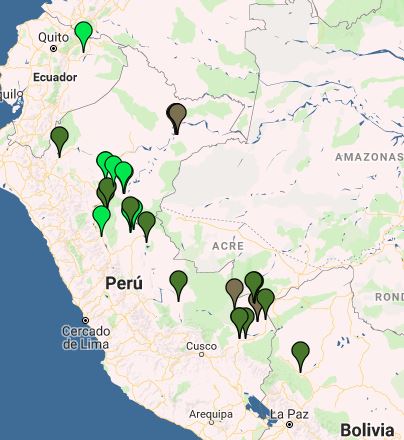
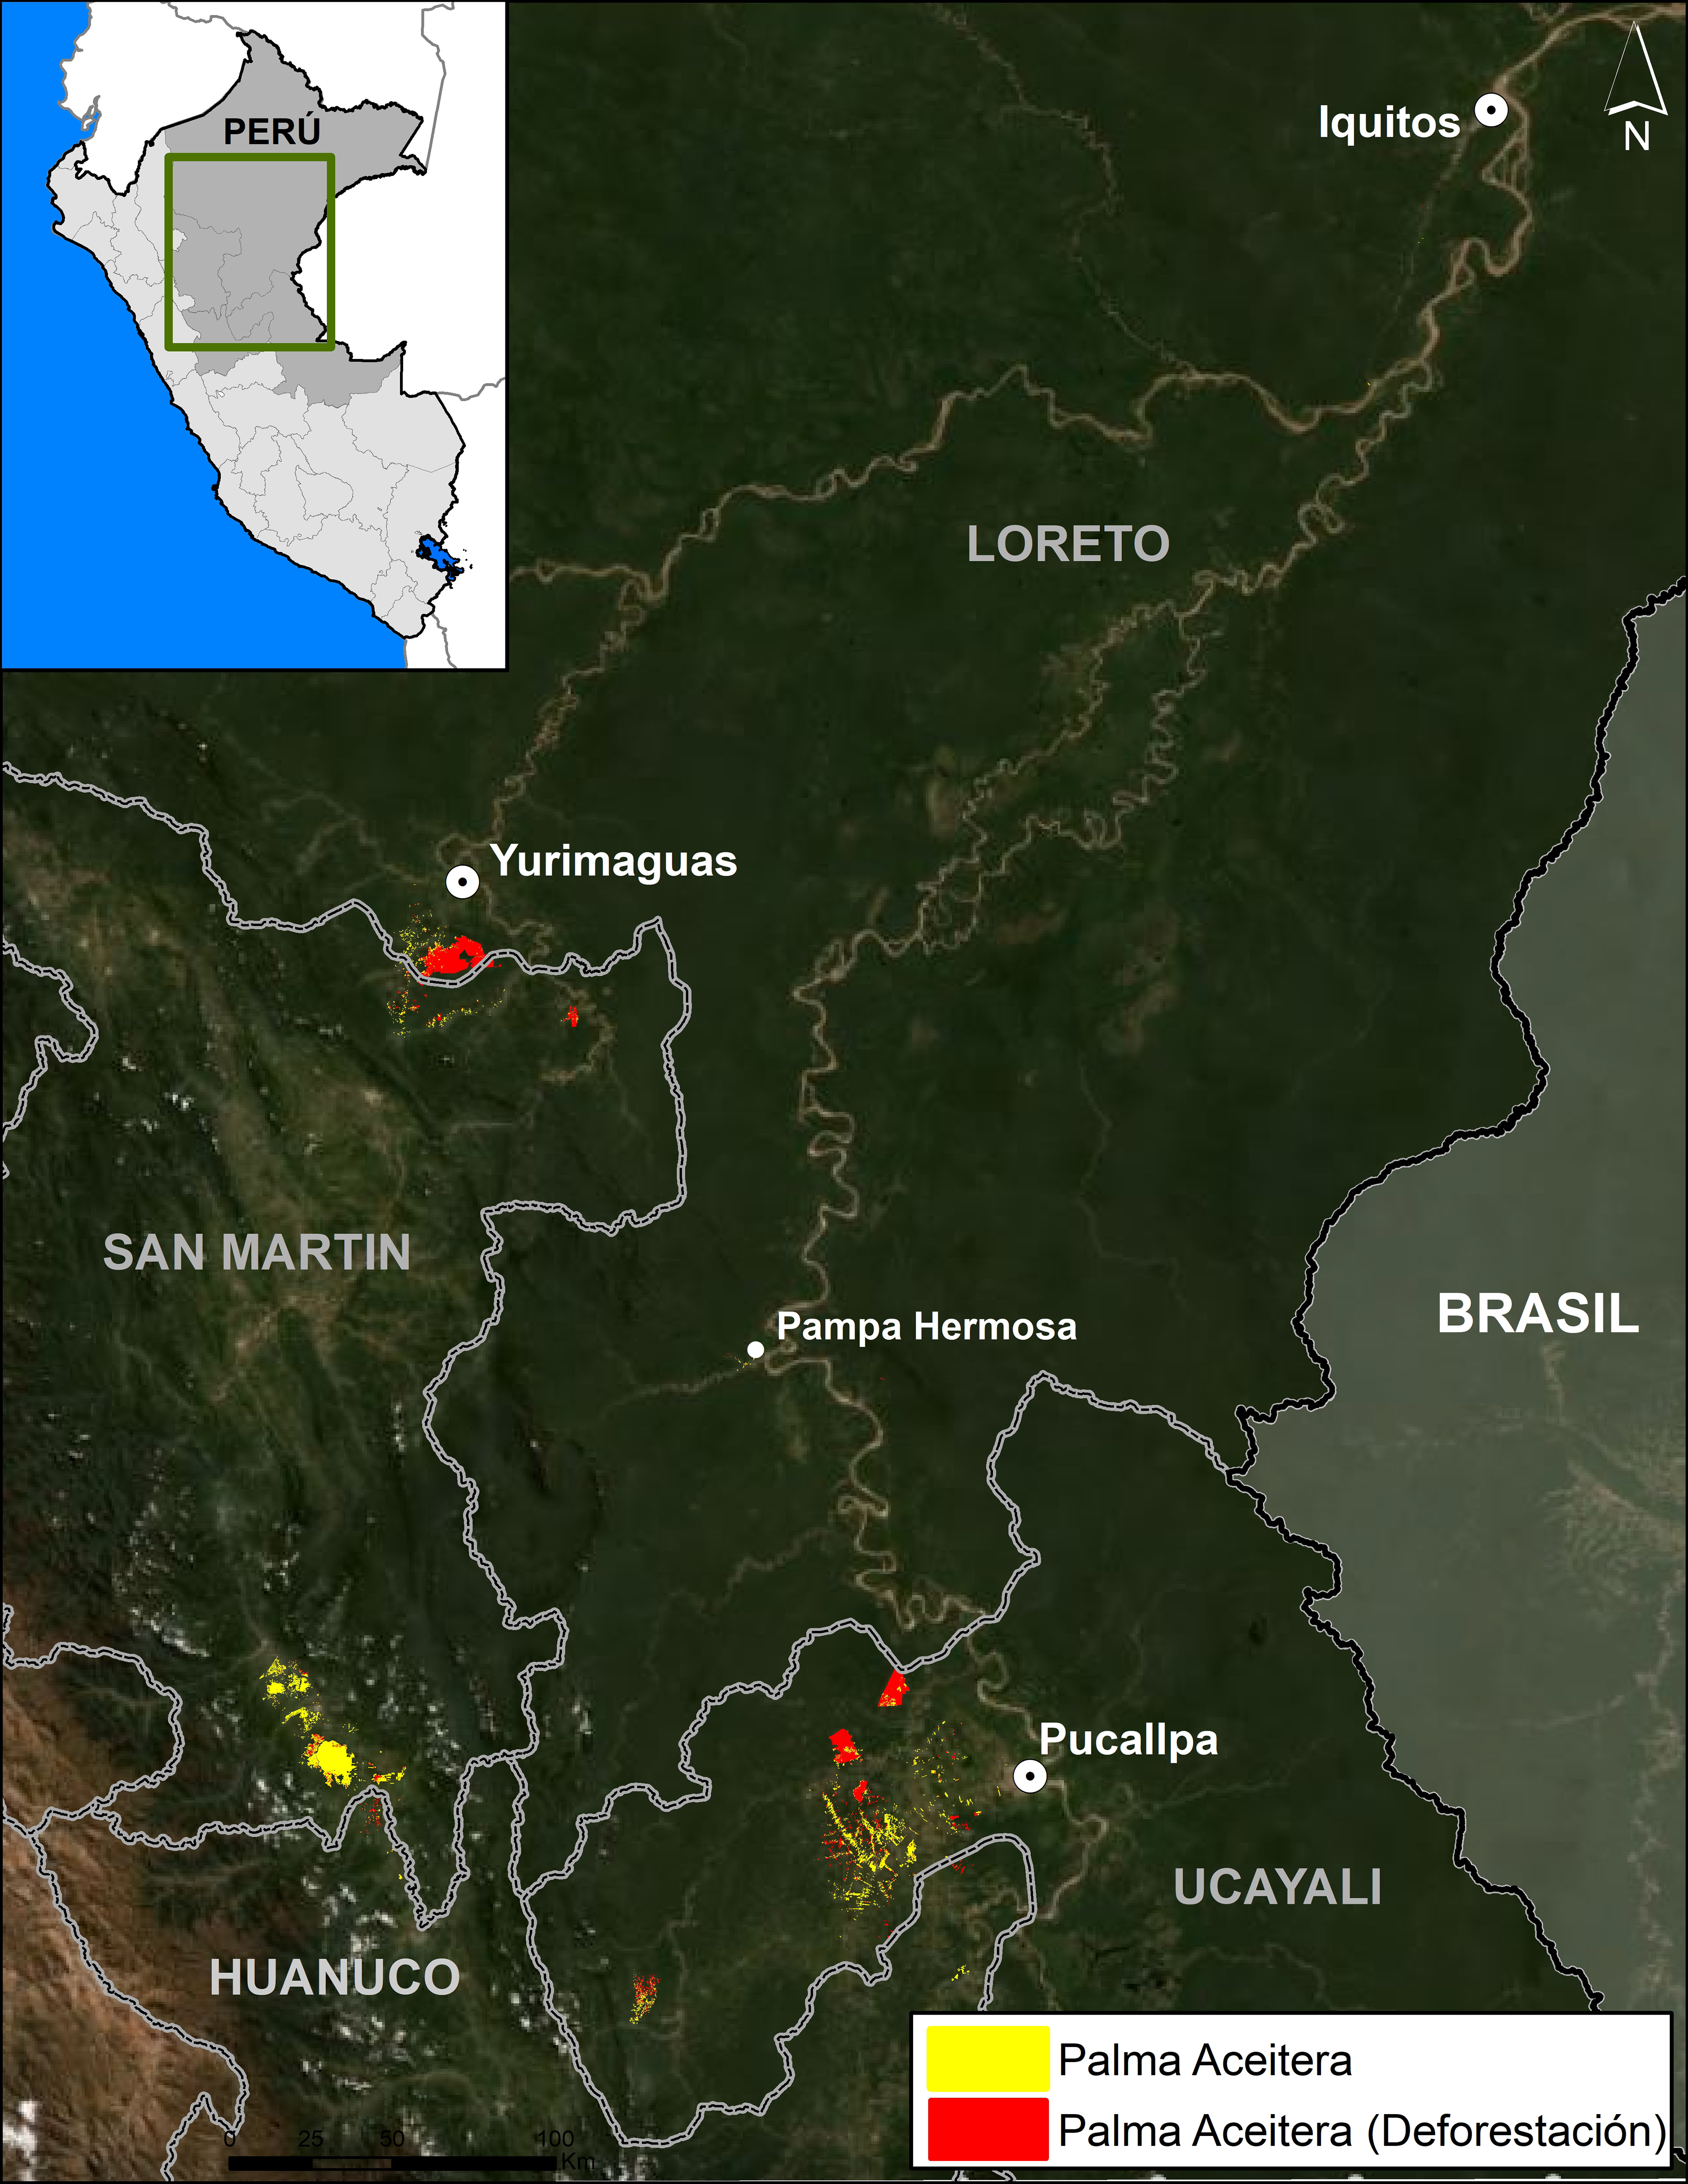
Image 4: Interactive Map, agriculture. Data: MAAP.

Image 4 shows the results of the interactive map when applying the agriculture-related filters.

Legend:
Oil palm (bright green)
Cacao (brown)
Other crops (dark green)

Agricultural activity is one of the principal causes of deforestation in the Andean Amazon.

The majority of agriculture-related deforestation is caused by small- and medium-scale plantations (‹50 hectares).

Deforestation for large-scale, agro-industrial plantations is much less common, but represents a critical latent threat.


Large-scale Agriculture

We have documented five major deforestation events produced by large-scale plantations since 2007:  four of these occurred in Peru (three of which are related to oil palm and one to cacao) and one in Bolivia (resulting from sugar cane plantations).

First, between 2007 and 2011, two large-scale oil palm plantations caused the deforestation of 7,000 hectares on the border between Loreto and San Martín (MAAP #16).  Subsequent plantations in the surrounding area caused the additional deforestation of 9,800 hectares.

It is importnat to note that the Peruvian company Grupo Palmas is now working towards a zero deforestation value chain and has a new sustainability policy (see Case C of MAAP #64).

Next, between 2012 and 2015, two other large-scale oil palm plantations deforested 12,000 hectares in Ucayali  (MAAP #4, MAAP #41).

Between 2013 and 2015, the company United Cacao deforested 2,380 hectares for cacao plantations in Loreto (MAAP #9, MAAP #13, MAAP #27, MAAP #35).

Deforestation from large-scale agriculture decreased in Peru between 2016 and 2017, but there was one notable event: an oil palm plantation of 740 hectares in San Martín (MAAP #78).

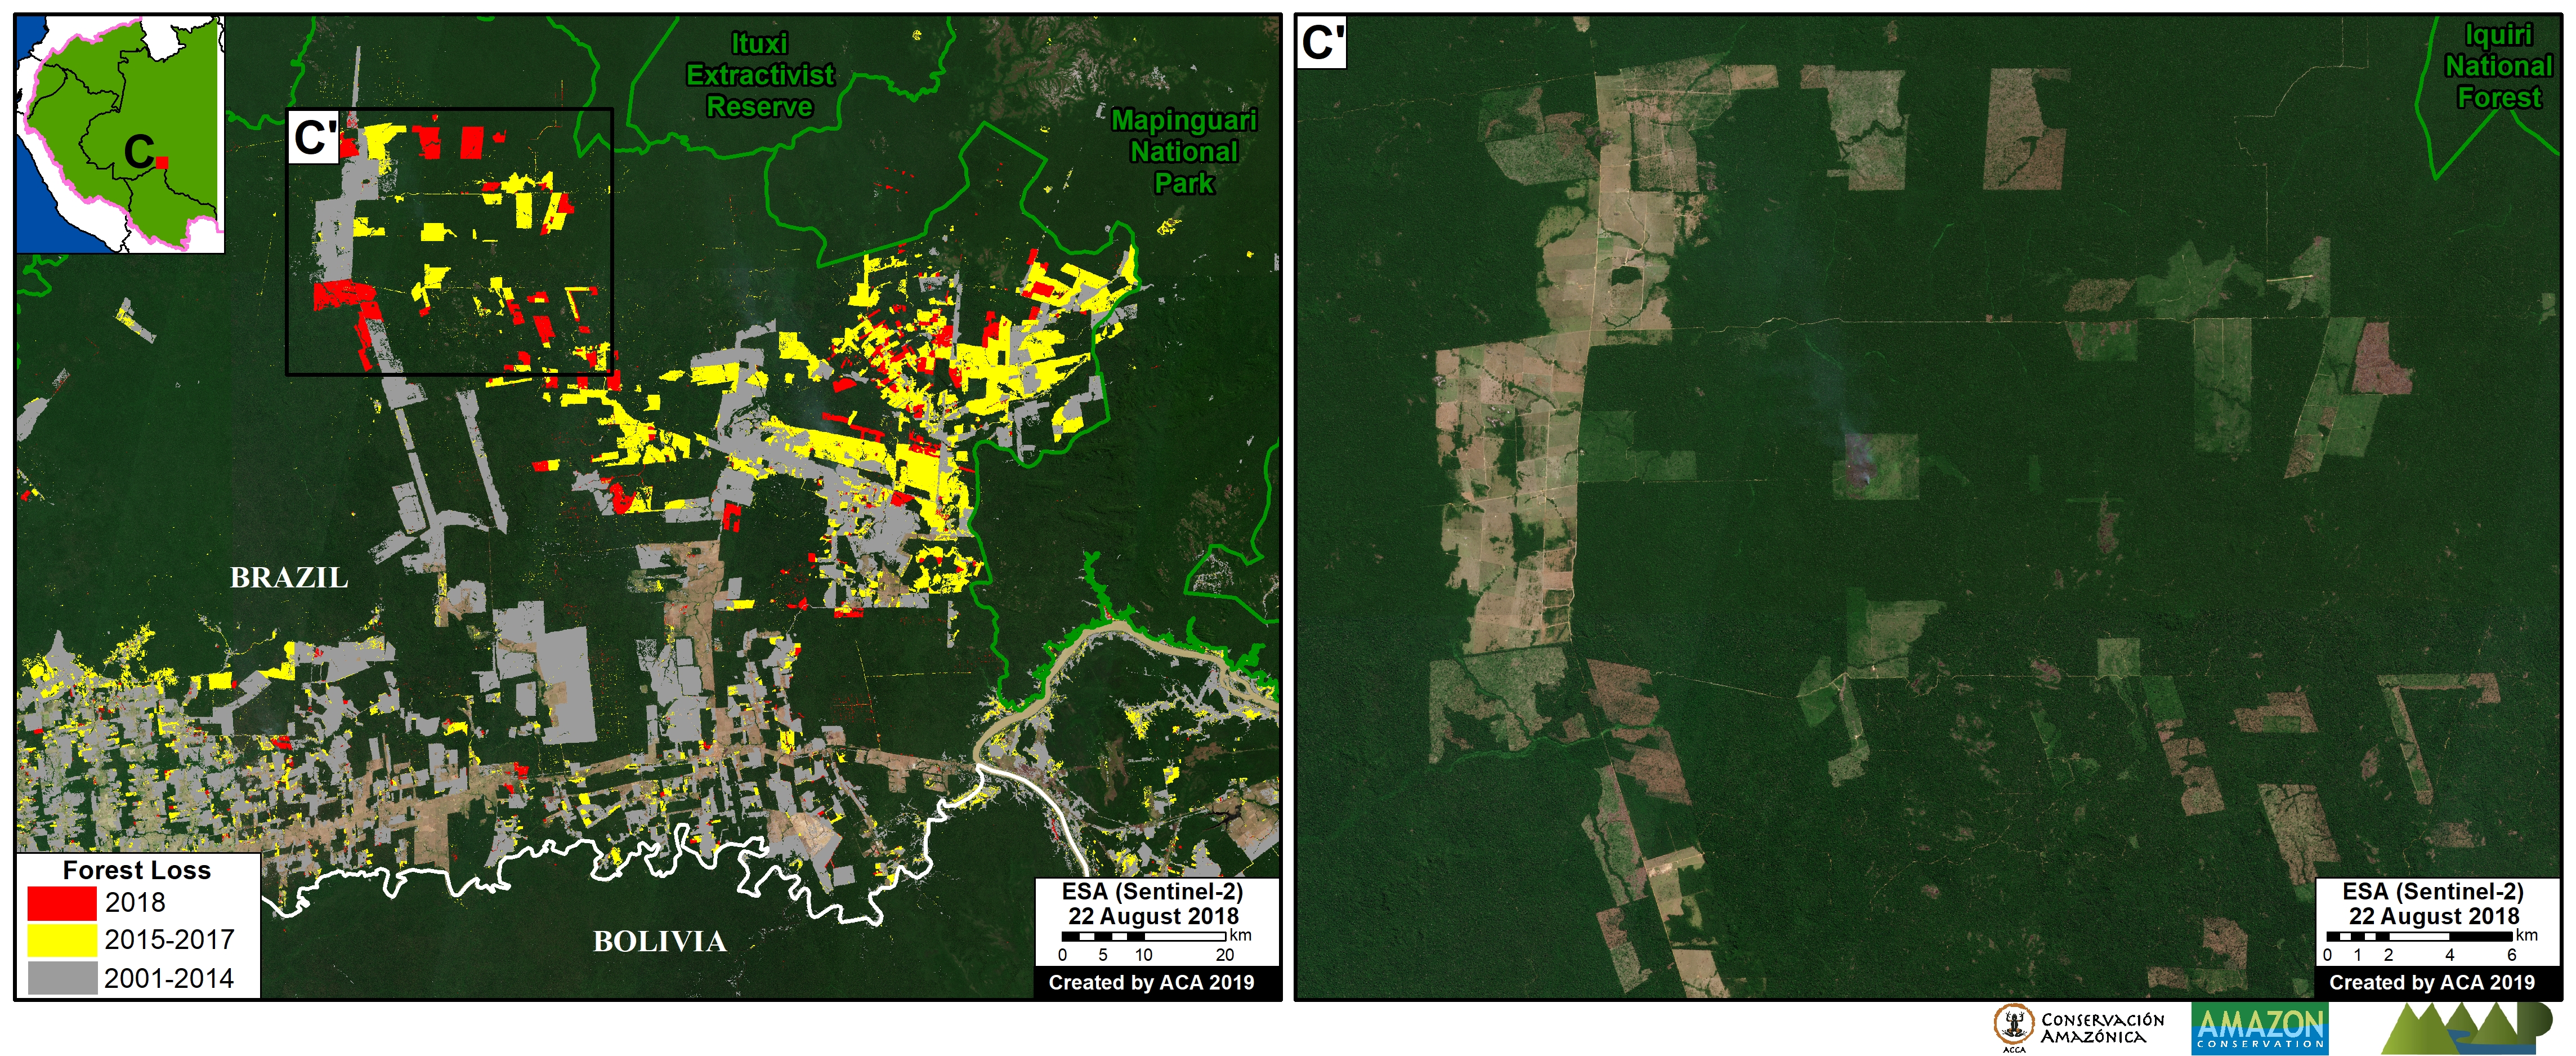
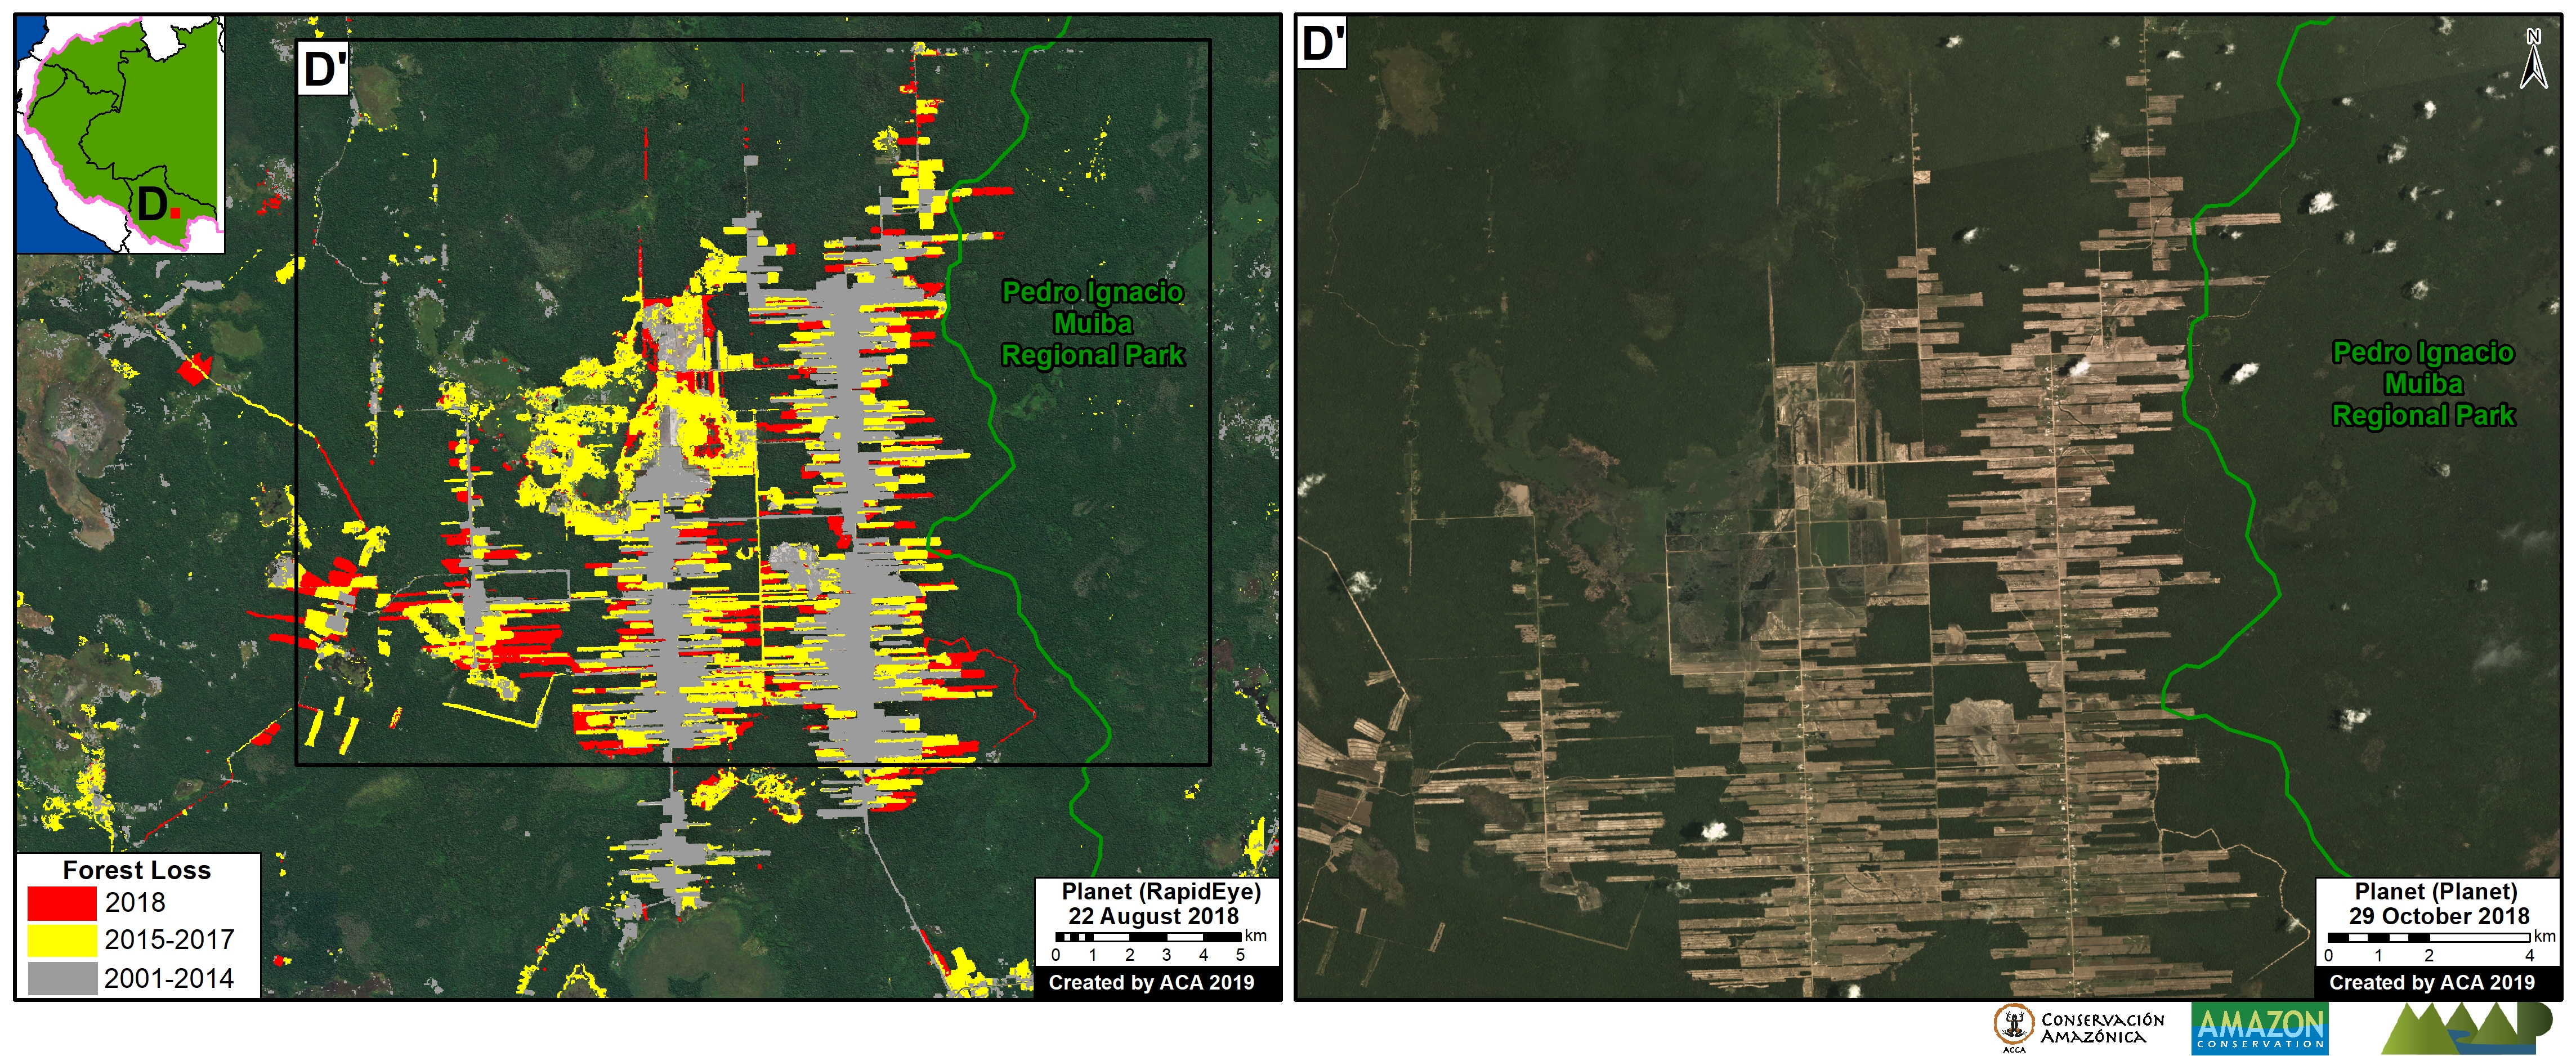
Another notable case of deforestation related to large-scale agriculture has been occurring in Bolivia, where a new sugarcane plantation has caused the deforestation of more than 2,500 hectares in the department of La Paz.

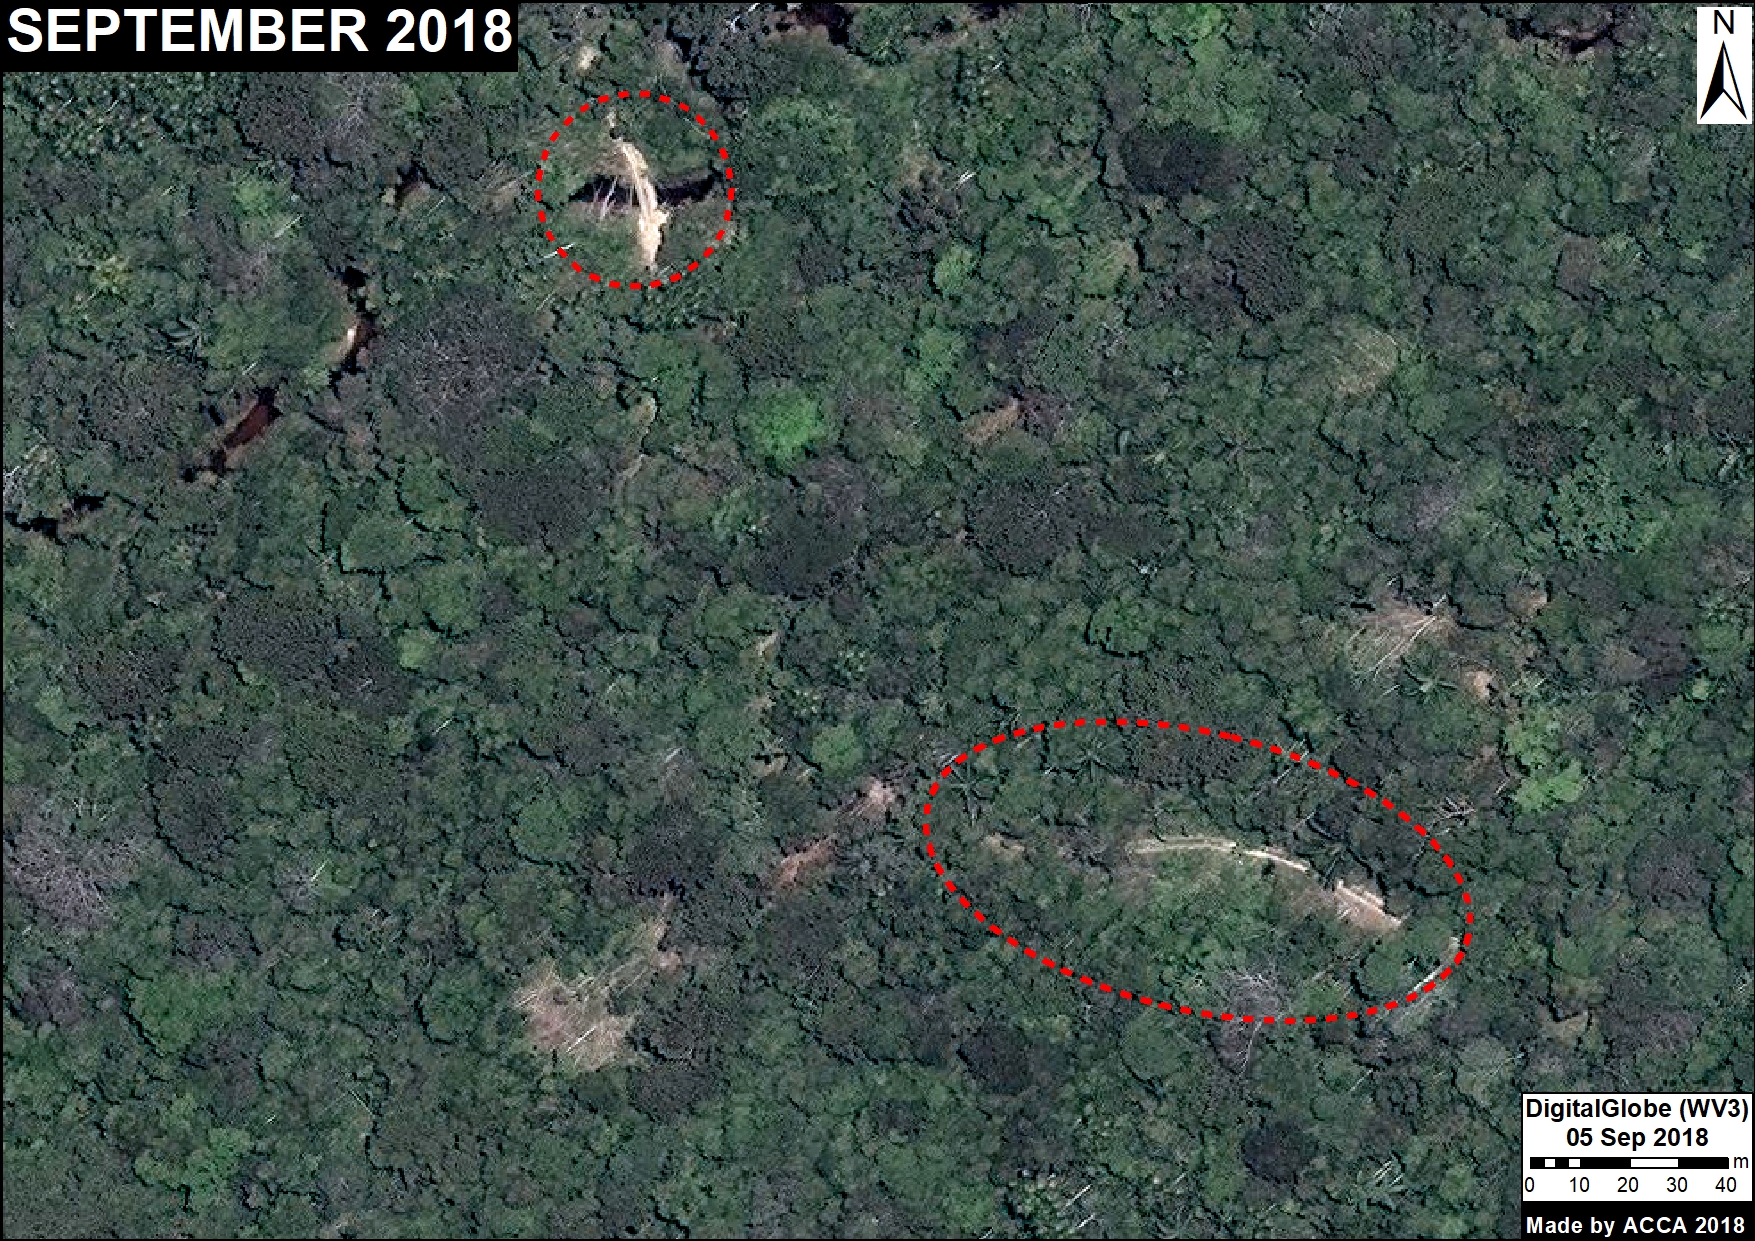
Additionally, we found three new zones in Peru characterized by the deforestation pattern produced by the construction of organized access roads which have the potential of becoming large-scale agriculture areas (MAAP #69).

Small and Medium-scale Agriculture

Deforestation caused by small- and medium-scale agriculture is much more widespread, but it is often difficult to identify the driver from satellite imagery.

We have identified some specific cases of oil palm in Huánuco, Ucayali, Loreto, and San Martín (MAAP #48, MAAP #26, MAAP #16).

Cacao and papaya are emerging drivers in Madre de Dios.  We have documented cacao deforestation along the Las Piedras River (MAAP #23, MAAP #40) and papaya along the Interoceanic Highway (MAAP #42).

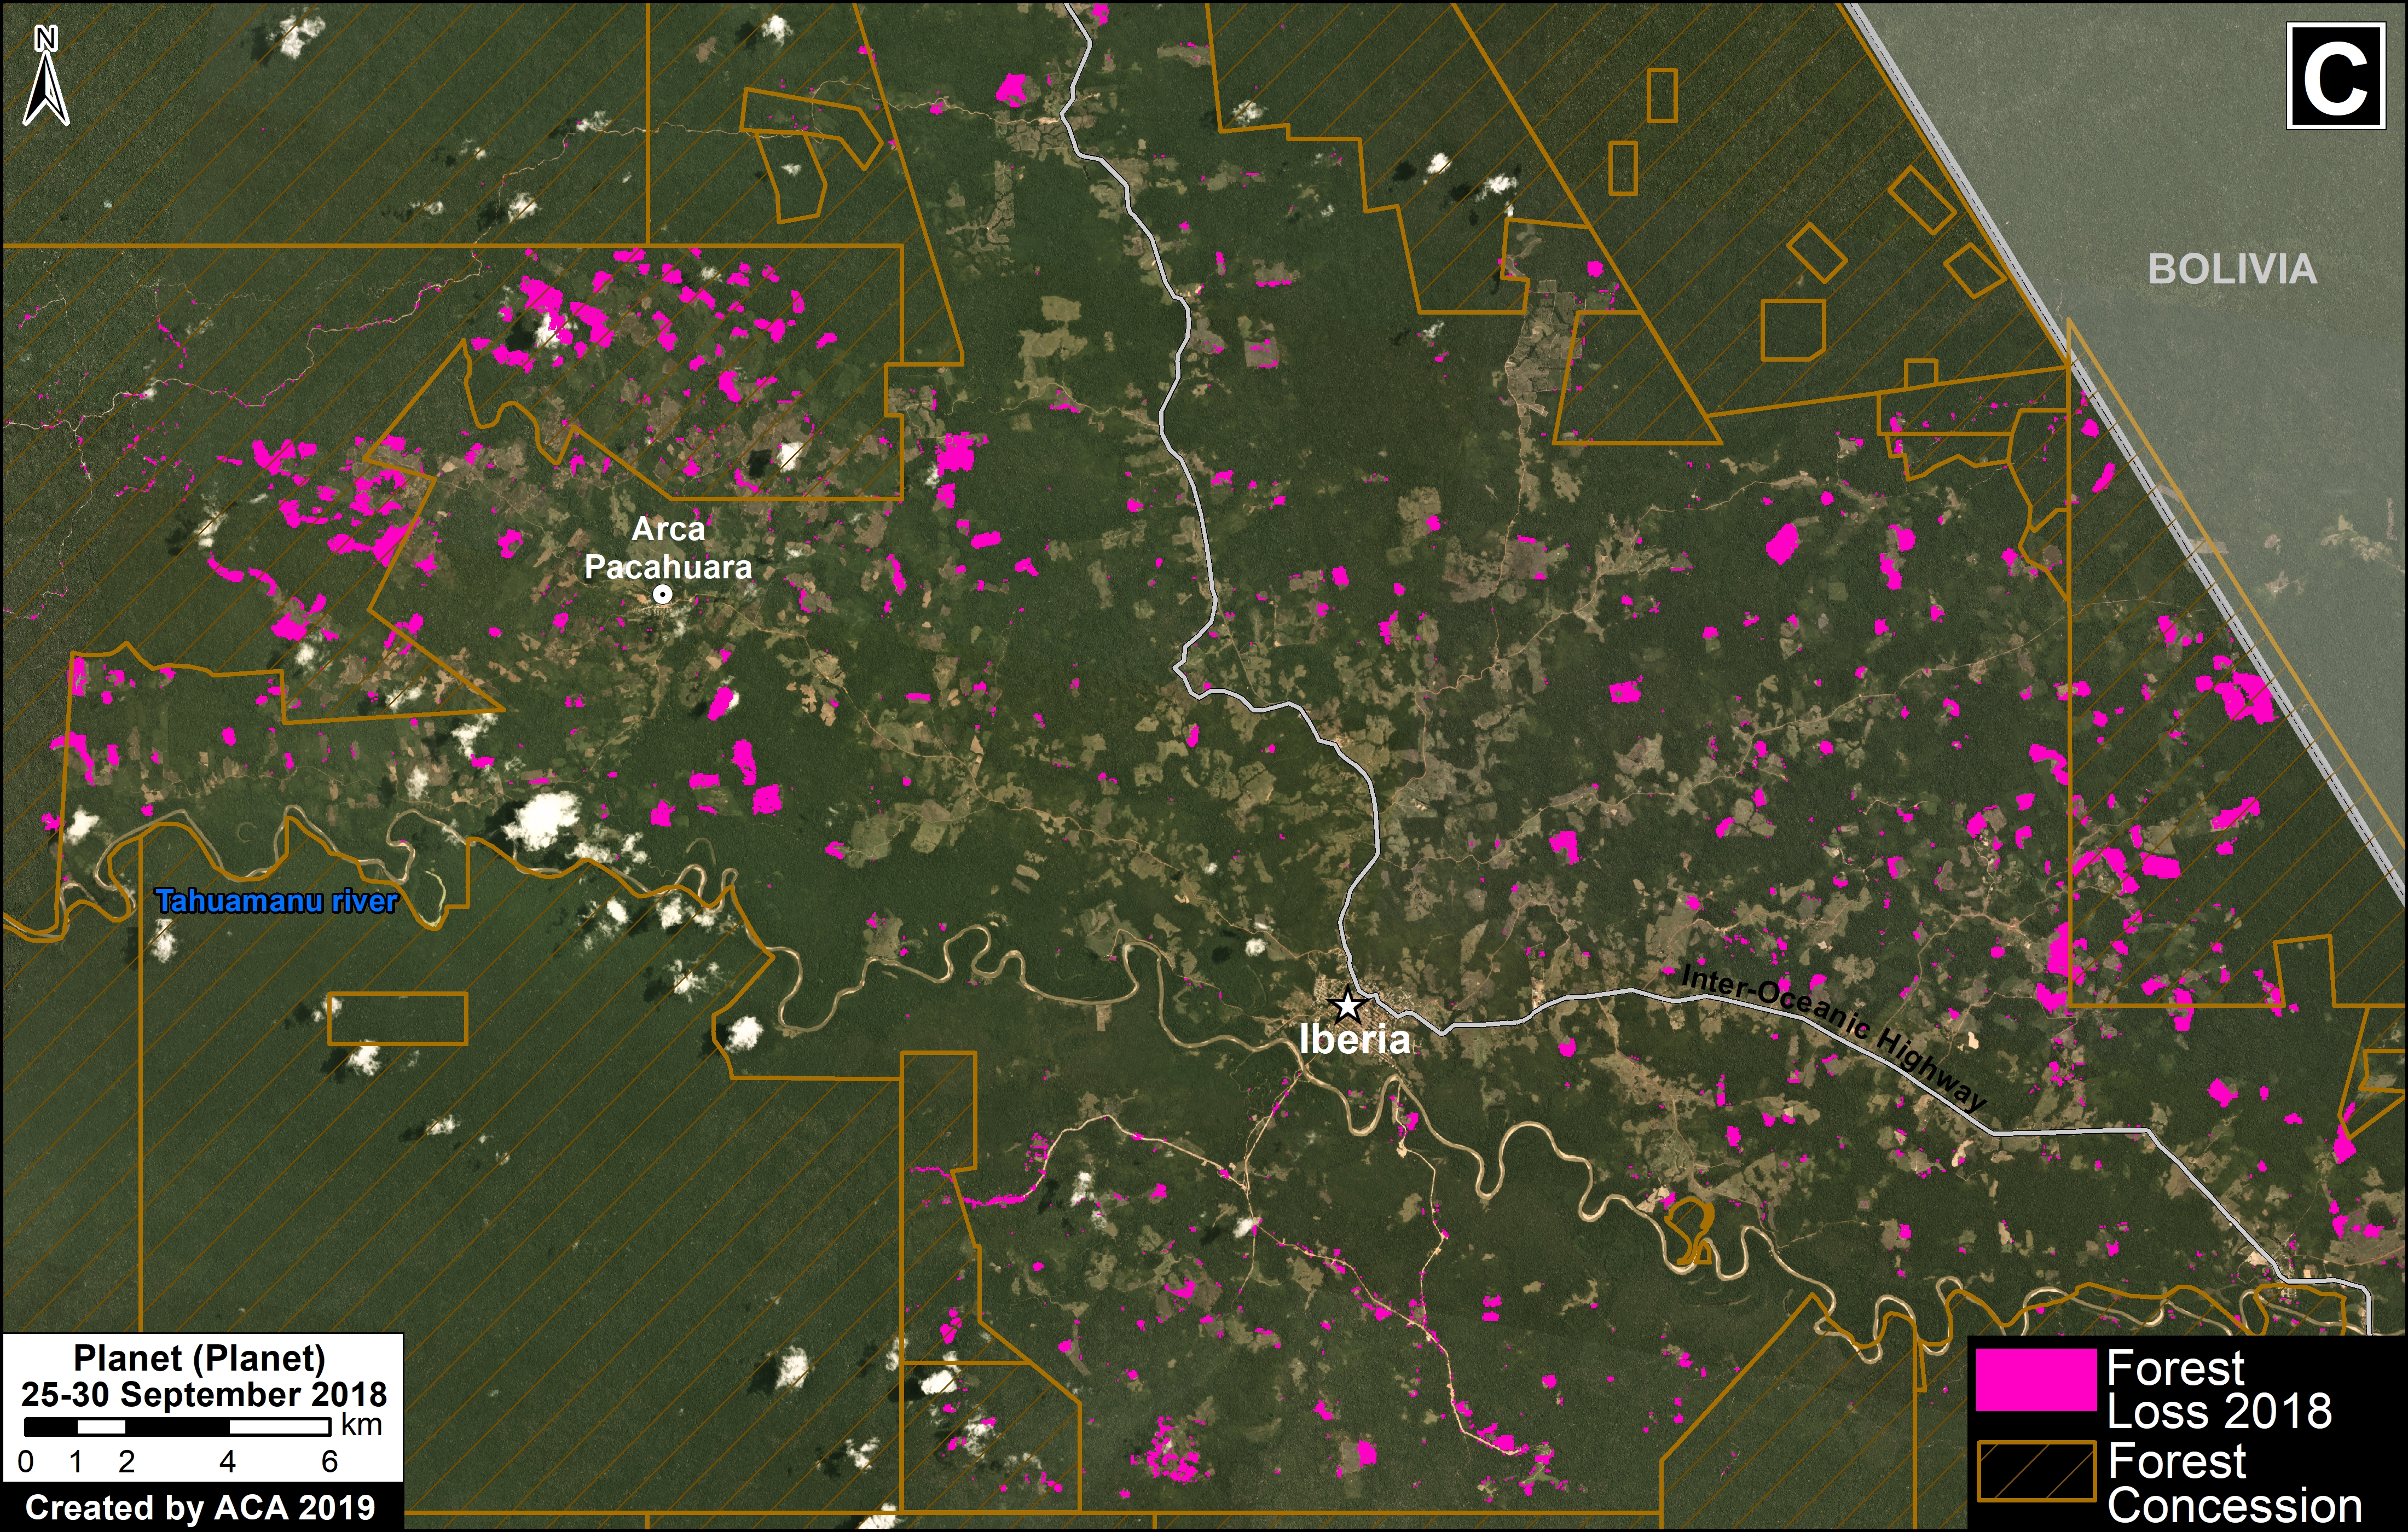
Corn and rice cultivation appear to be turning the area around the town of Iberia into a deforestation hotspot (MAAP #28).  In other cases, we have documented deforestation resulting from small- and medium-scale agriculture, though it has not been possible to identify the type of crop (MAAP #75, MAAP #78).

Additionally, small-scale agriculture is possibly a determining factor in the forest fires that degrade the Amazon during the dry season (MAAP #45, MAAP #47).

The cultivation of illicit coca is a cause of deforestation in some areas of Peru and Colombia.  For example, in southern Peru, the cultivation of coca is generating deforestation within the Bahuaja Sonene National Park and its surrounding areas.

Cattle Ranching

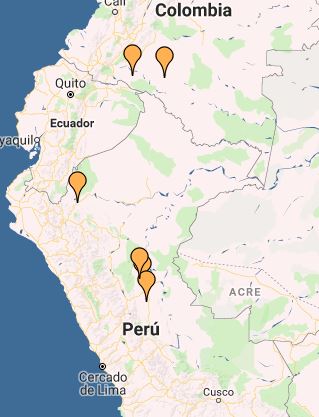
Image 5: Interactive Map, cattle ranching. Data: MAAP.

By analyzing high-resolution satellite imagery, we have developed a methodology for identifying areas deforestated by cattle ranching.*

Image 5 shows the results of the Interactive Map when applying the “Cattle pasture” filter, indicating the documented examples in Peru and Colombia.

Legend:
Cattle ranching (orange)

Cattle ranching is the principal driver of deforestation in the central Peruvian Amazon (MAAP #26, MAAP #37, MAAP #45, MAAP #78). We also identified recent deforestation from cattle ranching in northeastern Peru (MAAP #78).

In the Colombian Amazon, cattle ranching is one the primary direct drivers in the country’s most intense deforestation hotspots (MAAP #63, MAAP #77).

* Immediately following a major deforestation event, the landscape of felled trees is similar for both agriculture and cattle pasture.  However, by studying an archive of images and going back in time to analyze older deforestation cases, it is possible to distinguish between the drivers.  For example, after one or two years, agriculture and cattle pasture appear very different in the images. Ther former tends to have organized rows of new plantings, while the latter is mostly grassland.
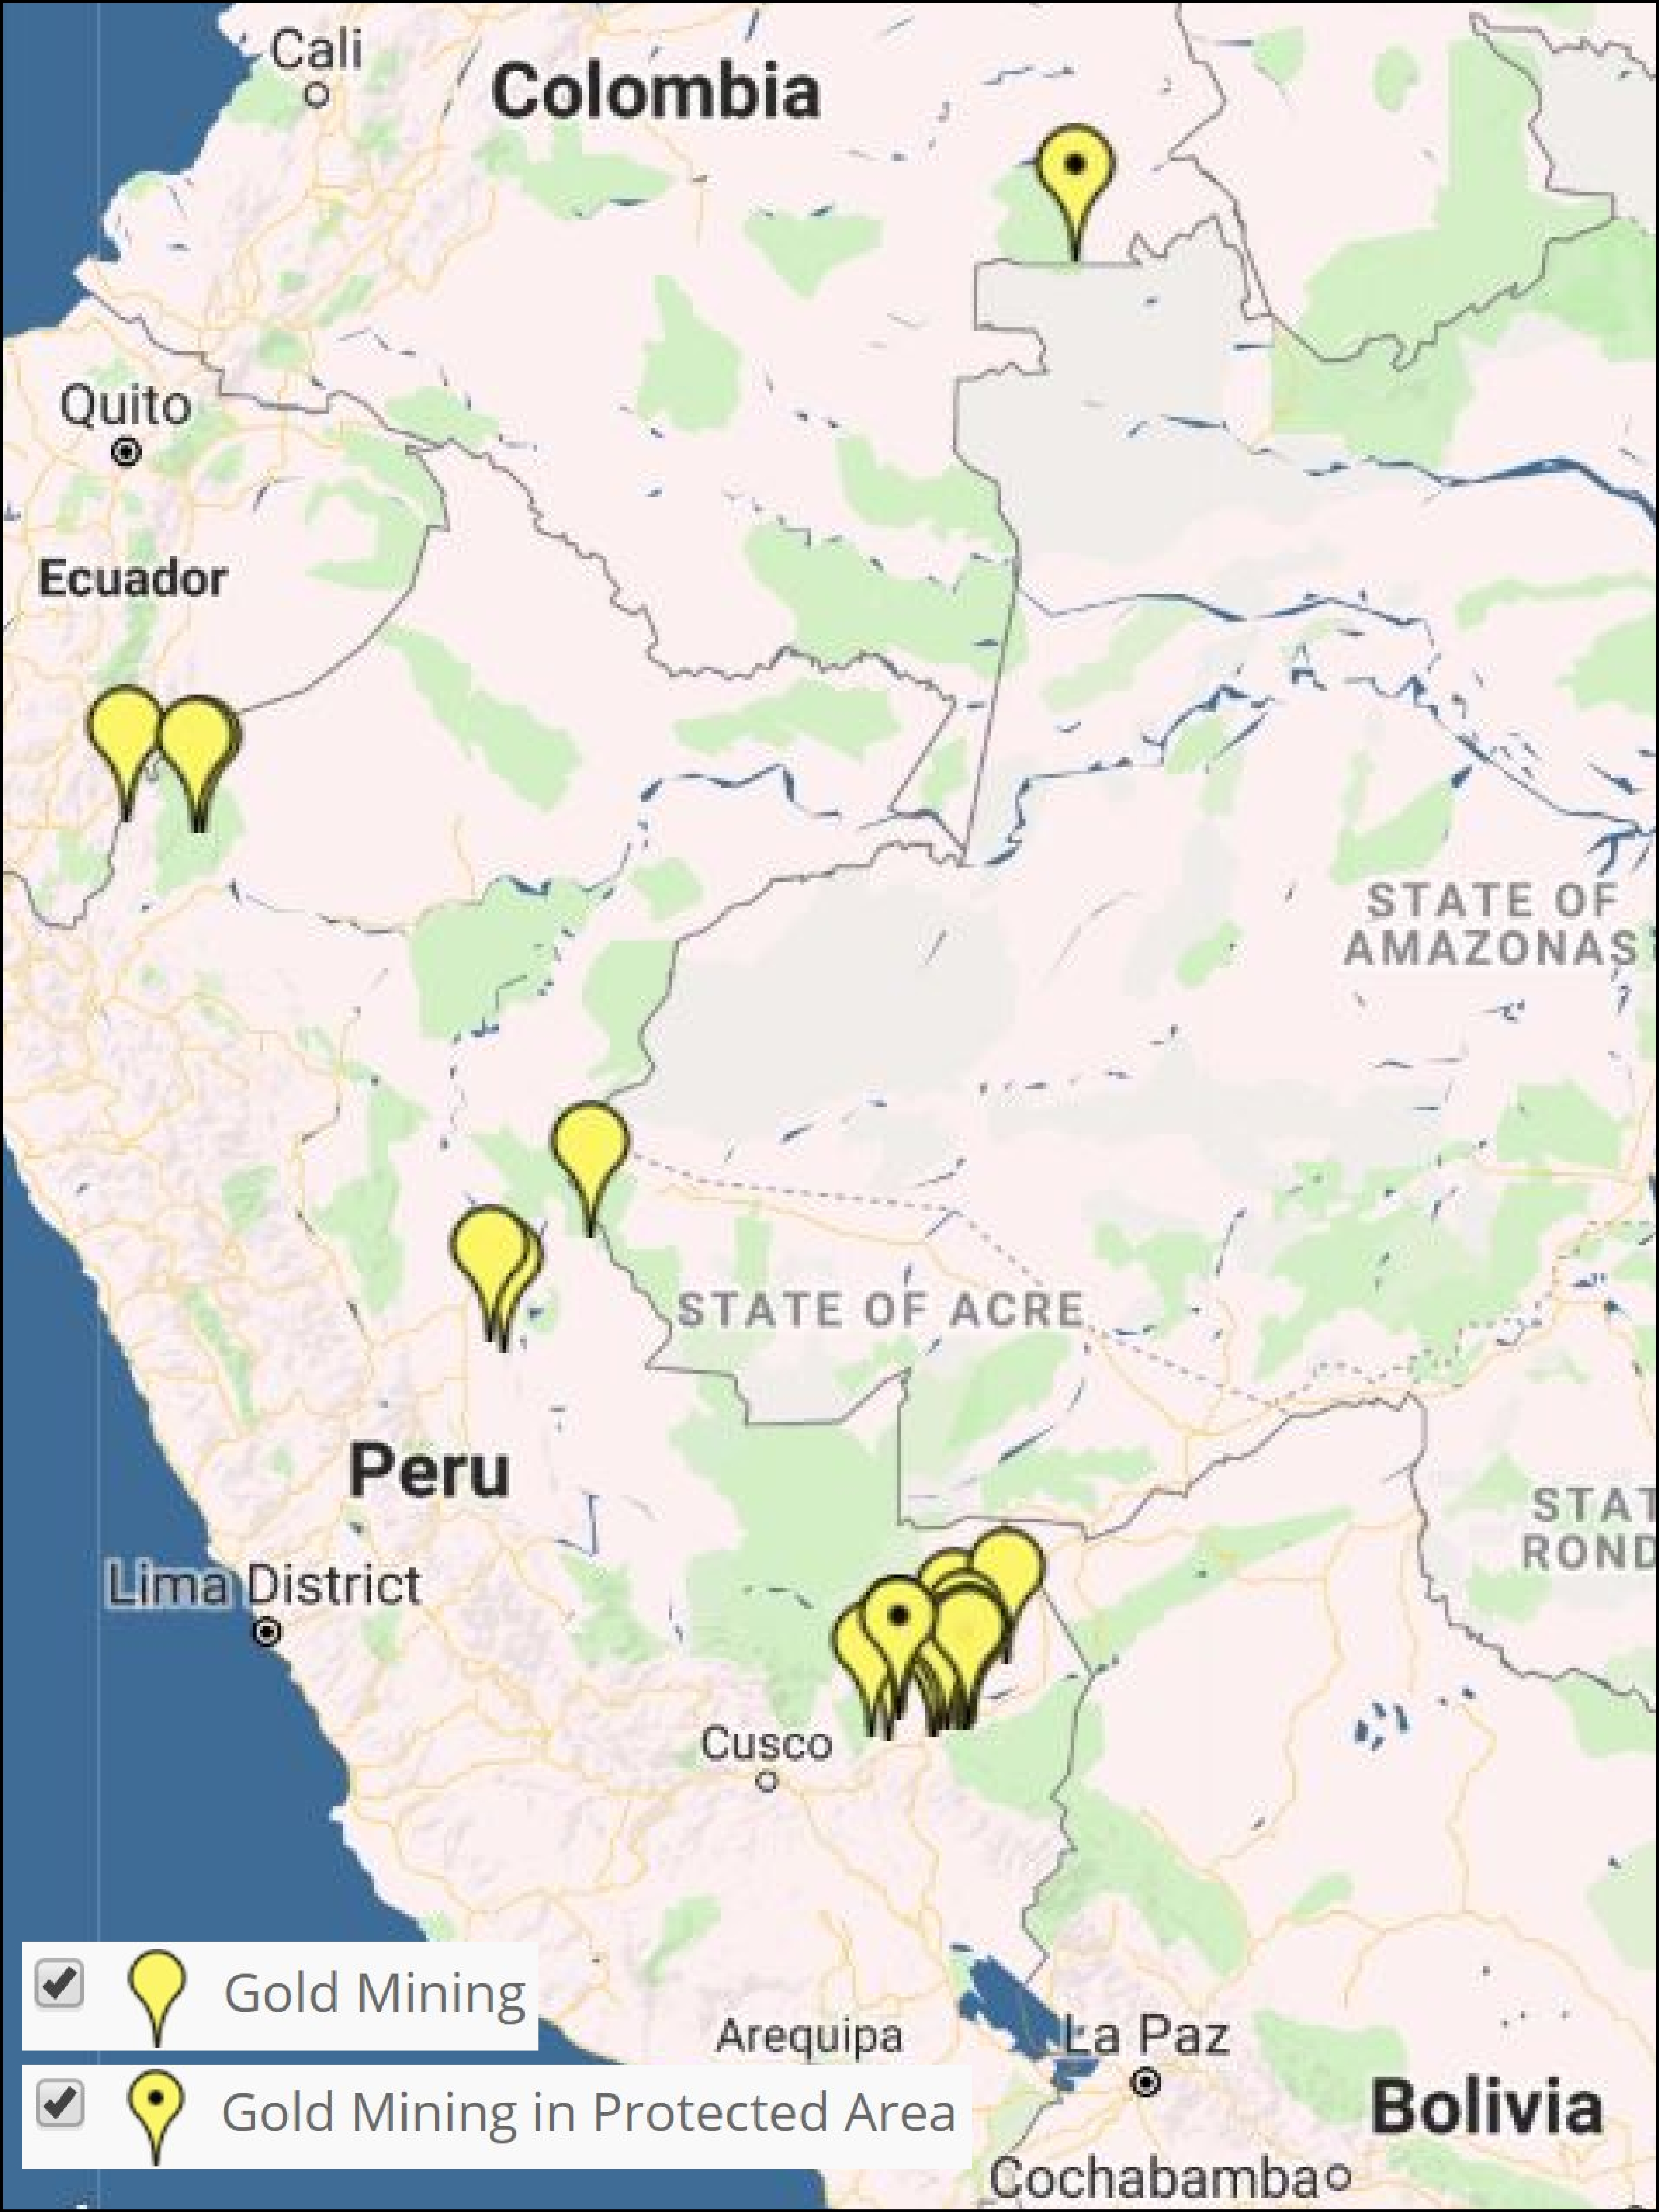


Gold Mining

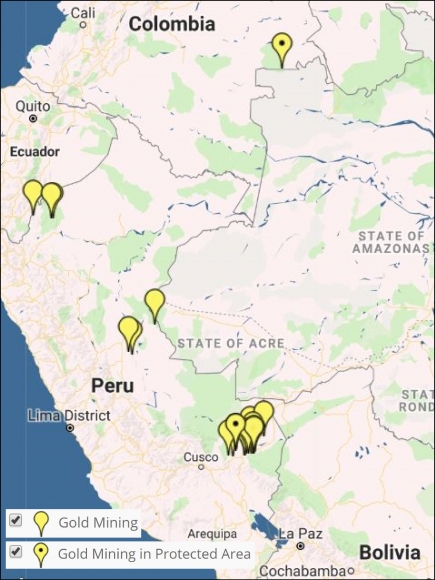
Image 6: Interactive Map, gold mining. Data: MAAP.

Image 6 shows the results of the Interactive Map when applying the “Gold mining” filter.

Legend:
Gold Mining (yellow)
*With dot indicates within protected area

The area that has been most impacted by gold mining is clearly the southern Peruvian Amazon, where we estimate the total deforestation of more than 63,800 hectares. Of this, at least 7,000 hectares have been lost since 2013.  The two most critical zones are La Pampa and Alto Malinowski in Madre de Dios (MAAP #87, MAAP #75, MAAP #79).  Another critical area exists in Cusco in the buffer zone of the Amarakaeri Communal Reserve, where mining deforestation is now less than one kilometer from the boundary of the protected area (MAAP #71).

It is important to highlight two important cases in which the Peruvian government has taken effective actions to halt illegal mining within protected areas (MAAP #64).  In September 2015, illegal miners invaded Tambopata National Reserve and deforested 550 hectares over the course of a two-year period.  At the end of 2016, the government intensified its interventions and the invasion was halted in 2017. In regards to Amarakaeri Communal Reserve, in June 2015 we revealed the mining invasion deforestation of 11 hectares.  Over the course of the following weeks, SERNANP and ECA Amarakaeri implemented measures and rapidly halted the illegal activity.

Other small gold-mining fronts are emerging in the northern and central Peruvian Amazon (MAAP #45, MAAP #49).

In addition, we have also documented deforestation linked to illegal gold-mining activities in the Puinawai National Park in the Colombian Amazon.
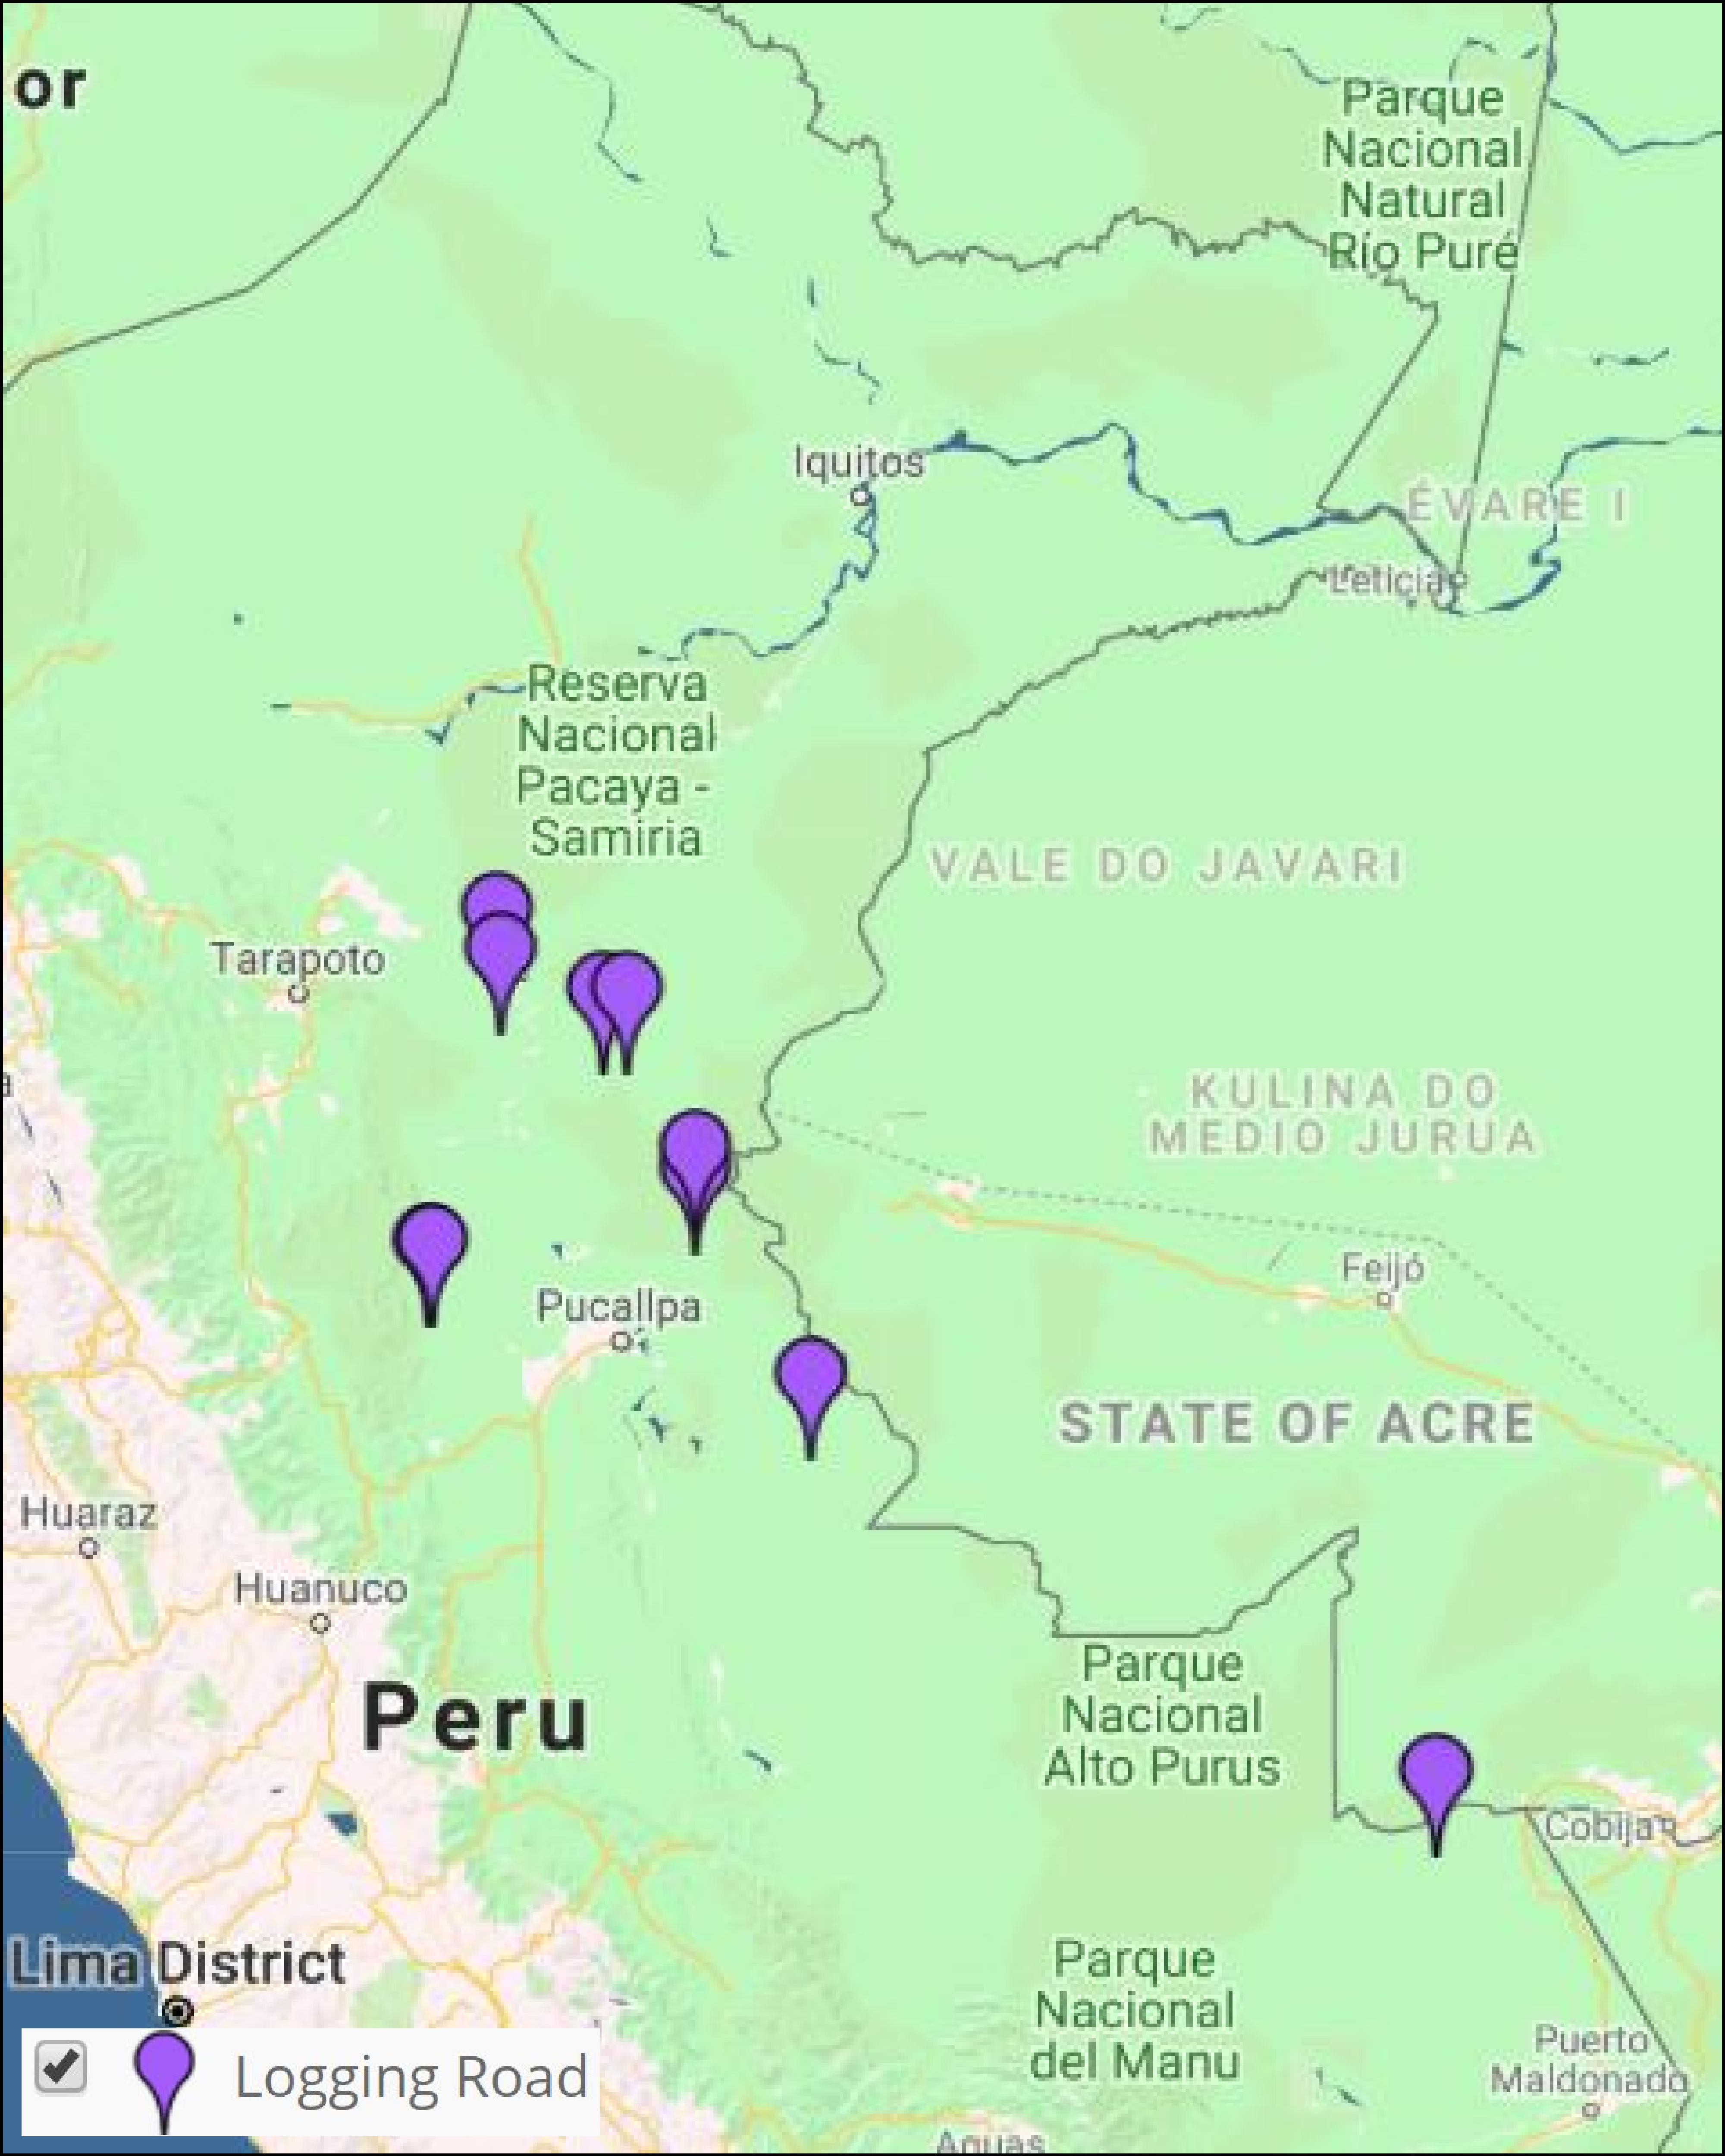
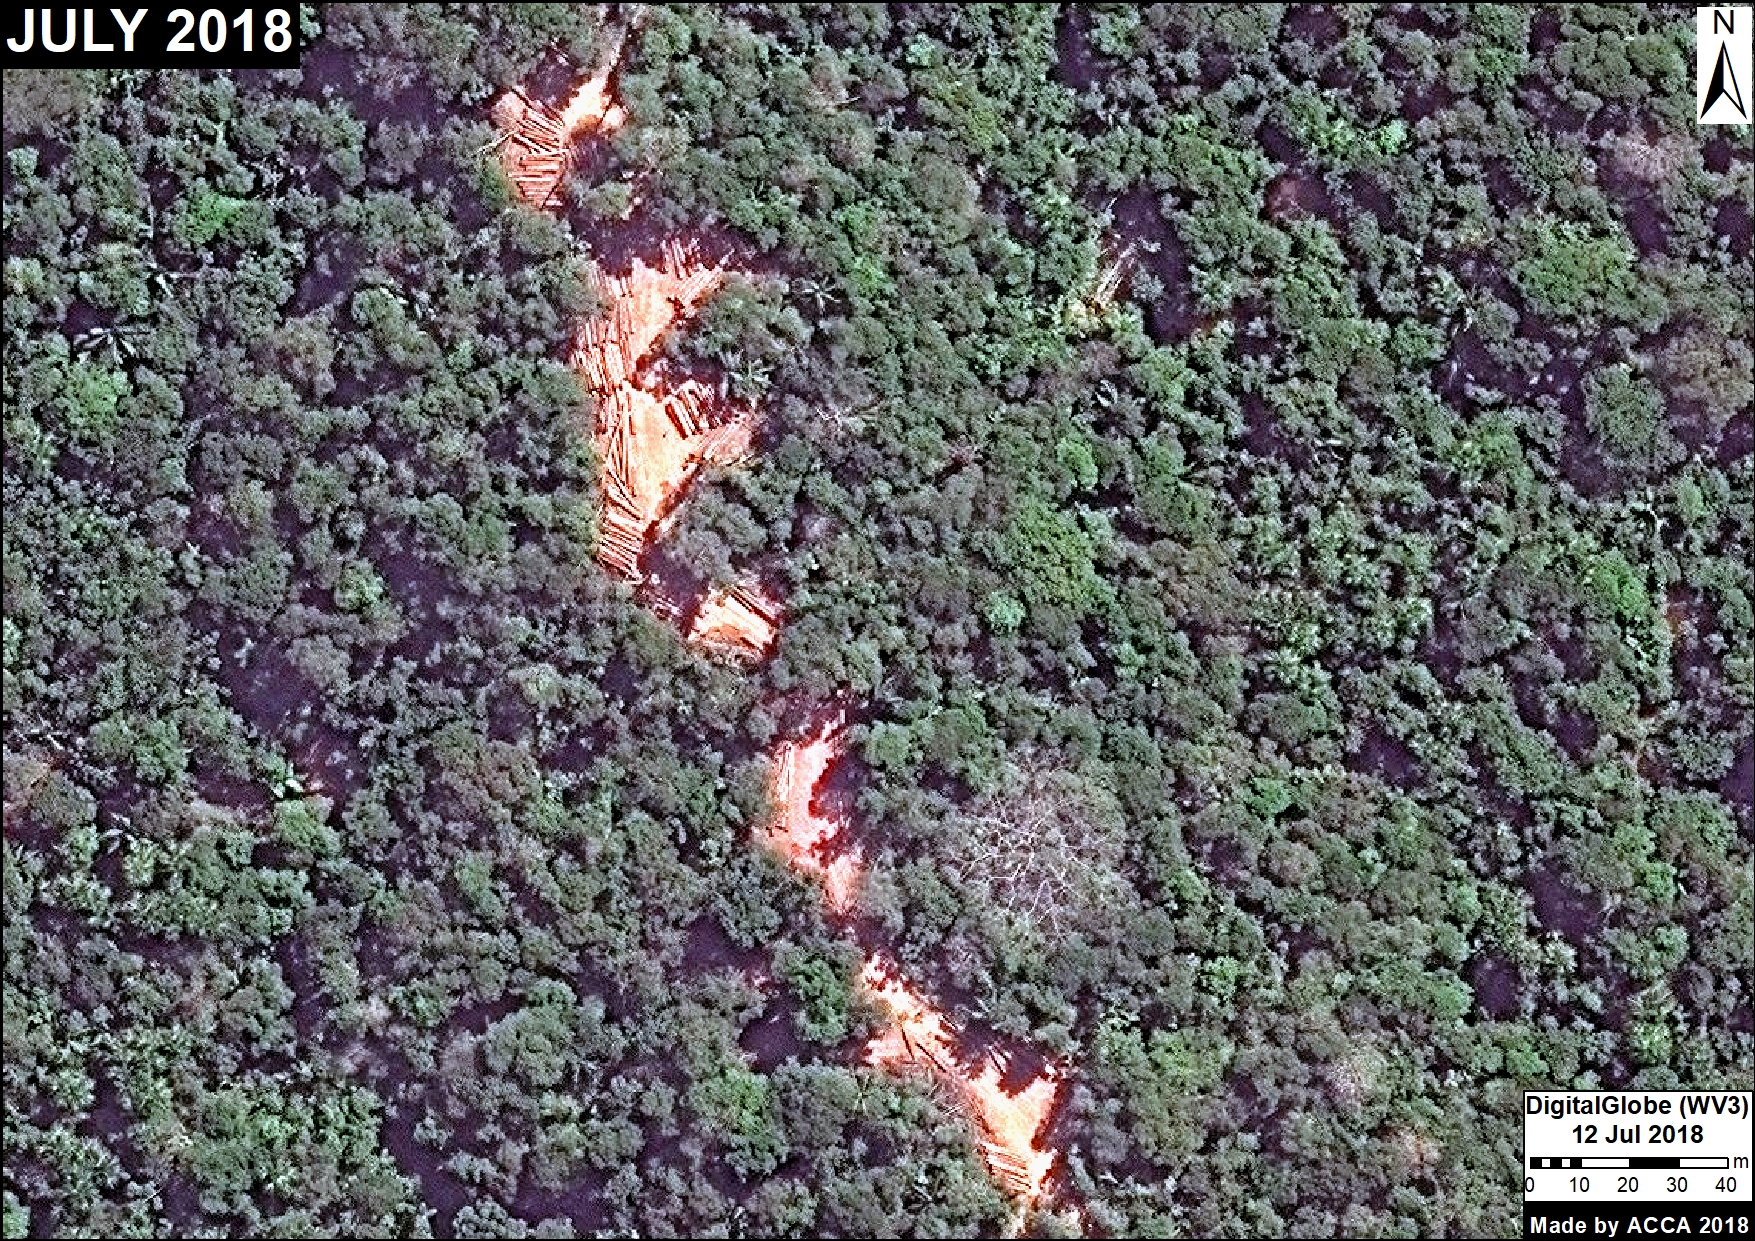
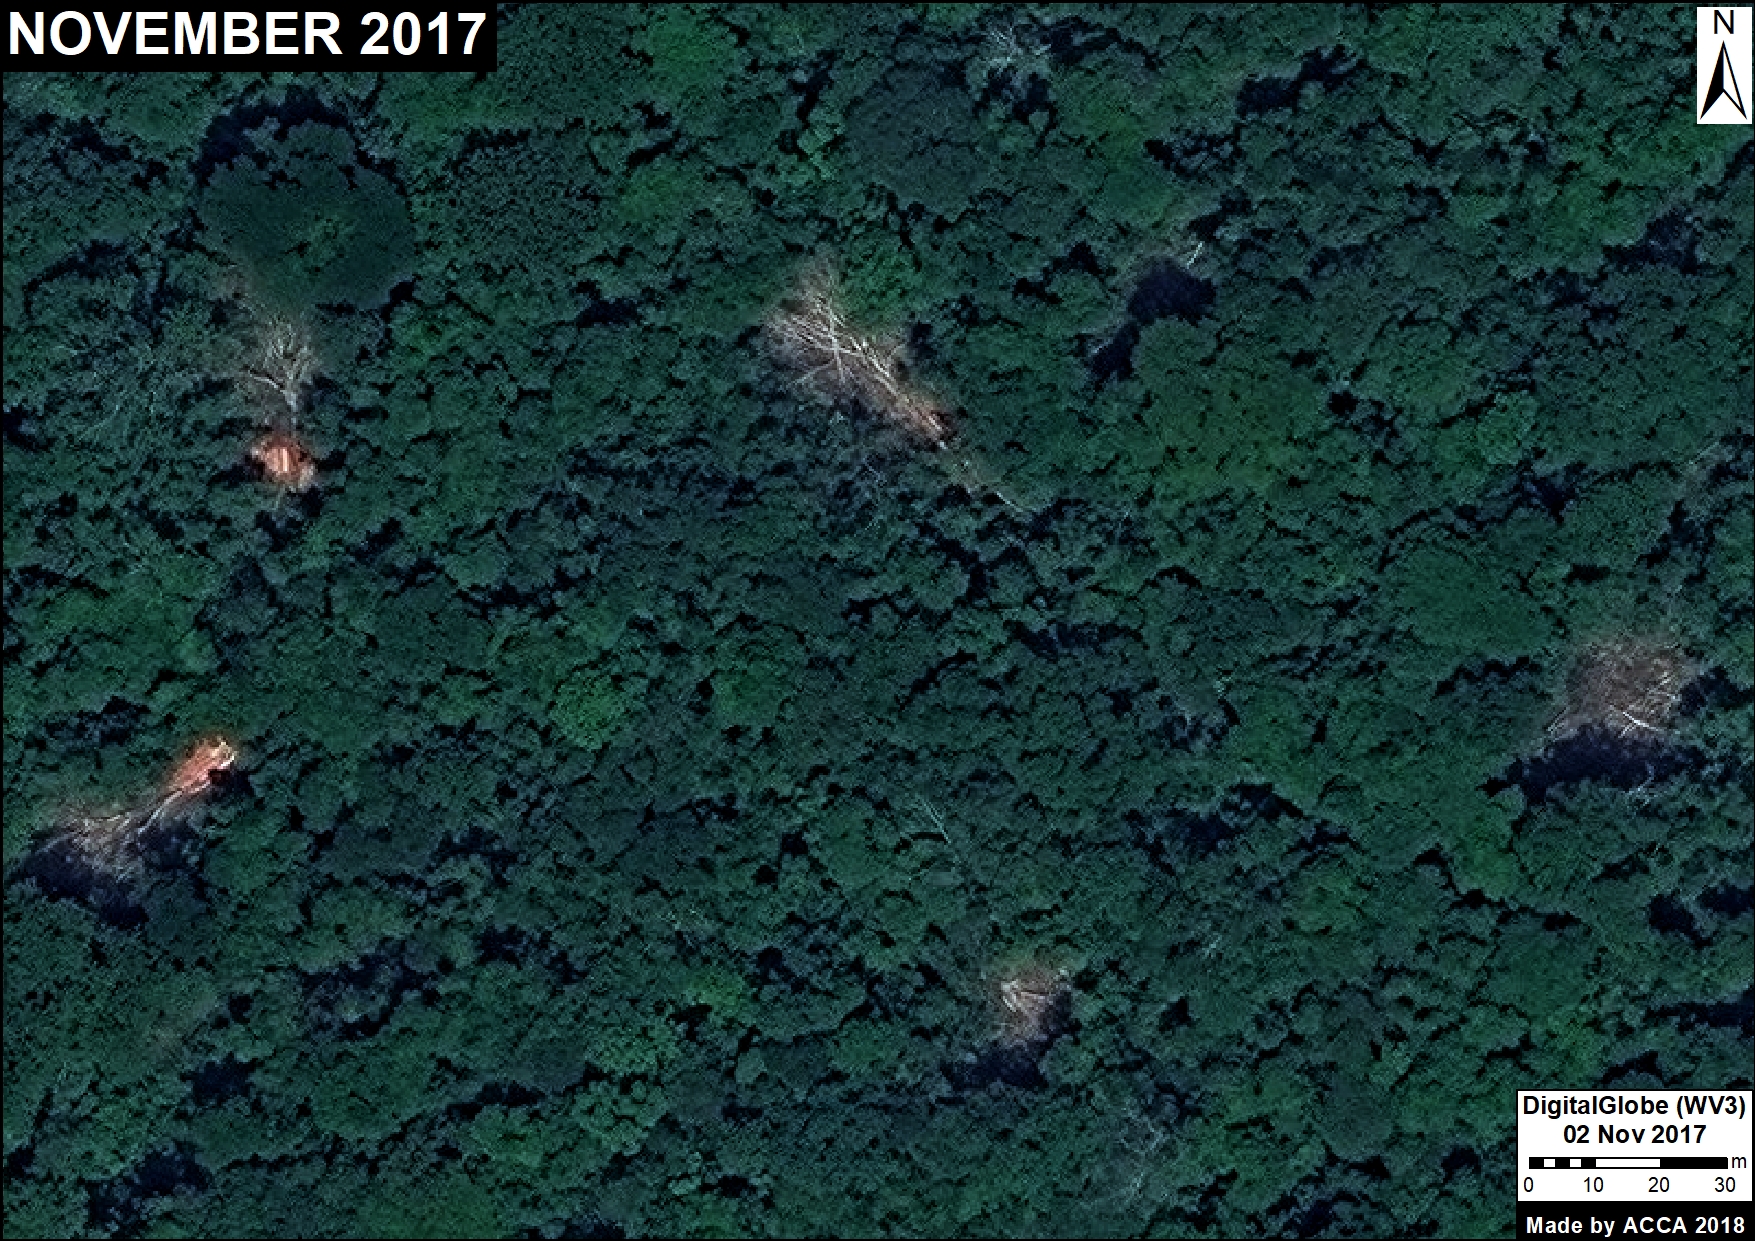
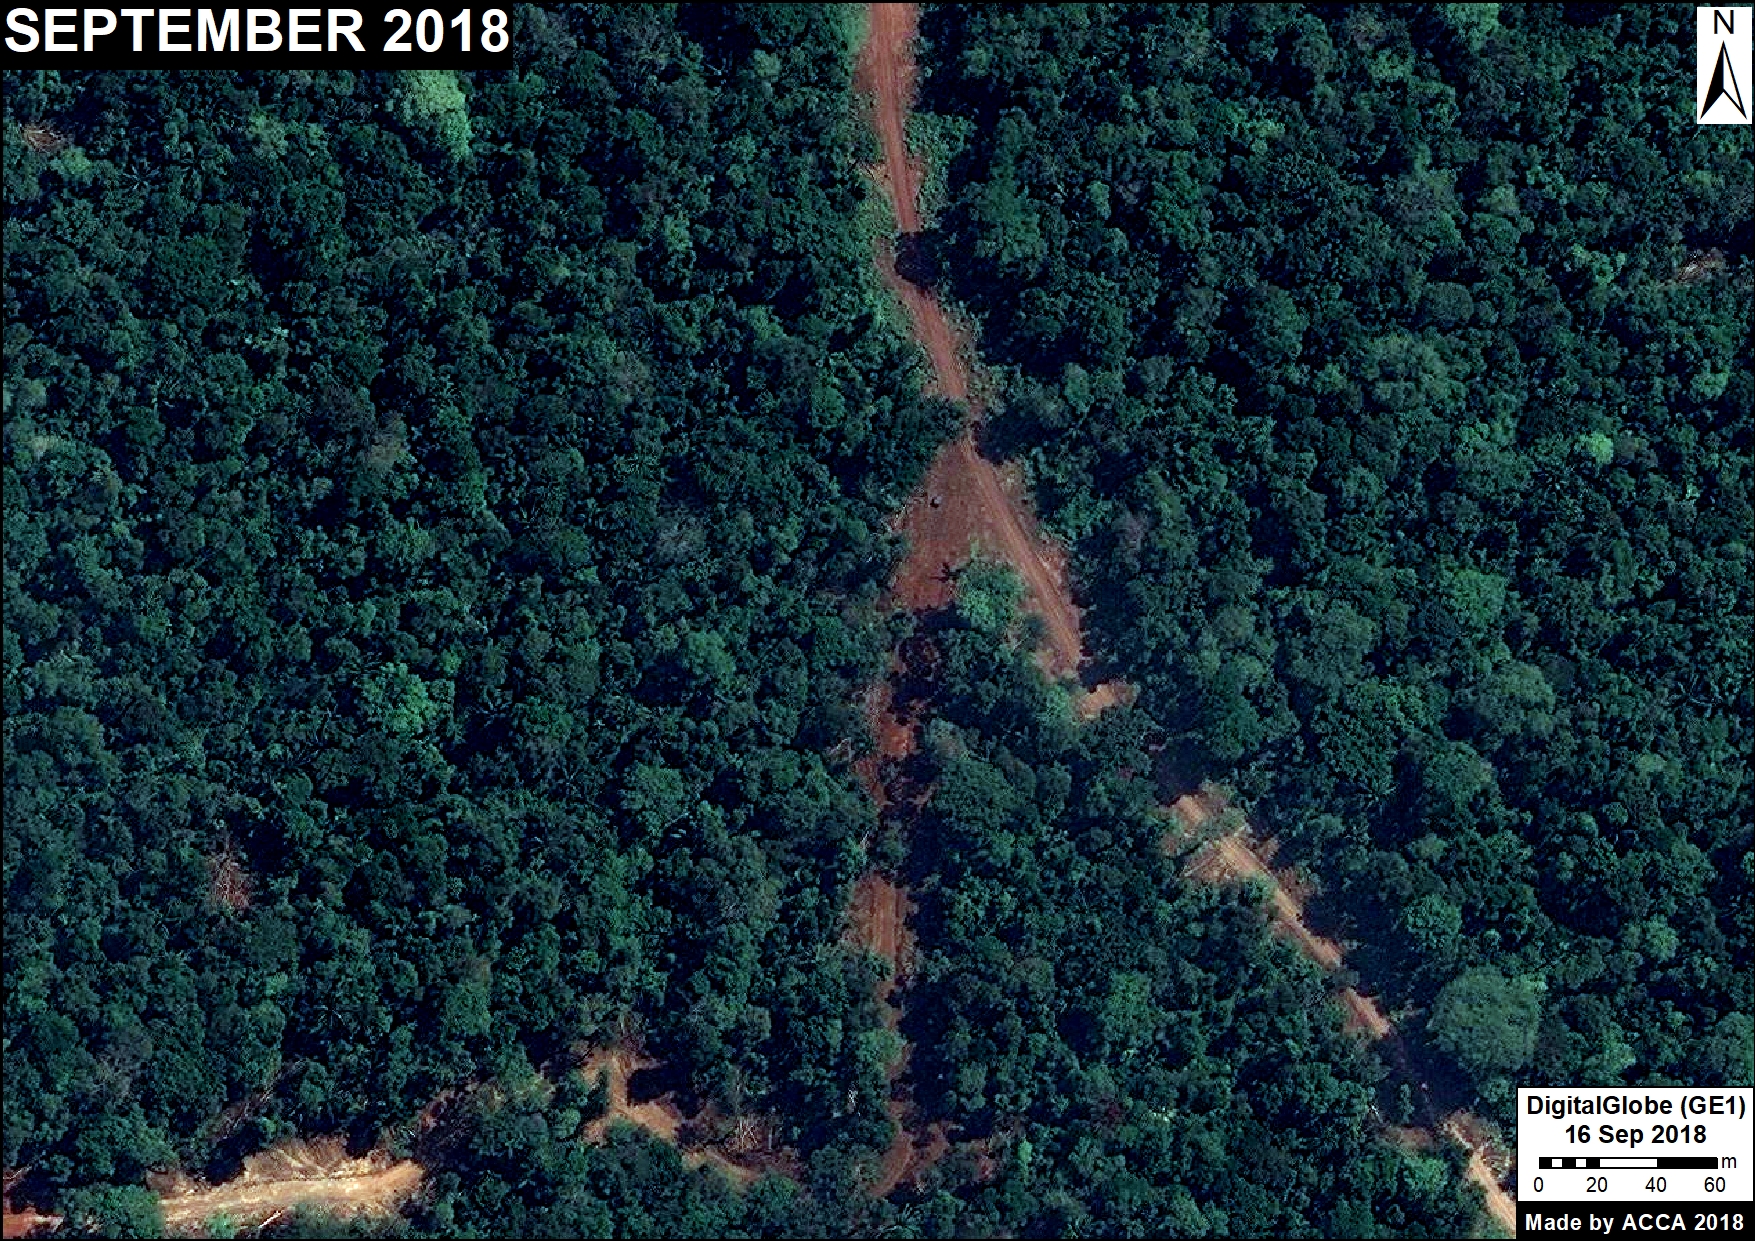
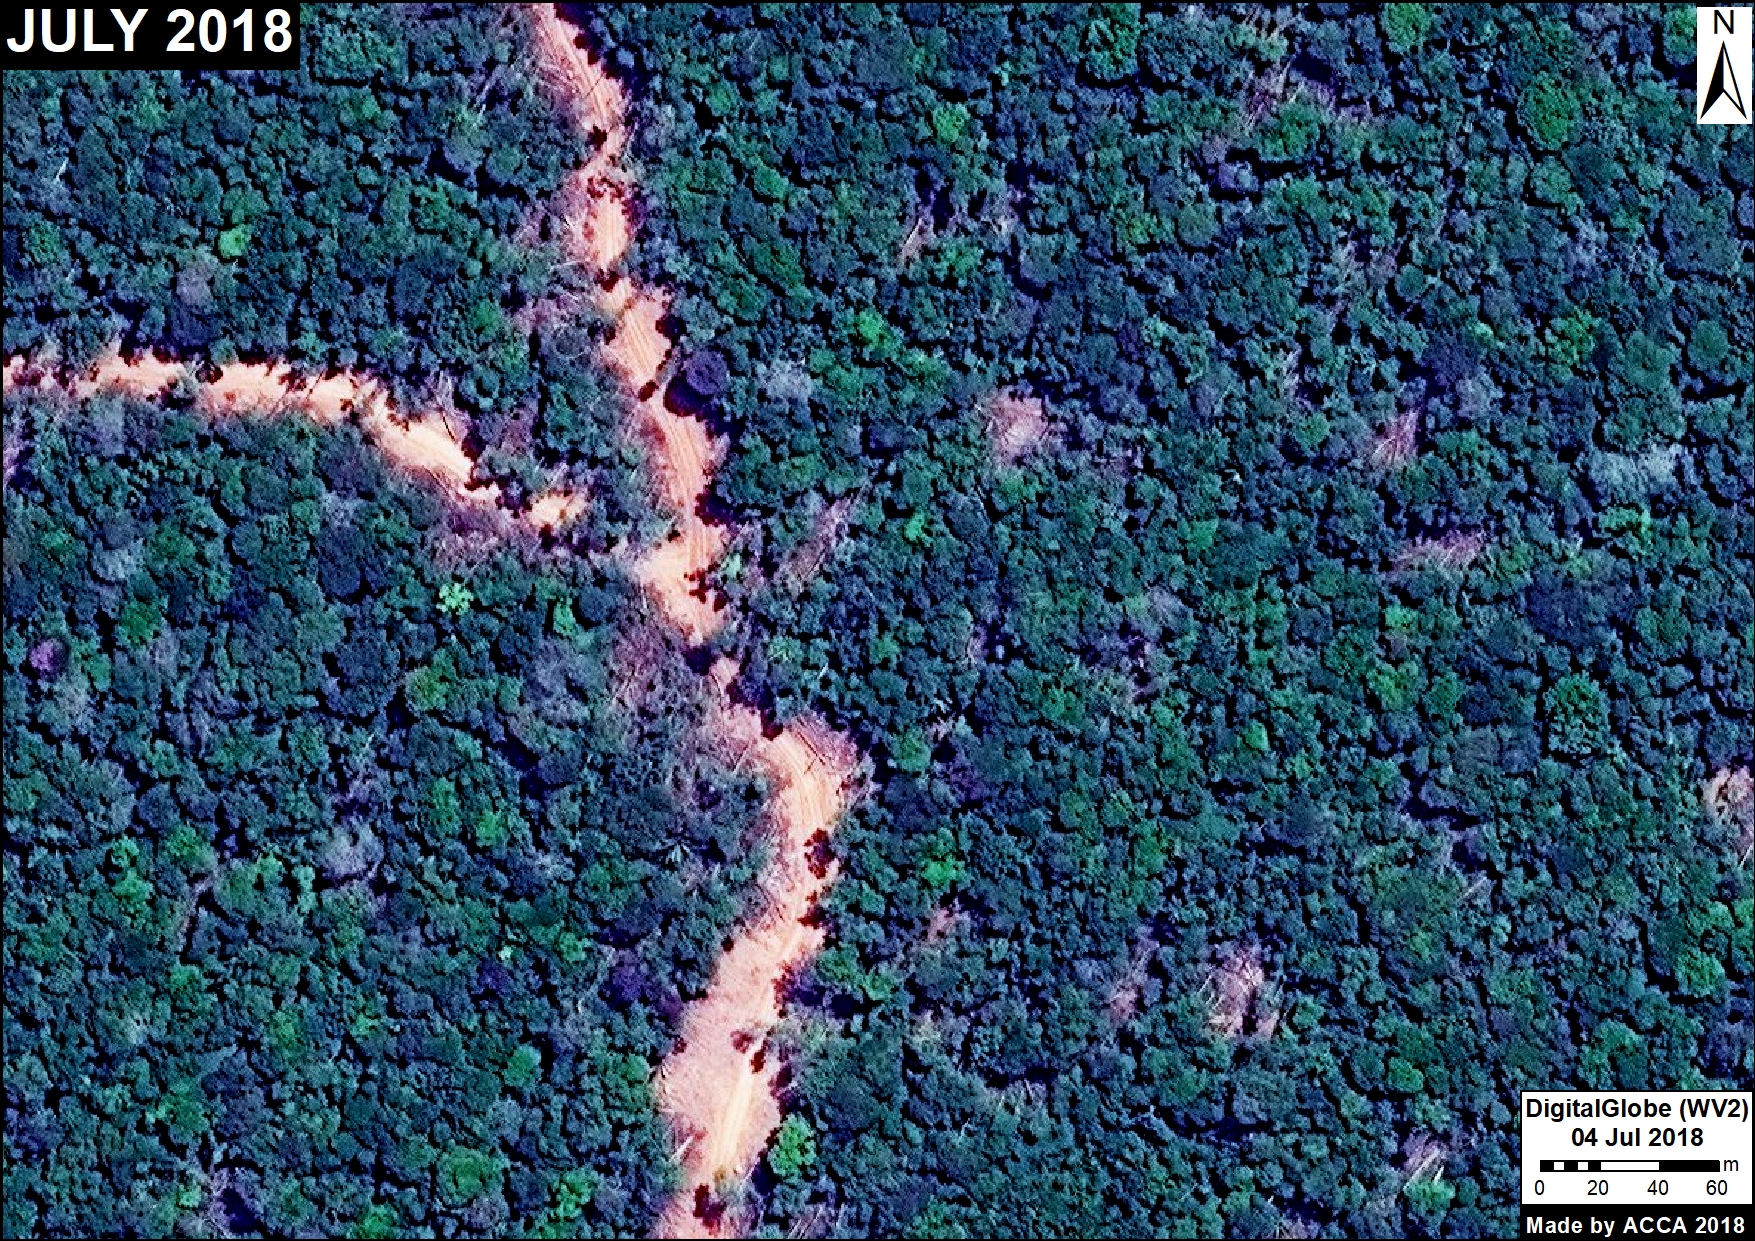
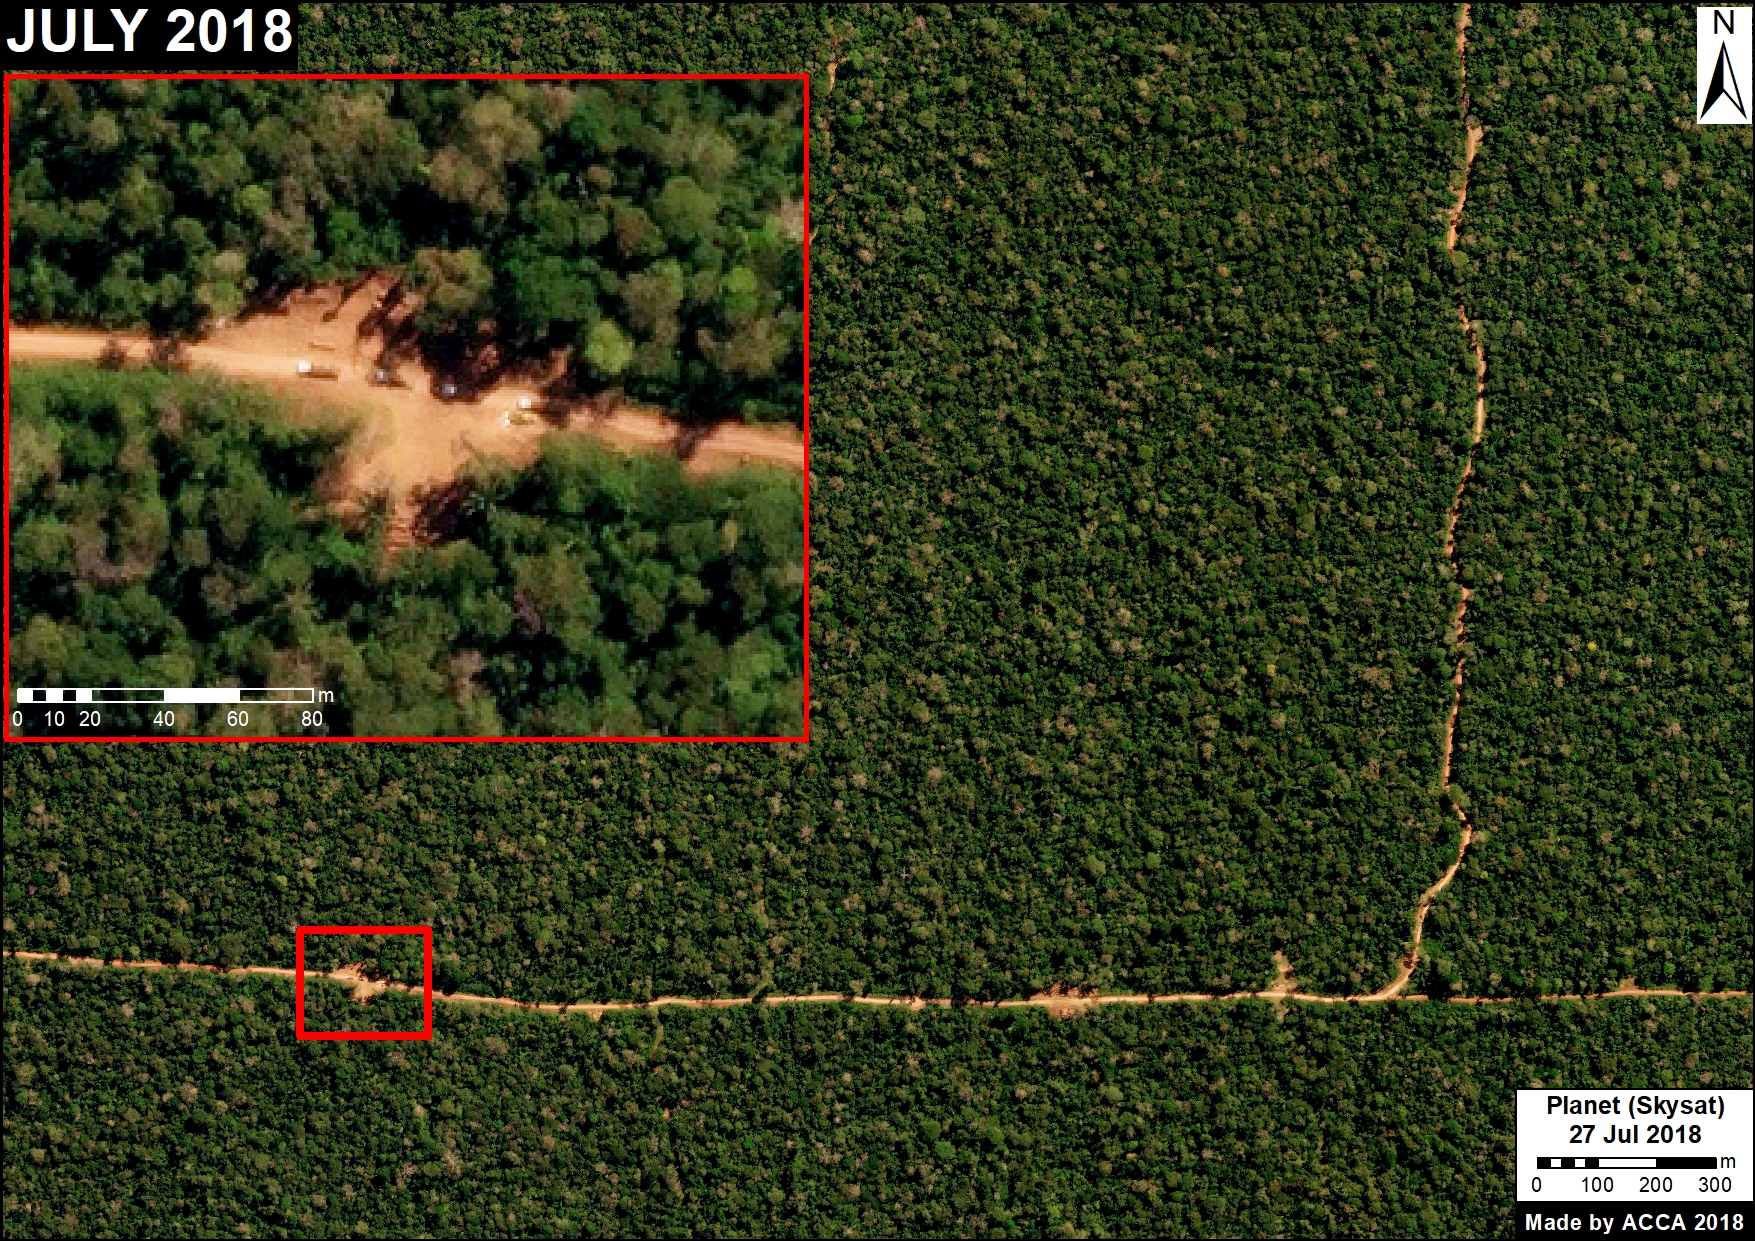
Logging

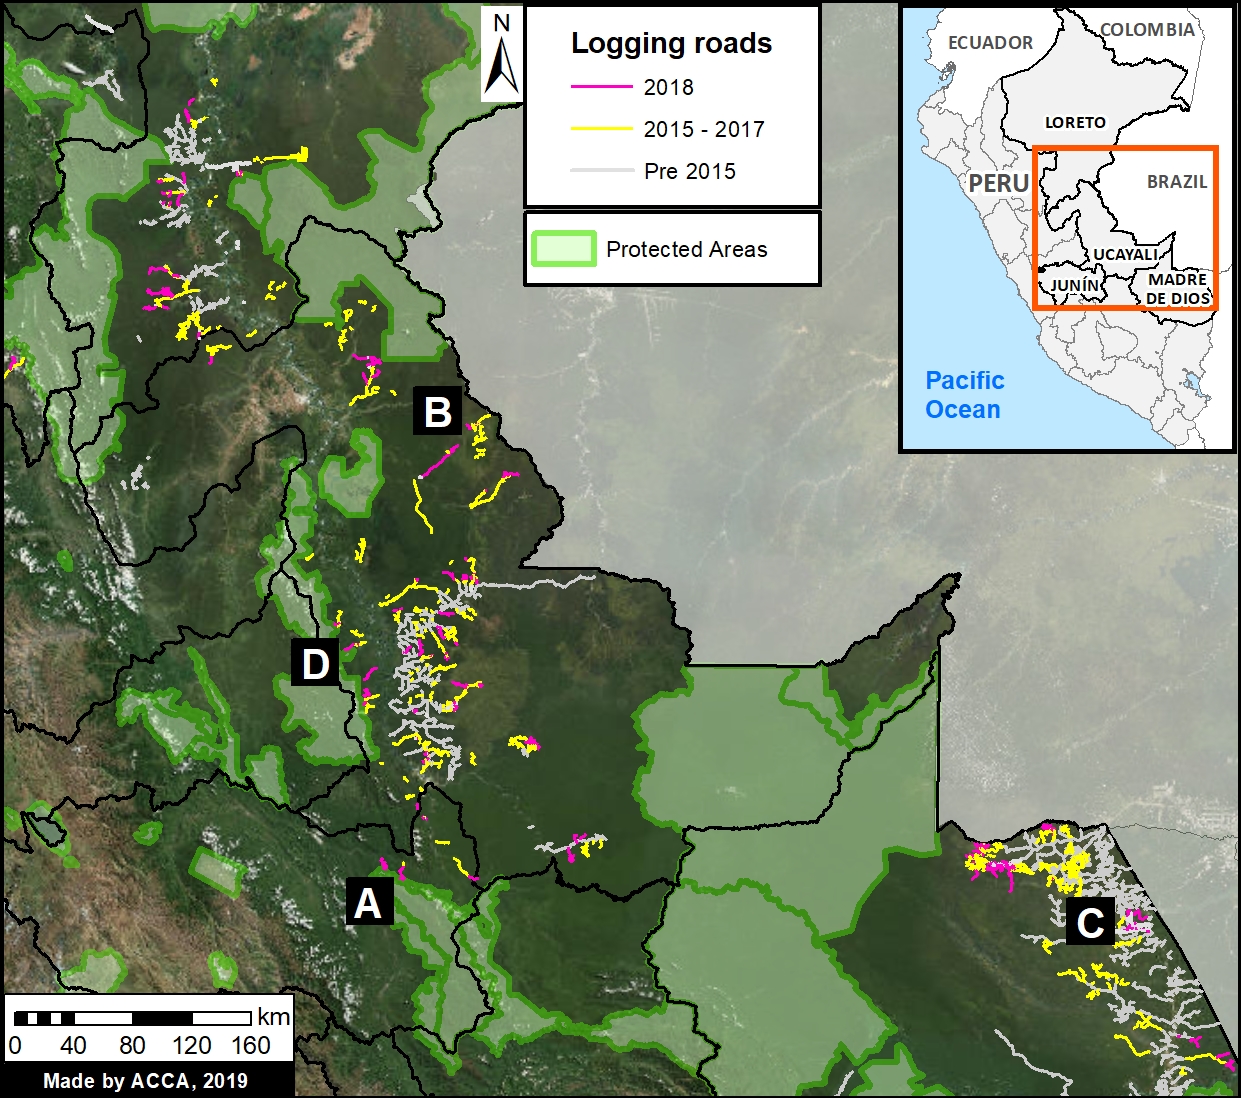
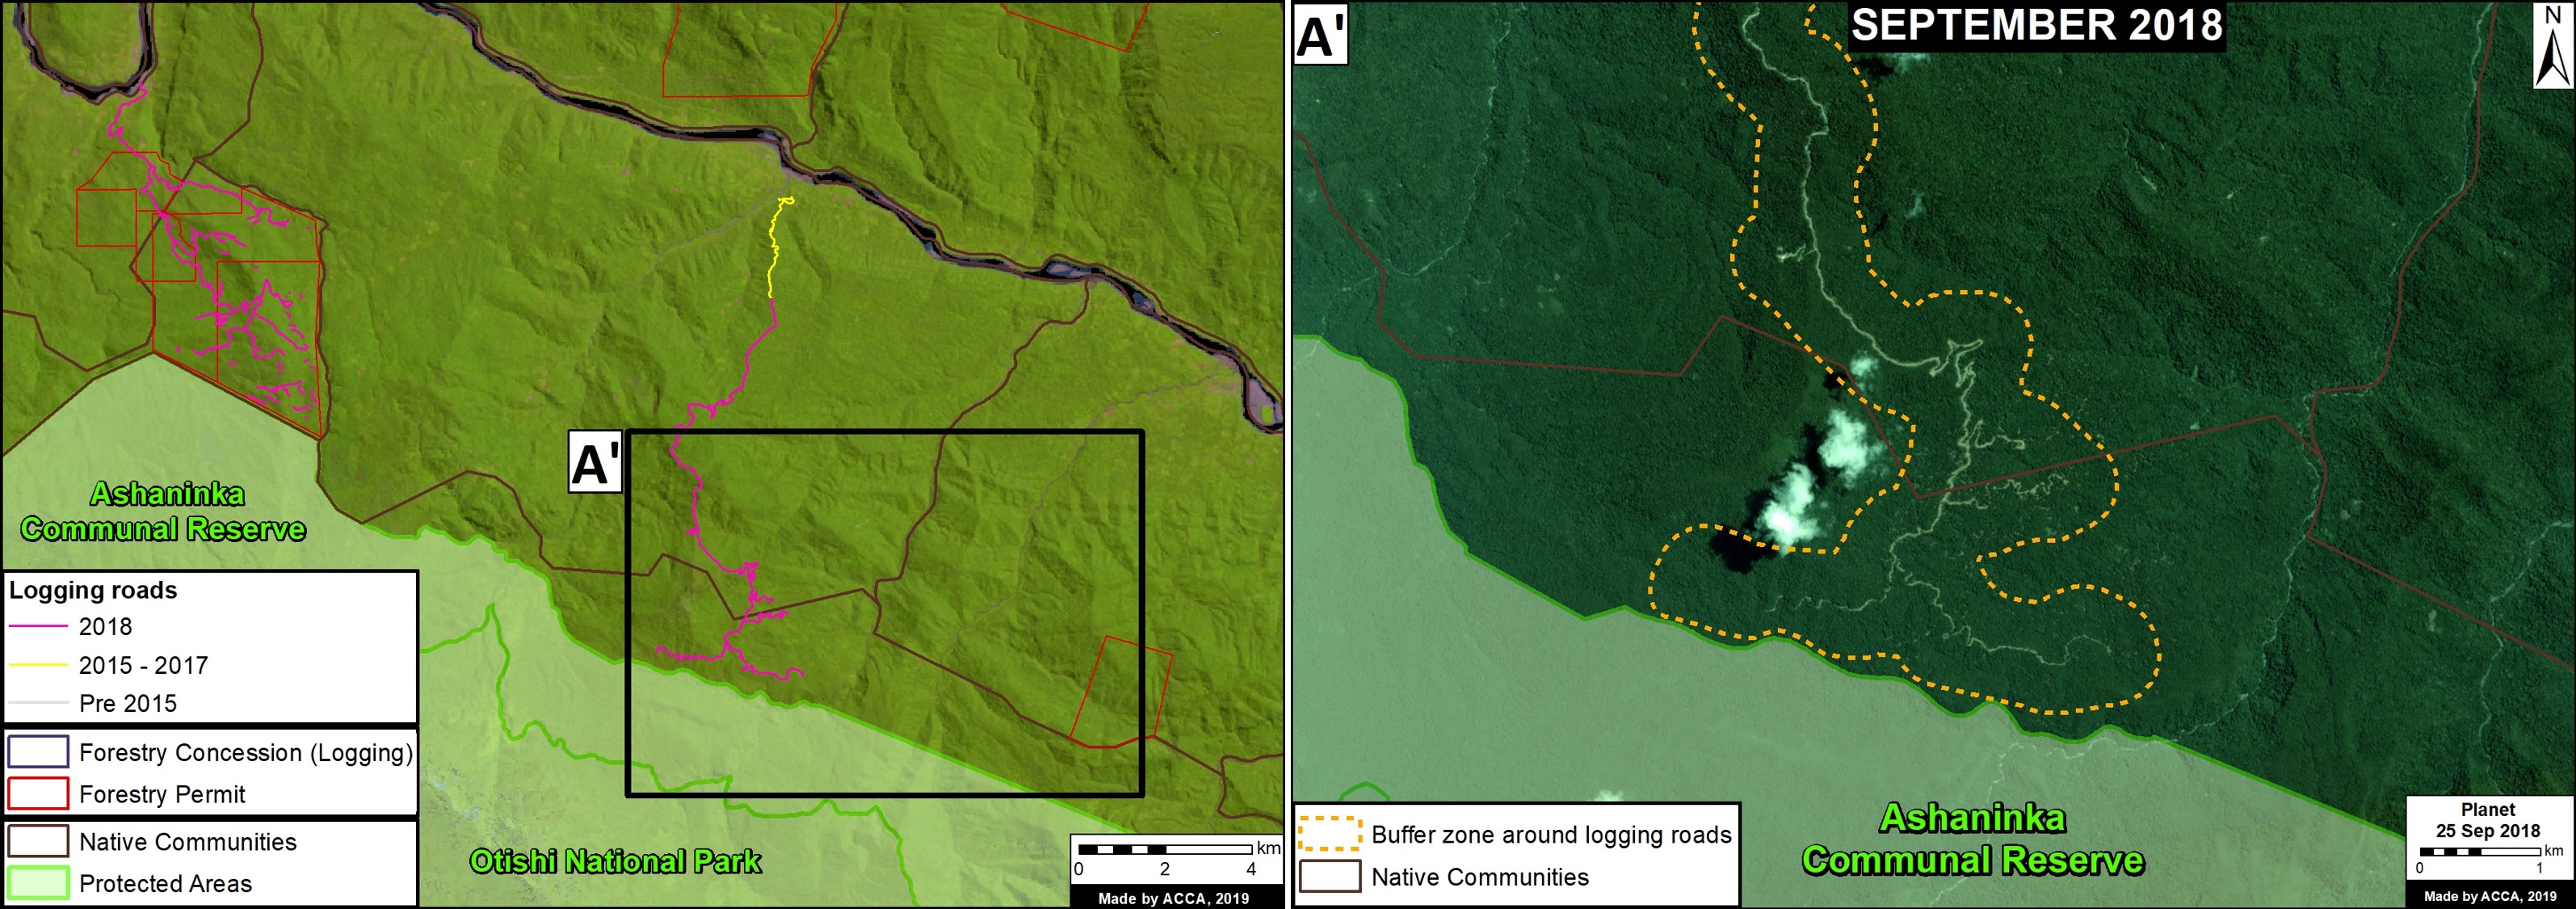
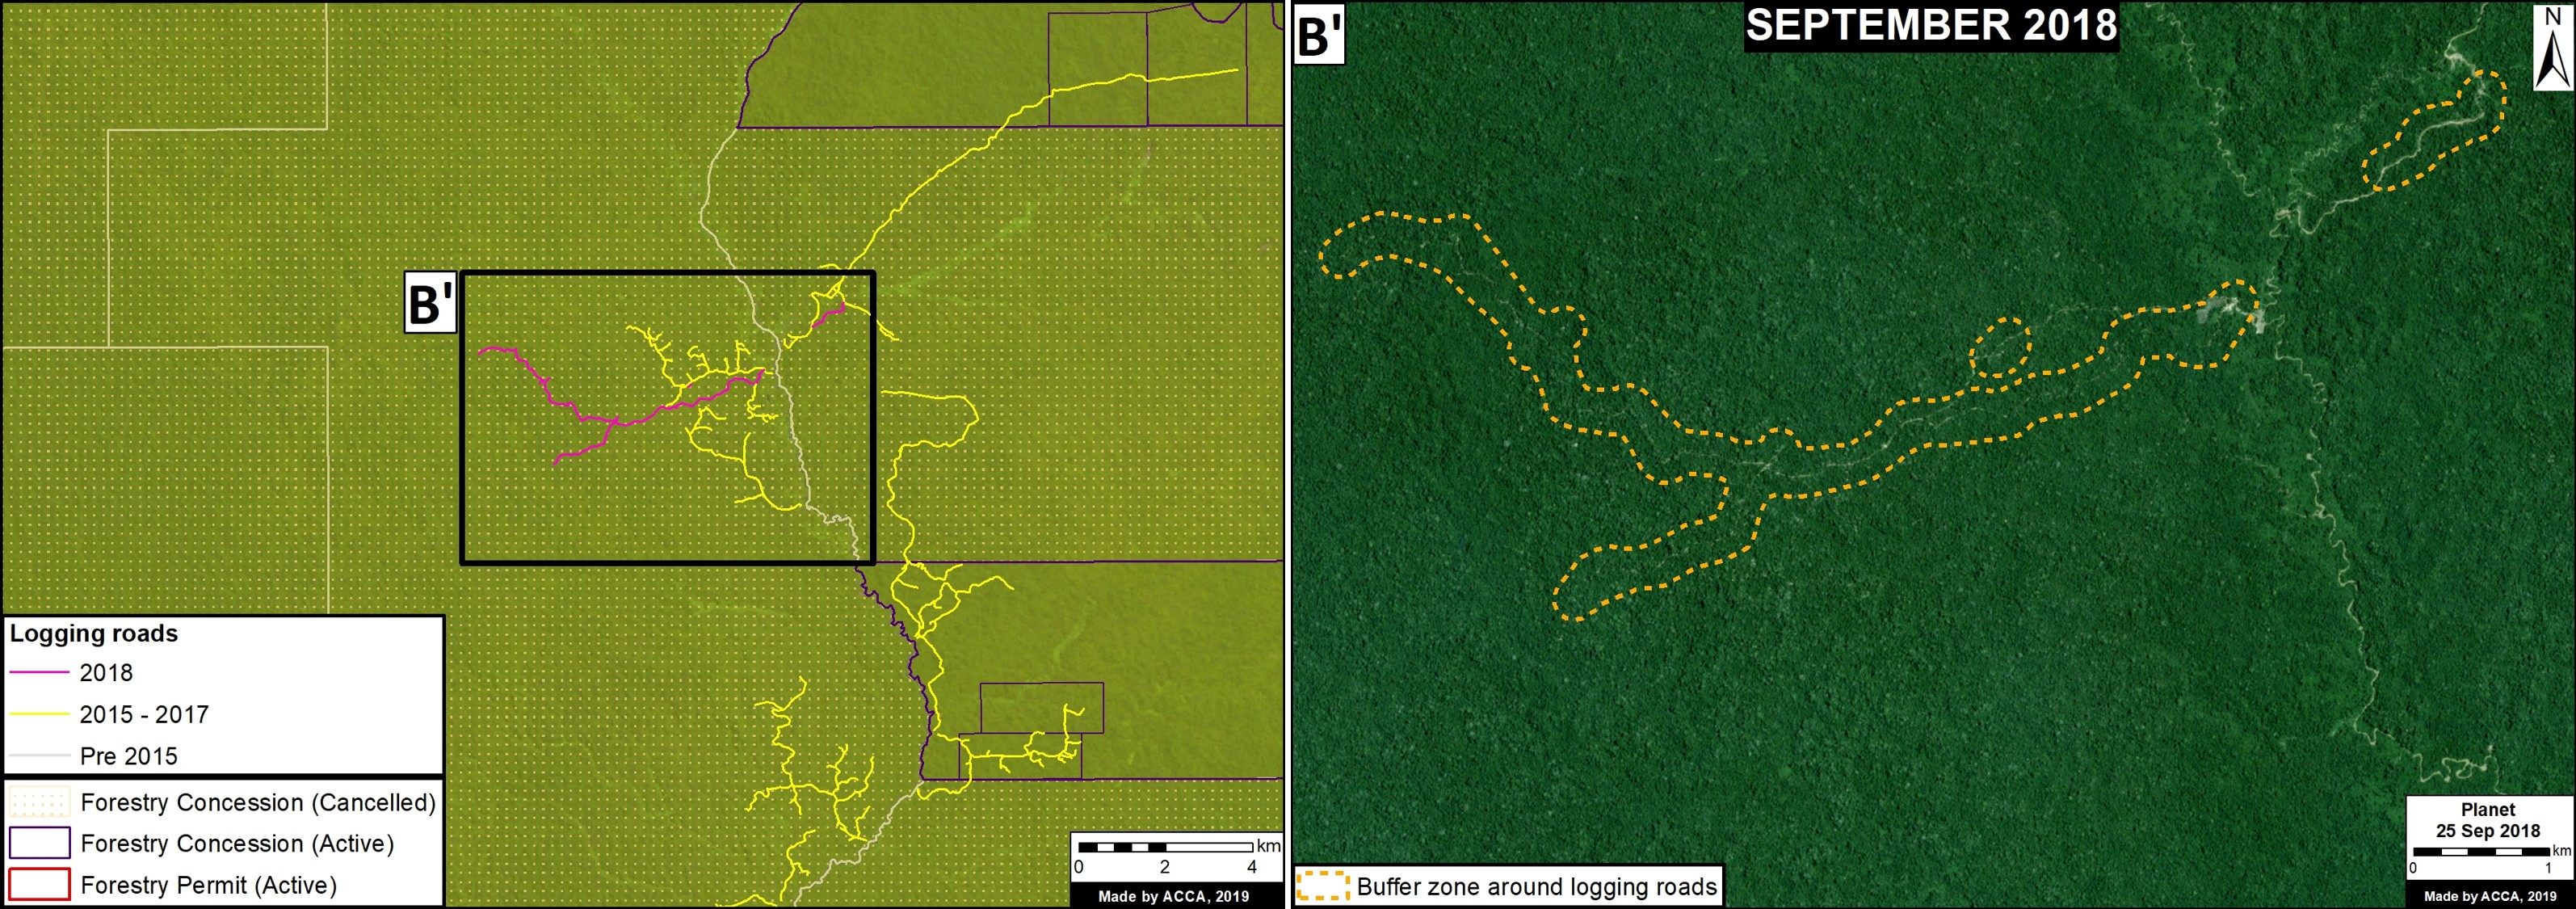
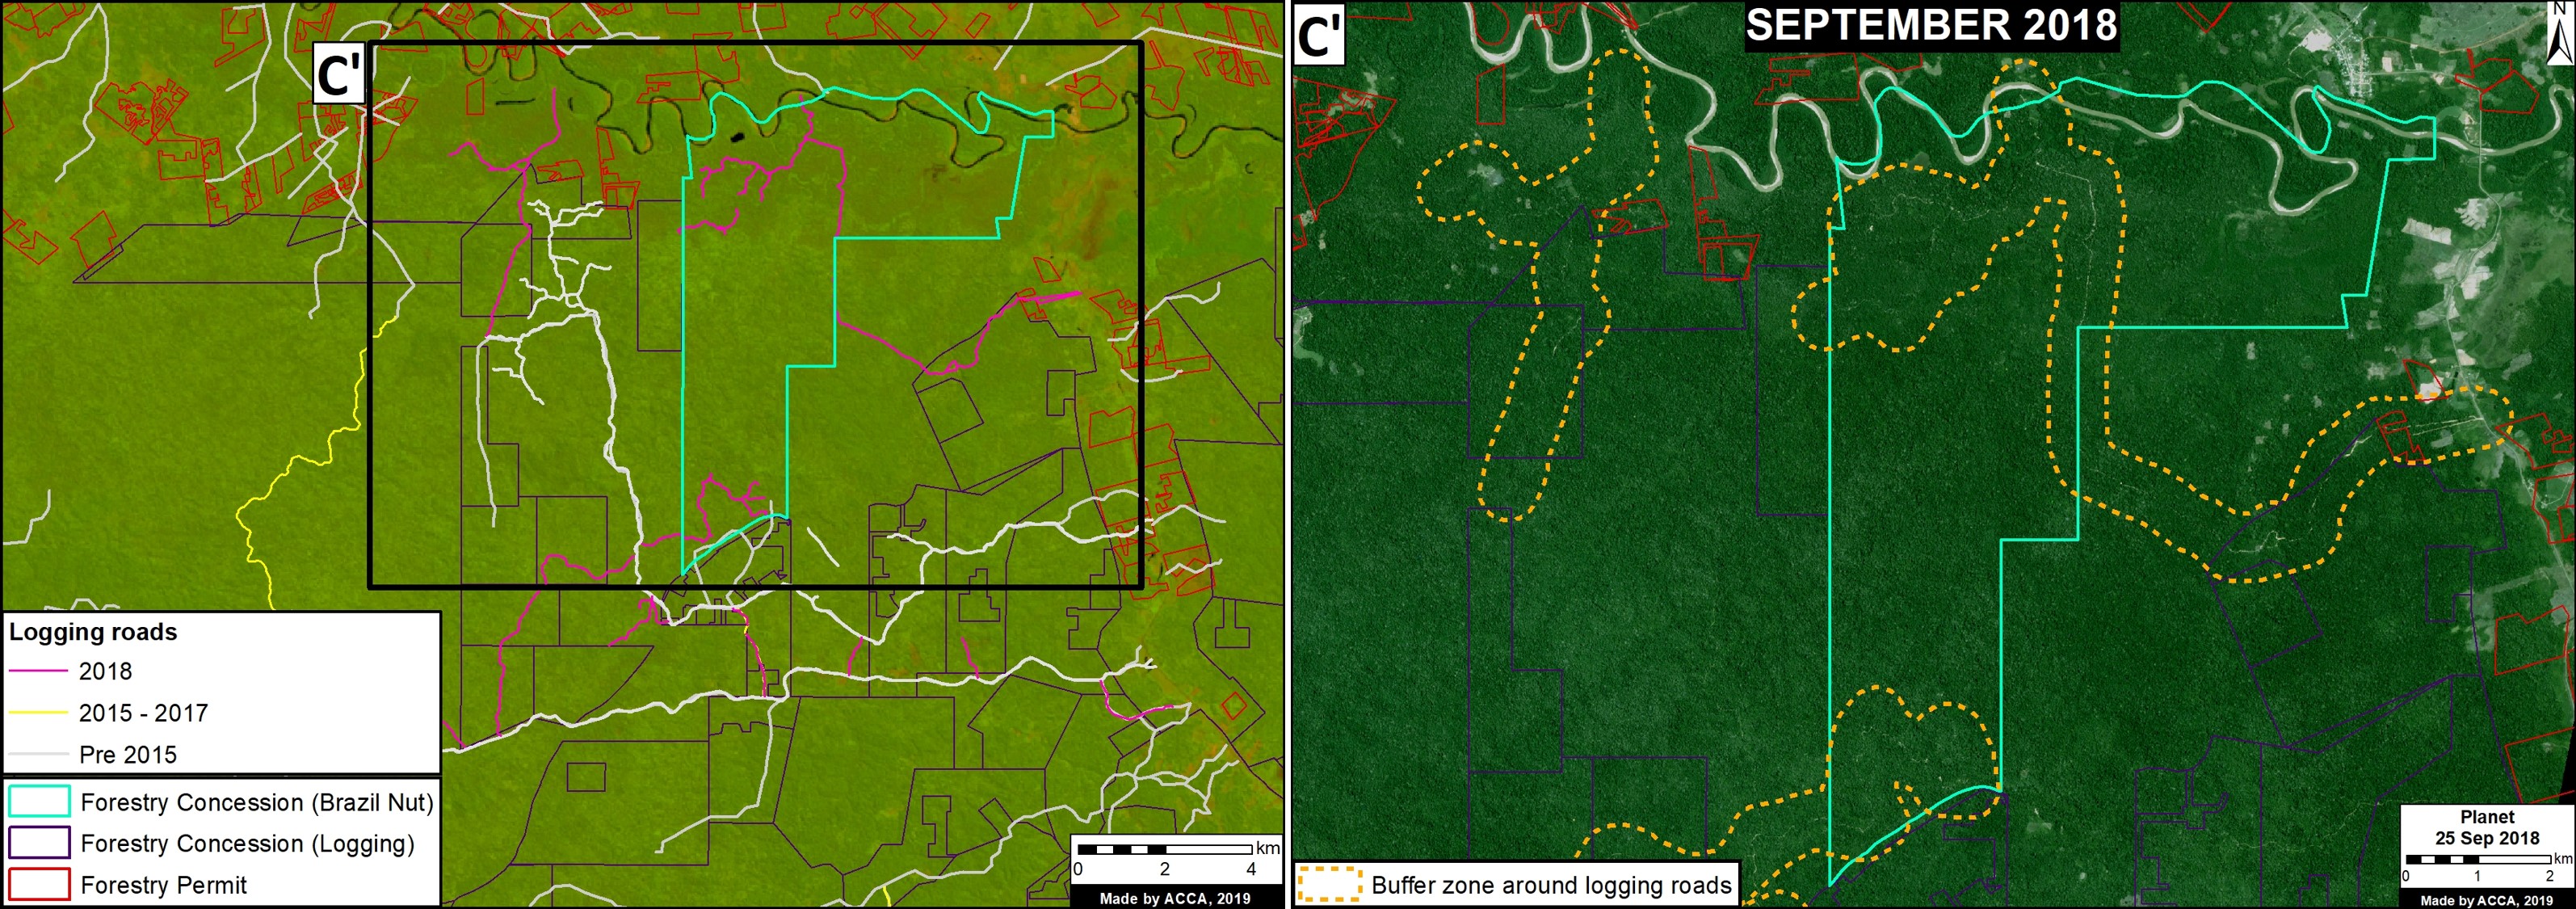
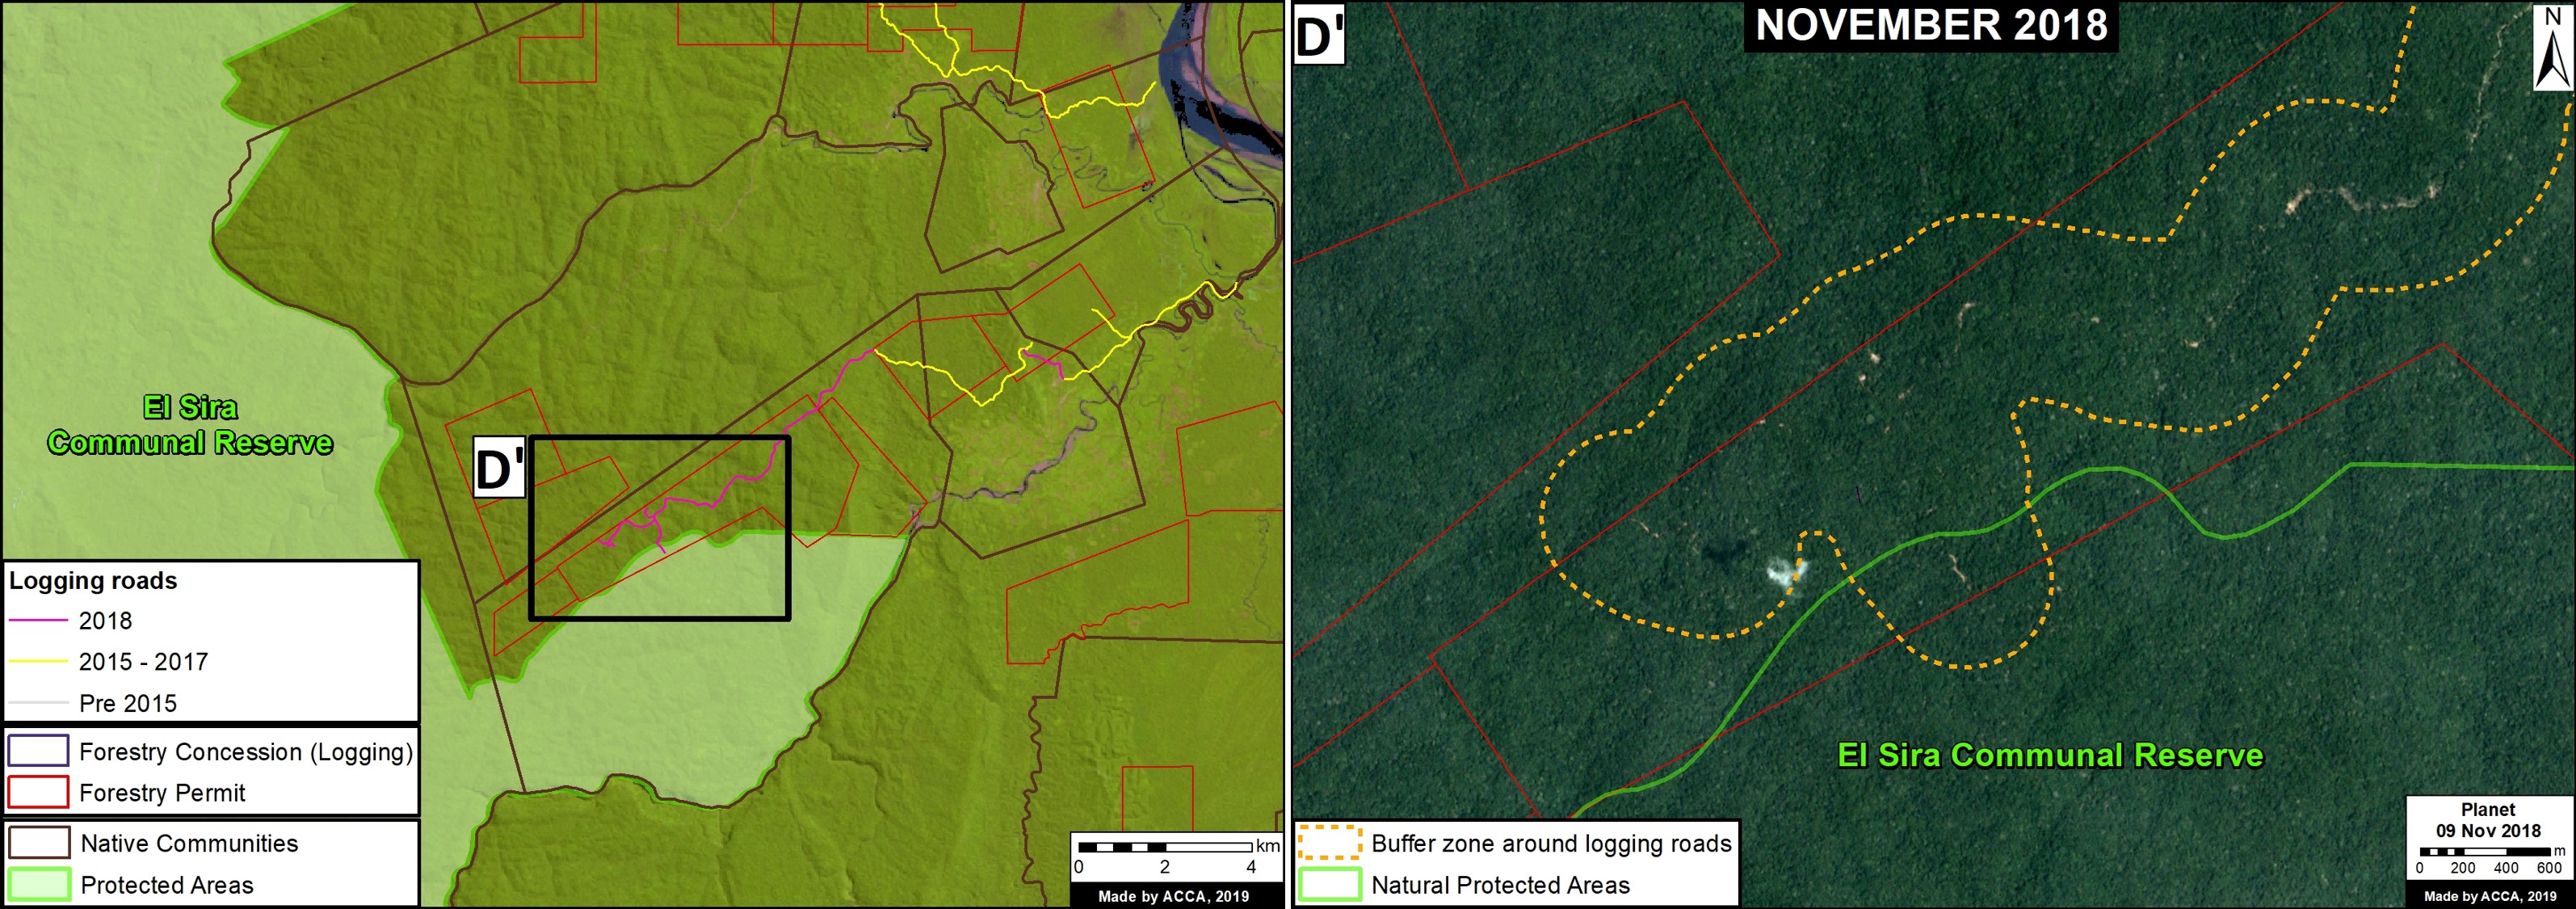
Image 7: Interactive Map, logging roads. Data: MAAP.

In MAAP #85 we proposed a new tool to address illegal logging in the Peruvian Amazon: utilize satellite imagery to monitor construction of logging roads in near real-time.

Image 7 shows the results of the Interactive Map when applying the “Logging roads” filter.

Legend:
Logging Road (purple)

We estimate that 2,200 kilometers of forest roads have been constructed in the Peruvian Amazon during the last three years (2015-2017).  The roads are concentrated in southern Loreto, Ucayali, and northwestern Madre de Dios.


Roads

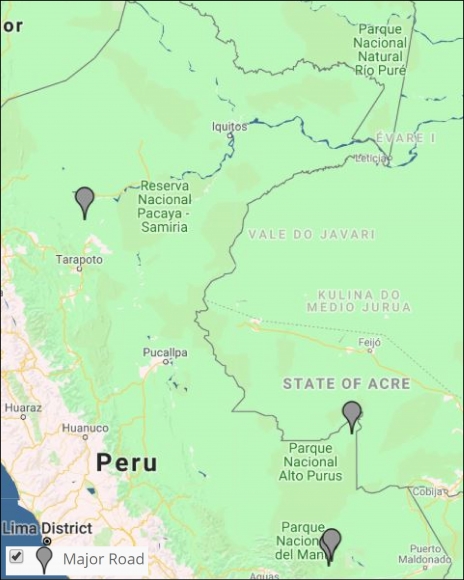
Image 8: Interactive map, roads. Data: MAAP.

It has been well-documented that roads are one of the most important drivers of deforestation in the Amazon, particularly due to the fact that they facilitate human access and activities related to agriculture, cattle ranching, mining, and logging.

Image 8 shows the results of the Interactive Map when applying the “Roads” filter.

Legend:
Road (gray)

We have analyzed two controversial proposed roads in Madre de Dios, Peru.

The Nuevo Edén – Boca Manu – Boca Colorado road would traverse the buffer zone of two protected areas: Amarakaeri Communal Reserve and Manu National Park (MAAP #29).

The other, the Puerto Esperanza-Iñapari road, would traverse the Purús National Park and threaten the territory of the indigenous peoples in voluntary isolation who live in this remote area (MAAP #76).
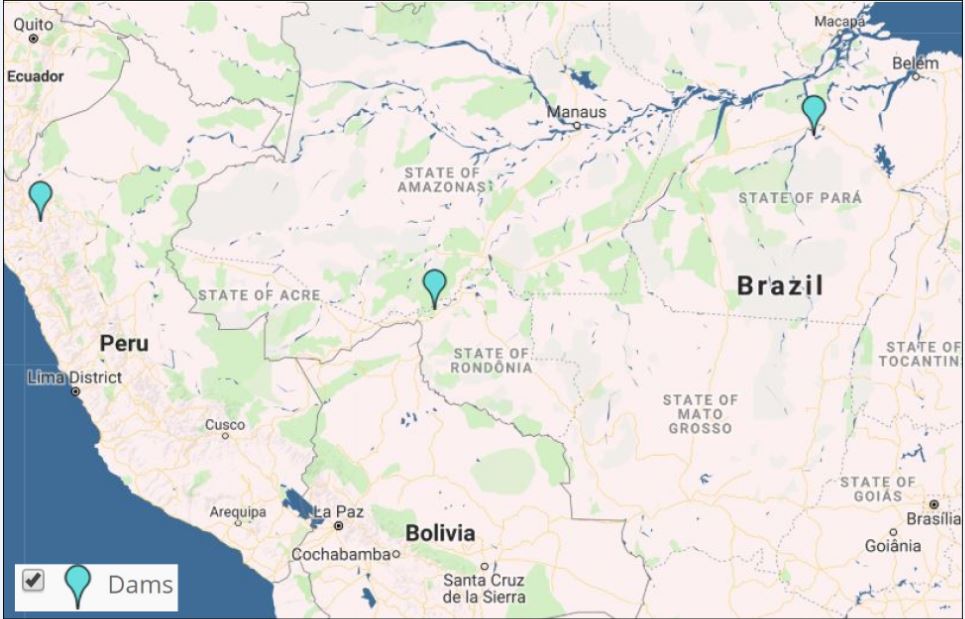


Hydroelectric dams

Image 9 shows the results of the Interactive Map when applying the “Dams” filter.

Legend:
Hydroelectric Dam (light blue)

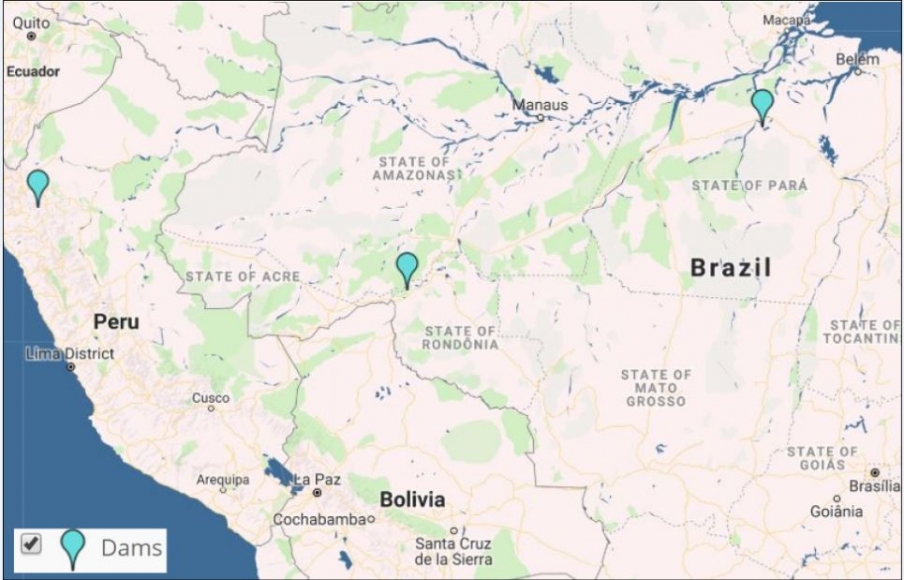
To date, we have analyzed three hydroelectric dams located in Brazil.  We have documented the loss of 36,100 hectares of forest associated with flooding produced by two dams (San Antonio and Jirau) on the Madeira River near the border with Bolivia (MAAP #34).  We also analyzed the controversial Belo Monte hydroelectrical complex located on the Xingú River, adn estimate that 19,880 hectares of land have been flooded. According to the imagery, this land is a combination of forested areas and agricultural areas (MAAP #66).

Additionally, we show a very high-resolution image of the exact location of the proposed Chadín-2 hydroelectric dam on the Marañón River in Peru (MAAP #80).

Hydrocarbon (oil and gas)

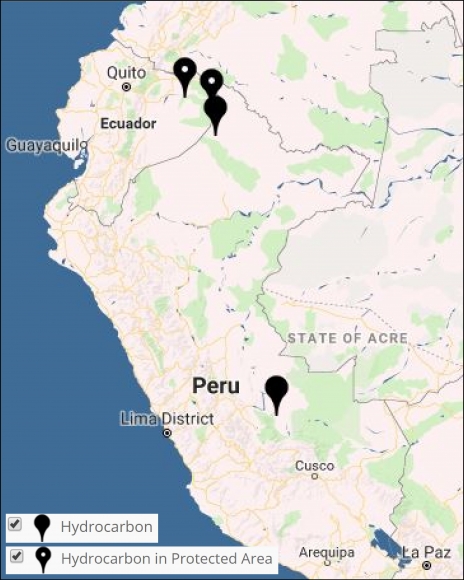
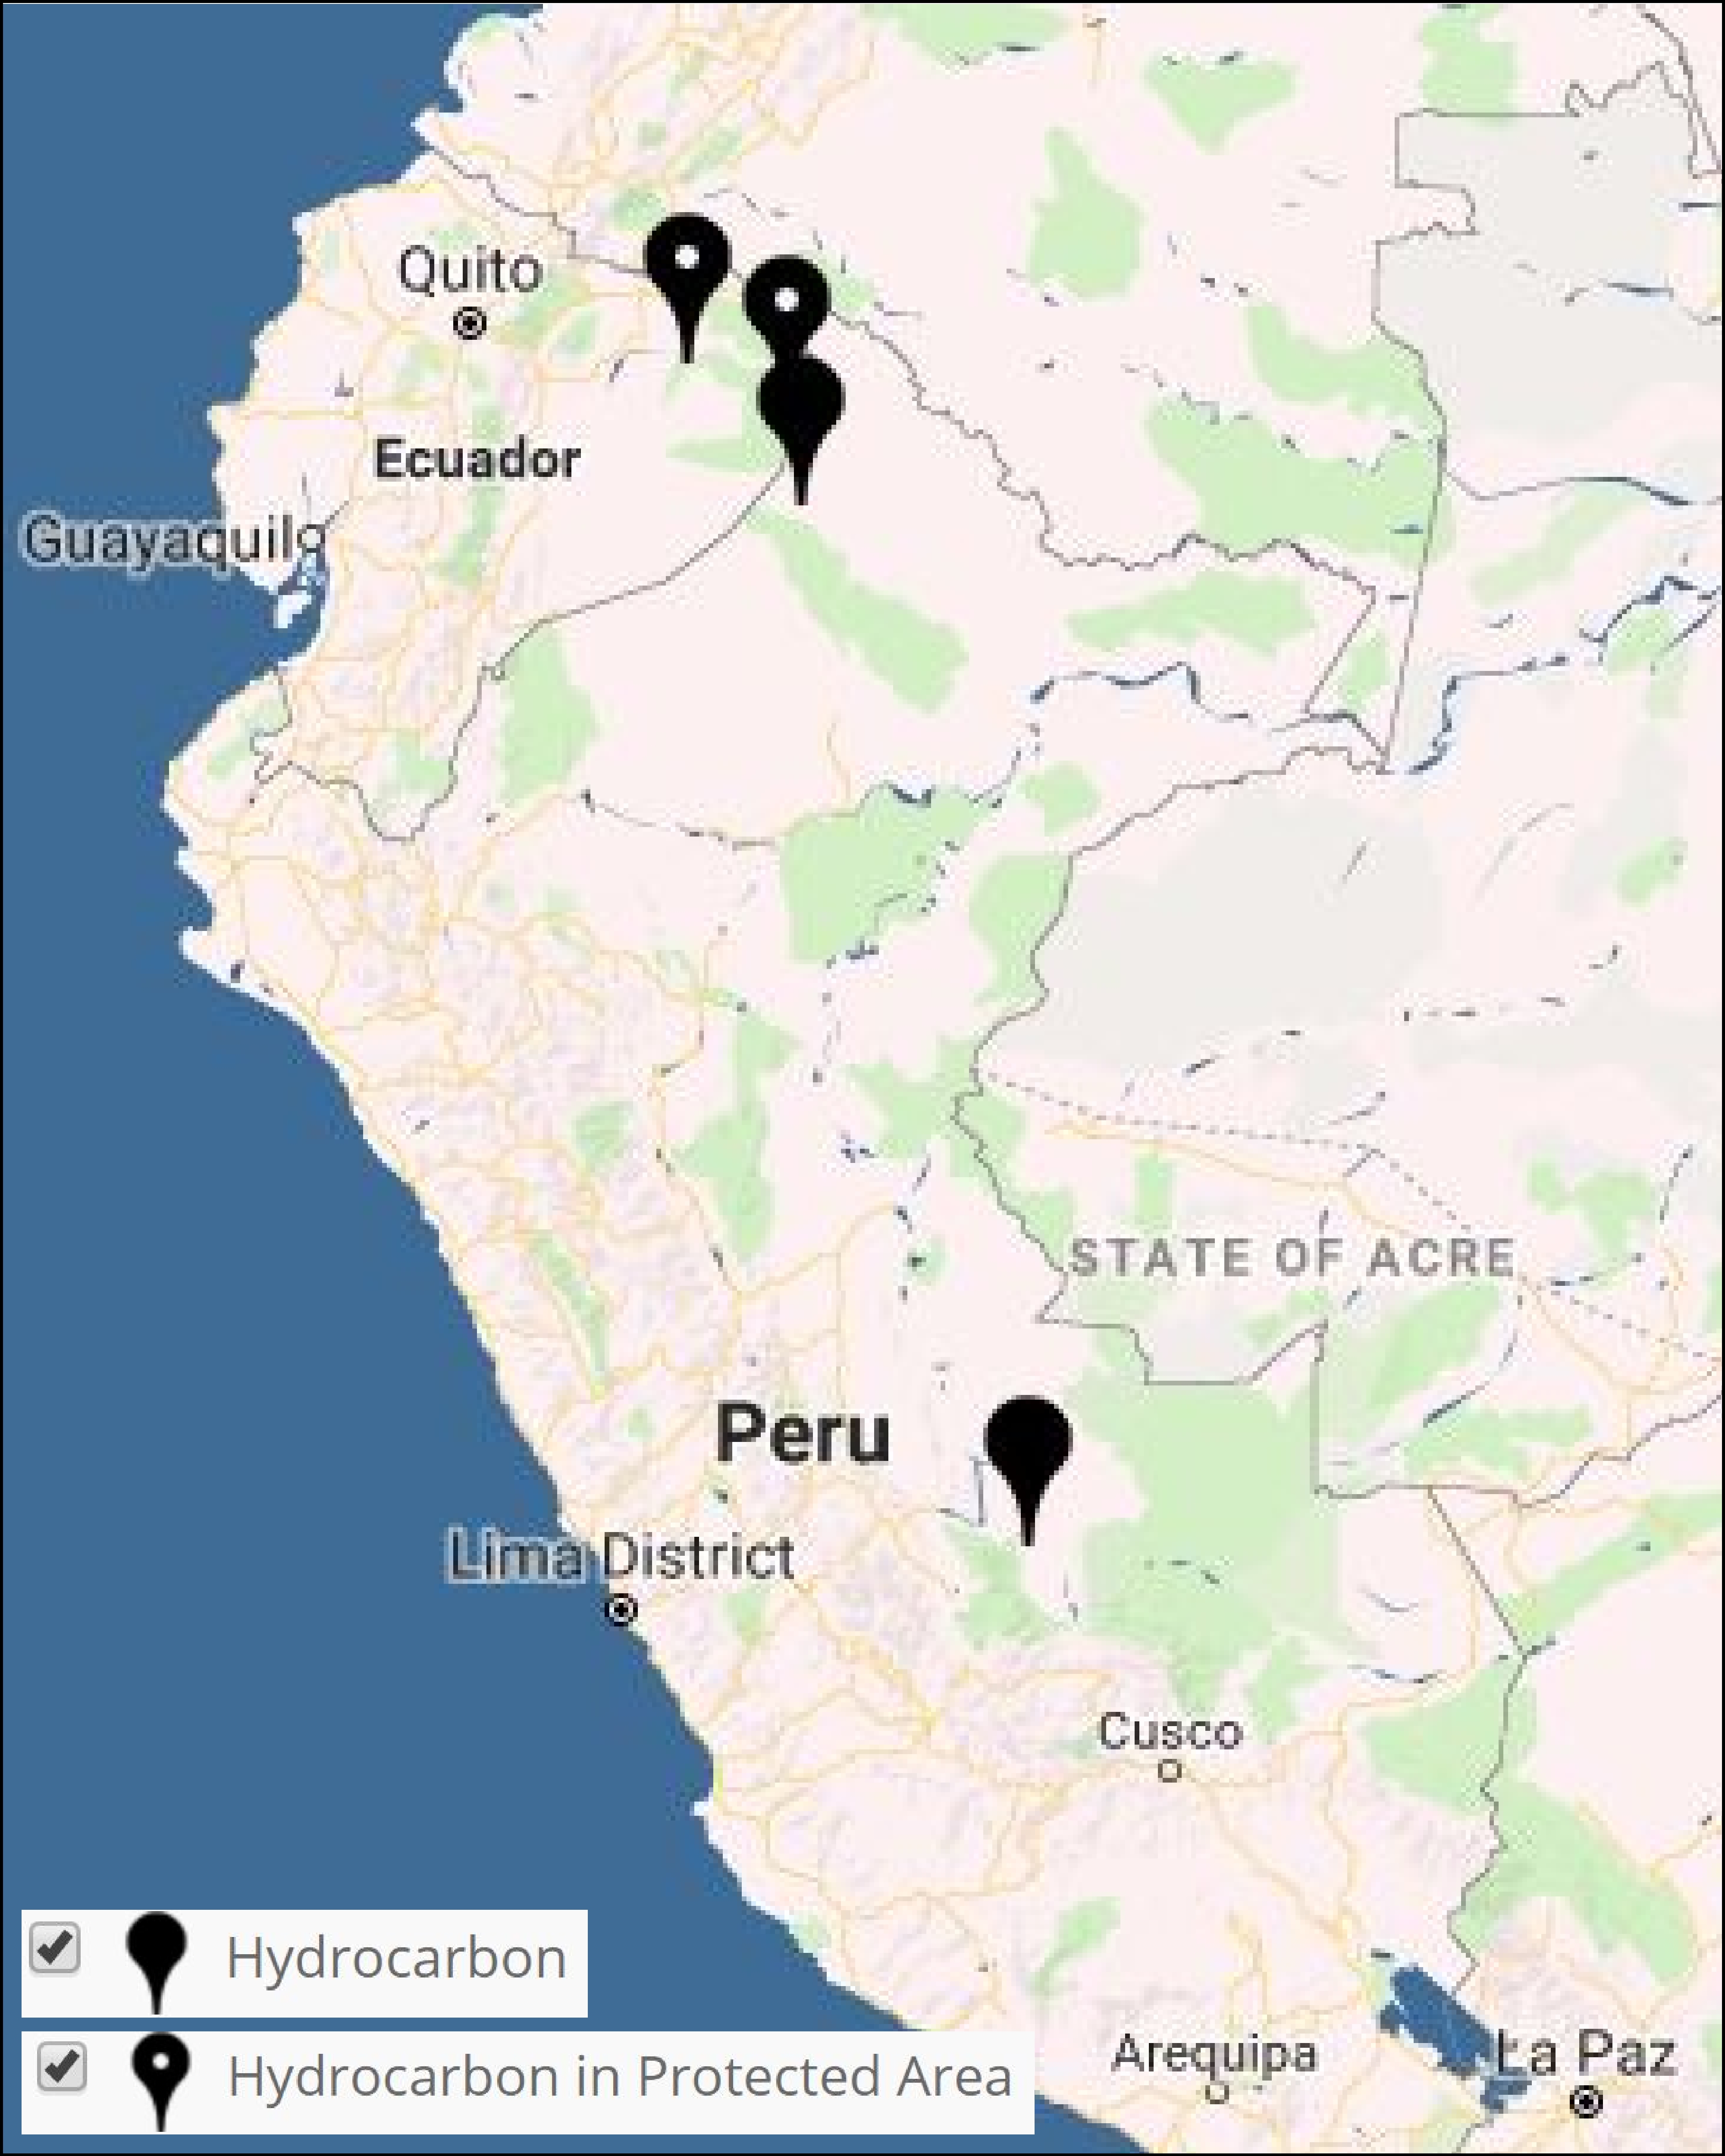
Image 10: Interactive map, hidrocarbon. Data: MAAP.

Image 10 shows the results of the Interactive Map when applying the “Hydrocarbon filter.

Legend:
Hydrocarbon (black)

Our first report on this sector focused on Yasuní National Park in the Ecuadorian Amazon.  We documented the direct and indirect deforestation amounts of 417 hectares (MAAP #82).

We also show the location of recent deforestation in two hydrocarbon block in Peru: Block 67 in the north and Blocks 57 in the south.


Climate Change

Tropical forests, especially the Amazon, sequester huge amounts of carbon, one of the main greenhouse gases driving climate change.

In MAAP #81, we estimated the loss of 59 million metric tons of carbon in the Peruian Amazon during the last five years (2013-17) due to forest loss, especially deforestation from mining and agricultural activities. This finding reveals that forest loss represents nearly half (47%) of Peru’s annual carbon emissions, including from burning fossil fuels.

In contrast, in MAAP #83 we show that protected areas and indigenous lands have safeguarded 3.17 billion metric tons of carbon, as of 2017. That is the equivalent to 2.5 years of carbon emissions from the United States.

The breakdown of results are:
1.85 billion tons safeguarded in the Peruvian national protected areas system;
1.15 billion tons safeguarded in titled native community lands; and
309.7 million tons safeguarded in Territorial Reserves for indigenous peoples in voluntary isolation.

Citation

Finer M, Mamani N (2018) Deforestation in the Andean Amazon (Trends, Hotspots, Drivers). MAAP Synthesis #3.

MAAP #95: Oil Palm Baseline for the Peruvian Amazon

High-resolution satellite image of oil palm plantation in Peruvian Amazon. Imagery: DigitalGlobe. Click to enlarge.

In previous reports, we have documented that oil palm is one of the deforestation drivers in the Peruvian Amazon (MAAP #41, #48). However, the full extent of this sector’s deforestation impact is not well known.

A newly published study assessed the deforestation impacts and risks posed by oil palm expansion in the Peruvian Amazon. Here, we review some of the key findings.

We first present a Base Map of oil palm in the Peruvian Amazon, highlighting the plantations that have caused recent deforestation. We then show two zooms of the most important oil palm areas, located in the central and northern Peruvian Amazon, respectively.

In summary, we document over 86,600 hectares (214,000 acres) of oil palm, of which we have confirmed the deforestation of at least  31,500 hectares for new plantations (equivalent to nearly 59,000 American football fields).

In other words, yes oil palm does cause Amazon deforestation, but not nearly as much as Asia.

Baseline Map. Oil palm in Peruvian Amazon. Data: MAAP, Vijay et al 2018, Planet

Base Map

A detailed analysis of high-resolution satellite imagery (DigitalGlobe and Planet) revealed that oil palm plantations now cover 86,623 hectares (214,050 acres) in the Peruvian Amazon (see Base Map).

In the Base Map, both yellow and red indicates the documented oil palm plantations, with red corresponding to those that caused deforestation.

The plantations are concentrated in the central and northern Peruvian Amazon (Ucayali, San Martin, Huánuco, and Loreto regions).

Deforestation

In the Base Map, as noted above, red indicates oil palm plantations that caused deforestation since 2000.

A satellite imagery time series analysis revealed that oil palm has directly led to the deforestation of at least 31,500 hectares (77,838 acres) since 2000.

This analysis is timely because the National Palm Oil Board of Peru (Junpalma) recently announced that “the producers have set their goal to reach 250,000 hectares of oil palm plantations by 2019, in order to cover the entire national market “(Source: Gestion).

For example, it is important to note that the Peruvian company Grupo Palmas several years ago proposed four new plantations that would cause the deforestation of 23,000 hectares of primary forest (see MAAP #64).

Clarification: It is important to note that, as indicated in MAAP #64 (case C), one of the most positive news stories in 2017 was that these 4 large-scale oil palm plantations were stopped before any deforestation event occurred. Grupo Palmas is now working towards a zero deforestation value chain and has a new sustainability policy, as indicated in that analysis.

Zoom Central Peruvian Amazon

Image 1 shows a zoom of the oil palm plantations in the central Peruvian Amazon. Most notable is the deforestation for two large-scale oil palm plantations near Pucallpa (MAAP #41). We have also described the growing oil palm deforestation in northern Huanuco (MAAP #48).

Image 1. Oil palm in central Peruvian Amazon. Data: MAAP, Vijay et al 2018, Planet

Zoom Northern Peruvian Amazon

Image 2 shows a zoom of the oil palm plantations in the northern Peruvian Amazon. Most notable is the deforestation for large-scale oil palm plantations along the Loreto-San Martin border (MAAP #16). More recently, we also described new large-scale oil palm deforestation in San Martin (MAAP #92).

Image 2. Oil palm in northern Peruvian Amazon. Data: MAAP, Vijay et al 2018, Planet

Methodology

Vijay et al (2018) identified oil palm plantations within areas deforested between 2000 and 2015 based on visual analysis of very high-resolution (≤ 0.5 m) Worldview-2 and Worldview-3 satellite imagery (from 2014-2016) obtained from DigitalGlobe (NextView). The total oil palm identified from this source is 84,500 hectares.

We also included data for 2016-18 (as of September 2018) based on analysis of high (Planet) and very high-resolution (DigitalGlobe) satellite imagery by the MAAP team. The total oil palm identified from this source is an additional 2,123 hectares.

For areas of interest (Shanusi, Tocache, North Ucayali, San Martin East, Plantations of Pucallpa), we developed a “time series” analysis of satellite images to determine if oil palm has directly caused the observed deforestation.

References

Vijay V et al (2018) Deforestation risks posed by oil palm expansion in the Peruvian Amazon. Environ. Res. Lett. 13 114010. Link: Link: http://iopscience.iop.org/article/10.1088/1748-9326/aae540/meta

Interactive map: https://sites.google.com/view/oilpalmperu

Citation

Finer M, Vijay V, Mamani N (2018) Oil Palm Baseline for the Peruvian Amazon. MAAP: 95.

MAAP #94: Detecting Logging in the Peruvian Amazon with High Resolution Imagery

Base Map. Logging Activities. Source: ACCA/ACA.

In MAAP # 85, we showed how medium and high-resolution satellites (such as Landsat, Planet and Sentinel-1) could be used to monitor the construction of logging roads in near-real time.

Here, we show the potential of very high-resolution satellites (such as DigitalGlobe and Planet’s Skysat), to identify the activities associated with logging, including illegal logging.

These activities include (see Base Map):
1. Selective logging of high-value trees,
2. Construction of logging roads (access roads),
3. Logging camps
4. Storage and transport

Next, we show a series of very high-resolution images (>50 centimeters), which allow clear identification of these activities.

Note that we show images of both possible legal logging in authorized areas (Images 1,2,5,6,7,9,10) and confirmed illegal logging in unauthorized areas (Images 3,4,8,11,12).*


1. Selective logging of high-value trees

The following images (1-4) show examples of selective logging. Importantly, note that Images 3 and 4 show examples of confirmed illegal logging.

Image 1: Selective logging in a forestry area (Ucayali). Data: DigitalGlobe
Image 2: Selective logging in a forestry area (Ucayali). Data: DigitalGlobe
Image 3: Confirmed illegal logging in unauthorized area. Data: DigitalGlobe
Image 4: Confirmed illegal logging in unauthorized area. Data: DigitalGlobe

2. Construction of logging roads

The following images (5-8) show examples of the construction of logging roads for access to logging areas and subsequent transport of the wood to collection areas. In Image 7, note that it is possible to identify down to the level of logging trucks. Image 8 shows an example of an illegal logging path in an unauthorized area.

Image 5. Logging road (Loreto). Data: DigitalGlobe
Image 6. Logging road (Ucayali). Data: DigitalGlobe
Image 7. Logging road and logging trucks. Data: Skysat (Planet)
Image 8. Illegal logging path. Data: DigitalGlobe

3. Logging camps

The following images (9-12) show examples of logging camps. Note that Images 11 and 12 show illegal camps in unauthorized areas.

Image 9. Logging camp in forestry area (Loreto). Data: DigitalGlobe.
Image 10. Logging camp in forestry area (Ucayali). Data: DigitalGlobe.
Image 11. Illegal logging camp in unauthorized area. Data: DigitalGlobe
Image 12. Illegal logging camp in unauthorized area. Data: DigitalGlobe

4. Storage and transport

The following images (13-15) show examples of large timber storage areas along major rivers, and the subsequent river transport by boat to the sawmills. In Figure 15, note that radar satellites (such as Sentinel-1) can relatively clearly identify timber transport ships.

Image 13. Timber storage area. Data: DigitalGlobe.
Image 14. Timber storage area. Data: DigitalGlobe.
Image 15. Detecting timber transport boats. Data: ESA (Sentinel-1B)

Annex

Before and after images. Here we show some of the images as above, but with an additional panel showing what the area looked like before the logging activity.

Image 1: Selective logging in a forestry area (Ucayali). Data: DigitalGlobe
Image 8. Illegal logging path. Data: DigitalGlobe
Image 10. Logging camp in forestry area (Ucayali). Data: DigitalGlobe.
Image 11. Illegal logging camp in unauthorized area. Data: DigitalGlobe

*Notes

We determined illegal logging by incorporating additional spatial information regarding forestry and conservation areas. Although very high resolution images allow the detection of activities related to selective logging, the determination of the legality of these activities often requires complementary and detailed information from the corresponding government entities.

Citation

Villa L, Finer M (2018) Detecting Logging in the Peruvian Amazon with High Resolution Imagery. MAAP: 94.

MAAP #93: Shrinking Primary Forests of the Peruvian Amazon

Base Map. Data: SERNANP, IBC, Hansen/UMD/Google/USGS/NASA, PNCB/MINAM, GLCF/UMD, ANA.

The primary forests of the Peruvian Amazon, the second largest stretch of the Amazon after Brazil, are steadily shrinking due to deforestation.

Here, we analyze both historic and current data to identify the patterns.

The good news: As the Base Map shows, the Peruvian Amazon is still home to extensive primary forest.* We estimate the current extent of Peruvian Amazon primary forest to be 67 million hectares (165 million acres), greater than the total area of France.

Importantly, we found that 48% of the current primary forests (32.2 million hectares) are located in officially recognized protected areas and indigenous territories (see Annex).**

The bad news: The Peruvian Amazon primary forests are steadily shrinking.

We estimate the original extent of primary forests to be 73.1 million hectares (180.6 million acres). Thus, there has been a historic loss of 6.1 million hectares (15 million acres), or 8% of the original. A third of the historic loss (2 million hectares) has occurred since 2001.

Below, we show three zooms (in GIF format) of the expanding deforestation, and shrinking primary forests, in the southern, central, and northern Peruvian Amazon.


GIF of deforestation in the southern Peruvian Amazon. Data: see Base Map

Southern Peruvian Amazon

Note these three important trends in the GIF (click to enlarge):

  • Increasing deforestation all along the route of the Interoceanic Highway;
  • Increasing gold mining deforestation across several different fronts near the southwestern section of the highway;
  • Increasing agricultural deforestation around Iberia, along the northern section of the highway near the border with Brazil.


GIF of deforestation in the central Peruvian Amazon. Data: see Base Map

Central Peruvian Amazon

Note these three important trends in the GIF (click to enlarge):

  • The substantial historic (pre 1990) deforestation around the cities Pucallpa and Tarapoto;
  • Increasing deforestation along the road leading west from Pucallpa;
  • Large-scale deforestation for oil palm plantations outside of Pucallpa and Yurimaguas.


Base Map plus protected areas and indigenous communities.

Northern Peruvian Amazon

Note these three important trends in the GIF (click to enlarge):

  • The historic (pre 1990) deforestation around Iquitos;
  • Increasing deforestation along the Iquitos-Nauta road;
  • Large-scale deforestation for United Cacao plantation near the town of Tamshiyacu.


Base Map plus protected areas and indigenous communities. Data: SERNANP, IBC, Hansen/UMD/Google/USGS/NASA, PNCB/MINAM, GLCF/UMD, RAISG, Ministerio de Cultura.

Annex

The Base Map with three additional categories: Protected Areas, titled Native Communities, and Indigenous Reserves.


Notes

*Defining primary forest: According to the Supreme Decree (No. 018-2015-MINAGRI) approving the Regulations for Forest Management under the framework of the new 2011 Forestry Act (No. 29763), the official definition of primary forest in Peru is: “Forest with original vegetation characterized by an abundance of mature trees with species of superior or dominant canopy, which has evolved naturally.” Using methods of remote sensing, our interpretation of that definition are areas that from the earliest available image are characterized by dense closed-canopy coverage and experienced no major clearing events.

It should be emphasized that our definition of primary forest does not mean that the area is pristine. These primary forests may have been degraded by selective logging and hunting.

**Historical Peruvian Amazon primary forests: 73,188,344 hectares. Current Peruvian Amazon primary forests: 67,043,378 hectares. Of this total, 27.6% are located in designated protected areas (18.5 million hectares), 18% in titled Native Communities (12 million hectares), and 4% in Indigenous Reserves/ Territories designated for indigenous peoples in voluntary isolation (2.9 million hectares). There is some overlap between these three categories, and the final combined percentage (48%) takes this into account.

Metodology

To generate the estimate of original (historical) expanse of primary forests in the Peruvian Amazon, we combined two satellite-based data sources. First, we used data from the Global Land Cover Facility (GLCF 2014), which established a forest cover baseline as of 1990 (The GLCF products are based on the Landsat Global Land Survey collection, which were compiled for years circa 1975, 1990, 2000 and 2005). Areas with no data due to shadows and clouds were filled in with GLCF data covering 2000-2005 time frame. The historical primary forest layer was created by combining the following three GLCF data layers: “Persistent Forest,” “Forest Gain,” and “Forest Loss.” Next, we incorporated the “Hydrography” data layer generated by the Peruvian Environment Ministry (Programa Nacional de Conservación de Bosques) to avoid including water bodies. We defined the limit of the analysis as the hydrographical basin of the Amazon. We generally define “historical Peruvian Amazon primary forest” as the expanse of primary forests before the European colonization of Peru (around 1750).

To generate the estimate of current primary forests, we subtracted areas determined to experience deforestation or forest loss from 1990 to 2017. For data covering 1990-2000, we incorporated two datasets: GLCF forest loss 1990-2000 and “No Forest as of 2000” (“No Bosque al 2000”) generated by the Peruvian Environment Ministry. For data covering 2001-2016, we used annual data generated by the Peruvian Environment Ministry. Finally, for 2017, we used early warning alert data generated by the Peruvian Environment Ministry. As a result, we define current primary forests as an area of historical forest with no observable (30 meter resolution) forest loss from 1990 to 2017.

Global Land Cover Facility (GLCF) and Goddard Space Flight Center (GSFC). 2014. GLCF Forest Cover Change 2000 2005, Global Land Cover Facility,University of Maryland, College Park.

Citation:

Finer M, Mamani N (2018) Shrinking Primary Forests of the Peruvian Amazon. MAAP: 93.