MAAP #76: Proposed Road would cross Primary Forest along Peru-Brazil Border

Image 76a. Base Map. Data: Mosaic of 16 images from Sentinel-2/ESA, July 2017

In December 2017, the Peruvian Congress approved a bill that declared it in the national interest to construct new roads in the border zone of Ucayali region, which shares a remote border with Brazil.

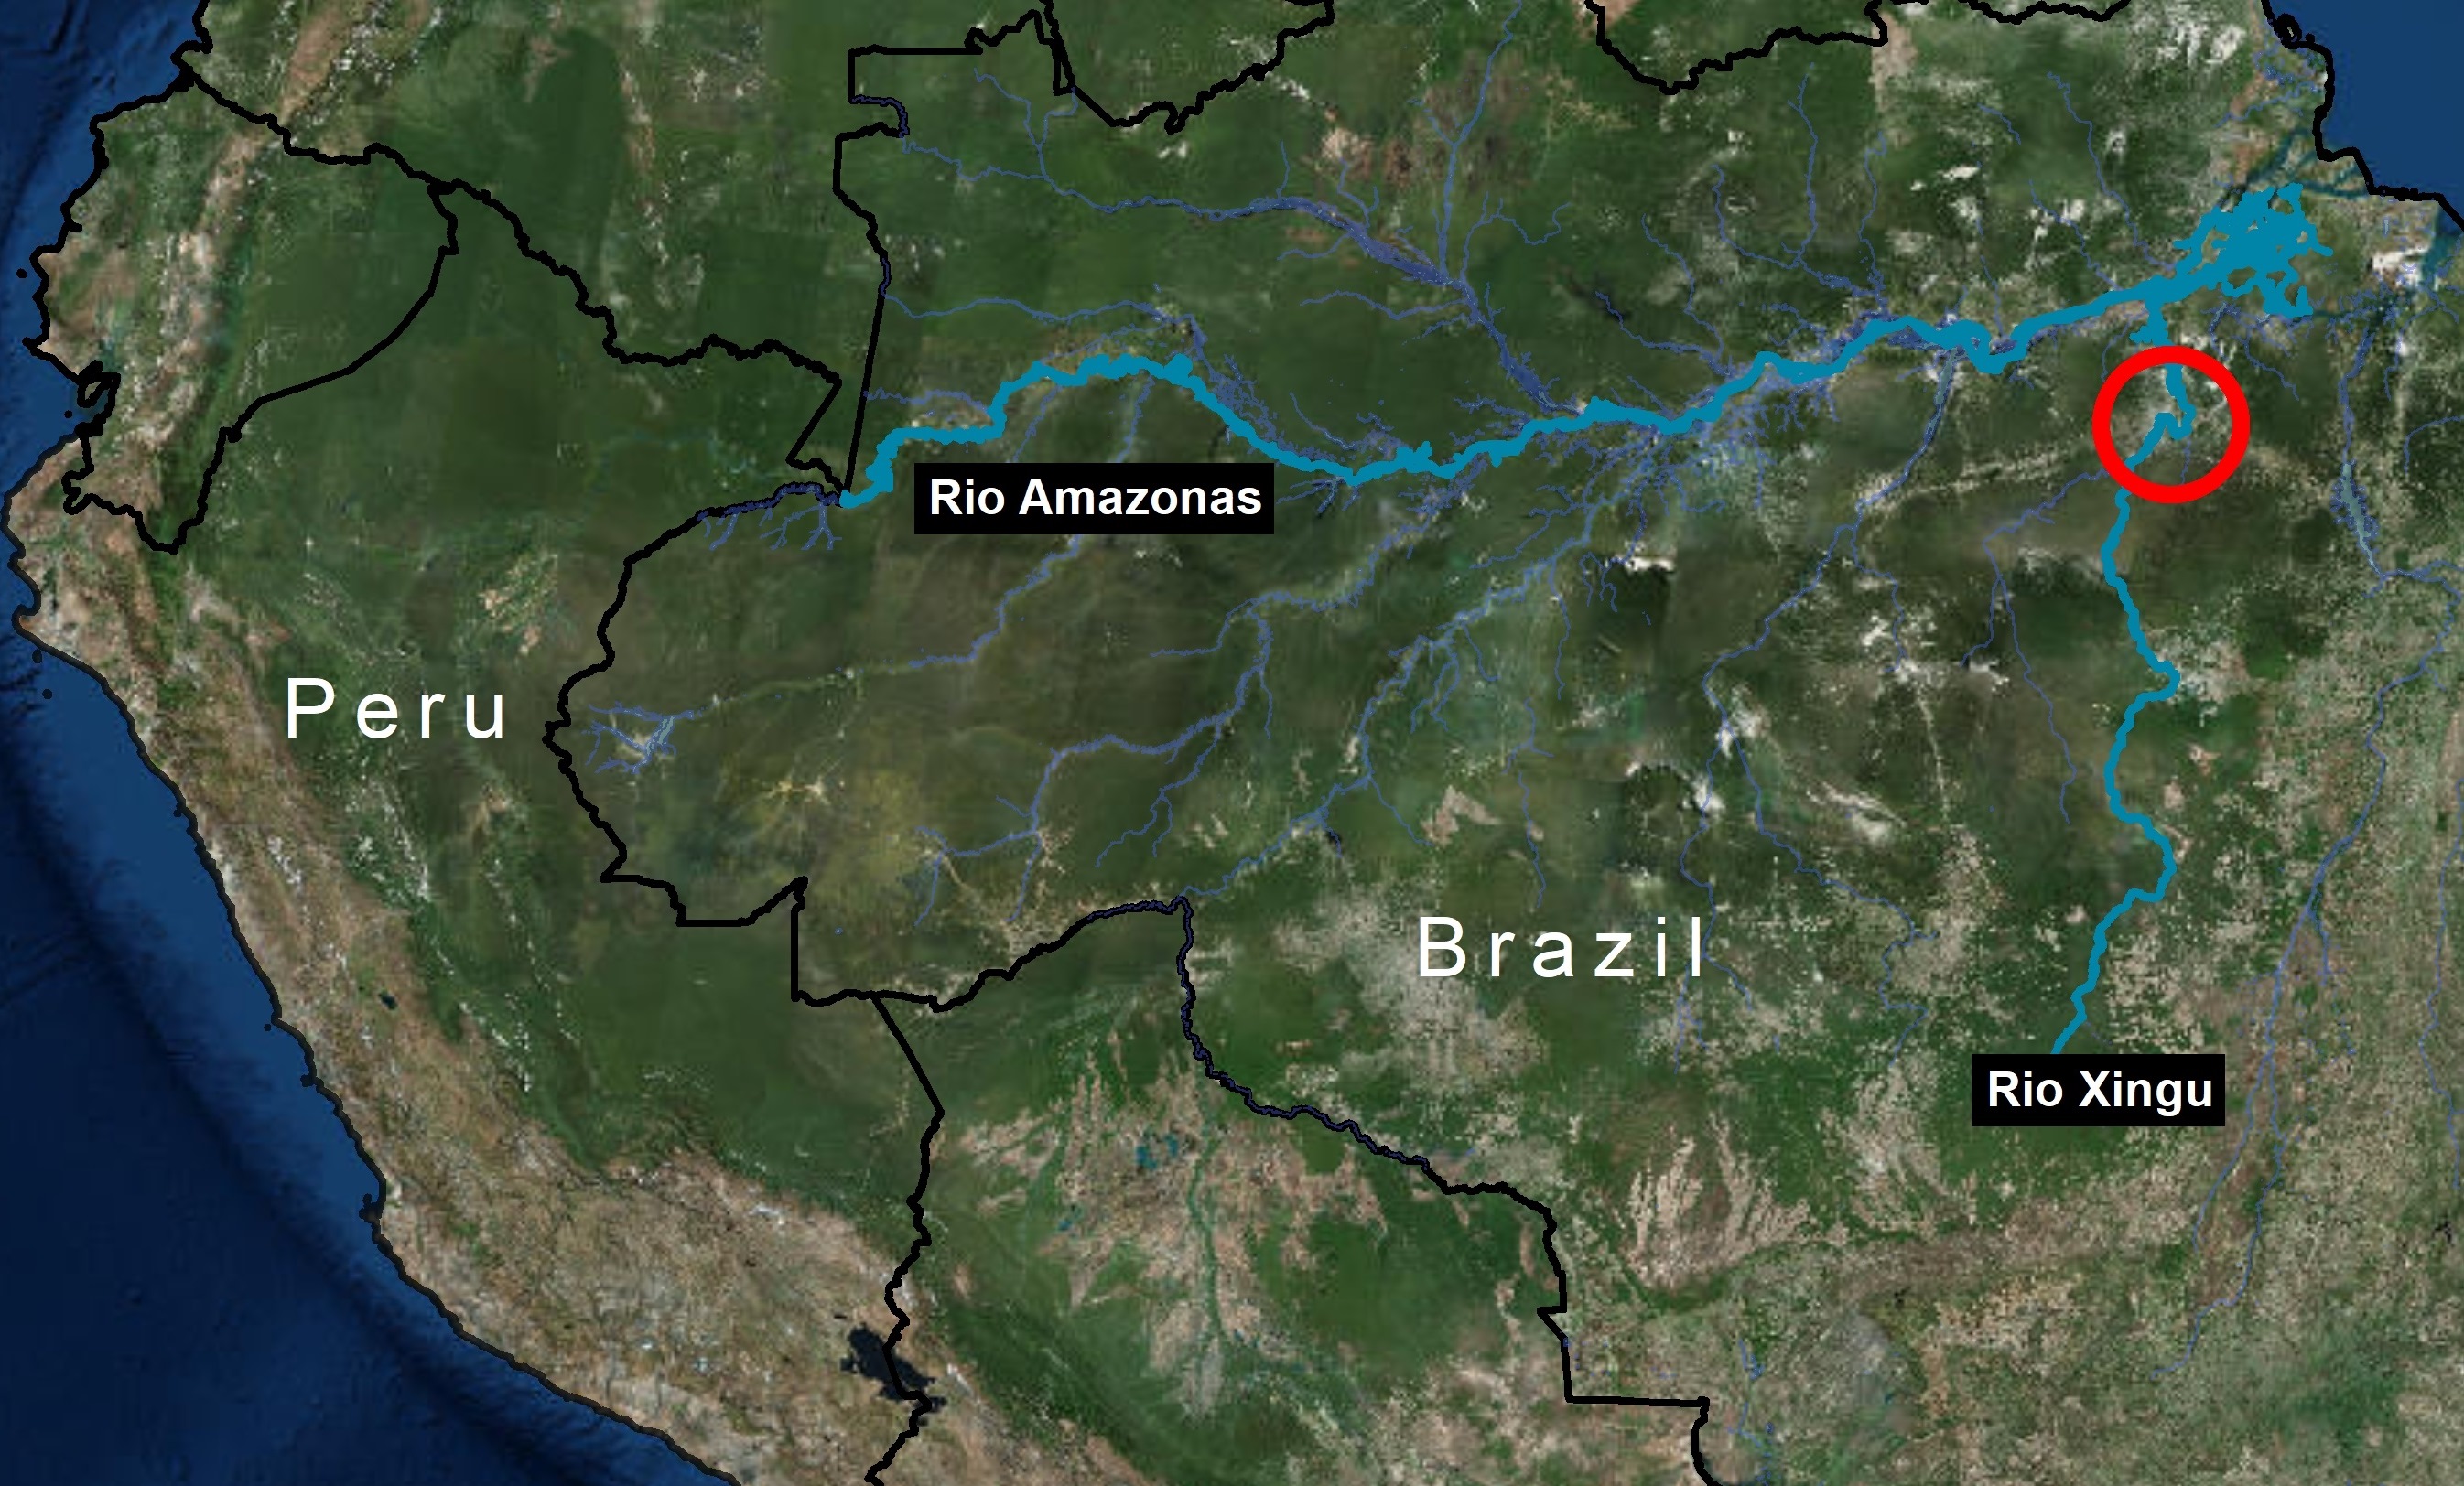
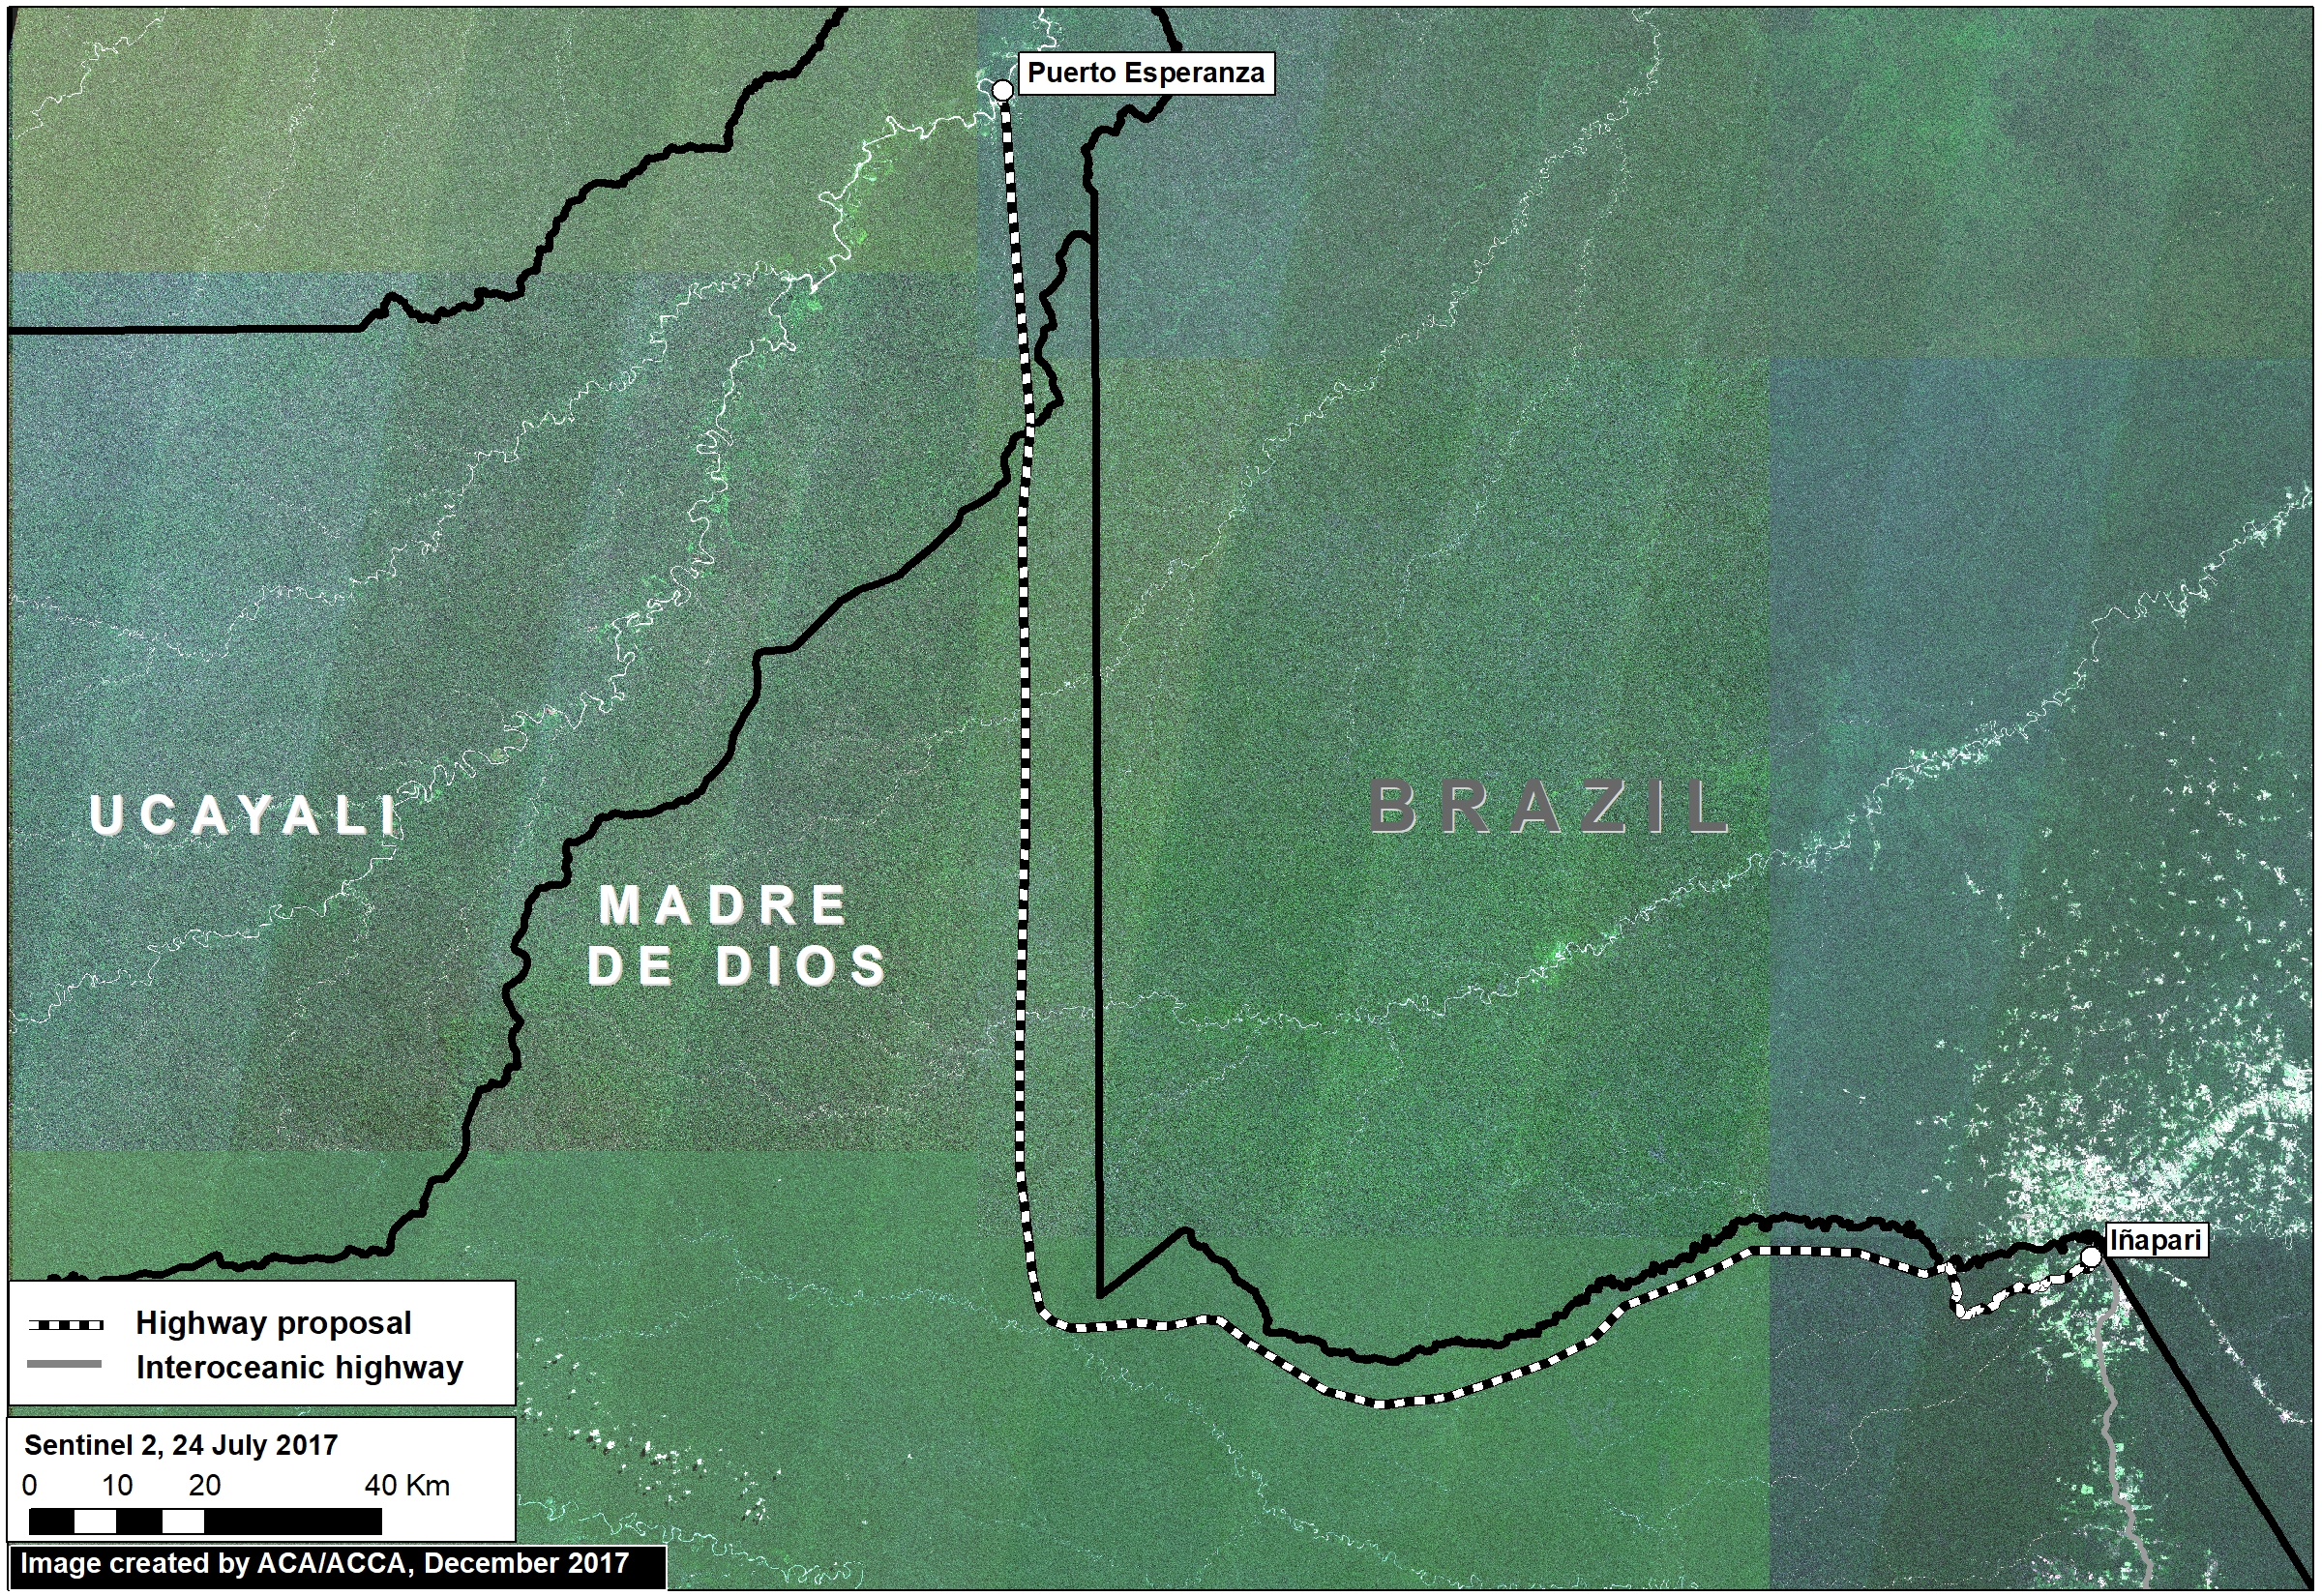
The main proposed road in this border area would cover 172 miles and connect the towns of Puerto Esperanza and Iñapari, in the Ucayali and Madre de Dios regions, respectively. Image 76a, a mosaic of satellite images from July 2017, illustrates just how remote and intact is the area surrounding the proposed road route.

Indigenous organizations and the Ministry of Culture have warned that the road would have major impacts on the indigenous peoples in voluntary isolation that are documented to inhabit parts of this remote area.

In this report, we add new information that complements the evaluation of possible impacts by calculating how much primary forest would be threatened as a result of road construction. We found that around 680,000 acres (275,00 hectares) of primary forest are at risk. Much of this area is within protected areas and a reserve for isolated indigenous groups.


Primary Forest

Image 76b. Data: GLCF/GSFC 2014, Hansen/UMD/Google/USGS/NASA, UMD/GLAD, PNCB/MINAM, UAC/ProPurús, SERNANP

We generated a primary forest layer based on existing satellite-based forest cover and forest loss data (see Methodology section for more details). We define primary forest as areas with intact forest cover dating back to the earliest available satellite-based data, 1990 in this case.

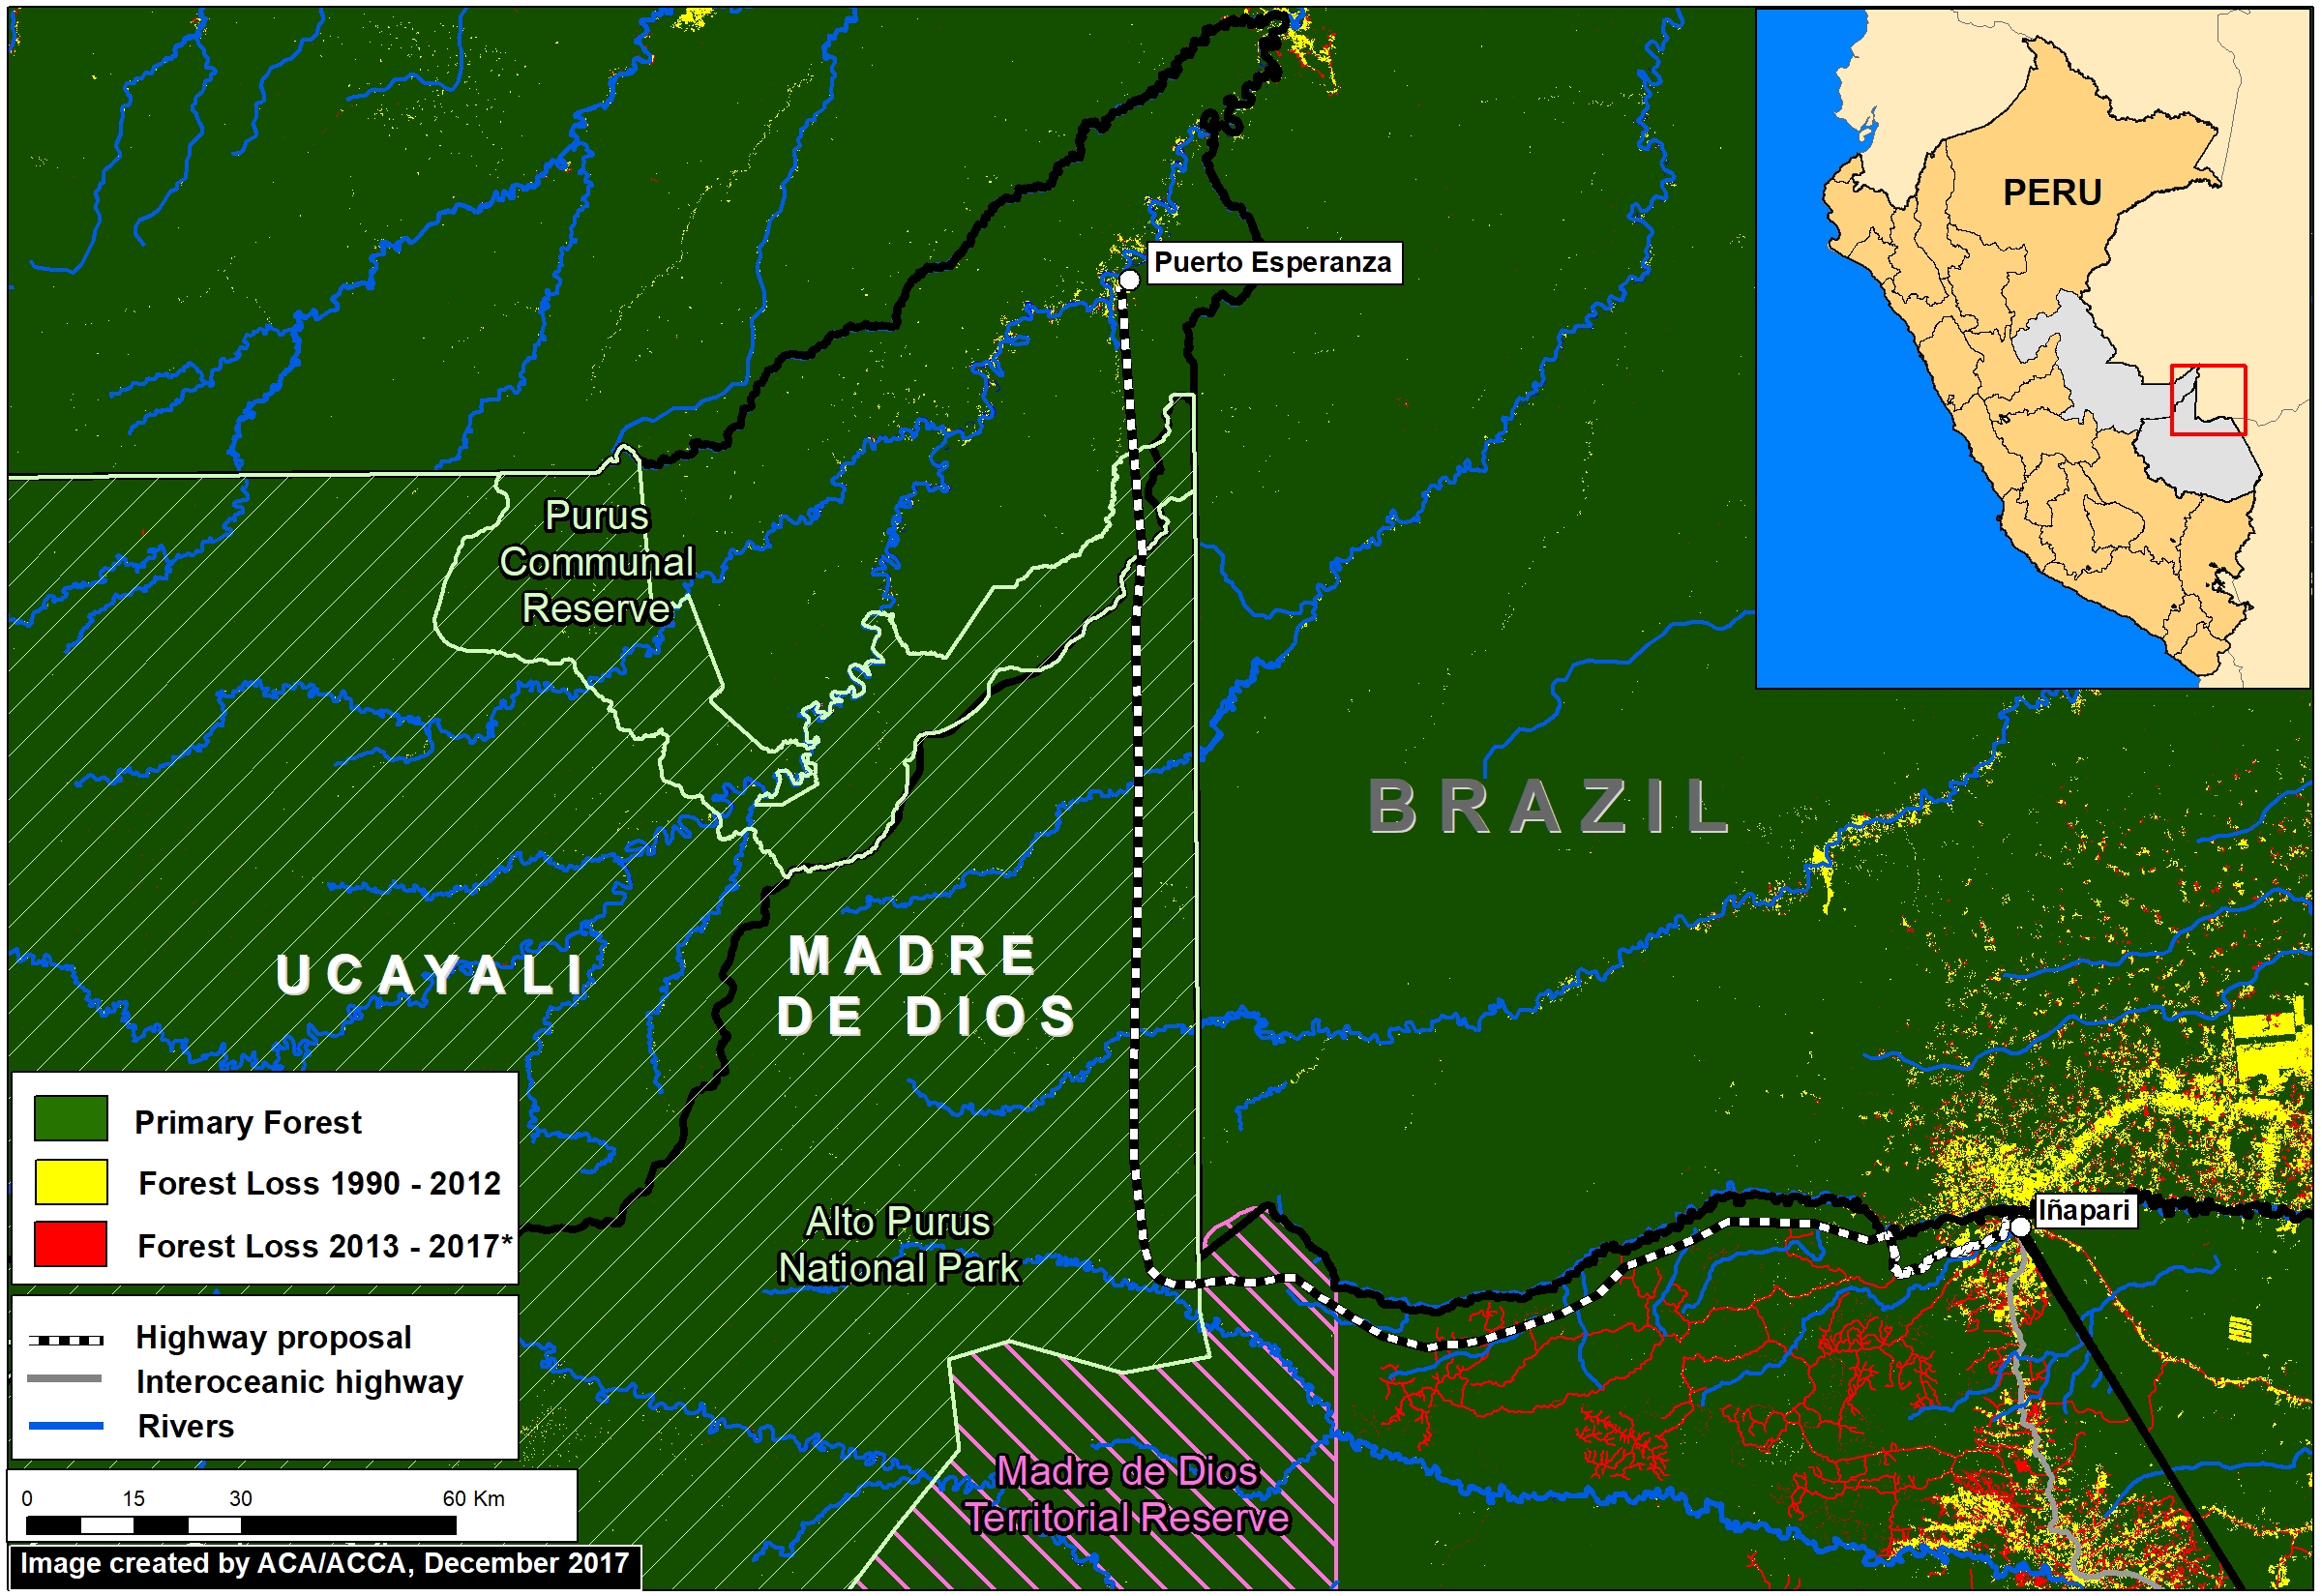
Image 76b shows the major results:

  • Virtually the entire route (172 miles; 277 km) crosses primary forest (dark green). Note the proliferation of forest roads in recent years around Iñapari (red lines).
  • The road would cross 3 critical protected areas and indigenous reserves: Madre de Dios Territorial Reserve, Alto Purús National Park, and Purús Communal Reserve.


Primary Forest at Risk

Imagen 76c. GLCF/GSFC 2014, Hansen/UMD/Google/USGS/NASA, UMD/GLAD, PNCB/MINAM, UAC/ProPurús

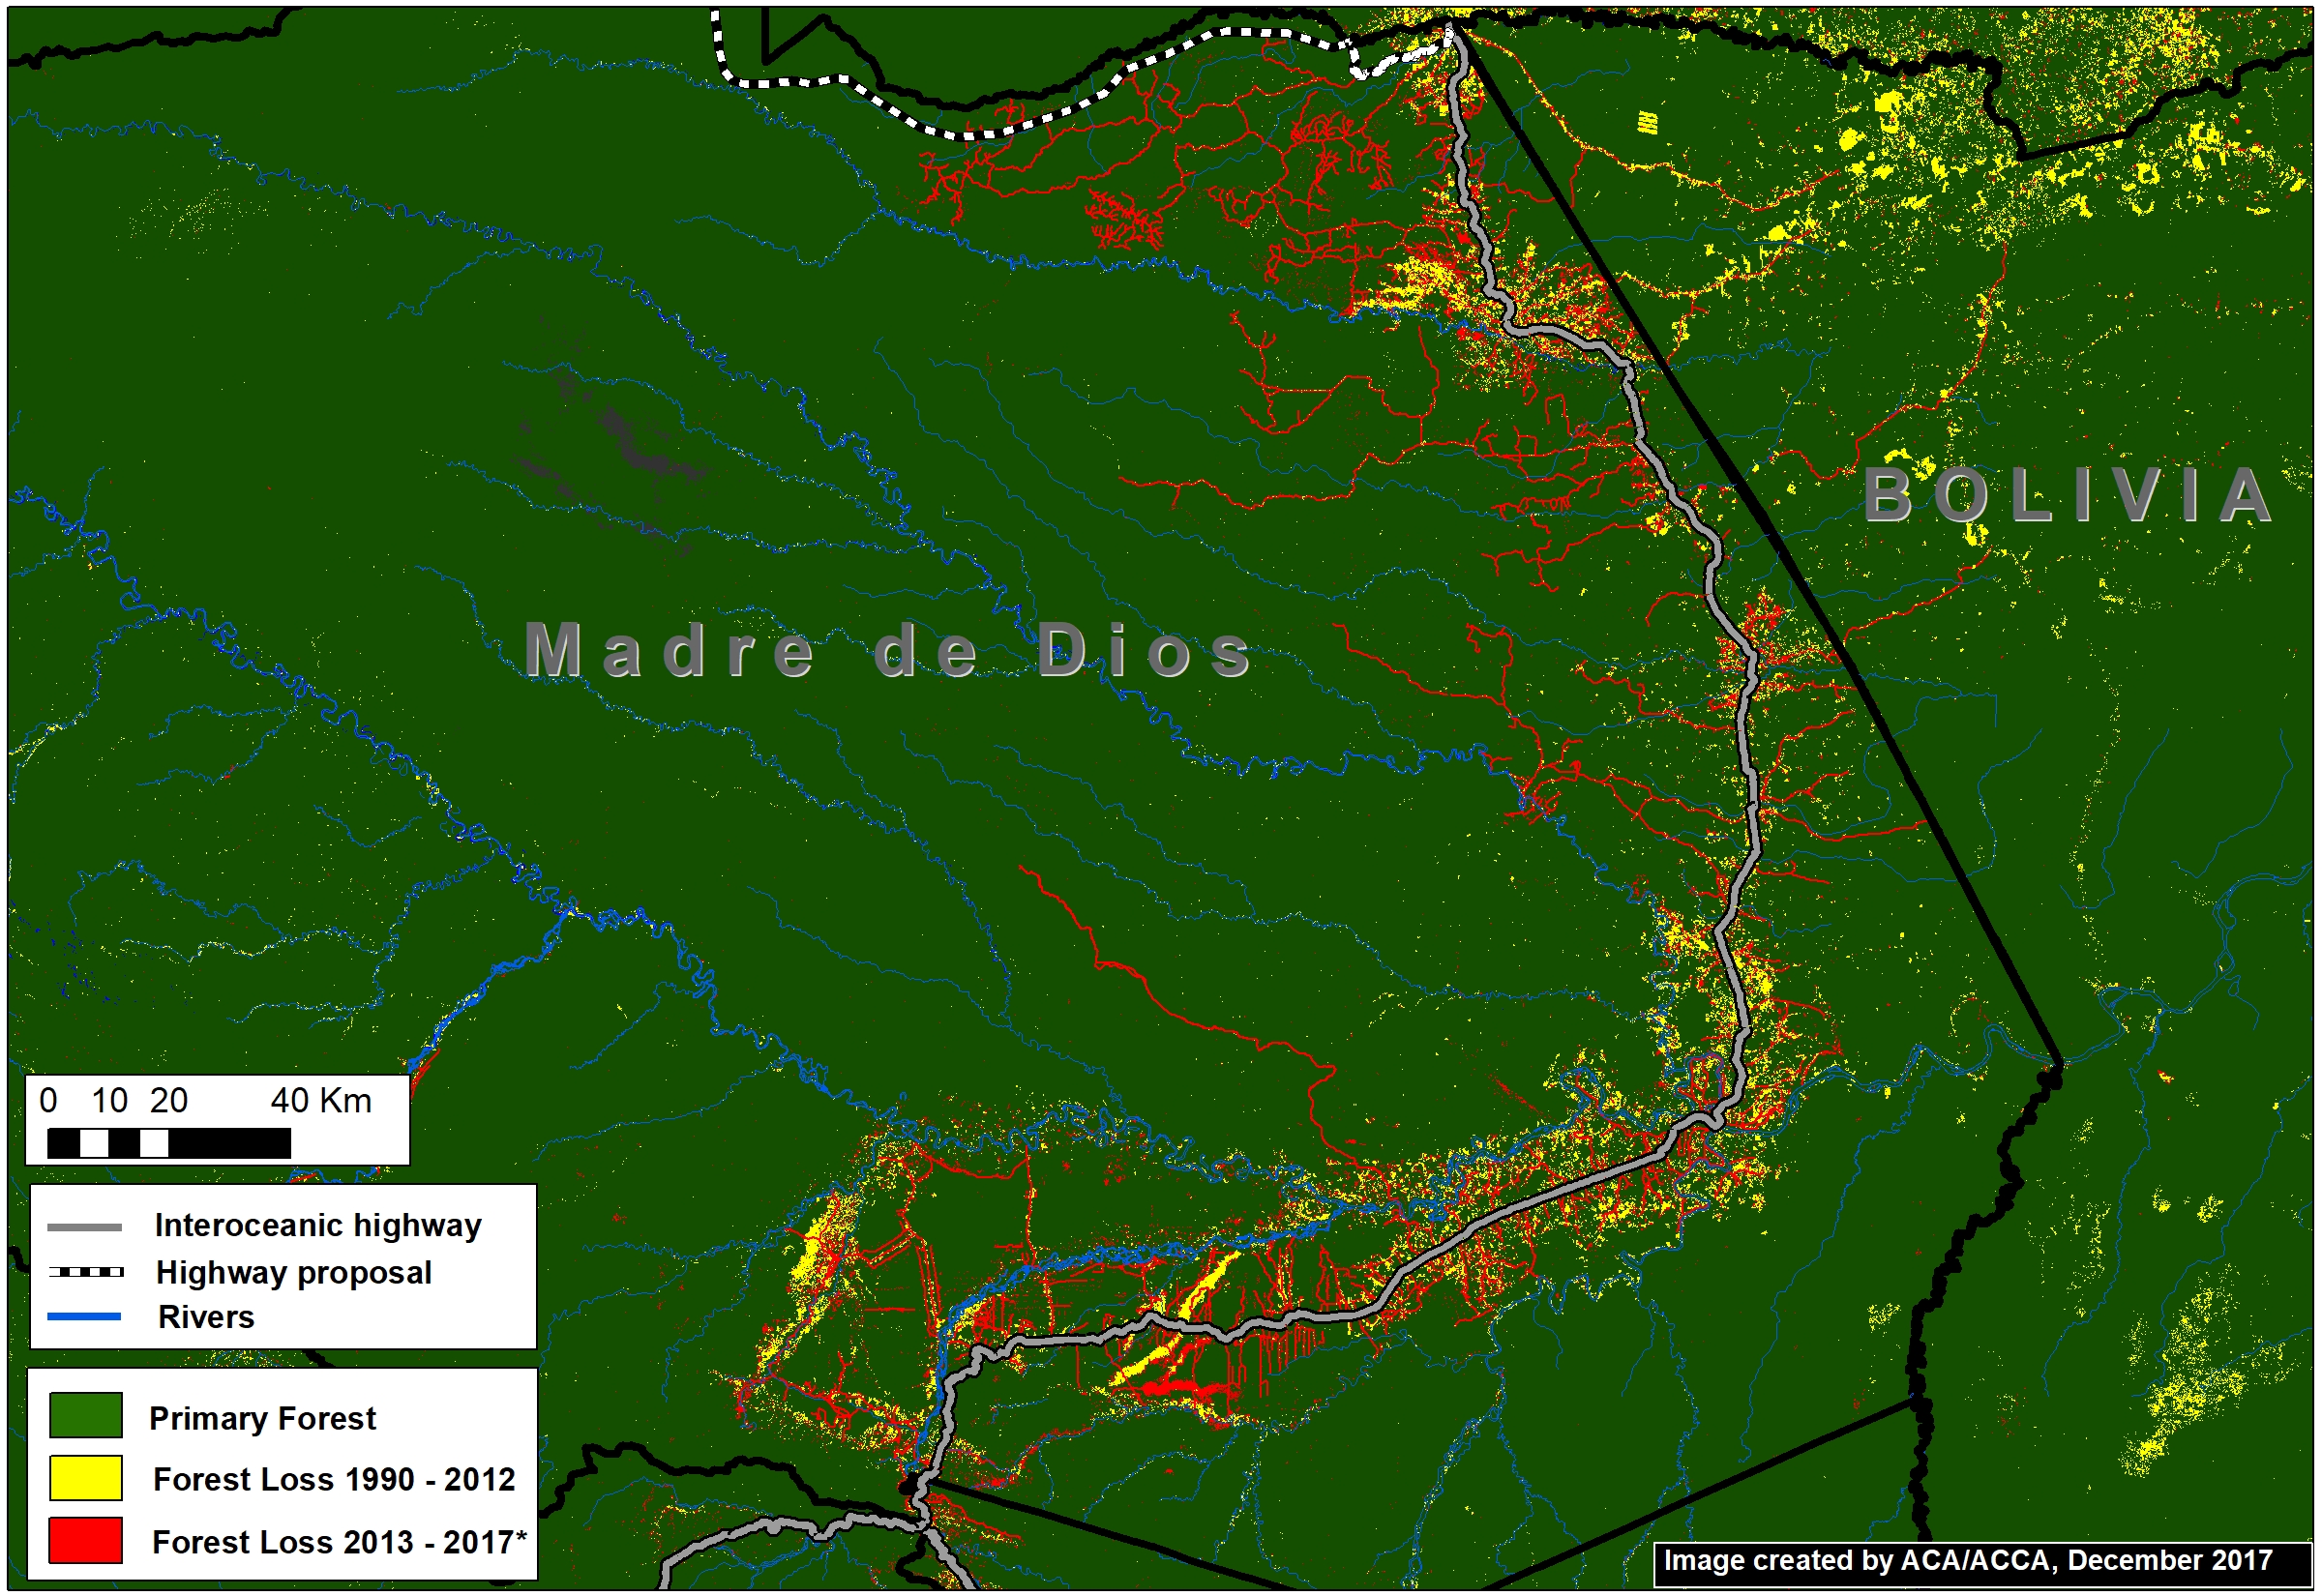
The Interoceanic Highway, the main existing road in the area, has experienced substantial deforestation within 5 km* along the length of its route (Image 76c).

Using this estimate of impact range (10 km), we calculated that at least 274,727 hectares of primary forest would be at risk if this road is constructed.

*We estimate that approximately 80% of forest loss has occurred in a 5 km radius on both sides of the Interoceanic highway.


Methodology

To generate our primary forest layer, we combined three satellite-based data sources. As baseline, we used data from the Global Land Cover Facility (2014), which identifies forest cover as of 1990. We also used this dataset to remove areas with detected forest cover change between 1990 and 2000. Next, we removed areas with detected forest loss between 2001 – 2017 identified by Hansen/UMD/Google/USGS/NASA (Hansen et al 2013) and early warning data from GLAD alerts and the National Program of Forest Conservation of the Peruvian Environment Ministry (PNBC-MINAM). As a result, combining all datasets, this methodology defines primary forest as area with intact forest from the first available satellite-based data, 1990, until 2017.

Global Land Cover Facility (GLCF) and Goddard Space Flight Center (GSFC). 2014. GLCF Forest Cover Change 2000, 2005, Global Land Cover Facility,University of Maryland, College Park.

Hansen MC et al. 2013. High-Resolution Global Maps of 21st-Century Forest Cover Change. Science 342: 850–53.

Citation

Finer M, Novoa S (2018) Proposed Road would cross Primary Forest along Peru-Brazil Border. MAAP: 76.

MAAP Interactive: Deforestation Drivers in the Andean Amazon

Since its launch in April 2015, MAAP has published over 70 reports related to deforestation (and natural forest loss) in the Andean Amazon. We have thus far focused on Peru, with several reports in Colombia and Brazil as well.

These reports are meant to be case studies of the most important and urgent deforestation events. We often use forest loss alerts (known as GLAD) to guide us, and satellite imagery (from Planet and DigitalGlobe) to identify the deforestation driver.

Here we present an interactive map highlighting the drivers identified in all published MAAP reports. These drivers include gold mining, agriculture (e.g. oil palm and cacao), cattle pasture, roads, and dams (see icon legend below map). We also include natural causes such as floods and blowdowns (fire included under agriculture since most human caused). Furthermore, we highlight deforestation events within protected areas. Note that you can filter by driver by checking boxes of interest.

We hope the result is one of the most detailed and up-todate resources on patterns and drivers of deforestation in the Andean Amazon. Over the coming year we will continue to focus on Peru and Colombia, and begin to include Ecuador and Bolivia as well.

To view the interactive map, please visit:

MAAP Interactive: Deforestation Drivers in the Andean Amazon
https://www.maapprogram.org/interactive/

For more information on patterns and drivers of deforestation in the Peruvian Amazon, see our latest Synthesis report 

MAAP #66: Satellite Images of Belo Monte Dam Project (Brazil)

Image 66a. Red circle indicates dam project area.

The Belo Monte hydroelectric dam complex, located on the Xingu River in the state of Para in the eastern Brazilian Amazon (see Image 66a), has been controversial since its inception over 15 years ago, due to both environmental and social concerns related to building and operating one of the largest dams in the world in a sensitive environment.

The dam has recently become operational, providing an opportunity to evaluate initial impacts.

The objective of this article is to present satellite imagery, including a time series from 2011 to 2017, that provides insight into major ecological impacts of the hydroelectric dam project.


Despite legal challenges and strong opposition from impacted indigenous groups, construction of Belo Monte began in 2011 and the first turbines became operational in early 2017. Image 66b shows a direct comparison of before (left panel, July 2011) and after (right panel, July 2017) dam construction.

Image 66b. NASA/USGS

The dam is in fact a complex: the main dam (red circle) on the Xingu River creates a main reservoir (blue circle); a canal diverts much (up to 80%) of the river’s flow from the main reservoir to the canal reservoir (yellow circle), which feeds the turbines generating the electricity. As a result, downstream of the main dam is left with a much reduced flow (20%) for a stretch of 100 km. This reduced flow stretch, known as the Xingu River’s “Big Bend,” is home to two indigenous peoples (Arara and Juruna). The reference points in the images show these four areas of the complex across time, including before construction.

Satellite Image Time Series

Image 66c. Data: NASA/USGS

Image 66c is a GIF showing a satellite (Landsat) imagery time series of the project impact area from July 2011 through May 2017. July 2011 serves as the pre-project baseline before the start of construction. By July 2015, construction of the main dam and canal is well under way. By January 2016, the main dam has closed, forming both the main and canal reservoirs. August 2016 provides a nearly cloudless view of the dam complex, including how dry the downstream section becomes. July 2017 represents the most recent cloud-free Landsat image.

In the most recent images, note the negative impact on local fisheries: flooding of river islands, rock outcrops, and seasonally flooded forests in the Main Reservoir that were important fish habitat; and reduced water flow along the “Big Bend” below the Main Dam, also important fish habitat.

Flooding Estimate

Based on an analysis of the Landsat images, we estimate the flooding of 48,960 acres (19,880 hectares) of land that, according to the imagery, appeared to be a mix of forest and agriculture (Image 66d). In other words, some of the flooded area was previously degraded.

Image 66d. Data: NASA/USGS, MAAP

Damming of the Xingu River

Image 66e shows, in high resolution (50 cm), the drastic change at the dam site between July 2010 (left panel) and June 2017 (right panel). The July 2010 image, which serves as the pre-construction baseline, shows the free-flowing Xingu River, whereas the June 2017 image shows the impact of the main dam and main reservoir. Image 66f is a GIF showing, in striking detail, the construction of the main dam and formation of the main reservoir between 2010 and 2017.

Image 66e. Data: DigitalGlobe (via ACT), Airbus (via Apollo Mapping)
Image 66f. Data: DigitalGlobe (Nextview), DigitalGlobe (via ACT), Airbus (via Apollo Mapping)

We thank International Rivers and Amazon Watch for reviewing earlier drafts of this article and providing crucial comments.

Finer M, Olexy T, Scott A (2017) Satellite Images of Controversial Belo Monte Dam Project. MAAP: 66.

MAAP #34: New Dams on the Madeira River in Brazil Cause Forest Flooding

The Amazon lowlands have been connected to the Andes Mountains for millions of years by only six major rivers: the Caqueta, Madeira, Maranon, Napo, Putumayo, and Ucayali* (see Image 34a). This intimate connection allows rich Andean nutrients to fuel the Amazon floodplain and enables long-distance catfish migration between feeding grounds in the lowlands and spawning grounds in the highlands.

Image 34a. Data: Esri, DigitalGlobe, GeoEye, Earthstar Geographics, CNES/Airbus DS, USDA, AEX, Getmapping, Aerogrid, IGN, IGP, swisstopo

However, one of these six major Andean tributaries has recently been dammed on its main channel: the Madeira River in western Brazil (See Inset A). The Santo Antônio dam was completed in 2011, followed by the upstream Jirau dam in 2013.

Note in Image 34a that these dams are are located downstream of the Madre de Dios River in southern Peru. Thus, major ecological impacts — such as blocking the route of migratory catfish**— are also very relevant to Peru.

Here in MAAP #34, we describe the forest loss—over 36,100 hectares—associated with the flooding caused by these two dams (with a focus on the Jirau dam).

Zoom A: Forest Loss due to Flooding

Image 34b shows the forest loss due to flooding immediately upstream of the Jirau dam. As of 2015, the total flooded area for both dams is 36,139 hectares (89,301 acres). Major flooding was first detected in 2010, rose substantially in 2011-12, and peaked in 2014.

According to Fearnside 2014, although much of the forest along the Madeira is seasonally flooded, it dies when permanently flooded.*** Therefore, the flooded area is an appropriate measure of forest loss.

Further below, we show a series of satellite images of the areas indicated by Inset B (see Images 34c-e) and Inset C (see Image 34f).

Image 34b. Flooding-related forest loss along the Upper Madeira River. Data: USGS, CLASlite, Hansen/UMD/Google/USGS/NASA.

Zoom B: Flooding Immediately Upstream Jirau Dam

Image 34c shows the flooding immediately upstream of the Jirau dam between 2011 (left panel) and 2015 (right panel). The red dot is a point of reference that indicates the same place in both images. Below, we show high-resolution images of the areas indicated by Insets B1 and B2.

zoomB_rnd2
Image 34c shows the flooding immediately upstream of the Jirau dam between 2011(left panel) and 2015 (right panel).

Zooms B1 and B2: Jirau Dam and Flooding

Image 34d shows a high-resolution view of the Jirau dam in July 2015. Image 34e shows a high-resolution view of a portion of the flooded area immediately upstream of the Jirau dam in August 2015. The red dot is a point of reference that indicates the same place in both panels.

b1_rnd2
Image 34d. High-resolution view of the Jirau dam. Data: WorldView-2 from Digital Globe (NextView).
zoomb2_rnd2
Image 34e: High-resolution view of flooded area immediately upstream of the Jirau dam. Data: WorldView-2 from Digital Globe (NextView).

Zoom C: Flooding Further Upstream of Jirau Dam

Image 34f shows the flooding further upstream of the Jirau dam between 2011 (left panel) and 2015 (right panel). The red dot is a point of reference that indicates the same point in both images.

zoomC_rnd2
Image 34f. Forest flooding further upstream of the Jirau dam between 2011 (left panel) and 2015 (right panel). Data: USGS

References

*Finer M, Jenkins CN (2012) Proliferation of Hydroelectric Dams in the Andean Amazon and Implications for Andes-Amazon Connectivity. PLOS ONE: 7(4): e35126. Link: http://journals.plos.org/plosone/article?id=10.1371/journal.pone.0035126

**Duponchelle F et al (2016) Trans-Amazonian natal homing in giant catfish. J. Appl. Ecol. http://doi.org/bd45

***Fearnside PM (2014) Impacts of Brazil’s Madeira River dams: Unlearned lessons for hydroelectric development in Amazonia. Environmental Science & Policy 38: 164-172.

Citation

Finer M, Olexy T (2015) New Dams on the Madeira River (Brazil) Cause Forest Flooding. MAAP: 34.