Country: Brazil
MAAP #242 Illegal gold mining in Yanomami Indigenous Territory (northern Brazilian Amazon)
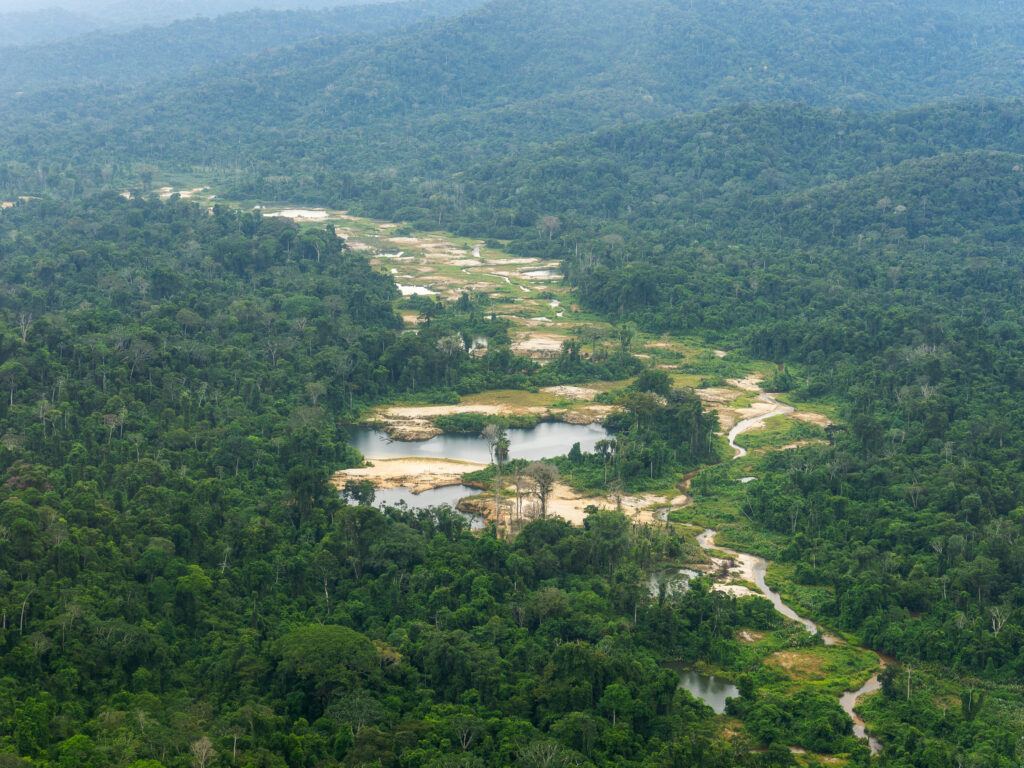
Photo 1. Gold mining in Yanomami Indigenous Territory. Photo credit: Lucas Silva/Platô/ISA
Yanomami Indigenous Territory, located in the northern Brazilian Amazon (along the border with Venezuela), is one of the territories most impacted by gold mining in the Amazon (MAAP #226).
This report details the results of geospatial monitoring of illegal gold mining activity in Yanomami Indigenous Territory, based on data collected up to December 2025. This territory is located in the northern Brazilian Amazon, along the border with Venezuela.
This monitoring effort, based on the analysis of high-resolution satellite imagery and data from collaborative monitoring carried out by the Yanomami and Ye’kwana communities, takes place in a context of operational transition in the territory, marked by the current government’s efforts to remove illegal occupants and the persistence of certain mining hotspots (see Note 1 below).
In recent years, this territory has faced an escalation of illegal mining that peaked in 2022, resulting in an unprecedented humanitarian and health crisis. Current data produced by the Brazilian organization Instituto Socioambiental (see below for details) reveals that the total area impacted by mining reached 5,564 hectares in 2025.
However, time series analysis demonstrates a critical inflection point: after the peak in 2022, the annual increase in newly impacted mining areas showed major and successive decreases in the years 2023 through 2025. Comparatively, while the accumulated area up to 2023 represents the vast majority of the impact (around 5,500 ha), there has been a documented increase of 129 hectares in 2024 and 2025 (83.95 ha and 45.2 ha, respectively).
This recent slowdown in the rate of mining expansion is a direct result of the command and control operations initiated by the Brazilian government in 2023, shortly after the official recognition of the public health emergency (see Note 2). The data, however, also serves as a warning: although the mining expansion has slowed, the continued detection in both 2024 and 2025 confirms that mining activity has not been completely eradicated.
Monthly monitoring indicates that illegal mining continues to exert pressure on the territory, miners are adapting to enforcement operations and maintain mining nodes of resistance that require continuity and improvement of territorial protection and monitoring strategies.
Analysis of illegal gold mining in Yanomami Indigenous Territory
Methodology
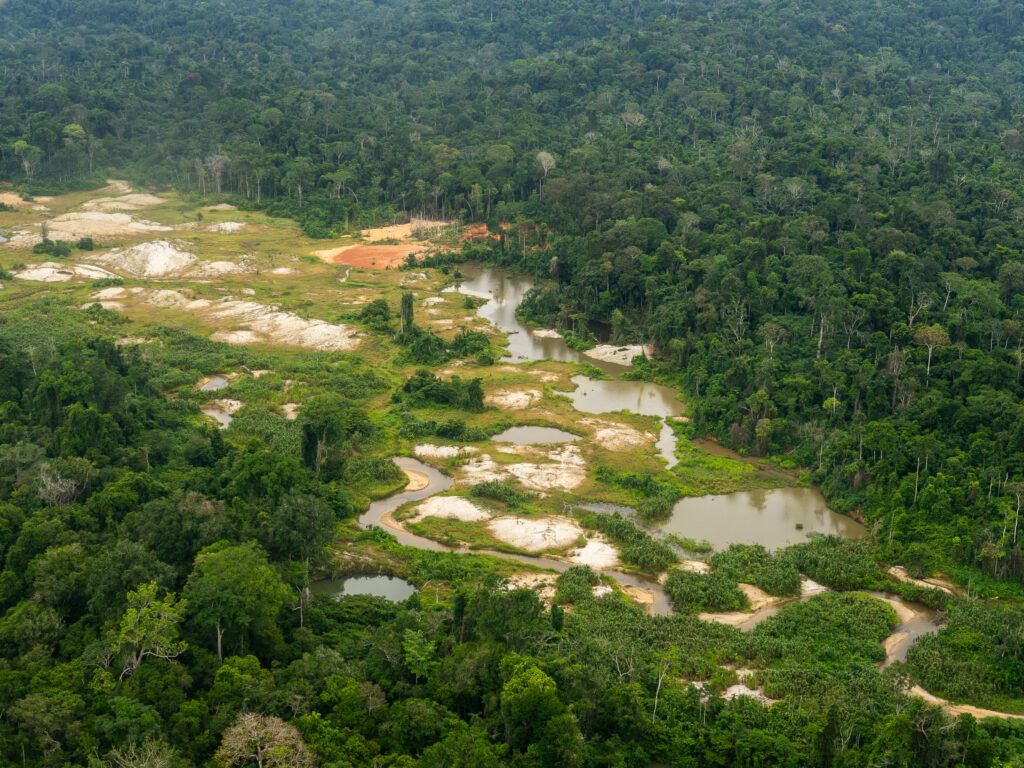
Photo 2. Gold mining in Yanomami Indigenous Territory. Photo credit: Lucas Silva/Platô/ISA
The data presented in this report is based on monitoring led by the Brazilian organization Instituto Socioambiental (ISA). This analysis is carried out monthly based on the visual interpretation of satellite images from Planet (monthly mosaics) and the European Space Agency’s Sentinel 2. Mining impact polygons were then generated by incorporating: 1) recent mining deforestation, 2) active mining areas with bare soil, 3) recently abandoned areas with initial vegetation growth (grasses covering gravel pits), and 4) tailings ponds.
Every month, the impacted regions are revisited to refine the mapping and check for possible misinterpretations. The analysis takes into account not only the spectral response of the objects but also the context. Therefore, all mapping is carried out considering the location of the communities and their cultivated areas, among other information about the Yanomami territory such as airstrips and health posts, which ensures differentiation between the removal of forest cover for traditional agricultural management and deforestation associated with mineral or other types of exploitation.
The systematic remote monitoring of Yanomami Indigenous Territory began in 2018, experimenting with different methodologies. Beginning in 2020, the refinement of impacted areas began using Planet mosaics (3 m spatial resolution). For this reason, 2020 is used as the initial year of detailed analysis.
In the Notes section, we also compare this ISA-led monitoring data with information obtained from Amazon Mining Watch.
In addition to remote monitoring, since 2023 a collaborative monitoring tool has been implemented to record events that pose risks to communities and people in the Yanomami Indigenous Territory. The ‘Wãnori’ Alert System receives and qualifies reports, aiming to strengthen communication between indigenous communities, their organizations, and the Public Authorities. Through a free application (ODK Collect), an alert monitor can report an adverse health event, environmental or territorial threat, using an offline form composed of geographic coordinates and a description of the problem in audio and/or photo. The system uses the form/application as its primary tool for receiving complaints, but it continues to receive information from other sources, such as WhatsApp messages, letters, and radio broadcasts, incorporating this information into a single flow. All alerts are compiled into weekly bulletins and sent to Brazilian authorities.
Results
By December 2025, the total area impacted by illegal mining in the Yanomami Indigenous Territory was mapped at 5,564 hectares (see Note 3 for comparison with Amazon Mining Watch). As seen in Graph 1 (with 2020 baseline at 400 ha), the annual mining impact increased in 2021 (just over 1,000 ha) and peaked in 2022 (nearly 1,800 ha), followed by major decreases in 2023 (330 ha), 2024 (84 ha), and 2025 (45 ha), respectively. This reduction was a result of the intervention of the Brazilian government, which initiated a process of removing illegal miners from the territory in 2023, after recognizing the humanitarian crisis caused by illegal mining among the Yanomami and Ye’kwana peoples.
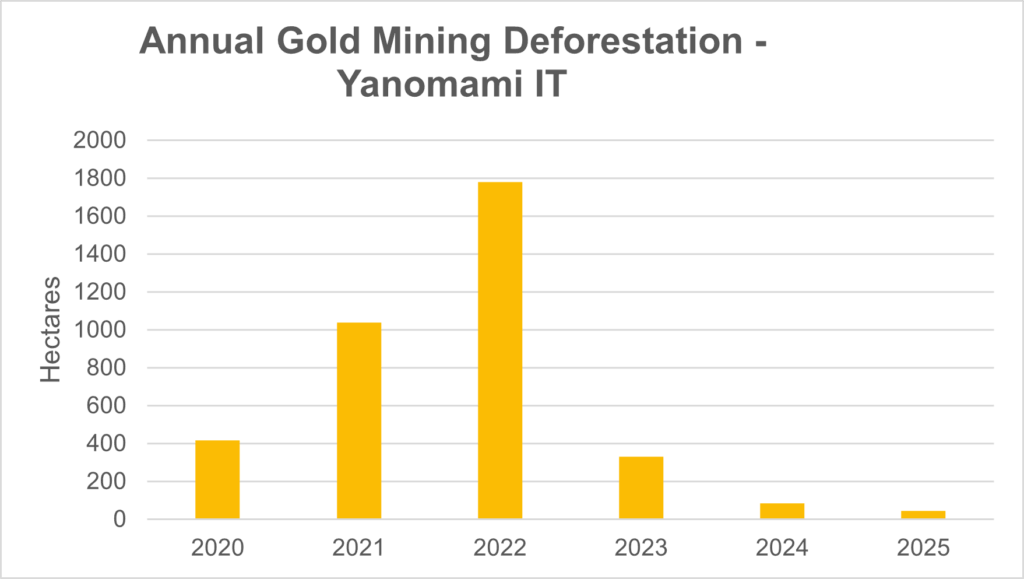
Graph 1 – Annual increase in the area affected by illegal mining in Yanomami Indigenous Territory.
The monitoring documented 45 hectares (across 121 polygons) of new mining deforestation within Yanomami Indigenous Territory in 2025. The vast majority (90%) of the polygons were small mining expansions of less than 1 hectare. This recent mining impact was mostly distributed across six areas: 1) Ericó; 2) Cabeceira do Aracaju; 3) Hokomawaë; 4) Parima-Parafuri; 5) Surucucus/Feijão Queimado; 6) Couto Magalhães (see Figure 1).
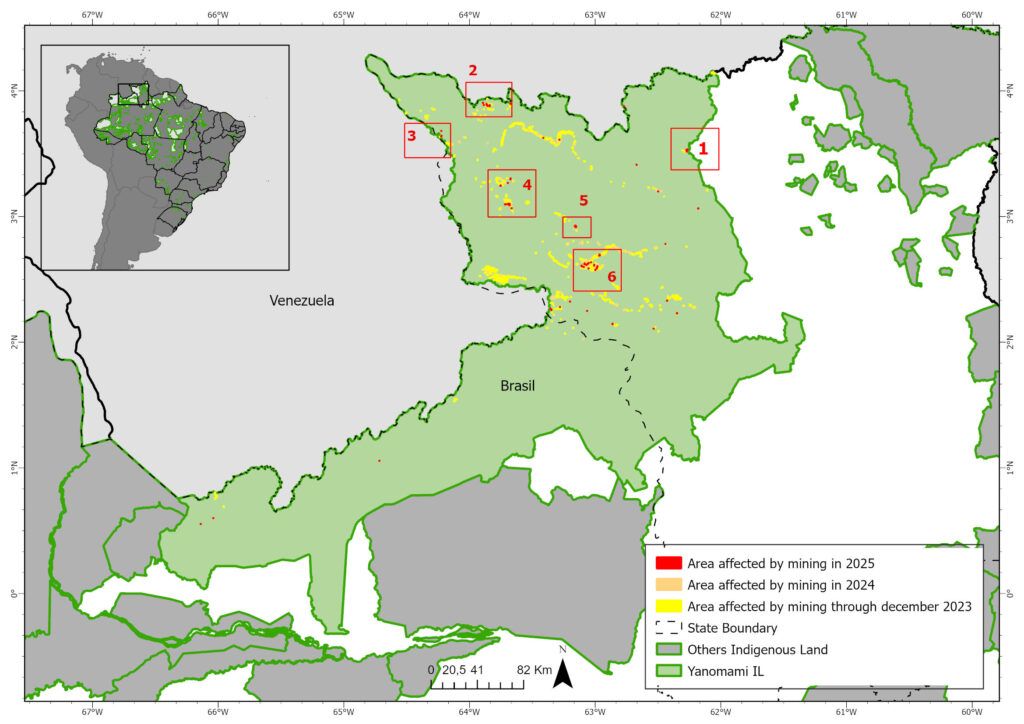
Figure 1. Illegal gold mining in Yanomami Indigenous Territory, highlighting areas with highest impact in 2025.
The two largest polygons (almost 4 hectares) were identified in Parima (Area 5) and Surucucus, near the Feijão Queimado airstrip (Area 6).
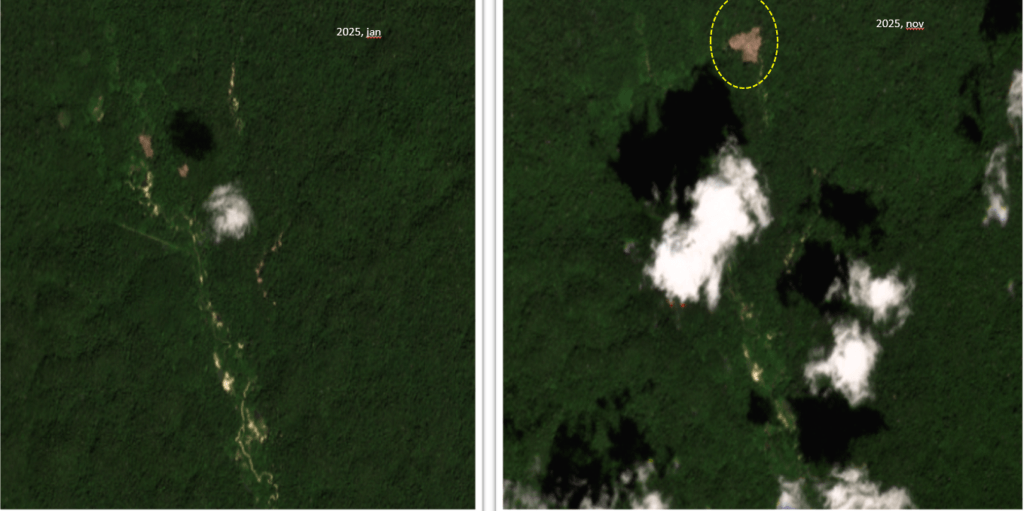
Figure 2 – Comparison of images from January 2025 and November 2025 near the Feijão Queimado airstrip. New deforestation is noticeable in the upper part of image 2.
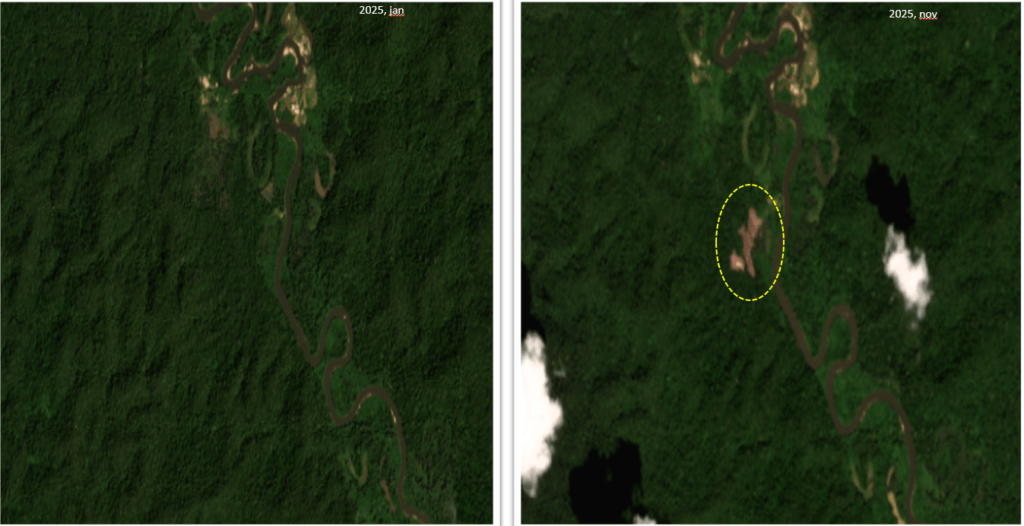
Figure 3 – Comparison between January 2025 and November 2025 in the Parima region.
The distribution of the new mining areas also indicates a trend towards fragmentation of activity, in contrast to the previous concentration around airstrips (such as Capixaba, Jeremias, Malária, Mucuim). With the exception of the Couto Magalhães river region (Area 6 in Figure 1), where the opening of new areas near old scars continued (Figure 4), the other centers of greater concentration, such as Alto Catrimani, Médio Uraricoera and Homoxi, appear to be relatively neutralized.
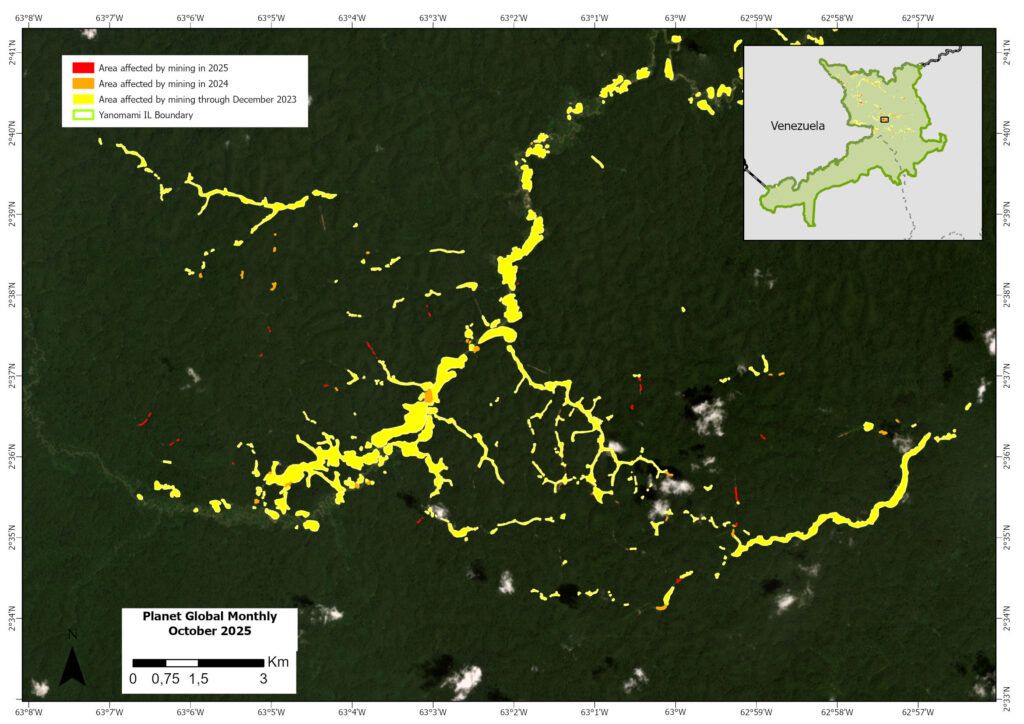
Figure 4. – Mapping of illegal mining in the Couto Magalhães River (Papiu and Kayanau regions)
In addition to decentralization, there is also a shift in activity to areas closer to the border with Venezuela (possible leakage or spillover effect), as is the case with the mapped areas in Parafuri-Parima, Hokomawë, and Cabeceira do Aracaçá (Areas 2-4 in Figure 1). It is known that part of this phenomenon is explained by the possibility of “circumventing” inspection by using logistical hubs located in Venezuelan territory, such as the airstrips in Dicão and Simada Ocho.
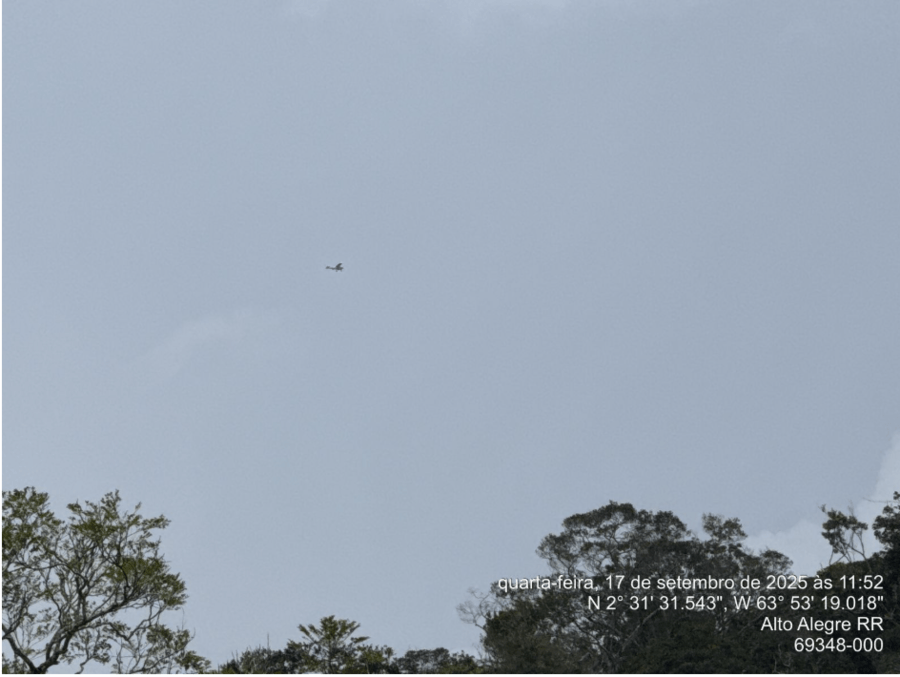
In 2025, the Yanomami Indigenous Territory’s alert system recorded at least five alerts regarding the movement of clandestine aircraft in the Auaris region. In most cases, the aircraft flew in the direction of Hokomawë, towards the Gaúcho Animal airstrip, located at the mouth of the Auaris River, or towards the airstrip located at the headwaters of the Aracaçá River (supposedly the Gongo airstrip). See Figure 5, which zooms in on Area 2 of Figure 1.
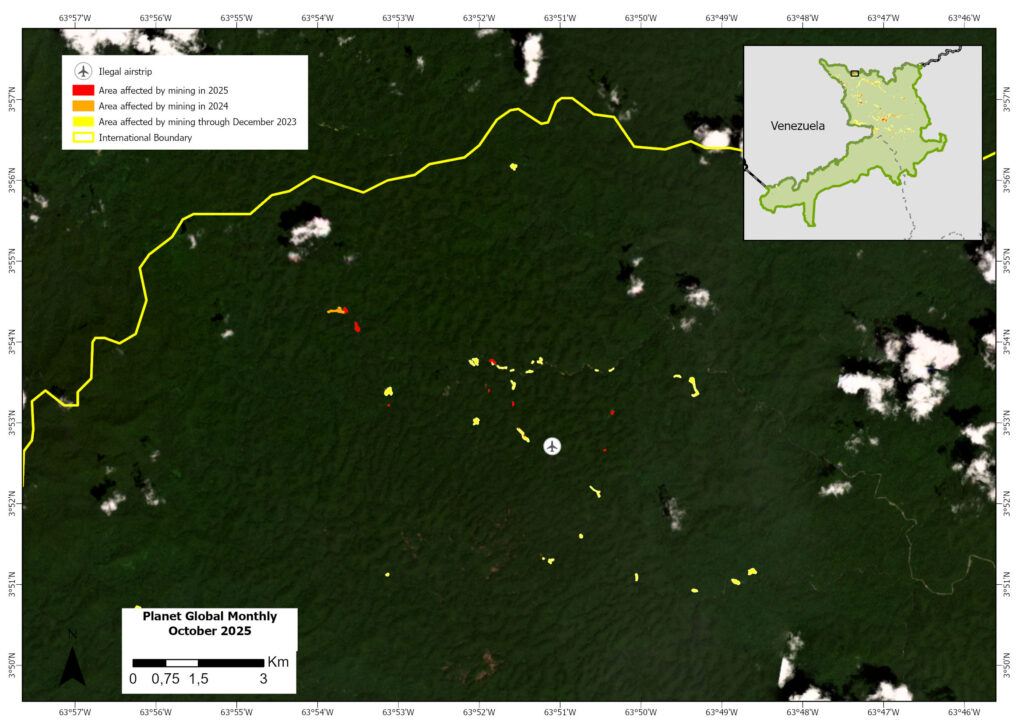
Figure 5 – Mapping of illegal mining at the headwaters of the Aracaçá River, near the Gongo airstrip and the border with Venezuela.
With respect to the ‘Wãnori’ Alert System, in 2025, it recorded a total of 66 territorial alerts, of which the vast majority (83%) were invasion alerts (Graph 2), which include information on the movement of clandestine aircraft, boats, barges, and other vehicles. There were also records of attacks and the entry of firearms. Cases of missing persons were resolved, without being actually associated with violence in the illegal mining areas.
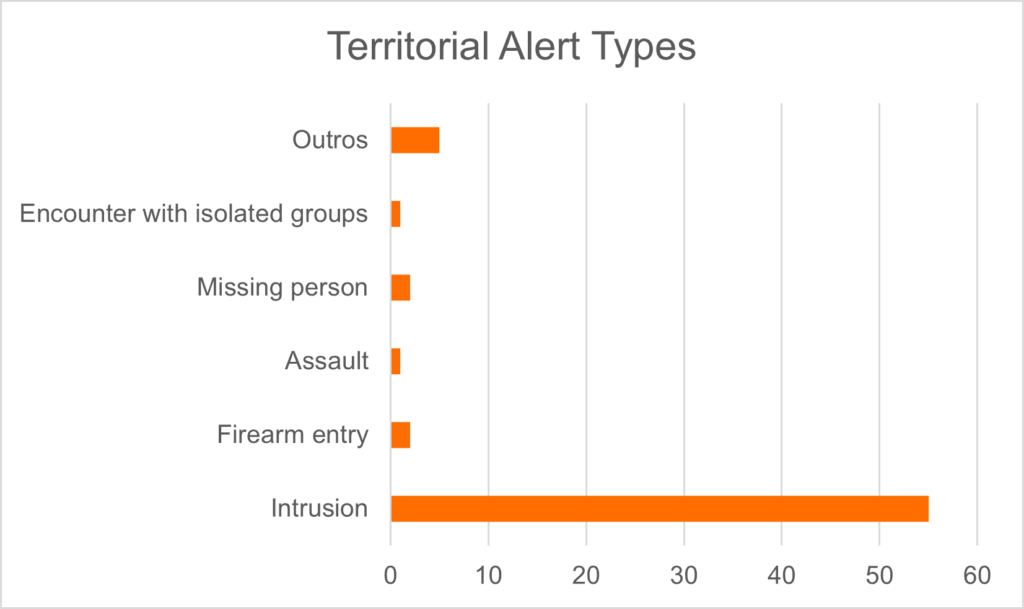
Graph 2 – Territorial alerts in 2025 by alert type
Figure 6 illustrates the spatial distribution of the alerts, again highlighting the concentration in the north of the territory, near the border with Venezuela.
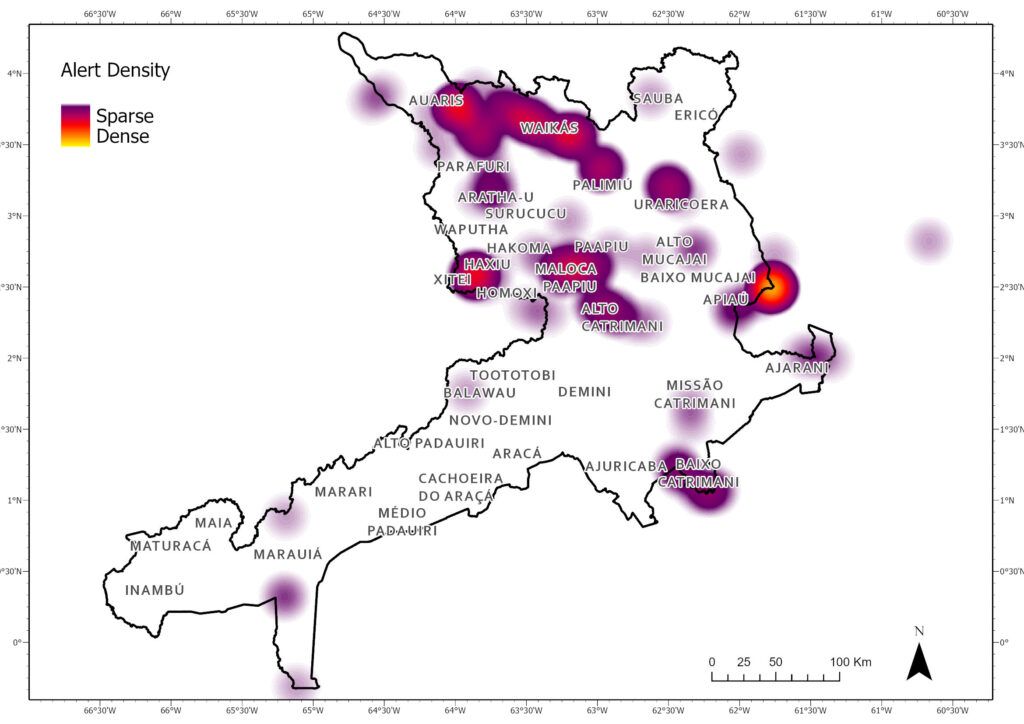
Figure 6 – Heat map of territorial alerts for 2024 and 2025
The area with the highest number of alerts, Apiaú (Chart 3), was also among the regions that registered airspace intrusion alerts (see Annex 1 for photo evidence), possibly associated with illegal mining on the Couto Magalhães River.
Alto Catrimani also had airspace alerts. In this case, the connection between this activity and illegal mining in the headwaters of the Orinoco River, in Venezuelan territory, is notable; this is one of the areas with the highest levels of illegal mining activity in recent years.
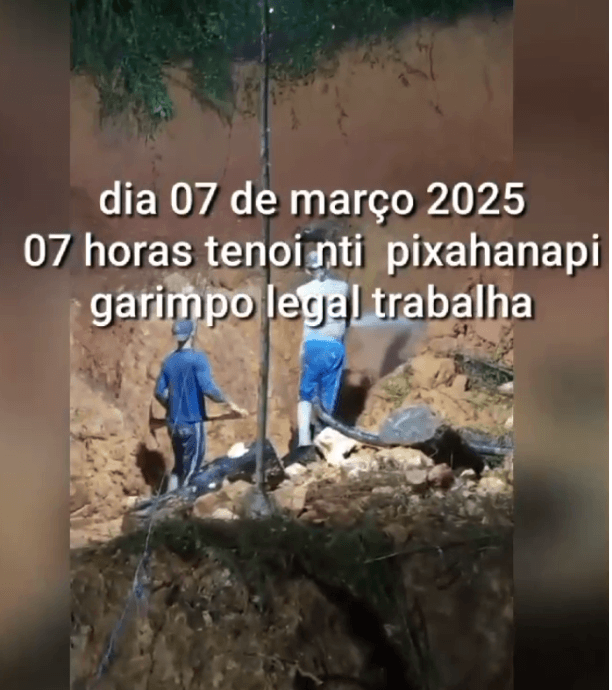
Other areas with airspace intrusion alerts include Auaris and Xitei (see Annex 2 for photo evidence). It should also be noted that, even though the Taboca airstrip is located in Venezuela, it supports the remaining fragments of illegal mining in the Alto Catrimani and Xitei regions, such as the mining operation located near the Pixahanapi community .It is worth noting that in the case of the Xitei mining operation (see Annex 3 for community alert), the warnings reinforce the residents’ concern regarding the entry of ammunition and firearms brought by the miners with the aim of recruiting young people and threatening leaders who oppose mineral exploration in the region. Since 2021, Xitei has been marked by violent conflicts associated with mining, and 2025 was no different. In 2025 alone, it is estimated that at least five people died due to these conflicts.
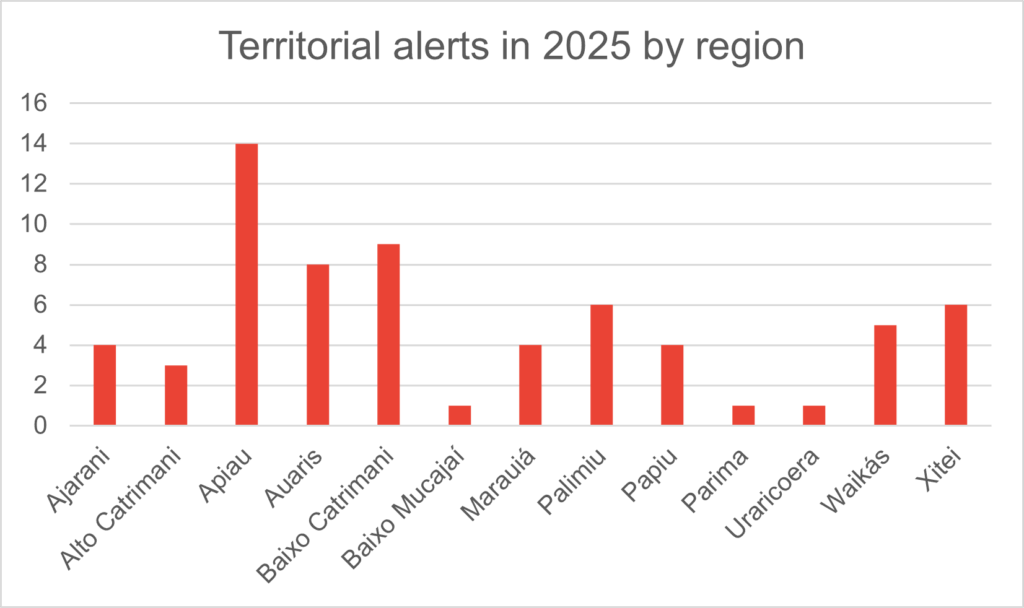
Graph 3 – Territorial alerts in 2025 by region
In addition to airspace violations, the alert system also recorded many instances of illegal incursions along the rivers of Yanomami Indigenous Territory, namel the Uraricoera, Catrimani, Apiaú, and Ajarani. In some cases, the river traffic was associated with the operation of barges and dredges, in others simply for the transport of cassiterite, or the entry of supplies to replenish the camps.
The Lower Catrimani region has reported the most instances of river invasion. From April to December 2025, nine alerts were issued regarding the presence of barges, dredges, and suspicious boats (Figure 7).
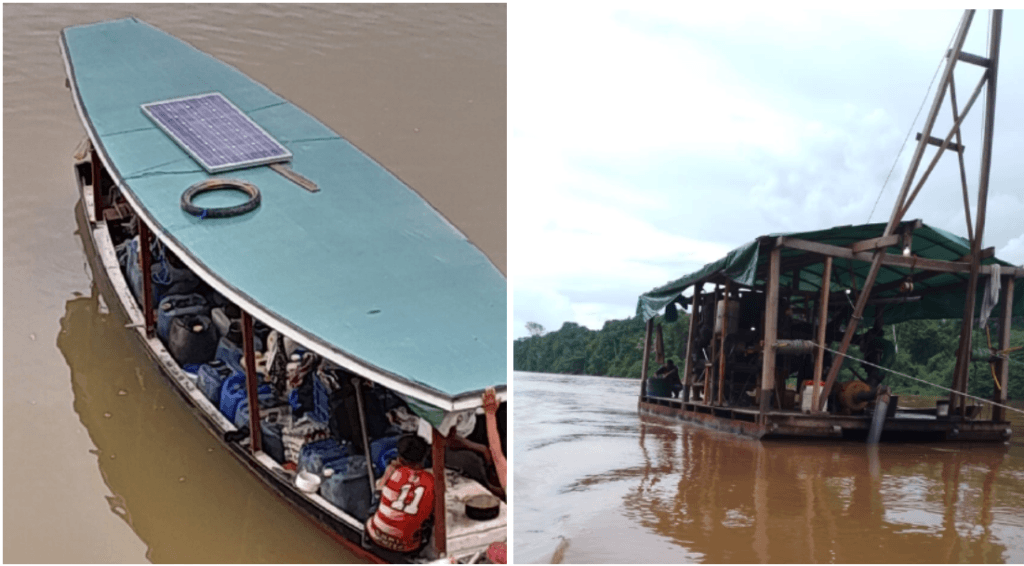
Figure 7 – Boat with supplies for illegal mining in the Lower Catrimani region and a mining dredge operating near the Yanomami community in the same region.
From Apiaú, reports have emerged of an alleged trail for ATVs that would serve to supply the mining operations located upstream and bypass the site where the new National Indigenous Foundation (Funai) base is being installed. The trail would connect existing secondary roads outside the territory and reach the Ingarana stream, a tributary of the Apiaú River (Figure 8).
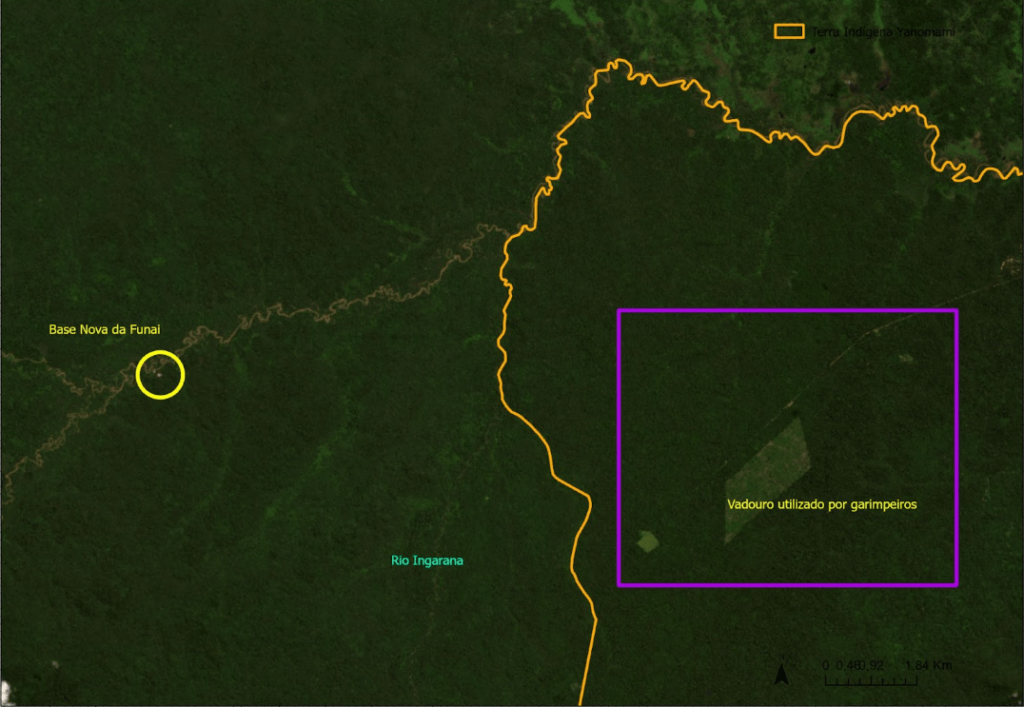
Figure 8 – Map of the Apiaú region showing the location of the alleged portage.
Finally, another noteworthy region is Ericó, an area accessible via the Uraricaá River, where significant signs of deforestation associated with mining were observed in 2025. During the period from 2018 to 2022, there were records of dredges operating on the Uraricaá River; however, there were no clear signs of land-based mining in the region. With the intensification of operations in other parts of the territory, however, there appears to have been a spillover into this basin, which, being further from the main areas of surveillance, ended up becoming vulnerable. See Figure 9, which zooms in on Area 1 of Figure 1.
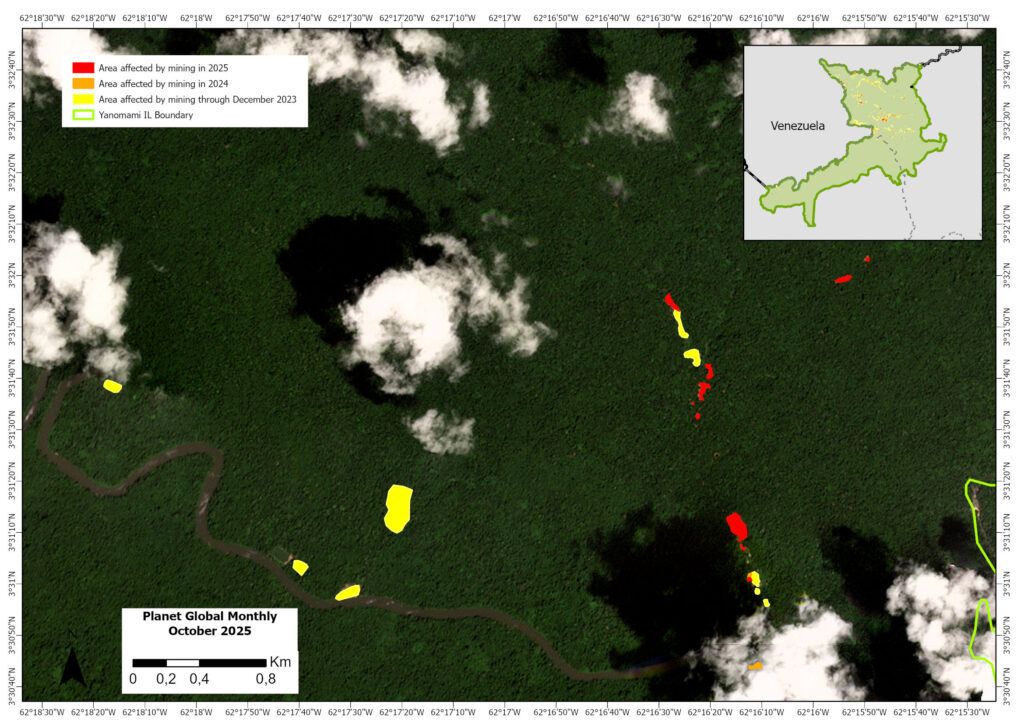
Figure 9 – Mapping of illegal mining in the Uraricaá River
Annex
Annex 1. Aircraft registration in service of the mining operation in Apiaú

Annex 2.Illegal mining plane registered in Xitei
Annex 3. Video sent to the Alert System, which records the presence of illegal miners operating at night, near the Pixahanapi community, Xitei.
Policy Implications & Recommendations
Analysis of the 2025 data indicates a significant inflection point in the dynamics of illegal mining. Although the total impacted area amounts to 5,564 hectares, there has been a substantial and successive decrease in the annual expansion of newly degraded areas since the peak in 2022. In 2025, only 45.2 hectares of new areas were recorded, distributed across 121 polygons, most of which are less than 1 hectare.
However, miners’ ability to adapt to the government operations is observed, by adopting some fragmentation and decentralization strategies, moving to areas closer to the border with Venezuela to utilize logistical distribution hubs outside the limits of inspection. Furthermore, the persistence of some extremely resilient mining nodes is noted, as is the case with the mining in the Couto Magalhães River.
With this in mind, to consolidate the results of land clearing operations and address the reentry of criminal activity within the territory, the following actions are recommended:
- All enforcement agencies should maintain operations to combat illegal mining in the remaining areas, with the complete destruction of machinery used in mineral extraction and the application of the respective administrative sanctions;
- To ensure continuous remote monitoring of Yanomami territory as well as rapid responses to new alerts from security forces;
- To guarantee the maintenance of the physical structures and the minimum staff for the continuous operation of the existing Protection Posts (Ajarani, Xexena, Walopali, Serra da Estrutura and Pakilapi);
- Finalize the construction of the Apiaú and Kayanau Protection Posts;
- Install new Protection Posts on strategic rivers that serve as routes for illegal mining, specifically on the Uraricaá and Catrimani rivers;
- Implement more efficient river barriers on the Uraricoera, Mucajaí, Uraricaá, and Catrimani rivers.
- To promote regular State enforcement agencies’ patrols on the Uraricoera, Mucajaí, Ajarani, Apiaú, Uraricaá, Catrimani, Parima and Couto Magalhães rivers.
- Enhanced airspace control and strict enforcement of the Brazilian Aeronautical Code.
- Disabling all clandestine airstrips and seized aircraft within Yanomami territory (Integrated Territory of Yanomami).
- To promote regular inspection actions on highways, gas stations, airports, and ports located around Yanomami territory.
- Support from the federal government for the implementation of the Indigenous Surveillance Plan, integrating information from the communities’ Alert System with state action;
- Implement a strict sanitary and territorial protection cordon around the territory of the isolated groups, led by the Indigenous Peoples’ National Foundation (FUNAI) and the Health District (Distrito Sanitário) with support from the National Forces;
- The FUNAI or the Government House (Casa de Governo) should lead the development of a plan to encourage voluntary disarmament in sensitive regions.
- The Brazilian government should foster spaces for governance and dialogue, with members of the government, indigenous associations, and technical partners from civil society, to monitor the implementation of territorial protection actions.
- The Brazilian government should develop, translate, and distribute regular newsletters to communities about territorial protection actions and their progress.
- The national government should coordinate with the Venezuelan government joint actions to combat the logistical “hubs” located just across the border, which serve as refuge for illegal miners and escape routes.
Notes
1. Operational transition refers to the changes in the model, regularity, and intensity of enforcement actions taken following the change in government. https://g1.globo.com/rr/roraima/noticia/2024/02/29/casa-de-governo-com-foco-na-crise-yanomami-e-instalada-em-rr-com-orcamento-de-r-1-bilhao.ghtml
2. https://www.planalto.gov.br/ccivil_03/_ato2023-2026/2023/decreto/D11405.htm
3. For comparison, Amazon Mining Watch has detected 2,470 hectares in Yanomami Indigenous Territory between 2018 and 2025. This data also shows a peak in 2022 (increase of 850 ha), followed by declines in 2023 (250 ha) and 2024 (80 ha). AMW did not detect any new mining in 2025. Importantly, the overall detected spatial patterns are similar, with both monitoring systems highlighting the concentration in the northern part of the territory.
4. Protection bases are control points managed by Funai that provide support for operations by other enforcement agencies, such as Ibama and the Federal Police.
5. The River Barriers function as control points and nautical blockades managed by Funai, with support from Ibama and the Federal Police, to prevent logistical access by wildcat miners and intruders to the rivers of the Yanomami Indigenous Territory.
6. This should involve regulatory agencies alongside environmental enforcement and command-and-control bodies, such as the National Civil Aviation Agency – ANAC (for airfield inspections), the National Petroleum Agency – ANP (for fuel station inspections), and the National Land Transport Agency – ANTT (for road and highway inspections).
Acknowledgments
This report is part of a series focusing on gold mining in the Amazon, through a strategic collaboration between Amazon Conservation and regional partners, with support from the Gordon and Betty Moore Foundation. In this case, we thank our partner Instituto Socioambiental (ISA) for leading this report
![]()
MAAP #240: Expansion of illegal gold mining in the Xingu Basin of the Brazilian Amazon (part 2. Protected Areas)
Base Map. Mining sites in the Xingu Socio-environmental Diversity Corridor. Data: ACA/MAAP, ISA.
We present the second of a two-part series on illegal gold mining deforestation in the Xingu River Basin, located in the eastern Brazilian Amazon (states of Pará and Mato Grosso). The current report examines mining in protected areas of the Xingu, while Part 1 focused on Indigenous territories (see MAAP #239)
The Xingu Basin is the site of the largest historical concentration of gold mining deforestation in the Brazilian Amazon (see MAAP #235). At the heart of this basin is the Xingu Socio-environmental Diversity Corridor, which is one of the largest continuous blocks (over 26 million hectares) of designated forests on the planet, connecting 24 Indigenous territories and 9 protected areas (see Base Map). Despite the official land designations, the area remains threatened, especially by the expansion of illegal gold mining driven by record high gold prices.
To address this challenge, the Xingu+ Network (Rede Xingu+) was created, a political alliance formed by a coalition of organizations representing the area. This network monitors deforestation and other pressures in the Xingu Corridor monthly, using the radar-based SiRAD X system.
In 2025, the Xingu+ Network partnered with Amazon Conservation, facilitating access to high-resolution optical images (from Planet), allowing for validation of alerts and identification of drivers. This collaboration also incorporates the online public dashboard Amazon Mining Watch.
Both systems, SiRAD X and Amazon Mining Watch, have detected a major expansion of gold mining deforestation since 2018 in the Corridor, including continued illegal activity during 2025. Throughout the report, we present data for both systems, noting their slight differences due to varying methodologies (Note 1), but the overall patterns of both datasets are consistent.
Between 2018 and 2024, the Sirad X monitoring system recorded the loss of around 11,500 hectares of forest within the Indigenous territories and protected areas of the Xingu Corridor (Amazon Mining Watch estimates around 16,000 ha), plus 400 hectares in 2025 (January – September), similar to the estimate of Amazon Mining Watch.
Both monitoring systems have detected recent mining deforestation in 6 protected areas in the Xingu Corridor (Note 2), in addition to the 5 Indigenous territories reported in part 1.
In Part 1, we detailed the recent gold mining deforestation in three of these Indigenous territories (Kuruaya, Baú, and Kayapó).
Here, in part 2, we focus on the recent gold mining deforestation in three of these protected areas (Altamira National Forest, Terra do Meio Ecological Station, and Nascentes da Serra do Cachimbo Biological Reserve) in the Xingu Corridor, including the presentation of a series of high-resolution images.
The Base Map indicates the focal areas of this series, with Points A-C covered in the first report (Indigenous territories), and Points D-F in the current second report (protected areas).
Mining in Protected Areas
Altamira National Forest
The Altamira National Forest (located in Pará state) is experiencing expanding illegal mining in three locations with notable increases in 2025. In just the first eight months of 2025, the area affected by illegal mining in the Altamira National Forest has already exceeded the total environmental damage recorded for the entire year of 2024, highlighting the urgent need for enforcement operations in the area.
Mining began in its northwestern and western sections between 2016 and 2018 and expanded 832 hectares by September 2025. Figure D1 shows recent mining deforestation in the western section, between October 2024 (left panel) and September 2025 (right panel). Although there are mining exploration applications for these sections, mining is not permitted in the area’s Management Plan or in its creation decree (Decree No. 2483, 1998). See Note 3 for comparison with AMW.
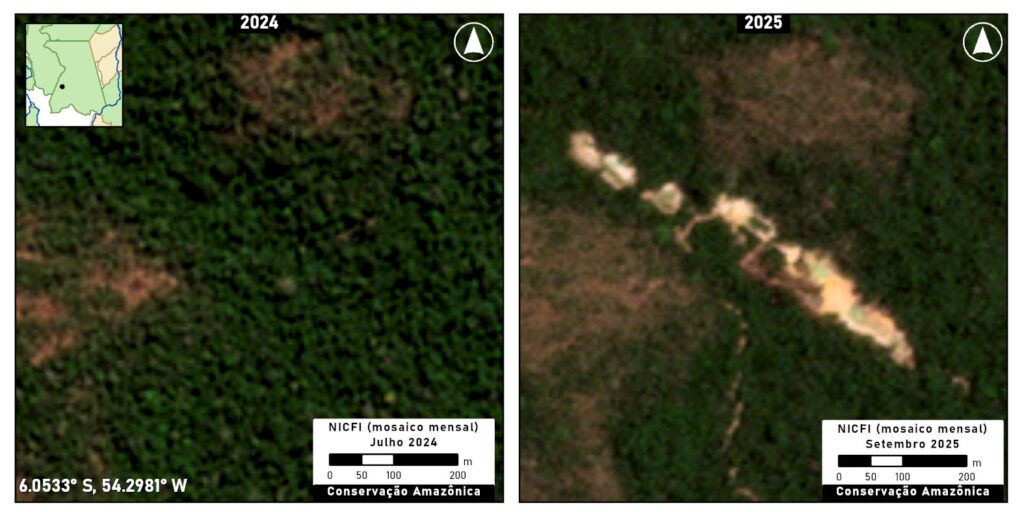
Figure D1 Data: Planet, NICFI
The mining in the southeastern section began in 2024 and expanded to a cumulative total of 36 hectares by October 2025, according to the Xingu+ Network monitoring. Gold mining in the southeastern section accounted for 45.7% of the area deforested by mining operations in 2025 within the National Forest, with the peak of its expansion occurring in June. Figure D2 shows recent mining deforestation in this section, between September 2024 (left panel) and September 2025 (right panel).
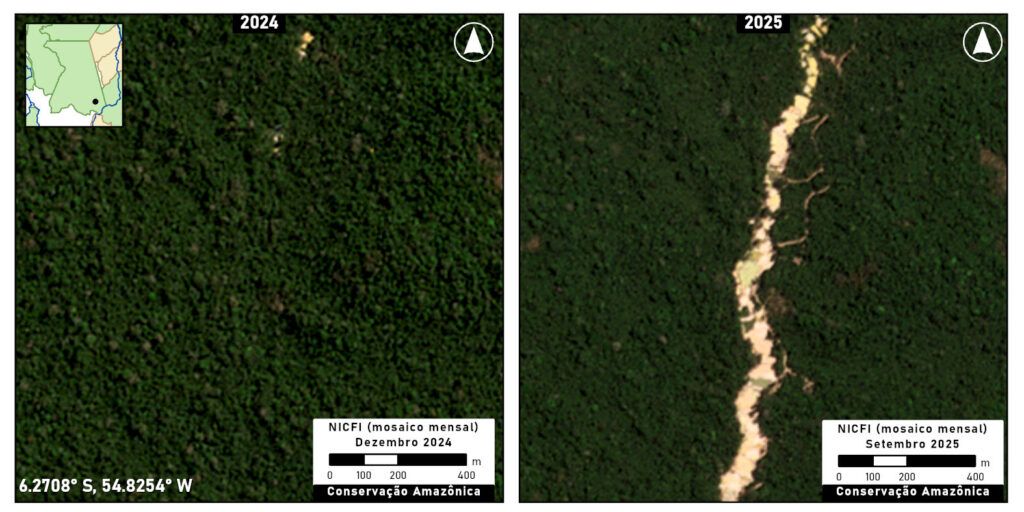
Figure D2 Data: Planet, NICFI
Terra do Meio Ecological Station
The Terra do Meio Ecological Station has emerged as a new mining front. First identified in September 2024, the mining rapidly expanded to a cumulative total of 30 hectares by the end of 2025, according to the Xingu+ Network monitoring (see Note 4 for comparison with AMW). Figure E shows this expansion between December 2024 (left panel) and September 2025 (right panel).
Although the Terra do Meio Ecological Station faces other illegal activities, such as deforestation, the presence of illegal mining operations within its boundaries is particularly concerning. This case not only demonstrates how far the offenders have encroached on a strictly protected area, but also highlights their high level of operational capacities. This combination increases the risk that the activity will spread, causing environmental degradation in other parts of the protected area.
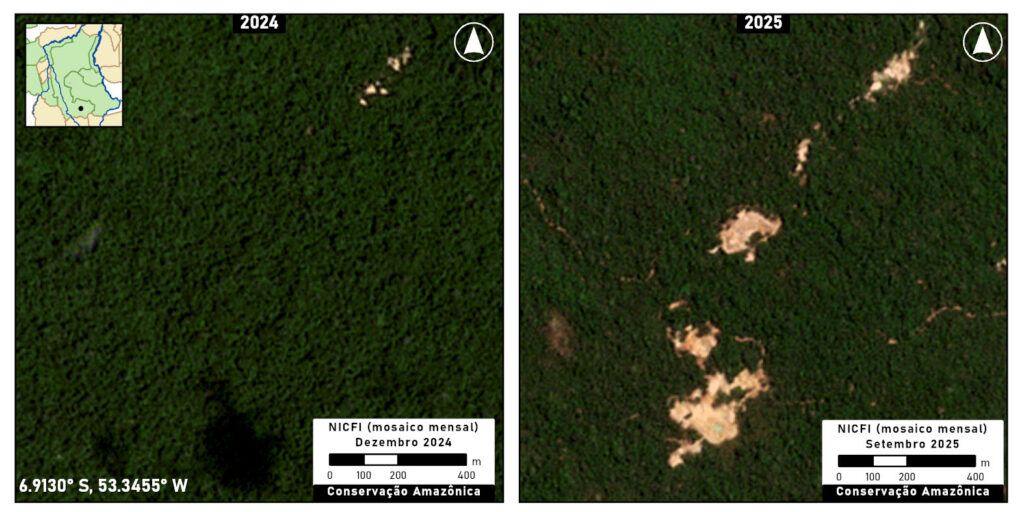
Figure E. Data: Planet, NICFI
Cachimbo Mountain Headwaters Biological Reserve
The Cachimbo Mountain Headwaters Biological Reserve is strategically located along the BR-163 highway in Pará. It is a strictly protected conservation area established by Decree No. – May 20, 2005, and is located between the municipalities of Altamira and Novo Progresso, in the Tapajós-Xingu interfluve, and adjacent to the Menkragnoti and Panará Indigenous Lands on its eastern boundary.
Illegal mining in the Biological Reserve began to expand, primarily starting in January 2025. At that time, the mining site—which had previously covered an area of two hectares—was the subject of a complaint filed in Official Letter No. 01/2025 by Rede Xingu+. In June, illegal mining in the Biological Reserve was reported again via Official Letter No. 15/2025, following an expansion of 18 ha, and in July, via Official Letter No. 18/2025, following a further expansion of 6.82 ha, totaling 26.82 ha.
Two mining sites are located in the northeastern region of the Rebio, opened in November 2024 and March 2025, and another site in the eastern region, opened in June 2025. It is worth noting that the site in the eastern region was also the subject of a complaint in Official Letter No. 18/2025, as it is located on and causing pollution in a tributary of the Pitxatxá River, a river that borders the Menkragnoti Indigenous Territory and where six indigenous villages of the Kayapó people are located.
Illegal mining began in December 2024, expanding to a cumulative total of 19 hectares as of September 2025 across several locations in the protected area, according to the Xingu+ Network monitoring (see Note 5 for comparison with AMW).
Even after enforcement operations, gold mining activity continues to expand within the Cachimbo Mountain Headwaters Biological Reserve. Figures 1 and 2 show the rapid mining-deforestation expansion up to November 2025, and Figure 3 shows the construction of a landing strip between July and August, providing access to the gold mines in the eastern region.
Figure F1 shows recent mining deforestation in the northeast part of the Biological Reserve, between December 2024 (left panel) and November 2025 (right panel).
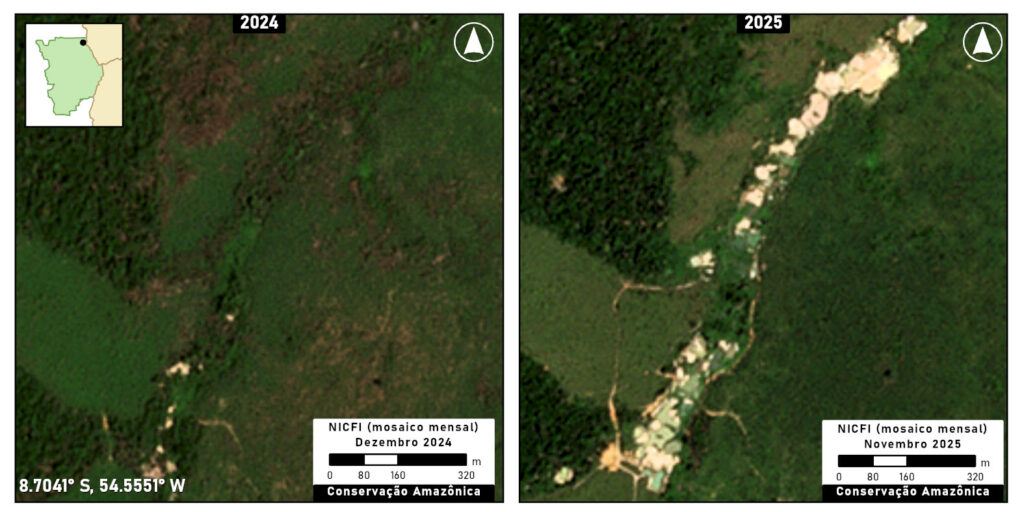
Figure F1 Data: Planet, NICFI
Figure F2 shows recent mining deforestation in the eastern part of the Biological Reserve, between June 2025 (left panel) and November 2025 (right panel).
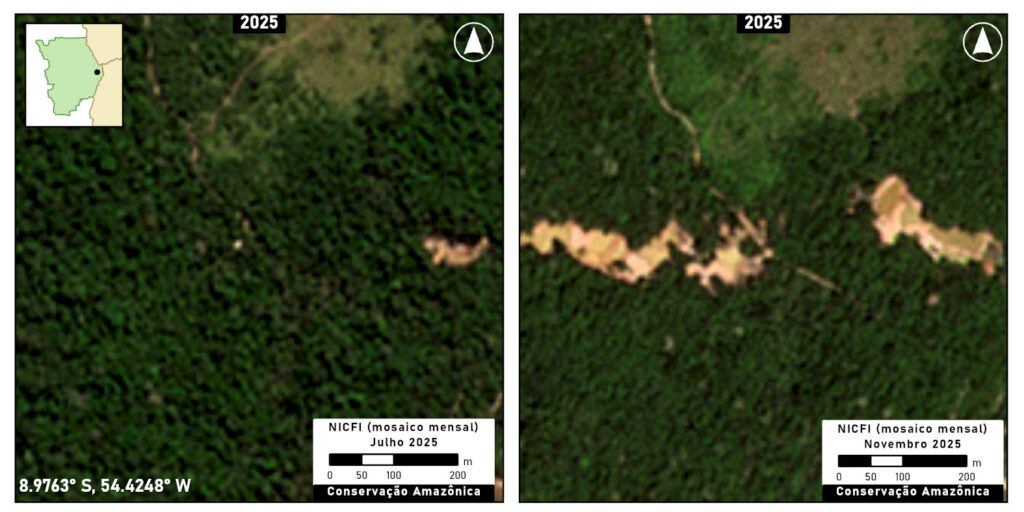
Figure F2 Data: Planet, NICFI
Figure F3 shows a new landing strip (opened in August 2025) in the eastern part of the Biological Reserve, between June 2025 (left panel) and November 2025 (right panel).
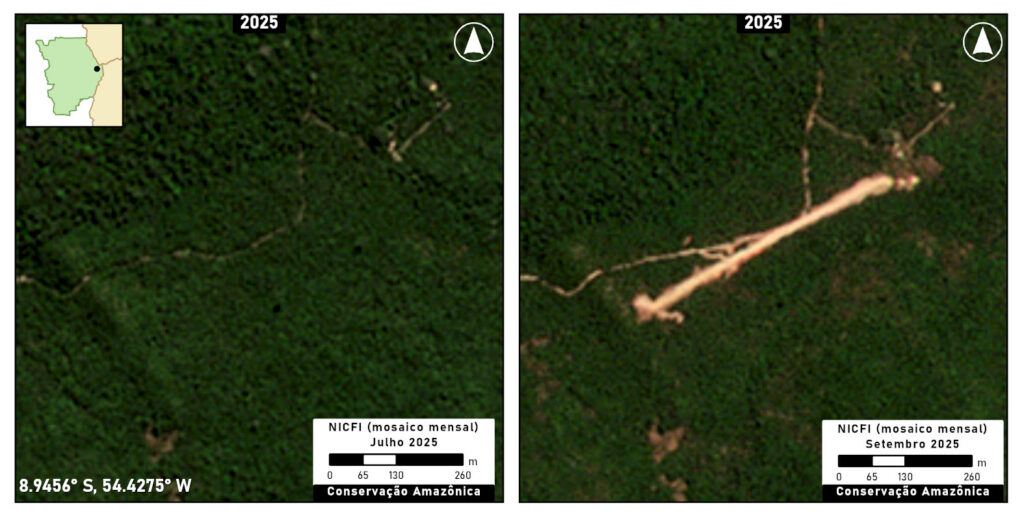
Figure F3 Data: Planet, NICFI
Conclusion and Recommendations
Based on the information presented above (and the previous MAAP #239), it is clear that illegal mining in the Xingu basin is not an isolated activity. It has spread to both Indigenous territories and protected areas, with illegal activity advancing into new territories, indicating the existence of a support network that provides the operational capacity and infrastructure necessary for the activity. Illegal mining poses a direct threat to protected areas by both deforestation and the contamination of rivers through the use of mercury, which affect sensitive ecosystems and the populations that depend on these resources.
Below, we propose a number of recommendations to Brazilian authorities with regards to: (i) the design of enforcement actions; (ii) monitoring and restoration (iii) traceability of gold supply chains.
(i) The design of enforcement actions;
Isolated enforcement actions have not been sufficient to guarantee the long-term protection of Protected Areas. Therefore, it is essential to establish a strategy coordinated with other agencies to dismantle the logistical structure that operates and fuels illegal mining. Alongside this, the structuring of preventive measures is fundamental.
- Establish permanent advanced bases (operated by government agencies such as ICMBio) in the most critical protected aeass, ensuring a constant presence to break the cycle of miners returning after eviction operations.
- Focus on disabling airstrips and seizing heavy machinery (hydraulic excavators) within protected areas, coordinating with National Civil Aviation agency (ANAC) and National Oil, Petroleum and Biofuel Agency (ANP) to block clandestine airfields and fuel stations in the areas surrounding protected lands.
- Strengthen oversight in the surroundings of protected areas to prevent legalized mining in nearby areas from serving as a front for illegal extraction within the boundaries of protected areas. This process would include the National Mining Agency (ANM), with oversight from other agencies.
(ii) Monitoring and restoration
Strengthening surveillance and environmental recovery is essential to discourage the return of illegal miners.
- Support management councils and associations of riverine and traditional populations in implementing surveillance protocols, recognizing the role of these communities in maintaining the integrity of sustainable-use protected areas.
- Implement Degraded Area Recovery Plans (PRADs) focused on the revegetation of riparian forests and the containment of siltation caused by mining sediments.In federal areas, it would be ICMBio; in state conservation units, the Institute for Forest and Biodiversity Development of the State of Pará (IDEFLOR-Bio).
(iii) Traceability of gold supply chains.
Implement a data-cross-referencing system that automatically blocks the issuance of Electronic Fiscal Invoices (NF-e) for minerals whose declared origin overlaps with Protected Area polygons. Improve legislation regarding documentation of sourcing area in traceability mechanisms, making it more difficult to “launder” minerals illegally extracted from Protected Areas.
Notes
1. Methodology of monitoring systems
For Sirad X monitoring, radar images from the Sentinel-1 satellite are used, which are processed by a series of algorithms on the Google Earth Engine (GEE) platform, along with optical images from the Landsat-9 satellite (OLI-2 sensor) and Sentinel-2 satellite (MSI sensor). A team of analysts examines the monitored area, visually searching for anomalies in the produced images. Each deforestation polygon is evaluated based on its proximity to other areas of degradation and the history of the region, and, if necessary, people familiar with the location are contacted to confirm the deforestation. Field knowledge is fundamental for data validation.
For Amazon Mining Watch, the mine detector is an artificial neural network, which we train to discriminate mines from other terrain by feeding it hand-labeled examples of mines and other key features as they appear in Sentinel-2 satellite imagery. The network operates on square patches of data extracted from the Sentinel-2 L1C data product. Each pixel in the patch captures the light reflected from Earth’s surface in twelve bands of visible and infrared light. We average (median composite) the Sentinel data across a period of many months to reduce the presence of clouds, cloud shadow, and other transitory effects. During run time, the network assesses each patch for signs of recent mining activity, and then the region of interest is shifted by half a patch width for the network to make a subsequent assessment. This process proceeds across the entire region of interest.
2-5. Comparisons with Amazon Mining Watch
2. Altamira National Forest, Terra do Meio Ecological Station, Iriri State Forest, Riozinho do Anfrísio Extractive Reserve, Nascentes da Serra do Cachimbo Biological Reserve, and Rio Iriri Extractive Reserve.
3. As a comparison, Amazon Mining Watch indicates the total mining deforestation of 620 hectares in Altamira National Forest between 2018 and 2025.
4. As a comparison, Amazon Mining Watch indicates the total mining deforestation of 3 hectares in Terra do Meio Ecological between 2018 and 2025.
5. As a comparison, Amazon Mining Watch indicates the total mining deforestation of 51 hectares in Cachimbo Mountain Headwaters Biological Reserve between 2018 and 2025.
Acknowledgments
This report is part of a series focusing on gold mining in the Amazon, through a strategic collaboration between Amazon Conservation and regional partners, with support from the Gordon and Betty Moore Foundation. In this case, we thank our partner Instituto Socioambiental (ISA) for leading this report.
![]()
MAAP #239: Expansion of illegal gold mining in the Xingu Basin of the Brazilian Amazon (part 1. Indigenous Territories)
Base Map. Mining sites in the Xingu Diversity Corridor. Data: Amazon Conservation/MAAP, ISA.
Illegal mining continues to expand in the Brazilian Amazon, likely driven by rising gold prices. As of the end of 2025, the accumulated area of mining activity in the Brazilian Amazon is estimated to be 223,000 hectares, according to Amazon Mining Watch (see MAAP #197, MAAP #226, and MAAP #235 for additional context).
Notably, the largest concentration of gold mining deforestation is in the Xingu River Basin, which extends over 51 million hectares in the eastern Brazilian Amazon (states of Pará and Mato Grosso).
At the heart of this territory is the Xingu Socio-environmental Diversity Corridor, which is one of the largest continuous blocks (over 26 million hectares) of designated forests on the planet, connecting 24 Indigenous territories and 9 protected areas (see Base Map). Despite the official land designations, the area remains threatened due to the continual expansion of illegal gold mining, agriculture, logging, roads, and human-caused forest fires.
The corridor is home to 26 Indigenous groups, who have historically acted as guardians against the advance of the deforestation frontier. To address these challenges, the Xingu+ Network (Rede Xingu+) was created, a political alliance formed by 53 organisations (43 Indigenous, 5 riverine, and 5 civil society partners) representing the inhabitants of the Corridor. The origin of this alliance dates back to the resistance movements against the damming of the Xingu River in 1989, and, after decades of collaboration, the Network was formalised in 2013.
The Xingu+ Network monitors deforestation and other pressures in the Xingu Corridor monthly, using the radar-based SiRAD X (Xingu Remote Deforestation Alert System). The system also relies on a local network of partners who carry out on-site territorial surveillance activities.
In 2025, the Brazilian organization Instituto Socioambiental (ISA) partnered with Amazon Conservation, facilitating access to high-resolution optical images (from Planet), allowing for validation of alerts and identification of drivers. This collaboration also incorporates the online public dashboard known as Amazon Mining Watch, a partnership between Amazon Conservation, Earth Genome and the Pulitzer Center.
Both systems, SiRAD X and Amazon Mining Watch, have detected a major expansion of gold mining deforestation since 2018 in the Corridor, including continued illegal activity in the most recent time period of 2025. Throughout the report, we present data for both systems, noting their slight differences due to varying methodologies (Note 1), but the overall patterns of both datasets are consistent.
Between 2018 and 2024, the Sirad X monitoring system recorded the loss of around 11,500 hectares of forest within the Indigenous territories and protected areas of the Xingu Corridor (Amazon Mining Watch estimates around 16,000 ha), plus 400 hectares in 2025 (January – September), similar to the estimate of Amazon Mining Watch.
Overall, this mining deforestation currently impacts 5 Indigenous territories (Kayapó, Baú, Kuruaya, Trincheira Bacajá, and Apyterewa) and 5 protected areas (Altamira National Forest, Iriri State Forest, Riozinho do Anfrísio Extractive Reserve, Nascentes da Serra do Cachimbo Biological Reserve, and Rio Iriri Extractive Reserve) in the Xingu Corridor.
We present a two-part series on this illegal gold mining deforestation in the Xingu Corridor. Part 1, detailed below, focuses on the Indigenous territories, while the upcoming Part 2 will focus on the protected areas.
In this Part 1, we detail the recent gold mining deforestation in 3 Indigenous territories (Kuruaya, Baú, and Kayapó), including the presentation of a series of high-resolution images.
The Base Map indicates the focal areas of this series, with Points A-C covered in this report (Indigenous territories), and the remaining Points D-F in the second report (protected areas).
Mining in Indigenous Territories
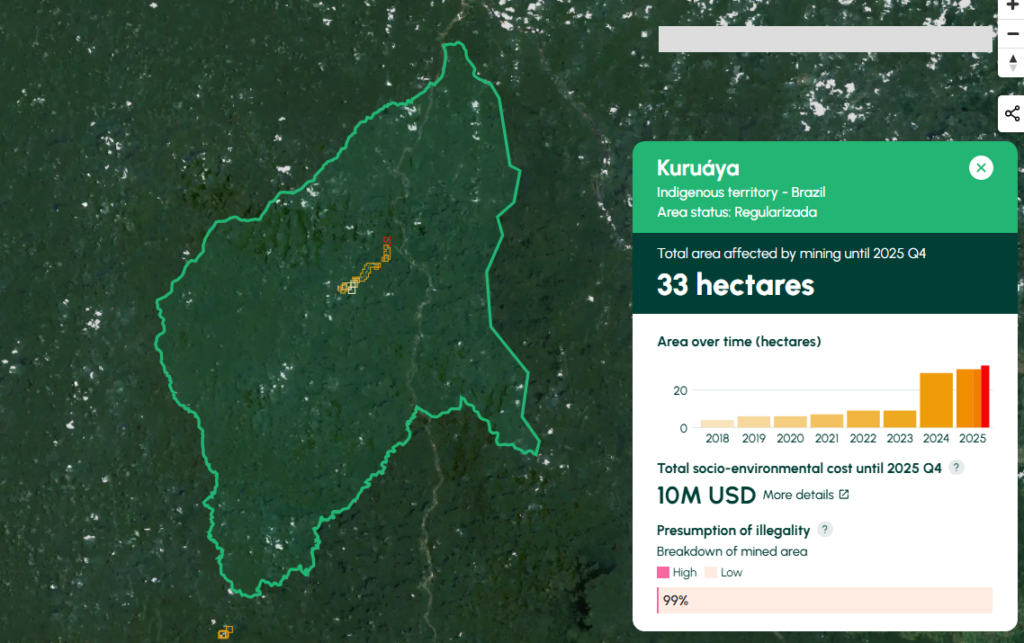
Kuruaya Indigenous Territory
The Kuruaya Indigenous Territory (state of Pará, municipality of Altamira) has experienced gold mining activity since the early 1980s, on the Curuá River, where the villages of the Kuruaya are located. The most intense recent mining has occurred on a tributary of the Curuá River, known as the Madalena.
Since 2023, the Xingu+ Network monitoring has recorded the expansion of illegal gold mining along the Madalena. That year, a formal complaint was filed (via Official Letter 42/2023-Rede Xingu+), which reported the loss of around 3 hectares due to gold mining. In 2024, the activity intensified with the deforestation of another 13.4 hectares, and from January to July 2025, the Madalena mining operation had already expanded by another 17.8 hectares, for a cumulative total of 34.2 hectares.
Figures A1 and A2 show the expansion of the illegal gold mining along the Madalena between 2024 (left panels) and 2025 (right panels). This mining is expanding primarily towards the confluence of the Madalena with the Curuá River. In addition, the activity has spread to new, smaller areas in the surrounding region.
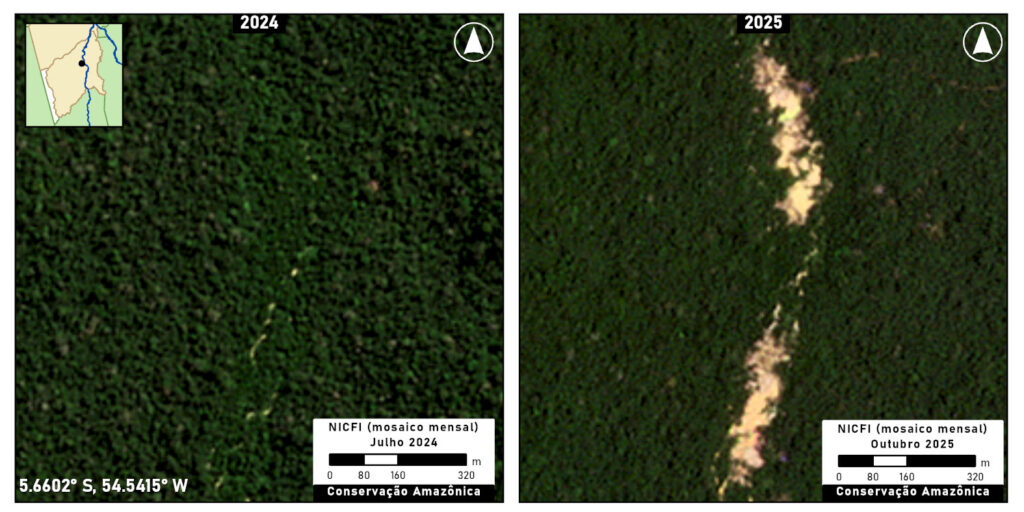
Figure A1. Mining in Kuruaya Indigenous Territory. Data: Planet/NICFI
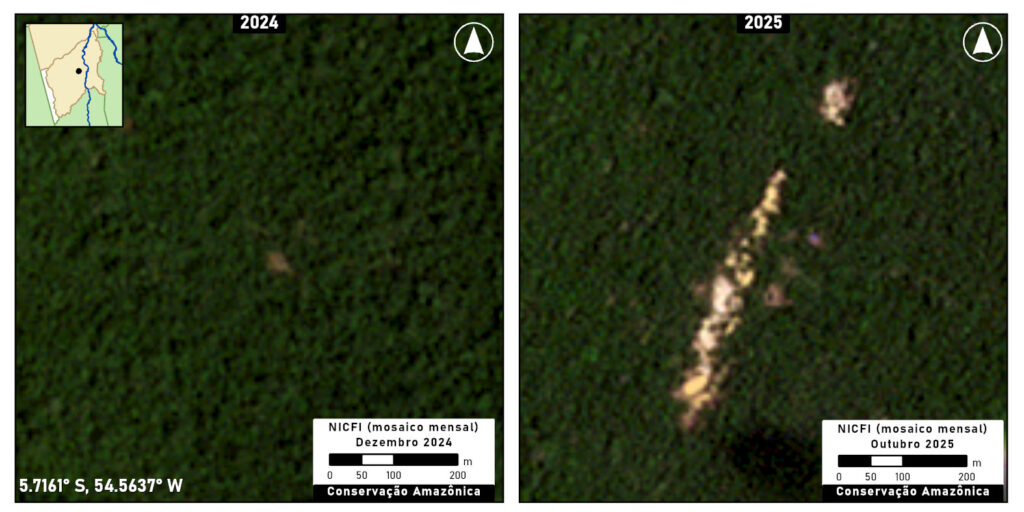
Figure A2. Mining in Kuruaya Indigenous Territory. Data: Planet/NICFI
Amazon Mining Watch results for Kuruaya Indigenous Territory.
Amazon Mining Watch indicates the cumulative mining deforestation of 33 hectares in Kuruaya Indigenous Territory, including 4 hectares in 2025 (click here to see on AMW).
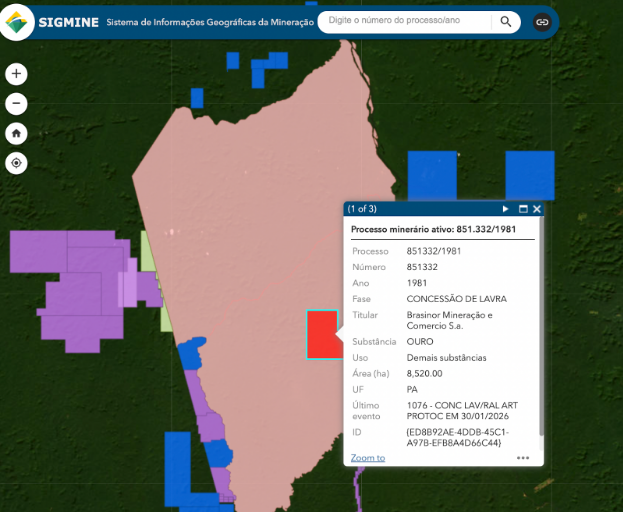
This mining is taking place within an active gold concession registered in the SIGMINE digital cadaster. Per the Brazilian Constitution, however, this type of concession (“lavra garimpeira” or exploitation permit for artisanal mining) is irregular within Indigenous territories (Note 2).
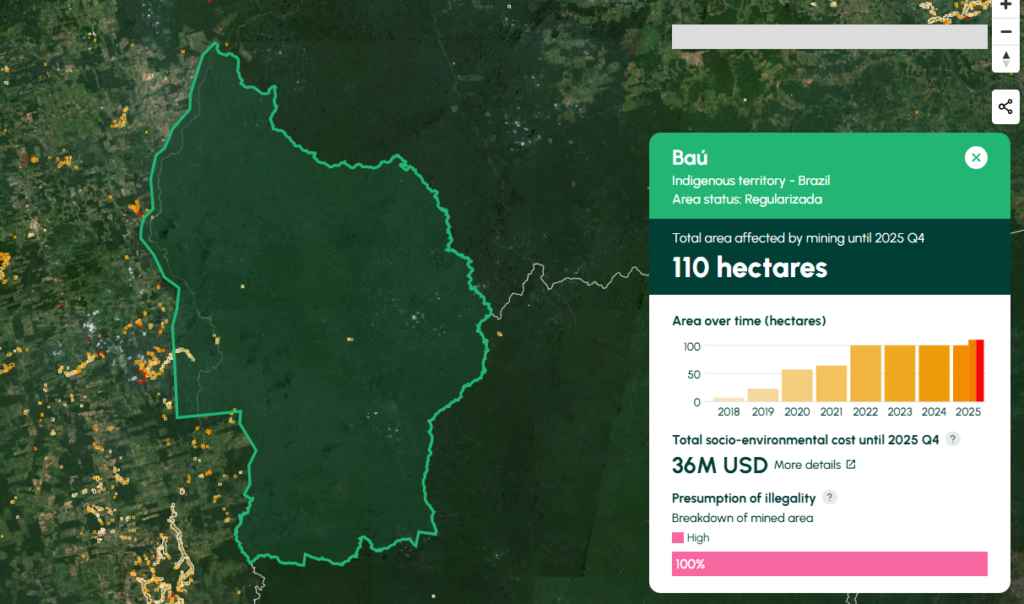
Baú Indigenous Territory
The Baú Indigenous Territory (state of Pará, municipality of Altamira) is inhabited by the Mebengôkre (Kayapó) Mekrãgnoti and isolated Purô peoples across its vast 1.5 million hectares. Illegal mining has impacted this territory since at least 2019, and has been the scene of several armed conflicts between miners and Indigenous members.
In the first half of 2025, active illegal mining sites were detected in several parts of the territory, most notably in the central mining site of Pista Velha. Pista Velha is an old mining site, but it was in 2019 that its reactivation became the scene of several armed conflicts between Indigenous peoples and gold miners, putting the lives of the Kayapó at risk. Efforts to reclaim this gold mine are ongoing and have been reported on numerous times by Rede Xingu+. In July 2025, an overflight confirmed the presence of mining activity in Pista Velha (see photo).

Overflight photo: Pista Velha mining site (Baú Indigenous Territory) on July 19, 2025. Photo: Xingu+ Network.
Figure B illustrates the gold mining expansion at Pista Velha between 2024 (left panel) and 2025 (right panel).
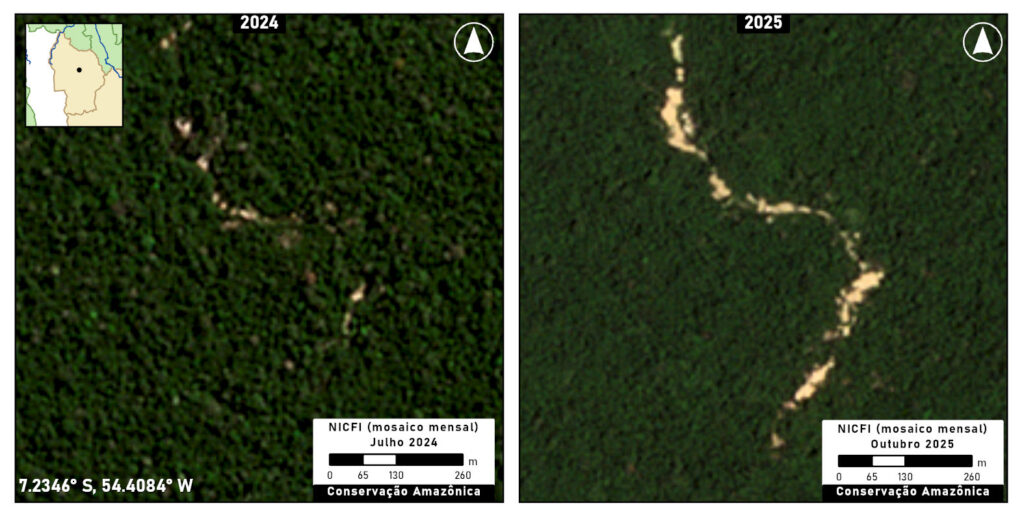
Figure B. Mining in Baú Indigenous Territory. Data: Planet/NICFI
Amazon Mining Watch results for Bau Indigenous Territory.
Amazon Mining Watch indicates the cumulative mining deforestation of 110 hectares in Bau Indigenous Territory, including 10 hectares in 2025 (click here to see on AMW.
Kayapó Indigenous Territory
The Kayapó Indigenous Territory (state of Pará, across four municipalities) has a long history of illegal mining dating back to the 1960s, and is the territory with the largest area deforested by illegal mining in the Brazilian Amazon.
Government operations to remove illegal miners from the Kayapó Indigenous Territory began in May 2025, in compliance with a Supreme Federal Court ruling (ADP 709), which aims not only to protect Indigenous peoples but also to contain the advance of illegal mining.
The first phase of these operations appears effective, as less than 2 hectares of new mining was detected in June 2025 by SIRAD-X monitoring. However, data from October indicates a small increase in mining in the territory, with an increase of 15 hectares.
Figures C1 and C2 show the recent advance of illegal mining in two locations of Kayapó Indigenous Territory between 2024 (left panels) and 2025 (right panels).
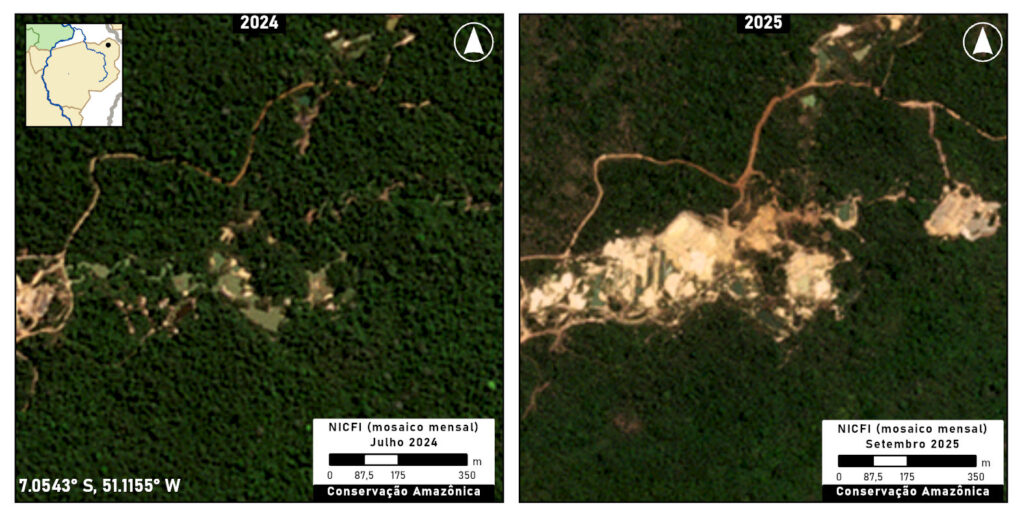
Figure C1. Mining in Kayapó Indigenous Territory. Data: Planet/NICFI
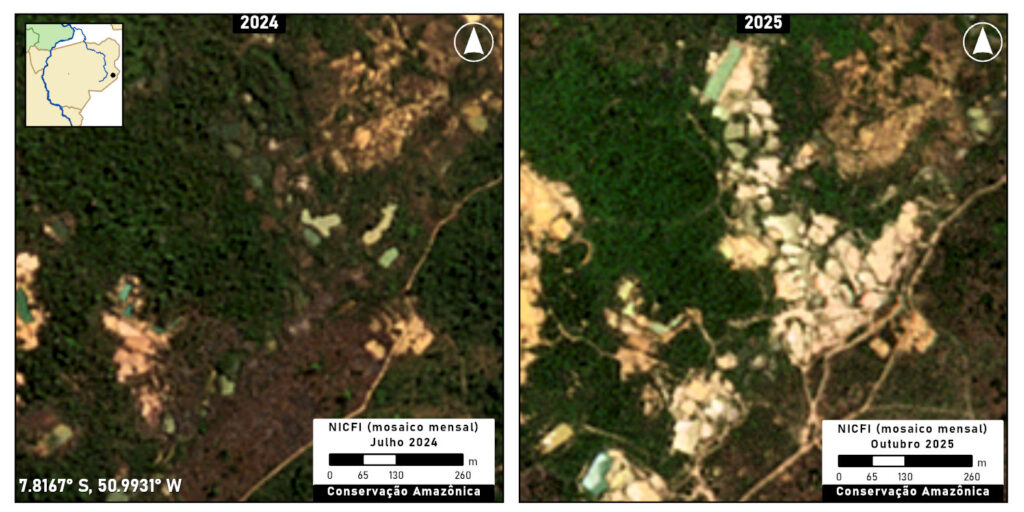
Figure C2. Mining in Kayapó Indigenous Territory. Data: Planet/NICFI
Amazon Mining Watch indicates the cumulative mining deforestation of 7,940 hectares in Kayapo Indigenous Territory, including 140 hectares in 2025 (click here to see on AMW). But much of this increase was detected in the first half of the year, indicating it might be a remnant of the 2024 expansion. Thus, much of that recently detected mining activity by Amazon Mining Watch likely happened in late 2024/early 2025 before the government intervention in May, consistent with the SiRAD X results stated above.
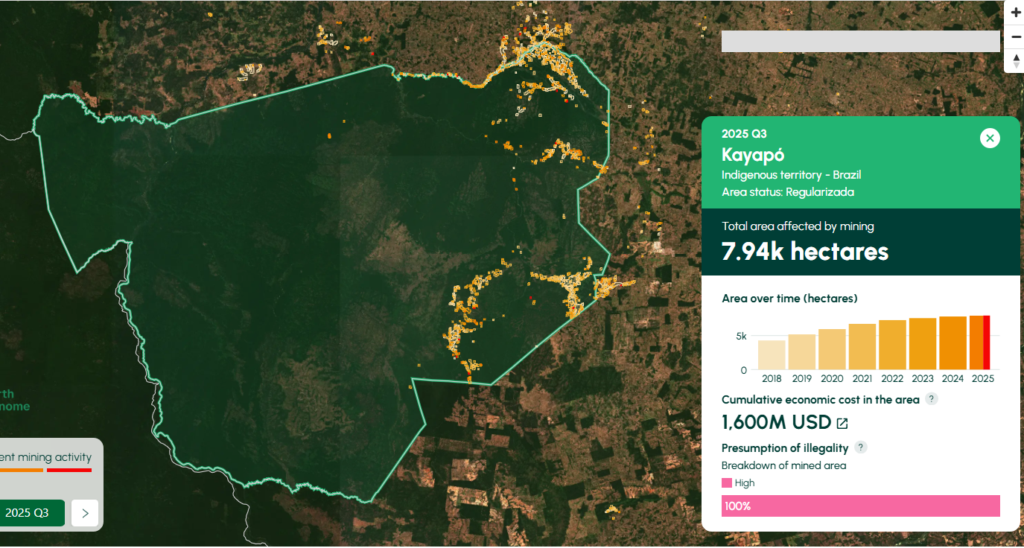
Amazon Mining Watch results for Kayapo Indigenous Territory.
Conclusion and Recommendations
Based on the information presented above, it is clear that illegal mining in the Xingu basin is not an isolated activity. It has spread to both Indigenous territories and protected areas, indicating the existence of a support network that provides the operational capacity and infrastructure necessary for the activity. This expansion brings with it a series of serious risks to the region and its communities.
Illegal mining poses a direct threat to the territorial integrity and well-being of riparian and indigenous communities. The main consequences are the degradation of native areas and the contamination of rivers through the use of mercury. In addition to environmental damage, the expansion of illegal activity increases the risk of socio-environmental conflicts between miners and traditional communities, who seek to protect their territories and way of life.
Below, we propose a number of recommendations to Brazilian authorities with regards to: (i) the design of enforcement actions; (ii) community-based monitoring and restoration (iii) traceability of gold supply chains.
(i) Enforcement actions:
To ensure the long-term protection of indigenous territories from illegal mining, it is crucial to move beyond immediate removal operations and establish a sustainable, preventative framework. While the Brazilian government has initiated removal efforts in response to recent judicial orders, there is a notable absence of a long-term strategy to prevent the recurrence of these invasions. Effective and lasting solutions call for the involvement of various regulatory agencies and strategic interventions that extend beyond the geographical boundaries of the indigenous lands themselves. Therefore, the following policy actions are recommended:
- Establish a permanent, multi-agency task force led by the President’s Chief of Staff (Casa Civil) to develop and implement a comprehensive, five-year strategic plan. This plan should focus on dismantling the external economic and logistical networks that sustain illegal mining, thereby preventing the return of invaders post-removal. The unique convening power of the Casa Civil is essential for orchestrating the necessary collaboration across different government ministries and agencies, ensuring a unified and effective national effort.
- Promote integrated enforcement actions in the areas surrounding the territories to achieve the logistical strangulation of illegal operations. This should involve regulatory agencies alongside environmental enforcement and command-and-control bodies, such as the National Civil Aviation Agency – ANAC (for airfield inspections), the National Petroleum Agency – ANP (for fuel station inspections), and the National Land Transport Agency – ANTT (for road and highway inspections).
- Strengthen agencies responsible for enforcement (IBAMA, ICMBio, and FUNAI) to ensure they have the capacity to operate regularly within the territories highlighted, by meeting their budgetary and personnel requirements.
- Promote the implementation of long-term Protection Plans, guaranteeing a budget for the maintenance of regular enforcement and crime repression actions.
(ii) Community-based monitoring and restoration:
The promotion and strengthening of indigenous surveillance group initiatives for territory monitoring and restoration can complement government-led efforts. An additional benefit of these actions is that they represent sustainable economic alternatives within the territories and thus reduce the vulnerability of youth to recruitment by illegal groups. To this effect, the following actions could be undertaken:
- Support the construction and maintenance of “Surveillance Centers” at strategic points (river confluences, TI boundaries), managed by the communities to ensure the physical occupation of remote areas, that produce relevant information for more effective State action.
- Develop and implement Payment for Environmental Services (PES) schemes for community agents, recognizing territorial surveillance as essential work for biome conservation.
- Strengthen governance actions within the territories by supporting meetings, assemblies, and forums, and promoting the development of management tools such as Territorial and Environmental Management Plans (PGTAs) and Consultation Protocols.
- Promote and finance environmental recovery and decontamination/remediation actions in the most affected areas, in addition to continuous monitoring of mercury levels in the population.
(iii) Traceability of the gold supply chain:
The Brazilian government has already taken some steps to improve the regulation of the gold supply chain and requires the formal registration of the main actors involved in the ASM gold supply chain (such as miners, traders, and exporters). In 2023, it implemented the Electronic Fiscal Invoice for Gold (NF-e ouro), a mandatory document that verifies and records the origin of the mineral.
Nevertheless, additional measures are still necessary to continue to improve gold traceability mechanisms and implement better legislation for the control of mineral production and trade, such as the creation of a digital public portal containing mining titles, licenses, embargoes, and monitored areas, allowing buyers to verify the mining site linked to the Gold NF-e. This would significantly improve traceability for companies and purchasers importing gold from Brazil, thereby promoting a more transparent supply chain.
*Notes
1. Methodology of monitoring systems
For Sirad X monitoring, radar images from the Sentinel-1 satellite are used, which are processed by a series of algorithms on the Google Earth Engine (GEE) platform, along with optical images from the Landsat-9 satellite (OLI-2 sensor) and Sentinel-2 satellite (MSI sensor). A team of analysts examines the monitored area, visually searching for anomalies in the produced images. Each deforestation polygon is evaluated based on its proximity to other areas of degradation and the history of the region, and, if necessary, people familiar with the location are contacted to confirm the deforestation. Field knowledge is fundamental for data validation.
For Amazon Mining Watch, the mine detector is an artificial neural network, which we train to discriminate mines from other terrain by feeding it hand-labeled examples of mines and other key features as they appear in Sentinel-2 satellite imagery. The network operates on square patches of data extracted from the Sentinel-2 L1C data product. Each pixel in the patch captures the light reflected from Earth’s surface in twelve bands of visible and infrared light. We average (median composite) the Sentinel data across a period of many months to reduce the presence of clouds, cloud shadow, and other transitory effects.During run time, the network assesses each patch for signs of recent mining activity, and then the region of interest is shifted by half a patch width for the network to make a subsequent assessment. This process proceeds across the entire region of interest.
2. Mining on Indigenous lands.
 Per the Brazilian Constitution, the concession of “lavra garimpeira” or exploitation permit for artisanal mining is irregular within indigenous territories. (Molina, Luísa Pontes, 2023. Terra rasgada: como avança o garimpo na Amazônia brasileira. Instituto Socioambiental).
In this specific case, the concession, awarded in 1981, predates the approval of the Indigenous Territory Kuruaya in 2001. Following the approval, the concession holder (the firm Brasinor) also submitted a number of concessions for exploration within the territory, which appear to have been rejected. However, a protocol related to the previously active concession was approved by the National Mining Agency on January 30, 2026. The legality of this act, as well as of the concession itself, should be investigated.
A well-established principle in Brazilian law is that Indigenous land rights are effective prior to their formal recognition, thus the fact that the concession predates the approval of the territory is immaterial. If the ANM authorization is found irregular, the constitutional interdiction of mining within indigenous territories should prevail, and the concession be rescinded. A decision from federal courts in 2019 determined that the National Mining Agency must negate any request for exploration or exploitation within indigenous territories, even prior to their approval.
Acknowledgments
This report is part of a series focusing on gold mining in the Amazon, through a strategic collaboration between Amazon Conservation and regional partners, with support from the Gordon and Betty Moore Foundation. In this case, we thank our partner Instituto Socioambiental (ISA) for leading this report.
![]()
![]()
MAAP #235: AI-powered detection of Amazon gold mining deforestation in real-time

Screen shot from the updated Amazon Mining Watch site.
As gold prices continue to skyrocket and shatter historical records, small-scale, but widespread, gold mining activity also continues to be one of the major deforestation drivers across the Amazon.
In collaboration with its network of partners in the region, MAAP has produced many reports documenting the expansion of gold mining across the Amazon over the years, highlighting often previously undocumented cases (see archive).
Given the vastness of the Amazon, however, it has been a challenge to systematically detect all new mining fronts in real-time. Such a timely and comprehensive system is crucial to ensure that monitoring can be the basis for a swift and consistent enforcement response from authorities.
Since 2023, Amazon Conservation, in partnership with Earth Genome and the Pulitzer Center, has been developing an online dashboard known as Amazon Mining Watch (MAAP #226). This online tool automates the analysis of satellite imagery through machine learning to identify areas affected by mining across the entire Amazon, from 2018 to 2024.
In a major advance, we are glad to announce that Amazon Mining Watch (AMW) will now move to quarterly updates for this data, achieving systematic near-real-time detection of new artisanal gold mining fronts across the region.
Additional functionalities have been added to the AMW that will enhance the analysis related to illegal gold mining in the biome, namely: an analysis of the legality of mining sites, and an economic valuation of the social and environmental damage through the mining impacts calculator tool (see Annex).
FIRST QUARTERLY UPDATE REPORT: MINING EXPANSION ACROSS THE AMAZON
Here, we present our first quarterly update report based on this fresh data for quarters 2 and 3 of 2025 (April-September 2025). The following Base Map shows the locations of recent (Q3 of 2025) mining deforestation across the Amazon, in relation to the cumulative mining impact area previously detected.
Key findings from the first quarterly updates include:
- We confirm the recent expansion of gold mining in all nine countries of the Amazon (37,109 hectares in 2025).
- Brazil registered the largest recent mining expansion area (15,538 ha in 2025), followed by Peru (6,511 ha) and Guyana (4,942 ha).
In addition, Venezuela, Suriname, Ecuador, and Bolivia all had over 2,000 hectares of recent impact. - Guyana and Suriname have the largest area of mining-related deforestation relative to their size.
- The total area of gold mining expansion in the second quarter of 2025 represents over 19,000 hectares
- Mining expansion accelerated in the third quarter (July-Sept) of 2025, with over 17,000 hectares of forest lost to mining, almost twice the rate observed in the first half of the year.
- Despite experiencing relatively widespread river-based mining, Colombia is the only country in the region that had been so far mostly spared from the impacts of gold mining on land (also referred to as “alluvial mining”). The recent crossing of alluvial mining along the Rio Puré from Brazil into Colombia, further described below, could put an end to this exception and explains almost single-handedly the sharp uptick seen in the last quarter (+58%).
- In 2025, over 200 (222) protected areas and Indigenous territories experienced new mining activity, and therefore likely to represent illegal mining. The estimated mined area of these 2025 mining events is over 14,000 hectares (14,004 ha). Of this total, 56% occurred in protected areas, and 44% in Indigenous territories.

CASES OF RECENT GOLD MINING DEFORESTATION ACROSS THE AMAZON

Base Map. Amazon gold mining deforestation highlighted cases Data: AMW, ACA/MAAP.
The Base Map shows the locations of confirmed recent (Q3 of 2025) mining deforestation across the Amazon, in relation to the cumulative mining impact area.
In each set of panels displayed below, we show high-resolution satellite imagery before (left panel) vs after (right panel) the recent gold mining deforestation. The red polygons indicate the pixels highlighted by the AI model as a new quarter 3 mining deforestation event. Yellow polygons are previously detected pixels.
A. Rio Puré, Colombia-Brazil border
The Q3 2025 detection revealed that alluvial gold mining has, for the first time, crossed the border between Brazil and Colombia, into the Rio Puré National Park. A relatively large-scale operation appears to be ongoing and expanding in one of the most remote corners of the Amazon, affecting one of the largest intact forest landscapes still remaining globally.
Mining along the Rio Puré is estimated to have started around 2018, gradually expanding along the whole Brazilian portion of the river between the border with Colombia and where it meets the Japurá river, itself one of the major tributaries of the Amazon river. The clear difference in the river’s color between the last two quarters also reveals the amount of sediments released from the mining operation, which greatly increased water turbidity.
The verified expansion of the mining into the Colombian side, under National Park status, makes this a clear case for transboundary collaboration between the enforcement authorities of Brazil and Colombia. This incursion from Brazil represents the vast majority of mining-related deforestation in the country for the last quarter, and an almost 60% increase in area compared to the previous 7 years.
This case registers as a Very High probability of being illegal based on the legality layer. For more information, consult the scene on Amazon Mining Watch.

B. Northern Ecuador
Figure B shows the recent mining deforestation outside of the Cofán Bermejo Ecological Reserve in the northern Ecuadorian Amazon. This area has experienced increasing mining impact in recent years, as further described in MAAP #227. Note that this mining activity is within the Puma Kucha, Indigenous territory. This case registers as a High probability of being illegal based on the legality layer. For more information, consult the scene on Amazon Mining Watch.

C. San José de Karene Indigenous Territory, Peru
Figure C shows the recent mining deforestation in the San José de Karene Indigenous Territory in the southern Peruvian Amazon. As detailed in MAAP #208, much of the illegal mining deforestation in the southern Peruvian Amazon is occurring within the territory of Native Communities. This case registers as a High probability of being illegal based on the legality layer. For more information, consult the scene on Amazon Mining Watch.

D. Pemon Indigenous Territory, Venezuela
The Pemon Indigenous territory stands out as the area most affected by gold mining in the last quarter, across all protected areas and indigenous territories of the region. The Pemon’s traditional territory is divided between an officially demarcated area, where mining increased by more than 100 hectares in the last quarter, and a much greater and yet-to-be-demarcated area, where mining increased by a staggering 700 ha in the last quarter only, a steep acceleration from the first semester of 2025. The Pemon’s territory encompasses part of the outstanding geological wonder Mount Roraima, a flat-topped mountain of immense cultural significance to local peoples. Mount Roraima harbors unique biodiversity and inspired Michael Crichton’s novel “The Lost World”.
This case registers as a High probability of being illegal based on the legality layer. For more information, consult the scene on the Amazon Mining Watch.

Brazil
Figure E shows the recent mining deforestation in the Amapá State Forest in the northeastern Brazilian Amazon. The forest is managed to benefit local communities through initiatives like sustainable agroecology and improved management of wood and non-forest products. This marks the first time this area has been highlighted by MAAP. This case registers as a Very High probability of being illegal based on the legality layer. For more information, consult the scene on the Amazon Mining Watch.

Figure F shows the recent mining deforestation in the Tapajós Environmental Protection Area in the central Brazilian Amazon. It is in the western portion of the BR-163 Sustainable Forest District. As noted in MAAP #226, Tapajós EPA is one of the Amazon’s top ten most impacted protected areas (in terms of accumulated footprint), including high levels of new mining deforestation in 2024. This case registers as a Very High probability of being illegal based on the legality layer. For more information, consult the scene on the Amazon Mining Watch.

Figure G shows the recent mining deforestation in Jamanxim National Forest in the central Brazilian Amazon. As noted in MAAP #226, Jamanxim NF is one of the Amazon’s top ten most impacted protected areas (in terms of accumulated footprint). This case registers as a Very High probability of being illegal based on the legality layer. For more information, consult the scene on the Amazon Mining Watch.

Figure H shows the recent mining deforestation in the Grão-Pará Ecological Station in the northeast Brazilian Amazon, along the border with Guyana. It is the largest strictly protected tropical forest research station in the world. This marks the first time this area has been highlighted by MAAP. This case registers as a Very High probability of being illegal based on the legality layer. For more information, consult the scene on the Amazon Mining Watch.

Suriname
Figure I show recent mining deforestation in northeast Suriname. This marks the first time this specific area has been highlighted by MAAP. This case registers as a High probability of being illegal based on the legality layer. For more information, consult the scene on the Amazon Mining Watch.

Guyana
Figure J shows the recent mining deforestation in northwestern Guyana, near the border with Venezuela. This marks the first time this specific area has been highlighted by MAAP. For more information, consult the scene on the Amazon Mining Watch.

Annex
New functionality: Legality of mining sites
Based on an analysis of potential overlaps with land designations and applicable regulations, a location-based presumption of illegality of mining operations was incorporated into the AMW. We classified the presumption of illegality from very high to low, using the following descriptions:
- Very High: Activity is occurring without a permit and within a protected area that doesn’t allow for any kind of resource exploitation
- High: Activity if occurring outside of any explicit concession for doing so
- Medium: Activity is happening within a concession, but active status could not be verified and/or concession doesn’t meet legal requirements
- Low: Activity is happening within active concession, but compliance with all requirements could not be verified
This functionality is available for 5 countries: Bolivia, Brazil, Colombia, Ecuador and Peru, and will be extended to the rest of Amazonian countries in 2026. Based on national datasets of land designations, it provides an immediate overview of the likelihood of illegality of ASM in any area of analysis.
New functionality: Mining impacts calculator
The Mining Impacts Calculator, developed by Conservation Strategy Fund, is a tool to assess the social and environmental damage caused by gold mining. The tool uses an economic formula to estimate effects on the environment and society by inputting variables such as the size of the mine, the amount of gold produced and the time of extraction. The automated formula uses average mining productivity and data-driven impact parameters to deliver contextualized data to the user.
The calculator can be used for three main purposes: to estimate social and environmental damage values to calculate the amount of financial compensation needed to mitigate the costs, to estimate the most efficient investment amounts for future impact planning and the prevention of negative impacts, and to estimate the recommended amount of investment in mercury-free technologies needed.
Notes/Methodology
Note that in this report, we focus on mining activity that causes deforestation. The vast majority is artisanal or small-scale gold mining, but other mining activities have also been detected, such as iron, aluminum, and nickel mines in Brazil and Colombia. Additional critical gold mining areas in rivers that are not yet causing deforestation (such as in northern Peru (MAAP #233), southeast Colombia (MAAP #228), and northwest Brazil (MAAP #197), are not included in this report. This information is not yet displayed in Amazon Mining Watch, but future updates will include river-based mining hotspots.
Our data source for protected areas and Indigenous territories is from RAISG (Amazon Network of Georeferenced Socio-Environmental Information), a consortium of civil society organizations in the Amazon countries. This source (accessed in December 2024) contains spatial data for 5,943 protected areas and Indigenous territories, covering 414.9 million hectares across the Amazon.
Amazon Mining Watch (AMW) is a partnership between Earth Genome, the Pulitzer Center’s Rainforest Investigations Network, and Amazon Conservation. The algorithm is based on 10-meter-resolution imagery from the European Space Agency’s Sentinel-2 satellite and produces 480-meter resolution pixelated mining deforestation alerts. Although the data is not designed for precise area measurements, it can be used to give timely estimates needed for management and conservation purposes.
Acknowledgments
This report was made possible by the generous support of the Gordon and Betty Moore Foundation.
![]()
MAAP #232: The Amazon Tipping Point – Importance of Flying Rivers Connecting the Amazon
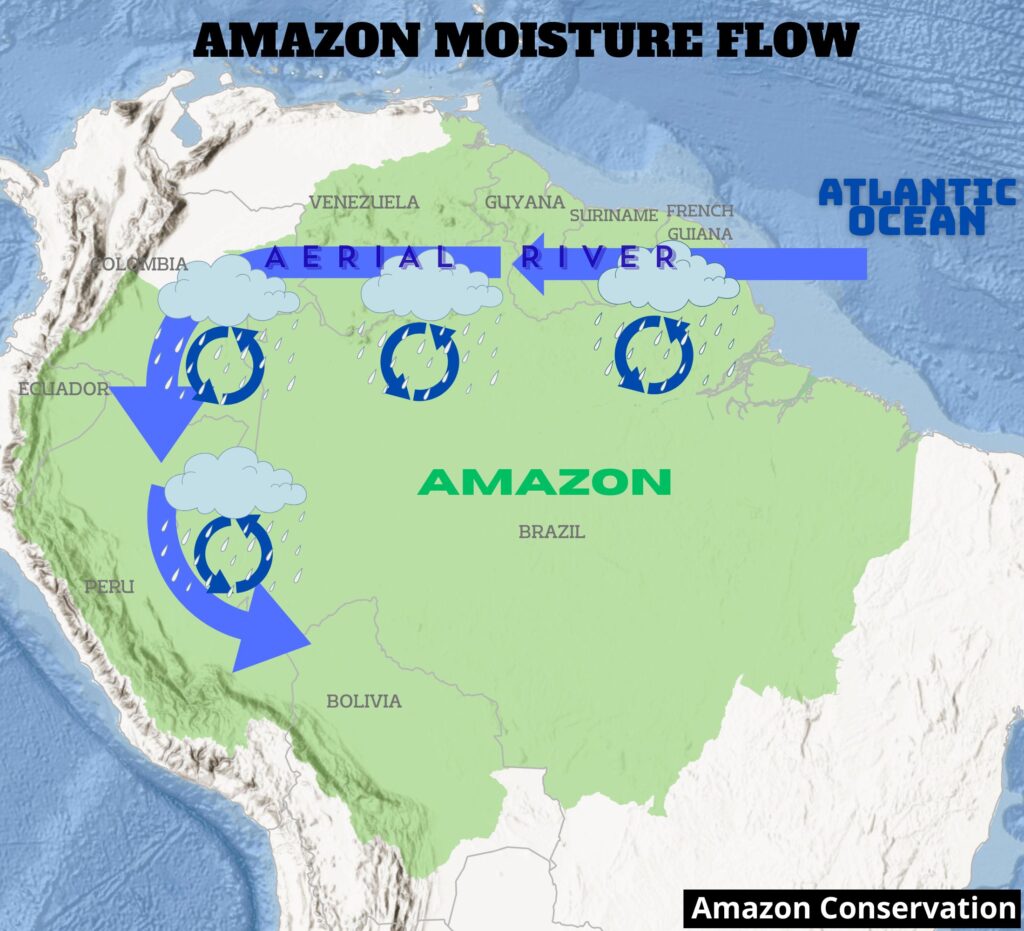
Intro Map. Amazon moisture flow (aerial river) for the southwest Amazon. Source: Amazon Conservation/MAAP
The Amazon biome, stretching over a vast area across nine countries in northern South America, is renowned for its extreme diversity (biological and cultural) and its abundant water resources. Indeed, the major features of the Amazon are linked by interconnected water flows, both on land and in the air (Beveridge et al. 2024).
The natural phenomenon of aerial moisture transport and recycling, also known as “aerial rivers” and popularized in the press as “flying rivers,” has emerged as an essential concept related to the conservation of the Amazon. In short, moisture flows from the Atlantic Ocean across the Amazon, uniquely facilitated by the rainforest itself. As they move westward, these flying rivers drop water onto the forest below. The forest subsequently transpires moisture back into them, thus recycling water and supporting rainforest ecosystems far from the Ocean source. For example, the Intro Map illustrates the aerial river for the southwest Amazon.
Continued deforestation and forest degradation, however, will disrupt and diminish the critical east-to-west aerial water flow, inducing a “tipping point” of impacted regions that would transition from rainforest to drier savannah ecosystems.
In this report, we aim to both summarize the current state of knowledge on the movement of atmospheric moisture across the Amazon and develop novel analyses based on this information. Overall, we aim to show the critical connections between the eastern and western Amazon, and how these connections change during the major seasons (wet, dry, and transition) of the year.
Our analysis is divided into three main parts:
First, we summarize the state of knowledge on the movement of atmospheric moisture across the Amazon, drawing on a review of recent literature and exchanges with experts. Second, we identify the sensitive areas that are the most vulnerable to deforestation-caused disruption of moisture recycling. Third, we relate these sensitive areas in the west to their respective eastern key source areas for moisture for each of the three Amazonian seasons: wet, dry, and transition.
In summary, we identified the sensitive areas that are the most vulnerable to deforestation-caused disruption of moisture recycling from the Atlantic Ocean source are mostly located in the southwestern Amazon (Peru and Bolivia). For the wet season, much of the moisture flow to these sensitive areas crosses the continuous primary (non-deforested) forests of the northern Amazon. For the dry and transition seasons, however, the moisture flow to the sensitive areas must cross several major deforestation fronts located in the eastern Brazilian Amazon.
Thus, an important contribution of this work is to reveal that, contrary to the common perception that the tipping point is a single Amazon-wide event, certain parts of the Amazon are more vulnerable than others. Most notably, the southwestern Amazon (Peru and Bolivia) is most vulnerable to a possible tipping point, particularly stressed by disrupted dry season moisture flows over major deforestation fronts.
1. Movement of aerial moisture across the Amazon (moisture flow)
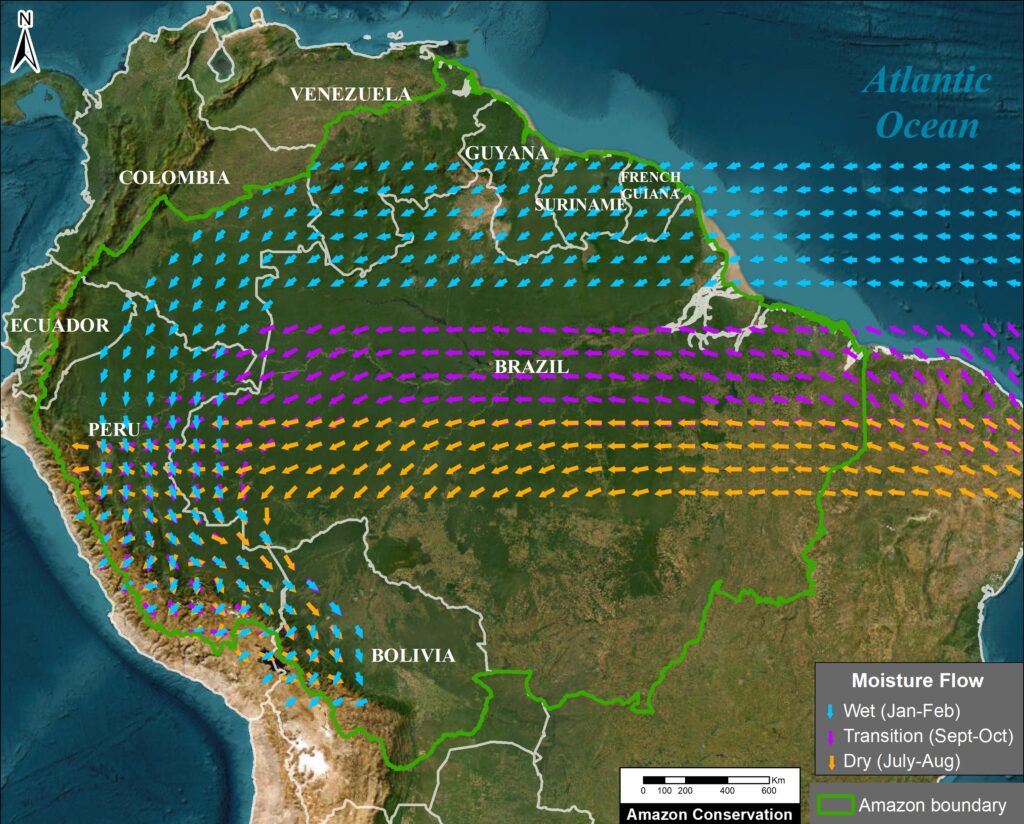
Figure 1. Amazon moisture flows by season for the SW Amazon. Data: ERA5, ACA/MAAP
Driven by permanent trade winds, aerial (atmospheric) moisture flows westward from its source in the Atlantic Ocean, across the Amazon lowlands, and toward the Andes Mountains. These moisture routes are recharged by evapotranspiration and discharged by precipitation, creating moisture recycling systems (Beveridge 2024, Weng et al. 2018, Staal 2018, Weng 2019). Evaporation recycling reloads atmospheric moisture after rainfall, while precipitation recycling removes this moisture. The Amazon forest is therefore a key component of a giant water pump, starting with water transported from the tropical Atlantic Ocean and helping push it westward (Zemp 2017, Boers 2017). Aerial rivers are the long-term and large-scale preferential pathways of the moisture flows driving this pump (Arraut et al. 2012) (see Intro Image). Thus, aerial rivers are the overall average (coarse-scale) moisture flow pattern, while moisture recycling focuses more on the seasonal differences (finer-scale).
Of all the rainfall in the Amazon, its trees have directly transpired 20% of it (Staal et al. 2018). Half of this precipitation (10%) is from moisture from one recycling event, and the other half (10%) is from multiple recycling events. This latter process of cascading precipitation, or cascading moisture recycling (Zemp et al. 2014), may happen multiple times (up to five or six), recycling water from the eastern to western Amazon, to areas increasingly distant from the Atlantic Ocean source (Lovejoy and Nobre 2019, Beveridge et al, 2024). Precipitation tends to increase exponentially as moist air travels over forests, but then drops off sharply once it moves beyond them, showing just how vital forests are in sustaining rainfall across large regions (Molina et al. 2019). Transpiration-driven moisture recycling is especially important during the dry season (Staal et al. 2018, Nehemy et al. 2025).
Thus, there are transboundary implications, as actions occurring in an eastern country can have an impact on a western country downwind of the moisture cascade. For example, deforestation in eastern Brazil can negatively impact moisture flow going to Colombia, Ecuador, Peru, and Bolivia, including the tropical Andean mountains (Ruiz-Vasquez et al., 2020; Sierra et al. 2022, Flores et al 2024). As moisture recycling also continues beyond the boundaries of the Amazon, there may also be impacts to agricultural areas in southern Brazil, Paraguay, northern Argentina, and northern Colombia (Martinez and Dominguez 2014; Ruiz-Vasquez et al., 2020).
The resulting terrestrial flow of water from the Andes mountains through the Amazon lowlands and back to the Atlantic Ocean as runoff and flow of the Amazon river and its tributaries results in the emerging concept known as the “Andes–Amazon– Atlantic” (AAA) pathway (Beveridge et al, 2024).
Importantly, the moisture flows change seasonally in the Amazon. Figure 1 illustrates these seasonal changes for the southwest Amazon, as an example.
In the rainy season (January–February), the moisture flow is both westward and southward, creating a giant arc (Arraut 2012). Thus, the continental moisture source is the northeast Amazon (Boers 2017, Weng et al. 2018, Sierra et al. 2022).
In the dry (July–August) and the dry-to-wet transition (September-October) seasons, the moisture flow shifts more directly westward (Arraut 2012, Staal et al, 2018). Therefore, the continental moisture source is the southeast Amazon, and some studies have identified this region as the most important for maintaining overall Amazonian resilience (Zemp et al. 2017, Staal et al. 2018).
There is increasing evidence that future deforestation will reduce rainfall downwind – further west – of the moisture recycling networks, inducing a “tipping point” of impacted regions that would transition from rainforest to savannah ecosystems (Boers 2017, Staal 2018, Lovejoy & Nobre 2018). This has led to calls for forest protection strategies to maintain the cascading moisture recycling system fueling the pathway (Zemp 2017, Encalada et al. 2021). A recent review indicates limited evidence for a single, system-wide tipping point; instead, specific areas of the Amazon may be more vulnerable (Brando et al, 2025).
Scientists are already documenting impacts linked to increasing forest loss. Several recent studies have found that Amazon deforestation has already caused a significant decrease in precipitation in the southeast Amazon, particularly during the dry season (Qin et al, 2025, Liu et al, 2025, Franco et al. 2025). Moreover, deforestation reduces rainfall upwind of the cleared areas, impacting the western Amazon as well (Qin et al, 2025). In addition, recent studies have shown that Amazon deforestation delays the onset of the wet season in southern Amazonia (Ruiz-Vasquez et al., 2020; Commar et al., 2023; Sierra et al., 2023).
Related to deforestation, additional climatic factors, such as increased temperature and the length of the dry season, are also contributing to the tipping point (Flores et al. 2024). Multiple sources have reported on the lengthening of the dry season in southern and eastern Amazonia in recent decades, with the largest dry season observed in 2023-2024 during the major drought reported in Amazonia (Marengo el al 2024; Espinoza et al., 2024). As a result of these drier conditions, recent years have experienced record-breaking fire seasons, most notably during the El Niño years of 2016 and 2024 (Finer et al 2025). Notably, the predicted forest-to-savannah change is already happening in places experiencing increased wildfire frequency due to these hot and dry conditions (Flores et al. 2021).
2. Areas most dependent on moisture recycling in the Amazon (sensitive areas)
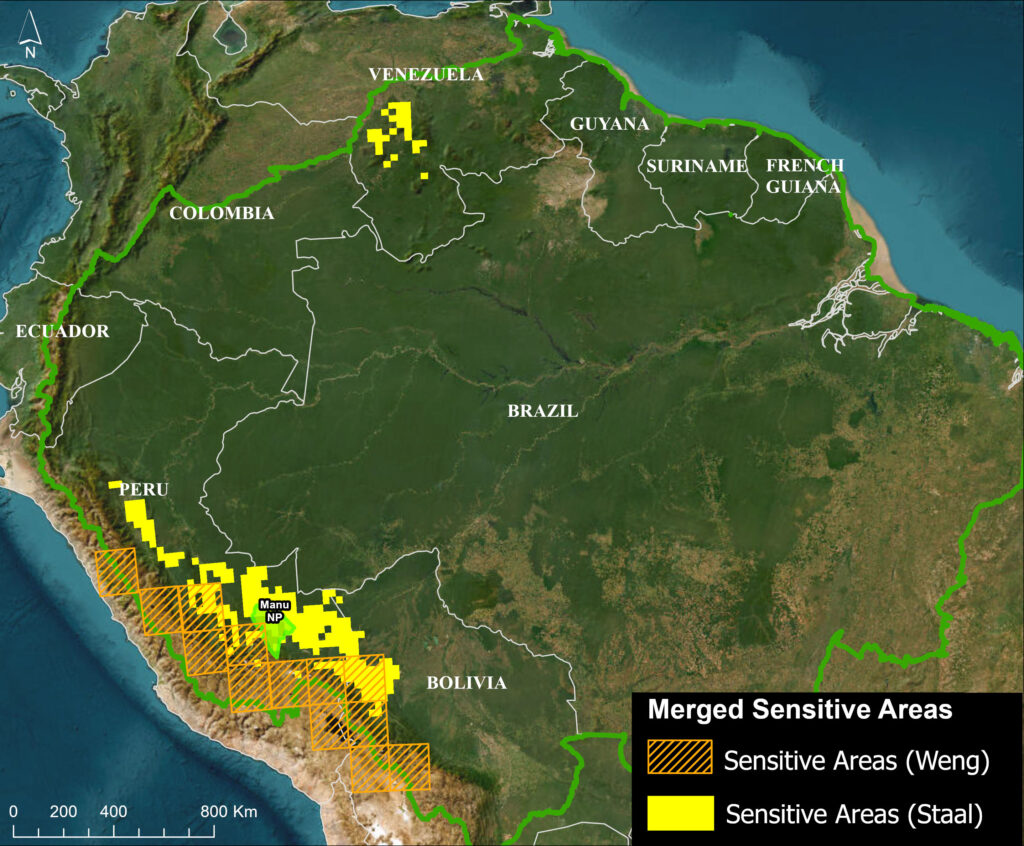
Figure 2. Merged sensitive areas. Data: Staal 2018, Weng 2018, Amazon Conservation/MAAP
A series of recent empirical and modeling studies indicate that the southwest Amazon (including the Peruvian and Bolivian ranges of the tropical Andes) is the major moisture sink – the area where precipitation is most dependent on moisture recycling (Boers et al. 2017, Zemp et al. 2017, Weng et al. 2018, Staal et al. 2018, Sierra et al. 2022). In fact, tree-transpired rainfall is greater than 70% in this region (Staal et al. 2018, Weng et al. 2018).
Given its dependence on transpiration-driven precipitation, the impact of a reduction in rainfall from cascading moisture recycling is predicted to be greatest in the southwest Amazon (Zemp et al. 2017, Weng et al. 2018, Staal 2018, Sierra et al. 2022, Beveridge 2024). Indeed, the southwest Amazon forest may enter the bioclimatic equilibrium of savannas following projected extensive Amazon deforestation scenarios (Zemp, 2017). Forests in the northwest and Guyana Shield are also relatively dependent on forest-rainfall cascades (Hoyos et al 2018; Staal et al. 2018).
To precisely identify the most vulnerable areas in the Amazon to disruptions of transpiration-based moisture recycling in a spatially explicit manner, we merged two key studies featuring spatially explicit model outputs (Weng 2018, Staal 2018). These studies cover data for the dry season (Staal 2018) and yearly (both dry and wet seasons) (Weng 2018).
Weng 2018 identifies “sensitive areas,” defined as areas having more than 50% of rainfall coming from Amazonian evapotranspiration (representing the 98th percentile of the highest sensitivity to Amazonian land use change). Staal 2018 estimates the effect of Amazon tree transpiration on Amazon forest resilience. We selected the areas with the highest resilience loss (0.8 and higher), quantified as the fraction of resilience that would be lost in the absence of tree transpiration by Amazonian trees.
Figure 2 illustrates the merged dataset, which we refer to as “merged sensitive areas.” Notably, both studies concur that the most vulnerable areas are located in the southwest Amazon, spanning the lowlands of only two of the nine countries of the Amazon Basin: Peru and Bolivia. This merged sensitive area covers a 1,750-kilometer-long swath along the Peruvian and Bolivian Andes. In this merged data map, we include Manu National Park as a reference point, located roughly in the middle of the sensitive areas.
Weng et al. identified higher elevation areas of the Andean-Amazon transition area in both Peru (Junín, Cusco, and Puno regions) and Bolivia, while Staal et al (2018) identified slightly lower elevation areas in this same range. These regions are consistent with predicted areas of higher rainfall reduction due to deforestation (Sierra et al. 2022). Also, note that Staal indicates an additional area in the Venezuelan Amazon.
Although, as noted above, forests in the northwest and northeast (Guyana Shield) are also relatively dependent on forest-rainfall cascades, the forests of the southwest are the most dependent, likely given their location at the far end of the Atlantic-Amazon-Andes pathway.
3. Moisture flows to sensitive areas (by season)
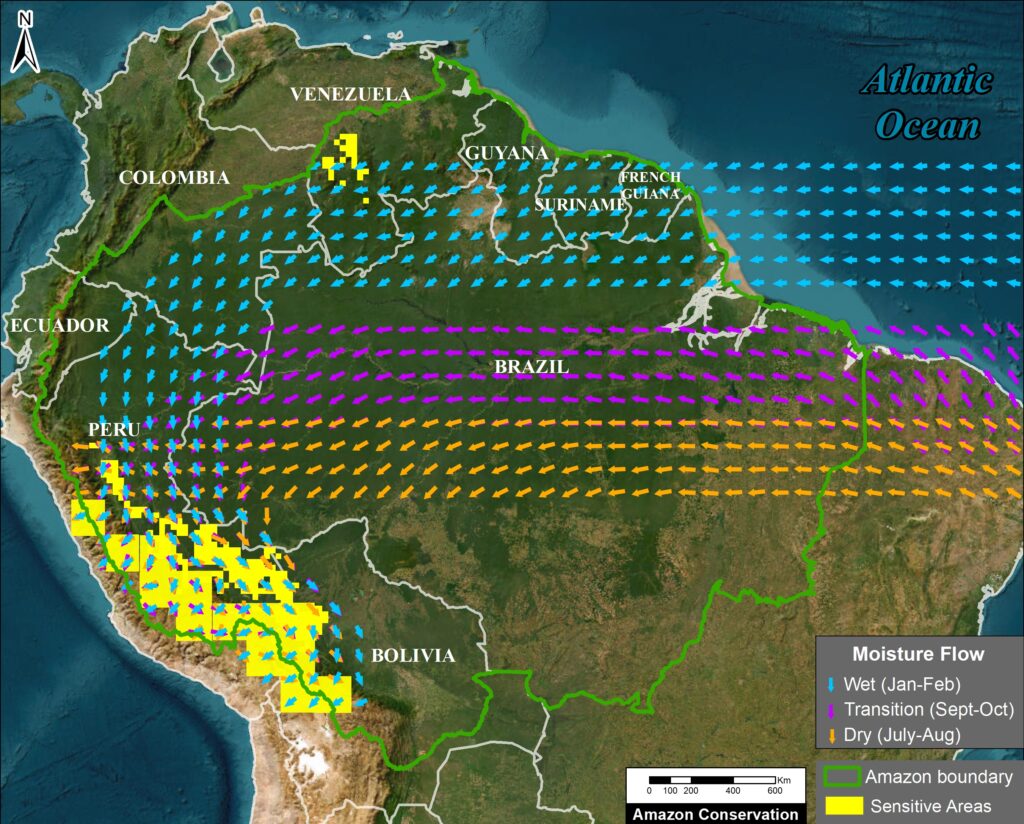
Figure 3. Amazon moisture flows by season relative to sensitive areas in the southwest Amazon. Data: ERA5, ACA/MAAP
Given the reliance of western, especially southwest, Amazon forests on cascading moisture recycling, a key challenge is to identify the most important moisture source areas in the eastern Amazon. In this respect, the literature provides a less definitive answer, likely because the moisture recycling routes change with seasons, in contrast to the long-term path of the aerial rivers that represent overall preferential pathways (Arraut 2012, Staal 2018, Weng et al. 2018).
We correlate the merged sensitive areas in the southwest Amazon with their respective moisture source areas by back-tracking the moisture flows upwind. This component of the work was inspired by the precipitation-shed concept, defined here as the terrestrial upwind surface areas providing evapotranspiration to a specific area’s precipitation (Keys et al. 2012, Weng et al. 2018).
We determined that analyzing all three major seasons is essential because of the major seasonal variability (Staal et al, 2018) and that each plays a key role in the stability of the rainforests: During the wet season, nearly 50% of total annual precipitation falls over the region, and these wet periods recharge Amazonian groundwater reserves vital for sustaining forest transpiration rates during dry months (Miguez-Macho and Fan 2012, Sierra et al 2022). During the dry season, moisture recycling processes are particularly important to ensure that some of the limited precipitation reaches the western Amazon (Beveridge et al, 2024). Tree-transpired rainfall then peaks during September to November, when large parts of the Amazon are at the end of the dry season and transitioning to the wet season (Zanin et al., 2024).
To map the pathway of moisture flow between the western Amazon merged sensitive areas and their eastern moisture sources, we utilize moisture flow data from the ERA5 reanalysis (Hersbach 2023). Specifically, we merged vertically integrated data for both northward and eastward water vapour flux. We chose data from 2022 as a recent year not heavily influenced by extreme weather events such as El Niño or drought (Espinoza et al., 2024). For 2022, we downloaded and analyzed the moisture flow data for three separate time periods: January-February (representing the wet or monsoon season), July-August (dry season), and September-October (dry-to-wet transition season).
The results for all three seasons are illustrated in Figure 3, where the arrows represent the ERA5 reanalysis moisture flow data from the Atlantic Ocean to the merged sensitive areas in the southwest Amazon.
Note that in the wet season (January-February), moisture flows from the Atlantic Ocean over the northeast Amazon (northern Brazil, French Guiana, Suriname, Guyana, and Venezuela) before taking a major southern turn (arc) through the southeast Colombian Amazon and northern Peru before reaching the Sensitive Areas. This general pattern is consistent with other studies focused on the wet season (Arraut 2012, Boers 2017, Sierra et al. 2022) and year-round (Weng et al. 2018).
In contrast, in the dry (July-August) and transition (September-October) seasons, the moisture flows from the Atlantic Ocean further south across the central Brazilian Amazon, and has a less pronounced arc near the border with Peru. Specifically, the dry season pattern is consistent with other studies focused on the dry season (Arraut 2012, Staal 2018, Zemp 2017 NC). Note that the transition season flow is located between the wet season to the north and the dry season to the south.
For all three seasons, we emphasize that the entire trajectory from east to west is important for conservation regarding cascading moisture recycling. That is, the farthest away areas in the east represent the full cascading trajectory, while the closest areas in the west exert the strongest direct influence (Weng et al. 2018).
While moisture recycling covers a vast area from east to west, much of the tree-induced rainfall in the southwest Amazon is transpired nearby (Stall 2018). That is, areas exerting the strongest and most efficient influence on the southwest Amazon are located just upwind, in the central-west Amazon (Weng 2018; Wongchuig et al., 2023). In sum, extensive forest loss anywhere along the cascading moisture pathway from the eastern to the western Amazon, far or near, may affect transpiration-based precipitation in the western Amazon, adding to its sensitivity.
The overall annual pattern, accounting for all three seasons, could then be described as aerial rivers. As indicated by Weng et al. (2018), this mostly matches the pattern of the wet season.
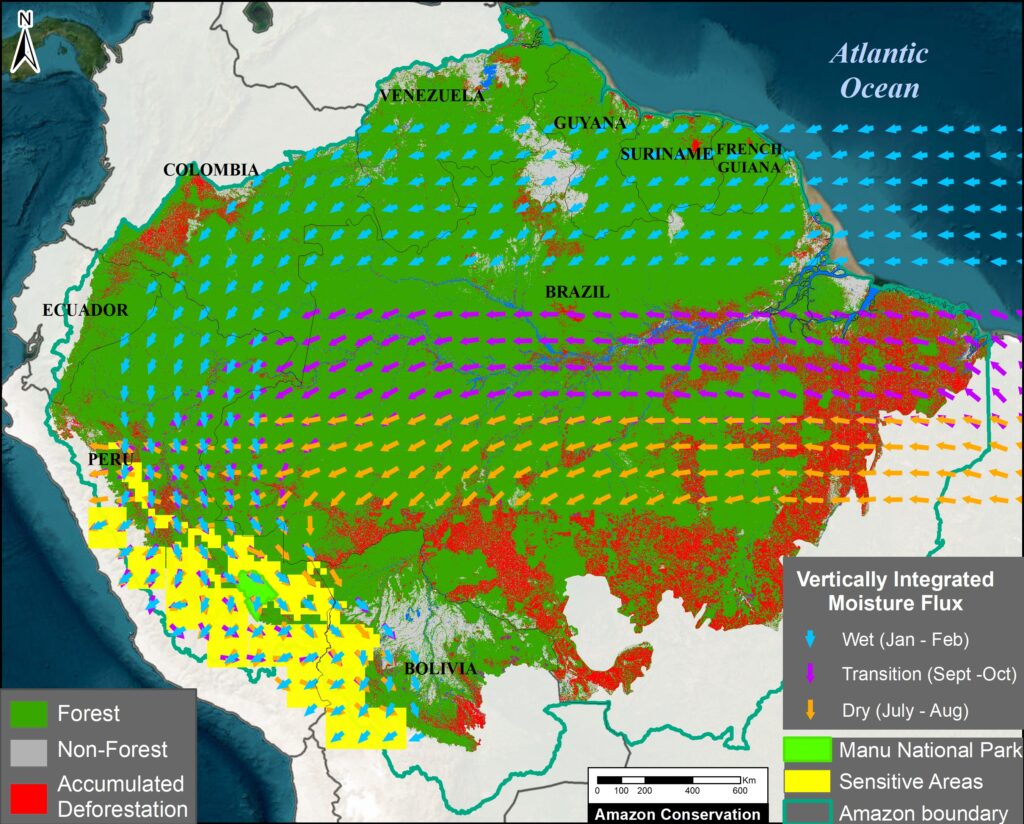
Figure 4. As in Figure 3, plus forest cover. Data: ERA5, Amazon Conservation/MAAP
For additional context, Figure 4 incorporates current land classification broken down into three major categories based on satellite imagery analysis: Forest, Non-forest (such as savannah), and accumulated Deforestation areas (as of 2022).
For January-February (wet season), note that much of the moisture flow crosses the continuous primary forest of the northern Amazon. That is, the moisture crosses predominantly non-deforested areas of northern Brazil, French Guiana, Suriname, Guyana, Venezuela, southeast Colombia, and northern Peru.
In contrast, the moisture flows for July-August (dry season) and September-October (transition season) cross several major deforestation fronts in the central Amazon, particularly during the dry season.
During the critical dry-to-wet transition season, the role of the local area’s tree evapotranspiration is especially important. The southern Amazon presents lower overall evapotranspiration values (Fassoni-Andrade 2021; Zanin et al., 2024). Due to the greater access of forest roots to deep soil water, however, evapotranspiration over forested areas is higher than croplands/grasslands during this time (von Randow et al. 2004). Since, during this transition season, the moisture transport to the southwestern Amazon passes over large deforested areas, the conservation of the remaining forest along this pathway is critical.
In addition, recent studies show that the main patterns of moisture flux can be altered at a continental scale due to deforestation (Commar et al., 2023; Sierra et al., 2023). As a result, reduced moisture transport from the Atlantic to the continent and delays in the onset of the wet season may occur in the future due to Amazon deforestation and climate change (Agudelo et al., 2023).
Conclusion
Above, in this initial technical report, we merged three key points that are critical to understanding the tipping point concept in the Amazon.
First, we presented an overview of aerial moisture flows originating from the Atlantic Ocean and then moving and recycling from the eastern to the western Amazon. Second, we identified the “sensitive areas” that are the most vulnerable to deforestation-caused disruption of moisture recycling, mostly located in the western Amazon (Peru and Bolivia). Third, we relate these sensitive areas in the west to their respective eastern key source areas for moisture for each of the three Amazonian seasons: wet, dry, and transition.
Incorporating updated land-use data, we found important differences by season. For the wet season, much of the moisture flow crosses the continuous primary (non-deforested) forests of the northern Amazon. For the dry and transition seasons, however, the moisture flow must cross several major deforestation fronts mainly located in the central Amazon.
Thus, an important contribution of this work is to reveal that, contrary to the common perception that the tipping point is a single Amazon-wide event, certain parts of the Amazon are more vulnerable than others. Most notably, the southwestern Amazon (Peru and Bolivia) is most vulnerable to a possible tipping point, particularly stressed by disrupted dry season moisture flows over major deforestation fronts.
We will soon build off of these results in an upcoming policy-focused report that presents the major implications of the maintenance of aerial moisture flows for conservation. This analysis will include how to identify key conservation areas for each season based on the key concept of maintaining cascading moisture flow to the sensitive areas, in relation to protected areas, Indigenous territories, and major road networks. It will also reveal several policy implications that require urgent attention and new approaches to national governance and international cooperation. For example, It considers the implications of planned roads (most notably BR-319) and fortifying existing conservation areas and creating new ones in undesignated public lands.
Acknowledgements
This work was supported by the Leo Model Foundation.
We thank the following colleagues for datasets and/or comments on earlier versions of the report:
Wei Weng
Potsdam Institute for Climate Impact Research
Potsdam, Germany
Arie Staal
Assistant Professor
Environmental Sciences
Copernicus Institute of Sustainable Development
Utrecht University
Juan Pablo Sierra
Institut des Géosciences de l’Environnement,
Université Grenoble Alpes, IRD, CNRS,
Grenoble, France
Jhan-Carlo Espinoza
Directeur de Recherche, Institut de Recherche pour le Developpement (IRD)
IGE Univ. Grenoble Alpes, IRD, CNRS (UMR 5001 / UR 252) – France
Pontificia Universidad Católica del Perú. Lima – Peru
Co-chair of ANDEX: A regional Hydroclimate Initiative for the Andes – GEWEX
Coordinator of the AMANECER Project (Amazon-Andes Connectivity)
Clara Zemp
University of Neuchâtel
Corine Vriesendorp
Director of Science
Conservación Amazónica – Peru (ACCA)
Federico E. Viscarra
Science Officer
Science Panel for the Amazon
Daniel Larrea
Director of the Science & Technology Program
Conservación Amazónica – Bolivia (ACEAA)
Citation
Finer M, Ariñez A, Sierra JP, Espinoza JC,, Weng W, Vriesendorp C, Bodin B, Beavers J (2025) The Amazon Tipping Point – Importance of Flying Rivers Connecting the Amazon. MAAP: 232.
Literature Cited
Agudelo, J., Espinoza, J.C., Junquas, C., Arias, P. A., Sierra, J. P., Olmo, M. E (2023) Future projections of low-level atmospheric circulation patterns over South Tropical South America: Impacts on precipitation and Amazon dry season length. Journal of Geophysical Research: Atmospheres.
Beveridge et al (2024) The Andes–Amazon–Atlantic pathway: A foundational hydroclimate system for social–ecological system sustainability. PNAS 121 (22) e2306229121
Boers N, Marwan N, Barbosa HM, and Kurths J. (2017) A deforestation-induced tipping point for the South American monsoon system. Scientific reports, 7(1), 41489.
Brando PM, Barlow J, Macedo MN, Silvério DV, Ferreira JN, et al (2025) Tipping Points of Amazonian Forests: Beyond Myths and Toward Solutions. Annual Review of Environment and Resources. Vol. 50.
Commar, L.F.S., Abrahão, G.M., & Costa, M.H. (2023) A possible deforestation-induced synoptic-scale circulation that delays the rainy season onset in Amazonia. Environ. Res. Lett. 18, 044041.
Delphine Clara Zemp, Carl-Friedrich Schleussner, Henrique M. J. Barbosa, Marina Hirota, Vincent Montade, Gilvan Sampaio, Arie Staal, Lan Wang-Erlandsson & Anja Rammig (2017) Nat Comms 8: 14681
Encalada A.C., Adalberto L. Val, Simone Athayde, Jhan Carlo Espinoza, Marcia Macedo, Mirian Marmontel, Guido Miranda, Maria Tereza Fernandez Piedade, Tiago da Mota e Silva & Julia Arieira (2021) Conserving the Amazon’s freshwater ecosystems’ health and connectivity. SPA Policy Brief.
Espinoza JC., Jimenez J.C., Marengo J.A. Schongart J., Ronchail J., Lavado-Casimiro W. Ribeiro JVM (2024) The new record of drought and warmth in the Amazon in 2023 related to regional and global climatic features. Sci Rep 14, 8107.
Fassoni-Andrade, A. C., Fleischmann, A. S., Papa, F., Paiva, R. C. D. d., Wongchuig, S., Melack, J. M., et al. (2021). Amazon hydrology from space: Scientific advances and future challenges. Reviews of Geophysics, 59, e2020RG000728.
Finer M, Ariñez A, Mamani N, Cohen M, Santana A (2025) Amazon Deforestation & Fire Hotspots 2024. MAAP: 229.
Flores, B.M., Holmgren, M (2021) White-Sand Savannas Expand at the Core of the Amazon After Forest Wildfires. Ecosystems 24, 1624–1637.
Flores et al. (2024) Critical transitions in the Amazon forest system. Nature, 262 (555–564).
Franco et al. (2025) How climate change and deforestation interact in the transformation of the Amazon rainforest. Nature Communications 16:7944.
Hersbach, H., Bell, B., Berrisford, P., Biavati, G., Horányi, A., Muñoz Sabater, J., Nicolas, J., Peubey, C., Radu, R., Rozum, I., Schepers, D., Simmons, A., Soci, C., Dee, D., Thépaut, J-N. (2023): ERA5 hourly data on single levels from 1940 to present. Copernicus Climate Change Service (C3S) Climate Data Store (CDS).
Hoyos, F. Dominguez, J. Cañón-Barriga, J. A. Martínez, R. Nieto, L. Gimeno & P. A. Dirmeyer (2018) Moisture origin and transport processes in Colombia, northern South America. Climate Dynamics. Volume 50, pages 971–990
Josefina Moraes Arraut, Carlos Nobre, Henrique M. J. Barbosa, Guillermo Obregon, and José Marengo (2012) Aerial Rivers and Lakes: Looking at Large-Scale Moisture Transport and Its Relation to Amazonia and to Subtropical Rainfall in South America. Journal of Climate 25 (2):543-556.
Keys, P. W., Van Der Ent, R. J., Gordon, L. J., Hoff, H., Nikoli, R., and Savenije, H. H. G. (2012) Analyzing precipitation sheds to understand the vulnerability of rainfall dependent regions, Biogeosciences, 9, 733–746.
Lovejoy T. & Nobre C. (2018) Amazon tipping point. Science Advances, 4(2)
Lovejoy T.E., C. Nobre (2019) Amazon tipping point: Last chance for action. Sci. Adv. 5, eaba 2949.
Marengo, J. , Cunha, A. , Espinoza, J.C. , Fu, R. , Schöngart, J. , Jimenez, J. , Costa, M. , Ribeiro, J. , Wongchuig, S. and Zhao, S (2024) The Drought of Amazonia in 2023-2024. American Journal of Climate Change, 13, 567-597.
Martinez J.A. and Dominguez F. (2014) Sources of Atmospheric Moisture for the La Plata River Basin. 27 (17) 6737–6753.
Miguez-Macho G, Fan Y (2012) The role of groundwater in the Amazon water cycle: 1. Influence on seasonal streamflow, flooding and wetlands. J Geophys Res Atmos.
Molina, R. D., Salazar, J. F., Martínez, J. A., Villegas, J. C., & Arias, P. A. (2019). Forest-induced exponential growth of precipitation
along climatological wind streamlines over the Amazon. Journal of Geophysical Research: Atmospheres, 124, 2589–2599.
Nehemy MF et al. (2025) Embolism resistance supports the contribution of dry-season precipitation to transpiration in eastern Amazon forests. PNAS 122: 33.
Qin, Y., Wang, D., Ziegler, A.D. et al. (2025) Impact of Amazonian deforestation on precipitation reverses between seasons. Nature 639, 102–108.
Ruiz-Vásquez M. Arias PA., Martinez JA., Espinoza JC. (2020) Effects of Amazon basin deforestation on regional atmospheric circulation and water vapor transport towards tropical South America. Climate Dynamics.
Sierra, J.P., Junquas, C., Espinoza, J.C., Segura, H., Condom, T., Andrade, M., Molina-Carpio, J., Ticona, L., Mardoñez, V., Blacutt, L., Polcher, J., Rabatel, A., Sicart, J. E. (2022) Deforestation Impacts on Amazon-Andes Hydroclimatic Connectivity. Climate Dynamics.
Sierra, J.P., Espinoza, JC., Junquas, C. Wongchuig S., Polcher J., Moron V., Fita L., Arias PA., Schrapffer A., Pennel R. (2023) Impacts of land-surface heterogeneities and Amazonian deforestation on the wet season onset in southern Amazon. Clim Dyn.
Staal, A., Tuinenburg, O.A., Bosmans, J.H.C. et al. (2018) Forest-rainfall cascades buffer against drought across the Amazon. Nature Clim Change 8, 539–543.
von Randow C, Manzi AO, Kruijt B et al (2004) Comparative measurements and seasonal variations in energy and carbon exchange over forest and pasture in South West Amazonia. Theor Appl Climatol 78:5–26.
WCS (2023) High Integrity Forest Investment Initiative (HIFOR): The Science Basis
Weng W. (2019), Aerial river management for future water in the context of land use change in Amazonia
Weng, Wei, Matthias K. B. Luedeke, Delphine C. Zemp, Tobia Lakes, and Juergen P. Kropp. (2018) “Aerial and Surface Rivers: Downwind Impacts on Water Availability from Land Use Changes in Amazonia.” Hydrology and Earth System Sciences 22 (1): 911–27
Wongchuig S, Espinoza JC, Condom T, Junquas C, Sierra JP, Fita L, Sörensson A, Polcher J. 2023. Changes in the surface and atmospheric water budget due to projected Amazon deforestation: Lessons from a fully coupled model simulation, Journal of Hydrology, Volume 625.
Zanin PR, Pareja-Quispe D, Espinoza JC. (2024) Evapotranspiration in the Amazon Basin: Couplings, hydrological memory and water feedback. Agricultural and Forest Meteorology.
Zemp, D. C., C-F Schleussner, H. M. J. Barbosa, and A. Rammig. (2017) “Deforestation Effects on Amazon Forest Resilience.” Geophysical Research Letters 44 (12): 6182–90
Zemp, D. C., Schleussner, C.-F., Barbosa, H. M. J., van der Ent, R. J., Donges, J. F., Heinke, J., Sampaio, G., and Rammig, A.(2017) On the importance of cascading moisture recycling in South America, Atmos. Chem. Phys., 14, 13337–13359, https://doi.org/10.5194/acp-14-13337-2014, 2014.
MAAP #229: Amazon Deforestation & Fire Hotspots 2024
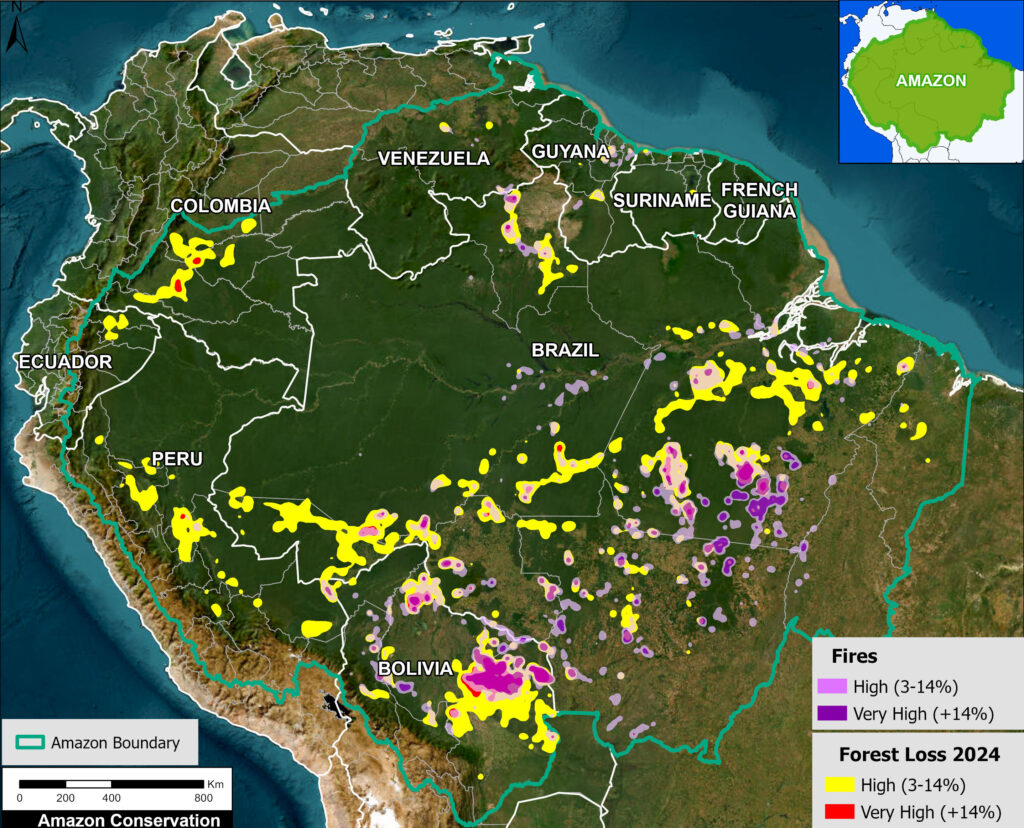
Base Map. Deforestation and fire hotspots across the Amazon in 2024. Data: UMD/GLAD, Amazon Conservation/MAAP.
Continuing our annual series, we present a detailed look at the major 2024 Amazon forest loss hotspots, based on the final annual data recently released by the University of Maryland and featured on Global Forest Watch. As in other reports of the series, we take this global dataset and analyze it for the Amazon specifically.
This forest loss dataset serves as a consistent source across all nine countries of the Amazon, distinguishing forest loss from fire and non-fire causes. We use the non-fire forest loss as a proxy for human-caused deforestation, although it also includes some natural loss (such as landslides and windstorms). Previous research has confirmed that nearly all Amazon fires are human-caused (MAAP #189).
With this context, we are able to present both estimated deforestation and fire hotspots across the Amazon (see Base Map and Graph 1).
In 2024, the deforestation was the fifth highest on record (since 2002), at over 1.7 million hectares (4.3 million acres) across the Amazon. This value represents a major increase (34%) from 2023, but a decrease (12%) from the recent peak in 2022 (1.98 million hectares). The majority of the deforestation occurred in Brazil (54.7%), followed by Bolivia (27.3%), Peru (8.1%), and Colombia (4.7%) as the clear top four in 2024.
The big story in 2024, however, was the record-breaking impact of fires on primary forests, with a total of 2.8 million hectares (6.9 million acres). This total shattered the previous record of 1.7 million hectares in 2016. The vast majority (95%) of this fire impact occurred in just two countries: Brazil and Bolivia, which both set annual fire records of their own (along with Peru, Guyana, Suriname, and French Guiana). Overall, this fire data may be interpreted as forest degradation, in contrast to the more permanent impacts of deforestation.
In terms of spatial patterns, the Base Map indicates that most of the intense forest loss hotspots were due to fire. These fire hotspots were especially concentrated in the soy and cattle frontiers of the southeast Brazilian Amazon and southeast Bolivian Amazon. The deforestation hotspots (without major associated fires) were largely due to agriculture and gold mining across the Amazon, notably in Bolivia, Brazil, Colombia, Ecuador, and Peru. See Annex 1 for the overall forest loss hotspots (without the specific fire loss data).
Previous research has revealed the tight link between deforestation and fires in the Amazon (MAAP #189). That is, many major fires are burning recently deforested areas, and sometimes escape into surrounding forests, especially with extended dry conditions.
In total, 4.5 million hectares (11.2 million acres) of primary forest were impacted by deforestation and fire combined. This total is the highest on record by far, surpassing 2016 (3.4 million hectares) by over a million hectares.
Since 2002, we estimate the deforestation of 33.7 million hectares (83.4 million acres) of primary forest, greater than the size of the state of New Mexico. An additional 10.6 million hectares (26.2 million acres) have been impacted by fires.
Below, we zoom in on the four countries with the highest deforestation (Brazil, Bolivia, Peru, and Colombia), plus additional highlights from around the Amazon (Guyana, Venezuela, and Ecuador).
Amazon Primary Forest Loss, 2002-2024
Graph 1 shows the historical trend of Amazonian primary forest loss, from 2022 to present.
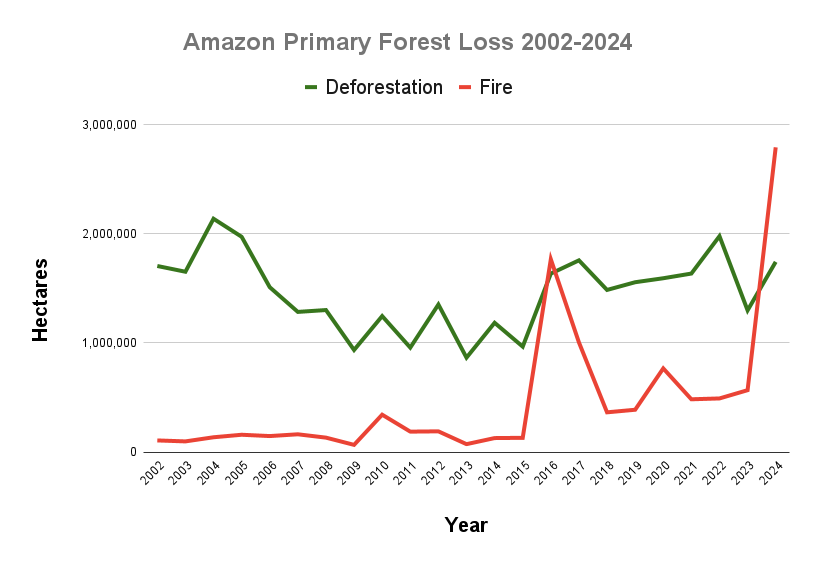
Graph 1. Amazon Forest Loss, 2002-24. Data: UMD/GLAD, Amazon Conservation/MAAP.
Amazon Primary Forest Loss (By Country), 2002-2024
Graph 2a shows 2024 Amazon primary forest loss for all nine countries. In Annex 2, Graph 2b removes Brazil and Bolivia to see the other countries in greater detail.
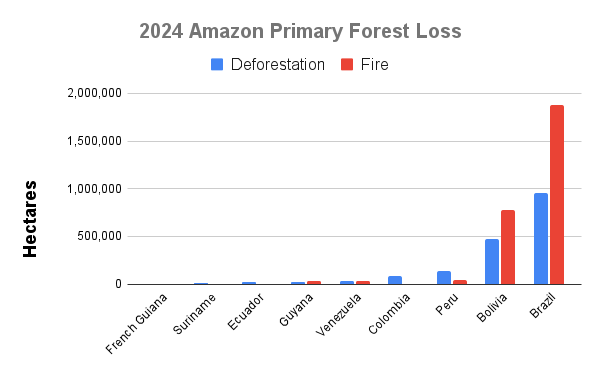
Graph 2a. Amazon primary forest loss for all nine countries. Data: UMD
Brazilian Amazon
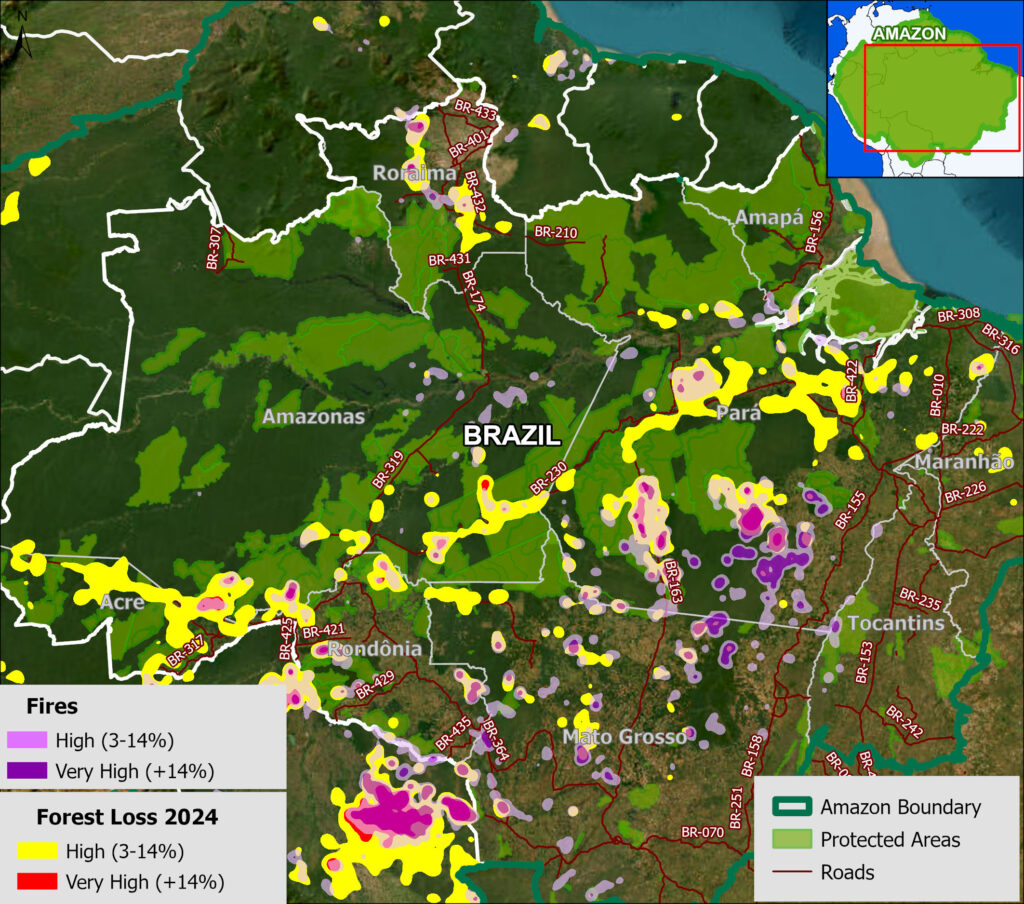
Figure 2. Deforestation and fire hotspots in the Brazilian Amazon. Data: UMD.
In 2024, the Brazilian Amazon lost 954,126 hectares (2.4 million acres) of primary forest to deforestation. Although this total marked a 13.6% increase from 2023, it was historically relatively low (16th highest overall since 2002).
The bigger story is that fires directly impacted an additional 1.9 million hectares (4.6 million acres). This fire impact was the highest on record, surpassing the previous high of 2016 (1.6 million hectares).
All of the most intense forest loss hotspots were characterized by intense fires. Many of these hotspots were concentrated in the southeast Brazilian Amazon (Figure 2). These areas include along the major north-south road in the state of Pará (BR-163), and further to the east of this road. The hotpots also expanded south into the soy frontier of Mato Grosso state.
Fire hotspots were also located in the northern state Roraima, and along the other major road networks, especially road BR-230 (Trans-Amazonian Highway) in the states of Pará and Amazonas, and road BR-364 in the state of Acre.
Previous research has revealed that over 70% of major fires in the Brazilian Amazon are burning recently deforested areas (MAAP #189). In extended dry conditions, such as 2016 and 2024, these major fires escape into surrounding forests.
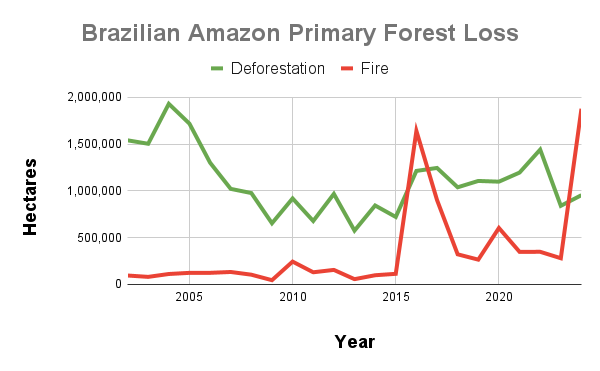
Graph 3. Deforestation and fire trends in the Brazilian Amazon. Data: UMD.
Bolivian Amazon
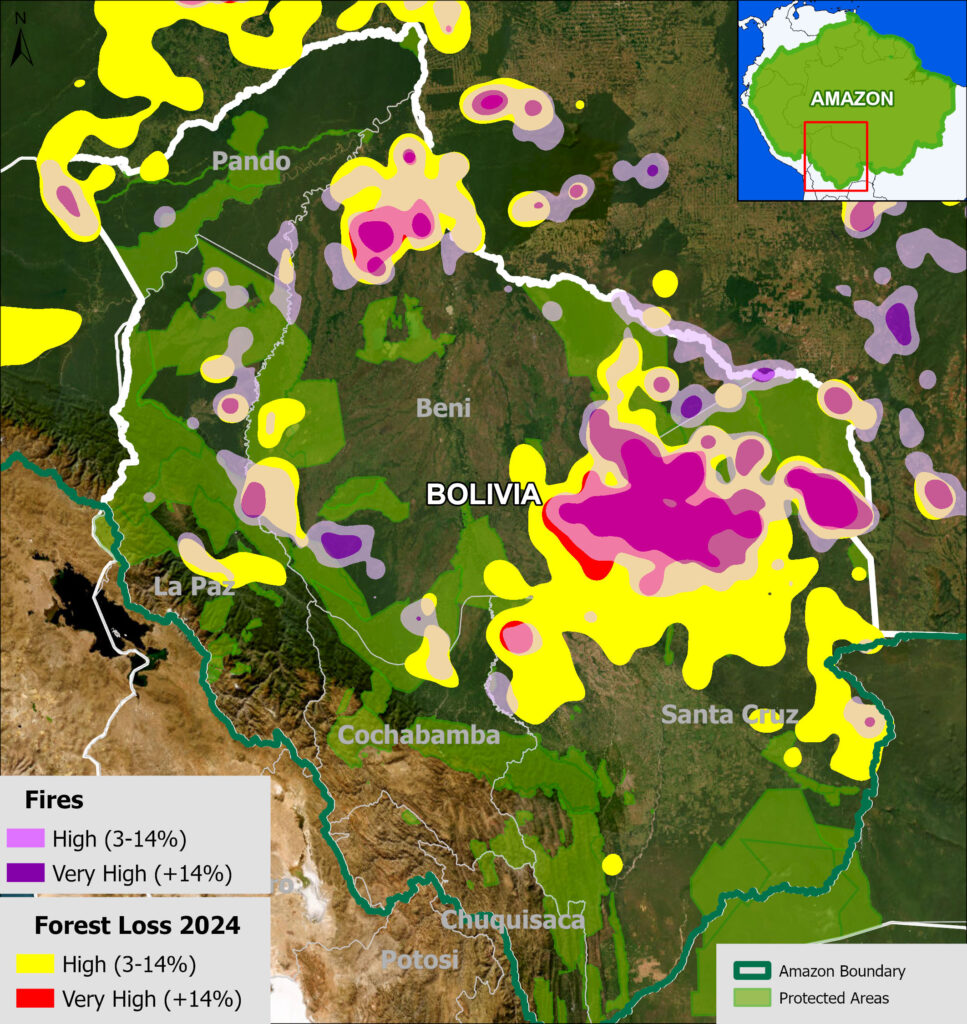
Figure 3. Deforestation and fire hotspots in the Bolivian Amazon. Data: UMD.
In 2024, the Bolivian Amazon lost 476,030 hectares (1.2 million acres) of primary forest to deforestation. This total was the highest on record, surpassing the previous high of 2022 (245,177 hectares).
In an even bigger shattering record, fires directly impacted an additional 779,960 hectares (1.9 million acres). This total crushed the previous record of 2023 (250,843 hectares).
Like Brazil, the most intense forest loss hotspots were characterized by intense fires.
These fires were concentrated in the soy frontier located in the southeastern department of Santa Cruz (Figure 3). We emphasize that this particular hotspot is further north than in previous years, indicating a northern expansion of soy plantations.
There was also a concentration of fire hotspots along the Beni and Pando departments’ border, and closer to the Andes Mountains in the departments of La Paz and Beni.
Deforestation hotspots (without fires) were concentrated in the soy frontier in the southeast.
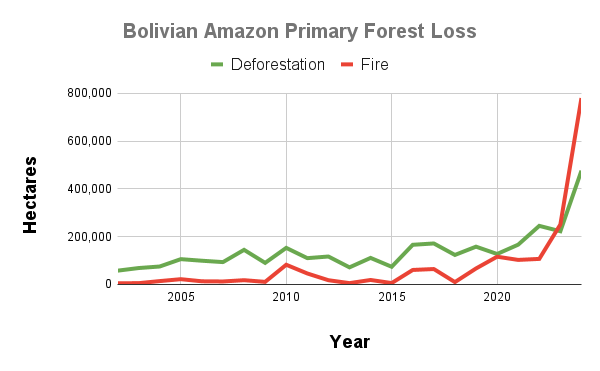
Graph 4. Deforestation and fire trends in the Bolivian Amazon. Data: UMD.
Peruvian Amazon
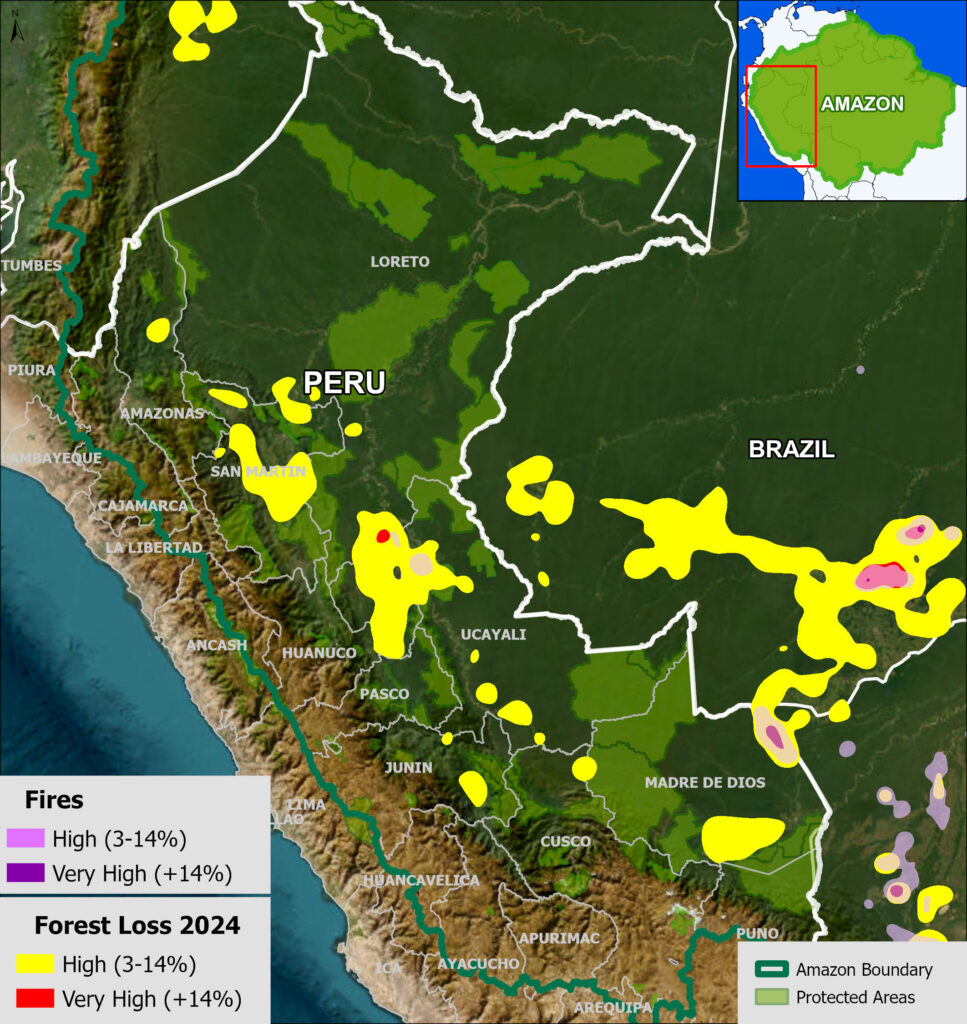
Figure 4. Deforestation and fire hotspots in the Peruvian Amazon. Data: UMD.
In 2024, the Peruvian Amazon lost 141,781 hectares (350,341 acres) of primary forest to deforestation. This total marks the 6th highest on record since 2002.
Breaking a record, fires impacted an additional 47,574 hectares (117,554 acres). This total more than doubled the previous high of 2023 (20,042 hectares). As noted above, this fire data may be interpreted as forest degradation, in contrast to the more permanent impacts of deforestation.
Like both Brazil and Bolivia, all of the most intense forest loss hotspots were characterized by intense fires. These fires were concentrated in the central and southeast Amazon (Ucayali and Madre de Dios regions, respectively) (Figure 4).
Deforestation hotspots were concentrated in the gold mining frontier in the southern Amazon and throughout the central Amazon. The very high hotspot in central Peru corresponds to the latest deforestation by Mennonite colonies (see MAAP #222 for context).
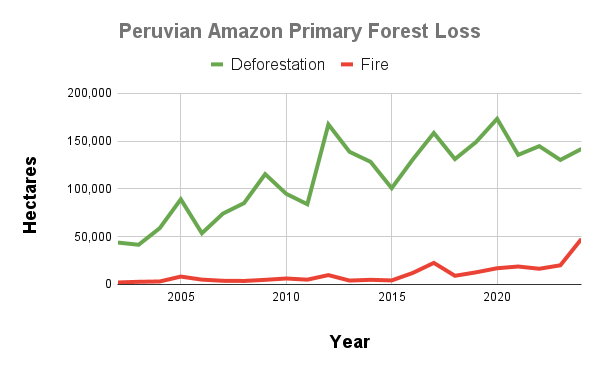
Graph 5. Deforestation and fire trends in the Peruvian Amazon. Data: UMD
Colombian Amazon
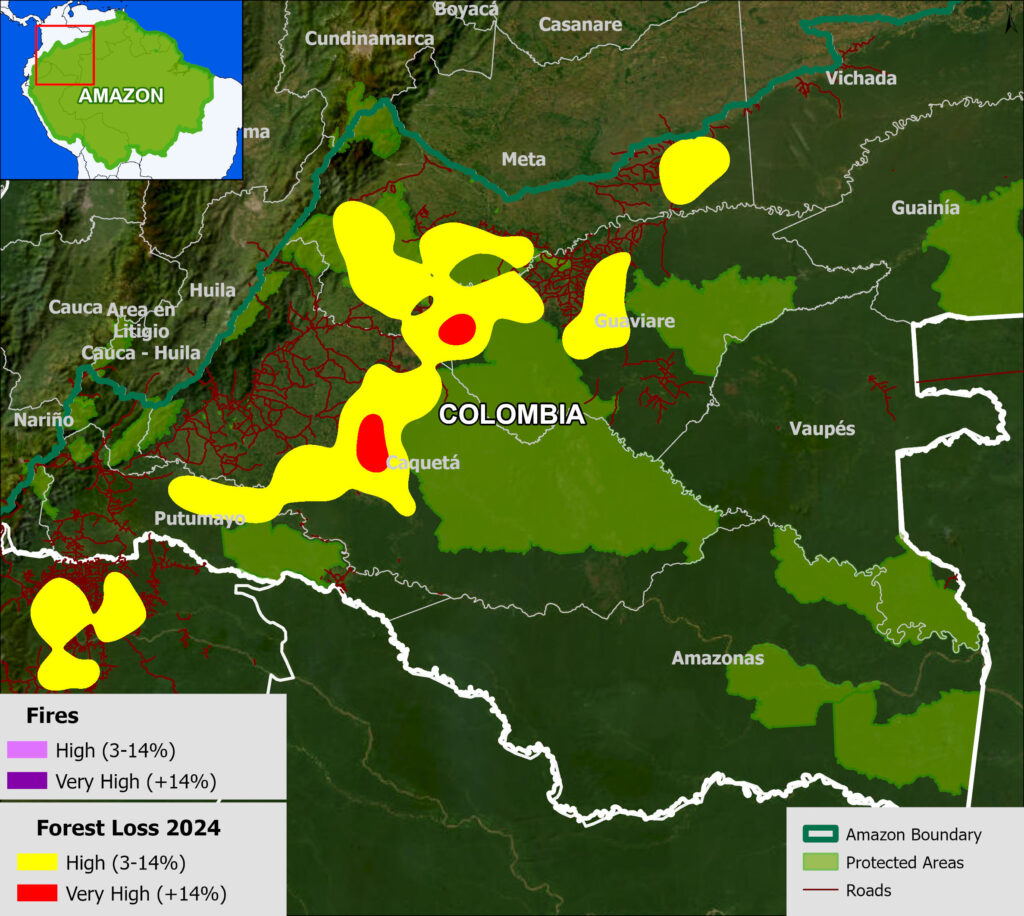
Figure 5. Deforestation and fire hotspots in the Colombian Amazon. Data: UMD.
In 2024, the Colombian Amazon lost 81,396 hectares (201,129 acres) of primary forest to deforestation. This total marked a striking 82.5% increase from the recent low recorded in 2023. It was the 7th highest on record, continuing the trend of elevated forest loss since the FARC peace agreement in 2016 (all top seven deforestation annual totals have occurred since 2016).
Major fires were less of an issue in the Colombian Amazon, but did directly impact an additional 5,184 hectares (8th highest on record).
As described in previous reports (see MAAP #120), Figure 5 shows that there continues to be an “arc of deforestation” in the northwest Colombian Amazon (Caqueta, Meta, Putumayo and Guaviare departments). Most notably, there is a pair of very high deforestation areas surrounding Chiribiquete National Park, and high deforestation areas within Tinigua and Macarena National Parks.
This arc impacts numerous Protected Areas (particularly Tinigua and Chiribiquete National Parks) and Indigenous Reserves (particularly Yari-Yaguara II and Nukak Maku).
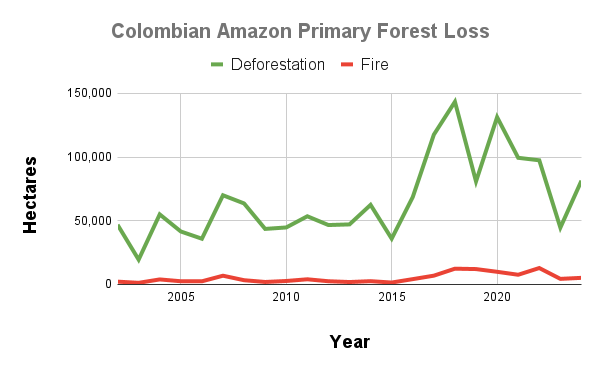
Graph 6. Deforestation and fire trends in the Colombian Amazon. Data: UMD.
Rest of the Amazon
Other important highlights from around the Amazon include:
Deforestation and fire hotspots in northeast Guyana. In total, Guyana lost 25,858 hectares of primary forest to deforestation, and an additional 38,314 hectares to fires, both of which shattered previous records.
Deforestation in the Venezuelan Amazon was the highest on record (32,240 hectares), and additional fire impacts were the second highest (36,471 hectares).
Deforestation in the Ecuadorian Amazon was the second highest on record (18,615 hectares), just behind 2022 (18,902 hectares). Deforestation hotspots were concentrated in the northern Amazon, areas characterized by high gold mining activity (MAAP #227, MAAP #221, MAAP #219). As in Colombia, major fires were less of an issue in the northwest Amazon overall, but did directly impact an additional 1,540 hectares (4th highest on record).
Fires were the highest on record in Suriname (7,926 ha) and French Guiana (635 ha).
Policy Implications
The dominant policy development of 2024 was the record-breaking fire season across the Amazon. These fire records were not only region-wide but also country-specific, occurring in Brazil, Bolivia, Peru, Guyana, Suriname, and French Guiana.
The 2024 records are particularly significant given that the Amazon has experienced several intense fire years over the past two decades. The most notable, and previous record-breaker, occurred in 2016, following the “Godzilla” El Niño event of 2015-16. However, the extreme drought conditions of 2023 and 2024, also associated with El Niño, exceeded those past benchmarks, creating extreme conditions for widespread fires across the Amazon.
As a result, fire policy is now emerging as a central pillar of Amazon conservation, alongside longstanding efforts to curb deforestation. This growing prominence is directly related to climate change, both in terms of intensifying dry seasons and the projected increase in the frequency, length, and severity of El Niño events.
These policies must be centered on how to avoid fires in the first place, and then how to effectively respond to major fires once they appear.
Previous research has revealed the tight link between deforestation and fires in the Brazilian Amazon (MAAP #189). That is, many major fires are burning recently deforested areas, and sometimes escape into surrounding forests, especially with extended dry conditions. Therefore, strengthening deforestation control remains one of the most effective fire mitigation strategies in Brazil and other Amazonian countries.
There is also a strong link between deforestation and fire in the Bolivian Amazon. While deforestation often precedes fires, as in Brazil, there is also a second round of deforestation following the fires
In both contexts, real-time fire monitoring, such as the MAAP Fire Tracker, should be integrated into national response protocols and field-level coordination.
Beyond fire, high rates of forest loss continue to be driven by deforestation across other parts of the Amazon. In Colombia’s arc of deforestation, we detected very high deforestation around Chiribiquete National Park, as well as high deforestation within Tinigua and Macarena National Parks. Although the national government is engaged on the issue of deforestation, these losses are closely tied to the presence and influence of armed groups in the country, which exert substantial control over land-use and deforestation dynamics (explaining shifts such as the dip in 2023 and the rise again in 2024). The major deforestation drivers in Colombia are roads, land grabbing (and associated cattle pastures), and coca cultivation.
Other high forest loss areas include gold mining fronts in northern Ecuador and southern Peru, Mennonite colonies in central Peru, the soy frontier in southeast Bolivia, and along major existing roads in Brazil. Although there is gold mining in both Venezuela and Guyana, the most intense forest loss hotspots were associated with fires surrounding agricultural areas.
It is important to note that the data presented here may differ from national data presented by governments. This difference may be due to methodology (we focus on impact on primary forests), spatial resolution (30 meters in our case), and Amazon boundaries (we employ a hybrid boundary designed for maximum inclusion of both watershed and biogeography). Due to these potential differences among sources, it is best to focus on the convergence of overall trends and patterns, and not overly focus on absolute numerical differences.
Annex 1
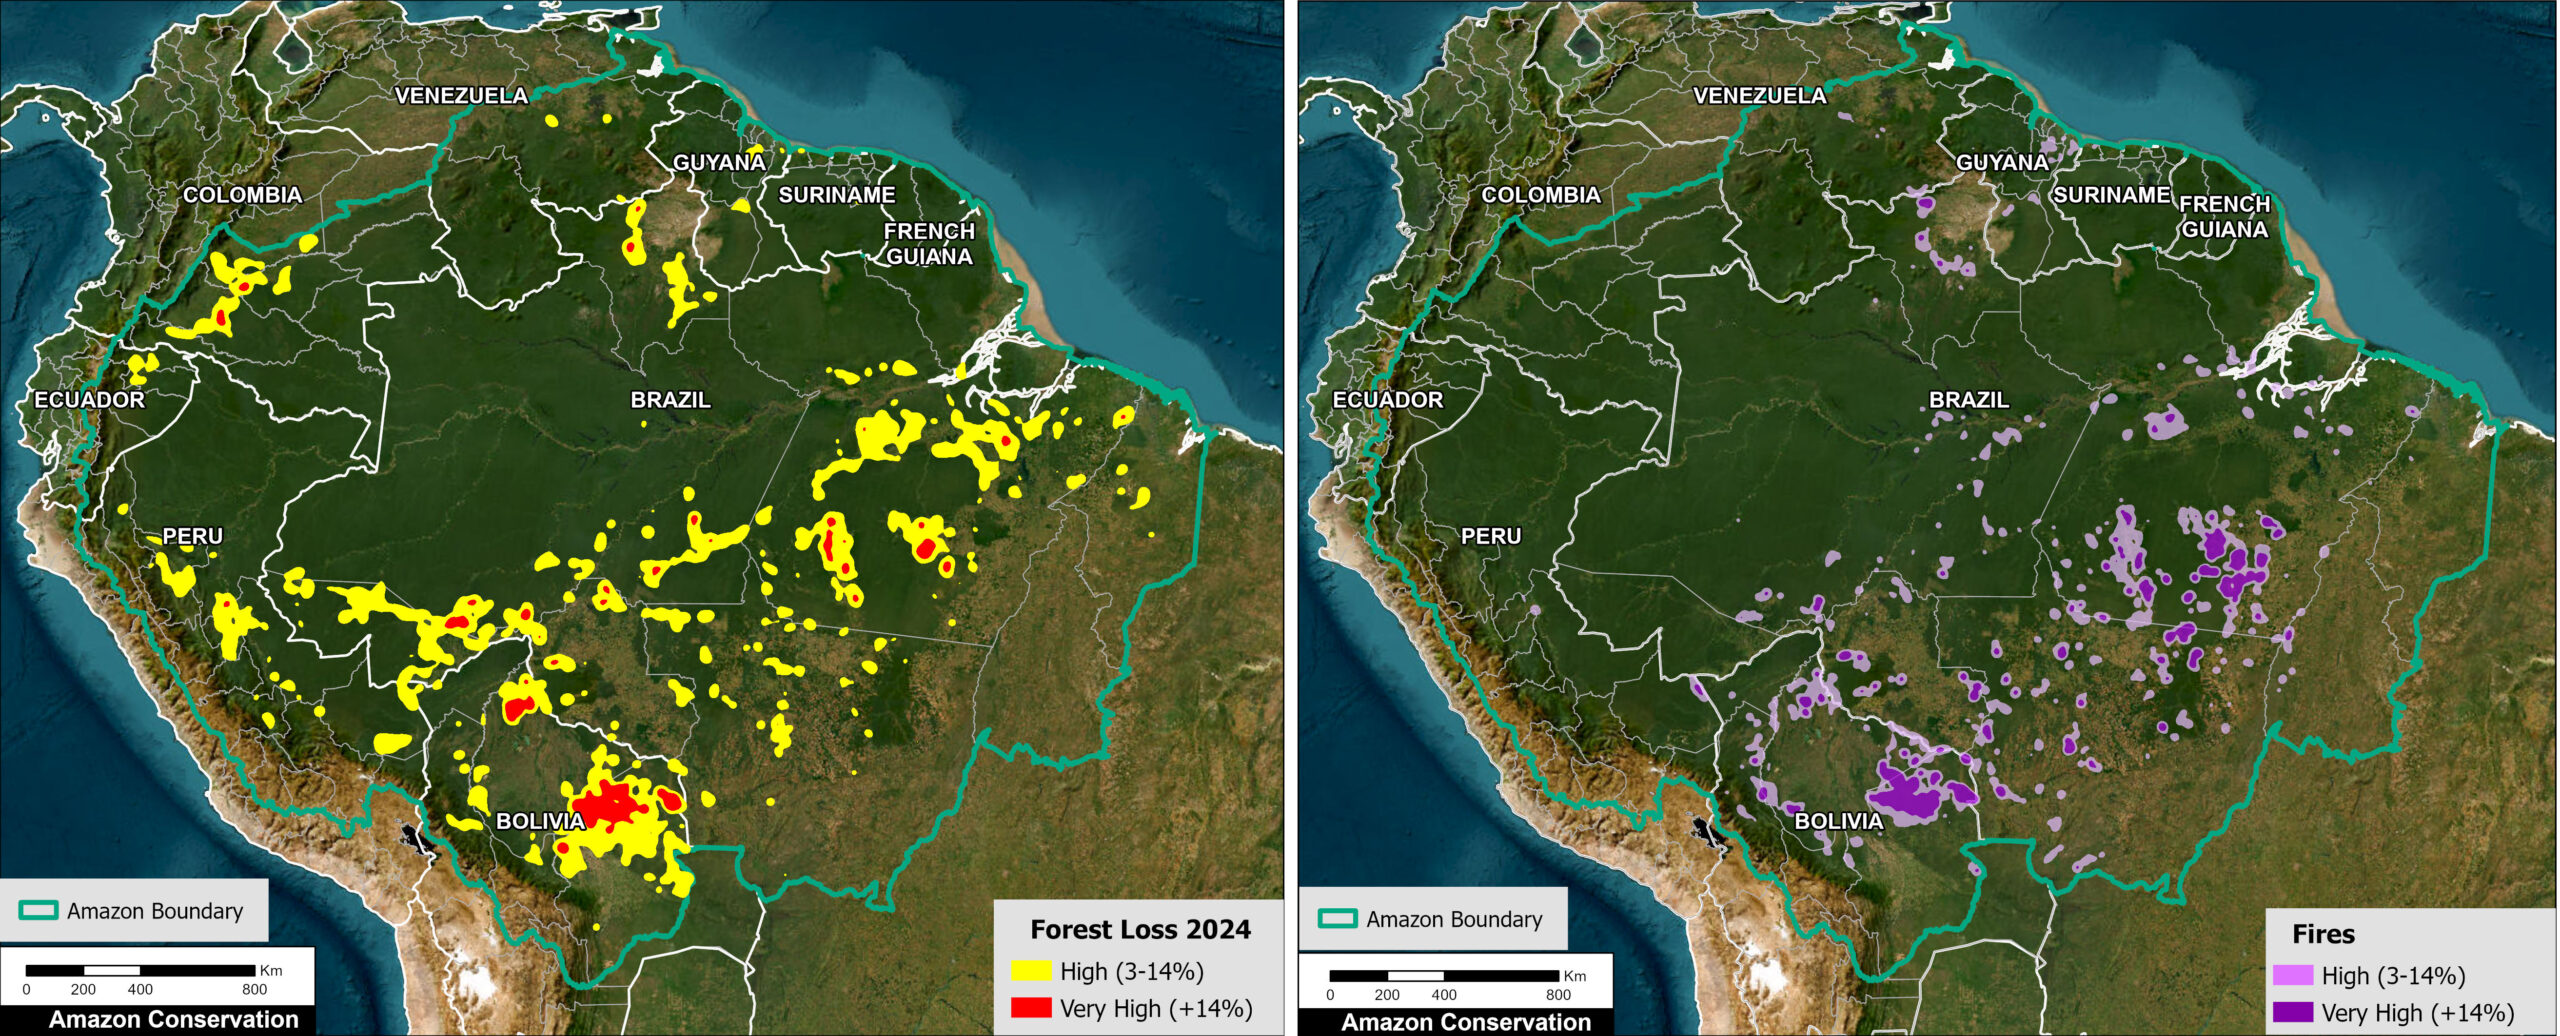
Annex 1. Forest loss hotspots in relation to fire specific hotspots across the Amazon in 2024. Data: UMD/GLAD, ACA/MAAP.
Annex 2
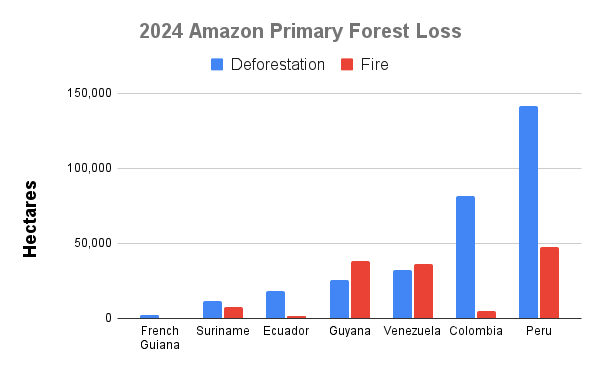
Graph 2b. Amazon primary forest loss for seven countries (except Brazil and Bolivia). Data: UMD
Methodology
The analysis was based on 30-meter resolution annual forest loss data produced by the University of Maryland and also presented by Global Forest Watch.
This data was complemented with the Global Forest Loss due to fire dataset that is unique in terms of being consistent across the Amazon (in contrast to country specific estimates) and distinguishes forest loss caused directly by fire (note that virtually all Amazon fires are human-caused). The values included were ‘medium’ and ‘high’ confidence levels (code 3-4). This fire data may be interpreted as forest degradation, in contrast to the more permanent impacts of deforestation.
The remaining forest loss serves as a likely close proxy for deforestation, with the only remaining exception being natural events such as landslides, wind storms, and meandering rivers. The values used to estimate this category was ‘low’ certainty of forest loss due to fire (code 2), and forest loss due to other ‘non-fire’ drivers (code 1).
For the baseline, it was defined to establish areas with >30% tree canopy density in 2000. Importantly, we applied a filter to calculate only primary forest loss by intersecting the forest cover loss data with the additional dataset “primary humid tropical forests” as of 2001 (Turubanova et al 2018). For more details on this part of the methodology, see the Technical Blog from Global Forest Watch (Goldman and Weisse 2019).
Our geographic range for the Amazon is a hybrid designed for maximum inclusion: biogeographic boundary (as defined by RAISG) for all countries, except for Bolivia and Peru, where we use the watershed boundary, and Brazil, where we use the Legal Amazon boundary.
To identify the deforestation hotspots, we conducted a kernel density estimate. This type of analysis calculates the magnitude per unit area of a particular phenomenon, in this case, forest cover loss. We conducted this analysis using the Kernel Density tool from the Spatial Analyst Tool Box of ArcGIS. We used the following parameters:
Search Radius: 15000 layer units (meters)
Kernel Density Function: Quartic kernel function
Cell Size in the map: 50 x 50 meters (0.25 hectares)
Everything else was left to the default setting.
For the Base Map, we used the following concentration percentages: High: 3-14%; Very High: >14%. These percentages correspond to the concentration of forest loss pixels, with a pixel size of 50 x 50 meters (0.25 hectares).
Acknowledgements
We thank colleagues at Global Forest Watch (GFW), an initiative of the World Resources Institute (WRI) for early access to data.
We also thank colleagues from the following organizations for helpful comments on the report: Conservación Amazónica – ACEAA in Bolivia, Conservación Amazónica – ACCA in Peru, Fundación EcoCiencia in Ecuador, and Instituto Centro de Vida (ICV) in Brazil.
This work was supported by Norad (Norwegian Agency for Development Cooperation).
![]()
Citation
Finer M, Ariñez A, Mamani N, Cohen M, Santana A (2025) Amazon Deforestation & Fire Hotspots 2024. MAAP: 229.
MAAP #225: Carbon in the Amazon (part 4): Protected Areas & Indigenous Territories
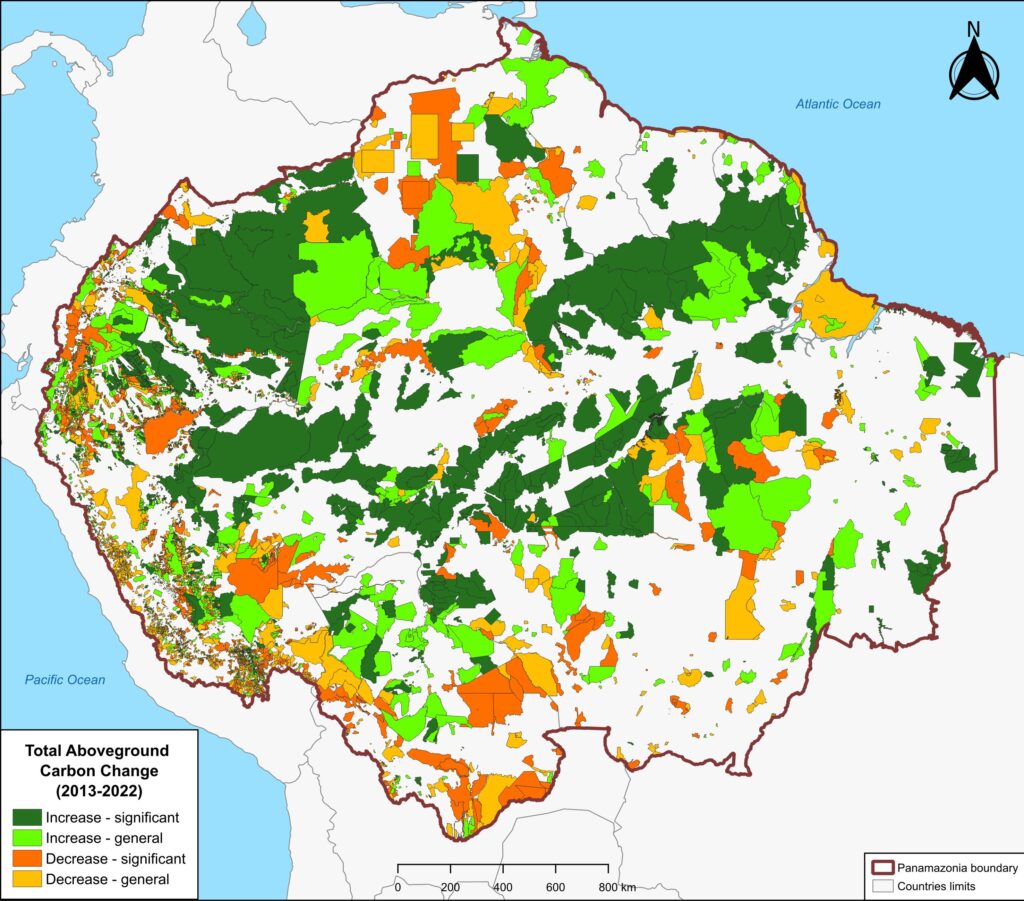
Figure 1. Total aboveground carbon change, Amazon protected areas & Indigenous territories 2013-2022. Data: Planet, ACA/MAAP.
We continue our ongoing series about carbon in the Amazon.
In part 1 (MAAP #215), we introduced a new dataset (Planet’s Forest Carbon Diligence) with wall-to-wall estimates for aboveground carbon at an unprecedented 30-meter resolution between 2013 and 2022. In part 2 (MAAP #217), we highlighted which parts of the Amazon are currently home to the highest (peak) carbon stocks. In part 3 (MAAP #220), we showed key cases of carbon loss (deforestation) and gain across the Amazon.
A key finding from this series is that the Amazon biome is teetering between a carbon source and sink. That is, historically the Amazon has functioned as a critical sink, with its forests accumulating carbon if left undisturbed. However, relative to the 2013 baseline, the Amazon flipped to a source during the high deforestation, drought, and fire seasons of 2015-2017. It then rebounded as a narrow carbon sink in 2022.
Here, in part 4, we focus on the importance of aboveground carbon in protected areas and Indigenous territories, which together cover 49.5% (414.9 million hectares) of the Amazon biome (see Figure 1).
We find that, as of 2022, Amazonian protected areas and Indigenous territories contained 34.1 billion metric tons of aboveground carbon (60% of the Amazon’s total). Importantly, in the ten years between 2013 and 2022, they functioned as a significant carbon sink, gaining 257 million metric tons.
With this data, we can also analyze aboveground carbon for each protected area and Indigenous territory. For example, Figure 1 illustrates aboveground carbon loss vs. gain for each protected area and Indigenous territory during the 10-year period of 2013 – 2022 (see details below).
Below, we further explain and illustrate the key findings.
Amazon-wide & Country-level Results
Amazonian protected areas and Indigenous territories currently cover nearly half (49.5%) of the Amazon biome, but contain 60% of the aboveground carbon. Together they contained 34.1 billion metric tons of aboveground carbon as of 2022, gaining 257 million metric tons since 2013, thus functioning as a carbon sink (Figure 2).1,2
In contrast, areas outside of protected areas and Indigenous territories (424 million hectares) contained 22.6 billion metric tons of aboveground carbon as of 2022, losing 255 million metric tons since 2013, thus functioning as an overall carbon source.
Thus, the carbon sink function of protected areas and Indigenous territories narrowly offsets the emissions in the rest of the Amazon.
We emphasize that the protected areas and Indigenous territories functioned as a significant carbon sink (p-value = 0.01), while the outside areas were not a significant source (p-value= 0.15).
Regarding results by country, protected areas and Indigenous territories were significant carbon sinks in Colombia, Brazil, Suriname, and French Guiana (Guyana gained carbon but not significantly). In contrast, they were significant carbon sources in Bolivia and Venezuela (Peru and Ecuador lost carbon but not significantly).
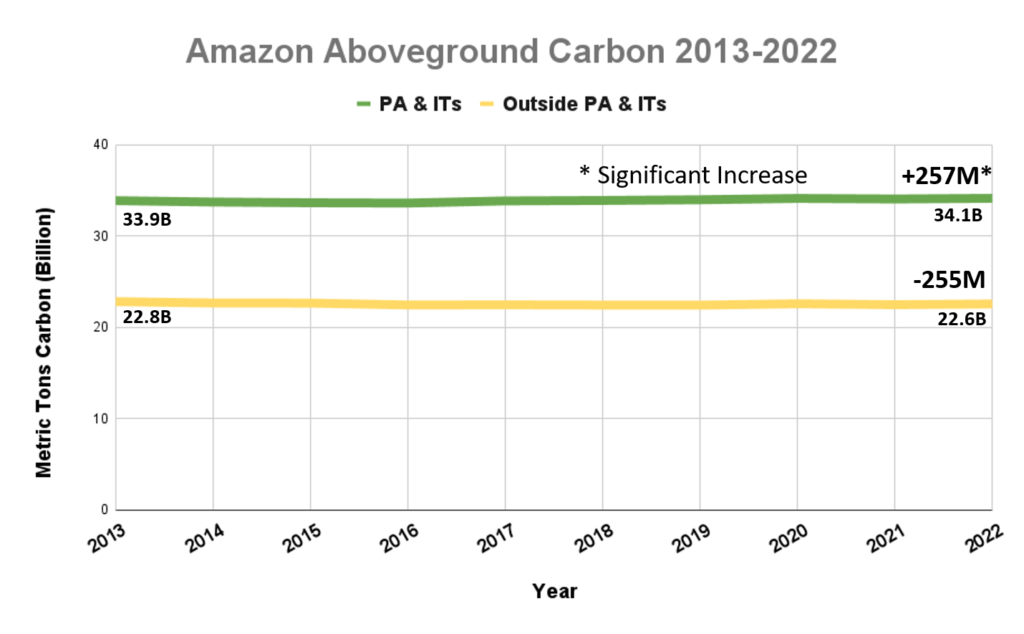
Figure 2. Amazon aboveground carbon 2013-2022, within vs. outside protected areas and Indigenous territories. Data: Planet, ACA/MAAP.
Individual Protected Area & Indigenous Territory Results
Figure 1 (see above) illustrates total aboveground carbon loss vs. gain for each protected area and Indigenous territory during the 10-year period of 2013 – 2022.
Overall, we found 1,103 areas that served as significant carbon sinks (dark green) during this period (238 protected areas and 865 Indigenous territories). These areas are concentrated in the northern and central Amazon. See Annex 1 for a list of specific areas that were significant carbon sinks.
It is important to note that deforestation pressures currently threaten several of these significant carbon sinks, including Chiribiquete National Park and Nukak-Maku Indigenous Reserve in Colombia, Sierra del Divisor National Park in Peru, and Canaima National Park in Venezuela.
In contrast, we found 1,439 areas (156 protected areas and 1,283 Indigenous territories) that served as significant carbon sources. It is important to note that some areas with little documented deforestation, such as Alto Purus National Park, may have carbon loss from natural causes.
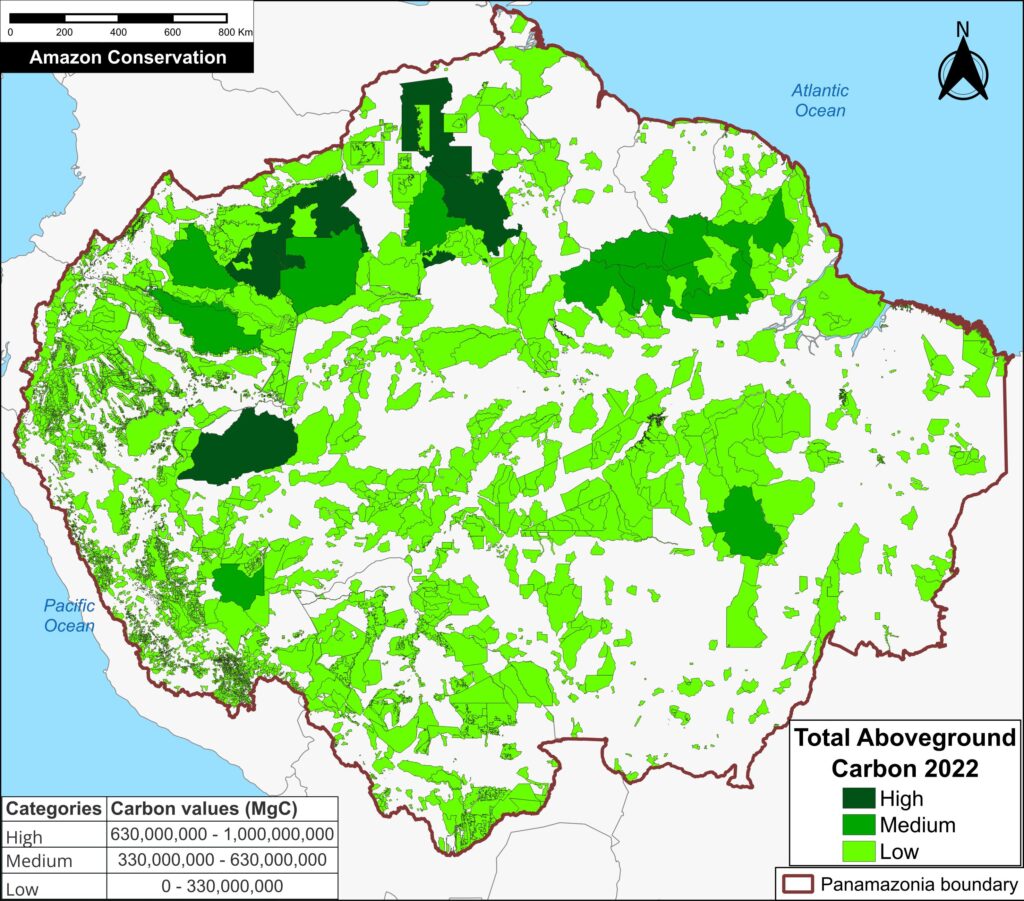
Figure 3. Total aboveground carbon stocks in each protected area and Indigenous territory. Data: Planet, ACA/MAAP.
Figure 3 offers the most recent snapshot of total aboveground carbon stocks in each protected area and Indigenous territory.
It presents data for 2022 categorized into three groups of High, Medium, and Low. Note that the highest carbon totals (over 330 million metric tons) are concentrated across the large designated areas of the northern Amazon.
These High and Medium carbon areas may be considered to have the highest overall conservation value purely in terms of total carbon.
See Annex 1 for specific areas with the highest carbon stocks as of 2022.
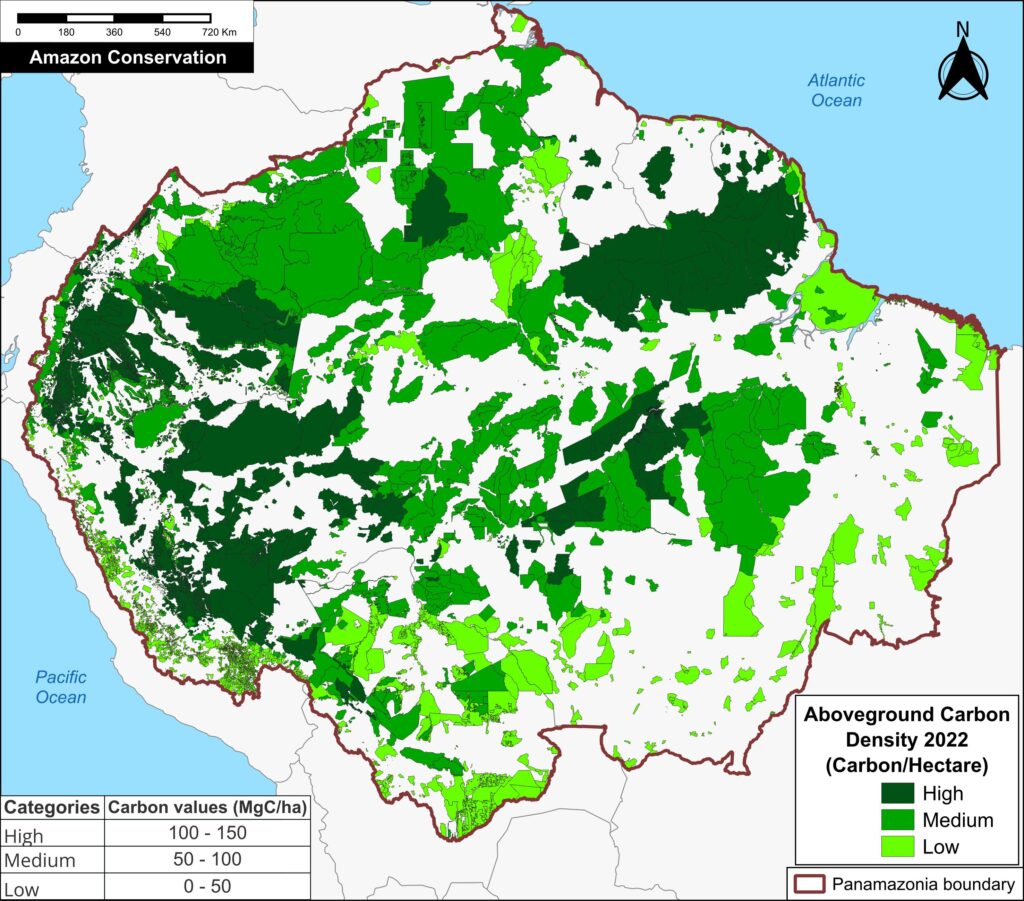
Figure 4. Aboveground carbon density in each protected area and Indigenous territory (2022). Data: Planet, ACA/MAAP
Finally, Figure 4 also displays the most recent data (2022) in each protected area and Indigenous territory, but standardized for area (aboveground carbon/hectare).
Note that the highest carbon totals (over 50 metric tons per hectare) are more evenly concentrated across the Amazon.
These High and Medium carbon areas may be considered to have the highest carbon conservation value per hectare.
Policy Implications:
Unlocking the Climate Value of Protected Areas and Indigenous Territories in the Amazon
Policy and finance for tropical forests as a climate solution have largely focused on reducing emissions from deforestation and forest degradation (REDD+). These efforts have made important strides in slowing and directing finance to tackle forest loss, particularly in high-deforestation regions. However, this emphasis on avoided emissions overlooks a critical component of the global carbon cycle: the carbon sink function (gaining of carbon over time) of primary tropical forests — which this analysis using Planet’s Forest Carbon Diligence data show is both measurable and significant.
This omission leaves a major flux in the carbon system—ongoing carbon sequestration in old-growth forests—outside the scope of existing market or non-market incentives. Critically, many of these carbon-absorbing forests are already located within established protected areas and indigenous territories. These areas are globally recognized for their importance in biodiversity conservation and for the stewardship provided by Indigenous Peoples and local communities.
As global attention increasingly turns to engineered carbon removal strategies such as BECCS (Bioenergy with carbon capture and storage) and Direct Air Capture, there is an urgent need to recognize that Amazonian forests are already performing this function—naturally and at scale. Yet the value of Protected Areas and Indigenous territories as a potent carbon sink is neither monetized nor rewarded under current frameworks, unless they can demonstrate that they are under threat from deforestation or degradation in order to access REDD+ finance. An emerging exception is the High Integrity Forests Investment Initiative (HIFOR), which recognizes the value of carbon sequestration in old-growth forests, but does not generate tradable credits for each ton absorbed.5 The Tropical Forests Forever Fund (TFFF) proposed by Brazil for adoption at COP 30, would also reward forest countries at a rate of approximately US$ 4.00/year for every hectare of tropical forest they protect, regardless of whether they are under threat.6
To date, however, protected areas and Indigenous territories, despite their proven climate contribution, often lack the financial support necessary to ensure long-term effectiveness and resilience. As a result, they often face chronic underfunding,7 limiting their long-term effectiveness and resilience. Policy innovation is needed to close this gap and integrate the carbon sink function of mature forests into funding mechanisms for forest protection. Doing so would unlock meaningful incentives for the continued, long-term stewardship of these high-carbon ecosystems and would ensure that one of the planet’s most effective natural climate solutions receives the attention and resources it deserves.
Annex 1
Specific areas that were significant carbon sinks include:
Otishi, Sierra del Divisor, Güeppí-Sekime and Yaguas National Parks, Matsés, and Pucacuro National Reserves, Ashaninka Communal Reserve, and Cordillera Escalera and Alto Nanay- Pintuyacu Chambira Regional Conservation Area, Matses, Pampa Hermosa, and Yavarí – Tapiche Indigenous Reserves, and Kugapakori, Nahua, Nanti Territorial Reserve in Peru;
Amacayacu, Chiribiquete, Cahuinari, Rio Pure, and Yaigoje Apaporis National Parks, Nukak Natural Reserve, Amazonas Forest Reserve, and Putumayo and Nukak-Maku, Yaigoje Rio Apaporis and Vaupes Indigenous Reserve in Colombia;
Campos Amazônicos, Juruena, Mapinguari, Nascentes do Lago Jari, Serra do Divisor, and Montanhas do Tumucumaque National Parks, Amanã, Aripuanã, Crepori, Tapajós, and Tefé National Forests in Brazil, Itaituba and Jatuarana National Forests, and Alto Rio Negro, Baú, Aripuanã, Aripuanã, Apyterewa, Mundurucu, and Vale do Javari Indigenous Territories in Brazil.
Achuar Indigenous Territory and Zona Intangible Tagaeri – Taromenane in Ecuador; Manuripi Heath National Reserve and Takana, Takana II, and Yuracare Indigenous Reserves in Bolivia; Central Suriname and Sipaliwini Nature Reserves in Suriname; Canaima National Park in Venezuela; and Parc Amazonien de Guyane National Park in French Guiana,
Specific areas with the highest carbon stocks, as of 2022, include:
Alto Purús, Manu, Sierra del Divisor, and Cordillera National Parks in Peru; Chiribiquete National Park in Colombia; Montanhas do Tumucumaque, Pico da Neblina, Jaú, and Juruena National Parks and Yanomami, Menkragnoti, Kayapó, Mundurucu, and Vale do Javari Indigenous Territories in Brazil; Caura and Canaima National Parks in Venezuela; and Parc Amazonien de Guyane National Park in French Guiana;
Methodology
We analyzed Planet Forest Carbon Diligence, a cutting-edge new dataset from the satellite-based company Planet, featuring a 10-year historical time series (2013 – 2022) with wall-to-wall estimates for aboveground carbon density at 30-meter resolution.3,4
One notable caveat of this data is that it does not distinguish aboveground carbon loss from natural vs human-caused drivers, so additional information may be incorporated to understand the context of each area.
Based on these data, annual aboveground carbon values were estimated in Amazonian protected areas and Indigenous territories to obtain a time series for 2013-2022. In addition, the Mann-Kendall test was used to analyze trends in the generated time series.
Our data source for protected areas and Indigenous territories is from RAISG (Amazon Network of Georeferenced Socio-Environmental Information), a consortium of civil society organizations in the Amazon countries. This source (accessed in December 2024) contains spatial data for 5,943 protected areas and Indigenous territories, covering 414.9 million hectares across the Amazon.
We determined that many of these areas (4,000) did not include creation date metadata, prohibiting any time-series control for that variable. Instead, we used the most current extent of protected areas and Indigenous territories as a proxy for those that existed from 2013 to 2022.
There was substantial overlap between protected areas and Indigenous territories, but we accounted for this to avoid double counting of the overlapping areas.
The aboveground carbon values for protected areas and Indigenous territories were calculated for each country and then summed across the Amazon.
The remaining areas were combined into the category of “Outside protected areas and Indigenous territories” and also calculated for each country and summed across the Amazon.
Our geographic range for the Amazon is a hybrid designed for maximum inclusion: biogeographic boundary (as defined by RAISG) for all countries, except for Bolivia and Peru, where we use the watershed boundary, and Brazil, where we use the Legal Amazon boundary. Our area estimate for this definition of the Amazon biome is 839.2 million hectares.
Notes
1 Breaking down the results by category, protected areas contained nearly 21.1 billion metric tons of aboveground carbon as of 2022, gaining over 204 million metric tons since 2013, while Indigenous territories contained over 16.8 billion metric tons of aboveground carbon as of 2022, gaining over 132 million metric tons since 2013. Note that protected areas and Indigenous territories overlap in many areas.
2 Standardizing for area (that is, calculating the results per hectare), protected areas and Indigenous territories contained 82.2 metric tons of aboveground carbon per hectare as of 2022, gaining a net 0.6 metric tons per hectare since 2013. In contrast, areas outside of protected areas and Indigenous territories contained 53.2 metric tons of aboveground carbon per hectare as of 2022, losing a net 0.6 metric tons per hectare since 2013.
3 Anderson C (2024) Forest Carbon Diligence: Breaking Down the Validation and Intercomparison Report. https://www.planet.com/pulse/forest-carbon-diligence-breaking-down-the-validation-and-intercomparison-report/
4 In terms of the limitations of Planet’s Forest Carbon Diligence data, Duncanson et al (2025) recently wrote a Letter in Science focused on spatial resolution for forest carbon maps. Given the natural constraint of the size of a tree, they discuss the challenge of pixel-level validation below 5 meters for forest carbon monitoring. The authors state that spatial resolution should at minimum exceed the crown diameter of a typical large tree, which is about 20 meters for tropical forests. In this sense, the 30-meter product exceeds this limitation.
Duncanson et al (2025) Spatial resolution for forest carbon maps. Science 387: 370-71.
5 WCS High Integrity Forest Investment Initiative (HIFOR): The Science Basis
6 https://www.bloomberg.com/news/newsletters/2025-04-04/too-big-to-fell-brazil-takes-trees-to-wall-street?cmpid=BBD040425_GR
7 UNEP-WCMC, IUCN, and NGS. (2022). Protected Planet Report 2022. Cambridge, UK: UNEP-WCMC.
Acknowledgments
Through a generous sharing agreement with the satellite company Planet, we have been granted access to this data across the entire Amazon biome for the analysis presented in this series.
We thank colleagues from the following organizations for helpful comments on this report: Planet, Conservación Amazónica – ACCA, Conservación Amazónica -ACEAA, Gaia Amazonas, Ecociencia, and Instituto del Bien Común.
We especially thank colleagues at Conservación Amazónica – ACCA for help with the 10-year data analysis.
This report was made possible by the generous support of the Norwegian Agency for Development Cooperation (NORAD)
![]()
Citation
Bodin B, Finer M, Castillo H, Mamani N (2025) Carbon in the Amazon (part 4): Protected Areas & Indigenous Territories. MAAP: 225.
MAAP #220: Carbon across the Amazon (part 3): Key Cases of Carbon Loss & Gain
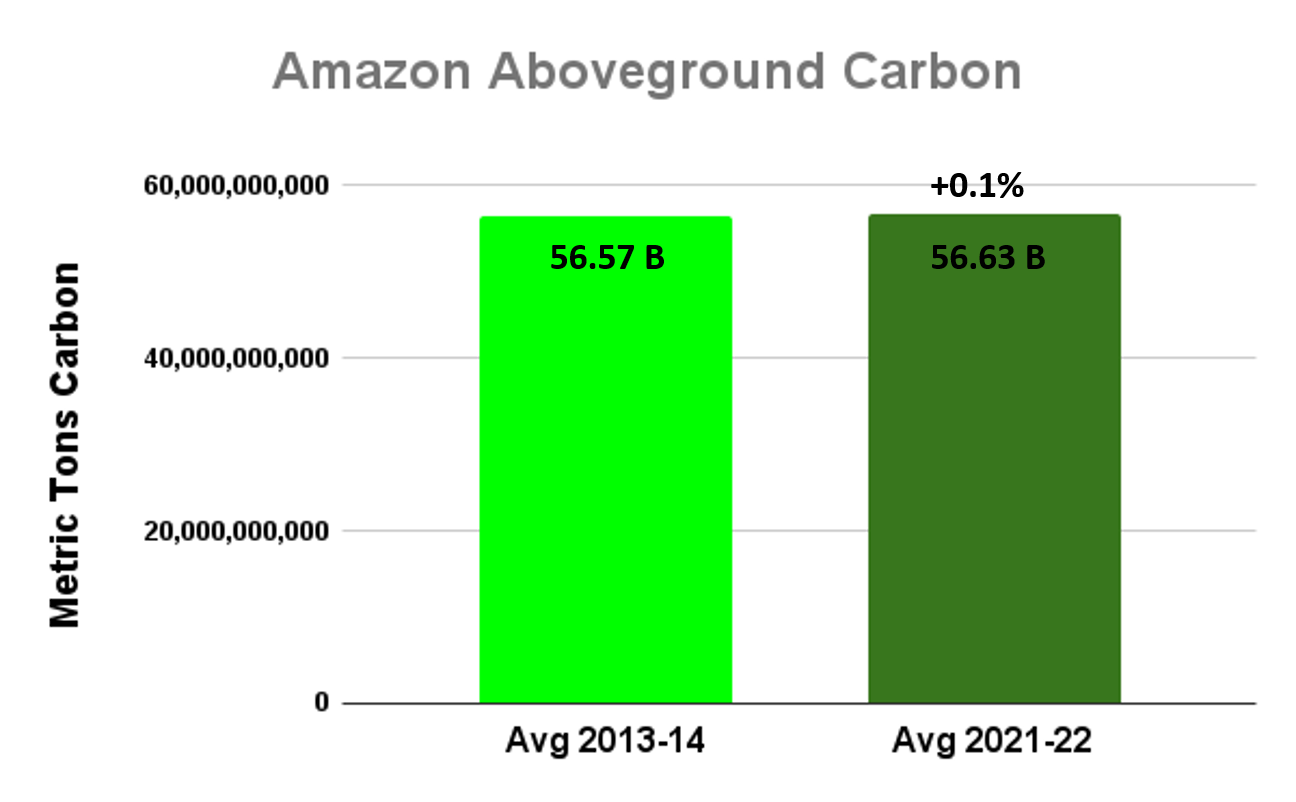
Graph 1. The Amazon biome functions as a narrow carbon sink from 2013 to 2022. Data: Planet, ACA/MAAP.
In part 1 of this series (MAAP #215), we introduced a critical new dataset (Planet’s Forest Carbon Diligence) with wall-to-wall estimates for aboveground carbon at an unprecedented 30-meter resolution between 2013 and 2022. This data uniquely merges machine learning, satellite imagery, airborne lasers, and a global biomass dataset from GEDI, a NASA mission.
In part 2 (MAAP #217), we highlighted which parts of the Amazon are currently home to the highest (peak) aboveground carbon levels and the importance of protecting these high-integrity forests (see Annex 1).
Here, in part 3, we focus on aboveground carbon loss and gain across the Amazon over the 10 years for which we have data (2013-22; see Base Map below).
The Amazon loses carbon to the atmosphere due to deforestation, logging, human-caused fires, and natural disturbances, while it gains carbon from forest regeneration and old-growth forests continuing to sequester atmospheric carbon.4
Overall, we find that the Amazon still narrowly functions as a carbon sink (meaning the carbon gain is greater than the loss) during this period, gaining 64.7 million metric tons of aboveground carbon between 2013 and 2022 (see Graph 1).
This finding underscores the importance of both primary and secondary forests in countering widespread deforestation. Moreover, it highlights the critical potential of primary forests to continue accumulating carbon if left undisturbed.
This gain, however, is quite small relative to the total 56.8 billion metric tons of aboveground carbon contained in the Amazon biome (that is, a gain of just +0.1%), reinforcing concerns that the Amazon could flip to a carbon source in the coming years (with carbon loss becoming greater than its gain) due to increasing deforestation, degradation, and fires.1 See Annex 2 for more details, including how the Amazon became a carbon sink following the 2015 drought, but since rebounded.
The countries with the largest carbon gain are 1) Brazil, 2) Colombia, 3) Suriname, 4) Guyana, and 5) French Guiana. In contrast, the countries with the greatest carbon loss are 1) Bolivia, 2) Venezuela, 3) Peru, and 4) Ecuador.
Zooming in to the site level yields additional insights. For example, we can now estimate the carbon loss from major deforestation events across the Amazon from 2013 to 2022. On the flip side, we can also calculate the carbon gain from both secondary and primary forests.
Areas with carbon gain in intact areas indicate excellent candidates for the High Integrity Forest (HIFOR) initiative, a new financing instrument uniquely focused on maintaining intact tropical forests.2 Importantly, a HIFOR unit represents a hectare of high-integrity tropical forest within a high-integrity landscape that has been “well-conserved” for over a decade.3 Intact areas with carbon gain between 2013-22 may indicate decadally “well-conserved” areas that can be overlapped with areas of high ecological integrity.
Below, we illustrate these findings with a series of novel maps zooming in on emblematic cases of large carbon loss and gain across the Amazon from 2013 – 2022. These cases include forest loss driven by agriculture, gold mining, and roads, as well as forest gain in remote primary forests.
Base Map – Amazon Carbon Loss & Gain (2013-2022)
The Base Map shows wall-to-wall estimates of aboveground carbon loss and gain across the Amazon between 2013 and 2022.
Carbon loss is indicated by yellow to red, indicating low to high carbon loss. Carbon gain is indicated by light to dark green, indicating low to high carbon gains.
Below, we present a series of notable cases of high carbon loss and gain indicated in Insets A-I.
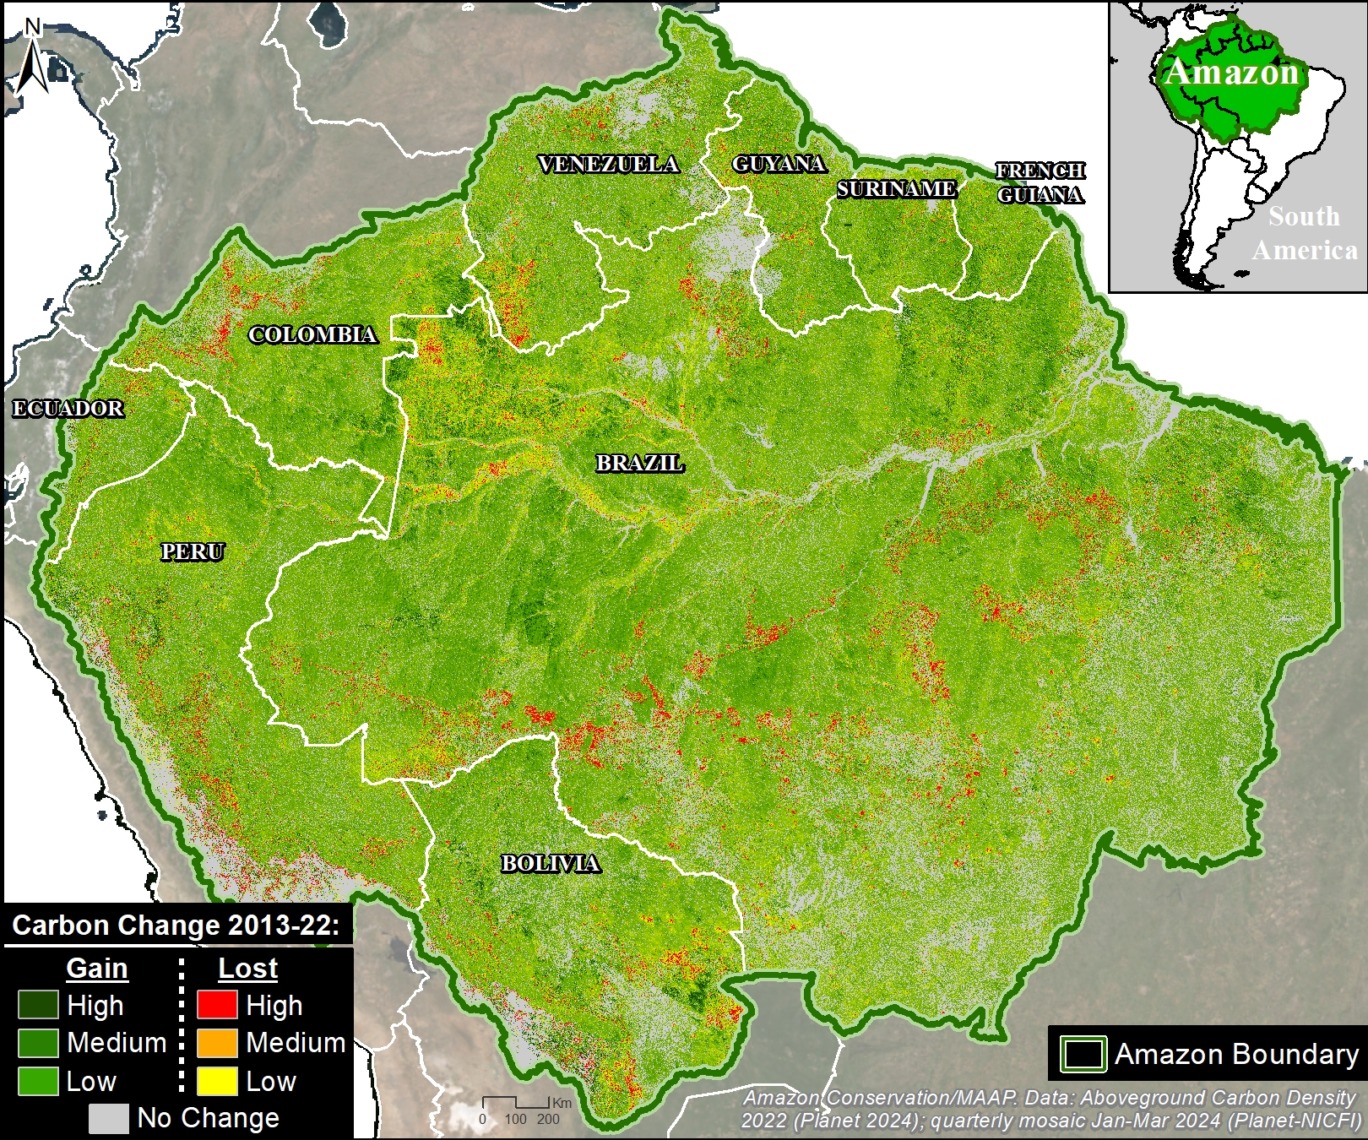
Base Map. Areas of major carbon loss and gain across the Amazon between 2013 and 2022. Source: Amazon Conservation/MAAP, Planet.
Emblematic Cases of Carbon Loss & Gain
Figure 1 highlights emblematic cases of carbon loss (Insets A-F in red) and carbon gain (Insets G-I in green). Below we highlight a series of emblematic cases.
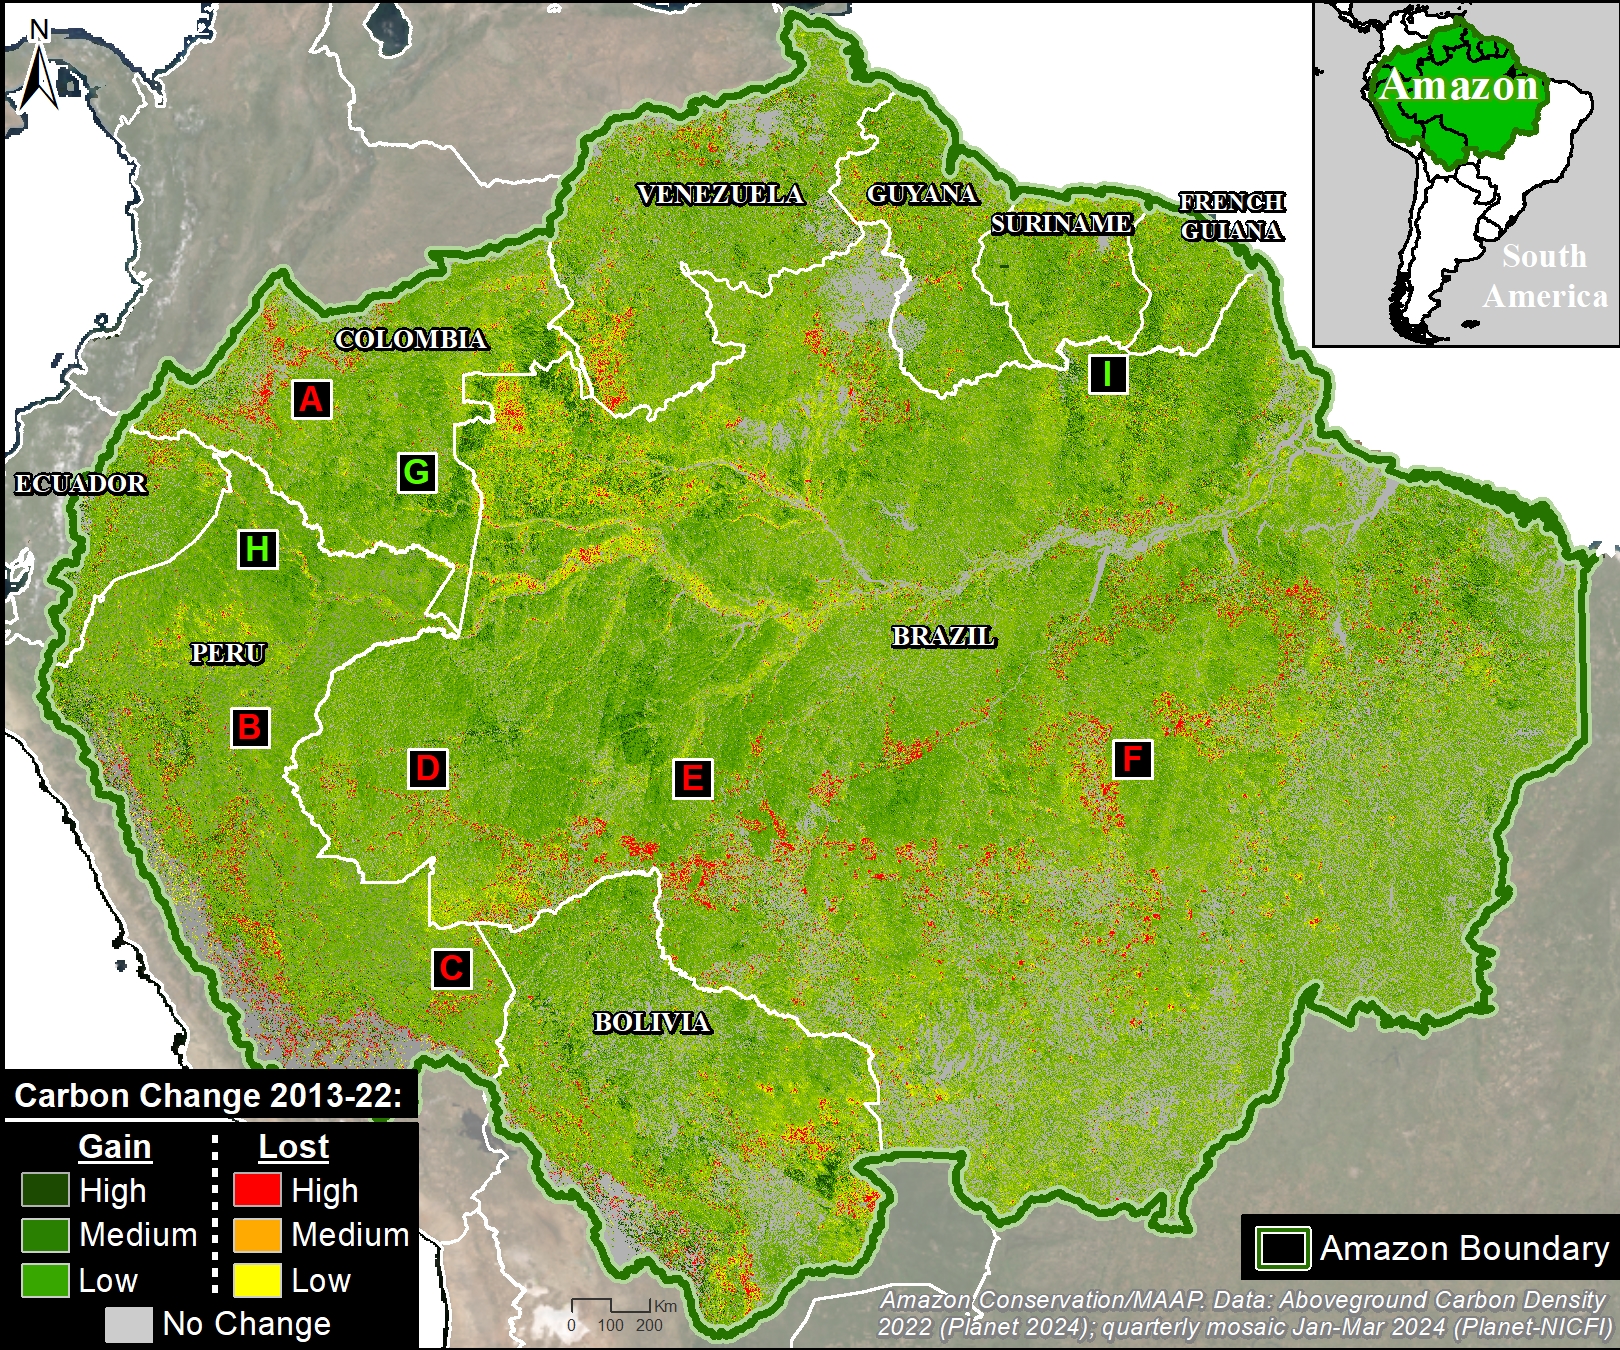
Figure 1. Emblematic cases of carbon loss and gain across the Amazon. Source: Amazon Conservation/MAAP, Planet.
Carbon Loss
We can now estimate the carbon loss from major deforestation events across the Amazon during the past ten years, directly from a single dataset. These cases include forest loss from agriculture, gold mining, and roads. Note that the presented values represent just the carbon loss featured in the selected area.
A. Colombia – Arc of Deforestation
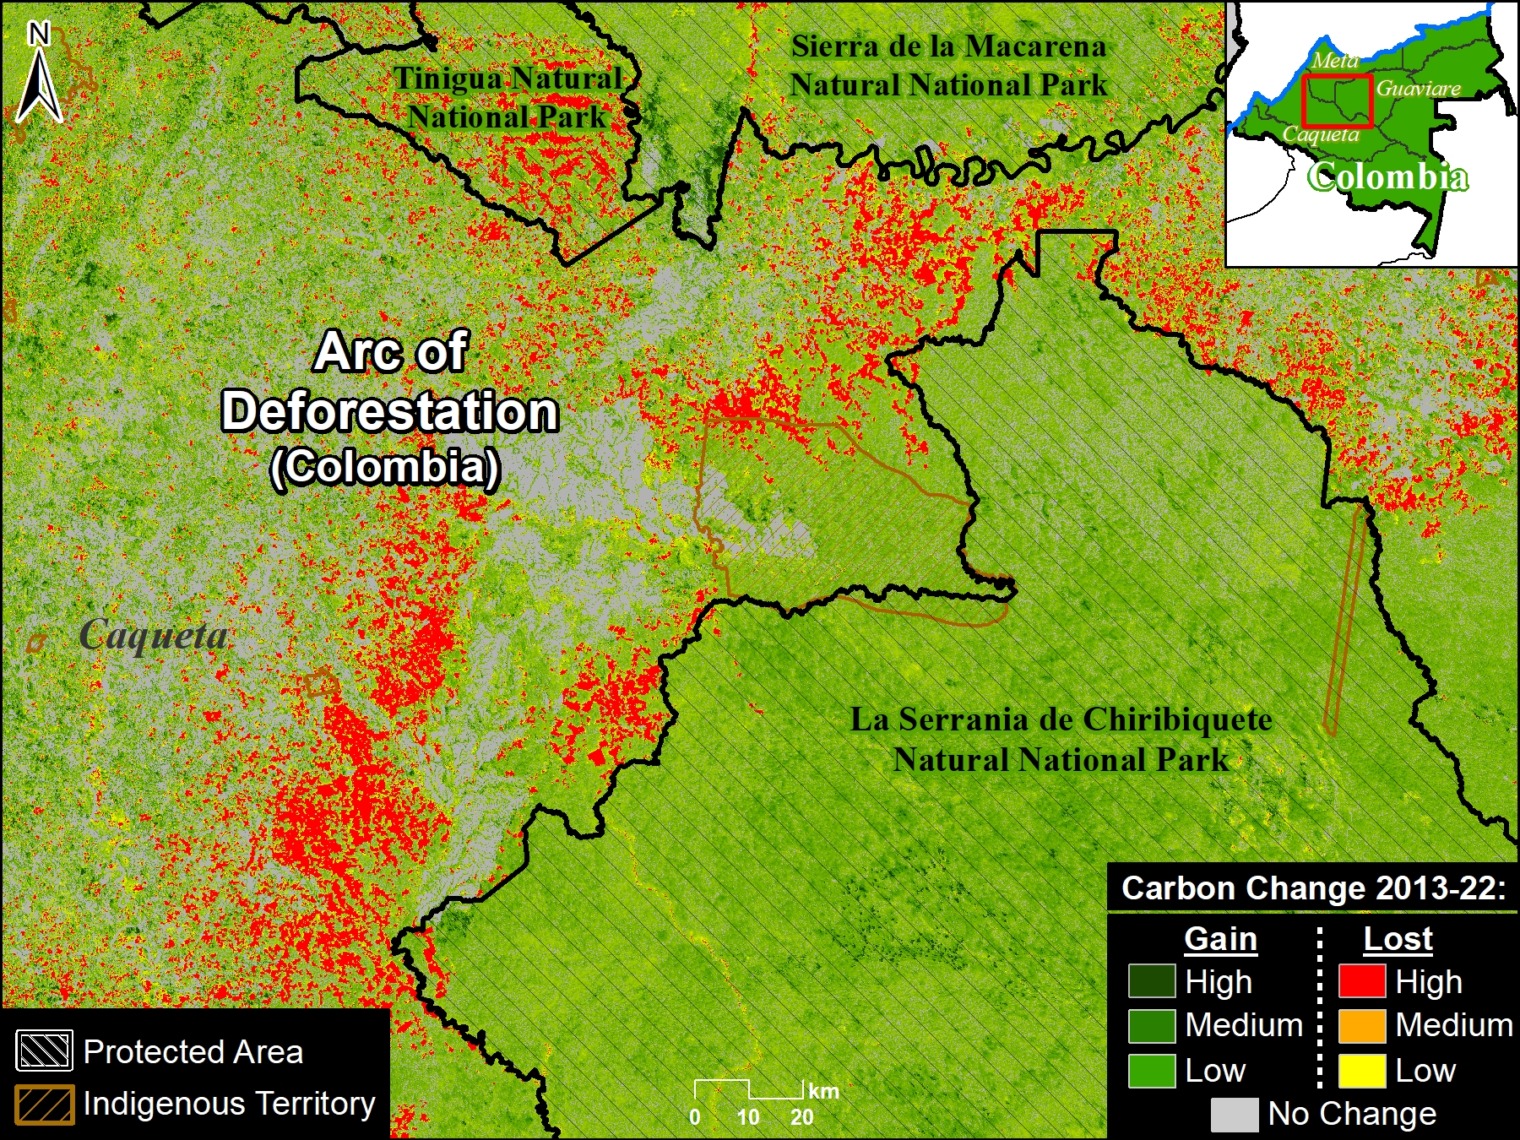
Figure 1A. Carbon loss in the Colombian Amazon’s arc of deforestation. Source: Amazon Conservation/MAAP, Planet.
Figure 1A shows the extensive carbon emissions (39.5 million metric tons) associated with the major deforestation within and surrounding protected areas and Indigenous territories in the Colombian Amazon‘s arc of deforestation.
The carbon loss within the protected areas and Indigenous territories is likely from illegal deforestation.
See MAAP #211 for more details.
B. Peru – Mennonite Colonies
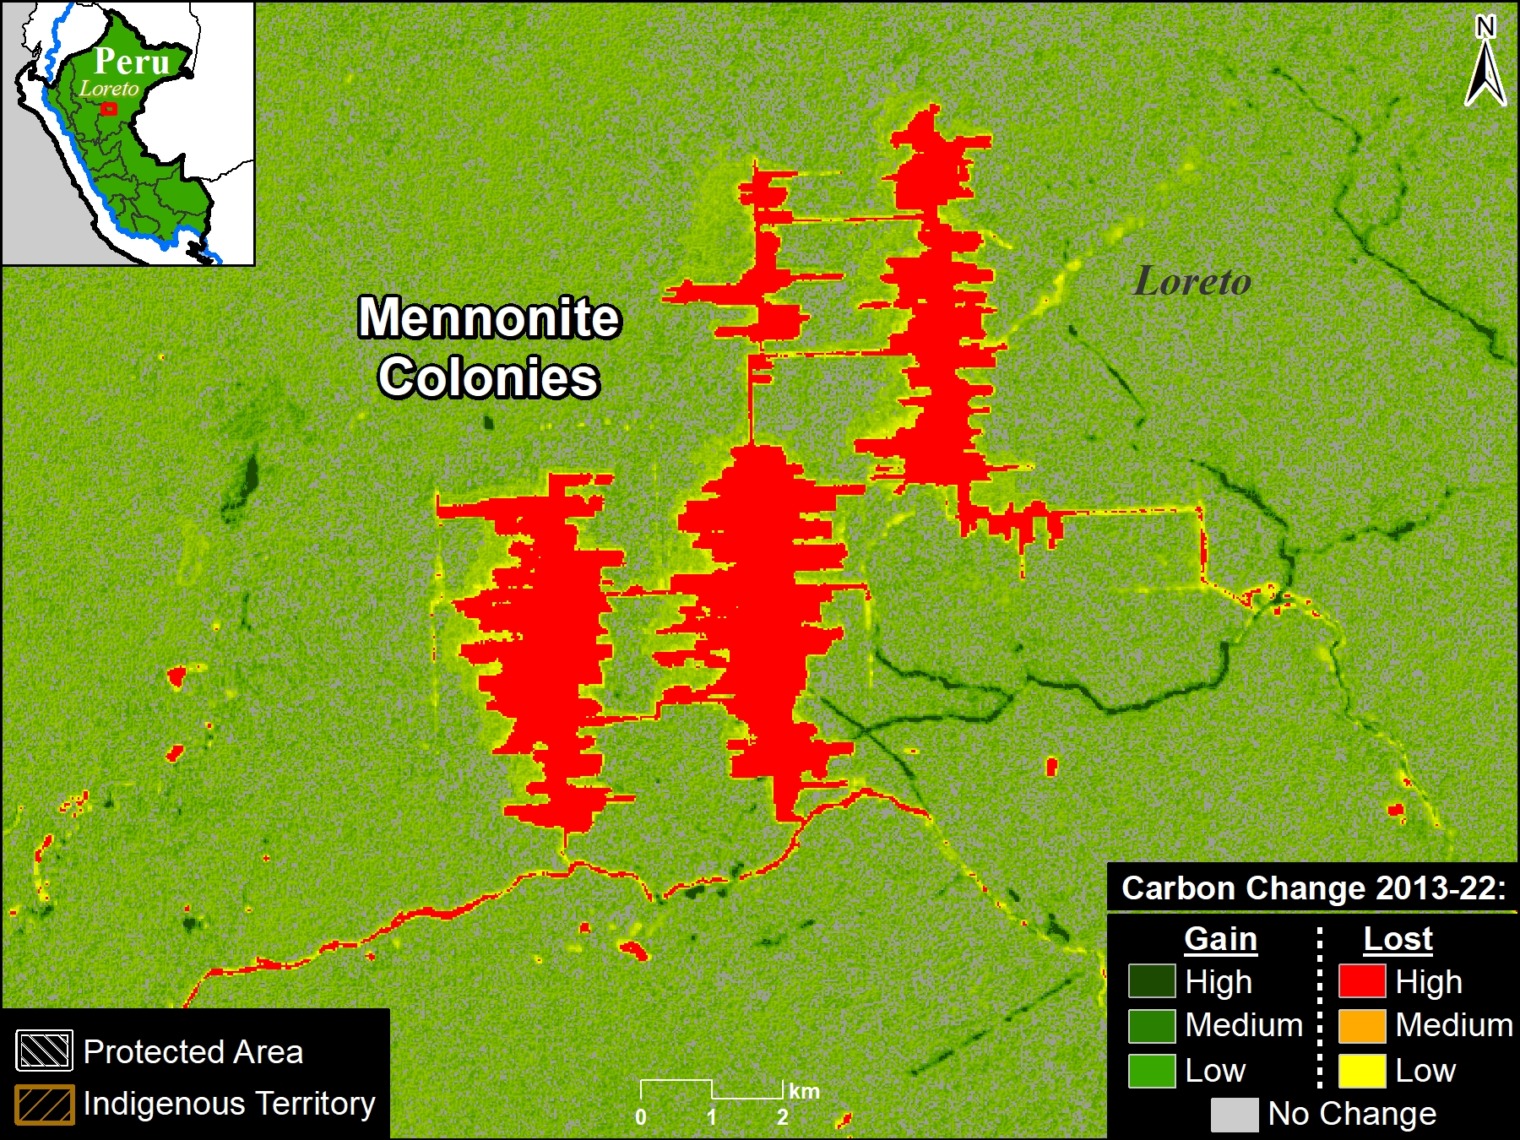
Figure 1B. Carbon loss by new Mennonite colonies in the Peruvian Amazon. Source: Amazon Conservation/MAAP, Planet.
Figure 1B shows the carbon emissions of 224,300 metric tons associated with the recent deforestation carried out by new Mennonite colonies arriving in the central Peruvian Amazon starting in 2017.
See MAAP #188 for more details, including information regarding the legality of the deforestation causing the carbon loss.
C. Peru – Gold Mining
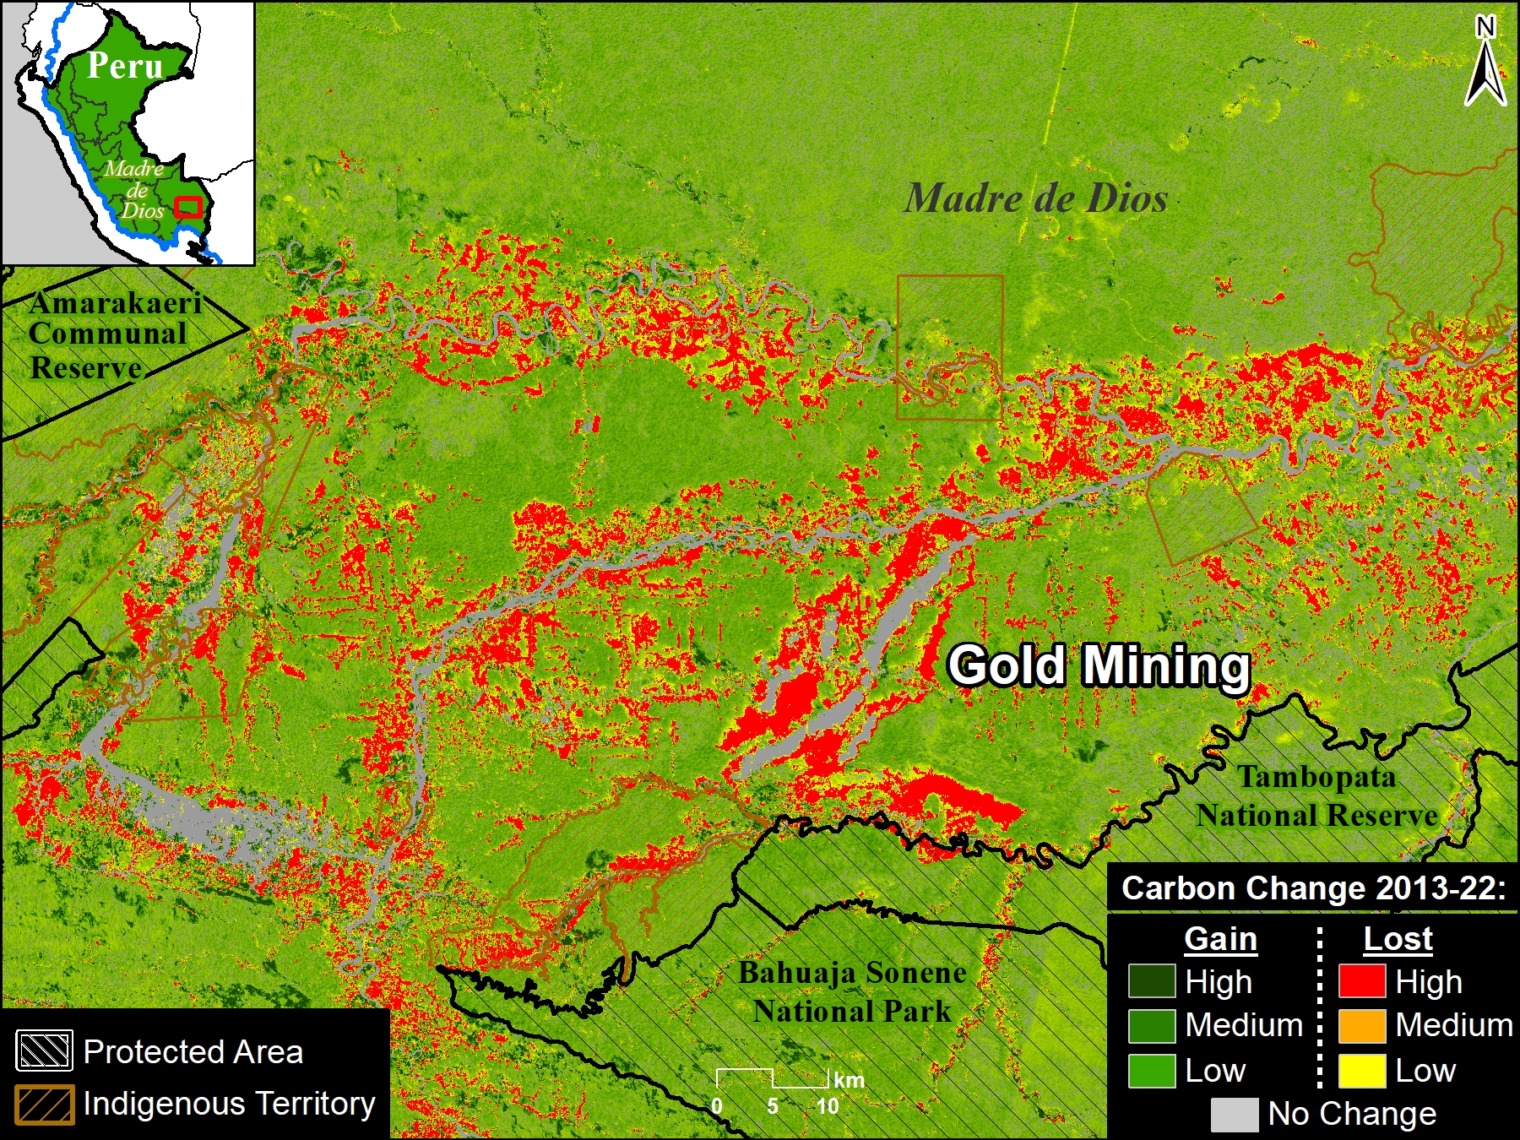
Figure 1C. Carbon loss associated with gold mining deforestation in southern Peruvian Amazon. Source: ACA/MAAP, Planet.
Figure 1C shows the extensive carbon emissions (11.3 million metric tons) associated with gold mining deforestation in the southern Peruvian Amazon.
Most of the carbon loss within the protected areas (and their buffer zones) and Indigenous territories is likely from illegal deforestation.
See MAAP #208 for more information, including details regarding the legality of the deforestation causing the carbon loss.
D. Brazil – Road BR-364
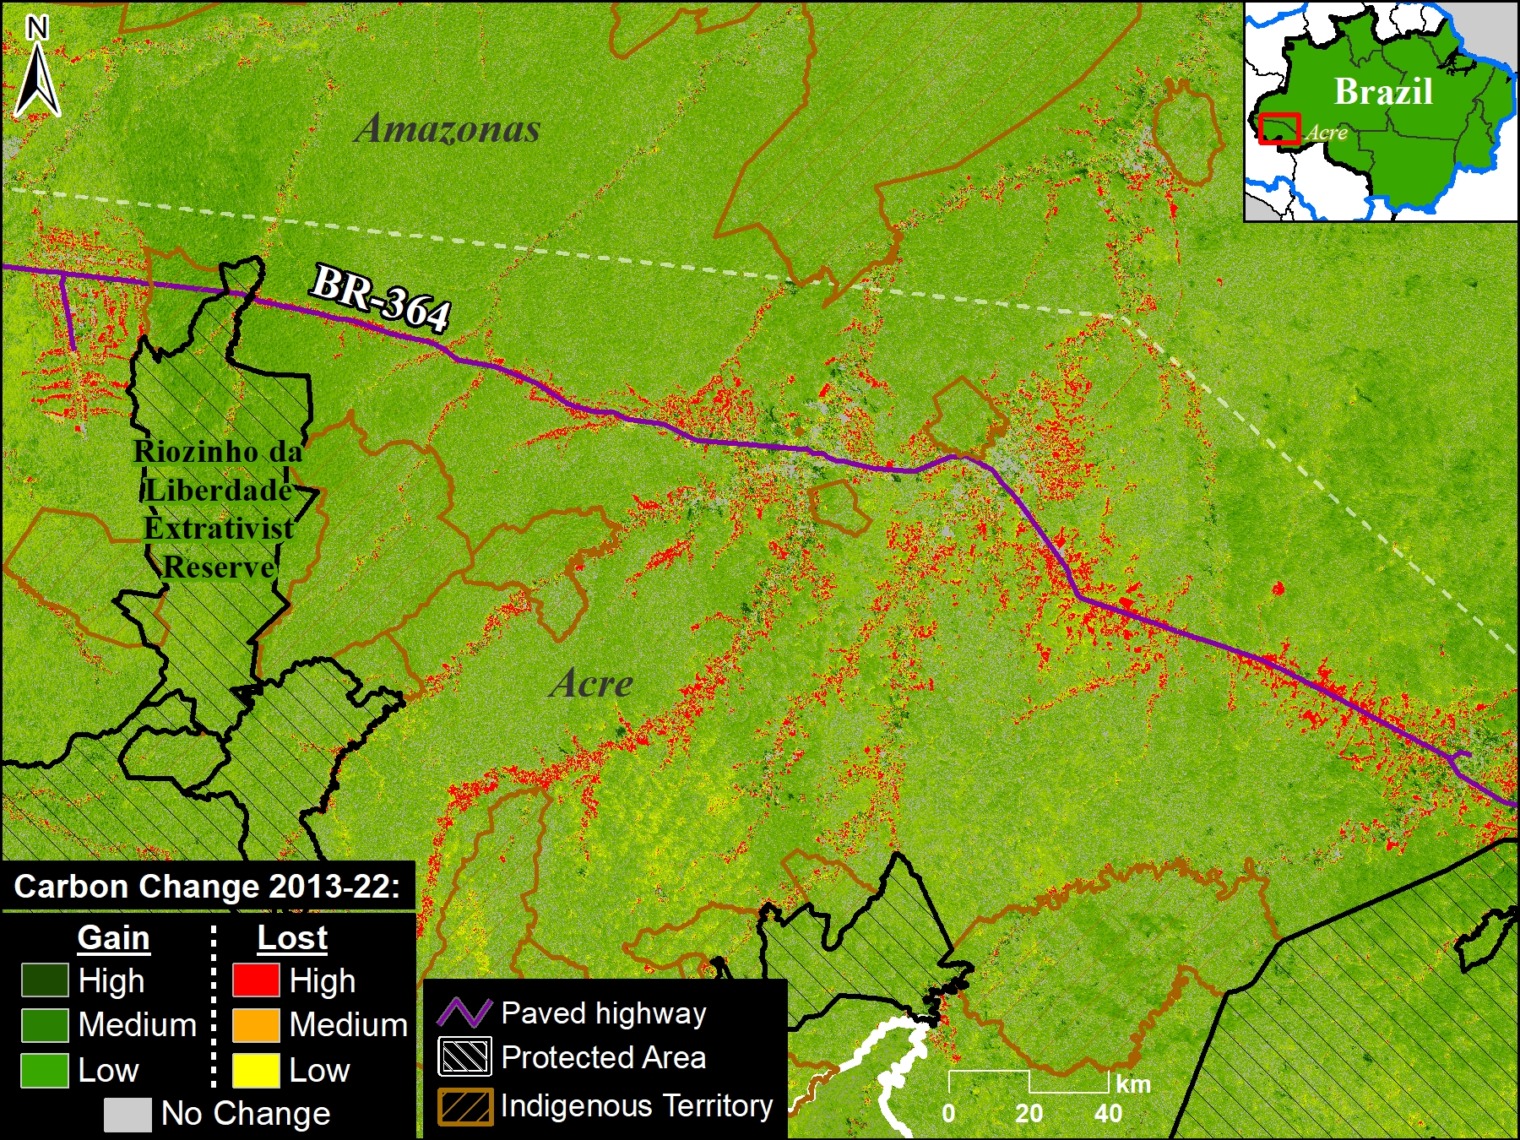
Figure 1D. Carbon loss along BR-364 in the southwest Brazilian Amazon. Source: ACA/MAAP, Planet.
Figure 1D shows the carbon emissions along road BR-364 that crosses the state of Acre in the southwest Brazilian Amazon.
This road was opened in the 1960s and paved in the 1980s.
E. Brazil – Road BR-319
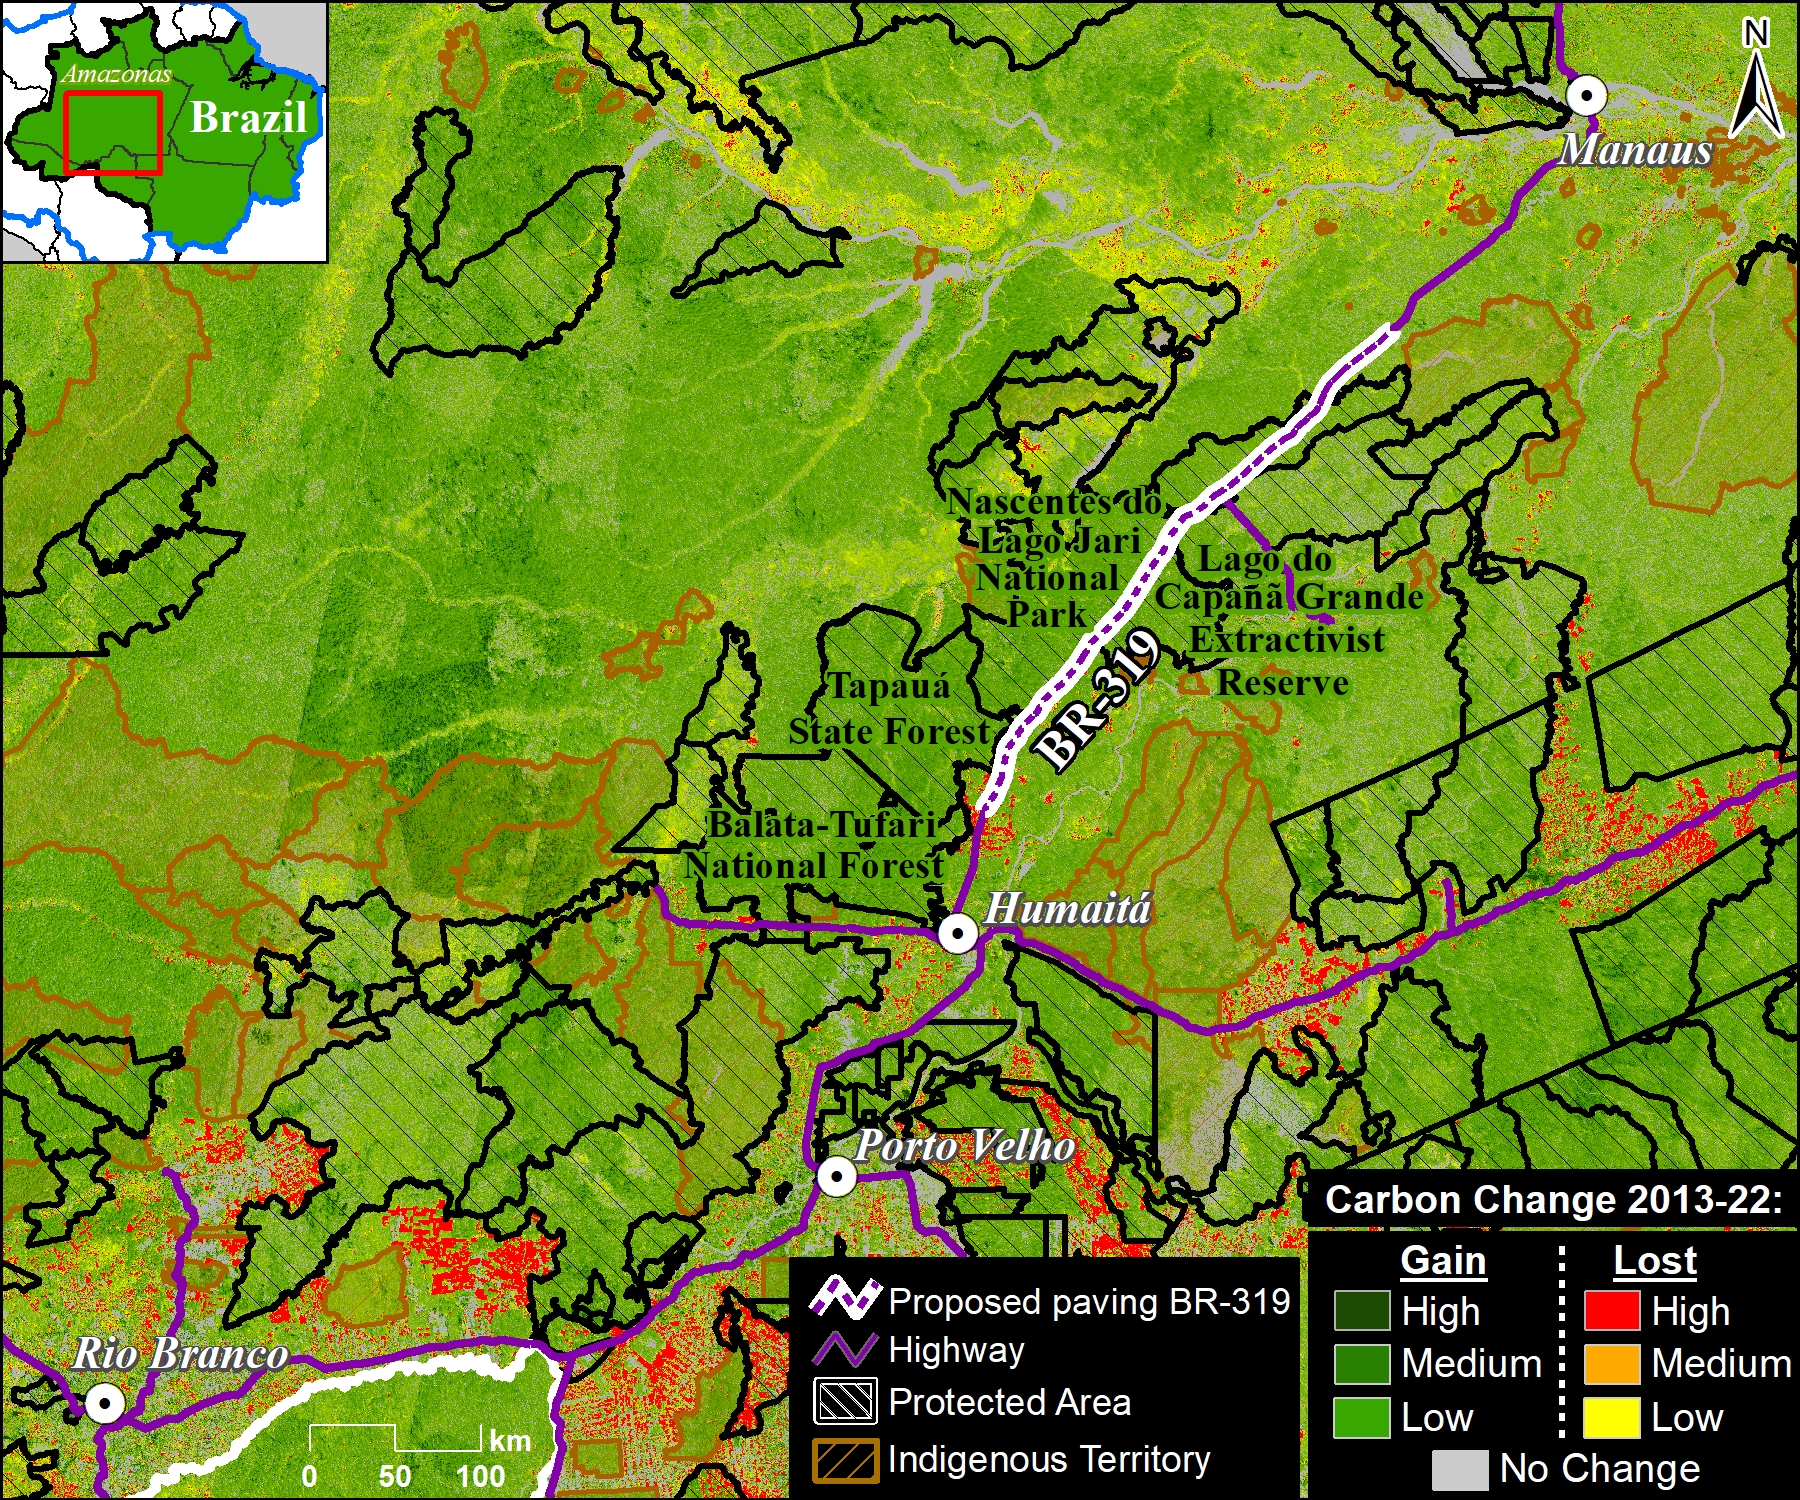
Figure 1E. Carbon loss along paved roads. Source: ACA/MAAP, Planet.
Figure 1E shows a controversial road paving project that would effectively link the arc of deforestation to the south with more intact forests to the north in Amazonas and Roraima states.
Note that the current carbon loss is concentrated along the paved roads.
The paving of road BR-319 has recently caused headlines as President Luiz Inácio Lula da Silva recently authorized the paving of 20 km of the road and plans to bid for an additional 32 km (thus, paving of 52 km in total).
Modeling studies predict extensive new deforestation from this road construction, and thus additional associated carbon loss.
F. Brazil – Road BR-163
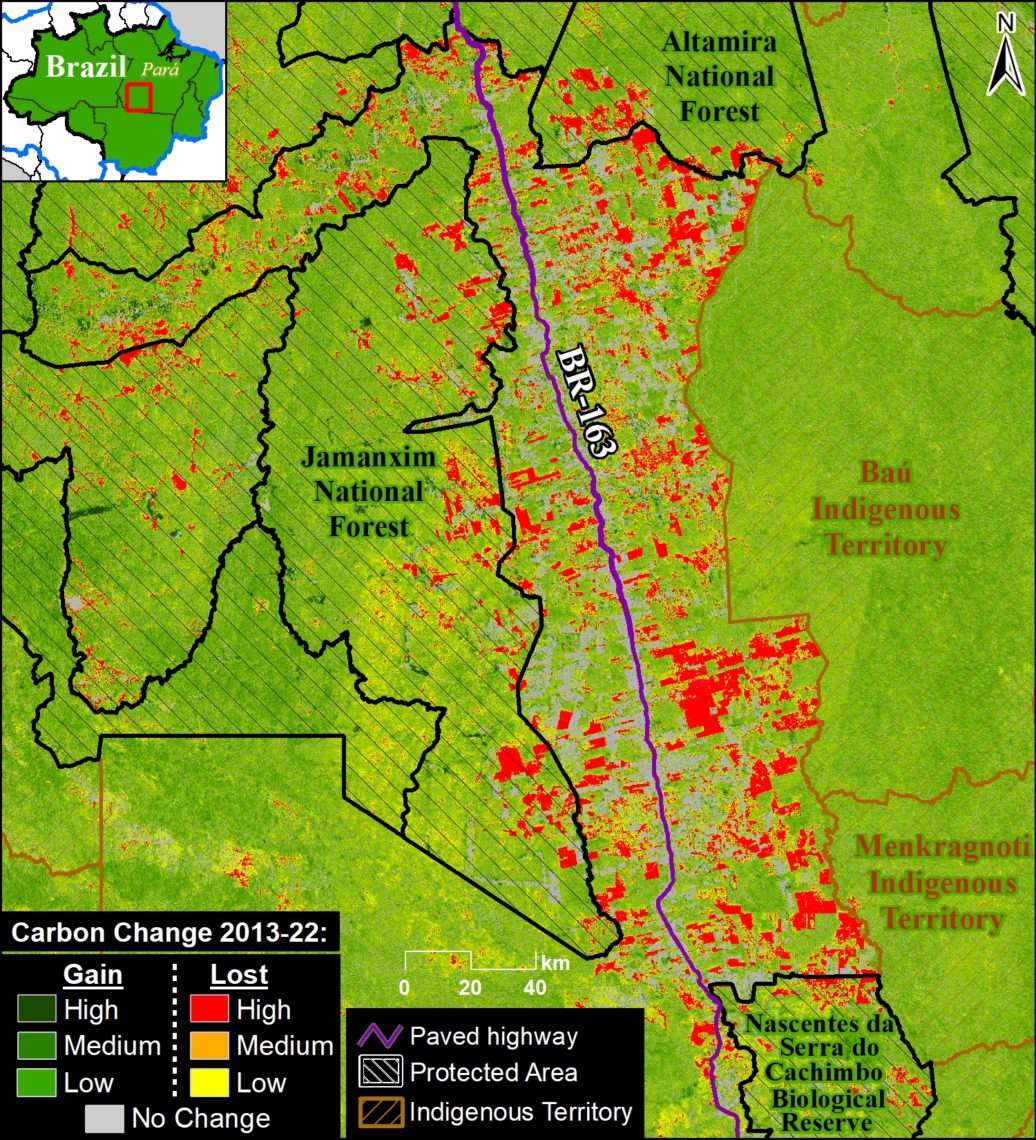
Figure 1F. Carbon loss along BR-163 in the eastern Brazilian Amazon. Source: ACA/MAAP, Planet.
Figure 1F shows the extensive carbon emissions (71.4 million metric tons) along a recently paved stretch of road BR-163 which crosses the state of Pará in the eastern Brazilian Amazon.
Importantly, this stretch of road has been presented as a case study of what may happen along road BR-319 if it is paved.
Carbon Gain
We can also calculate the carbon gain from both secondary and primary forests. These cases include forest gain from remote primary forests that may be good candidates for the HIFOR initiative.
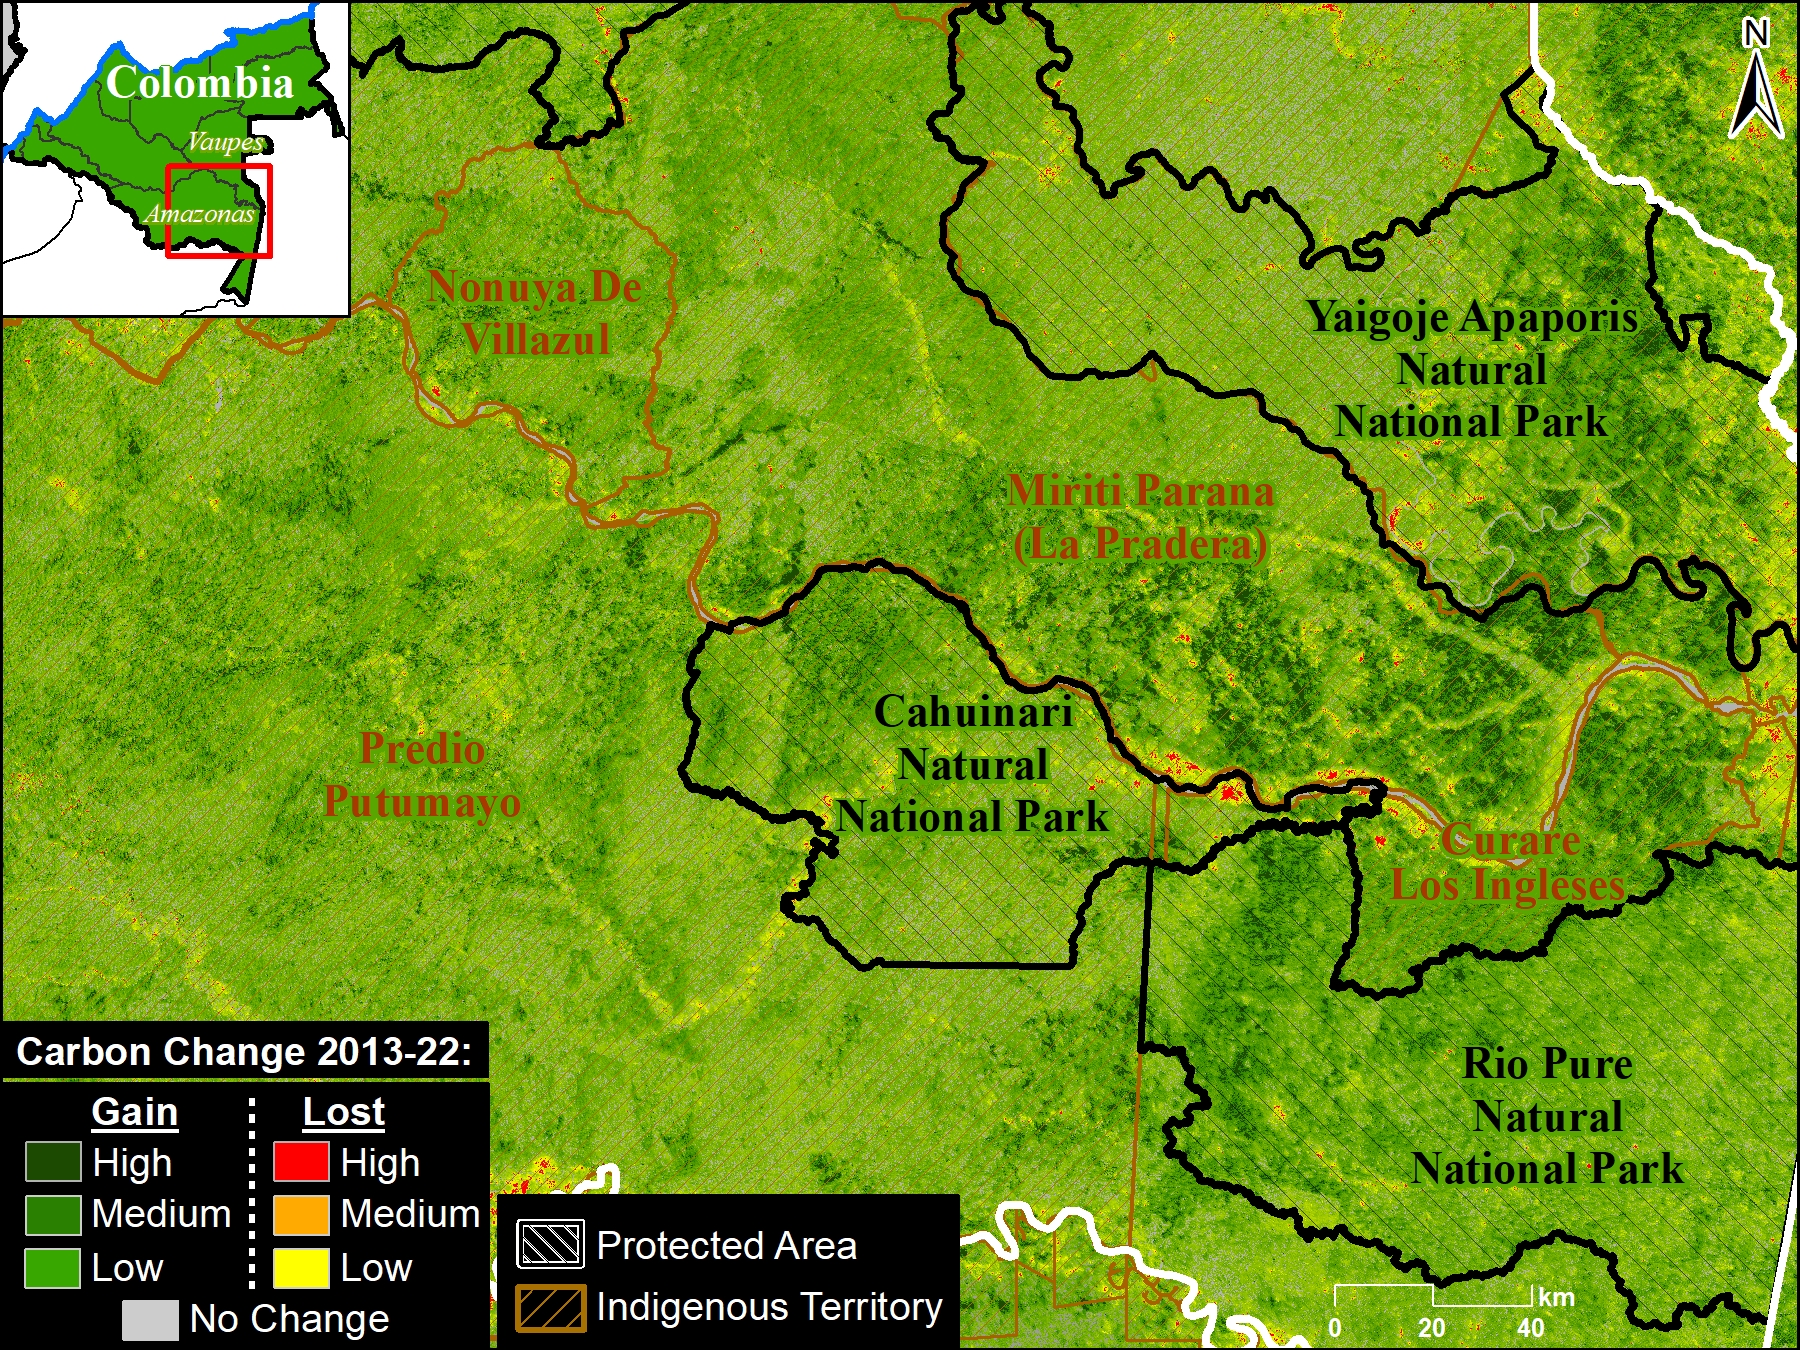
Figure 1G. Carbon gains in the southeast Colombian Amazon. Source: ACA/MAAP, Planet.
G. Southeast Colombia
Figure 1G shows the carbon gain of over 52.5 million metric tons in the remote southeast Colombian Amazon.
This area is anchored by three national parks and several large indigenous territories.
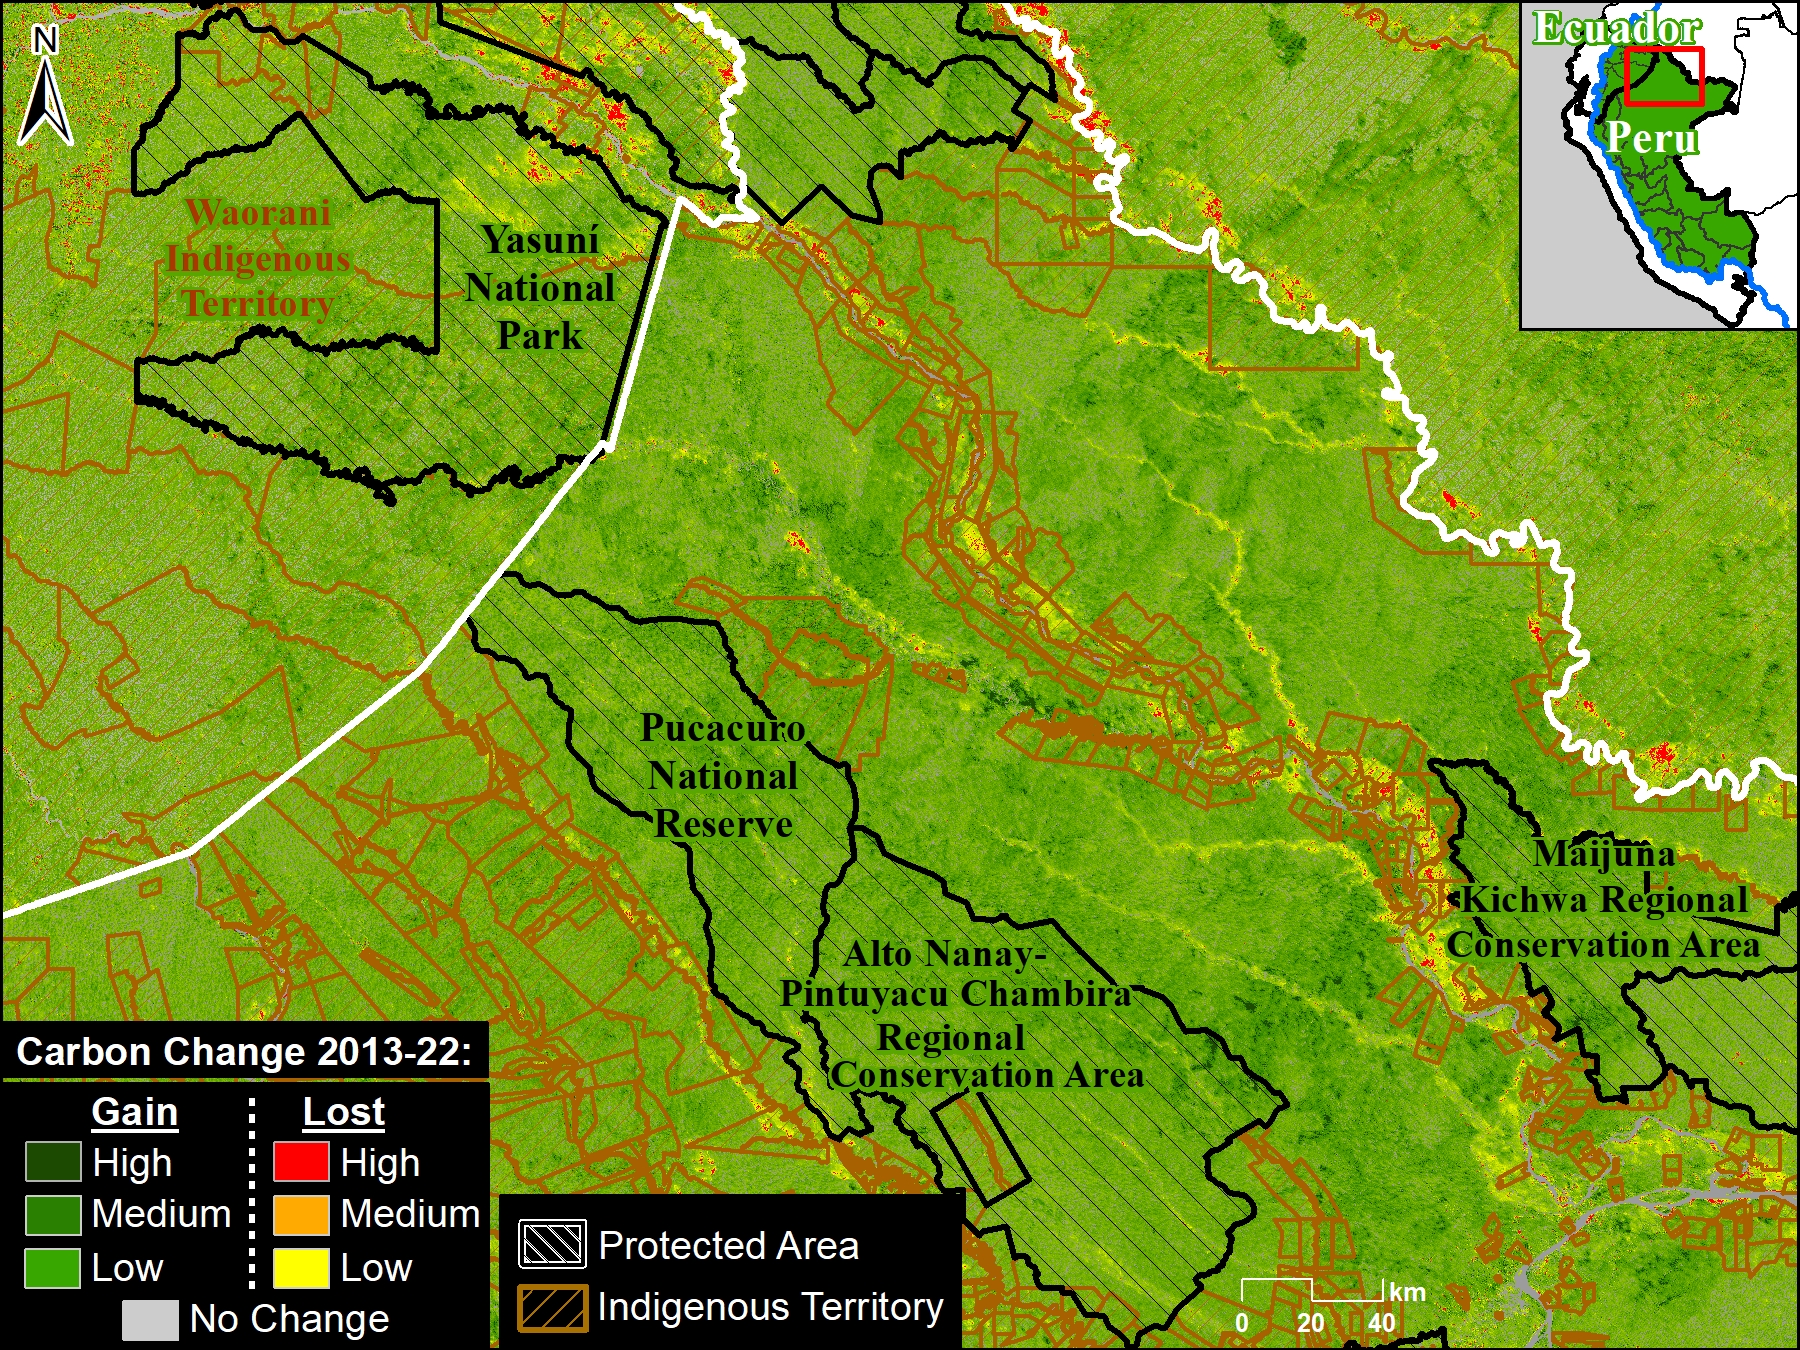
Figure 1H. Carbon gains along the border of eastern Ecuador and northern Peru. Source: ACA/MAAP, Planet.
H. Ecuador – Peru border
Figure 1H shows the carbon gain of nearly 40 million metric tons along the border in eastern Ecuador and northern Peru.
Note this area is anchored by numerous protected areas, including Yasuni National Park in Ecuador and Pucacuro National Reserve in Peru, and Indigenous territories.
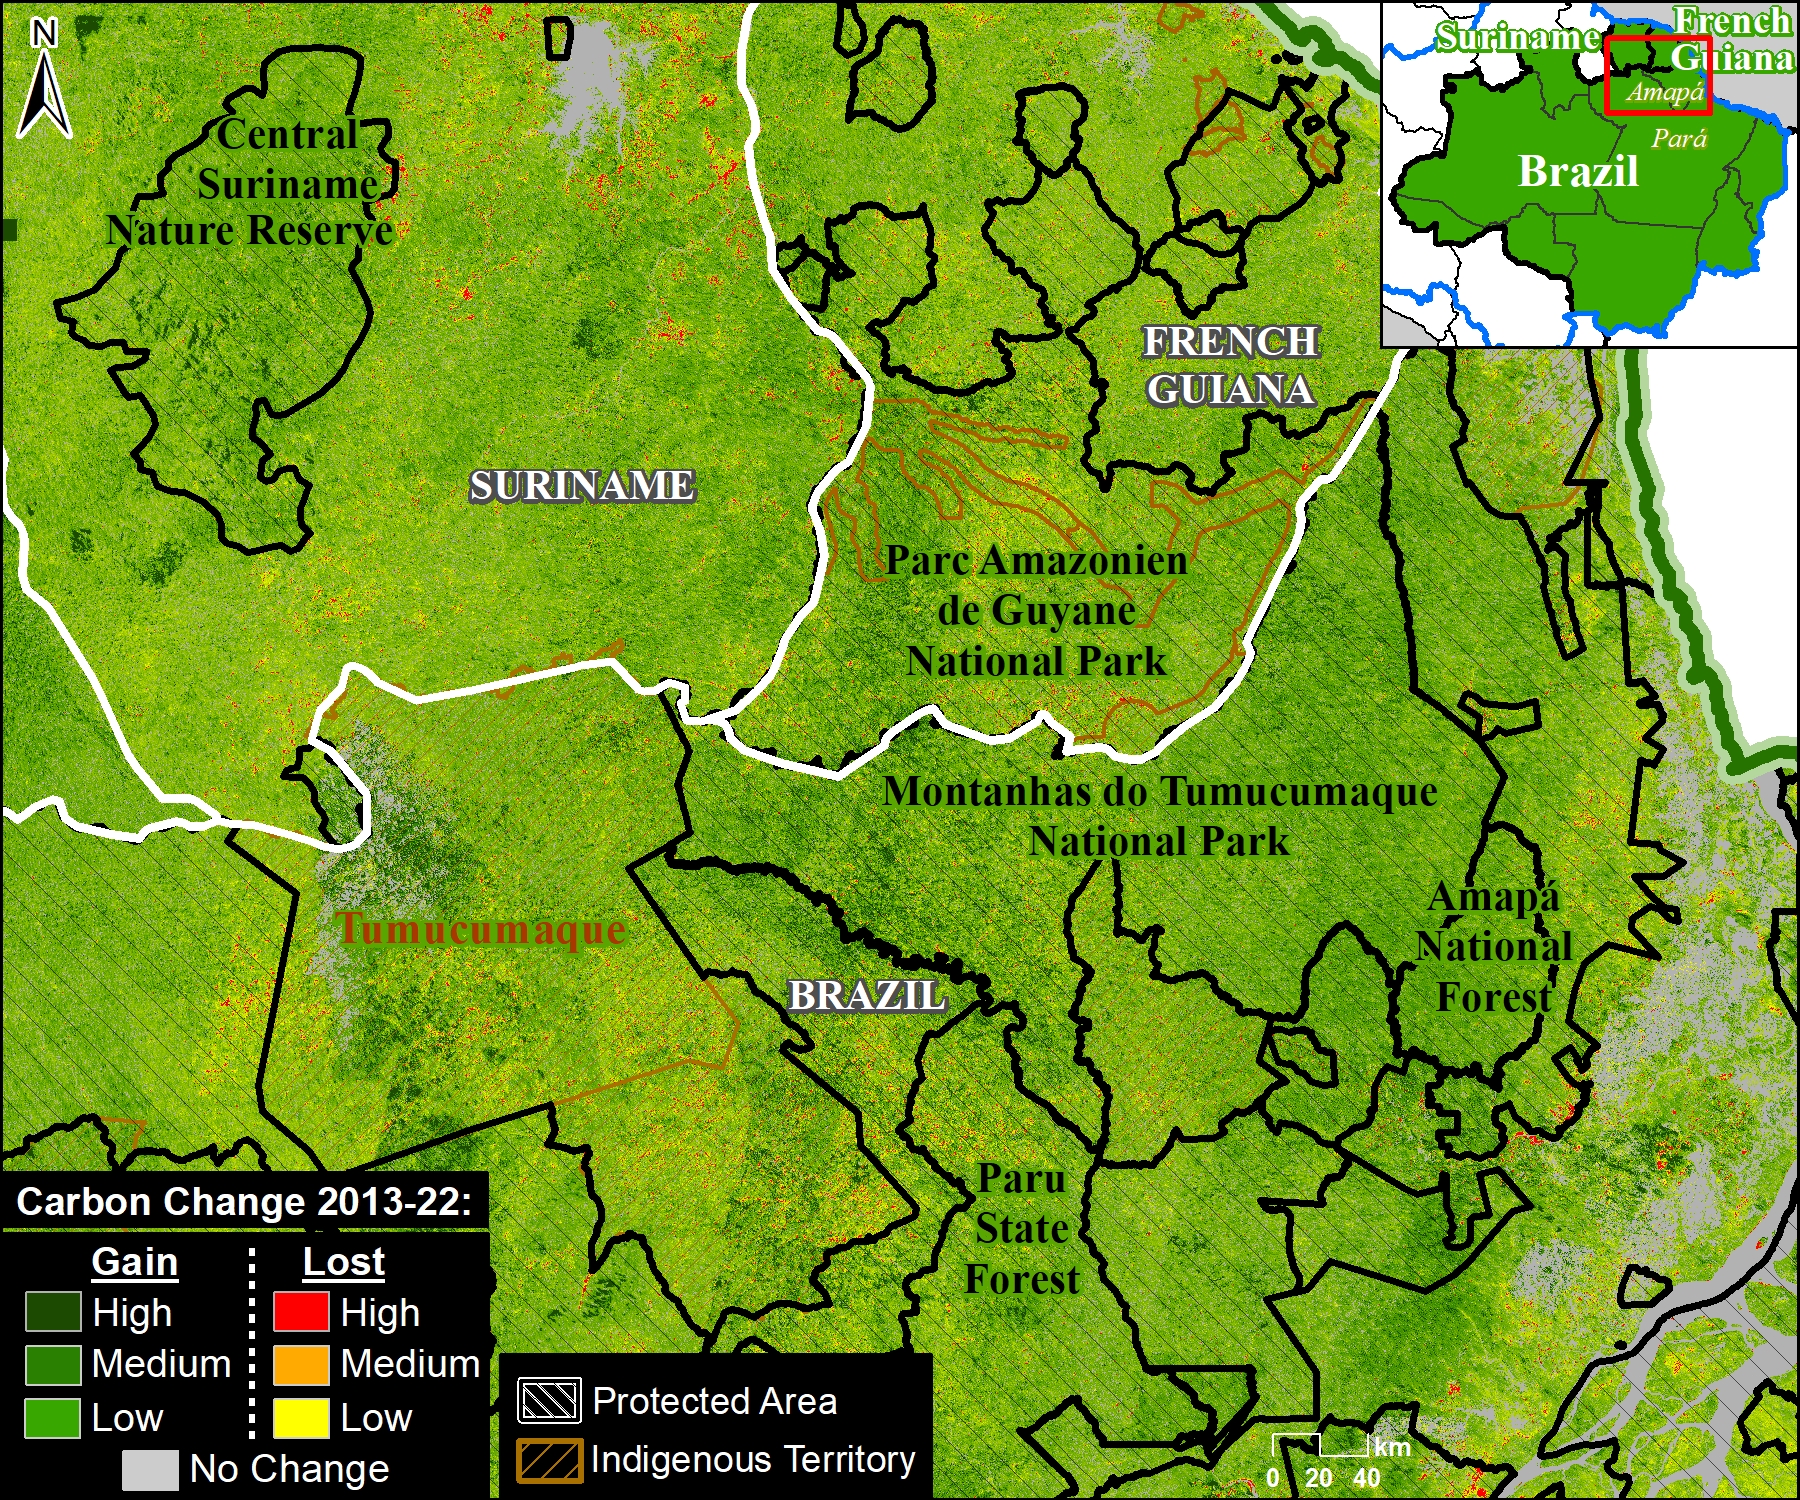
Figure 1I. Carbon gains in the tri-border region of the northeast Amazon. Source: ACA/MAAP, Planet.
I. Northeast Amazon
Figure 1I shows the carbon gain of 164.7 million metric tons in the tri-border region of the northeast Amazon (northern Brazil, French Guiana, and Suriname).
For example, note the carbon gains in Montanhas do Tumucumaque National Park and Tumucumaque Indigenous territory in northeast Brazil.
Also note that this was an Amazonian “peak carbon area,” as described in MAAP #217.
Annex 1
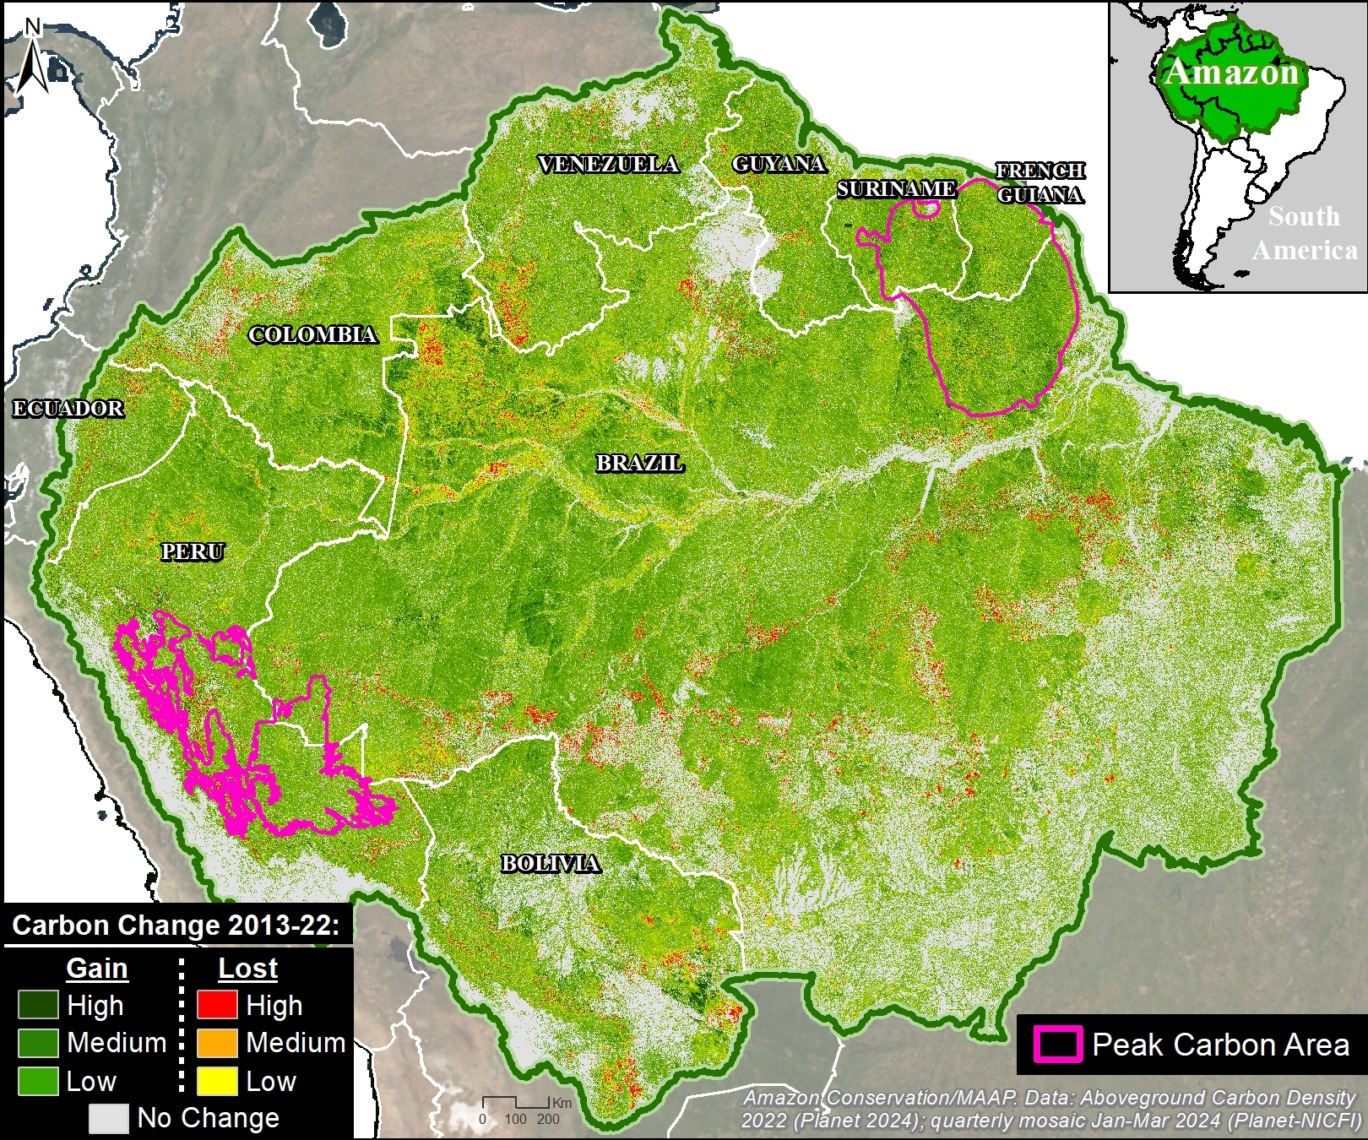
Annex 1. Peak carbon areas in relation to the carbon loss and gain data. Source: Amazon Conservation/MAAP, Planet.
In part 2 of this series (MAAP #217), we highlighted which parts of the Amazon are currently home to the highest (peak) aboveground carbon levels.
Annex 1 shows these peak carbon areas in relation to the carbon loss and gain data presented above.
Note that both peak carbon areas (southeast and northeast Amazon) are largely characterized by carbon gain.
Annex 2
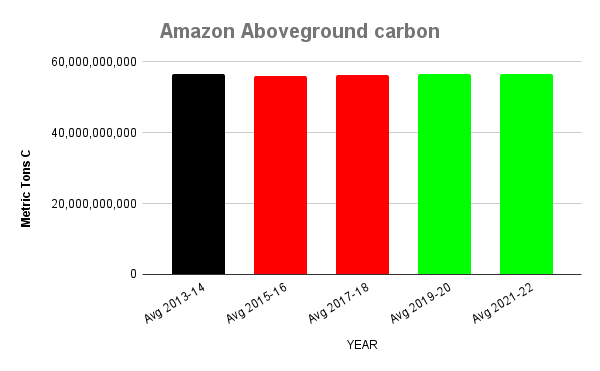
Annex 2. Amazon biome functions as a narrow carbon sink from 2013 to 2022, but became a source in between. Data: Planet, ACA/MAAP.
Annex 2 shows all ten years of aboveground carbon data grouped by two-year intervals (thus, it is an extension of Graph 1 above, adding data for the intermediate years).
In this context, black indicates our baseline of 2013-14, red indicates a decrease from the baseline (carbon source), and green indicates an increase from the baseline (carbon sink).
Importantly, there was a decrease in aboveground carbon from 2015-18, which likely reflects the severe droughts of 2015 and 2016 and subsequent severe fire seasons of 2016 and 2017. Aboveground carbon rebounded from 2019-22.
This trend supports the hypothesis that the Amazon biome is teetering on being an aboveground carbon source vs sink.
It also raises the possibility that the Amazon may return to being a carbon source following the intense drought and fires of 2024.
.
.
Notes
1 In part 1 of this series (MAAP #215), we found the Amazon “is still functioning as a critical carbon sink”. As pointed out in a companion blog by Planet, however, the net carbon sink of +64 million metric tons is quite small relative to the total estimate of 56.8 billion metric tons of aboveground carbon across the Amazon. That is a net positive change of just +0.1%. As the blog notes, that’s a “very small buffer” and there’s “reason to worry that the biome could flip from sink to source with ongoing deforestation.”
2 High Integrity Forest (HIFOR) units are a new, non-offset asset that recognizes and rewards the essential climate services and biodiversity conservation that intact tropical forests provide, including ongoing net removal of CO2 from the atmosphere. HIFOR rewards the climate services that intact tropical forests provide, including ongoing net carbon removal from the atmosphere, and complements existing instruments to reduce emissions from deforestation and degradation (REDD+) by focusing on tropical forests that are largely undegraded. A HIFOR unit represents a hectare of well-conserved, high-integrity tropical forest where ‘well-conserved’ means that high ecological integrity is maintained over a decade of monitoring as part of equitable, effective management of a site and ‘high ecological integrity’ means a score of >9.6 on the Forest Landscape Integrity Index. For more information see https://www.wcs.org/our-work/climate-change/forests-and-climate-change/hifor
3 Two additional important references regarding HIFOR methodology and application:
High Integrity Forest Investment Initiative, Methodology for HIFOR units, April 2024. Downloaded from https://www.wcs.org/our-work/climate-change/forests-and-climate-change/hifor
Forest Landscape Integrity Index metric used by HIFOR: www.forestintegrity.com
4 In Planet’s Forest Carbon Diligence product, carbon loss and gain are detected via changes in canopy cover and canopy height during the given periods (in this case, 2013 vs 2022).
Acknowledgments
Through a generous sharing agreement with the satellite company Planet, we have been granted access to this data across the entire Amazon biome for the analysis presented in this series.
We also thank D. Zarin (WCS) for helpful comments regarding the implications of our findings for the HIFOR initiative.
This report was made possible by the generous support of the Norwegian Agency for Development Cooperation (NORAD)
![]()
Citation
Finer M, Mamani N, Anderson C, Rosenthal A (2024) Carbon across the Amazon (part 3): Key Cases of Carbon Loss & Gain. MAAP: 220.
MAAP #217: Carbon across the Amazon (part 2): Peak Carbon Areas
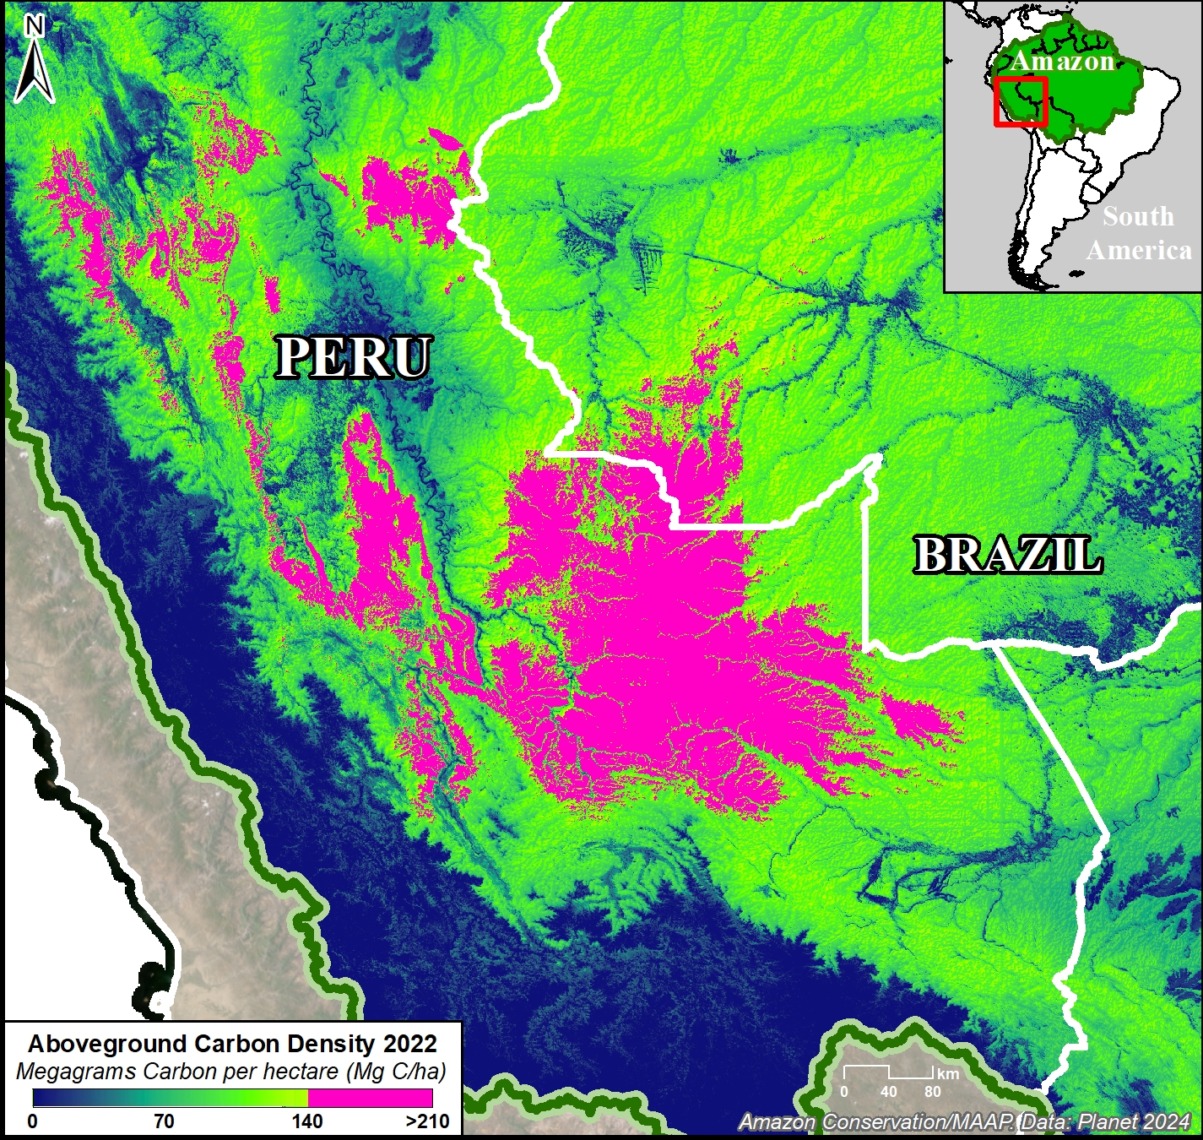
Figure 1. Example of peak carbon areas in southern Peru and adjacent western Brazil. Data: Planet.
In part 1 of this series (MAAP #215), we introduced a critical new resource (Planet Forest Carbon Diligence) that provides wall-to-wall estimates for aboveground carbon density at an unprecedented 30-meter resolution. This data uniquely merges machine learning, satellite imagery, airborne lasers, and a global biomass dataset from GEDI, a NASA mission.4
In that report, we showed that the Amazon contains 56.8 billion metric tons of aboveground carbon (as of 2022), and described key patterns across all nine countries of the Amazon biome over the past decade.
Here, in part 2, we focus on the peak carbon areas of the Amazon that are home to the highest aboveground carbon levels.
These peak carbon areas correspond to the upper one-third of aboveground carbon density levels (>140 metric tons per hectare).1
They likely have experienced minimal degradation (such as selective logging, fire, and edge/fragmentation effects)2 and are thus a good proxy for high-integrity forests.
Figure 1 shows an important example of peak carbon areas in southern Peru and adjacent western Brazil.
The peak carbon areas are often found in the remote primary forests of protected areas and Indigenous territories, but some are located in forestry concessions (specifically, logging concessions) or undesignated lands (also referred to as undesignated public forests).
Our goal in this report is to leverage unprecedented aboveground carbon data to reinforce the importance of these designated areas and draw attention to the remaining undesignated lands.
For example, peak carbon areas would be excellent candidates for the High Integrity Forest (HIFOR) initiative, a new financing instrument that uniquely focuses on maintaining intact tropical forests.3 HIFOR rewards the climate services that intact tropical forests provide, including ongoing net carbon removal from the atmosphere, and complements existing instruments to reduce emissions from deforestation and degradation (REDD+) by focusing on tropical forests that are largely undegraded.
Below, we detail the major findings and then zoom in on the peak carbon areas in the northeast and southwest Amazon.
Peak Carbon Areas in the Amazon
The Base Map below illustrates our major findings.
The peak carbon areas (>140 metric tons per hectare; indicated in pink) are concentrated in the southwest and northeast Amazon, covering 27.8 million hectares (11 million ha in the southwest and 16.8 million ha in the northeast).
k
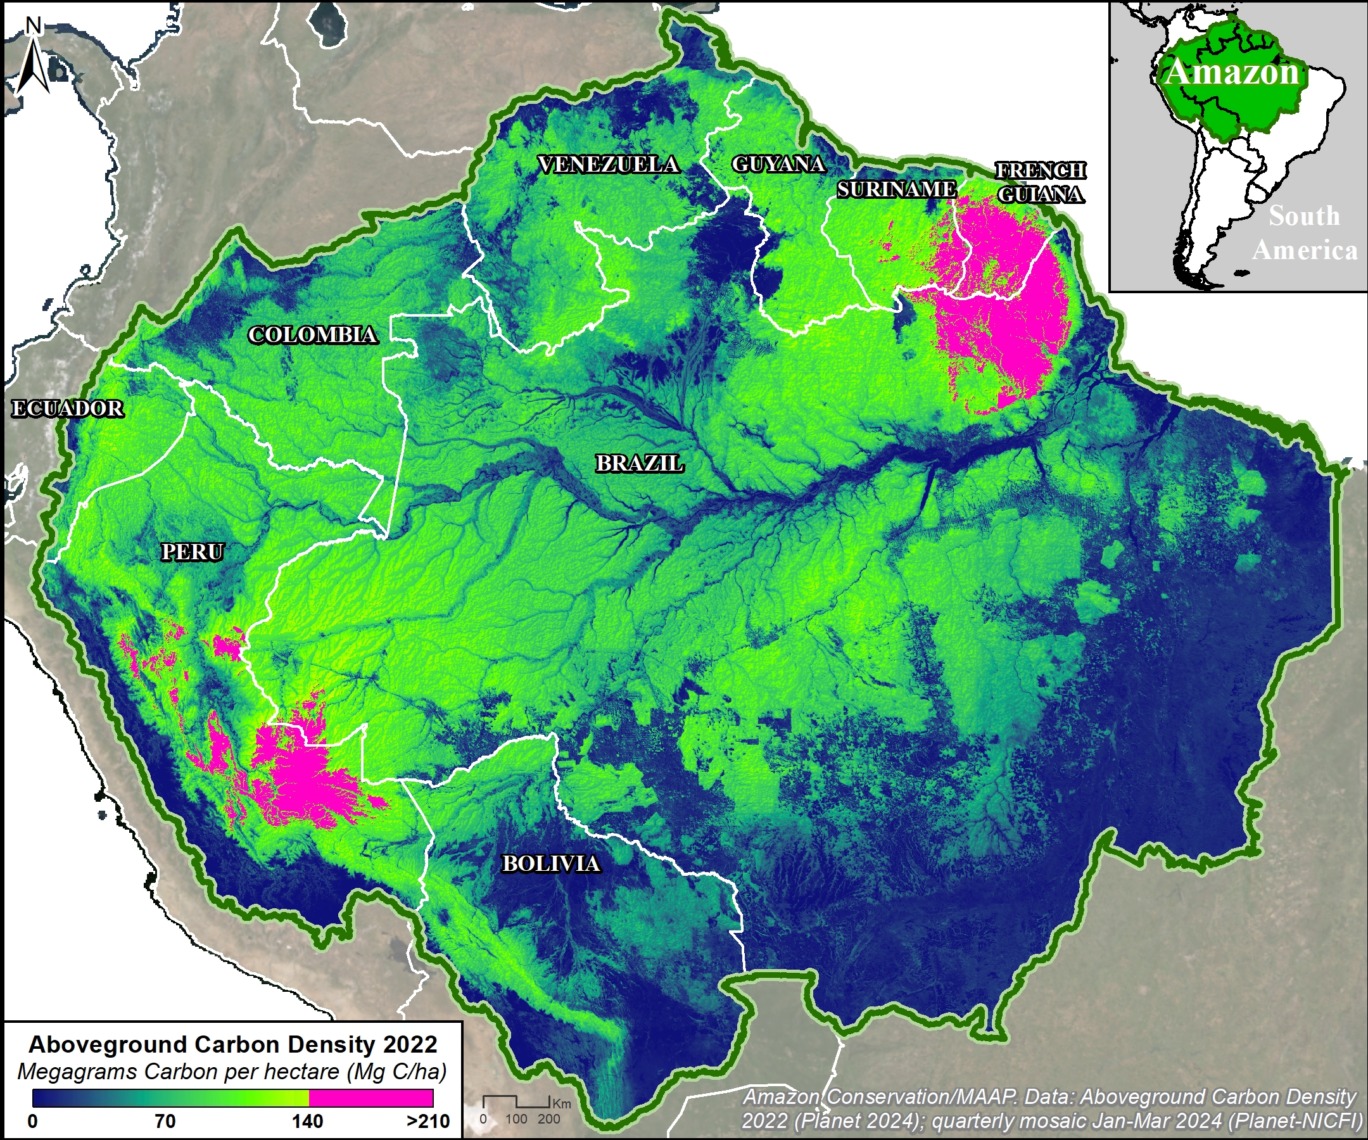
Base Map. Planet Forest Carbon Diligence across the Amazon biome for the year 2022. Data: Planet.
In the southwest Amazon, peak carbon levels are found in southern & central Peru, and adjacent western Brazil.
In the northeast Amazon, peak carbon levels are found in northeast Brazil, much of French Guiana, and parts of Suriname.
By country, Brazil and Peru have the largest area of peak carbon (10.9 million and 10.1 million hectares respectively), followed by French Guiana (4.7 million ha), and Suriname (2.1 million ha).
Protected areas and Indigenous territories cover much (61%) of the peak carbon area (16.9 million hectares).
The remaining 39% remains unprotected, and arguably threatened, in undesignated lands (9.4 million hectares) and forestry concessions (1.5 million ha), respectively.
In addition, high carbon areas (>70 metric tons per hectare; indicated by the greenish-yellow coloration in the Base Map) are found in all nine countries of the Amazon biome, notably Colombia, Ecuador, Bolivia, Venezuela, and Guyana.
Southwest Amazon
Southern Peru
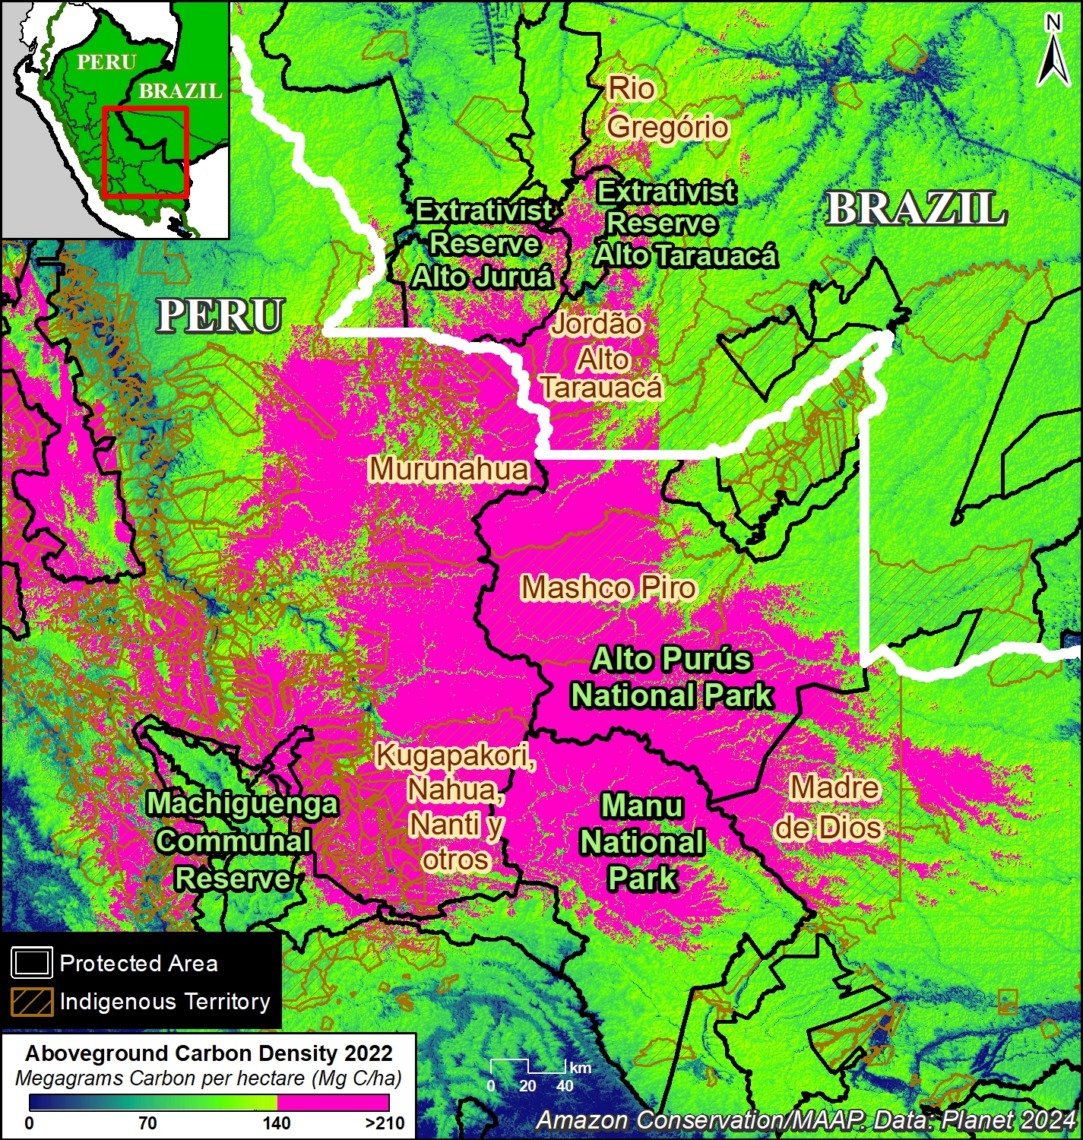
Figure 2a. Peak carbon area in the southern Peruvian Amazon. Data: Planet, SERNANP, RAISG.
Figure 2a zooms in on the peak carbon area covering 7.9 million hectares in southern Peru (regions of Madre de Dios, Cusco, and Ucayali) and adjacent southwest Brazil (Acre).
Several protected areas (such as Manu and Alto Purús National Parks, and Machiguenga Communal Reserve) anchor this area.
It is also home to numerous Indigenous territories (such as Mashco Piro, Madre de Dios, and Kugapakori, Nahua, Nanti & Others Indigenous Reserves).
Figure 2b highlights the major land designations within the peak carbon area of southern Peru.
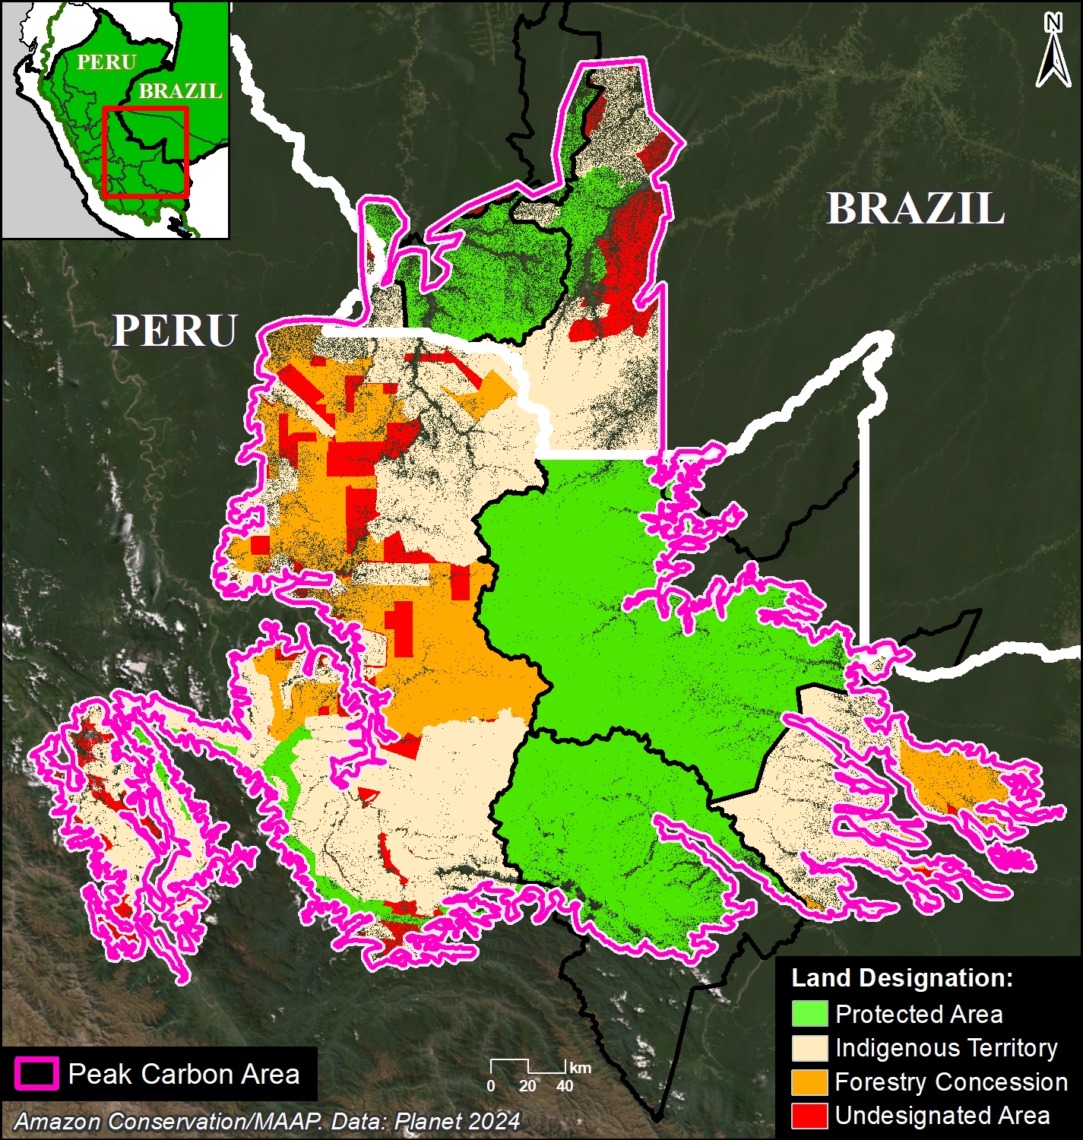
Figure 2b. Peak carbon areas in southern Peru.
Protected areas and Indigenous territories cover 77% of this area (green and brown, respectively).
The remaining 23% could be considered threatened, as they are located in forestry concessions or undesignated lands (orange and red, respectively). Thus, these areas are ideal candidates for increased protection to maintain their peak carbon levels.
Figure 2b. Peak carbon areas (outlined in pink), categorized by land designation in southern Peru and adjacent western Brazil. Data: Planet, NICFI, SERNANP, SERFOR, RAISG.
Central Peru
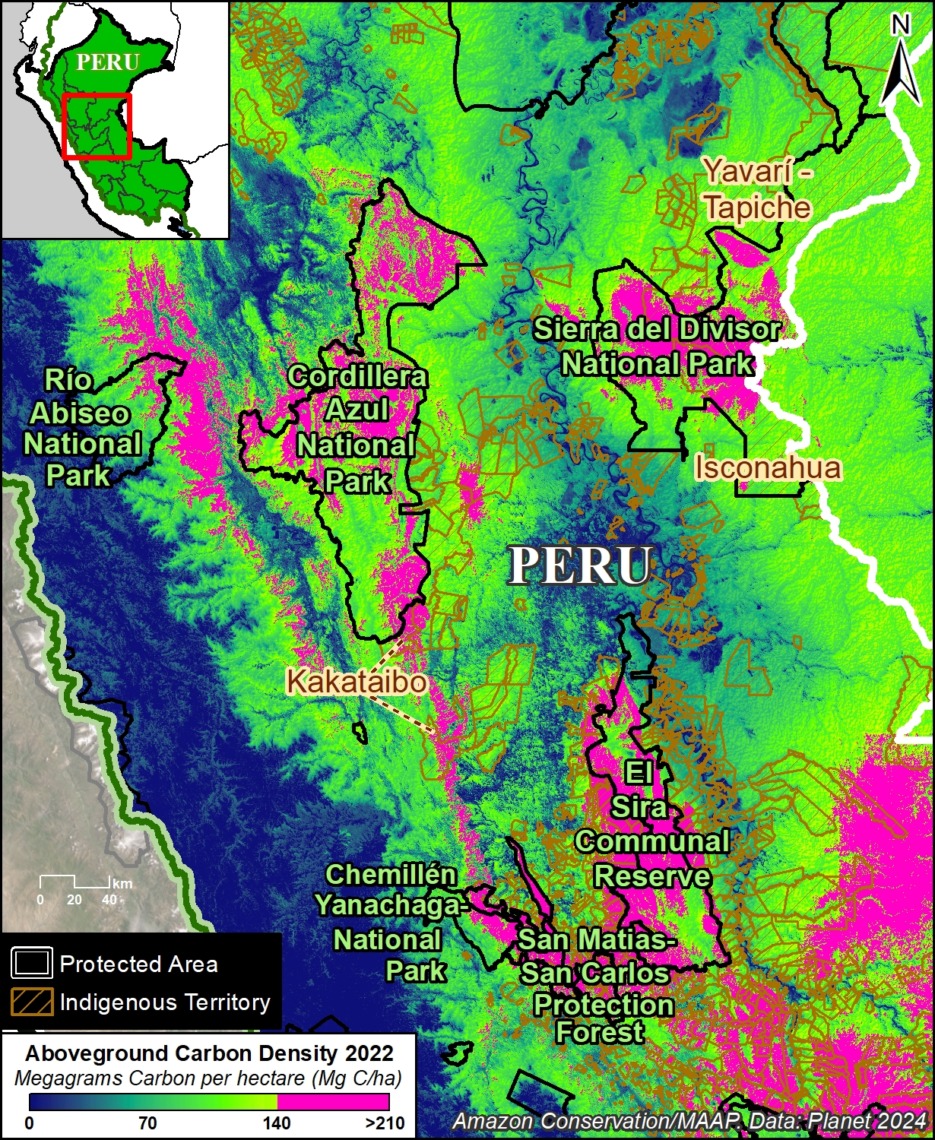
Figure 3a. Peak carbon area in the central Peruvian Amazon. Data: Planet, SERNANP, RAISG.
Figure 3a zooms in on the peak carbon area in the central Peruvian Amazon, which covers 3.1 million hectares in the regions of Ucayali, Loreto, Huánuco, Pasco, and San Martin.
Several protected areas (including Sierra del Divisor, Cordillera Azul, Rio Abiseo, and Yanachaga–Chemillén National Parks, and El Sira Communal Reserve) anchor this area.
It is also home to numerous Indigenous territories (such as Kakataibo, Isconahua, and Yavarí Tapiche Indigenous Reserves).
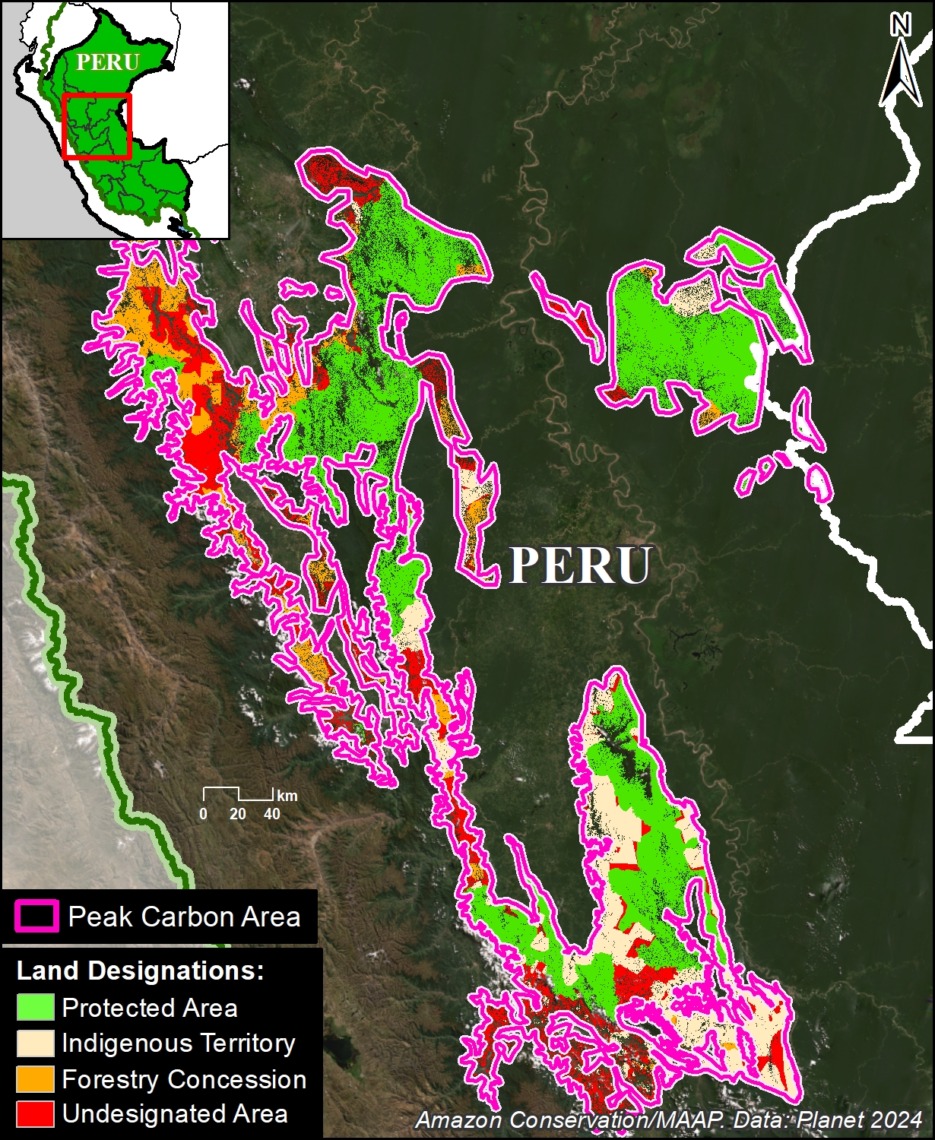
Figure 3b. Peak carbon areas categorized by land designation in central Peru.
Figure 3b highlights the major land designations within the peak carbon area of central Peru.
Protected areas and Indigenous territories cover 69% of this area (green and brown, respectively).
The remaining 31% could be considered threatened, as they are located in forestry concessions or undesignated lands (orange and red, respectively), and are ideal candidates for increased protection.
Figure 3b. Peak carbon areas (outlined in pink), categorized by land designation in central Peru. Data: Planet, NICFI, SERNANP, SERFOR, RAISG.
Northeast Amazon
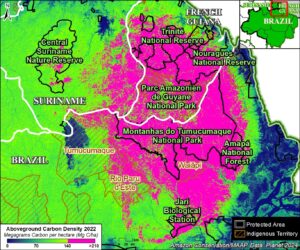
Figure 4a. Peak carbon area in the tri-border region of the northeast Amazon. Data: Planet, RAISG.
Figure 4a zooms in on the peak carbon area in the tri-border region of the northeast Amazon, which covers 16.8 million hectares in northern Brazil, French Guiana, and Suriname.
Several protected areas (including Montanhas do Tumucumaque National Park in northeast Brazil, Amazonien de Guyane National Park in French Guiana, and Central Suriname Nature Reserve) anchor this area.
It is also home to numerous Indigenous territories (such as Tumucumaque, Rio Paru de Este, and Wayãpi in northeast Brazil).
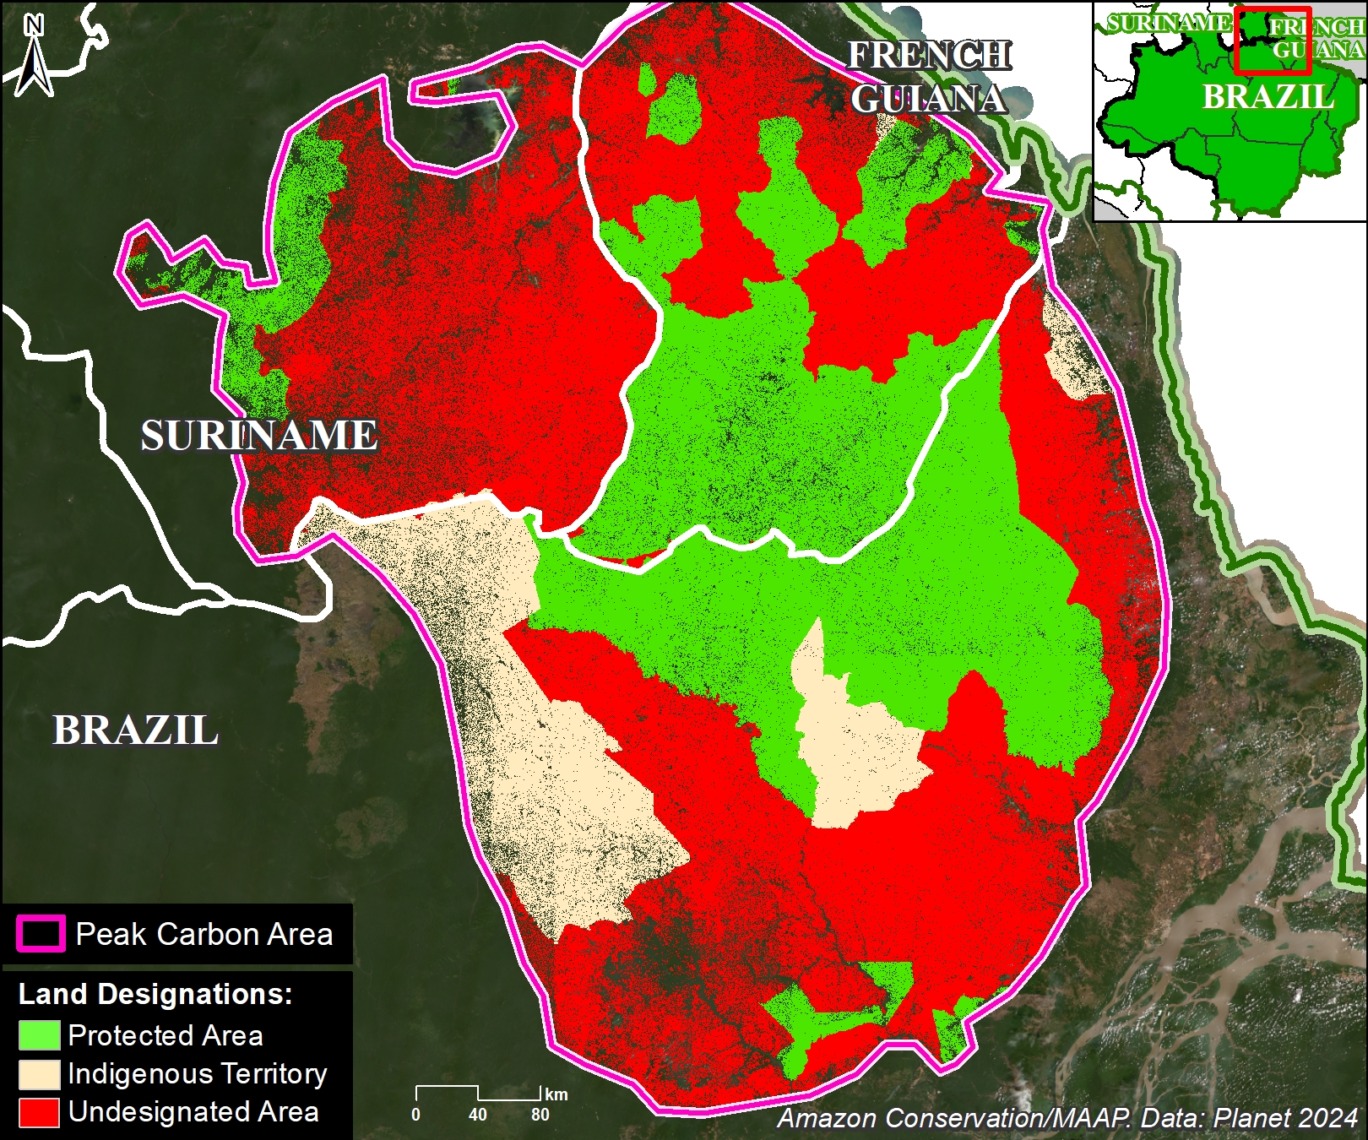
Figure 4b. Peak carbon areas (outlined in pink), categorized by land designation in northeast Amazon. Data: Planet, NICFI, RAISG.
Figure 4b highlights the major land designations within the peak carbon area of the northeast Amazon.
Protected areas and Indigenous territories cover just over half (51%) of this area (green and brown, respectively).
The remaining 49% could be considered threatened, as they are located in undesignated lands, and are ideal candidates for increased protection.
Notes
1 We selected this value (upper 33%) to capture the highest aboveground carbon areas and include a range of high carbon areas. Additional analyses could target different values, such as the highest 10% or 20% of aboveground carbon.
2 A recent paper documented a strong relationship between selective logging and aboveground carbon loss (Csillik et al. 2024, PNAS). The link between forest edges and carbon is presented in Silva Junior et al, Science Advances.
3 High Integrity Forest (HIFOR) units are a new tradable asset that recognizes and rewards the essential climate services and biodiversity conservation that intact tropical forests provide, including ongoing net removal of CO2 from the atmosphere. For more information see https://www.wcs.org/our-work/climate-change/forests-and-climate-change/hifor
4 For more information, see the “What is Forest Carbon Diligence?” section in this recent blog from Planet.
Citation
Finer M, Mamani N, Anderson C, Rosenthal A (2024) Carbon across the Amazon (part 2): Peak Carbon Areas. MAAP #217.
Acknowledgments
This report was made possible by the generous support of the Norwegian Agency for Development Cooperation (NORAD)
![]()


