In part 1 of this series (MAAP #215), we introduced a critical new resource (Planet Forest Carbon Diligence) that provides wall-to-wall estimates for aboveground carbon density at an unprecedented 30-meter resolution. This data uniquely merges machine learning, satellite imagery, airborne lasers, and a global biomass dataset from GEDI, a NASA mission.4
In that report, we showed that the Amazon contains 56.8 billion metric tons of aboveground carbon (as of 2022), and described key patterns across all nine countries of the Amazon biome over the past decade.
Here, in part 2, we focus on the peak carbon areas of the Amazon that are home to the highest aboveground carbon levels.
These peak carbon areas correspond to the upper one-third of aboveground carbon density levels (>140 metric tons per hectare).1
They likely have experienced minimal degradation (such as selective logging, fire, and edge/fragmentation effects)2 and are thus a good proxy for high-integrity forests.
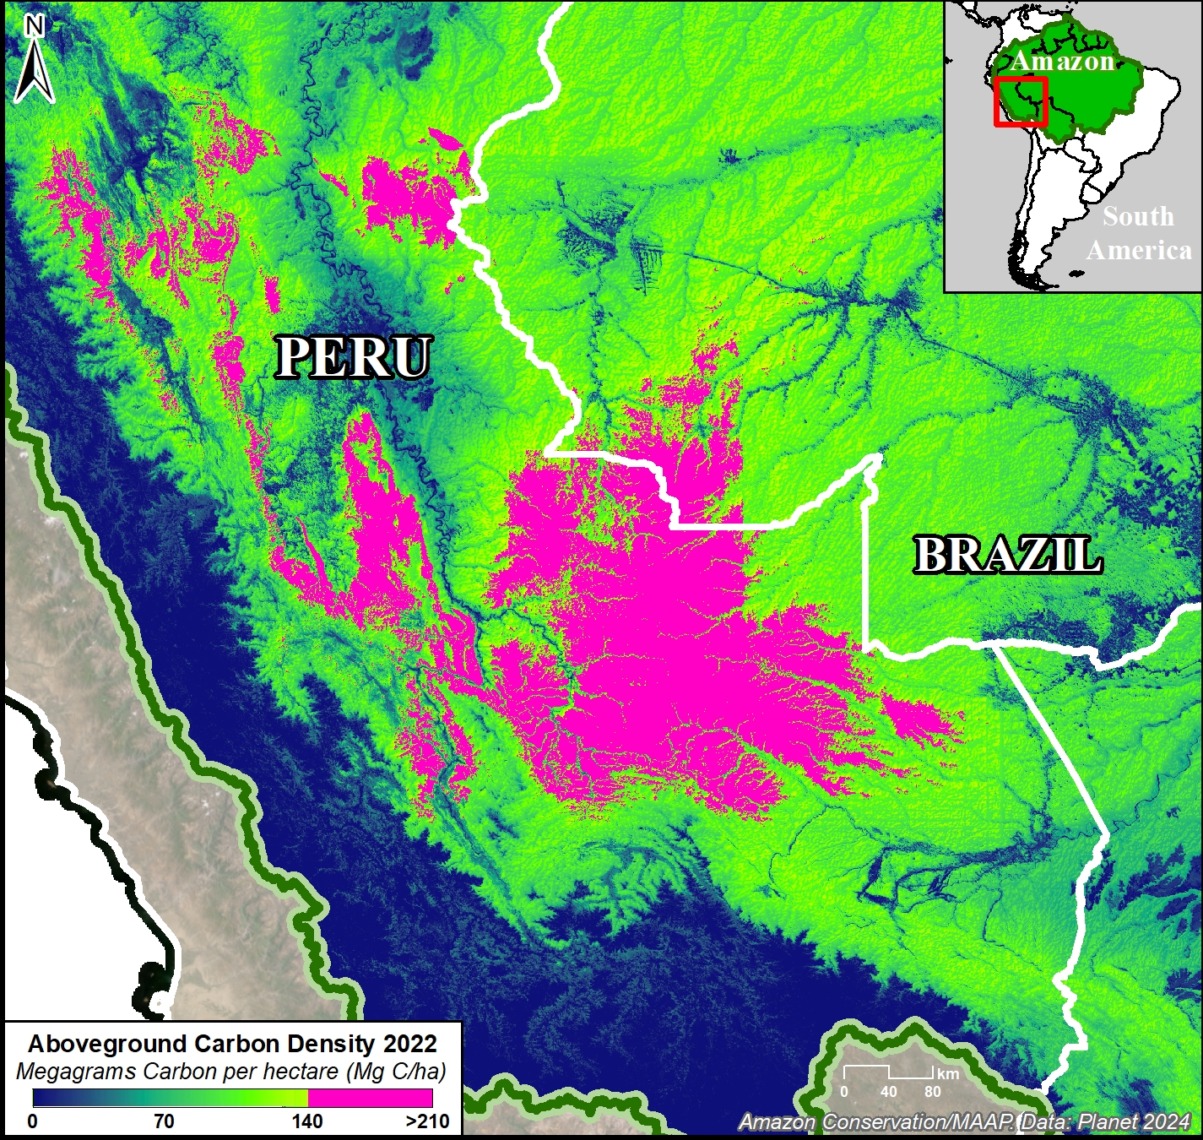
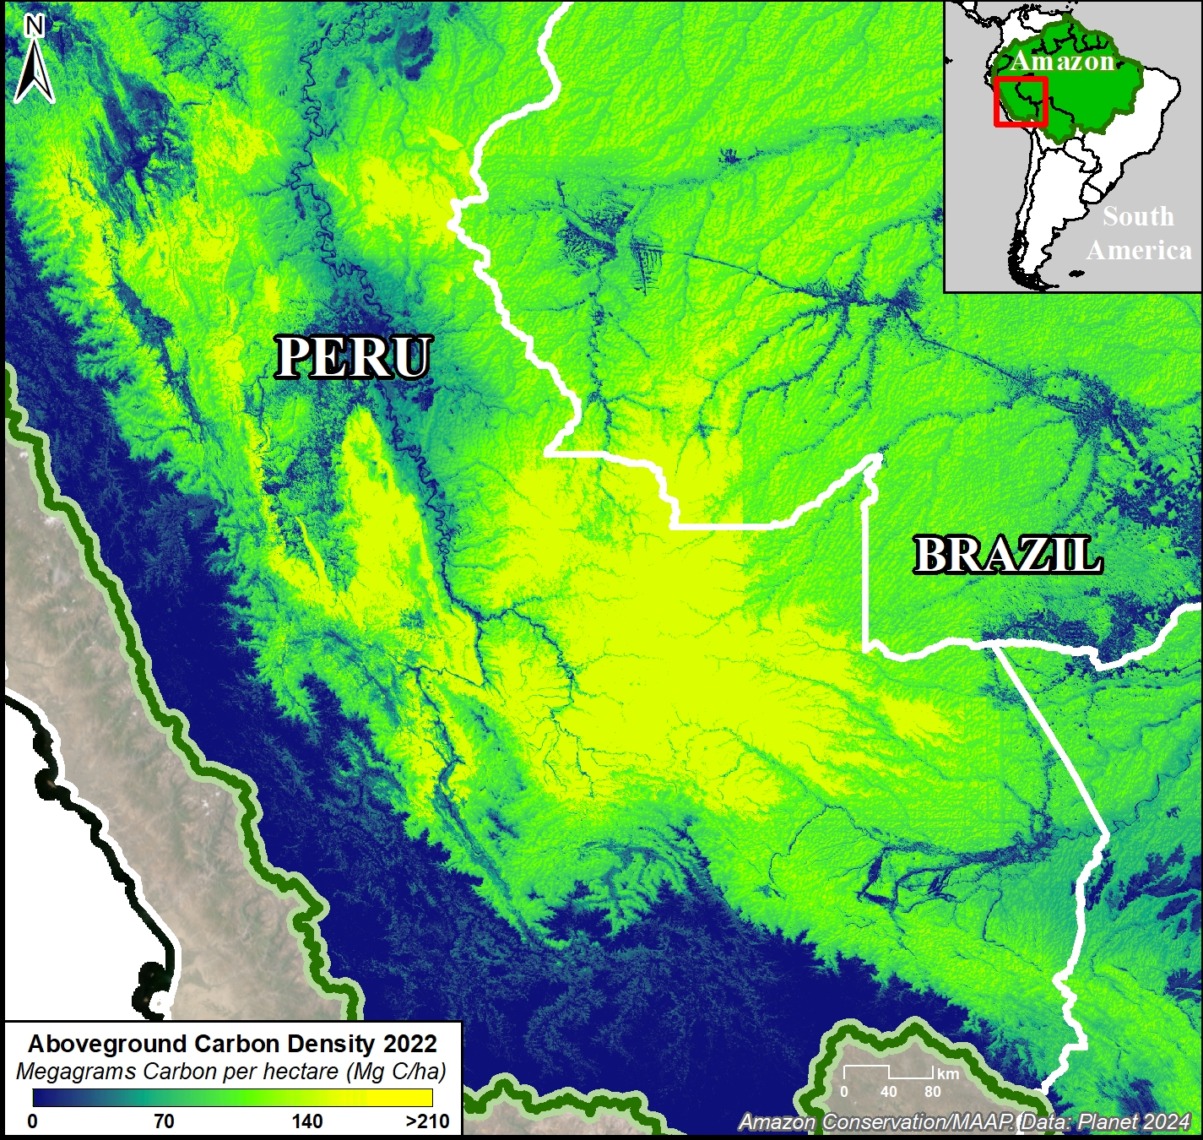
Figure 1 shows an important example of peak carbon areas in southern Peru and adjacent western Brazil.
The peak carbon areas are often found in the remote primary forests of protected areas and Indigenous territories, but some are located in forestry concessions (specifically, logging concessions) or undesignated lands (also referred to as undesignated public forests).
Our goal in this report is to leverage unprecedented aboveground carbon data to reinforce the importance of these designated areas and draw attention to the remaining undesignated lands.
For example, peak carbon areas would be excellent candidates for the High Integrity Forest (HIFOR) initiative, a new financing instrument that uniquely focuses on maintaining intact tropical forests.3 HIFOR rewards the climate services that intact tropical forests provide, including ongoing net carbon removal from the atmosphere, and complements existing instruments to reduce emissions from deforestation and degradation (REDD+) by focusing on tropical forests that are largely undegraded.
Below, we detail the major findings and then zoom in on the peak carbon areas in the northeast and southwest Amazon.
Peak Carbon Areas in the Amazon
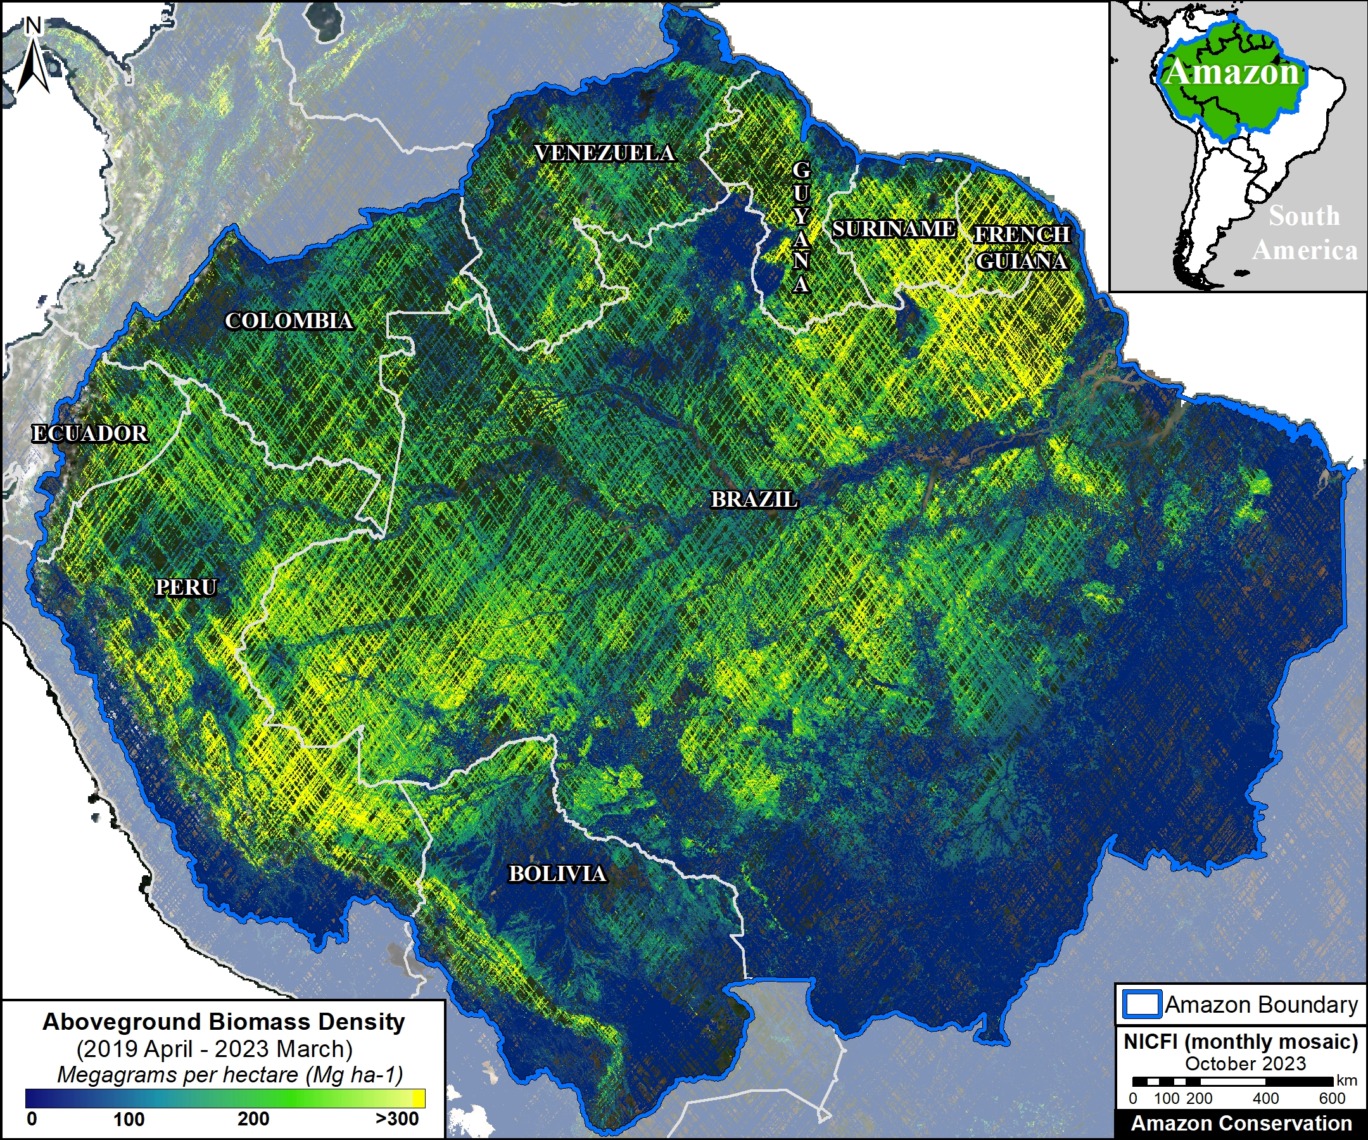
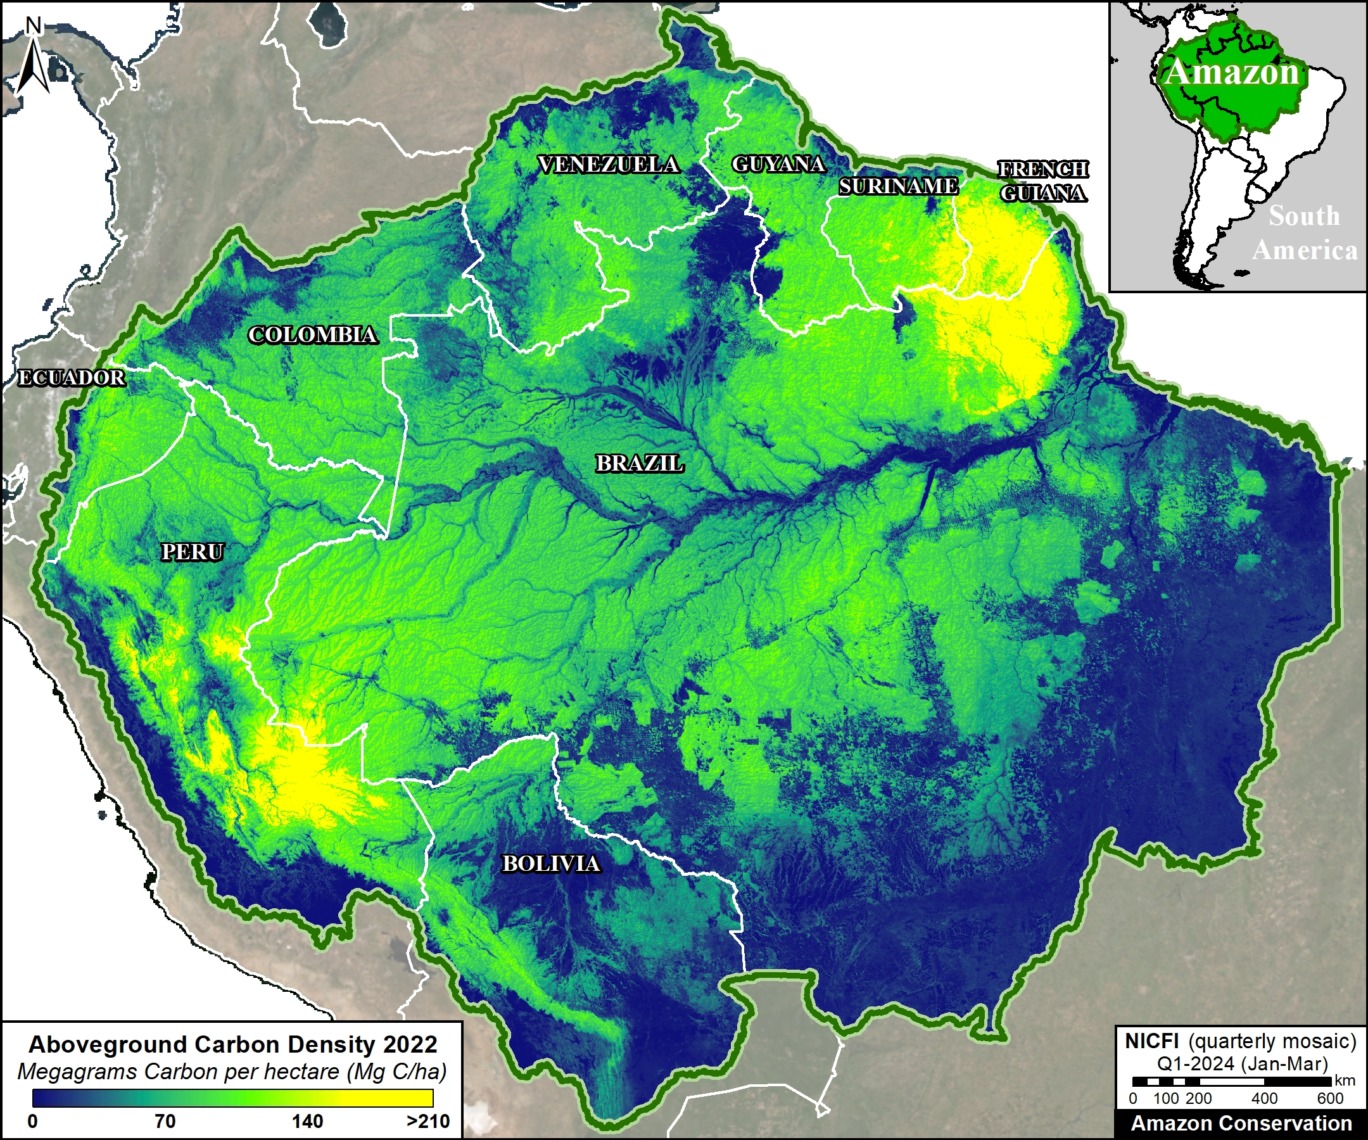
The Base Map below illustrates our major findings.
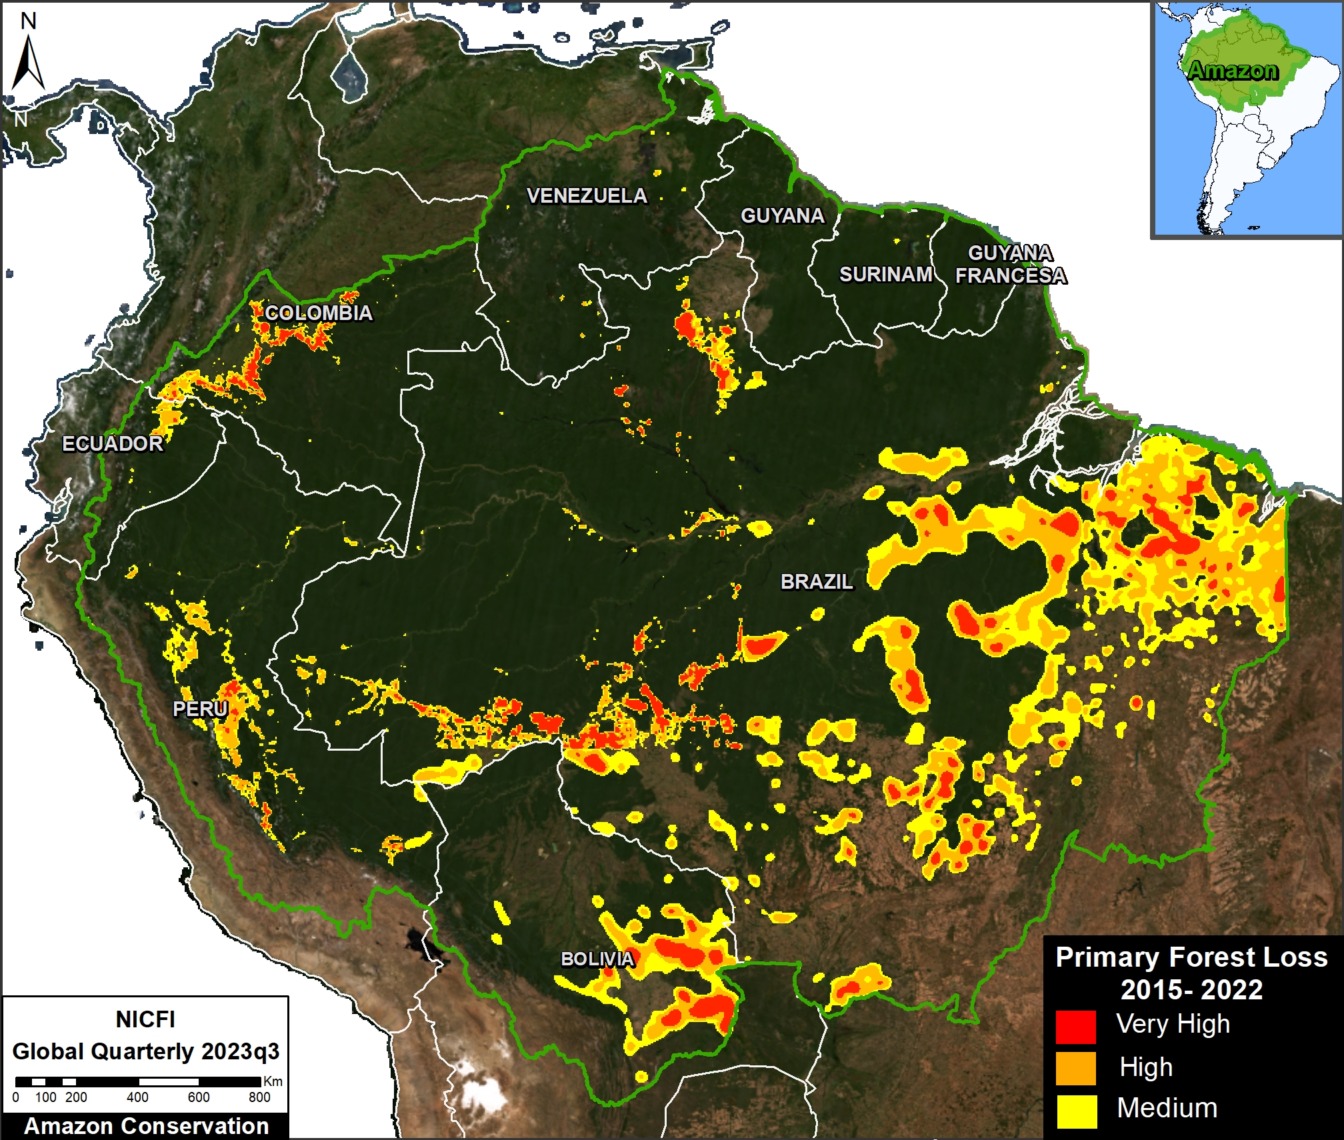
The peak carbon areas (>140 metric tons per hectare; indicated in pink) are concentrated in the southwest and northeast Amazon, covering 27.8 million hectares (11 million ha in the southwest and 16.8 million ha in the northeast).
k
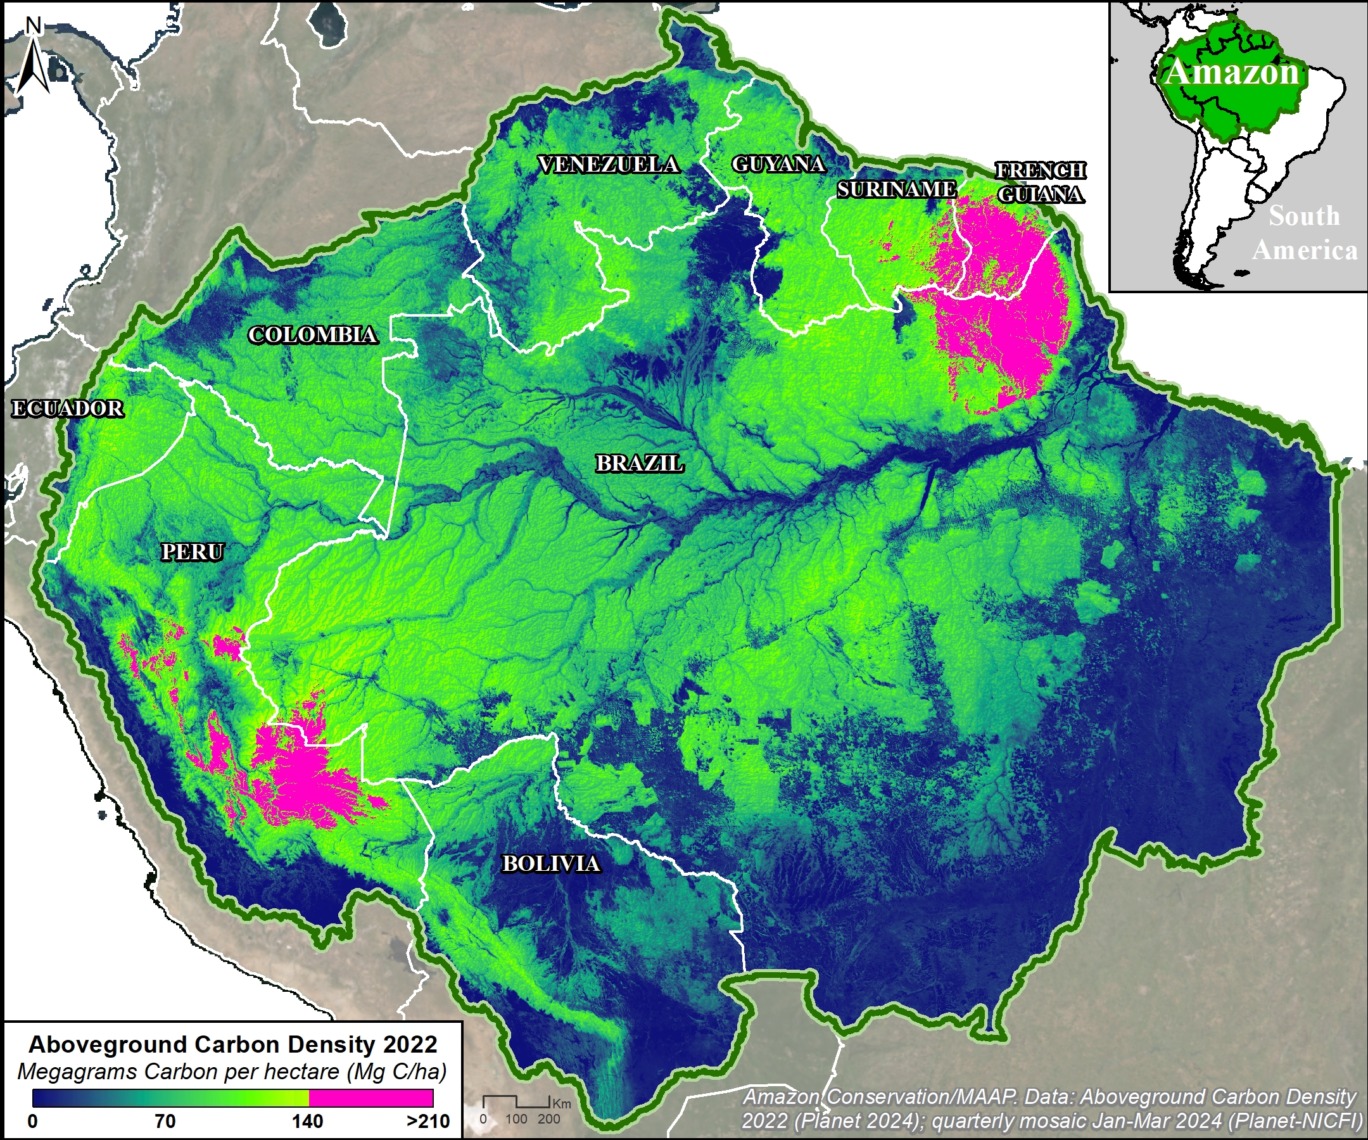
In the southwest Amazon, peak carbon levels are found in southern & central Peru, and adjacent western Brazil.
In the northeast Amazon, peak carbon levels are found in northeast Brazil, much of French Guiana, and parts of Suriname.
By country, Brazil and Peru have the largest area of peak carbon (10.9 million and 10.1 million hectares respectively), followed by French Guiana (4.7 million ha), and Suriname (2.1 million ha).
Protected areas and Indigenous territories cover much (61%) of the peak carbon area (16.9 million hectares).
The remaining 39% remains unprotected, and arguably threatened, in undesignated lands (9.4 million hectares) and forestry concessions (1.5 million ha), respectively.
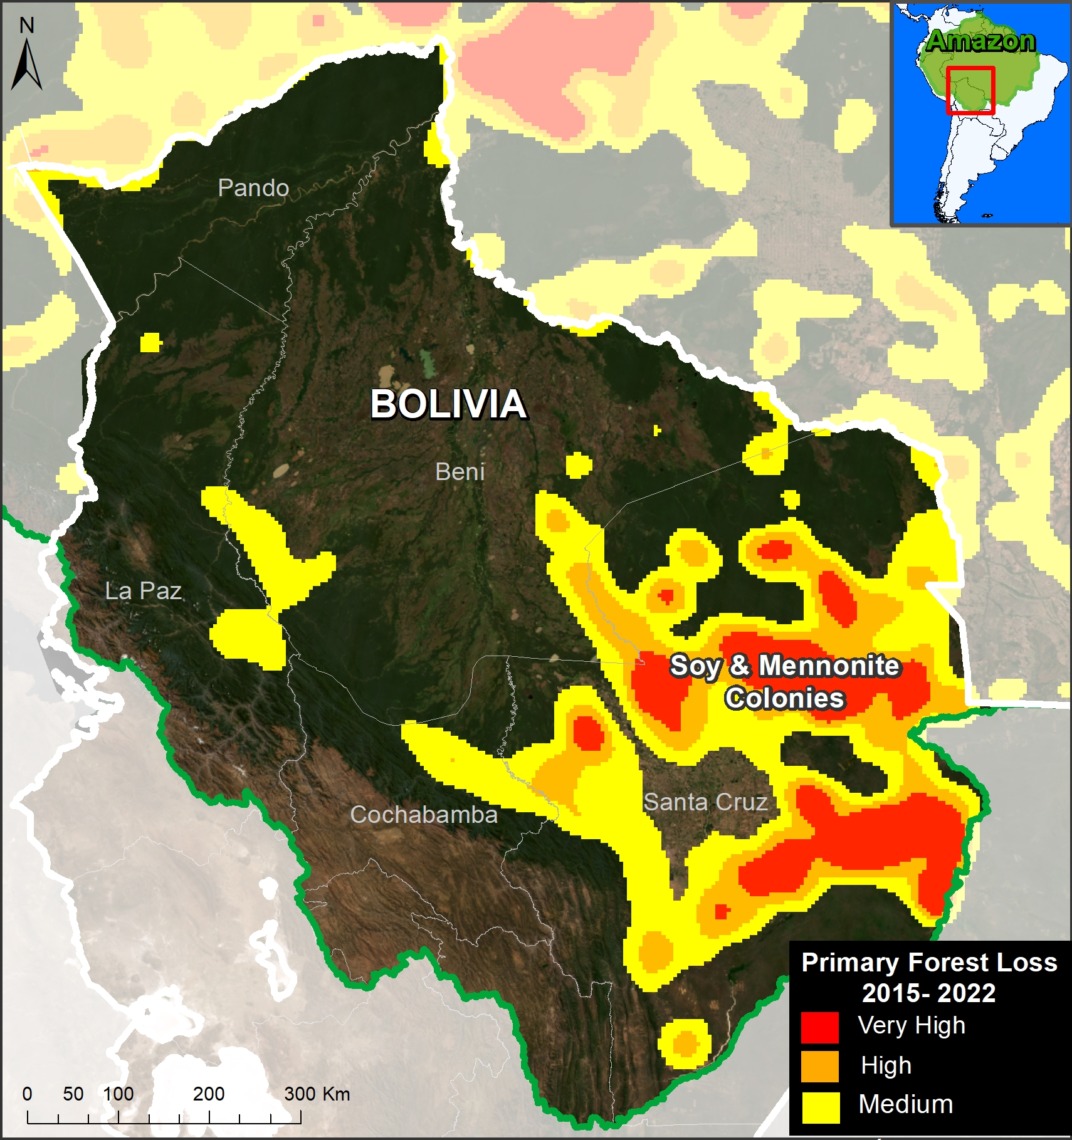
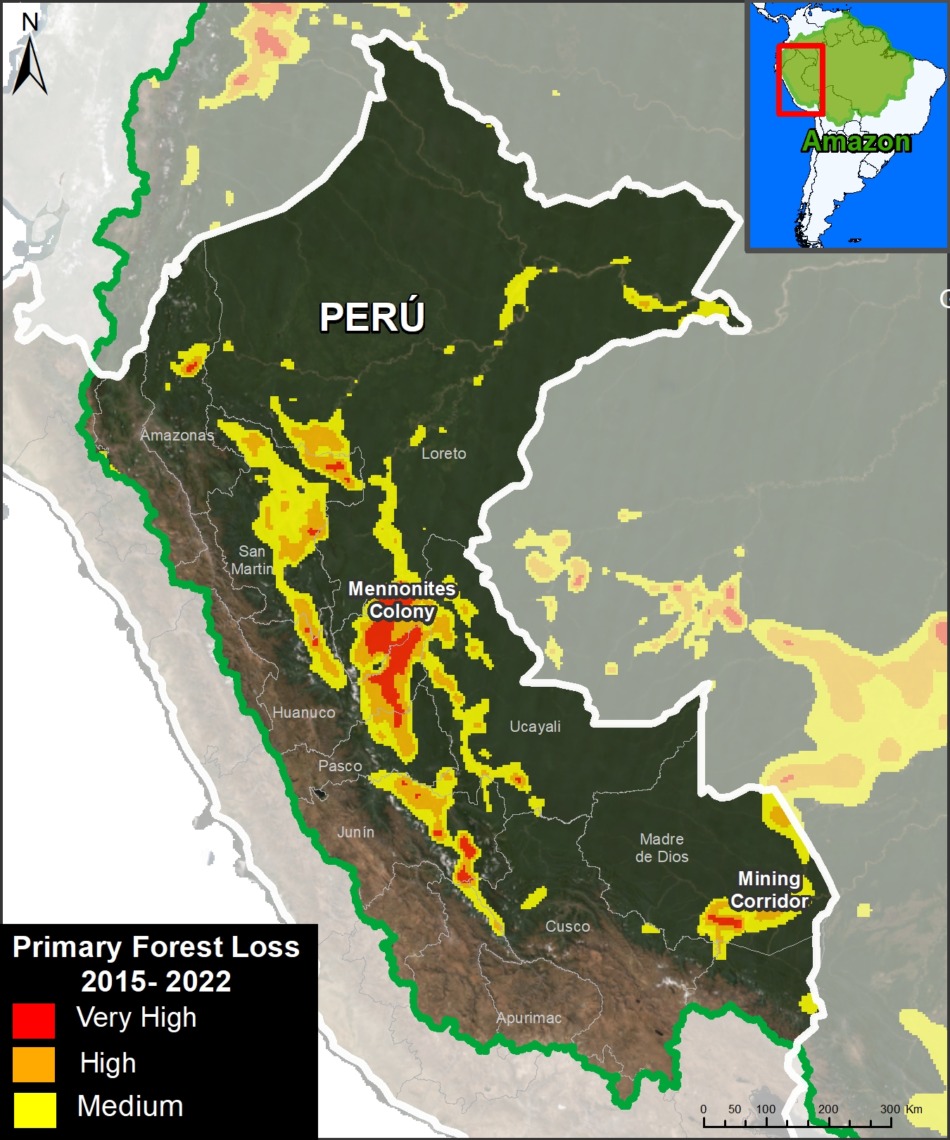
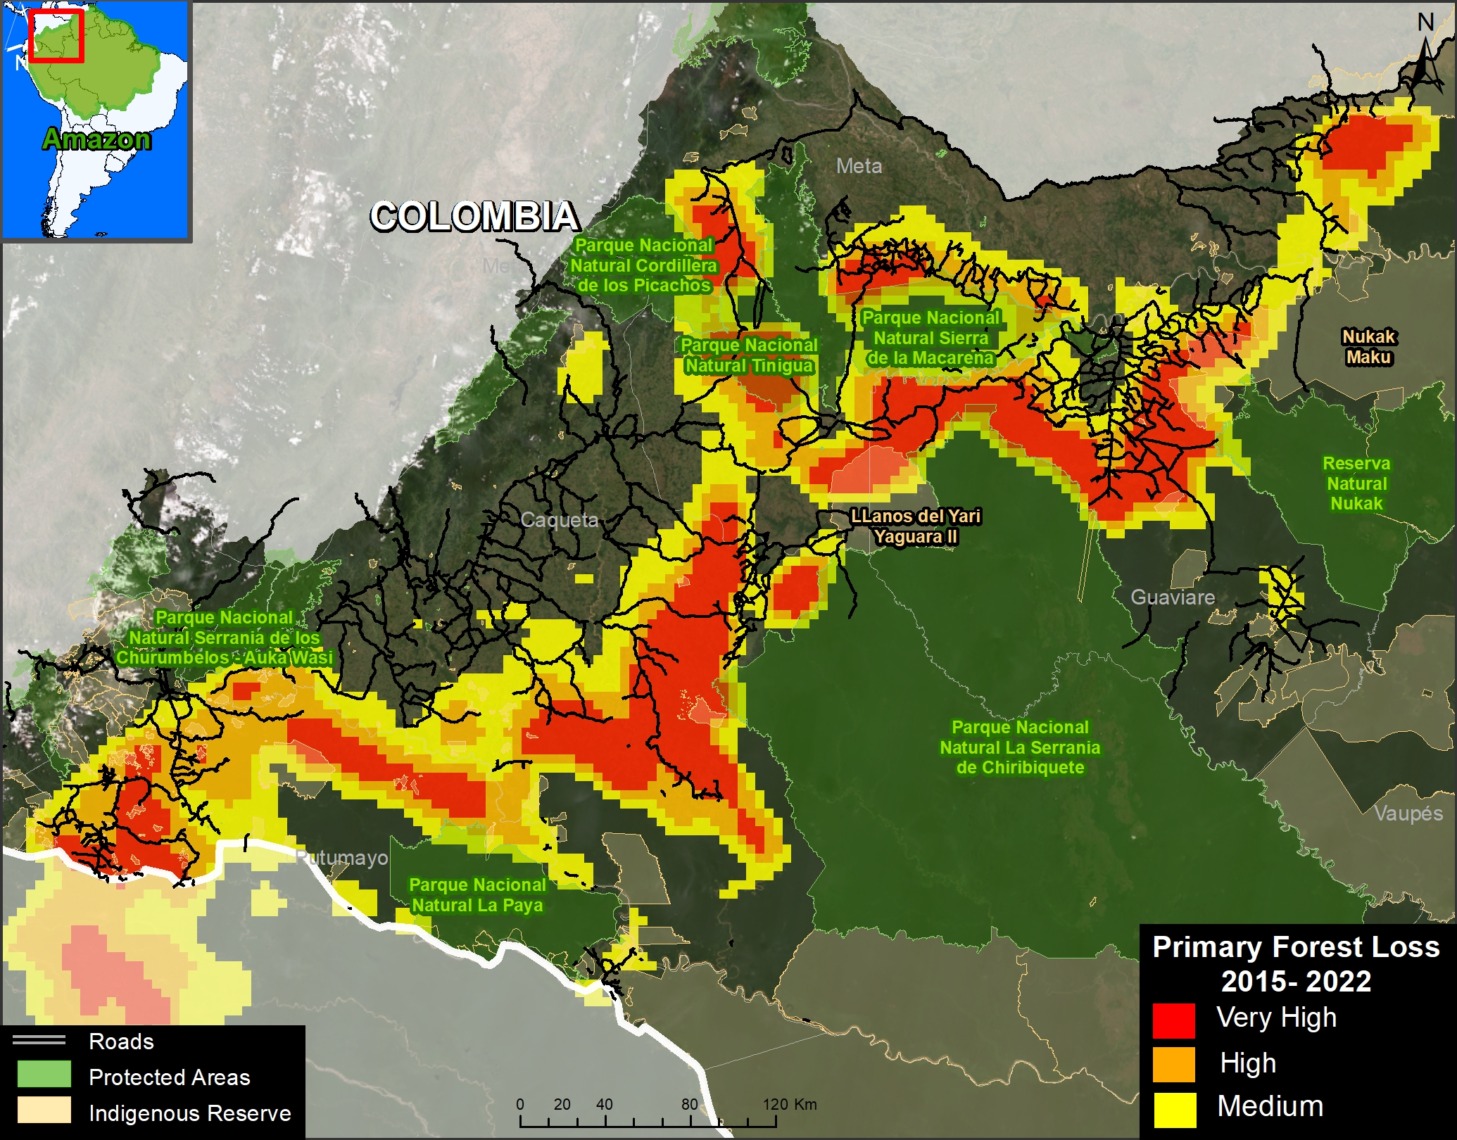
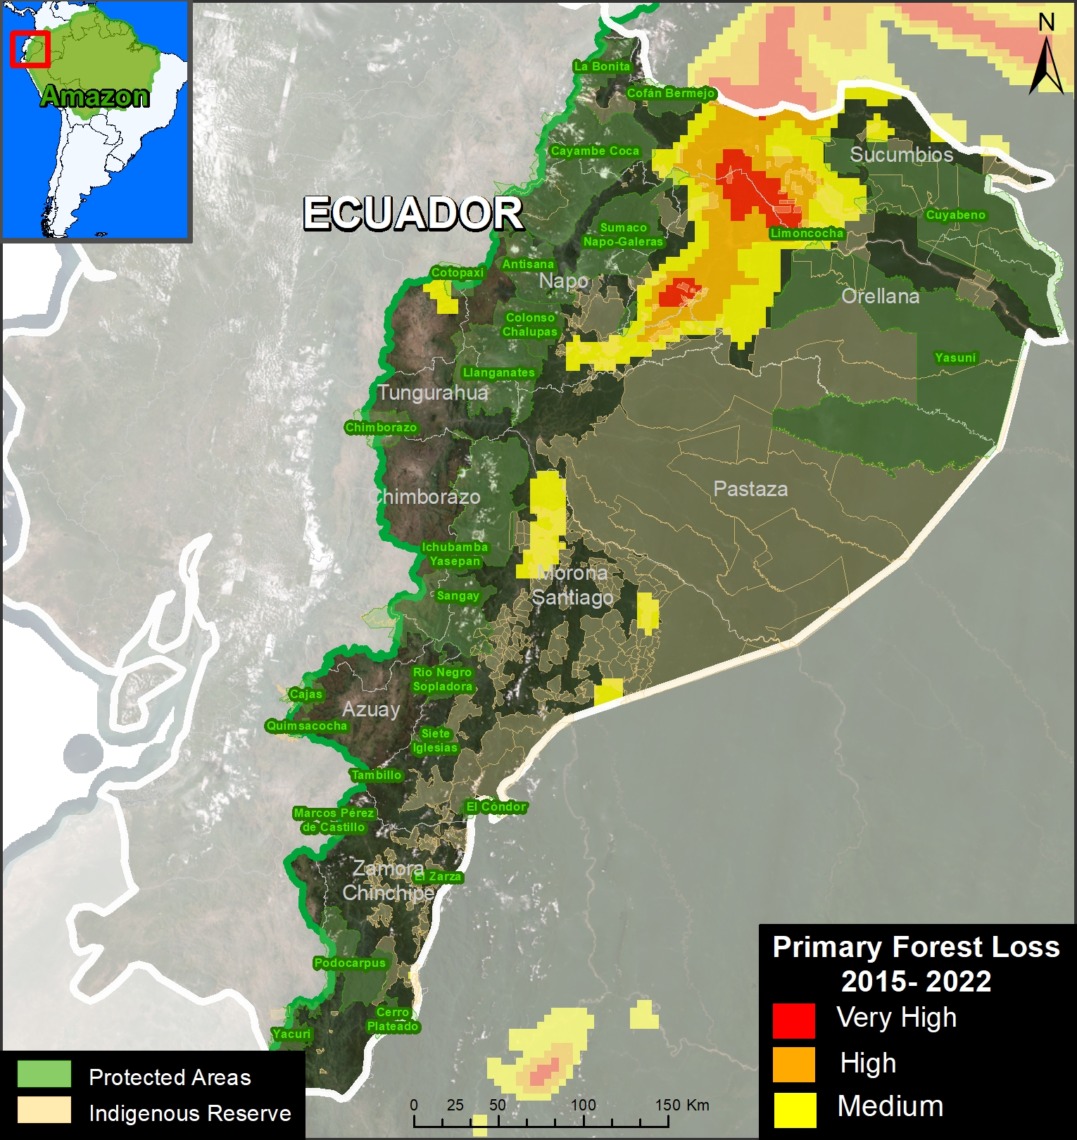
In addition, high carbon areas (>70 metric tons per hectare; indicated by the greenish-yellow coloration in the Base Map) are found in all nine countries of the Amazon biome, notably Colombia, Ecuador, Bolivia, Venezuela, and Guyana.
Southwest Amazon
Southern Peru
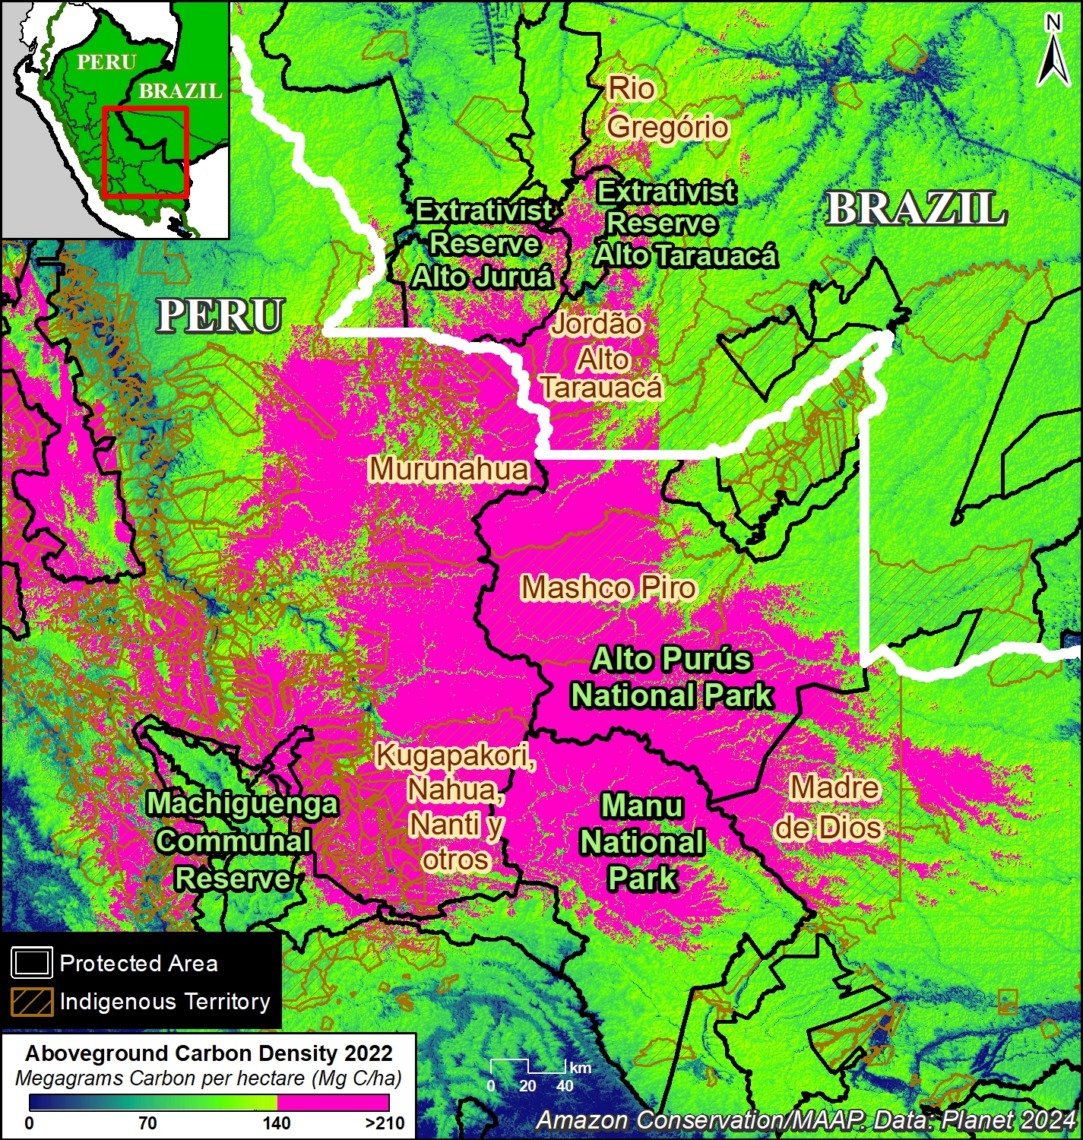
Figure 2a zooms in on the peak carbon area covering 7.9 million hectares in southern Peru (regions of Madre de Dios, Cusco, and Ucayali) and adjacent southwest Brazil (Acre).
Several protected areas (such as Manu and Alto Purús National Parks, and Machiguenga Communal Reserve) anchor this area.
It is also home to numerous Indigenous territories (such as Mashco Piro, Madre de Dios, and Kugapakori, Nahua, Nanti & Others Indigenous Reserves).
Figure 2b highlights the major land designations within the peak carbon area of southern Peru.
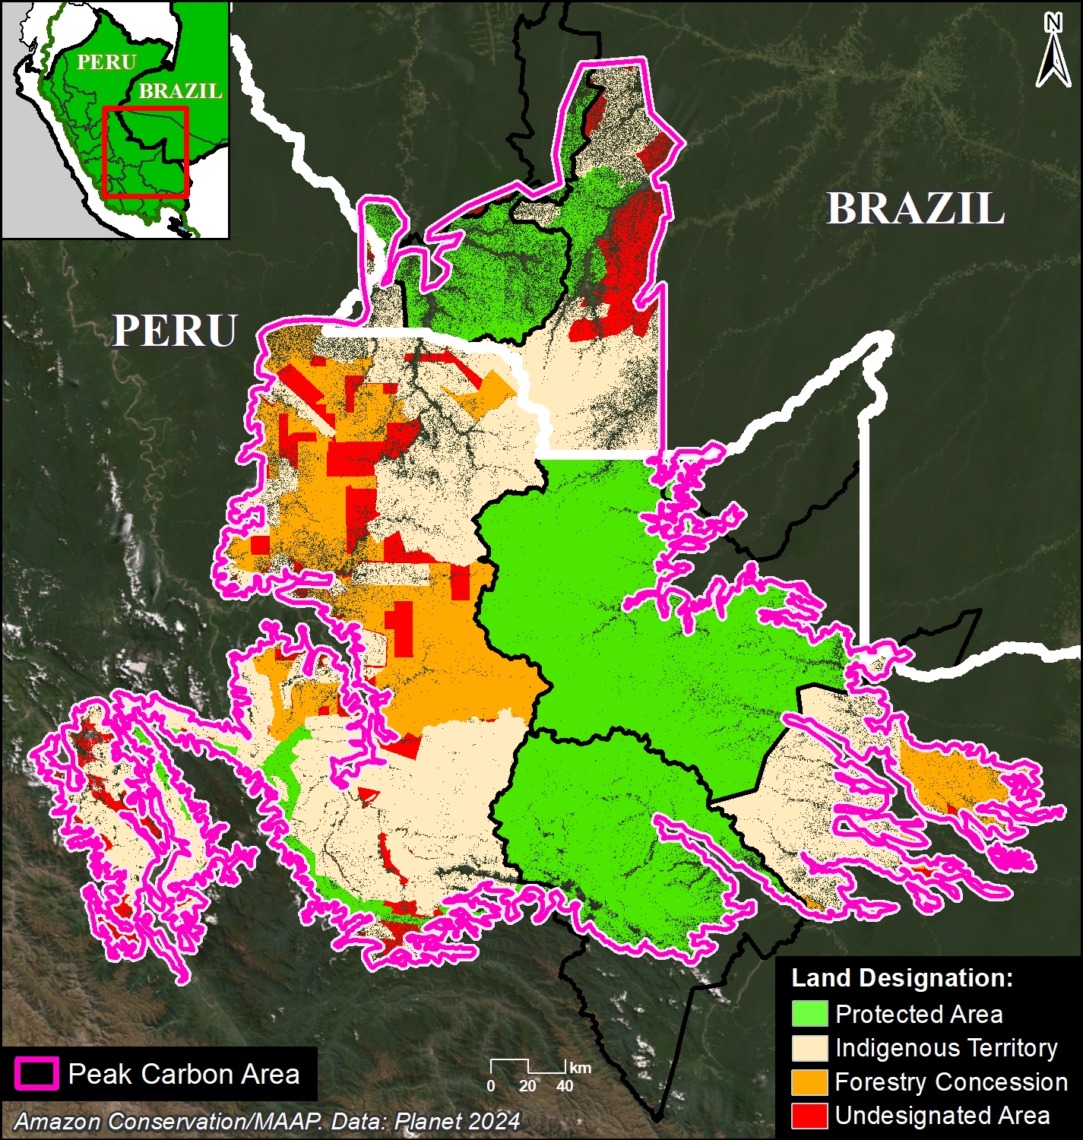
Protected areas and Indigenous territories cover 77% of this area (green and brown, respectively).
The remaining 23% could be considered threatened, as they are located in forestry concessions or undesignated lands (orange and red, respectively). Thus, these areas are ideal candidates for increased protection to maintain their peak carbon levels.
Central Peru
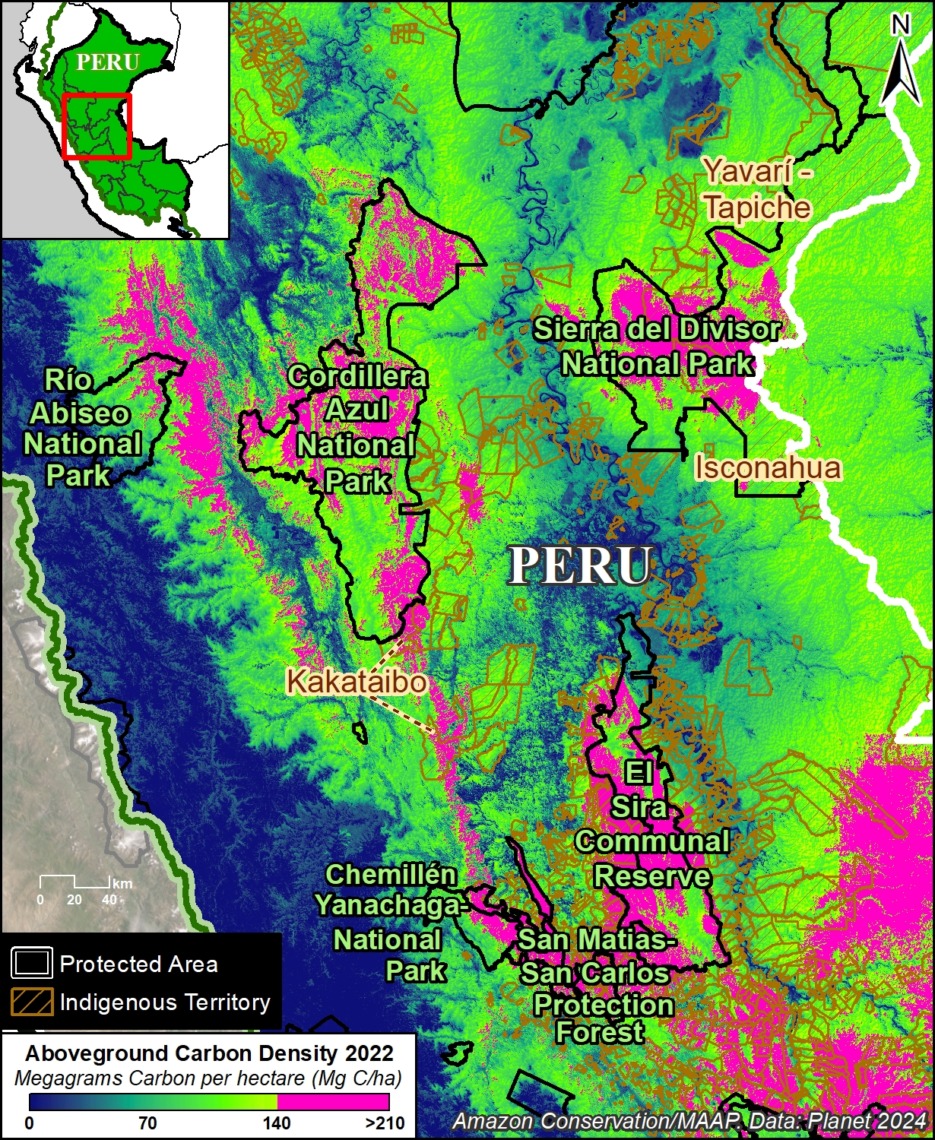
Figure 3a zooms in on the peak carbon area in the central Peruvian Amazon, which covers 3.1 million hectares in the regions of Ucayali, Loreto, Huánuco, Pasco, and San Martin.
Several protected areas (including Sierra del Divisor, Cordillera Azul, Rio Abiseo, and Yanachaga–Chemillén National Parks, and El Sira Communal Reserve) anchor this area.
It is also home to numerous Indigenous territories (such as Kakataibo, Isconahua, and Yavarí Tapiche Indigenous Reserves).
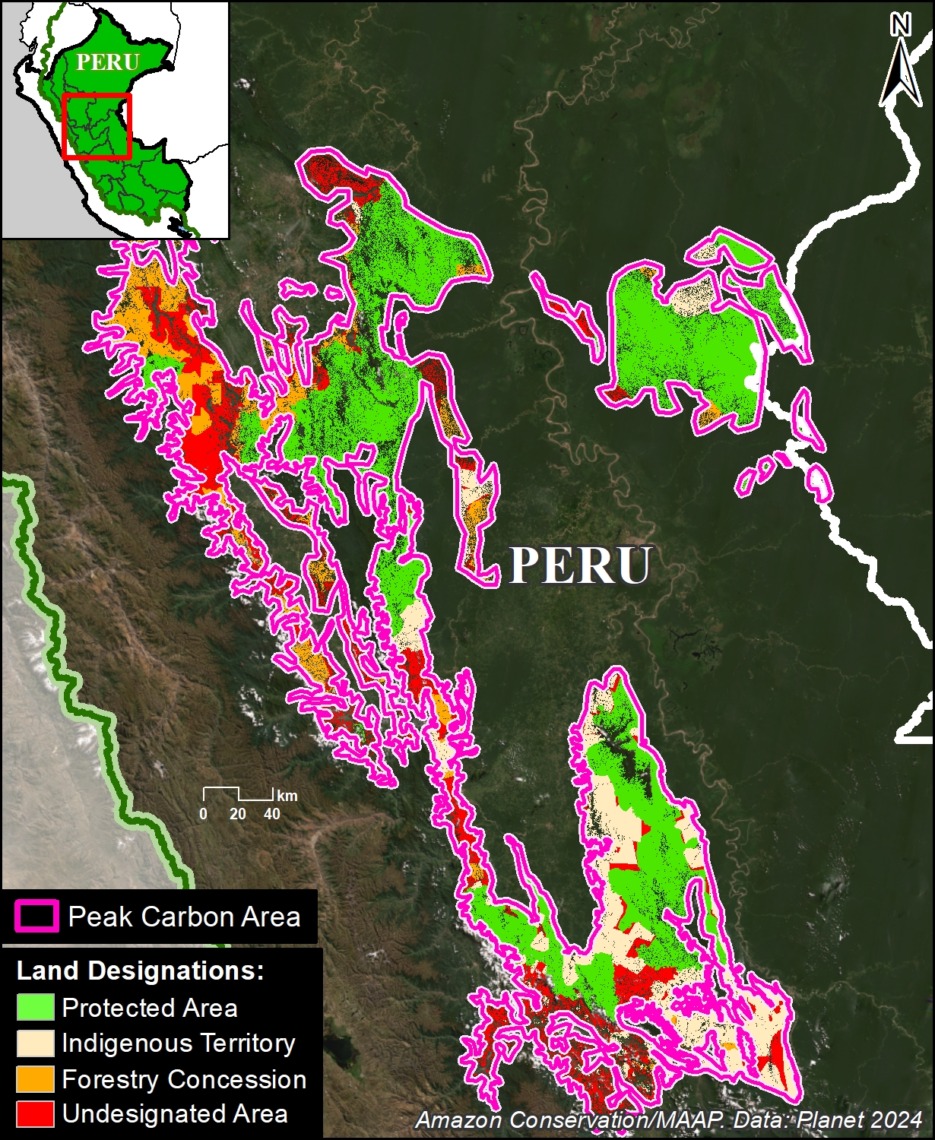
Figure 3b highlights the major land designations within the peak carbon area of central Peru.
Protected areas and Indigenous territories cover 69% of this area (green and brown, respectively).
The remaining 31% could be considered threatened, as they are located in forestry concessions or undesignated lands (orange and red, respectively), and are ideal candidates for increased protection.
Northeast Amazon
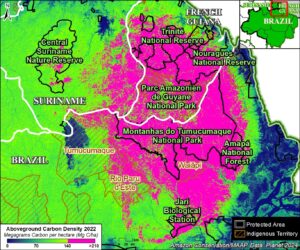
Figure 4a zooms in on the peak carbon area in the tri-border region of the northeast Amazon, which covers 16.8 million hectares in northern Brazil, French Guiana, and Suriname.
Several protected areas (including Montanhas do Tumucumaque National Park in northeast Brazil, Amazonien de Guyane National Park in French Guiana, and Central Suriname Nature Reserve) anchor this area.
It is also home to numerous Indigenous territories (such as Tumucumaque, Rio Paru de Este, and Wayãpi in northeast Brazil).
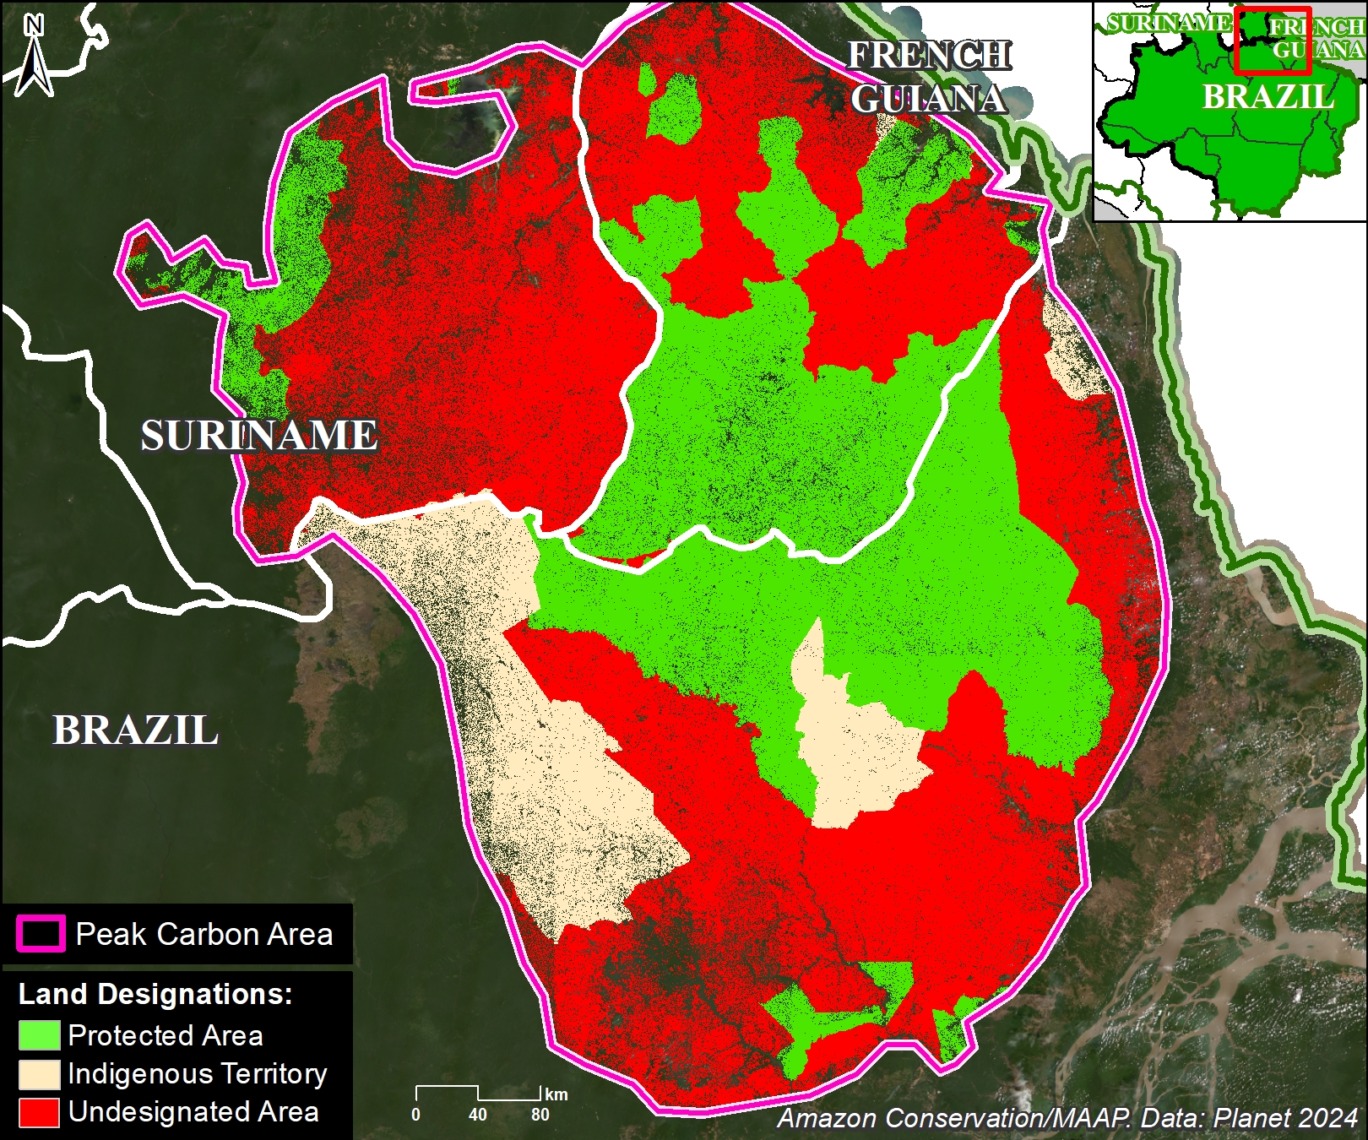
Figure 4b highlights the major land designations within the peak carbon area of the northeast Amazon.
Protected areas and Indigenous territories cover just over half (51%) of this area (green and brown, respectively).
The remaining 49% could be considered threatened, as they are located in undesignated lands, and are ideal candidates for increased protection.
Notes
1 We selected this value (upper 33%) to capture the highest aboveground carbon areas and include a range of high carbon areas. Additional analyses could target different values, such as the highest 10% or 20% of aboveground carbon.
2 A recent paper documented a strong relationship between selective logging and aboveground carbon loss (Csillik et al. 2024, PNAS). The link between forest edges and carbon is presented in Silva Junior et al, Science Advances.
3 High Integrity Forest (HIFOR) units are a new tradable asset that recognizes and rewards the essential climate services and biodiversity conservation that intact tropical forests provide, including ongoing net removal of CO2 from the atmosphere. For more information see https://www.wcs.org/our-work/climate-change/forests-and-climate-change/hifor
4 For more information, see the “What is Forest Carbon Diligence?” section in this recent blog from Planet.
Citation
Finer M, Mamani N, Anderson C, Rosenthal A (2024) Carbon across the Amazon (part 2): Peak Carbon Areas. MAAP #217.
Acknowledgments
This report was made possible by the generous support of the Norwegian Agency for Development Cooperation (NORAD)
![]()
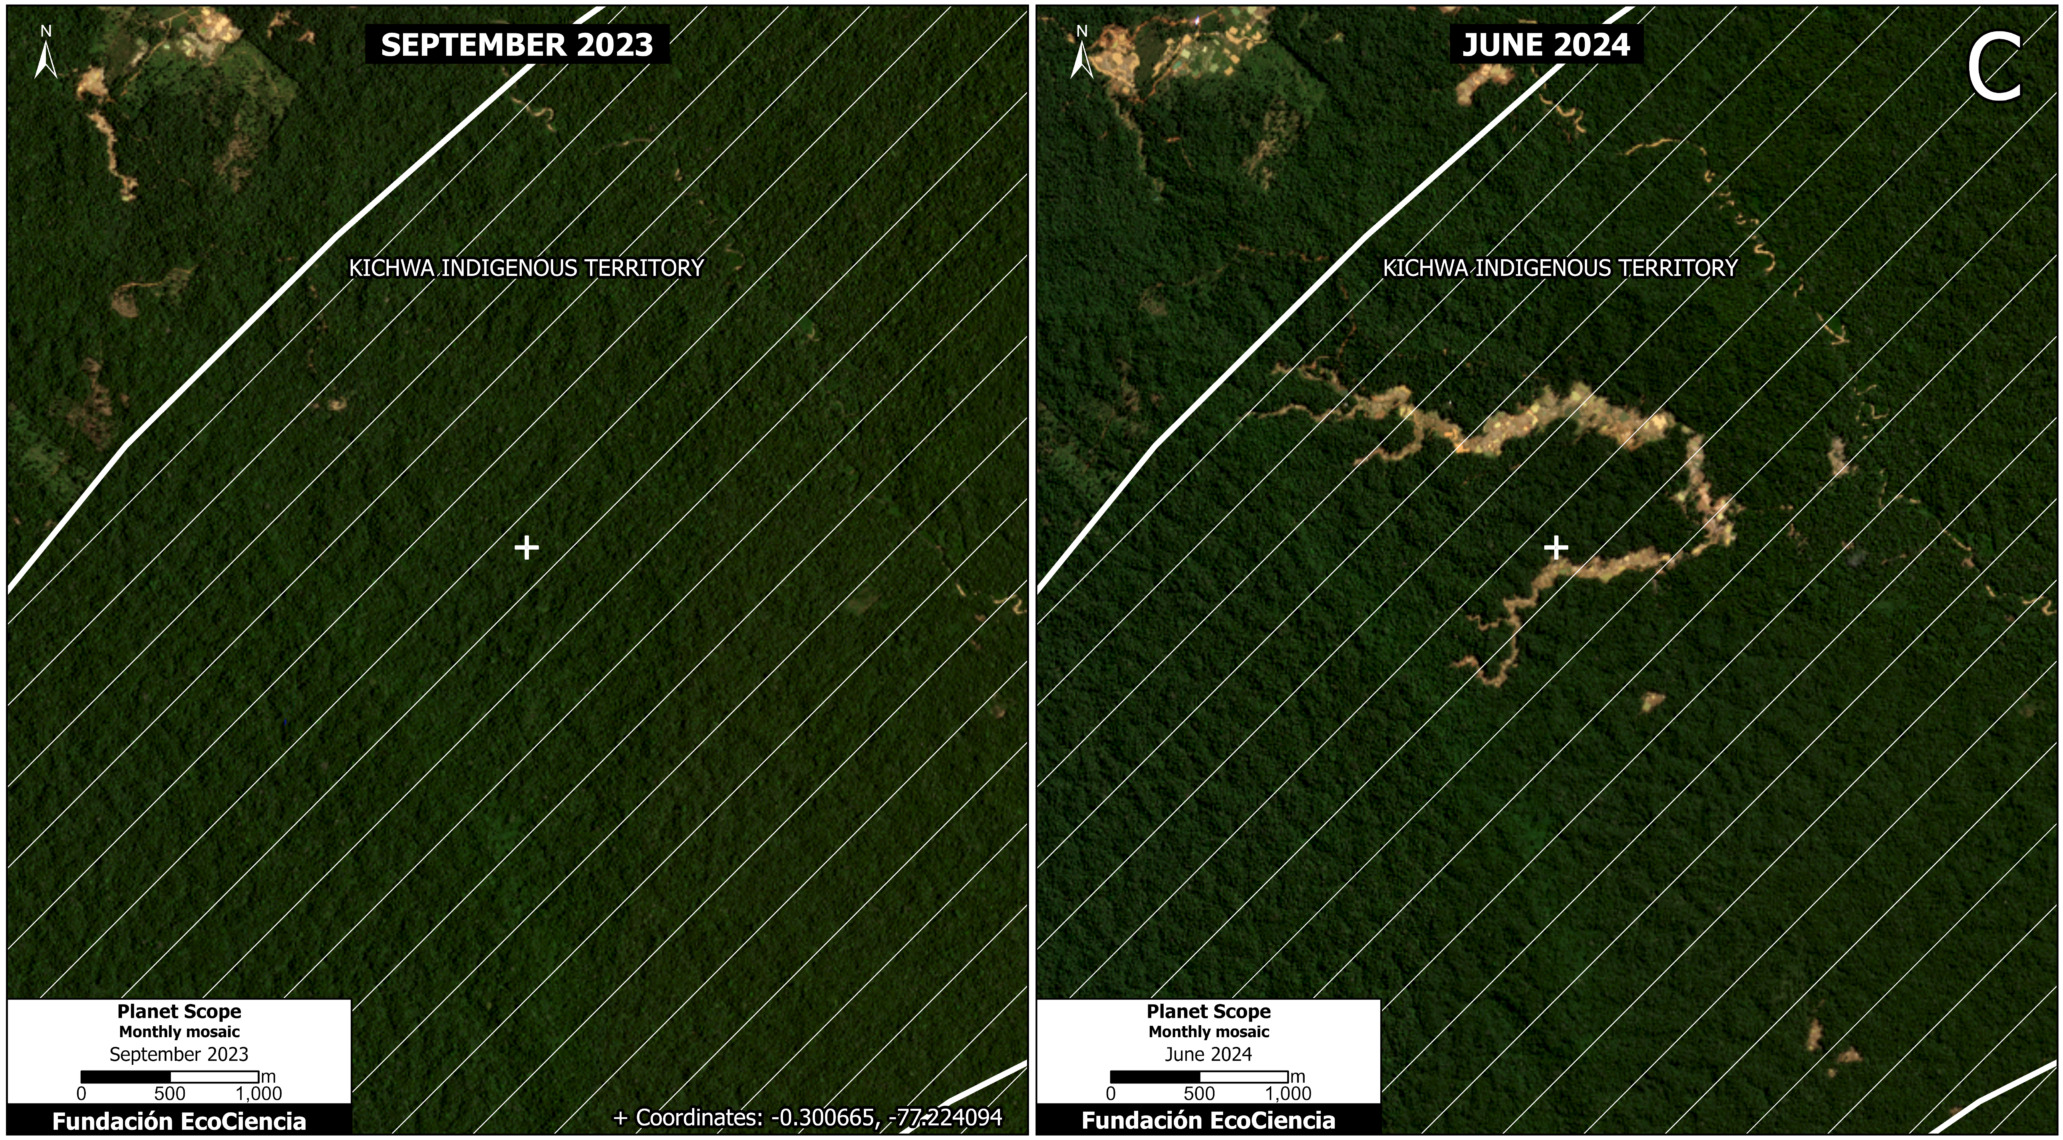
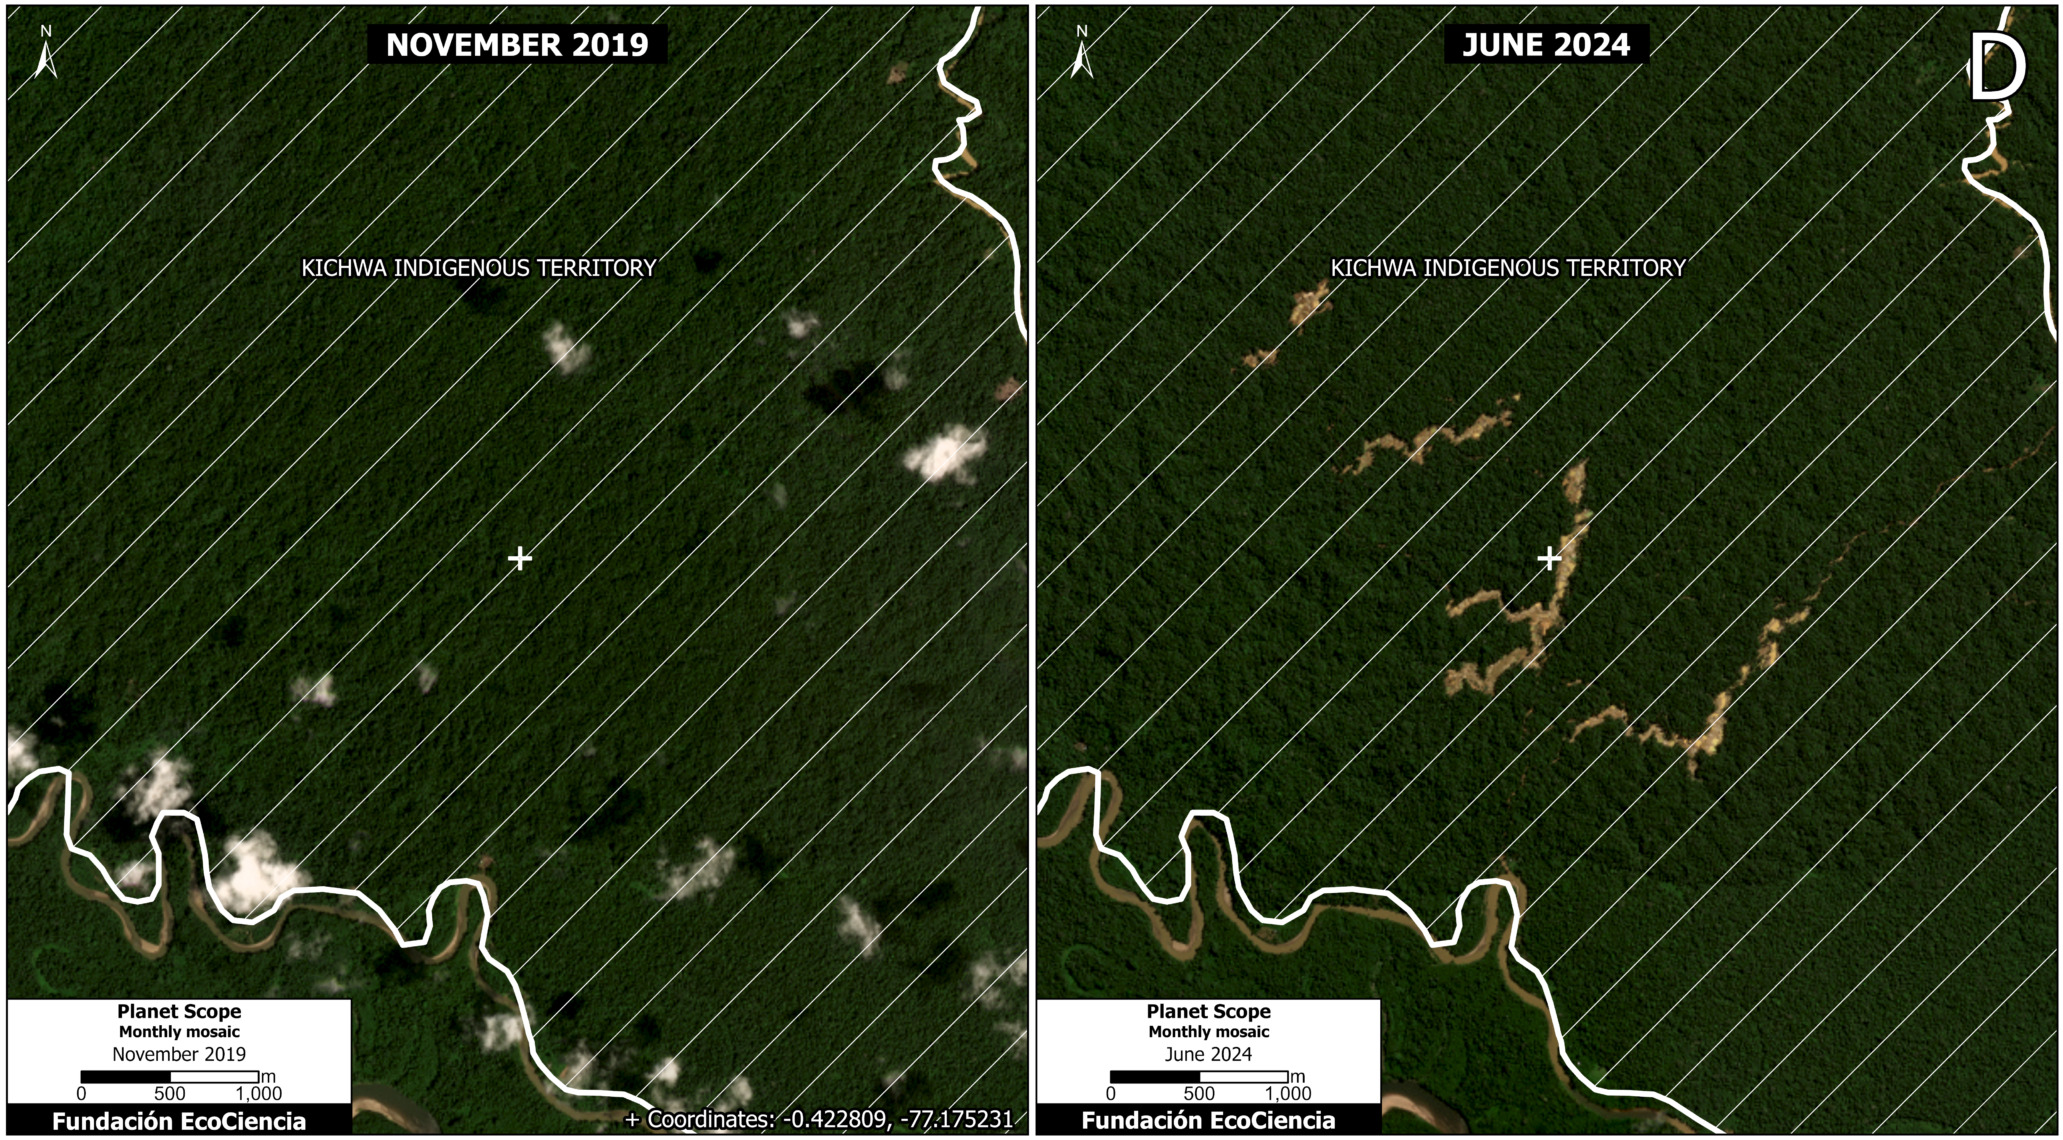
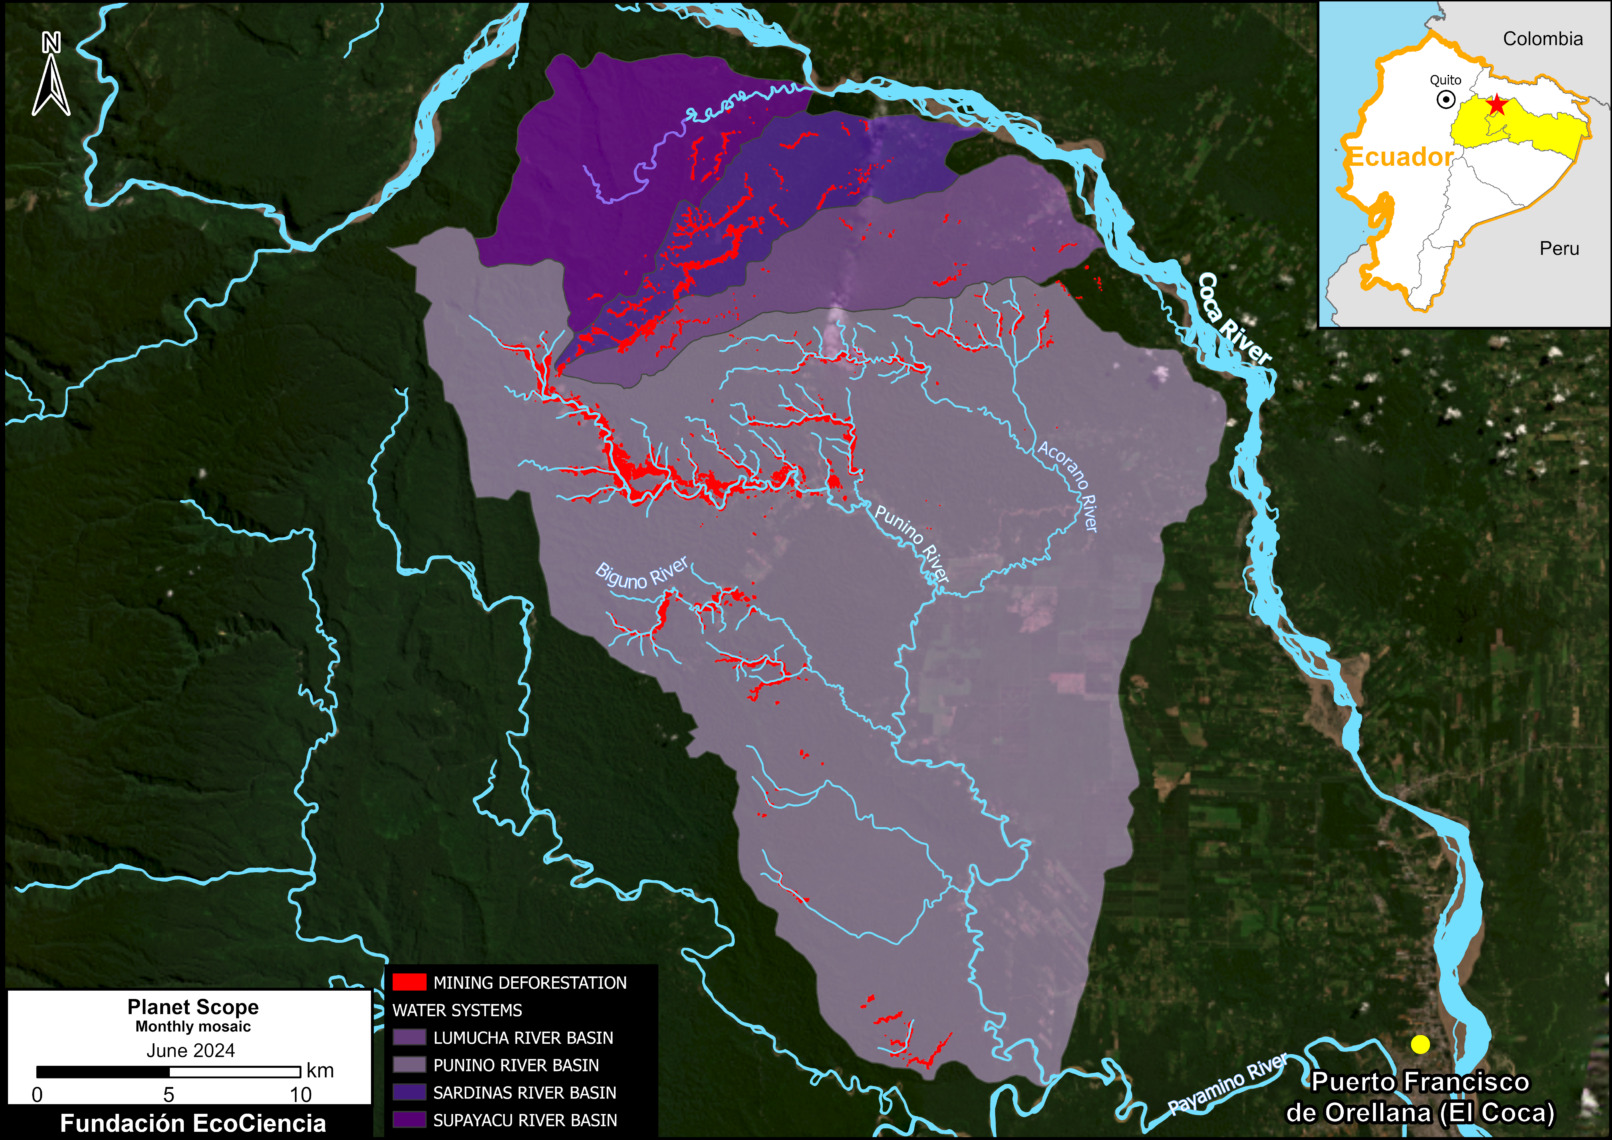
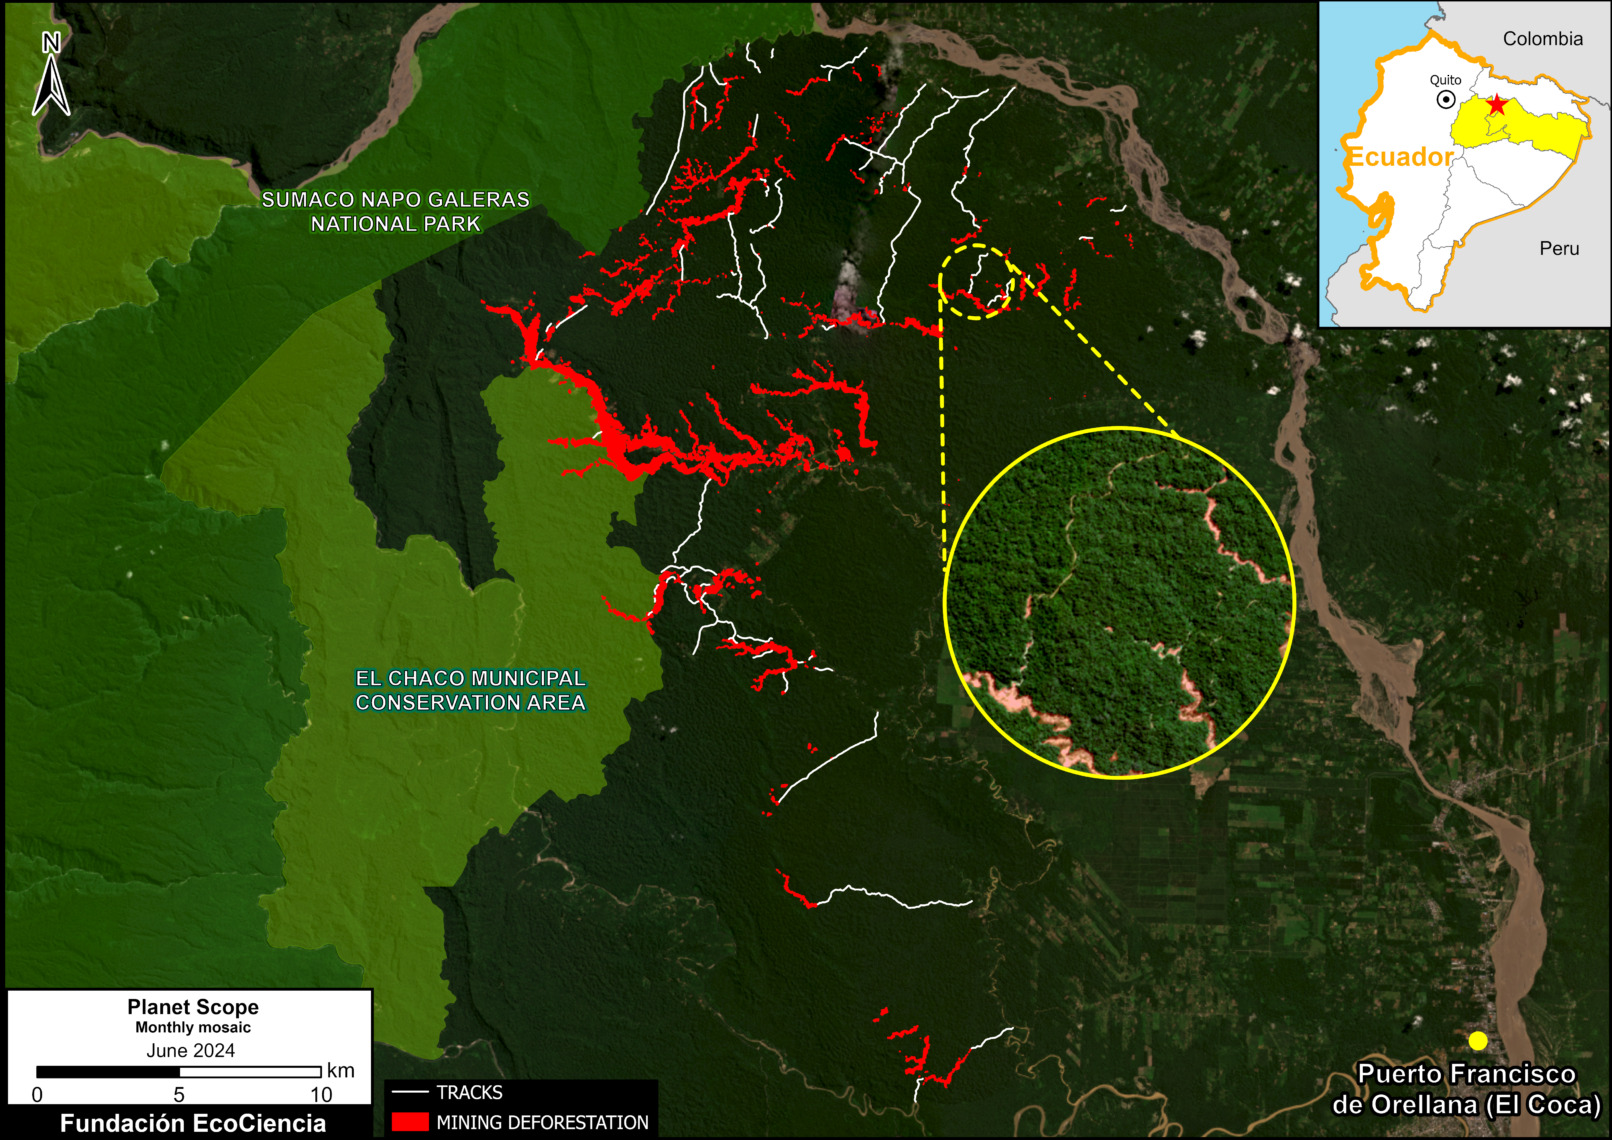


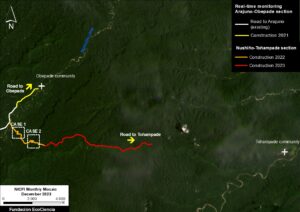
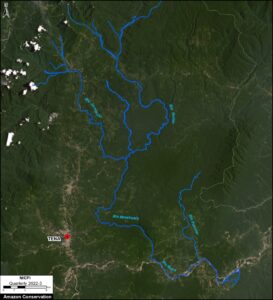
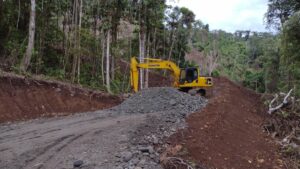 We analyze a new road project that enters the western sector of the Waorani Indigenous Territory, located in the heart of the Ecuadorian Amazon (see Base Map, below).