MAAP #183: Protected Areas & Indigenous Territories Effective Against Deforestation Across Amazon

Base Map. Primary forest loss (2017-21) across the Amazon, in relation to protected areas and indigenous territories.

As deforestation continues to threaten primary forest across the Amazon, key land use designations are one of the best hopes for the long-term conservation of critical remaining intact forests.

Here, we evaluate the impact of two of the most important: protected areas & indigenous territories.

Our study looked across all nine countries of the Amazon biome, a vast area of 883.7 million hectares (see Base Map).

We calculated primary forest loss over the past 5 years (2017-2021).

For the first time, we were able to distinguish fire vs non-fire forest loss. For non-fire, while this does include natural events (such as landslides and wind storms), we consider this our best proxy for human-caused deforestation.

We analyzed the results across three major land use categories:

1) Protected Areas (national and state/department levels), which cover 197 million hectares (23.6% of Amazon).

2) Indigenous Territories (official), which cover 163.8 million hectares (19.6% of Amazon).

3) Other (all remaining areas outside protected areas and indigenous territories), which cover 473 million hectares (56.7% of Amazon).

In summary, we found that deforestation was the primary driver of forest loss, with fire always being a smaller subset. Averaged across all 5 years, protected areas and indigenous territories had similar levels of effectiveness, reducing primary forest loss rate by 3x compared to areas outside of these designations.

Below, we show the key results across the Amazon in greater detail, including a breakdown for the western Amazon (Bolivia, Colombia, Ecuador, and Peru) and the Brazilian Amazon.

Key Findings

Amazon Biome

We documented the loss of 11 million hectares of primary forests across all nine countries of the Amazon biome between 2017 and 2021. Of this total, 71% was non-fire (deforestation and natural) and 29% was fire.

For the major land use categories, 11% of the forest loss occurred in both protected areas and indigenous territories, respectively, while the remaining 78% occurred outside these designations.

To standardize these results for the varying area coverages, we calculated annual primary forest loss rates (loss/total area of each category). Figure 1 displays the results for these rates across all nine countries of the Amazon biome.

Figure 1. Primary forest loss rates across the Amazon, 2017-21.

Broken down by year, 2017 had the highest forest loss rates, with both a severe deforestation and fire season. In addition, 2021 had the second highest deforestation rate, while 2020 had the second highest fire loss rate.

Averaged across all five years, protected areas (green) had the lowest overall primary forest loss rate (0.12%), closely followed by indigenous territories (0.14%).

Interestingly, indigenous territories (orange) actually had a slightly lower deforestation rate compared to protected areas (0.7 vs 0.8%), but higher fire loss rate (o.7 vs .04%), resulting in the overall higher forest loss rate noted above.

Outside of these designations (red), the primary forest loss rate was triple (.36%), especially due to much higher deforestation.

Western Amazon

Breaking the results down specifically for the western Amazon (Bolivia, Colombia, Ecuador, and Peru), we documented the loss of 2.6 million hectares of primary forests between 2017 and 2021. Of this total, 80% was non-fire (deforestation and natural) and 20% was fire.

For the major land use categories, 9.6% occurred in protected areas, 15.6% in indigenous territories, and the remaining 74.8% occurred outside these designations.

Figure 2 displays the standardized primary forest loss rates across the western Amazon.

Figure 2. Primary forest loss rates across the Western Amazon, 2017-21.

Broken down by year, 2017 had the highest deforestation rate and overall forest loss rates. But 2020 had the highest fire loss rate, mainly due to extensive fires in Bolivia. 2021 also had a relatively high deforestation rate. Also, note the high level of fires in protected areas in 2020 and 2021, and indigenous territories in 2019.

Averaged across all five years, protected areas had the lowest overall primary forest loss rate (0.11%), followed by indigenous territories (0.16%).

Outside of these designations, the primary forest loss rate was .30%. That is, triple the protected areas rate and double the indigenous territories rate.

Brazilian Amazon

Breaking the results down specifically for the Brazilian Amazon, we documented the loss of 8.1 million hectares of primary forests between 2017 and 2021. Of this total, 68% was non-fire (deforestation and natural) and 32% was fire.

For the major land use categories, 9.4% occurred in indigenous territories, 11.2% occurred in protected areas, and the remaining 79.4% occurred outside these designations.

Figure 3 displays the standardized primary forest loss rates across the Brazilian Amazon.

Figure 3. Primary forest loss rates in the Brazilian Amazon, 2017-21.

Broken down by year, 2017 had the highest forest loss rate recorded in the entire study (.58%), due to both elevated deforestation and fire. Note that indigenous territories were particularly impacted by fire in 2017.

2020 had the next highest forest loss rate, also driven by an intense fire season. Fires were not as severe the following year in 2021, but deforestation increased.

Averaged across all five years, indigenous territories had the lowest overall primary forest loss rate (0.14%), closely followed by protected areas (0.15%).

Interestingly, indigenous territories had a lower deforestation rate compared to protected areas (0.5 vs 0.11%), but higher fire impact (0.09 vs 0.04%).

Outside of these designations (red), the primary forest loss rate was triple (.45%).

Methodology

To estimate deforestation across all three categories (protected areas, indigenous territories, and other), we used annual forest loss data (2017-21) from the University of Maryland (Global Land Analysis and Discovery GLAD laboratory) to have a consistent source across all countries (Hansen et al 2013).

We obtained this data, which has a 30-meter spatial resolution, from the “Global Forest Loss due to Fires 2000–2021” data download page. It is also possible to visualize and interact with the data on the main Global Forest Change portal.

The annual data is disaggregated into forest loss due to fire vs. non-fire (other disturbance drivers). It is important to note that the non-fire drivers include both human-caused deforestation and forest loss caused by natural forces (landslides, wind storms, etc.).

We also filtered this data for only primary forest loss, following the established methodology of Global Forest Watch. Primary forest is generally defined as intact forest that has not been previously cleared (as opposed to previously cleared secondary forest, for example). We applied this filter by intersecting the forest cover loss data with the additional dataset “primary humid tropical forests” as of 2001 (Turubanova et al 2018). Thus, we often use the term “primary forest loss” to describe this filtered data.

Data presented as primary forest loss rate is standardized per the total area covered of each respective category per year (annual). For example, to properly compare raw forest loss data in areas that are 100 hectares vs 1,000 hectares total size respectively, we divide by the area to standardize the result.

Our geographic range extends from the Andes to the Amazon plain and reaching the transitions with the Cerrado and the Pantanal. This range includes nine countries of the Amazon (or Pan-Amazon region as defined by RAISG) and consists of a combination of the Amazon watershed limit, the Amazon biogeographic limit and the Legal Amazon limit in Brazil. See Base Map above for delineation of this hybrid Amazon limit, designed for maximum inclusion.

Additional data sources include:

  • National and state/department level protected areas: RUNAP 2020 (Colombia), SNAP 2022 (Ecuador), SERNAP & ACEAA 2020 (Bolivia), SERNANP 2022 (Peru), INPE/Terrabrasilis 2022 (Brazil), SOS Orinoco 2021 (Venezuela), and RAISG 2020 (Guyana, Suriname, and French Guiana.)
  • Indigenous Territories: RAISG & Ecociencia 2022 (Ecuador), INPE/Terrabrasilis 2022 (Brazil), RAISG 2020 (Colombia, Bolivia, Venezuela, Guyana, Suriname, and French Guiana), and MINCU & ACCA 2021 (Peru). For Peru, this includes titled native communities and Indigenous/Territorial Reserves for indigenous groups in voluntary isolation.

For analysis, we categorized Protected Areas first, then Indigenous Territories to avoid overlapping areas. Each category was disaggregated by year created/recognized to match the annual report of forest loss, for example. If a Protected area was created in December 2018, it would be considered within the analysis for the year 2019.

Acknowledgements

This work was supported by the Andes Amazon Fund (AAF), Norwegian Agency for Development Cooperation (NORAD), and International Conservation Fund of Canada (ICFC).

We thank M. MacDowell and M. Cohen for helpful comments on this report.

Citation

Finer M, Mamani N (2023) Protected Areas & Indigenous Territories Effective Against Deforestation Across Amazon. MAAP: 176.

MAAP #178: Gold Mining Deforestation Across the Amazon

Base Map. Mining deforestation hotspots across the Amazon. Letters A-J indicate locations of case studies below. Click image to enlarge.

Gold Mining is one of the major deforestation drivers across the Amazon.

Although not typically at the scale of agricultural deforestation, gold mining has the potential to severely impact critical areas such as protected areas & indigenous territories.

Relatedly, gold mining often targets remote areas, thus impacting largely intact and carbon-rich primary forests.

Here, for the first time, we present a large-scale overview of the major gold mining deforestation hotspots across the entire Amazon biome.

We found that gold mining is actively causing deforestation in nearly all nine countries of the Amazon (see Base Map).

In  this report, we focus on five countries: Peru, Brazil, Venezuela, Ecuador, and Bolivia, featuring case studies of the most severe active gold mining fronts.

In most cases, this mining is likely illegal given that it is occurring in protected areas and indigenous territories.

Note that we focus on mining activity that is causing deforestation of primary forests. There are additional critical gold mining areas that are occurring in rivers, such as in northern Peru and southern Colombia, that are not included in this report.

Below, we show a series high-resolution satellite images of the Amazon case studies. Each example highlights recent gold mining deforestation; that is comparing 2020 (left panel) with 2022 (right panel).

Case Studies, in High-resolution

Peruvian Amazon

Southern Peru (specifically, the region of Madre de Dios) is one of the most severe and emblematic examples of gold mining deforestation in the Amazon, clearing thousands of hectares of primary forest (see MAAP #154). The active mining fronts have evolved substantially over the past 20+ years. Most recently, gold mining has impacted areas such as Mangote and Pariamanu.

A. Mangote

B. Pariamanu

Brazilian Amazon

In the vast Brazilian Amazon, illegal gold mining deforestation is most severe across a number of indigenous territories, most notably: Munduruku (Pará state), Kayapó (Pará), and Yanomami (Roraima).

C. Munduruku Indigenous Territory


D. Kayapó Indigenous Territory


E. Yanomami Indigenous Territory

Venezuelan Amazon

Mining is one of the major deforestation drivers in the Venezuelan Amazon (MAAP #155). This mining impact is occurring in the designated Orinoco Mining Arc, but also key protected areas such as Caura, Canaima, and Yapacana National Parks.

F. Canaima National Park


G. Yapacana National Park

Ecuadorian Amazon

We have been documenting the numerous mining deforestation hotspots in the Ecuadorian Amazon that appear to be intensifying in recent years. Two key examples are along the Punino River (Napo and Orellana provinces) and further south in Podocarpus National Park.

H. Punino River

I. Podocarpus National Park

Bolivian Amazon

One of the newest gold mining deforestation hotspots is along the Tuichi River in Madidi National Park.

J. Madidi National Park

Methodology

Mining deforestation hotspots were identified based on MAAP’s ongoing monitoring efforts, and assisted by Amazon Mining Watch.

Acknowledgements

We thank A. Folhadella, S. Novoa, D. Larrea, C. De Ugarte, and M. Teran for helpful comments on this report, and Conservación Amazónica – ACCA for data on mining sites in northern Peru.

This work was supported by Norad (Norwegian Agency for Development Cooperation) and ICFC (International Conservation Fund of Canada).

Citation

Finer M, Ariñez A, Mamani N (2023) Mining Deforestation Across the Amazon. MAAP: 178.

MAAP #182: Gold Mining Deforestation in the Ecuadorian Amazon

Base Map. Major cases of recent gold mining deforestation in Ecuadorian Amazon.

Gold mining is one of the major deforestation drivers across the Amazon, with well-known cases in Peru, Brazil, and Venezuela.

In a recent series of technical articles*, in collaboration with the Ecuadorian organization Foundation EcoCiencia, we have also shown that gold mining is escalating in the Ecuadorian Amazon.

Here, we summarize the results from the series and present 5 major cases of recent gold mining deforestation in Ecuador (see Base Map).

These cases, which include gold mining expansion in protected areas, indigenous territories, and primary forests, are:

  • Punino River, located between Napo and Orellana provinces, has experienced the rapid mining deforestation expansion of 217 hectares since 2019.
    l
  • Yutzupino, located in Napo province, has experienced mining deforestation of 125 hectares since 2021. Surrounding sites in Napo have added 490 hectares since 2017.
    l
  • Shuar Arutam Indigenous Territory, located in Morona Santiago province, has experienced 257 hectares of mining deforestation since 2021.
    l
  • Podocarpus National Park, located in Zamora Chinchipe province, has experienced 25 hectares of mining deforestation within the park since 2019.
    k
  • Upper Nangaritza River Protected Forest, also located in Zamora Chinchipe has experienced 545 hectares of mining deforestation since 2018.

In total, we have documented the recent gold mining deforestation of 1,660 hectares (4,102 acres) in the Ecuadorian Amazon. This is equivalent to 2,325 soccer fields.

For each case, we show high-resolution satellite images of the recent gold mining deforestation.

Case Studies – Recent Gold Mining Deforestation in the Ecuadorian Amazon

For each of the five cases presented below, we show both a high-resolution (3 meters) example of the recent mining deforestation (left panel) and very-high resolution (0.5 meters) zoom of the mining activity (right panel).

Punino River

Along the Punino River, located between Napo and Orellana provinces, we have documented the rapid mining deforestation expansion of 217 hectares since November 2019. Alarmingly, much of this activity (85%) occurred most recently in 2022. See MAAP #176 for more details.

Case 1. Punino River.

Yutzupino/Napo

In this area, located in Napo province, we have documented the mining deforestation of 125 hectares since October 2021, including major impacts along the Jatunyacu River. Surrounding sites in Napo have added 490 hectares since 2017. See MAAP #151 and MAAP #162 for more details.

Case 2. Yutzupino/Napo.

Upper Nangaritza River Protected Forest

In Upper Nangaritza River Protected Forest, also located in Zamora Chinchipe province, we have documented the mining deforestation of 545 hectares since 2018 along the Nangaritza River. See MAAP #167 for more details.

Case 3. Upper Nangaritza River Protected Forest.

Shuar Arutam Indigenous Territory

In the Shuar Arutam Indigenous Territory, located in Morona Santiago province, we have documented the mining deforestation of 257 hectares since 2021. See MAAP #170 for more details.

Case 4. Shuar Arutam Indigenous Territory.

Podocarpus National Park

In Podocarpus National Park, located in Zamora Chinchipe province, we have documented the mining deforestation of 25 hectares since 2019 within the park, including the presence of over 200 mining camps. See MAAP #172 for more details.

Case 5. Podocarpus National Park.

*MAAP Technical Reports

MAAP #176: Expansión Alarmante de Minería en la Amazonía Ecuatoriana (Caso Punino)
https://www.maapprogram.org/2023/mineria-ecuador-punino/

MAAP #172: Minería ilegal de oro en el Parque Nacional Podocarpus, Ecuador
https://www.maapprogram.org/2023/mineria-podocarpus-ecuador/

MAAP #170: Actividad Minera en Territorio Shuar Arutam (Amazonia Ecuatoriana)
https://www.maapprogram.org/2022/mineria-shuar-arutam-ecuador/

MAAP #167: Actividad Minera en el Bosque Protector Cuenca Alta del Río Nangaritza (Ecuador)
https://www.maapprogram.org/2022/minera-nangaritza-ecuador/

MAAP #162: Dinámica de la actividad minera en la  provincia de Napo (Ecuador)
https://www.maapprogram.org/2022/mineria-napo-ecuador/

MAAP #151: Minería Ilegal en la Amazonía Ecuatoriana
https://www.maapprogram.org/2022/mineria-ecuador/

Acknowledgments

This report is part of a series focused on the Ecuadorian Amazon through a strategic collaboration between the organizations Fundación EcoCiencia and Amazon Conservation, with the support of the Norwegian Agency for Development Cooperation (Norad).

MAAP #164: Amazon Tipping Point – Where Are We?

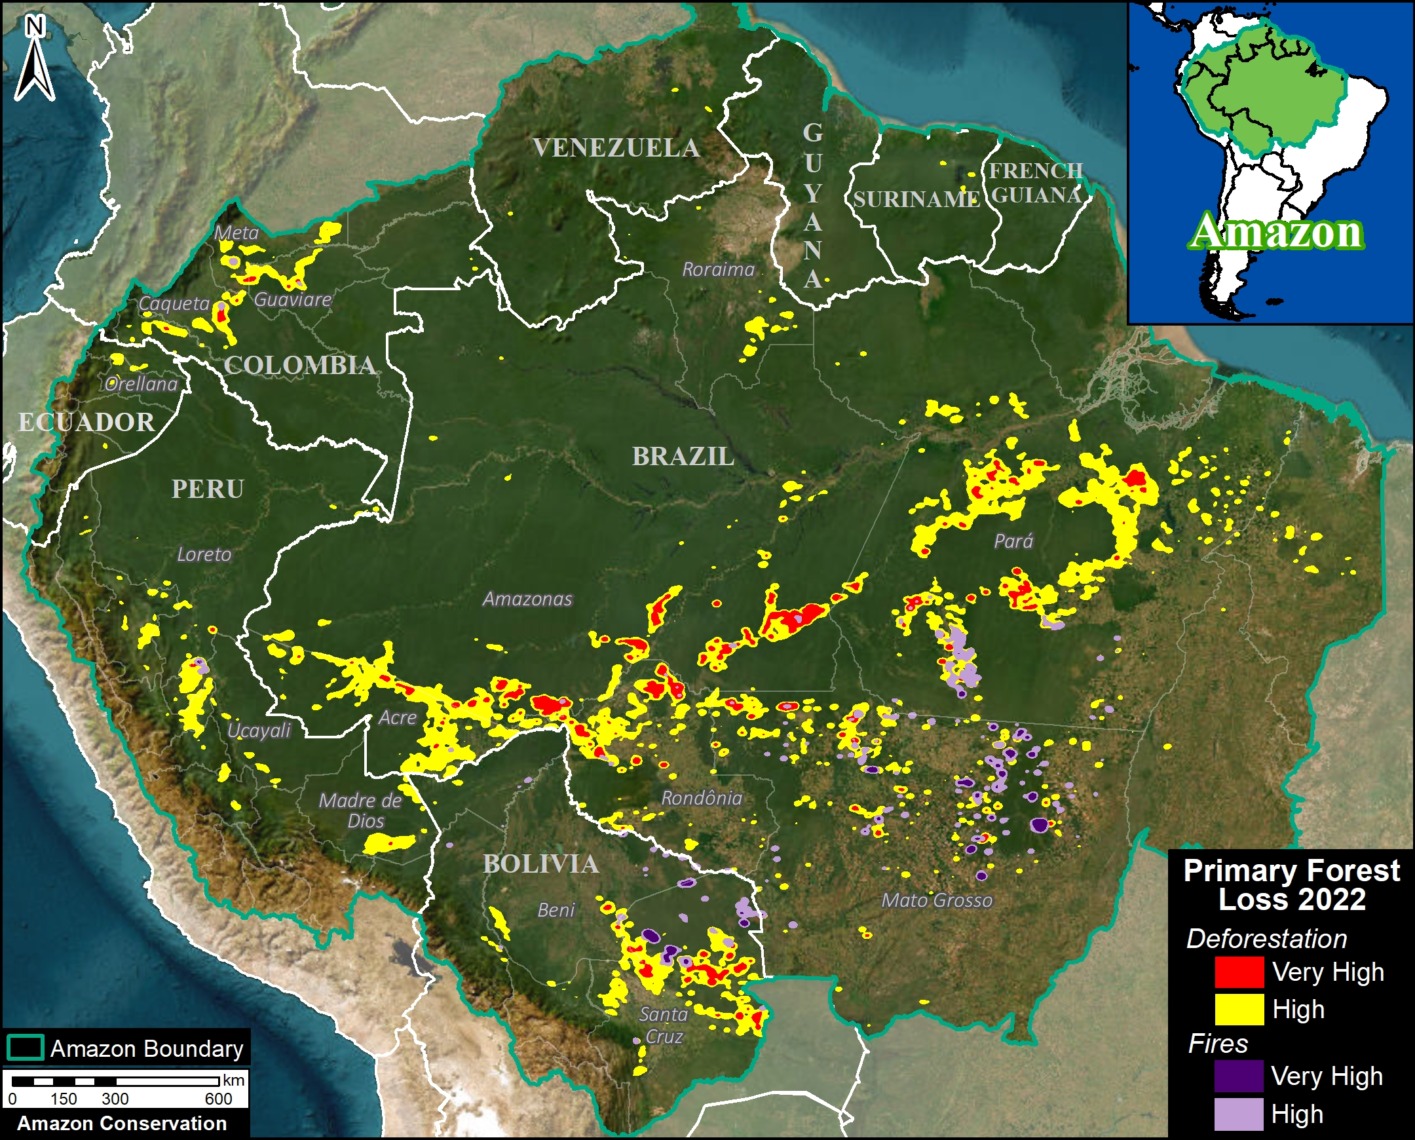
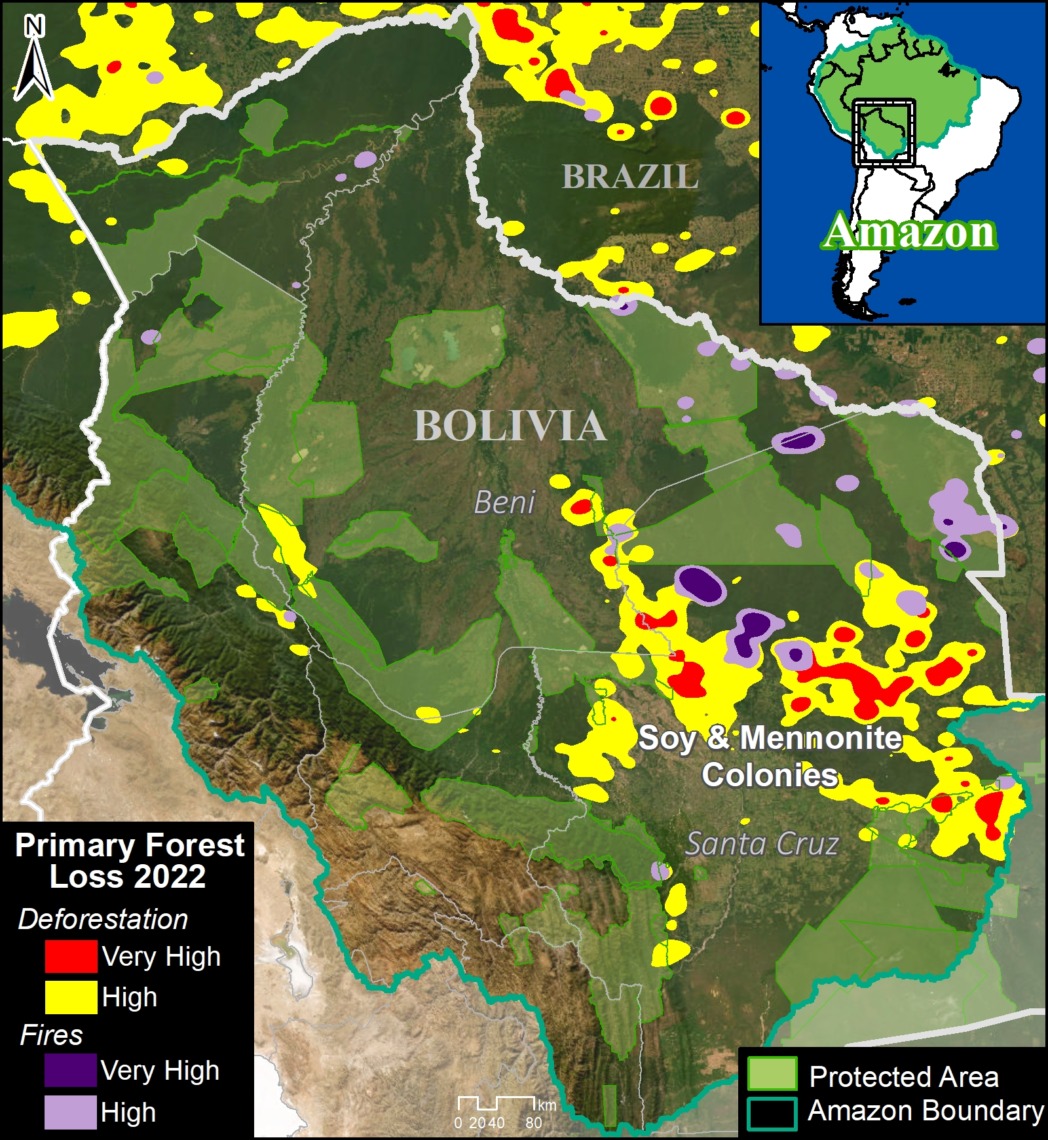
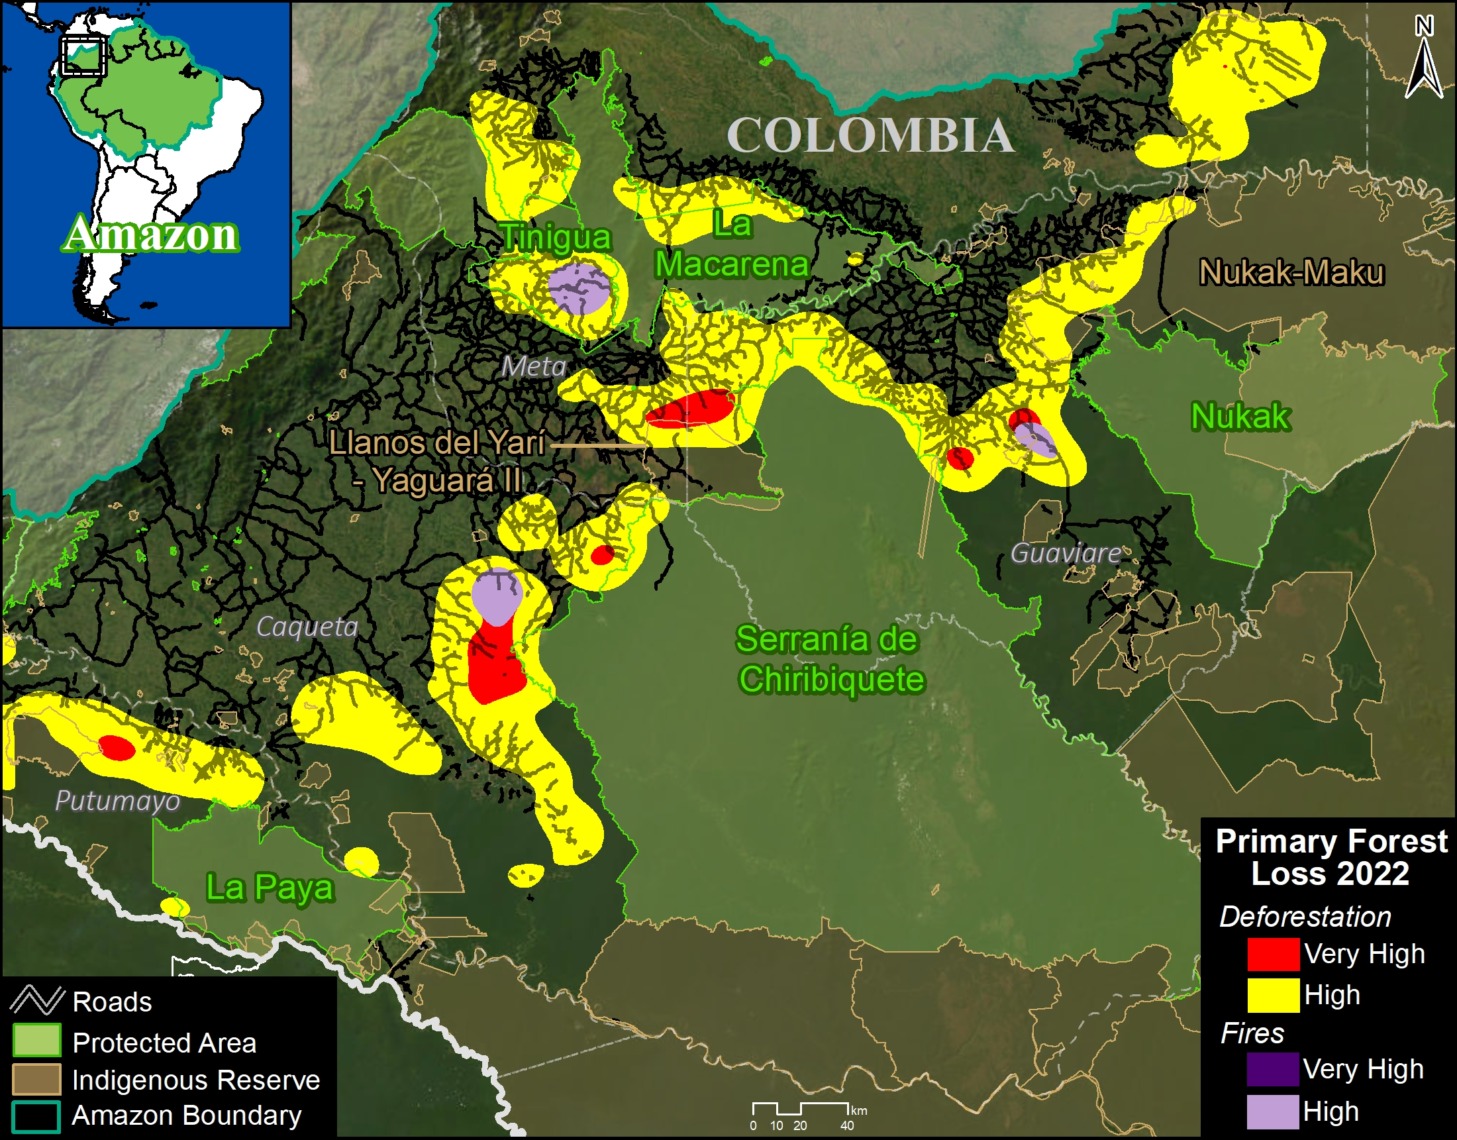
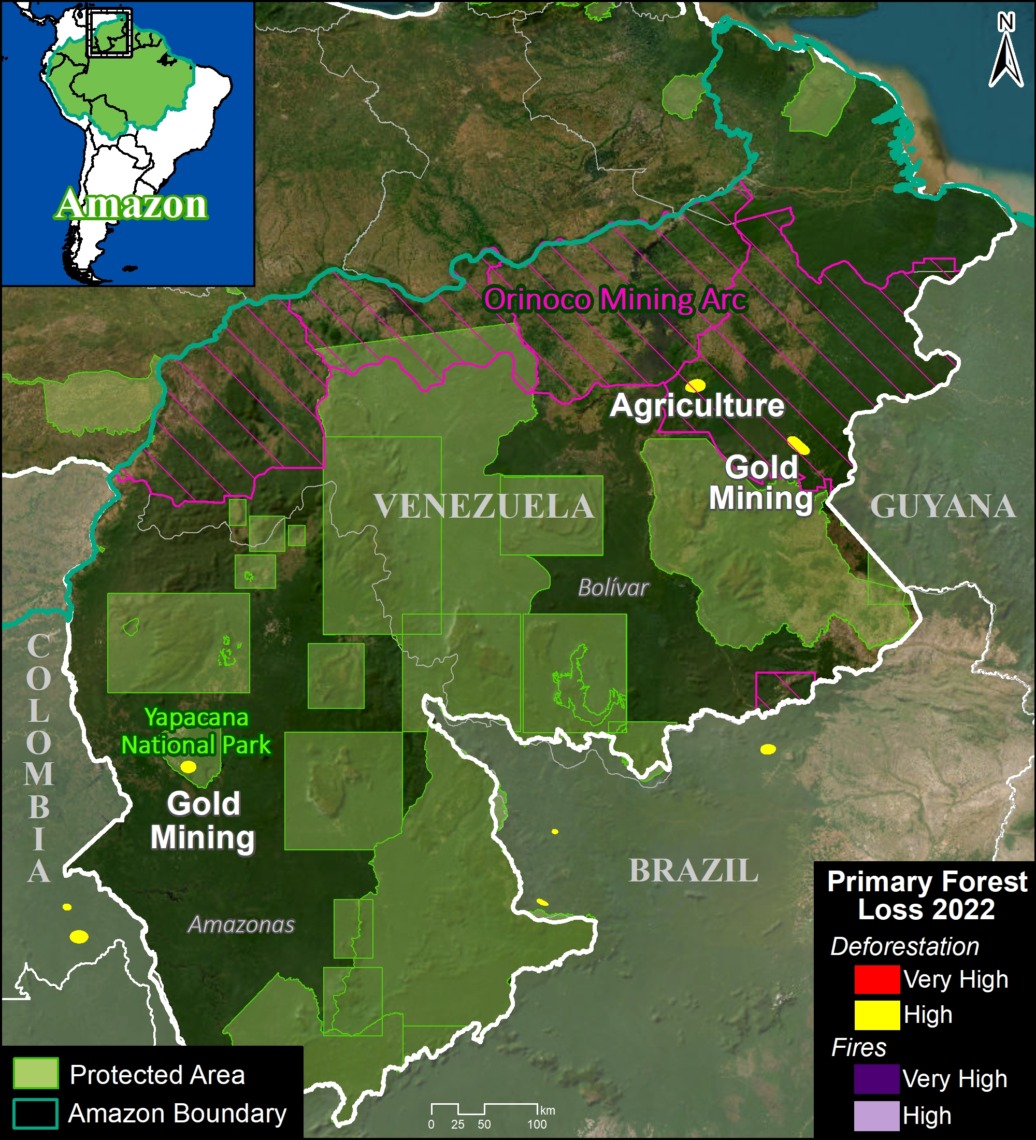
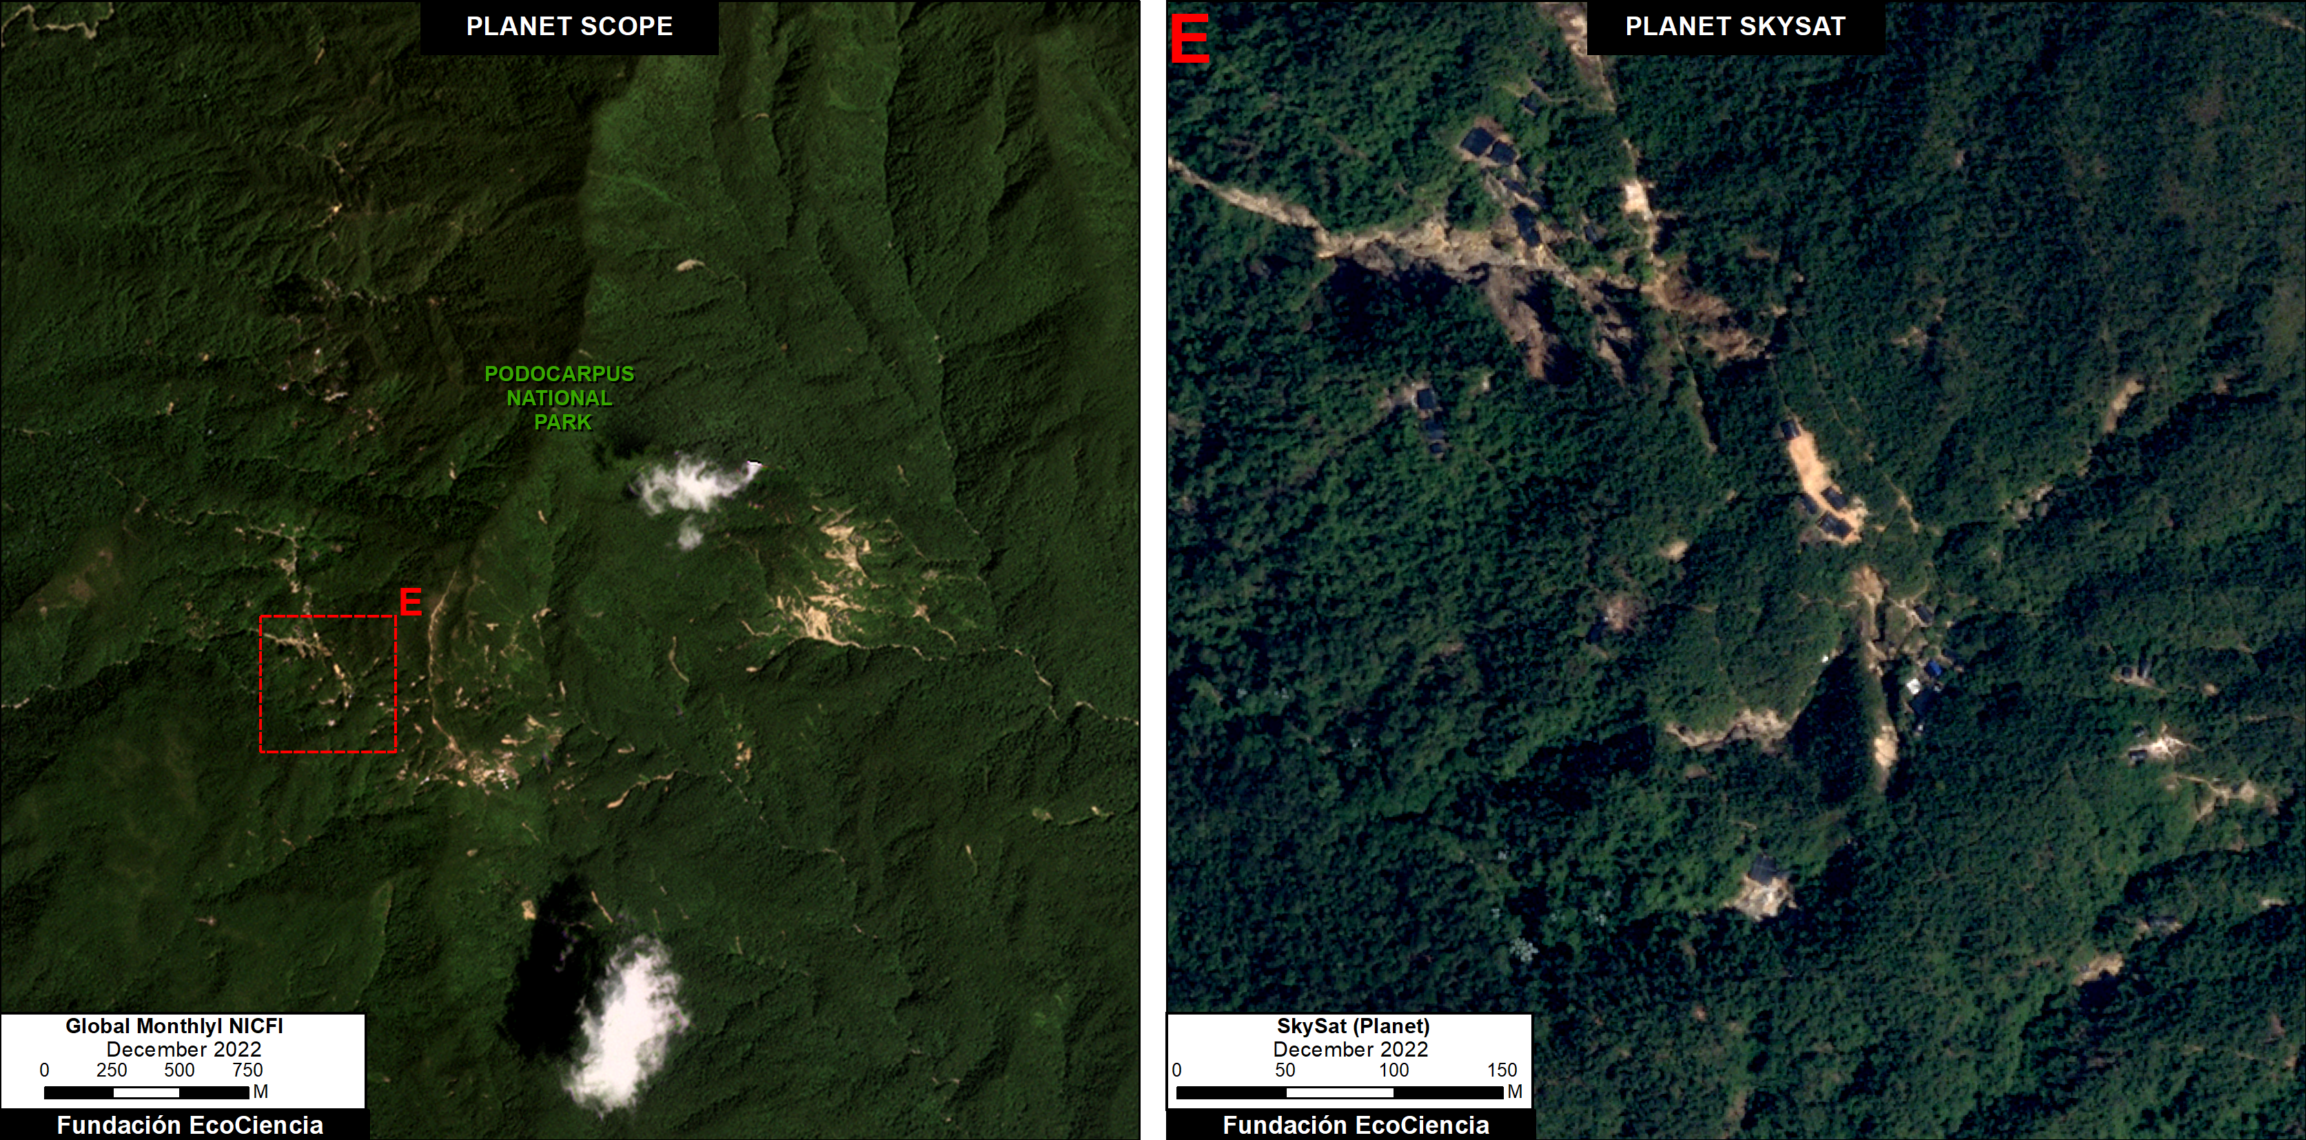
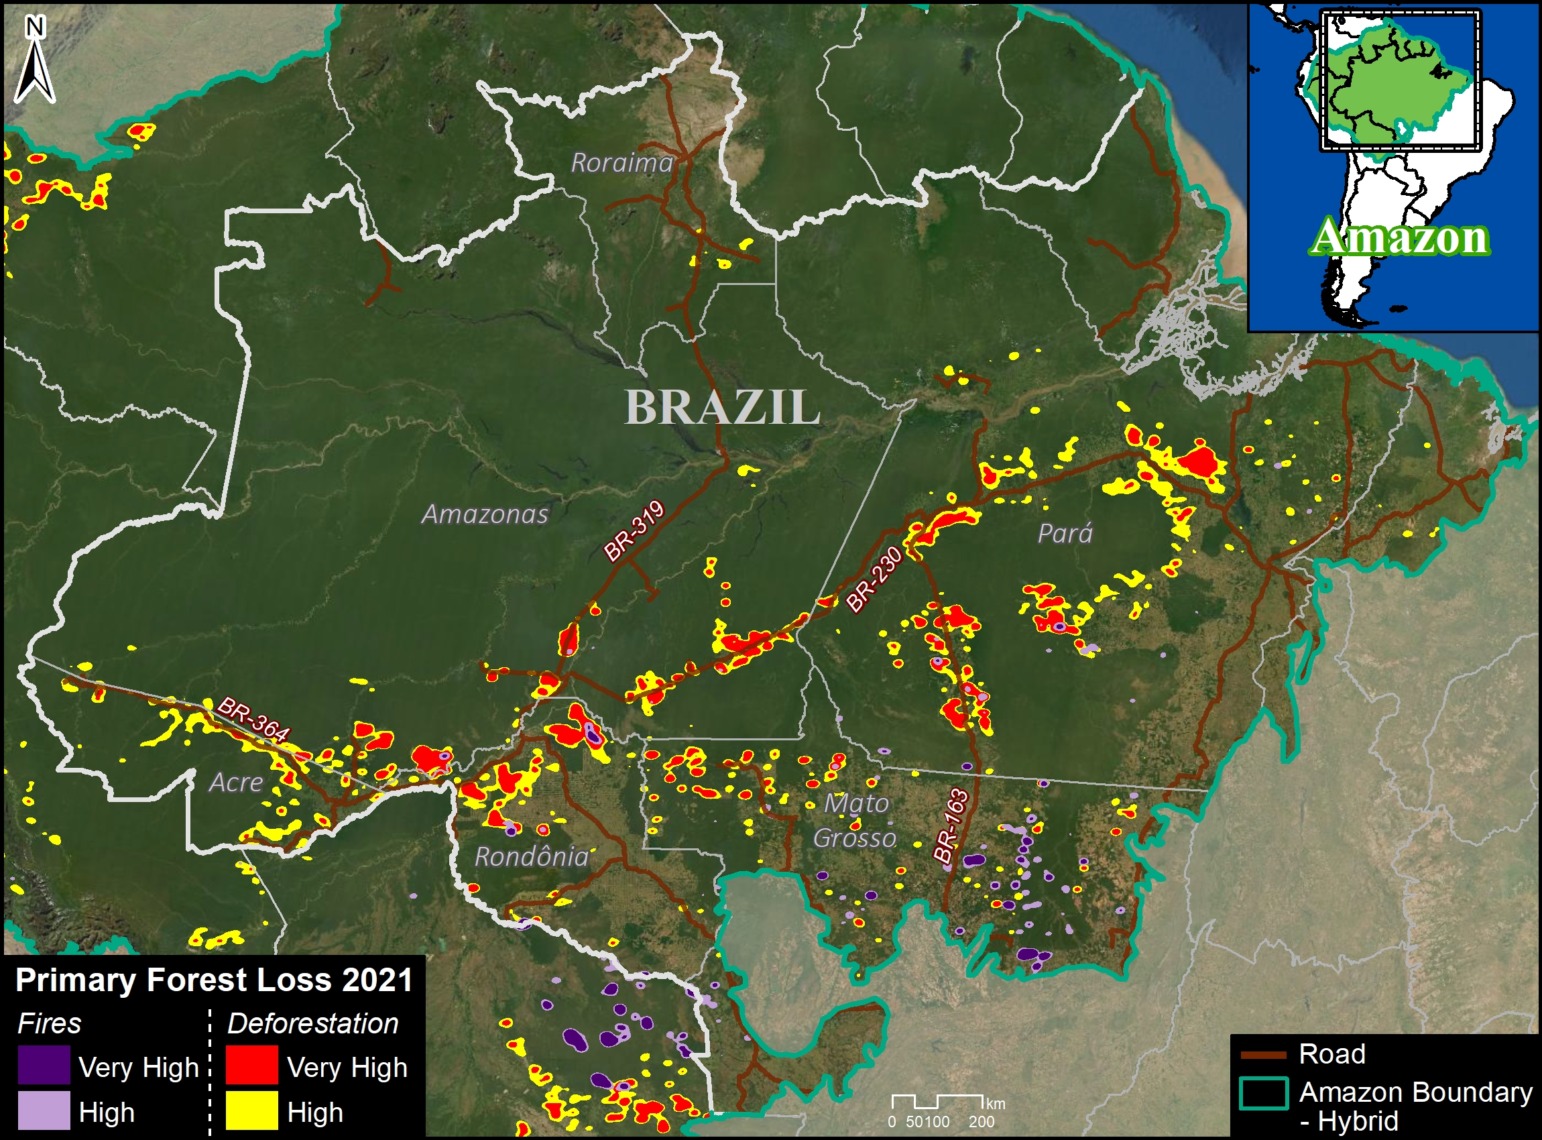
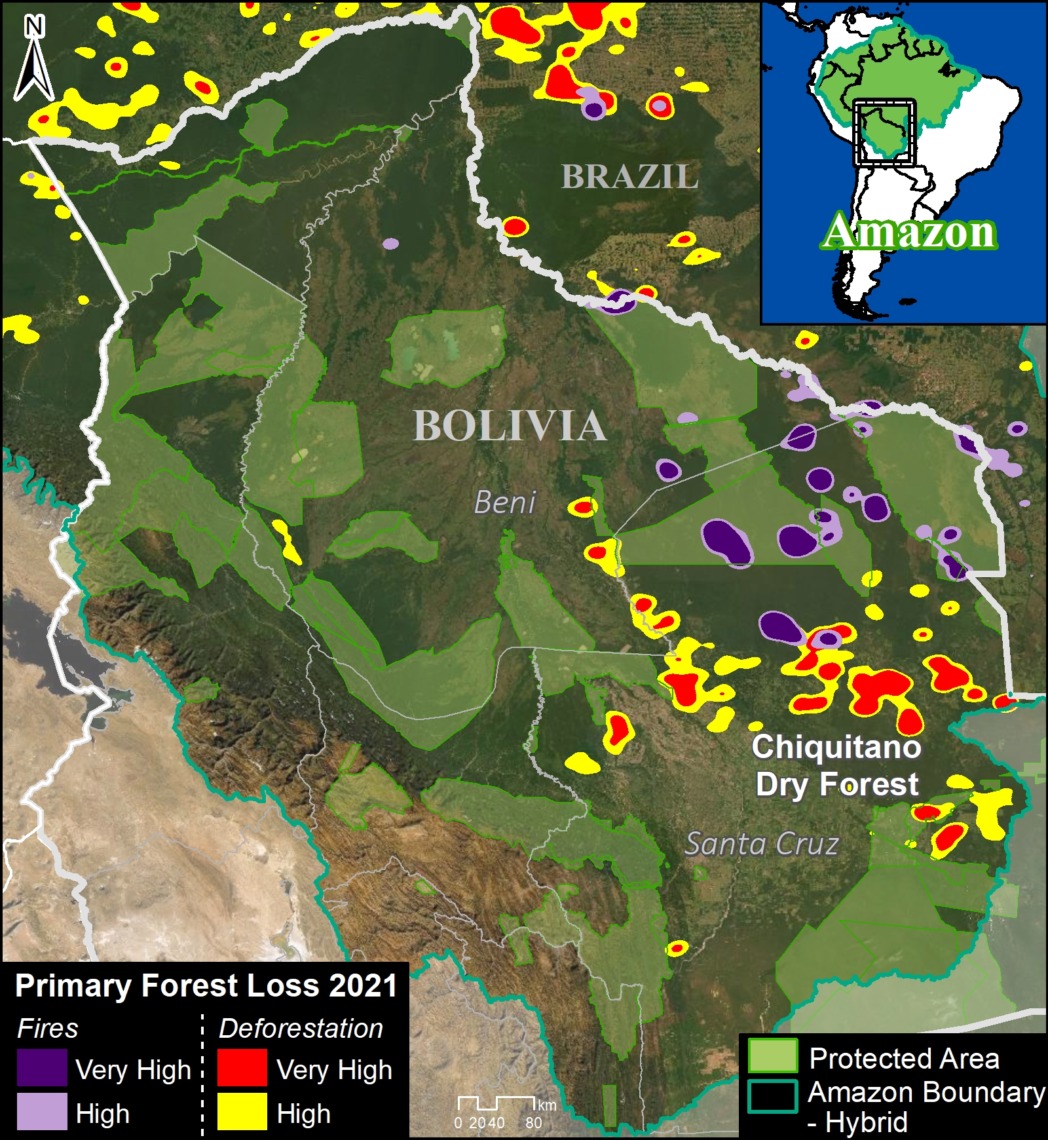
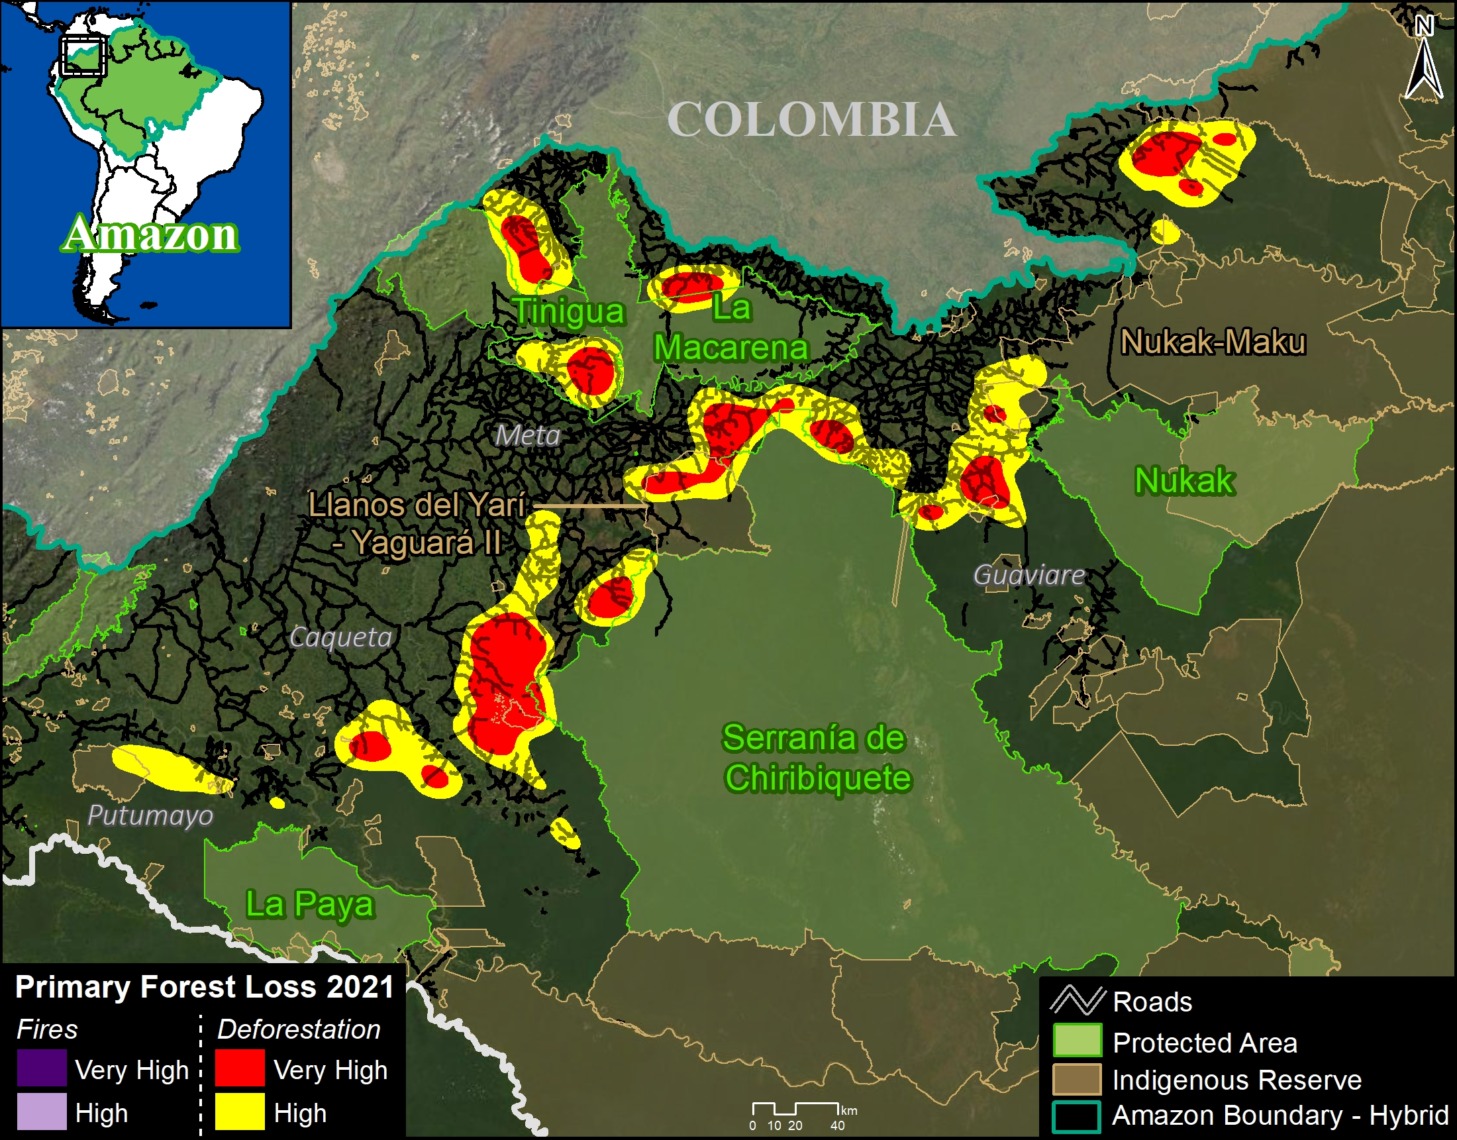
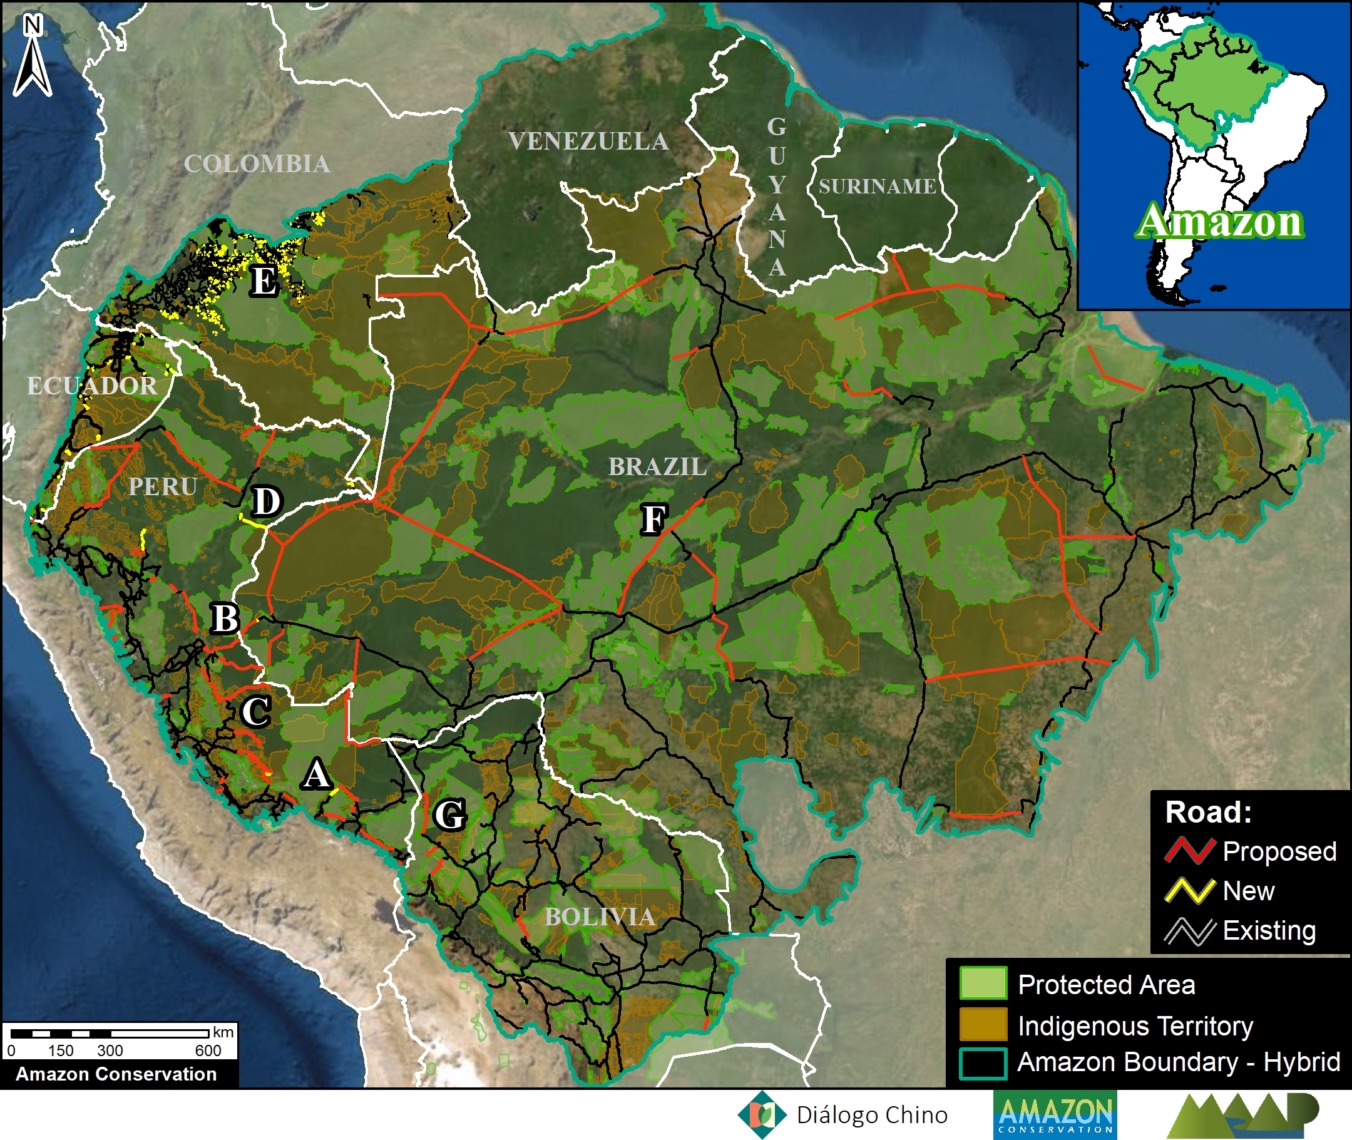
Base Map. Total Amazon forest loss. Data: ACA/MAAP.

It is increasingly reported that the largest rainforest in the world, the Amazon, is rapidly approaching a tipping point.

As repeatedly highlighted by the late Tom Lovejoy (see Acknowledgements), this tipping point is where parts of the rainforest will convert into drier ecosystems due to disrupted precipitation patterns and more intense dry seasons, both exacerbated by deforestation.

The Amazon generates much of its own rainfall by recycling water as air passes from its major source in the Atlantic Ocean. Thus, high deforestation in the eastern Amazon may lead to downwind impacts in the central and western Amazon (see Background section below).

The scientific literature indicates this tipping point could be triggered at 25% Amazon forest loss, in conjunction with climate change impacts.

The literature, however, is less clear on the critical first part of the tipping point equation: how much of the Amazon has already been lost?

There are numerous estimates, including 14% forest loss cited in the recent Science Panel for the Amazon report, but we did not find any actual definitive studies specifically addressing this question.

Here, we directly tackle this key question of how much of the original Amazon has been lost to date.

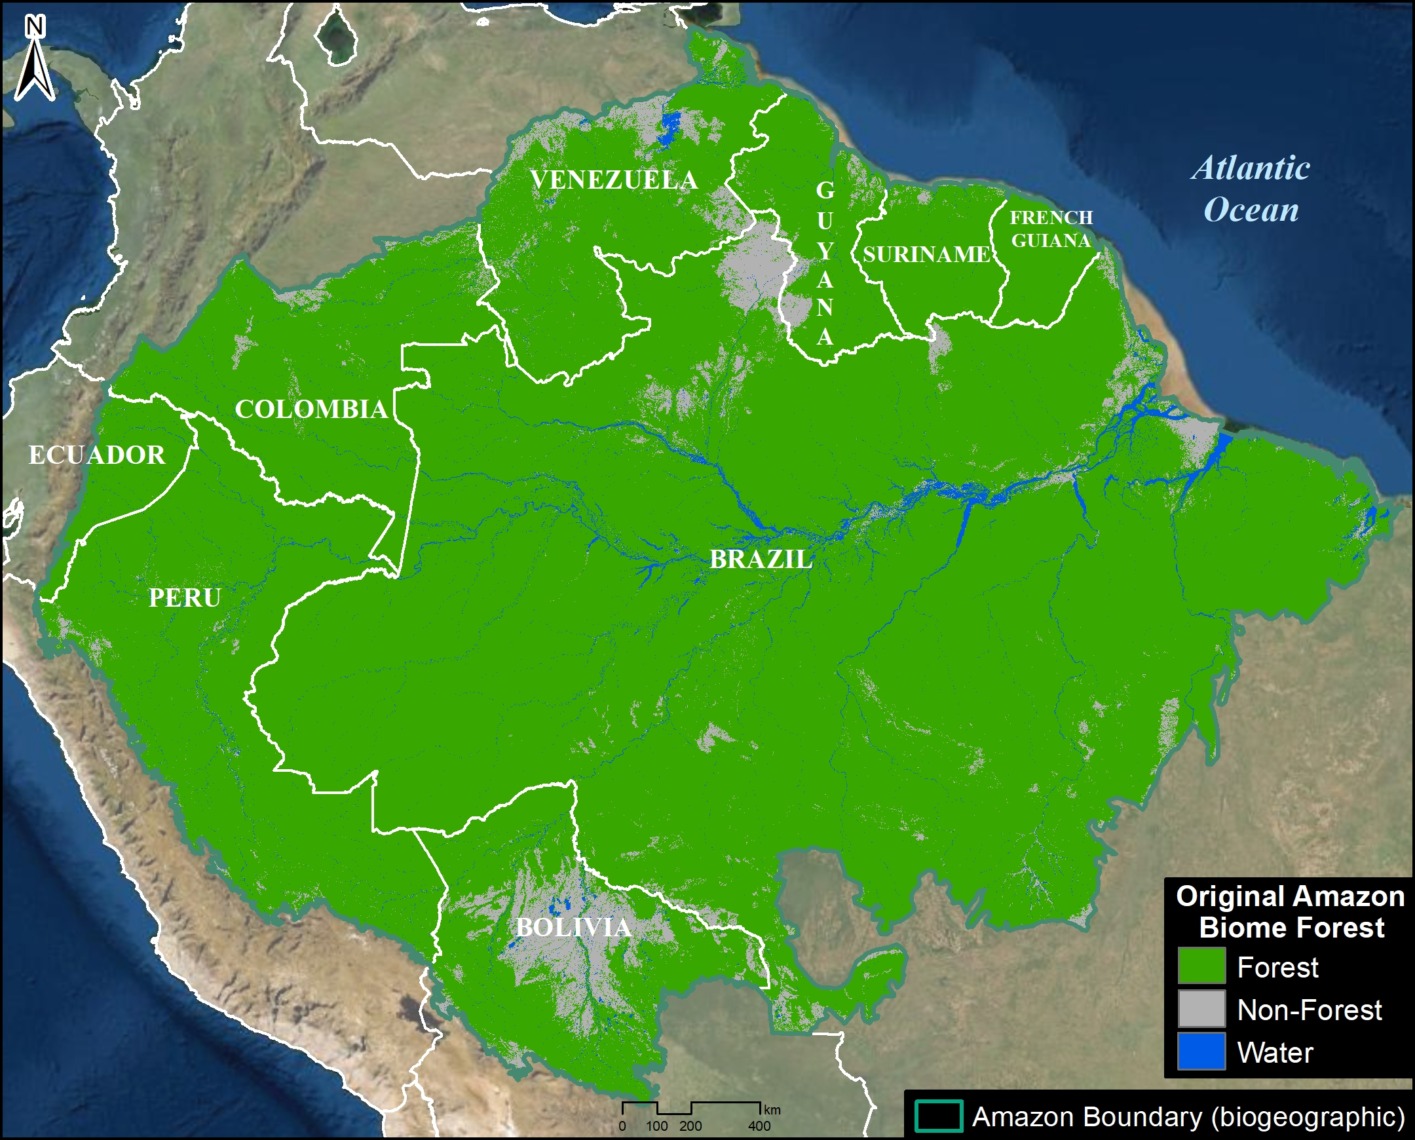
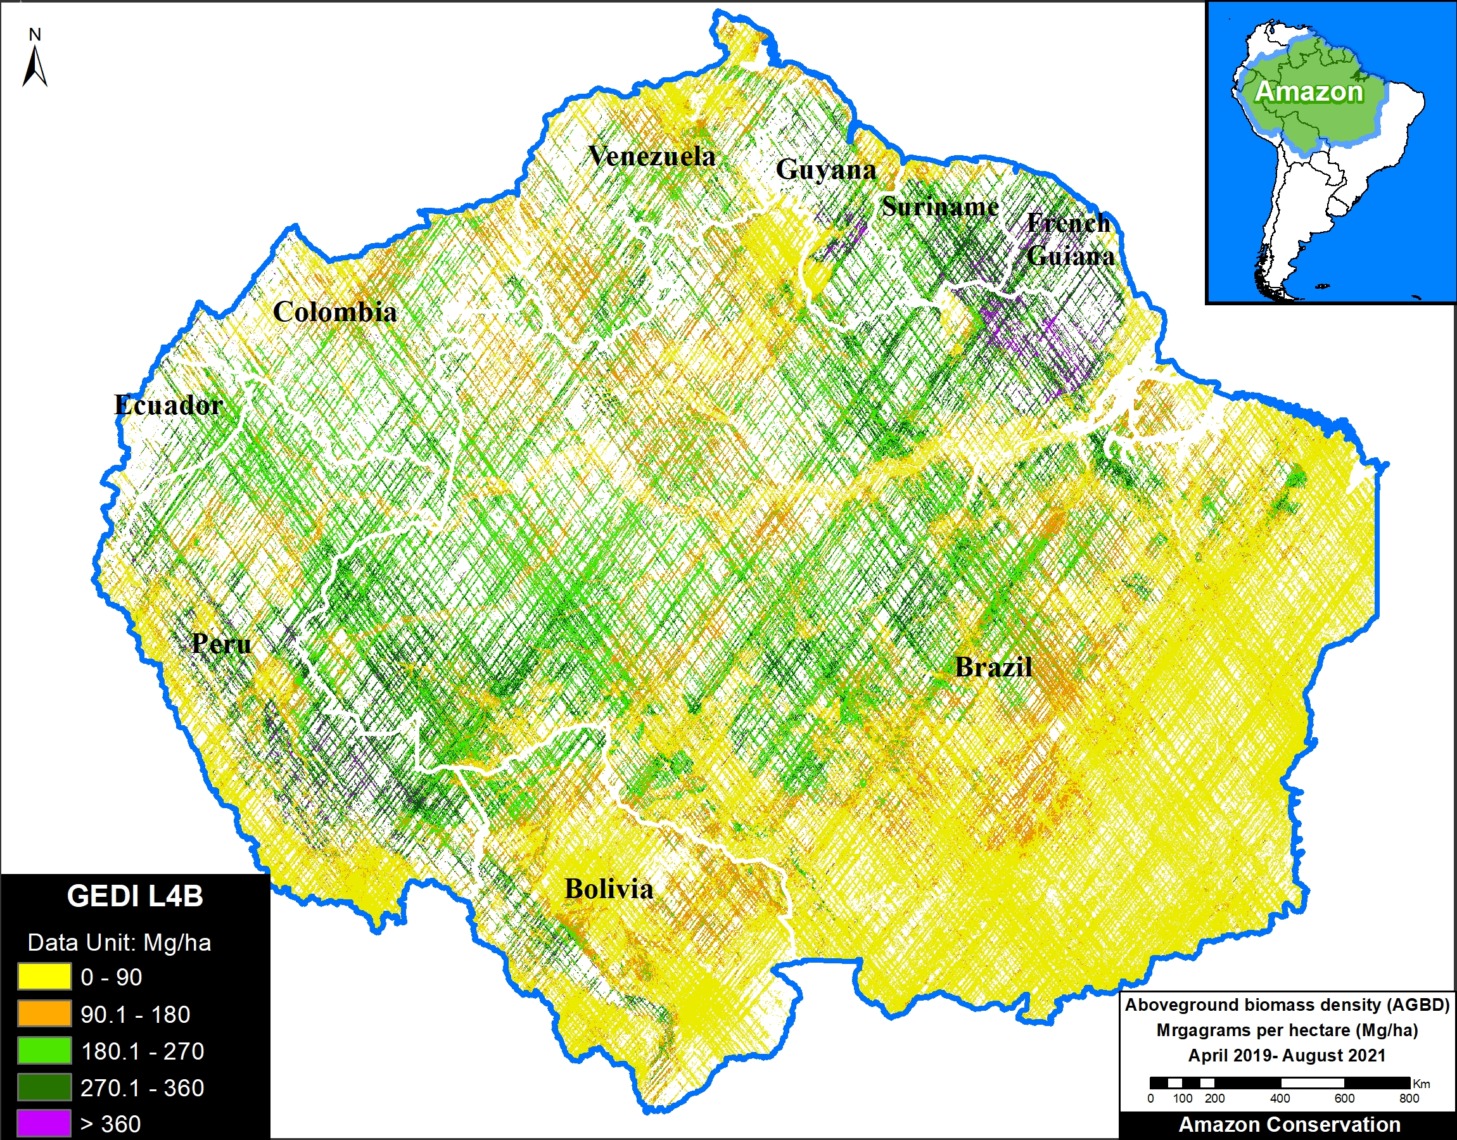
First, we present the first known rigorous estimate of original Amazon biome forest prior to European colonization: over 647 million hectares (1.6 billion acres; see Image 1 below).

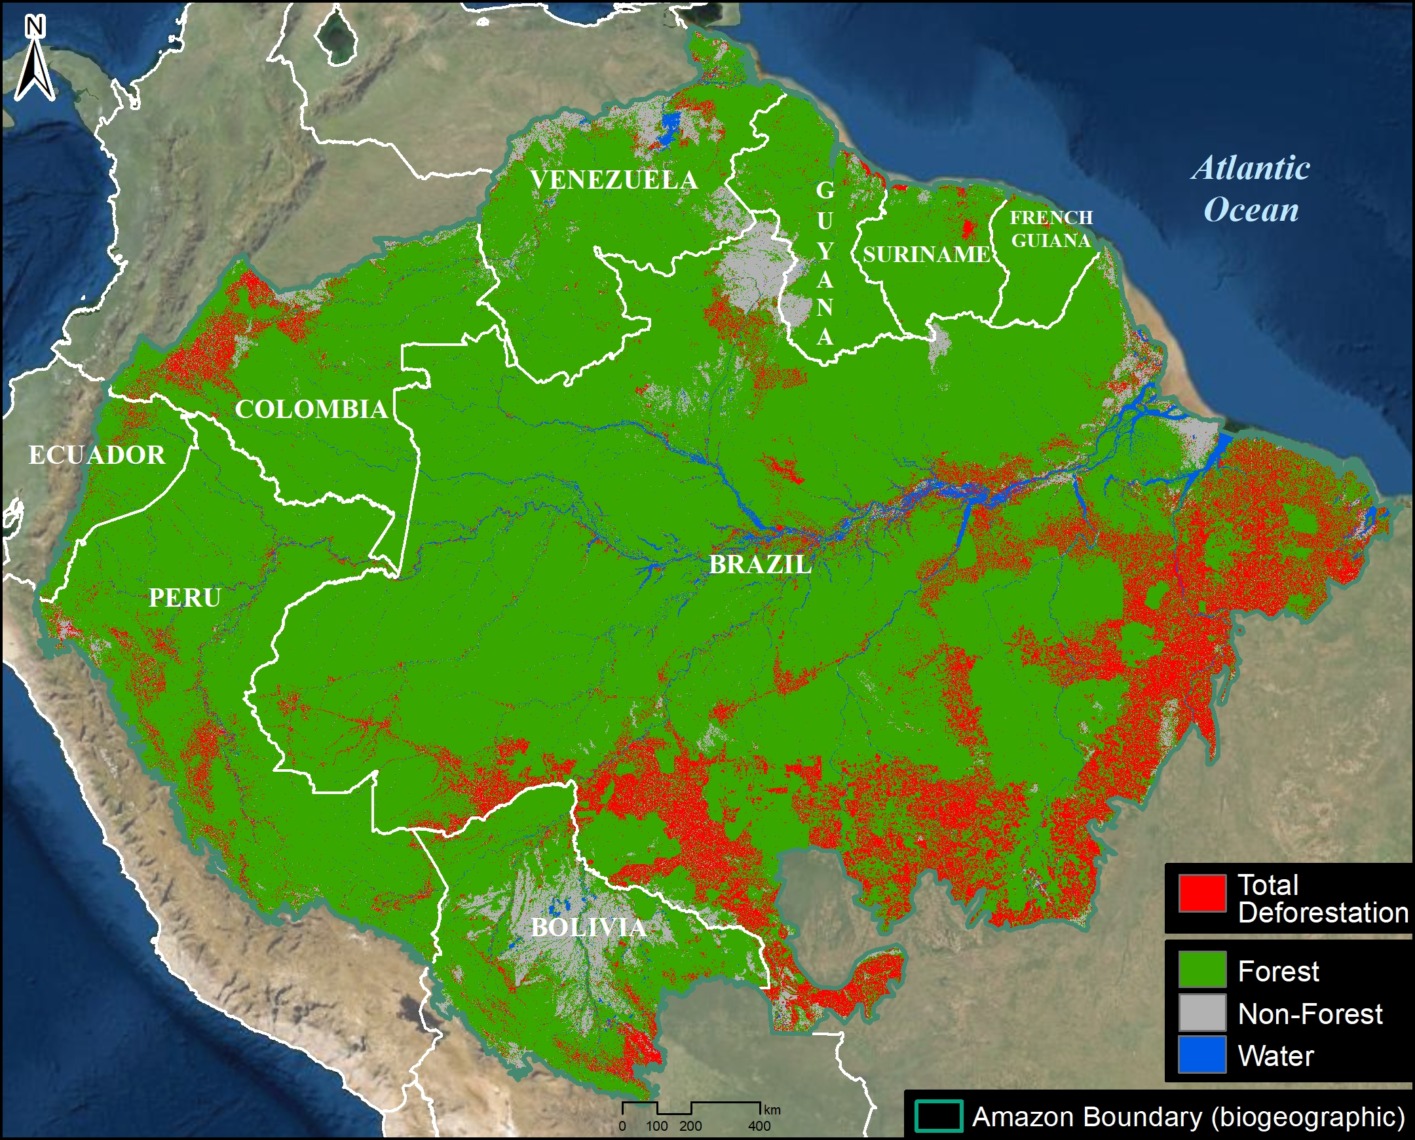
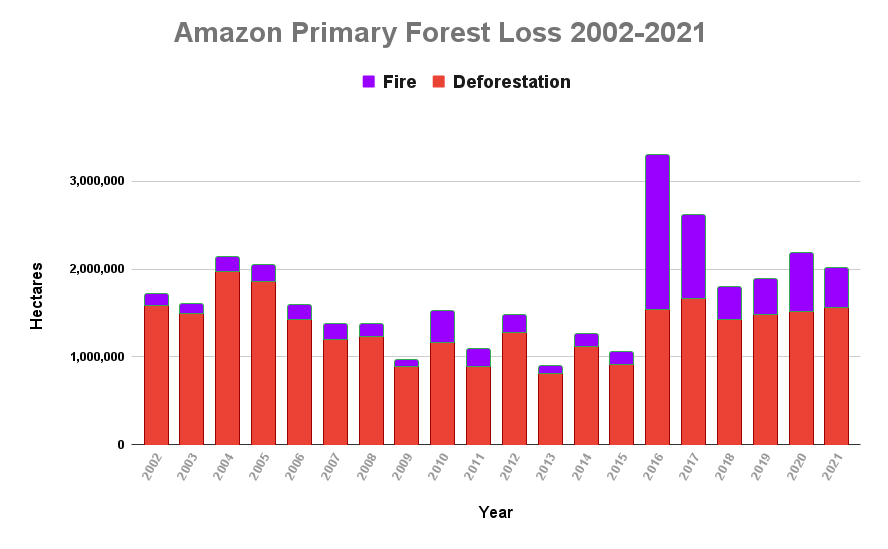
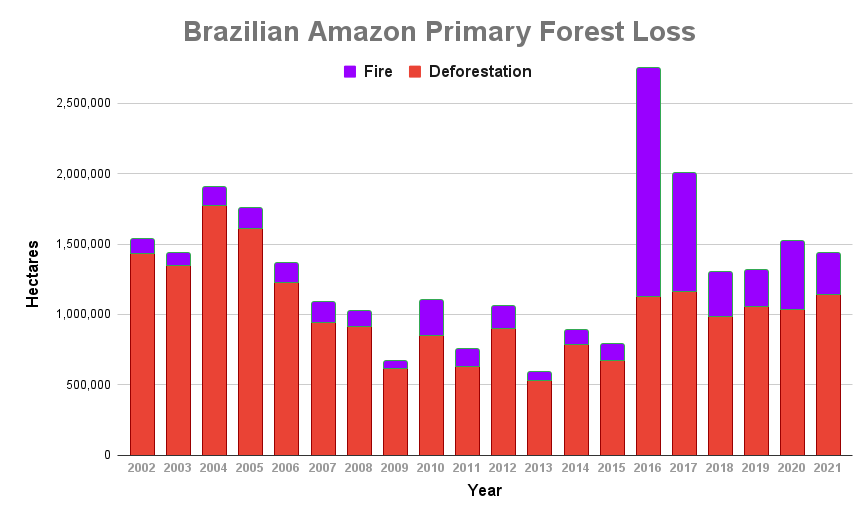
Second, we estimate the accumulated total Amazon forest loss, from the original estimate to the present: over 85 million hectares (211 million acres; see Base Map).

Combining these two results, we estimate that 13% of the original Amazon biome forest has been lost.

More importantly, however, focusing on just the eastern third of the Amazon biome (see Image 2 below), we estimate that 31% of the original forest has been lost, above the speculated tipping point threshold. This finding is critical because the tipping point will likely be triggered in the eastern Amazon, as it is closest to the oceanic source of the water that then flows to the central and western Amazon.

Original Amazon Forest

Image 1 shows the first known estimate of original Amazon forest prior to European colonization. Note that we use a broader biogeographical definition of the Amazon that covers nine countries (Amazon biome) rather than the strict Amazon watershed (see Methodology).

Image 1. Original Amazon biome forest. Data: ACA/MAAP.

This represents the most rigorous effort to date to recreate the original Amazon. For example, we attempted to recreate original forest lost to historic dam reservoirs.

The map has just three classes: Original Amazon forest, Original non-forest (such as natural savannah), and Water.

We found that the original Amazon forest covered over 647 million hectares (647,607,020 ha). This is equivalent to 1.6 billion acres.

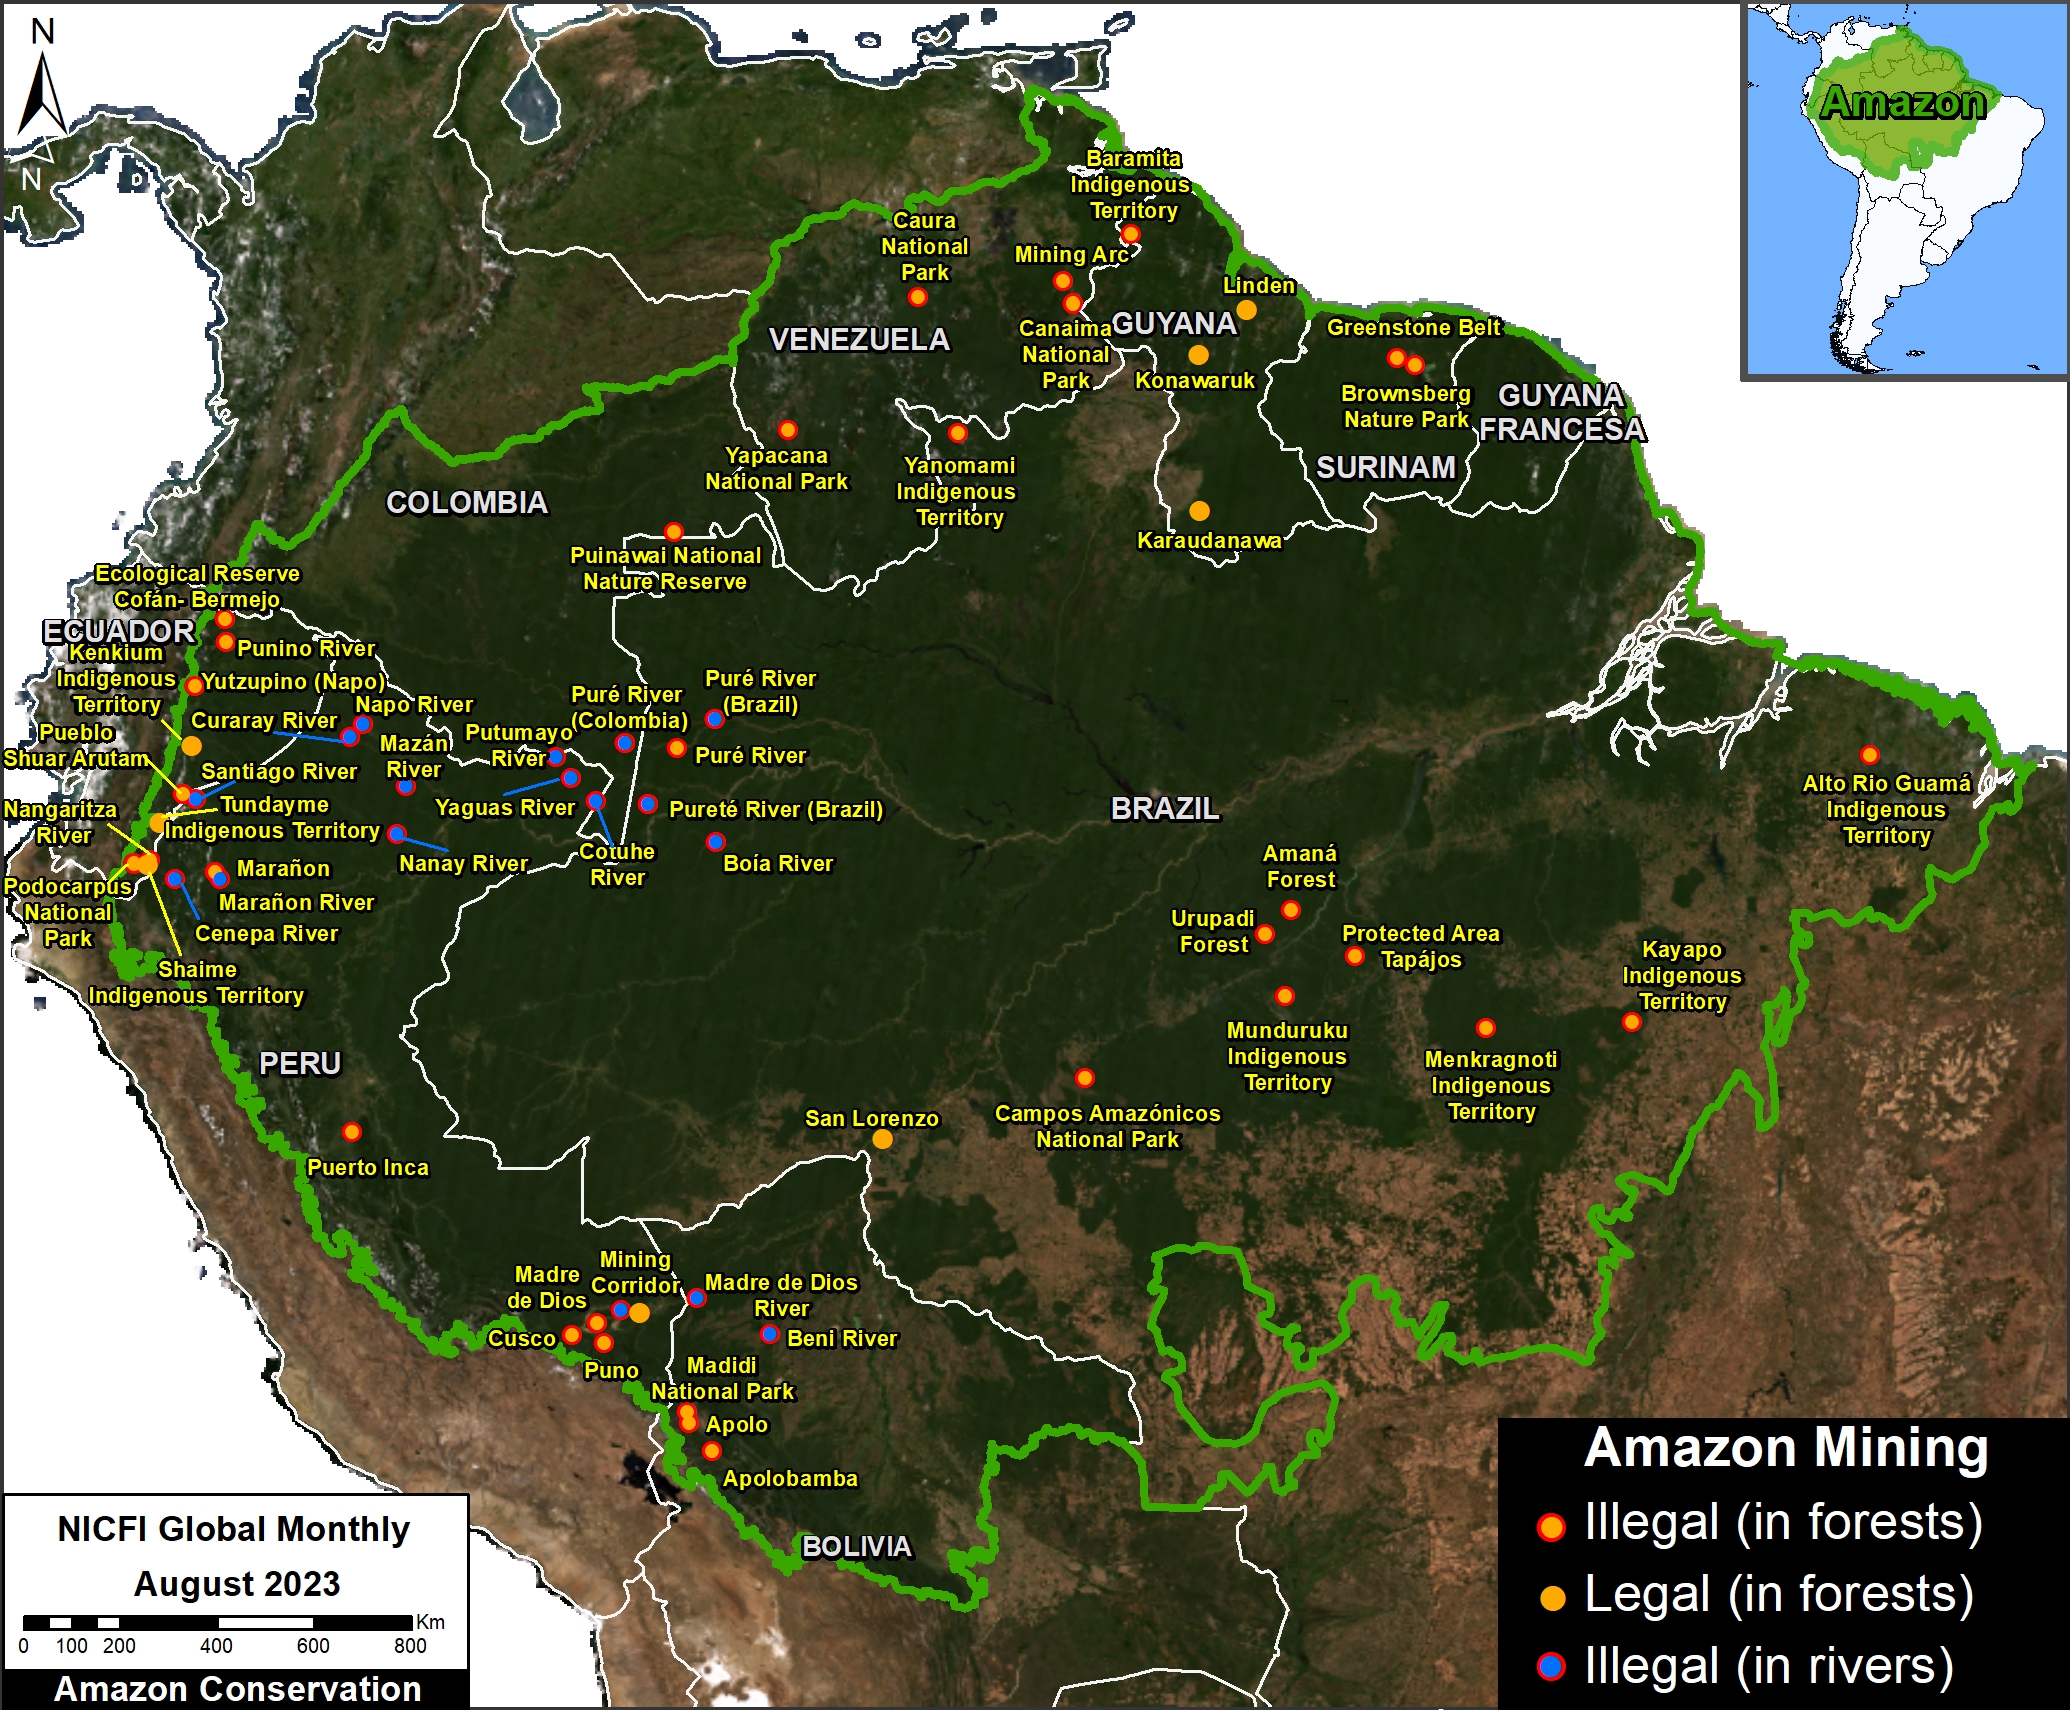
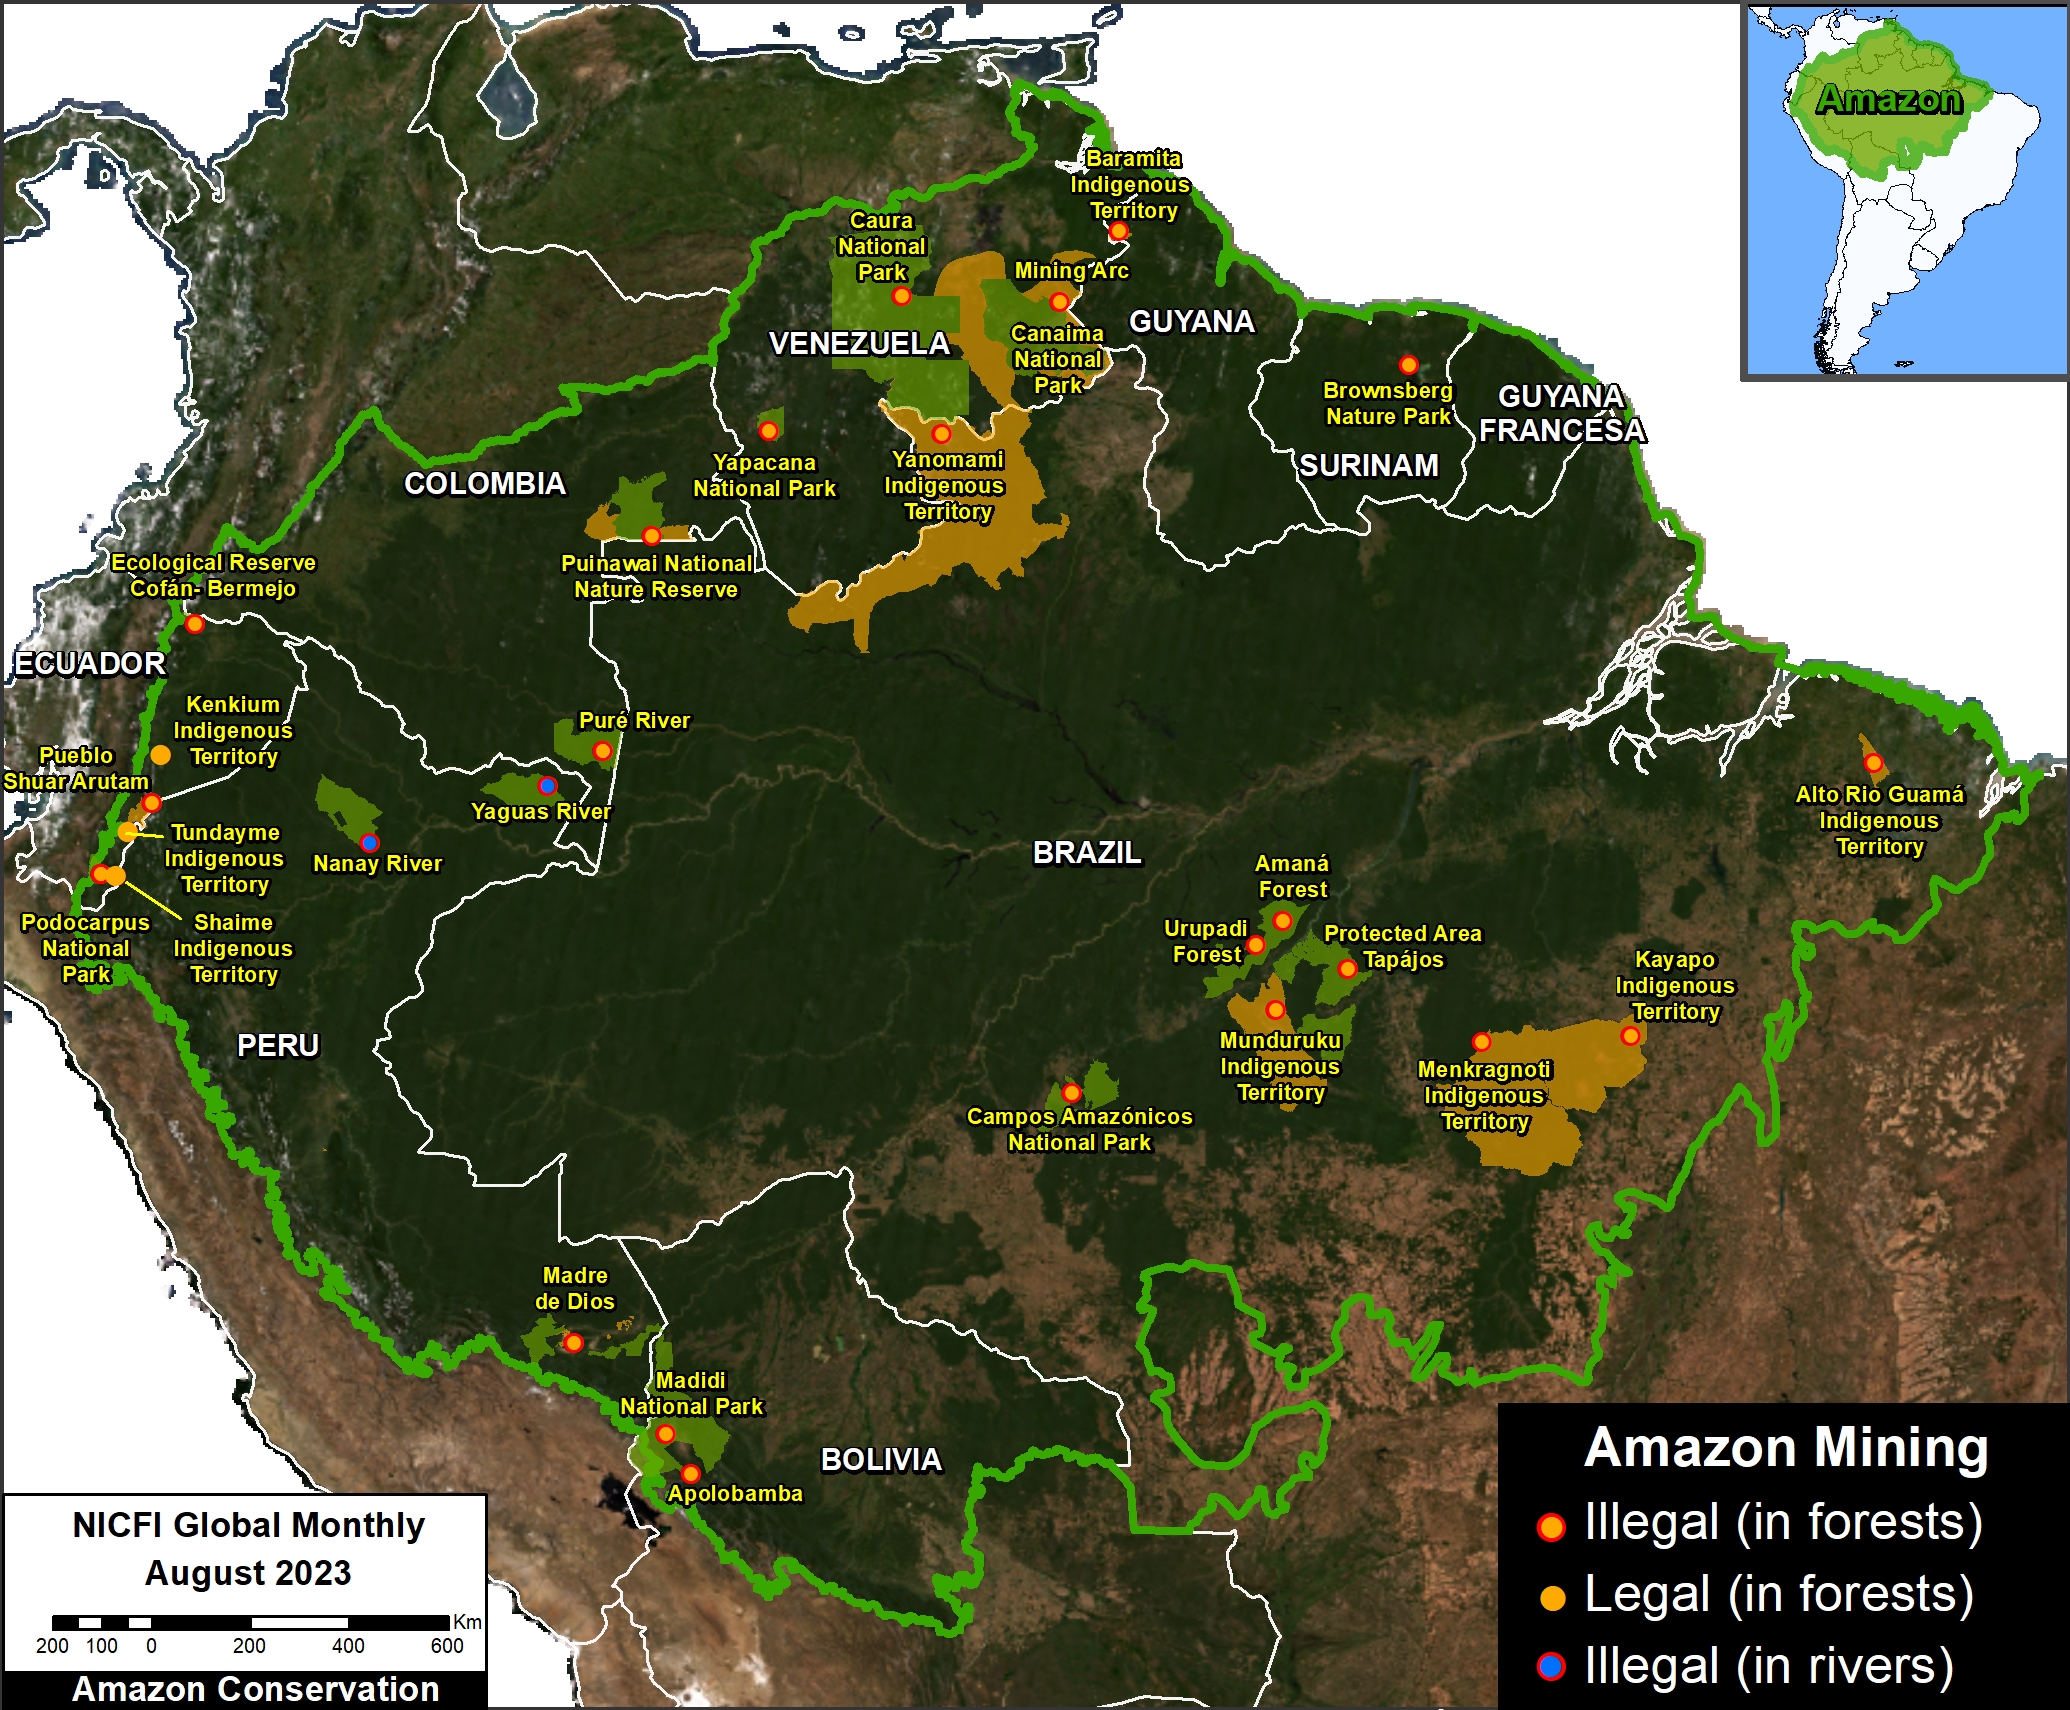
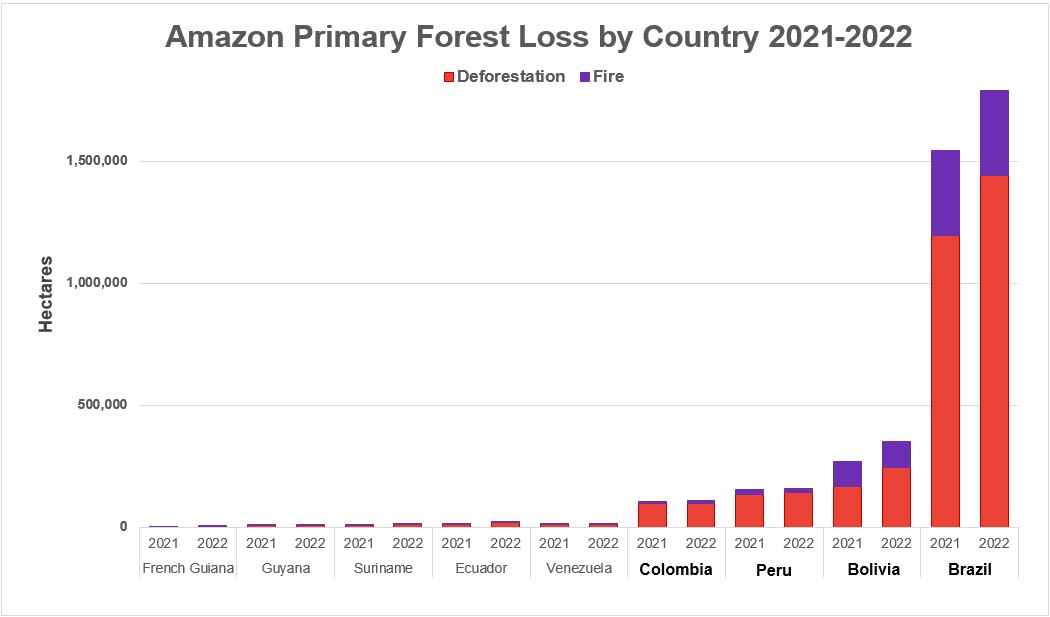
Of this total, 61.4% occurred in Brazil, followed by Peru (12%), Colombia (7%), Venezuela (6%), and Bolivia (5%). The remaining four countries (Ecuador, Guyana, Suriname, and French Guiana) make up the final 8%.

Amazon Forest Loss

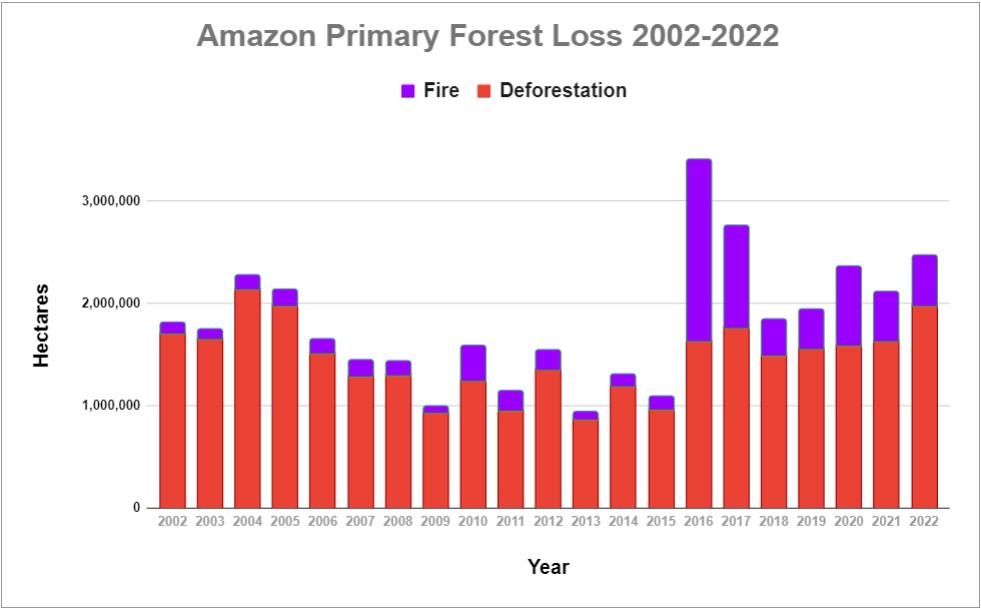
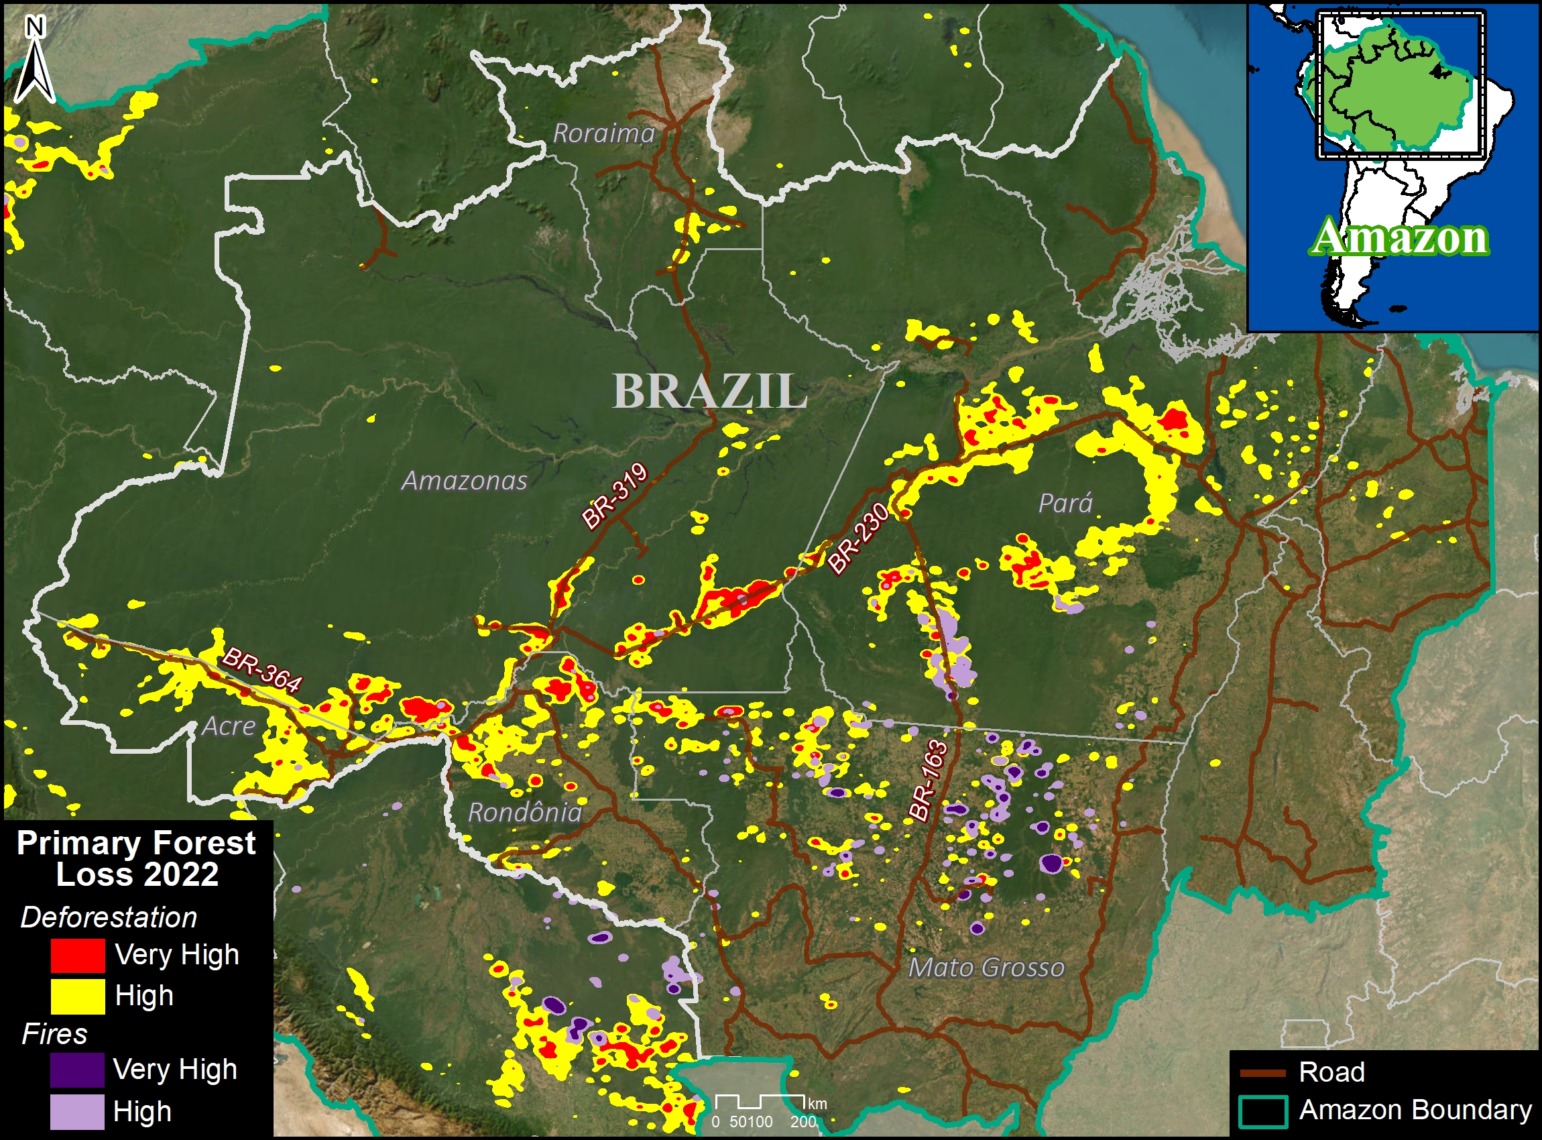
Image 2 shows the accumulated total Amazon forest loss, from the original estimate to the present (2022).

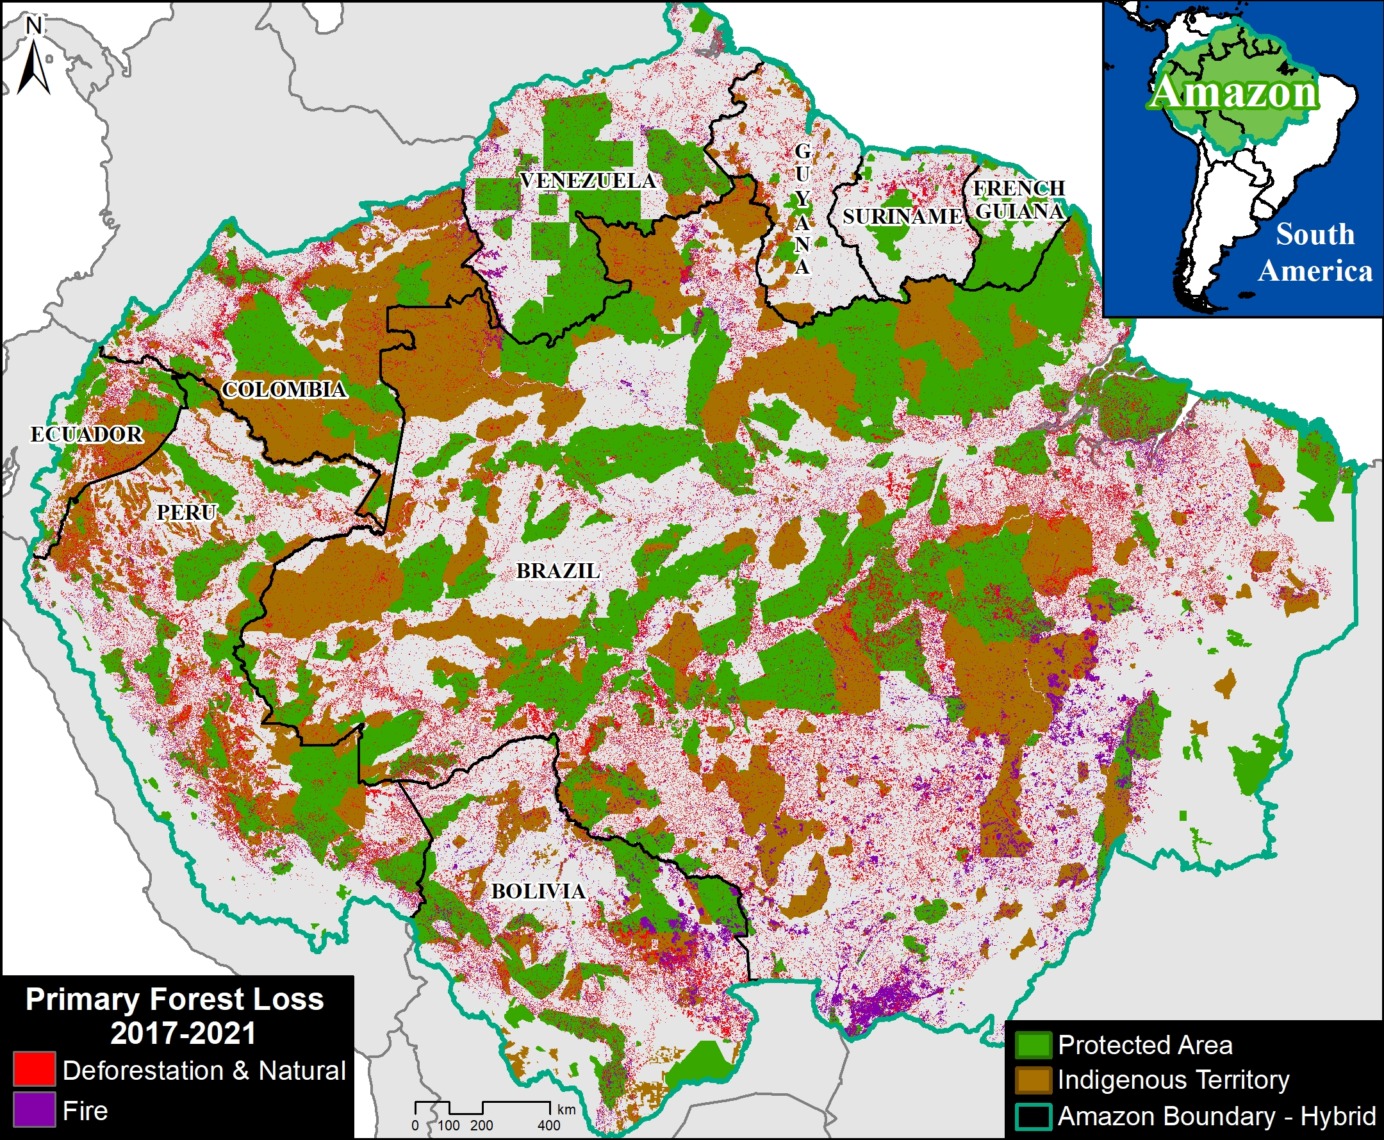
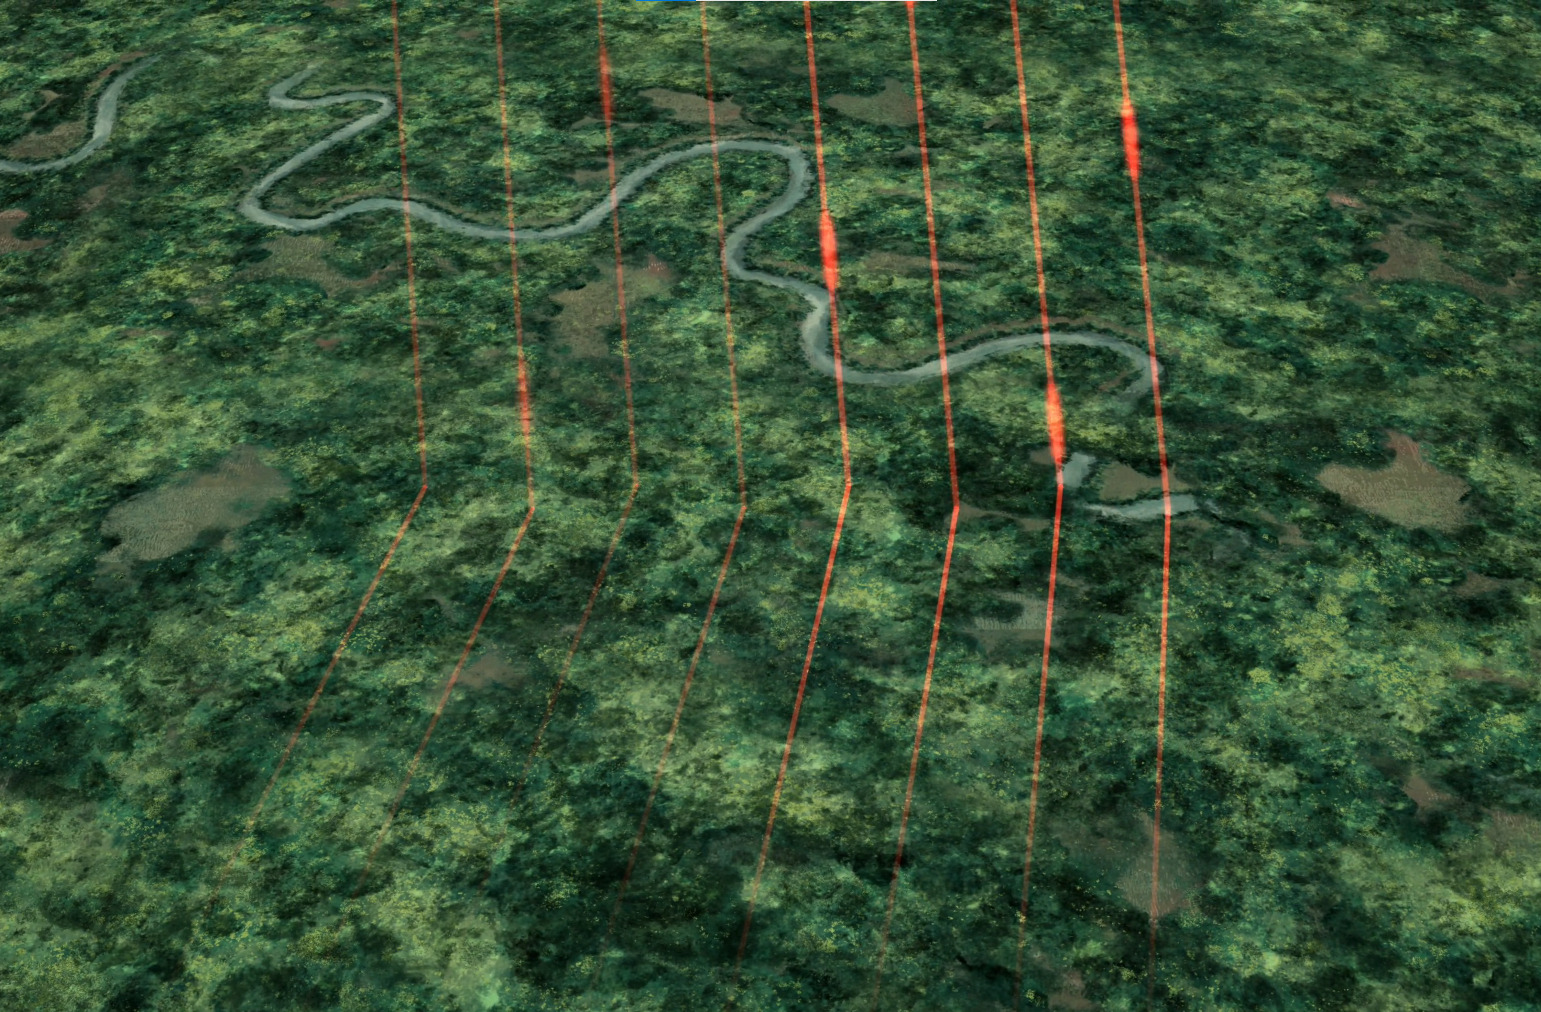
Image 2. Total Amazon forest loss. Vertical lines indicate the Amazon broken down into thirds. Data: ACA/MAAP.

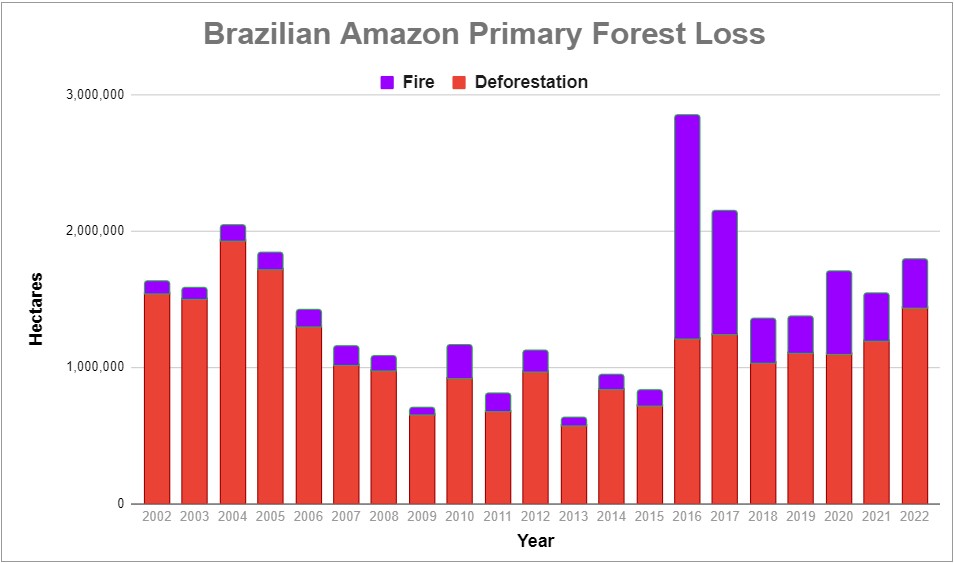
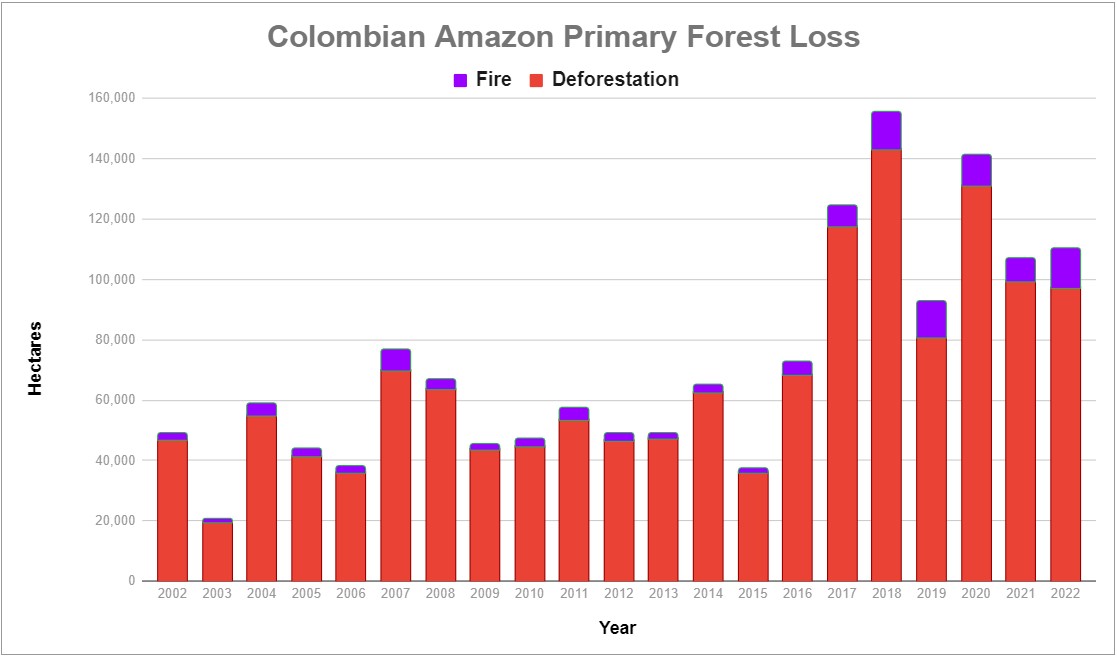
Of the original forest noted above, we documented the historic loss of over 85 million hectares (85,499,157 ha). This is equivalent to 211 million acres.

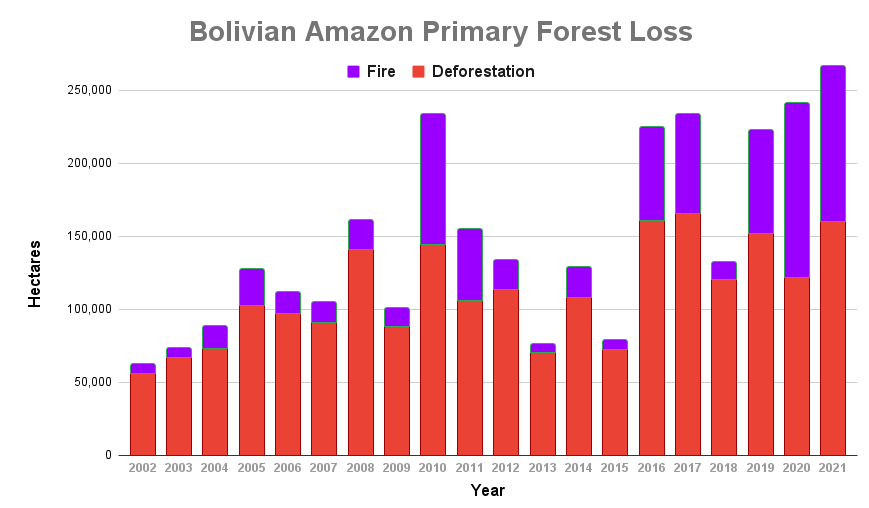
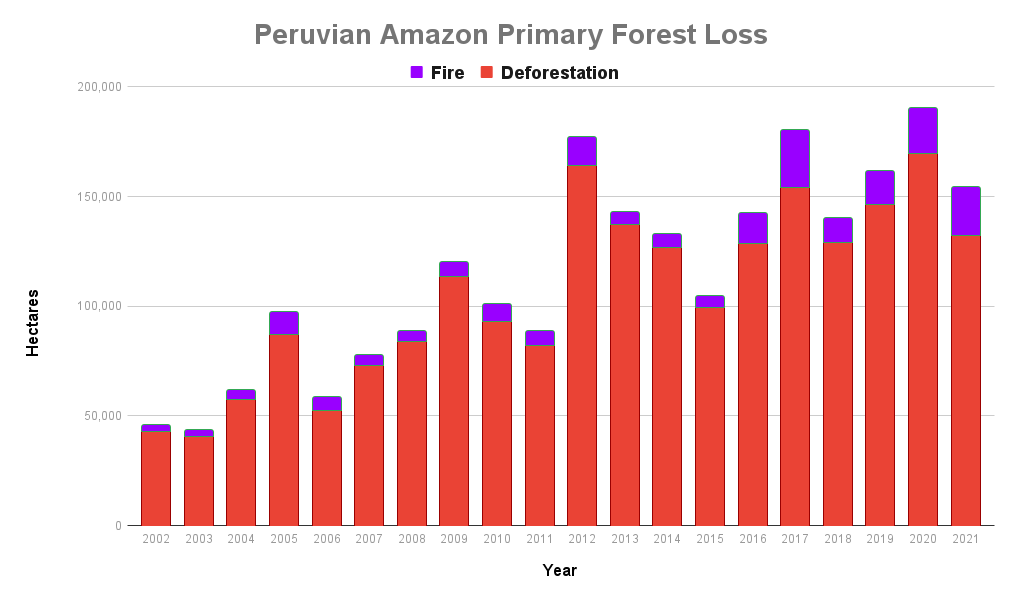
The largest loss occurred in Brazil (69.5 million ha), followed by Peru (4.7 million ha), Colombia (4 million ha), Bolivia (3.8 million ha), and Venezuela (1.4 million ha). The remaining four countries (Ecuador, Guyana, Suriname, and French Guiana) make up the final 1.9 million ha.

By comparing the original Amazon biome, we calculated the historic loss of 13.2% of the original Amazon forest due to deforestation and other causes.

More importantly, however, we find that 30.8% of the original Amazon has been lost in the eastern third of the Amazon biome (see vertical dashed lines Image 2), above the speculated tipping point threshold. This finding is critical because as noted above, the tipping point will likely be triggered in the east as it is the source of the water flowing to the central and western Amazon.

In contrast, we find that 10.8% of the original Amazon has been lost in the central third of the Amazon biome and 6.3% has been lost in the western third, both of which are below the speculated tipping point threshold.

Background

The Amazon generates around half of its own rainfall by recycling moisture up to 6 times as air masses move from the Atlantic Ocean in the east across the basin to the west. Thus, the rainforest plays a major part in keeping itself alive, by recycling water through its trees to generate rainfall from east to west.

This unique hydrological cycle has historically supported rainforest ecosystems for vast areas far from the main ocean source.

But it also raises the question of how much deforestation would be required to cause the cycle to degrade to the point of being unable to support these forests, thus the Amazon tipping point hypothesis.

In this scenario, rainforests would transform into drier ecosystems, such as open canopy scrubland and savannah.

The tipping point concept originally referred to an abrupt ecosystem change, but it is now believed that the shift could happen gradually (30-50 years).

It is worth noting that the western Amazon near the Andes mountains would likely maintain its rainforests, as air currents flowing over the mountains would continue causing water vapor to condense and fall as rain.

Methodology

At the core of this work, we generated two major estimates: original Amazon forest and total historical Amazon forest loss.

For both of these estimates, we used the biogeographical boundary of the Amazon (as determined by RAISG 2020), which encompasses nine countries. Thus, we used a broader definition of the Amazon (Amazon biome) rather than the strict Amazon watershed, which omits part of the northeastern Amazon biome.

For original Amazon forest, we defined three major classes: Forest, Non-Forest, and Water. This analysis was based on data from MapBiomas Brazil (collection 2 from 1990) with some additional modifications. Original Forest was made up of these MapBiomas categories: Forest Formation, Mangrove, Flooded Forest, Mosaic of Agriculture and Pasture. Non-Forest was made up of these MapBiomas categories: Savanna Formation, Natural Non-Forest Flood Formation, Grassland, and Other non-Forest Formations. Water was made up of these MapBiomas categories: River, Lake, Ocean and Glacier.

We then made a number of modifications with manual edits based on data from the University of Maryland, INPE (Terrabrasilis), ArcGis satellite images, Planet mosaics, Google Earth Engine Landsat images from 1984-1990, and official government data for several countries (Ministry of the Environment of Ecuador (MAE) and Peru (GeoBosques/MINAM), Forest and Carbon Monitoring System/IDEAM of Colombia, National Institute for Space Research of Brazil (INPE/Terrabrasilis), General Directorate of Forest Management and Development of Bolivia (DGGDF), and the National Service of Protected Areas of Bolivia (SERNAP). As an example of a major modification, deforested areas and historic dam reservoirs were changed to Original Forest based on an analysis of the oldest available satellite image for the area (1984-1990). We also corrected some misclassifications, such as forest patches in clearly non-forest areas were changed to Non-Forest (and vice versa) and mountain forest areas found as water were changed to Forest. Also, agriculture and urban areas in likely savannah areas were changed to Non-Forest. Additional Water data from MapBiomas based on 1985 was incorporated. Overall, our focus was defining Original Forest as best as possible; data confusions between Non-Forest and Water categories were not worked on as thoroughly.

For total historical Amazon forest loss, we used data from the University of Maryland. Specifically, we first used their data layer ‘Tree Cover 2000″ (>30% canopy density) to estimate historical (pre-2000) forest loss. We then added annual forest loss data from 2001 to 2021.

Finally, we divided the original Amazon forest by the total historical loss to estimate how much of the original Amazon has been lost. In addition, we delimited the Amazon in thirds according to distance east to west at the widest point. We then estimated how much of the original Amazon has been lost in each of these three sections.

References

(in chronological order)

Sampaio, G., Nobre, C., Costa, M. H., Satyamurty, P., Soares‐Filho, B. S., & Cardoso, M. (2007). Regional climate change over eastern Amazonia caused by pasture and soybean cropland expansion. Geophysical Research Letters, 34(17).

Hansen, M. C. et. al. (2013) High-Resolution Global Maps of 21st-Century Forest Cover Change. Science 342.

Nobre et al. (2016) Land-use and climate change risks in the Amazon and the need of a novel sustainable development paradigm. PNAS, 113 (39).

Turubanova S., Potapov P., Tyukavina, A., and Hansen M. (2018) Ongoing primary forest loss in Brazil, Democratic Republic of the Congo, and Indonesia. Environmental Research Letters.

Lovejoy, T. E., & Nobre, C. (2018). Amazon Tipping Point. Science Advances, 4(2).

Lovejoy, T. E., & Nobre, C. (2019). Amazon tipping point: Last chance for action. Science Advances, 5 (12).

Bullock et. al. (2019) Satellite-based estimates reveal widespread forest degradation in the Amazon. Glob Change Biol., 26.

Amigo, I. (2020) The Amazon’s fragile future. Nature, 578.

MapBiomas. 2020. MapBiomas Amazonia v2.0. https://amazonia.mapbiomas.org/.

Killeen (2021) A Perfect Storm in the Amazon Wilderness

Berenguer E. et. al. (2021) Ch 19. Drivers and ecological impacts of deforestation and forest degradation. In: Nobre C, Encalada et al. (Eds). Amazon Assessment Report 2021. United Nations Sustainable Development Solutions Network, New York, USA. Available from https://www.theamazonwewant.org/spa-reports

Hirota M et. al (2021) Science Panel for the Amazon, Ch 24. Resilience of the Amazon Forest to Global Changes: Assessing the Risk of Tipping Points. In: Nobre C, Encalada et al. (Eds). Amazon Assessment Report 2021. United Nations Sustainable Development Solutions Network, New York, USA. Available from https://www.theamazonwewant.org/spa-reports/

Wunderling et al (2022) Recurrent droughts increase risk of cascading tipping events by outpacing adaptive capacities in the Amazon rainforest. PNAS 119 (32) e2120777119.

Acknowledgements

This report is in memory of Tom Lovejoy, who helped launch the critical concept of an Amazon tipping point. Starting in 2019, we collaborated with Tom on the need assessment and background research behind this report.

We thank Carmen Thorndike for helping with the initial literature review, and Carlos Nobre for review of the final report. We also thank J. Beavers (ACA), A. Folhadella (ACA), M.E. Gutierrez (ACCA), and C. Josse (EcoCiencia) for additional comments.

This work was supported by NORAD (Norwegian Agency for Development Cooperation) and ICFC (International Conservation Fund of Canada).

Citation

Finer M, Mamani N (2022) Amazon Tipping Point – Where Are We?. MAAP: 164.

MAAP #160: Lasers Estimate Carbon in the Amazon – NASA’s GEDI Mission

Simulation of GEDI lasers collecting data. Source: UMD.

NASA’s GEDI mission uses lasers to provide cutting-edge estimates of aboveground biomass and related carbon on a global scale.

Launched in late 2018 and installed on the International Space Station, GEDI’s lasers return an estimate of aboveground biomass density at greater accuracy and resolution than previously available.

Here, we zoom in on the Amazon and take a first look at the recently available Level 4B data: Gridded Aboveground Biomass Density measured in megagrams per hectare (Mg/ha) at a 1-kilometer resolution.

See the GEDI homepage for more background information on the mission, which extends until January 2023. Be sure to check out this illustrative video.


Base Map – Aboveground Biomass in the Amazon

The Base Map displays the GEDI data for the nine countries of the Amazon biome, displaying aboveground biomass for the time period April 2019 to August 2021.

Base Map. Aboveground Biomass Density in the Amazon. Data: NASA/UMD GEDI L4B. Click twice to enlarge.


We highlight the following initial major findings:

  • The data is not yet comprehensive as there are some areas the lasers have not yet recorded data (indicated in white).
    h
  • The areas with the highest aboveground biomass and related carbon (indicated in dark green and purple) include:
    • Northeast Amazon: Corner of Brazil, Suriname, & French Guiana.
    • Southwest Amazon: Southwest Brazil and adjacent Peru (see zoom below).
    • Northwest Amazon: Northern Peru, Ecuador, and southeast Colombia.

Zoom In – Southwest Amazon

To better visualize the GEDI laser data, we also present a zoom of the Southwest Amazon. Although deforested areas (and natural savannahs) are illustrated in yellow and orange, note the surrounding presence of high carbon forest (green and purple).

Zoom In – Southwest Amazon. Aboveground Biomass Density. Data: NASA/UMD GEDI L4B. Click twice to enlarge.

Zoom Out – Global Scale

Note that tropical forests, including the Amazon, have the highest levels of aboveground biomass globally.

Zoom Out – Glocal scale. Aboveground Biomass Density. Data: NASA/UMD GEDI L4B. Click twice to enlarge.

Acknowledgements

This work was supported by NORAD (Norwegian Agency for Development Cooperation) and ICFC (International Conservation Fund of Canada).

Citation

Finer M, Ariñez A (2022) Lasers Estimate Carbon in the Amazon – NASA’s GEDI Mission. MAAP: 160.

MAAP #158: Amazon Deforestation & Fire Hotspots 2021

2021 Amazon Forest Loss Base Map. Deforestation and fire hotspots across the full Amazon biome. Data: UMD/GLAD, ACA/MAAP.

We present a detailed look at the major 2021 Amazon forest loss hotspots, based on the final annual data produced by the University of Maryland.

This dataset is unique in that distinguishes forest loss from fire, leaving the rest as a close proxy for deforestation.

Thus, for the first time, the results include both deforestation and fire hotspots across the Amazon.

The Base Map (see right) and Results Graph (see below) reveal several key findings:p

  • In 2021, we estimate the loss of 2 million hectares (4.9 million acres) of primary forest loss across the nine countries of the Amazon biome. This total represents a slight decrease from 2020, but the 6th highest on record.
    l
  • The vast majority of this loss was deforestation (78%), accounting for 1.57 million hectares. This total represents a slight increase from 2020, and the 5th highest on record. This deforestation impacted the entire stretch of the southern Amazon (southern Brazil, Bolivia, and Peru) plus further north in Colombia.
    l
  • This deforestation was concentrated in Brazil (73%), Bolivia (10%), Peru (8%), and Colombia (6%). In Brazil and Bolivia, deforestation was the highest since 2017. In Peru and Colombia, deforestation dropped from 2020 but was still historically high. See below for maps and graphs for each country. See Annex for 2020-21 details.
    k
  • Fires directly caused the remaining primary forest loss (22%), accounting for 436,000 hectares. This total represents a decrease from the severe fire season of 2020, but was the 4th highest on record. Moreover, each of the six most intense fire seasons has occurred in the past six years. Over 90% of the fire impact occurred in just two countries: Brazil and Bolivia. Note that fire impacts were concentrated in the southeast of each country (Mato Grosso and Santa Cruz states, respectively).
    k
  • Since 2002, we estimate the deforestation of over 27 million hectares (67 million acres) of primary forest, greater than the size of the United Kingdom or the U.S. state of Colorado. On top of this, we estimate an additional impact of 6.7 million hectares due to fires.

Below, we zoom in on the four countries with the highest deforestation (Brazil, Bolivia, Peru, and Colombia), with additional maps and analysis.

Amazon Forest Loss Results Graph, 2002-21. Data: UMD/GLAD, ACA/MAAP.

For deforestation, note that in 2021 there was a slight increase across the Amazon, continuing a gradual four-year trend. 2021 had the 5th highest deforestation on record (behind just 2002, 2004, 2005, and 2017).

For fire, in 2021 there was a decrease from the severe fire season of 2020, but was the 4th highest on record (behind just 2016, 2017, and 2020). Moreover, each of the last six years is in the top six worst fire seasons across the Amazon.

For total forest loss (deforestation and fire combined), in 2021 there was slight decrease from 2020, but the 6th highest on record.

Brazil Base Map, 2021. Deforestation and fire hotspots in the Brazilian Amazon. Data: UMD/GLAD, ACA/MAAP.

Brazilian Amazon

In 2021, the Brazilian Amazon lost 1.1 million hectares of primary forest to deforestation. Fires directly impacted an additional 293,000 hectares.

The deforestation was the highest since 2017 and also the peak of the early 2000s (6th highest on record). The fire impact was relatively high (5th highest on record), but less than the peak years of 2016, 2017, and 2020.

The deforestation was concentrated along the major road networks, especially roads 163, 230, 319, and 364 in the states of Acre, Amazonas, Pará, and Rondônia (see Brazil Base Map).

The direct fire impacts were concentrated in the southeastern state of Mato Grosso.

It is also important to note that many areas experienced the one-two combination of initial deforestation followed by fire to prepare the area for agriculture or cattle.


Bolivia Base Map. Deforestation hotspots in Bolivian Amazon. Data: UMD/GLAD, ACA/MAAP.

Bolivian Amazon

In 2021, the Bolivian Amazon lost 161,000 hectares of primary forest to deforestation. Fires directly impacted an additional 106,000 hectares.

Deforestation was the third-highest on record, just behind the peak in 2016 and 2017. The fire impact was the second-highest on record, behind just the intense year of 2020 (thus, the last two years are the two highest on record).

Both the deforestation and fires were concentrated in the southeastern department of Santa Cruz (see Bolivia Base Map).

Much of the deforestation was associated with large-scale agriculture, while the fires once again impacted important natural ecosystems, most notably the Chiquitano dry forests.


Peru Base Map. Deforestation hotspots in the Peruvian Amazon. Data: UMD/GLAD, ACA/MAAP.

Peruvian Amazon

In 2021, the Peruvian Amazon lost 132,400 hectares of primary forest to deforestation. Fires directly impacted an additional 21,800 hectares.

Deforestation dropped from a record high in 2020, but was 6th highest on record. Thre fire impact was the second-highest on record (behind just 2017).

The deforestation was concentrated in the central and southern Amazon (Ucayali and Madre de Dios regions, respectively) (see Peru Base Map).

We highlight the rapid deforestation (365 hectares) for a new Mennonite colony in 2021, near the town of Padre Marquez (see MAAP #149).

Also, note some additional hotspots in the south (Madre de Dios region), but these are largely from expanding agriculture instead of the historical driver of gold mining.

Indeed, gold mining deforestation has been greatly reduced due to government actions, but this illegal activity still threatens several key areas and indigenous territories (MAAP #154).


Rapid deforestation (365 hectares) for a new Mennonite colony in 2021, near the town of Padre Marquez. Data: Planet.

Colombia Base Map. Deforestation hotspots in northwest Colombian Amazon. Data: UMD/GLAD, ACA/MAAP, FCDS.

Colombian Amazon

In 2021, the Colombian Amazon lost 98,000 hectares of primary forest to deforestation. Fires directly impacted an additional 9,000 hectares.

Deforestation and fire dropped from last year, but both were the fourth highest on record, following the trend of elevated forest loss and associated fires since the peace agreement in 2016.

As described in previous reports (see MAAP #120), the Colombia Base Map shows there continues to be an “arc of deforestation” in the northwest Colombian Amazon (Caqueta, Meta, and Guaviare departments).

This arc impacts numerous Protected Areas (particularly Tinigua and Chiribiquete National Parks) and Indigenous Reserves (particularly Yari-Yaguara II and Nukak Maku).

The main drivers of deforestation in the Colombian Amazon are land grabbing, expansion of road networks, and cattle ranching.


Annex

Notes and Methodology

The analysis was based on 30-meter resolution annual forest loss data produced by the University of Maryland and also presented by Global Forest Watch. For the first time, this data set distinguished forest loss caused directly by fire (note that virtually all Amazon fires are human-caused). The remaining forest loss serves as a likely close proxy for deforestation, with the only remaining exception being natural events such as landslides, wind storms, and meandering rivers.

Importantly, we applied a filter to calculate only primary forest loss by intersecting the forest cover loss data with the additional dataset “primary humid tropical forests” as of 2001 (Turubanova et al 2018). For more details on this part of the methodology, see the Technical Blog from Global Forest Watch (Goldman and Weisse 2019).

Our geographic range for the Amazon is a hybrid designed for maximum inclusion: biogeographic boundary (as defined by RAISG) for all countries, except for Bolivia where we use the watershed boundary.

To identify the deforestation hotspots, we conducted a kernel density estimate. This type of analysis calculates the magnitude per unit area of a particular phenomenon, in this case, forest cover loss. We conducted this analysis using the Kernel Density tool from the Spatial Analyst Tool Box of ArcGIS. We used the following parameters:

Search Radius: 15000 layer units (meters)
Kernel Density Function: Quartic kernel function
Cell Size in the map: 200 x 200 meters (4 hectares)
Everything else was left to the default setting.

For the Base Map, we used the following concentration percentages: Medium: >5%; High: >7%; Very High: >14%.

Acknowledgements

We thank A. Gómez (FCDS), R. Botero (FCDS)… for helpful comments on earlier drafts of the text and images.

This work was supported by NORAD (Norwegian Agency for Development Cooperation) and ICFC (International Conservation Fund of Canada).

Citation

Finer M, Mamani N (2022) Amazon Deforestation Hotspots 2021. MAAP: 153.

MAAP #157: New and Proposed Roads Across the Western Amazon

Amazon Roads Base Map 1.

Extensive deforestation, especially along the major road networks, has shockingly turned the eastern Brazilian Amazon into a net carbon source (see MAAP #144).

Fortunately, the greater Amazon across all nine countries is still a net carbon sink, largely thanks to the still intact core of the western Amazon.

The biggest long-term threat to this core Amazon is likely new roads, as they are a leading cause of opening up vast and previously remote areas to deforestation and degradation (Vilela et al 2020).

Here, we present an initial analysis of new and proposed roads across the western Amazon.

Although it’s difficult to predict what proposed projects are actually likely to eventually move forward, we do find the potential of a major road expansion across the core western Amazon (see Base Map 1).

Moreover, even by just focusing on the most advanced or actively discussed projects, we find the risk of major negative impact.

Below, we discuss our initial Amazon Roads Base Map and present a series of zooms showing the primary forest at risk if select road projects move forward.


Amazon Roads Base Map

Base Map 2 highlights new, proposed, and existing roads (red, yellow, and black lines, respectively), in relation to protected areas and indigenous territories for context. We focus on the still largely intact core of the western Amazon (Bolivia, Colombia, Ecuador, Peru, and western Brazil).

Most of the new roads were constructed in the past five years and were digitized from satellite imagery. Note that for some of these new roads, just initial construction of a rough road started and there is still potential for future impacts from road improvement and paving.

Most of the proposed roads were obtained from official government data sets. As noted above, it’s difficult to predict what proposed road projects are actually likely to eventually move forward. Nonetheless, it is clear to see there is the potential to greatly divide the remaining core western Amazon with the portfolio of proposed roads.

Amazon Roads Base Map 2. Data: ACA/MAAP, MTC, MINAM, MI, ABT, GAD Napo, FCDS, EcoCiencia, Diálogo Chino, CSF, RAISG, ACCA, ACEAA.

Zooms of High-Impact New & Proposed Roads

In this section, we focus on the currently most advanced or actively discussed projects (see Letters A-F on Amazon Roads Base Map). We highlight their potential impacts to vast sections of the core western Amazon protected areas and indigenous terrritories.

A. Boca Manu Road (Peru)

The new/proposed road that we refer to here as the Boca Manu road would serve as a new connection between Cusco and Madre de Dios regions. It is notable due its sensitive route between Manu National Park and Amarakaeri Communal Reserve to Boca Manu, and from there between Los Amigos Conservation Concession and Amarakaeri Communal Reserve to Boca Colorado. In addition to likely impacting these protected areas and the concession, the road also has the potential to impact the nearby territory of  indigenous groups in voluntary isolation. See this recent report from Diálogo Chino for more information about this road and its status and impacts.

Zoom A. Boca Manu Road. Data: MTC, MINAM, ACA, ACCA, RAISG.

B. Pucallpa – Cruzeiro do Sul Road (Peru – Brazil)

This proposed road would connect the Peruvian city of Pucallpa with the edge of the existing road network in western Brazil, near the town of Cruzeiro do Sul. Although the potential route has several options, it would sure cut through or near Sierra del Divisor National Park in Peru and the adjacent Serra do Divisor National Park in Brazil. This area is characterized by vast primary forests, thus creating a new binational route connecting the deforestation fronts in each country could obviously trigger significant impacts. See this recent report from Diálogo Chino for more information about this road and its status and impacts.

Zoom B. Pucallpa – Cruzeiro do Sul Road. Data: MTC, MINAM, ACA, CSF, Diálogo Chino, RAISG.

C. Yurua Road (Peru)

The new/proposed road that we refer to here as the Yurua road would connect the Peruvian towns of Nueva Italia on the Ucayali River and Breu on the Yurua River. This 200 km route was originally built as a logging road in the late 1980s to access remote timber areas in the central Peruvian Amazon, but had fallen into disrepair by the early 2000s. A recent MAAP analysis (see MAAP #146) found that between 2010 and 2021 much of the route had been rehabilitated, triggering elevated deforestation along the way. If this road were ever to be paved then impacts would likely continue to rise, including with native communities along the route. See MAAP #146 for more information about this road and its status and impacts.

Zoom C. Yurua Road. Data: MTC, MINAM, ACA, ACCA, RAISG.

D. Genaro Herrera – Angamos Road (Peru)

This new/proposed road would build off an old track through the vast forests connecting the northern Peruvian towns of Genaro Herrera and Angamos, in the region of Loreto. In 2021, clearing began along this route, advancing over 100 kilometers from both ends. If completed and paved, the final road project would impact protected areas on both sides (including the Matsés National Reserve to the south) and pose a major threat to indigenous people in voluntary isolation reportedly living to the north. See this recent report for more information about this road and its status and impacts.

Zoom D. Genaro Herrera – Angamos Road. Data: MTC, ACA, RAISG.

E. Cachicamo – Tunia Road (Chiribiquete National Park, Colombia)

Chiribiquete National Park, located in the heart of the Colombian Amazon, has been experiencing increasing deforestation pressures, partly due to expanding road networks around and even within the park. For example, the Cachicamo-Tunia Road, constructed in 2020, has triggered a new deforestation front in the northwest section of the park. Note this road is also impacting an adjacent Indigenous Reserve.

Zoom E. Cachicamo – Tunia Road. Data: FCDS, RAISG, ACA.

F.  Manaus – Porto Velho Road (BR-319, Brazil)

Arguably the most controversial project on the list: paving the middle section of BR-319 in the heart of the Brazilian Amazon. This nearly 900 km road connects the remote city of Manaus (otherwise only reachable by air or water) with the rest of Brazilian road network in Humaitá and Porto Velho to the south. It was built in the early 1970s but abandoned and impassable by the late 1980s, isolating Manaus once again. Since 2015, a basic maintenance program has made the road generally passable, but the main project remains: paving the 400 km middle section that passes through the core western Amazon. This paving would effectively connect Manaus with the existing highways in the south, and most likely trigger massive forest loss by extending the arc of deforestation northwards, including within and around the protected areas that surround the road. This road project has been the subject of numerous recent press reports, including investigative pieces by the Washington Post and El Pais.

Zoom F. Manaus – Porto Velho Road. Data: Ministério da Infraestrutura, ACA, RAISG.

G. Ixiamas – Chivé Road (Bolivia)

In recent years, Bolivia has been seeking financing for a 250 km road linking the current frontier town Ixiamas with the isolated town Chivé, located near the Peruvian border on the Madre de Dios river. This road would cross extensive tracts of primary Amazon forest and savannah in the north of the La Paz department, including the newly created Bajo Madidi Municipal Conservation Area and the Tacana II indigenous territory.

Zoom G. Ixiamas – Chivé Road. Data: ABT, ACEAA, ACA, RAISG.

Methodology

Our analysis and maps focus on the western Amazon (Bolivia, Colombia, Ecuador, Peru, and western Brazil).

Most of the new roads were constructed in the past five years and were digitized from satellite imagery. Note that for some of these new roads, just initial rehabilitation/improvement of a rough road started and there is still potential for future impacts from paving.

Most of the proposed roads were obtained from official government data sets (and complemented by civil society reports).

We credit the following data sources: Ministerio de Transportes y Comunicaciones (Peru), Geobosques/MINAM (Peru), Ministério da Infraestrutura (Brazil),  Autoridad de Fiscalización y Control Social de Bosques y Tierra – ABT (Bolivia), Gobierno Autonomo Descentralizado Provincial de Napo (Ecuador), Fundación para la Conservación y el Desarrollo Sostenible – FCDS (Colombia), Fundación EcoCiencia (Ecuador), Diálogo Chino, Conservation Strategy Fund, RAISG, Conservación Amazónica – ACCA (Peru), Conservación Amazónica – ACEAA (Bolivia), and Amazon Conservation (digitalization of some new and proposed roads).

Reference:
Vilela et al (2020) A better Amazon road network for people and the environment. PNAS 17 (13) 7095-7102.

Acknowledgments

We especially thank Diálogo Chino for their support of this report. We also thank E. Ortiz, S. Novoa, S. Villacis, D. Larrea, M. Terán, and D. Larrea for helpful comments on earlier drafts of the text and images.

Citation

Finer M, Mamani N (2022) New and Proposed Roads Across the Western Amazon. MAAP: 157.

MAAP #151: Illegal Mining in the Ecuadorian Amazon

Base Map. The two case studies of illegal mining in the Ecuadorian Amazon: Yutzupino and Punino. Data: EcoCiencia.

In this report, we report on illegal gold mining activity in the Ecuadorian Amazon, building off our previous reports on Peru (MAAP #130) and Brazil (MAAP #116).

The Base Map shows the two new cases presented below: Yutzupino (Napo province) and Punino (border of Napo and Orellana provinces).

Both cases showed alarming expansion in 2021 and require continued action by authorities to minimize the impact in 2022.

This report is part of a series focused on the Ecuadorian Amazon through a strategic collaboration between the organizations Fundación EcoCiencia and Amazon Conservation, with the support of the Norwegian Agency for Development Cooperation (Norad).


Yutzupino

We have documented the rapid mining expansion of 70 hectares (173 acres) between October 2021 and January 2022, on the banks of the Jatunyacu River in the Napo province (see Image Yutzupino 1). Most of this activity occurred in December, highlighting the recent activity at the site.

Image Yutzupino 1. Data: Planet.

The gold mining concession Confluencia is located in this area. However, the operating company TerraEarth Resources has stated that it is not responsible for this sudden mining expansion, indicating that the detected activity is illegal because it does not have the proper licenses.

On January 8 of this year (2022), the Ecuadorian government carried out a field intervention, confirming the illegal activity (see national news report). Despite this action, the illegal mining activity has continued to advance in January 2022, increasing by at least 6 hectares (15 acres).

To analyze this most recent activity, we obtained a very high-resolution satellite image (Skysat, 0.50 meters) from January 17 (2022). We identified the presence of at least 70 mining-related machines that still remained on site after the government’s field operation was carried out (see Image Yutzupino 2 and Zooms A-B).

Image Yutzupino 2. Data: Planet, EcoCiencia.
Skysat Zoom A. Data: Planet, EcoCiencia.
Skysat Zoom B. Data: Planet, EcoCiencia.

Punino

We have also documented the mining deforestation of 32 hectares (79 acres) between November 2019 and November 2021, on the banks of the Río Punino on the border between the provinces of Napo and Orellana (see Image Punino 1).

Image Punino 1. Data: Planet.

Two active gold mining concessions, Punino I and Punino II, are located in this area. However, nearly half (46%) of the detected mining deforestation (15 ha) is located outside these concessions, indicating that it is illegal activity (see Image Punino 2).

Image Punino 2. Data: EcoCiencia, Planet.

Para contextualizar dicha deforestación ilegal, hemos utilizado una imagen de muy alta resolución (Skysat, 0.50 metros) para mostrar en detalle la expansión minera fuera de las concesiones mineras, incluso con dragados, máquinas, y campamentos (ver Imagen Punino 3).

To analyze this most recent illegal mining deforestation, we obtained a very high-resolution satellite image (Skysat, 0.50 meters) from December 2021. We identified the details of the mining expansion outside the concessions, including machines and camps (see Image Punino 3).

Image Punino 3. Data: EcoCiencia, Planet.

Acknowledgments

We thank C. Rivadeneyra (F. EcoCiencia), E. Ortiz (AAF), and A. Folhadella (ACA) for their contributions to this report.

This report is part of a series focused on the Ecuadorian Amazon through a strategic collaboration between the organizations Fundación EcoCiencia and Amazon Conservation, with the support of the Norwegian Agency for Development Cooperation (Norad).

Cita

Villacís S, Ochoa J, Borja MO, Josse C, Finer M, Mamani N (2022) Illegal Mining in the Ecuadorian Amazon. MAAP: #151.

MAAP #150: New Oil Platforms Deeper into Yasuni National Park (Ecuador), towards Uncontacted Indigenous Zone

Base Map. Location of Yasuni National Park, ITT Block, and Zona Intangible in the Ecuadorian Amazon.

Yasuni National Park, located in the heart of the Ecuadorian Amazon, is one of the most biodiverse places in the world thanks to its unique location at the intersection of the Amazon, Andes Mountains, and the equator (see Base Map).

In addition, it is part of the ancestral territory of the Waorani indigenous peoples. The entire southern portion of Yasuni National Park has been declared an Untouchable Zone (Zona Intangible) to protect the territory of the relatives of the Waorani who live in voluntary isolation (Tagaeri-Taromenane).

In a series of previous reports, we have shown the construction of oil drilling platforms (and associated access road) in the ITT Block. This controversial block, run by the state oil company Petroecuador, is located in the remote and largely intact northeast sector of Yasuni National Park.

In this report, based on the latest satellite images, we show the most recent construction within the ITT Block: an oil drilling platform known as Ishpingo B. This platform is located just 300 meters from the buffer zone of the Zona Intangible.

We also issue a warning about the future construction of additional oil drilling platforms that would enter the buffer zone and reach the limit of the Zona Intangible itself.

Image 1. Data: Planet, MAAP/ACA.

Ishpingo Platforms A & B

The following images show the construction of the two new oil drilling platforms (Ishpingo A and B) in the heart of the Yasuni National Park (ITT Block).

Image 1 (on the right) shows that the newest and southernmost platform (Ishpingo B) is located just 300 meters from the buffer zone of the Zona Intangible.

Image 2 (below) shows the construction of the two new platforms and associated access road between June 2020 (left panel) and January 2022 (right panel).

It is worth mentioning that the construction of these platforms has a corresponding environmental license in accordance with the “Environmental Impact Study and Environmental Management Plan of the Ishpingo North Development and Production Project.”

Image 2. Data ESA, Planet, MAAP/ACA.
Image 3. Data: MAAP/ACA, Energy and Environmental Consulting.

Towards the Zona Intangible

Image 3 shows (in red) the location of the two new platforms (Ishpingo A and B) in relation to Yasuni National Park and the Zona Intangible.

Once again, note that the newest and southernmost platform (Ishpingo B) is located just 300 meters from the buffer zone of the Zona Intangible.

Alert: It is critical to emphasize that a previous version of the Environmental Impact Study includes plans for the construction of eight additional platforms (Ishpingo C-J), all located within the buffer zone towards the limit of the Zona Intangible Zone.

In fact, in early 2022, the head of Petroecuador has begun to publicly state the importance of moving forward with these extremely controversial plans.

Acknowledgments

We thank M. Bayón and P. Bermeo for useful information about the Environmental Impact Studies.

This report is part of a series focused on the Ecuadorian Amazon through a strategic collaboration between the organizations Fundación EcoCiencia and Amazon Conservation, with the support of the Norwegian Agency for Development Cooperation (Norad) and the International Conservation Fund of Canada (ICFC).

Citation

Finer M, Mamani N, Josse C, Villacis S (2022) New Oil Platforms Deeper into Yasuni National Park (Ecuador), towards Uncontacted Indigenous Zone. MAAP: 150.

MAAP #141: Protected Areas & Indigenous Territories Effective Against Deforestation in the Western Amazon

Base Map. Primary forest loss across the western Amazon, with magnified visualization of the data. Click to enlarge. See Methodology for data sources.

As deforestation continues to threaten primary forest across the Amazon, key land use designations are one of the best hopes for the long-term conservation of critical remaining intact forests.

Here, we evaluate the impact of two of the most important land use designations: protected areas and indigenous territories.

Our study area focused on the four mega-diverse countries of the western Amazon (Bolivia, Colombia, Ecuador, & Peru), covering a vast area of over 229 million hectares (see Base Map).

We calculated primary forest loss over the past four years (2017-2020) across the western Amazon and analyzed the results across three major land use categories:

1) Protected Areas (national and state/department levels), which covered 43 million hectares as of 2020.

2) Indigenous Territories (official), which covered over 58 million hectares as of 2020.

3) Other (that is, all remaining areas outside protected areas and indigenous territories), which covered the remaining 127 million hectares as of 2020.

In addition, we took a deeper look at the Peruvian Amazon and also included long-term forestry lands.

In summary, we found that, averaged across all four years, protected areas had the lowest primary forest loss rate, closely followed by indigenous territories (see Figure 1). Outside of these critical areas, the primary forest loss rate was more than double.

Below, we describe the key results in greater detail, including a detailed look at each country.


Key Findings – Western Amazon

Figure 1. Primary forest loss rates in the western Amazon.

Overall, we documented the loss of over 2 million hectares of primary forests across the four countries of the western Amazon between 2017 and 2020. Of the four years, 2020 had the most forest loss (588,191 ha).

Of this total, 9% occurred in protected areas (179,000 ha) and 15% occurred in indigenous territories (320,000 ha), while the vast majority (76%) occurred outside key these land use designations (1.6 million ha).

To standardize these results for the varying area coverages, we calculated primary forest loss rates (loss/total area of each category). Figure 1 displays the combined results for these rates across all four countries.

From 2017-19, protected areas (green) had the lowest primary forest loss rates across the western Amazon (less than 0.10%).

Indigenous territories (brown) also had low primary forest loss rates from 2017-18 (less than 0.11%), but this rose in 2019 (0.18%) due to fires in Bolivia.

In the intense COVID pandemic year of 2020, this overall pattern flipped, with elevated primary forest loss in protected areas, again largely due to major fires in Bolivia. Thus, indigenous territories had the lowest primary forest loss rate followed by protected areas (0.15% and 0.19%, respectively) in 2020.

Averaged across all four years, protected areas had the lowest primary forest loss rate (0.11%), closely followed by indigenous territories (0.14%). Outside of these critical areas (red), the primary forest loss rate was more than double (0.30%). The lowest primary forest loss rates (less than 0.10%) occurred in the protected areas of Ecuador and Peru (0.01% and 0.03%, respectively), and indigenous territories of Colombia (0.07%).

Country Results

Figure 2. Primary forest loss rates in the Colombian Amazon.

Colombian Amazon

Colombia had, by far, the highest primary forest loss rates outside protected areas and indigenous territories (averaging 0.67% across all four years).

By contrast, Colombian indigenous territories had one of the lowest primary forest loss rates across the western Amazon (averaging 0.07% across all four years).

The primary forest loss rates for protected areas were on average nearly double that of indigenous territories (mostly due to the high deforestation in Tinigua National Park), but still much lower than non-protected areas.


Figure 3. Primary forest loss rates in the Ecuadorian Amazon.

Ecuadorian Amazon

Overall, Ecuador had the lowest primary forest loss rates across all three categories.

Protected areas had the lowest primary forest loss rate of any category across the western Amazon (averaging 0.01% across all four years).

Indigenous territories also had relatively low primary forest loss rates, averaging half that of outside protected areas and indigenous territories (0.10% vs 0.21%, respectively).


Figure 4. Primary forest loss rates in the Bolivian Amazon.

Bolivian Amazon

Bolivia had the most dynamic results, largely due to intense fire seasons in 2019 and 2020. Indigenous territories had the lowest primary forest loss rates, with 2019 being the only exception, due to large fires in the Santa Cruz department that affected the Monte Verde indigenous territory.

Protected areas had the lowest primary forest loss rate in 2019, but in extreme contrast, the highest the following year in 2020, also due to large fires in the Santa Cruz department that affected Noel Kempff Mercado National Park.

Overall, primary forest loss was highest outside protected areas and indigenous territories (averaging 0.33% across all four years).


Figure 5a. Primary forest loss rates in the Peruvian Amazon. Data: UMD.

Peruvian Amazon

Following Ecuador, Peru also had relatively low primary forest loss rates, particularly in protected areas (averaging 0.03% across all four years).

Primary forest loss in indigenous territories (that is, combined data for native communities and Territorial/Indigenous Reserves for groups in voluntary isolation) was surprisingly high, similar to that of areas outside protected areas across all four years. For example, in 2020, elevated primary forest loss was concentrated in several titled native communities in the regions of Amazonas, Ucayali, Huánuco, and Junín.


Figure 5b. Deforestation rates in the Peruvian Amazon. Data: MINAM/Geobosques.

As noted above, we conducted a deeper analysis for the Peruvian Amazon, using deforestation data produced by the Peruvian government and adding the additional category of long-term forestry lands (known as Permanent Production Forests, or BPP in Spanish) (see Annex map).

We also separated the data for indigenous territories into native communities and Territorial/Indigenous Reserves for groups in voluntary isolation, respectively.

These data also show that deforestation was lowest in the remote Territorial/Indigenous Reserves, closely followed by protected areas (0.01% vs 0.02% across all four years, respectively). Deforestation in titled native communities was 0.21% across all four years. Surprisingly, deforestation was higher in the forestry lands than areas outside protected areas and indigenous territories (0.30% vs 0.27% across all four years).


Annex – Peruvian Amazon

The following map shows added detail for Peru, most notably the inclusion of long-term forestry lands (known as Permanent Production Forests, or BPP in Spanish).


*Methodology

To estimate deforestation across all three categories, we used annual forest loss data (2017-20) from the University of Maryland (Global Land Analysis and Discovery GLAD laboratory) to have a consistent source across all four countries (Hansen et al 2013).

We obtained this data, which has a 30-meter spatial resolution, from the “Global Forest Change 2000–2020” data download page. It is also possible to visualize and interact with the data on the main Global Forest Change portal.

It is important to note that these data include both human-caused deforestation and forest loss caused by natural forces (landslides, wind storms, etc…).

We also filtered this data for only primary forest loss, following the established methodology of Global Forest Watch. Primary forest is generally defined as intact forest that has not been previously cleared (as opposed to previously cleared secondary forest, for example). We applied this filter by intersecting the forest cover loss data with the additional dataset “primary humid tropical forests” as of 2001 (Turubanova et al 2018). For more details on this part of the methodology, see the Technical Blog from Global Forest Watch (Goldman and Weisse 2019).

Thus, we often use the term “primary forest loss” to describe the data.

Data presented as primary forest loss or deforestation rate is standardized per the total area covered of each respective category. For example, to properly compare raw forest loss data in areas that are 100 hectares vs 1,000 hectares total size respectively, we divide by the area to standardize the result.

Our geographic range included four countries of the western Amazon and consists of a combination of the Amazon watershed limit (most notably in Bolivia) and Amazon biogeographic limit (most notably in Colombia) as defined by RAISG. See Base Map above for delineation of this hybrid Amazon limit, designed for maximum inclusion.

Additional data sources include: National and state/deprartment level protected areas: RUNAP 2020 (Colombia), SNAP 2017 & RAISG 2020 (Ecuador), SERNAP & ACEAA 2020 (Bolivia), and SERNANP 2020 (Peru).

Indigenous Territories: RAISG 2020 (Colombia, Ecuador, and Bolivia), and MINCU & ACCA 2020 (Peru). For Peru, this includes titled native communities and Indigenous/Territorial Reserves for indigenous groups in voluntary isolation.

For the additional analysis in Peru, we used deforestation data from MINAM/Geobosques (note this is actual deforestation and not primary forest loss) and BPP data from SERFOR. We also separated data from titled native communities and Territorial/Indigenous Reserves for groups in voluntary isolation.

Acknowledgements

We thank M. MacDowell (AAF) A. Folhadella (ACA), J. Beavers (ACA), S. Novoa (ACCA), and D. Larrea (ACEAA) for their helpful comments on this report.

This work was supported by the Andes Amazon Fund (AAF), Norwegian Agency for Development Cooperation (NORAD), and International Conservation Fund of Canada (ICFC).


Citation

Finer M, Mamani N, Silman M (2021) Protected Areas & Indigenous Territories Effective Against Deforestation in the Western Amazon. MAAP: 141.