MAAP #93: Shrinking Primary Forests of the Peruvian Amazon

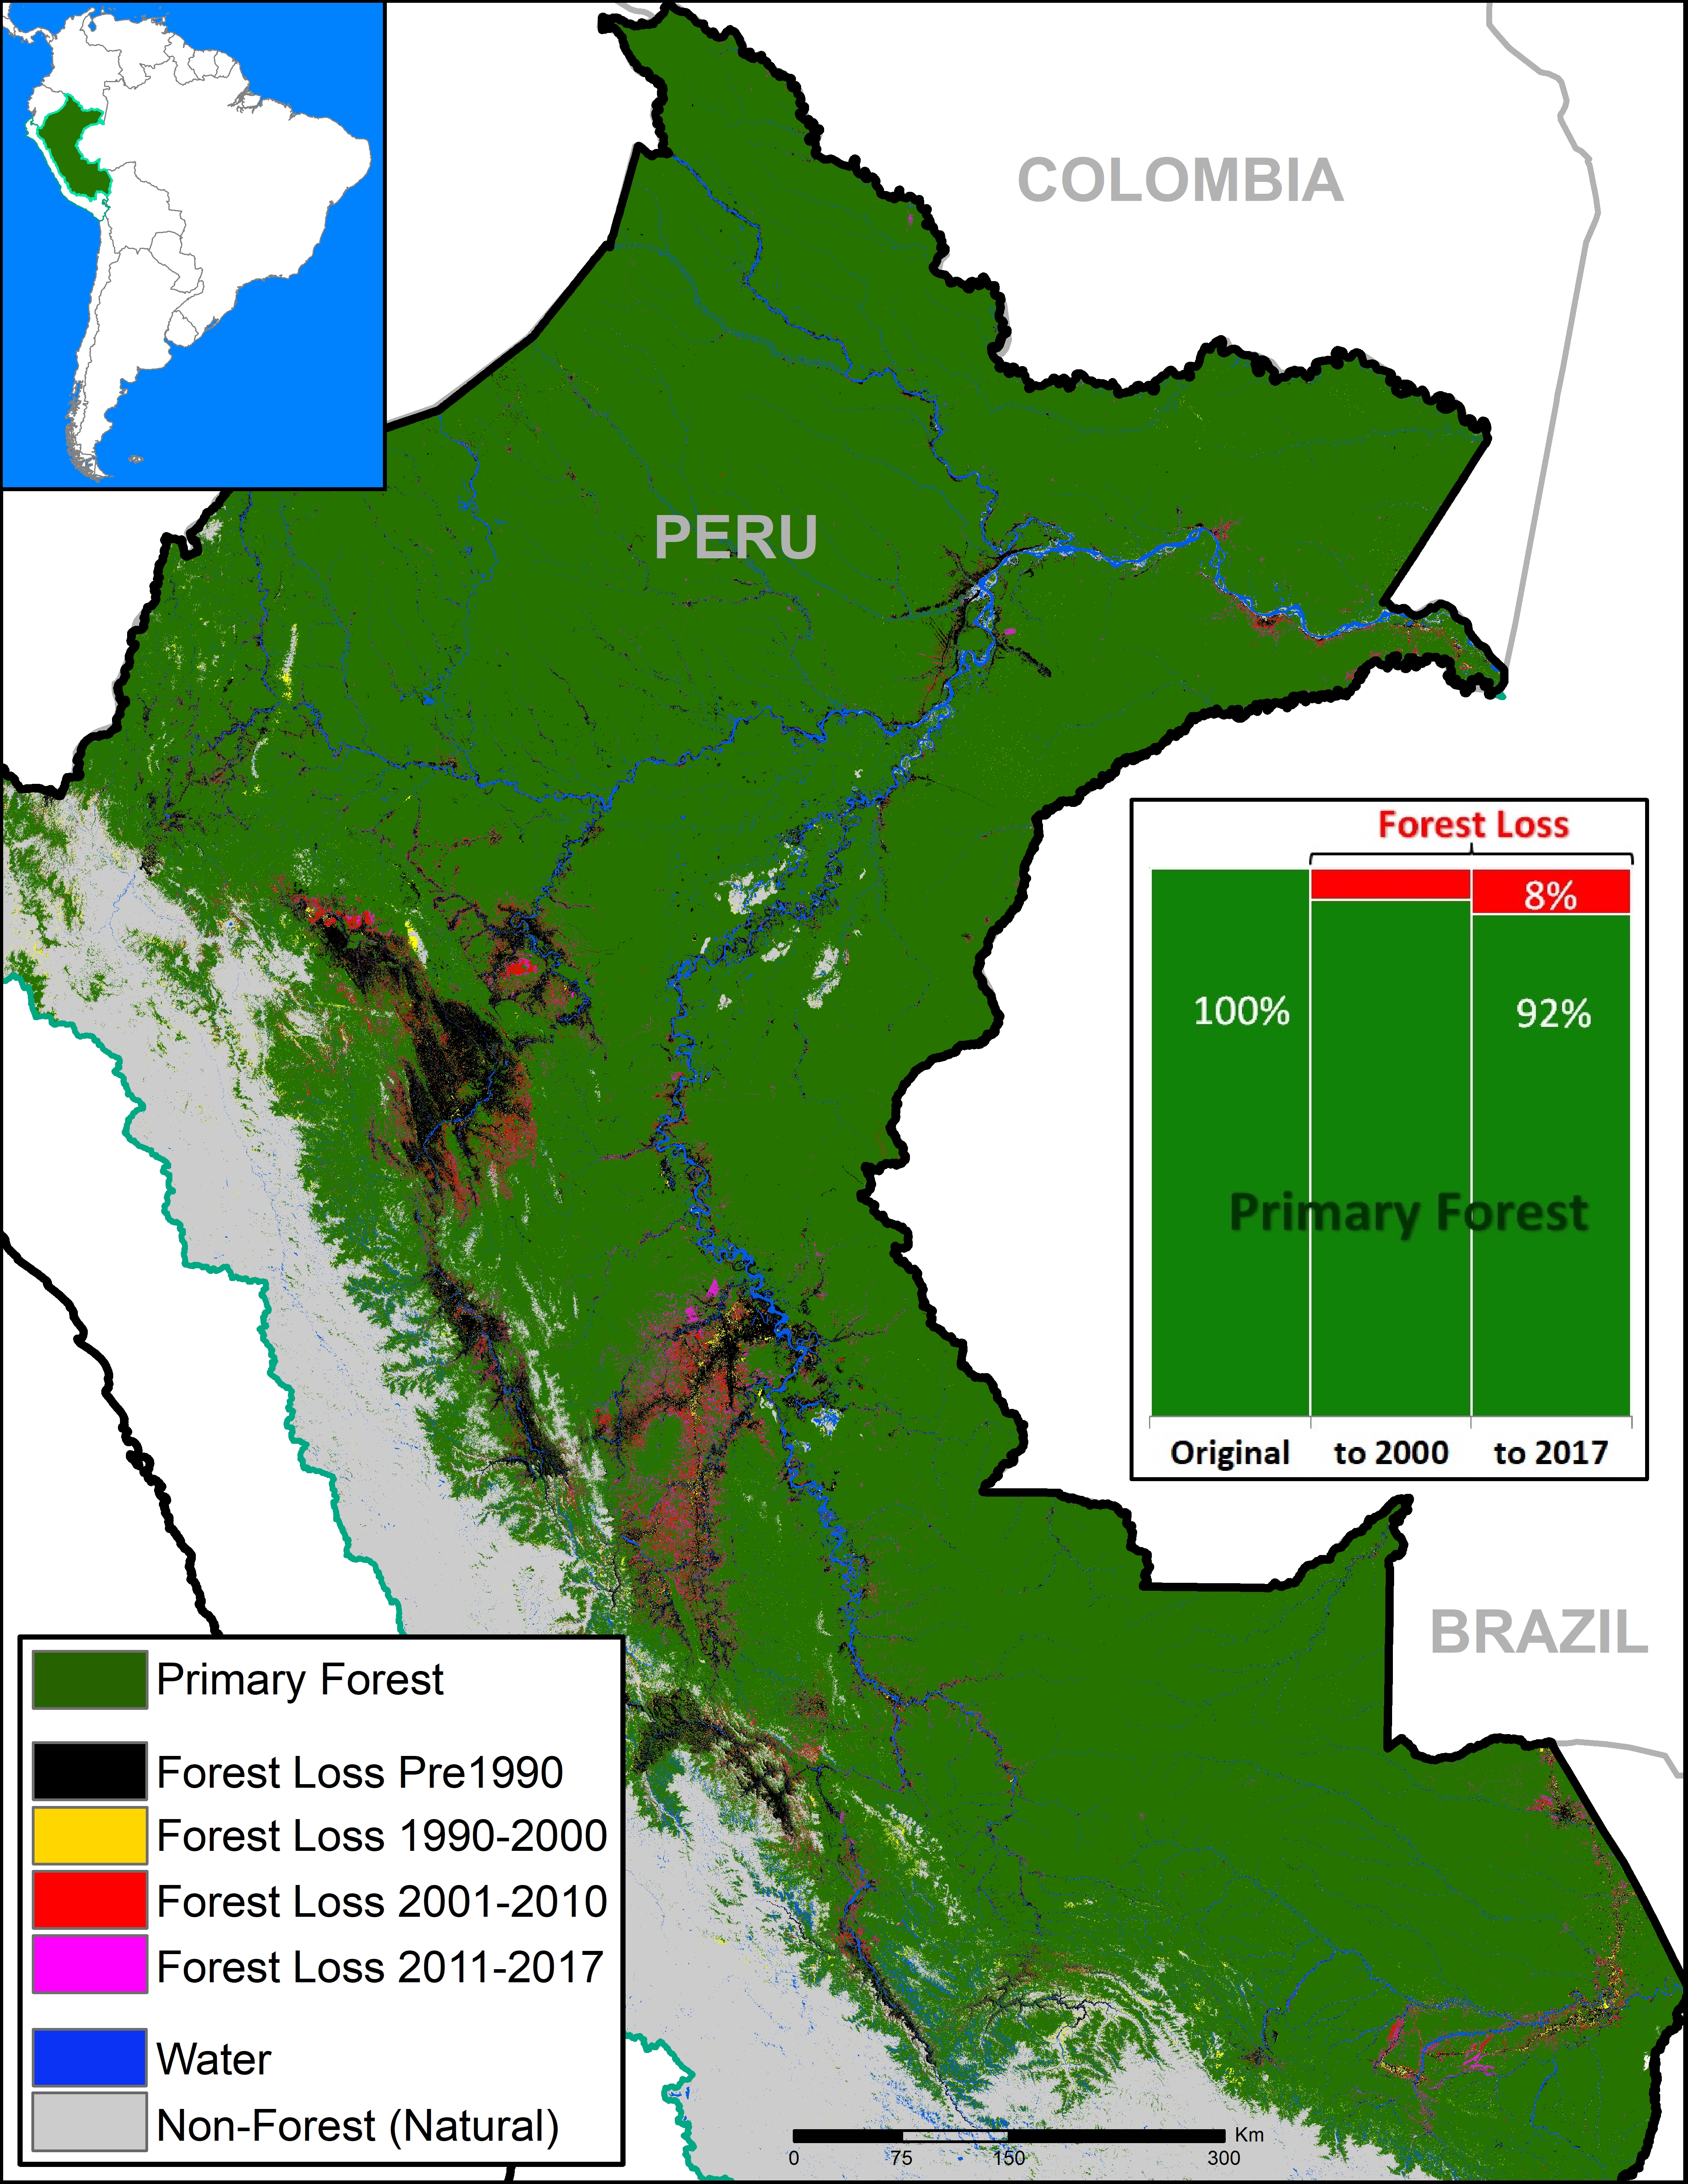
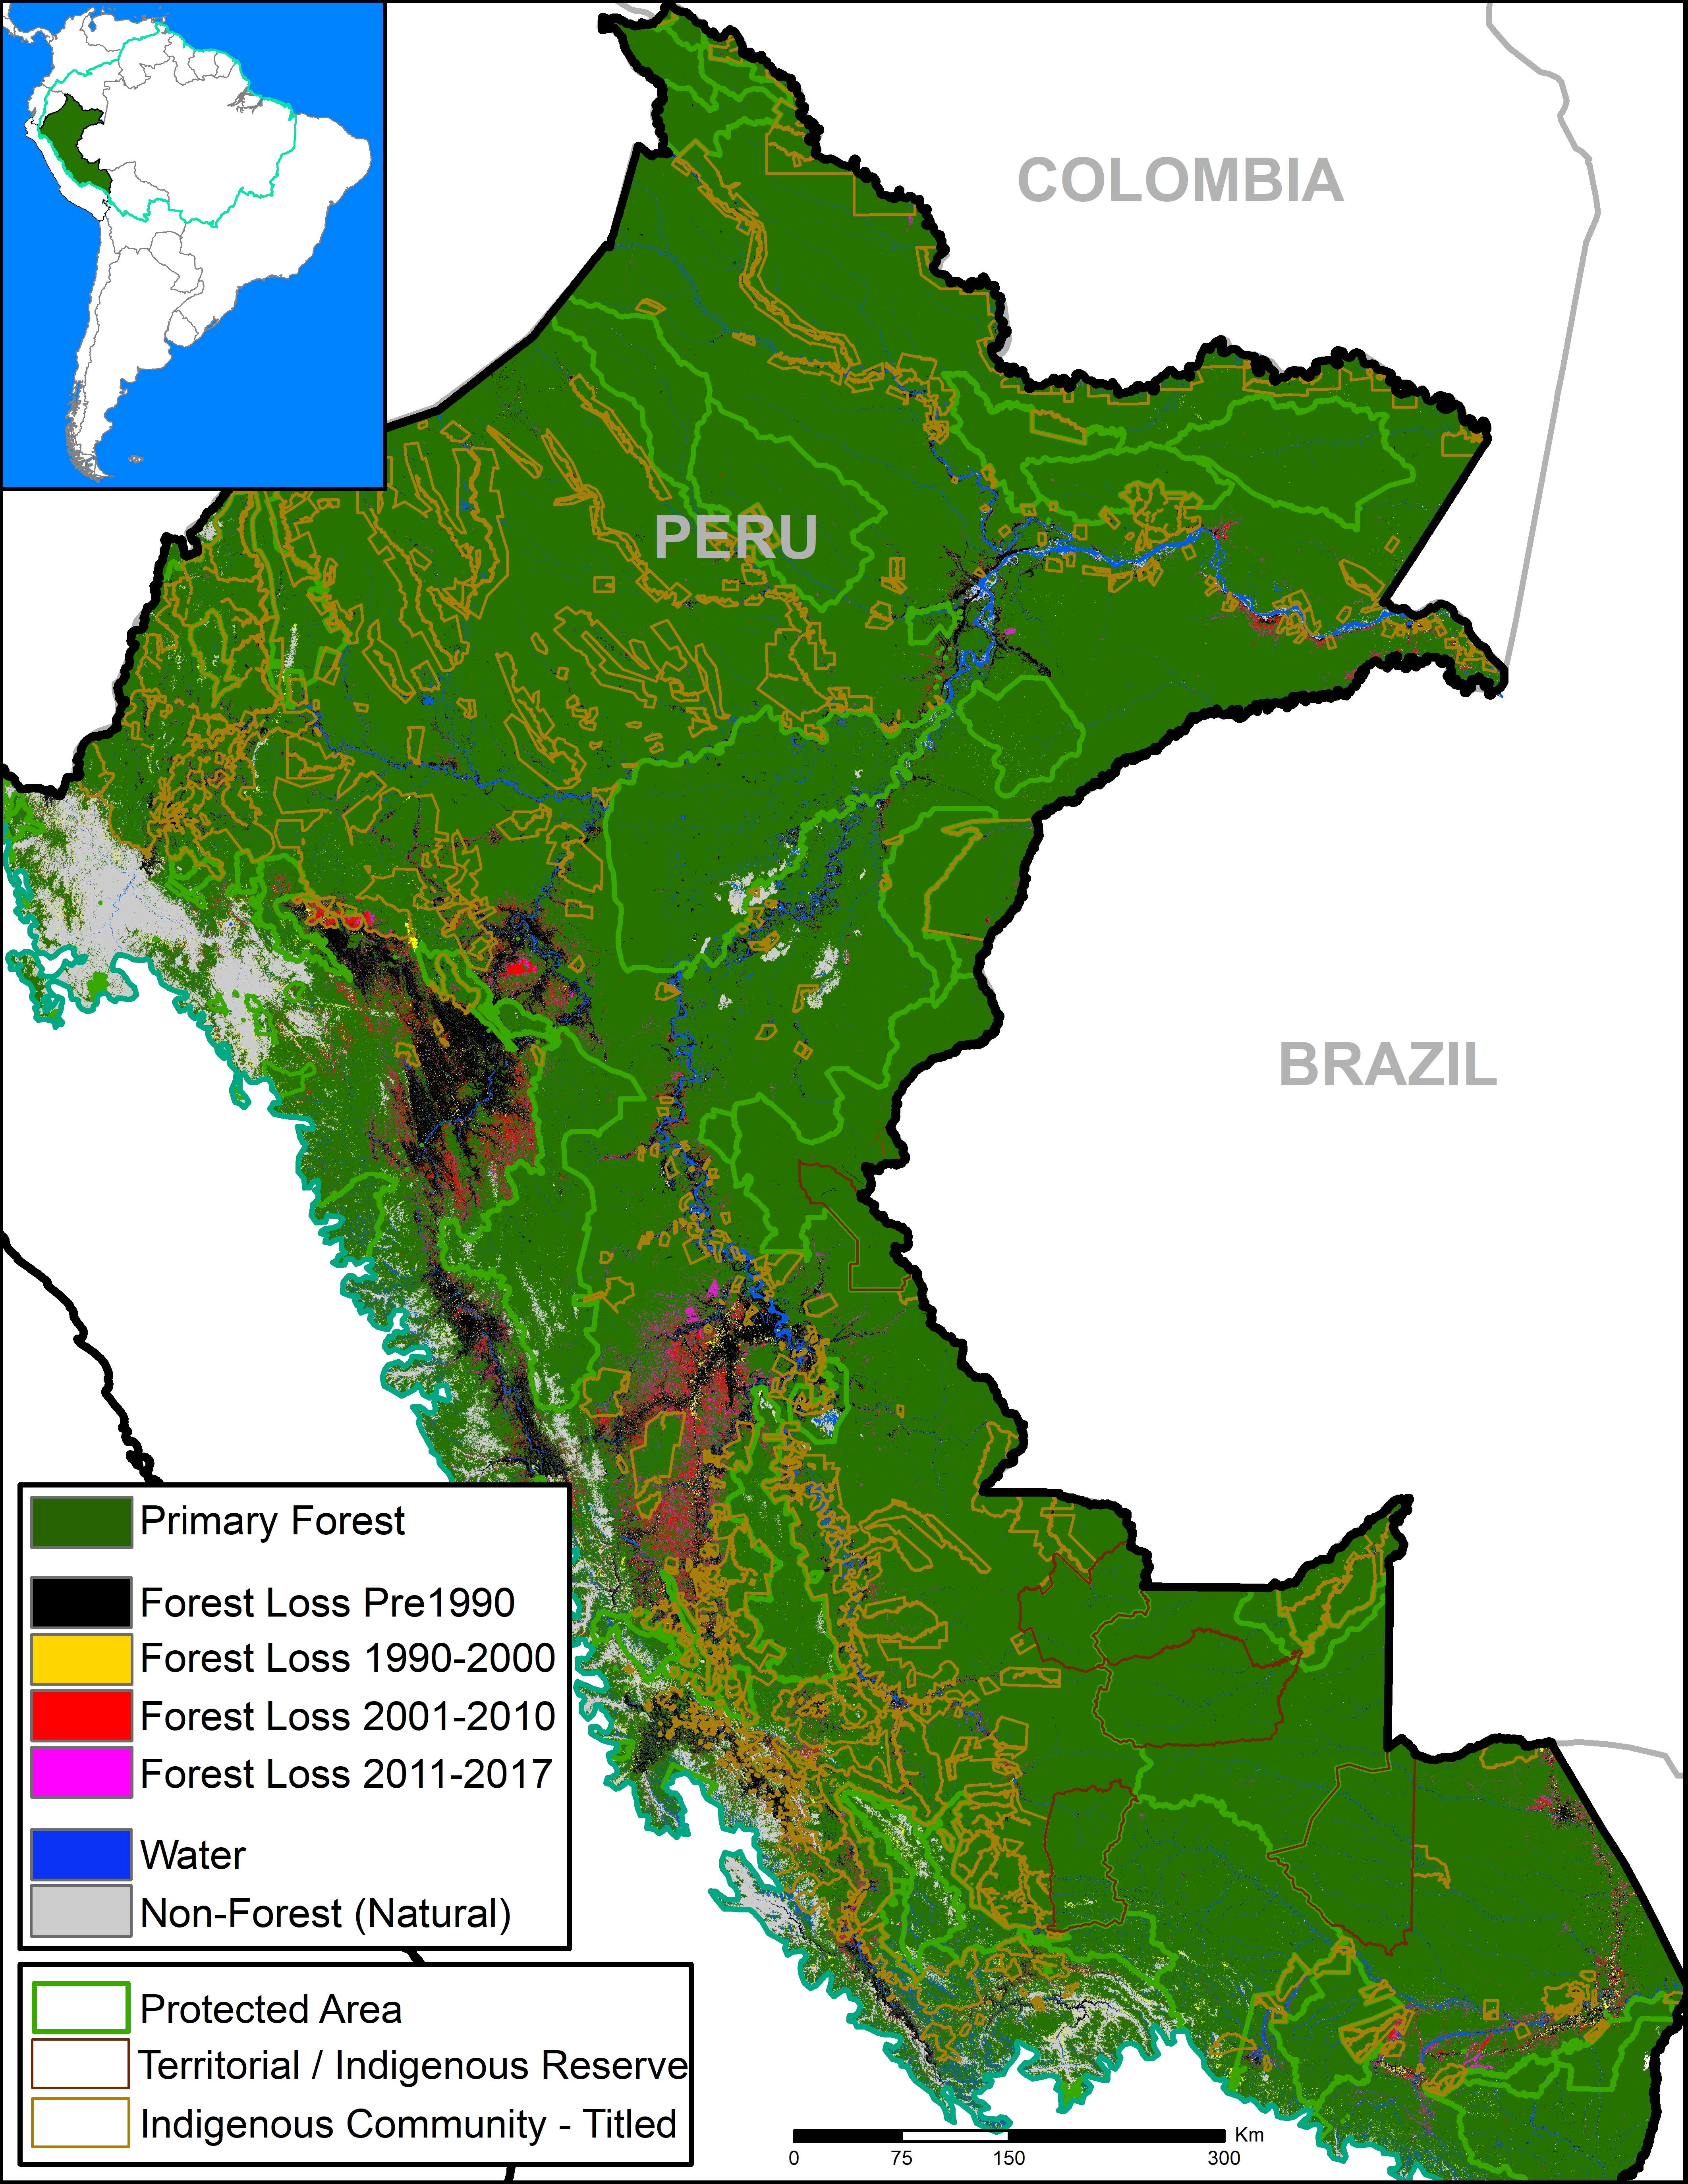
Base Map. Data: SERNANP, IBC, Hansen/UMD/Google/USGS/NASA, PNCB/MINAM, GLCF/UMD, ANA.

The primary forests of the Peruvian Amazon, the second largest stretch of the Amazon after Brazil, are steadily shrinking due to deforestation.

Here, we analyze both historic and current data to identify the patterns.

The good news: As the Base Map shows, the Peruvian Amazon is still home to extensive primary forest.* We estimate the current extent of Peruvian Amazon primary forest to be 67 million hectares (165 million acres), greater than the total area of France.

Importantly, we found that 48% of the current primary forests (32.2 million hectares) are located in officially recognized protected areas and indigenous territories (see Annex).**

The bad news: The Peruvian Amazon primary forests are steadily shrinking.

We estimate the original extent of primary forests to be 73.1 million hectares (180.6 million acres). Thus, there has been a historic loss of 6.1 million hectares (15 million acres), or 8% of the original. A third of the historic loss (2 million hectares) has occurred since 2001.

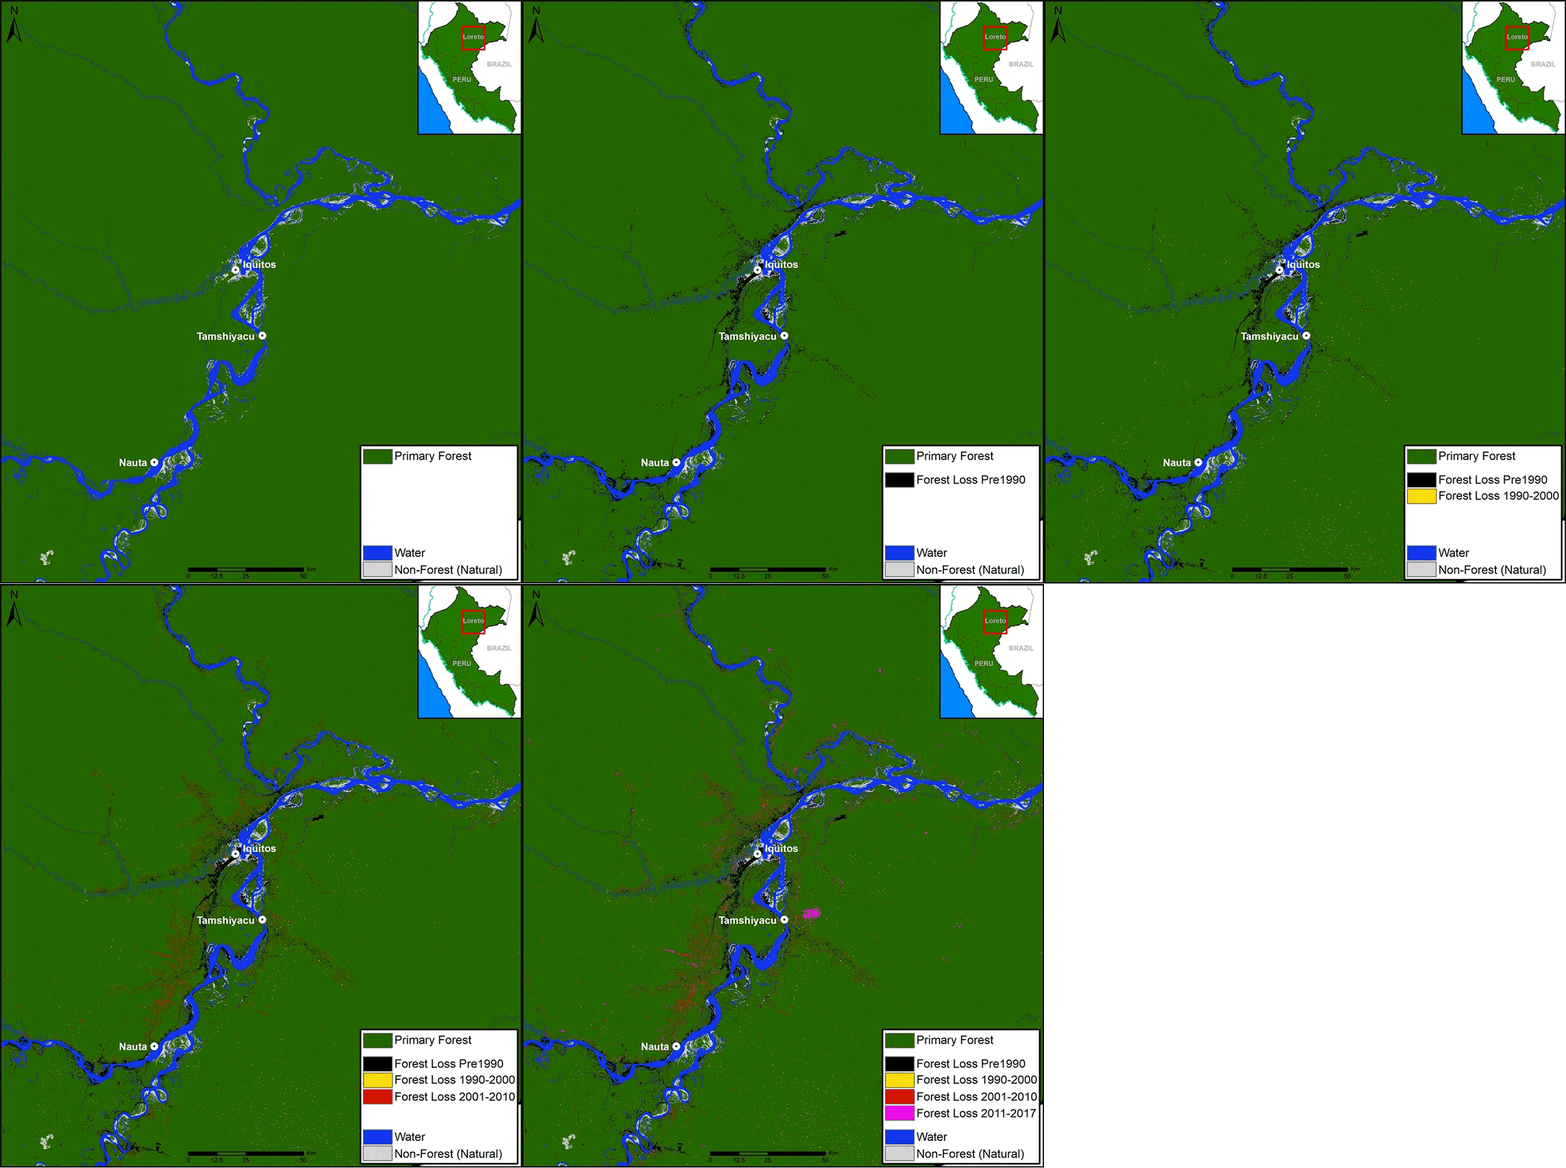
Below, we show three zooms (in GIF format) of the expanding deforestation, and shrinking primary forests, in the southern, central, and northern Peruvian Amazon.


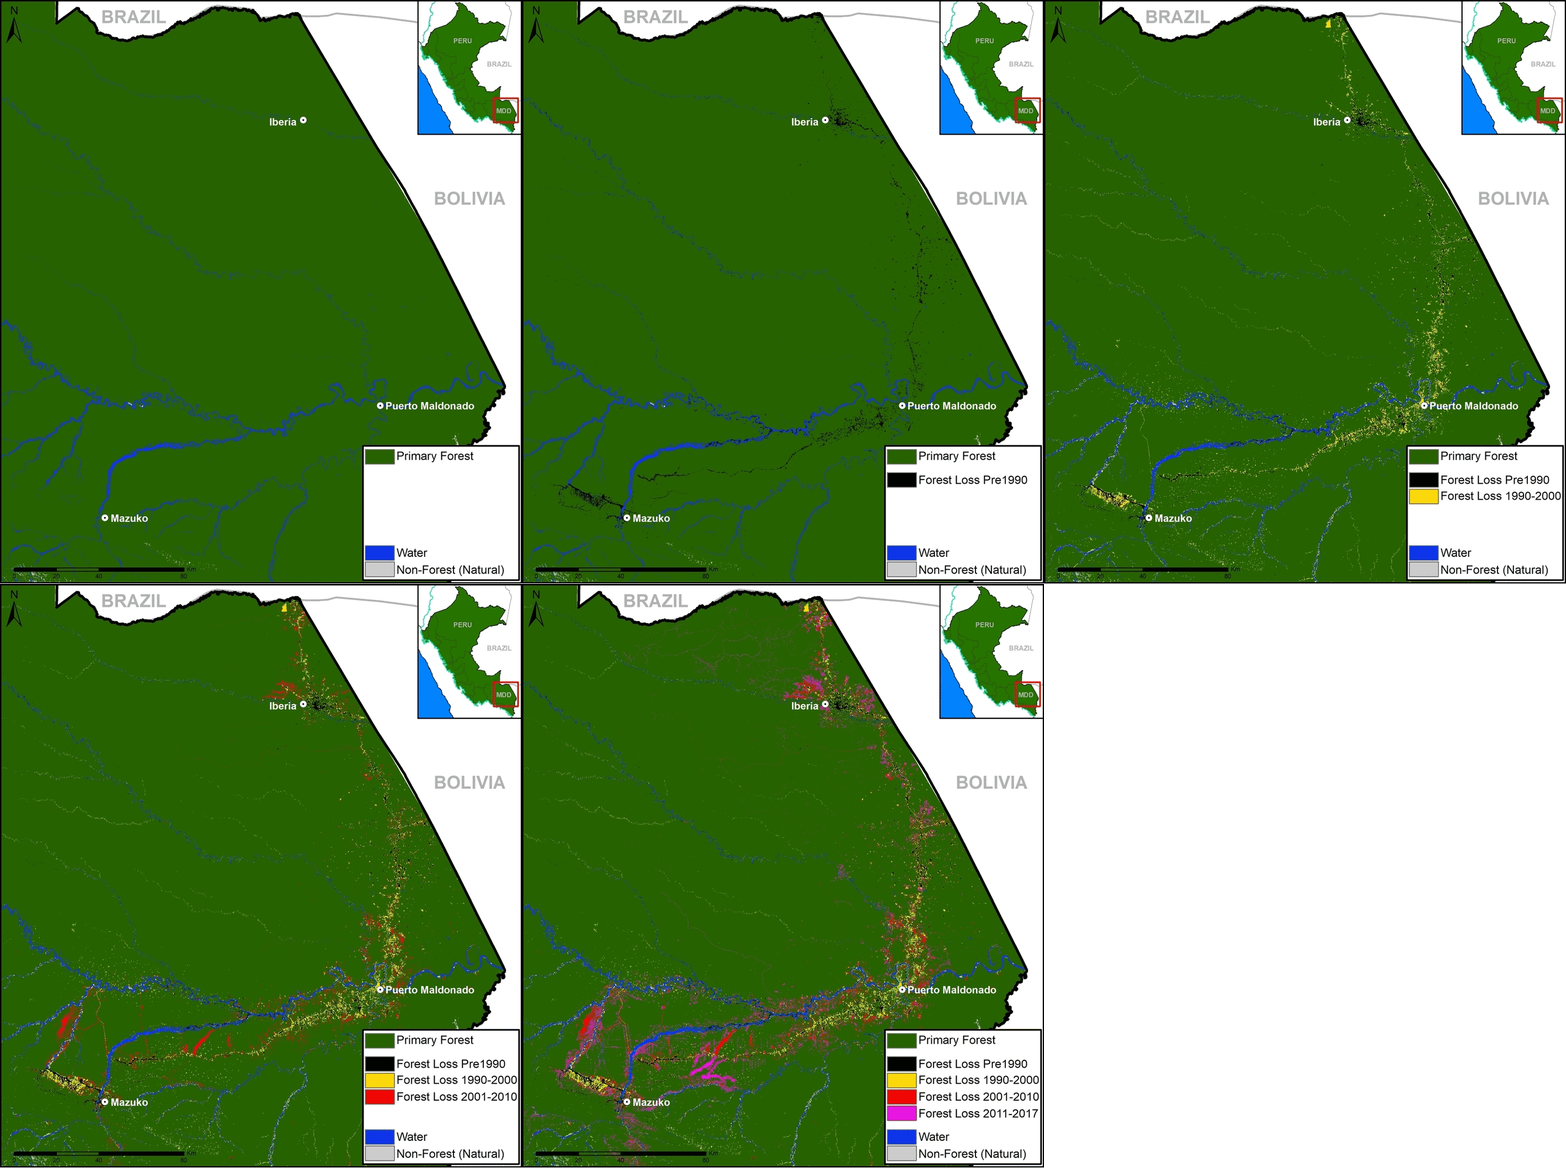
GIF of deforestation in the southern Peruvian Amazon. Data: see Base Map

Southern Peruvian Amazon

Note these three important trends in the GIF (click to enlarge):

  • Increasing deforestation all along the route of the Interoceanic Highway;
  • Increasing gold mining deforestation across several different fronts near the southwestern section of the highway;
  • Increasing agricultural deforestation around Iberia, along the northern section of the highway near the border with Brazil.


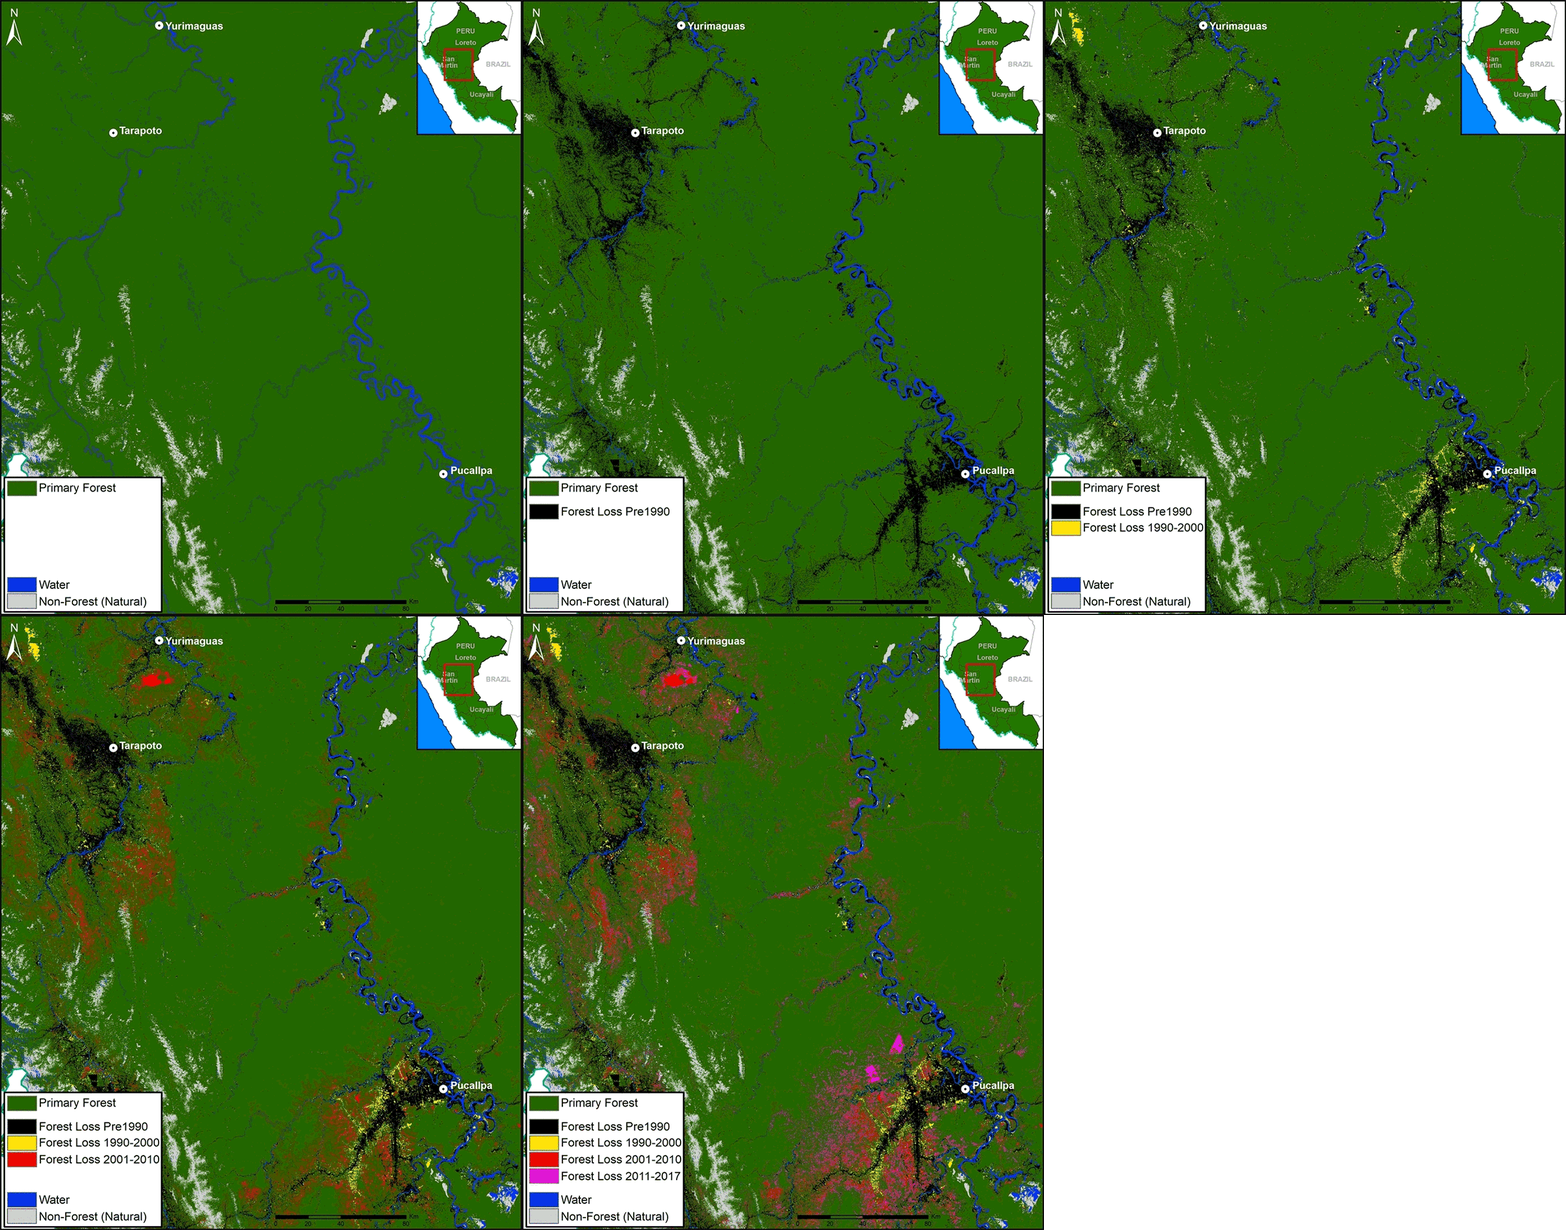
GIF of deforestation in the central Peruvian Amazon. Data: see Base Map

Central Peruvian Amazon

Note these three important trends in the GIF (click to enlarge):

  • The substantial historic (pre 1990) deforestation around the cities Pucallpa and Tarapoto;
  • Increasing deforestation along the road leading west from Pucallpa;
  • Large-scale deforestation for oil palm plantations outside of Pucallpa and Yurimaguas.


Base Map plus protected areas and indigenous communities.

Northern Peruvian Amazon

Note these three important trends in the GIF (click to enlarge):

  • The historic (pre 1990) deforestation around Iquitos;
  • Increasing deforestation along the Iquitos-Nauta road;
  • Large-scale deforestation for United Cacao plantation near the town of Tamshiyacu.


Base Map plus protected areas and indigenous communities. Data: SERNANP, IBC, Hansen/UMD/Google/USGS/NASA, PNCB/MINAM, GLCF/UMD, RAISG, Ministerio de Cultura.

Annex

The Base Map with three additional categories: Protected Areas, titled Native Communities, and Indigenous Reserves.


Notes

*Defining primary forest: According to the Supreme Decree (No. 018-2015-MINAGRI) approving the Regulations for Forest Management under the framework of the new 2011 Forestry Act (No. 29763), the official definition of primary forest in Peru is: “Forest with original vegetation characterized by an abundance of mature trees with species of superior or dominant canopy, which has evolved naturally.” Using methods of remote sensing, our interpretation of that definition are areas that from the earliest available image are characterized by dense closed-canopy coverage and experienced no major clearing events.

It should be emphasized that our definition of primary forest does not mean that the area is pristine. These primary forests may have been degraded by selective logging and hunting.

**Historical Peruvian Amazon primary forests: 73,188,344 hectares. Current Peruvian Amazon primary forests: 67,043,378 hectares. Of this total, 27.6% are located in designated protected areas (18.5 million hectares), 18% in titled Native Communities (12 million hectares), and 4% in Indigenous Reserves/ Territories designated for indigenous peoples in voluntary isolation (2.9 million hectares). There is some overlap between these three categories, and the final combined percentage (48%) takes this into account.

Metodology

To generate the estimate of original (historical) expanse of primary forests in the Peruvian Amazon, we combined two satellite-based data sources. First, we used data from the Global Land Cover Facility (GLCF 2014), which established a forest cover baseline as of 1990 (The GLCF products are based on the Landsat Global Land Survey collection, which were compiled for years circa 1975, 1990, 2000 and 2005). Areas with no data due to shadows and clouds were filled in with GLCF data covering 2000-2005 time frame. The historical primary forest layer was created by combining the following three GLCF data layers: “Persistent Forest,” “Forest Gain,” and “Forest Loss.” Next, we incorporated the “Hydrography” data layer generated by the Peruvian Environment Ministry (Programa Nacional de Conservación de Bosques) to avoid including water bodies. We defined the limit of the analysis as the hydrographical basin of the Amazon. We generally define “historical Peruvian Amazon primary forest” as the expanse of primary forests before the European colonization of Peru (around 1750).

To generate the estimate of current primary forests, we subtracted areas determined to experience deforestation or forest loss from 1990 to 2017. For data covering 1990-2000, we incorporated two datasets: GLCF forest loss 1990-2000 and “No Forest as of 2000” (“No Bosque al 2000”) generated by the Peruvian Environment Ministry. For data covering 2001-2016, we used annual data generated by the Peruvian Environment Ministry. Finally, for 2017, we used early warning alert data generated by the Peruvian Environment Ministry. As a result, we define current primary forests as an area of historical forest with no observable (30 meter resolution) forest loss from 1990 to 2017.

Global Land Cover Facility (GLCF) and Goddard Space Flight Center (GSFC). 2014. GLCF Forest Cover Change 2000 2005, Global Land Cover Facility,University of Maryland, College Park.

Citation:

Finer M, Mamani N (2018) Shrinking Primary Forests of the Peruvian Amazon. MAAP: 93.

MAAP #83: Climate Change Defense: Amazon Protected Areas and Indigenous Lands

Base Map. Data: Asner et al 2014, MINAM/PNCB, SERNANP, IBC

Tropical forests, especially the Amazon, sequester huge amounts of carbon, one of the main greenhouse gases driving climate change.

Here, we show the importance of protected areas and indigenous lands to safeguard these carbon stocks.

In MAAP #81, we estimated the loss of 59 million metric tons of carbon in the Peruvian Amazon during the last five years (2013-17) due to forest loss, especially deforestation from mining and agricultural activities.

This finding reveals that forest loss represents nearly half (47%) of Peru’s annual carbon emissions, including from burning fossil fuels.1,2

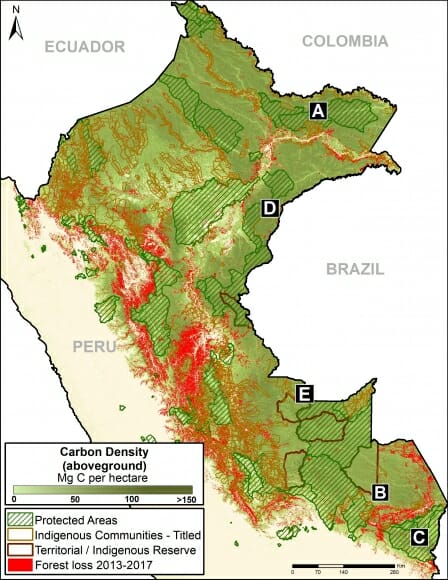
In contrast, here we show that protected areas and indigenous lands have safeguarded 3.17 billion metric tons of carbon, as of 2017.3,4

The Base Map (on the right) shows, in shades of green, the current carbon densities in relation to these areas.

The breakdown of results are:
1.85 billion tons safeguarded in the Peruvian national protected areas system;
1.15 billion tons safeguarded in titled native community lands; and
309.7 million tons safeguarded in Territorial Reserves for indigenous peoples in voluntary isolation.

The total safeguarded carbon (3.17 billion metric tons) is the equivalent to 2.5 years of carbon emissions from the United States.5

Below, we show several examples of how protected areas and indigenous lands are safeguarding carbon reservoirs in important areas, indicated by insets A-E.

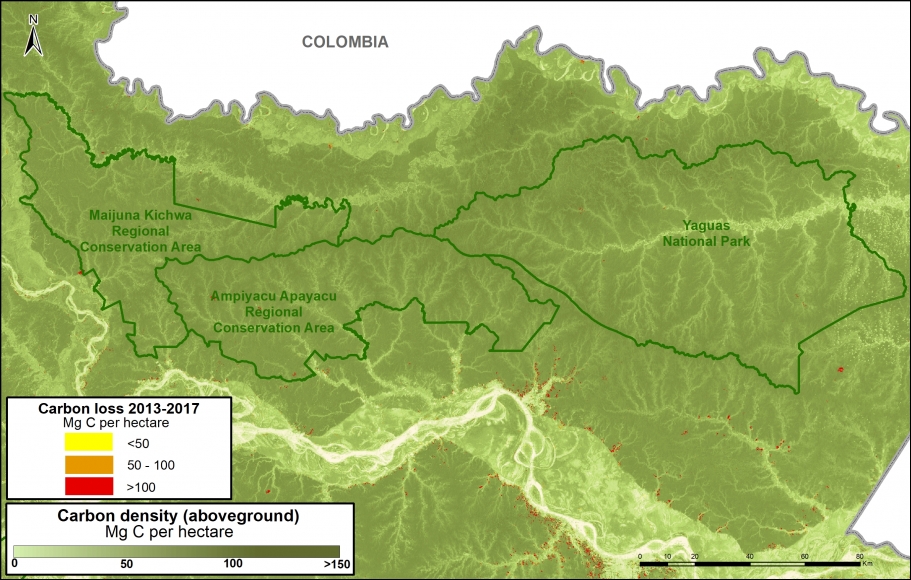
A. Yaguas National Park

The following Image A shows how three protected areas, including the new Yaguas National Park, are effectively safeguarding 202 million metric tons of carbon in the northeastern Peruvian Amazon. This area is home to some of the highest carbon densities in the country.

Image 83a. Yaguas. Data: Asner et al 2014, MINAM/PNCB, SERNANP

B. Manu National Park, Amarakaeri Communal Reserve, CC Los Amigos

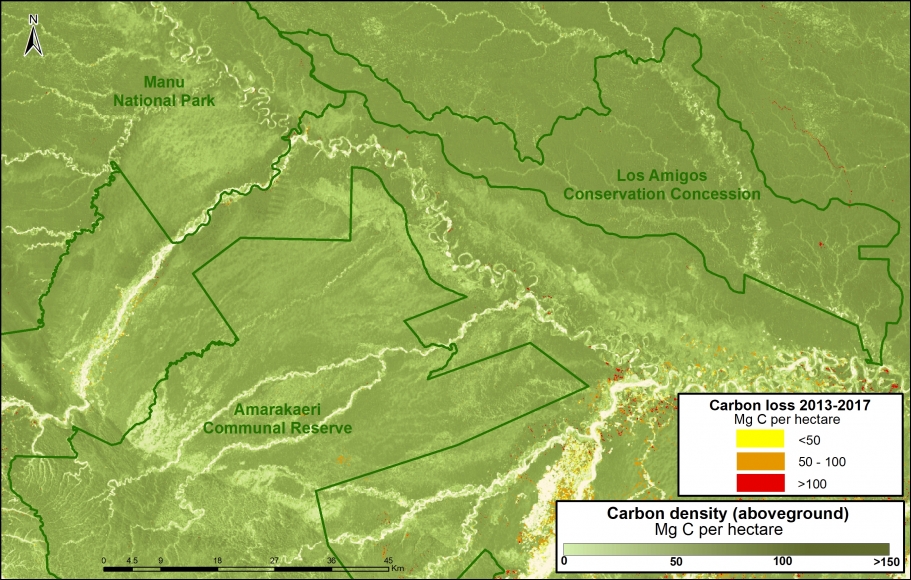
The following Image B shows how Los Amigos, the world’s first conservation concession, is effectively safeguarding 15 million metric tons of carbon in the southern Peruvian Amazon. Two surrounding protected areas, Manu National Park and Amarakaeri Communal Reserve, safeguard an additional 194 million metric tons. This area is home to some of the highest carbon densities in the country.

Image 83b. Los Amigos-Manu-Amarakaeri. Data: Asner et al 2014, MINAM/PNCB, SERNANP, ACCA

C. Tambopata National Reserve, Bahuaja Sonene National Park

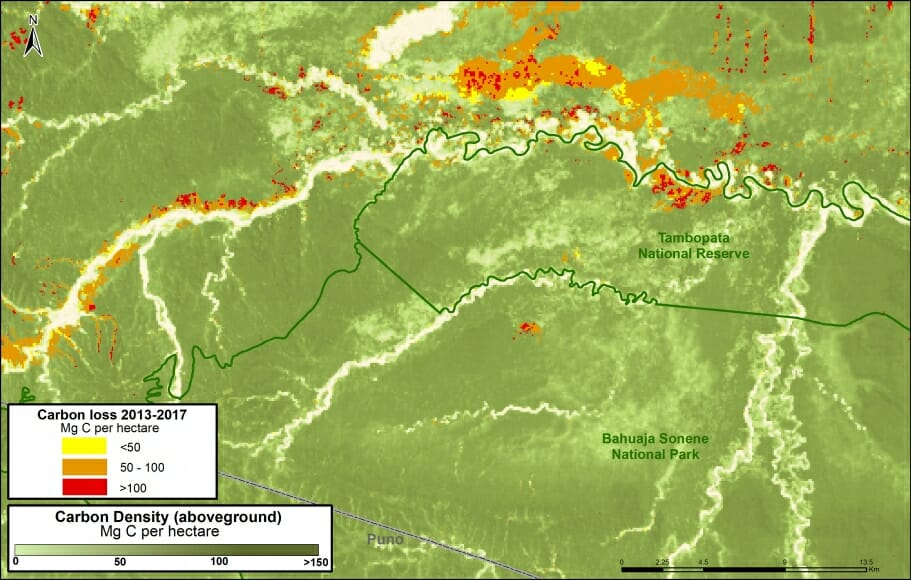
The following Image C shows how two important natural protected areas, Tambopata National Reserve and Bahuaja Sonene National Park, are helping conserve carbon stocks in an area with intense illegal gold mining activity.

D. Sierra del Divisor National Park, National Reserve Matsés

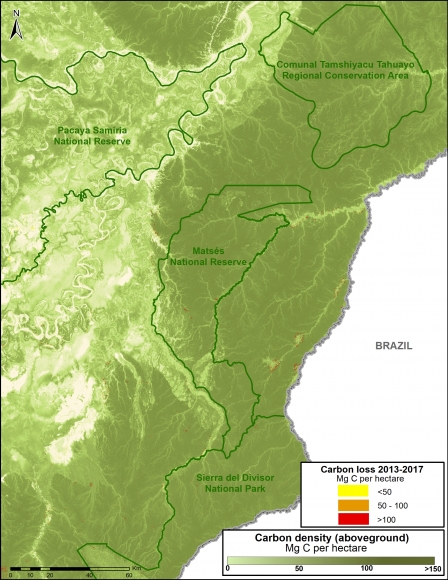
Image 83d. Data: Asner et al 2014, MINAM/PNCB, SERNANP

The following Image D shows how four protected areas, including the new Sierra del Divisor National Park, and adjacent National Reserve Matsés are effectively safeguarding 270 million metric tons of carbon in the eastern Peruvian Amazon.

This area is home to some of the highest carbon densities in the country.

E. Murunahua Indigenous Reserve

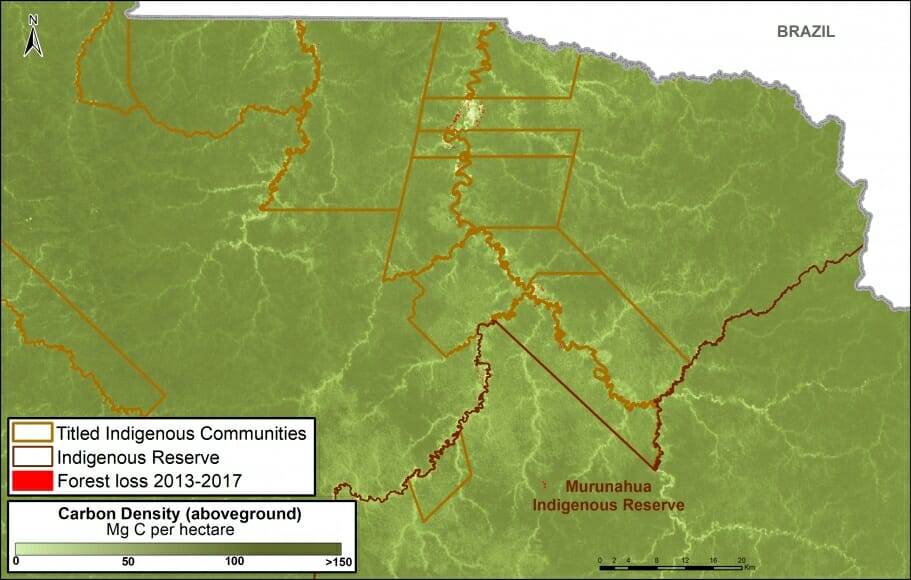
The following Image E shows the carbon protected in the Murunahua Indigenous Reserve (for indigenous peoples in voluntary isolation) and the surrounding titled native communities.

Imagen 83e. Datos: Asner et al 2014, MINAM/PNCB, SERNANP

References

1  UNFCCC. Emissions Summary for Peru. http://di.unfccc.int/ghg_profile_non_annex1

2  No incluye las emisiones por la degradación de bosques

Asner GP et al (2014). The High-Resolution Carbon Geography of Perú. Carnegie Institution for Science. ftp://dge.stanford.edu/pub/asner/carbonreport/CarnegiePeruCarbonReport-English.pdf

Sistema de Áreas Naturales Protegidas del Perú, que incluye áreas de administración nacional, regional, y privado. Datos de las tierras indígenas son de Instituto de Bien Común. Datos de pérdida forestal son de la Programa Nacional de Conservación de Bosques para la Mitigación del Cambio Climático (MINAM/PNCB).

UNFCCC. Emissions Summary for United States. http://di.unfccc.int/ghg_profile_annex1

Citation

Finer M, Mamani N (2017). Climate Change Defense: Amazon Protected Areas and Indigenous Lands. MAAP: 83.

Acknowledgments

This report was made possible by the generous support of the Norwegian Agency for Development Cooperation (NORAD).

Image #6: Expanding Gold Mining Deforestation Enters Amarakaeri Communal Reserve (Madre de Dios, Peru)

Recall that in Image of the Week #1 and Image of the Week #5 we documented how gold mining deforestation continues to expand within the Department of Madre de Dios, Peru (in the areas known as La Pampa and Upper Malinowski, respectively). Here, Image of the Week #6 documents how expanding deforestation from the mining zone known as Huepetuhe/Delta-1 is now entering the Amarakaeri Communal Reserve, an important Peruvian protected area that is co-managed by indigenous communities and Peru’s National Protected Areas Service (known as SERNANP).

Our analysis shows that gold mining deforestation, expanding from Huepetuhe/Delta-1, entered the southeast corner of the reserve in 2013 and expanded in 2014 and 2015. We also show that gold mining deforestation is spreading within the reserve’s south-eastern buffer zone.

2015_MDD_Amarakaeri_MAAP_6a_v8
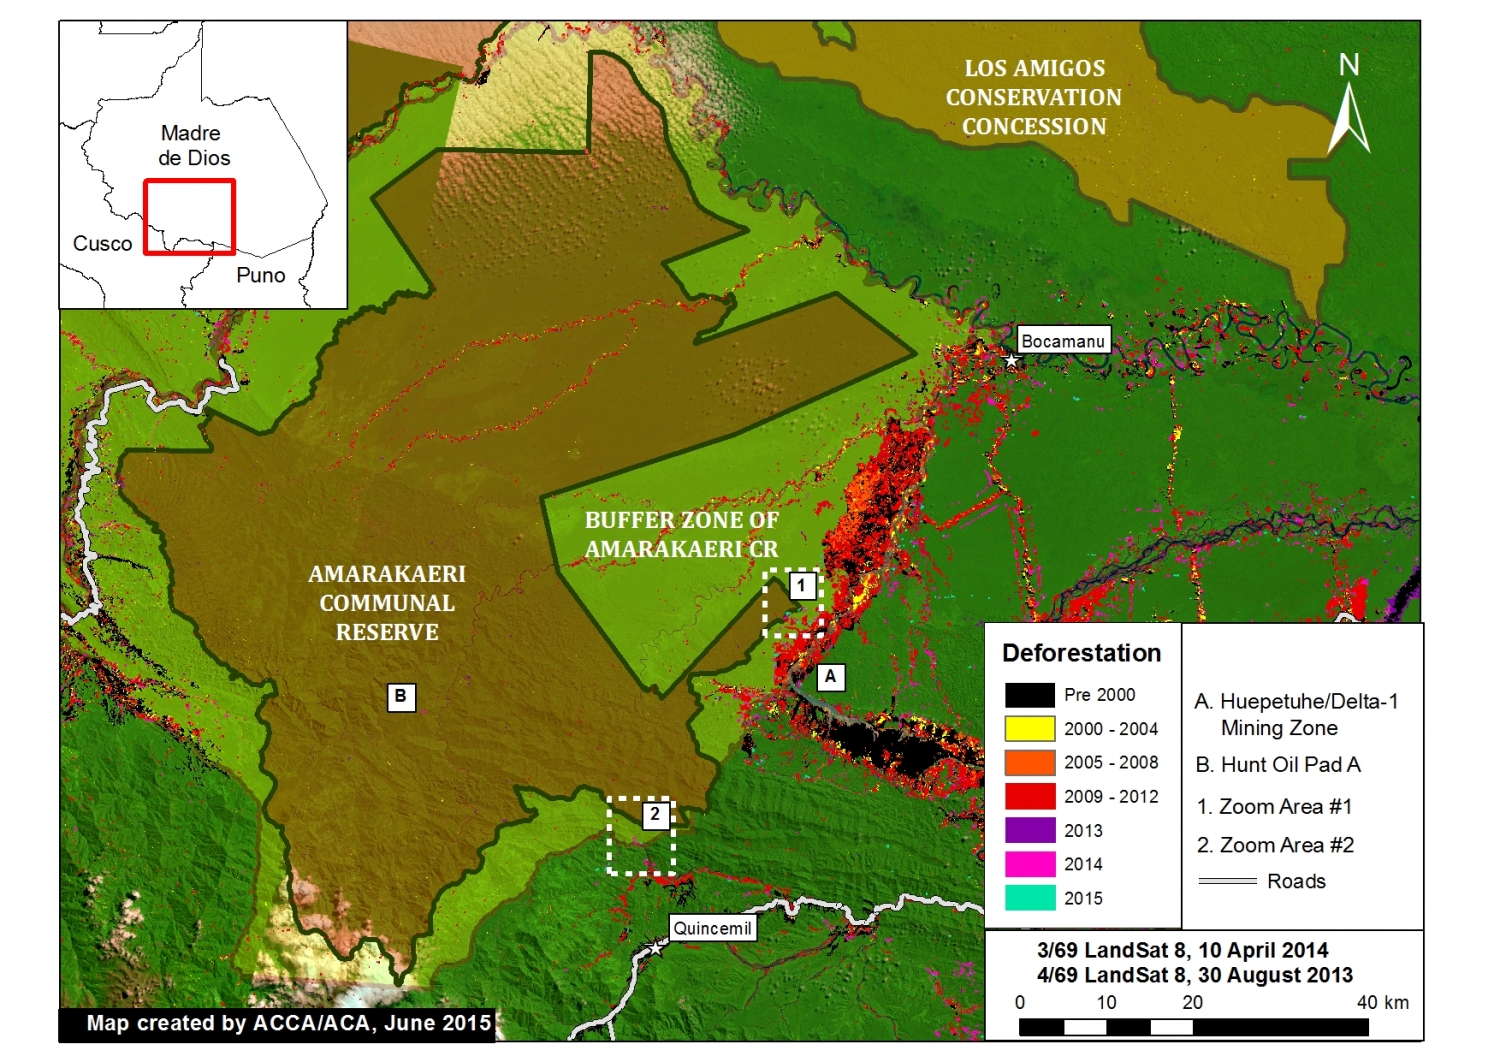
Image of the Week 6a. Deforestation detected within and around the Amarakaeri Communal Reserve and its buffer zone. Zoom Area #1 indicates focal area in Images 6b and 6c, while Zoom Area #2 indicates focal area in Image 6d. Key data sources: MINAM, SERNANP, ACCA, USGS, IBC, Hansen/UMD/Google/USGS/NASA.

Key Findings:

According to our CLASlite analysis, deforestation entered the southeast corner of the Amarakaeri Communal Reserve in 2013 and expanded in 2014 and 2015 (see Zoom #1 below). Additional analysis revealed that the driver of this deforestation was gold mining due to the pattern and appearance of the forest loss.

We also detected increasing gold mining deforestation within the reserve’s south-eastern buffer zone between 2014 and 2015 (see Zoom #2 below). See below for more details.

We also detected a small amount of deforestation in 2014 from Hunt Oil’s drilling of Pad A within the reserve (see “B” in Image 6a). Note that overall deforestation from this gas exploration project has been very low because the company did not build an access road.

Gold Mining Deforestation Enters the Reserve (Zoom Area #1)

2015_MDD_Amarakaeri_MAAP_6b_v7 (1)
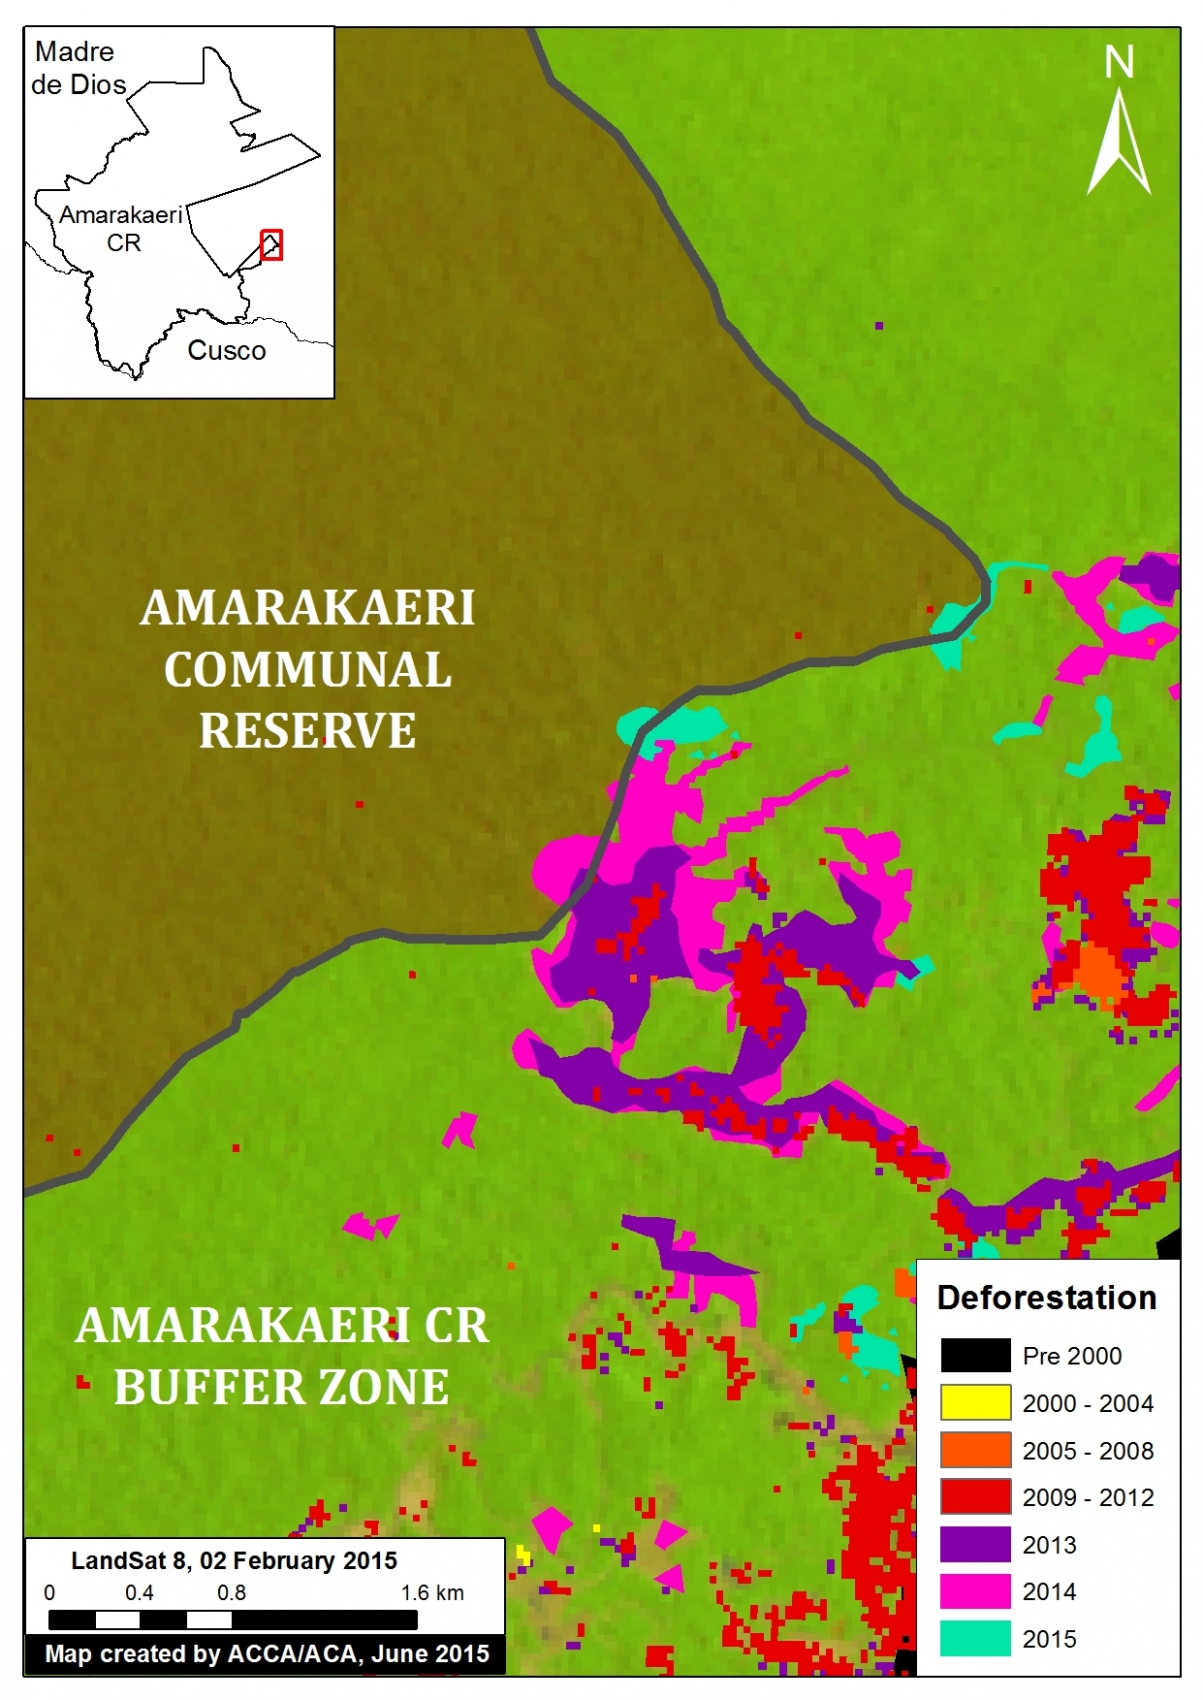
Image 6b. Zoom Area #1 provides an enhanced view of the deforestation within the southeast section of Amarakaeri Communal Reserve and its surrounding buffer zone. Key data sources: MINAM, SERNANP, ACCA, Hansen/UMD/Google/USGS/NASA, USGS.


Image 6b is a zoom view of the deforestation within the southeast section of Amarakaeri Communal Reserve and its surrounding buffer zone (see Zoom Area #1 in Image 6a for context).

Here, one can more clearly see how the gold mining deforestation entered the southeast corner of the reserve in 2013 and expanded in 2014 and 2015.

Total gold mining deforestation within this section of the Reserve is currently 11 hectares. Although this is currently only 1% of the Reserve’s total area, it represents a growing trend that may worsen.

Note that all of the rest of the deforestation in the image is within the reserve’s surrounding buffer zone.


Satellite Image Time-series of Deforestation Entering the Reserve (Zoom Area #1)

2015_MDD_Amarakaeri_MAAP_6c_v4
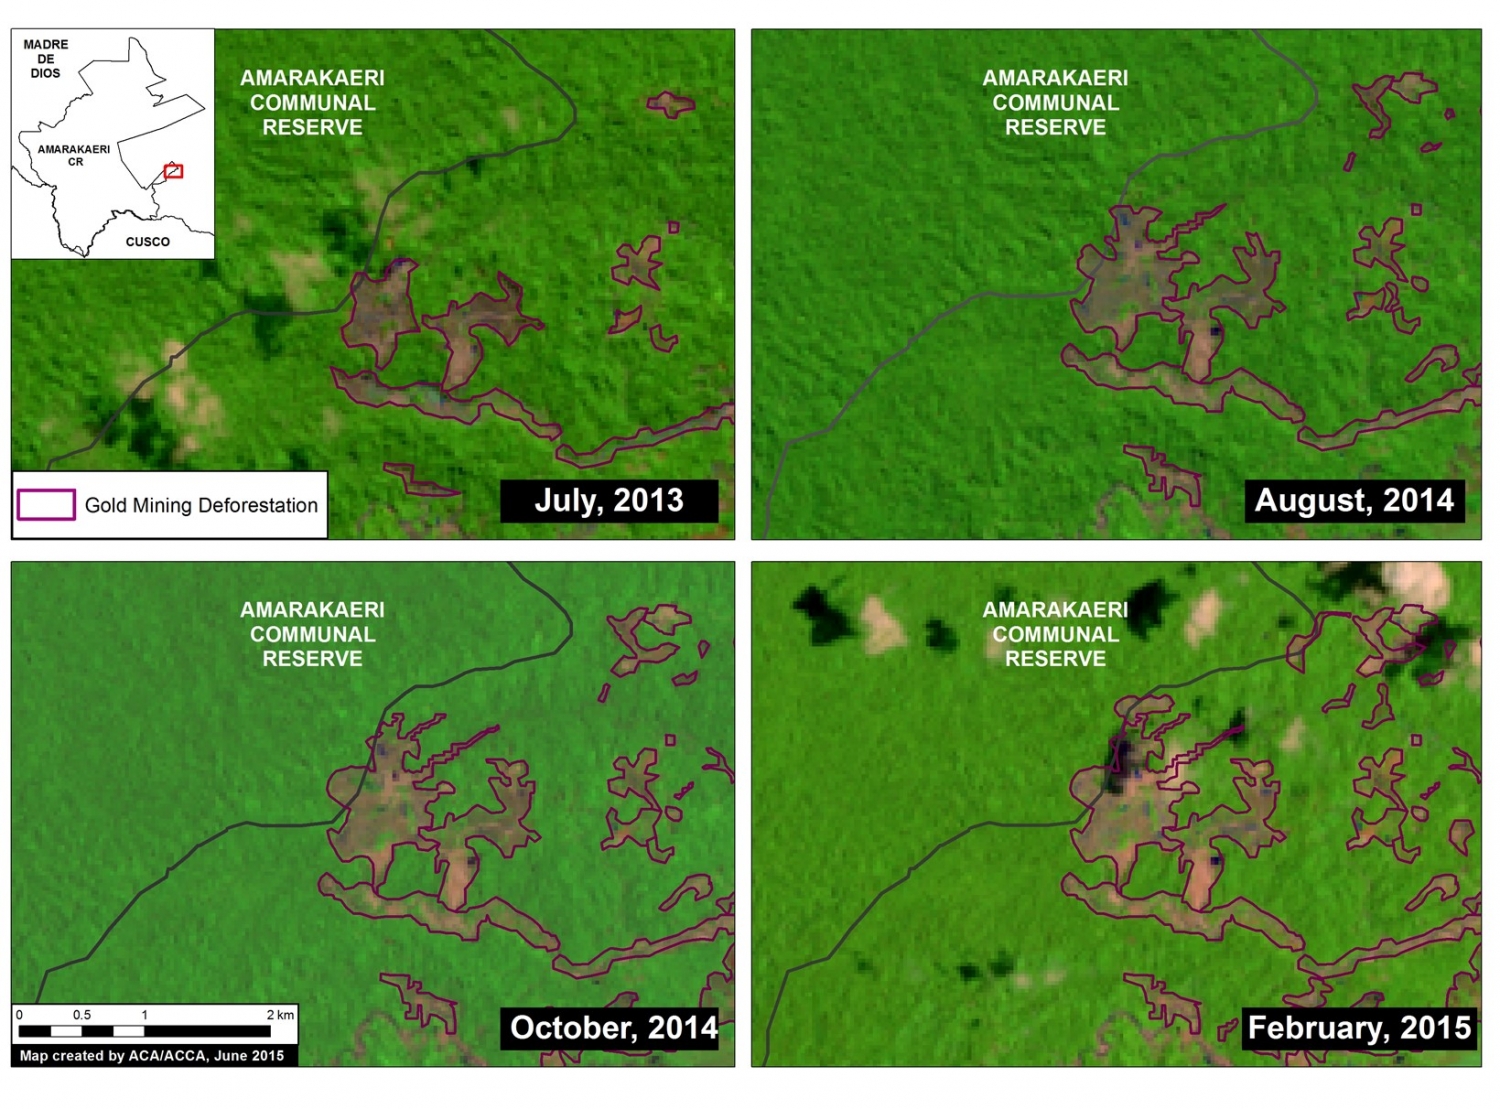
Image 6c. Satellite (Landsat 8) image time-series (2013 – 2015) of deforestation within the southeast section of the Amarakaeri Communal Reserve. Note that all four panels show the same location over time. Key data sources: USGS, SERNANP.

To better understand the deforestation dynamics over time within the southeast corner of the Amarakaeri Communal Reserve, we created a satellite (Landsat 8) image time-series. As seen in Image 6c, gold mining deforestation within the reserve is first seen in July 2013, and then slowly expands on several fronts until February 2015, the last good Landsat image for the area. Note that all four panels show the same location. Also note that all area in each panel outside the reserve is within its official buffer zone.

Gold Mining Deforestation Encroaching Upon Another Part of the Reserve (Zoom Area #2)

2015_MDD_Amarakaeri_MAAP_6e_v8
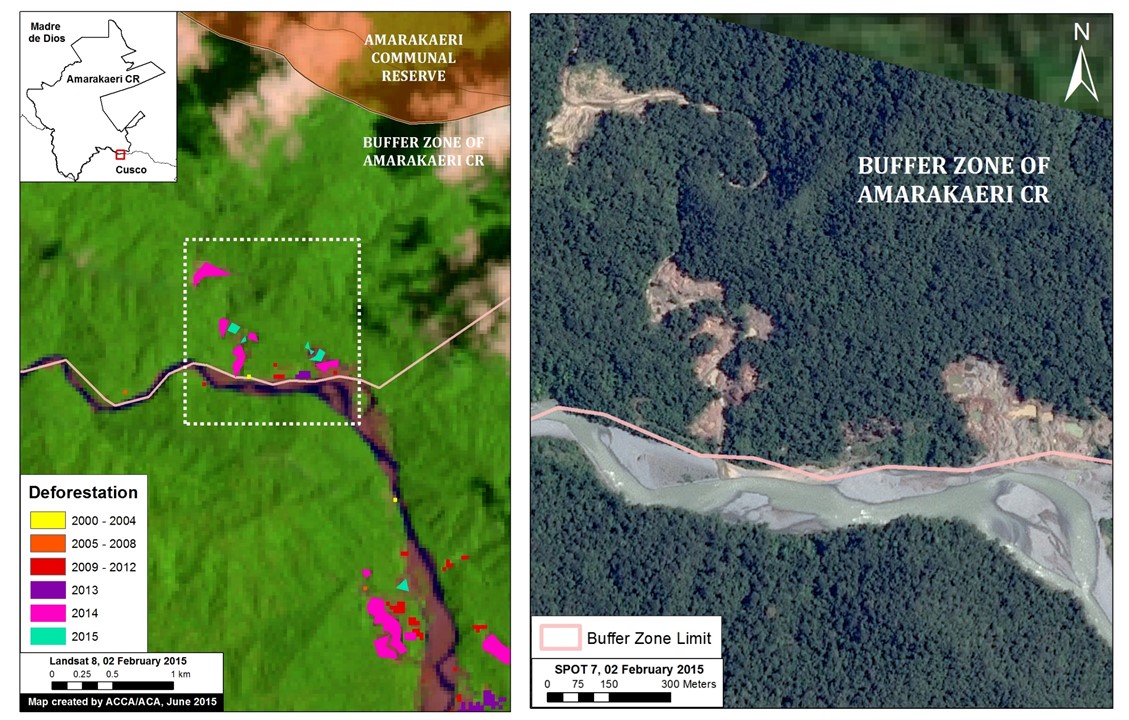
Image 6d. Zoom view of the deforestation within the south-eastern buffer zone of the Amarakaeri Communal Reserve. Left panel shows deforestation results data and right panel shows high resolution SPOT 7 imagery for the area in white dashed lines. Key data sources: MINAM, SERNANP, ACCA, Hansen/UMD/Google/USGS/NASA, USGS, and SPOT 7 from Airbus.

Image 6d shows how gold mining deforestation is encroaching on another part of the south-eastern section of the reserve (see Zoom Area #2 in Image 6a for context). As seen in the left panel, the deforestation within the buffer zone began expanding most notably in 2014 and 2015.

To confirm the driver of the deforestation, we acquired high resolution satellite imagery (SPOT 7 with 1.5 m resolution). As seen in the right panel of Image 6d, the pattern of the recent deforestation is characteristic of gold mining, and not other possible drivers such as agriculture.

Data Description:

Background map is a mosaic of two Landsat 8 images (30 m resolution) from April 10, 2014 and August 30, 2013. Any variation of green indicates forest cover. Note there is some scattered cloud cover. Data is from USGS.

Protected areas data is from SERNANP. Dark green indicates an established Peruvian national protected area or conservation concession and yellow-green indicates an official protected area buffer zone.

Black indicates areas that were deforested as of 2000 according to data from the Peruvian Environment Ministry (MINAM 2009). Yellow, orange, and red indicate areas that were deforested from 2000 to 2012 (each color covers a four year period) (Hansen MC et al. 2013 Science 342: 850–53; Data download).

Purple, pink, and teal indicate areas that were deforested between January 2013 and February 2015 based on our analysis of Landsat imagery using CLASlite forest monitoring software.

Citation

Finer M, Novoa S (2015) Gold Mining Deforestation Enters Amarakaeri Communal Reserve (Madre de Dios, Peru). MAAP: Image #6. Link: https://www.maapprogram.org/2015/08/image-of-the-week-6-gold-mining-deforestation-enters-amarakaeri-communal-reserve/