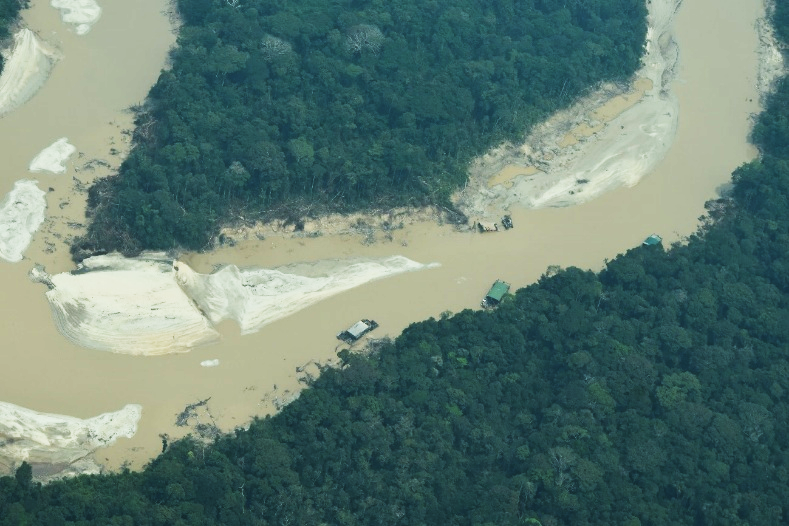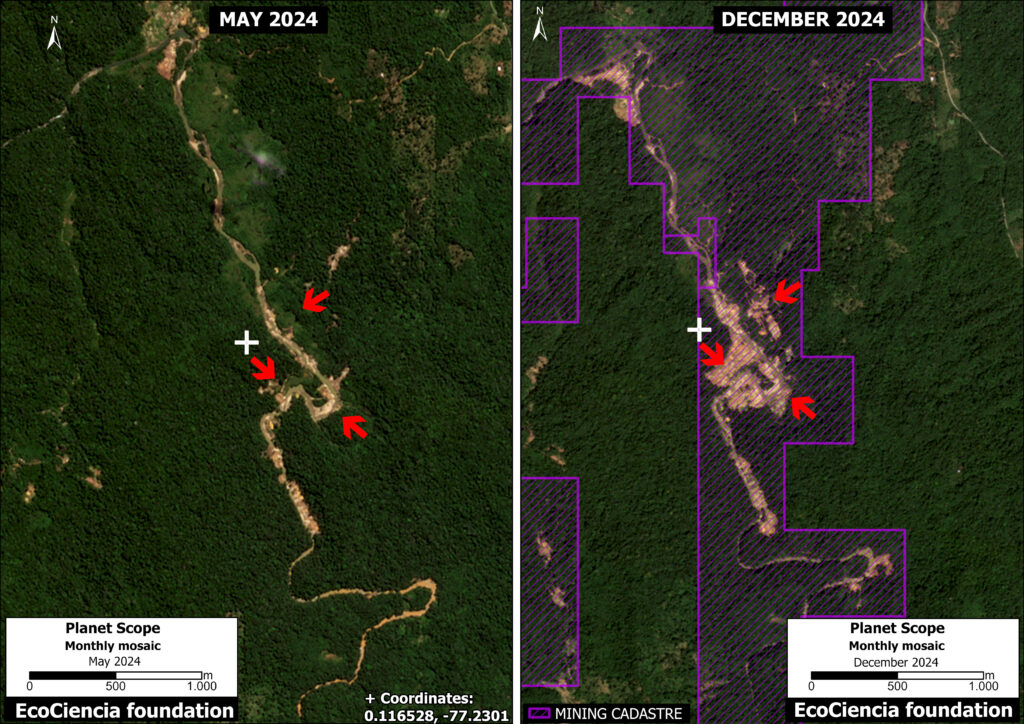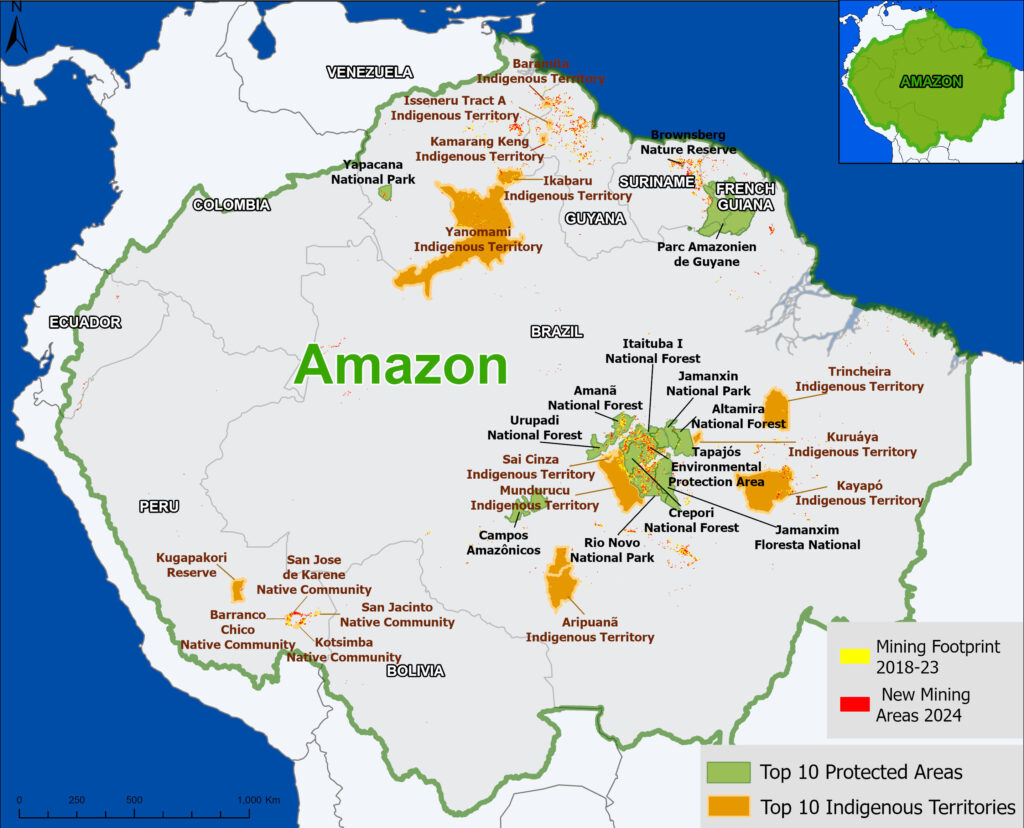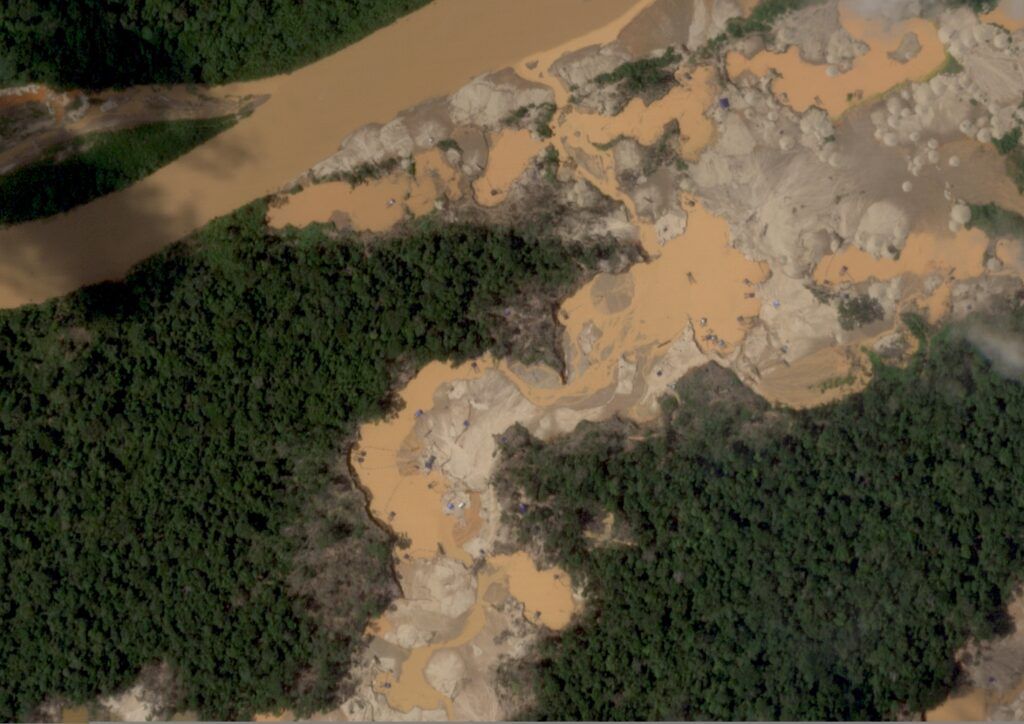
Image 1. Recent expansion of illegal gold mining in Tambopata National Reserve. Data: ACCA, Planet.
Gold mining has been a notorious driver of deforestation in the southern Peruvian Amazon for several decades. This mining-related deforestation reached crisis levels in the mid-2010s, particularly affecting Tambopata National Reserve and its buffer zone (see MAAP #96 from January 2019). This situation led to the major government operation known as “Operation Mercury” in February 2019, and a subsequent initiative known as the “Restoration Plan” in 2021.
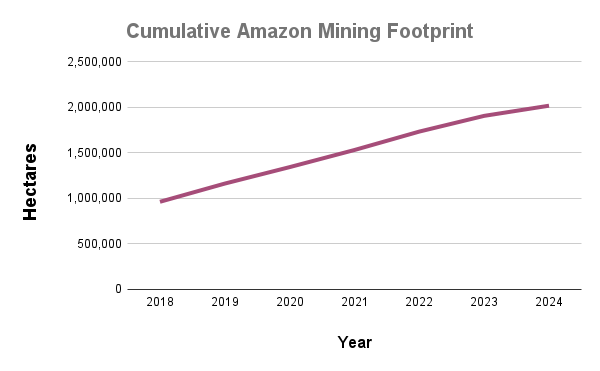
After a period of reduced mining activity due to Operation Mercury and the Restoration Plan, illegal gold mining has resumed an alarming expansion within Tambopata National Reserve, primarily during the second half of 2025 and early 2026 (see Graph 1 below).
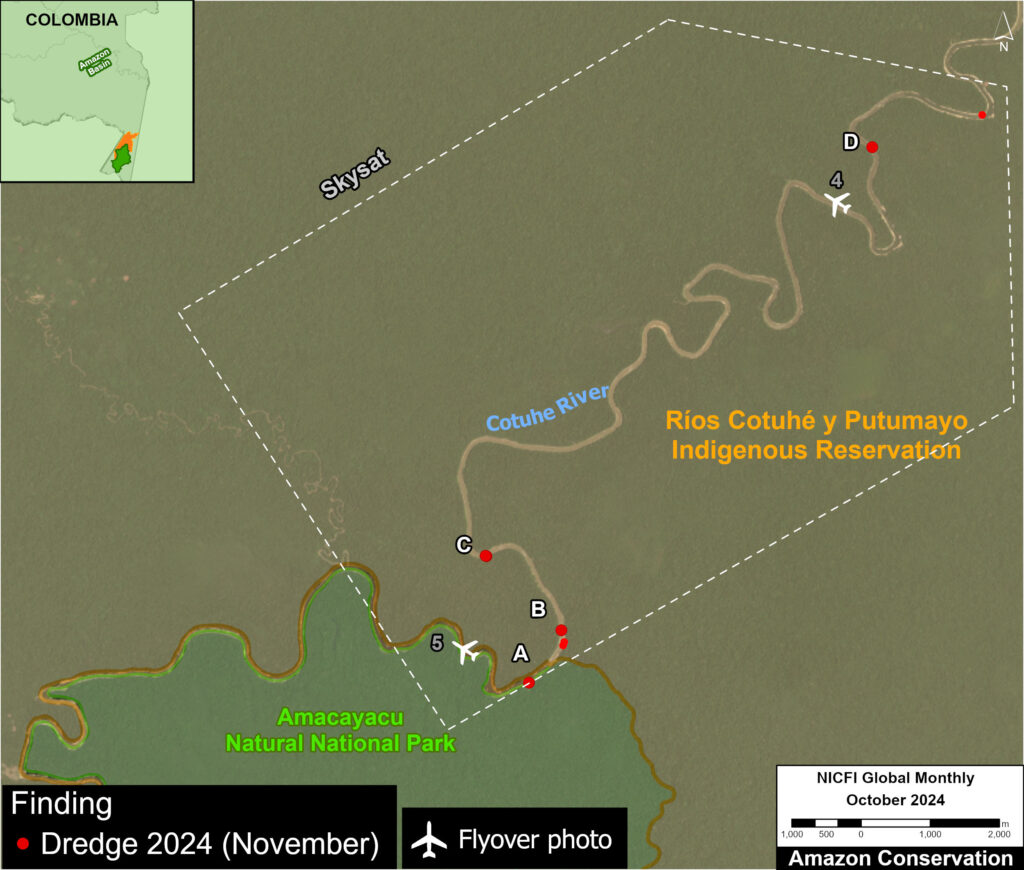
During this recent period (2025–26), we find that a total area of 500 hectares was deforested due to illegal mining in the northern part of the Reserve along the Malinowski River, which forms part of its northern boundary (see Base Map below).
Analyzing very high-resolution satellite imagery (Planet’s SkySat, 0.5m), we detected a total of 183 mining structures (such as heavy equipment and excavators) and 67 mining camps across five mining zones within the northern part of Tambopata National Reserve, as of February 2026.
Based on this finding, we estimate that around 1,000 people are currently involved in illegal mining activities in the Reserve, using a conversion factor derived from the machinery and camps detected within the mining zones (ACCA, 2022).
In response to this situation, the Peruvian government has initiated several actions in early 2026 (January – March) to address the expanding invasion of illegal mining within Tambopata National Reserve. Through coordination between police and military institutions, these interventions have resulted in the seizure and destruction of machinery, equipment, and encampments used in illegal mining activities within the Reserve (Joint Command of the Armed Forces, 2026).
Below, we present:
- Annual mining deforestation trends in Tambopata National Reserve (2016–2025);
.
- Four case studies featuring satellite imagery to illustrate the most recent mining expansion within the Reserve.
.
- 5 pillars of public policy regarding illegal mining in Tambopata National Reserve, including enforcement operations and state limitations; legislative setbacks and threats; and the 2026 political election.
Annual Mining Deforestation in Tambopata National Reserve
Graph 1 shows annual mining deforestation within Tambopata National Reserve for the period 2016–2025. The main ecosystems affected by this mining activity were the Alluvial Floodplain Forest and Non-Floodplain Terrace Forest.
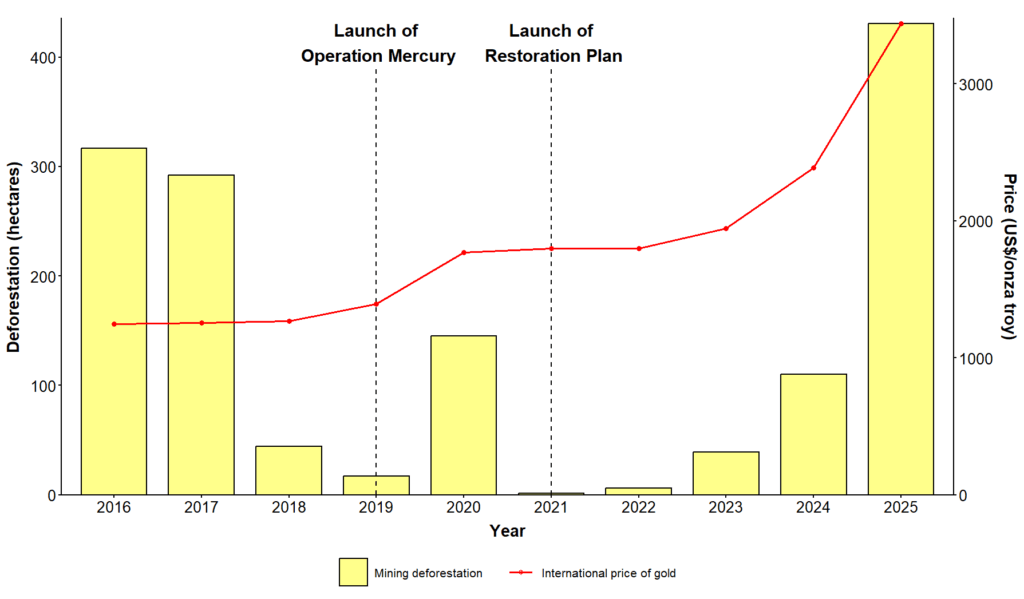
Graph 1. Mining Deforestation in Tambopata National Reserve. Data: ACA, ACCA, BCRP, CINCIA, MapBiomas Perú.
During this period, three key events stand out:
First, Operation Mercury—a multisectoral intervention against illegal mining in critical zones of the Madre de Dios region, carried out in early 2019—resulted in a major reduction that same year compared to 2016 and 2017, when higher levels of mining expansion were recorded. During 2017 and 2018, a series of operations and interdictions were launched in the region that helped combat the advance of illegal mining (AIDER, 2021). Coupled with these actions, the success of Operation Mercury led to a substantial reduction in mining expansion within the Tambopata National Reserve and its buffer zone (MAAP #104, MAAP #121).
Second, the “Restoration Plan“—a series of military interventions conducted in 2021 in critical illegal mining zones within the southern Peruvian Amazon—also resulted in a major decrease in mining deforestation that same year, compared to the previous year. In 2020, due to the COVID-19 pandemic, difficulties arose regarding the execution of operations and patrols within Tambopata National Reserve and its buffer zone, leading to a reduction in police and military presence in key sectors (AIDER, 2021; DAR, 2023; Vadillo, 2022). Consequently, instances of illegal miners re-entering Tambopata were recorded (Romo, 2020). In response, the renewed military operations successfully combated the expansion of illegal mining activity in the Madre de Dios region, including Tambopata.
Thirdly, during 2025-early 2026, we recorded an alarming gold mining deforestation expansion (500 hectares), surpassing the figures registered during the critical years of 2016 and 2017 that led up to Operation Mercury. This sudden increase was likely driven by the exponential rise in the international price of gold (see red line in Graph 1). Thus, it is likely that the sustained rise in gold prices has influenced the expansion of illegal mining in recent years by boosting the expected profitability derived from the trade of extracted ore.
Base Map & Case Studies
The Base Map displays the recent expansion of 500 hectares deforested by illegal mining within Tambopata National Reserve during the second half of 2025 (431 hectares) and early 2026 (69 hectares through February). Mining activity is concentrated in the northwestern part of the Reserve, in areas adjacent to the Malinowski River. Furthermore, it has been identified that this illegal activity is taking place in the vicinity of several of the Reserve’s surveillance posts. Insets A–D indicate the location of the four case studies.
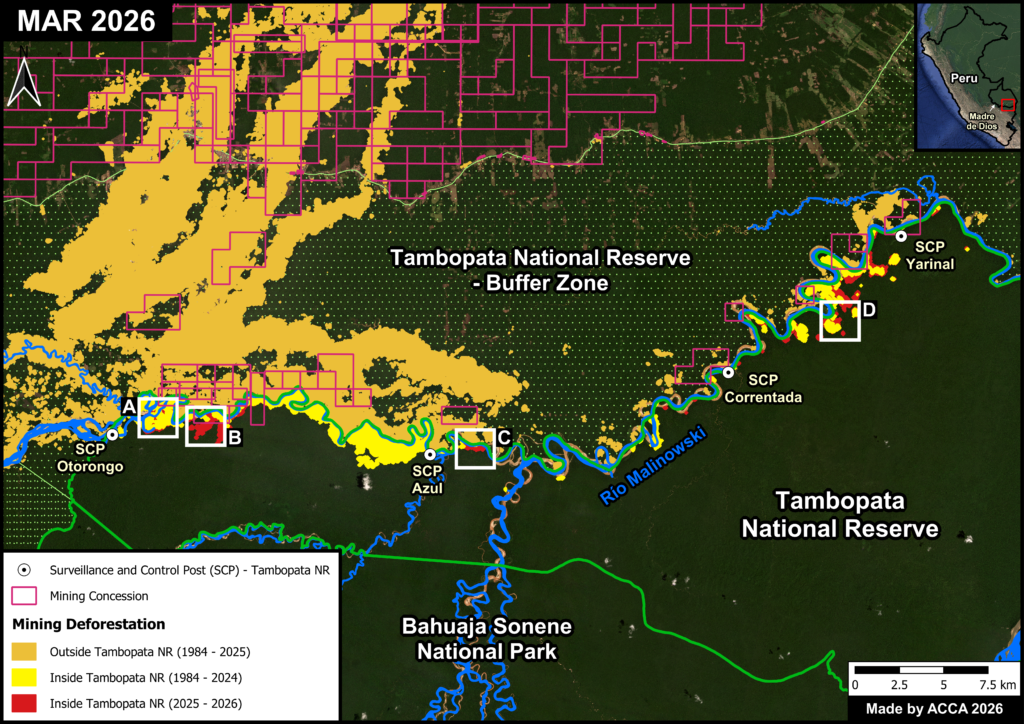
Base Map. Illegal Gold Mining Activity in the Tambopata National Reserve. Data: ACA, ACCA, CINCIA, MapBiomas Perú.
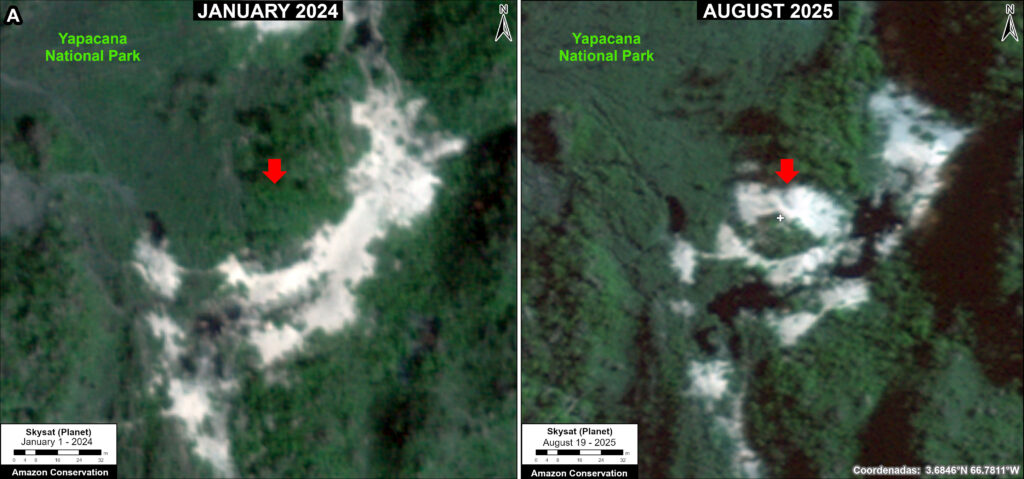
Case Study A. Sector Isla Córdoba
In this area, located in the northwest corner of Tambopata National Reserve (see Box A in the Base Map), we recorded 106 hectares of mining deforestation between January 2025 and January 2026 (Figure A1). Note that this mining zone is situated near the Reserve’s Otorongo surveillance and control post (see Base Map).
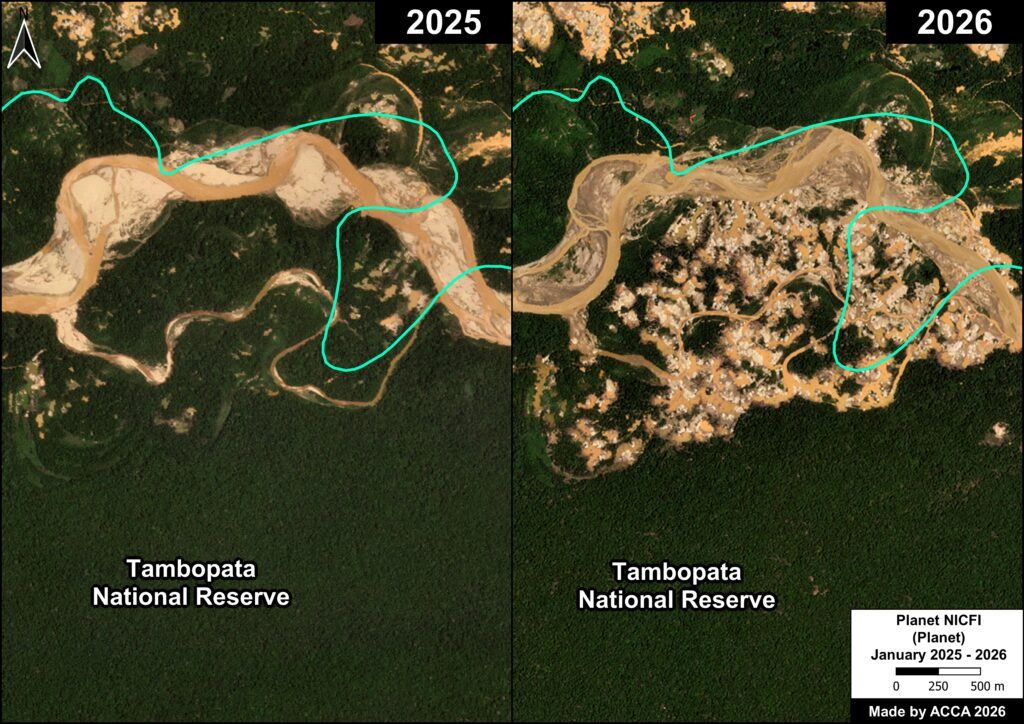
Figure A1. Mining deforestation in the Isla Córdoba sector of Tambopata National Reserve. Data: ACCA, Planet.
Figure A2 shows that a large portion of this deforestation (80%) occurred between July and December 2025 (indicated in orange) and continued to expand until early 2026 (red). This sector has recorded mining activity in previous years (blue), primarily between 2017 and 2018. As part of the actions undertaken during Operation Mercury in 2019, military operations were carried out to intervene in the mining zones located within this sector, achieving a reduction in the expansion of illegal mining during this period (Salazar, 2024).
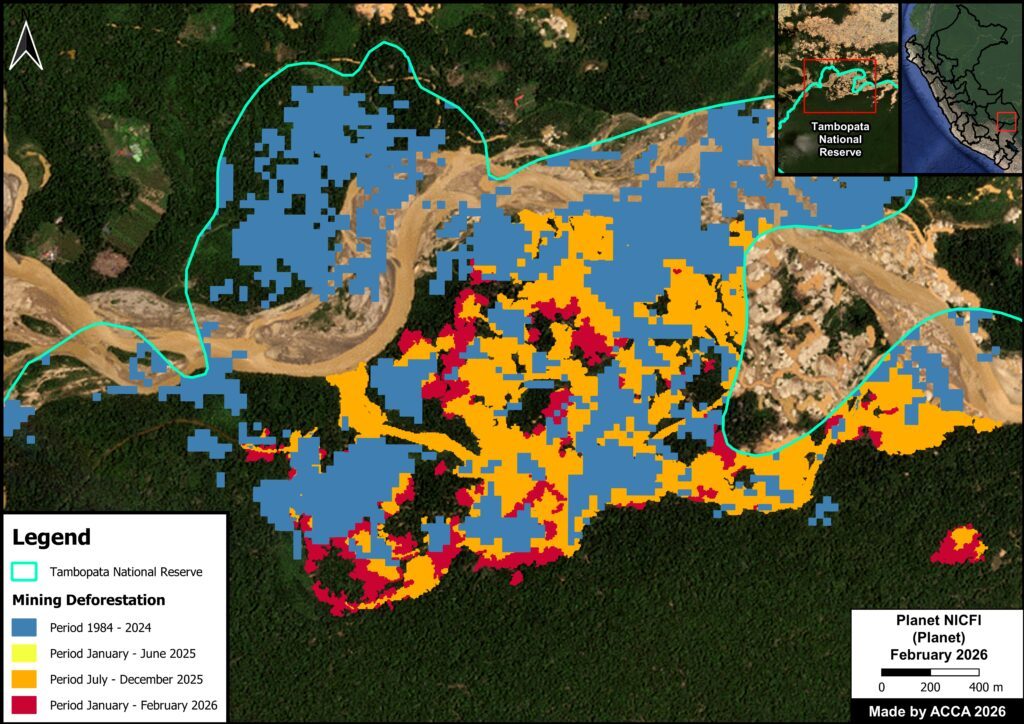
Figure A2. Mining deforestation in the Isla Córdoba sector of Tambopata National Reserve. Data: ACCA, Planet.
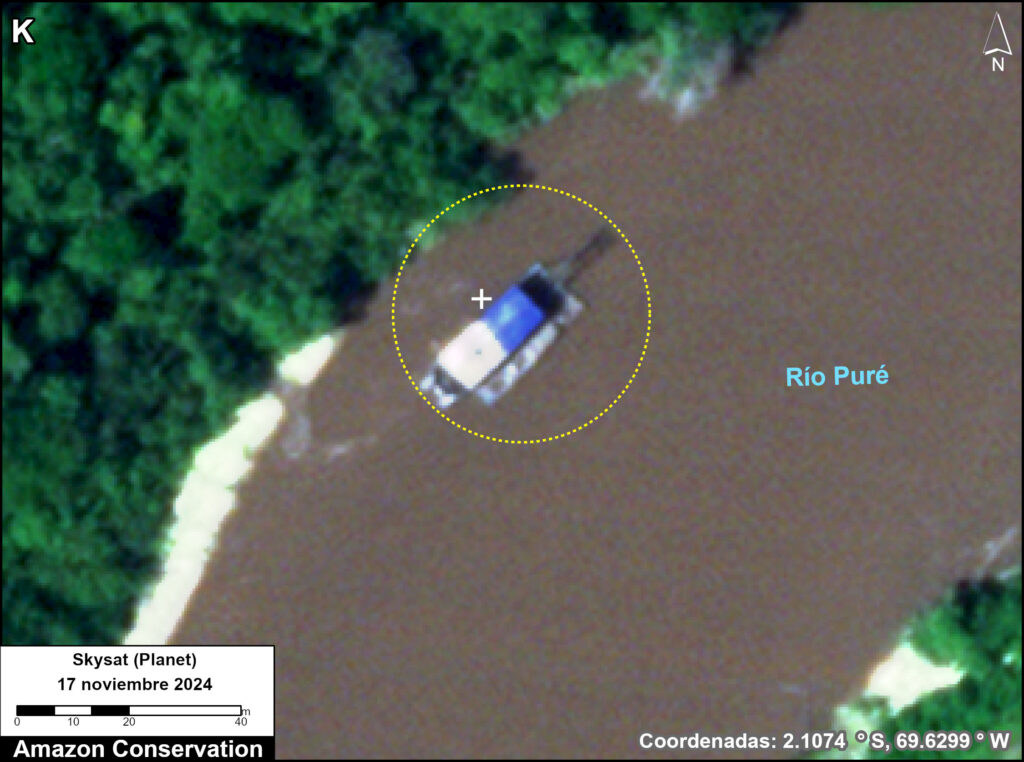
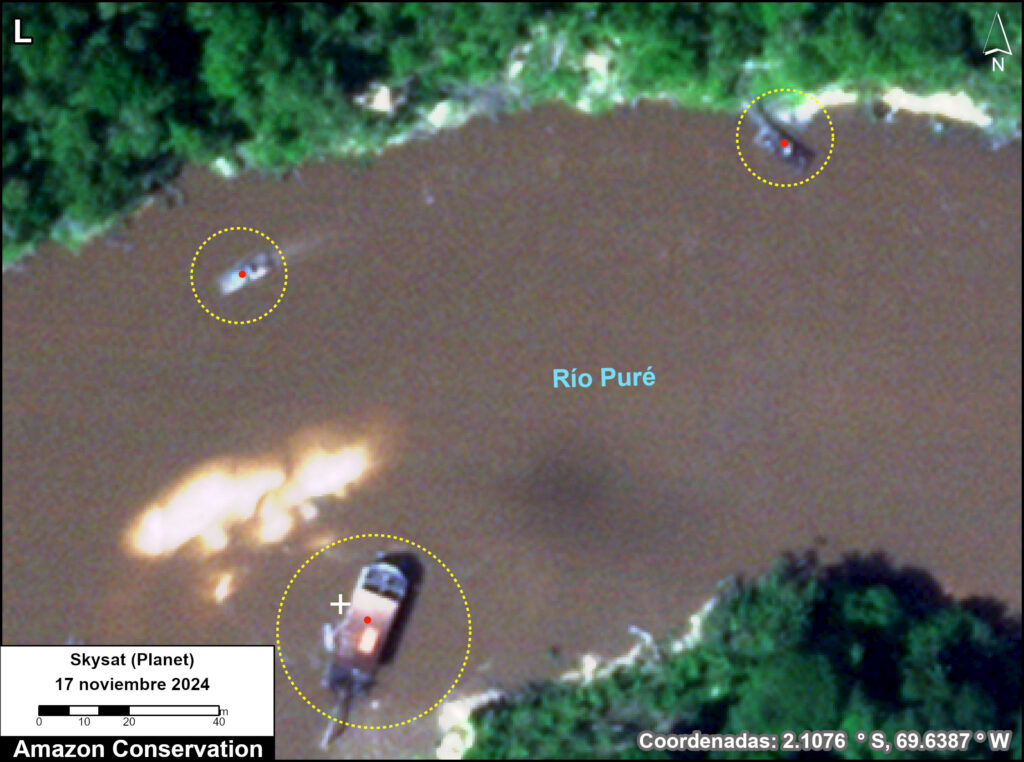
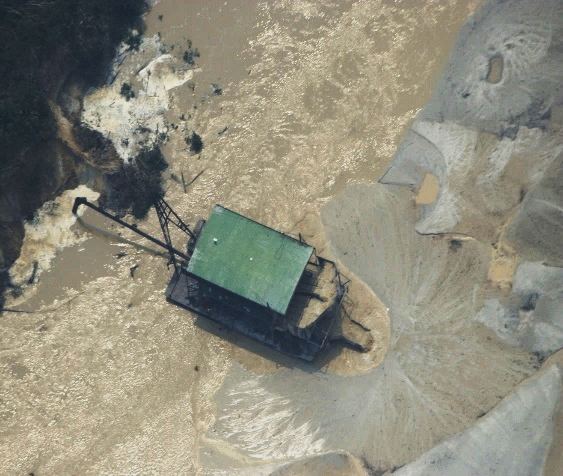
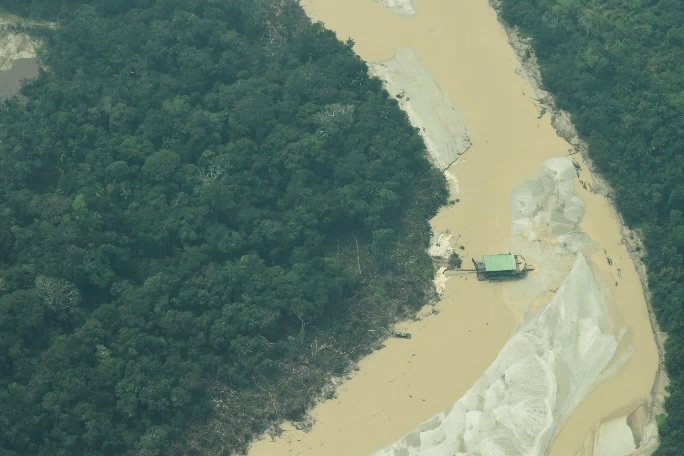
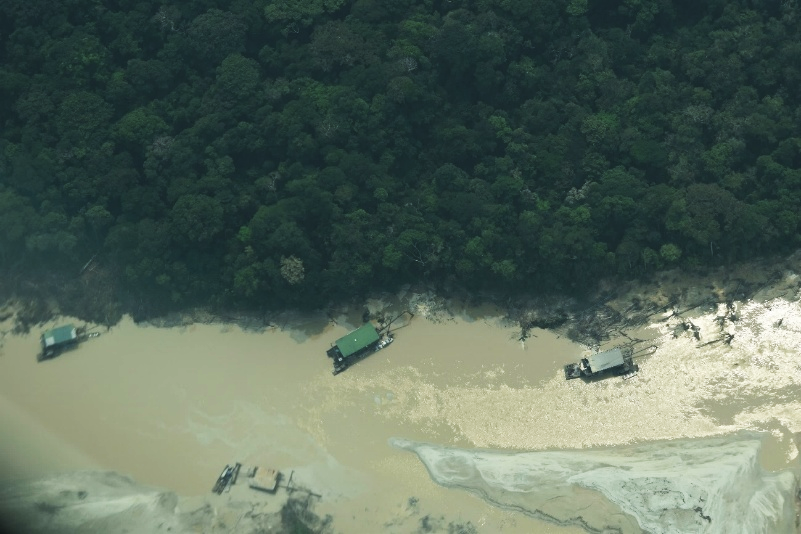
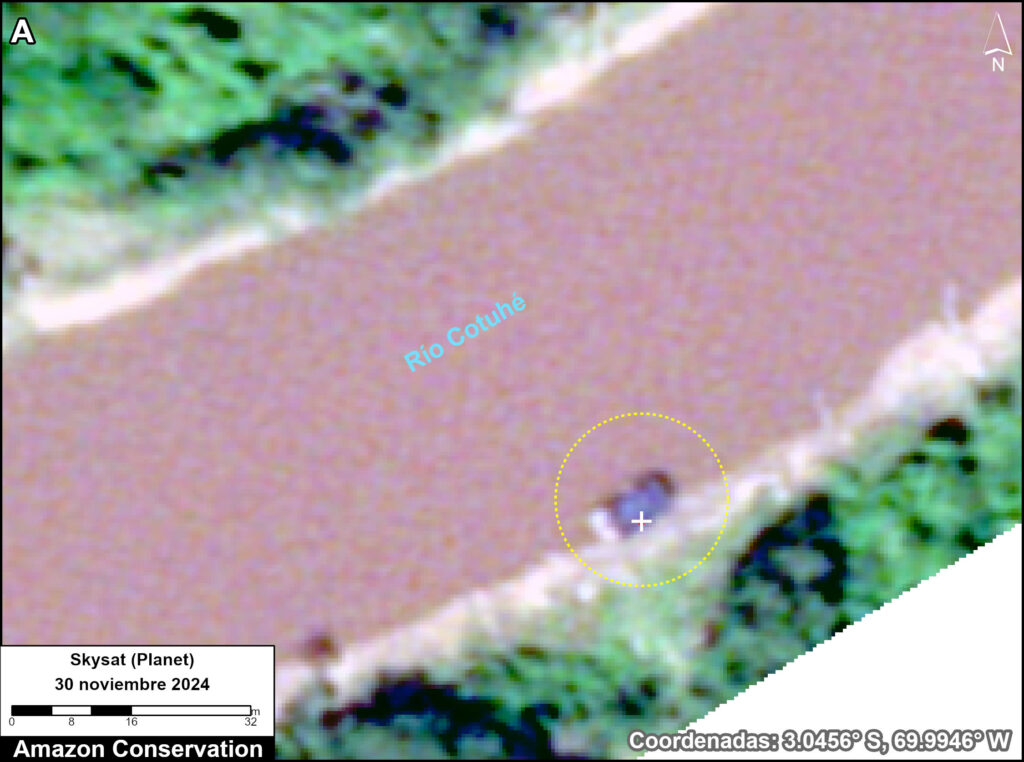
The presence of gold mining infrastructure has expanded into the various pools located in this sector, with a total of 53 dredges and 20 mining camps recorded in February 2026 (Figure A3).
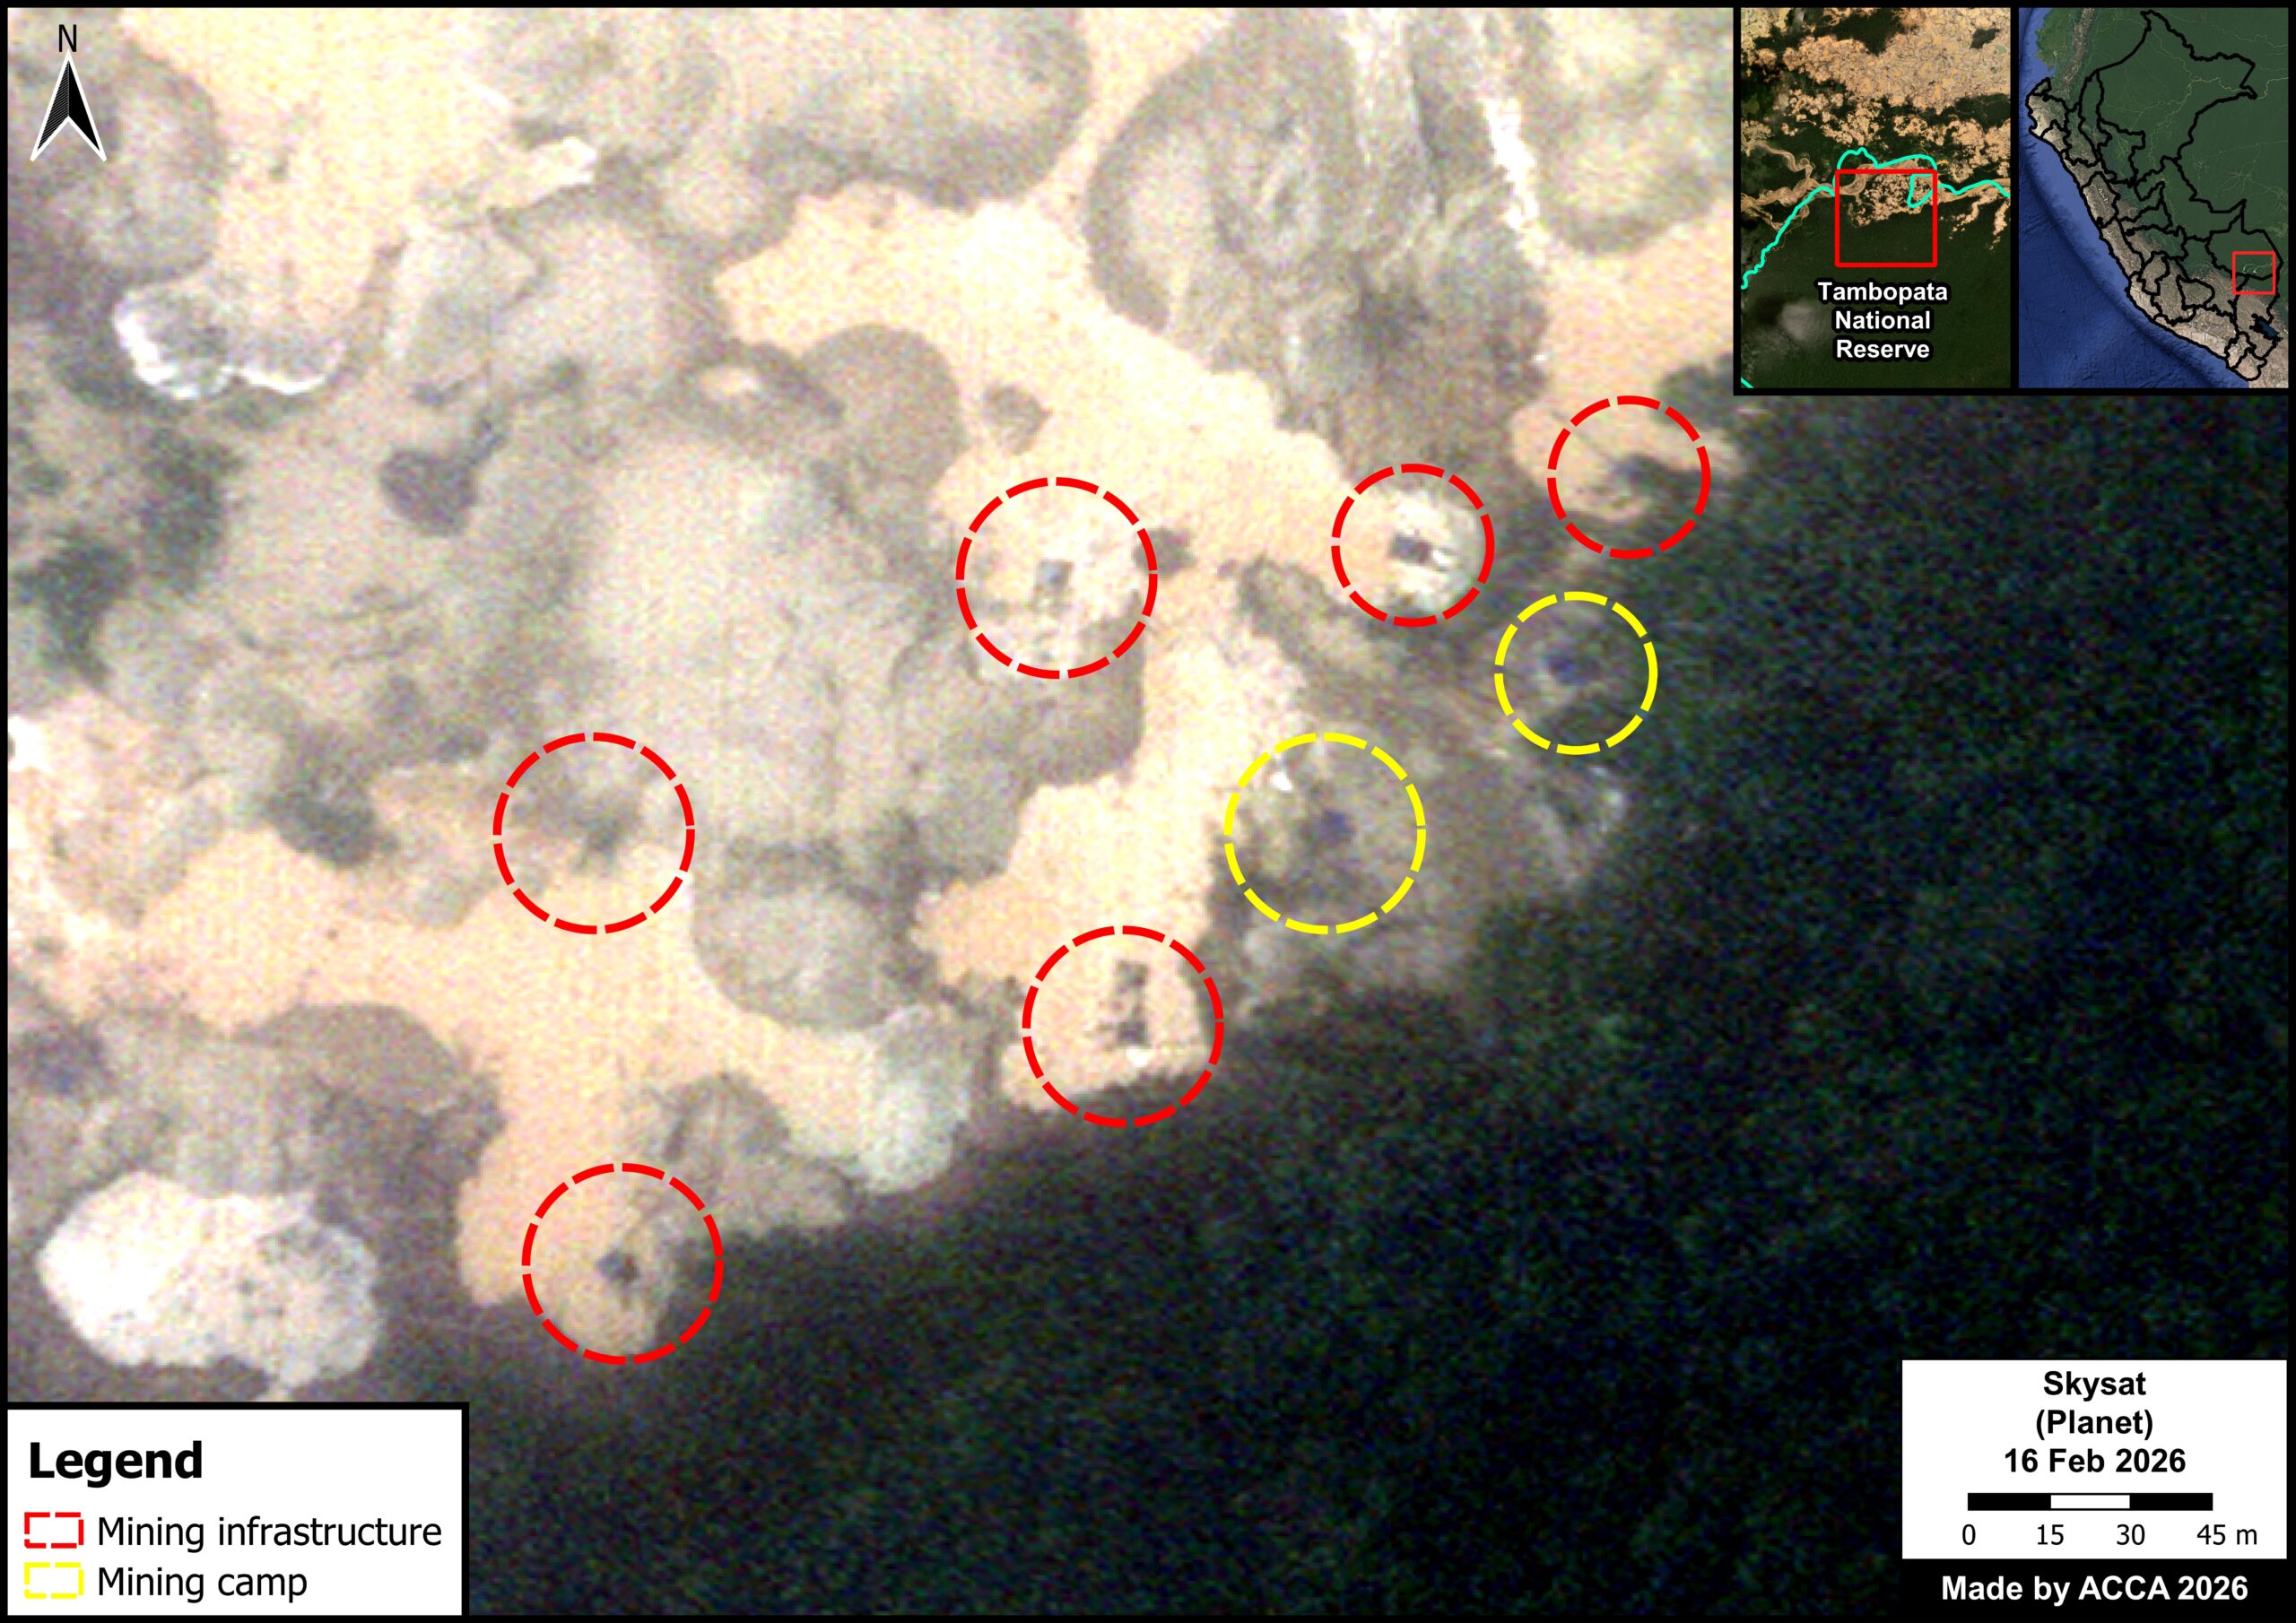
Figure A3. Mining infrastructure in the Isla Córdoba sector of Tambopata National Reserve. Data: ACCA, Planet.
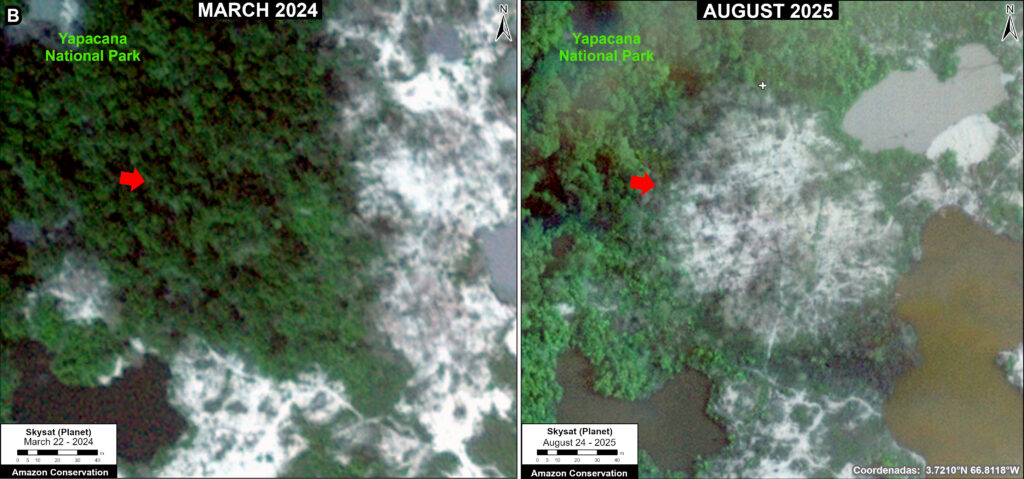
Case Study B. Sector A4
In this area, also located in the northwest corner of Tambopata National Reserve (see Box B on the Base Map), we recorded 101 hectares of mining deforestation between February 2025 and February 2026 (Figure B1).
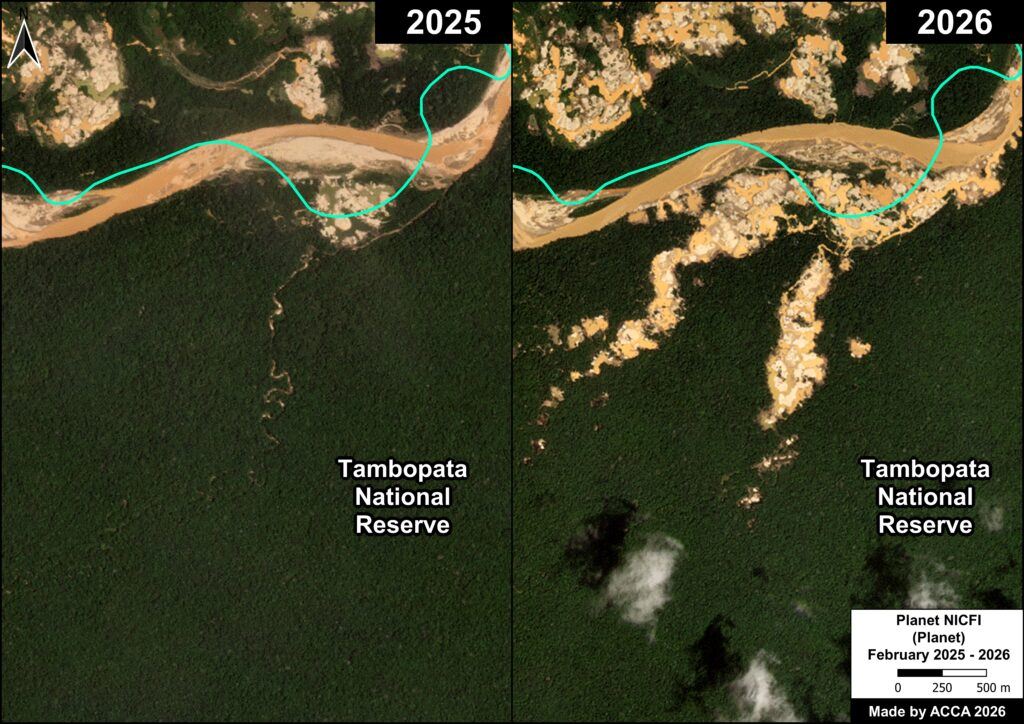
Figure B1. Mining deforestation in Sector A4 of Tambopata National Reserve. Data: ACCA, Planet.
Figure B2 shows that, in early 2025, we detected the expansion of the first mining zones in this sector into the interior of Tambopata National Reserve (indicated yellow). Subsequently, between July and December 2025, an increase of 83 hectares of mining activity was recorded (orange), representing 82% of the total recorded. This increase in mining activity continued until early 2026 (red), expanding further into the interior of the Reserve.
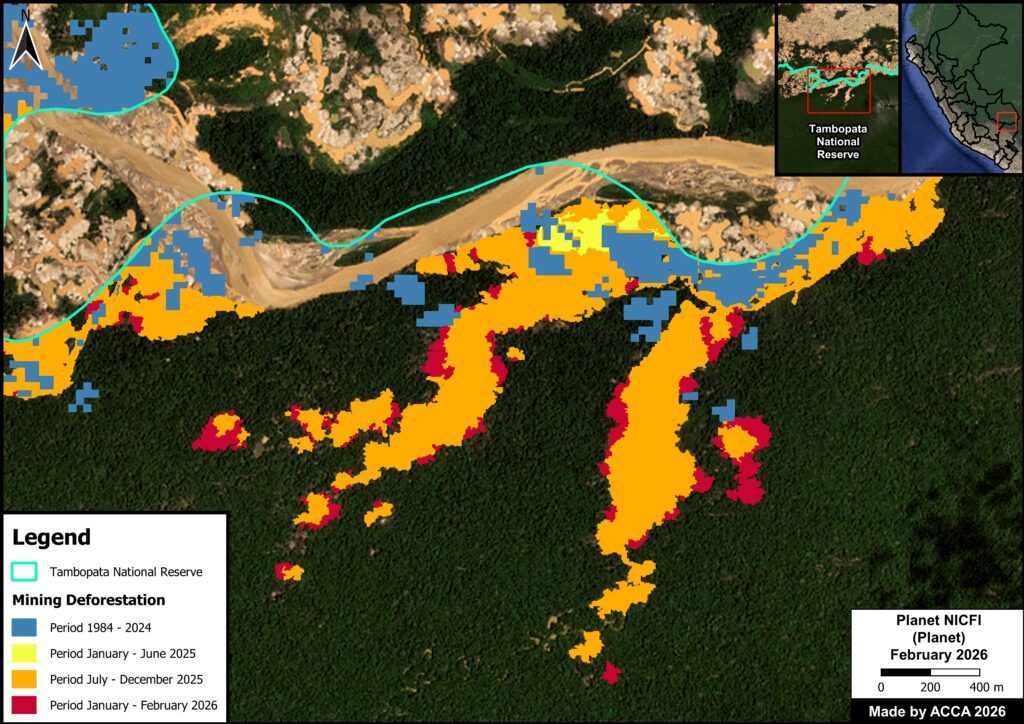
Figure B2. Data: ACCA, Planet
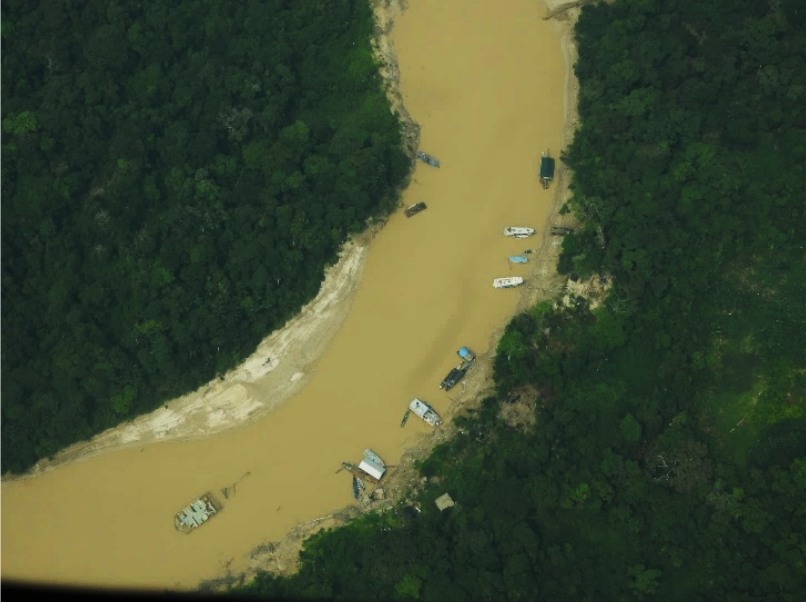
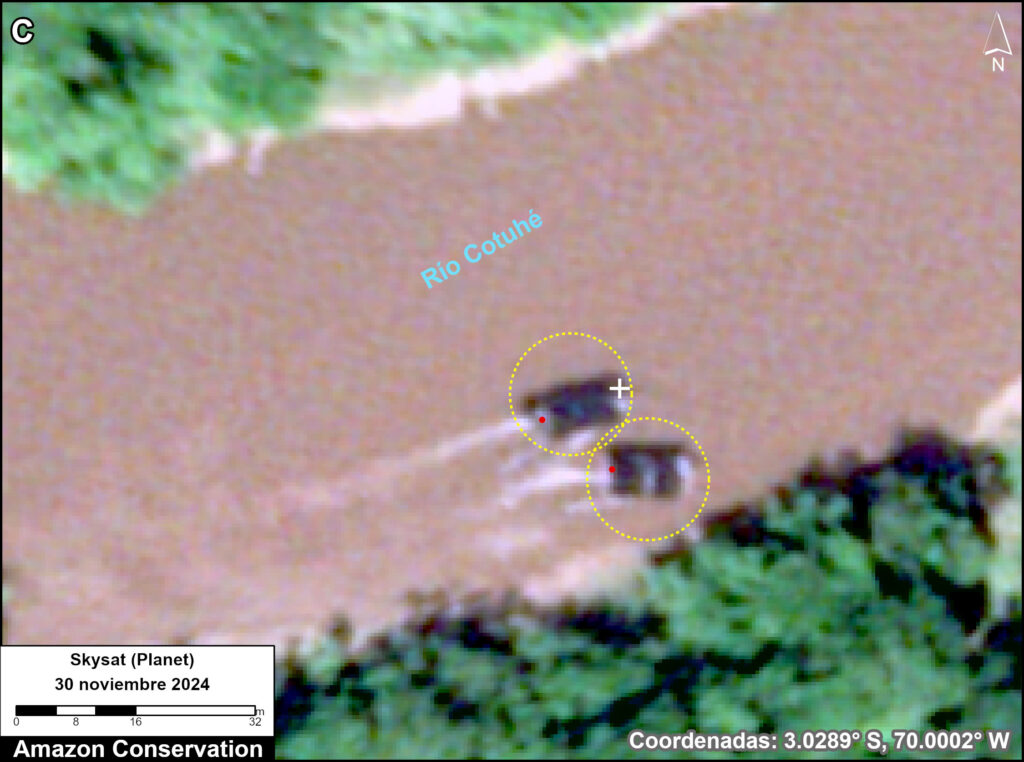
In this sector, we recorded 68 mining structures located within pits, as well as the presence of 33 mining camps, in February 2026 (Figure B3). The number of structures identified in this zone was higher compared to the other sectors analyzed.
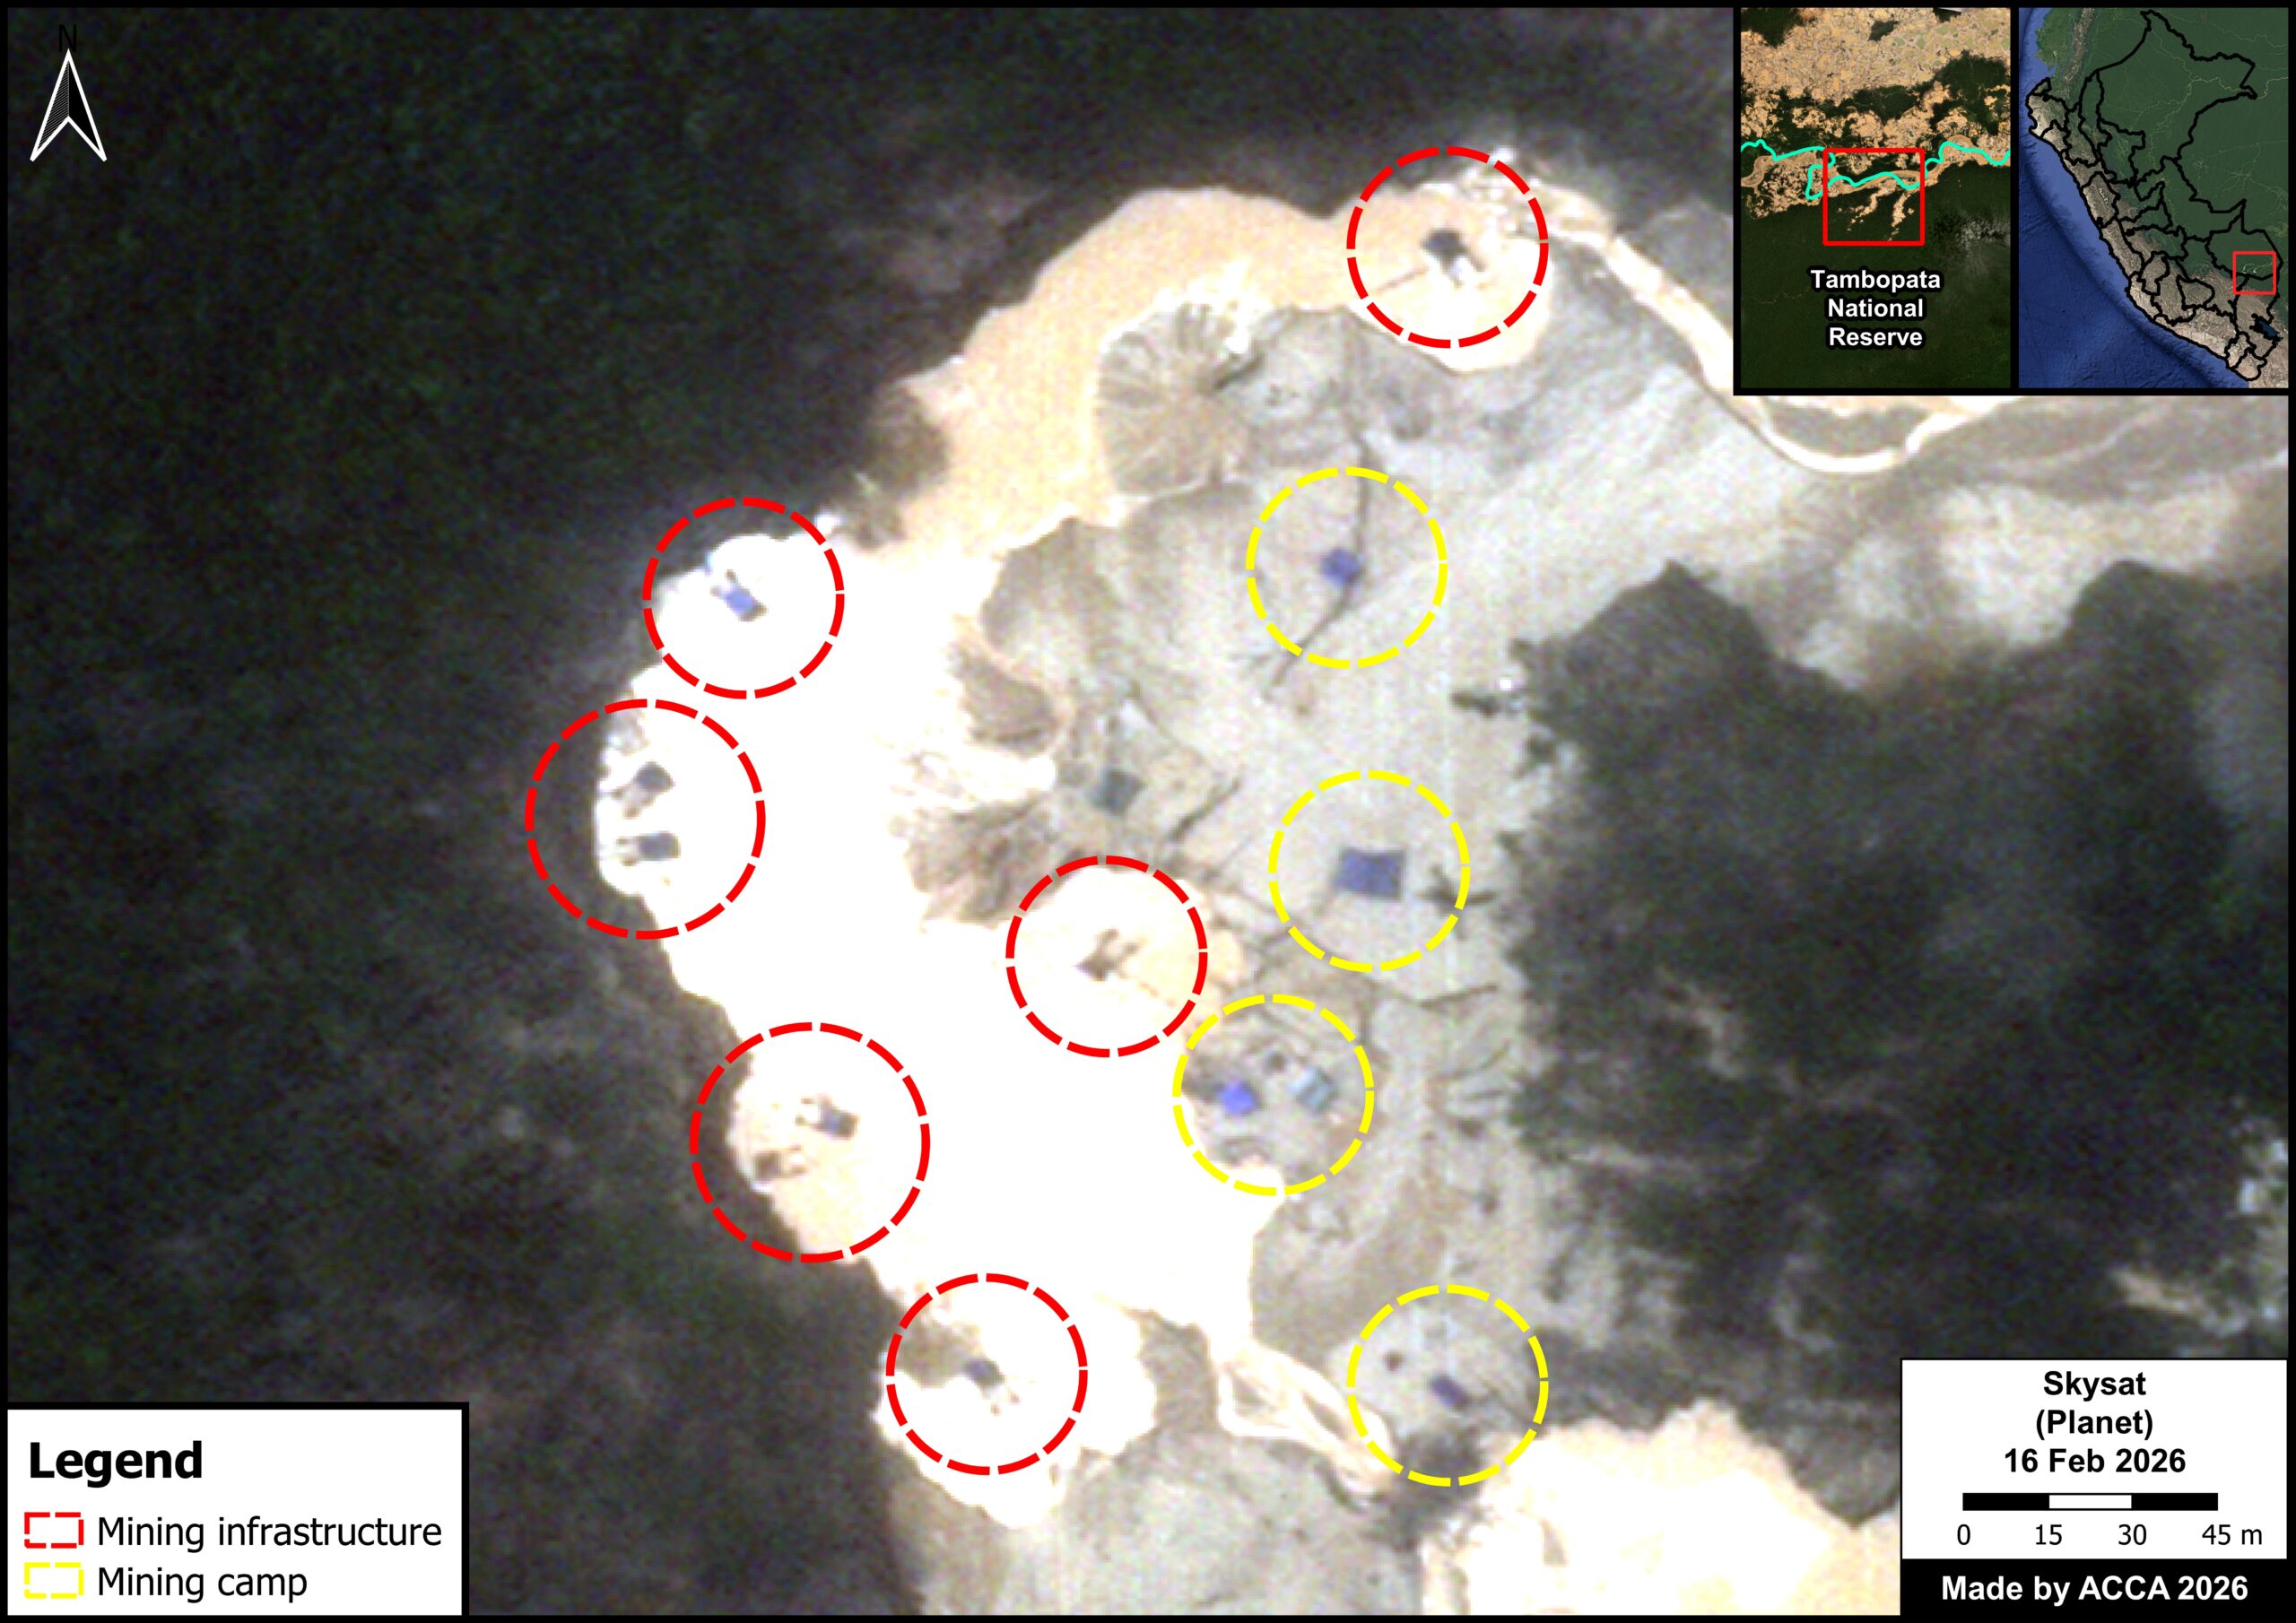
Figure B3. Mining infrastructure in Sector A4 of Tambopata National Reserve. Data: ACCA, Planet.
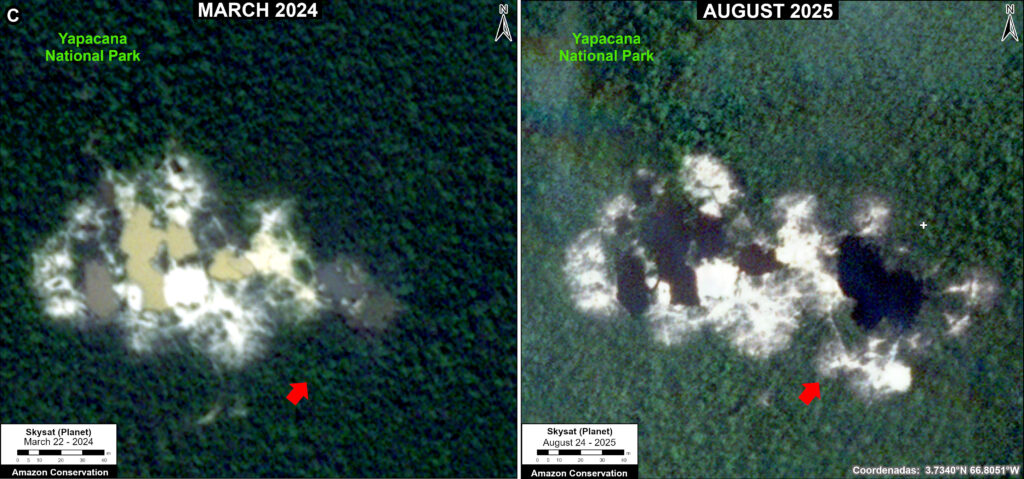
Caso Study C. Sector A7
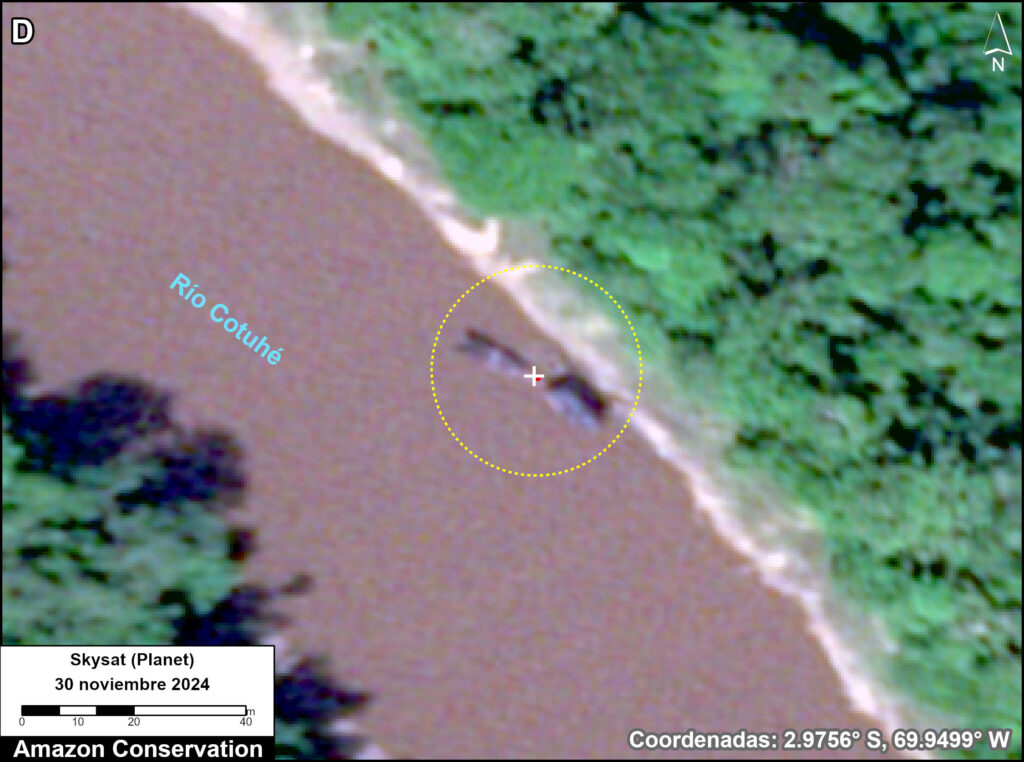
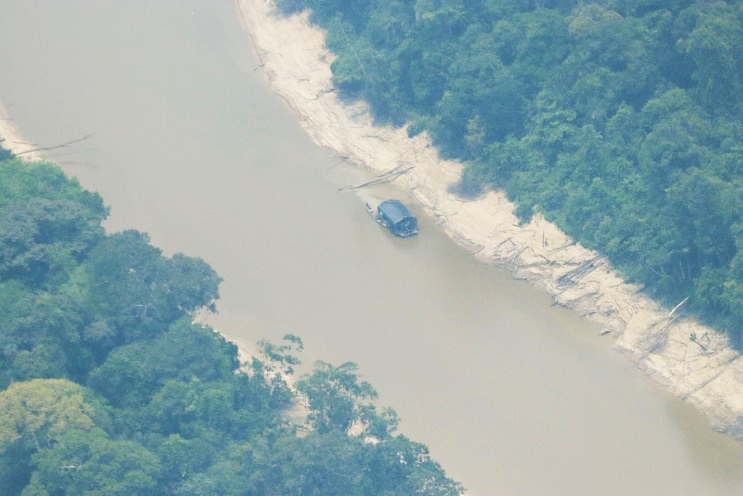
In this area, located in the northern part of Tambopata National Reserve (see Box C on the Base Map), we recorded 25 hectares of mining deforestation between February 2025 and February 2026 along the Malinowski River (Figure C1). This new mining zone is situated near the Azul surveillance and control post (see Base Map).
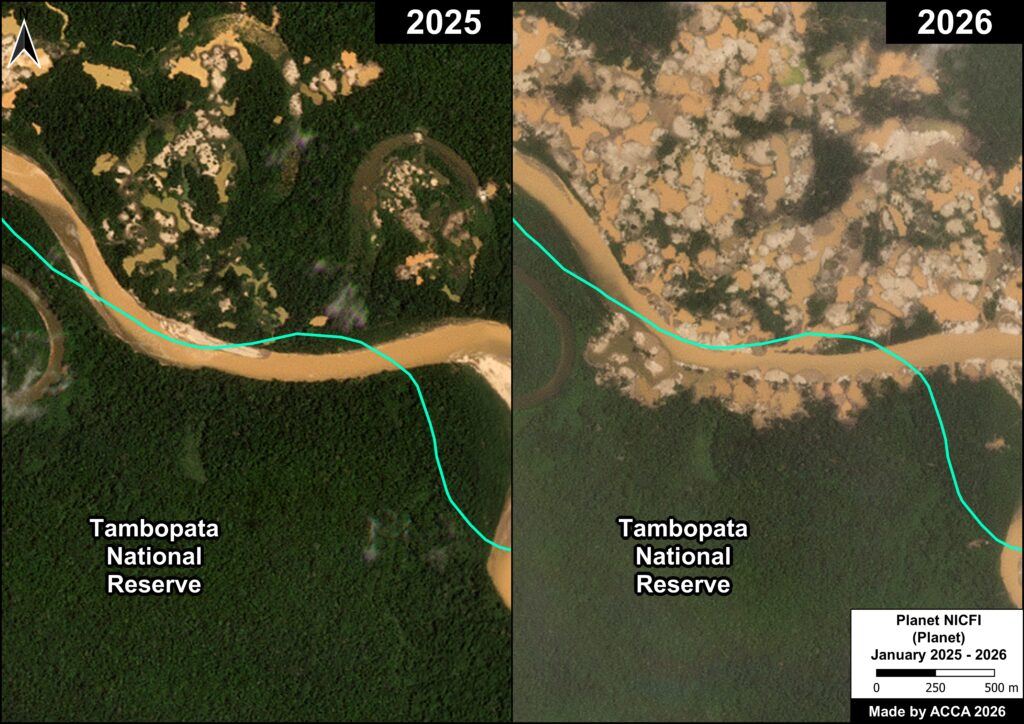
Figure C1. Mining deforestation in Sector A7 of Tambopata National Reserve. Data: ACCA, Planet.
Figure C2 shows that mining began in the second half of 2025 (indicated in orange), marked by the presence of a mining pit adjacent to the Malinowski River, and subsequently expanded over the following months. In 2026 (red), we recorded an increase of 17 hectares, representing 68% of total deforestation. No mining infrastructure was recorded in this sector due to the lack of available very high-resolution satellite imagery for 2026.
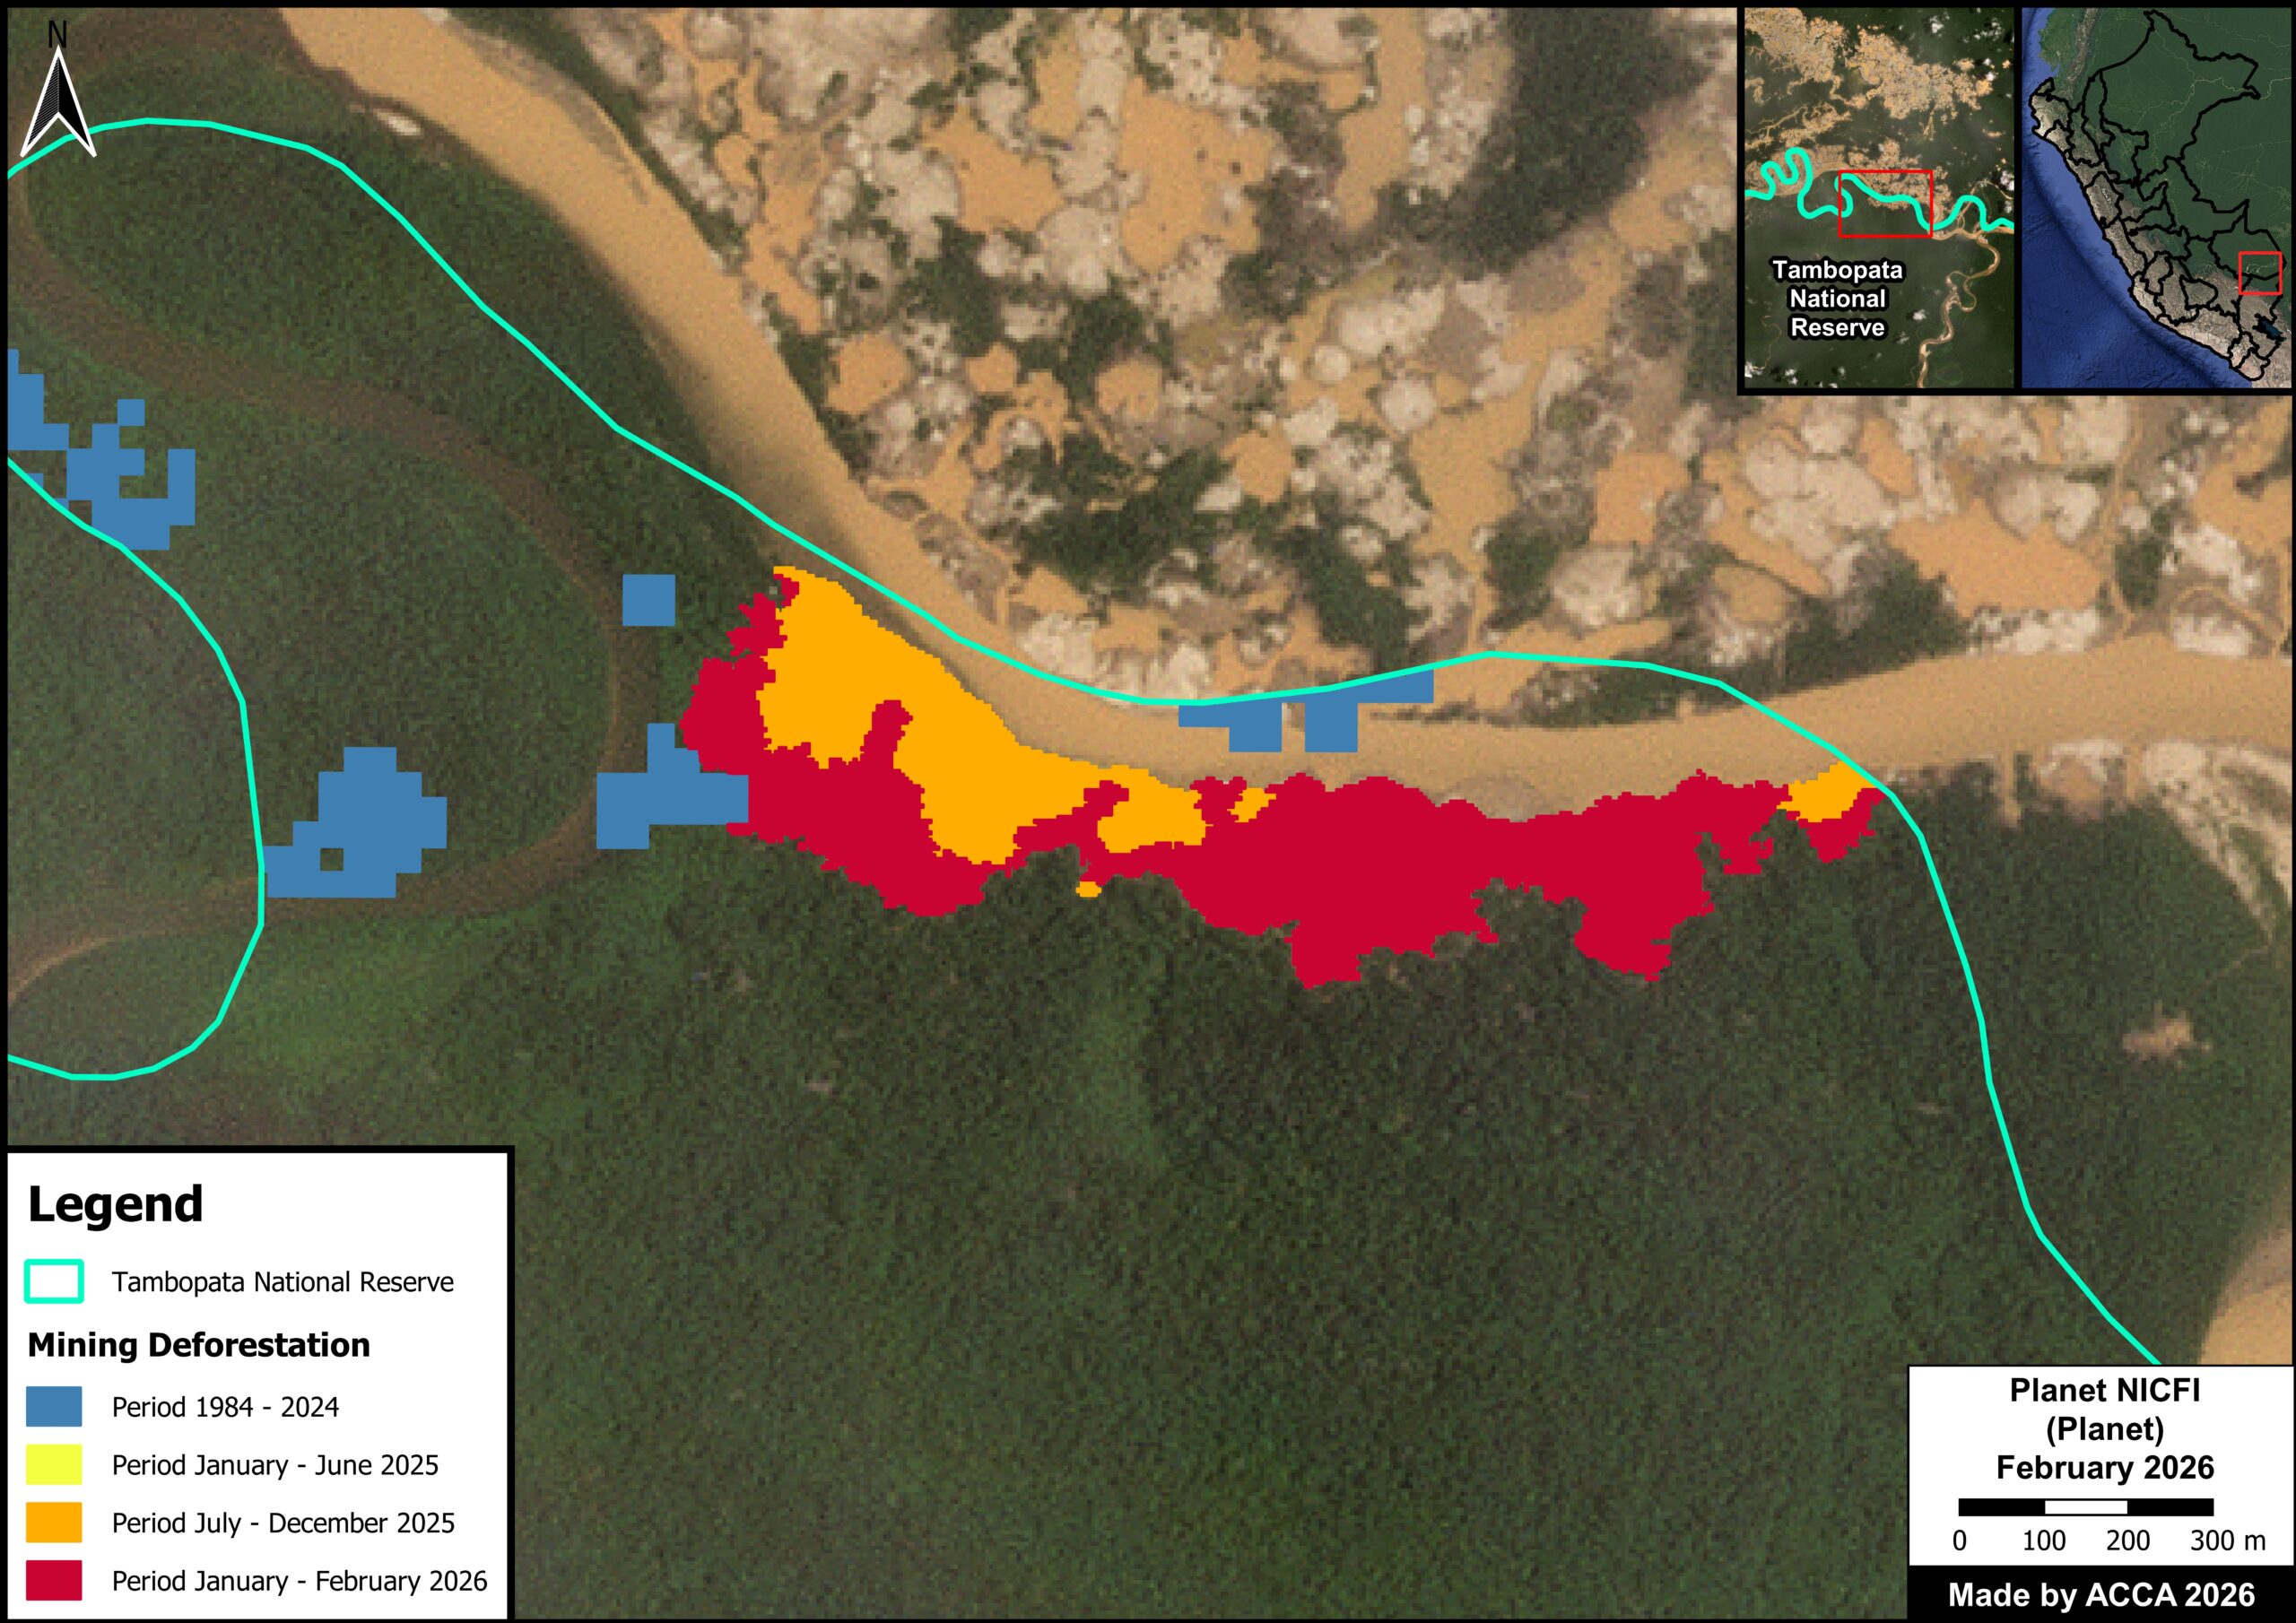
Figure C2. Mining deforestation in Sector A7 of Tambopata National Reserve. Data: ACCA, Planet.
Case Study D. Sector Isla Correntada
In this area, located in the northeast of Tambopata National Reserve (see inset D on the Base Map), we recorded 111 hectares of mining deforestation between January 2025 and January 2026 (Figure D1). This mining zone is situated near the Yarinal surveillance and control post (see Base Map).
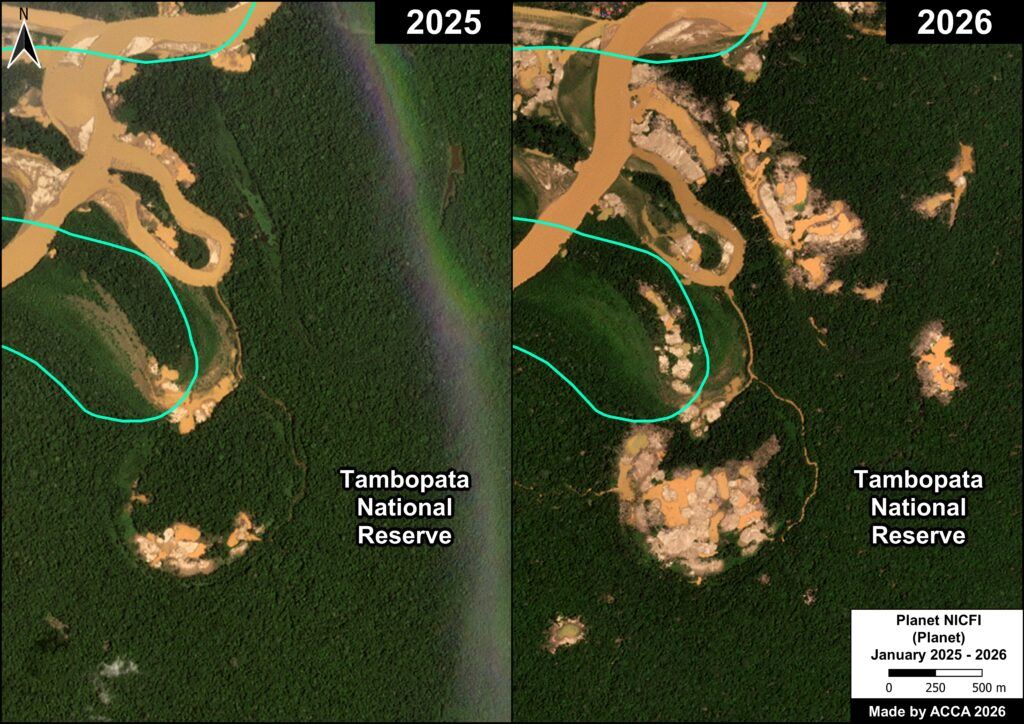
Figure D1. Mining deforestation in the Isla Correntada sector of Tambopata National Reserve. Data: ACCA, Planet.
Figure D2 shows that mining began expanding slightly during the January–June 2025 period (indicated in yellow). Subsequently, an advancement of mining activity was detected starting in July 2025. The expansion of mining was greatest during the July–December 2025 period, during which a total of 85 hectares of deforestation were recorded (orange), representing 76% of the total. As of 2026, mining continues to expand in various zones within the Isla Correntada sector (red).
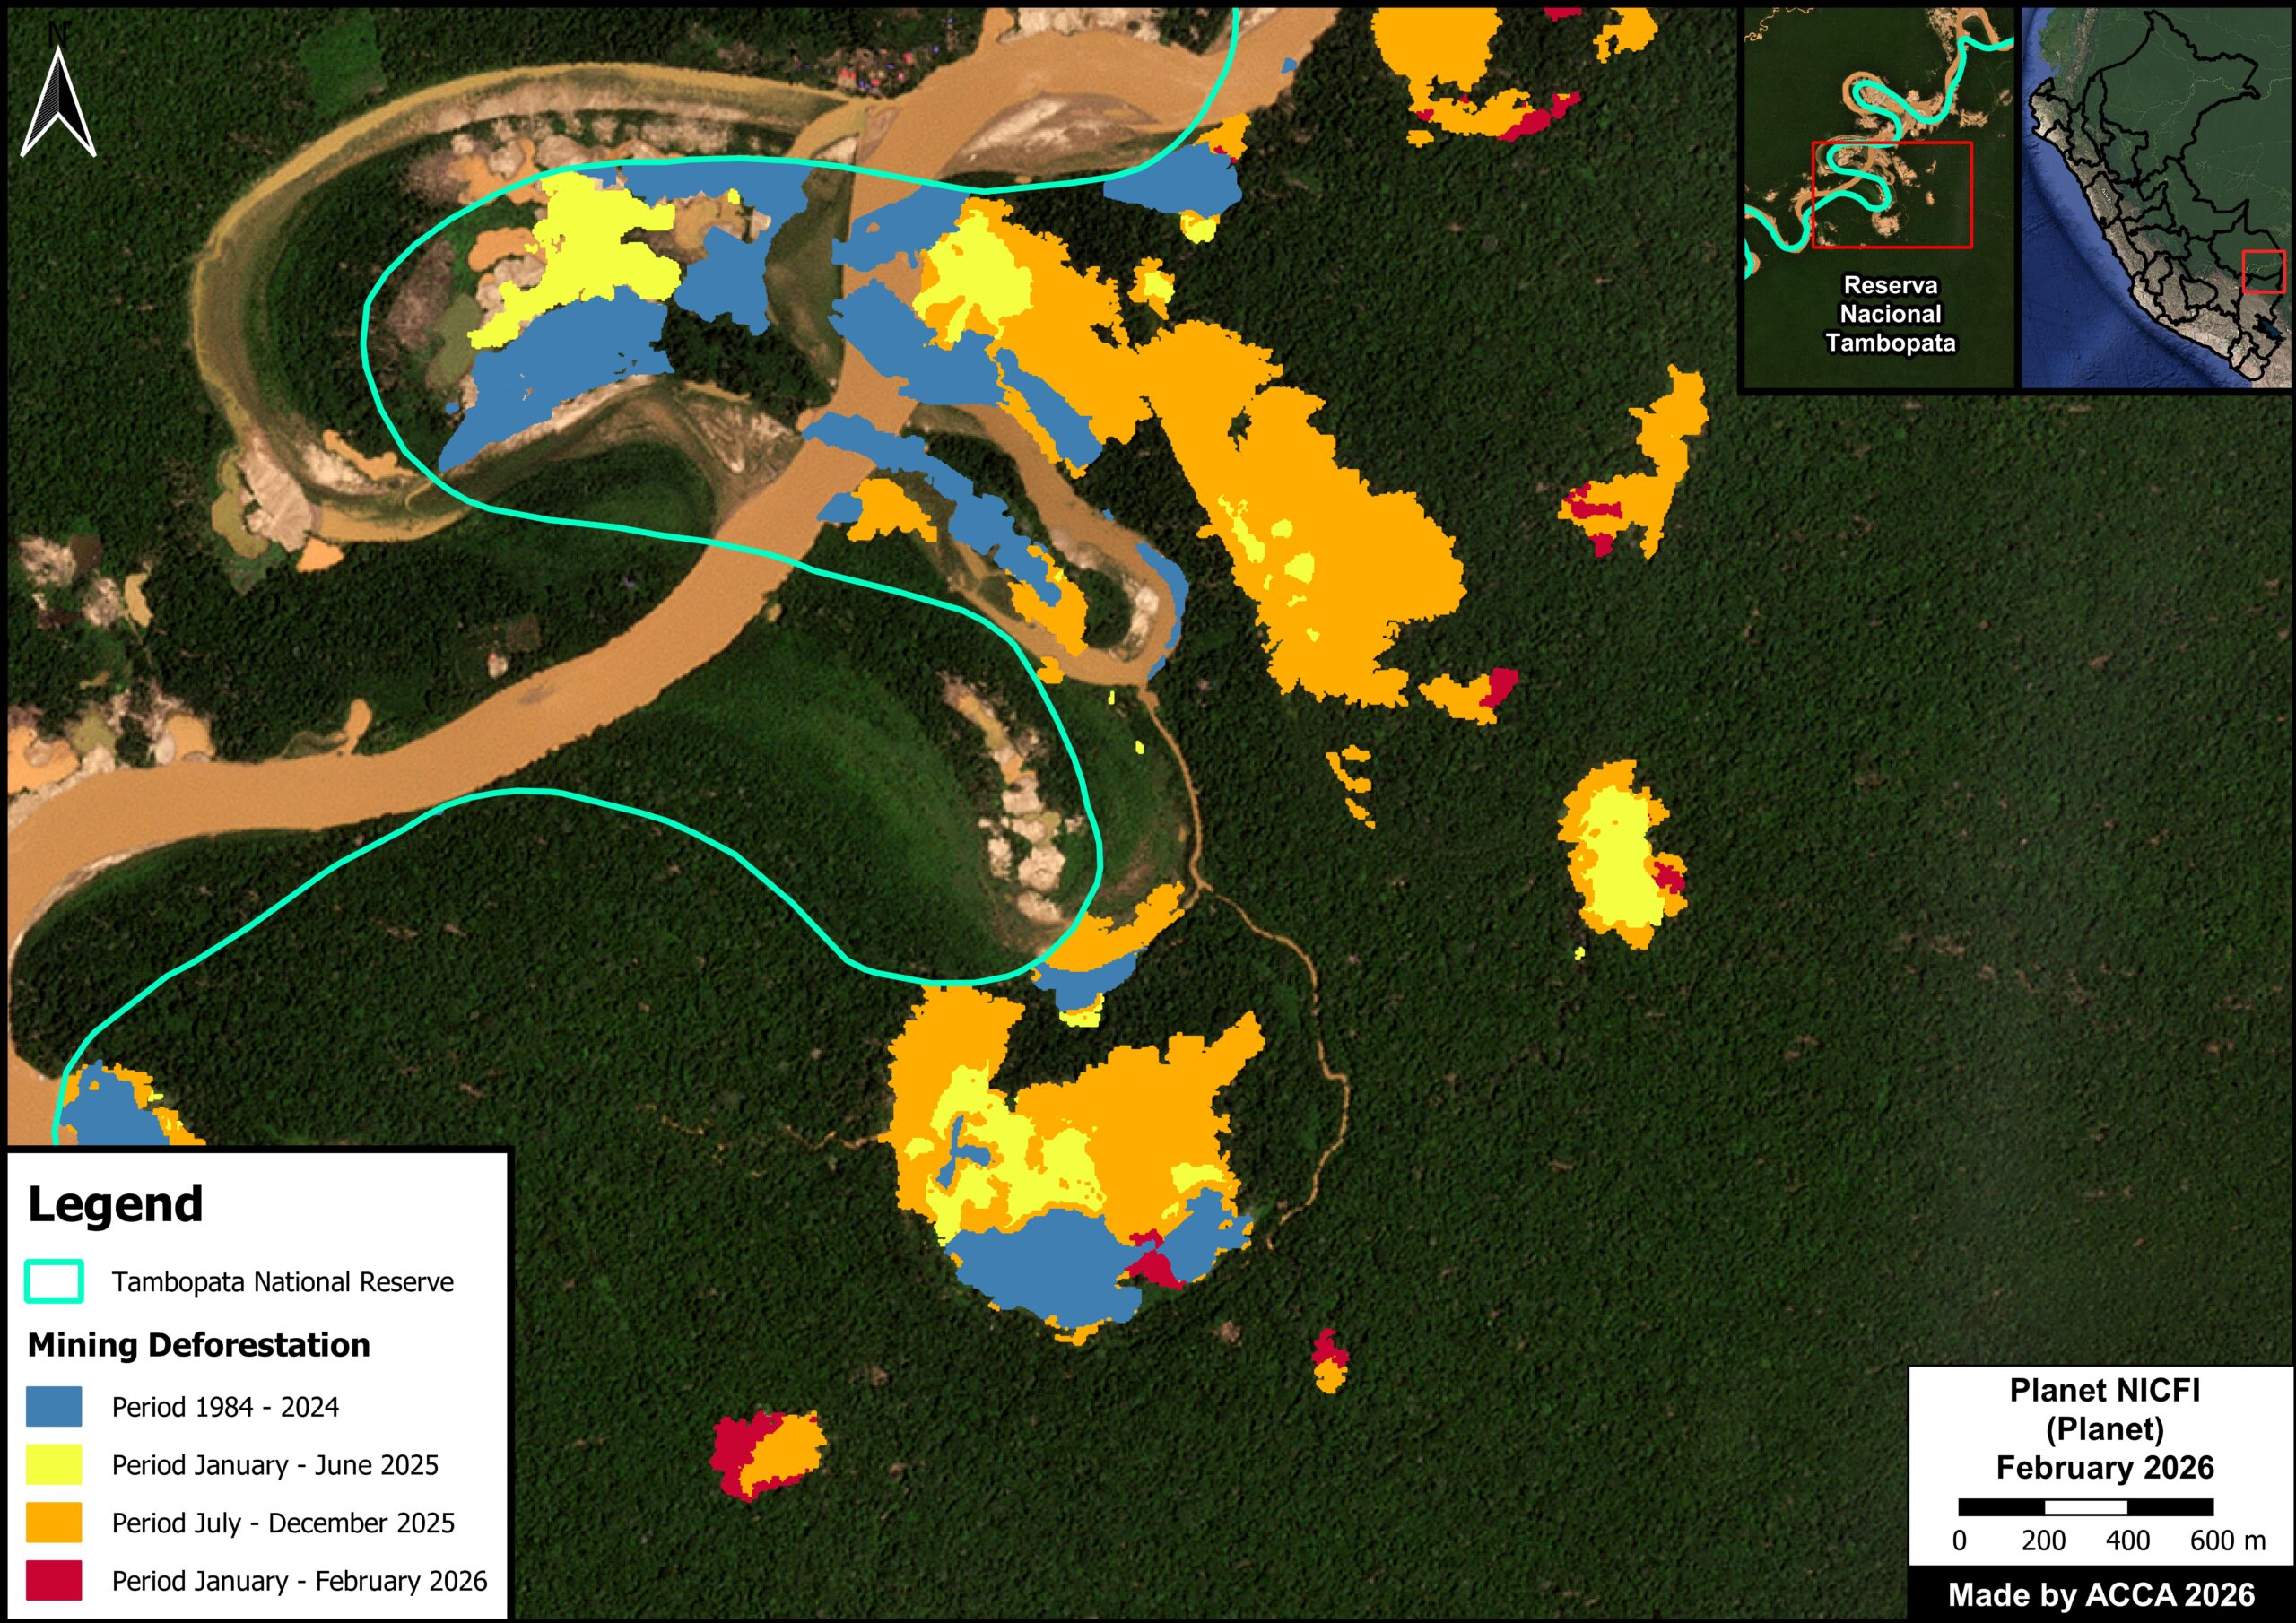
Figure D2. Mining deforestation in the Isla Correntada sector of Tambopata National Reserve. Data: ACCA, Planet.
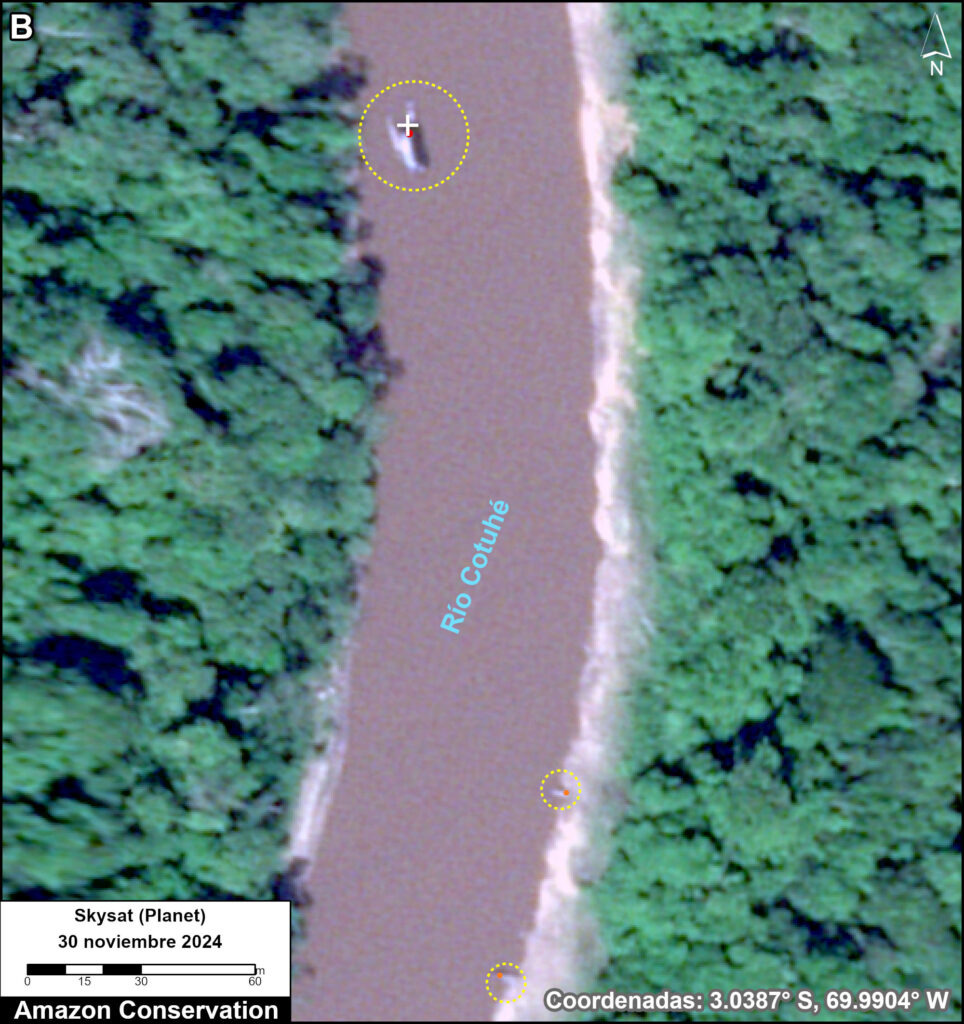
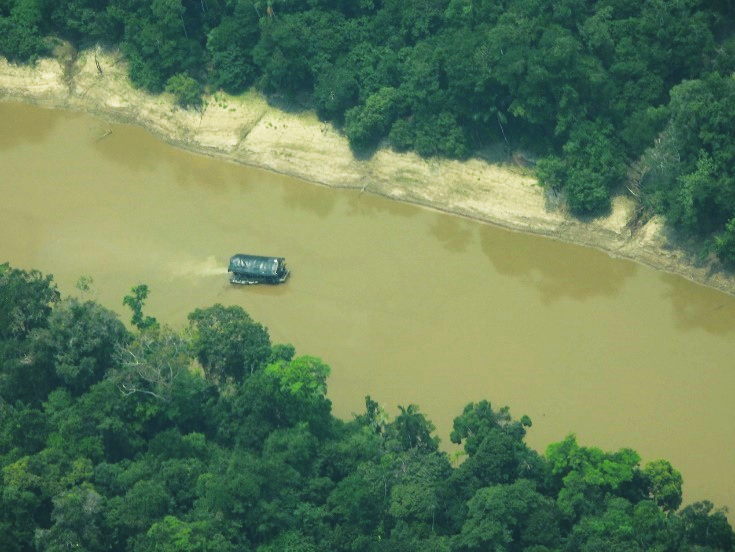
A total of 11 mining structures have been identified within various mining pits, and three mining camps have also been located in this sector. Figure D3 depicts various mining structures engaged in gold extraction near the Malinowski River, as well as the presence of a mining camp.
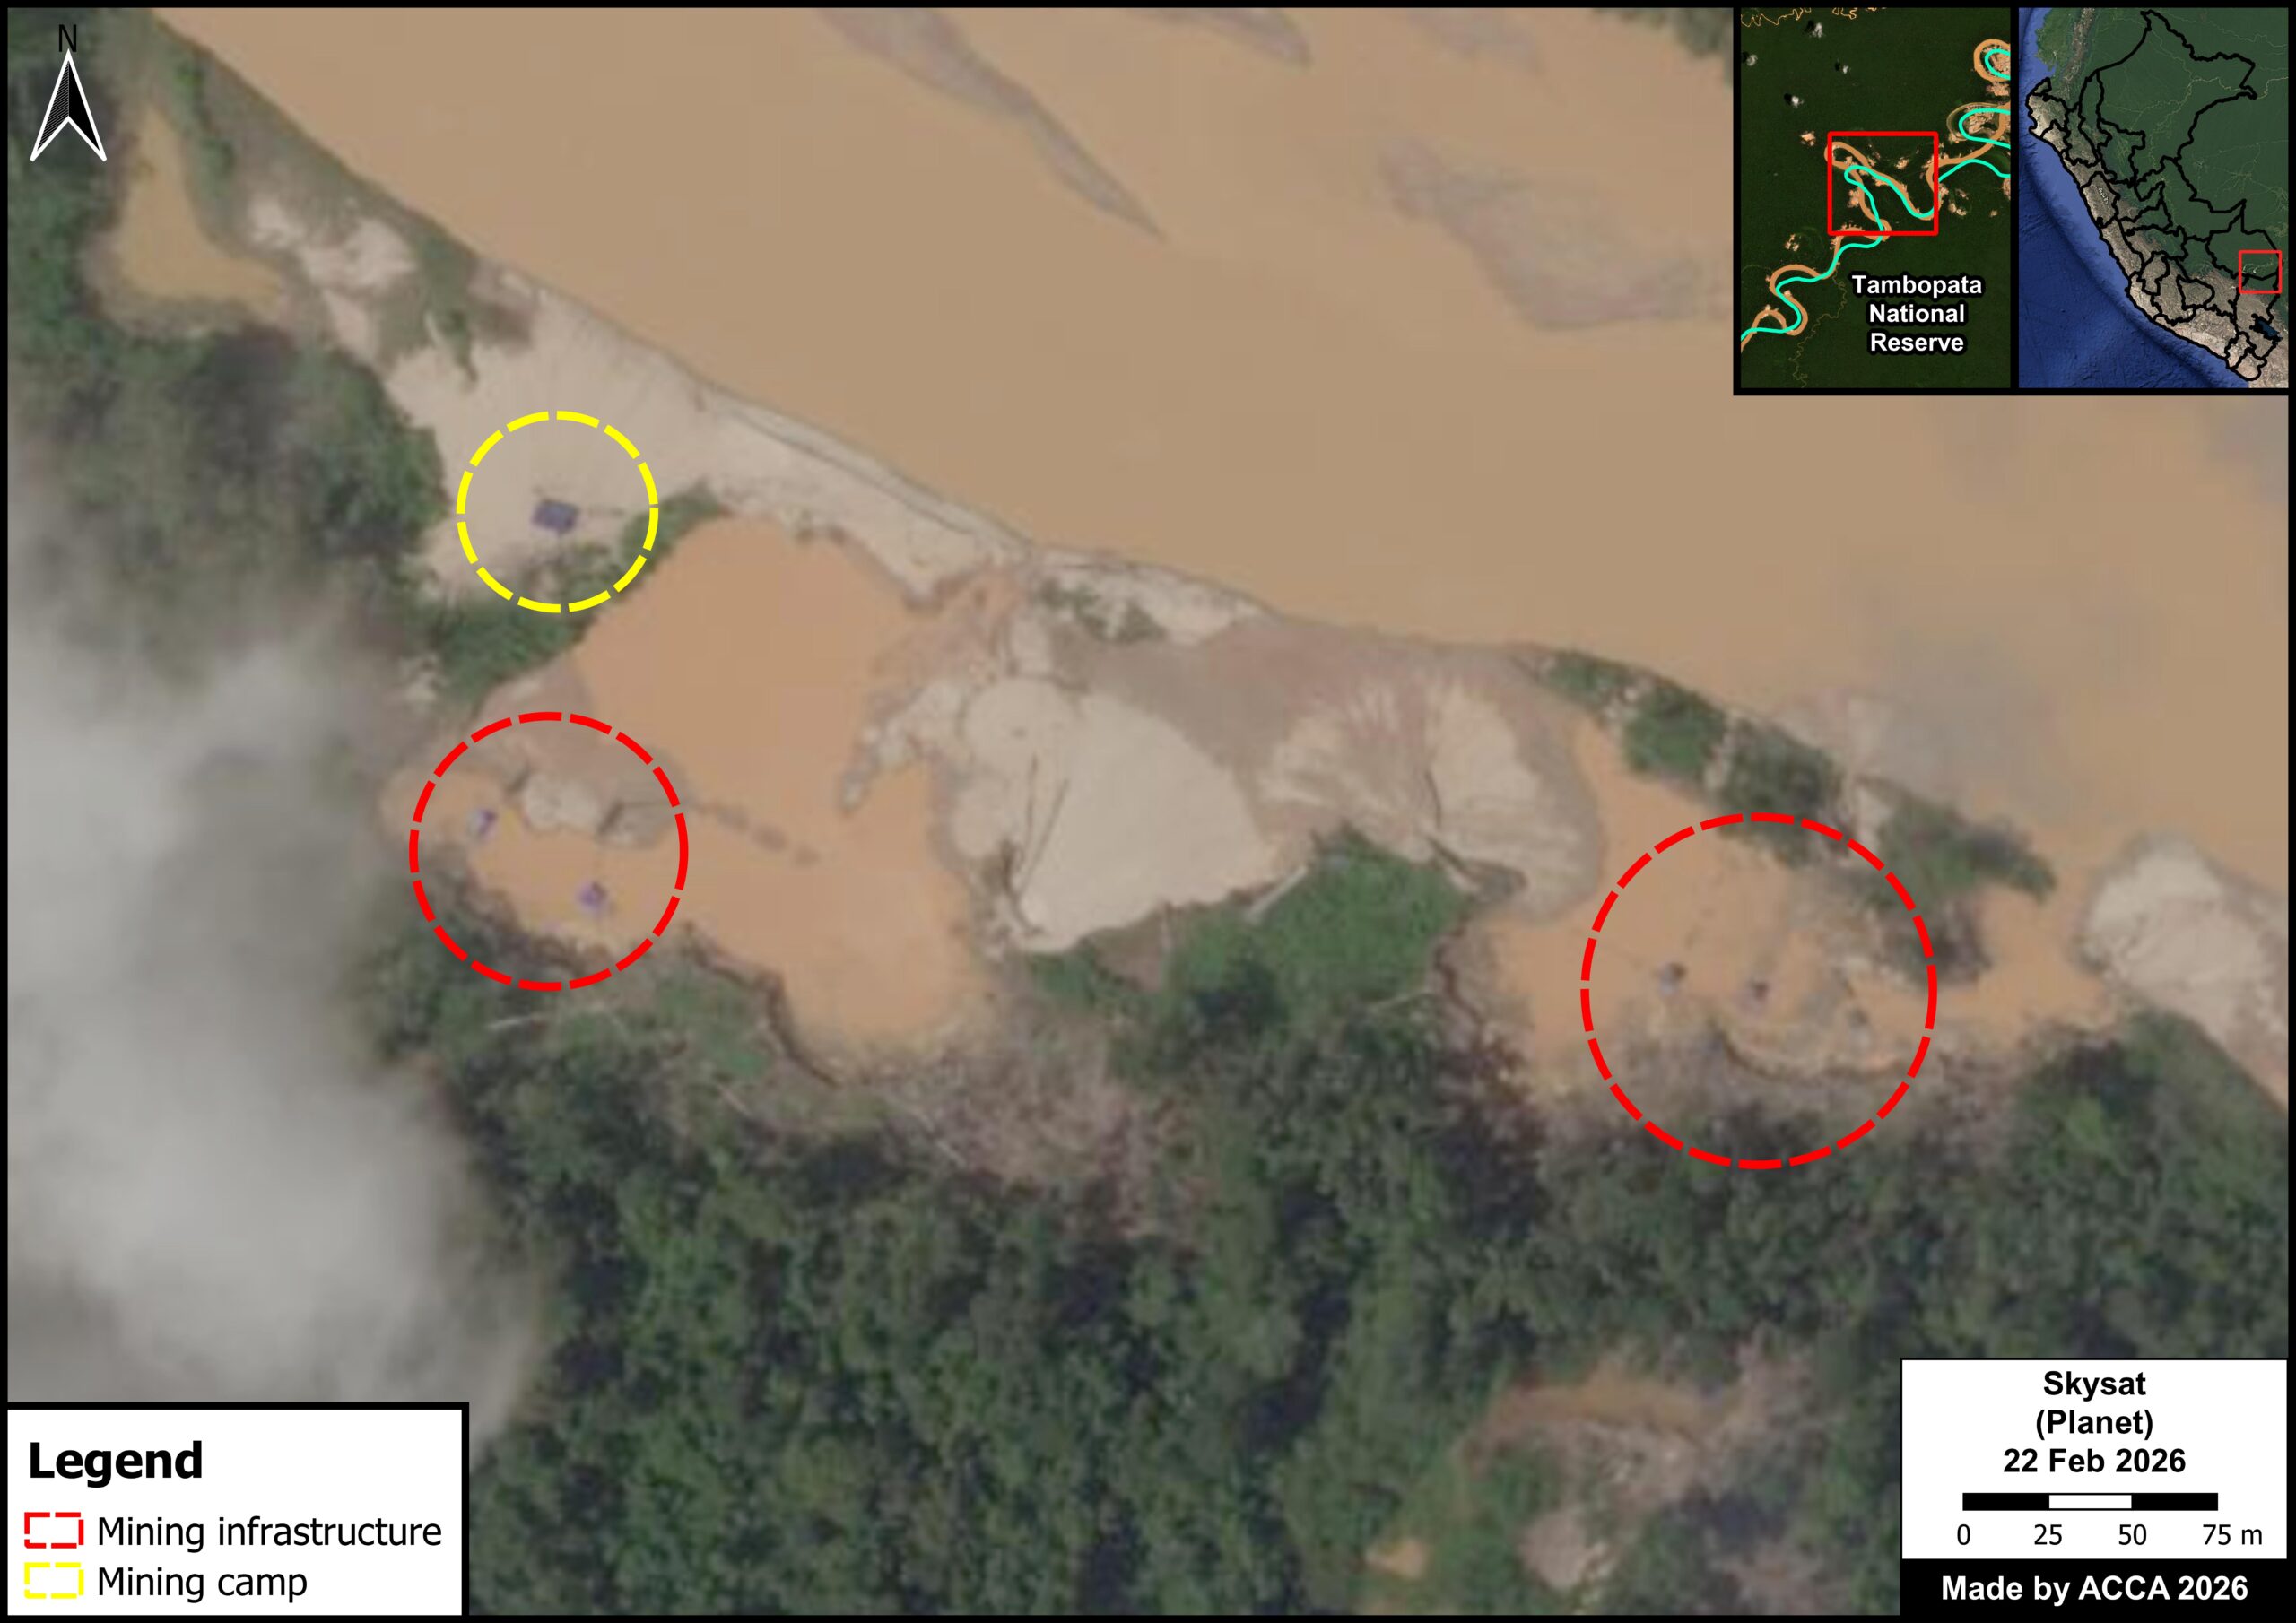
Figure D3. Mining infrastructure in the Isla Correntada sector of Tambopata National Reserve. Data: ACCA, Planet.
Public Policies Addressing Illegal Mining in the Tambopata National Reserve
The satellite imagery analysis presented in this report documents the advancement of illegal mining deforestation within Tambopata National Reserve during the 2025–2026 period. To contextualize these findings, this section examines the Peruvian State’s public policy framework during the same period, identifying the institutional, regulatory, and political factors that directly or indirectly influence the dynamics observed within the reserve.
The analysis is organized around five key themes:
- The State’s Response: Operations and Interdiction;
- Structural Limitations of the State Response;
- Legislative Setbacks Favoring Illegal Mining;
- Legislative Threats to Protected Natural Areas;
- 2026 Political and Electoral Context.
Taken together, the regulatory and institutional landscape of the 2025–2026 period reflects a structural tension between the control measures deployed by the Executive Branch and a regressive legislative trend that has weakened mechanisms for prevention, oversight, and enforcement. This contradiction constitutes one of the primary explanatory factors behind the expansion of illegal mining documented in the analyzed satellite imagery. Each of these key areas is discussed in detail below.
1. State Response: Operations and Interdiction
In response to the encroachment of illegal mining within Tambopata National Reserve, the Peruvian State implemented a series of operational and regulatory control measures during the 2025–2026 period. The most persistent exceptional measure in the region is the state of emergency in Madre de Dios, in effect uninterruptedly since April 7, 2023, when it was declared by Supreme Decree No. 046-2023-PCM. This declaration encompasses the districts of Tambopata, Inambari, Las Piedras, and Laberinto—all located within the Tambopata province—as well as the districts of Madre de Dios and Huepetuhe in the Manu province. The measure mandated that the Peruvian National Police (PNP) assume control of internal order, supported by the Armed Forces, with the specific aim of combating illegal mining, illegal logging, and illicit drug trafficking within the region.
Building upon this declaration, land- and river-based interdiction operations were carried out within the Reserve. The National Service of Natural Protected Areas (SERNANP)—in coordination with the National Police of Peru (PNP), the General Directorate of Captaincies and Coast Guards of Peru (DICAPI), and the Specialized Environmental Prosecutor’s Office (FEMA)—activated, through the Second Amazon Protection Brigade, a dynamic control strategy featuring continuous patrols at critical points within the reserve, with particular emphasis on the Otorongo, Azul, Yarinal, and Malinowski sectors—the latter serving as a key hub for both riverine and land-based control along the reserve’s northern boundary.
The scope of these interventions, carried out between January and March 2026, was considerable in terms of the equipment seized or destroyed by authorities, including mining rafts, engines, motors, pumps, generators, fuel, and motorcycles. In addition, 340 mining camps were dismantled. Nevertheless, satellite monitoring indicates that these actions failed to reverse the expansion of mining activity in the targeted sectors (see Figure A2).
Parallel to these actions in the field, the Executive sought to strengthen the legal framework for prosecuting crime. On January 20, 2026, it promulgated Legislative Decree No. 1695, which amends the Penal Code to stiffen penalties against illegal mining, establishing prison sentences of five to eight years for those who engage in mining activities without authorization or outside the formalization process, and six to nine years for those who traffic in chemical inputs, machinery, or minerals of illicit origin (Presidency of the Republic of Peru, 2026).
Furthermore, the regulation expressly incorporates illegal mining into the scope of the Law Against Organized Crime (Law No. 30077), thereby enabling the use of special investigative tools for the prosecution of these networks. Additionally, on February 5, 2026, a new extension of the state of emergency was ordered for an additional 60 days by means of Supreme Decree No. 017-2026-PCM, the validity of which was extended until April 6, 2026. However, the effectiveness of these measures—both operational and regulatory—encountered concrete limitations, which are analyzed in the following section.
2. Structural Limitations of the State Response
Despite the operational deployment described in the previous section, the State’s response faced limitations that reduced its effectiveness and that explain, in part, the continued advance of illegal mining documented in satellite imagery. The most critical limitation was budgetary in nature: the special units of the Peruvian Navy, which maintained a permanent presence at control and surveillance posts along the Malinowski River (the natural boundary between the Reserve and its buffer zone), were withdrawn during 2025 due to a lack of funding. This interrupted interdiction operations in one of the most active entry corridors for illegal mining into the interior of the reserve—a fact consistent with the data presented in the Base Map (Chumpitaz, 2025).
This absence of a continuous field presence resulted in a response capacity that was reactive rather than preventive. Although the High Commissioner for the Fight Against Illegal Mining, Rodolfo García Esquerre, noted that the budget allocated to this struggle was increased for 2026, specialists warned that such an increase would prove insufficient as long as current regulations continue to foster conditions of impunity for illegal operators (Chumpitaz, 2025). Along similar lines, the Illegal Mining Observatory (OMI) pointed out that judges, prosecutors, and government attorneys face budgetary constraints and a shortage of specialized personnel, thereby jeopardizing the effective enforcement of Legislative Decree No. 1695, approved in January 2026 (Pizarro, 2026).
The result of these limitations is a structural gap between the State’s operational response and the scale of the problem. The fact that the Madre de Dios region has been under a continuous state of emergency since April 2023—with consecutive extensions every 60 days—attests to the chronic nature of the phenomenon and the inadequacy of the measures adopted to reverse it in a sustained manner: interdiction operations succeed in dismantling specific equipment and camps, but they fail to prevent the reconstitution of criminal networks or the steady advance of the mining frontier deeper into the reserve. This gap cannot be explained solely by budgetary constraints or limitations in institutional capacity, but also by a series of legislative setbacks that—as analyzed in the following section—have worked at cross-purposes with the control efforts deployed in the field.
3. Legislative Setbacks Favoring Illegal Mining
As noted in the previous section, the limitations of the state response cannot be explained solely by operational or budgetary constraints, but also by a series of legislative amendments approved during the 2025–2026 period that have weakened the mechanisms for preventing, overseeing, and sanctioning illegal mining. These regulations—approved concurrently with interdiction operations—create a contradictory regulatory framework that reduces the effectiveness of control actions deployed in the field.
The most significant setback was the fifth extension of the Mining Formalization Registry (REINFO), approved by the Congressional Plenary in December 2025 and enacted by the Executive Branch via Law No. 32537 on December 26 of the same year. Through this measure, the deadline for the mining formalization process was extended until the end of 2026, with the possibility of an earlier closure should the MAPE Law and its implementing regulations enter into force prior to that date. It is worth noting that this marks the fifth consecutive extension of a mechanism originally conceived as transitional; previous extensions occurred in 2019, 2024, June 2025, and December 2025 (Zevallos Morón, 2026). Isabel Calle (2025) pointed out that, with this extension, the country remains trapped in a system that has failed to drive effective formalization and has, on the contrary, created incentives for non-compliance with the law, thereby exacerbating environmental degradation in regions such as Madre de Dios.
Compounding this setback are additional amendments that have weakened the legal tools available for combating illegal mining. Congress repealed the First Final Complementary Provision of Legislative Decree No. 1607, which had amended Law No. 30077 on Organized Crime, thereby curtailing the National Police’s (PNP) authority to take action regarding the illegal possession of explosives—particularly in cases involving miners suspended from the REINFO registry. This measure drew harsh criticism from the Office of the Comptroller General of the Republic, which warned that its implementation could facilitate illicit activities linked to informal mining (Tuesta, 2024).
Taken together, these legislative setbacks create a scenario in which interdiction operations and the stricter penalties introduced by Legislative Decree No. 1695 operate within a regulatory framework that simultaneously broadens the scope of tolerance toward informal mining. Furthermore, this landscape is compounded by legislative initiatives that pose a direct threat to the region’s Natural Protected Areas, as discussed in the following section.
4. Legislative Threats to Protected Natural Areas
Added to the landscape of legislative setbacks described in the previous section are parliamentary initiatives during this same period that pose a direct threat to the legal protection framework for Protected Areas in the Madre de Dios region, including ecosystems adjacent to Tambopata National Reserve. Unlike the regulations analyzed previously, these initiatives do not merely weaken existing oversight mechanisms regarding illegal mining; rather, they aim to alter the legal protection status of spaces that currently constitute the final institutional barrier against the expansion of extractive activities in the region.
The first of these initiatives is Bill No. 1822/2024-CR, introduced on July 2, 2025, by Congressman Jorge Luis Flores Ancachi (Acción Popular). The proposal seeks to amend nine articles of the Protected Natural Areas Law (Law No. 26834), thereby opening the door to hydrocarbon extraction activities in spaces that currently enjoy the highest level of legal protection—such as national parks, as well as national and historical sanctuaries—and granting the Ministry of Energy and Mines greater authority over the management of these areas. Vanessa Cueto warned that, should this amendment be approved, protected areas would ultimately become mere “paper parks,” left exposed to the impacts of high-intensity extractive activities. Among the areas directly affected are Bahuaja Sonene and Manu National Parks, both of which border the Tambopata National Reserve (Sierra Praeli, 2023). Along similar lines, on March 20, 2026, Congressman Eduardo Salhuana introduced Bill No. 14288/2025-CR, which would declare the development of the Madre de Dios gas basin to be a matter of national interest and strategic priority. The bill would—on an exceptional basis—authorize gas exploration and exploitation activities within “indirect-use” Protected Natural Areas (ANPs), including the Manu and Bahuaja Sonene National Parks, as well as the Amarakaeri Communal Reserve. Critics have argued that the approval of this bill would constitute a regulatory regression of the highest order, given that both the Manu National Park and the Bahuaja Sonene National Park are indirect-use ANPs which, under current legislation, expressly prohibit the extraction of natural resources within their boundaries (SPDA, 2026).
During the same period, Bill No. 3377—originally introduced in October 2022 by the same congressman—was reactivated. This bill proposes to authorize the granting of mining concessions over areas that have reverted to State control due to non-compliance with obligations, inactivity, or other grounds for termination or annulment. If approved, this proposal would lift the current restrictions on the granting of new mining concessions in Madre de Dios (Salazar Vega, 2026).
These bills—although still in the legislative debate stage at the time this report was finalized—reflect a trend toward subordinating the region’s environmental protection to extractive interests. This is occurring within a context where pressure on Tambopata National Reserve has already reached critical levels, according to the satellite data analyzed. This scenario is further exacerbated by political and social factors, which are examined in the following section.
5. Violence Against Environmental Defenders and the 2026 Political-Electoral Context
The scenario of legislative pressure and institutional weakness described in the preceding sections unfolds within a social and political context that further exacerbates the situation of Tambopata National Reserve. Two factors stand out in this regard: the violence perpetrated against those who defend the territory, and the absence of a robust environmental agenda within the framework of the 2026 national electoral process.
As an example regarding violence against environmental defenders, on July 26, 2025, Hipólito Quispe Huamán—an environmental defender for Tambopata National Reserve—was murdered while traveling toward his home along the Interoceanic Highway in Madre de Dios. His death adds to the more than 30 killings of environmental defenders and Indigenous leaders recorded in Peru since 2020, solidifying a pattern of violence that functions as a deterrent against those who monitor and denounce illegal activities within the reserve (Sierra Praeli, 2025).
Compounding this factor is the political-electoral context of 2026. The national electoral process—which entails the renewal of both the Executive and Legislative branches—is unfolding against a backdrop of political instability and the progressive weakening of environmental policies. Although Peru’s natural capital underpins approximately 20% of the GDP and 65% of national agriculture, the environment does not occupy a central place in the candidates’ proposals, according to experts consulted by various organizations (Guardia Brown, 2026). This absence of structural political will implies that the substantive decisions necessary to halt the advance of illegal mining in the Reserve—such as the approval of an effective MAPE Law, the definitive closure of the REINFO, or the budgetary strengthening of SERNANP—are unlikely to be addressed in the short term, thereby prolonging the window of vulnerability documented in this report.
6. Public Policy Conclusion
An analysis of the Peruvian State’s public policy framework during the 2025–2026 period reveals a scenario of profound institutional contradiction. On one hand, the Executive branch implemented concrete response measures to address the mining crisis in Tambopata National Reserve, including declaring a state of emergency in the province of Tambopata, conducting land- and river-based interdiction operations, and strengthening the penal framework through Legislative Decree No. 1695. On the other hand, these actions operate upon a normative and institutional foundation that has simultaneously been undermined by regressive legislative decisions, structural budgetary constraints, parliamentary initiatives threatening the legal status of the region’s natural Protected Areas, and a climate of violence against environmental defenders that diminishes territorial surveillance capacity.
This contradiction is not merely circumstantial but structural: it reflects the absence of a comprehensive and sustained policy for the protection of the Reserve—one that coherently integrates the available operational, normative, budgetary, and institutional instruments. One indication of this is that, given the magnitude of the problem, SERNANP is promoting the establishment of a unified command to combat illegal mining, recognizing that the PNP’s capacity for territorial control has been overwhelmed by the scale of the phenomenon and that a more comprehensive intervention by the Armed Forces is required.
In this regard, the findings from the satellite analysis presented in this report cannot be interpreted solely as the result of the activities of criminal networks, but also as the territorial manifestation of an environmental governance framework that, during the period under review, failed to halt the encroachment of illegal mining or reverse the deforestation trend in one of the country’s most critical protected natural areas. The contrast with the results of Operation Mercury in 2019 and Plan Restoration in 2021—both associated with measurable reductions in deforestation documented in Graph 1—suggests that the effectiveness of the State does not depend on the absence of tools, but rather on the coordination, coherence, and sustainability with which these are deployed.
Methodology
The identification of gold mining deforestation in Tambopata National Reserve utilized historical mining deforestation data in the Madre de Dios region, generated by the Center for Amazonian Scientific Innovation (CINCIA) for the years 1984–2019, by MapBiomas Perú for 2020, and by Amazon Conservation (ACA) for the period from January 2021 to March 2024.
Next, the LandTrendR algorithm was used to identify forest loss in monthly Planet NICFI mosaics for the period April 2024 – July 2025. For the period August 2025 – February 2026, mining deforestation (identified using the monthly Planet NICFI mosaics at 4.7 m spatial resolution) was monitored to record the expansion of mining-related deforestation within the Reserve.
The identification of mining infrastructure and camps was based on the visual interpretation of very-high-resolution satellite imagery (Skysat from Planet) obtained (tasked) for the mining zones identified within Tambopata National Reserve.
References
Alza, R. (27 de febrero de 2026). Estado intensifica lucha contra minería ilegal en Tambopata. Rumbo Minero. https://www.rumbominero.com/actualidad/estado-intensifica-lucha-contra-mineria-ilegal-en-tambopata/
Andina. (4 de febrero de 2026). Normas Legales: prorrogan estado de emergencia en diversos distritos de Madre de Dios. Andina. https://andina.pe/agencia/noticia-normas-legales-prorrogan-estado-emergencia-diversos-distritos-madre-dios-1061822.aspx
Asociación para la Investigación y Desarrollo Integral – AIDER. (2021). Minería ilegal en la zona de amortiguamiento de la Reserva Nacional Tambopata. Cartilla N°17. https://aider.com.pe/publicacionesca/cartillas/Cartilla_Mineria_2021_VF_opt.pdf
Calle, I. (28 de noviembre de 2025). El Reinfo: una excepción que se volvió norma. SPDA. https://spda.org.pe/noticia/el-reinfo-una-excepcion-que-se-volvio-norma/
Chumpitaz, O. (31 de diciembre de 2025). Mafias mantienen en vilo al Parque Nacional del Manu y a la Reserva Nacional de Tambopata. La República. https://larepublica.pe/politica/2025/12/31/mafias-mantienen-en-vilo-al-parque-nacional-del-manu-y-a-la-reserva-nacional-de-tambopata-mineria-ilegal-hnews-775496
Conservación Amazónica (ACCA), Proyecto Prevenir – USAID. (2022). Estimación de la población minera informal e ilegal en el departamento de Madre de Dios, a partir del uso de imágenes satelitales sub métricas. https://repositorio.profonanpe.org.pe/handle/20.500.14150/2744
Comando Conjunto de las Fuerzas Armadas. (2026). Comando Operacional del Sur asesta golpe de S/ 1.7 millones contra la minería en Tambopata. Presidencia de la República del Perú. https://www.gob.pe/institucion/ccffaa/noticias/1374254-comando-operacional-del-sur-asesta-golpe-de-s-1-7-millones-contra-la-mineria-ilegal-en-tambopata
Derecho, Ambiente y Recursos Naturales – DAR. (2023). Desafiando la legalidad y la justicia: La minería ilegal en Madre de Dios. Lima, Perú. https://dar.org.pe/wp-content/uploads/2024/08/Mineria-ilegal-en-Madre-de-Dios-version-final.pdf
Finer, M., Mamani, N. (2020). Reducción de Minería Ilegal en la Amazonía Peruana Sur. MAAP: 121. https://www.maapprogram.org/es/mineria-peru-2020/
Guardia Brown. (26 de enero de 2026). Desafíos ambientales del Perú en 2026: minería ilegal, crimen organizado y gobernanza ambiental en un contexto electoral. Pulso PUCP. https://pulso.pucp.edu.pe/noticias/desafios-ambientales-del-peru-en-2026-mineria-ilegal-crimen-organizado-y-gobernanza-ambiental-en-un-contexto-electoral
Inforegión Redacción. (15 de enero de 2026). Destruyen 24 máquinas utilizadas para la minería ilegal en la Reserva Nacional de Tambopata. Inforegión. https://inforegion.pe/destruyen-24-maquinas-utilizadas-para-la-mineria-ilegal-en-la-reserva-nacional-de-tambopata/
Mongabay Latam. (18 de julio de 2025). ¿Qué cambios busca el proyecto de ley de Áreas Naturales Protegidas en Perú? Mongabay. https://es.mongabay.com/podcast/2025/07/que-cambios-busca-el-proyecto-de-ley-de-areas-naturales-protegidas-en-peru/
Pizarro, O. (4 de febrero de 2026). Minería ilegal en Perú: nuevo decreto endurece penas, pero no ataca las causas de fondo. Infobae. https://www.infobae.com/peru/2026/02/04/mineria-ilegal-en-peru-nuevo-decreto-endurece-penas-pero-no-ataca-las-causas-de-fondo/
Presidencia de la República del Perú. (20 de enero de 2026). Gobierno fortalece medidas para combatir delito de minería ilegal. Presidencia de la República del Perú. https://www.gob.pe/institucion/presidencia/noticias/1337593-gobierno-fortalece-medidas-para-combatir-delito-de-mineria-ilegal
Romo, V. (2020). Perú: Minería ilegal entra a la Reserva Nacional Tambopata ante ausencia temporal de la policía. Mongabay. https://es.mongabay.com/2020/03/peru-tambopata-mineria-ilegal-ausencia-de-policia/
Salazar, E. (2024). La violencia replegó al Estado peruano y presiona la Reserva Nacional Tambopata en Perú. Mongabay. https://es.mongabay.com/2024/07/violencia-replego-al-estado-peruano-presiona-reserva-nacional-tambopata-peru/
Guardia Brown. (26 de enero de 2026). Desafíos ambientales del Perú en 2026: minería ilegal, crimen organizado y gobernanza ambiental en un contexto electoral. Pulso PUCP. https://pulso.pucp.edu.pe/noticias/desafios-ambientales-del-peru-en-2026-mineria-ilegal-crimen-organizado-y-gobernanza-ambiental-en-un-contexto-electoral
Inforegión Redacción. (15 de enero de 2026). Destruyen 24 máquinas utilizadas para la minería ilegal en la Reserva Nacional de Tambopata. Inforegión. https://inforegion.pe/destruyen-24-maquinas-utilizadas-para-la-mineria-ilegal-en-la-reserva-nacional-de-tambopata/
Mongabay Latam. (18 de julio de 2025). ¿Qué cambios busca el proyecto de ley de Áreas Naturales Protegidas en Perú? Mongabay. https://es.mongabay.com/podcast/2025/07/que-cambios-busca-el-proyecto-de-ley-de-areas-naturales-protegidas-en-peru/
Pizarro, O. (4 de febrero de 2026). Minería ilegal en Perú: nuevo decreto endurece penas, pero no ataca las causas de fondo. Infobae. https://www.infobae.com/peru/2026/02/04/mineria-ilegal-en-peru-nuevo-decreto-endurece-penas-pero-no-ataca-las-causas-de-fondo/
Presidencia de la República del Perú. (20 de enero de 2026). Gobierno fortalece medidas para combatir delito de minería ilegal. Presidencia de la República del Perú. https://www.gob.pe/institucion/presidencia/noticias/1337593-gobierno-fortalece-medidas-para-combatir-delito-de-mineria-ilegal
Vadillo Vila, J. (2022). La minería ilegal y su impacto en tiempos de pandemia. Diario El Peruano. https://elperuano.pe/noticia/170967-la-mineria-ilegal-hoy
Zevallos Morón, J. (26 de diciembre de 2025). Gobierno promulgó ley que amplía la vigencia del Reinfo hasta diciembre de 2026. RPP. https://rpp.pe/politica/gobierno/gobierno-promulgo-ley-que-amplia-la-vigencia-del-reinfo-hasta-diciembre-de-2026-noticia-1669269
Acknowledgments
We express our gratitude to the Sub-directorate of Strategic Information and Research on Protected Natural Areas and the Sub-directorate of Supervision, Surveillance, and Control of the National Service of Protected Natural Areas by the State (SERNANP) for their contributions and comments on this report.
This report is part of a series focusing on gold mining in the Peruvian Amazon, through a strategic collaboration between Amazon Conservation and Conservación Amazónica – Peru (ACCA), with support from the Gordon and Betty Moore Foundation

Pacsi R, Novoa S, La Torre S, Balbuena H, Finer M, Santana A, Castillo H. (2026). Rapid Expansion of Illegal Gold Mining in Tambopata National Reserve (Southern Peruvian Amazon). MAAP:241.
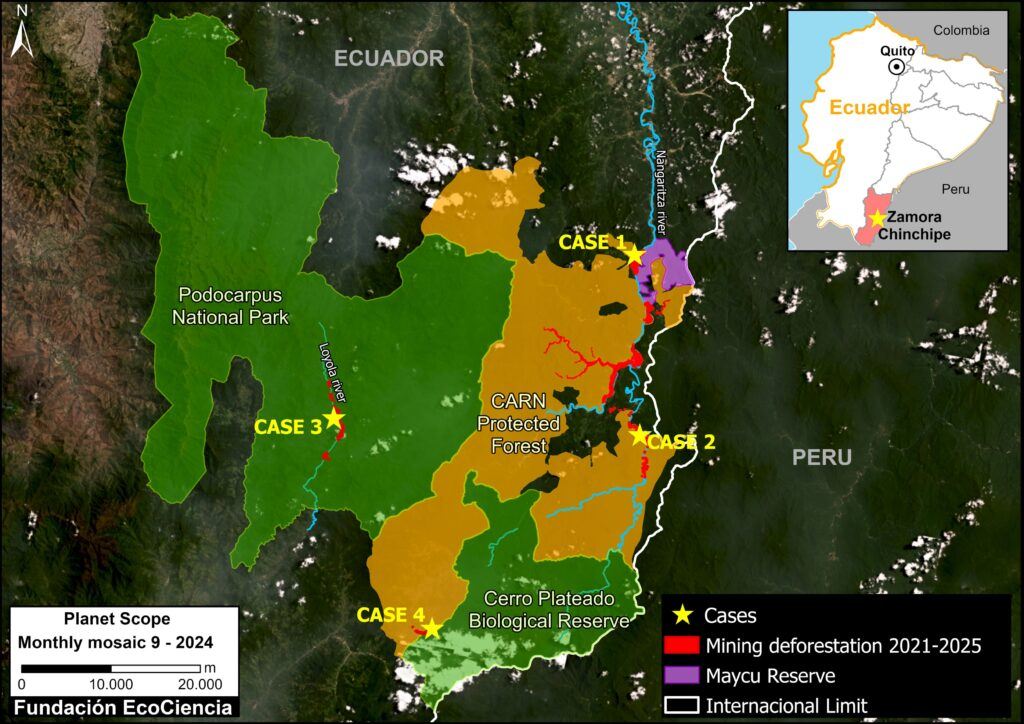
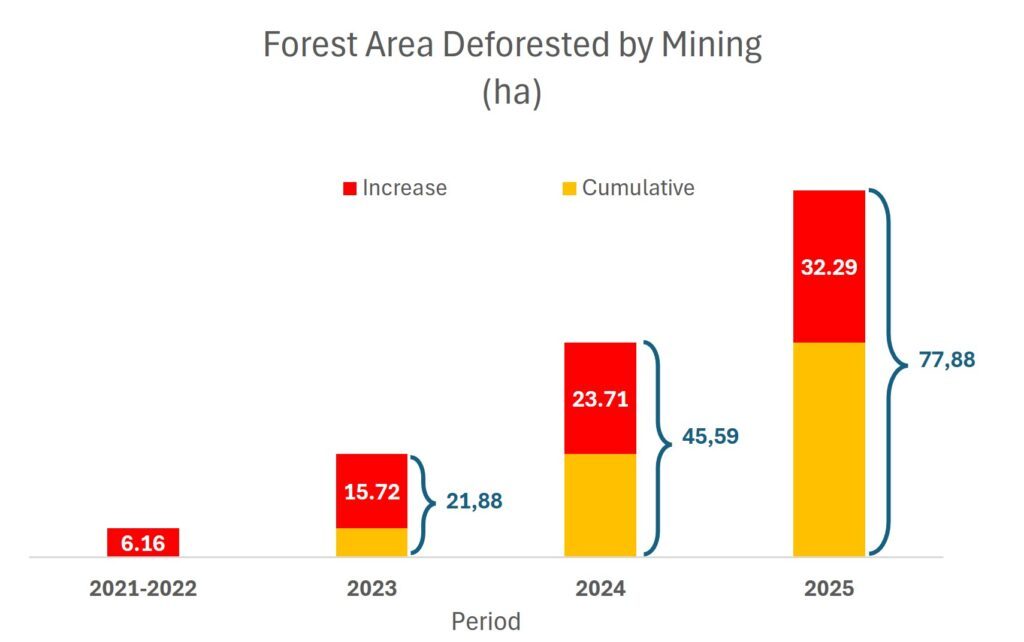
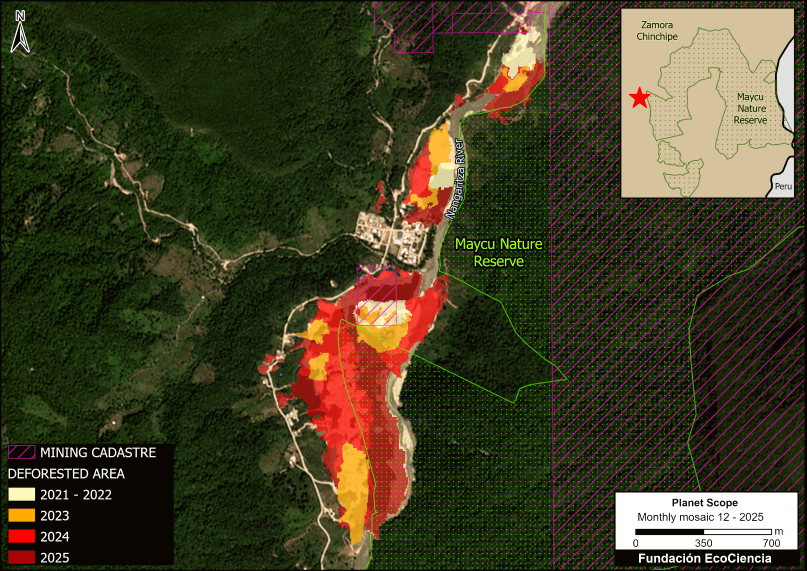
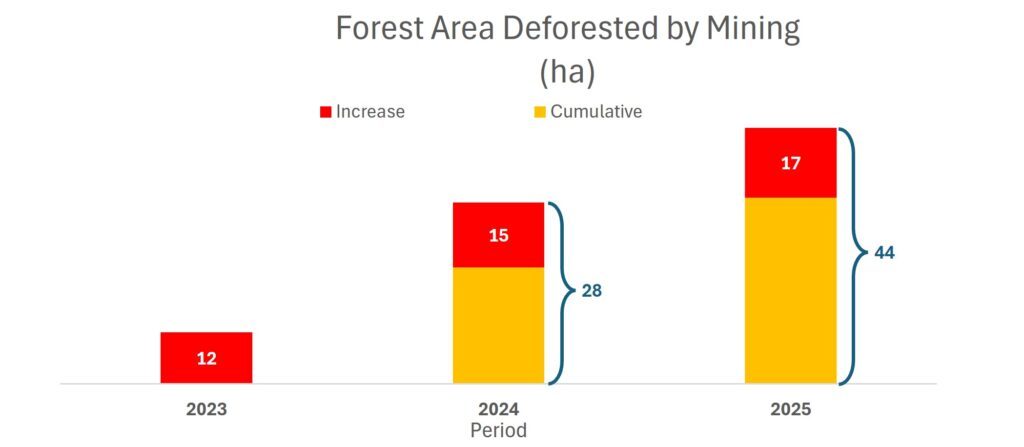
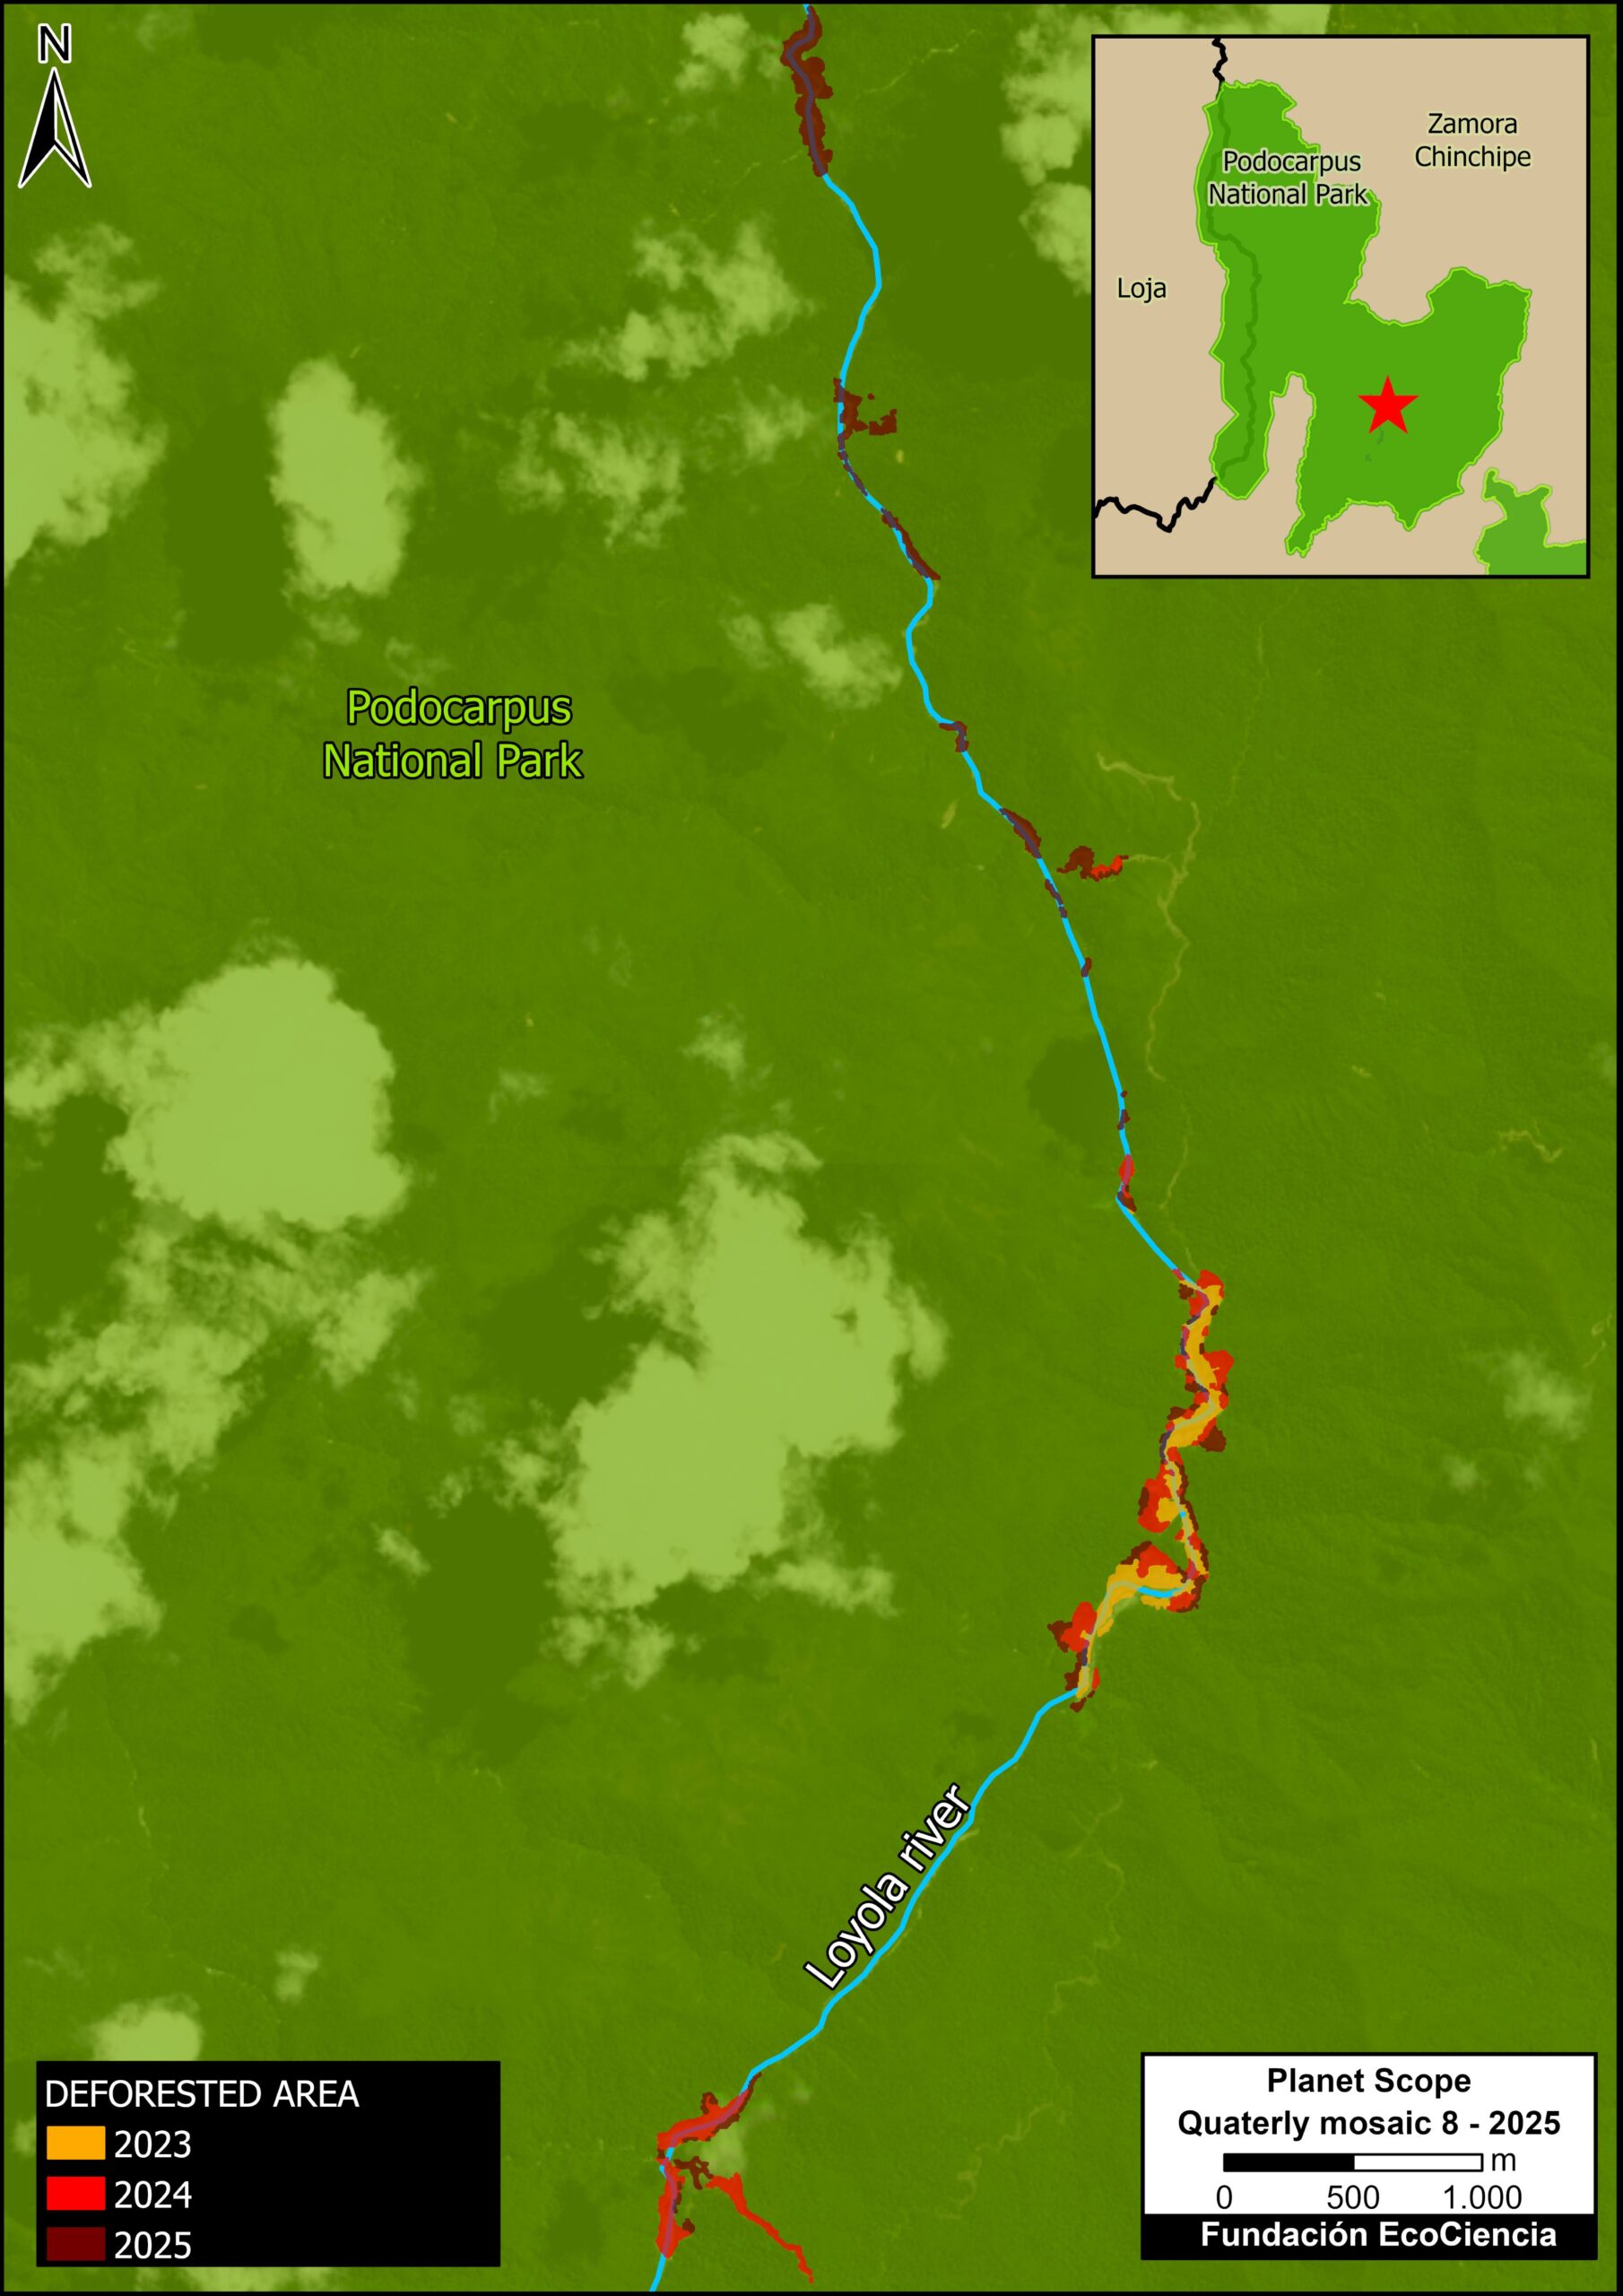
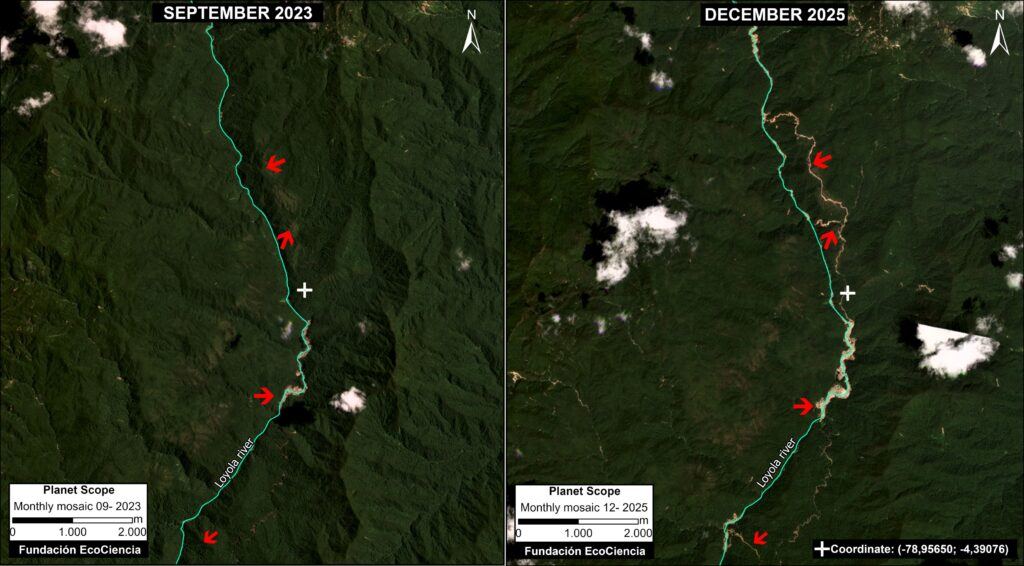
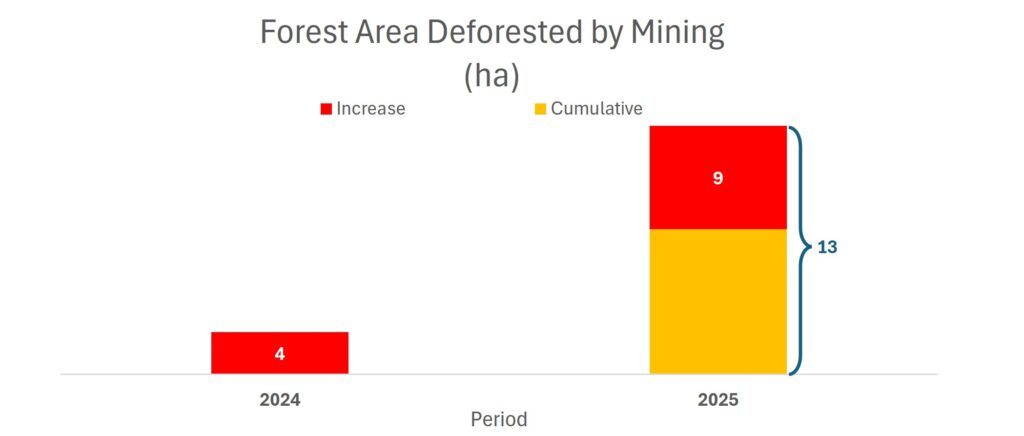
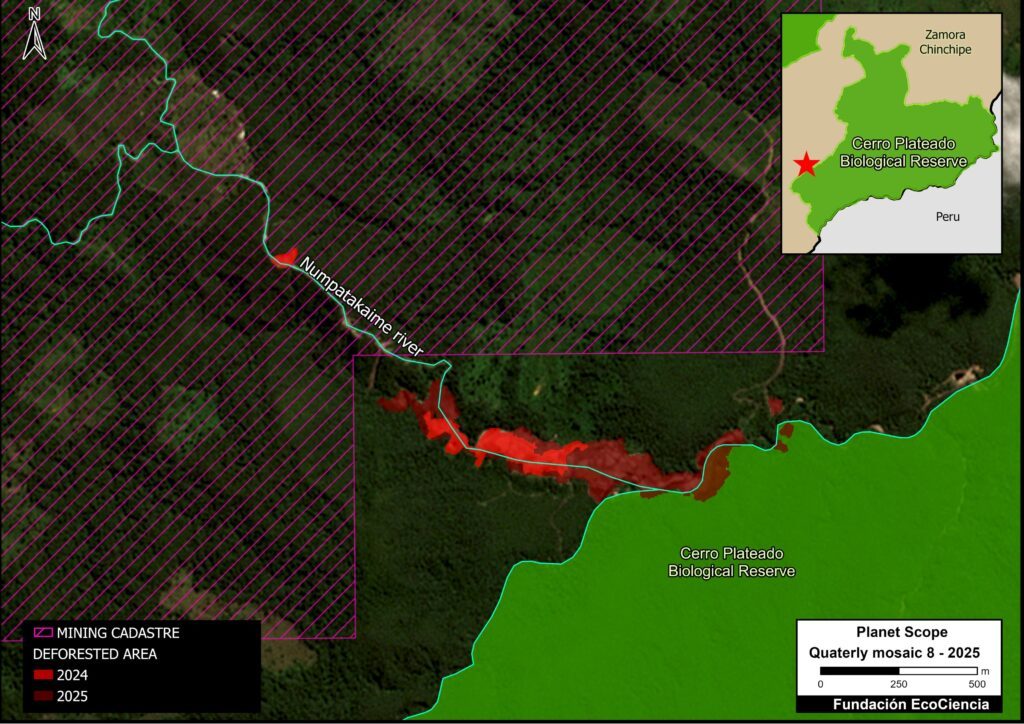
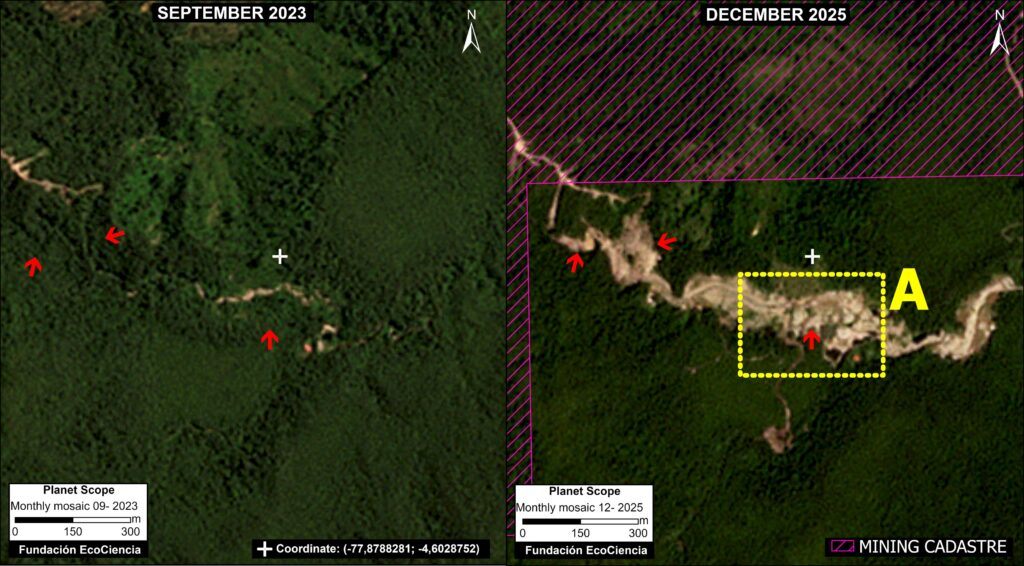
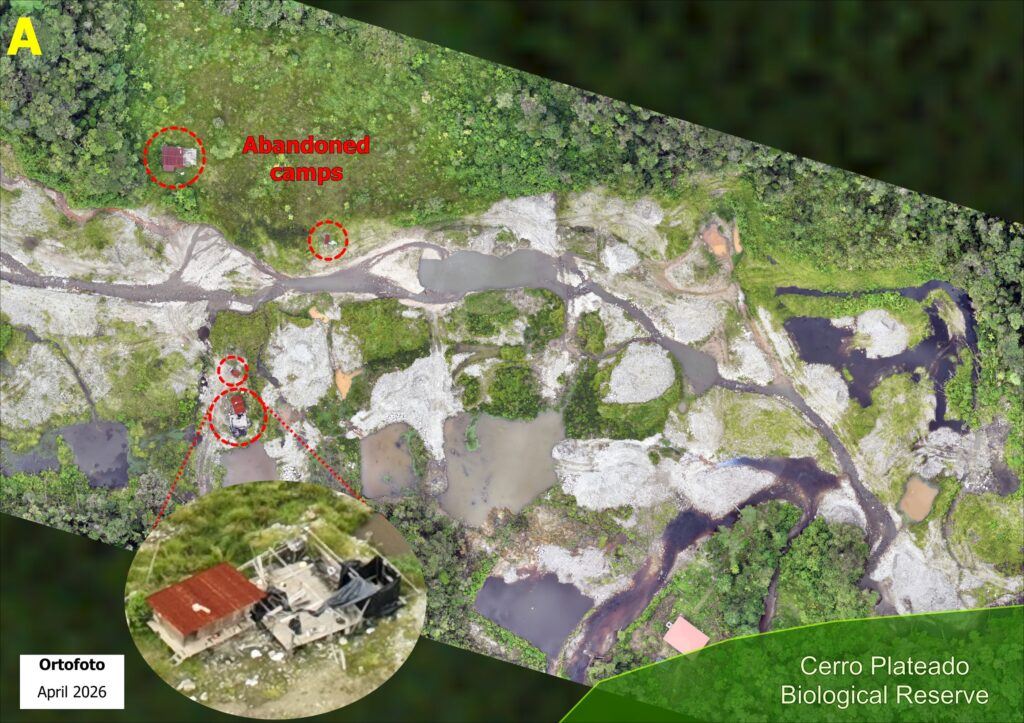

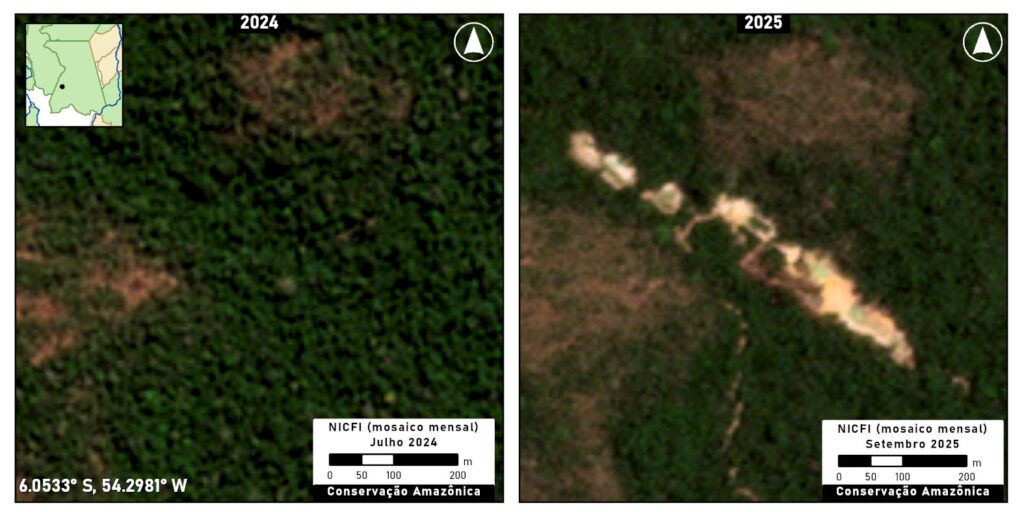
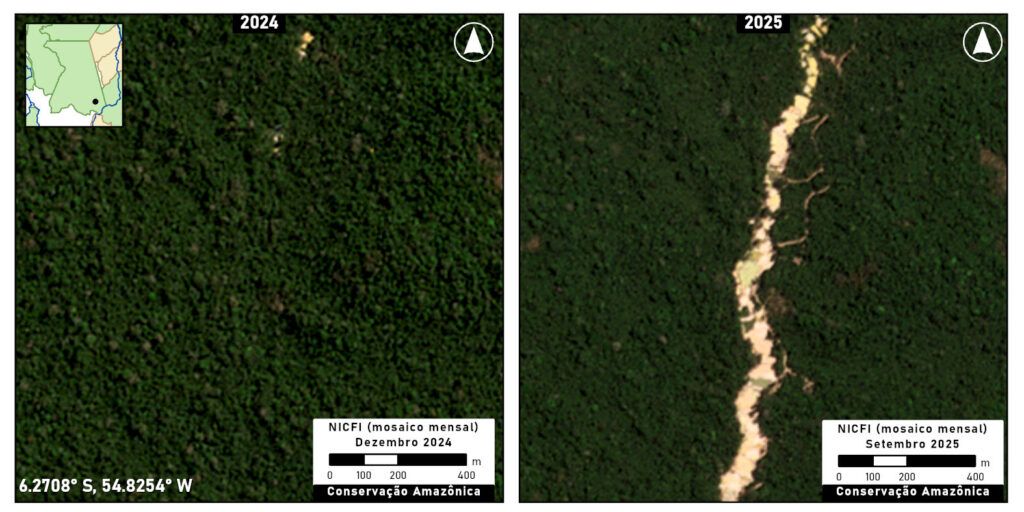
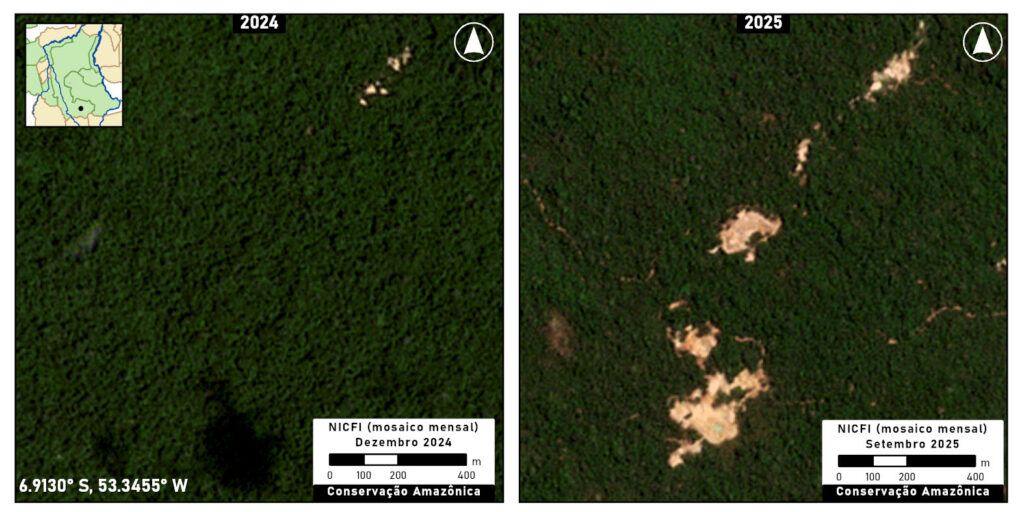
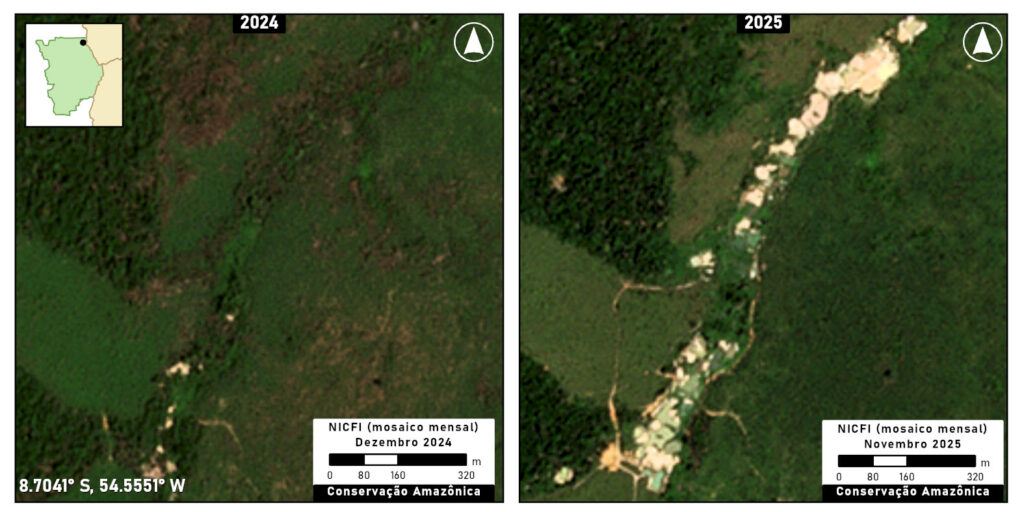
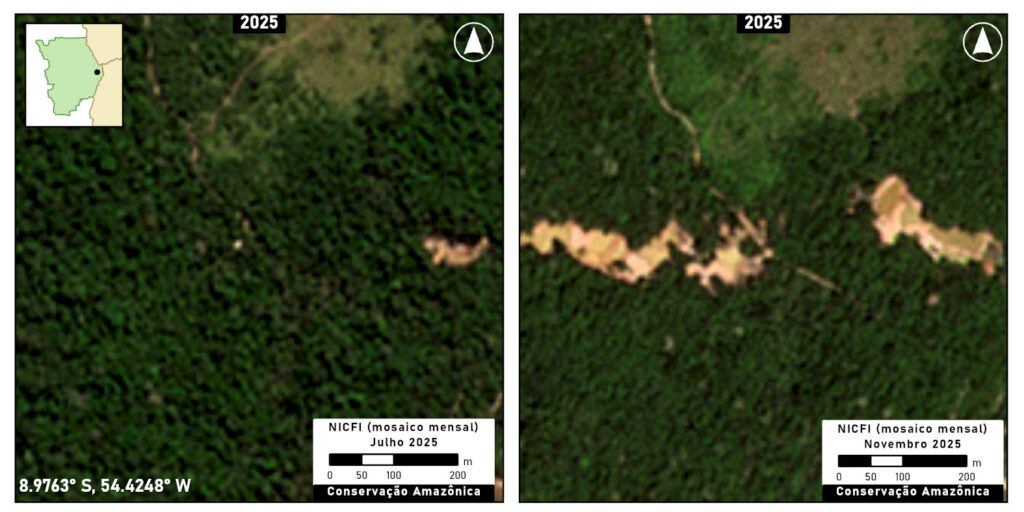
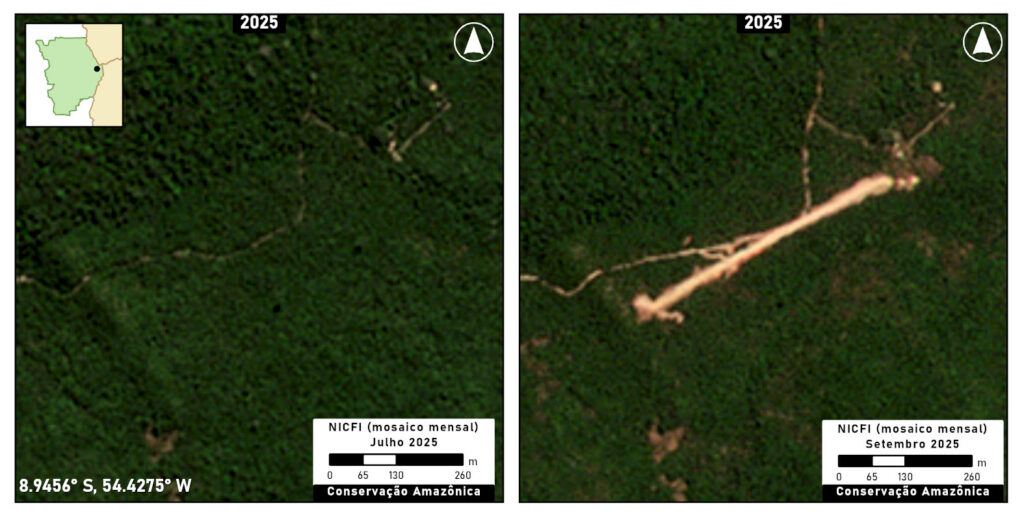
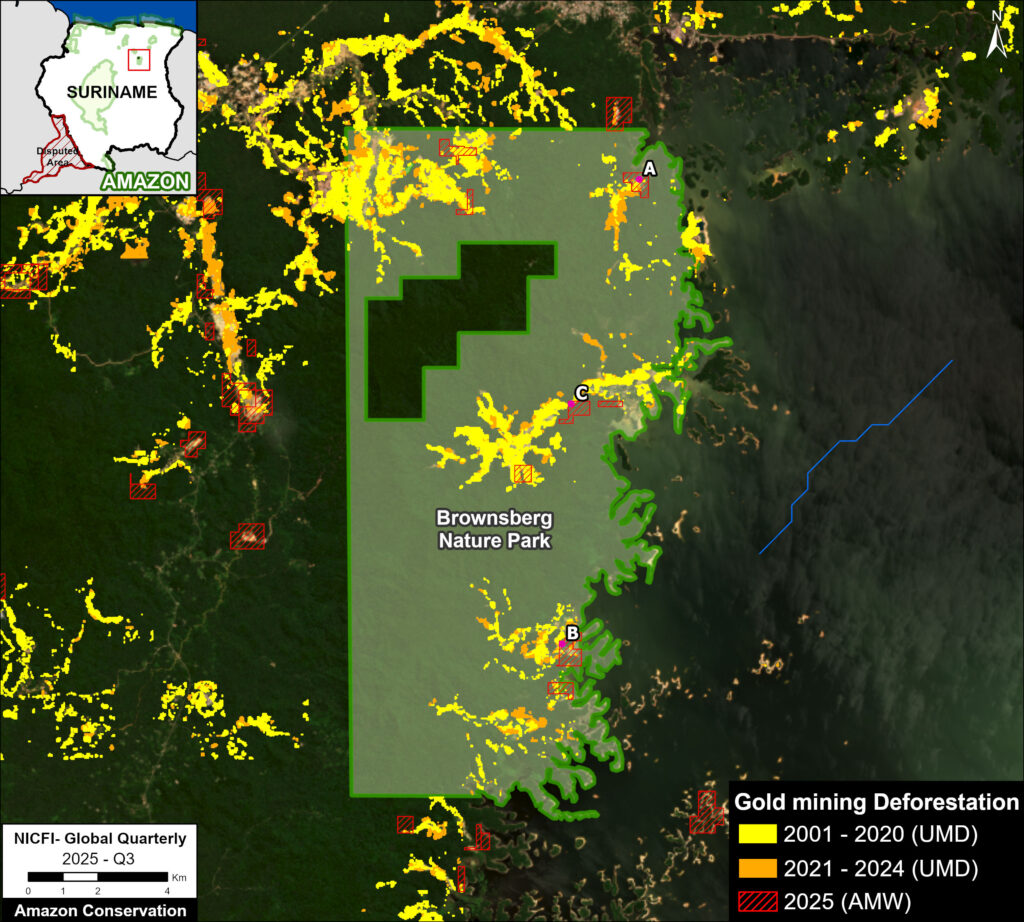
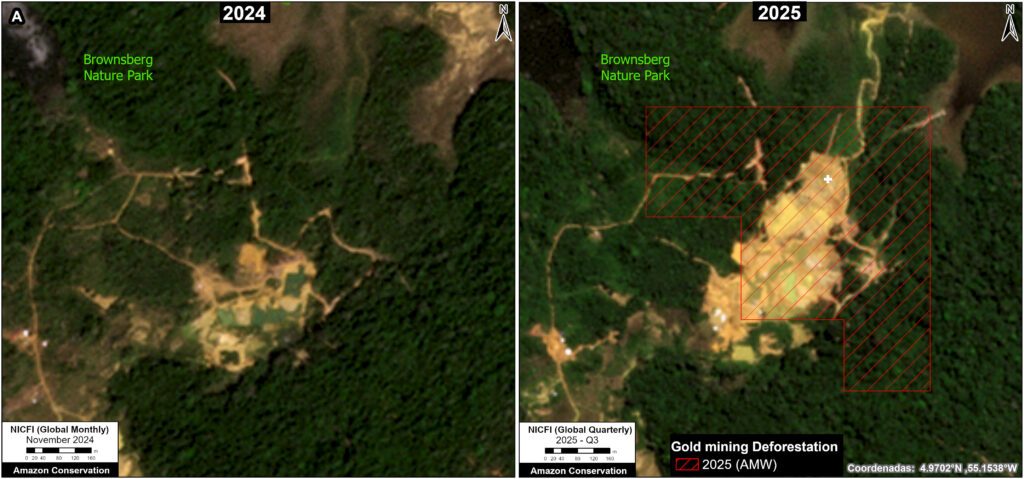
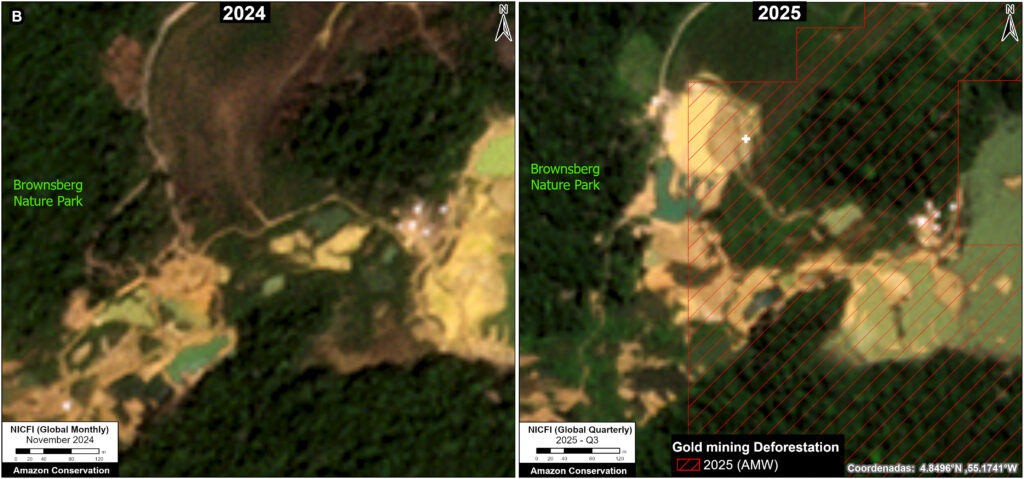
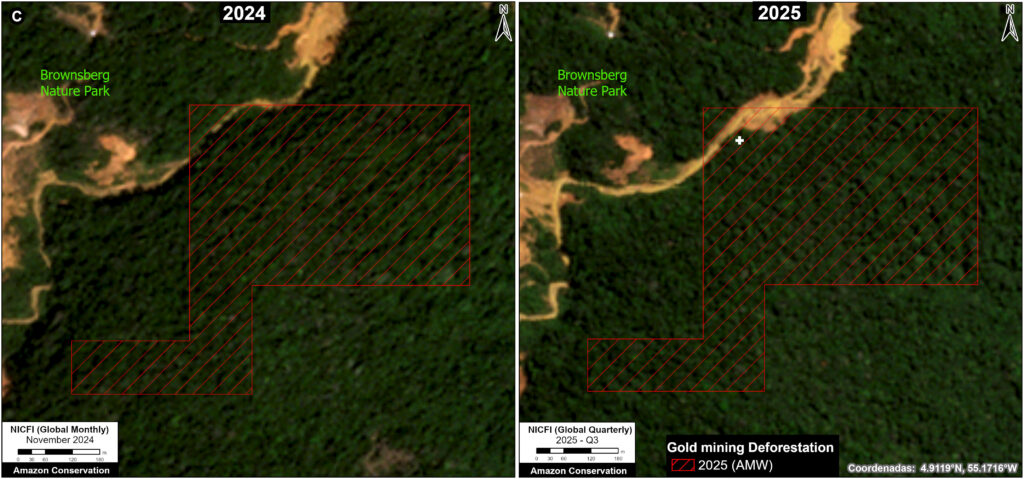
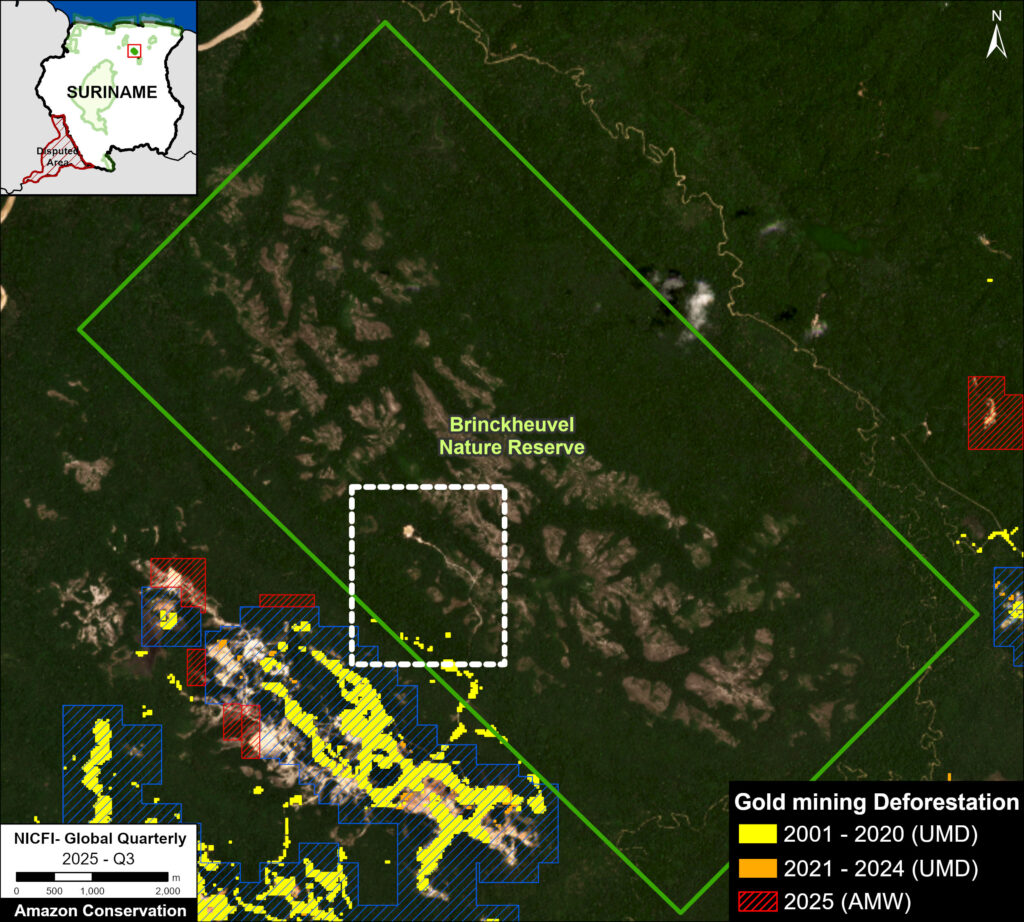


 Figure 1