MAAP #241: Rapid Expansion of Illegal Gold Mining in Tambopata National Reserve (Southern Peruvian Amazon)

Image 1. Recent expansion of illegal gold mining in Tambopata National Reserve. Data: ACCA, Planet.

Gold mining has been a notorious driver of deforestation in the southern Peruvian Amazon for several decades. This mining-related deforestation reached crisis levels in the mid-2010s, particularly affecting Tambopata National Reserve and its buffer zone (see MAAP #96 from January 2019). This situation led to the major government operation known as “Operation Mercury” in February 2019, and a subsequent initiative known as the “Restoration Plan” in 2021.

After a period of reduced mining activity due to Operation Mercury and the Restoration Plan, illegal gold mining has resumed an alarming expansion within Tambopata National Reserve, primarily during the second half of 2025 and early 2026 (see Graph 1 below).

During this recent period (2025–26), we find that a total area of ​​500 hectares was deforested due to illegal mining in the northern part of the Reserve along the Malinowski River, which forms part of its northern boundary (see Base Map below).

Analyzing very high-resolution satellite imagery (Planet’s SkySat, 0.5m), we detected a total of 183 mining structures (such as heavy equipment and excavators) and 67 mining camps across five mining zones within the northern part of Tambopata National Reserve, as of February 2026.

Based on this finding, we estimate that around 1,000 people are currently involved in illegal mining activities in the Reserve, using a conversion factor derived from the machinery and camps detected within the mining zones (ACCA, 2022).

In response to this situation, the Peruvian government has initiated several actions in early 2026 (January – March) to address the expanding invasion of illegal mining within Tambopata National Reserve. Through coordination between police and military institutions, these interventions have resulted in the seizure and destruction of machinery, equipment, and encampments used in illegal mining activities within the Reserve (Joint Command of the Armed Forces, 2026).

Below, we present:

  • Annual mining deforestation trends in Tambopata National Reserve (2016–2025);
    .
  • Four case studies featuring satellite imagery to illustrate the most recent mining expansion within the Reserve.
    .
  • 5 pillars of public policy regarding illegal mining in Tambopata National Reserve, including enforcement operations and state limitations; legislative setbacks and threats; and the 2026 political election.

Annual Mining Deforestation in Tambopata National Reserve

Graph 1 shows annual mining deforestation within Tambopata National Reserve for the period 2016–2025. The main ecosystems affected by this mining activity were the Alluvial Floodplain Forest and Non-Floodplain Terrace Forest.

Graph 1. Mining Deforestation in Tambopata National Reserve. Data: ACA, ACCA, BCRP, CINCIA, MapBiomas Perú.

During this period, three key events stand out:

First, Operation Mercury—a multisectoral intervention against illegal mining in critical zones of the Madre de Dios region, carried out in early 2019—resulted in a major reduction that same year compared to 2016 and 2017, when higher levels of mining expansion were recorded. During 2017 and 2018, a series of operations and interdictions were launched in the region that helped combat the advance of illegal mining (AIDER, 2021). Coupled with these actions, the success of Operation Mercury led to a substantial reduction in mining expansion within the Tambopata National Reserve and its buffer zone (MAAP #104, MAAP #121).

Second, the “Restoration Plan“—a series of military interventions conducted in 2021 in critical illegal mining zones within the southern Peruvian Amazon—also resulted in a major decrease in mining deforestation that same year, compared to the previous year. In 2020, due to the COVID-19 pandemic, difficulties arose regarding the execution of operations and patrols within Tambopata National Reserve and its buffer zone, leading to a reduction in police and military presence in key sectors (AIDER, 2021; DAR, 2023; Vadillo, 2022). Consequently, instances of illegal miners re-entering Tambopata were recorded (Romo, 2020). In response, the renewed military operations successfully combated the expansion of illegal mining activity in the Madre de Dios region, including Tambopata.

Thirdly, during 2025-early 2026, we recorded an alarming gold mining deforestation expansion (500 hectares), surpassing the figures registered during the critical years of 2016 and 2017 that led up to Operation Mercury. This sudden increase was likely driven by the exponential rise in the international price of gold (see red line in Graph 1). Thus, it is likely that the sustained rise in gold prices has influenced the expansion of illegal mining in recent years by boosting the expected profitability derived from the trade of extracted ore.

Base Map & Case Studies

The Base Map displays the recent expansion of 500 hectares deforested by illegal mining within Tambopata National Reserve during the second half of 2025 (431 hectares) and early 2026 (69 hectares through February). Mining activity is concentrated in the northwestern part of the Reserve, in areas adjacent to the Malinowski River. Furthermore, it has been identified that this illegal activity is taking place in the vicinity of several of the Reserve’s surveillance posts. Insets A–D indicate the location of the four case studies.

Base Map. Illegal Gold Mining Activity in the Tambopata National Reserve. Data: ACA, ACCA, CINCIA, MapBiomas Perú.

Case Study A. Sector Isla Córdoba

In this area, located in the northwest corner of Tambopata National Reserve (see Box A in the Base Map), we recorded 106 hectares of mining deforestation between January 2025 and January 2026 (Figure A1). Note that this mining zone is situated near the Reserve’s Otorongo surveillance and control post (see Base Map).

Figure A1. Mining deforestation in the Isla Córdoba sector of Tambopata National Reserve. Data: ACCA, Planet.

Figure A2 shows that a large portion of this deforestation (80%) occurred between July and December 2025 (indicated in orange) and continued to expand until early 2026 (red). This sector has recorded mining activity in previous years (blue), primarily between 2017 and 2018. As part of the actions undertaken during Operation Mercury in 2019, military operations were carried out to intervene in the mining zones located within this sector, achieving a reduction in the expansion of illegal mining during this period (Salazar, 2024).

Figure A2. Mining deforestation in the Isla Córdoba sector of Tambopata National Reserve. Data: ACCA, Planet.

The presence of gold mining infrastructure has expanded into the various pools located in this sector, with a total of 53 dredges and 20 mining camps recorded in February 2026 (Figure A3).

Figure A3. Mining infrastructure in the Isla Córdoba sector of Tambopata National Reserve. Data: ACCA, Planet.

Case Study B. Sector A4

In this area, also located in the northwest corner of Tambopata National Reserve (see Box B on the Base Map), we recorded 101 hectares of mining deforestation between February 2025 and February 2026 (Figure B1).

Figure B1. Mining deforestation in Sector A4 of Tambopata National Reserve. Data: ACCA, Planet.

Figure B2 shows that, in early 2025, we detected the expansion of the first mining zones in this sector into the interior of Tambopata National Reserve (indicated yellow). Subsequently, between July and December 2025, an increase of 83 hectares of mining activity was recorded (orange), representing 82% of the total recorded. This increase in mining activity continued until early 2026 (red), expanding further into the interior of the Reserve.

Figure B2. Data: ACCA, Planet

In this sector, we recorded 68 mining structures located within pits, as well as the presence of 33 mining camps, in February 2026 (Figure B3). The number of structures identified in this zone was higher compared to the other sectors analyzed.

Figure B3. Mining infrastructure in Sector A4 of Tambopata National Reserve. Data: ACCA, Planet.

Caso Study C. Sector A7

In this area, located in the northern part of Tambopata National Reserve (see Box C on the Base Map), we recorded 25 hectares of mining deforestation between February 2025 and February 2026 along the Malinowski River (Figure C1). This new mining zone is situated near the Azul surveillance and control post (see Base Map).

Figure C1. Mining deforestation in Sector A7 of Tambopata National Reserve. Data: ACCA, Planet.

Figure C2 shows that mining began in the second half of 2025 (indicated in orange), marked by the presence of a mining pit adjacent to the Malinowski River, and subsequently expanded over the following months. In 2026 (red), we recorded an increase of 17 hectares, representing 68% of total deforestation. No mining infrastructure was recorded in this sector due to the lack of available very high-resolution satellite imagery for 2026.

Figure C2. Mining deforestation in Sector A7 of Tambopata National Reserve. Data: ACCA, Planet.

Case Study D. Sector Isla Correntada

In this area, located in the northeast of Tambopata National Reserve (see inset D on the Base Map), we recorded 111 hectares of mining deforestation between January 2025 and January 2026 (Figure D1). This mining zone is situated near the Yarinal surveillance and control post (see Base Map).

Figure D1. Mining deforestation in the Isla Correntada sector of Tambopata National Reserve. Data: ACCA, Planet.

Figure D2 shows that mining began expanding slightly during the January–June 2025 period (indicated in yellow). Subsequently, an advancement of mining activity was detected starting in July 2025. The expansion of mining was greatest during the July–December 2025 period, during which a total of 85 hectares of deforestation were recorded (orange), representing 76% of the total. As of 2026, mining continues to expand in various zones within the Isla Correntada sector (red).

Figure D2. Mining deforestation in the Isla Correntada sector of Tambopata National Reserve. Data: ACCA, Planet.

A total of 11 mining structures have been identified within various mining pits, and three mining camps have also been located in this sector. Figure D3 depicts various mining structures engaged in gold extraction near the Malinowski River, as well as the presence of a mining camp.

Figure D3. Mining infrastructure in the Isla Correntada sector of Tambopata National Reserve. Data: ACCA, Planet.

Public Policies Addressing Illegal Mining in the Tambopata National Reserve

The satellite imagery analysis presented in this report documents the advancement of illegal mining deforestation within Tambopata National Reserve during the 2025–2026 period. To contextualize these findings, this section examines the Peruvian State’s public policy framework during the same period, identifying the institutional, regulatory, and political factors that directly or indirectly influence the dynamics observed within the reserve.

The analysis is organized around five key themes:

  • The State’s Response: Operations and Interdiction;
  • Structural Limitations of the State Response;
  • Legislative Setbacks Favoring Illegal Mining;
  • Legislative Threats to Protected Natural Areas;
  • 2026 Political and Electoral Context.

Taken together, the regulatory and institutional landscape of the 2025–2026 period reflects a structural tension between the control measures deployed by the Executive Branch and a regressive legislative trend that has weakened mechanisms for prevention, oversight, and enforcement. This contradiction constitutes one of the primary explanatory factors behind the expansion of illegal mining documented in the analyzed satellite imagery. Each of these key areas is discussed in detail below.

1. State Response: Operations and Interdiction

In response to the encroachment of illegal mining within Tambopata National Reserve, the Peruvian State implemented a series of operational and regulatory control measures during the 2025–2026 period. The most persistent exceptional measure in the region is the state of emergency in Madre de Dios, in effect uninterruptedly since April 7, 2023, when it was declared by Supreme Decree No. 046-2023-PCM. This declaration encompasses the districts of Tambopata, Inambari, Las Piedras, and Laberinto—all located within the Tambopata province—as well as the districts of Madre de Dios and Huepetuhe in the Manu province. The measure mandated that the Peruvian National Police (PNP) assume control of internal order, supported by the Armed Forces, with the specific aim of combating illegal mining, illegal logging, and illicit drug trafficking within the region.

Building upon this declaration, land- and river-based interdiction operations were carried out within the Reserve.  The National Service of Natural Protected Areas (SERNANP)—in coordination with the National Police of Peru (PNP), the General Directorate of Captaincies and Coast Guards of Peru (DICAPI), and the Specialized Environmental Prosecutor’s Office (FEMA)—activated, through the Second Amazon Protection Brigade, a dynamic control strategy featuring continuous patrols at critical points within the reserve, with particular emphasis on the Otorongo, Azul, Yarinal, and Malinowski sectors—the latter serving as a key hub for both riverine and land-based control along the reserve’s northern boundary.

The scope of these interventions, carried out between January and March 2026, was considerable in terms of the equipment seized or destroyed by authorities, including mining rafts, engines, motors, pumps, generators, fuel, and motorcycles. In addition, 340 mining camps were dismantled. Nevertheless, satellite monitoring indicates that these actions failed to reverse the expansion of mining activity in the targeted sectors (see Figure A2).

Parallel to these actions in the field, the Executive sought to strengthen the legal framework for prosecuting crime. On January 20, 2026, it promulgated Legislative Decree No. 1695, which amends the Penal Code to stiffen penalties against illegal mining, establishing prison sentences of five to eight years for those who engage in mining activities without authorization or outside the formalization process, and six to nine years for those who traffic in chemical inputs, machinery, or minerals of illicit origin (Presidency of the Republic of Peru, 2026).

Furthermore, the regulation expressly incorporates illegal mining into the scope of the Law Against Organized Crime (Law No. 30077), thereby enabling the use of special investigative tools for the prosecution of these networks. Additionally, on February 5, 2026, a new extension of the state of emergency was ordered for an additional 60 days by means of Supreme Decree No. 017-2026-PCM, the validity of which was extended until April 6, 2026. However, the effectiveness of these measures—both operational and regulatory—encountered concrete limitations, which are analyzed in the following section.

2. Structural Limitations of the State Response

Despite the operational deployment described in the previous section, the State’s response faced limitations that reduced its effectiveness and that explain, in part, the continued advance of illegal mining documented in satellite imagery. The most critical limitation was budgetary in nature: the special units of the Peruvian Navy, which maintained a permanent presence at control and surveillance posts along the Malinowski River (the natural boundary between the Reserve and its buffer zone), were withdrawn during 2025 due to a lack of funding. This interrupted interdiction operations in one of the most active entry corridors for illegal mining into the interior of the reserve—a fact consistent with the data presented in the Base Map (Chumpitaz, 2025).

This absence of a continuous field presence resulted in a response capacity that was reactive rather than preventive. Although the High Commissioner for the Fight Against Illegal Mining, Rodolfo García Esquerre, noted that the budget allocated to this struggle was increased for 2026, specialists warned that such an increase would prove insufficient as long as current regulations continue to foster conditions of impunity for illegal operators (Chumpitaz, 2025). Along similar lines, the Illegal Mining Observatory (OMI) pointed out that judges, prosecutors, and government attorneys face budgetary constraints and a shortage of specialized personnel, thereby jeopardizing the effective enforcement of Legislative Decree No. 1695, approved in January 2026 (Pizarro, 2026).

The result of these limitations is a structural gap between the State’s operational response and the scale of the problem. The fact that the Madre de Dios region has been under a continuous state of emergency since April 2023—with consecutive extensions every 60 days—attests to the chronic nature of the phenomenon and the inadequacy of the measures adopted to reverse it in a sustained manner: interdiction operations succeed in dismantling specific equipment and camps, but they fail to prevent the reconstitution of criminal networks or the steady advance of the mining frontier deeper into the reserve. This gap cannot be explained solely by budgetary constraints or limitations in institutional capacity, but also by a series of legislative setbacks that—as analyzed in the following section—have worked at cross-purposes with the control efforts deployed in the field.

3. Legislative Setbacks Favoring Illegal Mining

As noted in the previous section, the limitations of the state response cannot be explained solely by operational or budgetary constraints, but also by a series of legislative amendments approved during the 2025–2026 period that have weakened the mechanisms for preventing, overseeing, and sanctioning illegal mining. These regulations—approved concurrently with interdiction operations—create a contradictory regulatory framework that reduces the effectiveness of control actions deployed in the field.

The most significant setback was the fifth extension of the Mining Formalization Registry (REINFO), approved by the Congressional Plenary in December 2025 and enacted by the Executive Branch via Law No. 32537 on December 26 of the same year. Through this measure, the deadline for the mining formalization process was extended until the end of 2026, with the possibility of an earlier closure should the MAPE Law and its implementing regulations enter into force prior to that date. It is worth noting that this marks the fifth consecutive extension of a mechanism originally conceived as transitional; previous extensions occurred in 2019, 2024, June 2025, and December 2025 (Zevallos Morón, 2026). Isabel Calle (2025) pointed out that, with this extension, the country remains trapped in a system that has failed to drive effective formalization and has, on the contrary, created incentives for non-compliance with the law, thereby exacerbating environmental degradation in regions such as Madre de Dios.

Compounding this setback are additional amendments that have weakened the legal tools available for combating illegal mining. Congress repealed the First Final Complementary Provision of Legislative Decree No. 1607, which had amended Law No. 30077 on Organized Crime, thereby curtailing the National Police’s (PNP) authority to take action regarding the illegal possession of explosives—particularly in cases involving miners suspended from the REINFO registry. This measure drew harsh criticism from the Office of the Comptroller General of the Republic, which warned that its implementation could facilitate illicit activities linked to informal mining (Tuesta, 2024).

Taken together, these legislative setbacks create a scenario in which interdiction operations and the stricter penalties introduced by Legislative Decree No. 1695 operate within a regulatory framework that simultaneously broadens the scope of tolerance toward informal mining. Furthermore, this landscape is compounded by legislative initiatives that pose a direct threat to the region’s Natural Protected Areas, as discussed in the following section.

4. Legislative Threats to Protected Natural Areas

Added to the landscape of legislative setbacks described in the previous section are parliamentary initiatives during this same period that pose a direct threat to the legal protection framework for Protected Areas in the Madre de Dios region, including ecosystems adjacent to Tambopata National Reserve. Unlike the regulations analyzed previously, these initiatives do not merely weaken existing oversight mechanisms regarding illegal mining; rather, they aim to alter the legal protection status of spaces that currently constitute the final institutional barrier against the expansion of extractive activities in the region.

The first of these initiatives is Bill No. 1822/2024-CR, introduced on July 2, 2025, by Congressman Jorge Luis Flores Ancachi (Acción Popular). The proposal seeks to amend nine articles of the Protected Natural Areas Law (Law No. 26834), thereby opening the door to hydrocarbon extraction activities in spaces that currently enjoy the highest level of legal protection—such as national parks, as well as national and historical sanctuaries—and granting the Ministry of Energy and Mines greater authority over the management of these areas. Vanessa Cueto warned that, should this amendment be approved, protected areas would ultimately become mere “paper parks,” left exposed to the impacts of high-intensity extractive activities. Among the areas directly affected are Bahuaja Sonene and Manu National Parks, both of which border the Tambopata National Reserve (Sierra Praeli, 2023). Along similar lines, on March 20, 2026, Congressman Eduardo Salhuana introduced Bill No. 14288/2025-CR, which would declare the development of the Madre de Dios gas basin to be a matter of national interest and strategic priority. The bill would—on an exceptional basis—authorize gas exploration and exploitation activities within “indirect-use” Protected Natural Areas (ANPs), including the Manu and Bahuaja Sonene National Parks, as well as the Amarakaeri Communal Reserve. Critics have argued that the approval of this bill would constitute a regulatory regression of the highest order, given that both the Manu National Park and the Bahuaja Sonene National Park are indirect-use ANPs which, under current legislation, expressly prohibit the extraction of natural resources within their boundaries (SPDA, 2026).

During the same period, Bill No. 3377—originally introduced in October 2022 by the same congressman—was reactivated. This bill proposes to authorize the granting of mining concessions over areas that have reverted to State control due to non-compliance with obligations, inactivity, or other grounds for termination or annulment. If approved, this proposal would lift the current restrictions on the granting of new mining concessions in Madre de Dios (Salazar Vega, 2026).

These bills—although still in the legislative debate stage at the time this report was finalized—reflect a trend toward subordinating the region’s environmental protection to extractive interests. This is occurring within a context where pressure on Tambopata National Reserve has already reached critical levels, according to the satellite data analyzed. This scenario is further exacerbated by political and social factors, which are examined in the following section.

5. Violence Against Environmental Defenders and the 2026 Political-Electoral Context

The scenario of legislative pressure and institutional weakness described in the preceding sections unfolds within a social and political context that further exacerbates the situation of Tambopata National Reserve. Two factors stand out in this regard: the violence perpetrated against those who defend the territory, and the absence of a robust environmental agenda within the framework of the 2026 national electoral process.

As an example regarding violence against environmental defenders, on July 26, 2025, Hipólito Quispe Huamán—an environmental defender for Tambopata National Reserve—was murdered while traveling toward his home along the Interoceanic Highway in Madre de Dios. His death adds to the more than 30 killings of environmental defenders and Indigenous leaders recorded in Peru since 2020, solidifying a pattern of violence that functions as a deterrent against those who monitor and denounce illegal activities within the reserve (Sierra Praeli, 2025).

Compounding this factor is the political-electoral context of 2026. The national electoral process—which entails the renewal of both the Executive and Legislative branches—is unfolding against a backdrop of political instability and the progressive weakening of environmental policies. Although Peru’s natural capital underpins approximately 20% of the GDP and 65% of national agriculture, the environment does not occupy a central place in the candidates’ proposals, according to experts consulted by various organizations (Guardia Brown, 2026). This absence of structural political will implies that the substantive decisions necessary to halt the advance of illegal mining in the Reserve—such as the approval of an effective MAPE Law, the definitive closure of the REINFO, or the budgetary strengthening of SERNANP—are unlikely to be addressed in the short term, thereby prolonging the window of vulnerability documented in this report.

6. Public Policy Conclusion

An analysis of the Peruvian State’s public policy framework during the 2025–2026 period reveals a scenario of profound institutional contradiction. On one hand, the Executive branch implemented concrete response measures to address the mining crisis in Tambopata National Reserve, including declaring a state of emergency in the province of Tambopata, conducting land- and river-based interdiction operations, and strengthening the penal framework through Legislative Decree No. 1695. On the other hand, these actions operate upon a normative and institutional foundation that has simultaneously been undermined by regressive legislative decisions, structural budgetary constraints, parliamentary initiatives threatening the legal status of the region’s natural Protected Areas, and a climate of violence against environmental defenders that diminishes territorial surveillance capacity.

This contradiction is not merely circumstantial but structural: it reflects the absence of a comprehensive and sustained policy for the protection of the Reserve—one that coherently integrates the available operational, normative, budgetary, and institutional instruments. One indication of this is that, given the magnitude of the problem, SERNANP is promoting the establishment of a unified command to combat illegal mining, recognizing that the PNP’s capacity for territorial control has been overwhelmed by the scale of the phenomenon and that a more comprehensive intervention by the Armed Forces is required.

In this regard, the findings from the satellite analysis presented in this report cannot be interpreted solely as the result of the activities of criminal networks, but also as the territorial manifestation of an environmental governance framework that, during the period under review, failed to halt the encroachment of illegal mining or reverse the deforestation trend in one of the country’s most critical protected natural areas. The contrast with the results of Operation Mercury in 2019 and Plan Restoration in 2021—both associated with measurable reductions in deforestation documented in Graph 1—suggests that the effectiveness of the State does not depend on the absence of tools, but rather on the coordination, coherence, and sustainability with which these are deployed.

Methodology

The identification of gold mining deforestation in Tambopata National Reserve utilized historical mining deforestation data in the Madre de Dios region, generated by the Center for Amazonian Scientific Innovation (CINCIA) for the years 1984–2019, by MapBiomas Perú for 2020, and by Amazon Conservation (ACA) for the period from January 2021 to March 2024.

Next, the LandTrendR algorithm was used to identify forest loss in monthly Planet NICFI mosaics for the period April 2024 – July 2025. For the period August 2025 – February 2026, mining deforestation (identified using the monthly Planet NICFI mosaics at 4.7 m spatial resolution) was monitored to record the expansion of mining-related deforestation within the Reserve.

The identification of mining infrastructure and camps was based on the visual interpretation of very-high-resolution satellite imagery (Skysat from Planet) obtained (tasked) for the mining zones identified within Tambopata National Reserve.

References

Alza, R. (27 de febrero de 2026). Estado intensifica lucha contra minería ilegal en Tambopata. Rumbo Minero. https://www.rumbominero.com/actualidad/estado-intensifica-lucha-contra-mineria-ilegal-en-tambopata/

Andina. (4 de febrero de 2026). Normas Legales: prorrogan estado de emergencia en diversos distritos de Madre de Dios. Andina. https://andina.pe/agencia/noticia-normas-legales-prorrogan-estado-emergencia-diversos-distritos-madre-dios-1061822.aspx

Asociación para la Investigación y Desarrollo Integral – AIDER. (2021). Minería ilegal en la zona de amortiguamiento de la Reserva Nacional Tambopata. Cartilla N°17. https://aider.com.pe/publicacionesca/cartillas/Cartilla_Mineria_2021_VF_opt.pdf

Calle, I. (28 de noviembre de 2025). El Reinfo: una excepción que se volvió norma. SPDA. https://spda.org.pe/noticia/el-reinfo-una-excepcion-que-se-volvio-norma/

Chumpitaz, O. (31 de diciembre de 2025). Mafias mantienen en vilo al Parque Nacional del Manu y a la Reserva Nacional de Tambopata. La República. https://larepublica.pe/politica/2025/12/31/mafias-mantienen-en-vilo-al-parque-nacional-del-manu-y-a-la-reserva-nacional-de-tambopata-mineria-ilegal-hnews-775496

Conservación Amazónica (ACCA), Proyecto Prevenir – USAID. (2022). Estimación de la población minera informal e ilegal en el departamento de Madre de Dios, a partir del uso de imágenes satelitales sub métricas. https://repositorio.profonanpe.org.pe/handle/20.500.14150/2744

Comando Conjunto de las Fuerzas Armadas. (2026). Comando Operacional del Sur asesta golpe de S/ 1.7 millones contra la minería en Tambopata. Presidencia de la República del Perú. https://www.gob.pe/institucion/ccffaa/noticias/1374254-comando-operacional-del-sur-asesta-golpe-de-s-1-7-millones-contra-la-mineria-ilegal-en-tambopata

Derecho, Ambiente y Recursos Naturales – DAR. (2023). Desafiando la legalidad y la justicia: La minería ilegal en Madre de Dios. Lima, Perú. https://dar.org.pe/wp-content/uploads/2024/08/Mineria-ilegal-en-Madre-de-Dios-version-final.pdf

Finer, M., Mamani, N. (2020). Reducción de Minería Ilegal en la Amazonía Peruana Sur. MAAP: 121. https://www.maapprogram.org/es/mineria-peru-2020/

Guardia Brown. (26 de enero de 2026). Desafíos ambientales del Perú en 2026: minería ilegal, crimen organizado y gobernanza ambiental en un contexto electoral. Pulso PUCP. https://pulso.pucp.edu.pe/noticias/desafios-ambientales-del-peru-en-2026-mineria-ilegal-crimen-organizado-y-gobernanza-ambiental-en-un-contexto-electoral

Inforegión Redacción. (15 de enero de 2026). Destruyen 24 máquinas utilizadas para la minería ilegal en la Reserva Nacional de Tambopata. Inforegión. https://inforegion.pe/destruyen-24-maquinas-utilizadas-para-la-mineria-ilegal-en-la-reserva-nacional-de-tambopata/

Mongabay Latam. (18 de julio de 2025). ¿Qué cambios busca el proyecto de ley de Áreas Naturales Protegidas en Perú? Mongabay. https://es.mongabay.com/podcast/2025/07/que-cambios-busca-el-proyecto-de-ley-de-areas-naturales-protegidas-en-peru/

Pizarro, O. (4 de febrero de 2026). Minería ilegal en Perú: nuevo decreto endurece penas, pero no ataca las causas de fondo. Infobae. https://www.infobae.com/peru/2026/02/04/mineria-ilegal-en-peru-nuevo-decreto-endurece-penas-pero-no-ataca-las-causas-de-fondo/

Presidencia de la República del Perú. (20 de enero de 2026). Gobierno fortalece medidas para combatir delito de minería ilegal. Presidencia de la República del Perú. https://www.gob.pe/institucion/presidencia/noticias/1337593-gobierno-fortalece-medidas-para-combatir-delito-de-mineria-ilegal

Romo, V. (2020). Perú: Minería ilegal entra a la Reserva Nacional Tambopata ante ausencia temporal de la policía. Mongabay. https://es.mongabay.com/2020/03/peru-tambopata-mineria-ilegal-ausencia-de-policia/

Salazar, E. (2024). La violencia replegó al Estado peruano y presiona la Reserva Nacional Tambopata en Perú. Mongabay. https://es.mongabay.com/2024/07/violencia-replego-al-estado-peruano-presiona-reserva-nacional-tambopata-peru/

Guardia Brown. (26 de enero de 2026). Desafíos ambientales del Perú en 2026: minería ilegal, crimen organizado y gobernanza ambiental en un contexto electoral. Pulso PUCP. https://pulso.pucp.edu.pe/noticias/desafios-ambientales-del-peru-en-2026-mineria-ilegal-crimen-organizado-y-gobernanza-ambiental-en-un-contexto-electoral

Inforegión Redacción. (15 de enero de 2026). Destruyen 24 máquinas utilizadas para la minería ilegal en la Reserva Nacional de Tambopata. Inforegión. https://inforegion.pe/destruyen-24-maquinas-utilizadas-para-la-mineria-ilegal-en-la-reserva-nacional-de-tambopata/

Mongabay Latam. (18 de julio de 2025). ¿Qué cambios busca el proyecto de ley de Áreas Naturales Protegidas en Perú? Mongabay. https://es.mongabay.com/podcast/2025/07/que-cambios-busca-el-proyecto-de-ley-de-areas-naturales-protegidas-en-peru/

Pizarro, O. (4 de febrero de 2026). Minería ilegal en Perú: nuevo decreto endurece penas, pero no ataca las causas de fondo. Infobae. https://www.infobae.com/peru/2026/02/04/mineria-ilegal-en-peru-nuevo-decreto-endurece-penas-pero-no-ataca-las-causas-de-fondo/

Presidencia de la República del Perú. (20 de enero de 2026). Gobierno fortalece medidas para combatir delito de minería ilegal. Presidencia de la República del Perú. https://www.gob.pe/institucion/presidencia/noticias/1337593-gobierno-fortalece-medidas-para-combatir-delito-de-mineria-ilegal

Vadillo Vila, J. (2022). La minería ilegal y su impacto en tiempos de pandemia. Diario El Peruano. https://elperuano.pe/noticia/170967-la-mineria-ilegal-hoy

Zevallos Morón, J. (26 de diciembre de 2025). Gobierno promulgó ley que amplía la vigencia del Reinfo hasta diciembre de 2026. RPP. https://rpp.pe/politica/gobierno/gobierno-promulgo-ley-que-amplia-la-vigencia-del-reinfo-hasta-diciembre-de-2026-noticia-1669269

Acknowledgments

We express our gratitude to the Sub-directorate of Strategic Information and Research on Protected Natural Areas and the Sub-directorate of Supervision, Surveillance, and Control of the National Service of Protected Natural Areas by the State (SERNANP) for their contributions and comments on this report.

This report is part of a series focusing on gold mining in the Peruvian Amazon, through a strategic collaboration between Amazon Conservation and Conservación Amazónica – Peru (ACCA), with support from the Gordon and Betty Moore Foundation

Pacsi R, Novoa S, La Torre S, Balbuena H, Finer M, Santana A, Castillo H. (2026). Rapid Expansion of Illegal Gold Mining in Tambopata National Reserve (Southern Peruvian Amazon). MAAP:241.


MAAP #240: Expansion of illegal gold mining in the Xingu Basin of the Brazilian Amazon (part 2. Protected Areas)

Base Map. Mining sites in the Xingu Socio-environmental Diversity Corridor. Data: ACA/MAAP, ISA.

We present the second of a two-part series on illegal gold mining deforestation in the Xingu River Basin, located in the eastern Brazilian Amazon (states of Pará and Mato Grosso). The current report examines mining in protected areas of the Xingu, while Part 1 focused on Indigenous territories (see MAAP #239)

The Xingu Basin is the site of the largest historical concentration of gold mining deforestation in the Brazilian Amazon (see MAAP #235). At the heart of this basin is the Xingu Socio-environmental Diversity Corridor, which is one of the largest continuous blocks (over 26 million hectares) of designated forests on the planet, connecting 24 Indigenous territories and 9 protected areas (see Base Map). Despite the official land designations, the area remains threatened, especially by the expansion of illegal gold mining driven by record high gold prices.

To address this challenge, the Xingu+ Network (Rede Xingu+) was created, a political alliance formed by a coalition of organizations representing the area. This network monitors deforestation and other pressures in the Xingu Corridor monthly, using the radar-based SiRAD X system. 

In 2025, the Xingu+ Network partnered with Amazon Conservation, facilitating access to high-resolution optical images (from Planet), allowing for validation of alerts and identification of drivers. This collaboration also incorporates the online public dashboard Amazon Mining Watch.

Both systems, SiRAD X and Amazon Mining Watch, have detected a major expansion of gold mining deforestation since 2018 in the Corridor, including continued illegal activity during 2025. Throughout the report, we present data for both systems, noting their slight differences due to varying methodologies (Note 1), but the overall patterns of both datasets are consistent. 

Between 2018 and 2024, the Sirad X monitoring system recorded the loss of around 11,500 hectares of forest within the Indigenous territories and protected areas of the Xingu Corridor (Amazon Mining Watch estimates around 16,000 ha), plus 400 hectares in 2025 (January – September), similar to the estimate of Amazon Mining Watch.

Both monitoring systems have detected recent mining deforestation in 6 protected areas in the Xingu Corridor (Note 2), in addition to the 5 Indigenous territories reported in part 1.

In Part 1, we detailed the recent gold mining deforestation in three of these Indigenous territories (Kuruaya, Baú, and Kayapó). 

Here, in part 2, we focus on the recent gold mining deforestation in three of these protected areas (Altamira National Forest, Terra do Meio Ecological Station, and Nascentes da Serra do Cachimbo Biological Reserve) in the Xingu Corridor, including the presentation of a series of high-resolution images.

The Base Map indicates the focal areas of this series, with Points A-C covered in the first report (Indigenous territories), and Points D-F in the current second report (protected areas). 

Mining in Protected Areas

Altamira National Forest

The Altamira National Forest (located in Pará state) is experiencing expanding illegal mining in three locations with notable increases in 2025. In just the first eight months of 2025, the area affected by illegal mining in the Altamira National Forest has already exceeded the total environmental damage recorded for the entire year of 2024, highlighting the urgent need for enforcement operations in the area.

Mining began in its northwestern and western sections between 2016 and 2018 and expanded 832 hectares by September 2025. Figure D1 shows recent mining deforestation in the western section, between October 2024 (left panel) and September 2025 (right panel). Although there are mining exploration applications for these sections, mining is not permitted in the area’s Management Plan or in its creation decree (Decree No. 2483, 1998). See Note 3 for comparison with AMW.

Figure D1 Data: Planet, NICFI

The mining in the southeastern section began in 2024 and expanded to a cumulative total of 36 hectares by October 2025, according to the Xingu+ Network monitoring. Gold mining in the southeastern section accounted for 45.7% of the area deforested by mining operations in 2025 within the National Forest, with the peak of its expansion occurring in June. Figure D2 shows recent mining deforestation in this section, between September 2024 (left panel) and September 2025 (right panel). 

Figure D2 Data: Planet, NICFI

Terra do Meio Ecological Station

The Terra do Meio Ecological Station has emerged as a new mining front. First identified in September 2024, the mining rapidly expanded to a cumulative total of 30 hectares by the end of 2025, according to the Xingu+ Network monitoring (see Note 4 for comparison with AMW). Figure E shows this expansion between December 2024 (left panel) and September 2025 (right panel).

Although the Terra do Meio Ecological Station faces other illegal activities, such as deforestation, the presence of illegal mining operations within its boundaries is particularly concerning. This case not only demonstrates how far the offenders have encroached on a strictly protected area, but also highlights their high level of operational capacities. This combination increases the risk that the activity will spread, causing environmental degradation in other parts of the protected area.

Figure E. Data: Planet, NICFI

Cachimbo Mountain Headwaters Biological Reserve

The Cachimbo Mountain Headwaters Biological Reserve is strategically located along the BR-163 highway in Pará. It is a strictly protected conservation area established by Decree No. – May 20, 2005, and is located between the municipalities of Altamira and Novo Progresso, in the Tapajós-Xingu interfluve, and adjacent to the Menkragnoti and Panará Indigenous Lands on its eastern boundary.

Illegal mining in the Biological Reserve began to expand, primarily starting in January 2025. At that time, the mining site—which had previously covered an area of two hectares—was the subject of a complaint filed in Official Letter No. 01/2025 by Rede Xingu+. In June, illegal mining in the Biological Reserve was reported again via Official Letter No. 15/2025, following an expansion of 18 ha, and in July, via Official Letter No. 18/2025, following a further expansion of 6.82 ha, totaling 26.82 ha.  

Two mining sites are located in the northeastern region of the Rebio, opened in November 2024 and March 2025, and another site in the eastern region, opened in June 2025. It is worth noting that the site in the eastern region was also the subject of a complaint in Official Letter No. 18/2025, as it is located on and causing pollution in a tributary of the Pitxatxá River, a river that borders the Menkragnoti Indigenous Territory and where six indigenous villages of the Kayapó people are located.

Illegal mining began in December 2024, expanding to a cumulative total of 19 hectares as of September 2025 across several locations in the protected area, according to the Xingu+ Network monitoring (see Note 5 for comparison with AMW).

Even after enforcement operations, gold mining activity continues to expand within the Cachimbo Mountain Headwaters Biological Reserve. Figures 1 and 2 show the rapid mining-deforestation expansion up to November 2025, and Figure 3 shows the construction of a landing strip between July and August, providing access to the gold mines in the eastern region.

Figure F1 shows recent mining deforestation in the northeast part of the Biological Reserve, between December 2024 (left panel) and November 2025 (right panel).

Figure F1 Data: Planet, NICFI

Figure F2 shows recent mining deforestation in the eastern part of the Biological Reserve, between June 2025 (left panel) and November 2025 (right panel).

Figure F2 Data: Planet, NICFI

Figure F3 shows a new landing strip (opened in August 2025) in the eastern part of the Biological Reserve, between June 2025 (left panel) and November 2025 (right panel).

Figure F3 Data: Planet, NICFI

Conclusion and Recommendations

Based on the information presented above (and the previous MAAP #239), it is clear that illegal mining in the Xingu basin is not an isolated activity. It has spread to both Indigenous territories and protected areas, with illegal activity advancing into new territories, indicating the existence of a support network that provides the operational capacity and infrastructure necessary for the activity. Illegal mining poses a direct threat to protected areas by both deforestation and the contamination of rivers through the use of mercury, which affect sensitive ecosystems and the populations that depend on these resources. 

Below, we propose a number of recommendations to Brazilian authorities with regards to: (i) the design of enforcement actions; (ii) monitoring and restoration (iii) traceability of gold supply chains.

(i) The design of enforcement actions

Isolated enforcement actions have not been sufficient to guarantee the long-term protection of Protected Areas. Therefore, it is essential to establish a strategy coordinated with other agencies to dismantle the logistical structure that operates and fuels illegal mining. Alongside this, the structuring of preventive measures is fundamental.

  • Establish permanent advanced bases (operated by government agencies such as ICMBio) in the most critical protected aeass, ensuring a constant presence to break the cycle of miners returning after eviction operations.
  • Focus on disabling airstrips and seizing heavy machinery (hydraulic excavators) within protected areas, coordinating with National Civil Aviation agency (ANAC) and National Oil, Petroleum and Biofuel Agency (ANP) to block clandestine airfields and fuel stations in the areas surrounding protected lands.
  • Strengthen oversight in the surroundings of protected areas to prevent legalized mining in nearby areas from serving as a front for illegal extraction within the boundaries of protected areas. This process would include the National Mining Agency (ANM), with oversight from other agencies.

(ii) Monitoring and restoration 

Strengthening surveillance and environmental recovery is essential to discourage the return of illegal miners.

  • Support management councils and associations of riverine and traditional populations in implementing surveillance protocols, recognizing the role of these communities in maintaining the integrity of sustainable-use protected areas.
  • Implement Degraded Area Recovery Plans (PRADs) focused on the revegetation of riparian forests and the containment of siltation caused by mining sediments.In federal areas, it would be ICMBio; in state conservation units, the Institute for Forest and Biodiversity Development of the State of Pará (IDEFLOR-Bio).

(iii) Traceability of gold supply chains.

Implement a data-cross-referencing system that automatically blocks the issuance of Electronic Fiscal Invoices (NF-e) for minerals whose declared origin overlaps with Protected Area polygons. Improve legislation regarding documentation of sourcing area in traceability mechanisms, making it more difficult to “launder” minerals illegally extracted from Protected Areas.

Notes

1. Methodology of monitoring systems

For Sirad X monitoring, radar images from the Sentinel-1 satellite are used, which are processed by a series of algorithms on the Google Earth Engine (GEE) platform, along with optical images from the Landsat-9 satellite (OLI-2 sensor) and Sentinel-2 satellite (MSI sensor). A team of analysts examines the monitored area, visually searching for anomalies in the produced images. Each deforestation polygon is evaluated based on its proximity to other areas of degradation and the history of the region, and, if necessary, people familiar with the location are contacted to confirm the deforestation. Field knowledge is fundamental for data validation.

For Amazon Mining Watch, the mine detector is an artificial neural network, which we train to discriminate mines from other terrain by feeding it hand-labeled examples of mines and other key features as they appear in Sentinel-2 satellite imagery. The network operates on square patches of data extracted from the Sentinel-2 L1C data product. Each pixel in the patch captures the light reflected from Earth’s surface in twelve bands of visible and infrared light. We average (median composite) the Sentinel data across a period of many months to reduce the presence of clouds, cloud shadow, and other transitory effects. During run time, the network assesses each patch for signs of recent mining activity, and then the region of interest is shifted by half a patch width for the network to make a subsequent assessment. This process proceeds across the entire region of interest.

2-5. Comparisons with Amazon Mining Watch

2. Altamira National Forest, Terra do Meio Ecological Station, Iriri State Forest, Riozinho do Anfrísio Extractive Reserve, Nascentes da Serra do Cachimbo Biological Reserve, and Rio Iriri Extractive Reserve.

3. As a comparison, Amazon Mining Watch indicates the total mining deforestation of 620 hectares in Altamira National Forest between 2018 and 2025.

4. As a comparison, Amazon Mining Watch indicates the total mining deforestation of 3 hectares in Terra do Meio Ecological between 2018 and 2025.

5. As a comparison, Amazon Mining Watch indicates the total mining deforestation of 51 hectares in Cachimbo Mountain Headwaters Biological Reserve between 2018 and 2025.

Acknowledgments 

This report is part of a series focusing on gold mining in the Amazon, through a strategic collaboration between Amazon Conservation and regional partners, with support from the Gordon and Betty Moore Foundation. In this case, we thank our partner Instituto Socioambiental (ISA) for leading this report.


MAAP #237: Gold Mining Deforestation in Suriname: Current State & Expansion into Protected Areas

Base Map. Suriname Gold Mining Deforestation. Data: Amazon Conservation/MAAP, AMW, UMD, GONINI

In previous Amazon-level reports (MAAP #235, MAAP #226, MAAP #197), we have indicated extensive gold mining deforestation in Suriname, located in the northeast part of the Amazon biome.

Here, we take a closer look at the current situation in Suriname.

The Base Map illustrates the gold mining deforestation across Suriname, from 2001 to 2025. Note that historically (2001-2024), the gold mining deforestation (indicated in yellow and orange) is concentrated in the northeast part of the country, along the border with French Guiana.

Across this area, we estimate the gold mining deforestation to be around 89,000 hectares. Of that total, around 25,000 hectares (28%) occurred in the last four years of 2021-2024.

In addition, new data from Amazon Mining Watch indicates the most recent deforestation of 2,800 hectares in 2025 (indicated in red).

The Base Map also shows that Brownsberg Nature Park is the most impacted conservation area by mining, while Brinckheuvel Nature Reserve is starting to experience a mining invasion.

Below, we detail the current gold-mining deforestation situation in both of these conservation areas, highlighting how to use the near-real-time online dashboard Amazon Mining Watch.

Amazon Mining Watch

Amazon Mining Watch (a partnership between Amazon Conservation, Earth Genome, and the Pulitzer Centre) is an online tool that uses machine learning to automate the analysis of satellite imagery and identify areas affected by mining across the entire Amazon. Importantly, it now provides systematic near-real-time (quarterly) gold mining detection alerts.

The video shows how to use Amazon Mining Watch to detect the latest cases of mining-related deforestation, in this case, quarters 2 and 3 of 2025. Note the fresh mining deforestation alerts in the northeast, central, and southeast parts of Brownsberg Nature Park.


Brownsberg Nature Park

Figure 1. Gold mining deforestation in Brownsberg Nature Park.  Data: ACA/MAAP, AMW, UMD, GONINI

Brownsberg Nature Park was established in 1969 and is managed by the Foundation for Nature Conservation in Suriname (STINASU).

Within the park, we estimate that gold mining deforestation amounted to 1,274 hectares from 2001 to 2024 (Figure 1).

This mining deforestation has impacted 8.8% of Brownsberg Nature Park’s total area (14,560 hectares).

Of this total, 315 hectares (26%) occurred in the last four years of 2021-2024 (indicated in orange). Note that this recent expansion is occurring in multiple sites across the park.

In addition, new data from Amazon Mining Watch indicates the most recent deforestation of 56 hectares in 2025 (indicated in red).


Panels A-C zoom in on three specific cases of recent (2025) mining deforestation in Brownsberg Nature Park. In each panel, we compare high-resolution satellite imagery from 2024 (left) and 2025 (right). In each of the right panels, we also include the detected mining area data from Amazon Mining Watch.

Brinckheuvel Nature Reserve

Figure 2. Gold mining invasion of Brinckheuvel Nature Reserve. Data: ACA/MAAP, AMW, UMD, GONINI

Figure 2 shows the area of detected gold mining invasion of Brinckheuvel Nature Reserve (see white inset).

Note that this incursion originates from a known mining zone to the southwest of the reserve.


This 3-part panel shows a series of satellite images detailing the entry and expansion of this mining area. The left panel is the baseline at February 2025. The middle panel shows the emergence of the new mining area in the reserve in March 2025. The right panel shows the expansion of this mining area to 1.3 hectares. The access road to this new mining area is approximately 2.3 km long.

Policy Implications

In response to this report and related information, the Suriname government has indicated plans to tighten its approach to illegal gold mining in Brownsberg Nature Park.

Specifically, the government will strengthen cooperation, coordination, and information sharing between the relevant agencies to more effectively and decisively combat illegal gold mining activities in the park. This agreement was reached during a meeting between the Ministry of Land Policy and Forest Management, STINASU, the Suriname Gold Sector Management Board, and the National Forest Service.

The result is expected to be joint enforcement actions against the illegal mining activity in Brownsberg Nature Park. In addition, structural and sustainability measures were also discussed to address the underlying causes of the illegal mining in the area.

Similar efforts are called for to address the invasion of Brinckheuvel Nature Reserve and prevent irreversible damage to the area.

Finally, Amazon Mining Watch fills a critical regional gap by enabling near–real-time detection of emerging and expanding gold-mining deforestation across the Amazon, including within protected areas. In countries where no official mining-specific detection systems exist, AMW provides a free and operational tool for the quarterly identification of new mining activity. It can also be integrated as a complementary data source to existing monitoring approaches, including satellite-based systems and drone-based field verification.

Acknowledgments

This report was made possible by the generous support of the Gordon and Betty Moore Foundation. We thank Amazon Conservation Team for their helpful review.


MAAP #235: AI-powered detection of Amazon gold mining deforestation in real-time

Screen shot from the updated Amazon Mining Watch site.

As gold prices continue to skyrocket and shatter historical records, small-scale, but widespread, gold mining activity also continues to be one of the major deforestation drivers across the Amazon.

In collaboration with its network of partners in the region, MAAP has produced many reports documenting the expansion of gold mining across the Amazon over the years, highlighting often previously undocumented cases (see archive).

Given the vastness of the Amazon, however, it has been a challenge to systematically detect all new mining fronts in real-time. Such a timely and comprehensive system is crucial to ensure that monitoring can be the basis for a swift and consistent enforcement response from authorities.

Since 2023, Amazon Conservation, in partnership with Earth Genome and the Pulitzer Center, has been developing an online dashboard known as Amazon Mining Watch (MAAP #226). This online tool automates the analysis of satellite imagery through machine learning to identify areas affected by mining across the entire Amazon, from 2018 to 2024. 

In a major advance, we are glad to announce that Amazon Mining Watch (AMW) will now move to quarterly updates for this data, achieving systematic near-real-time detection of new artisanal gold mining fronts across the region.

Additional functionalities have been added to the AMW that will enhance the analysis related to illegal gold mining in the biome, namely: an analysis of the legality of mining sites, and an economic valuation of the social and environmental damage through the mining impacts calculator tool (see Annex).

FIRST QUARTERLY UPDATE REPORT: MINING EXPANSION ACROSS THE AMAZON

Here, we present our first quarterly update report based on this fresh data for quarters 2 and 3 of 2025 (April-September 2025). The following Base Map shows the locations of recent (Q3 of 2025) mining deforestation across the Amazon, in relation to the cumulative mining impact area previously detected.

Key findings from the first quarterly updates include:

  • We confirm the recent expansion of gold mining in all nine countries of the Amazon (37,109 hectares in 2025).
  • Brazil registered the largest recent mining expansion area (15,538 ha in 2025), followed by Peru (6,511 ha) and Guyana (4,942 ha).
    In addition,
    Venezuela, Suriname, Ecuador, and Bolivia all had over 2,000 hectares of recent impact.
  • Guyana and Suriname have the largest area of mining-related deforestation relative to their size.
  • The total area of gold mining expansion in the second quarter of 2025 represents over 19,000 hectares
  • Mining expansion accelerated in the third quarter (July-Sept) of 2025, with over 17,000 hectares of forest lost to mining, almost twice the rate observed in the first half of the year.
  • Despite experiencing relatively widespread river-based mining, Colombia is the only country in the region that had been so far mostly spared from the impacts of gold mining on land (also referred to as “alluvial mining”). The recent crossing of alluvial mining along the Rio Puré from Brazil into Colombia, further described below, could put an end to this exception and explains almost single-handedly the sharp uptick seen in the last quarter (+58%).
  • In 2025, over 200 (222) protected areas and Indigenous territories experienced new mining activity, and therefore likely to represent illegal mining. The estimated mined area of these 2025 mining events is over 14,000 hectares (14,004 ha). Of this total, 56% occurred in protected areas, and 44% in Indigenous territories.

CASES OF RECENT GOLD MINING DEFORESTATION ACROSS THE AMAZON

Base Map. Amazon gold mining deforestation highlighted cases Data: AMW, ACA/MAAP.

The Base Map shows the locations of confirmed recent (Q3 of 2025) mining deforestation across the Amazon, in relation to the cumulative mining impact area.

In each set of panels displayed below, we show high-resolution satellite imagery before (left panel) vs after (right panel) the recent gold mining deforestation. The red polygons indicate the pixels highlighted by the AI model as a new quarter 3 mining deforestation event. Yellow polygons are previously detected pixels.


A. Rio Puré, Colombia-Brazil border

The Q3 2025 detection revealed that alluvial gold mining has, for the first time, crossed the border between Brazil and Colombia, into the Rio Puré National Park. A relatively large-scale operation appears to be ongoing and expanding in one of the most remote corners of the Amazon, affecting one of the largest intact forest landscapes still remaining globally.

Mining along the Rio Puré is estimated to have started around 2018, gradually expanding along the whole Brazilian portion of the river between the border with Colombia and where it meets the Japurá river, itself one of the major tributaries of the Amazon river. The clear difference in the river’s color between the last two quarters also reveals the amount of sediments released from the mining operation, which greatly increased water turbidity. 

The verified expansion of the mining into the Colombian side, under National Park status, makes this a clear case for transboundary collaboration between the enforcement authorities of Brazil and Colombia. This incursion from Brazil represents the vast majority of mining-related deforestation in the country for the last quarter, and an almost 60% increase in area compared to the previous 7 years.

This case registers as a Very High probability of being illegal based on the legality layer. For more information, consult the scene on Amazon Mining Watch.

B. Northern Ecuador

Figure B shows the recent mining deforestation outside of the Cofán Bermejo Ecological Reserve in the northern Ecuadorian Amazon. This area has experienced increasing mining impact in recent years, as further described in MAAP #227. Note that this mining activity is within the Puma Kucha, Indigenous territory. This case registers as a High probability of being illegal based on the legality layer. For more information, consult the scene on Amazon Mining Watch.

C. San José de Karene Indigenous Territory, Peru

Figure C shows the recent mining deforestation in the San José de Karene Indigenous Territory in the southern Peruvian Amazon. As detailed in MAAP #208, much of the illegal mining deforestation in the southern Peruvian Amazon is occurring within the territory of Native Communities. This case registers as a High probability of being illegal based on the legality layer. For more information, consult the scene on Amazon Mining Watch.

D. Pemon Indigenous Territory, Venezuela 

The Pemon Indigenous territory stands out as the area most affected by gold mining in the last quarter, across all protected areas and indigenous territories of the region. The Pemon’s traditional territory is divided between an officially demarcated area, where mining increased by more than 100 hectares in the last quarter, and a much greater and yet-to-be-demarcated area, where mining increased by a staggering 700 ha in the last quarter only, a steep acceleration from the first semester of 2025. The Pemon’s territory encompasses part of the outstanding geological wonder Mount Roraima, a flat-topped mountain of immense cultural significance to local peoples. Mount Roraima harbors unique biodiversity and inspired Michael Crichton’s novel “The Lost World”.

This case registers as a High probability of being illegal based on the legality layer. For more information, consult the scene on the Amazon Mining Watch.

Brazil

Figure E shows the recent mining deforestation in the Amapá State Forest in the northeastern Brazilian Amazon. The forest is managed to benefit local communities through initiatives like sustainable agroecology and improved management of wood and non-forest products. This marks the first time this area has been highlighted by MAAP.  This case registers as a Very High probability of being illegal based on the legality layer. For more information, consult the scene on the Amazon Mining Watch.

Figure F shows the recent mining deforestation in the Tapajós Environmental Protection Area in the central Brazilian Amazon. It is in the western portion of the BR-163 Sustainable Forest District. As noted in MAAP #226, Tapajós EPA is one of the Amazon’s top ten most impacted protected areas (in terms of accumulated footprint), including high levels of new mining deforestation in 2024. This case registers as a Very High probability of being illegal based on the legality layer. For more information, consult the scene on the Amazon Mining Watch.


Figure G shows the recent mining deforestation in Jamanxim National Forest in the central Brazilian Amazon. As noted in MAAP #226, Jamanxim NF is one of the Amazon’s top ten most impacted protected areas (in terms of accumulated footprint). This case registers as a Very High probability of being illegal based on the legality layer. For more information, consult the scene on the Amazon Mining Watch.

Figure H shows the recent mining deforestation in the Grão-Pará Ecological Station in the northeast Brazilian Amazon, along the border with Guyana. It is the largest strictly protected tropical forest research station in the world. This marks the first time this area has been highlighted by MAAP. This case registers as a Very High probability of being illegal based on the legality layer. For more information, consult the scene on the Amazon Mining Watch.

Suriname

Figure I show recent mining deforestation in northeast Suriname. This marks the first time this specific area has been highlighted by MAAP. This case registers as a High probability of being illegal based on the legality layer. For more information, consult the scene on the Amazon Mining Watch.

Guyana

Figure J shows the recent mining deforestation in northwestern Guyana, near the border with Venezuela. This marks the first time this specific area has been highlighted by MAAP. For more information, consult the scene on the Amazon Mining Watch.

Annex

New functionality: Legality of mining sites

Based on an analysis of potential overlaps with land designations and applicable regulations, a location-based presumption of illegality of mining operations was incorporated into the AMW. We classified the presumption of illegality from very high to low, using the following descriptions:

  • Very High: Activity is occurring without a permit and within a protected area that doesn’t allow for any kind of resource exploitation
  • High: Activity if occurring outside of any explicit concession for doing so
  • Medium: Activity is happening within a concession, but active status could not be verified and/or concession doesn’t meet legal requirements
  • Low: Activity is happening within active concession, but compliance with all requirements could not be verified

This functionality is available for 5 countries: Bolivia, Brazil, Colombia, Ecuador and Peru, and will be extended to the rest of Amazonian countries in 2026. Based on national datasets of land designations, it provides an immediate overview of the likelihood of illegality of ASM in any area of analysis.

New functionality: Mining impacts calculator

The Mining Impacts Calculator, developed by Conservation Strategy Fund, is a tool to assess the social and environmental damage caused by gold mining. The tool uses an economic formula to estimate effects on the environment and society by inputting variables such as the size of the mine, the amount of gold produced and the time of extraction. The automated formula uses average mining productivity and data-driven impact parameters to deliver contextualized data to the user.

The calculator can be used for three main purposes: to estimate social and environmental damage values to calculate the amount of financial compensation needed to mitigate the costs, to estimate the most efficient investment amounts for future impact planning and the prevention of negative impacts, and to estimate the recommended amount of investment in mercury-free technologies needed.

Notes/Methodology

Note that in this report, we focus on mining activity that causes deforestation. The vast majority is artisanal or small-scale gold mining, but other mining activities have also been detected, such as iron, aluminum, and nickel mines in Brazil and Colombia. Additional critical gold mining areas in rivers that are not yet causing deforestation (such as in northern Peru (MAAP #233), southeast Colombia (MAAP #228), and northwest Brazil (MAAP #197), are not included in this report. This information is not yet displayed in Amazon Mining Watch, but future updates will include river-based mining hotspots.

Our data source for protected areas and Indigenous territories is from RAISG (Amazon Network of Georeferenced Socio-Environmental Information), a consortium of civil society organizations in the Amazon countries. This source (accessed in December 2024) contains spatial data for 5,943 protected areas and Indigenous territories, covering 414.9 million hectares across the Amazon.

Amazon Mining Watch (AMW) is a partnership between Earth Genome, the Pulitzer Center’s Rainforest Investigations Network, and Amazon Conservation. The algorithm is based on 10-meter-resolution imagery from the European Space Agency’s Sentinel-2 satellite and produces 480-meter resolution pixelated mining deforestation alerts. Although the data is not designed for precise area measurements, it can be used to give timely estimates needed for management and conservation purposes.

Acknowledgments

This report was made possible by the generous support of the Gordon and Betty Moore Foundation.


MAAP #234: Illegal gold mining in Yapacana National Park, including on top of Yapacana Tepui (Venezuelan Amazon)

Intro Image. Illegal gold mining deforestation (in red) on top of Yapacana Tepui. Data: Planet

In a series of previous reports, and in collaboration with SOS Orinoco, we have tracked the illegal gold mining deforestation and related impacts in Yapacana National Park, located in the Venezuelan Amazon.

Critically, some of this illegal mining activity has been happening on top of the Yapacana tepui (see red circles in Intro Image). 

Tepuis are stunning table-top mountains found in northern South America. They are considered sacred by indigenous groups of the Guiana Shield region; in fact, the word tepui means “mountain” in the local indigenous (Pemon) language. 

In 2022, we published an urgent report about the illegal mining on top of the Yapacana tepui (MAAP #169). In this report, we documented over 400 points of mining camps and heavy machinery, indicating an organized and large-scale operation, causing the deforestation of 8.8 hectares on top of the tepui.

Given the importance of this finding, the Washington Post published a high-profile article on the subject, further exposing the severity of the illegal mining on the tepui.

In response, the Venezuelan government conducted a military operation against illegal mining activity on the tepui in December 2022.

In early 2024, we reported that all illegal mining camps and equipment on top of the tepui had been removed (MAAP #207). Indeed, we detected no additional mining deforestation on top of the tepui during 2024.

However, we now present evidence that the illegal mining activity has resumed on top of the tepui in 2025

We also show continuing mining deforestation surrounding the tepui in other parts of Yapacana National Park. As of the time of the government intervention in late 2022, we detected the cumulative mining deforestation of 2,190 hectares in the park, including large increases in both 2021 and 2022 (MAAP #173). This mining deforestation has slowed, particularly in 2024 and 2025, but has now impacted 2,240 hectares in the park.

Gold Mining Deforestation in Yapacana National Park, 2020-2025

Figure 1 presents our digitized results for annual mining deforestation across all mining areas in Yapacana National Park, based on an analysis of high-resolution satellite imagery.


Graph 1. Mining deforestation in Yapacana National Park. Data: ACA/MAAP

Graph 1 shows the trends found in the digitized data of Yapacana National Park.

The orange line shows the annual mining deforestation decreasing following the highs detected in 2021 and 2022. Both years had over 400 hectares of new mining deforestation, while 2024 had just 37 hectares.

The red line shows the cumulative mining deforestation rising from the baseline in 2020 before plateauing in 2024 and 2025, with a current deforestation total of 2,250 hectares.


Gold Mining Deforestation on top of Yapacana Tepui, 2020-2025

Figure 2. Mining deforestation on top of Yapacana Tepui. Data: ACA/MAAP, Planet, NICFI.

Figure 2 presents our digitized results for annual mining deforestation on top of the Yapacana Tepui, based on an analysis of high-resolution satellite imagery.


Graph 2. Mining deforestation on top of Yapacana Tepui. Data: ACA/MAAP,

Graph 2 shows the trends found in the digitized data on top of Yapacana Tepui.

The orange line shows the annual mining deforestation of about 2 hectares in both 2021 and 2022, followed by a notable decrease after the government intervention in late 2022. In fact, there was zero detected mining deforestation in 2024, followed by the reappearance detailed in this report.

The red line shows the cumulative mining deforestation rising from the baseline in 2020 before plateauing in 2024 and 2025, with a current deforestation total of  9.3 hectares.


Recent Gold Mining Deforestation Events, 2024-2025

Base Map. Boxes A-C indicate location of detailed analysis below. Data: ACA/MAAP, Planet, NICFI

In the Base Map, Insets A-C indicate the three areas with documented gold mining expansion between 2024 and 2025, based on an analysis of very high-resolution satellite imagery.

Below, we provide a more detailed examination of these three areas.


Illegal gold mining on top of the Yapacana Tepui

Zoom A shows the recent gold mining deforestation of 0.09 hectares between January 2024 (left panel) and August 2025 (right panel), located on the top of the Yapacana Tepui in Yapacana National Park. Although a small expansion, it indicates the return of illegal mining on the tepui.

Zoom A. Gold mining deforestation on top of Yapacana Tepui. Data: Planet, ACA/MAAP

Illegal gold mining in Yapacana National Park

Zoom B shows the recent gold mining deforestation of 22.4 hectares between March 2024 (left panel) and August 2025 (right panel) in Yapacana National Park, just to the north of the Yapacana Tepui. There are also signs of mining equipment associated with this activity.

Zoom B. Gold mining deforestation in Yapacana National Park. Data: Planet, ACA/MAAP

Zoom C shows the recent gold mining deforestation of 1.01 hectares between March 2024 (left panel) and August 2025 (right panel) in Yapacana National Park, just to the north of the Yapacana Tepui.

Zoom C. Gold mining deforestation in Yapacana National Park. Data: Planet, ACA/MAAP

Policy Implications:

Photo of illegal gold mining in Yapacana National Park. Credit: SOSOrinoco

Mining is strictly prohibited in all Venezuelan national parks. This legal protection is fundamental to the conservation of the country’s most biodiverse and ecologically significant areas.

In addition, mining is explicitly prohibited in Amazonas (state in which Yapacana National Park is located) by Presidential Decree No. 269 (1989). This decree was enacted to safeguard the unique ecosystems and indigenous territories of the region, recognizing their global and national importance.

To enforce these legal prohibitions, there is a permanent command post of the Bolivarian National Guard at the entrance of Yapacana National Park. The presence of this security force raises important questions about the effectiveness and willingness of law enforcement and the actual control over activities within the park.

Although the recent mining deforestation on top of the Yapacana Tepui in 2025 is quantitatively small (0.09 hectares), it highlights the importance of early detection and response, especially in such ecologically and culturally sensitive zones. The fact that this renewed activity occurs in the presence of a permanent National Guard command post raises serious concerns about the effectiveness of enforcement and the real capacity of the state to prevent illegal operations. It also suggests that even minimal incursions should not be dismissed, as they may signal the beginning of a new cycle of degradation.

Fuel distribution in the region is officially managed by PDVSA (the state oil company) under strict military supervision. However, given Amazonas’ status as a border state with Colombia and Brazil, gasoline may also be sourced from one of them, most likely Colombia, due to its proximity. The transport of fuel—whether Venezuelan or Colombian—requires the use of boats or helicopters, both of which are highly visible and subject to monitoring by the Bolivarian National Armed Forces. This context places the Armed Forces at the center of the logistical dynamics that either enable or prevent illegal mining, as both aerial control and fuel supply are essential for mining operations.

These facts invite us to reflect critically on the disconnect between legal frameworks and on-the-ground realities. How is it possible that illegal mining persists and even expands in areas with such clear legal protection and a strong security presence? What are the implications for conservation, indigenous rights, and the rule of law? The answers to these questions are crucial for understanding the challenges facing protected areas in Venezuela and for designing more effective strategies to address them.

This entire situation highlights the need to establish mechanisms to monitor illegal gold trafficking, both at its exit points outside the country and on the routes to the markets where the gold is refined and sold.

Biodiversity impacts:

Photo of Yapacana Tepui. Credit: SOSOrinoco

Yapacana Tepui (Cerro Yapacana), a sandstone mountain rising to 1,345 meters above sea level in the southwestern quadrant of Yapacana National Park (PNY), is a geomorphologically and ecologically unique formation within the Venezuelan Amazon. The park encompasses a mosaic of landscapes, including alluvial plains, erosion-alteration peneplains, and nutrient-poor white sand savannas, which host highly specialized vegetation with floristic links to both the Paleotropics and Neotropics. The mountain itself supports two distinct montane forest types—submontane evergreen forests on its slopes and cloud forests on its summit—harboring at least eight critically endangered endemic plant species. These ecosystems are part of the ancestral territory of Arawako, Huottüja (Piaroa), and Mako peoples, who regard the tepui as sacred (MARNR-ORSTOM 1988; Castillo y Salas 2007; SOSOrinoco 2019).

Illegal gold mining has emerged as a major threat to the integrity of these ecosystems, particularly on the summit of Cerro Yapacana, where deforestation from mining camps and machinery has directly impacted the fragile forest habitat. The destruction of summit vegetation not only endangers endemic flora but also disrupts ecological processes vital to the survival of species such as the Yapacana antbird (Myrmeciza disjuncta) and the red Yapacana frog (Minyobates steyermarki), both of which are exclusive to this tepui. Mining-induced deforestation across the park has reached over 2,240 hectares, threatening the continuity of forest cover, savannas and the ecological connectivity essential for species migration and resilience (Huber 1995; Llamozas et al., 2003; Lentino, 2006; Señaris and Rivas, 2006).

The broader biodiversity of Yapacana National Park is also at risk, including its designation as an Important Bird Area (IBA) due to the presence of species such as Crax alector, Selenidera nattereri, and migratory birds like Dendroica striata. The park hosts over 260 bird species, alongside 51 reptiles and 29 amphibians (Lentino, 2006; Señaris and Rivas, 2006). The illegal mining not only degrades these habitats but also introduces pollutants and human disturbance, undermining conservation efforts and threatening the survival of species with restricted ranges and specialized ecological requirements. Urgent and sustained action is needed to halt further degradation and safeguard the exceptional biodiversity of Cerro Yapacana and its surrounding ecosystems (SOSOrinoco, 2019).

Acknowledgements

We thank the organization  SOSOrinoco for important information and comments related to this report.

This report is part of a series focusing on gold mining in the Amazon, with support from the Gordon and Betty Moore Foundation.

MAAP #228: Illegal Gold Mining in the Puré and Cotuhé Rivers in the Colombian Amazon

Base Map. Illegal gold mining in the Puré & Cotuhé Rivers, Colombian Amazon. Data: ACA/MAAP, FCDS, RAISG

Illegal gold mining poses a challenge to environmental sustainability, governance, and security for all nine countries of the Amazon. The high price of gold on the international market has fueled the growth of this activity, combined with other factors such as the scarcity of economic alternatives, the presence of illicit groups, corruption, and a lack of effective government action.

In the Amazon, illegal mining has generated massive deforestation (MAAP #226), contamination of water sources due to the use of mercury, and expansion of illicit economies, with gold becoming a key source of financing for organized armed groups (Note 1).

In a series of reports, MAAP has detailed and illustrated cases of illegal mining in many parts of the Amazon, including Peru, Ecuador, Brazil, and Venezuela. These reports include both forest-based mining causing deforestation, and river-based mining causing mercury contamination.

In this report, we focus on river-based mining in the northwestern Amazon, specifically the triple border region between Colombia, Brazil, and Peru (see Base Map).In this area, illegal mining activities impact several rivers that connect these countries: the Puré, Cotuhé, Caquetá, Amazonas, Apaporis, and Putumayo Rivers in Colombia; the Napo, Curaray, Putumayo, Yaguas, Nanay, and Mazán Rivers in Peru; and the Puruí and Japurá Rivers in Brazil.

Although it doesn’t cause deforestation, this type of mining activity directly impacts not only the rivers but all ecosystems interconnected with them, due to the use of dredges and mercury. This mercury contamination spreads through the food chain, accumulating in species consumed by the local population, harming their health. This type of mining can extract up to three kilograms of gold per month, equivalent to approximately $275,000 per month (Notes 2-3).

Specifically, this report examines the current situation of the Puré and Cotuhé Rivers, in their southeastern reaches, located in the Colombian Amazon (see Base Map). These rivers are located in the department of Amazonas, along the borders of Brazil and Peru.

In both cases, we analyzed these river stretches using a combination of very high-resolution satellite images (0.5 meters, Planet/Skysat) and overflight photographs (courtesy of the Amazon Alliance for the Reduction of the Impacts of Gold Mining – AARIMO in Spanish).

This report was produced in collaboration with our Colombian partner, the Foundation for Conservation and Sustainable Development (FCDS), and with financial support from the Overbrook Foundation and Gordon and Betty Moore Foundation..

Detection of mining activity in the Puré River

The Puré River flows through the core of the Río Puré National Park in the southeastern Colombian Amazon (see Base Map).

This protected area, in addition to its extraordinary biodiversity and high carbon levels, also plays a role as a food source for Indigenous communities and is recognized as home to Indigenous peoples in voluntary isolation, including the Yurí–Passé, whose high vulnerability has been widely recognized internationally.

This protected area faces pressures and threats primarily associated with alluvial mining activities, which are increasingly occurring along the Puré River from the border with Brazil. The impacts of this activity include mercury contamination of water and fish, destruction of aquatic habitats and ecosystems, hunting, logging, and impacts on food security and the environment where communities in voluntary isolation live.

Despite interventions by the Colombian government and ongoing monitoring by organizations, mining activities continue, with increased intensity during periods when the river flow is lowest.Analyzing a Skysat image from November 2024, we found 29 dredges along the Puré River (see red dots in Figure 1). Figures 1J-L show examples of these findings. In other Skysat images from March and April 2025, we identified 27 dredges (see yellow dots in Figure 1).

Figure 1. Detected gold mining activity in the Puré River. Data: Amazon Conservation/MAAP, FCDS.

Overflight photos – Puré River

The following photos (corresponding to points 1-3 in Figure 1) were taken during a low-altitude overflight conducted by FCDS in September 2024. This additional resolution provides additional information on mining methods and their impacts (AARIMO 2024).

Punto 1

Overflight photo, Point 1. Green-roof dredger, with Starlink. Data: FCDS.

Punto 2

Overflight photo, Point 2. Three dredgers with barges and skidders. Data: FCDS.

Punto 3

Overflight photo. Point 3. Dredges and heavy machinery. Data: FCDS.

Detection of mining activity in the Cotuhé River

The Cotuhé River borders the north of Amacayacu National Park (see Base Map) and passes through the Cotuhé Putumayo Indigenous Reserve (see Figure 2), in the southeast Colombian Amazon, on the borders with Peru and Brazil.

Analyzing a Skysat image from November 30, 2024, we found five dredges (Figure 2). Figures 2A-D show examples of these findings.

Figure 2. Detected gold mining activity in the Cotuhé River. Data: Amazon Conservation/MAAP, FCDS.

Overflight photos – Cotuhé River

The following photos (corresponding to points 4-5 in Figure 2) were taken from a low-altitude overflight conducted by FCDS in September 2024 (AARIMO 2024).

Punto 4

Overflight photo, Point 4. Dredger in operation with Starlink antenna. Data: FCDS
Overflight photo, Point 5. Dredger. Data: FCDS

Policy Implications

The illegal river-based mining analyzed here occurs within two important Colombian protected areas, Río Puré and Amacayacu National Parks. In these areas, no mining operations of any kind are permitted, due to impacts on biodiversity, Indigenous communities in voluntary isolation, and local Indigenous communities that depend on natural resources for their survival, putting their food security at risk.

An important factor that has intensified mining activity in the area has been the significant upward trend in the price of gold. In January 2008, an ounce of gold was quoted at around $812. By July 2024, this value reached $2,514, representing an increase of more than 200% over that period. Furthermore, recent changes in tariff policies have further boosted demand for gold (GoldMarket, 2024). Consequently, in February 2025, gold reached new highs, approaching $3,000 per ounce, substantially driven by central bank purchases (El País, 2025a).

Although Law 1658 of 2013 initiated the ban on the use of mercury in Colombia, it was not fully implemented until 2023. This ban includes the import and export of mercury to and from Colombia. However, despite the ban in Colombia, this element is used in considerable quantities for illegal gold mining in border areas, such as those observed in this report. Thus, Colombia, Brazil, and Peru face a significant challenge in complying with the law, as controls on the sale and use of this element in border areas are very complex due to the fact that these are difficult-to-access areas.

In general, a correlation has been observed between the granting of mining concessions in cross-border areas and the increase in informal mining in the Amazon subregion. For example, in the case of the Río Puré National Park, the presence of mining dredges has increased within protected areas. These dredges enter the Puré River from the Brazilian side, where therea area a large number of formal mining concessions.

A key challenge is to strengthen operational capacities and coordinate control actions among the three border countries (Colombia, Peru, and Brazil) to combat environmental crimes associated with illegal mining. These operations must be effective and not result in actions that harm the local communities and Indigenous peoples in voluntary isolation in the region, as this exacerbates the internal conflict in Colombia.

Notes

1 Ministerio de Minas y Energía, 2023

2 Ebus & Pedroso, 2023

3 Bullion Vault, 2025

Acknowledgments

This report was produced in collaboration with our Colombian partner, the Foundation for Conservation and Sustainable Development (FCDS), and with financial support from the Overbrook Foundation and Gordon and Betty Moore Foundation.

FCDS Logo

MAAP #227: Gold Mining in the Ecuadorian Amazon – Northern Sector

Base Map. Gold mining deforestation in the Ecuadorian Amazon. Data: Amazon Mining Watch, RAISG

In a recent report (MAAP #226), we presented data from Amazon Mining Watch (AMW), a collaboration between Amazon Conservation, Earth Genome, and the Pulitzer Center. This public resource uses AI (artificial intelligence) to detect gold mining deforestation across the Amazon, starting in 2018.

The Base Map illustrates the current data, highlighting the most recent mining deforestation (2019–2024) in red. Note the concentration of new mining activity in the western part of the Ecuadorian Amazon, along the transition with the Andes Mountains.

This is the first in a series of reports detailing gold mining in these areas. In this report, we focus on deforestation due to mining in the northern sector, around the Cofán Bermejo Ecological Reserve.

The Cofán Bermejo Ecological Reserve was one of the best-preserved protected areas in the province of Sucumbios until approximately 2020. In recent years, a rapid expansion of gold mining has been unfolding in the buffer zone of the southeastern edge of the reserve.

The vast majority of this activity has been identified as illegal mining, as it occurs outside designated mining areas, or is carried out in concession areas without proper authorization. The expansion of illegal gold mining in this sector is promoted by criminal groups located on the border with Colombia (Note 1).


Mining in the Ecuadorian Amazon – Northern Sector

Figure 1. Mining to the southeast of Cofán-Bermejo Ecological Reserve. Data: AMW, ACA/MAAP; MAATE; NCI, Planet.

In a previous report, MAAP #186 analyzed mining activity just outside Cofán Bermejo Ecological Reserve, located in the northern Ecuadorian Amazon, in the province of Sucumbíos. Here, we update and expand this analysis around the reserve.

This expanded analysis incorporates additional conservation areas, such as El Bermejo Protective Forest and the Cascales Municipal Conservation and Sustainable Use Area (see Figure 1), as well as Shuar and Kichwa Indigenous territories (Figure 2).

Due to the development of this mining activity in several different land designation areas, it is worth emphasizing that there are two major factors determining its legality or illegality in Ecuador:

1) Express prohibition provided for by the Constitution or law, as in the case of metal mining activities in protected areas (Article 407 of the Constitution) or the prohibition on the use of mercury in mining operations (Article 86.1 of the Mining Law).

2) Lack of authorization, such as conducting exploration and exploitation activities without the corresponding permits.

In terms of social impact, Mongabay Latam (2023) contextualizes this area (References 1-2): “Indigenous communities and social and environmental organizations that work in the territory cannot openly denounce what is happening in this border area with Colombia, due to the presence of armed groups and the serious security problems that exist there.”

Considering that the largest area of ​​gold mining deforestation is located in the Cascales Conservation and Sustainable Use Area (Figure 1), it is important to note that this type of designation (Conservation and Sustainable Use Areas) are zones created by decentralized autonomous local governments, communities, or private landowners to conserve biodiversity and develop sustainable activities that maintain ecosystem services beneficial to human life. Activities such as conservation, research, restoration, education, culture, recreation, and tourism, as well as sustainable subsistence production activities, can be carried out in these protected areas. The declaration of these protected areas does not modify mining concessions granted by the National Environmental Authority that remain in force and may be renewed, as long as they are compatible with sustainable use.

Regarding El Bermejo Protective Forest, this designation type (Protective Forest) is natural vegetation formations (trees, shrubs, or herbs) found in areas with rugged topography, headwaters of watersheds, or zones unsuitable for agriculture or livestock farming. Their primary function is to conserve water, soil, flora, and wildlife. Activities permitted in these forests, with authorization from the National Environmental Authority, include the promotion of wildlife, the execution of priority public works, sustainable forest management, and scientific, tourism, and recreational activities.

Indigenous Territories

Figure 2. Gold mining deforestation in Indigenous territories (Shuar & Kichwa). Data: ACA/MAAP; EcoCiencia; Planet

In addition to  the Cofán Bermejo Indigenous Territory, which shares boundaries with the Ecological Reserve of the same name, gold mining deforestation threatens six surrounding Shuar and Kichwa Indigenous territories (Figure 2).

Note that these territories overlap with the conservation areas noted above.

In total, 68% of the mining deforestation detected in the study area was identified as occurring within these Indigenous territories.


Increase in Gold Mining Deforestation 2020 – 2024

Using satellite imagery (Planet), we estimated the annual expansion of gold mining deforestation in this area between 2020 and 2024. The total forest area affected by mining by the end of 2024 is approximately 754 hectares, equivalent to 1,863 acres.

The vast majority of this mining occurred in the Cascales Conservation and Sustainable Use Area or Indigenous territories.

The analysis shows that the largest increase occurred in 2024, with an expansion of 189.62 hectares. Overall, we documented a trend of continual accumulated expansion of gold mining deforestation across the region (Graph 1).

Graph 1. Mining activity 2017-2024 outside the Ecological Reserve Cofanes – Bermejo. Data: ACA/MAAP; Fundación EcoCiencia.

Mining Concessions

Figure 3. Overlay of mining activities with the mining cadastre. Data: ACA/MAAP; EcoCiencia; ARCOM; Planet

By adding the mining land designations, we determined that 59% of the mining deforestation (444 hectares) occured outside legal mining areas (Figure 3).

The Ecuadorian government, through the Ministry of Energy and Mines, grants mining rights for the exploitation of mineral resources in each of its phases (mining activity is divided into an exploration and development phase).

The exploration phase is further divided into three periods: initial exploration, advanced exploration, and economic evaluation.

Carrying out development activities prior to the granting of the right is illegal and may incur administrative or criminal sanctions.


Case Studies

We selected three case studies within the monitoring area to illustrate the rapid expansion of mining activity (see Insets A-C in Figure 3). The comparative panels below demonstrate the expansion of mining activity between May 2024 (left panel) and December 2024 (right panel) in each case.

Zoom A.

Panel A shows mining deforestation taking place outside designated mining concession areas. Moreover, this activity is occurring within a Shuar Indigenous territory (Taruka Territory).

Panel Zoom A. Mining deforestation in Shuar Indigenous territory. Data: ARCOM (2025); Planet

Zoom B.

In Panel B, we identified 61.4 hectares of mining activity within the El Tuerto mining concession. However, this concession is currently in the initial exploration phase, meaning it has not yet been authorized for development.

Panel Zoom B. Data: ARCOM (2025); Planet

Zoom C.

In Panel C, we recorded 19.65 hectares of mining activity within the El Porvenir mining concession. It is also currently in the exploration phase, with no authorization for development. Furthermore, this activity takes place within the ancestral territory of the Puma Kucha Commune (Kichwa Indigenous territory).

Panel Zoom C. Data: ARCOM (2025); Planet

Policy Implications

The recent gold mining deforestation described above highlights several key policy needs:

  • Regulate public investment to ensure that the various conservation entities recognized by the national government have the necessary resources for oversight within their jurisdiction.
  • Strengthen investigation and oversight processes in institutions responsible for ensuring environmentally responsible mining activities.

Methodology

In addition to Amazon Mining Watch to create the Base Map, we used LandTrendR, a temporal segmentation algorithm that identifies changes in pixel values ​​over time, to detect forest loss at the edge of the Cofán-Bermejo Ecological Reserve between August 2017 and December 2024 using the Google Earth Engine platform. Importantly, this method was originally designed for moderate-resolution (30-meter) Landsat imagery (Reference 3), but was adapted for higher spatial resolution (4.7-meter) NICFI-Planet monthly mosaics (Reference 4).

References

  1. Antonio José Paz Cardona. (2023, 7 junio). Ecuador: minería ilegal sigue avanzando hacia el interior de la Reserva Ecológica Cofán Bermejo. Noticias Ambientales. https://es.mongabay.com/2023/06/mineria-ilegal-reserva-ecologica-cofan-bermejo-ecuador/
  2. Amazon Watch report ‘Oro, bandas y gobernanza: La crisis que enfrentan las comunidades indígenas amazónicas de Ecuador’ 
  3. Kennedy, R.E., Yang, Z., Gorelick, N., Braaten, J., Cavalcante, L., Cohen, W.B., Healey, S. (2018). Implementation of the LandTrendr Algorithm on Google Earth Engine. Remote Sensing. 10, 691.
  4. Erik Lindquist, FAO, 2021

Acknowledgments

This report is part of a series focused on the Ecuadorian Amazon through a strategic collaboration between the EcoCiencia Foundation and Amazon Conservation, with support from the Gordon and Betty Moore Foundation.

MAAP #226: AI to detect Amazon gold mining deforestation – 2024 update

Intro Image. Amazon Mining Watch interactive map.

As gold prices continue to increase, small-scale gold mining activity also continues to be one of the major deforestation drivers across the Amazon

It often targets remote areas, thus impacting carbon-rich primary forests. Moreover, in many cases, we presume that this mining is illegal based on its location within conservation areas (such as protected areas and Indigenous territories) and outside mining concessions.

Given the vastness of the Amazon, however, it has been a challenge to accurately and regularly monitor mining deforestation across all nine countries of the biome, in order to better inform related policies in a timely manner.

In a previous report (MAAP #212) we presented the initial results of the new AI-based dashboard (known as Amazon Mining Watch) designed to address the issue of gold mining and related policy implications. Amazon Mining Watch (AMW) is a partnership between Earth Genome, the Pulitzer Center’s Rainforest Investigations Network, and Amazon Conservation.

This online tool (see Intro Image) analyzes satellite imagery archives to estimate annual mining deforestation footprints across the entire Amazon, from 2018 to 2024 (Note 1). Although the data is not designed for precise area measurements,  it can be used to give timely estimates needed for management and conservation purposes.  

For example, the cumulative data can be used to estimate and visualize the overall Amazon-wide mining deforestation footprint, and the annual data can be used to identify trends and emerging new mining areas. The algorithm is based on 10-meter resolution imagery from the European Space Agency’s Sentinel-2 satellite and produces 480-meter resolution pixelated mining deforestation alerts.

The only tool of this kind to be truly regional (Amazon-wide) in coverage, AMW can also help foster regional cooperation, in particular in transfrontier areas where a lack of interoperability between official monitoring systems might hamper interventions.

The Amazon Mining Watch partnership is currently working to enhance the functionality and conservation impact of the dashboard, AMW will be a one-stop shop platform including real-time visualization of: 1) AI-based detection of mining deforestation across all nine Amazonian countries, with quarterly updates; 2) Hotspots of urgent mining cases, including river-based mining; and 3) the socio-environmental costs of illegal gold mining with the Conservation Strategy Fund (CSF) Mining Impacts Calculator.

Here, we present an update focused on the newly added 2024 data and its context within the cumulative dataset (since 2018).

MAJOR FINDINGS

In  the following sections, we highlight several major findings:

  • Gold mining is actively causing deforestation in all nine countries of the Amazon. This impact is concentrated in three major areas: southeast Brazil, the Guyana Shield, and southern Peru. In addition, mining in Ecuador is escalating.
  • The cumulative mining deforestation footprint in 2024 was over 2 million hectares (nearly 5 million acres) and has increased by over 50% in the past six years.
  • Over half of all Amazon mining deforestation occurred in Brazil, followed by Guyana, Suriname, Venezuela, and Peru.
  • While the cumulative footprint continues to grow, the rate of increase slowed in 2023 and 2024 after peaking in 2022, likely due to increased enforcement in Brazil.
  • Over one-third of the mining deforestation has occurred within protected areas and Indigenous territories, where much of it is likely illegal. We highlight the most impacted areas.
  • These results have important policy implications.
Base Map. Mining deforestation footprints, 2018-2024. Data: AMW, Amazon Conservation/MAAP.

Amazon & National Scale Patterns

The Base Map presents the gold mining footprint across the Amazon, as detected by the AMW algorithm. This data serves as our estimate of gold mining deforestation.

Yellow indicates the accumulated mining deforestation footprint for the years 2018- 2023; that is, all areas that the algorithm classified as a mining site vs other types of terrain, such as forest or agriculture. Red indicates the new mining areas detected in 2024.

Three major Amazon gold mining regions stand out: southeast Brazil (between the Tapajos, Xingu, and Tocantis Rivers), Guyana Shield (Venezuela, Guyana, Suriname, and French Guiana), and southern Peru (Madre de Dios).  In addition, Ecuador has emerged as an important mining deforestation front.


Graph 1. Amazon mining deforestation footprint. Data: AMW

Graph 1 quantifies the spatial data detected by the AMW algorithm

The cumulative mining deforestation footprint in 2024 was 2.02 million hectares (4.99 million acres)

For context, the initial mining deforestation footprint was around 970,000 hectares in 2018, the first year of Amazon Mining Watch data.

Between 2019 and 2024, we estimate that the gold mining deforestation grew by 1.06 million hectares (2.61 million acres).

Thus, over half (52.3%) of the cumulative footprint has occurred in just the past six years.

Note that while the cumulative footprint continues to grow, the rate of increase slowed in 2023 and 2024 after peaking in 2022.


Graph 2 shows that, of the total accumulated mining (2.02 million hectares), over half has occurred in Brazil (55.3%), followed by Guyana (15.4%), Suriname (12.4%), Venezuela (7.3%), and Peru (7.0%).

Graph 2. Gold mining deforestation across the Amazon, by country. Data: AMW, Amazon Conservation/MAAP

Graph 3 digs deeper into the AMW data, revealing additional trends between years. This data highlights the annual changes in detected mining deforestation. Note the trend across the entire Amazon at the top in green for overall context, followed by each country. Note that Brazil (orange line) accounts for much of the annual mining (over 50%).

In 2024, we documented the new gold mining deforestation of 111,603 hectares (275,777 acres). This total represents a decrease of 35% relative to the previous year 2023 and 45% relative to the peak year 2022.

The countries with the highest levels of new gold mining deforestation in 2024 were 1) Brazil (57,240 ha), 2) Guyana (19,372 ha), 3) Suriname (15,323 ha), 4) Venezuela (9,531 ha), and 5) Peru (6,020 ha). However, all five of these countries saw a major decrease in 2024, between 33% (Brazil and Suriname) and 46% (Peru).

Graph 3. Annual changes in new mining deforestation. Data: AMW
Figure 1. Protected areas & Indigenous territories impacted by mining deforestation. Data: AMW, ACA/MAAP.

Protected Areas & Indigenous Territories

We estimate that 36% of the accumulated mining deforestation in 2024 (over 725,000 hectares) occurred within protected areas and Indigenous territories (Figure 1; Note 2), where much of it is likely illegal.

Notably, the vast majority of this overall mining deforestation in protected areas and Indigenous territories has occurred in Brazil (88%).


Figure 2a. Top 10 impacted protected areas & Indigenous territories. Data: AMW, ACA/MAAP.

Figure 2a illustrates the top ten for both protected areas and Indigenous territories, in terms of both accumulated mining deforestation footprint and new mining deforestation in 2024. Figures 2b-d show zooms of the three main mining areas: southeast Brazil (2b), Guyana Shield (2c), and southern Peru (2d).

The top nine most impacted protected areas (in terms of accumulated footprint) are all in Brazil, led by Tapajós Environmental Protection Area. This area has lost over 377,000 hectares, followed by Amanã and Crepori National Forests, Rio Novo National Park, Urupadi, Jamanxim, and Itaituba National Forests, Jamanxim National Park, and Altamira National Forest. The top ten is rounded out by Yapacana National Park in Venezuela.

The three most impacted Indigenous territories are also in Brazil: Kayapó, Mundurucu, and Yanomami. Together, these three territories had a mining footprint of nearly 120,000 hectares. Fourth on the list is Ikabaru in Venezuela, followed by three in southern Peru (San Jose de Karene, Barranco Chico, and Kotsimba) with mining impact of over 17,000 hectares. Rounding out the top ten are Sai Cinza and Trincheira/Bacajá in Brazil, and San Jacinto in Peru.

We also estimate the expansion of over 38,000 hectares of new mining deforestation in protected areas and Indigenous territories in 2024. The protected area with the highest levels of new mining deforestation in 2024 was Tapajós Environmental Protection Area (nearly 19,000 hectares), followed by Amanã and Urupadi National Forests in Brazil, Rio Novo and Jamanxim National Parks in Brazil, Crepori National Forest in Brazil, Campos Amazonicos National Park in Brazil, Yapacan National Park in Venezuela, Guyane Regional Park in French Guiana, and Brownsberg Nature Reserve in Suriname.

Finally, the Indigenous territory with the highest levels of new mining deforestation in 2024 was Kayapó in Brazil (over 2,100 hectares), followed by Ikabaru in Venezuela, Yanomami, Aripuana, and Mundurucu in Brazil, Baramita in Guyana, Kuruáya in Brazil, Isseneru and Kamarang Keng, San Jose de Karene in Peu. It is worth noting that Kayapó, Mundurucu, and Yanomami territories in Brazil all experienced declines in the mining deforestation rate in 2024. For example, Yanomami went from its peak in 2021 to the lowest on record in 2024.

Most impacted areas in eastern Brazilian Amazon

Figure 2b. Most impacted areas in eastern Brazilian Amazon. Data: AMW, Amazon Conservation/MAAP.

Most impacted areas in the Guyana Shield

Figure 2c. Most impacted areas in the Guyana Shield. Data: AMW, Amazon Conservation/MAAP.

Most impacted areas in the southern Peruvian Amazon

Figure 2d. Most impacted areas in the southern Peruvian Amazon. Data: AMW, Amazon Conservation/MAAP.

Conclusion & Policy Implications

Despite a recent downward trend in the rate of gold mining deforestation, the cumulative gold mining deforestation footprint continues to grow across the Amazon.

Our analysis shows that over one-third of this mining occurs within protected areas and Indigenous territories, the vast majority in Brazil. However, since the return of the Lula administration in 2023, Brazil has been ramping up enforcement efforts. This has contributed to the rapid decrease in area lost to mining across the Amazon, given Brazil’s outsized contribution to regional figures. This highlights again the importance of protected areas and Indigenous territories as a crucial policy instrument for the protection of the region’s ecosystems.

Although advances have been made in reducing illegal mining from protected areas in southern Peru, it continues to impact several Indigenous territories (MAAP #208, MAAP #196), particularly those surrounding the government-designated Mining Corridor. In fact, the most affected Indigenous territory in Peru, San Jose de Karene, has already lost over a third of its total area to illegal gold mining.  These territories are part of a regional organization known as FENAMAD, which has been supporting legal actions to help the government make decisions for a rapid response to illicit activities (such as illegal mining) that affect indigenous territories. This process led to five government-led operations between 2022 and 2024, in three communities: Barranco Chico, Kotsimba and San José de Karene (MAAP #208).

In Ecuador, mining deforestation continues to threaten numerous sites, including protected areas and Indigenous territories, along the Andes-Amazon transition zone (MAAP #206, MAAP #221, MAAP #219). An upcoming series of reports will detail these threats.

AMW is an emerging and powerful new tool, but it does have some caveats. One is that any mining activity less than 500 square meters may not be accurately detected. For example, we have been monitoring small-scale mining in several protected areas, such as Madidi National Park in Bolivia and Puinawai National Park in Colombia, that are not yet detected by the algorithm. In these cases, direct real-time monitoring with satellites is still needed. These areas will soon be added to the AMW as mining “Hotspots” (MAAP#197).

This is also the case for river-based mining that does not cause a large footprint on the ground. Imagery with very high resolution has revealed active river barge mining in northern Peru (MAAP #189) and along the Colombia/Brazil border (MAAP#197). These areas will also soon be added to the AMW as mining “Hotspots.”

Gold mining in the Amazon is certain to stay a major issue in the coming years as gold prices continue to skyrocket, reaching over $3,000 an ounce in April 2025, driven by global economic uncertainty. While there are encouraging signs of effective enforcement in Brazil, governments here and across the region will have to compete with this rising financial incentive for mining activities.

Tools such as the Amazon Mining Watch, which will eventually publish quarterly updates of newly detected mining deforestation areas, can help governments, civil society, and local community defenders spot new fronts of gold mining and take action in near real-time. In a feature developed by Conservation Strategy Fund (CSF), it will also evaluate the economic costs of socio-environmental mining damages necessary for communities and managers to declare punitive damages.

The only dashboard of this kind to be fully regional in coverage, the AMW can also help foster regional cooperation, in particular in transfrontier areas where a lack of interoperability between official monitoring systems might hamper interventions that are aimed at combating a phenomenon that is linked to other nature crimes and is mostly controlled by international organized crime. 

In the coming years, the MAAP and AMW teams will continue to publish both quarterly and annual reports of the dynamic mining situation in each country and across the Amazon, in addition to confidential reports directly to governments and community leaders on the most urgent cases.

Notes

1. Note that in this report, we focus on mining activity that causes deforestation. The vast majority is artisanal or small-scale gold mining, but other mining activities have also been detected, such as iron, aluminum, and nickel mines in Brazil and Colombia. Additional critical gold mining areas in rivers that are not yet causing deforestation (such as in northern Peru, southeast Colombia, and northwest Brazil; see MAAP #197), are not included in this report. This information is not yet displayed in Amazon Mining Watch, but future updates will include river-based mining hotspots. 

2. Our data source for protected areas and Indigenous territories is from RAISG (Amazon Network of Georeferenced Socio-Environmental Information), a consortium of civil society organizations in the Amazon countries. This source (accessed in December 2024) contains spatial data for 5,943 protected areas and Indigenous territories, covering 414.9 million hectares across the Amazon.

Acknowledgments

We thank colleagues from partner organizations around the Amazon for helpful comments on the report, including: Earth Genome, Conservación Amazónica (ACCA & ACEAA) & Federación Nativa del Río Madre de Dios y Afluentes (FENAMAD), Fundación EcoCiencia, Fundación para la Conservación y el Desarrollo Sostenible (FCDS), and Instituto Centro de Vida (ICV) & Instituto Socioambiental (ISA).

This report was made possible by the generous support of the Gordon and Betty Moore Foundation.

MAAP #225: Carbon in the Amazon (part 4): Protected Areas & Indigenous Territories

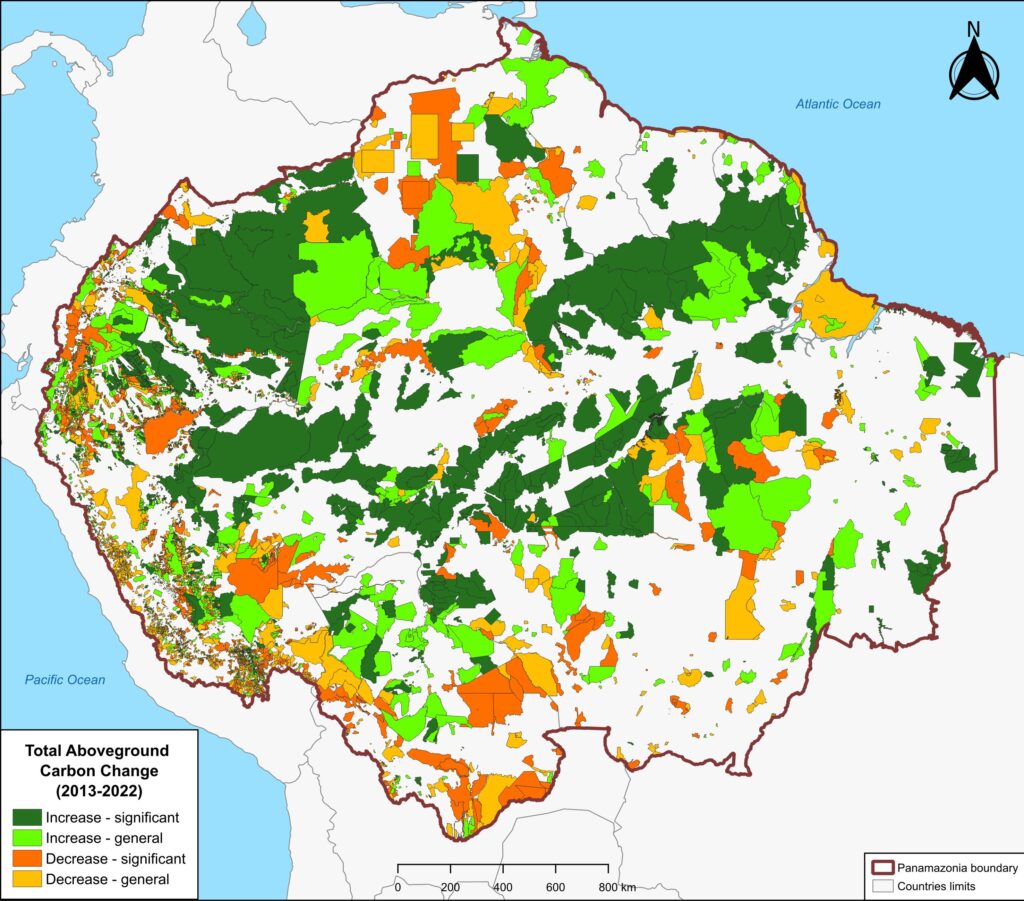
Figure 1. Total aboveground carbon change, Amazon protected areas & Indigenous territories 2013-2022. Data: Planet, ACA/MAAP.

We continue our ongoing series about carbon in the Amazon.

In part 1 (MAAP #215), we introduced a new dataset (Planet’s Forest Carbon Diligence) with wall-to-wall estimates for aboveground carbon at an unprecedented 30-meter resolution between 2013 and 2022. In part 2 (MAAP #217), we highlighted which parts of the Amazon are currently home to the highest (peak) carbon stocks. In part 3 (MAAP #220), we showed key cases of carbon loss (deforestation) and gain across the Amazon.

A key finding from this series is that the Amazon biome is teetering between a carbon source and sink. That is, historically the Amazon has functioned as a critical sink, with its forests accumulating carbon if left undisturbed. However, relative to the 2013 baseline, the Amazon flipped to a source during the high deforestation, drought, and fire seasons of 2015-2017. It then rebounded as a narrow carbon sink in 2022.

Here, in part 4, we focus on the importance of aboveground carbon in protected areas and Indigenous territories, which together cover 49.5% (414.9 million hectares) of the Amazon biome (see Figure 1).

We find that, as of 2022, Amazonian protected areas and Indigenous territories contained 34.1 billion metric tons of aboveground carbon (60% of the Amazon’s total). Importantly, in the ten years between 2013 and 2022, they functioned as a significant carbon sink, gaining 257 million metric tons.

With this data, we can also analyze aboveground carbon for each protected area and Indigenous territory. For example, Figure 1 illustrates aboveground carbon loss vs. gain for each protected area and Indigenous territory during the 10-year period of 2013 – 2022 (see details below).

Below, we further explain and illustrate the key findings.

Amazon-wide & Country-level Results

Amazonian protected areas and Indigenous territories currently cover nearly half (49.5%) of the Amazon biome, but contain 60% of the aboveground carbon. Together they contained 34.1 billion metric tons of aboveground carbon as of 2022, gaining 257 million metric tons since 2013, thus functioning as a carbon sink (Figure 2).1,2 

In contrast, areas outside of protected areas and Indigenous territories (424 million hectares) contained 22.6 billion metric tons of aboveground carbon as of 2022, losing 255 million metric tons since 2013, thus functioning as an overall carbon source.

Thus, the carbon sink function of protected areas and Indigenous territories narrowly offsets the emissions in the rest of the Amazon.

We emphasize that the protected areas and Indigenous territories functioned as a significant carbon sink (p-value = 0.01), while the outside areas were not a significant source (p-value= 0.15).

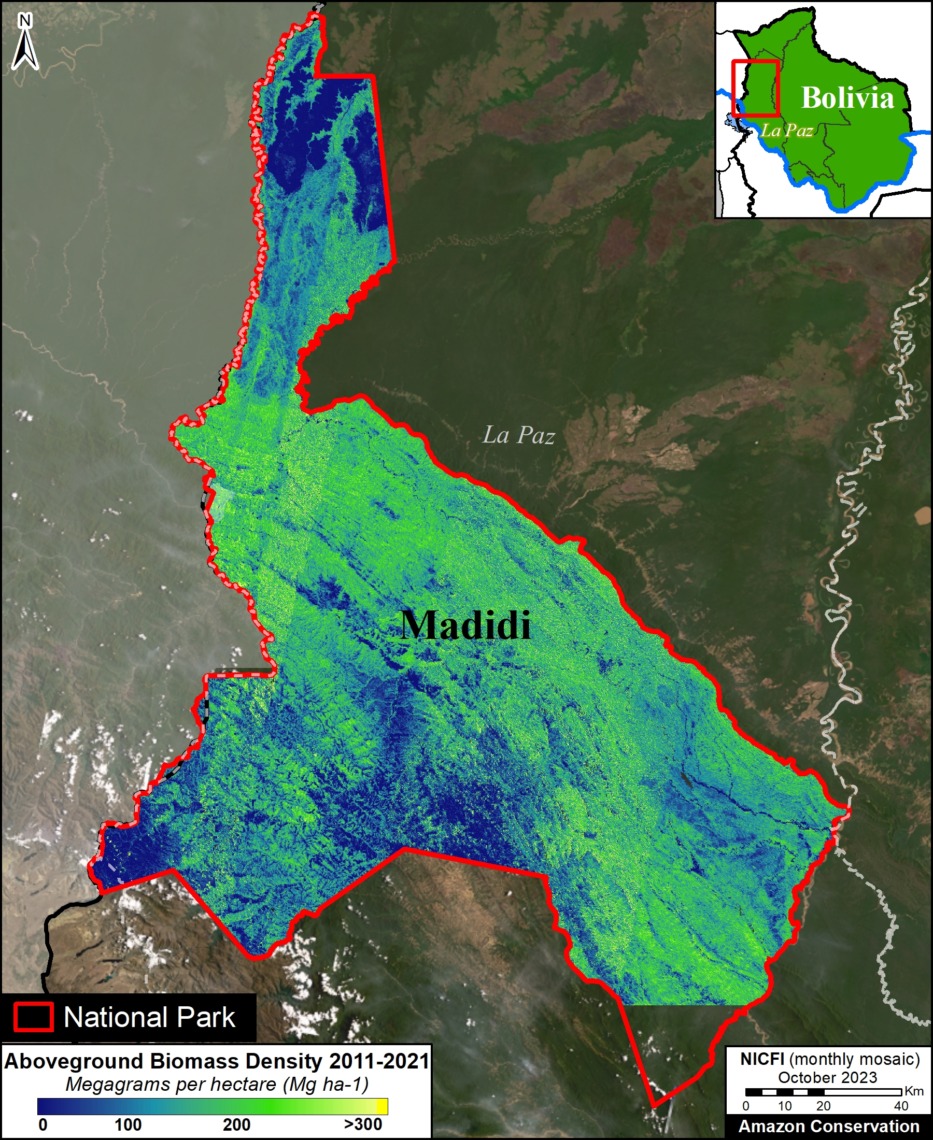
Regarding results by country, protected areas and Indigenous territories were significant carbon sinks in Colombia, Brazil, Suriname, and French Guiana (Guyana gained carbon but not significantly). In contrast, they were significant carbon sources in Bolivia and Venezuela (Peru and Ecuador lost carbon but not significantly).

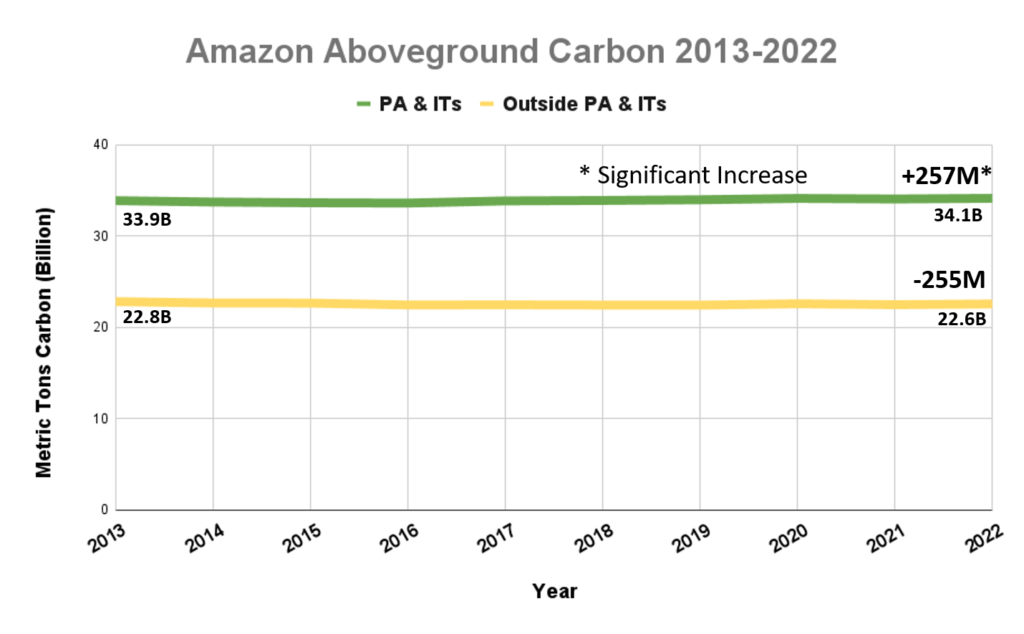
Figure 2. Amazon aboveground carbon 2013-2022, within vs. outside protected areas and Indigenous territories. Data: Planet, ACA/MAAP.

Individual Protected Area & Indigenous Territory Results

Figure 1 (see above) illustrates total aboveground carbon loss vs. gain for each protected area and Indigenous territory during the 10-year period of 2013 – 2022. 

Overall, we found 1,103 areas that served as significant carbon sinks (dark green) during this period (238 protected areas and 865 Indigenous territories). These areas are concentrated in the northern and central Amazon. See Annex 1 for a list of specific areas that were significant carbon sinks.

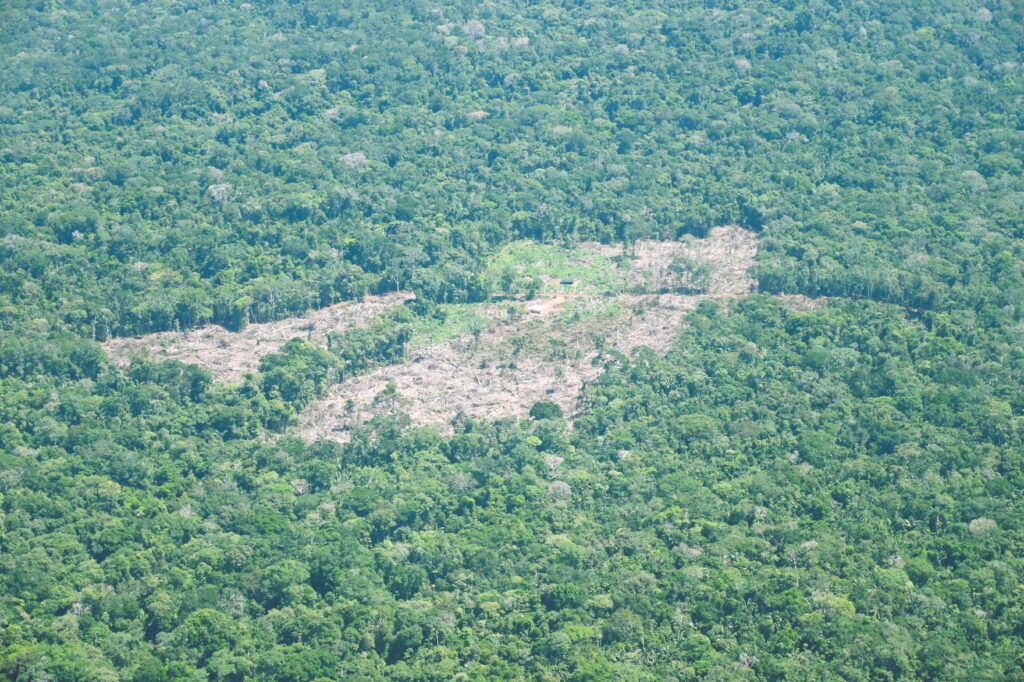
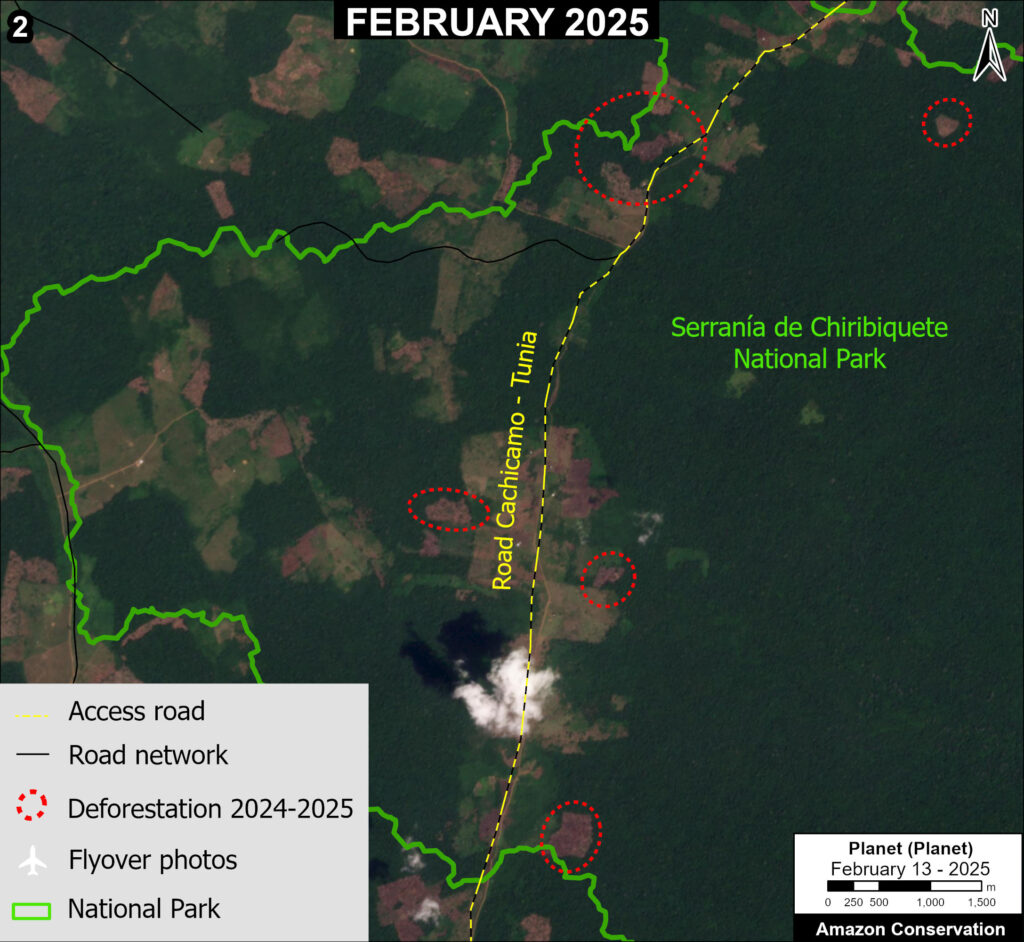
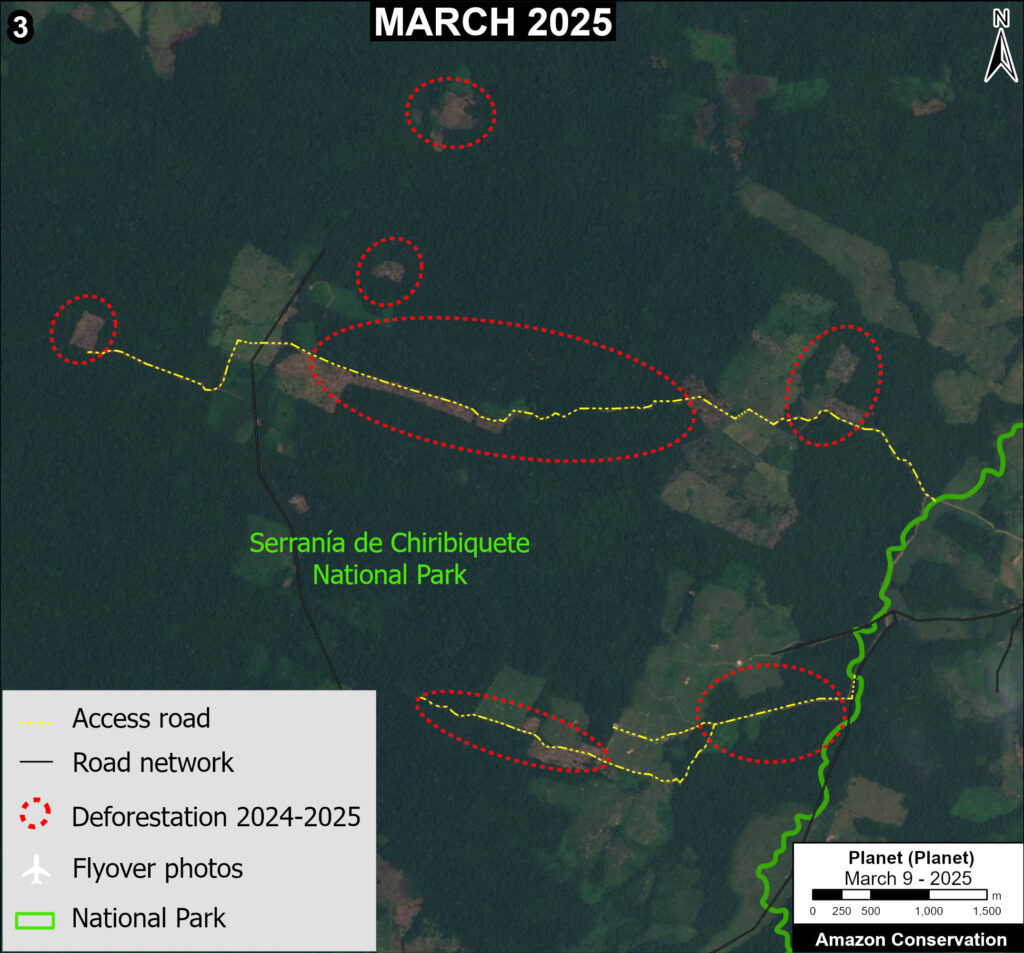
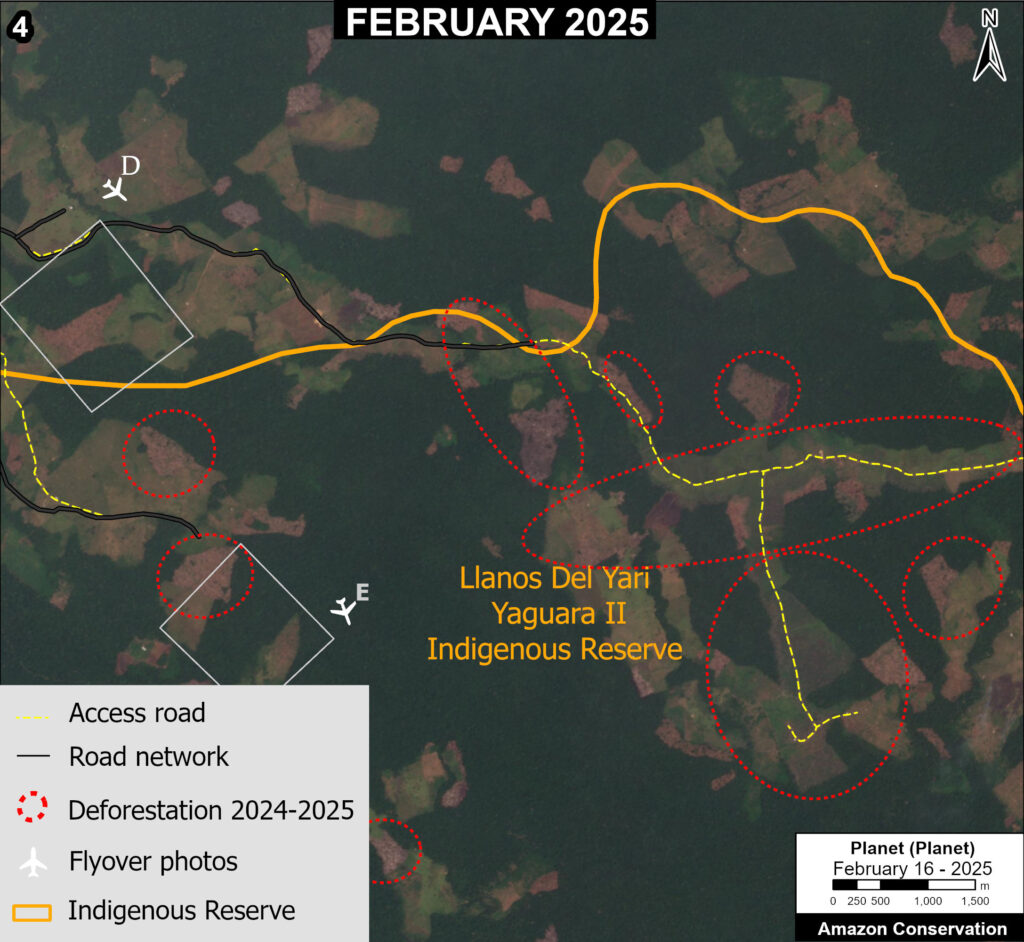
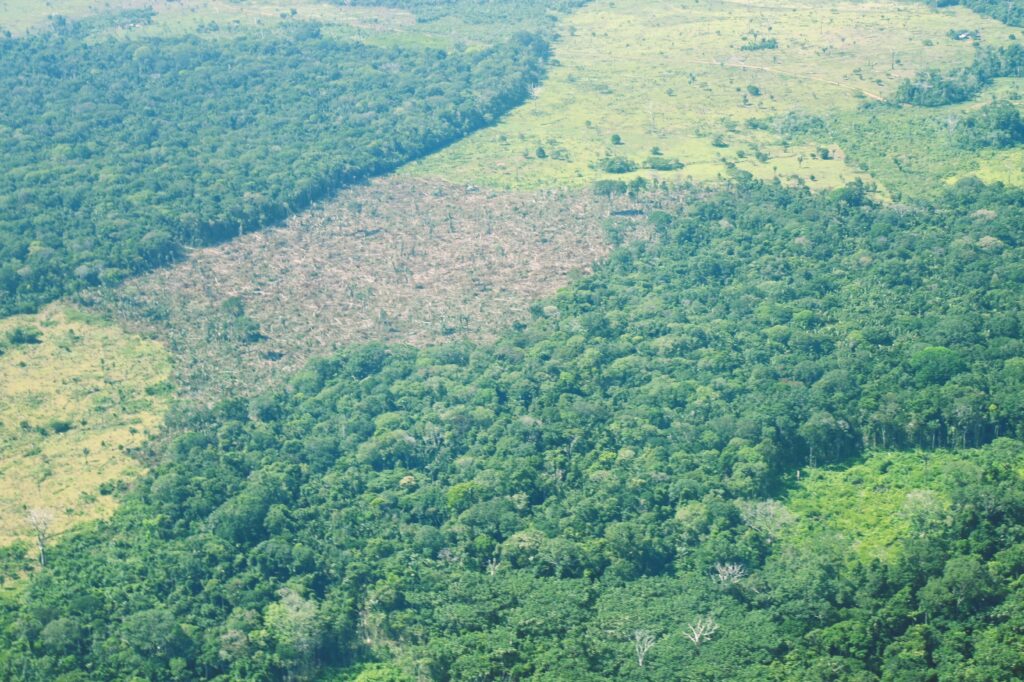
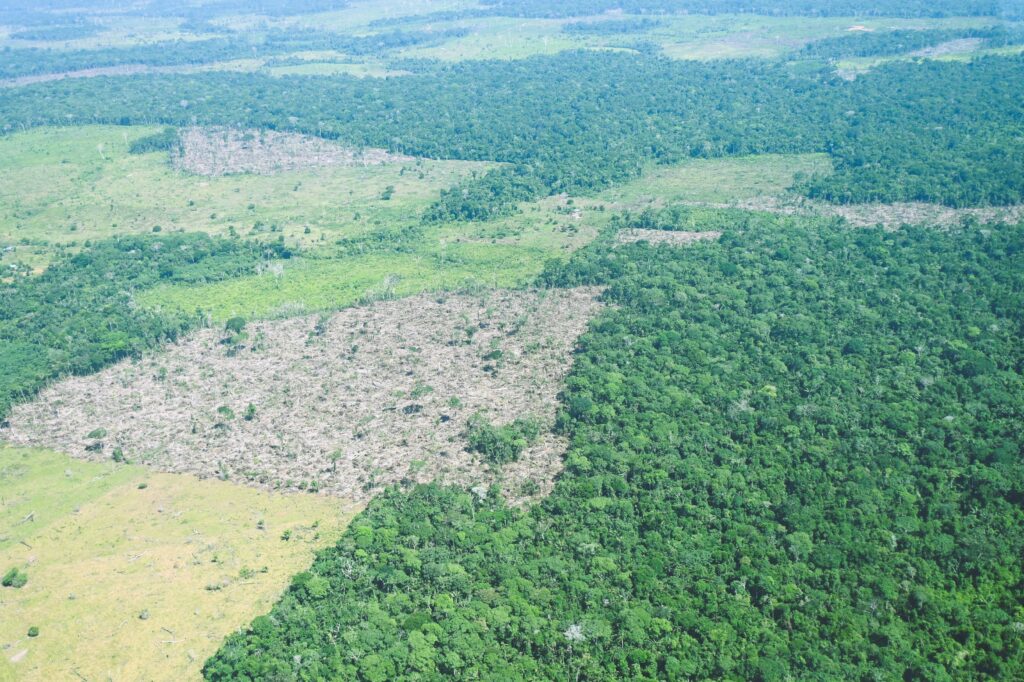
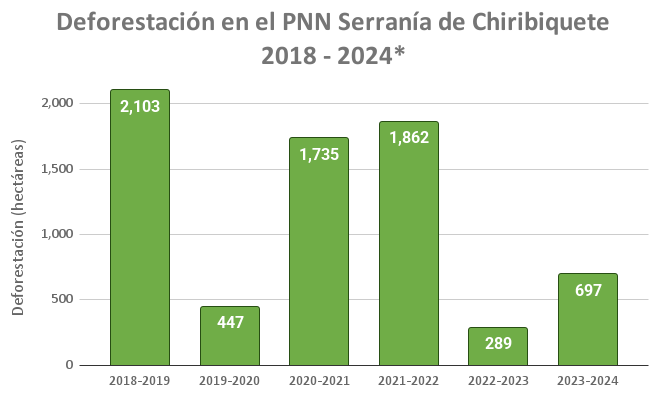
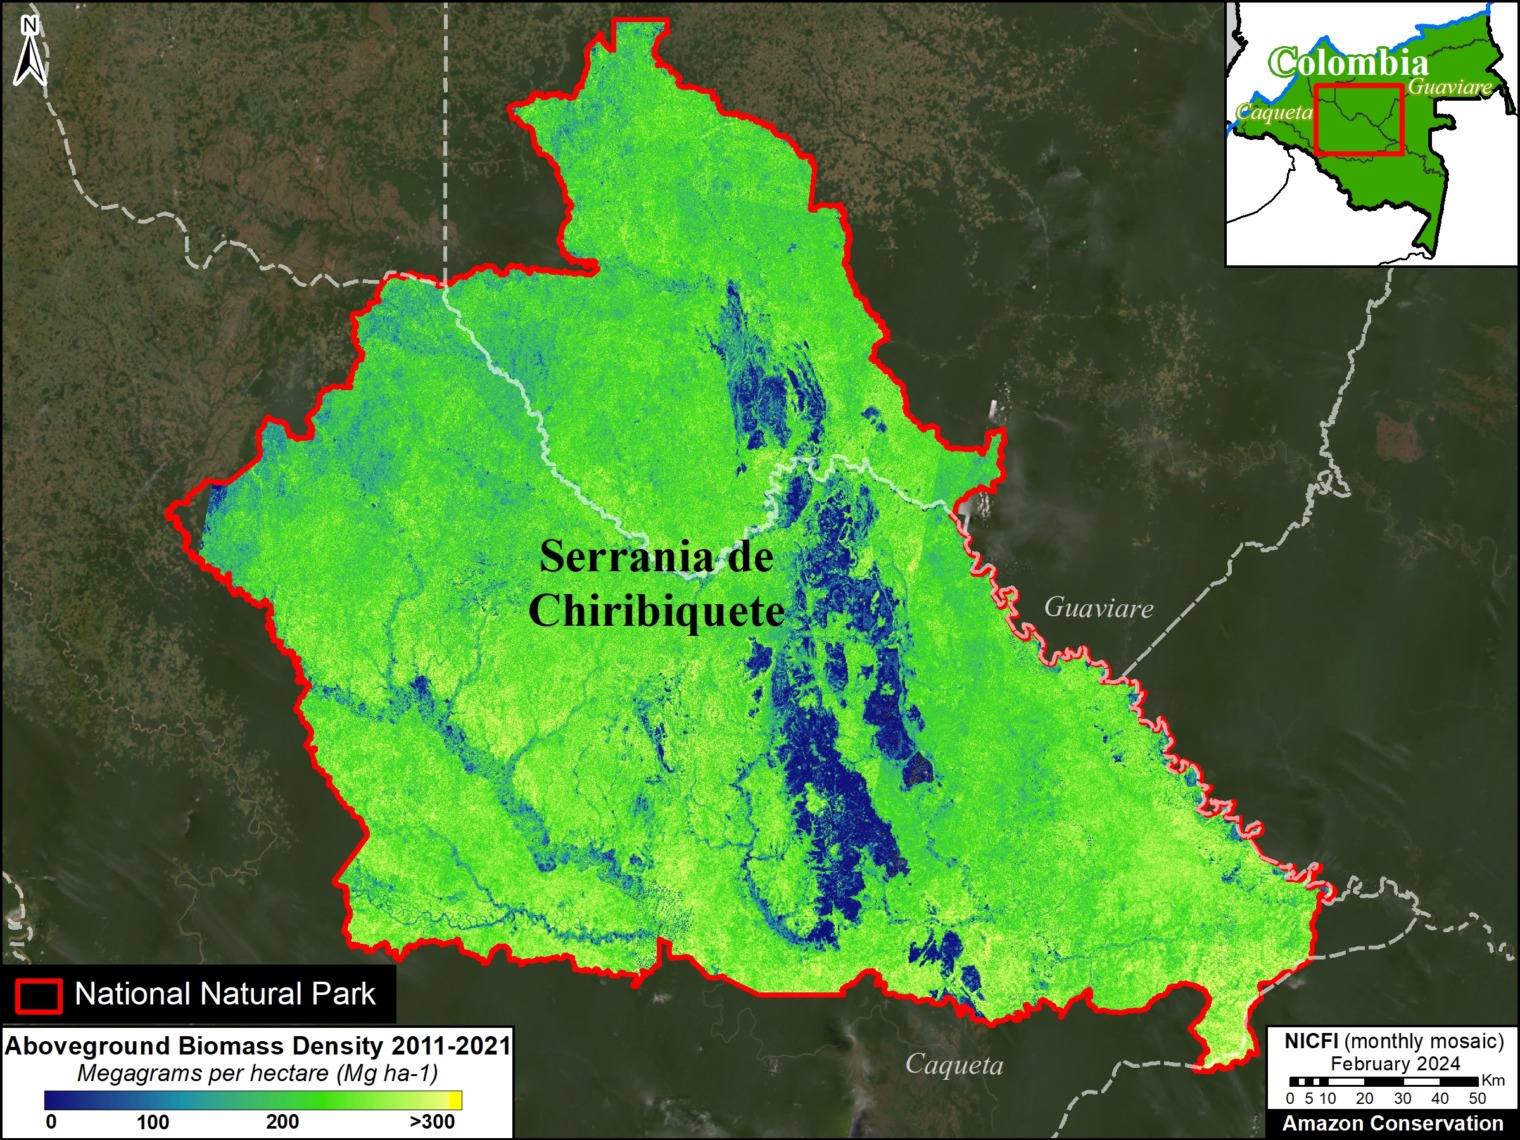
It is important to note that deforestation pressures currently threaten several of these significant carbon sinks, including Chiribiquete National Park and Nukak-Maku Indigenous Reserve in Colombia, Sierra del Divisor National Park in Peru, and Canaima National Park in Venezuela.

In contrast, we found 1,439 areas (156 protected areas and 1,283 Indigenous territories) that served as significant carbon sources. It is important to note that some areas with little documented deforestation, such as Alto Purus National Park, may have carbon loss from natural causes.

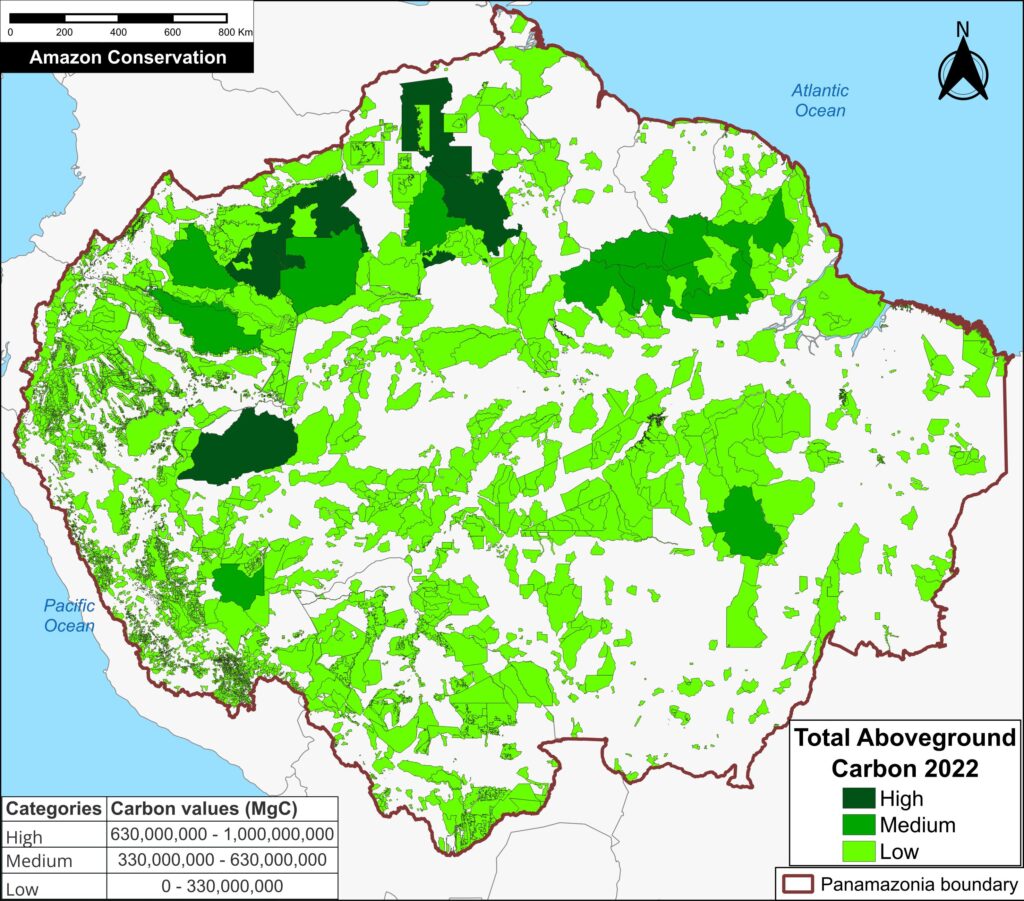
Figure 3. Total aboveground carbon stocks in each protected area and Indigenous territory. Data: Planet, ACA/MAAP.

Figure 3 offers the most recent snapshot of total aboveground carbon stocks in each protected area and Indigenous territory.

It presents data for 2022 categorized into three groups of High, Medium, and Low. Note that the highest carbon totals (over 330 million metric tons) are concentrated across the large designated areas of the northern Amazon.

These High and Medium carbon areas may be considered to have the highest overall conservation value purely in terms of total carbon.

See Annex 1 for specific areas with the highest carbon stocks as of 2022.


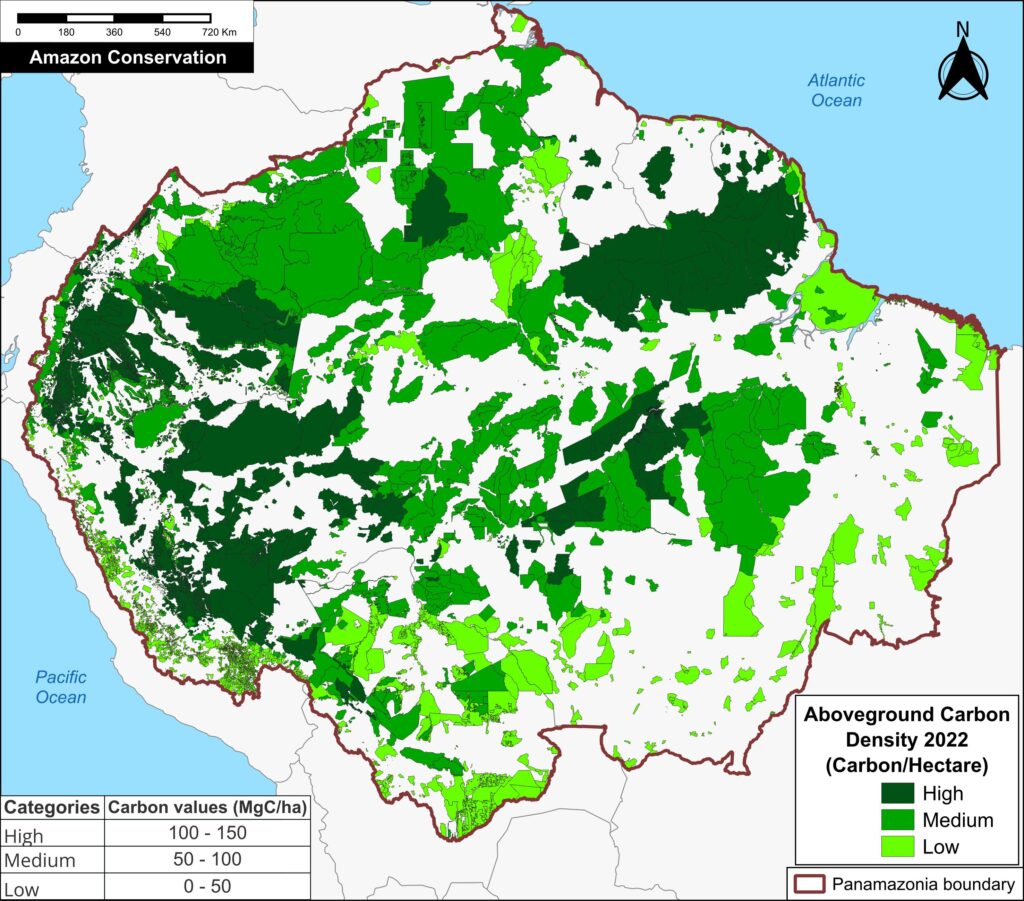
Figure 4. Aboveground carbon density in each protected area and Indigenous territory (2022). Data: Planet, ACA/MAAP

Finally, Figure 4 also displays the most recent data (2022) in each protected area and Indigenous territory, but standardized for area (aboveground carbon/hectare).

Note that the highest carbon totals (over 50 metric tons per hectare) are more evenly concentrated across the Amazon.

These High and Medium carbon areas may be considered to have the highest carbon conservation value per hectare.


Policy Implications:
Unlocking the Climate Value of Protected Areas and Indigenous Territories in the Amazon

Policy and finance for tropical forests as a climate solution have largely focused on reducing emissions from deforestation and forest degradation (REDD+). These efforts have made important strides in slowing and directing finance to tackle forest loss, particularly in high-deforestation regions. However, this emphasis on avoided emissions overlooks a critical component of the global carbon cycle: the carbon sink function (gaining of carbon over time) of primary tropical forests — which this analysis using Planet’s Forest Carbon Diligence data show is both measurable and significant.

This omission leaves a major flux in the carbon system—ongoing carbon sequestration in old-growth forests—outside the scope of existing market or non-market incentives. Critically, many of these carbon-absorbing forests are already located within established protected areas and indigenous territories. These areas are globally recognized for their importance in biodiversity conservation and for the stewardship provided by Indigenous Peoples and local communities. 

As global attention increasingly turns to engineered carbon removal strategies such as BECCS (Bioenergy with carbon capture and storage) and Direct Air Capture, there is an urgent need to recognize that Amazonian forests are already performing this function—naturally and at scale. Yet the value of Protected Areas and Indigenous territories as a potent carbon sink is neither monetized nor rewarded under current frameworks, unless they can demonstrate that they are under threat from deforestation or degradation in order to access REDD+ finance. An emerging exception is the High Integrity Forests Investment Initiative (HIFOR), which recognizes the value of carbon sequestration in old-growth forests, but does not generate tradable credits for each ton absorbed.5 The Tropical Forests Forever Fund (TFFF) proposed by Brazil for adoption at COP 30, would also reward forest countries at a rate of approximately US$ 4.00/year for every hectare of tropical forest they protect, regardless of whether they are under threat.6

To date, however, protected areas and Indigenous territories, despite their proven climate contribution, often lack the financial support necessary to ensure long-term effectiveness and resilience. As a result, they often face chronic underfunding,7 limiting their long-term effectiveness and resilience. Policy innovation is needed to close this gap and integrate the carbon sink function of mature forests into funding mechanisms for forest protection. Doing so would unlock meaningful incentives for the continued, long-term stewardship of these high-carbon ecosystems and would ensure that one of the planet’s most effective natural climate solutions receives the attention and resources it deserves.

Annex 1

Specific areas that were significant carbon sinks include:

Otishi, Sierra del Divisor, Güeppí-Sekime and Yaguas National Parks, Matsés, and Pucacuro National Reserves, Ashaninka Communal Reserve, and Cordillera Escalera and Alto Nanay- Pintuyacu Chambira Regional Conservation Area, Matses, Pampa Hermosa, and Yavarí – Tapiche Indigenous Reserves, and Kugapakori, Nahua, Nanti Territorial Reserve in Peru;

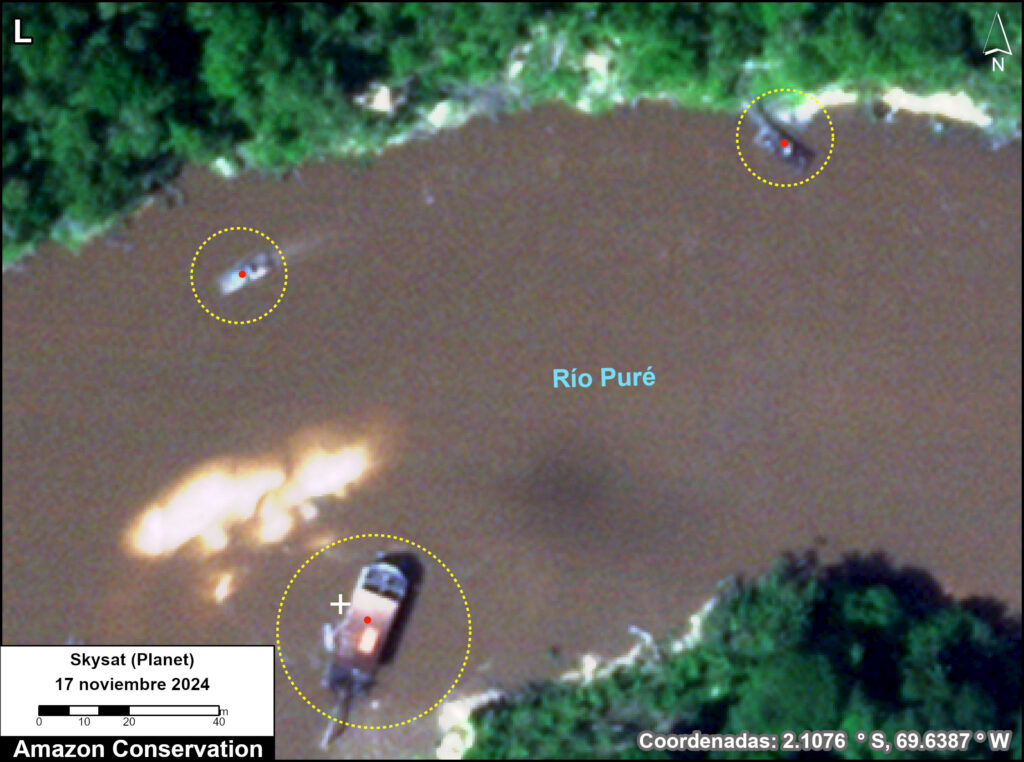
Amacayacu, Chiribiquete, Cahuinari, Rio Pure, and Yaigoje Apaporis National Parks, Nukak Natural Reserve, Amazonas Forest Reserve, and Putumayo and Nukak-Maku, Yaigoje Rio Apaporis and Vaupes Indigenous Reserve in Colombia;

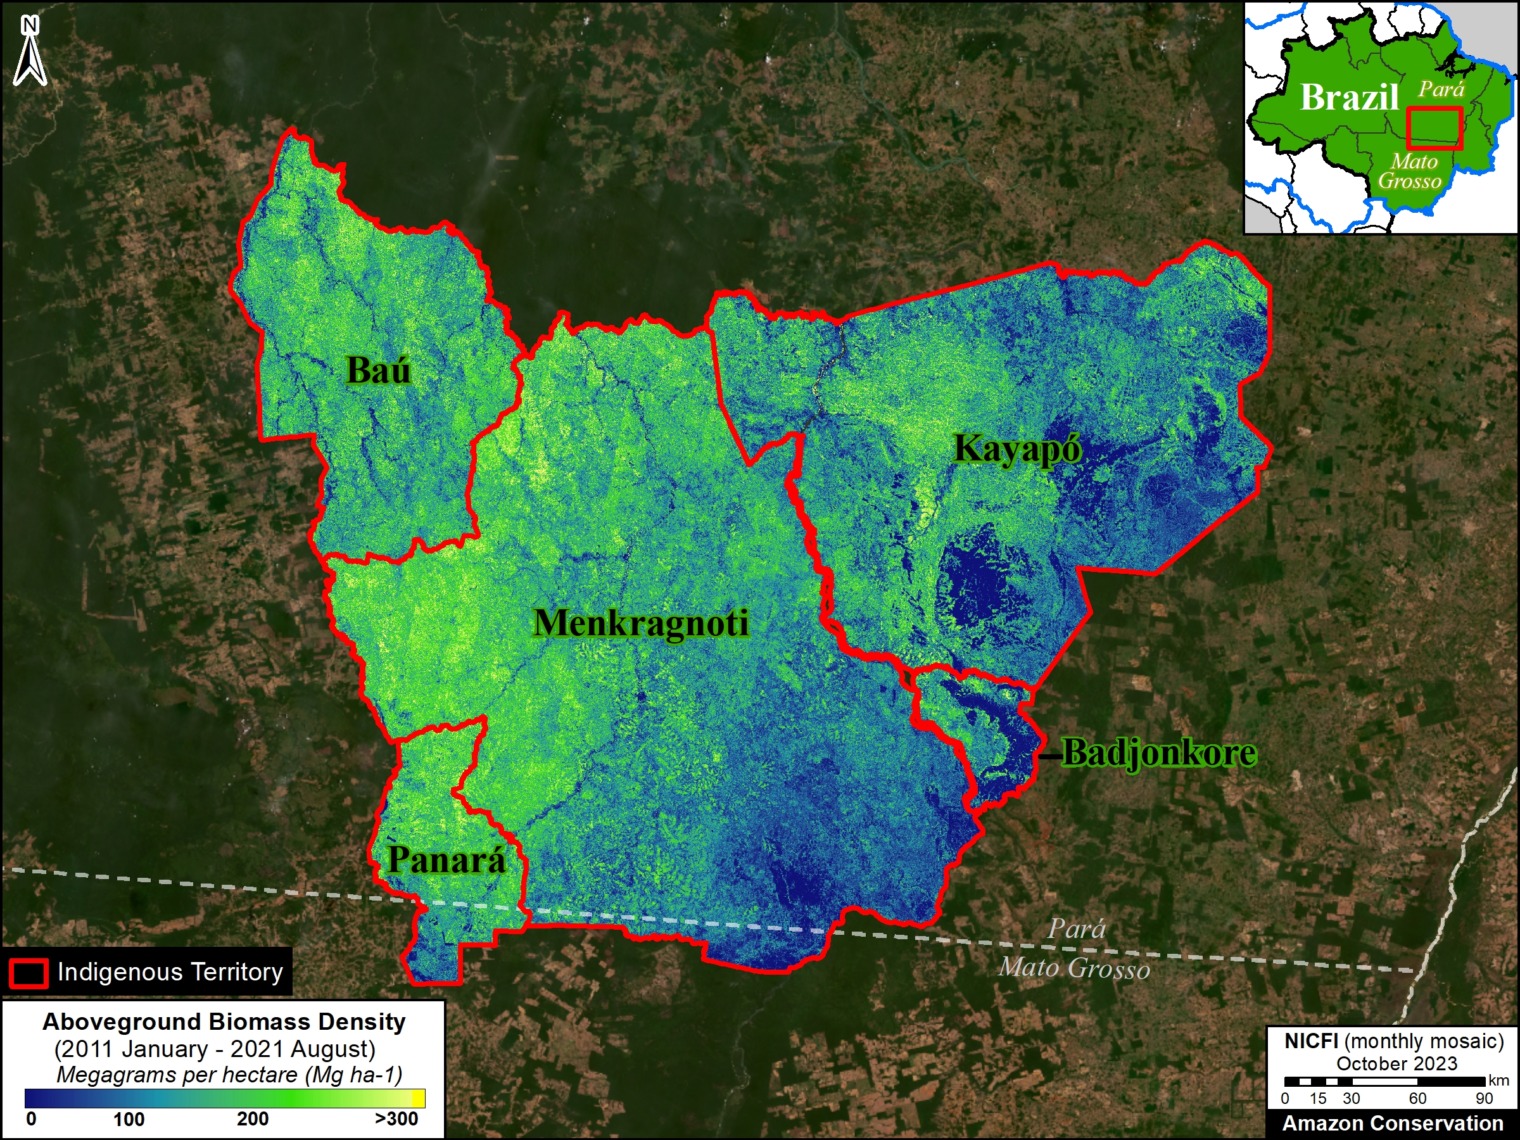
Campos Amazônicos, Juruena, Mapinguari, Nascentes do Lago Jari, Serra do Divisor, and Montanhas do Tumucumaque National Parks, Amanã, Aripuanã, Crepori, Tapajós, and Tefé National Forests in Brazil, Itaituba and Jatuarana National Forests, and Alto Rio Negro, Baú, Aripuanã, Aripuanã, Apyterewa, Mundurucu, and Vale do Javari Indigenous Territories in Brazil.

Achuar Indigenous Territory and Zona Intangible Tagaeri – Taromenane in Ecuador; Manuripi Heath National Reserve and Takana, Takana II, and Yuracare Indigenous Reserves in Bolivia; Central Suriname and Sipaliwini Nature Reserves in Suriname; Canaima National Park in Venezuela; and Parc Amazonien de Guyane National Park in French Guiana, 

Specific areas with the highest carbon stocks, as of 2022, include:

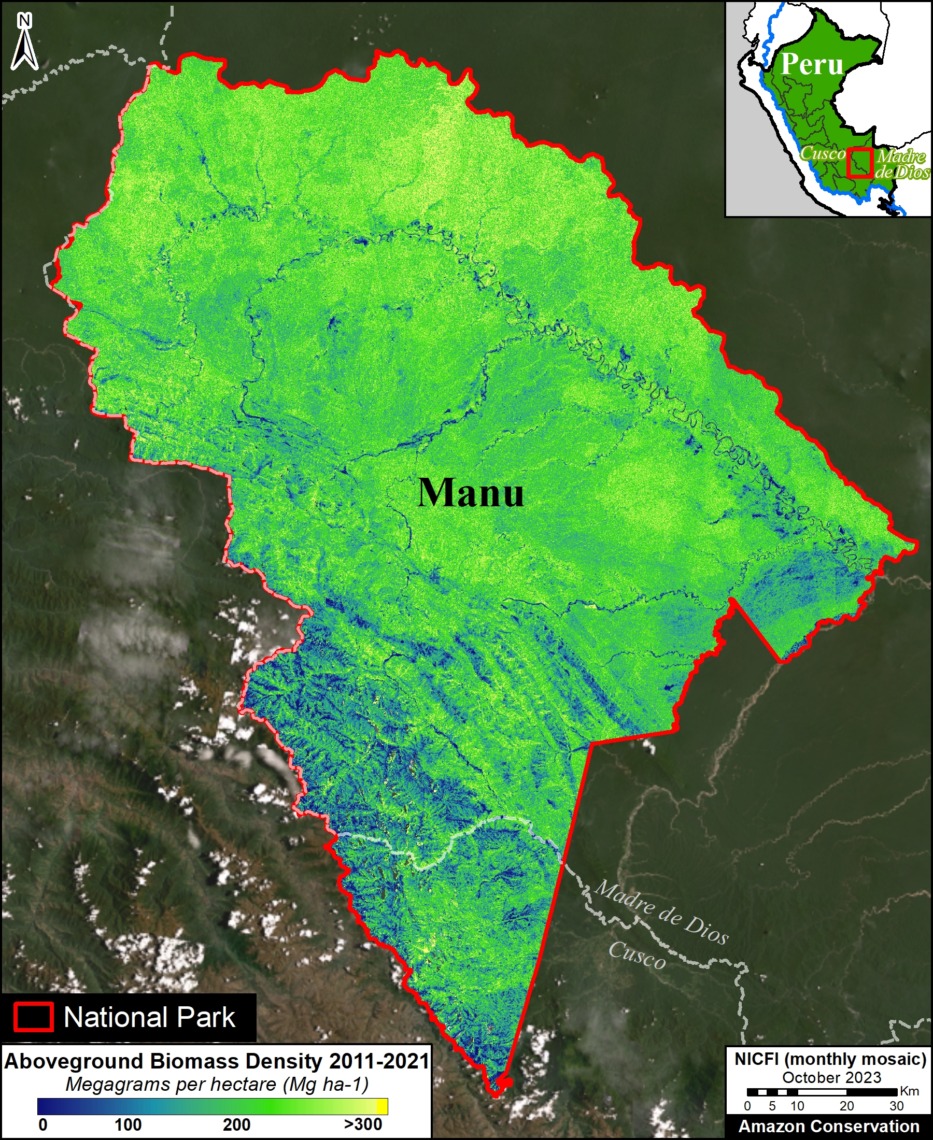
Alto Purús, Manu, Sierra del Divisor, and Cordillera National Parks in Peru; Chiribiquete National Park in Colombia; Montanhas do Tumucumaque, Pico da Neblina, Jaú, and Juruena National Parks and Yanomami, Menkragnoti, Kayapó, Mundurucu, and Vale do Javari Indigenous Territories in Brazil; Caura and Canaima National Parks in Venezuela; and Parc Amazonien de Guyane National Park in French Guiana;

Methodology

We analyzed Planet Forest Carbon Diligence, a cutting-edge new dataset from the satellite-based company Planet, featuring a 10-year historical time series (2013 – 2022) with wall-to-wall estimates for aboveground carbon density at 30-meter resolution.3,4

One notable caveat of this data is that it does not distinguish aboveground carbon loss from natural vs human-caused drivers, so additional information may be incorporated to understand the context of each area. 

Based on these data, annual aboveground carbon values ​​were estimated in Amazonian protected areas and Indigenous territories to obtain a time series for 2013-2022. In addition, the Mann-Kendall test was used to analyze trends in the generated time series.

Our data source for protected areas and Indigenous territories is from RAISG (Amazon Network of Georeferenced Socio-Environmental Information), a consortium of civil society organizations in the Amazon countries. This source (accessed in December 2024) contains spatial data for 5,943 protected areas and Indigenous territories, covering 414.9 million hectares across the Amazon.

We determined that many of these areas (4,000) did not include creation date metadata, prohibiting any time-series control for that variable. Instead, we used the most current extent of protected areas and Indigenous territories as a proxy for those that existed from 2013 to 2022.

There was substantial overlap between protected areas and Indigenous territories, but we accounted for this to avoid double counting of the overlapping areas.

The aboveground carbon values for protected areas and Indigenous territories were calculated for each country and then summed across the Amazon.

The remaining areas were combined into the category of “Outside protected areas and Indigenous territories” and also calculated for each country and summed across the Amazon.

Our geographic range for the Amazon is a hybrid designed for maximum inclusion: biogeographic boundary (as defined by RAISG) for all countries, except for Bolivia and Peru, where we use the watershed boundary, and Brazil, where we use the Legal Amazon boundary. Our area estimate for this definition of the Amazon biome is 839.2 million hectares.

Notes

1 Breaking down the results by category, protected areas contained nearly 21.1 billion metric tons of aboveground carbon as of 2022, gaining over 204 million metric tons since 2013, while Indigenous territories contained over 16.8 billion metric tons of aboveground carbon as of 2022, gaining over 132 million metric tons since 2013. Note that protected areas and Indigenous territories overlap in many areas.

2 Standardizing for area (that is, calculating the results per hectare), protected areas and Indigenous territories contained 82.2 metric tons of aboveground carbon per hectare as of 2022, gaining a net 0.6 metric tons per hectare since 2013. In contrast, areas outside of protected areas and Indigenous territories contained 53.2 metric tons of aboveground carbon per hectare as of 2022, losing a net 0.6 metric tons per hectare since 2013.

3 Anderson C (2024) Forest Carbon Diligence: Breaking Down the Validation and Intercomparison Report. https://www.planet.com/pulse/forest-carbon-diligence-breaking-down-the-validation-and-intercomparison-report/

4 In terms of the limitations of Planet’s Forest Carbon Diligence data, Duncanson et al (2025) recently wrote a Letter in Science focused on spatial resolution for forest carbon maps. Given the natural constraint of the size of a tree, they discuss the challenge of pixel-level validation below 5 meters for forest carbon monitoring. The authors state that spatial resolution should at minimum exceed the crown diameter of a typical large tree, which is about 20 meters for tropical forests. In this sense, the 30-meter product exceeds this limitation.

Duncanson et al (2025) Spatial resolution for forest carbon maps. Science 387: 370-71.

5 WCS High Integrity Forest Investment Initiative (HIFOR): The Science Basis

6 https://www.bloomberg.com/news/newsletters/2025-04-04/too-big-to-fell-brazil-takes-trees-to-wall-street?cmpid=BBD040425_GR

7 UNEP-WCMC, IUCN, and NGS. (2022). Protected Planet Report 2022. Cambridge, UK: UNEP-WCMC.

Acknowledgments

Through a generous sharing agreement with the satellite company Planet, we have been granted access to this data across the entire Amazon biome for the analysis presented in this series.

We thank colleagues from the following organizations for helpful comments on this report: Planet, Conservación Amazónica – ACCA, Conservación Amazónica -ACEAA, Gaia Amazonas, Ecociencia, and Instituto del Bien Común.

We especially thank colleagues at Conservación Amazónica – ACCA for help with the 10-year data analysis.

This report was made possible by the generous support of the Norwegian Agency for Development Cooperation (NORAD)

Citation

Bodin B, Finer M, Castillo H, Mamani N (2025) Carbon in the Amazon (part 4): Protected Areas & Indigenous Territories. MAAP: 225.

MAAP #224: Illegal Deforestation in the Colombian Amazon – Chiribiquete National Park & Llanos del Yarí – Yaguará II Indigenous Reserve

Graph 1. Deforestation in the Colombian Amazon, 2013-2024. Data: IDEAM, UMD/GFW

The Colombian Environment Ministry recently announced that, after the country experienced its lowest deforestation in over 20 years in 2023, forest clearing rose 35% in 2024 (Graph 1). In addition, the Ministry reported an increase in medium-sized clearing, indicating relatively organized and funded operations (Note 1).

Over the past 10 years, 60% of the national deforestation has occurred in the Colombian Amazon. As Graph 1 indicates, there was a large increase in 2017 following the peace accords with the guerrilla group FARC, and a subsequent decrease in 2022 and 2023 (Note 2). Initial estimates indicate an increase for 2024 (Note 3). Overall, there have been nearly 1,200,000 hectares of deforestation across the Colombian Amazon over the past 10 years.

Much of the clearing in the Colombian Amazon is likely illegal (Law of 2021), occurring in national protected areas and Indigenous reserves.

Base Map: Focal area of the report. Data: ACA/MAAP, FCDS.

Here, we highlight recent 2024-25 deforestation in two key areas in the core of the Colombian Amazon: Chiribiquete National Park (Parque Nacional Natural Serranía de Chiribiquete) and the adjacent Llanos del Yarí – Yaguará II Indigenous Reserve (Resguardo Indígena Llanos del Yarí – Yaguará II). See the Base Map for additional context.

These areas are affected by several deforestation pressures, such as the expansion of road infrastructure, extensive livestock farming, pasture expansion, land grabbing, and illicit crops (coca). These pressures often interact, with access roads facilitating livestock farming and pasture expansion, which then facilitates land grabbing.

These drivers have led to the deforestation of over 7,100 hectares in Chiribiquete National Park since its most recent expansion in 2018 (see Annex 1).

Most recently, we estimate the deforestation of 525 hectares in Chiribiquete National Park (concentrated in the northern sector) during 2024-25, plus an additional 856 hectares in Llanos del Yarí – Yaguará II Indigenous Reserve. Note that most of the deforestation follows access roads.

Below, we illustrate the key cases of recent deforestation in both areas, highlighting the role of access roads as facilitators of illegal clearing. These case studies feature satellite images and overflight photos.

Any deforestation in these areas is noteworthy not only due to its impacts on primary forests, biodiversity, and Indigenous groups, but also on carbon reserves. In an upcoming report, we reveal that Chiribiquete National Park is one of the Amazon’s most important and significant carbon sinks.

This report was conducted in collaboration with our Colombian partner Foundation for Conservation and Sustainable Development (Fundación para la Conservación y el Desarrollo Sostenible – FCDS), and with financial support from the Overbrook Foundation.

Illegal Deforestation Cases

Zoom 1. Chiribiquete National Park. Data: ACA/MAAP, FCDS.

Chiribiquete National Park: Sector el Camuya

Zoom 1 shows the deforestation of 198 hectares during 2024 and early 2025 (indicated by red circles), along the Tunia-Ajaju road in the northwest sector of Chiribiquete National Park.

This road extends 45.3 kilometers into the park.


Photo 1A. Data: FCDS.

In January 2025, FCDS conducted a low-altitude overflight over this sector (see Photos 1A-C).

These photos bring an added level of spatial resolution and perspective, providing greater insight into the cause of the recent deforestation.

Photo 1A highlights deforestation associated with the opening of access roads in the park.


Photo 1B. Data: FCDS.

Photos 1B-C illustrate more clearly the fresh deforestation for expansion of the agricultural frontier.


Photo 1C. Data: FCDS.


Zoom 2. Chiribiquete National Park. Data: ACA/MAAP, FCDS.

Chiribiquete National Park: Sector El Palmar

Zoom 2 shows the deforestation of 179 hectares during 2024 and early 2025 (indicated by red circles), along the Cachicamo-Tunia road in the northern sector of Chiribiquete National Park.

This road extends 21 kilometers inside the park.


Zoom 3. Chiribiquete National Park. Data: ACA/MAAP, FCDS.

Chiribiquete National Park: Sector Norte

Zoom 3 shows the deforestation of 148 hectares during 2024 and early 2025 (indicated by red circles) along or near new access roads in the northeast sector of Chiribiquete National Park.

We estimate the construction of 15.2 kilometers inside the park during this period (also indicated by red circles).


Zoom 4. Yarí – Yaguará II Indigenous Reserve. Data: ACA/MAAP, FCDS.

Yarí – Yaguará II Indigenous Reserve 

Zoom 4 shows the major deforestation of 1,070 hectares during 2024 and early 2025 along or near a new illegal road in the northern part of Yarí – Yaguará II Indigenous Reserve.

This road extends 22 kilometers inside the reserve.


Photo 4D. Data: FCDS.

In January 2025, FCDS conducted a low-altitude overflight over this area, confirming and documenting the new patches of deforestation (see Photos 4D-E).

As noted above, these photos bring an added level of spatial resolution and perspective, providing greater insight into the cause of the recent deforestation.

Both Photos 4D-E indicate the expansion of livestock agricultural activities.


Photo 4E. Data: FCDS.


Policy Implications

The recent deforestation in protected areas and Indigenous territories described above highlights the shortcomings of several current policies of the State of Colombia, which have failed to stem the expansion of cattle ranching and illicit crops as a first step towards land grabbing and permanent deforestation. Several steps could be taken to overcome that failure:

  • Improved coordination between public entities concerned with law enforcement against drivers of deforestation, shortening investigation processes and leading to more effective and comprehensive responses.
  • The inclusion of targets for the reduction of deforestation and the mitigation of impacts on natural forests in agreements for the cessation of hostilities and the de-escalation of the conflict between the national government and armed groups.
  • Monitoring and regulation of public investments for the expansion of livestock farming by local and national governments, to reduce public incentives for deforestation.

Annex 1.

Annex 1. Data: FCDS

Notes

1 Griffin, O (2025) Colombia deforestation rose 35% in 2024, minister says

https://www.reuters.com/business/environment/colombia-deforestation-rose-35-2024-minister-says-2025-02-20/

2 Based on data from Colombia’s Institute of Hydrology, Meteorology and Environmental Studies (Instituto de Hidrología, Meteorología y Estudios Ambientales – IDEAM), a government agency of the Ministry of Environment and Sustainable Development.

3 Based on data from the University of Maryland/Global Forest Watch.

Acknowledgments

This report was conducted in collaboration with our Colombian partner Foundation for Conservation and Sustainable Development (Fundación para la Conservación y el Desarrollo Sostenible – FCDS), and with financial support from the Overbrook Foundation.