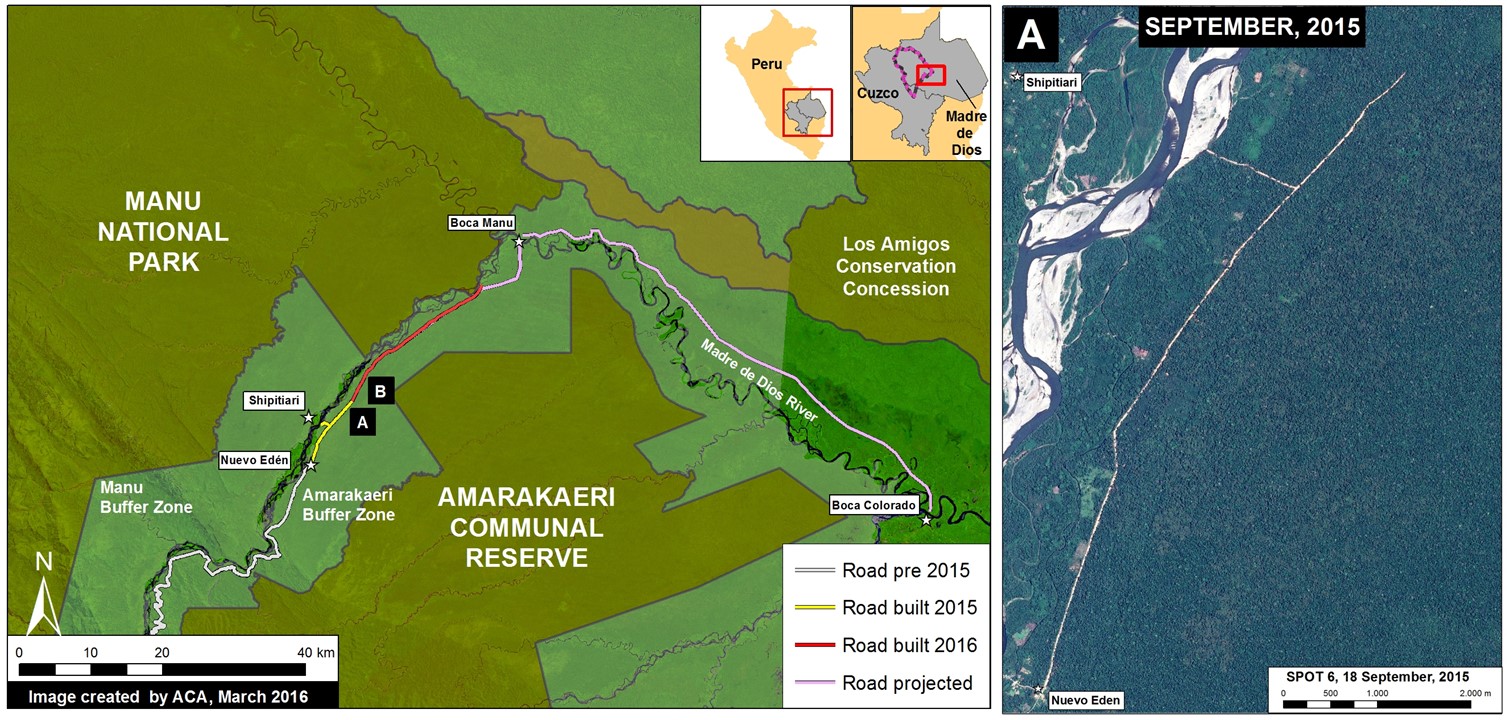
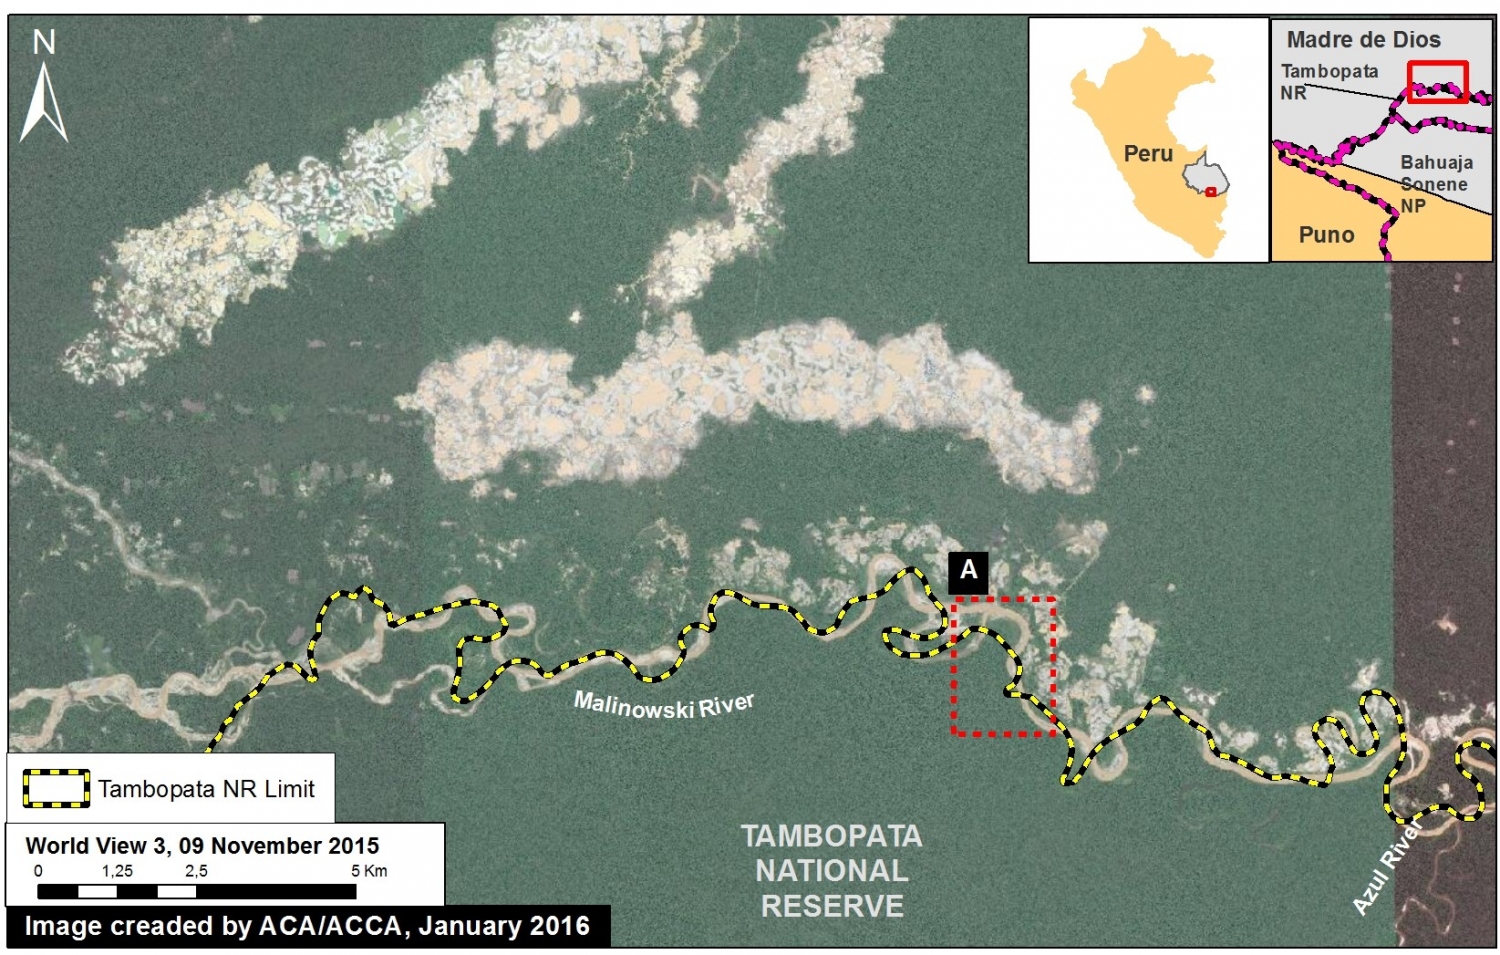
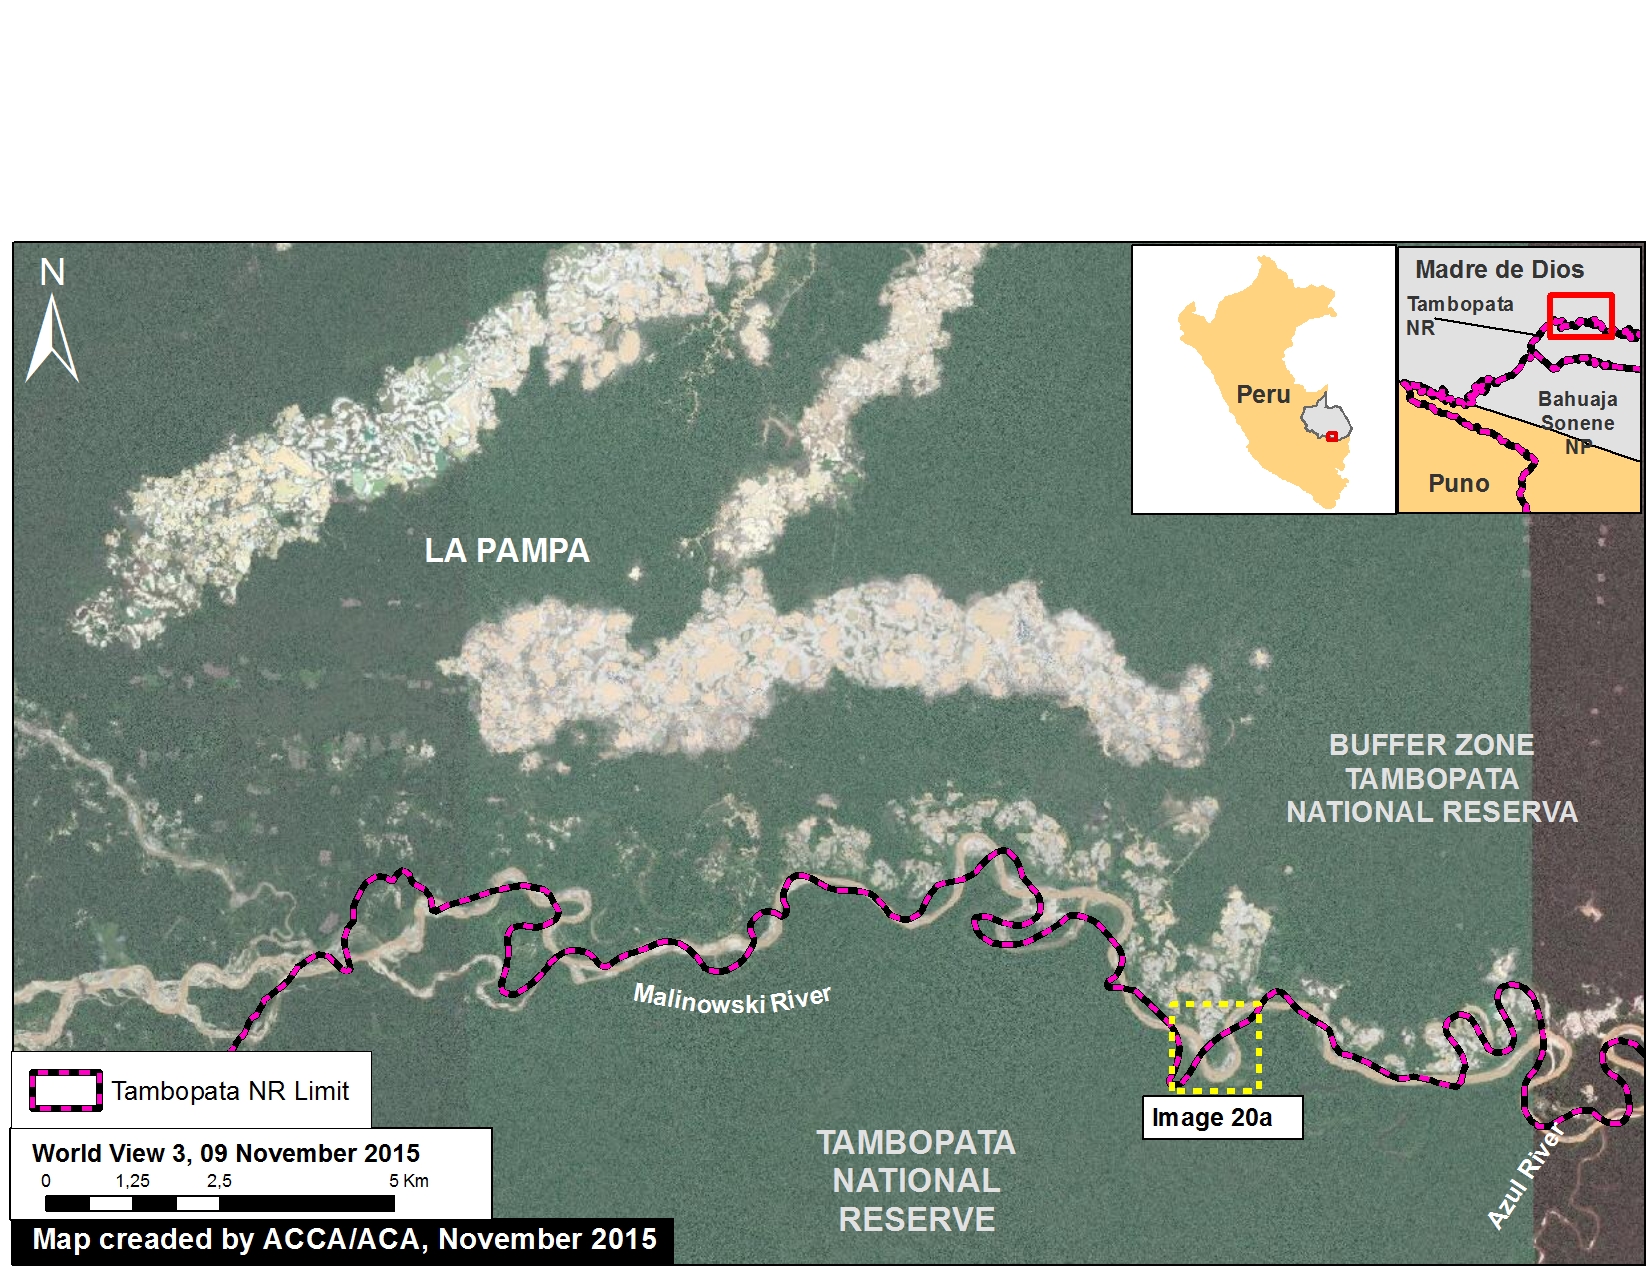
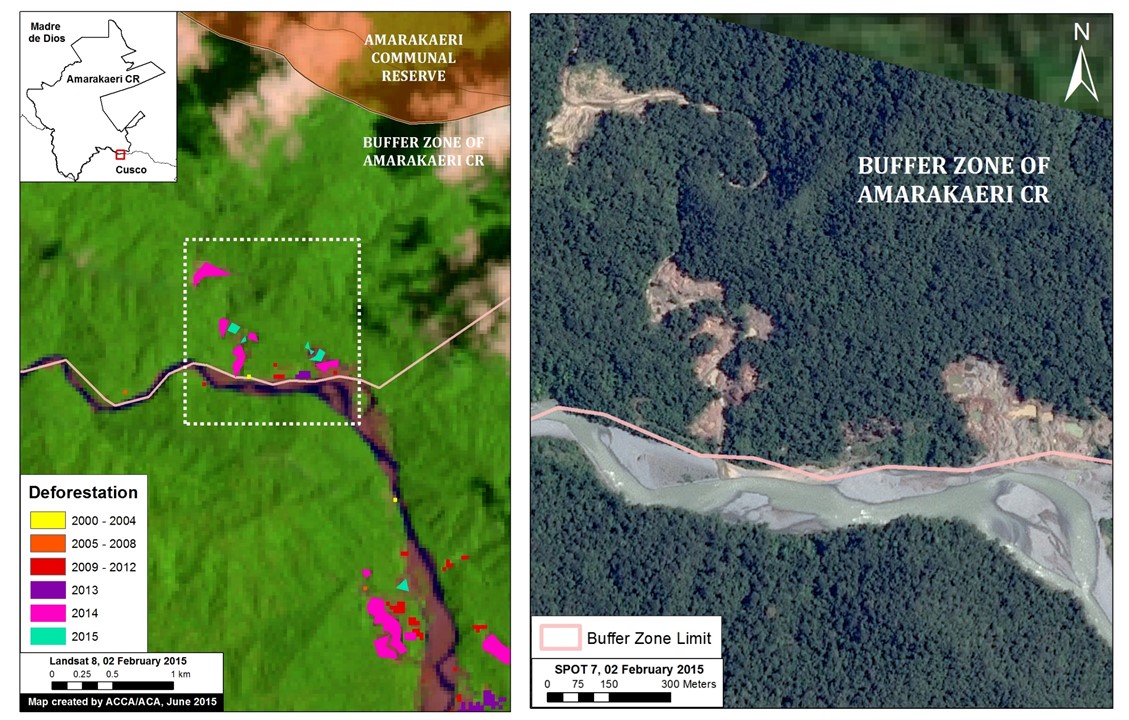
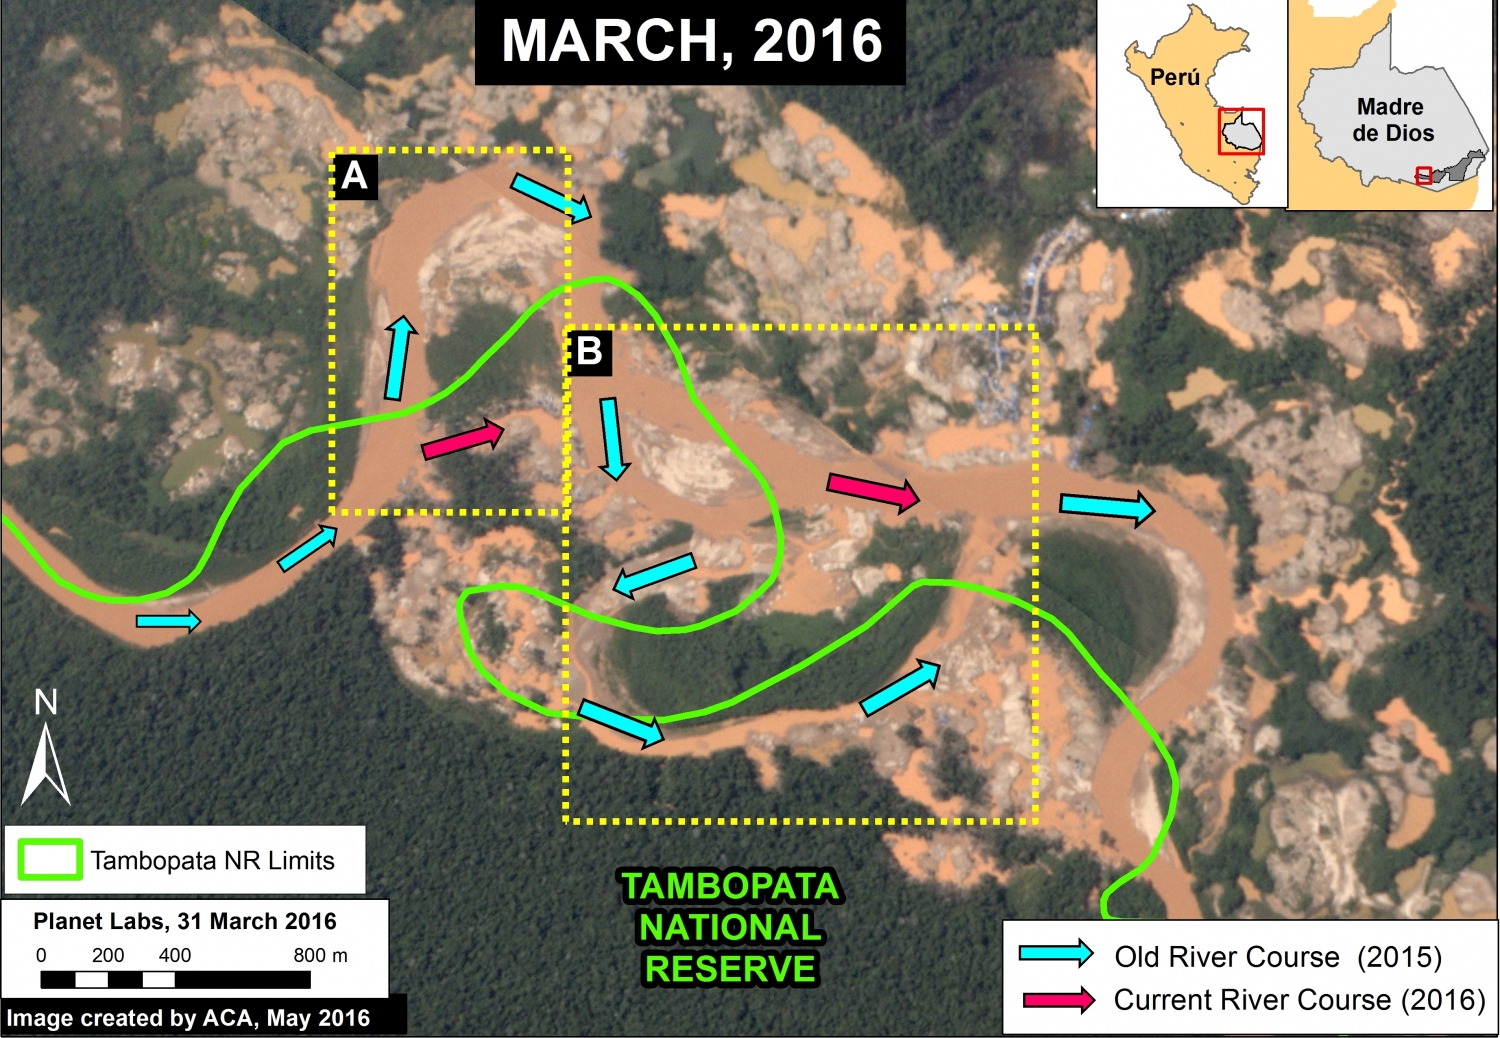
In MAAP #30, we described the illegal gold mining invasion of Tambopata National Reserve, an important protected area in the southern Peruvian Amazon (department of Madre de Dios). Here in MAAP #33, we show that illegal gold mining is also altering the course of the Malinowski River, which forms the natural boundary of the Reserve. Image 33a shows the two areas where we have documented a total artificial deviation (cutting) of 4.4 km (2.7 miles) of the river (see details below).
Zoom A: A Recent Deviation of the Malinowski River
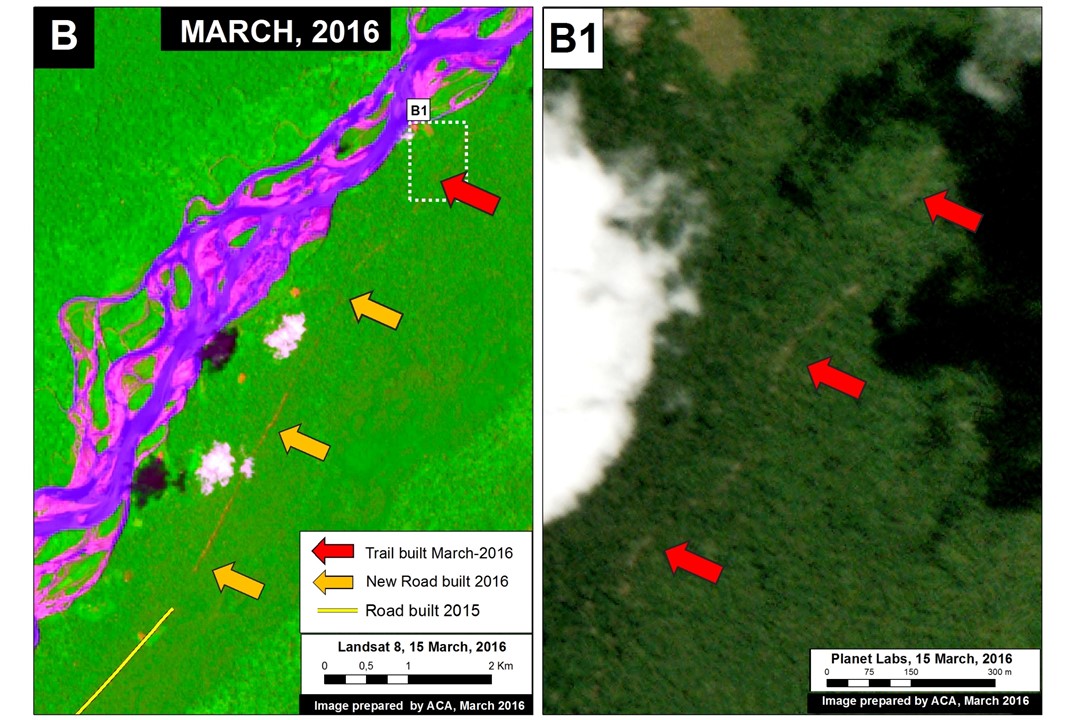
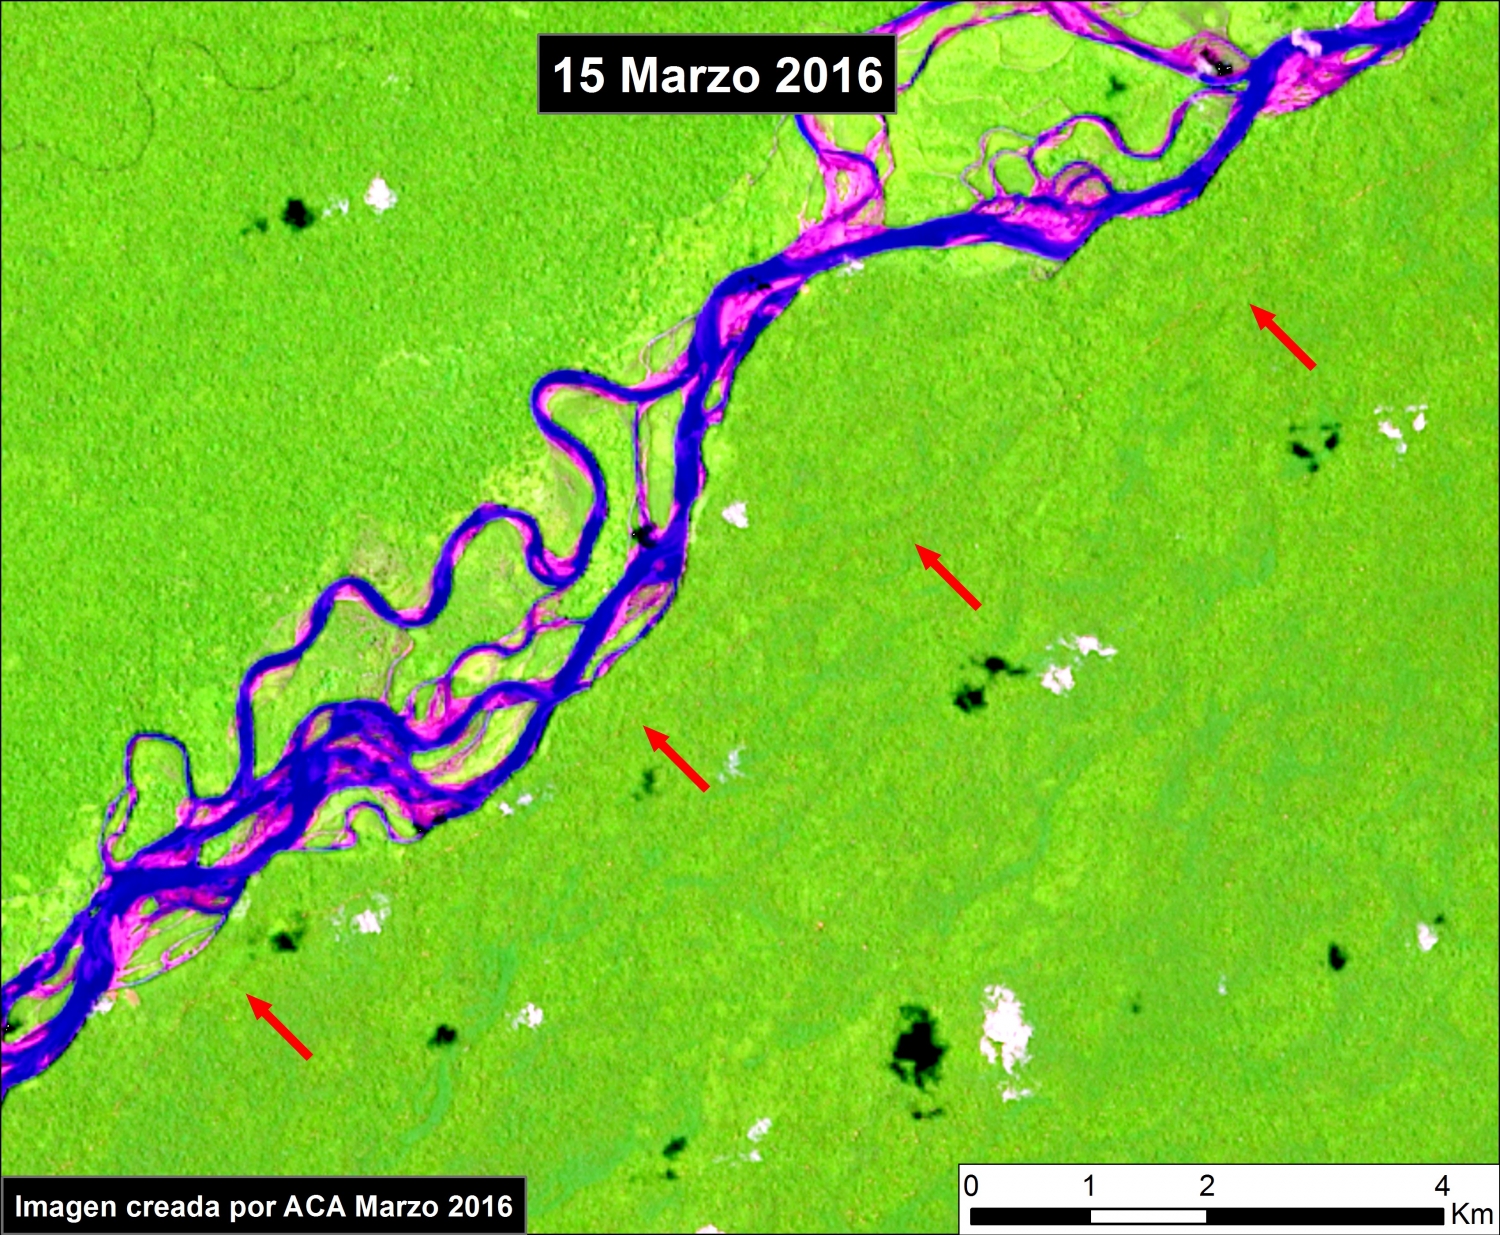
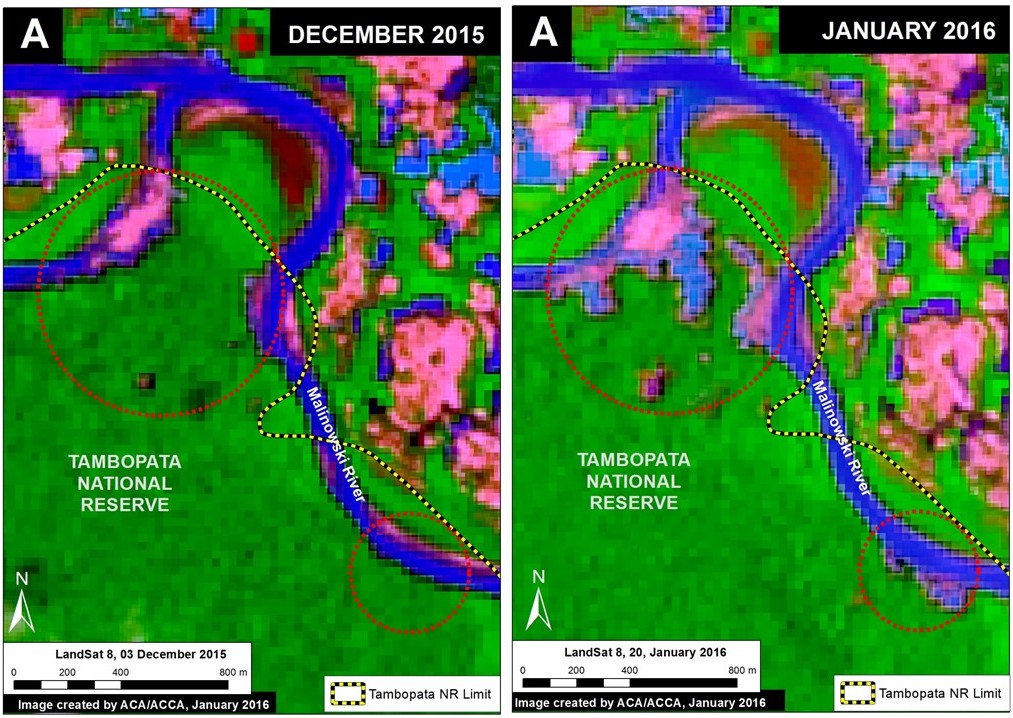
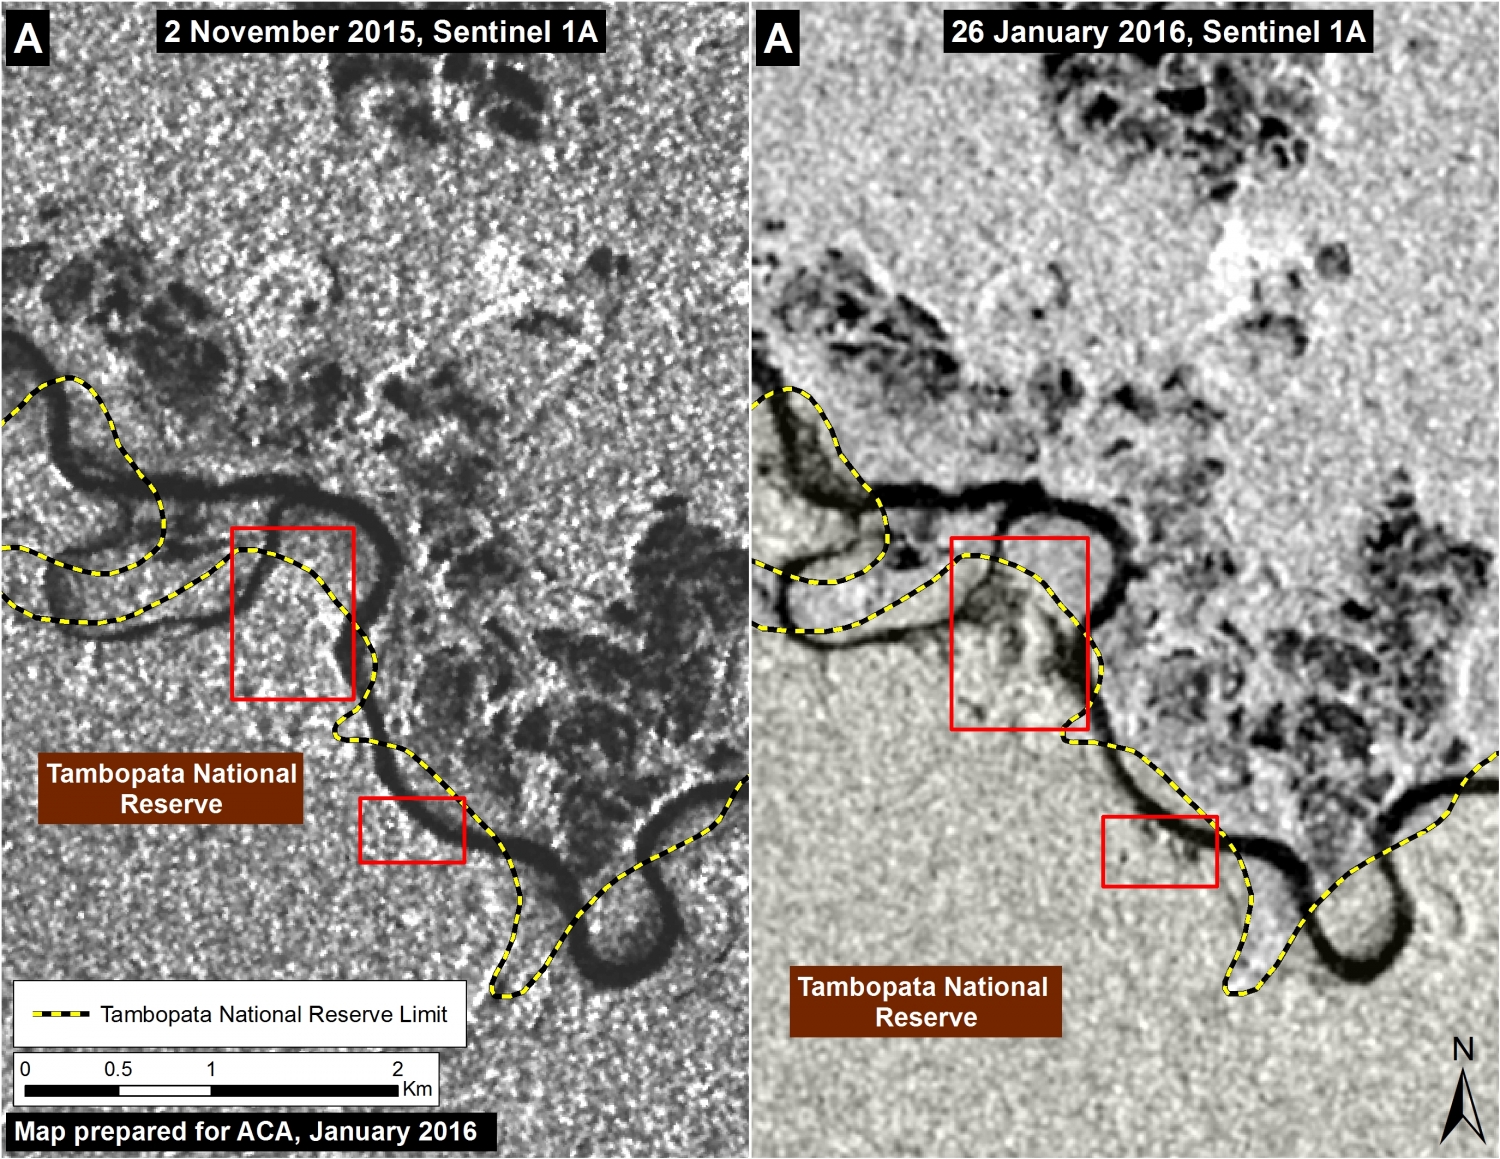
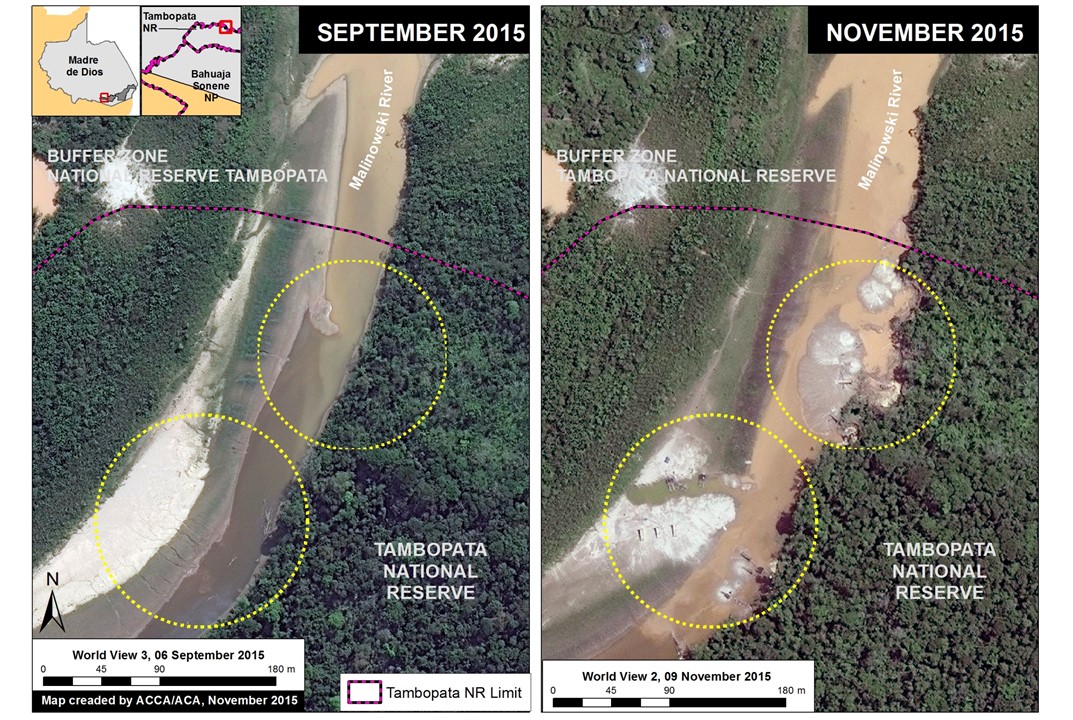
Image 33b shows the final stage of the deviation of the Malinowski River between March 31 (left panel) and May 3 (right panel) of this year in the area indicated by Inset A in Image 33a. The new flow of the river is clearly seen in the right panel, cutting a 1.7 km stretch of the previous course.
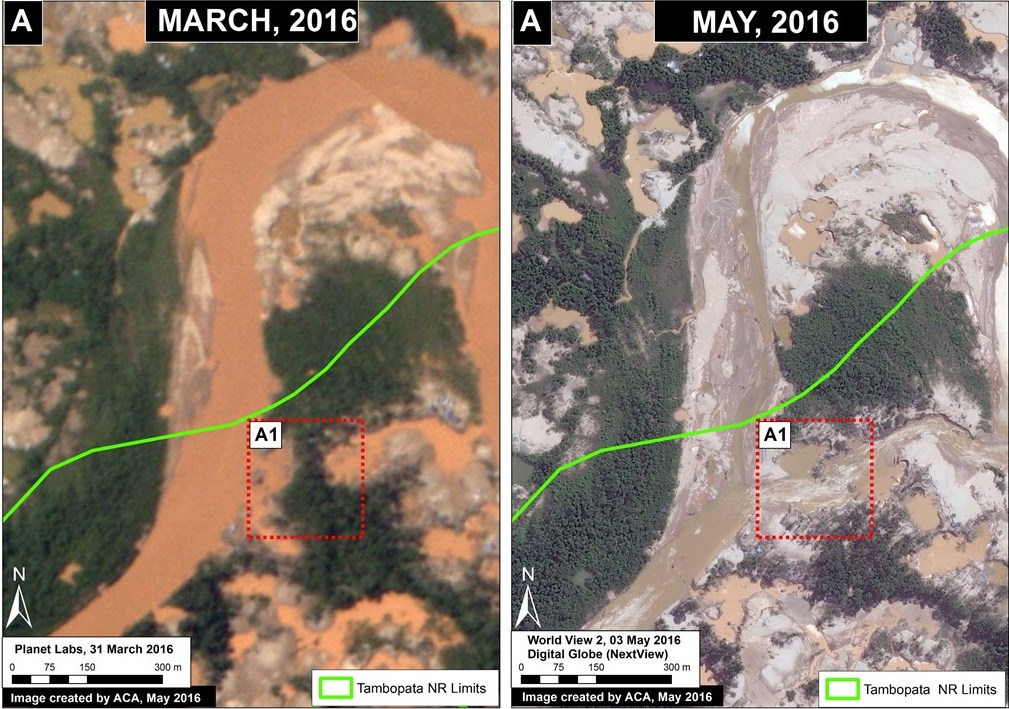
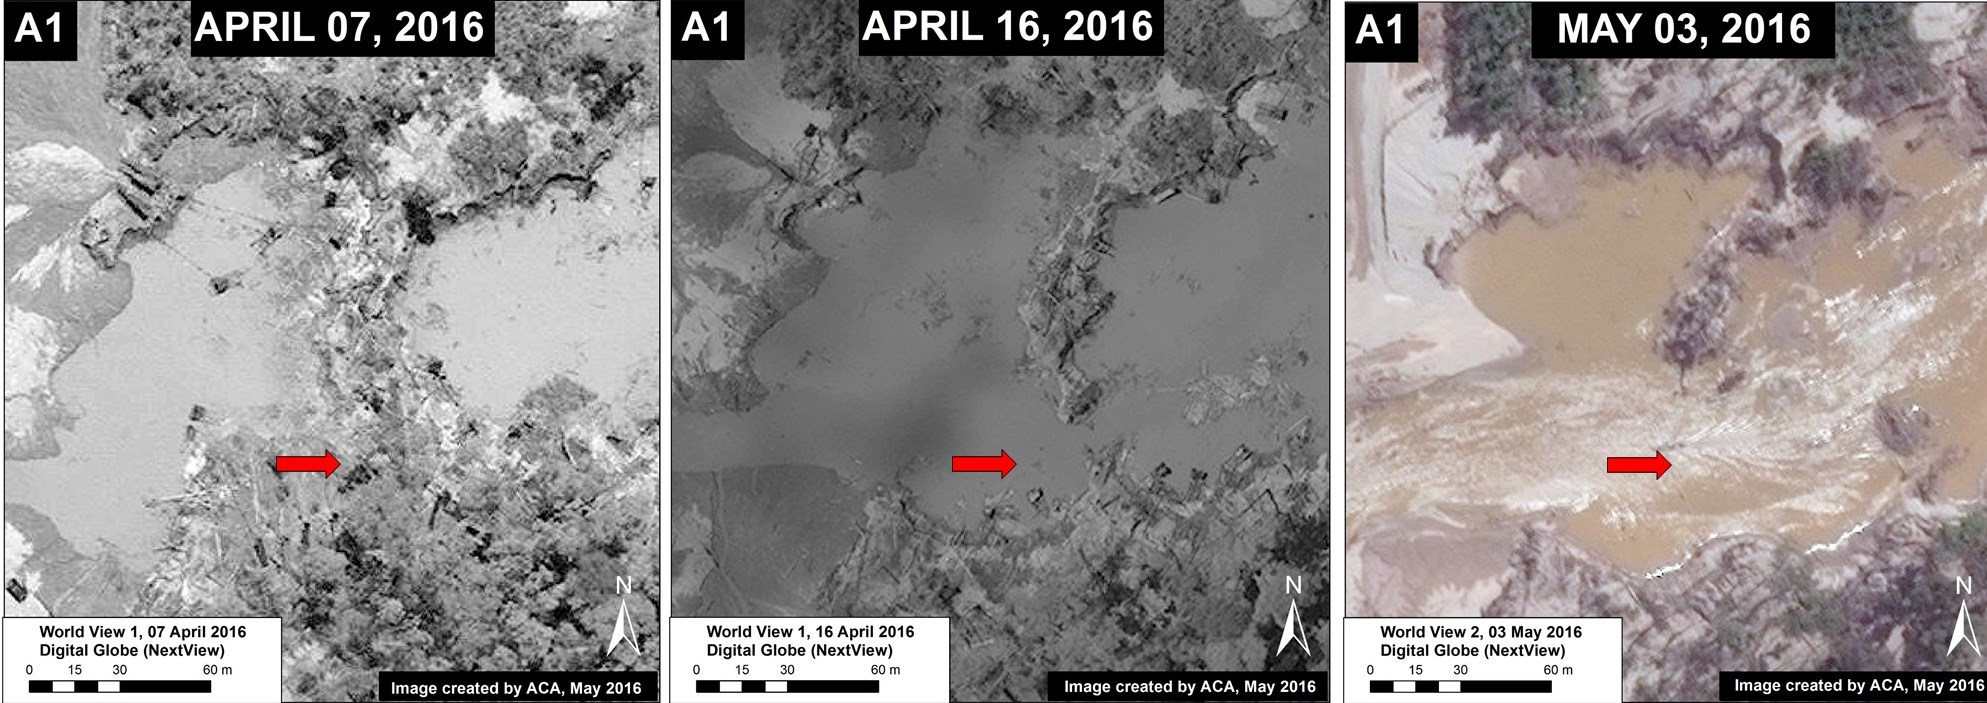
Image 33c shows with greater precision how the Malinowski river was diverted in this area between April and May 2016. The red arrow indicates the exact same place across time in the three images.
Zoom B: An Earlier Deviation of the Malinowski River
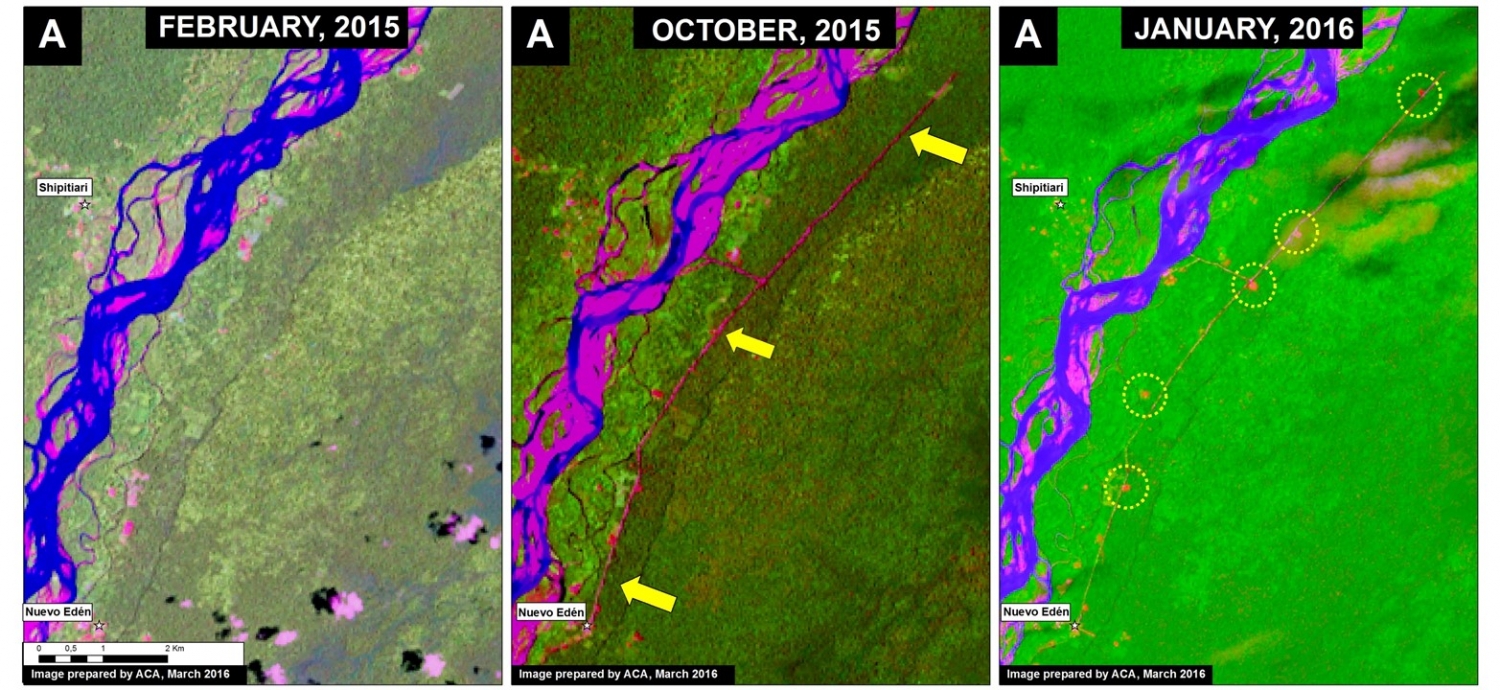
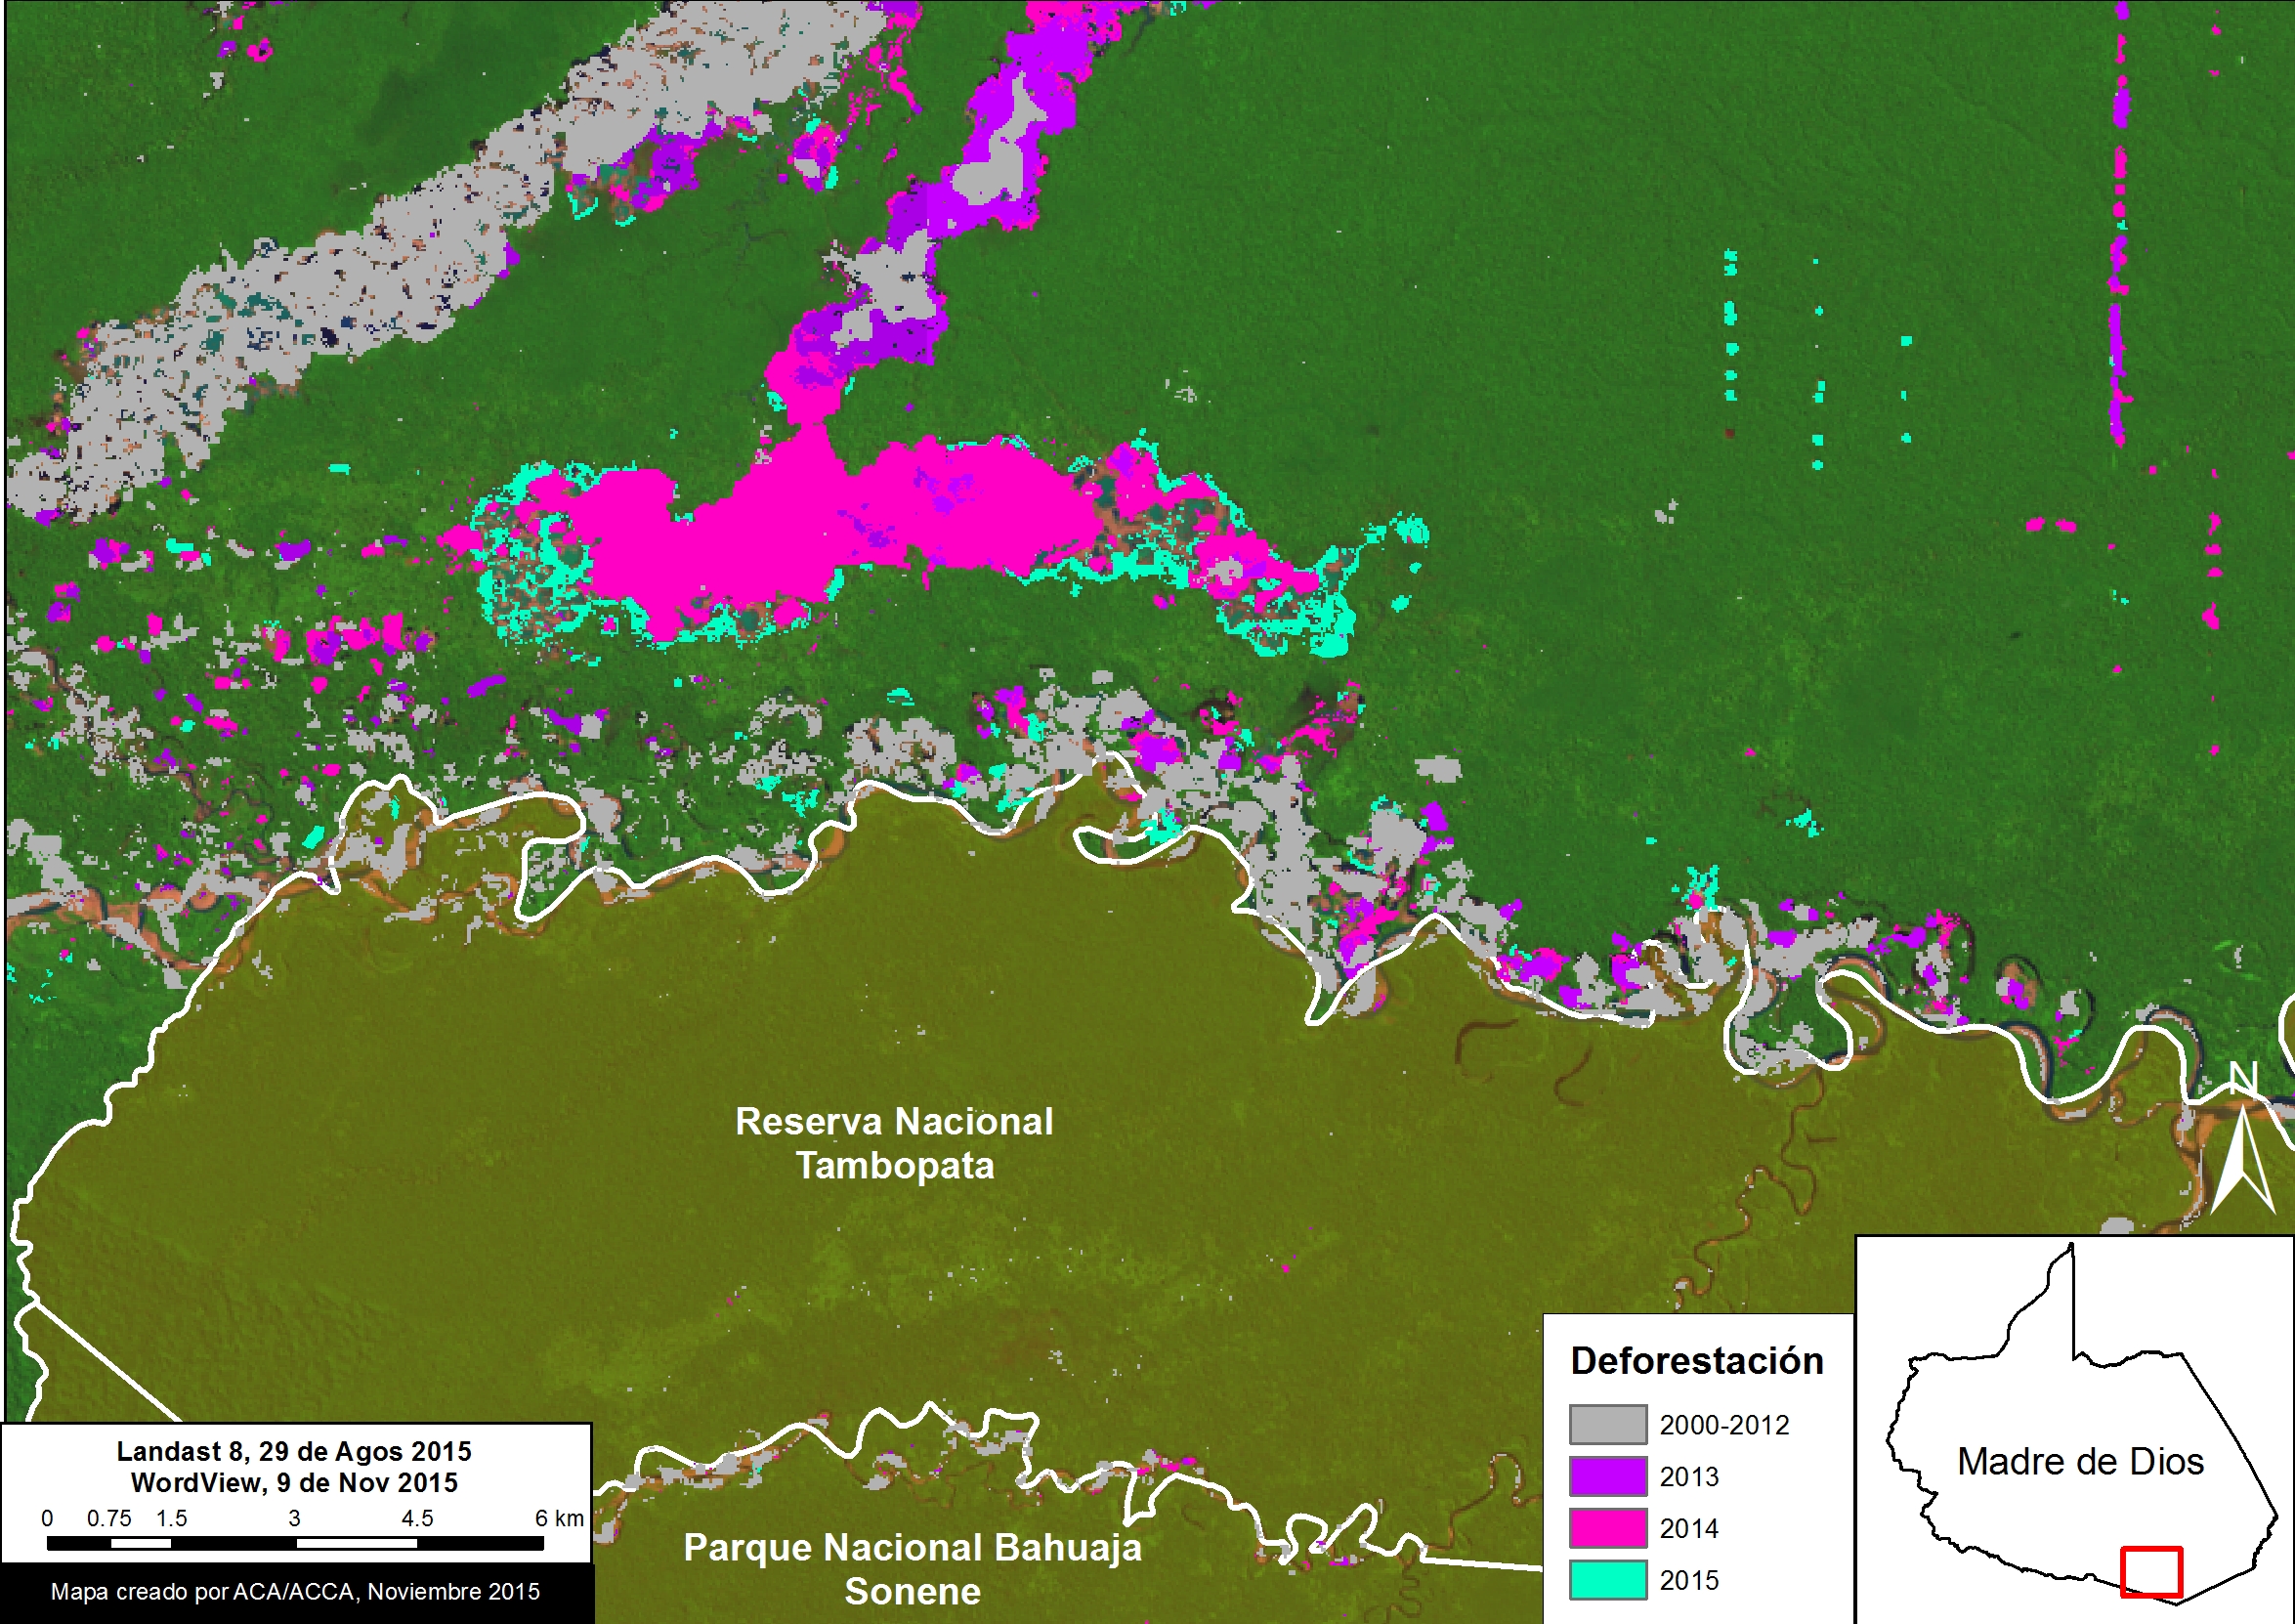
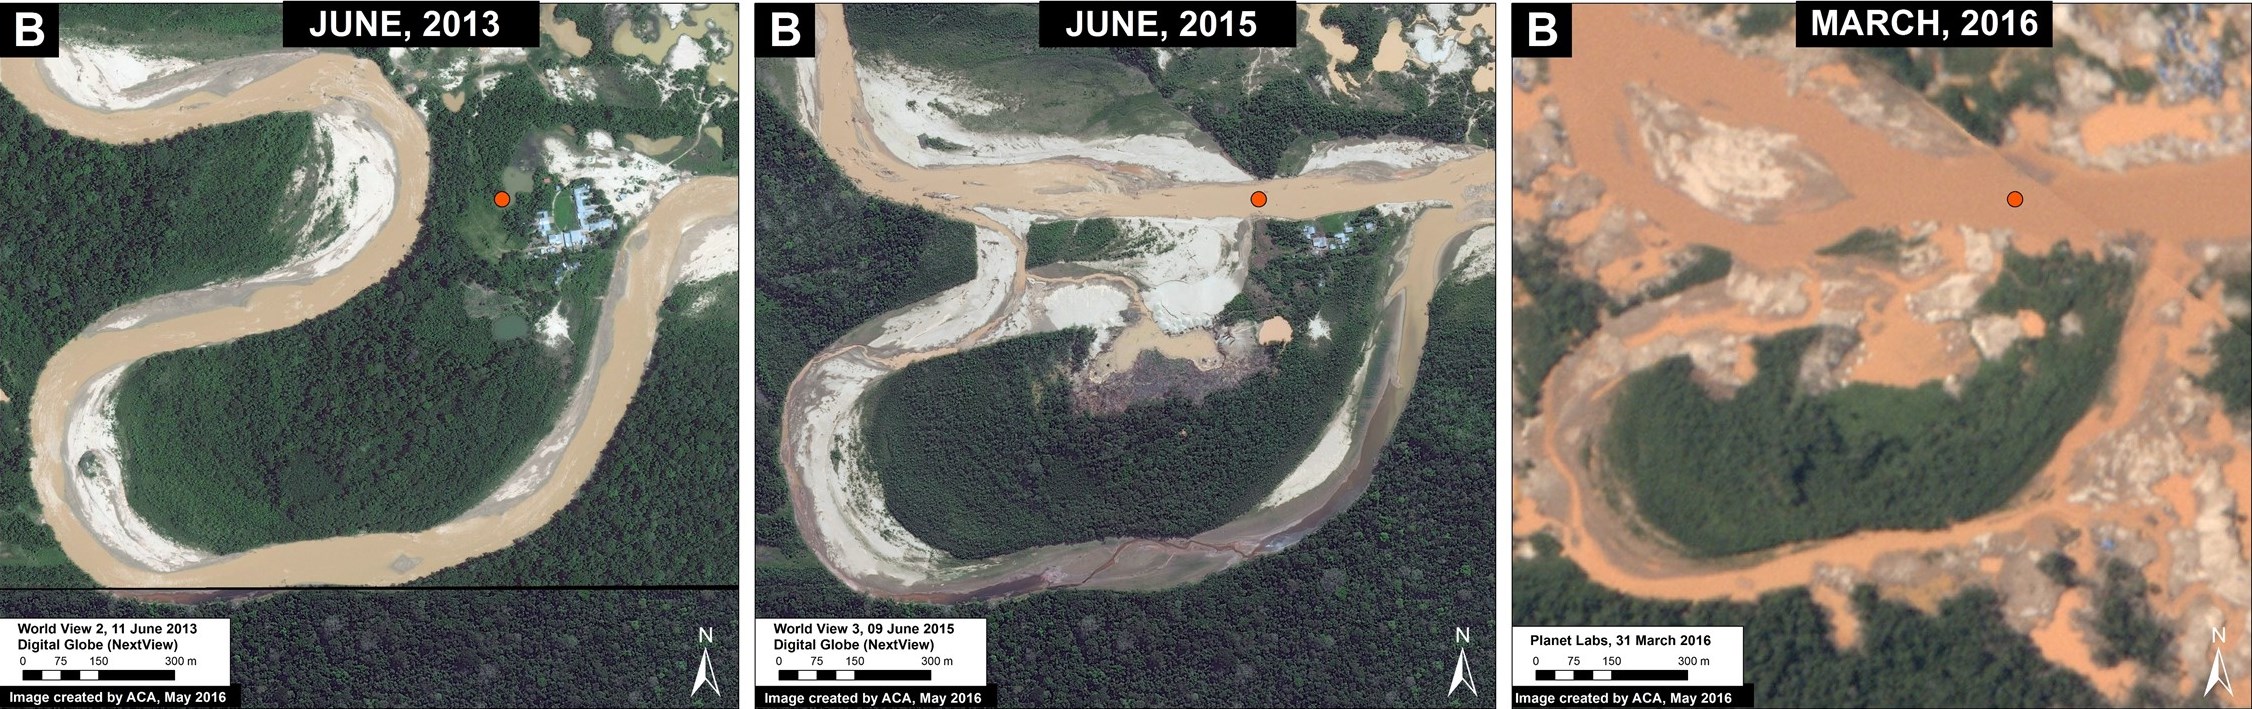
In February 2016, Peruvian specialists presented how mining activity had recently changed the natural course of the Malinowski river in the area indicated in Inset B*. Image 33d shows the progressive change: from the increase in mining activity along the normal course of the river in June 2013 (left panel), to the new stretch of riverbed in June 2015 (center panel), and finally to the expansion of mining activity along the previous course (right panel). The red dot indicates the same place over time in the three images. A total of 2.7 km was cut from the previous river course.
Ecological Impacts
According to Dr. Carlos Cañas**, coordinator of the Amazon Waters Initiative for Wildlife Conservation Society in Peru, the deviation of the natural course of the Malinowski River will have significant ecological impacts, including:
- Although the Malinowski River’s course has natural movement, the changes documented in MAAP #33 definitely represent an artificial alteration caused by mining activity.
- These artificial changes are altering the course of the Malinowski from one that is “narrow and defined” to one that is “wide and scattered.” This change impacts the river’s flood patterns by changing the intensity, timing, and frequency of flooding along the river’s banks. This implies an effect on the migratory behavior of many species of fish downstream, which receive and interpret signals from the river to guide vital functions like feeding and reproduction.
- The river’s new wider course also causes the velocity of water downstream to decrease, which will lead to increased levels of sediment in the discharge zone of the largest tributary, the Tambopata. Given the nature of the Tambopata, this could provide the almost-permanent damming of the Malinowski, as greater volume of the Tambopata means more sedimentation at the mouth of the river. Among other things, this could hinder the entry of fish to their feeding zones.
- As seen in Image 33d, fish access to certain areas will be interrupted by the blockade and closure of channels. Also, the connection between the floodable forest and the river channel is completely altered, if not interrupted, in this section of the river. Many fish species that eat fruit or vegetation from the adjacent forest depend on this seasonal connection for food.
- The Malinowski River, since it is a tributary of the Tambopata River, has natural áreas that are crucial to the reproduction of many local species. Its tributary streams represent habitats that differ from the main river and harbor an incredible variety of fish and invertebrates that contribute to the biodiversity of the river basin. These streams have little sediment, and are thus highly transparent. Mining will destroy or drastically alter these environments, severely impacting this biodiversity.
Referencias
*Villa L., Campos L. G., Pino I. M. (01 de febrero de 2016). Primer Sistema de Alerta Temprana de Geoinformación (SAT-GI) para Áreas Naturales Protegidas del Perú: Reserva Nacional Tambopata y el Ámbito de Madre de Dios del Parque Nacional Bahuaja Sonene. Reporte Nº 001-2016.
** Cañas CM, Waylen PR (2011) Modelling production of migratory catfish larvae (Pimelodidae) on the basis of regional hydroclimatology features of the Madre de Dios Basin in southeastern Peru. Hydrol. Process. DOI: 10.1002/hyp.8192.
**Cañas CM, Pine WE (2011) DOCUMENTATION OF THE TEMPORAL AND SPATIAL PATTERNS OF PIMELODIDAE CATFISH SPAWNING AND LARVAE DISPERSION IN THE MADRE DE DIOS RIVER
(PERU): INSIGHTS FOR CONSERVATION IN THE ANDEAN-AMAZON HEADWATERS. River Res. Applic. 27: 602–611.
Citation
Finer M, Novoa S (2016) Illegal Gold Mining Alters the Course of the Malinowski River (border of Tambopata National Reserve). MAAP: 33.