Our innovative new app for Real-time Amazon Fire Monitoring has detected over 200 major fires in 2020.
The app specializes in filtering out thousands of the traditional heat-based fire alerts to prioritize only those burning large amounts of biomass (defined here as a major fire).*
Our key findings include:
- We have detected 227 major Amazon fires (Brazil 220, Bolivia 6; Peru 1), as of August 10.
, - The vast majority of major fires have been in the Brazilian Amazon, where a strikingly high number (85%) have burned recently deforested areas. Thus, the fires are actually a smoking indicator of the rampant deforestation now in Brazil.
k - In Brazil, we have detected two forest fires, but this risk increases as we get deeper into the dry season. The rest of the fires have been on older fields.
l - In Brazil, the vast majority (94%) of the major fires have been illegal, in violation of the state and national fire moratoriums established in July. In fact, despite the moratoriums, the number of major fires is accelerating: 143 so far in August following 77 in May through July.
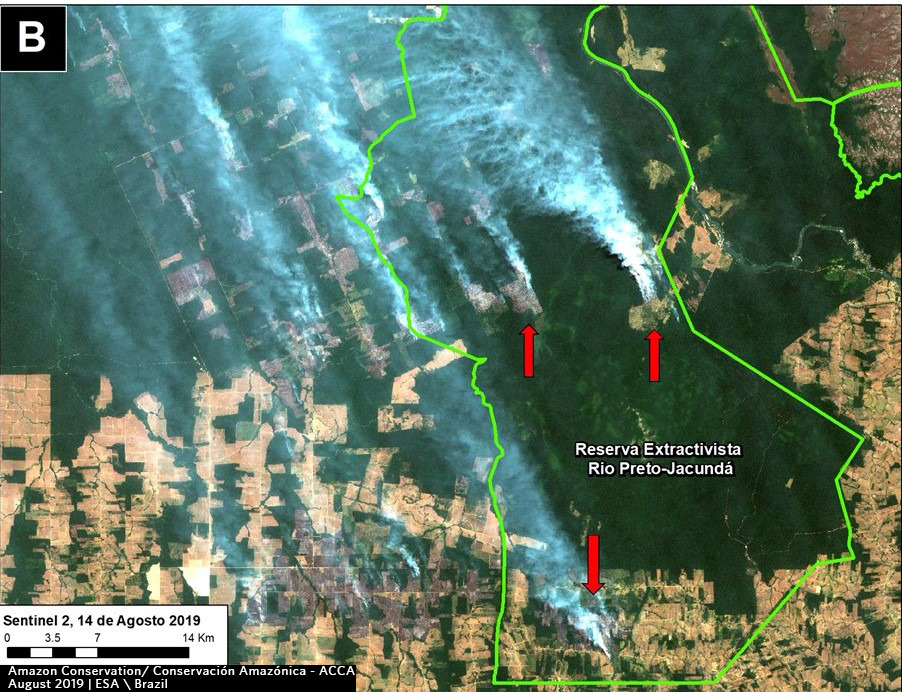
m - In Brazil, 14 of the fires have been in Protected Areas.
k - In the Bolivian and Peruvian Amazon, we have recently started detecting fires in the drier ecosystems (savannahs and grasslands).
See below for a more detailed breakdown of the results.
Additional Results
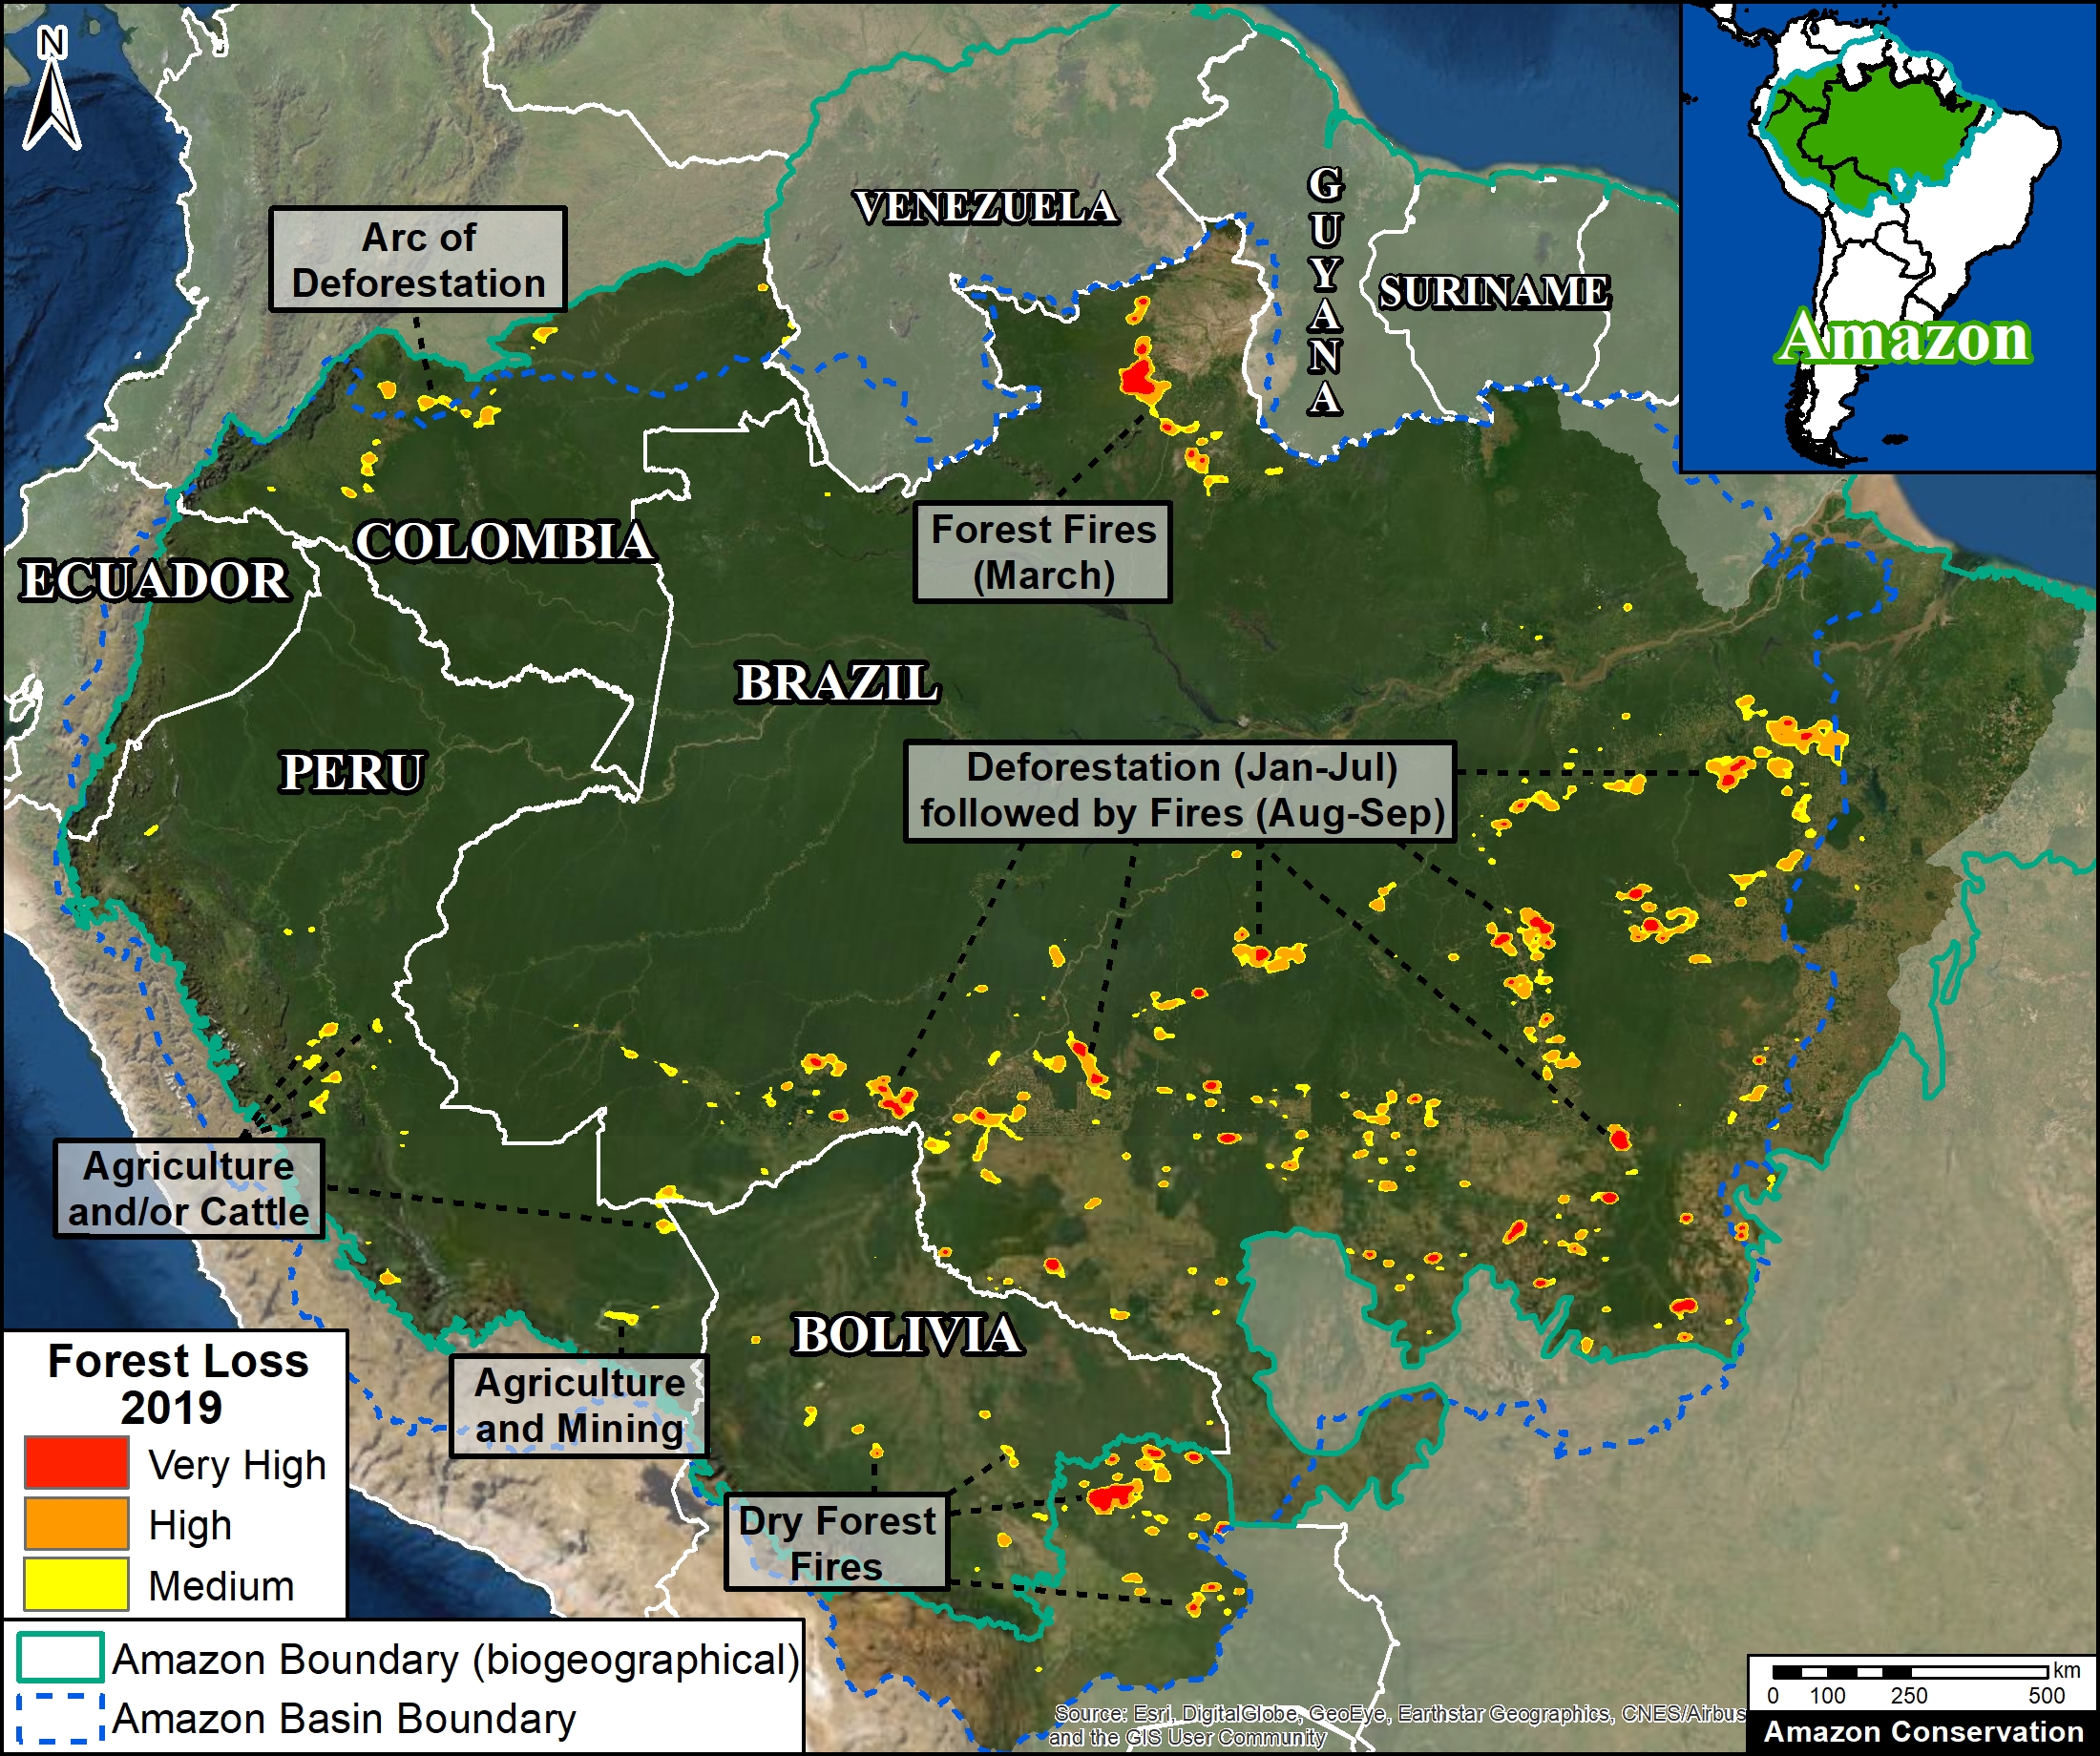
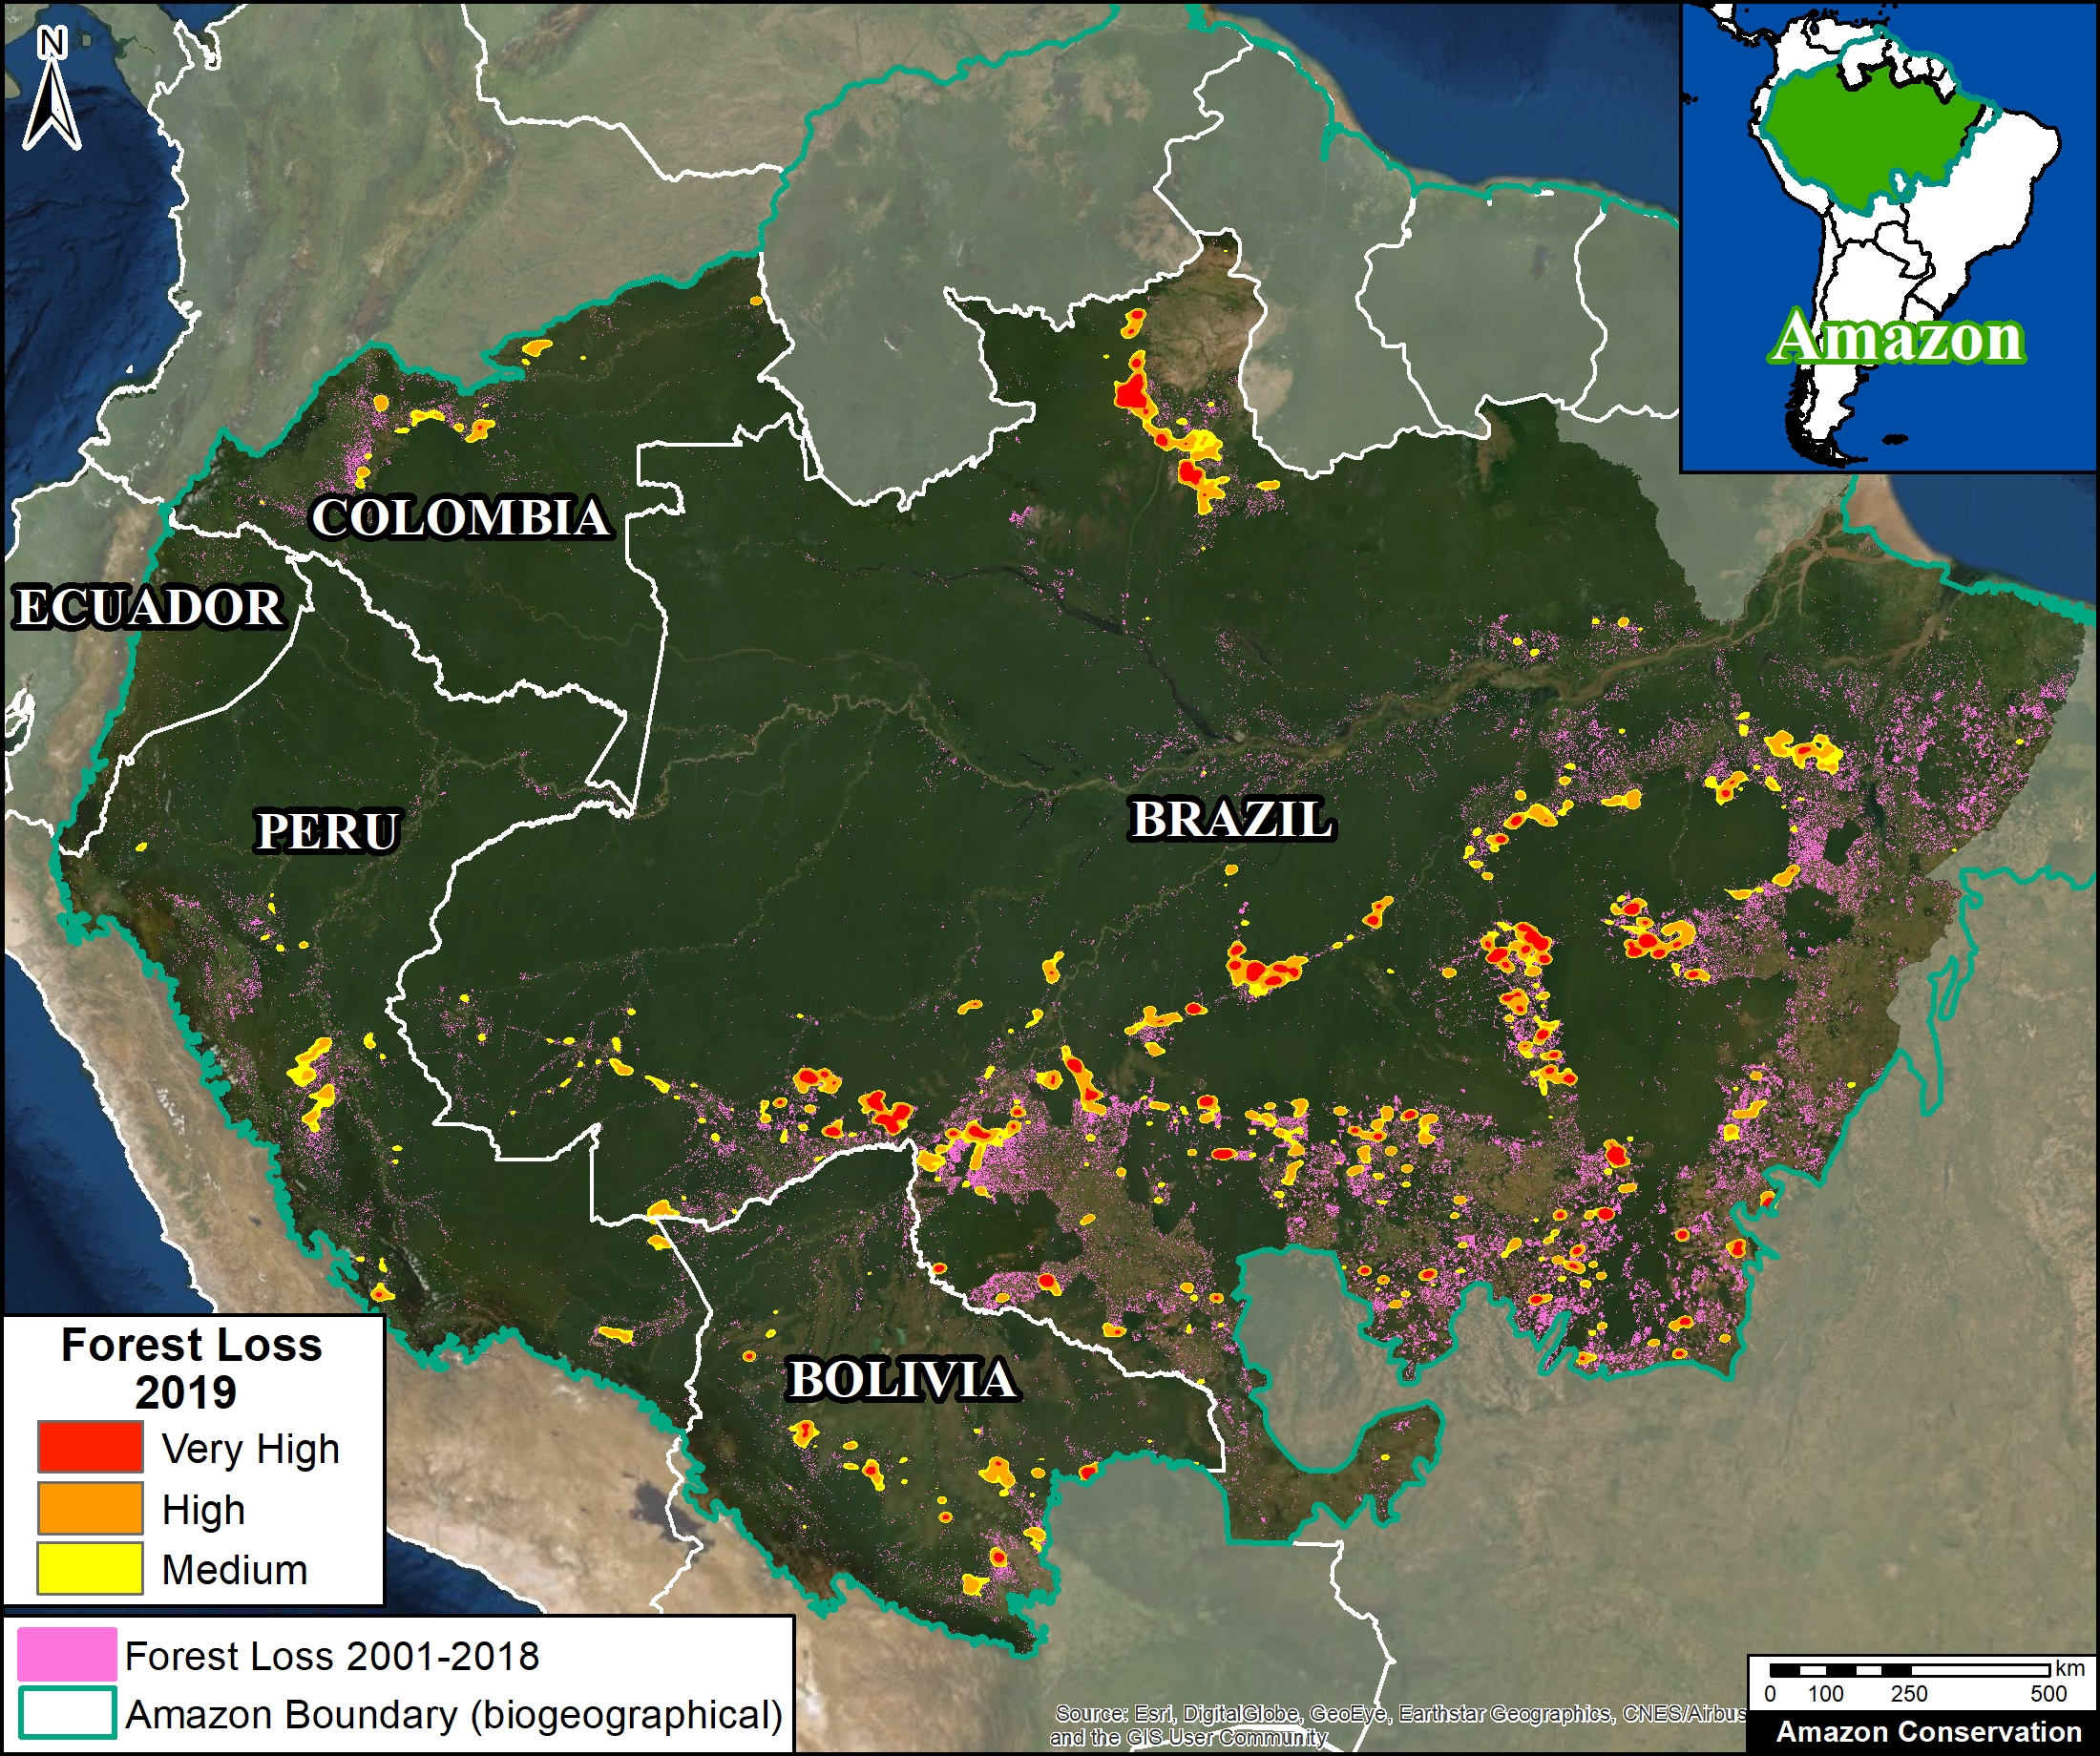
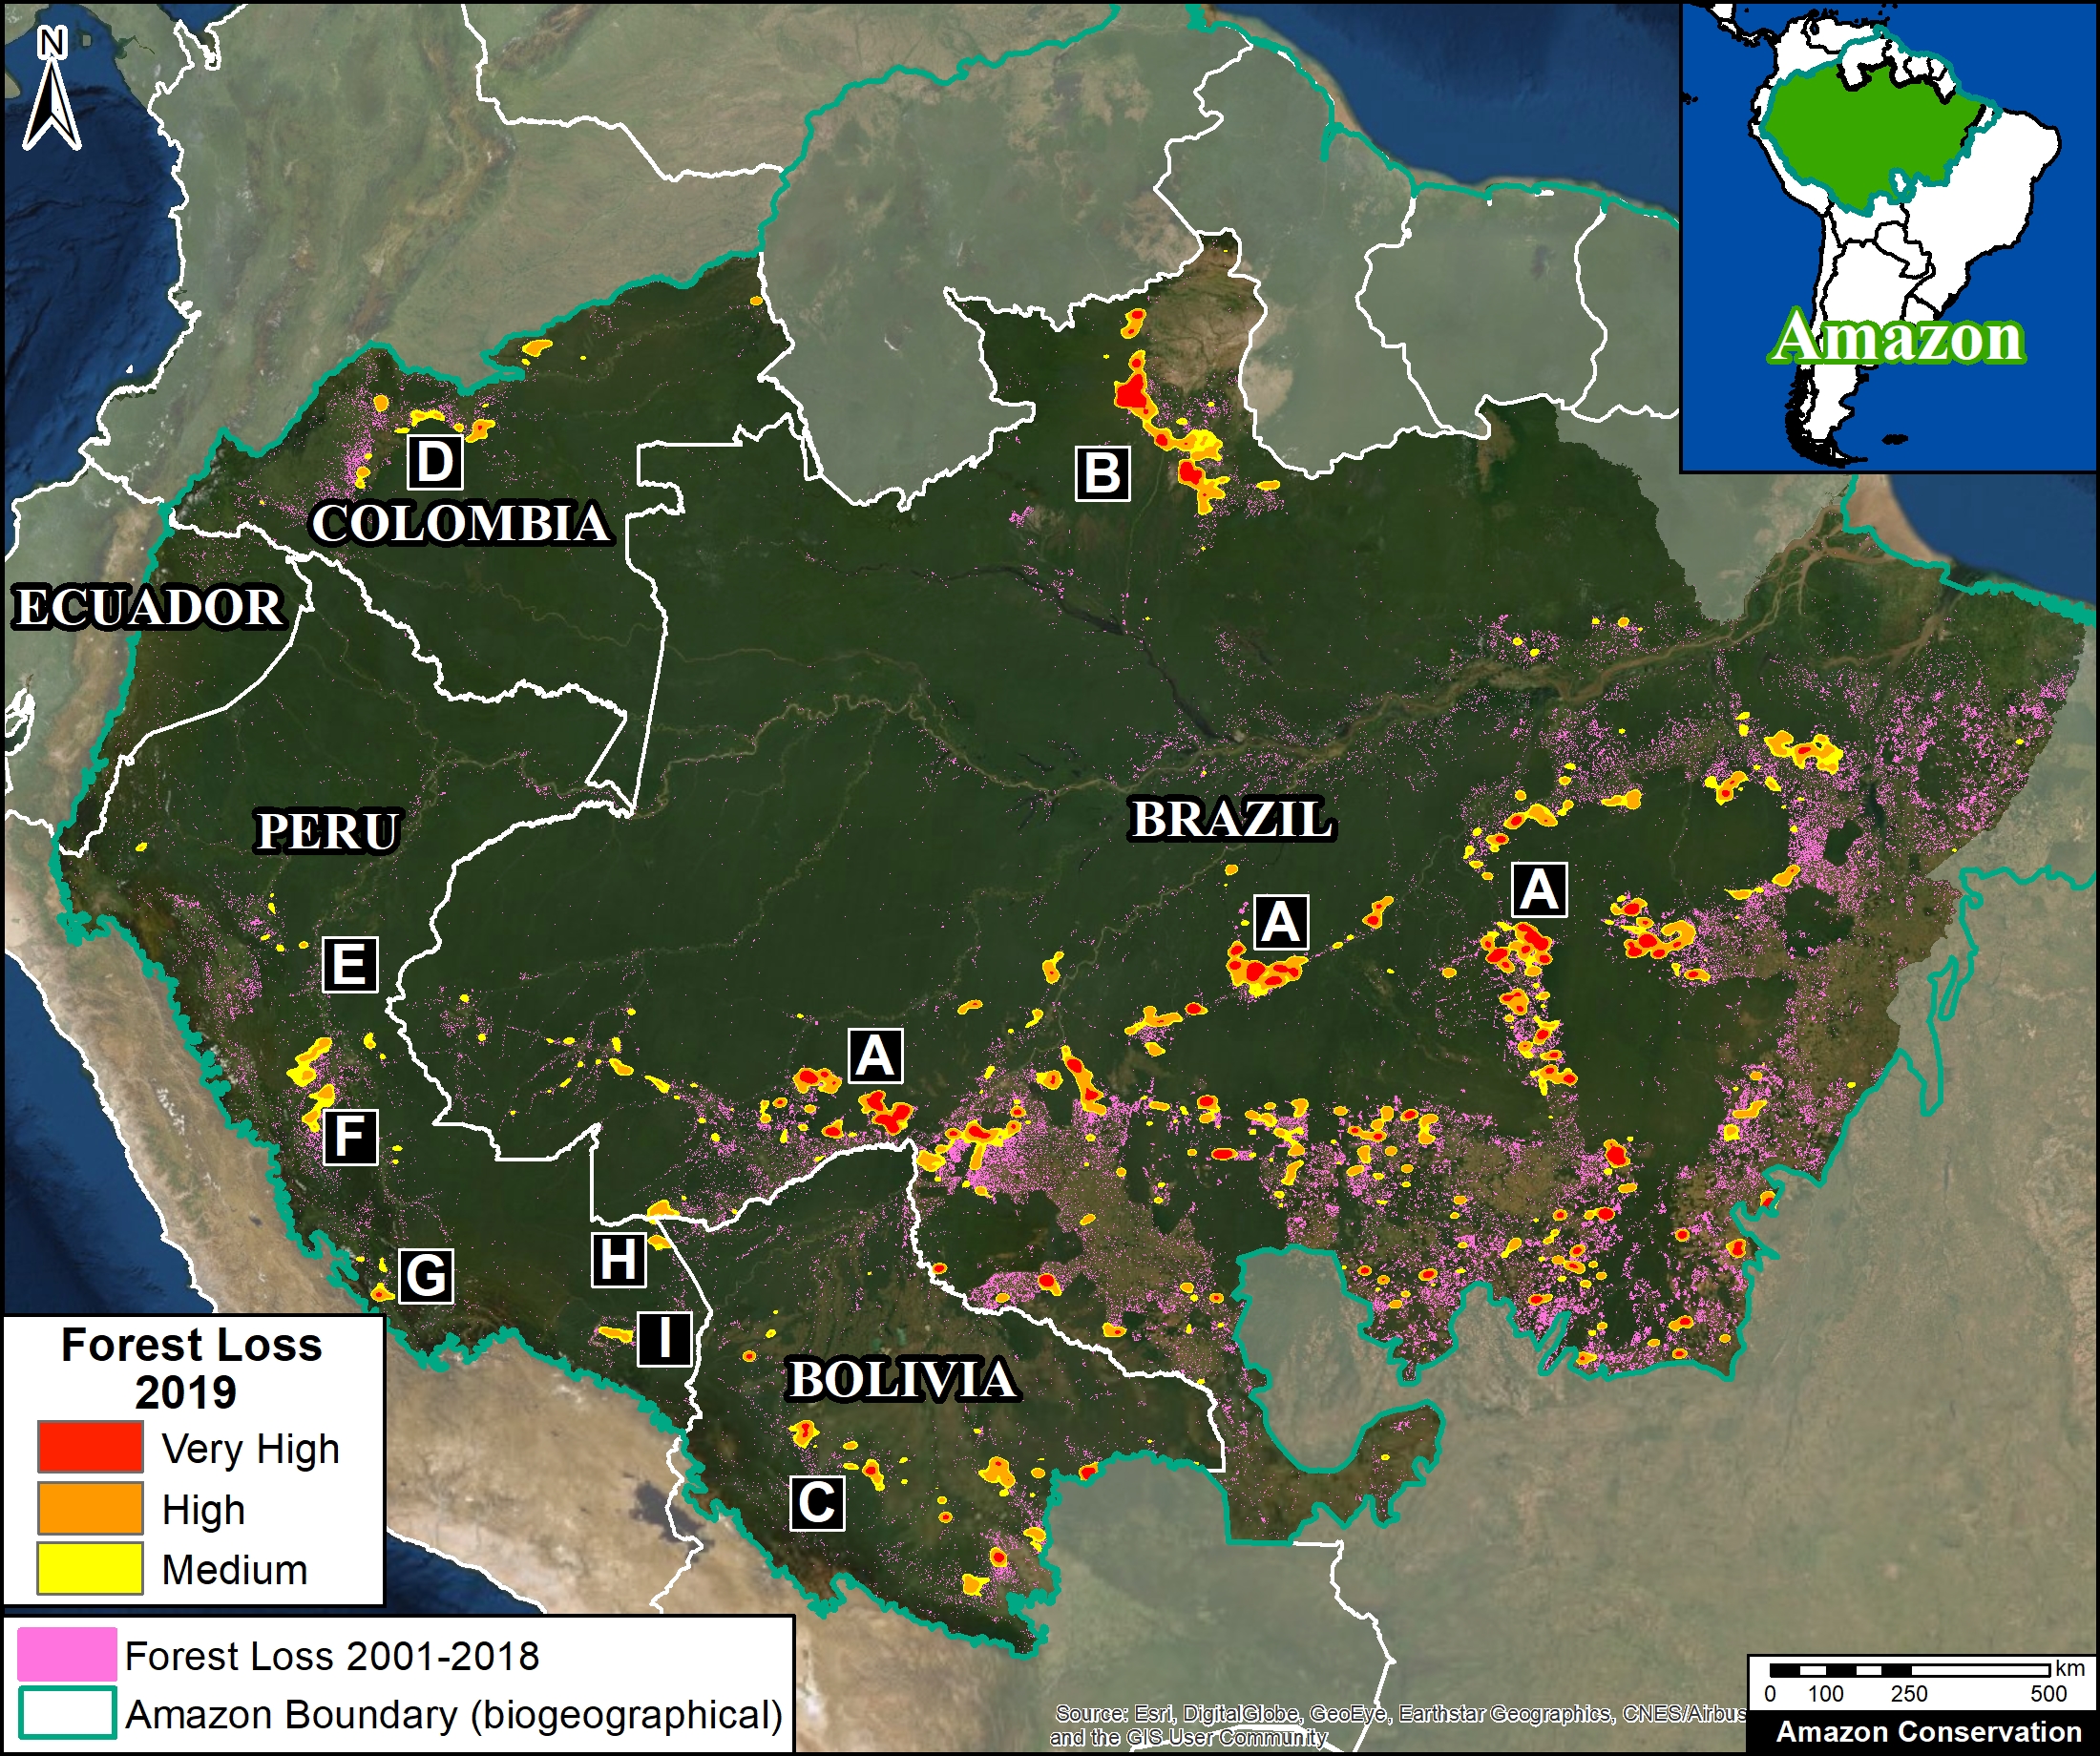
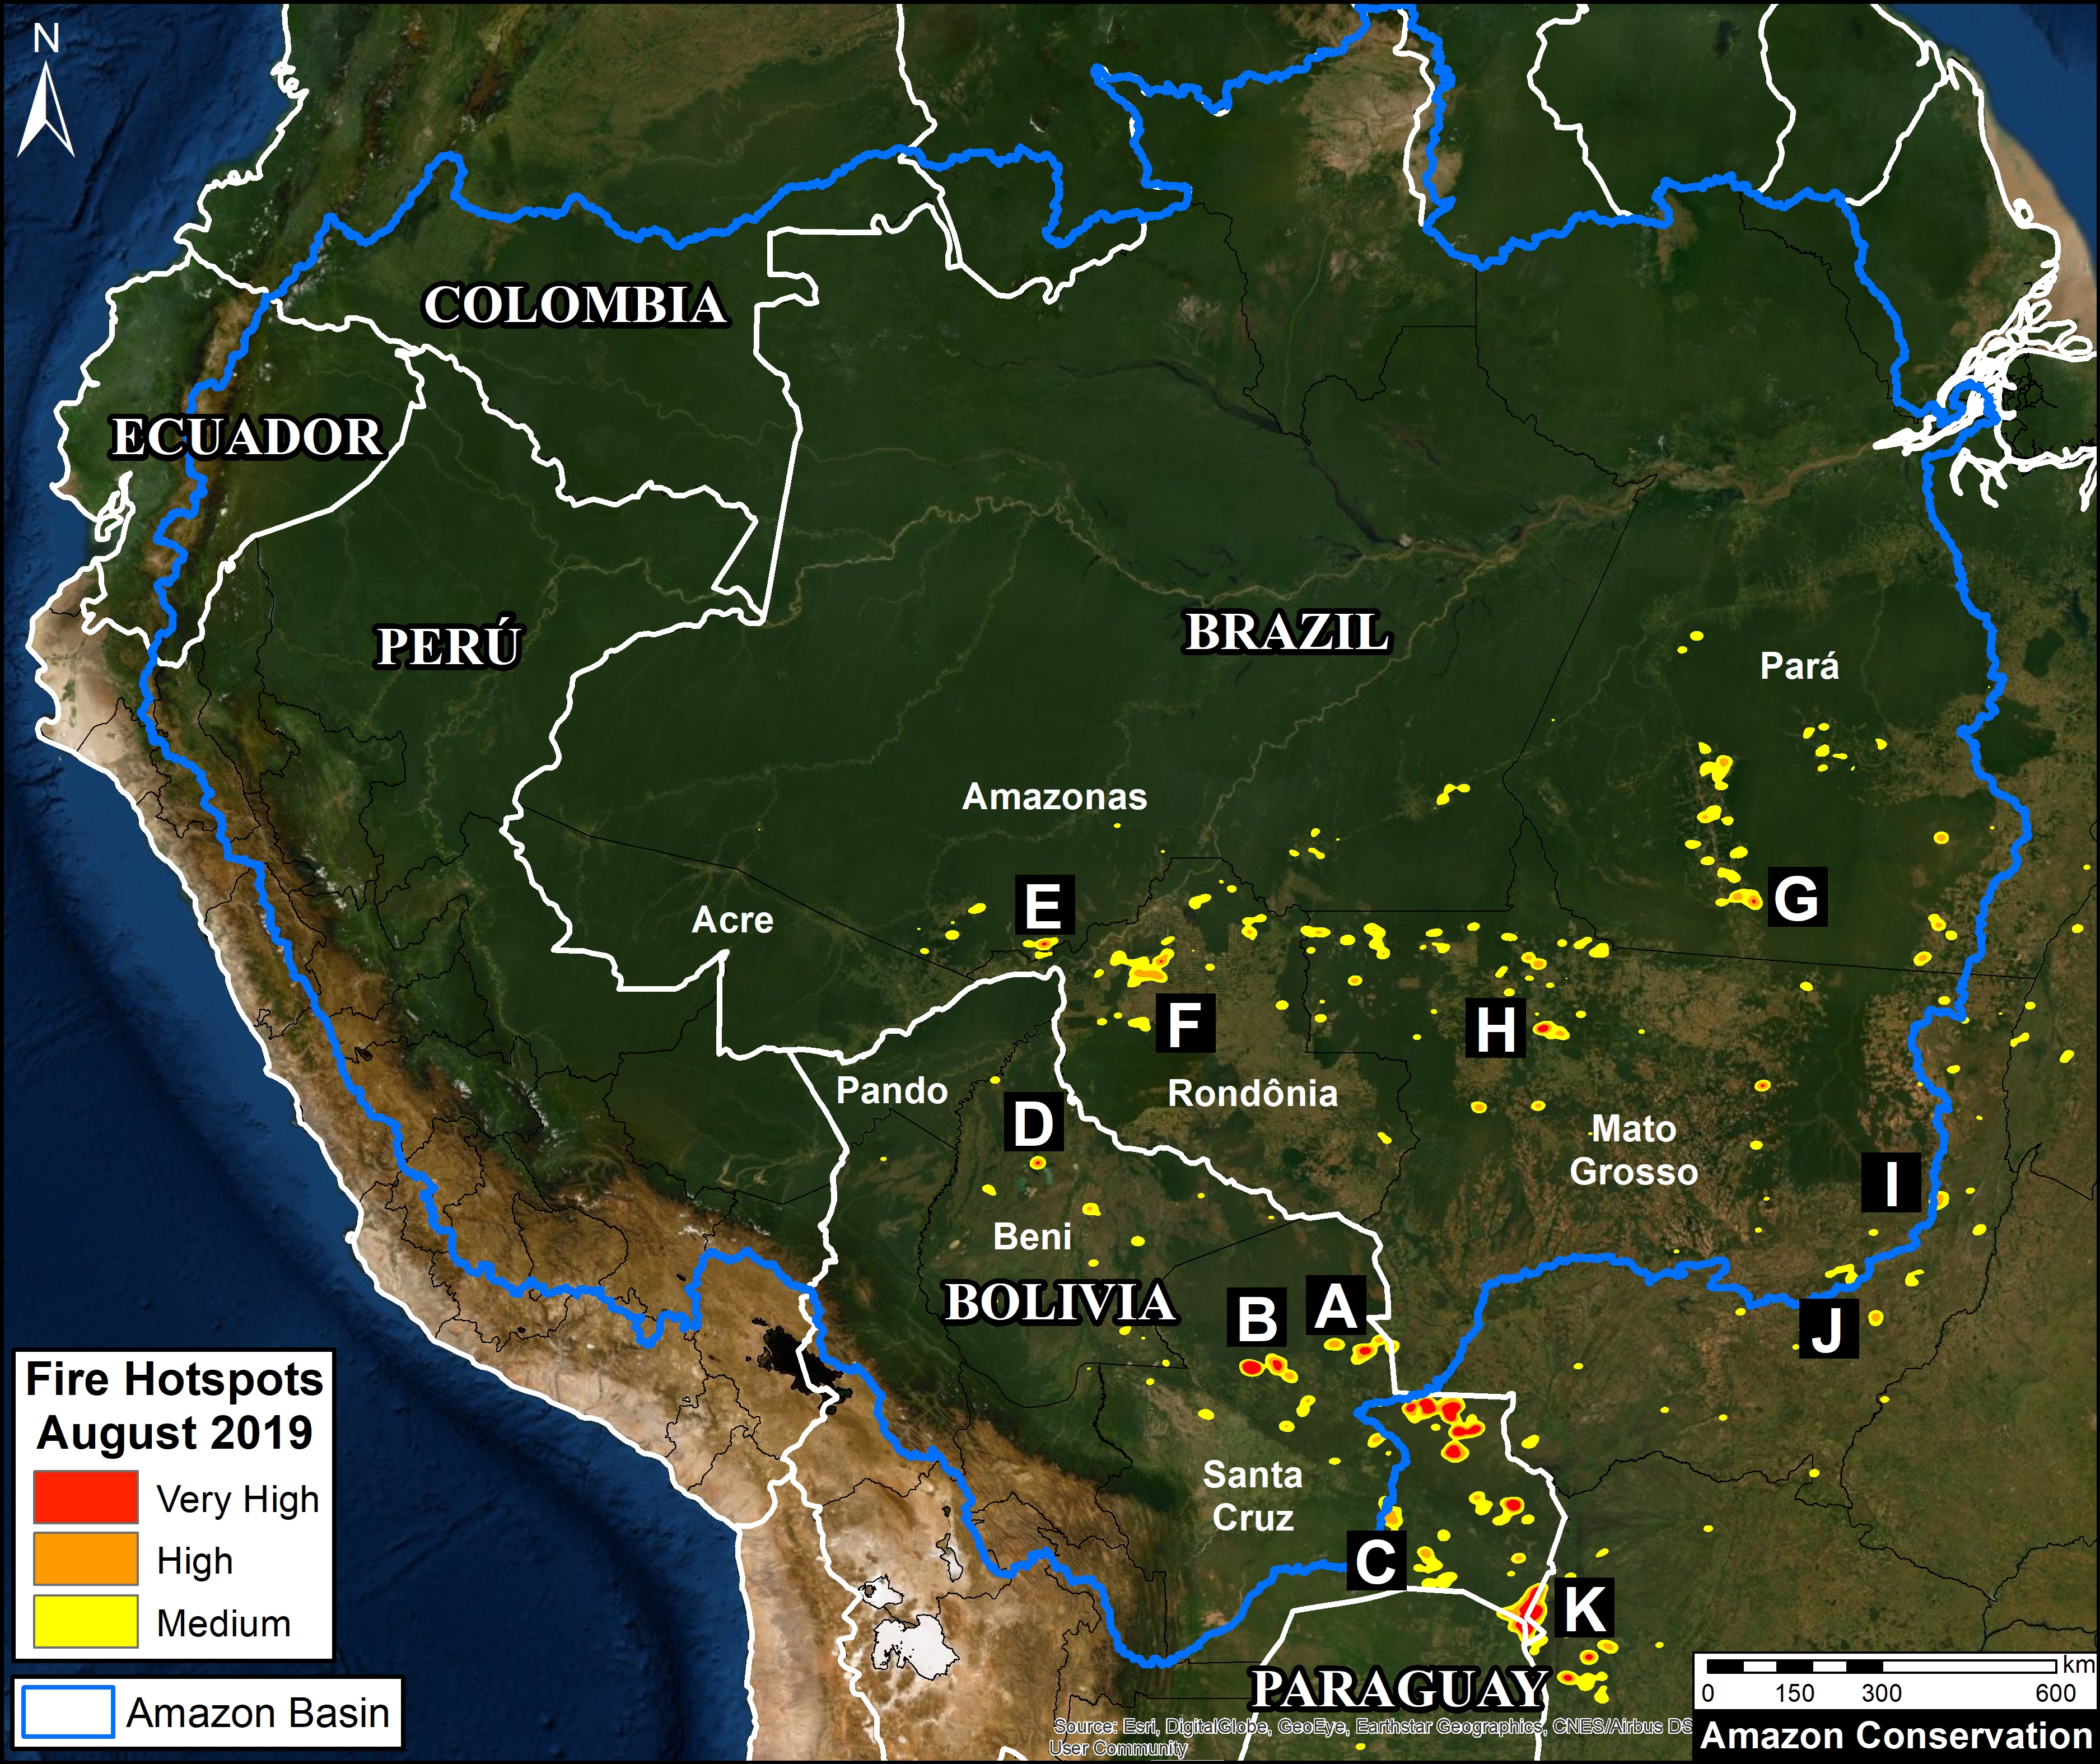
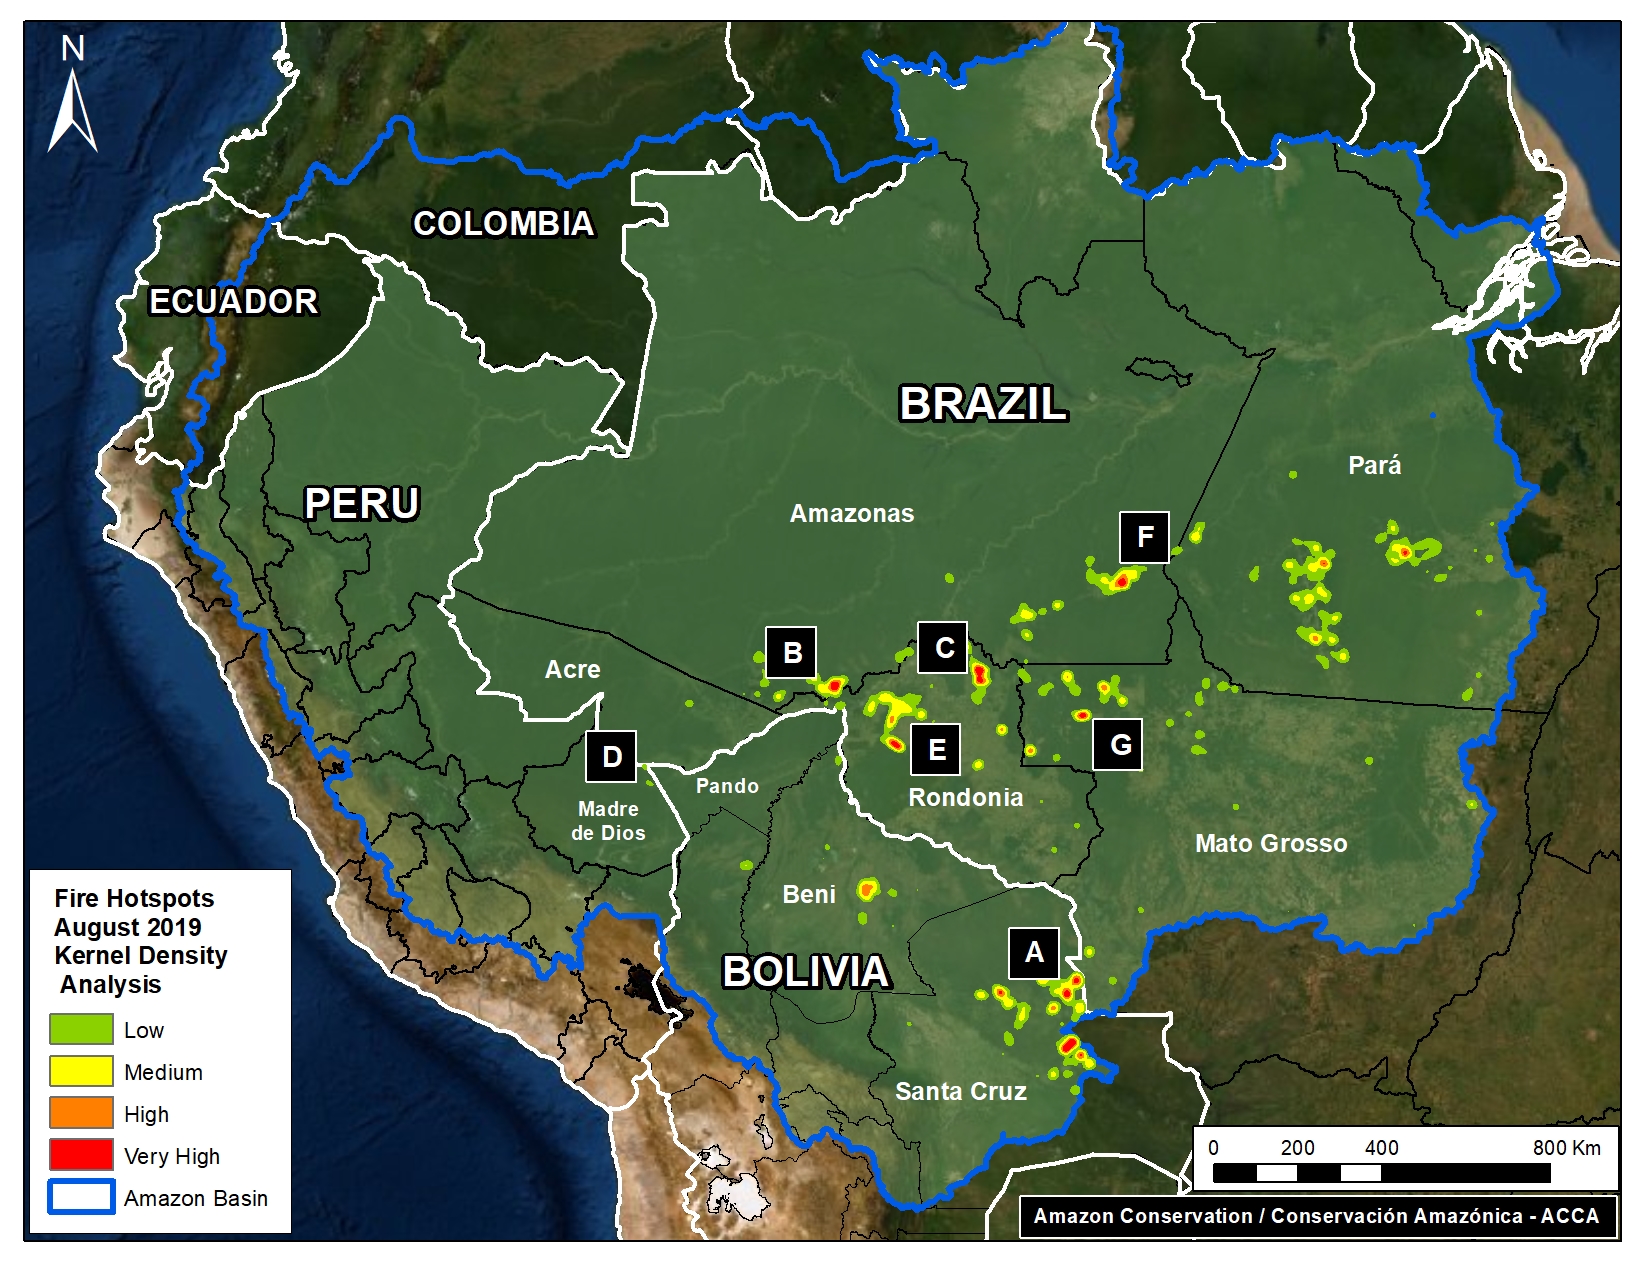
The Base Map is a screen shot of the app’s “Major Amazon Fires 2020” layer.
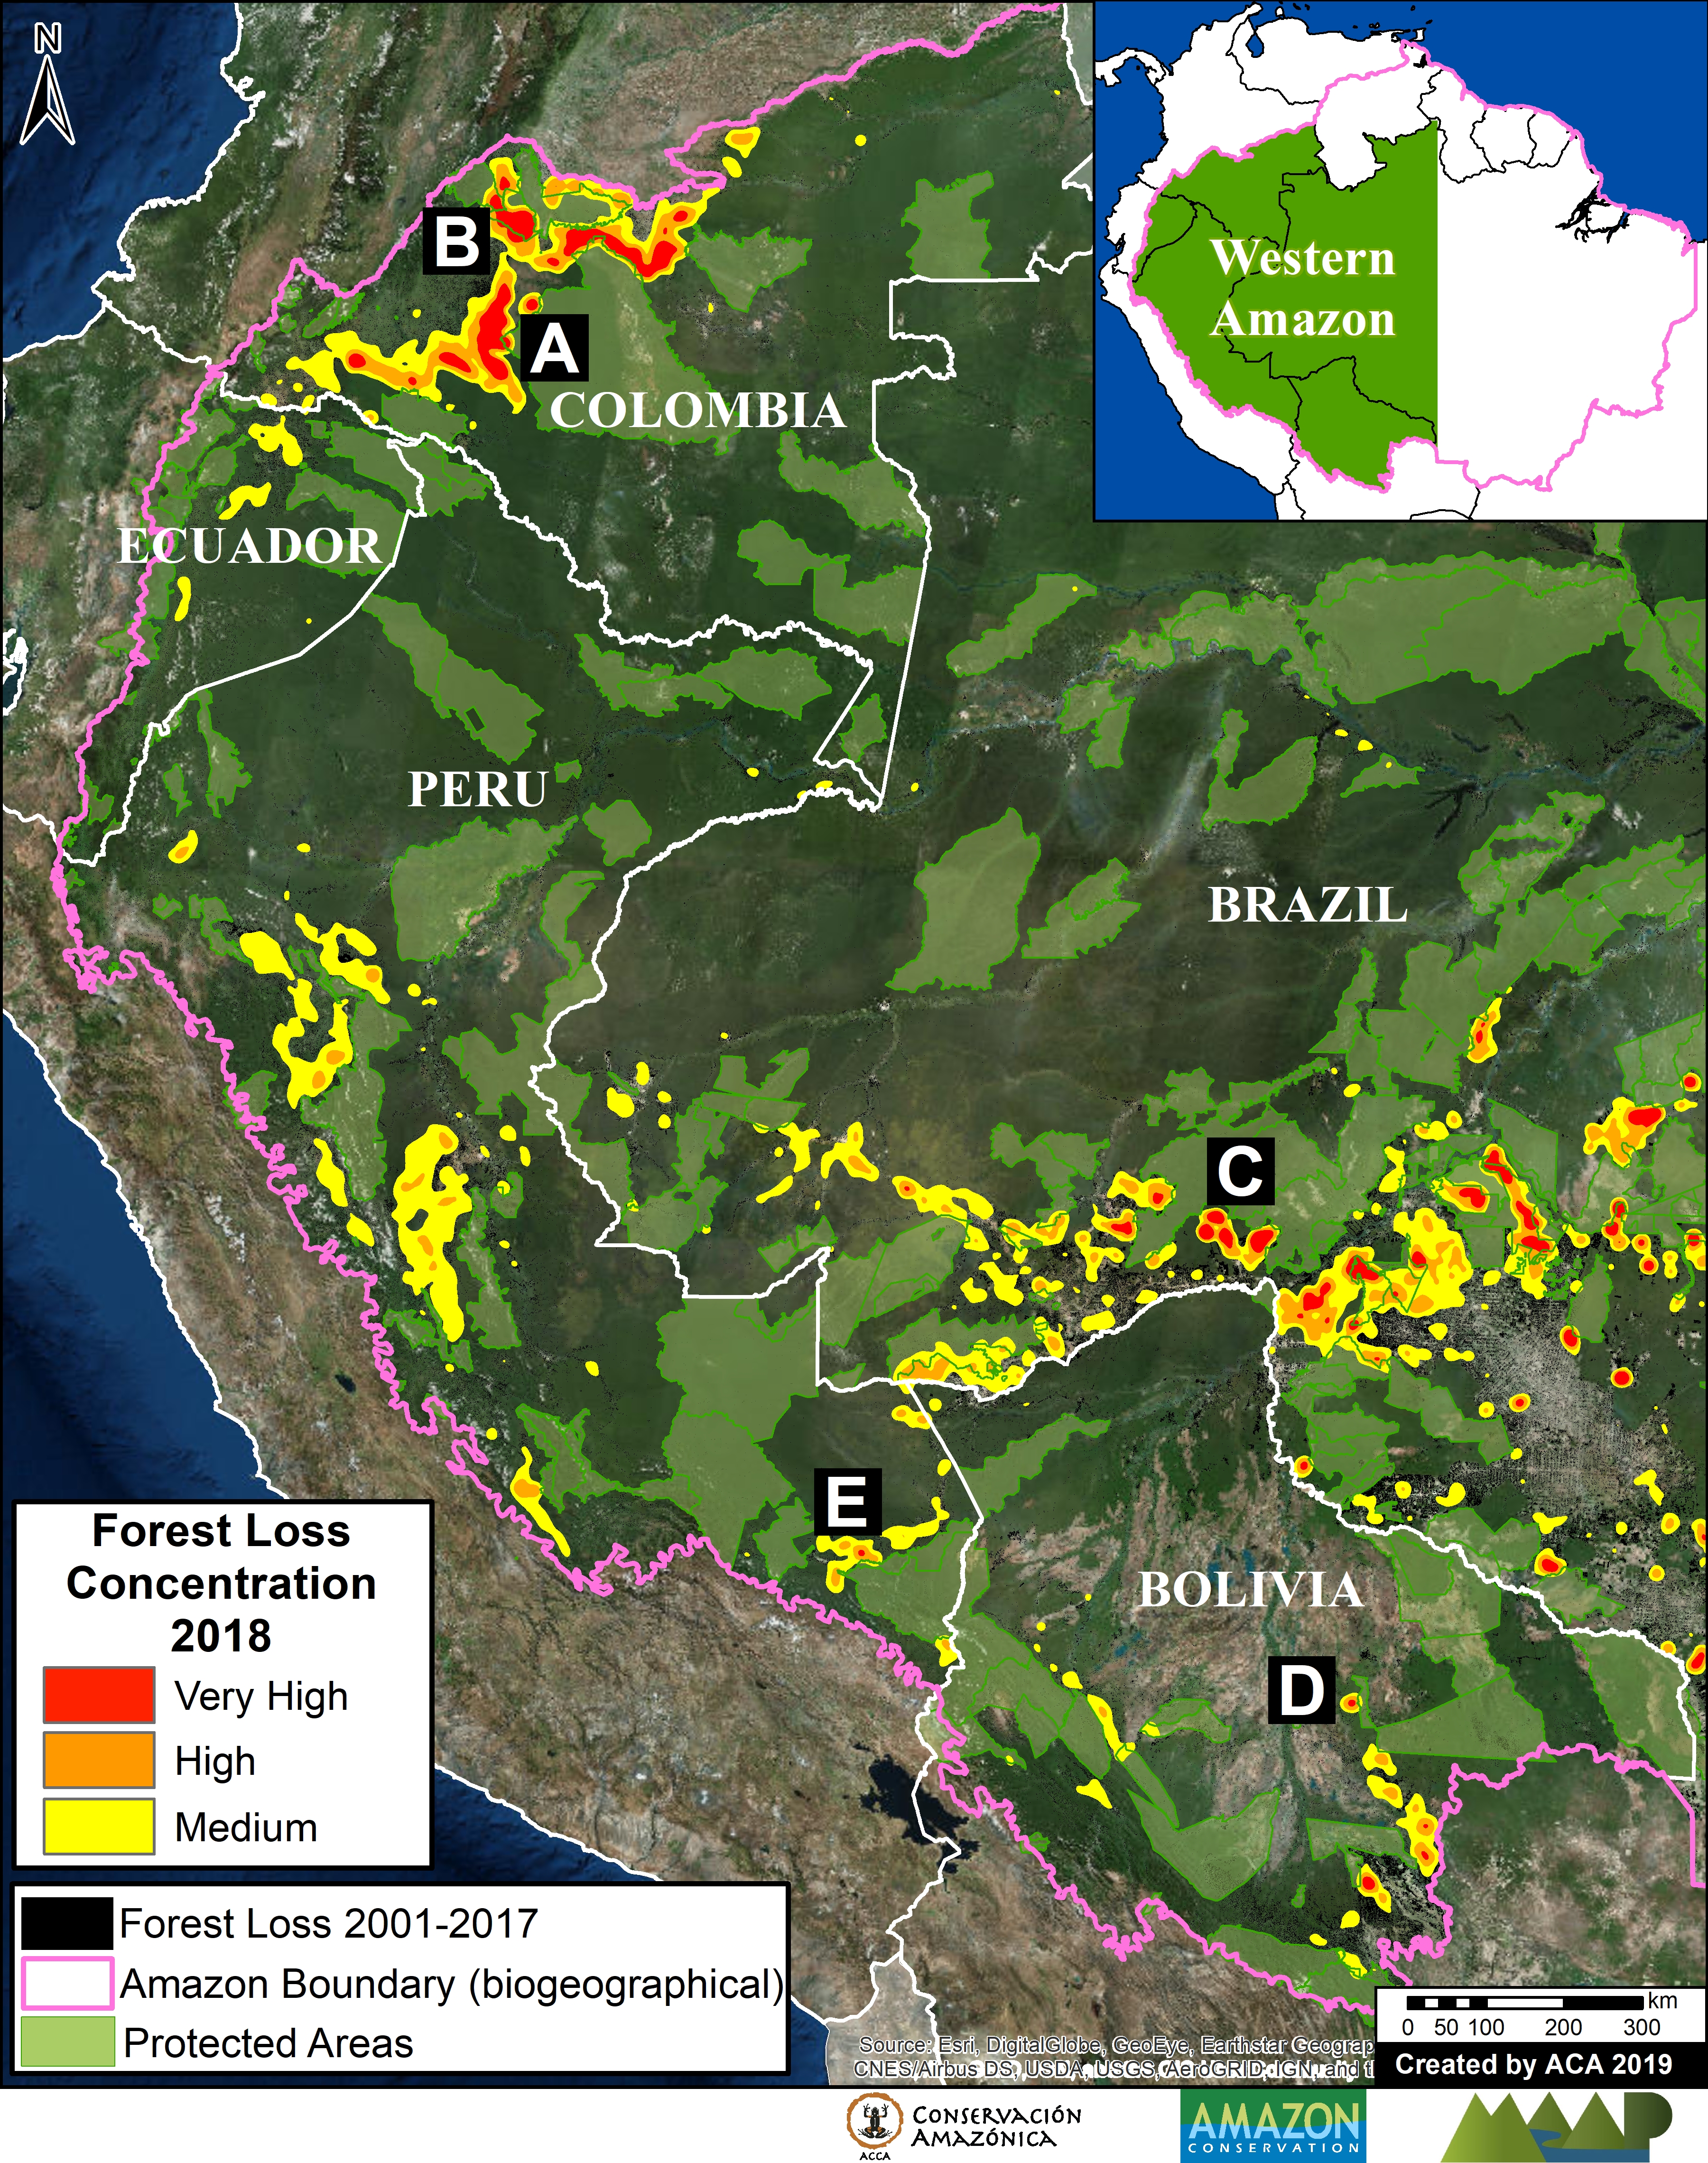
The vast majority of the fires have been in the Brazilian Amazon: Pará (37%) and Amazonas (39%), followed by Mato Grosso (17%) and Rondônia (8%).
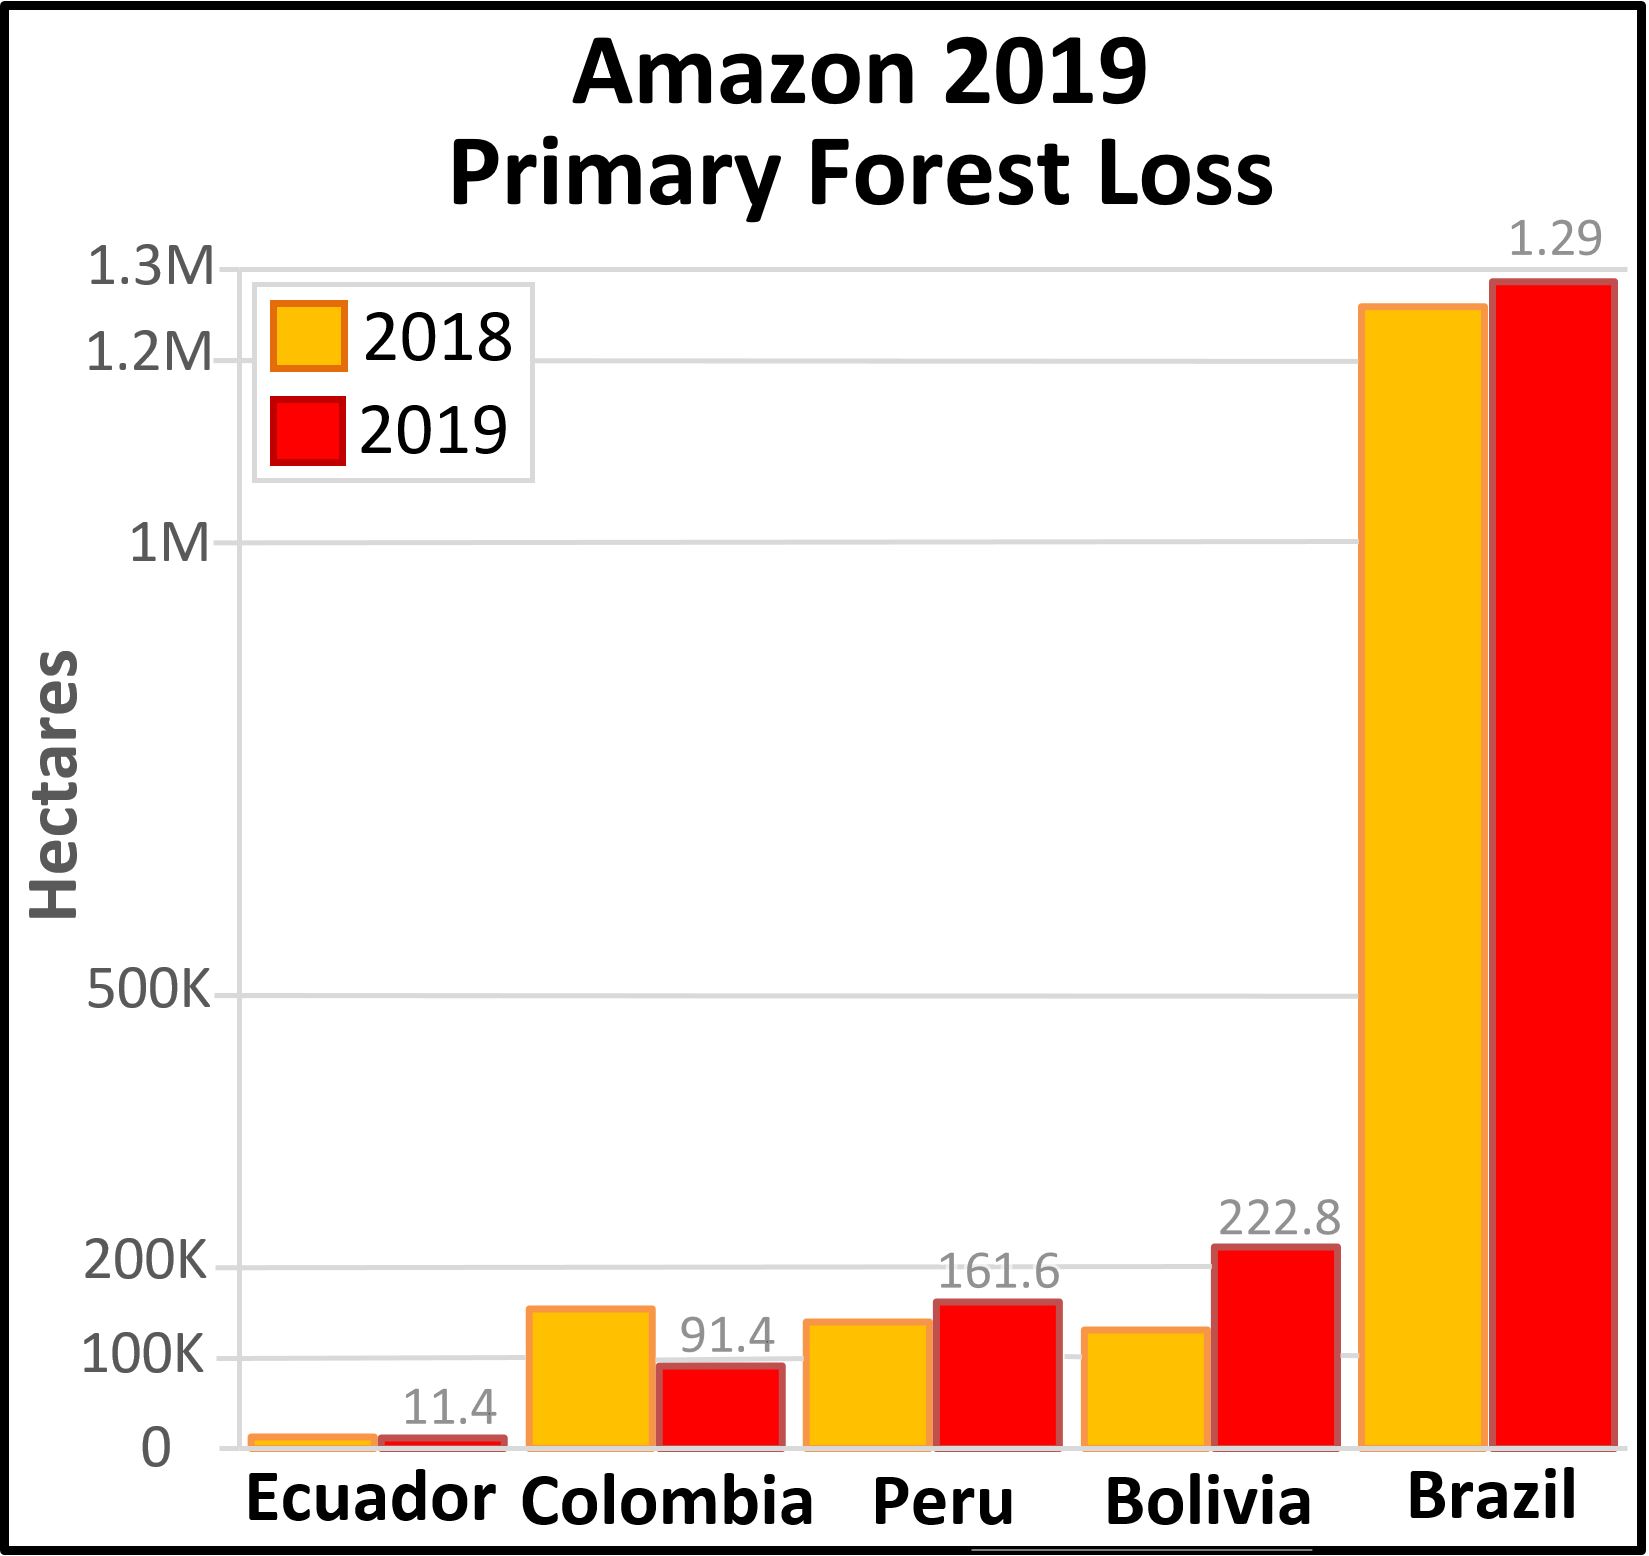
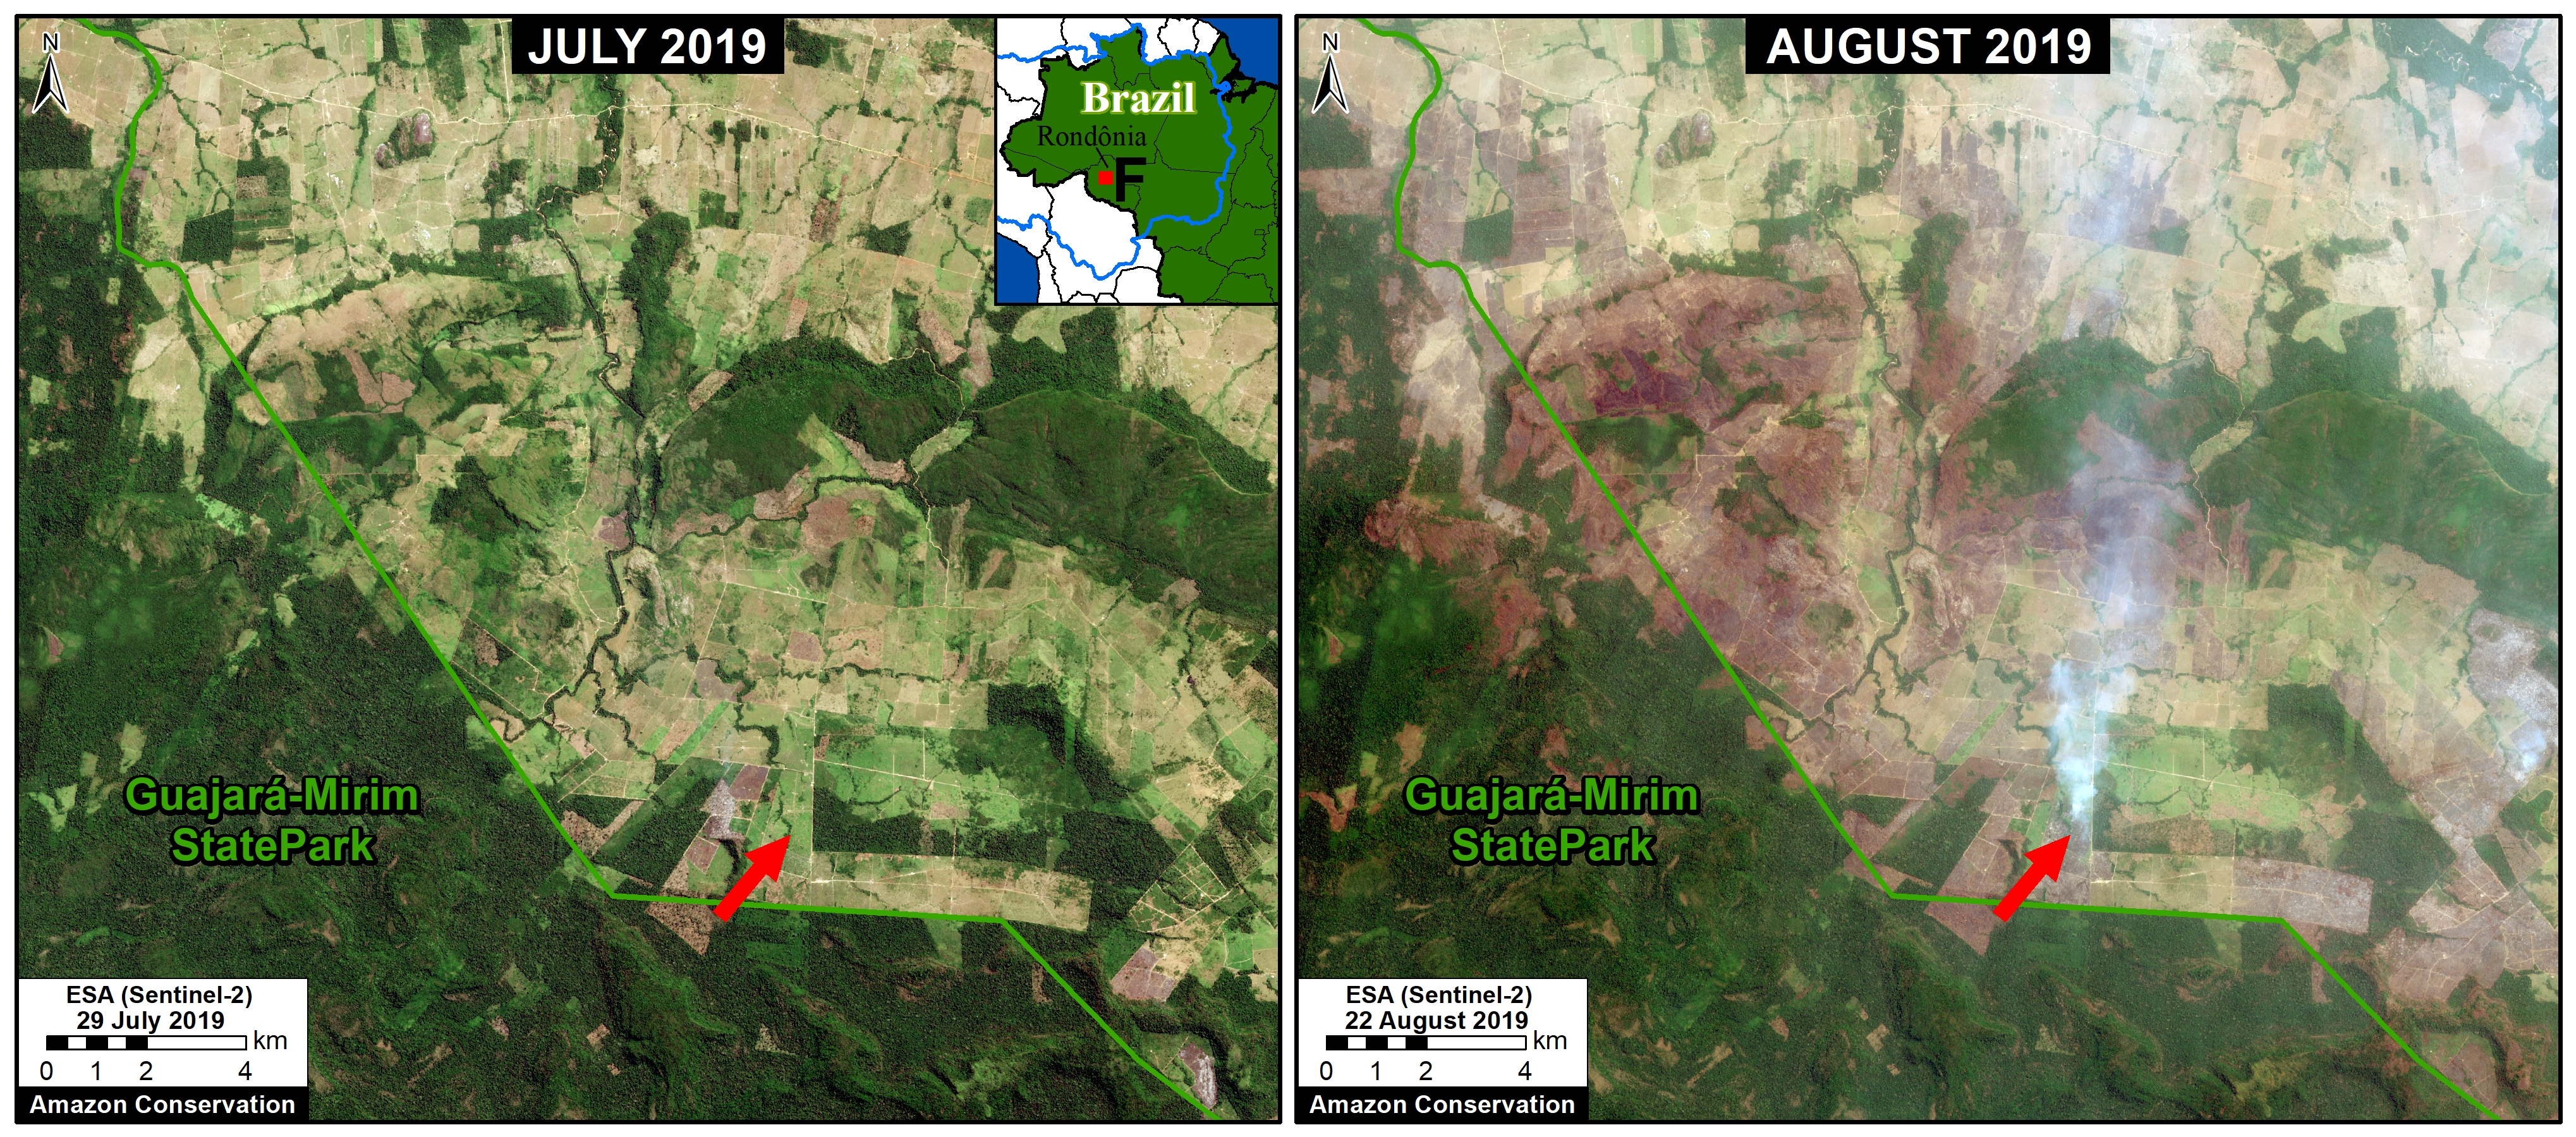
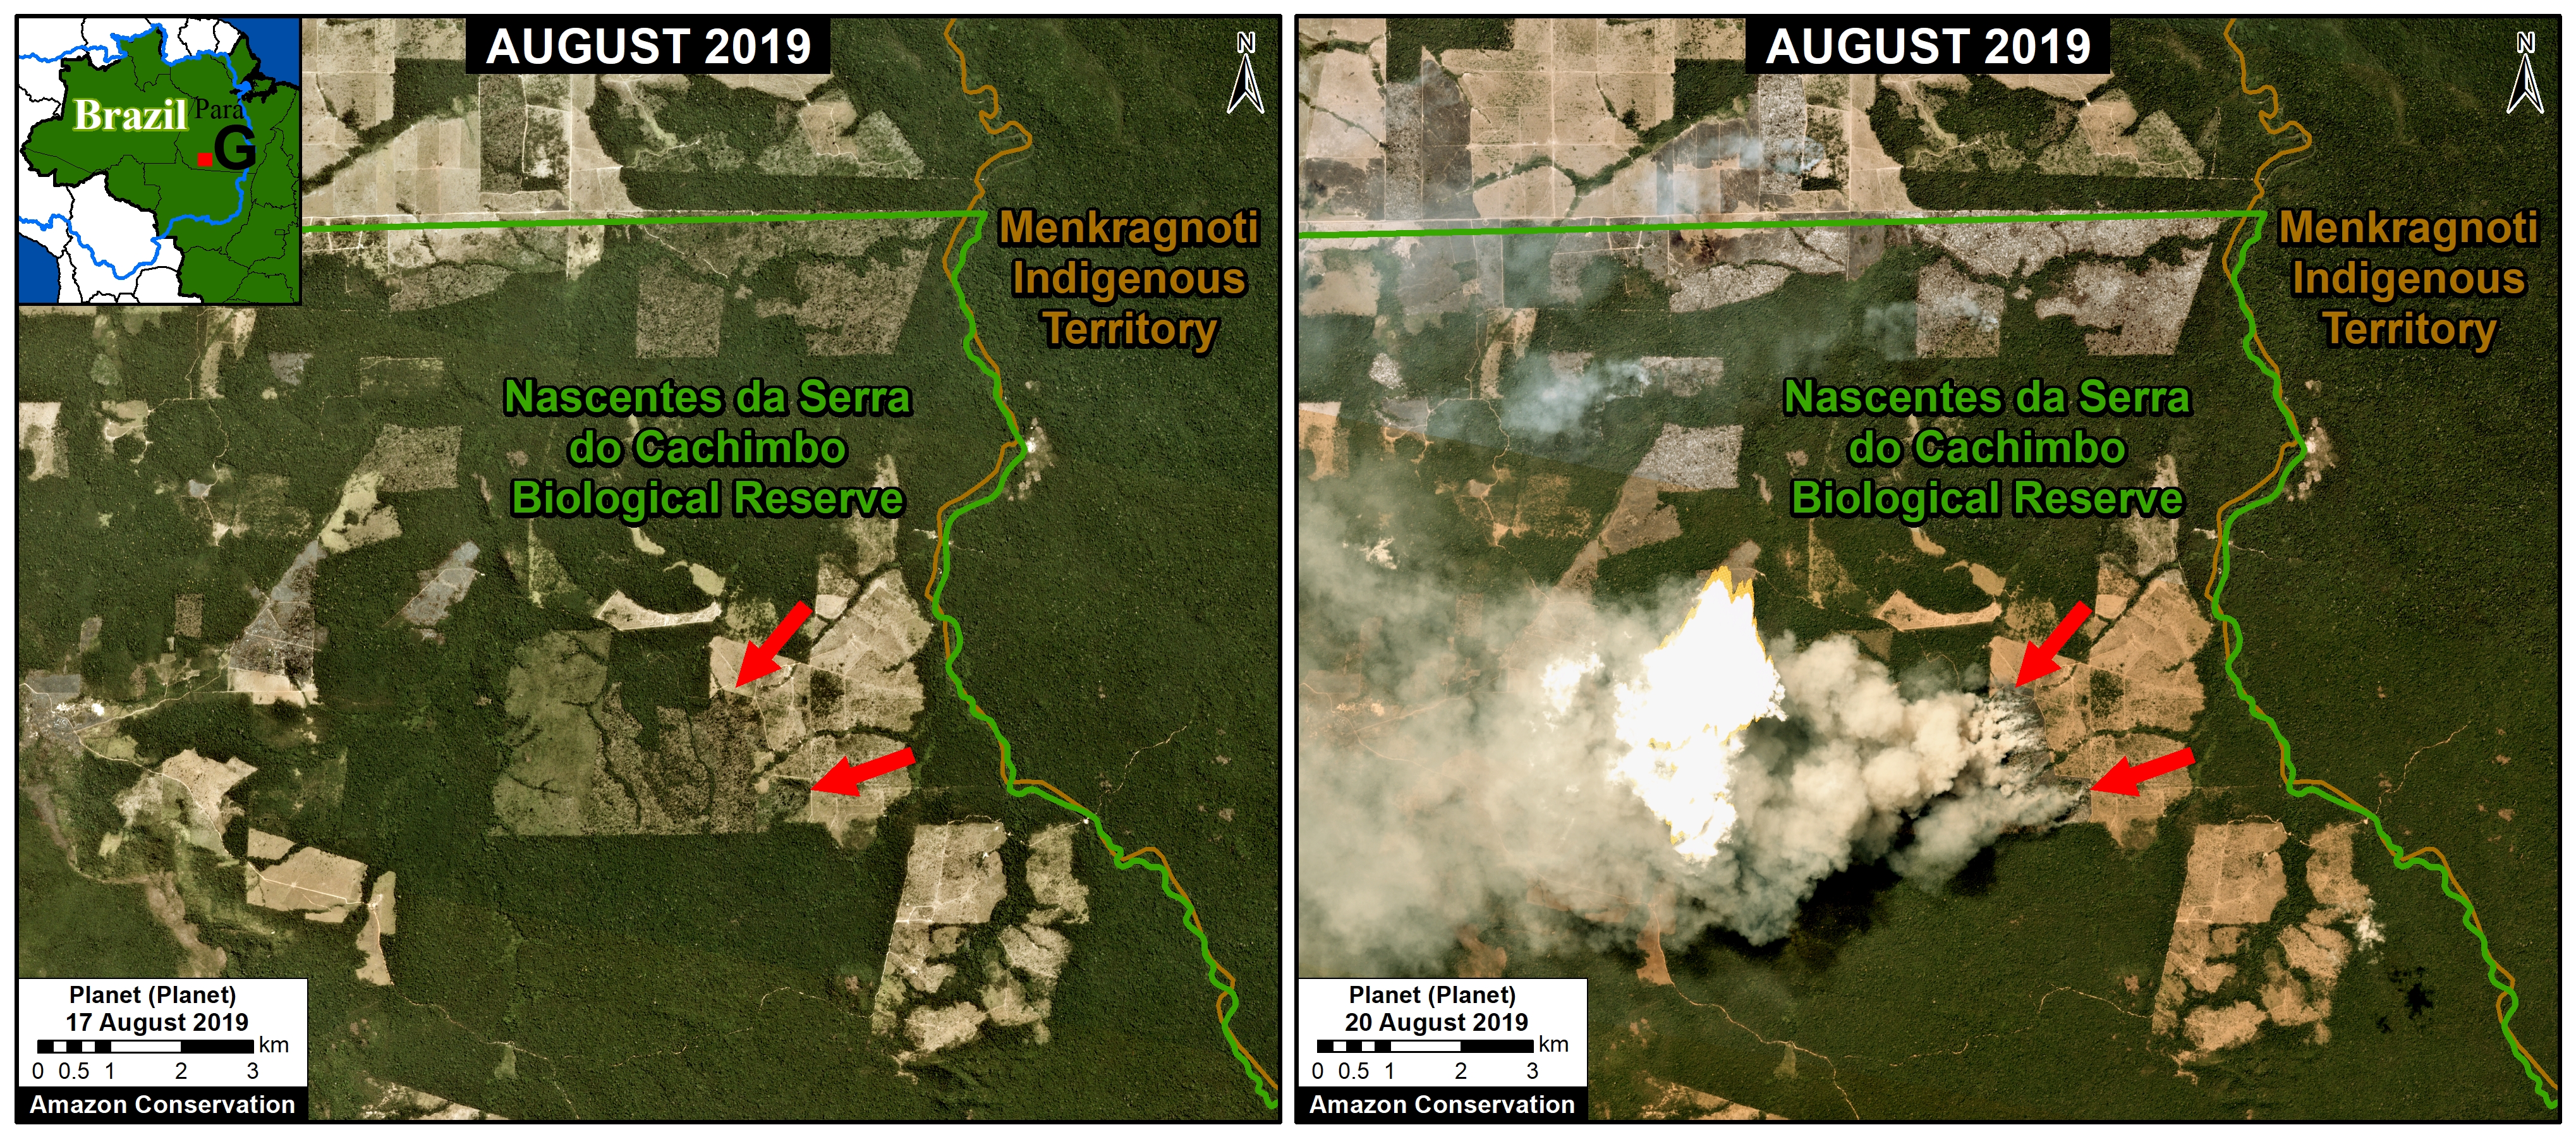
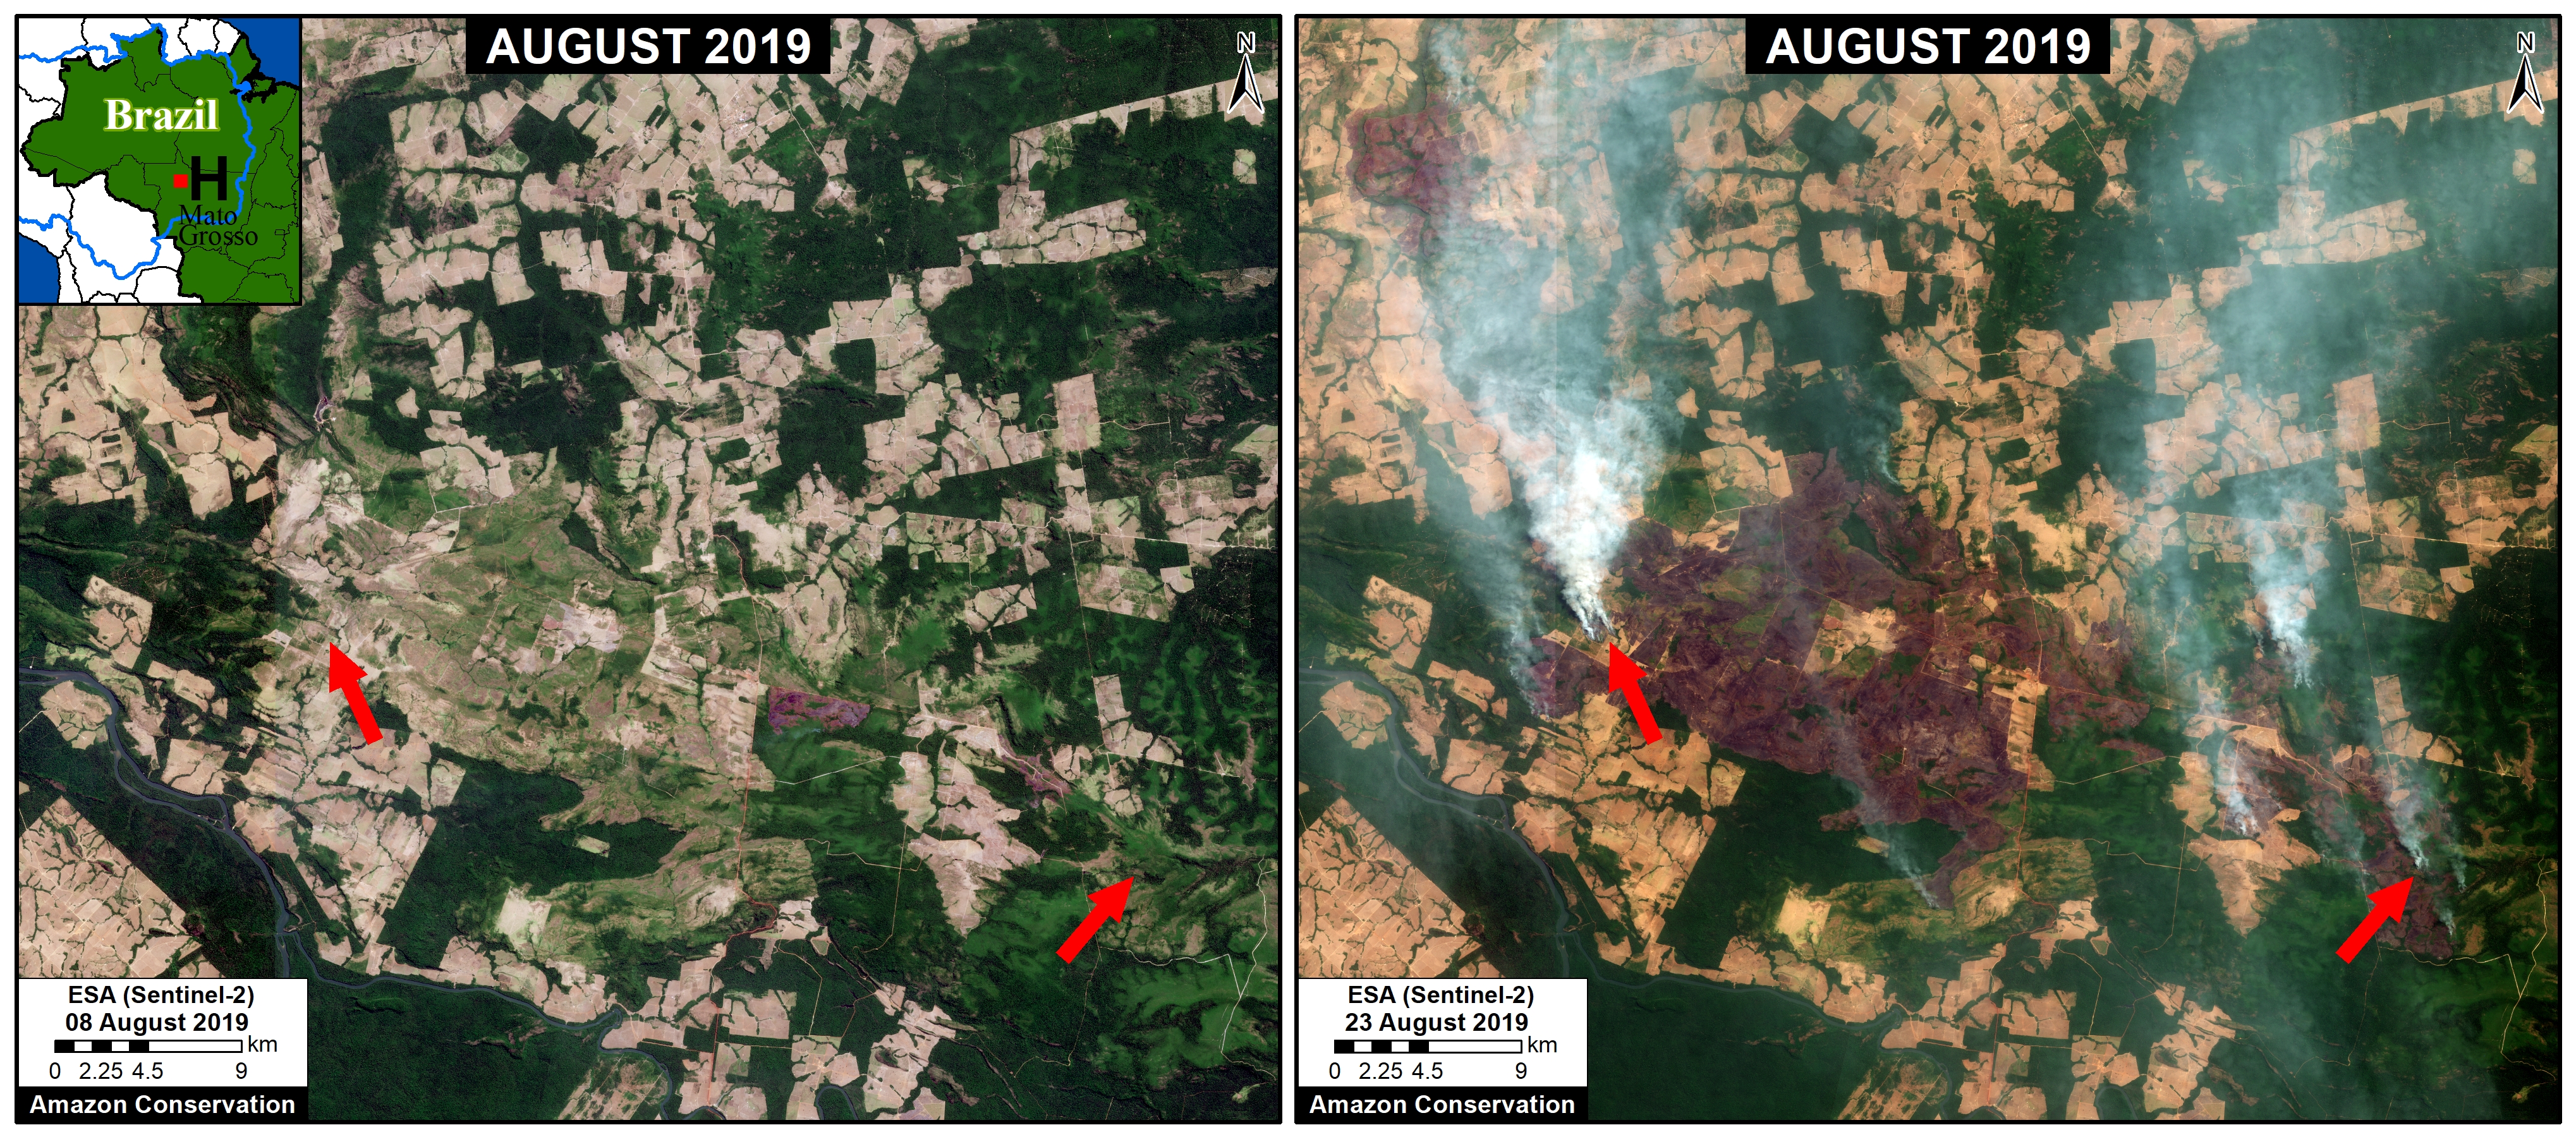
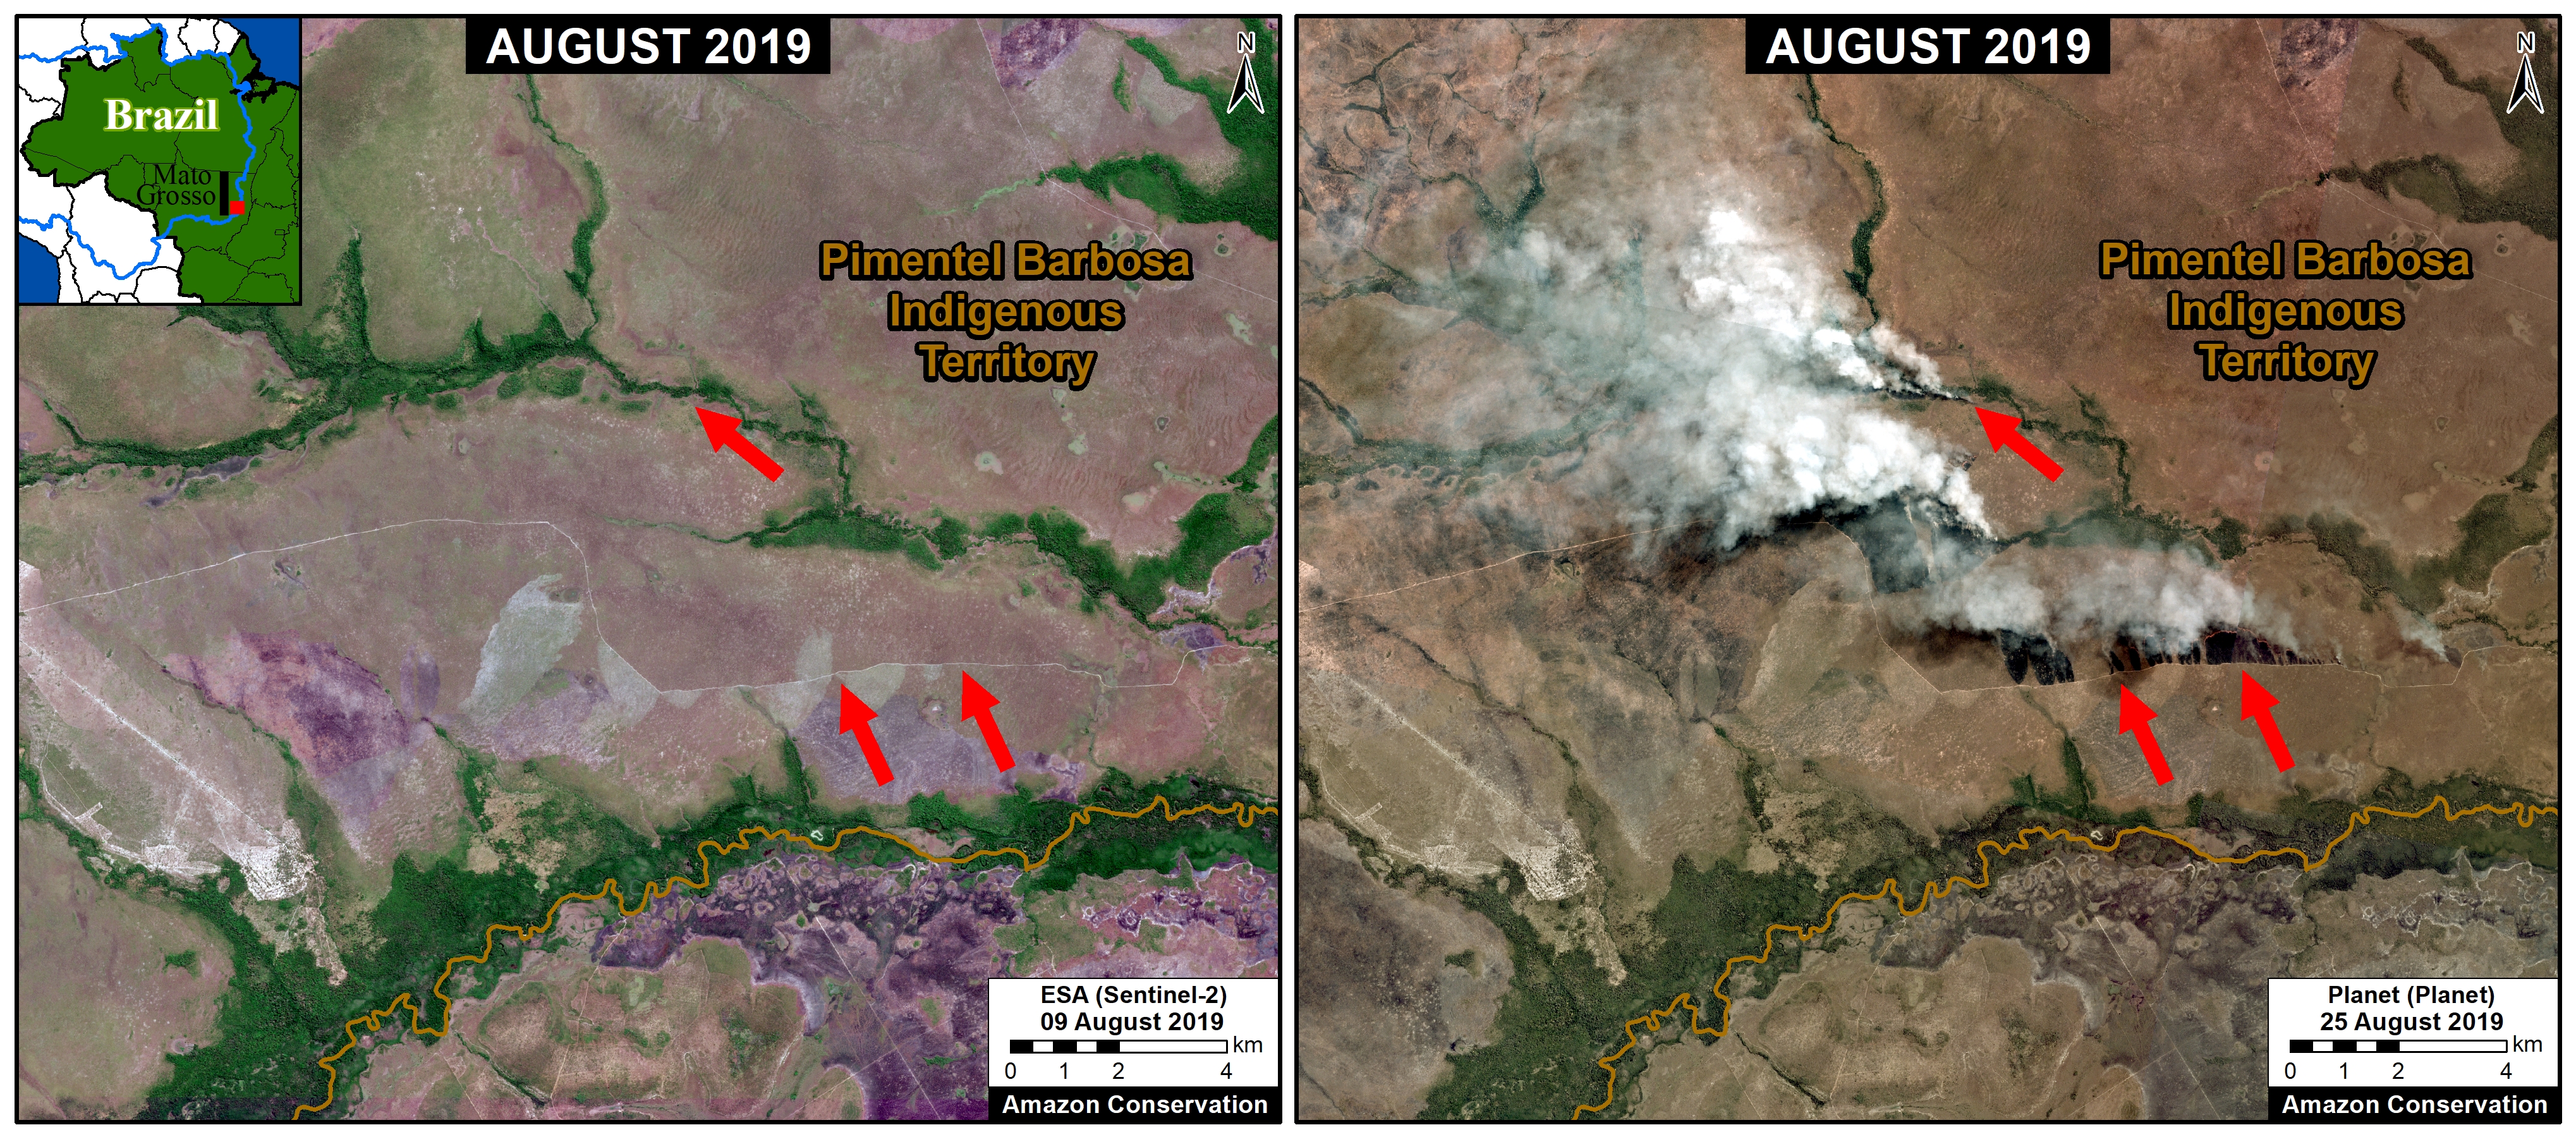
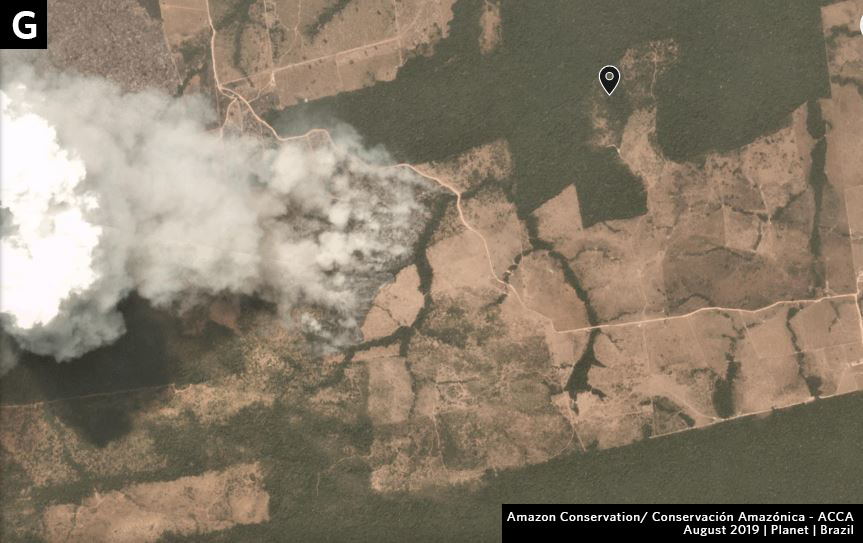
Importantly, the vast majority of the major fires in the Brazilian Amazon (85%) have burned recently deforested areas (cleared between 2018 and 2020) covering 280,000 acres (113,000 hectares). Thus, we argue that the central issue is actually deforestation and the fires are actually a smoking indicator of this forest loss.
We have detected the first two forest fires, burning 388 acres (1,447 hectares) in Mato Grosso and Para.
The rest of the major fires have been on older cattle or agricultural lands (deforested prior to 2018).
The most impacted protected areas are Jamanxim and Altamira National Forests in Pará. We emphasize, however, that these fires were burning recently deforested areas (not forest fires) and so, again, the primary issue is deforestation.
In Brazil, the vast majority of the major fires (94%) appear to be illegal as they violate the state and national government mandated fire moratoriums established in July. In fact, despite the moratoriums, the number of major fires is accelerating: 143 so far in August, following 64 in July, 12 in June, and the first one in May.
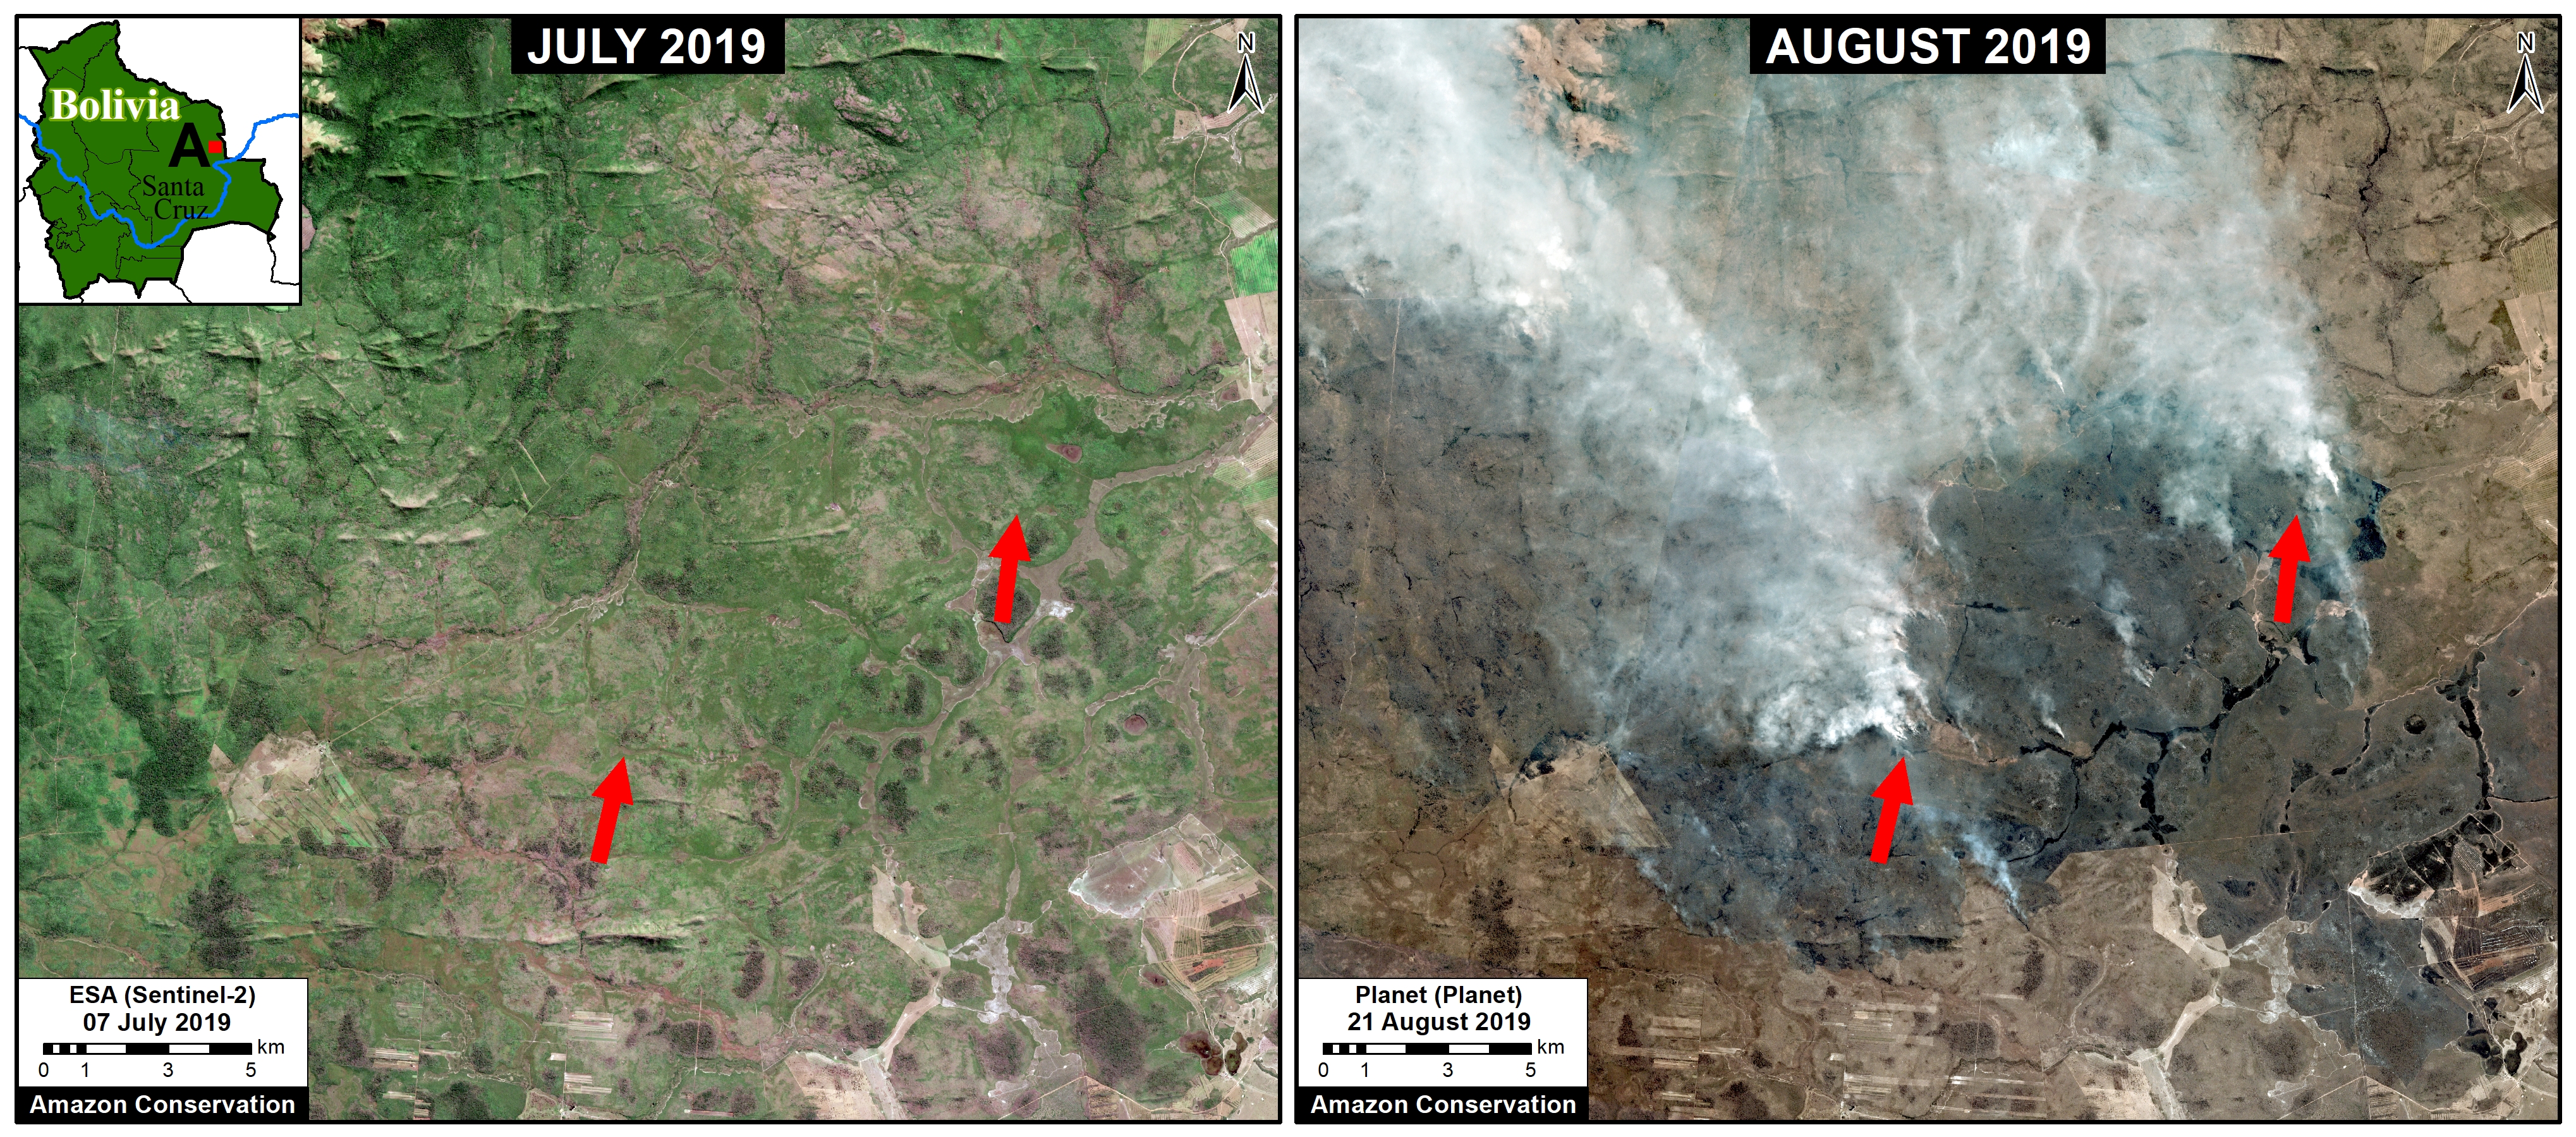
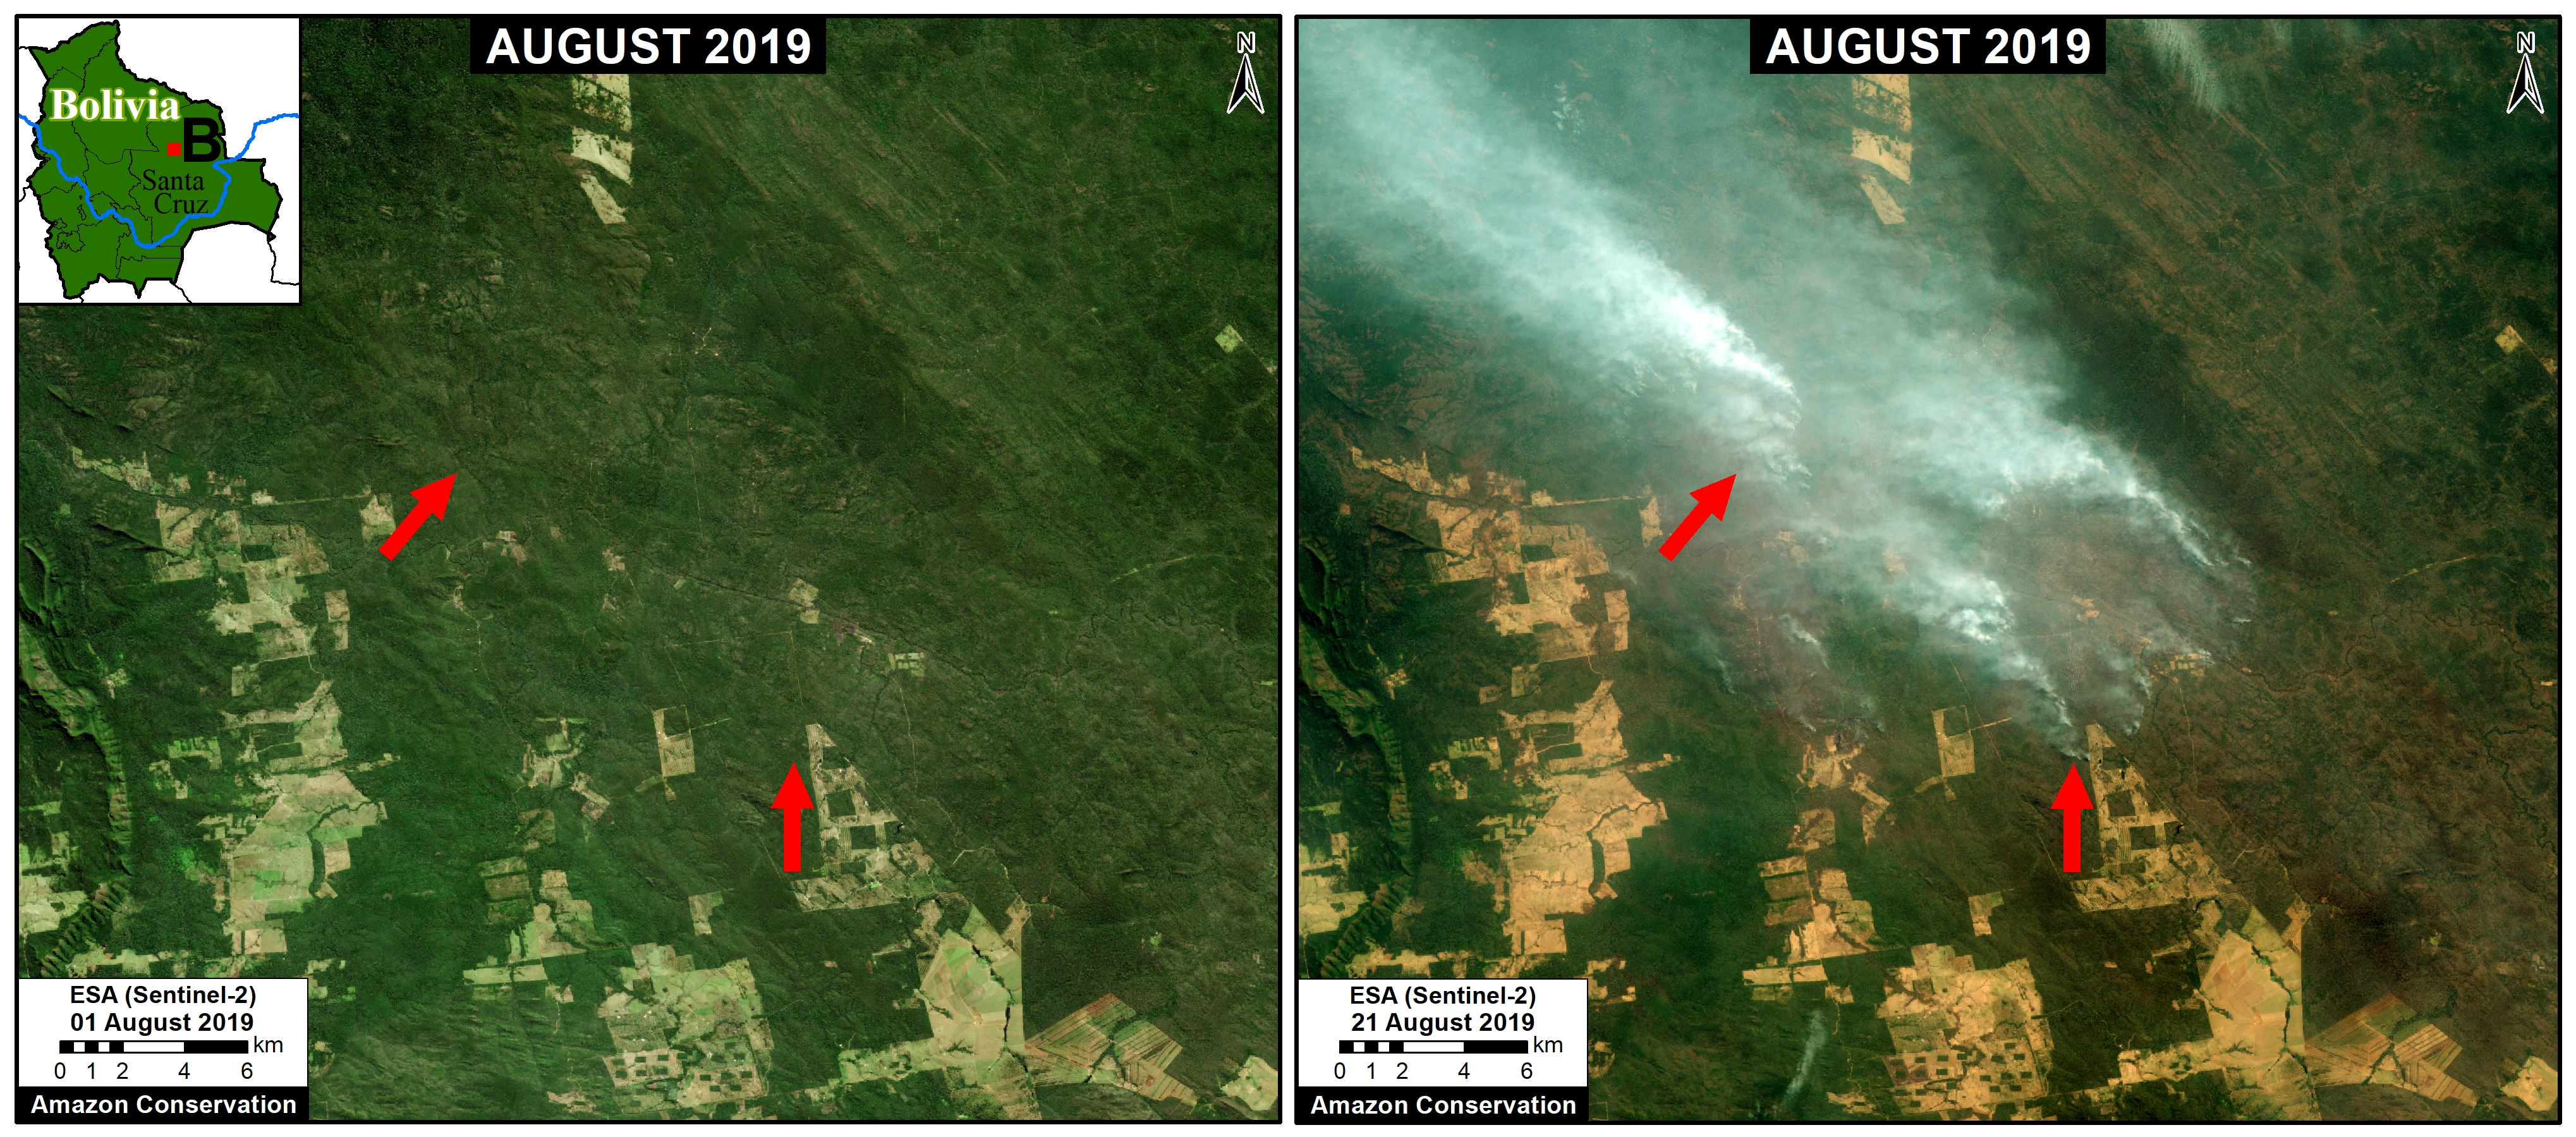
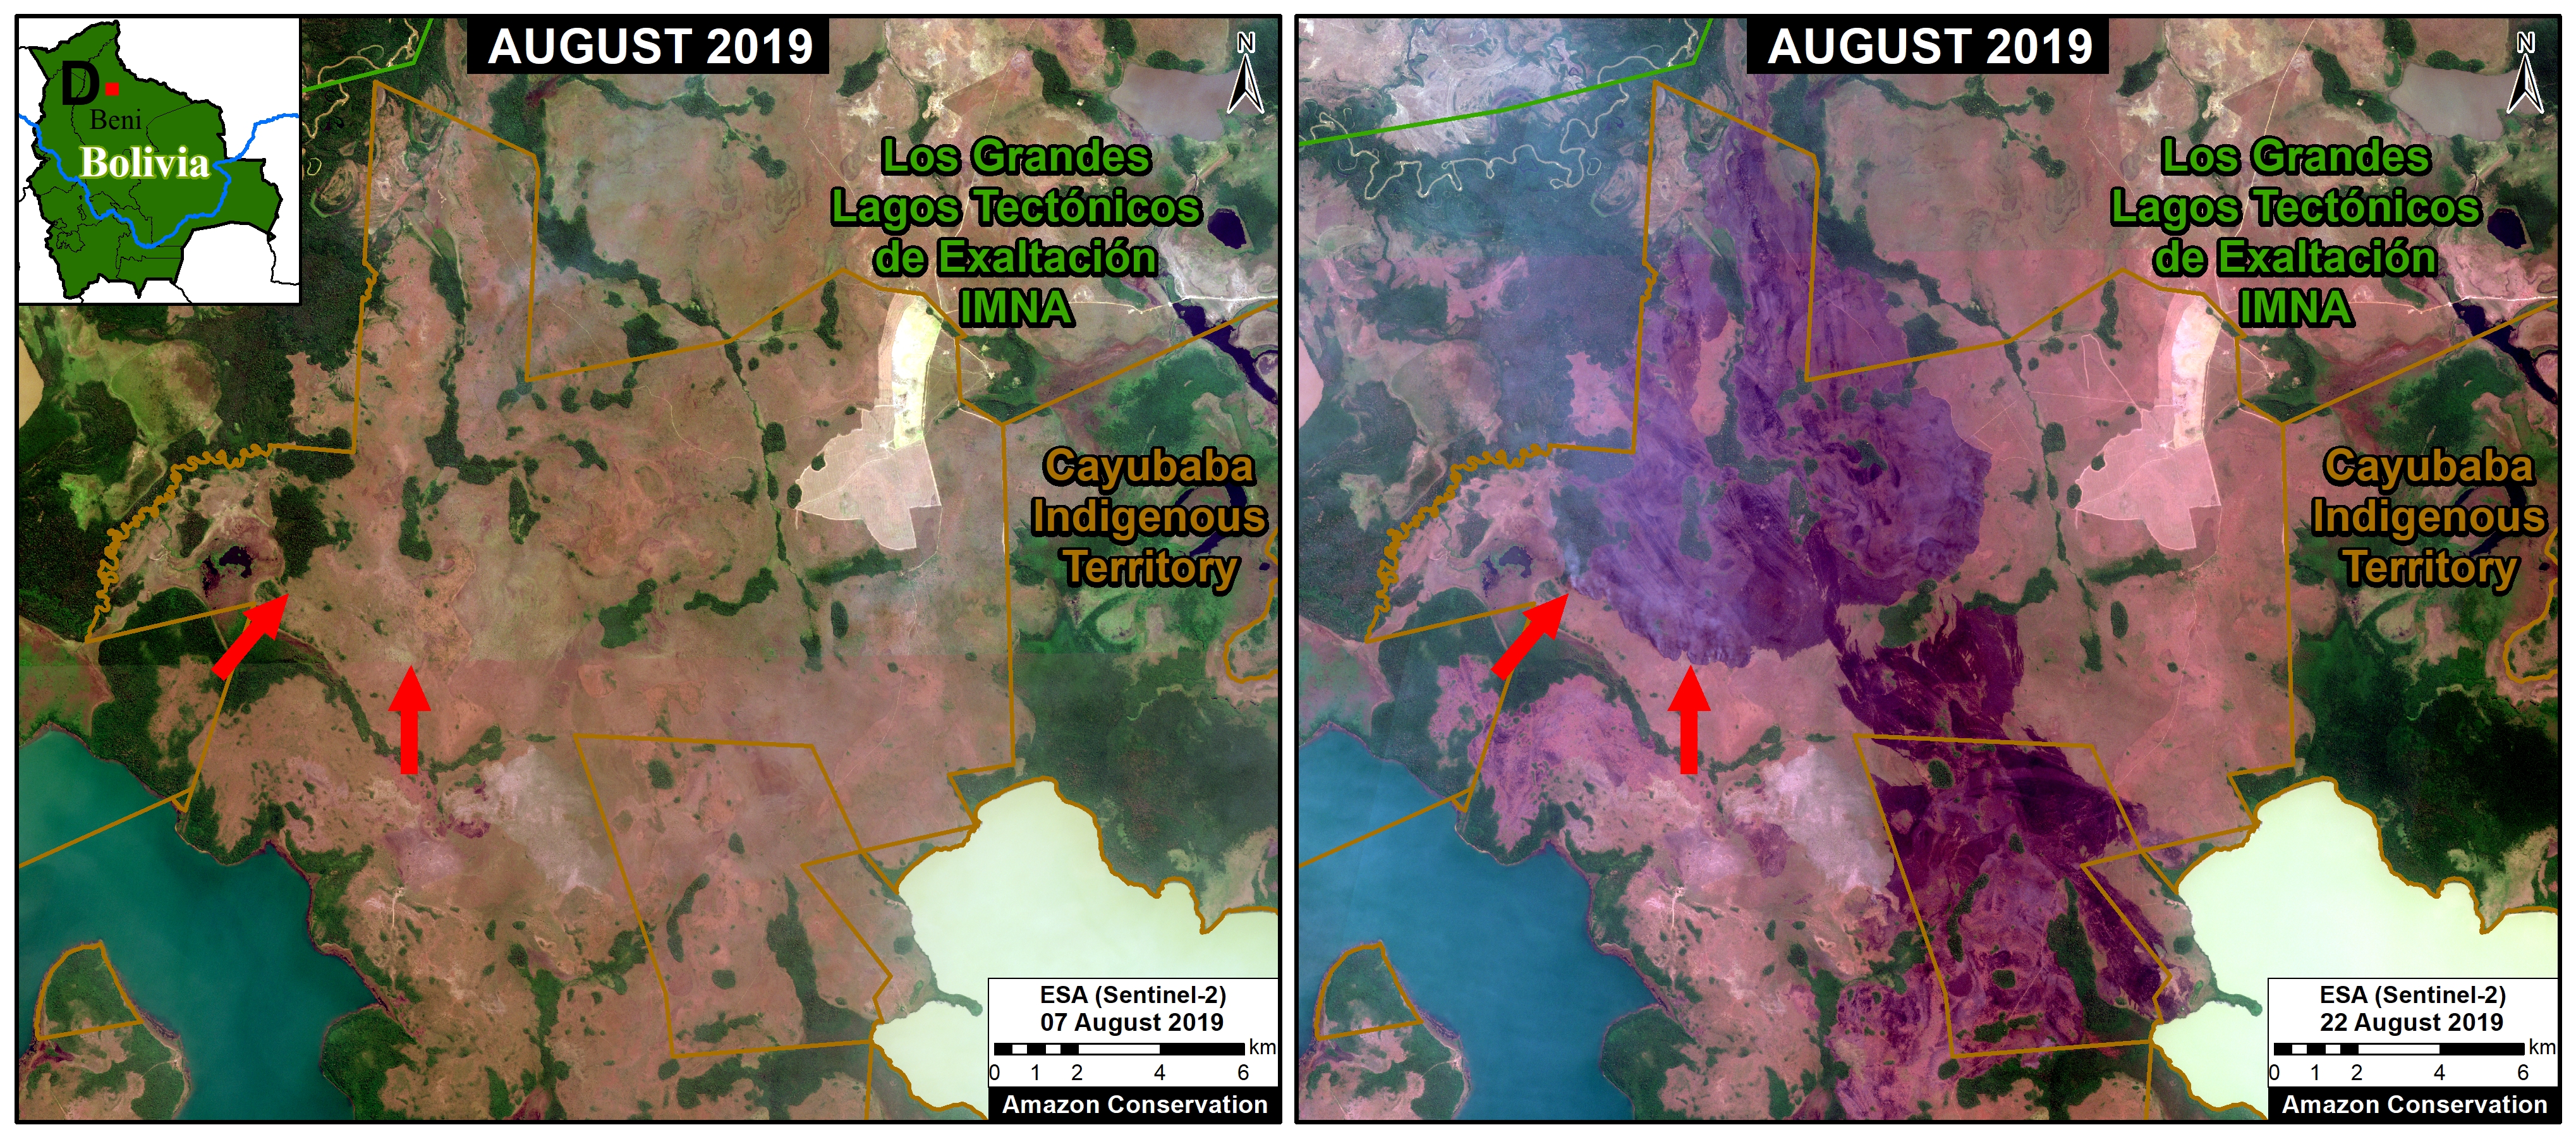
In the Bolivian Amazon, we have recently started detecting fires in the savannahs in the department of Beni. We also detected one fire in a recently deforested area in the Santa Cruz department.
In the Peruvian Amazon, we have recently started detecting fires in the upper elevation grasslands. The biggest one was actually within a protected area (Otishi National Park). There have also been smaller grassland fires near the buffer zone of upper Manu National Park.
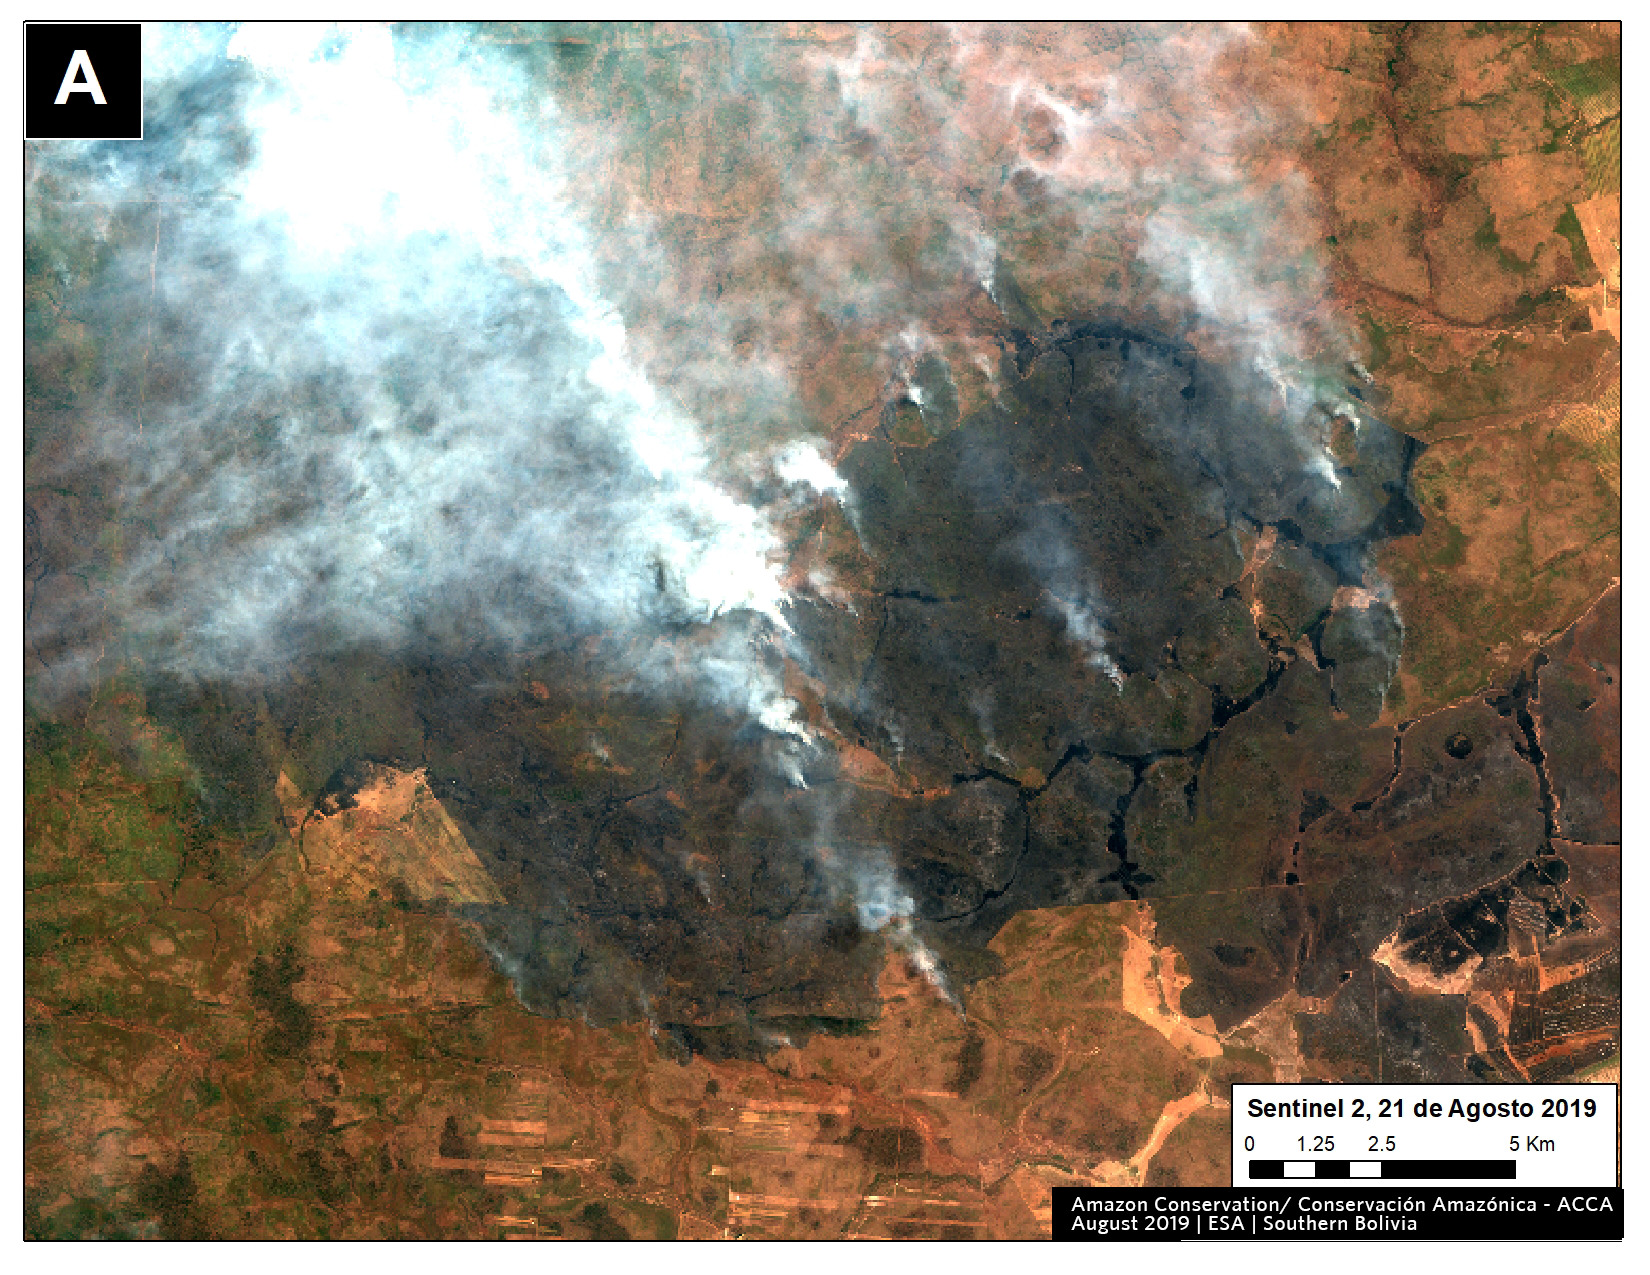
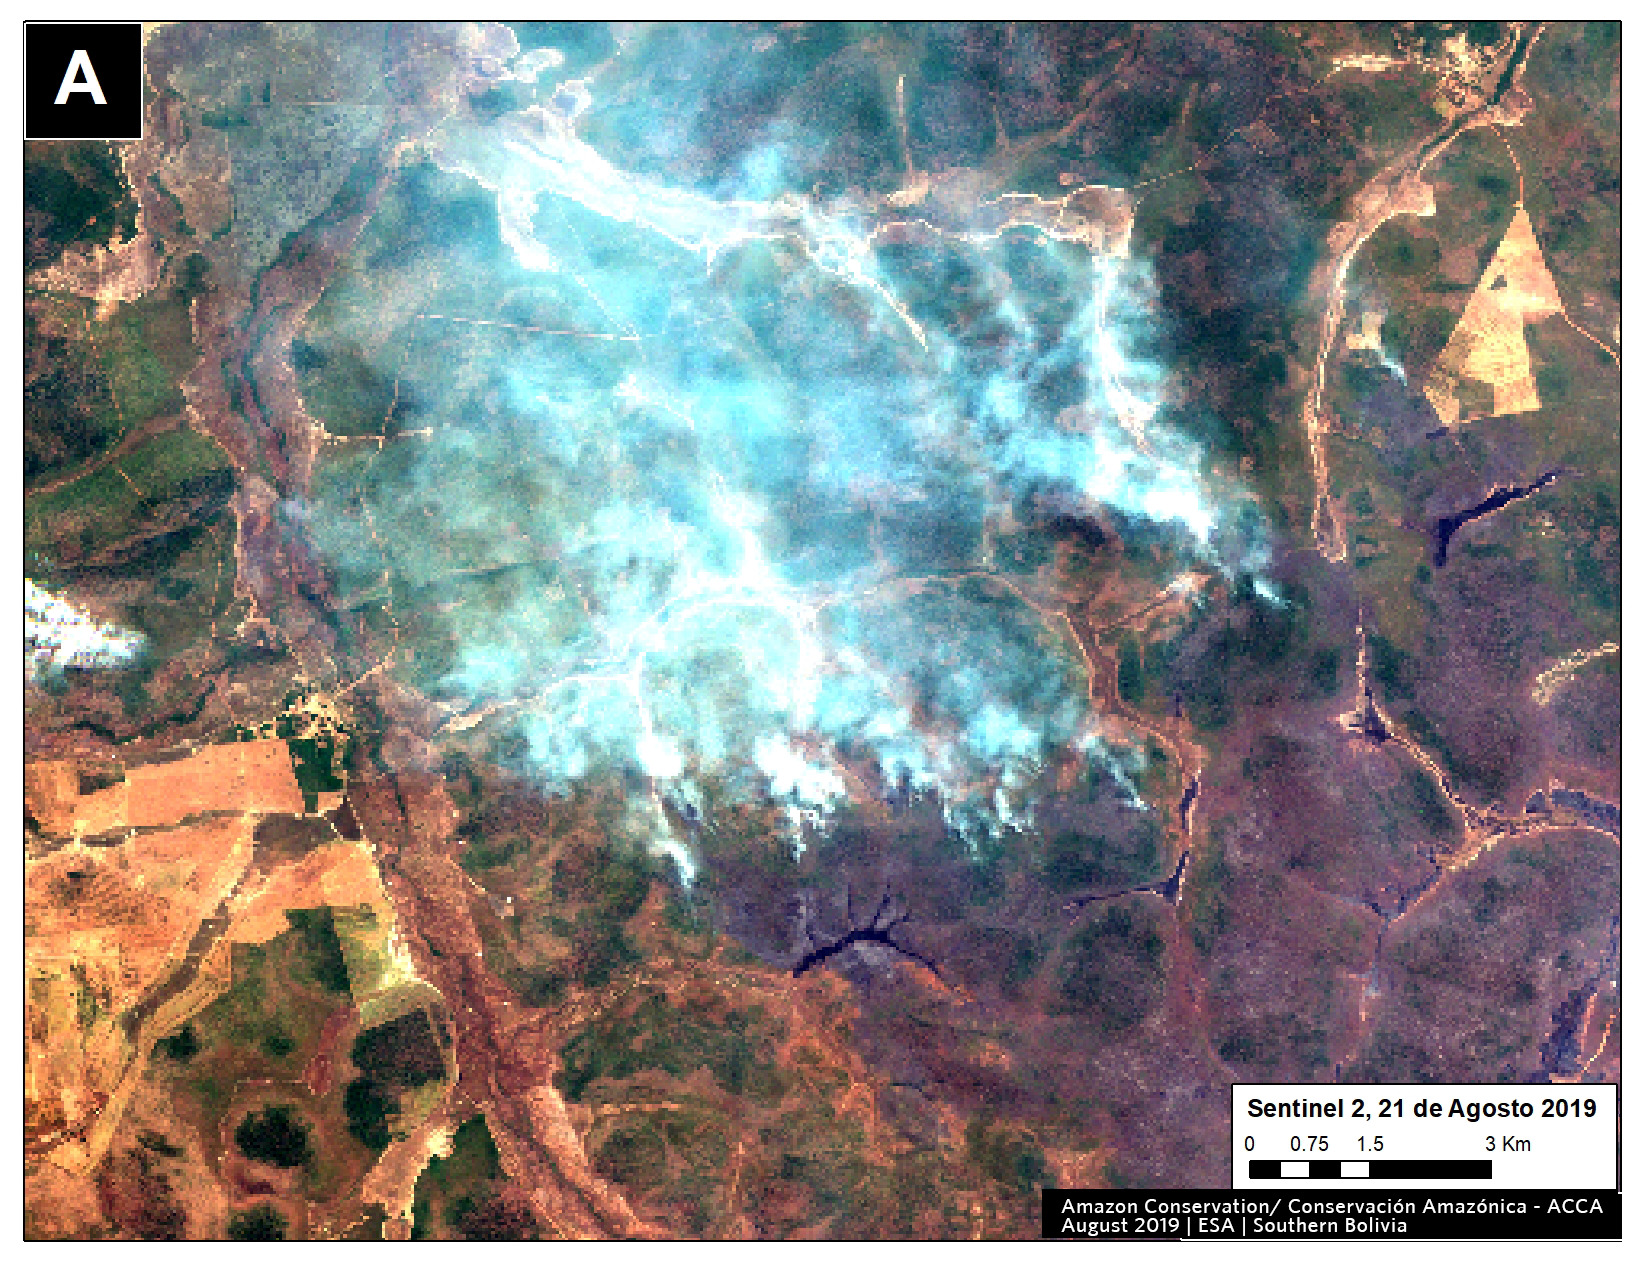
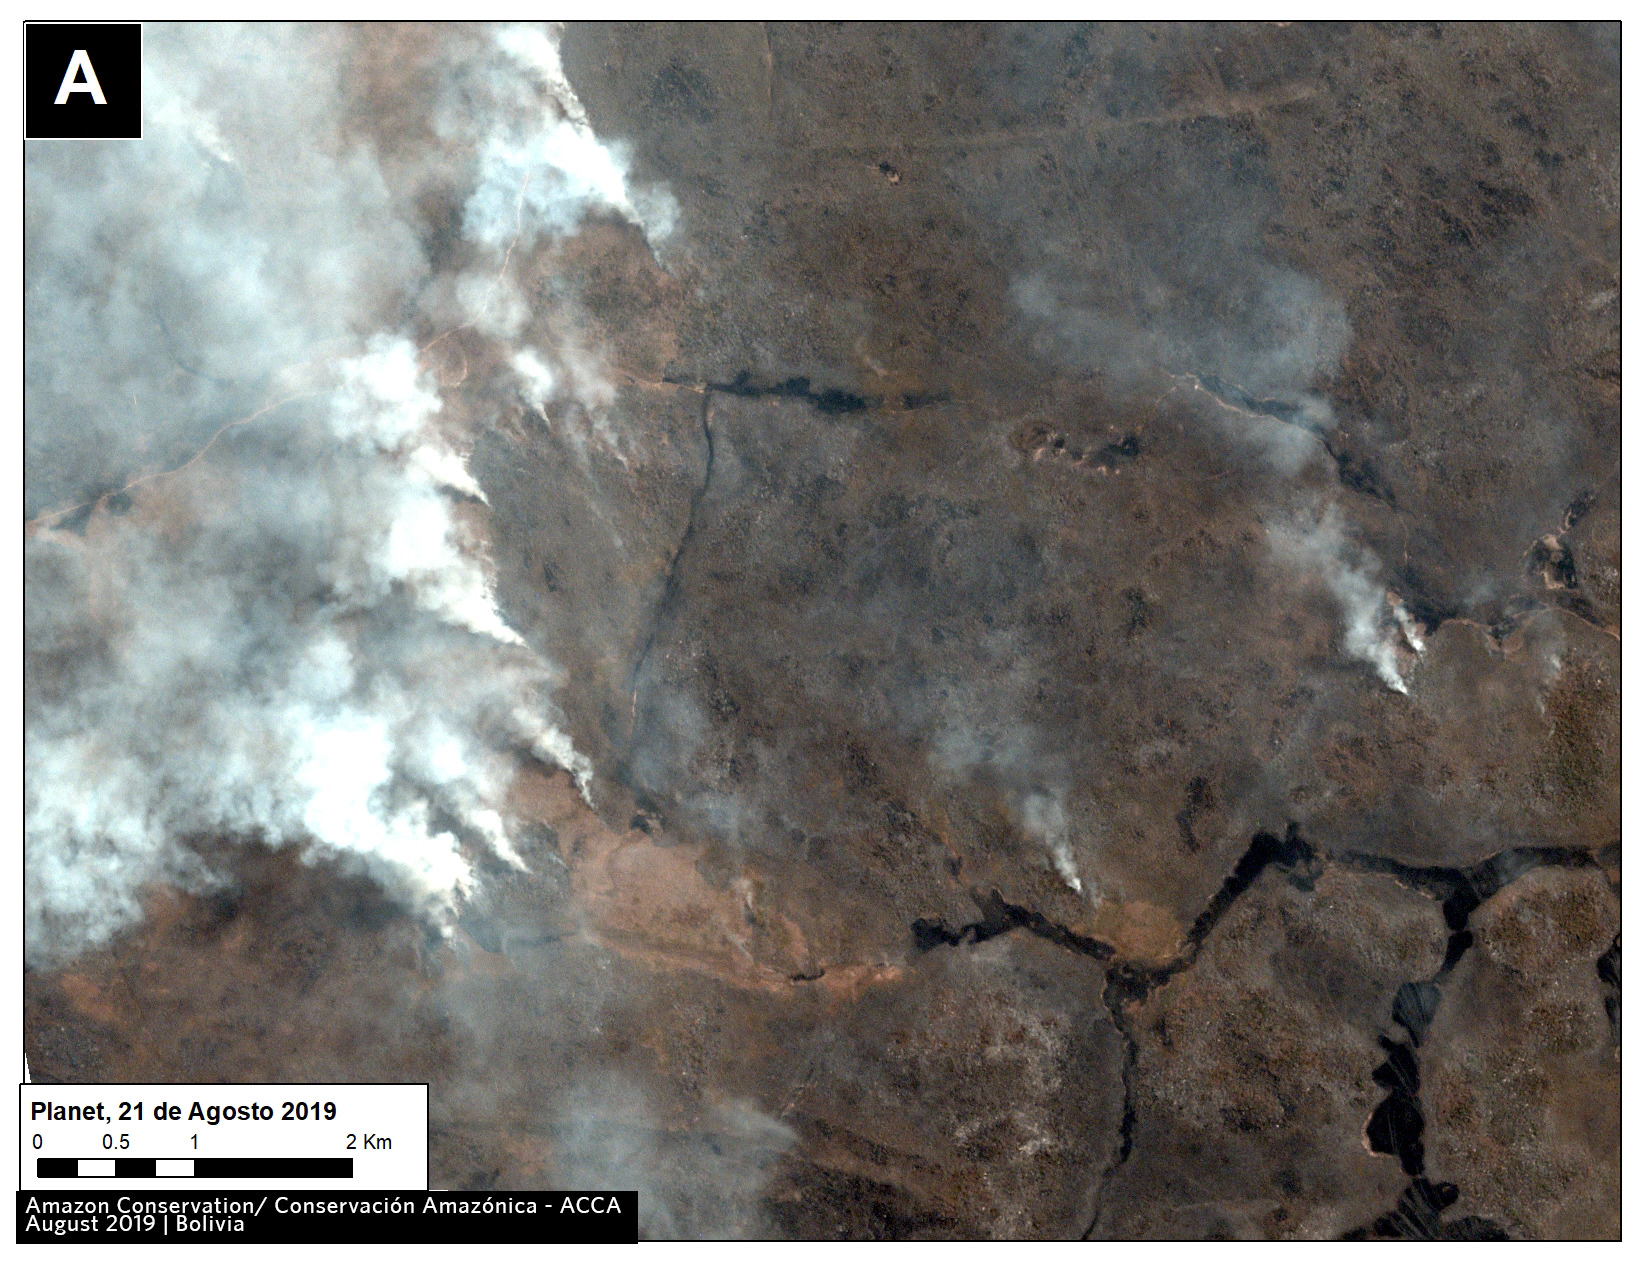
Key Examples of 2020 Fires
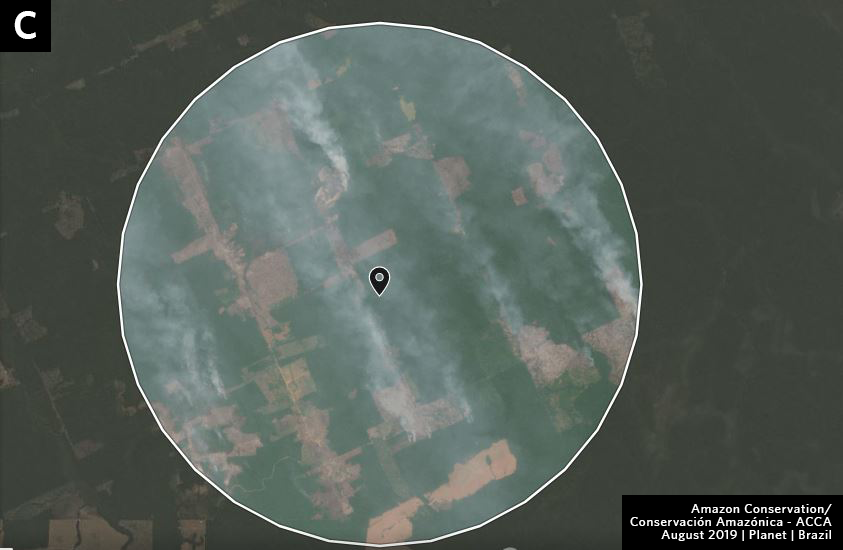
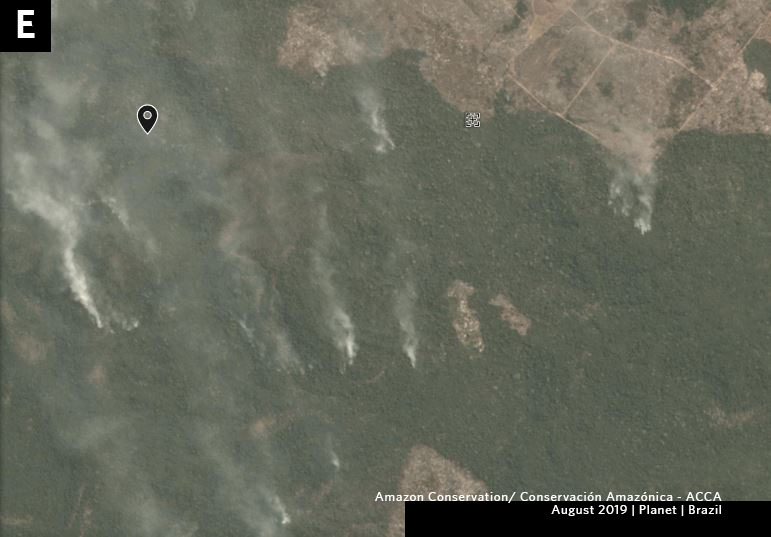
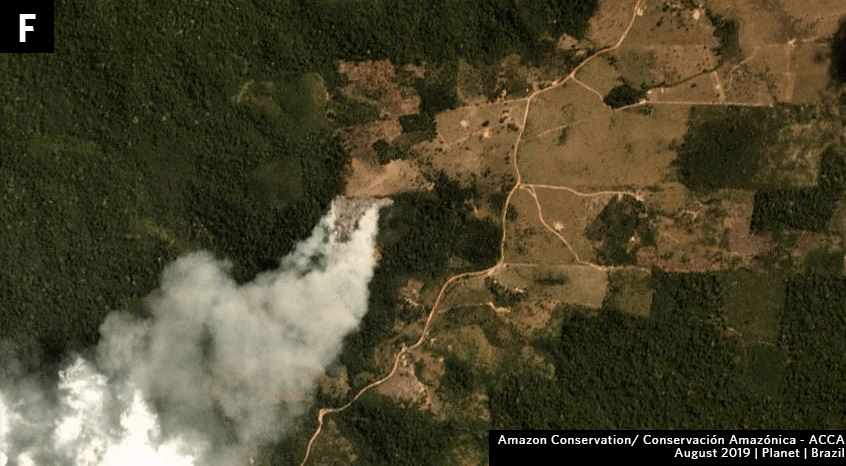
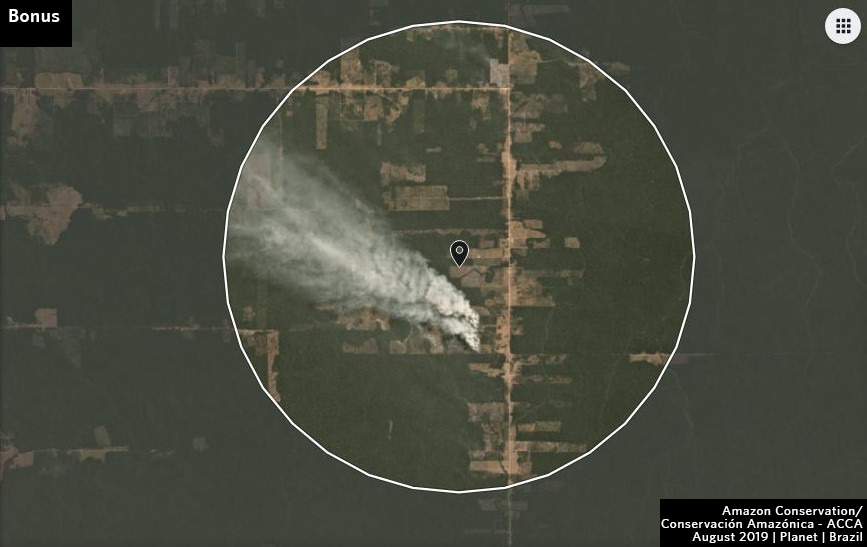
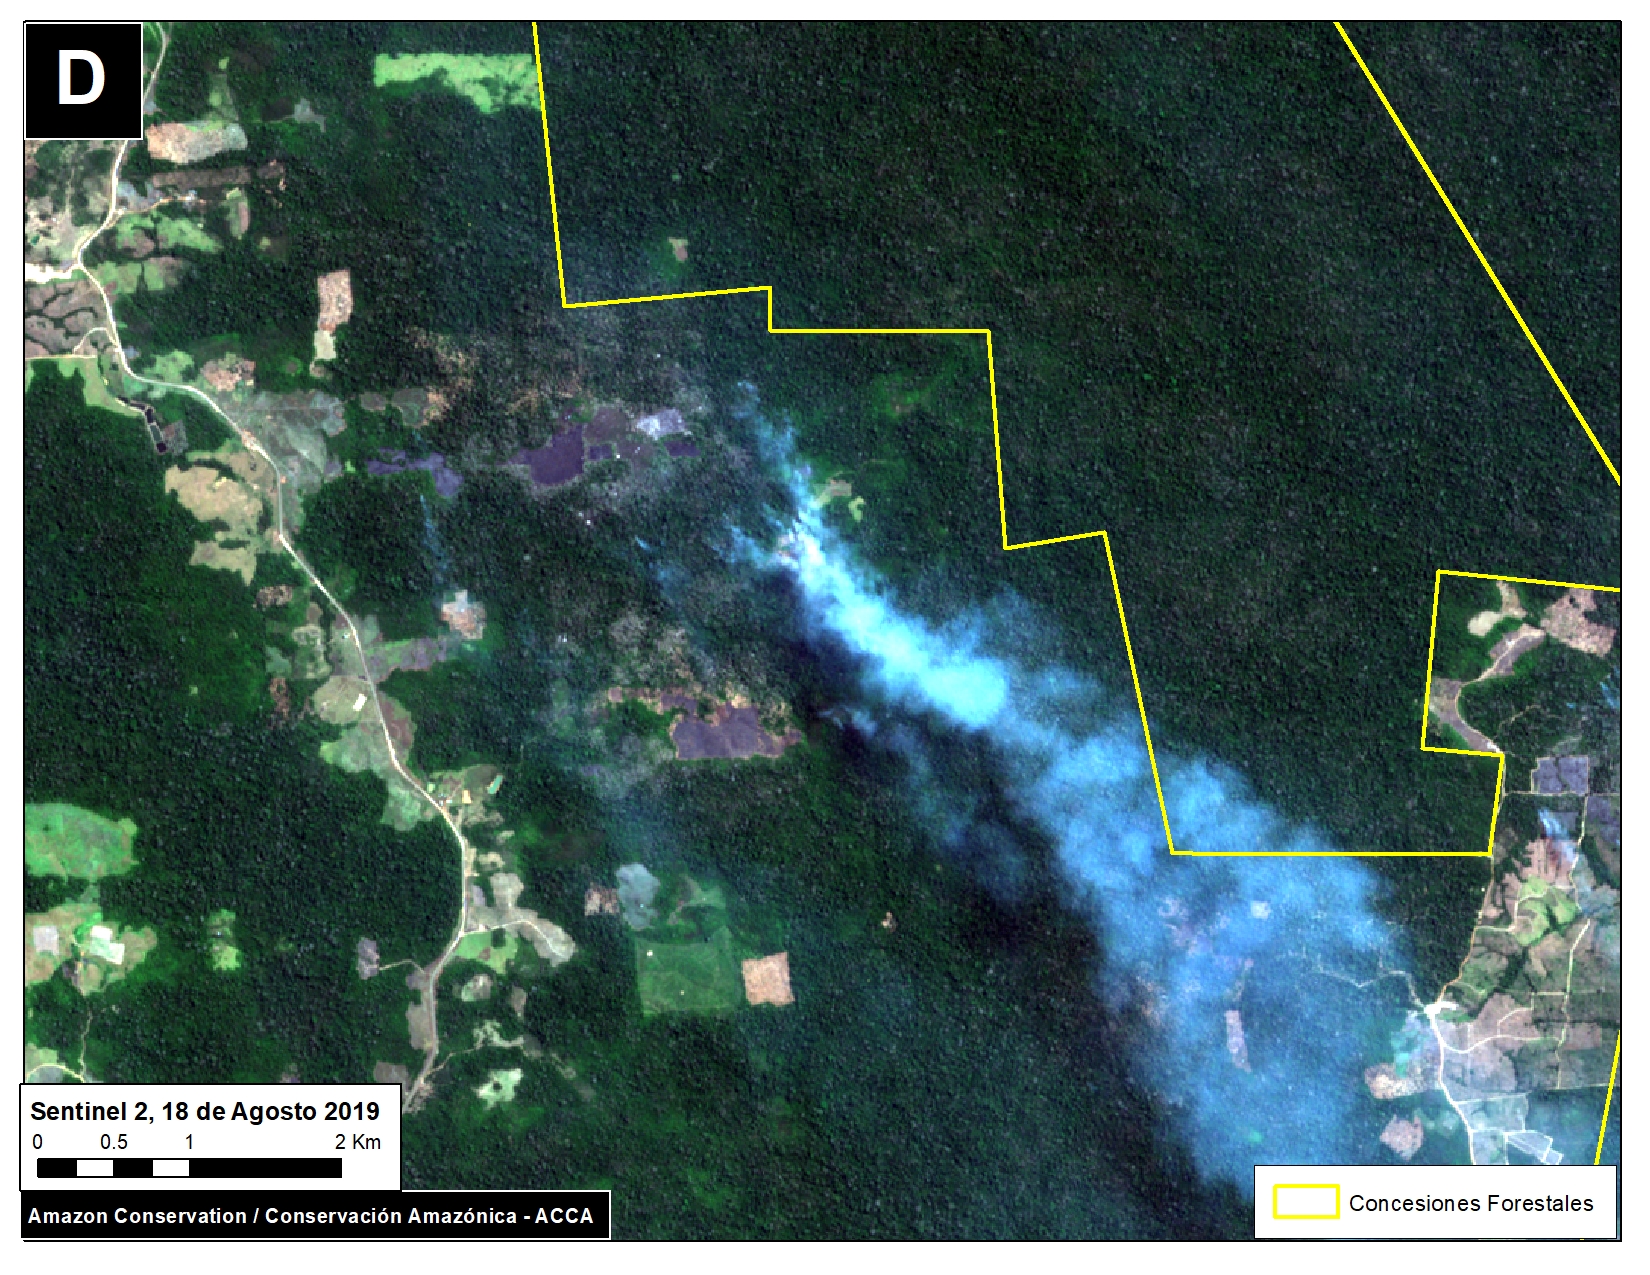
Overall our key finding is that most major Brazilian Amazon fires are burning recently deforested areas, and not raging forest fires. Below is a series of satellite image time-lapse videos showing examples of recent deforestation followed by a major 2020 fire.
Brazilian Amazon Fire #54, July 2020
Brazilian Amazon Fire #59, July 2020
Brazilian Amazon Fire #76, July 2020
Brazilian Amazon Fire #110, August 2020
*Notes and Methodology
In a novel approach, the app combines data from the atmosphere (aerosol emissions in smoke) and the ground (heat anomaly alerts) to effectively detect and visualize major Amazon fires.
When fires burn, they emit gases and aerosols. A new satellite (Sentinel-5P from the European Space Agency) detects these aerosol emissions. Thus, the major feature of the app is detecting elevated aerosol emissions which in turn indicate the burning of large amounts of biomass. For example, the app distinguishes small fires clearing old fields (and burning little biomass) from larger fires burning recently deforested areas or standing forest (and burning lots of biomass).
We define “major fire” as one showing elevated aerosol emission levels on the app, thus indicating the burning of elevated levels of biomass. This typically translates to an aerosol index of >1 (or cyan-green to red on the app). To identify the exact source of the elevated emissions, we reduce the intensity of aerosol data in order to see the underlying terrestrial heat-based fire alerts. Typically for major fires, there is a large cluster of alerts. The major fires are then confirmed, and burn areas estimated, using high-resolution satellite imagery from Planet Explorer.
See MAAP #118 for additional details.
No fires permitted in the Brazilian state of Mato Grosso after July 1, 2020. No fires permitted in all of Brazilian Amazon after July 15, 2020. Thus, we defined “illegal” as any major fires detected after these respective dates.
There was no available Sentinel-5 aerosol data on July 4, 15, and 26.
Acknowledgements
This analysis was done by Amazon Conservation in collaboration with SERVIR Amazonia.
Citation
Finer M, Nicolau A, Villa L (2020) 200 Major Amazon Fires in 2020: Tracker Analysis. MAAP.