MAAP #107: Seeing the Amazon Fires with Satellites

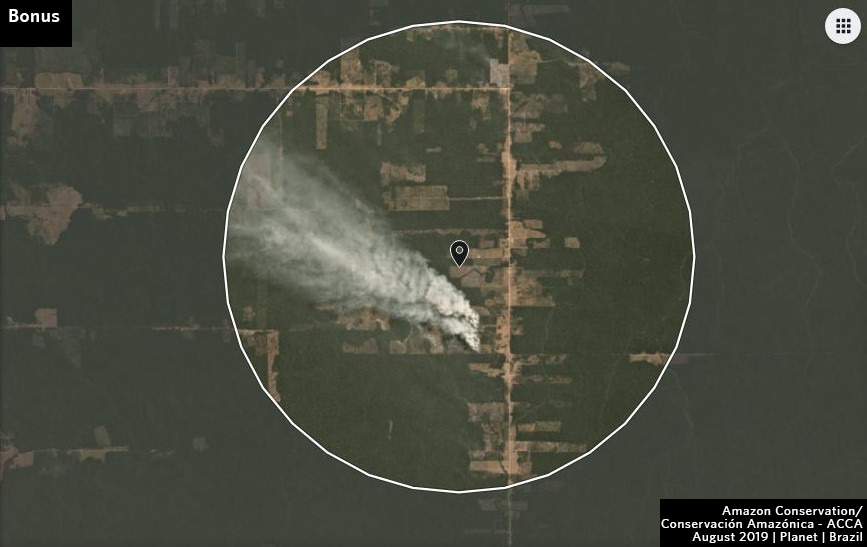
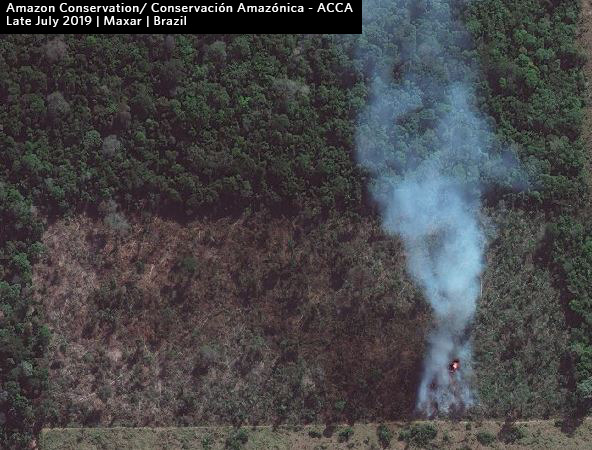
Recent fire (late July 2019) in the Brazilian Amazon. Data: Maxar.

Fires now burning in the Amazon, particularly Brazil and Bolivia, have become headline news and a viral topic on social media.

Yet little information exists on the impact on the Amazon rainforest itself, as many of the detected fires originate in or near agricultural lands.

Here, we advance the discussion on the impact of the fires by presenting the first Base Map of current “fire hotspots” across three countries (Bolivia, Brazil, and Peru). We also present a striking series of satellite images that show what the fires look like in each hotspot and how they are impacting Amazonian forests. Our focus is on the most recent fires in August 2019.

Our key findings include:

  • Fires are burning Amazonian forest in Bolivia, Brazil, and Peru.
    .
  • The fires in Bolivia are concentrated in the dry Chiquitano forests in the southern Amazon.
    .
  • The fires in Brazil are much more scattered and widespread, often associated with agricultural lands. Thus, we warn against using fire detection data alone as a measure of impact as many are clearing fields. However, many of the fires are at the agriculture-forest boundary and maybe expanding plantations or escaping into forest.
    .
  • Although not as severe, we also detected fires burning forest in southern Peru, in an area that has become a deforestation hotspot along the Interoceanic Highway.

Given the nature of the fires in Bolivia and Brazil, estimates of total burned forest area are still difficult to determine. We will continue monitoring and reporting on the situation over the coming days.


Base Map

The Base Map shows “fire hotspots” for the Amazonian regions of Bolivia, Brazil, and Peru in August 2019. The data comes from a NASA satellite that detects fires at 375 meter resolution. The letters (A-G) correlate to the satellite image zooms below.
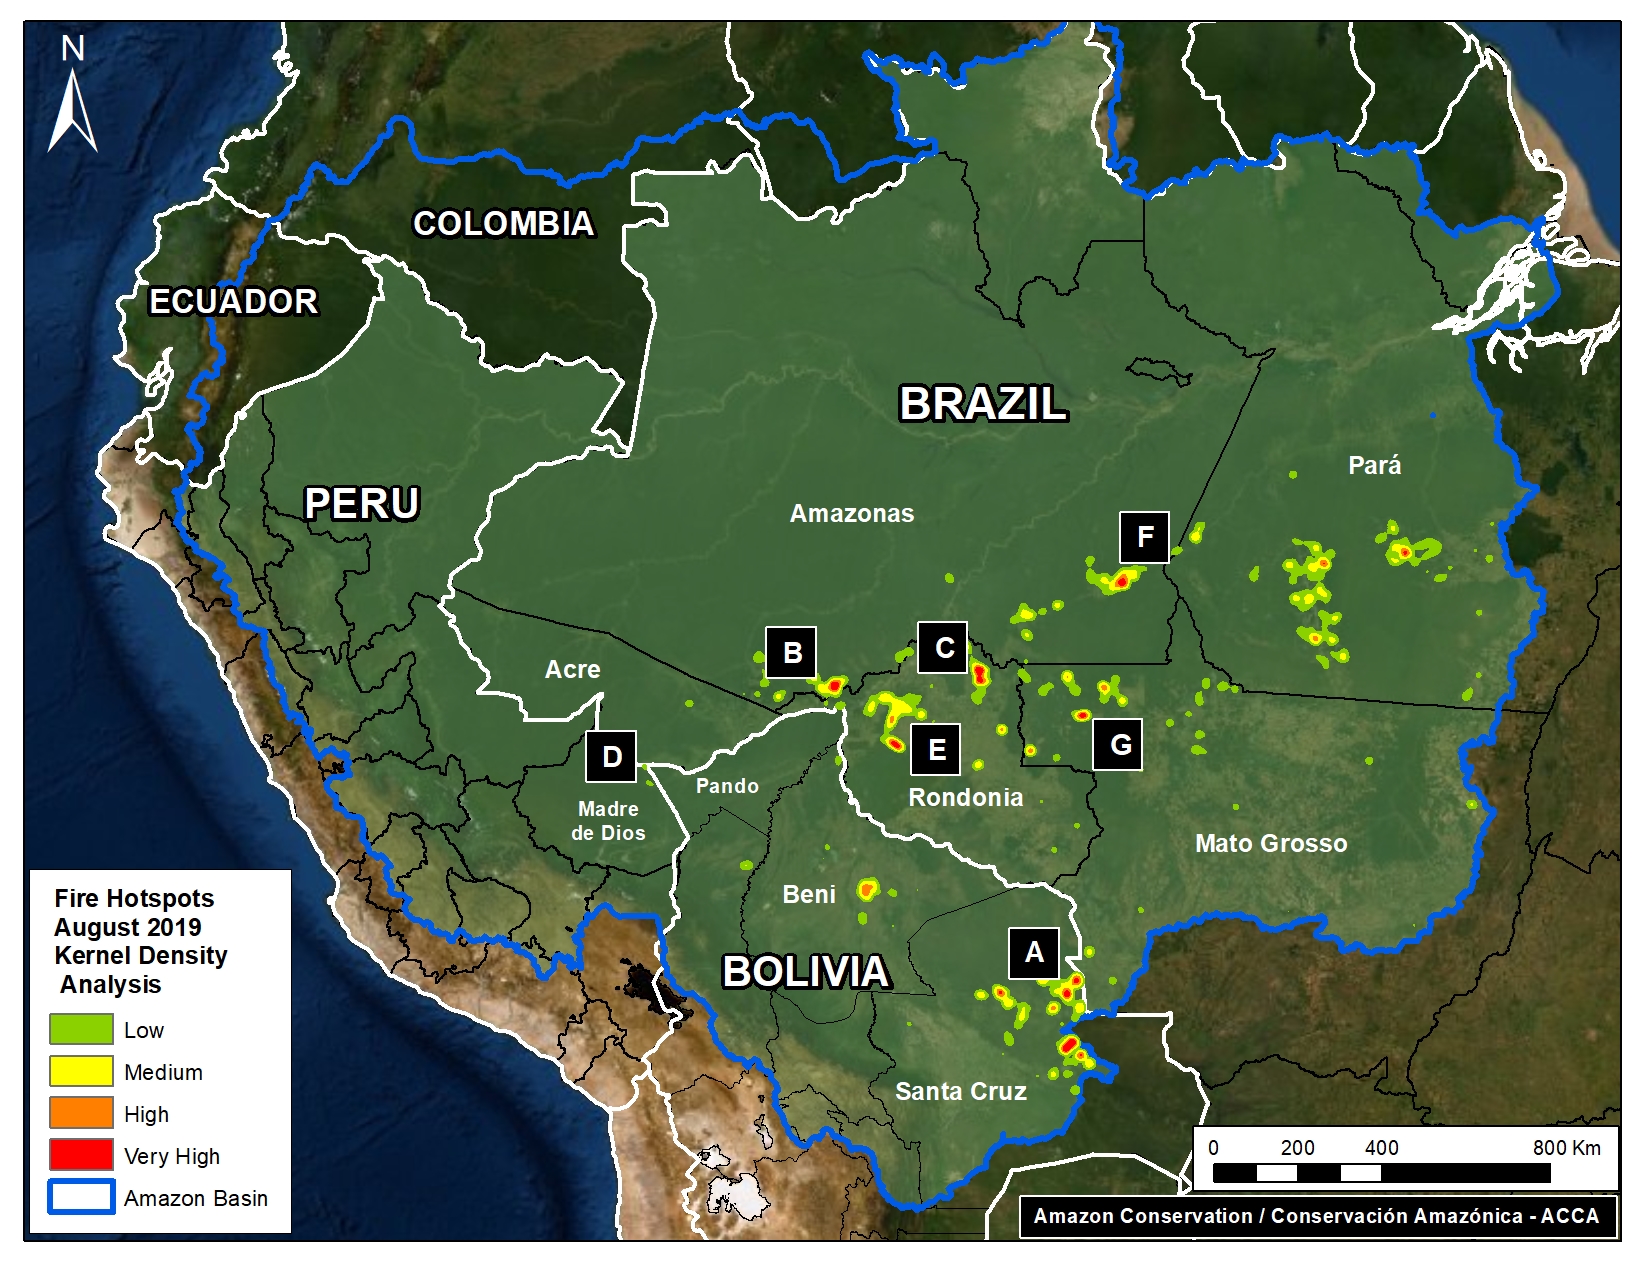
Base Map. Fire Hotspots in the Amazon during August 2019. Data: VIIRS/NASA.

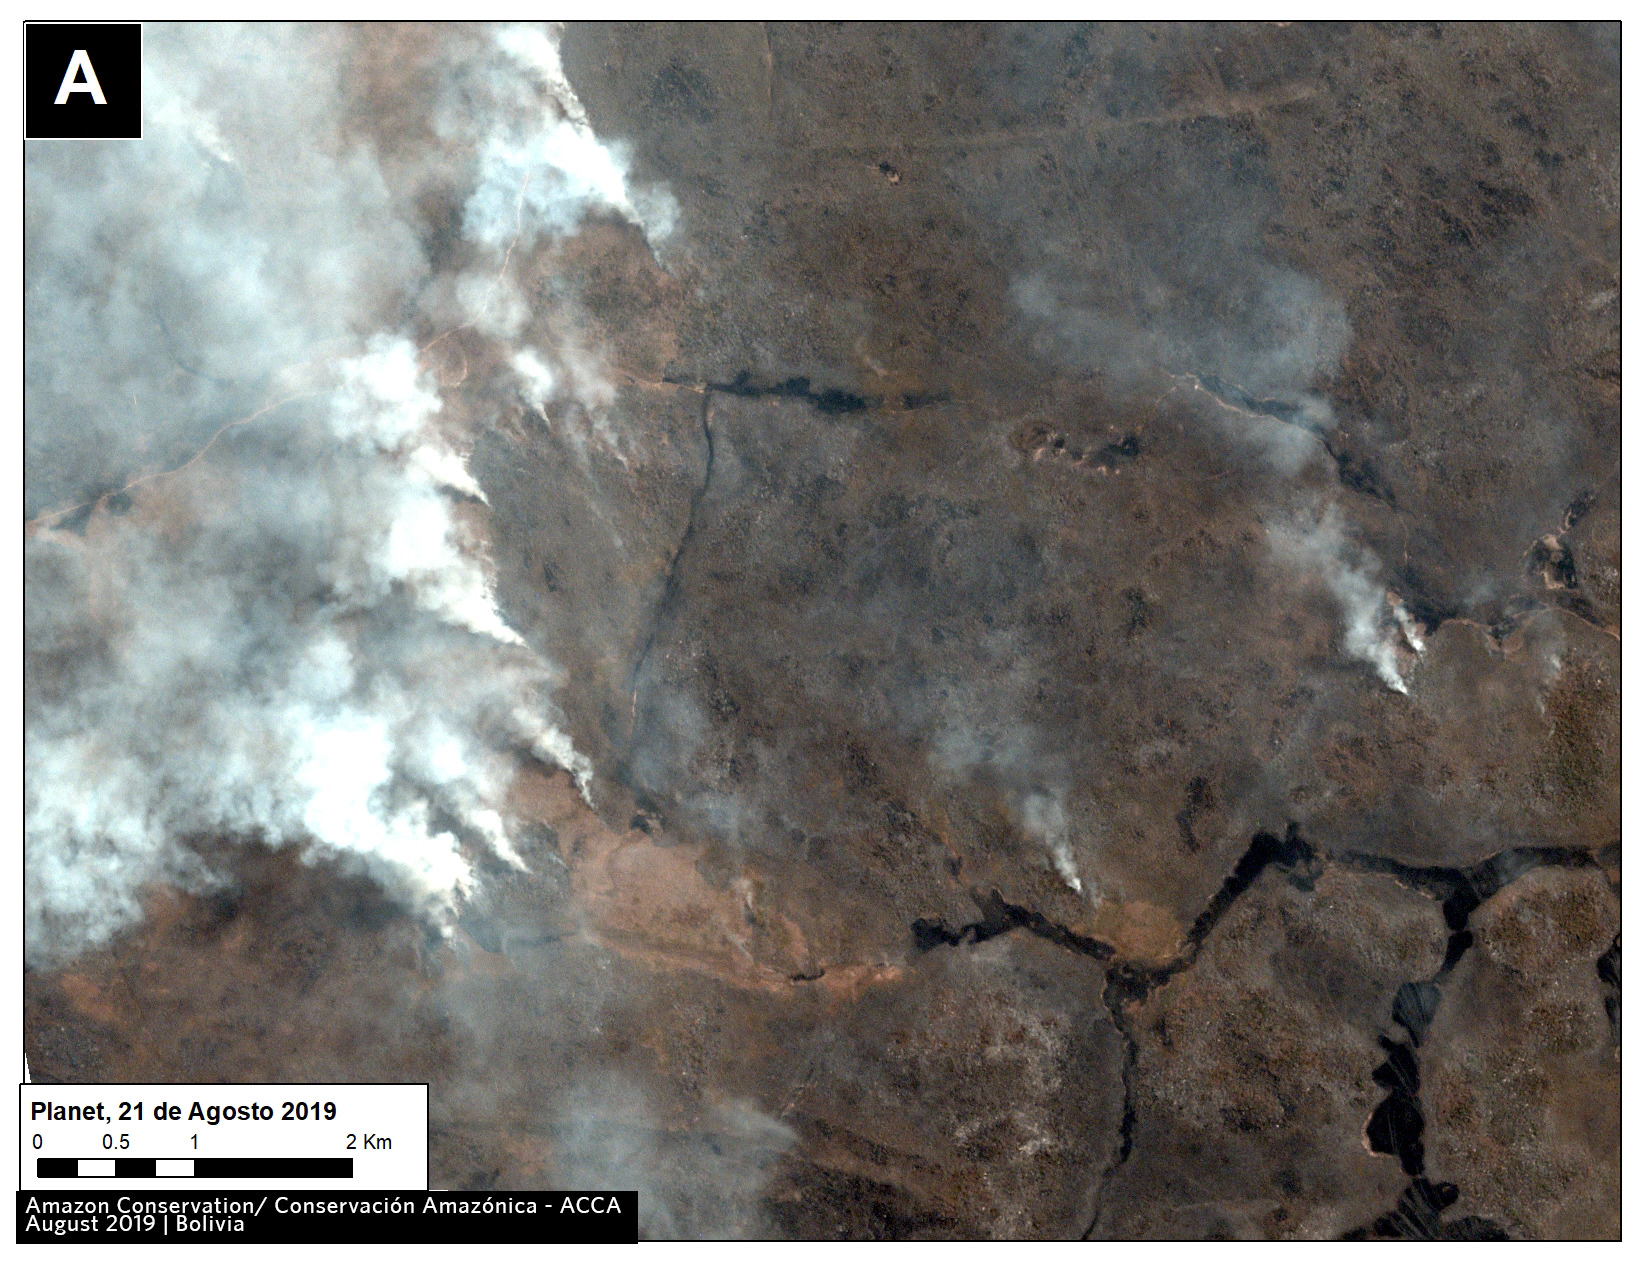
Zoom A: Southern Bolivian Amazon

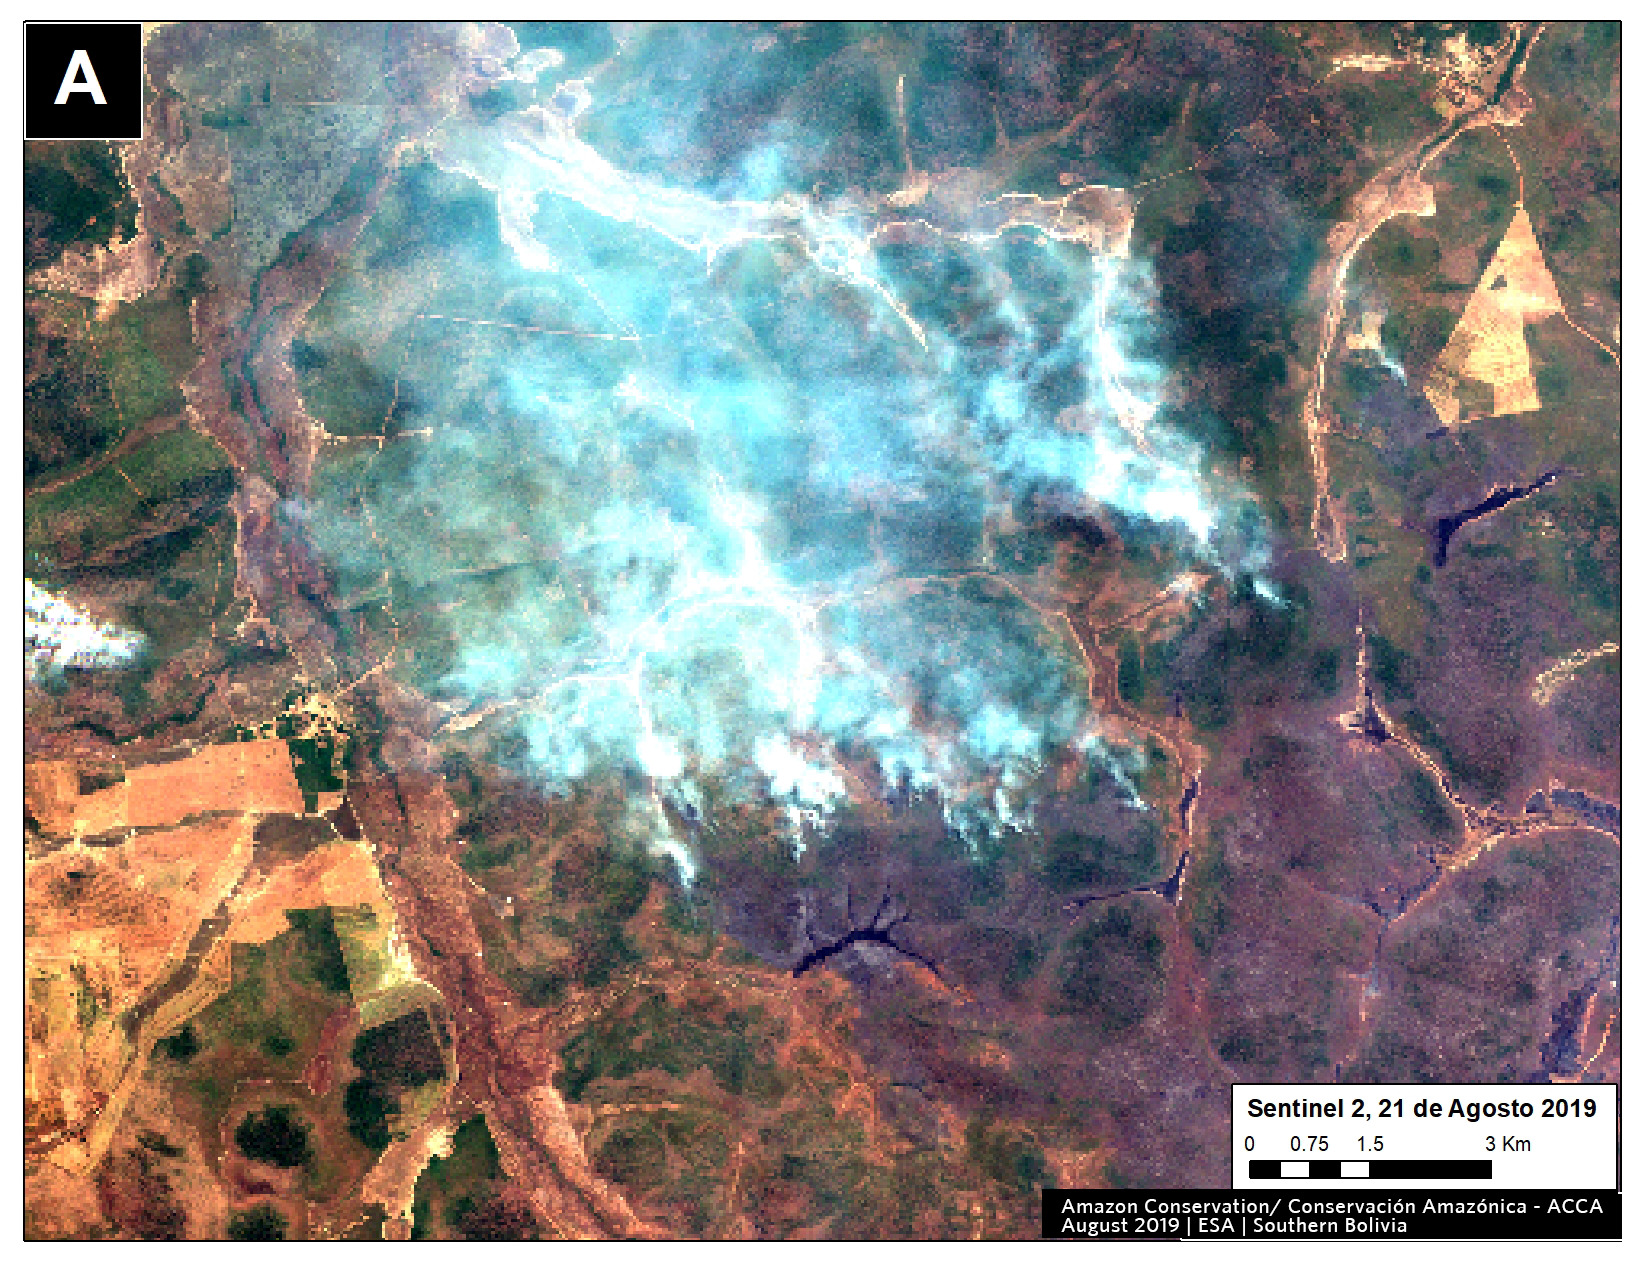
Fires are concentrated in the dry Chiquitano of southern Bolivia. It is part of the largest tropical dry forest in the world. The fires coincide with areas that have been part of cattle ranching expansion in recent decades (References 1 and 2), suggesting that poor burning practices could be the cause of the fires. Ranching using sown pastures has previously been referred to as a direct cause of forest loss in Bolivia (References 2 and 3). The Bolivian National Service of Meteorology and Hydrology (SENAMHI) issued high wind alerts in July and August for southern Bolivia, which could have led to the expansion of poorly managed fires. Also, August is usually the driest month of the year in this region. These conditions could explain the origin (poor fire practice) and expansion (little rain and strong winds) of the current fires.
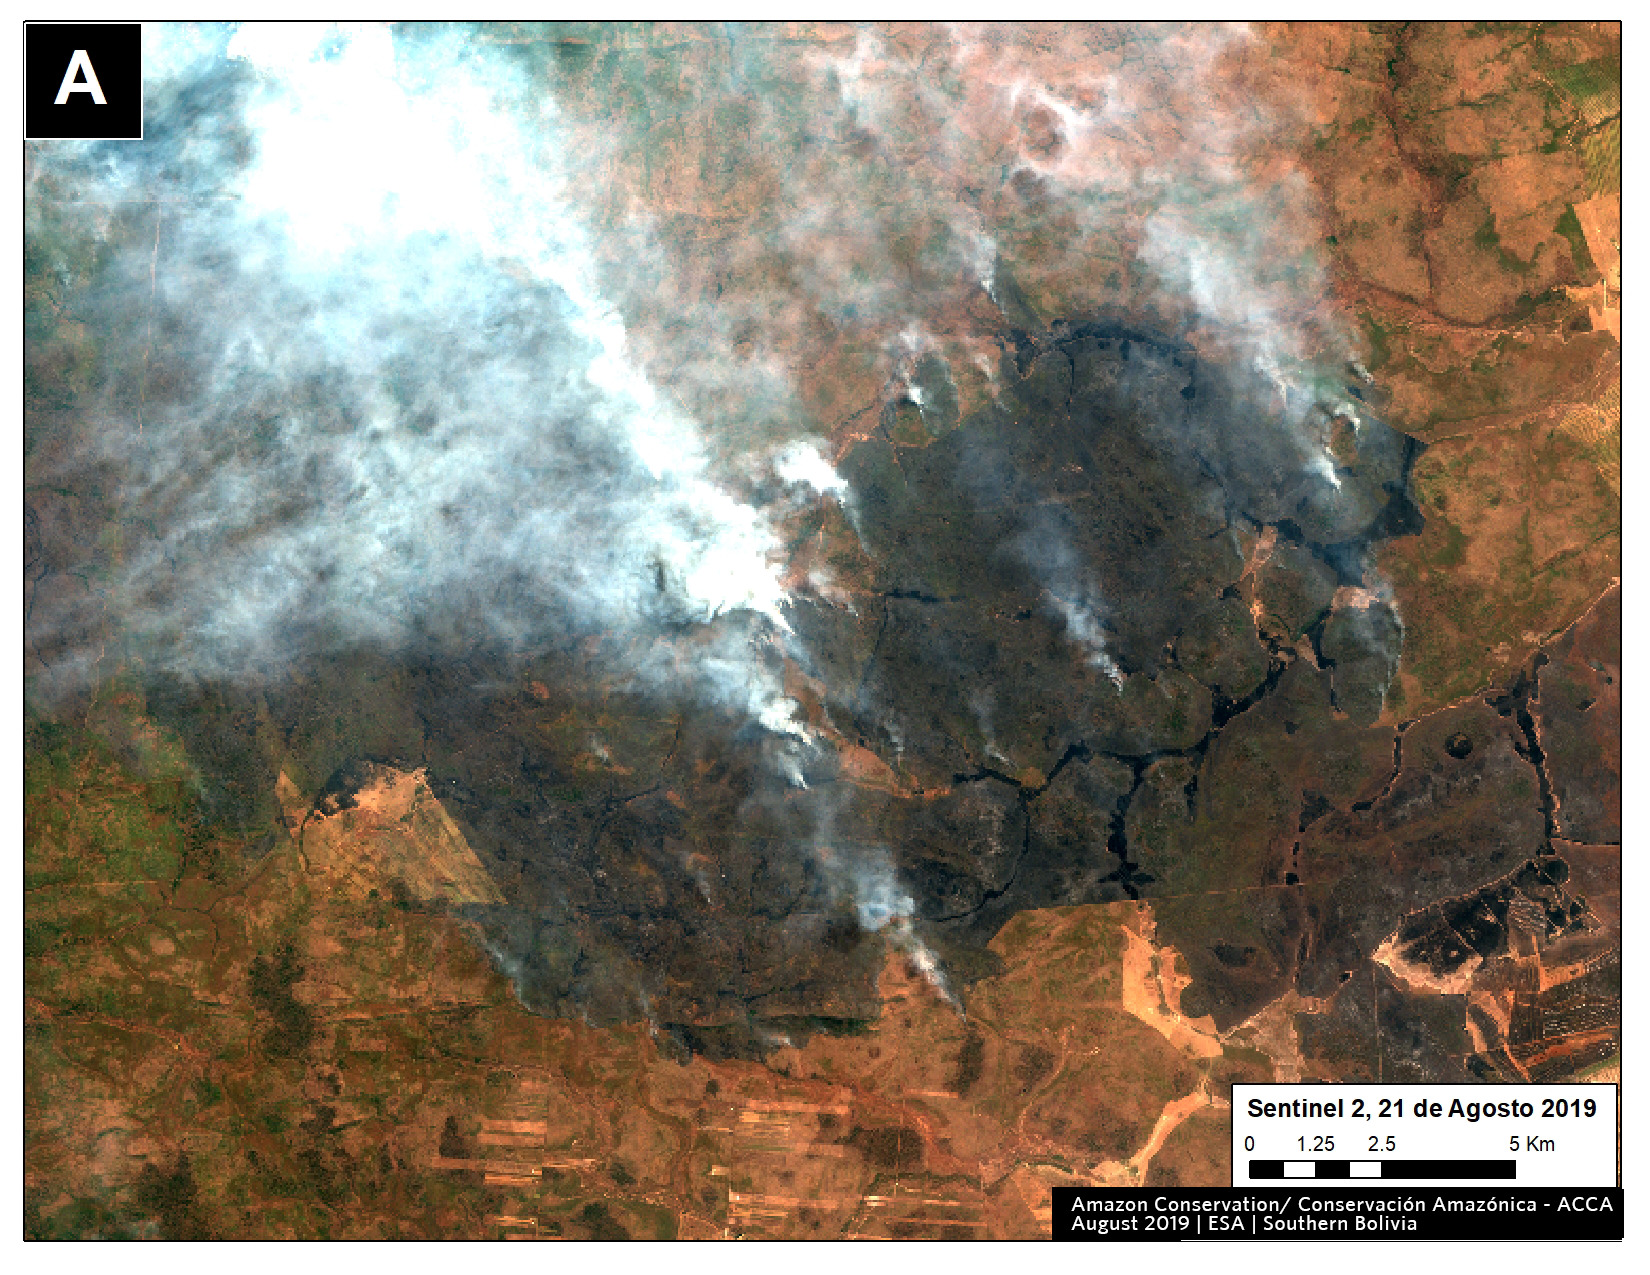
Zoom A1. Fire in southern Bolivian Amazon. Data: ESA
Zoom A2. Fire in southern Bolivian Amazon. Data: ESA
Zoom A3. Fire in southern Bolivian Amazon. Data: Planet

Zooms B, C, E, F, G: Western Brazilian Amazon

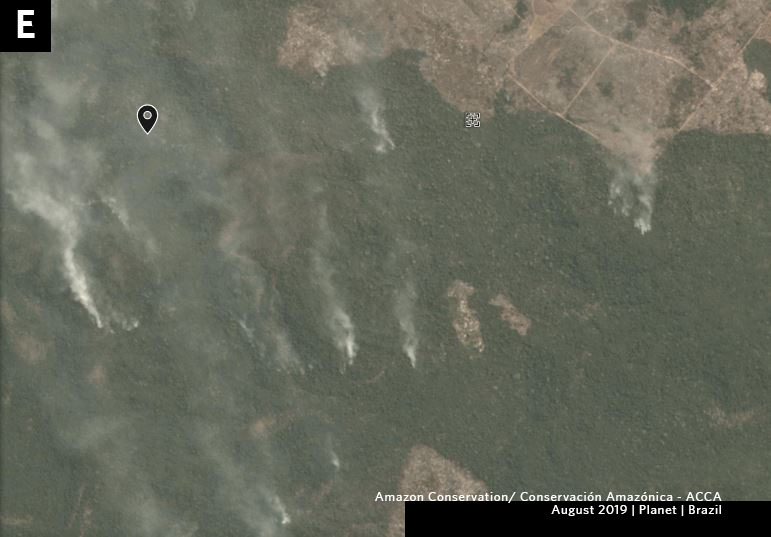
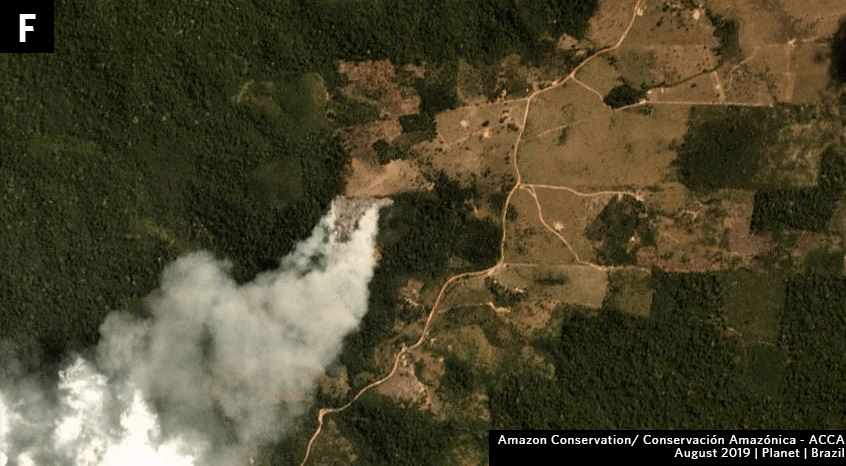
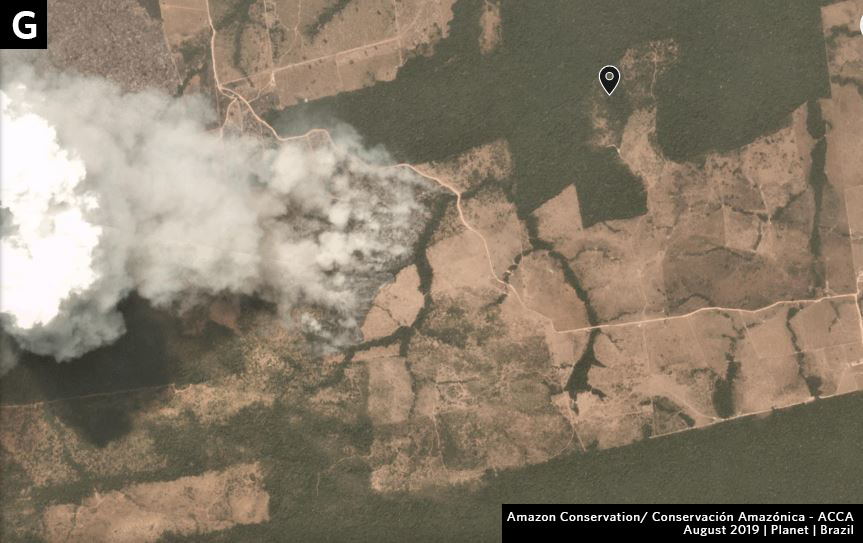
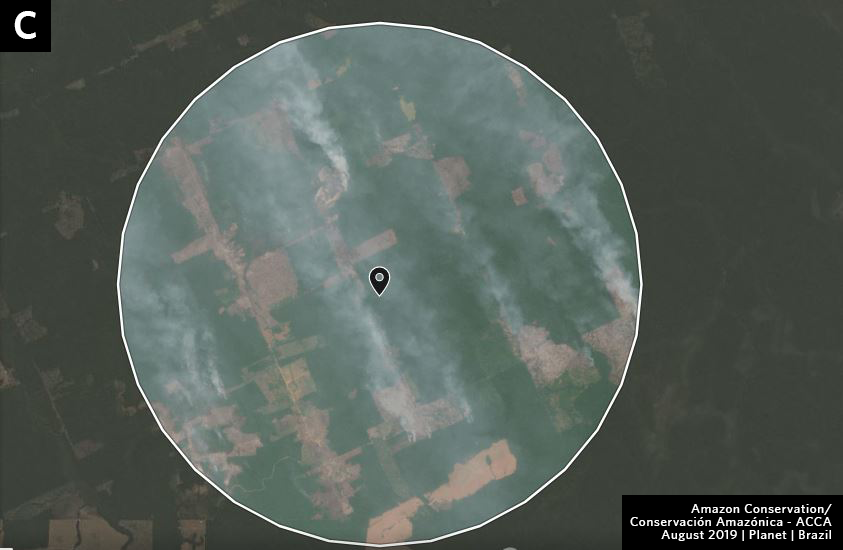
The major fires in western Brazil seem to be at the agriculture-forest boundary. Note that Zoom B shows fire in a protected area in Amazonas state; Zoom C seems to show fire escaping (or deliberately set) in the primary forests in Rondonia state; and Zooms F and G seems to show fire expanding plantation into forest in Amazonas and Mato Grosso states, respectively.
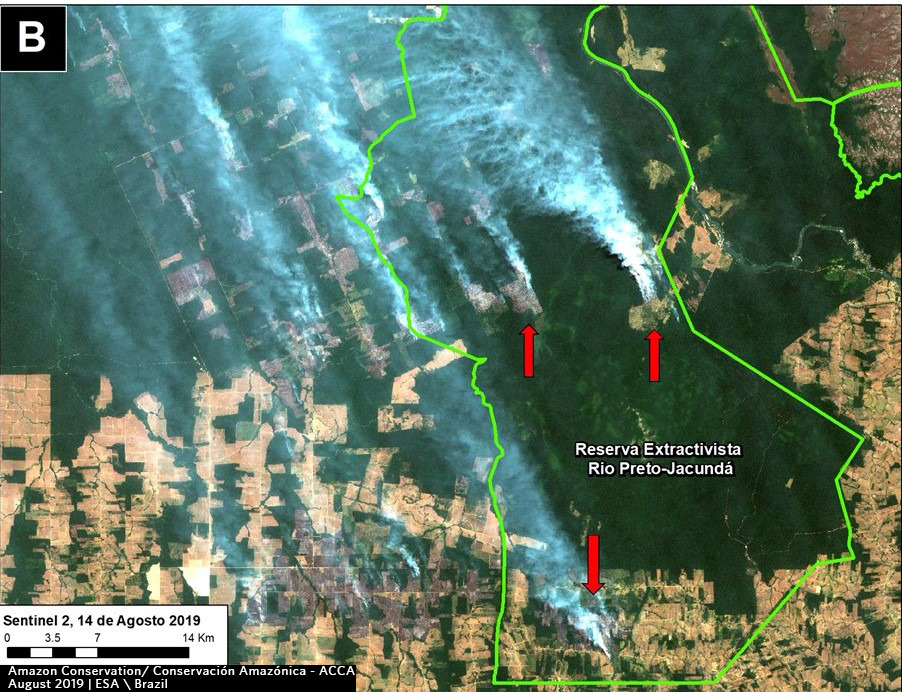
Zoom B. Fire in a protected area in Amazonas state. Data: ESA
Zoom C. Fires at agriculture-forest boundary in Rondonia state. Data: Sentinel.
Zoom E. Fire escaping (or deliberately set) in the primary forests in Rondonia state. Data: Planet
Zoom F. Fire that seems to be expanding plantation into forest in Amazonas state. Data: Planet.
Zoom G. Fire that seems to be expanding plantation into forest in Mato Grosso state. Data: Planet.
Bonus Zoom. Recent fire in Brazilan Amazon. Data: Planet.


Zoom D: Southern Peruvian Amazon

Fires burning forest near the town of Iberia, an area along the Interoceanic Highway that has become a deforestation hotspot in the region of Madre de Dios (see MAAP #28 and MAAP #47).
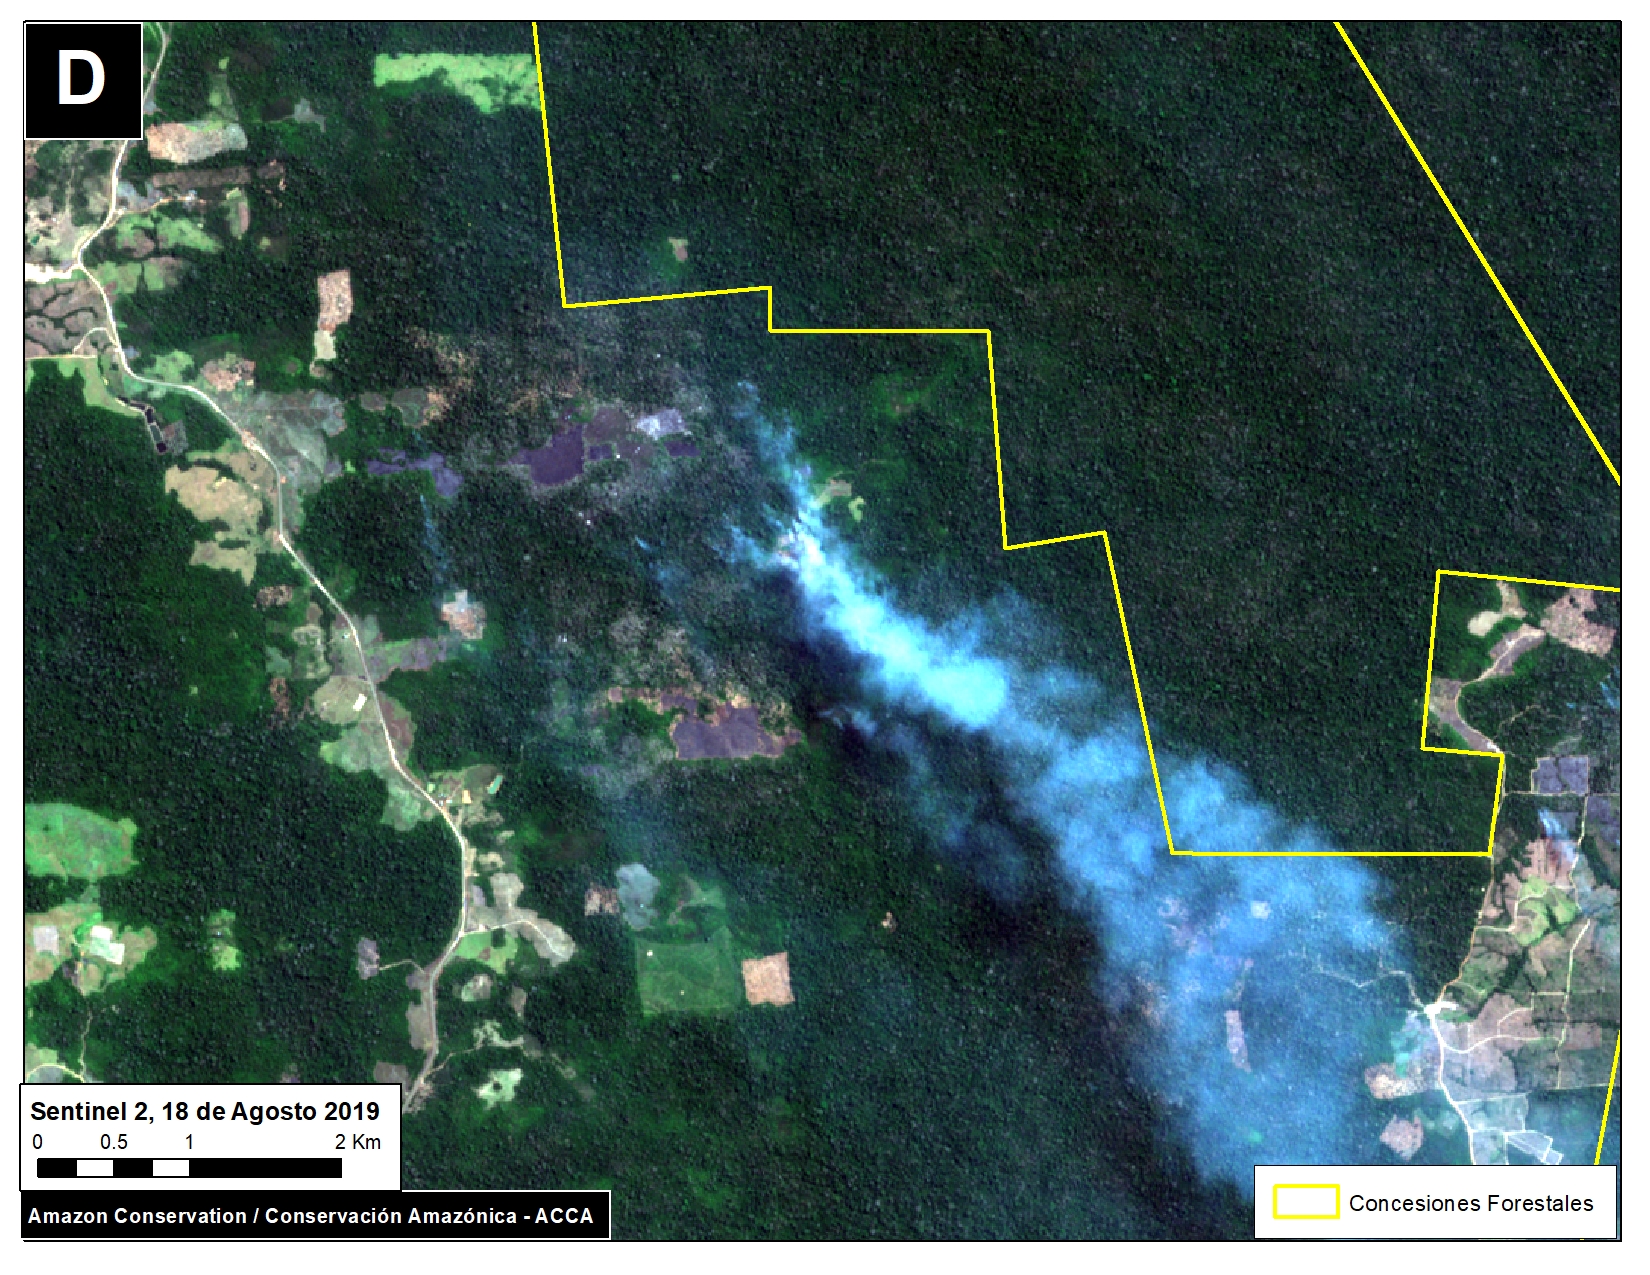
Zoom D. Fire in southern Peruvian Amazon (near Iberia, Madre de Dios). Data: ESA

Additonal References

We have these to be some of the most informative additional references:

New York Times, Aug 24

Global Forest Watch, Aug 23

Technical References

1 Müller, R., T. Pistorius, S. Rohde, G. Gerold & P. Pacheco. 2013. Policy options to reduce deforestation based on a systematic analysis of drivers and agents in lowland Bolivia. Land Use Policy 30(1): 895-907. http://dx.doi.org/10.1016/j. landusepol.2012.06.019

2 Muller, R., Larrea-Alcázar, D.M., Cuéllar, S., Espinoza, S. 2014.  Causas directas de la deforestación reciente (2000-2010) y modelado de dos escenarios futuros  en las tierras bajas de Bolivia. Ecología en Bolivia 49: 20-34.

3 Müller, R., P. Pacheco & J. C. Montero. 2014. El contexto de la deforestación y degradación de los bosques en Bolivia: Causas, actores e instituciones. Documentos Ocasionales CIFOR 100, Bogor. 89 p.

Acknowledgements

We thank  J. Beavers, D. Larrea, T. Souto, M. Silman, A. Condor, and G. Palacios for helpful comments to earlier versions of this report.

This work was supported by the following major funders: MacArthur Foundation, International Conservation Fund of Canada (ICFC), Metabolic Studio, and Global Forest Watch Small Grants Fund (WRI).

Citation

Novoa S, Finer M (2019) Seeing the Amazon Fires with Satellites. MAAP: 107.
MAAP #100: Western Amazon – Deforestation Hotspots 2018 (a regional perspective)

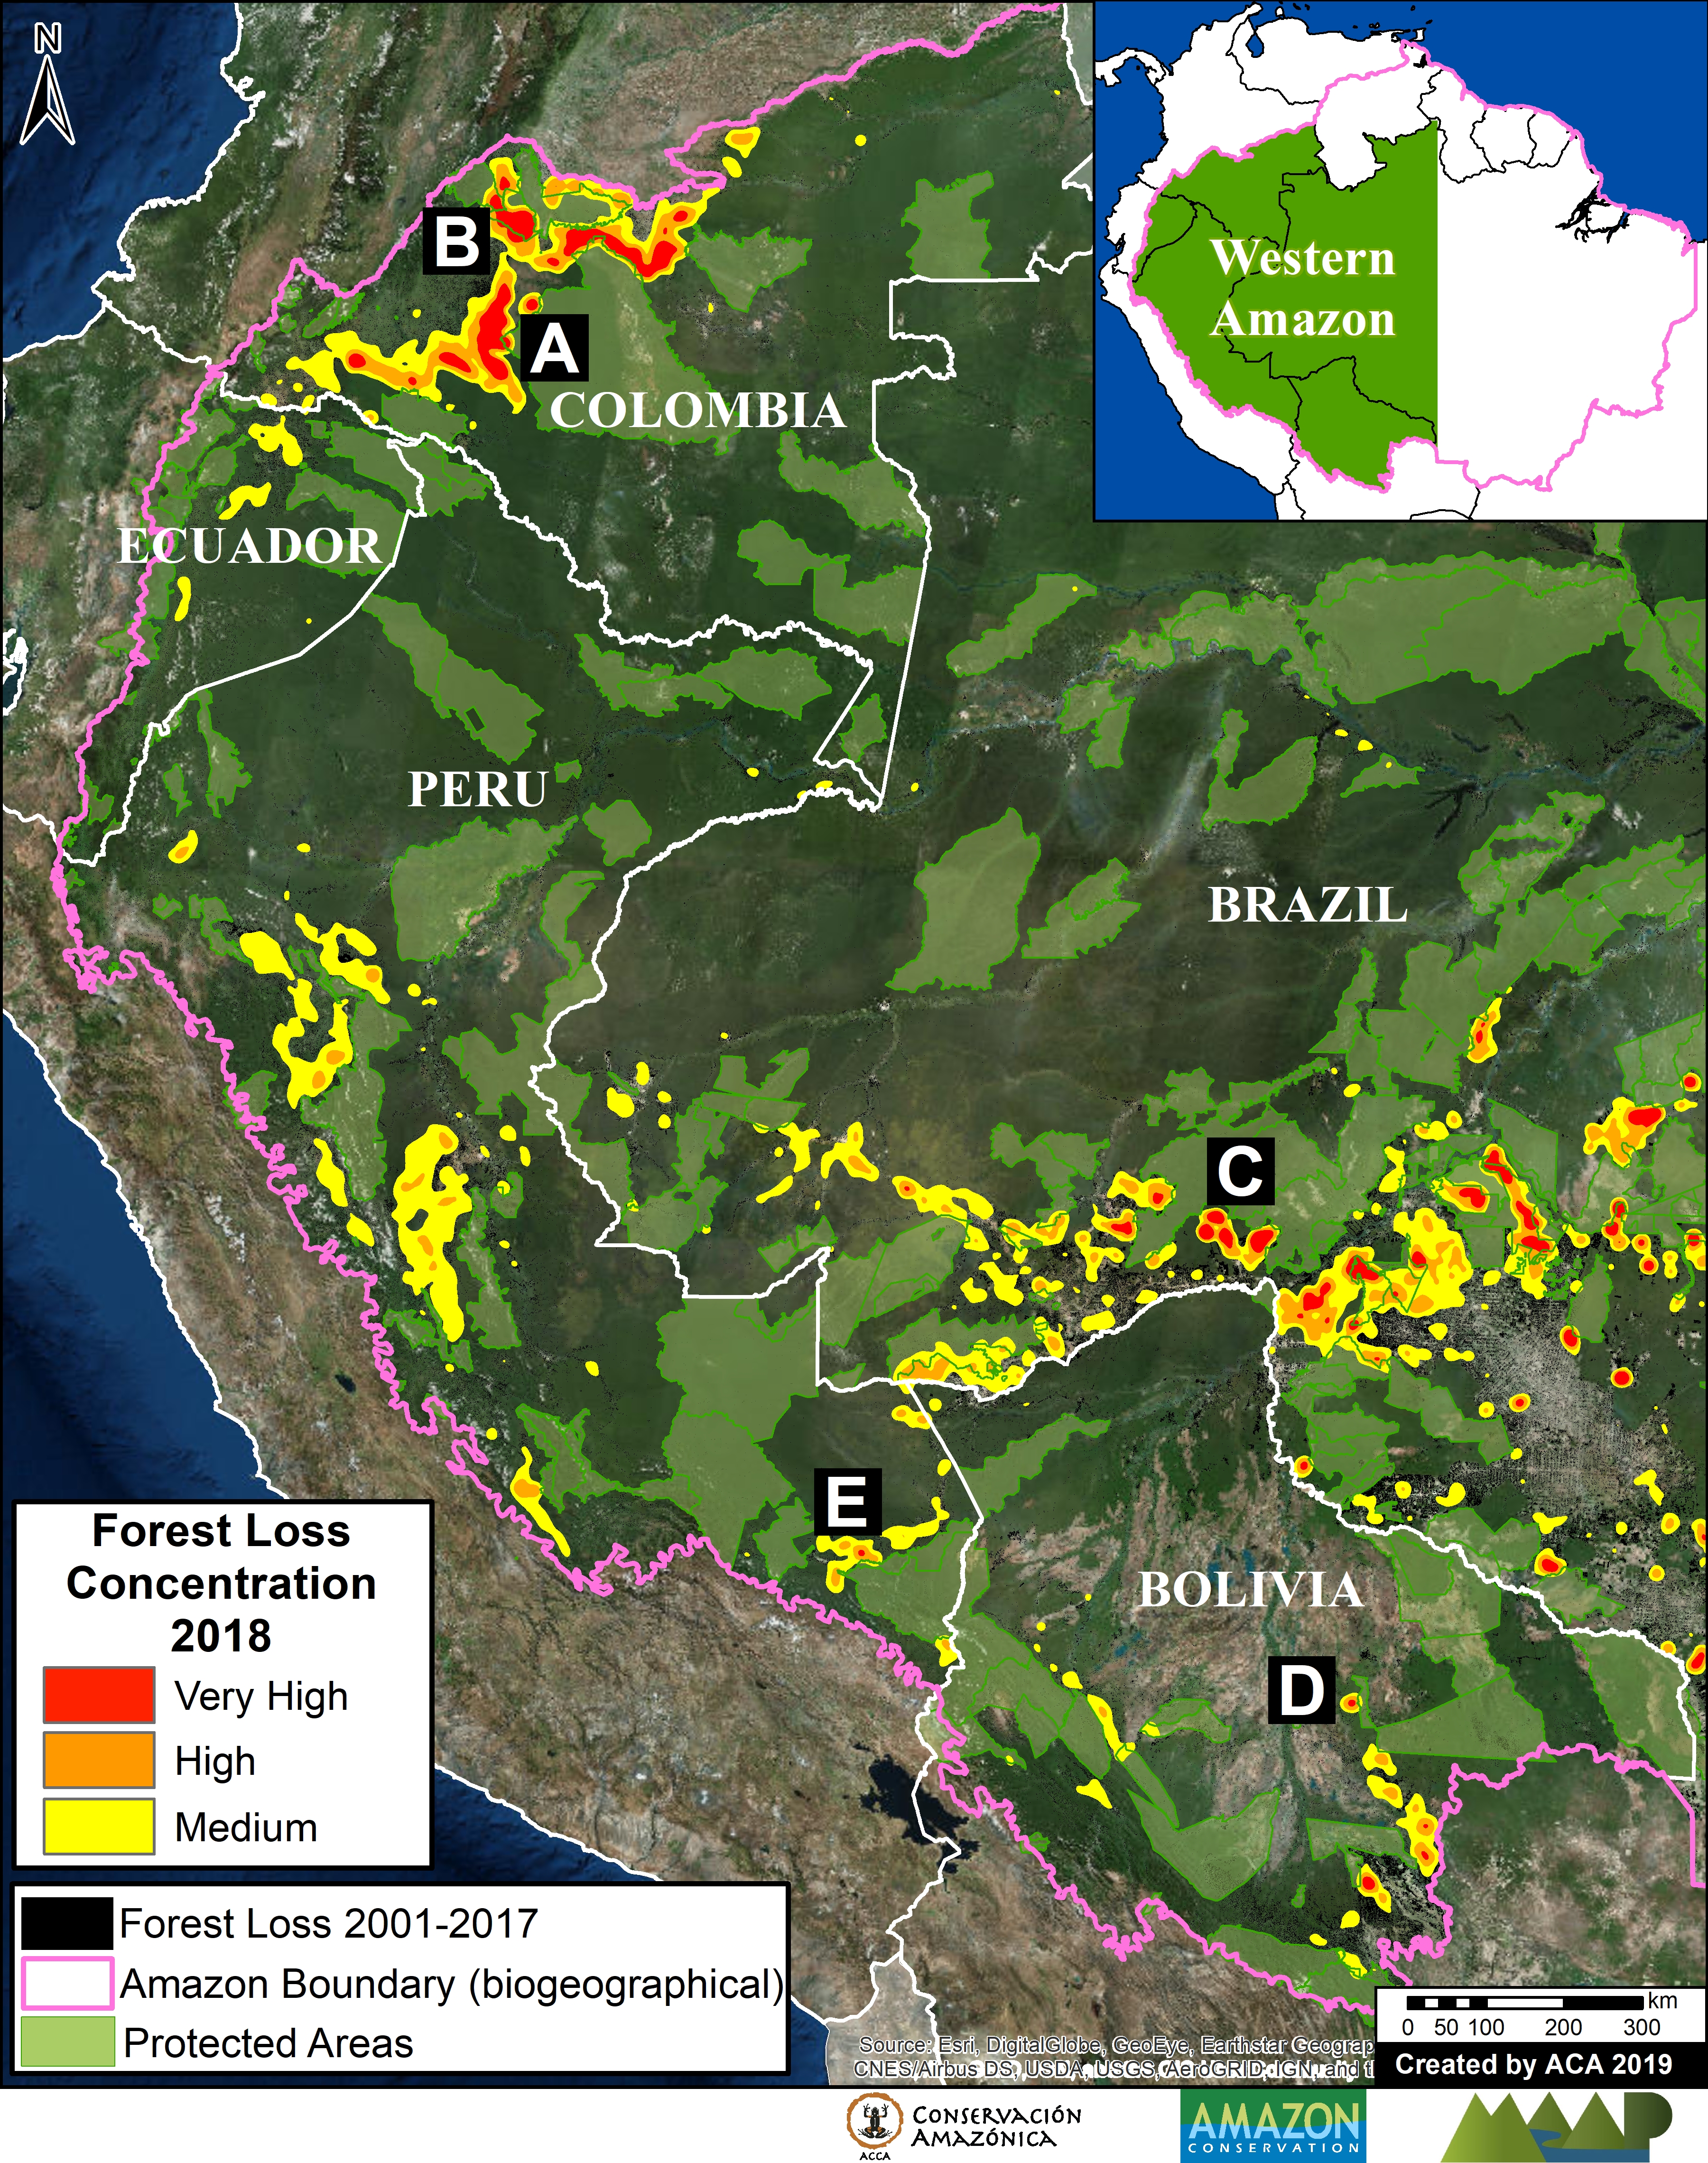
Base Map. Deforestation Hotspots in the western Amazon. Data: Hansen/UMD/Google/USGS/NASA, GFW, SERNANP, SNAP, SINAP, SERNAP, RAISG

For the 100th MAAP report, we present our first large-scale western Amazon analysis: Colombia, Peru, Ecuador, Bolivia, and western Brazil (see Base Map).

We use the new 2018 data for forest cover loss, generated by the  University of Maryland (Hansen et al 2013) and presented by Global Forest Watch.

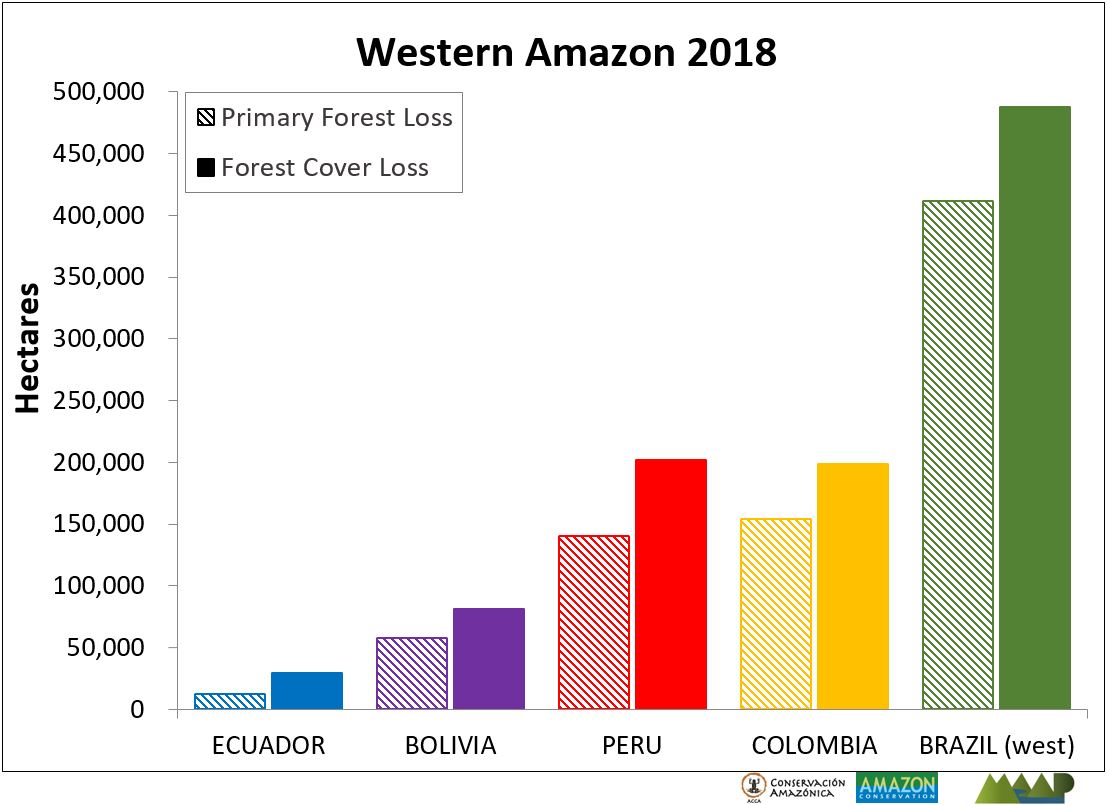
These data indicate 2.5 million acres of forest cover loss in the western Amazon in 2018.*

We conducted an additional analysis that indicates, of this total, 1.9 million acres were primary forest.*

To identify deforestation hotspots consistently across this vast landscape, we conducted a kernel density analysis (see Methodology).

The Base Map shows the hotspots in yellow, orange and red, indicating areas with medium, high, and very high forest loss concentrations, respectively.

Next, we focus on five zones of interest (Zooms A-E) in Colombia, Brazil, Bolivia, and Peru. For all images, please click to enlarge.

*Forest Cover Loss: 5 acres per minute. Almost half (49%) occurred in Brazil, followed by Peru (20%), Colombia (20%), Bolivia (8%), and Ecuador (3%). see Annex.

**Primary Forest Loss: 3.5 acres per minute. Over half (53%) occurred in Brazil, followed by Peru (20%), Colombia (18%), Bolivia (7%), and Ecuador (2%). see Annex.

Colombia

The largest concentration of 2018 forest loss is in the northeast Colombian Amazon (494,000 acres). Out of this total, 11% (56,800 acres) occurred in national parks. National experts indicate that land grabbing has emerged as a leading direct driver of deforestation (Arenas 2018). See MAAP #97 for more information.

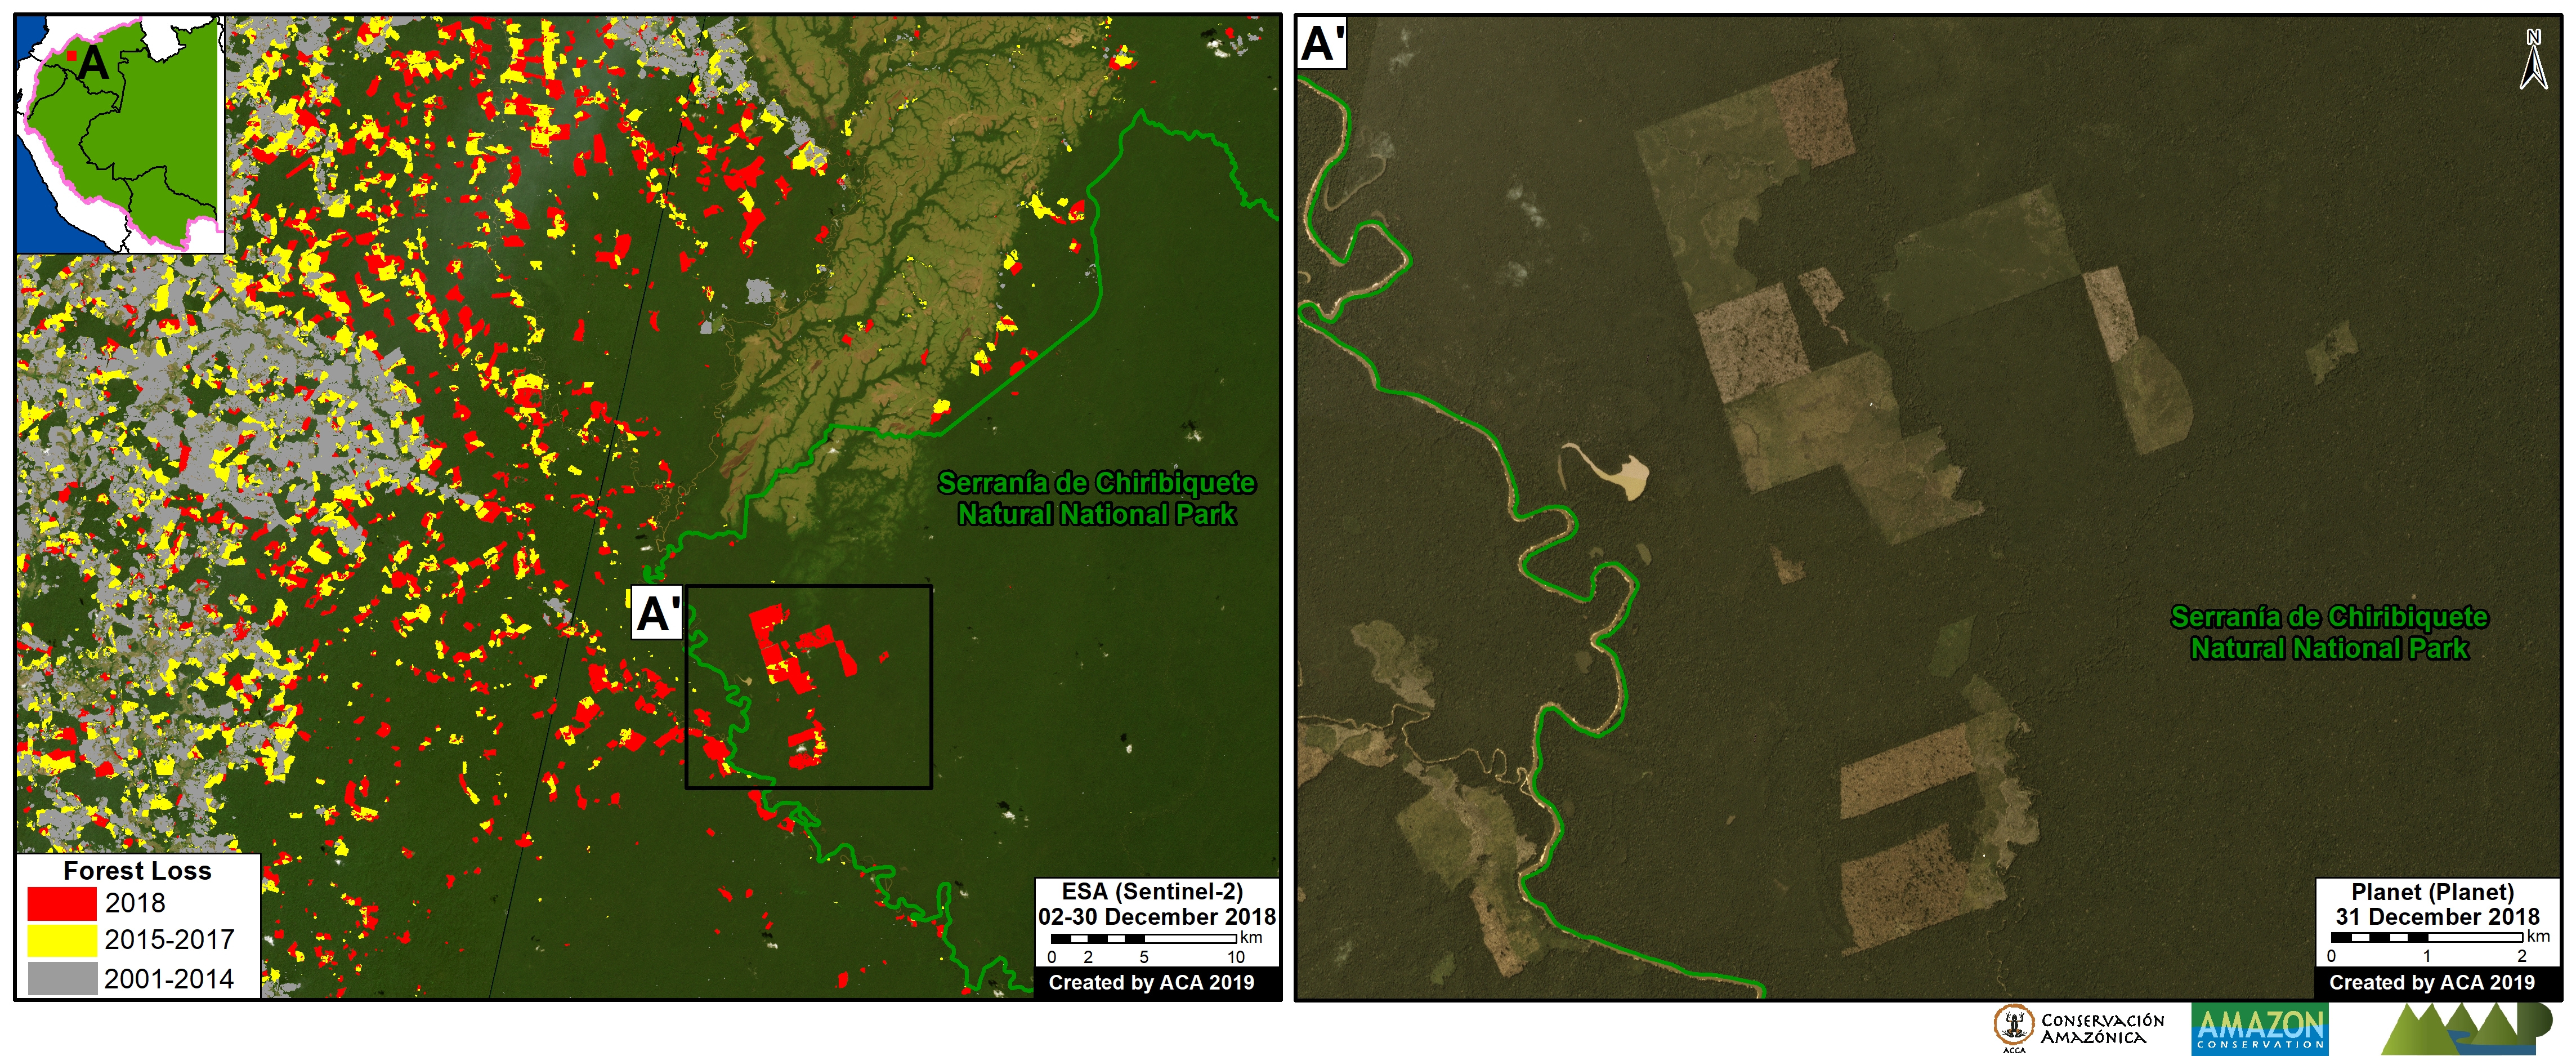
Zoom A shows the forest loss expanding towards western Chiribiquete National Park, including distinct deforestation in this protected area during 2018.

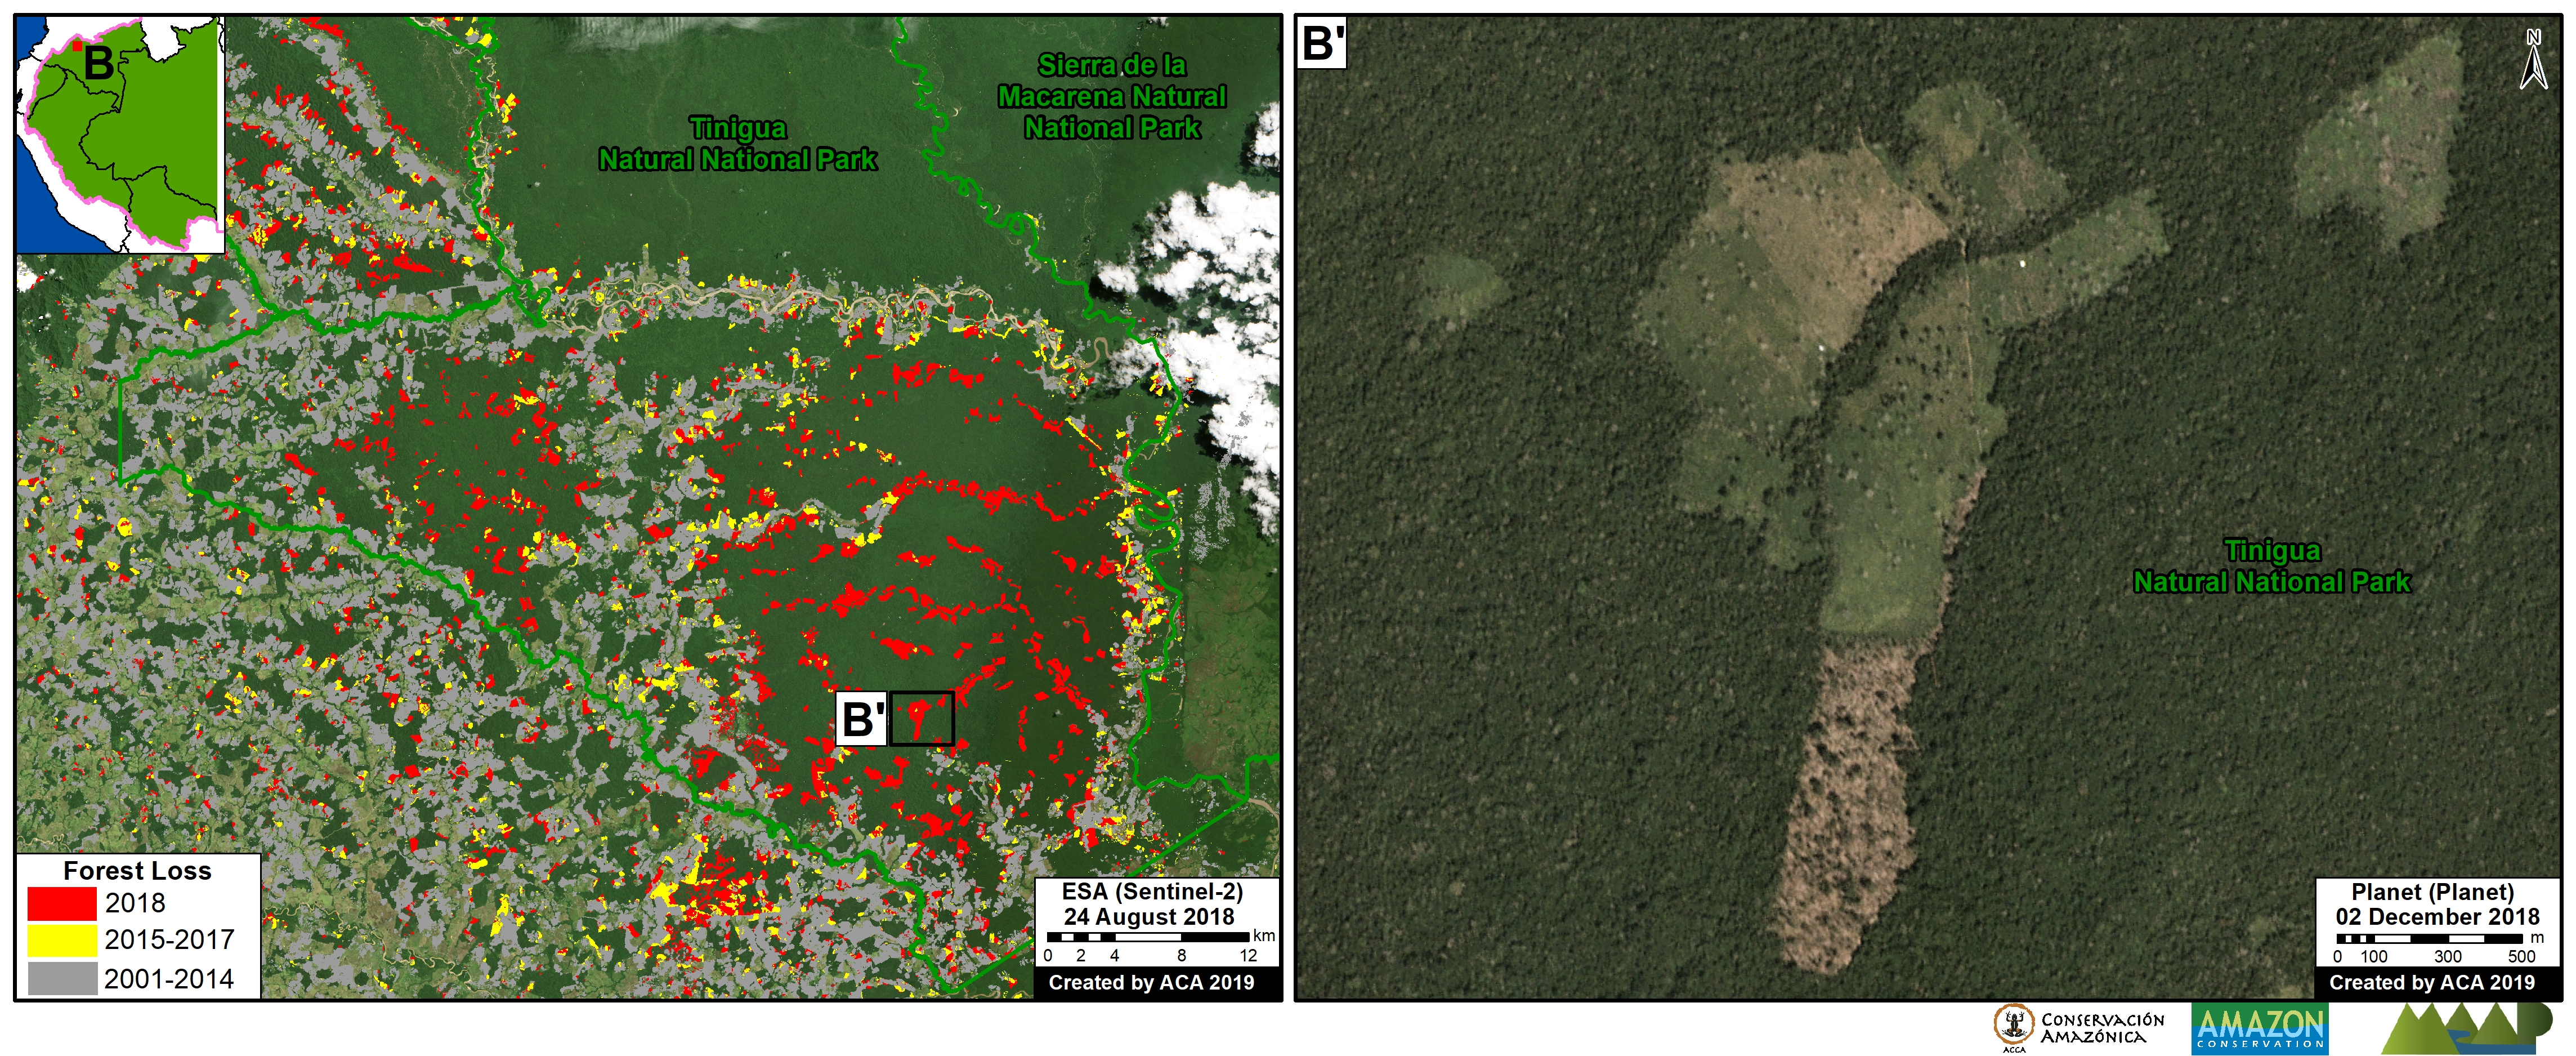
Zoom B shows the extensive 2018 deforestation (30,000 acres) within Tinigua National Park. A recent news report indicates that cattle ranching is one of the factors related to this deforestation.

Zoom A. Colombia-Chiribiquete. Data: Hansen/UMD/Google/USGS/NASA, SINAP, Planet, ESA
Zoom B. Colombia – Tinigua. Data: Hansen/UMD/Google/USGS/NASA, SINAP, Planet, ESA

Brazil (border with Bolivia)

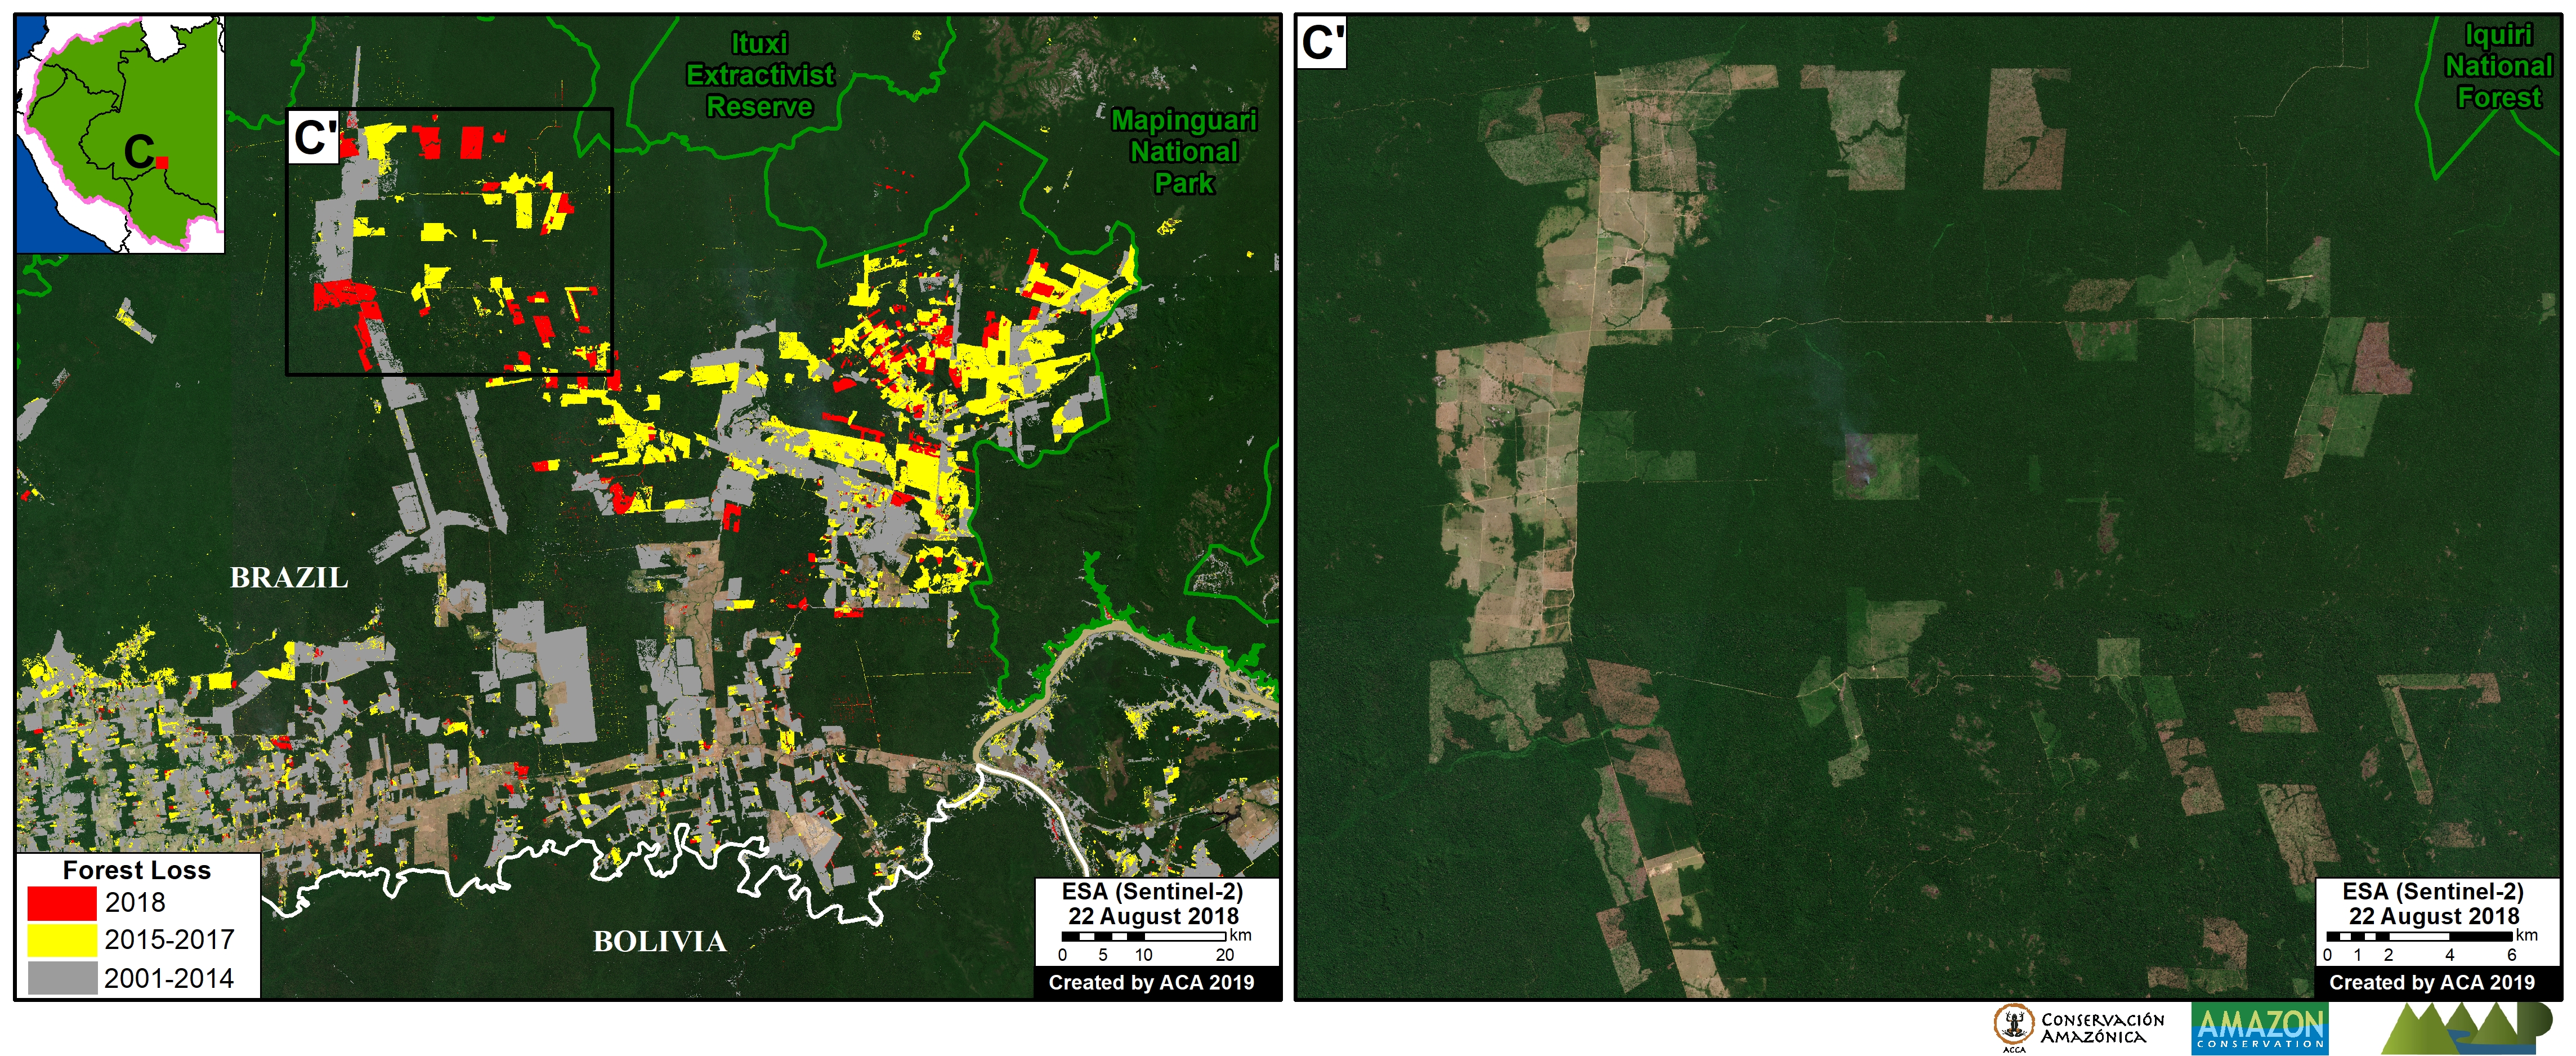
Another important result is the contrast between northern Bolivia (Pando department) and adjacent side Brazil (states of Acre, Amazonas, and Rondônia). Zoom C shows several deforestation hotspots on the Brazilian side, while the Bolivian side is much more intact.

Zoom C. Brazil, Bolivia border. Data: Hansen/UMD/Google/USGS/NASA, ESA, RAISG

Bolivia

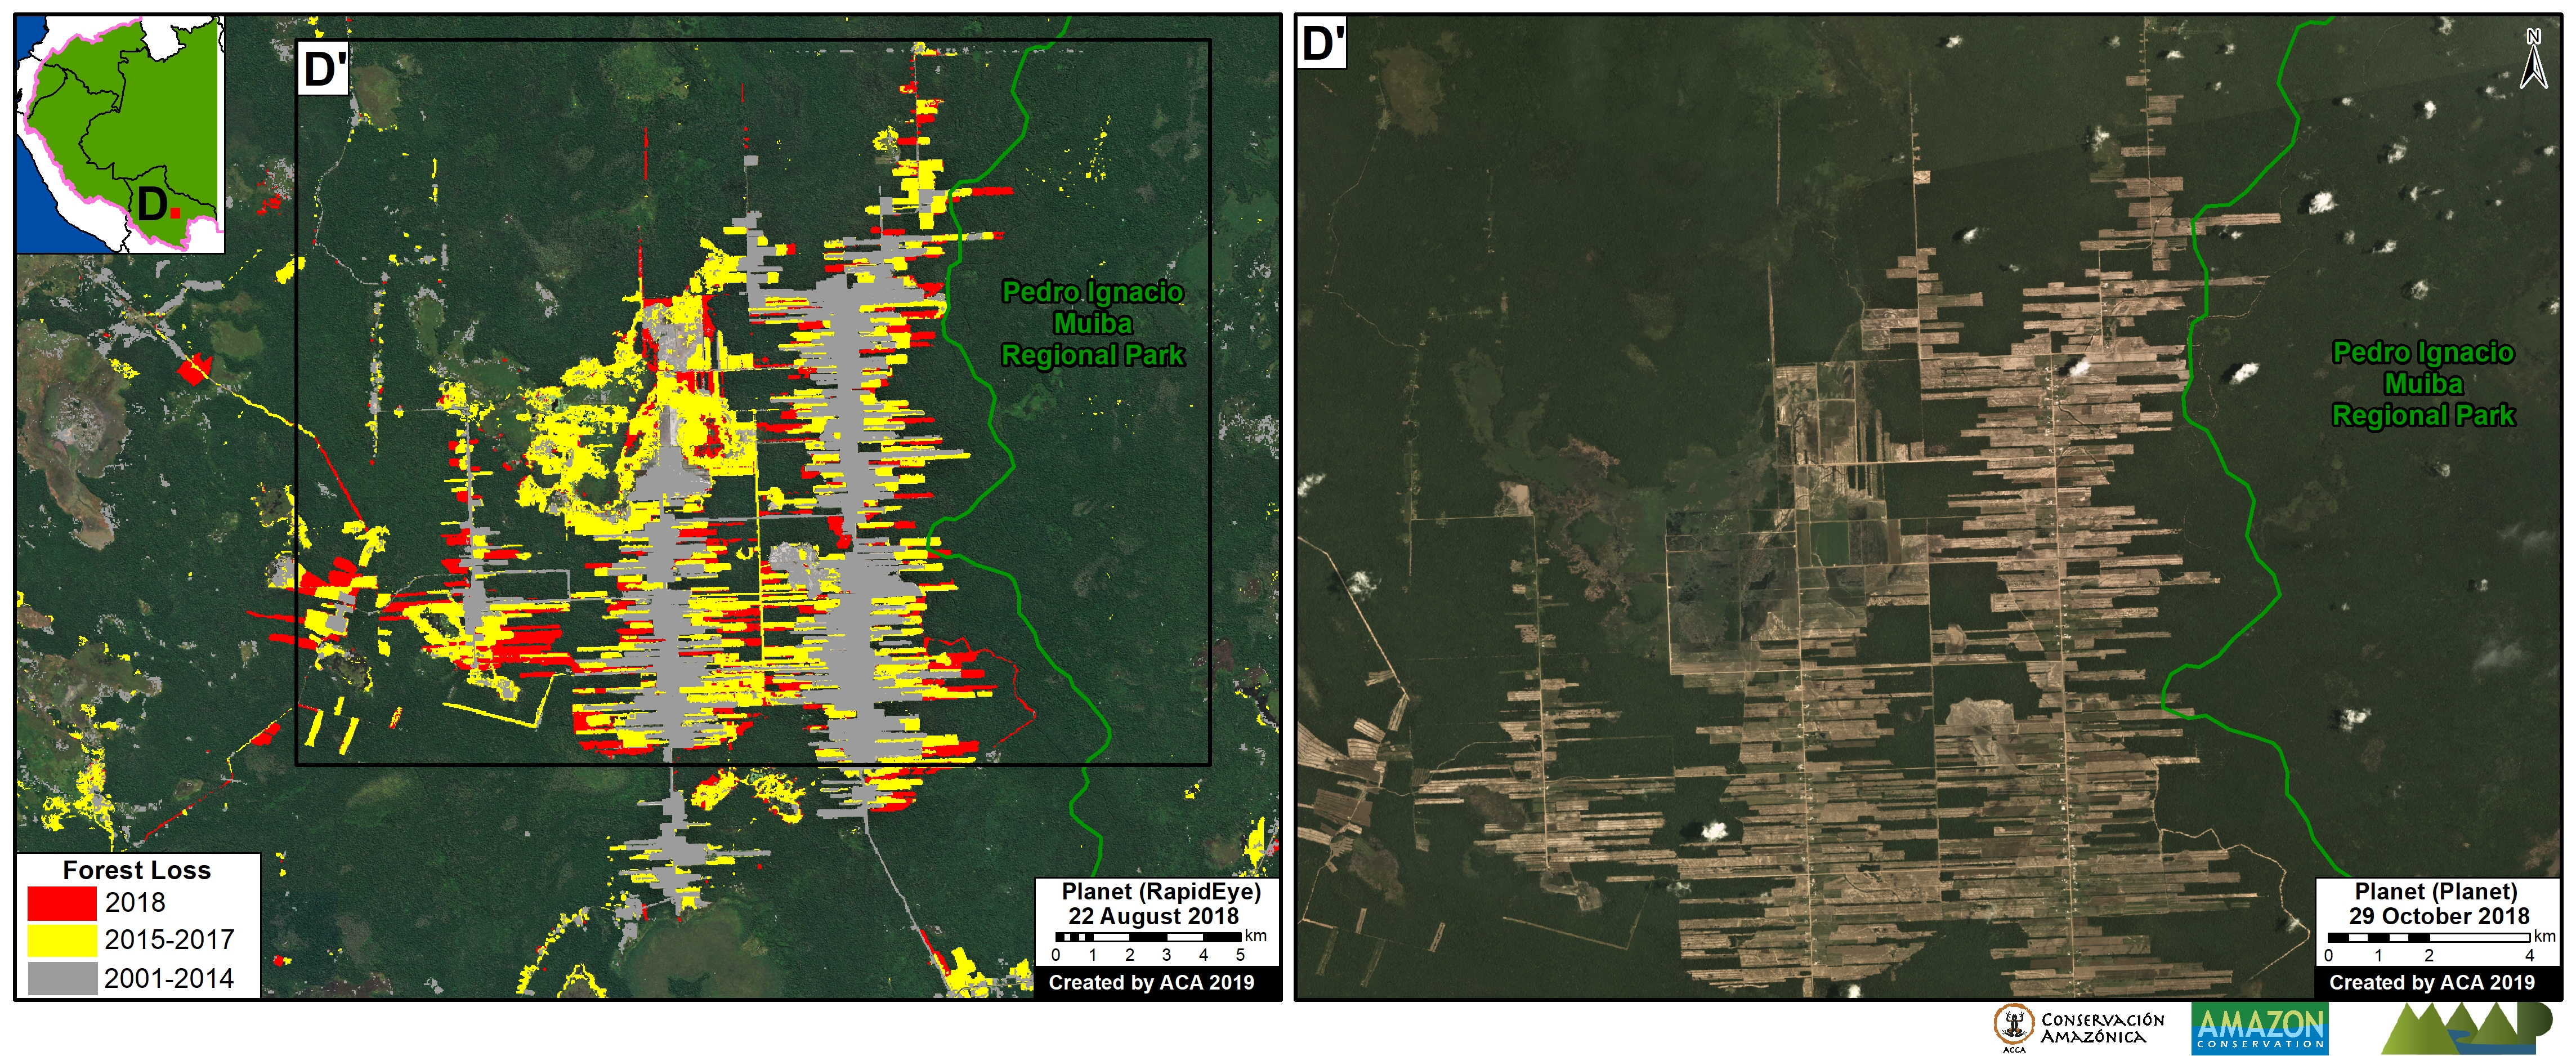
In Bolivia, the major forest loss hotspots are further south. Zoom D shows the recent deforestation (5,000 acres in 2018) due to agricultural activity associated with one of the first major Mennonite settlements in Beni department (Kopp 2015). The other Mennonite settlements are located further south.

Zoom D. Bolivia, Black River Mennonite settlement. Data: Hansen/UMD/Google/USGS/NASA, SERNAP, Planet

Peru

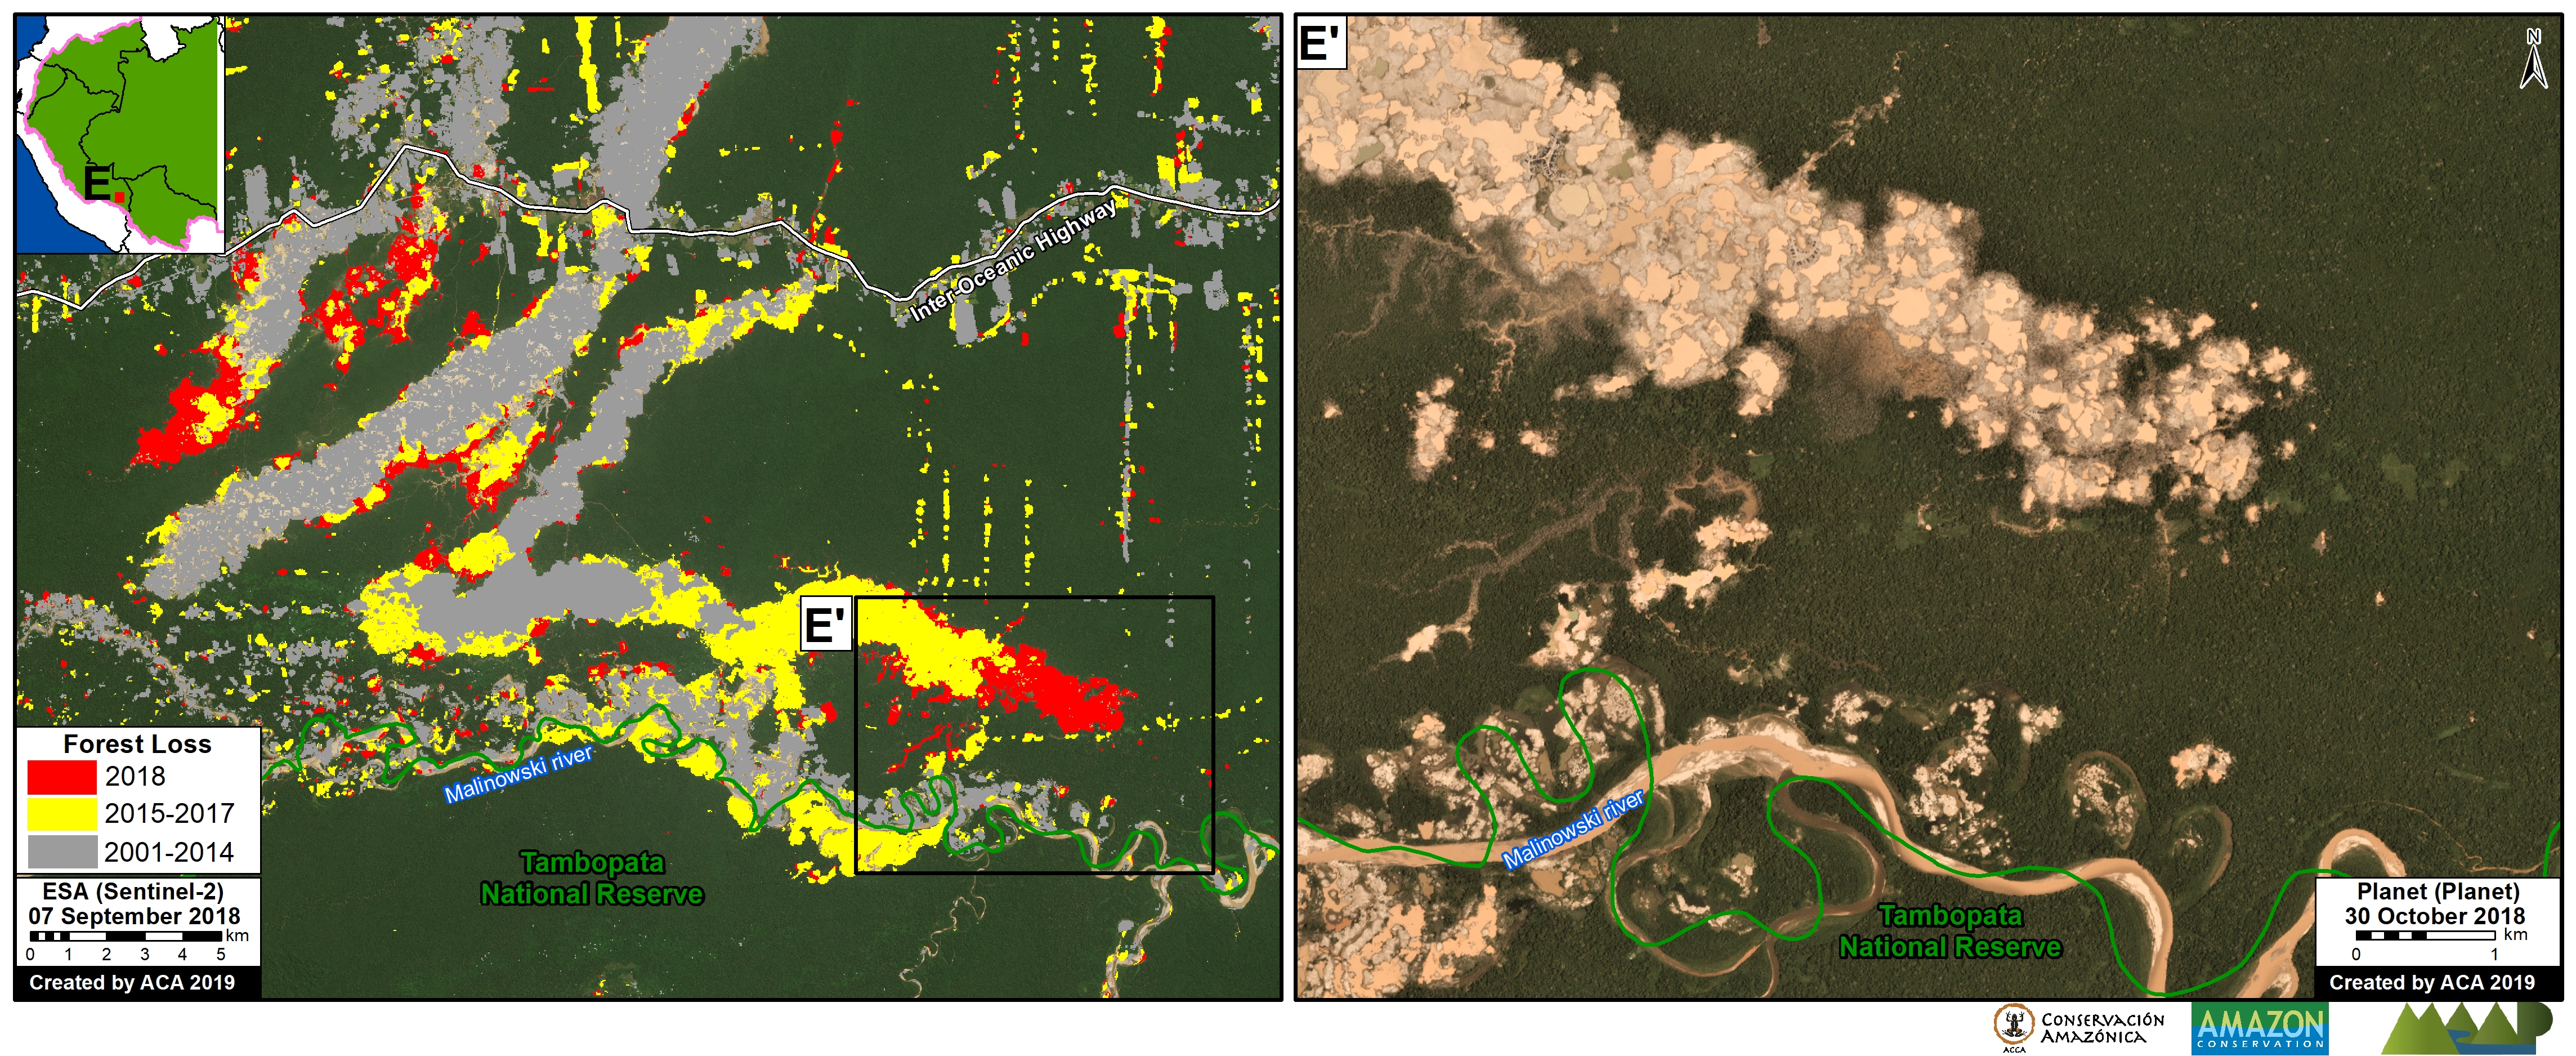
The Hansen data indicates over 200,000 acres of forest loss during 2018 in the Peruvian Amazon. One of the most important deforestation drivers, especially in southern Peru, is gold mining. We estimate 23,000 acres of gold mining deforestation during 2018 in the southern Peruvian Amazon (see MAAP #96).

Zoom E shows the most emblematic case of gold mining deforestation: the area known as La Pampa.

It is important to emphasize, however, that in February 2019 the Peruvian government launched “Operation Mercury 2019” (Operación Mercurio 2019), a multi-sectoral and comprehensive mega-operation aimed at eradicating illegal mining and associated crime in La Pampa, as well as promote development in the region.

Zoom D. Peru – La Pampa. Data: Hansen/UMD/Google/USGS/NASA, SERNAP, Planet

Annex

Annex. Forest cover and primary forest loss in the western Amazon.  Data: Hansen/UMD/Google/USGS/NASA, Global Forest Watch.

Methods

The 2018 forest loss data presented in this report were generated by the Global Land Analysis and Discovery (GLAD) laboratory at the University of Maryland (Hansen et al 2013) and presented by Global Forest Watch. Our study area is strictly what is presented in the Base Map: the areas within the Amazonian biogeographic boundary of the western Amazon.

Specifically, for our estimate of forest cover loss, we multiplied the annual “forest cover loss” data by the density percentage of the “tree cover” from the year 2000 (values >30%).

For our estimate of primary forest loss, we intersected the forest cover loss data with the additional dataset “primary humid tropical forests” as of 2001 (Turubanova et al 2018). For more details on this part of the methodology, see the Technical Blog from Global Forest Watch (Goldman and Weisse 2019).

All data were processed under the geographical coordinate system WGS 1984. To calculate the areas in metric units the UTM (Universal Transversal Mercator) projection was used: Peru and Ecuador 18 South, Colombia 18 North, Western Brazil 19 South and Bolivia 20 South.

Lastly, to identify the deforestation hotspots, we conducted a kernel density estimate. This type of analysis calculates the magnitude per unit area of a particular phenomenon, in this case forest cover loss. We conducted this analysis using the Kernel Density tool from Spatial Analyst Tool Box of ArcGIS. We used the following parameters:

Search Radius: 15000 layer units (meters)
Kernel Density Function: Quartic kernel function
Cell Size in the map: 200 x 200 meters (4 hectares)
Everything else was left to the default setting.

For the Base Map, we used the following concentration percentages: Medium: 10%-20%; High: 21%-35%; Very High: >35%.

References

Arenas M (2018) Acaparamiento de tierras: la herencia que recibe el nuevo gobierno de Colombia. Mongabay, 2 AGOSTO 2018. https://es.mongabay.com/2018/08/acaparamiento-de-tierras-colombia-estrategias-gobierno/

Goldman L, Weisse M (2019) Technical Blog: Global Forest Watch’s 2018 Data Update Explained. https://blog.globalforestwatch.org/data-and-research/blog-tecnico-explicacion-de-la-actualizacion-de-datos-de-2018-de-global-forest-watch

Hansen, M. C., P. V. Potapov, R. Moore, M. Hancher, S. A. Turubanova, A. Tyukavina, D. Thau, S. V. Stehman, S. J. Goetz, T. R. Loveland, A. Kommareddy, A. Egorov, L. Chini, C. O. Justice, and J. R. G. Townshend. 2013. “High-Resolution Global Maps of 21st-Century Forest Cover Change.” Science 342 (15 November): 850–53. Data available on-line from: http://earthenginepartners.appspot.com/science-2013-global-forest.

Kopp Ad (2015) Las colonias menonitas en Bolivia. Tierra. http://www.ftierra.org/index.php/publicacion/libro/147-las-colonias-menonitas-en-bolivia

Planet Team (2017). Planet Application Program Interface: In Space for Life on Earth. San Francisco, CA. https://api.planet.com

Turubanova S., Potapov P., Tyukavina, A., and Hansen M. (2018) Ongoing primary forest loss in Brazil, Democratic Republic of the Congo, and Indonesia. Environmental Research Letters  https://doi.org/10.1088/1748-9326/aacd1c 

Acknowledgements

We thank M. Terán (ACEAA), M. Weisse (GFW/WRI), A. Thieme (UMD), R. Catpo (ACCA) and A. Cóndor (ACCA) for helpful comments to this report.

Citation

Finer M, Mamani N (2019) Western Amazon – Deforestation Hotspots 2018 (a regional perspective). MAAP: 100.