In a recent report (MAAP #199), we presented the updated version of NASA’s GEDI data,1 which uses lasers aboard the International Space Station to provide cutting-edge estimates of aboveground carbon globally, including our focal area, the Amazon.
These lasers, however, have not yet achieved full coverage, leaving considerable gaps in the data and resulting maps.
Here, we feature two new tools that allow us to fill in these gaps and provide detailed wall-to-wall estimates of aboveground biomass for specific areas, which can then be converted to aboveground carbon estimates.
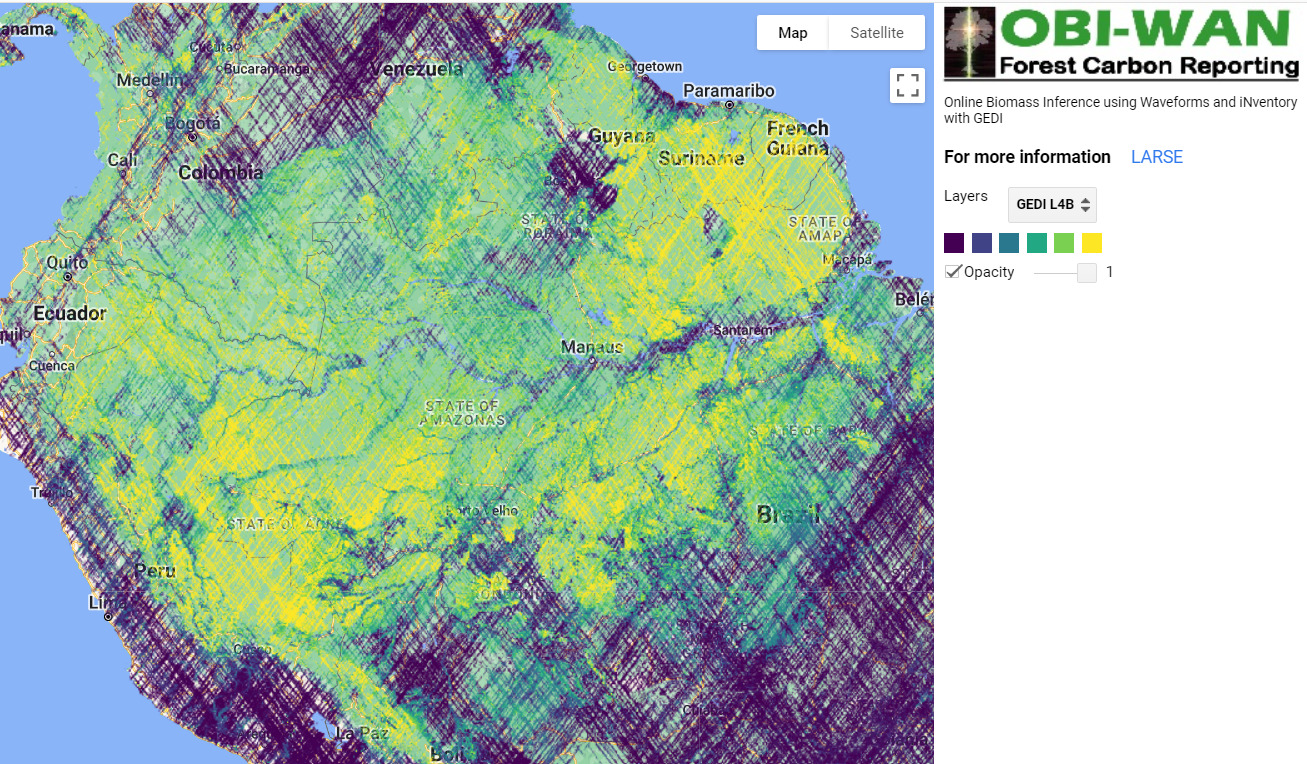
The first is the OBI-WAN forest carbon reporting app (see Intro Image), which uses statistical inference to produce mean, total, and uncertainty estimates for biomass baselines at any given scale (from local to worldwide).2
The second is a fused product from GEDI and TanDEM-X missions.3 The combination of lidar (GEDI) and radar (TanDEM-X) has started to produce unmatched maps that combine the ability of lidar to retrieve forest structure and the ability of radar to offer wall-to-wall coverage at multiple resolutions (see Figures 1-5 below for examples at 25m resolution).
Employing these two tools, we focus on estimating aboveground carbon for select examples of two critical land designations in the Amazon: protected areas and indigenous territories. Both are critical to the long-term conservation of the core Amazon (MAAP #183). We hope that providing precise carbon data will provide additional incentives for their long-term conservation.
We select 5 focal areas (3 National Parks and 2 Indigenous Territories; see list below) across the Amazon to demonstrate the power of these datasets. Together, these five areas are currently home to over 1.4 billion metric tons of aboveground carbon.
- Protected Areas (National Parks)
Chirbiquete National Park (Colombian Amazon)
Manu National Park (Peruvian Amazon)
Madidi National Park (Bolivian Amazon)
k - Indigenous Territories
Kayapó Indigenous Territory (Brazilian Amazon)
Barranco Chico Indigenous Territory (Peruvian Amazon)
Focal Areas
As noted above, the aboveground carbon estimates below are based on the aboveground biomass estimates from the OBI-WAN forest carbon reporting app and GEDI-TanDEM-X data. Figures 1 – 5 are based on GEDI-TanDEM-X, at 25 meter resolution.
National Parks
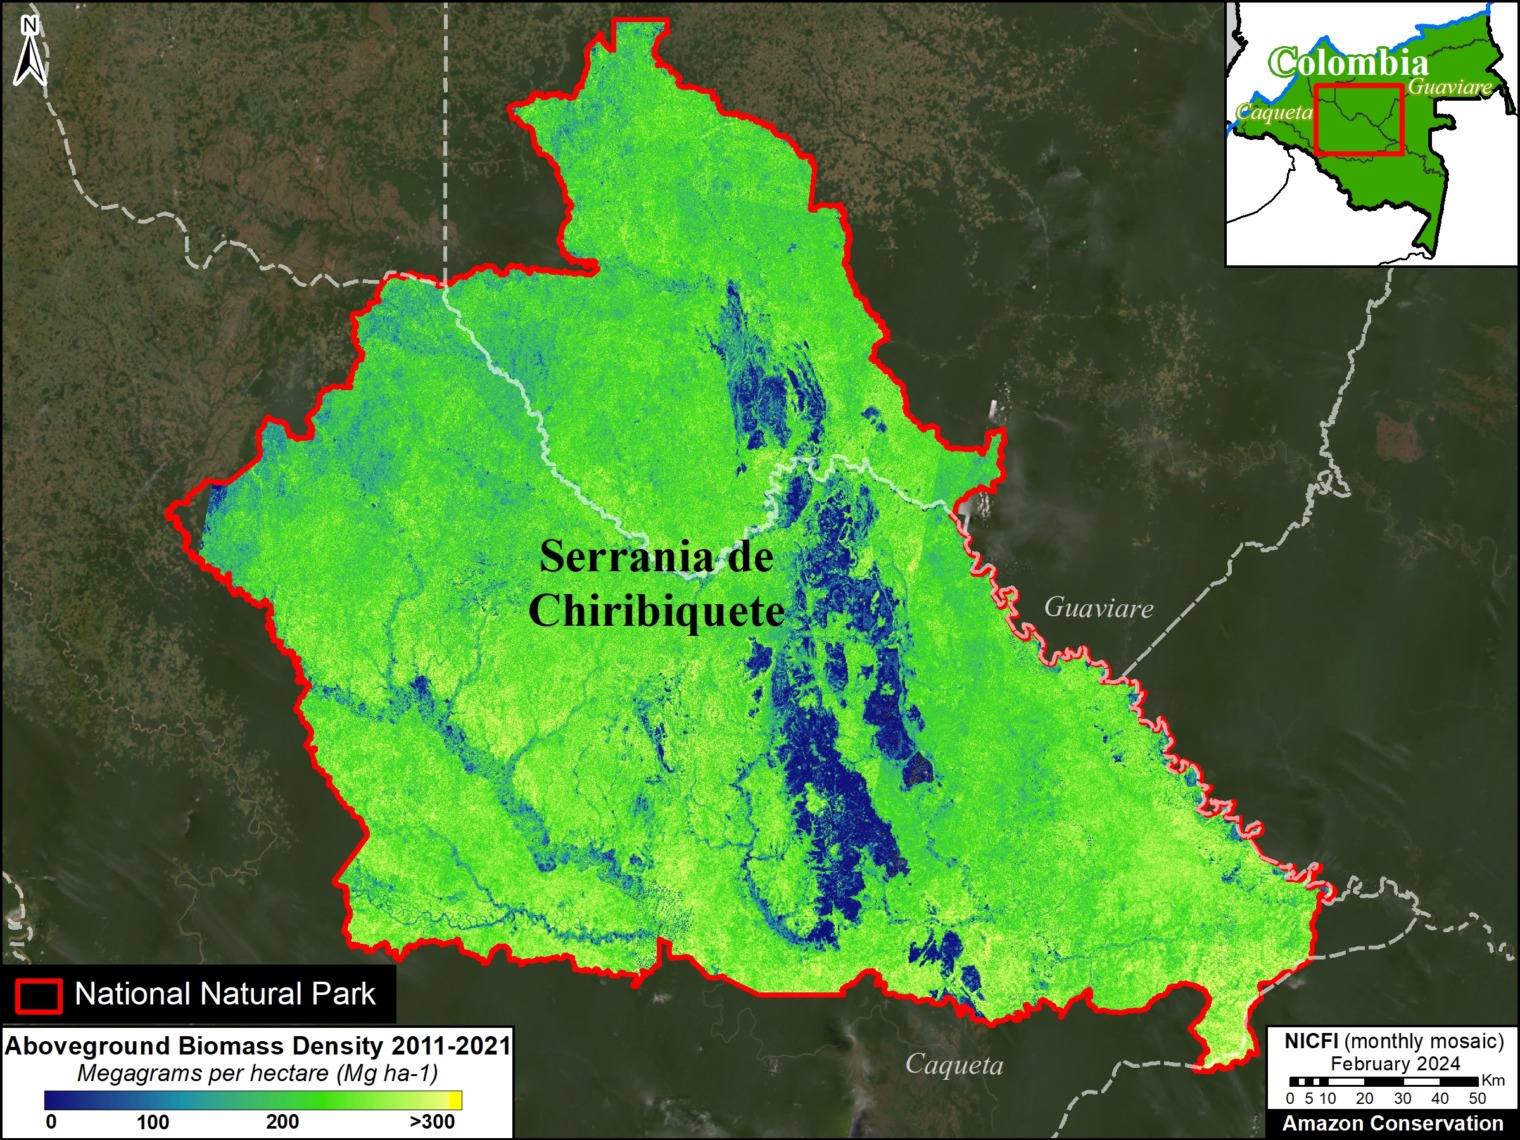
Chirbiquete National Park (Colombian Amazon)
Chirbiquete National Park covers over 4.2 million hectares in the heart of the Colombian Amazon (Guaviare and Caqueta departments). Both datasets converge in the estimate of around 600 metric tons of aboveground biomass, equating to over 300 million metric tons of aboveground carbon across the park (80.5 tons of carbon per hectare). Figure 1 shows the detailed spatial distribution of this biomass across Chirbiquete National Park. Note that the GEDI-TanDEM-X data misses the western tip of the park.
Manu National Park (Peruvian Amazon)
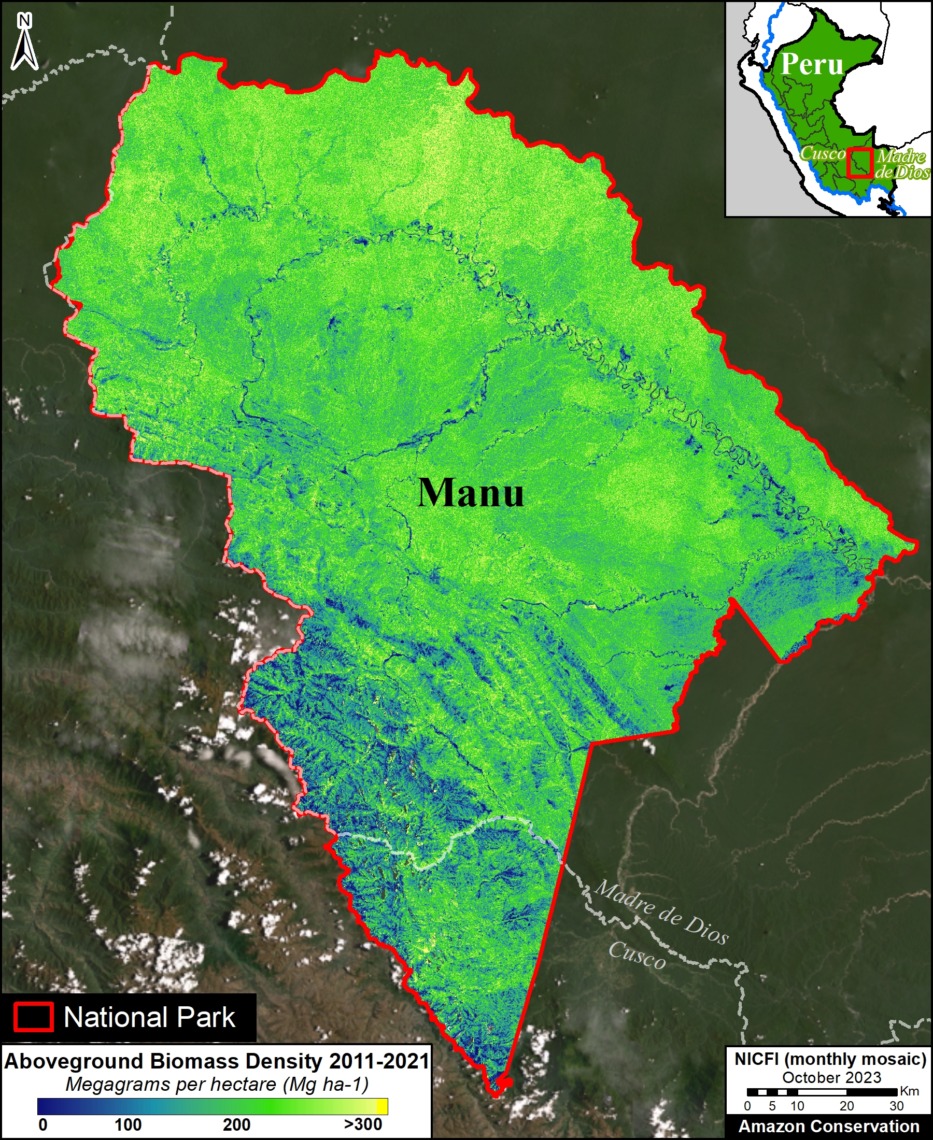
Manu National Park covers over 1.7 million hectares in the southern Peruvian Amazon (Madre de Dios and Cusco regions).
Both datasets converge in the estimate of over 450 metric tons of aboveground biomass, equating to over 215 million metric tons of aboveground carbon across the territory (126.8 tons of carbon per hectare).
Figure 2 shows the detailed spatial distribution of this biomass across Manu National Park.
Madidi National Park (Bolivian Amazon)
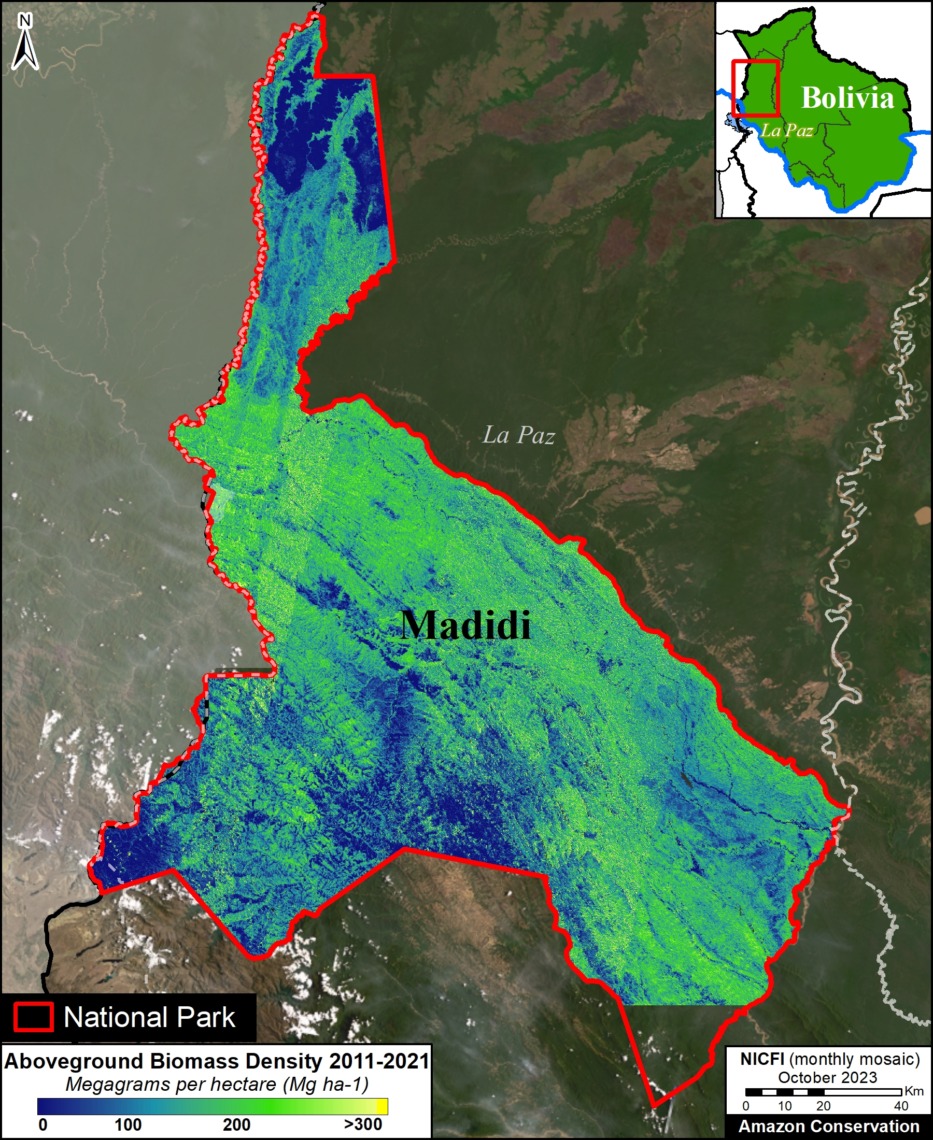
Madidi National Park and Integrated Management Area covers over 1.8 million hectares in the western Bolivian Amazon (La Paz department).
Both datasets converge in the estimate of over 350 metric tons of aboveground biomass, equating to over 160 million metric tons of aboveground carbon across the park (85.3 tons of carbon per hectare).
Figure 3 shows the detailed spatial distribution of this biomass across Madidi National Park. Note that the GEDI-TanDEM-X data misses the southern tip of the park.
Indigenous Territories
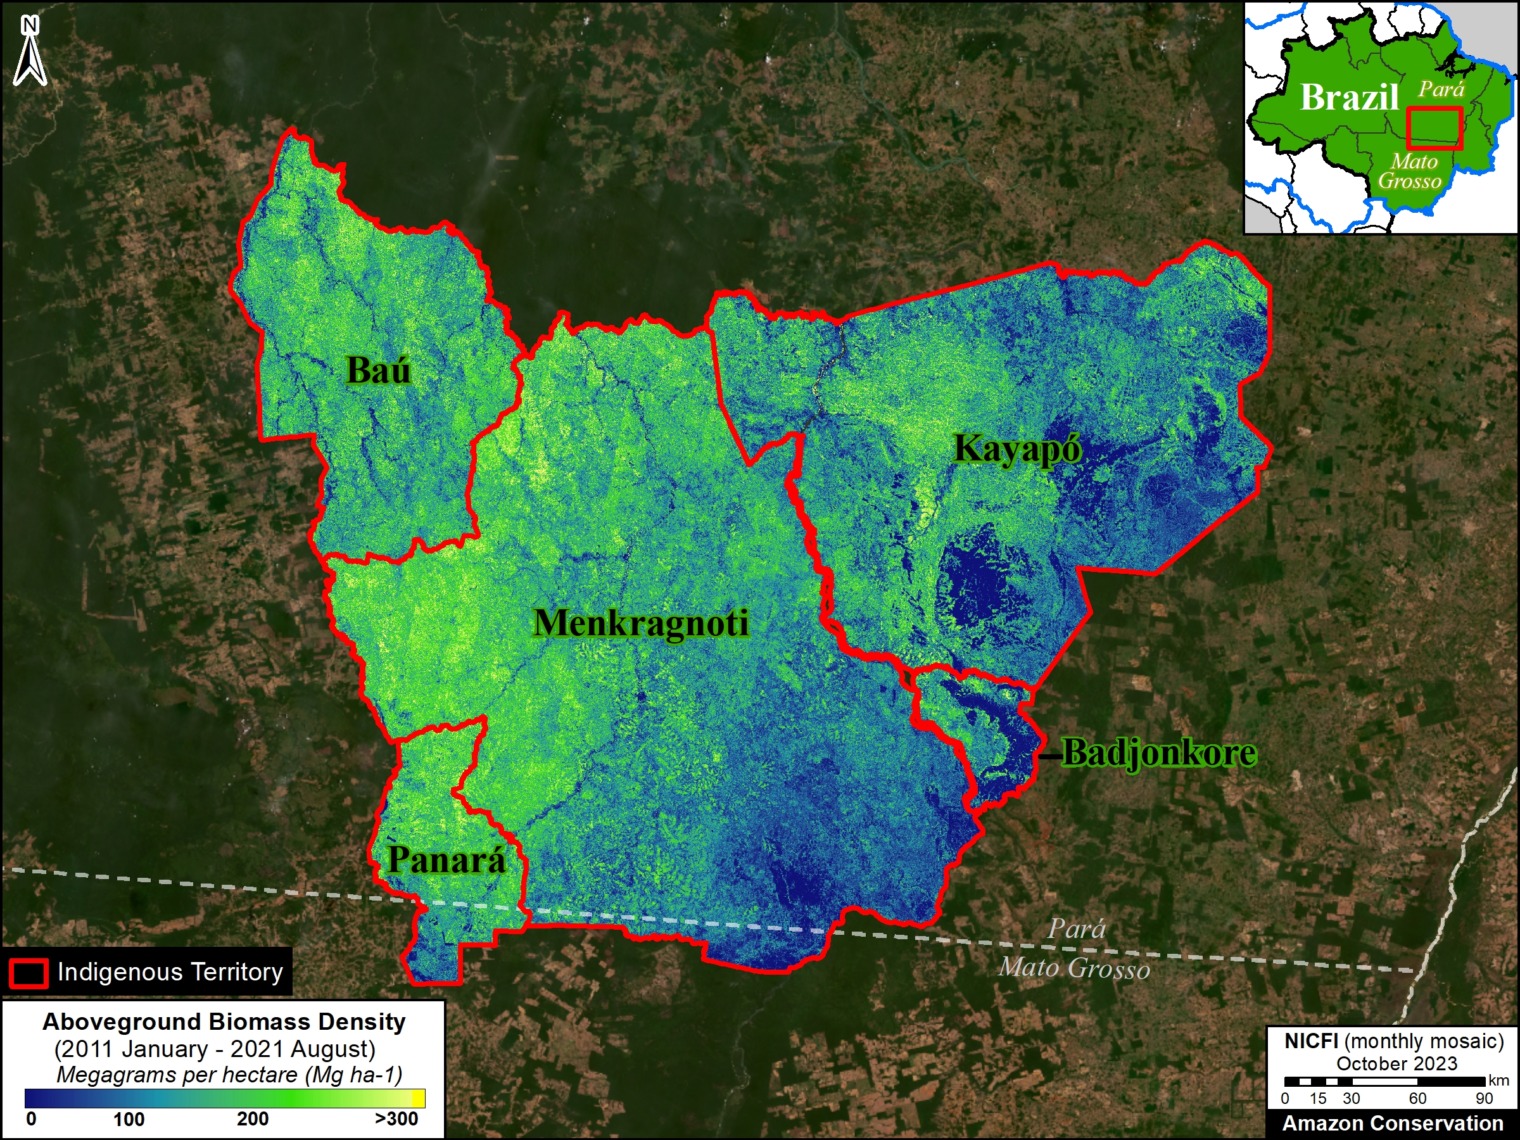
Kayapó Indigenous Territory (Brazilian Amazon)
Kayapó Indigenous Territory covers over 3.2 million hectares in the eastern Brazilian Amazon (Pará state). Both datasets converge in the estimate of over 413,000 metric tons of aboveground biomass, equating to over 198 million metric tons of aboveground carbon across the territory. Figure 4 shows the detailed spatial distribution of this biomass across Kayapó and four neighboring Indigenous Territories. Totaling across these five territories (10.4 million hectares), the data sets converge on over 1.5 billion metric tons of aboveground biomass, and 730 million metric tons of aboveground carbon (70 tons per hectare).
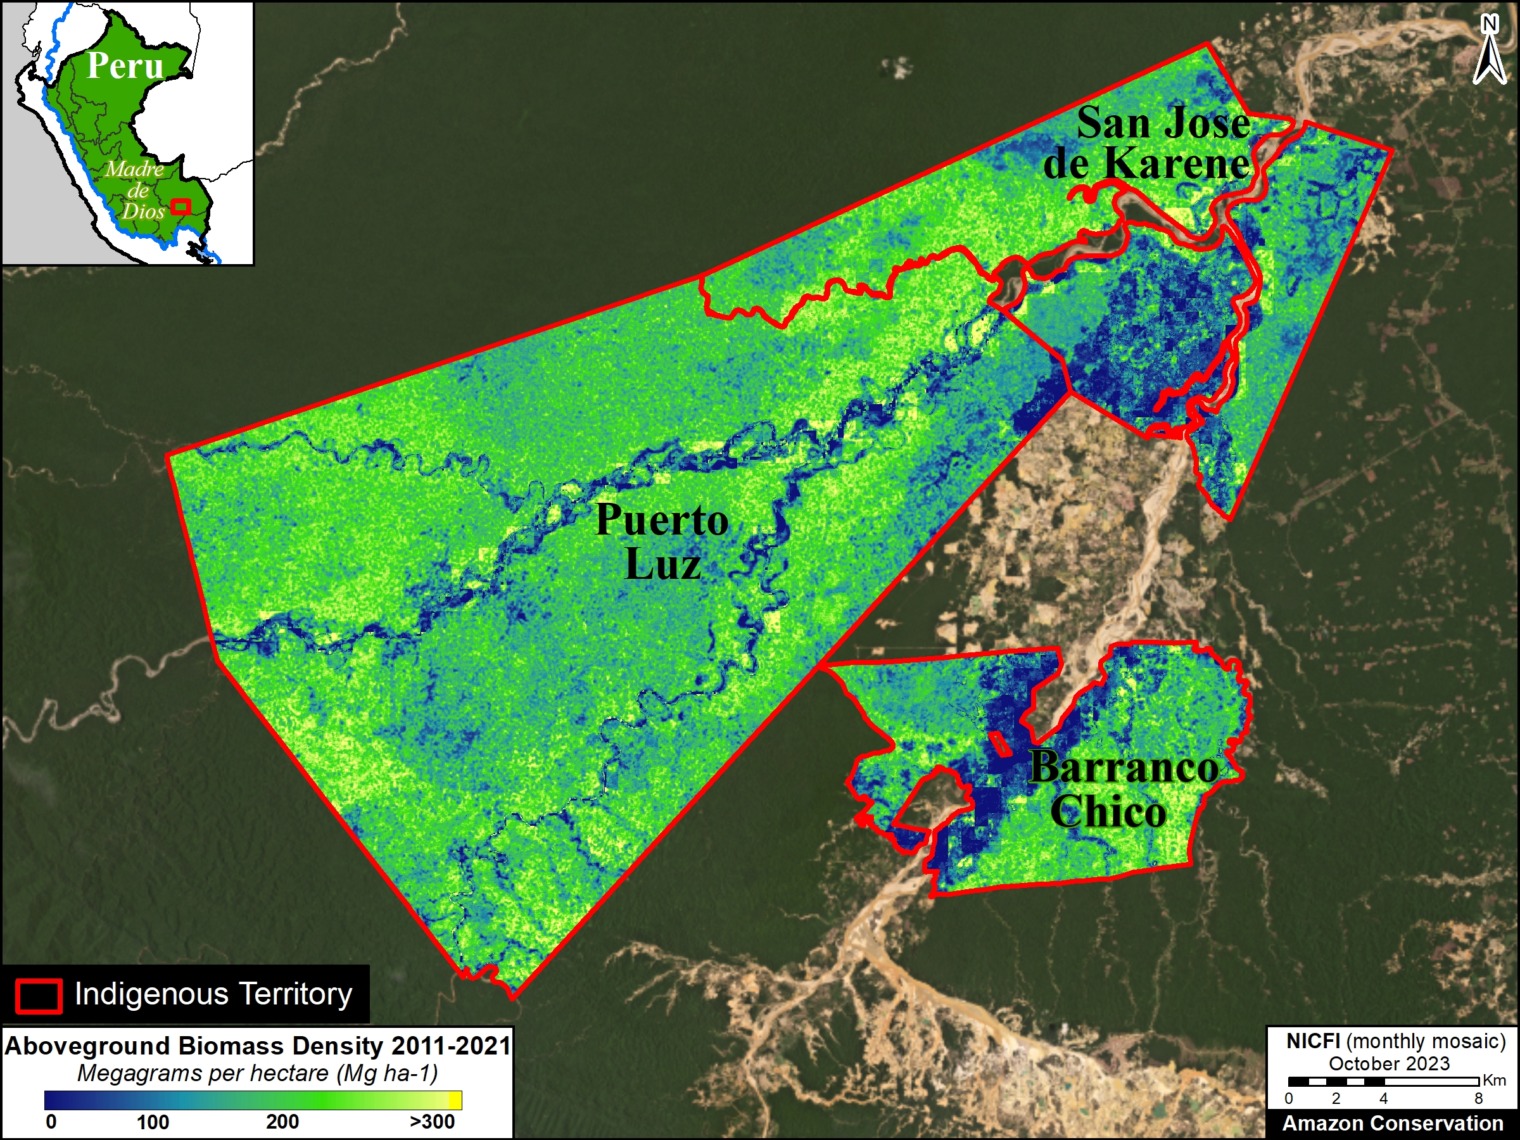
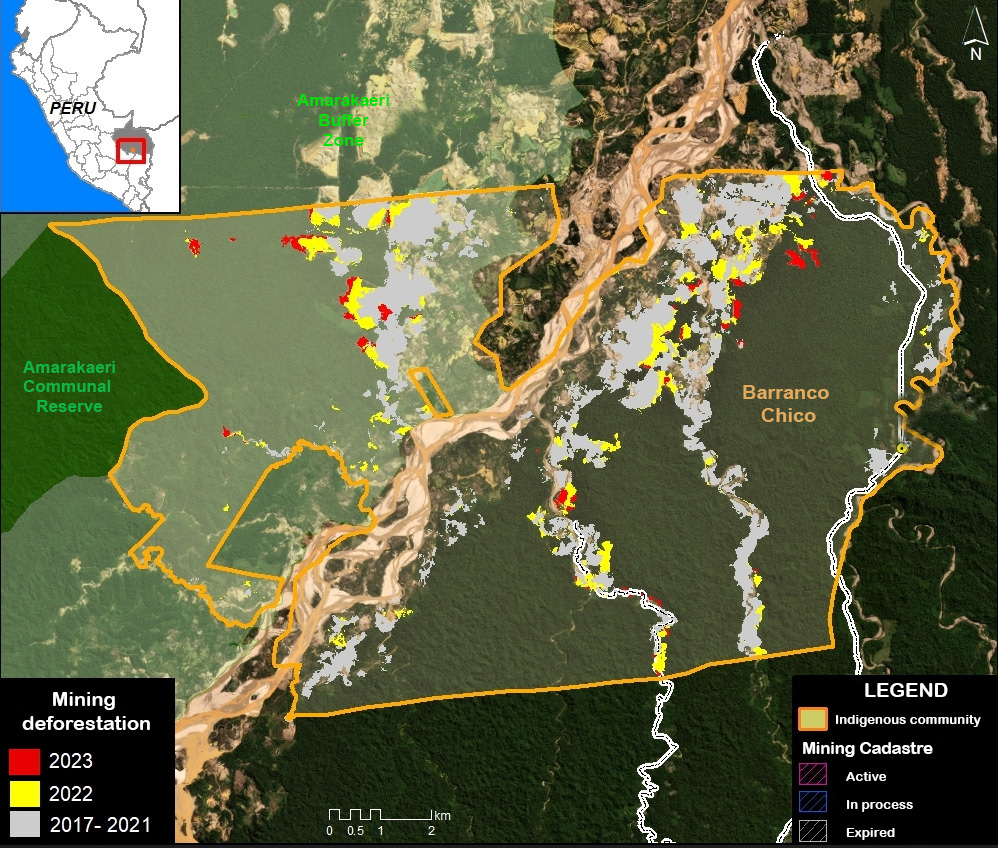
Barranco Chico Indigenous Territory (Peruvian Amazon)
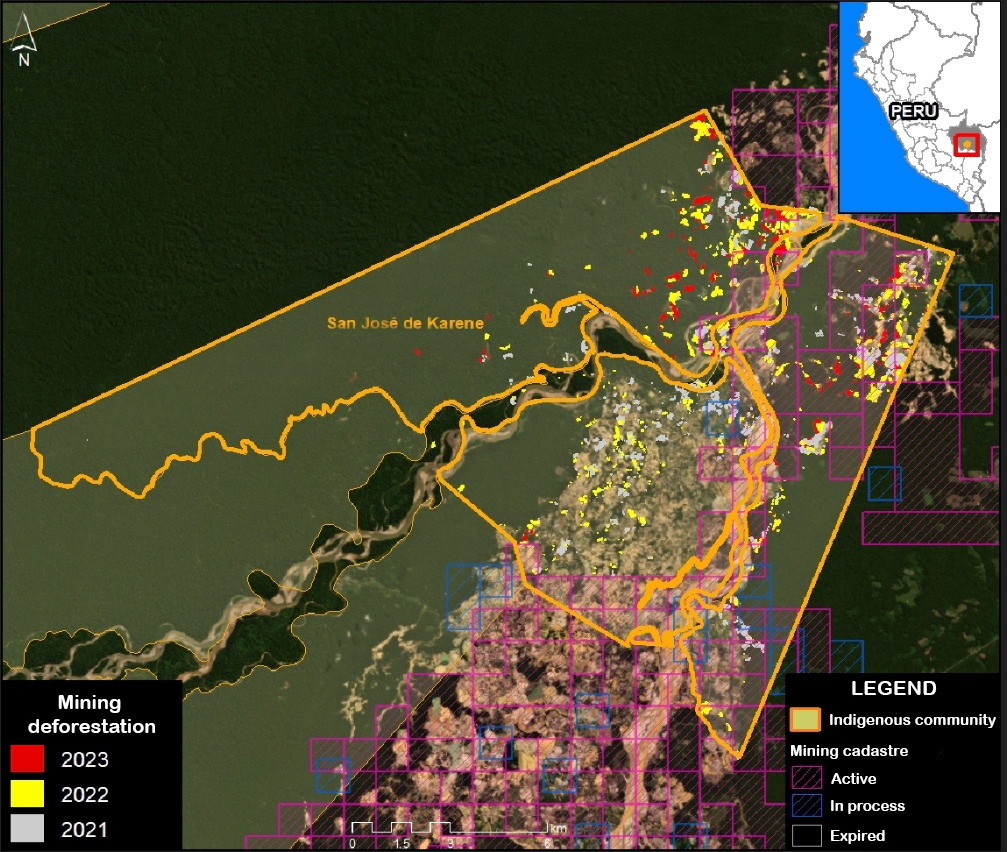
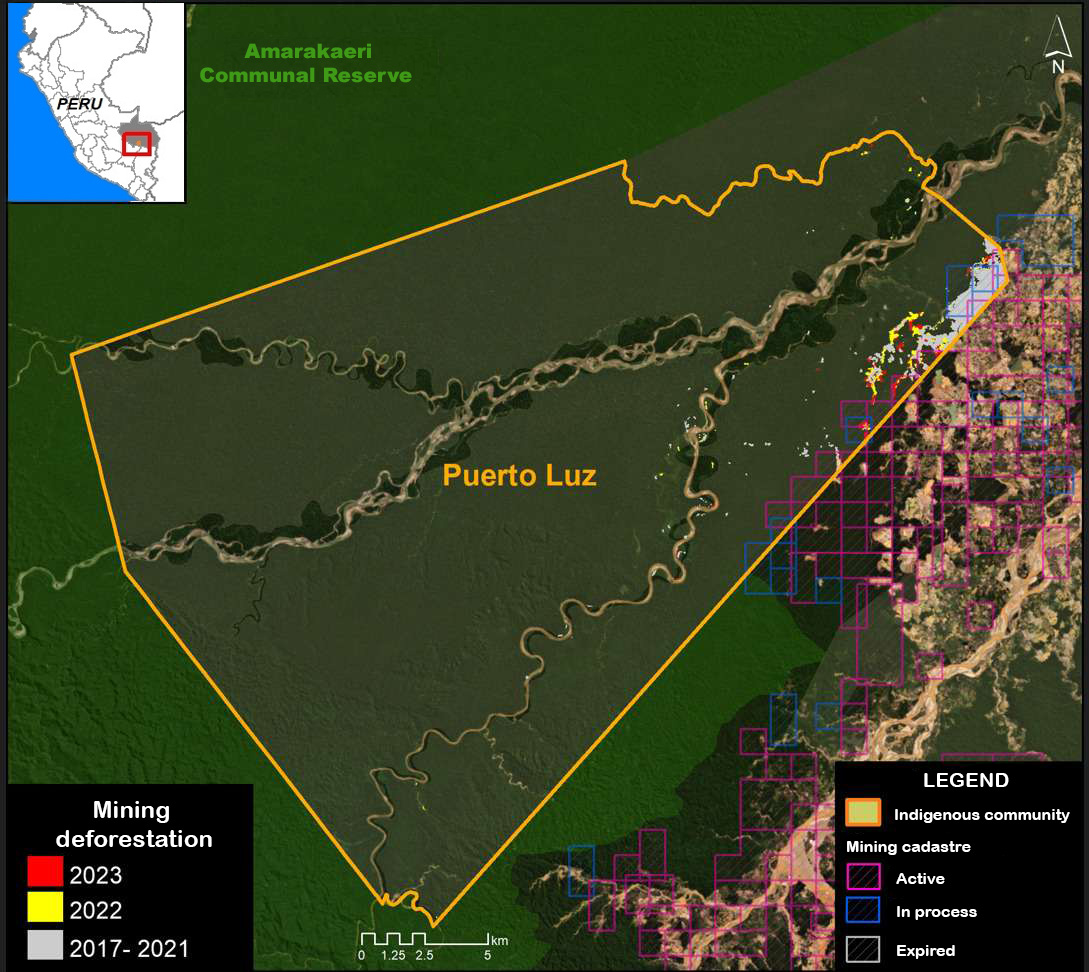
Barranco Chico Indigenous Territory covers over 12,600 hectares in the southern Peruvian Amazon (Madre de Dios region). Both datasets converge in the estimate of over 2 million metric tons of aboveground biomass, equating to over 1 million metric tons of aboveground carbon. Figure 5 shows the detailed spatial distribution of this biomass across Barranco Chico and two neighboring Indigenous Territories (Puerto Luz and San Jose de Karene). Totaling across these three territories (nearly 90,000 hectares), the data sets converge on over 19 million metric tons of aboveground biomass, and over 9 million metric tons of aboveground carbon (102 tons per hectare).
Notes
1 GEDI L4B Gridded Aboveground Biomass Density, Version 2.1. This data is measured in megagrams of aboveground biomass per hectare (Mg/ha) at a 1-kilometer resolution, with the period of April 2019 – March 2023. This serves as our estimate for aboveground carbon reserves, with the science-based assumption that 48% of recorded biomass is carbon.
2 The approach relies on the foundational paper from Patterson et al., (2019) and it is used by the GEDI mission to estimate mean and total biomass worldwide (Dubayh et al., 2022, Armston et al., 2023). The method considers the spatial distribution of GEDI tracks within a given user-specify boundary to infer the sampling error component of the total uncertainty that also includes the error from the GEDI L4A models used to predict biomass from canopy height estimates (Keller et al., 2022). For more information on the OBI-WAN app, see Healey and Yang 2022.
3 GEDI-TanDEM-X (GTDX) is a fusion of GEDI Version 2 and TanDEM-X (TDX) Interferometric Synthetic Aperture Radar (InSAR) images (from Jan 2011 to December 2020). It also incorporates annual forest loss data to account for deforestation during this time. The GTDX aboveground biomass maps were produced based on a generalized hierarchical model-based (GHMB) framework that utilizes GEDI biomass as training data to establish models for estimating biomass based on the GTDX canopy height. The combination of lidar (GEDI) and radar (TanDEM-X) has started to produce unmatched maps that combine the ability of lidar to retrieve forest structure and the ability of radar to offer wall-to-wall coverage (Qi et al.,2023, Dubayah et a;., 2023). This fused product is a wall-to-wall gap-free map that was produced at multiple resolutions: 25m, 100m and 1ha. Ongoing processing over the Pantropic region will be made available over the next months but some geographies have been already mapped such as most of the Amazon Basin (Dubayah et al., 2023). The data we used is publicly available.
References
Armston, J., Dubayah, R. O., Healey, S. P., Yang, Z., Patterson, P. L., Saarela, S., Stahl, G., Duncanson, L., Kellner, J. R., Pascual, A., & Bruening, J. (2023). Global Ecosystem Dynamics Investigation (GEDI)GEDI L4B Country-level Summaries of Aboveground Biomass [CSV]. 0 MB. https://doi.org/10.3334/ORNLDAAC/2321
Dubayah, R. O., Armston, J., Healey, S. P., Yang, Z., Patterson, P. L., Saarela, S., Stahl, G., Duncanson, L., Kellner, J. R., Bruening, J., & Pascual, A. (2023). Global Ecosystem Dynamics Investigation (GEDI)GEDI L4B Gridded Aboveground Biomass Density, Version 2.1 [COG]. 0 MB. https://doi.org/10.3334/ORNLDAAC/2299
Dubayah, R., Armston, J., Healey, S. P., Bruening, J. M., Patterson, P. L., Kellner, J. R., Duncanson, L., Saarela, S., Ståhl, G., Yang, Z., Tang, H., Blair, J. B., Fatoyinbo, L., Goetz, S., Hancock, S., Hansen, M., Hofton, M., Hurtt, G., & Luthcke, S. (2022). GEDI launches a new era of biomass inference from space. Environmental Research Letters, 17(9), 095001. https://doi.org/10.1088/1748-9326/ac8694
Dubayah, R., Blair, J. B., Goetz, S., Fatoyinbo, L., Hansen, M., Healey, S., Hofton, M., Hurtt, G., Kellner, J., Luthcke, S., Armston, J., Tang, H., Duncanson, L., Hancock, S., Jantz, P., Marselis, S., Patterson, P. L., Qi, W., & Silva, C. (2020). The Global Ecosystem Dynamics Investigation: High-resolution laser ranging of the Earth’s forests and topography. Science of Remote Sensing, 1, 100002. https://doi.org/10.1016/j.srs.2020.100002
Healey S, Yang Z (2022) The OBIWAN App: Estimating Property-Level Carbon Storage Using NASA’s GEDI Lidar. https://www.fs.usda.gov/research/rmrs/understory/obiwan-app-estimating-property-level-carbon-storage-using-nasas-gedi-lidar
Kellner, J. R., Armston, J., & Duncanson, L. (2022). Algorithm Theoretical Basis Document for GEDI Footprint Aboveground Biomass Density. Earth and Space Science, 10(4), e2022EA002516. https://doi.org/10.1029/2022EA002516
Dubayah, R.O., W. Qi, J. Armston, T. Fatoyinbo, K. Papathanassiou, M. Pardini, A. Stovall, C. Choi, and V. Cazcarra-Bes. 2023. Pantropical Forest Height and Biomass from GEDI and TanDEM-X Data Fusion. ORNL DAAC, Oak Ridge, Tennessee, USA. https://doi.org/10.3334/ORNLDAAC/2298
Qi, W., J. Armston, C. Choi, A. Stovall, S. Saarela, M. Pardini, L. Fatoyinbo, K. Papathanasiou, and R. Dubayah. 2023. Mapping large-scale pantropical forest canopy height by integrating GEDI lidar and TanDEM-X InSAR data. Research Square. https://doi.org/10.21203/rs.3.rs-3306982/v1
Krieger, G., M. Zink, M. Bachmann, B. Bräutigam, D. Schulze, M. Martone, P. Rizzoli, U. Steinbrecher, J. Walter Antony, F. De Zan, I. Hajnsek, K. Papathanassiou, F. Kugler, M. Rodriguez Cassola, M. Younis, S. Baumgartner, P. López-Dekker, P. Prats, and A. Moreira. 2013. TanDEM-X: A radar interferometer with two formation-flying satellites. Acta Astronautica 89:83–98. https://doi.org/10.1016/j.actaastro.2013.03.008
Acknowledgments
We greatly thank the University of Maryland’s GEDI team for data access and reviewing this report. In particular, we thank Ralph Dubayah, Matheus Nunes, and Sean Healey.
This report was made possible by the generous support of the Norwegian Agency for Development Cooperation (NORAD)
![]()
Citation
Mamani N, Pascual A, Finer M (2024) Estimating Carbon in Amazon Protected Areas & Indigenous Territories. MAAP: 213

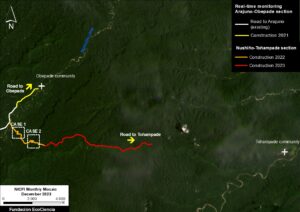
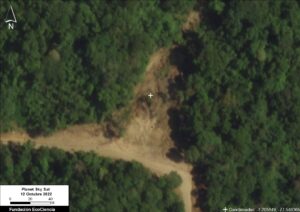
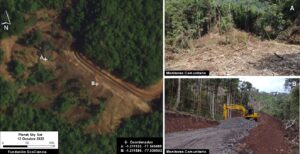
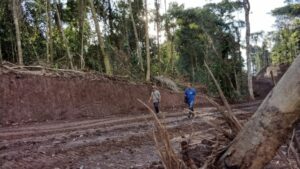
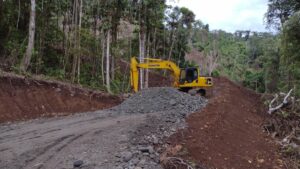 We analyze a new road project that enters the western sector of the Waorani Indigenous Territory, located in the heart of the Ecuadorian Amazon (see Base Map, below).