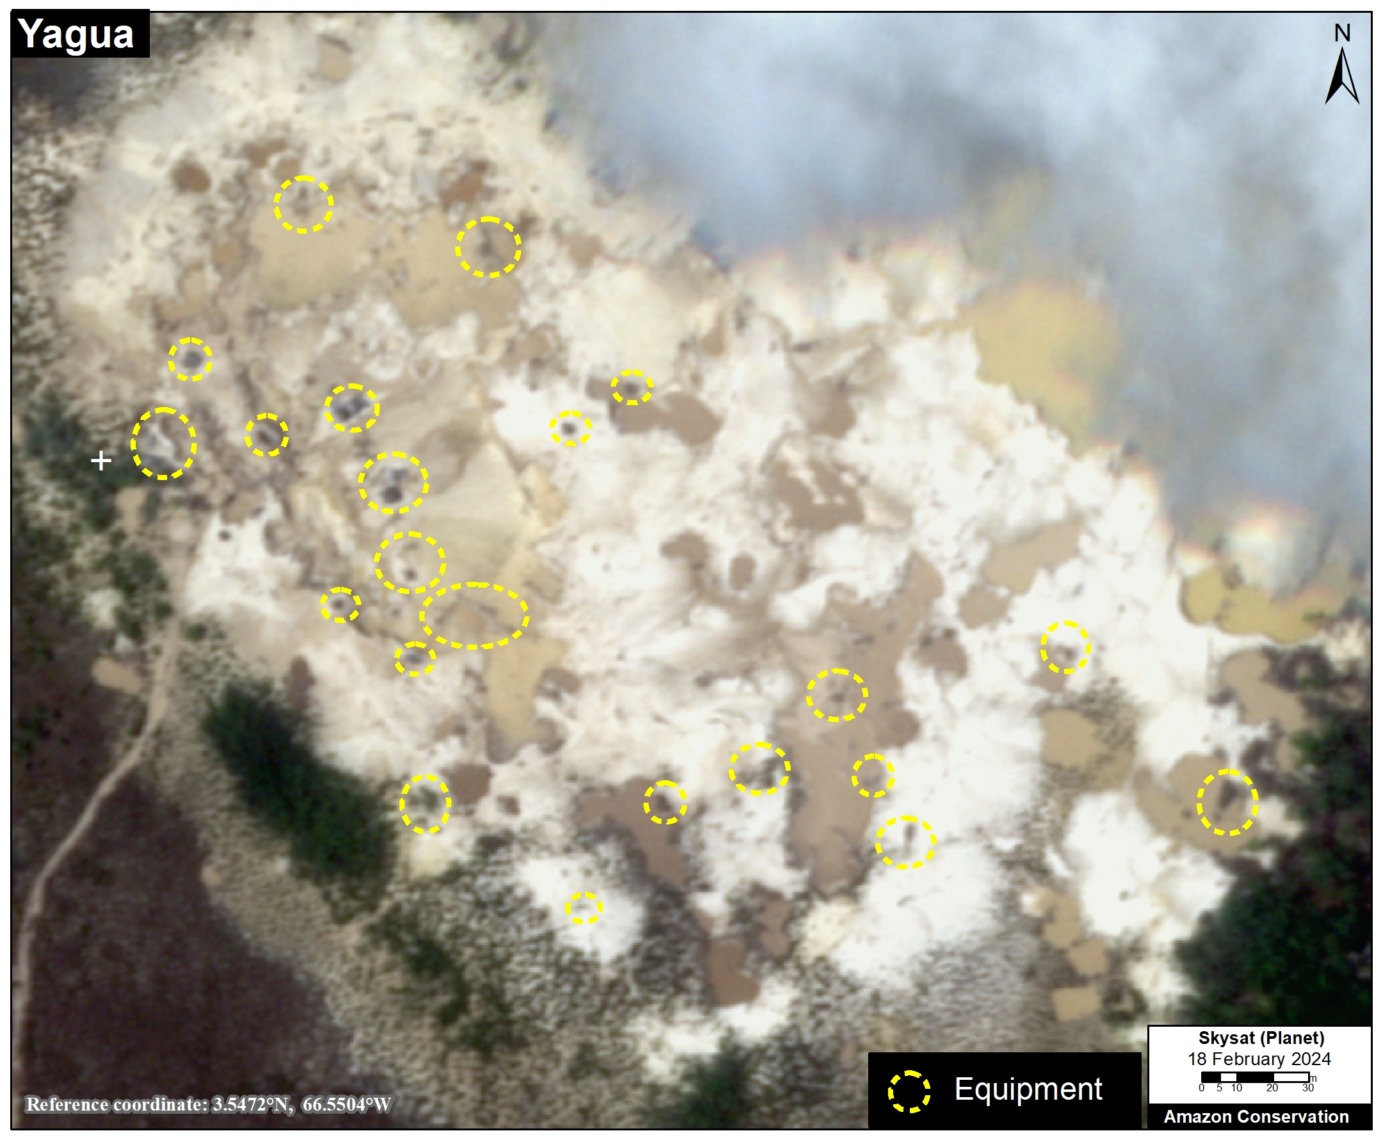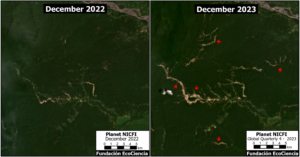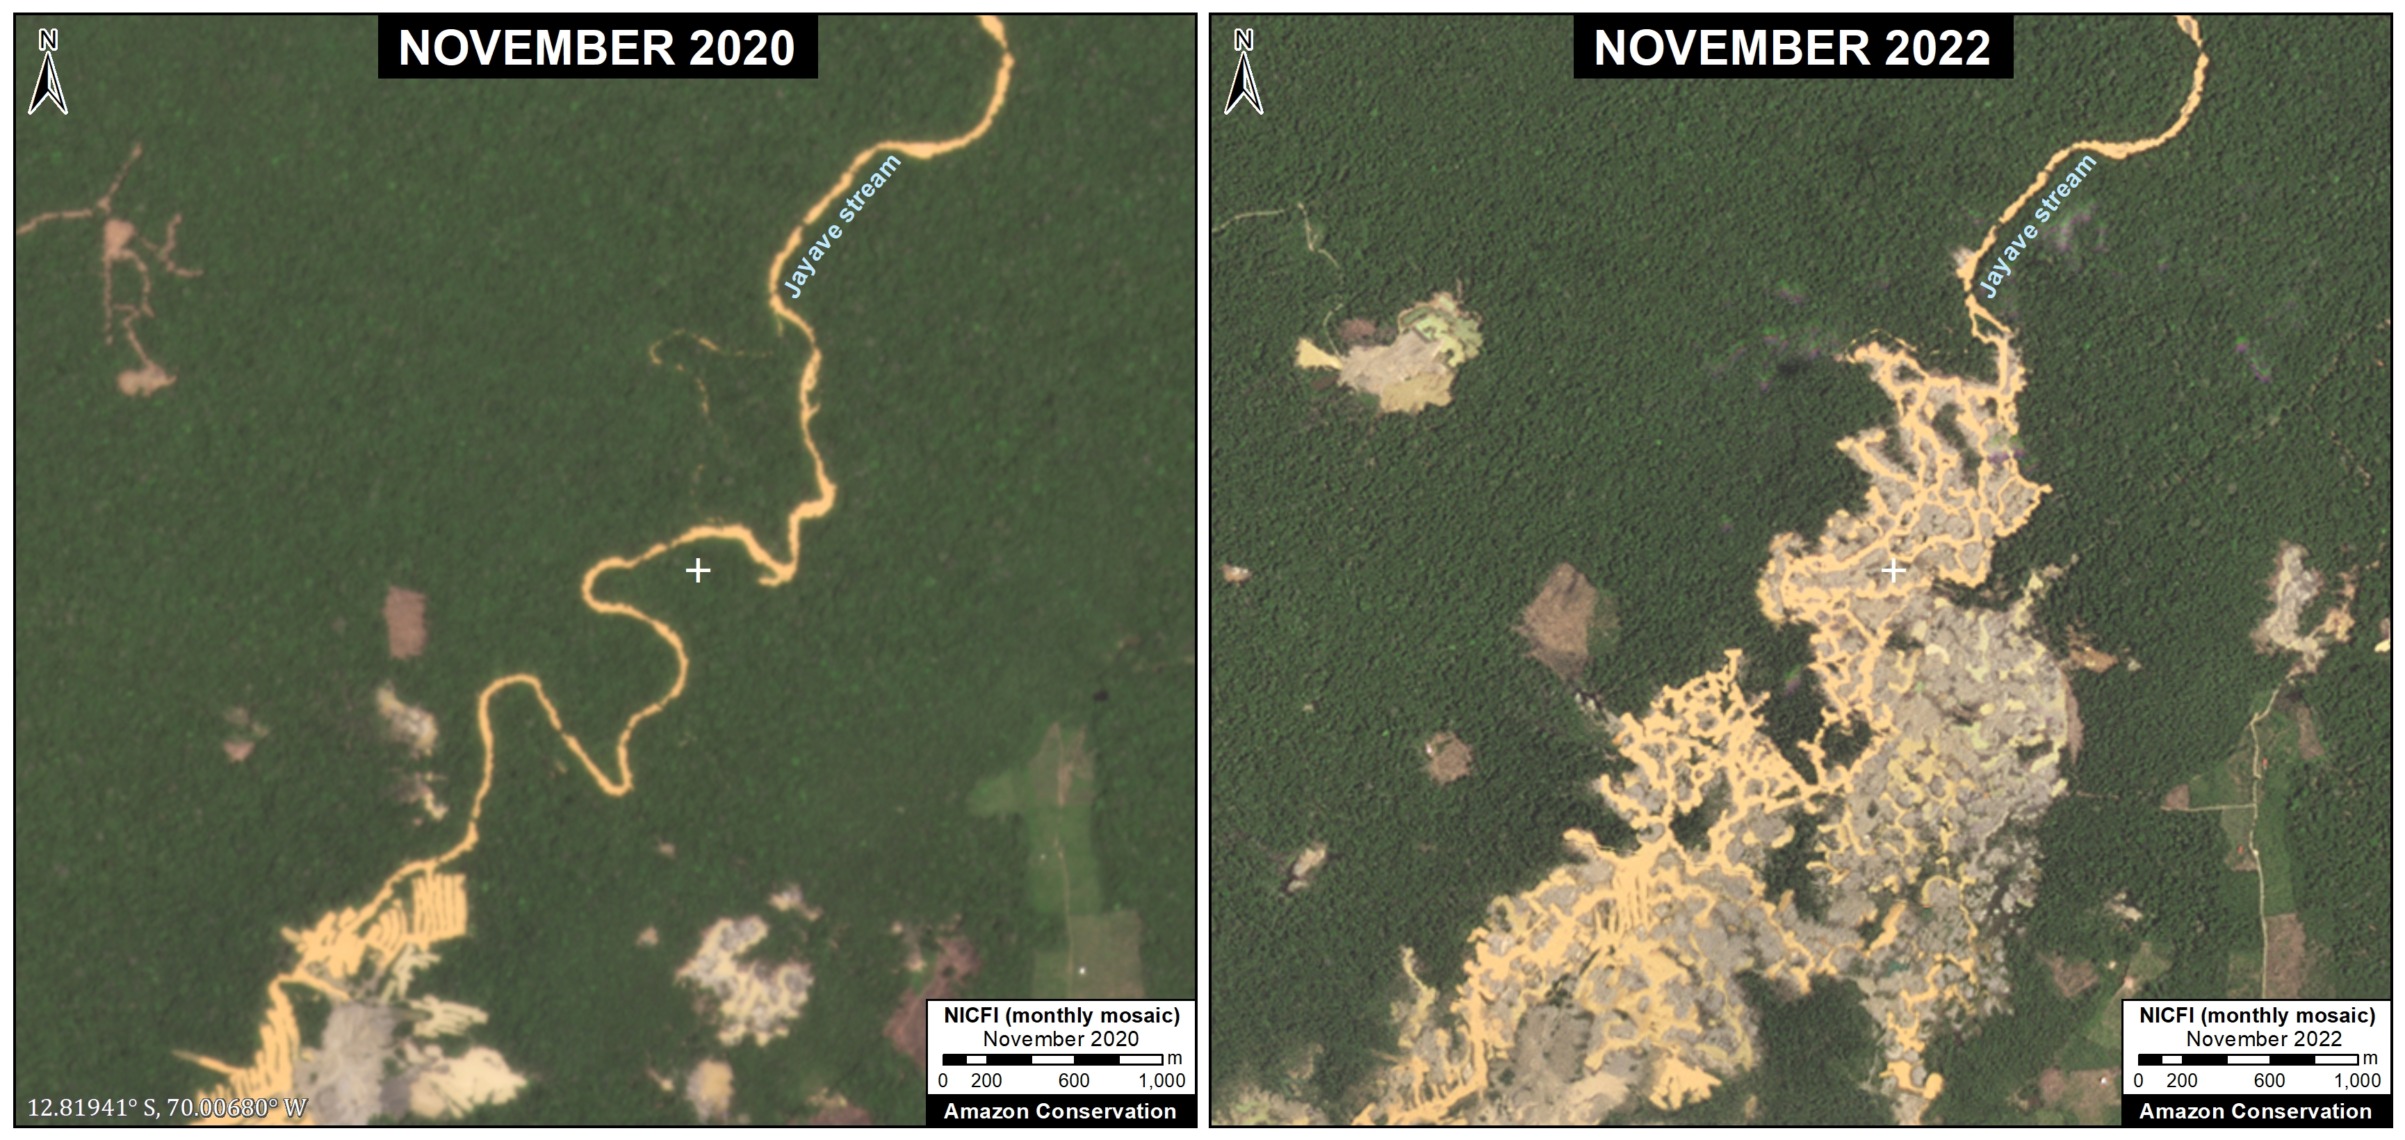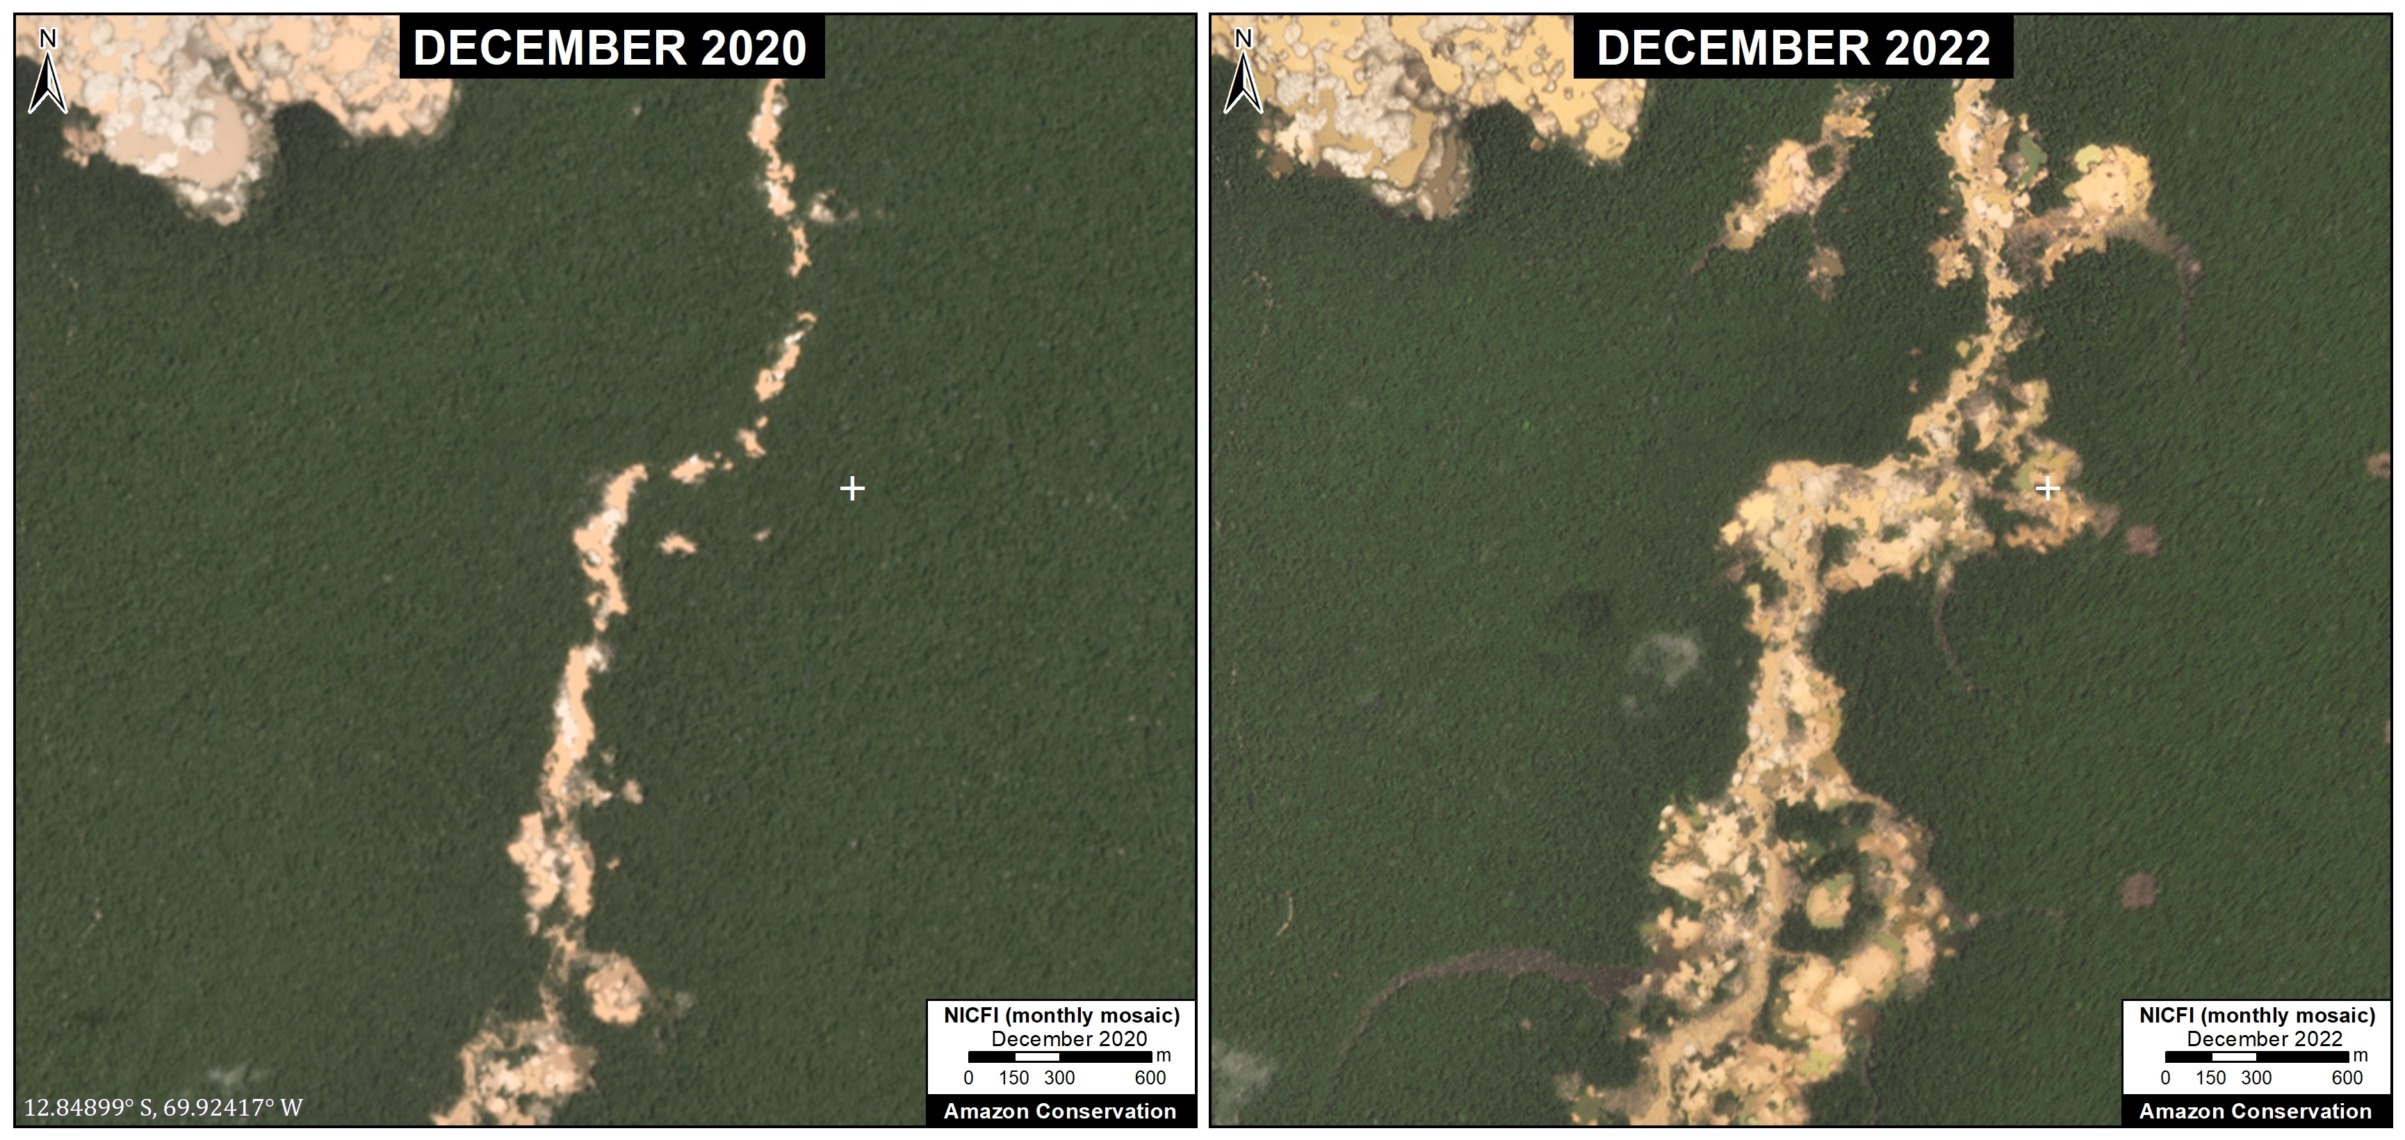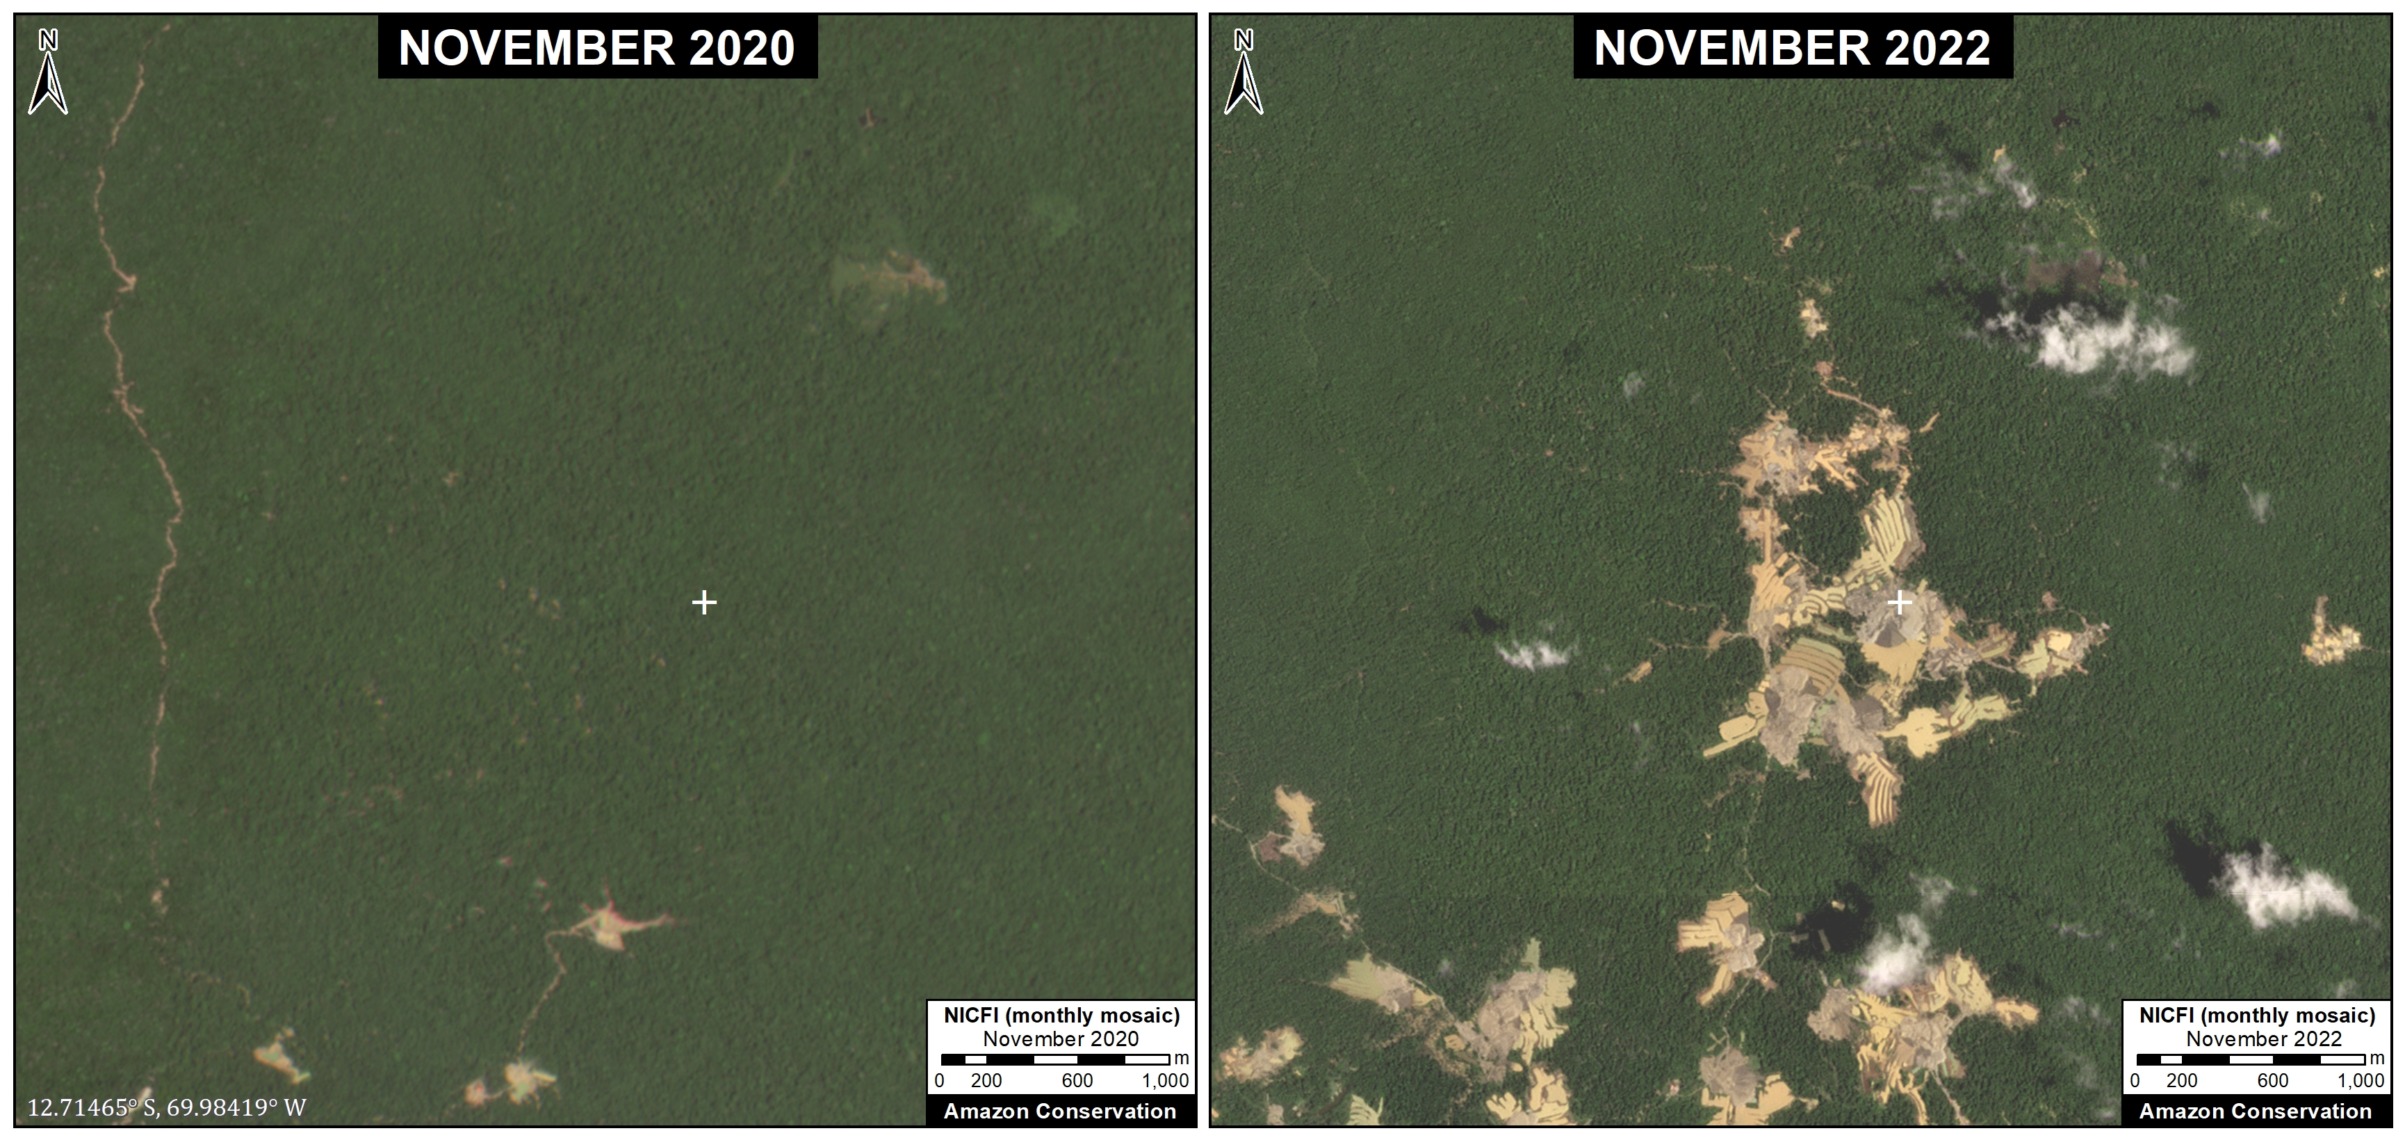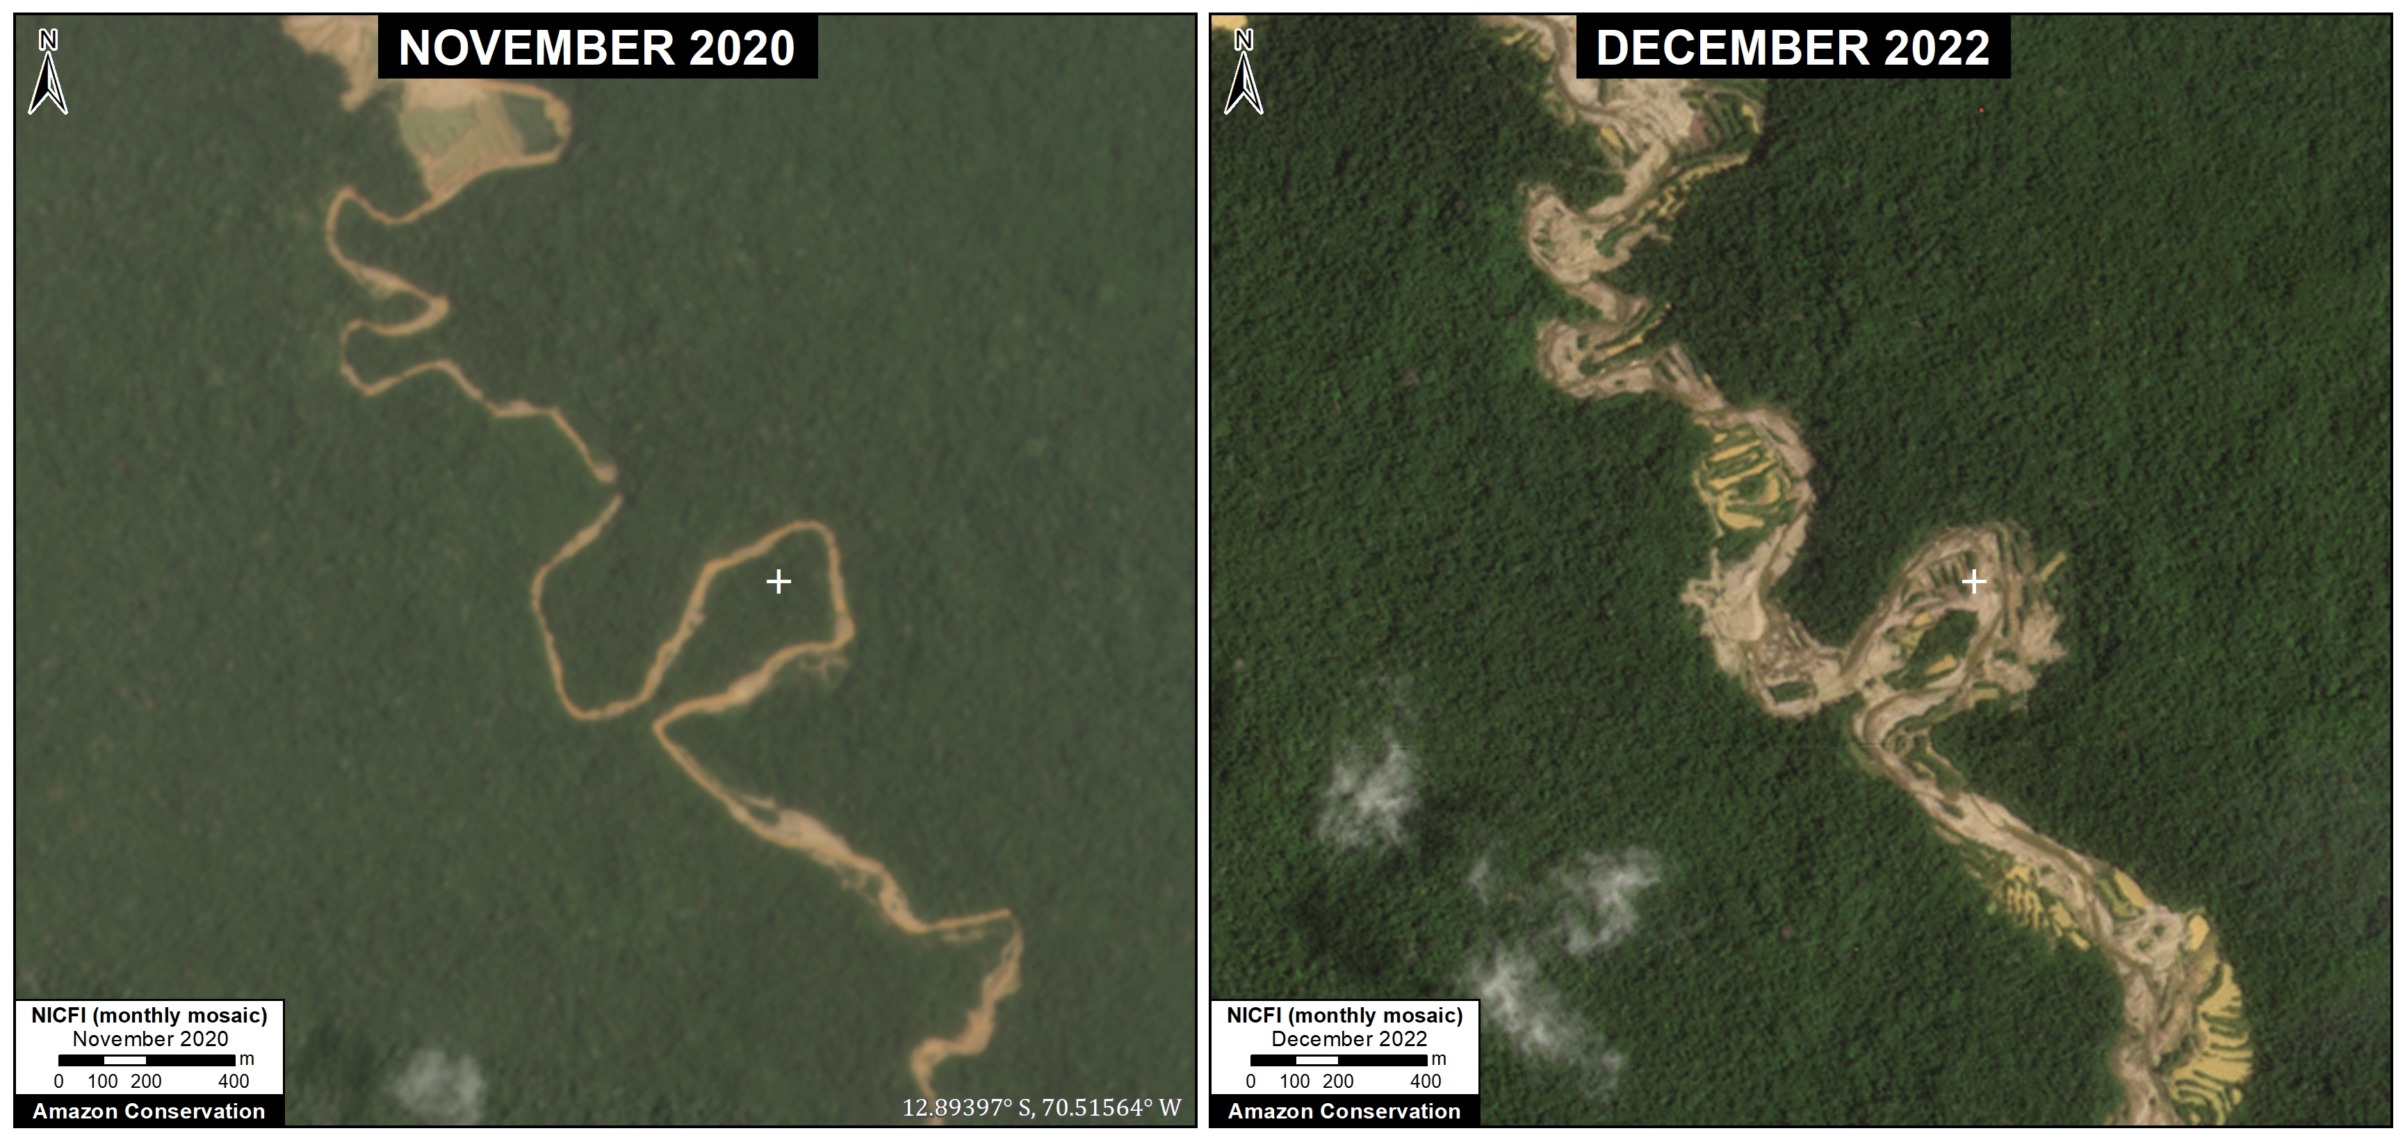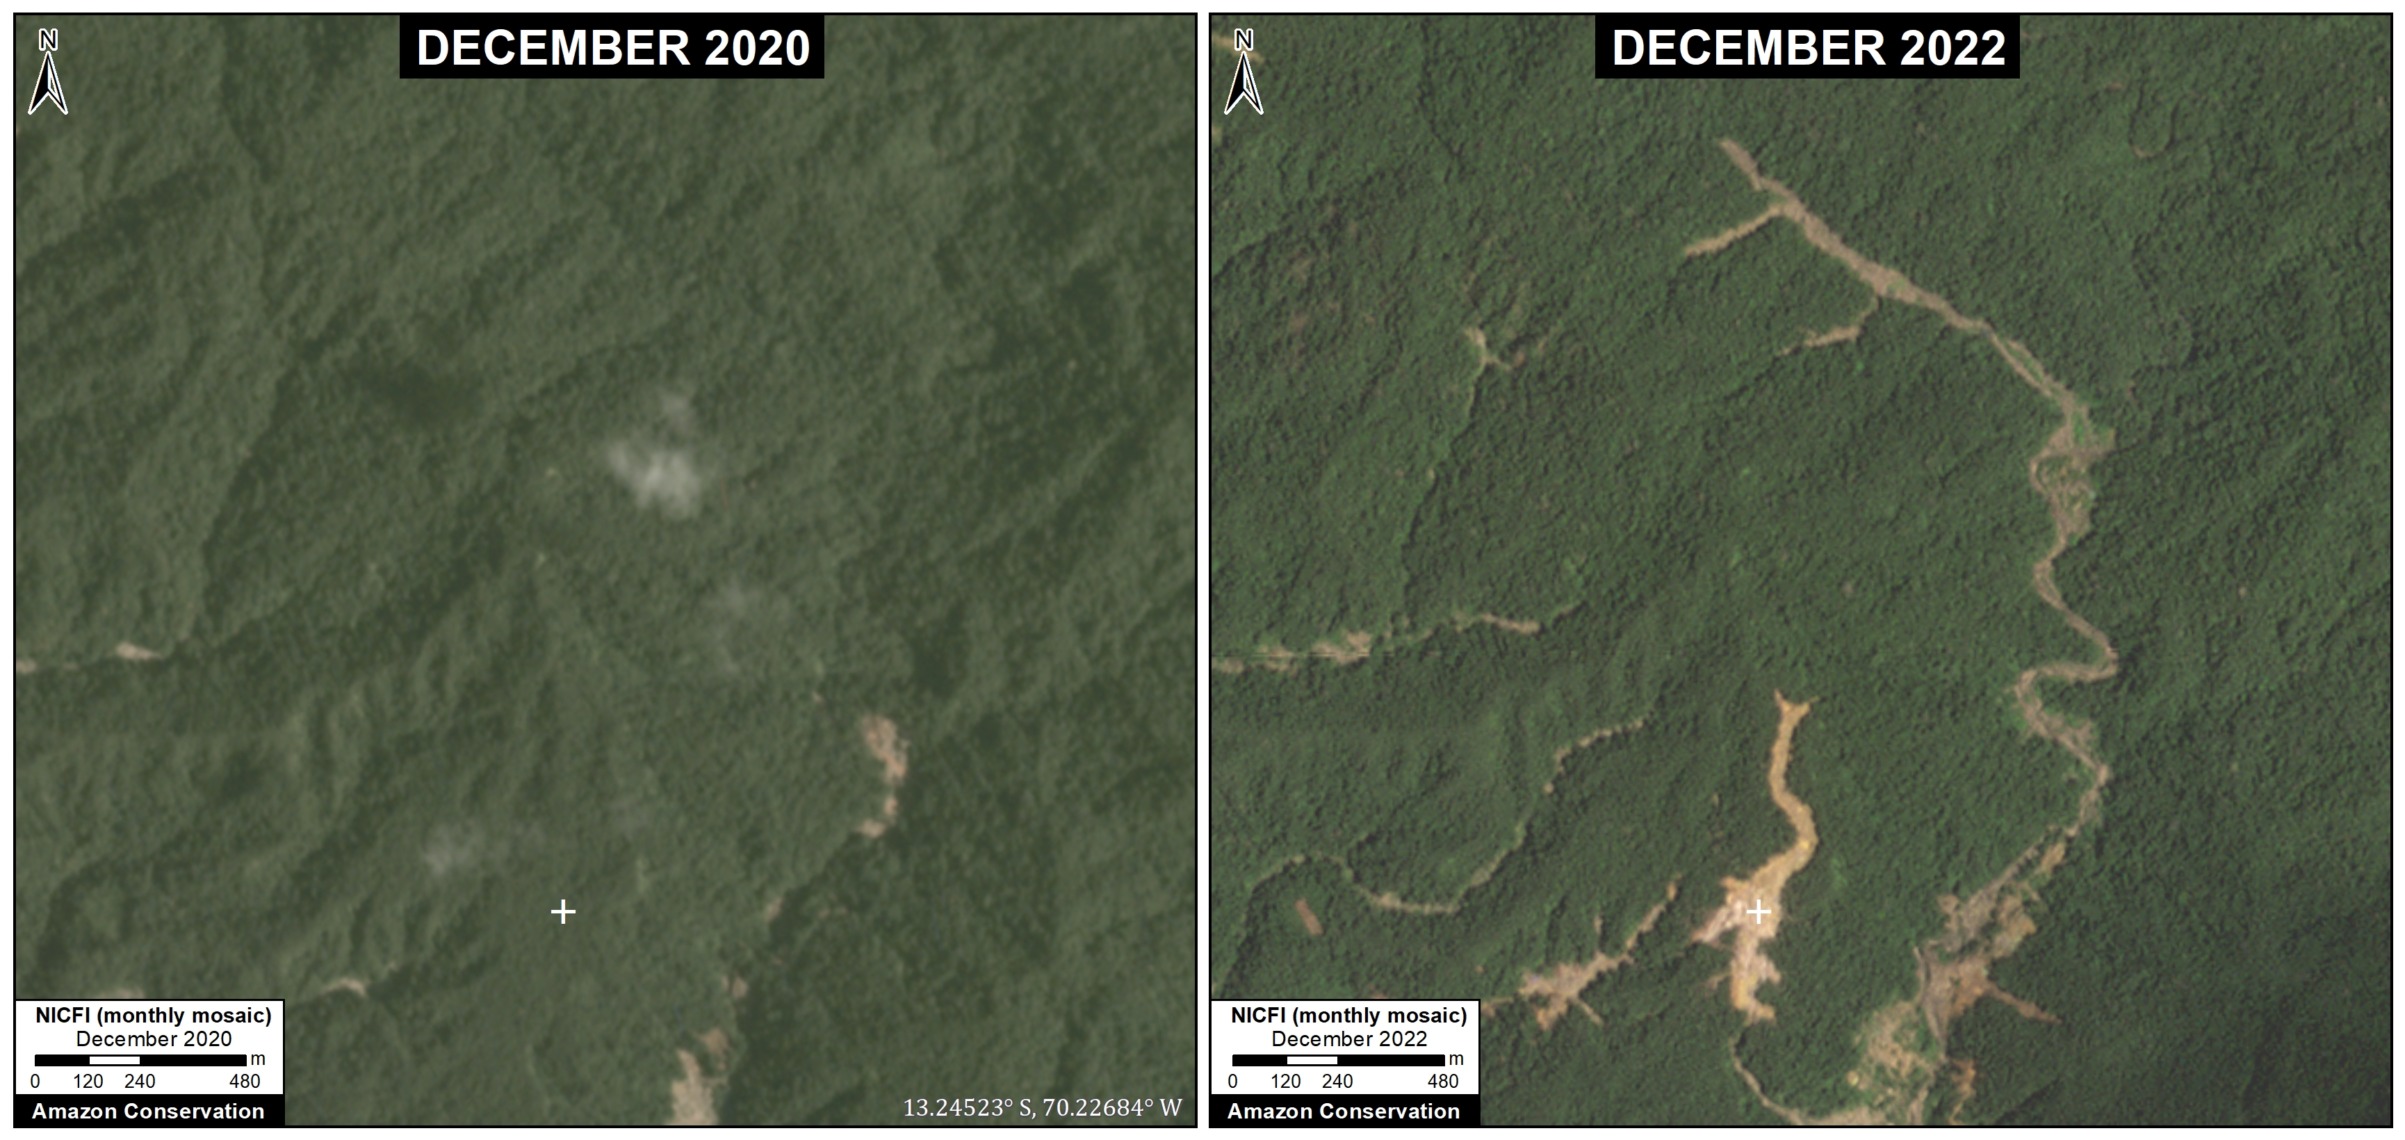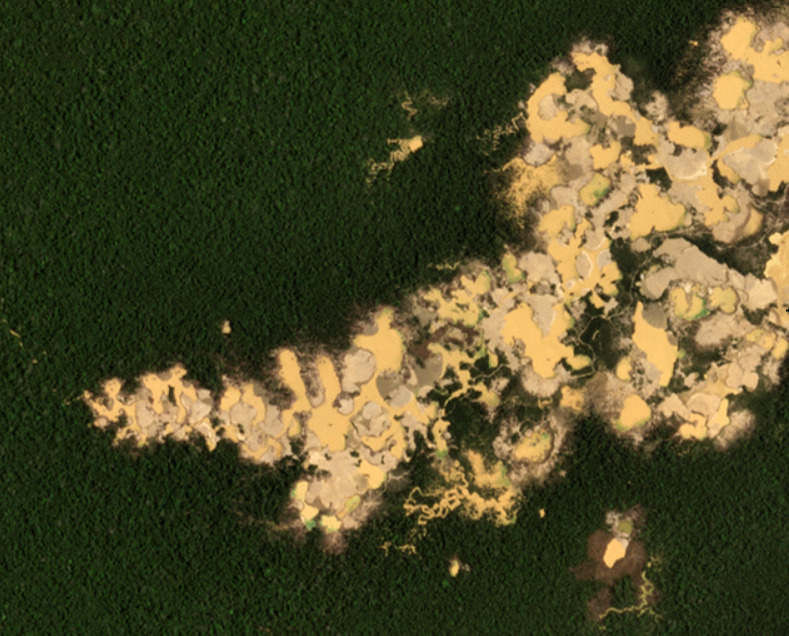
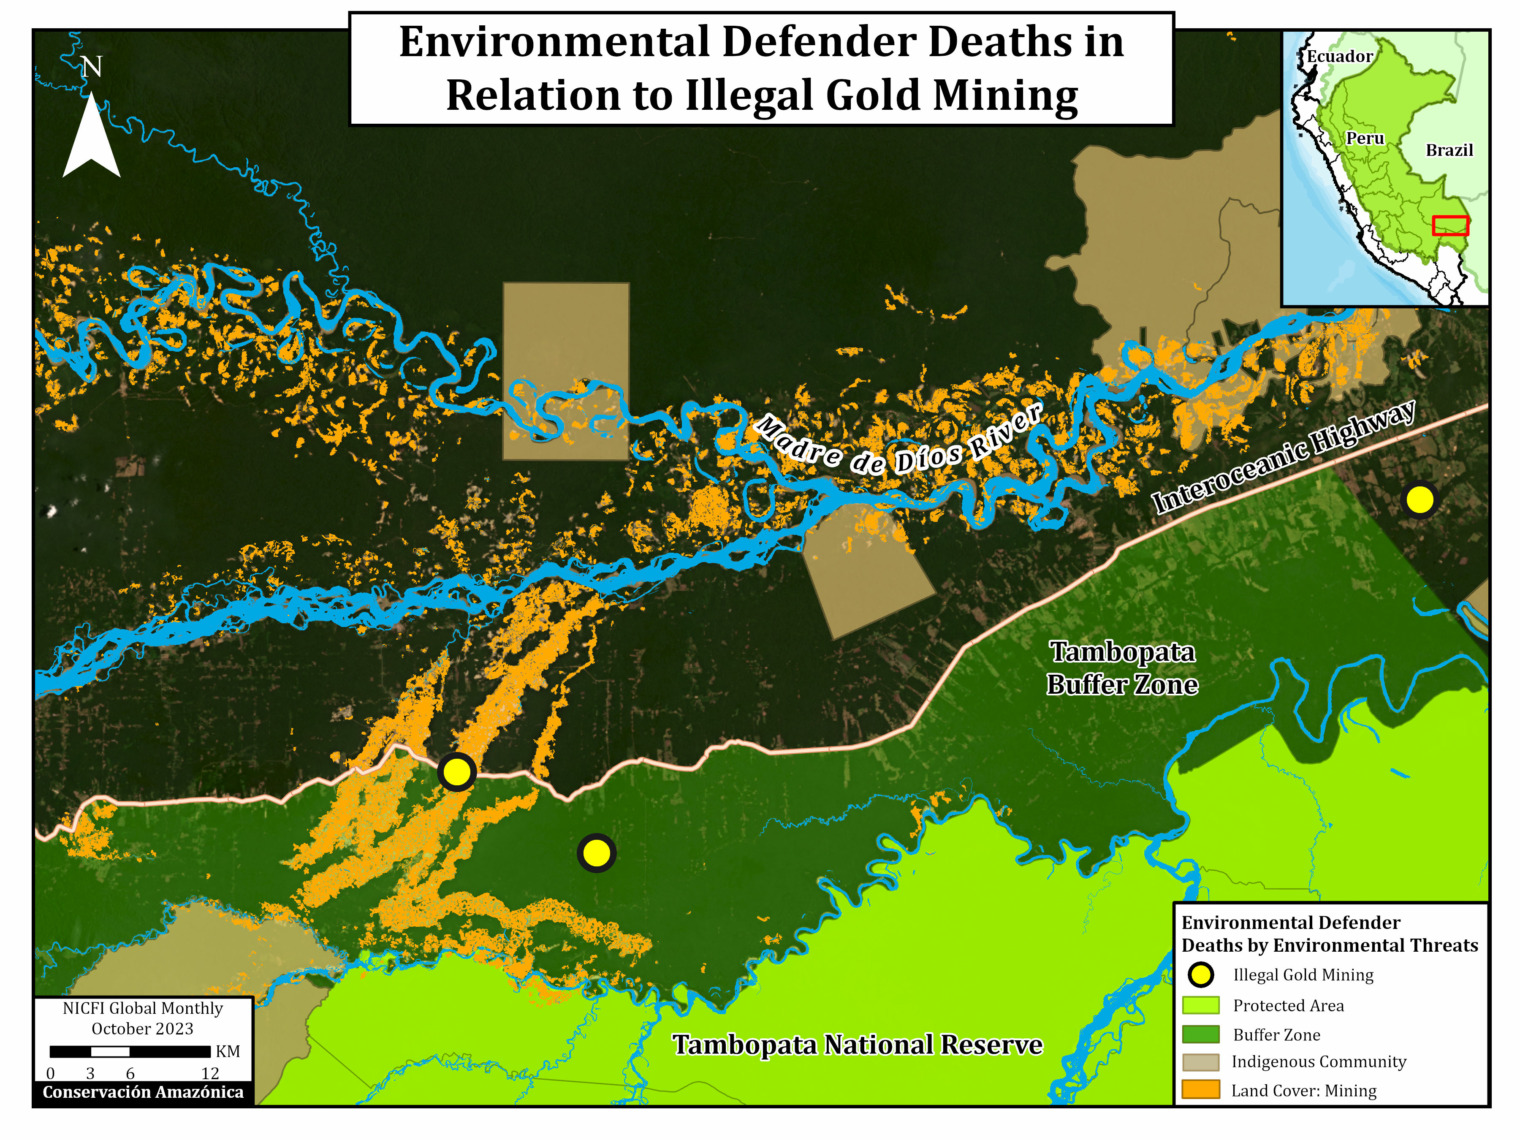
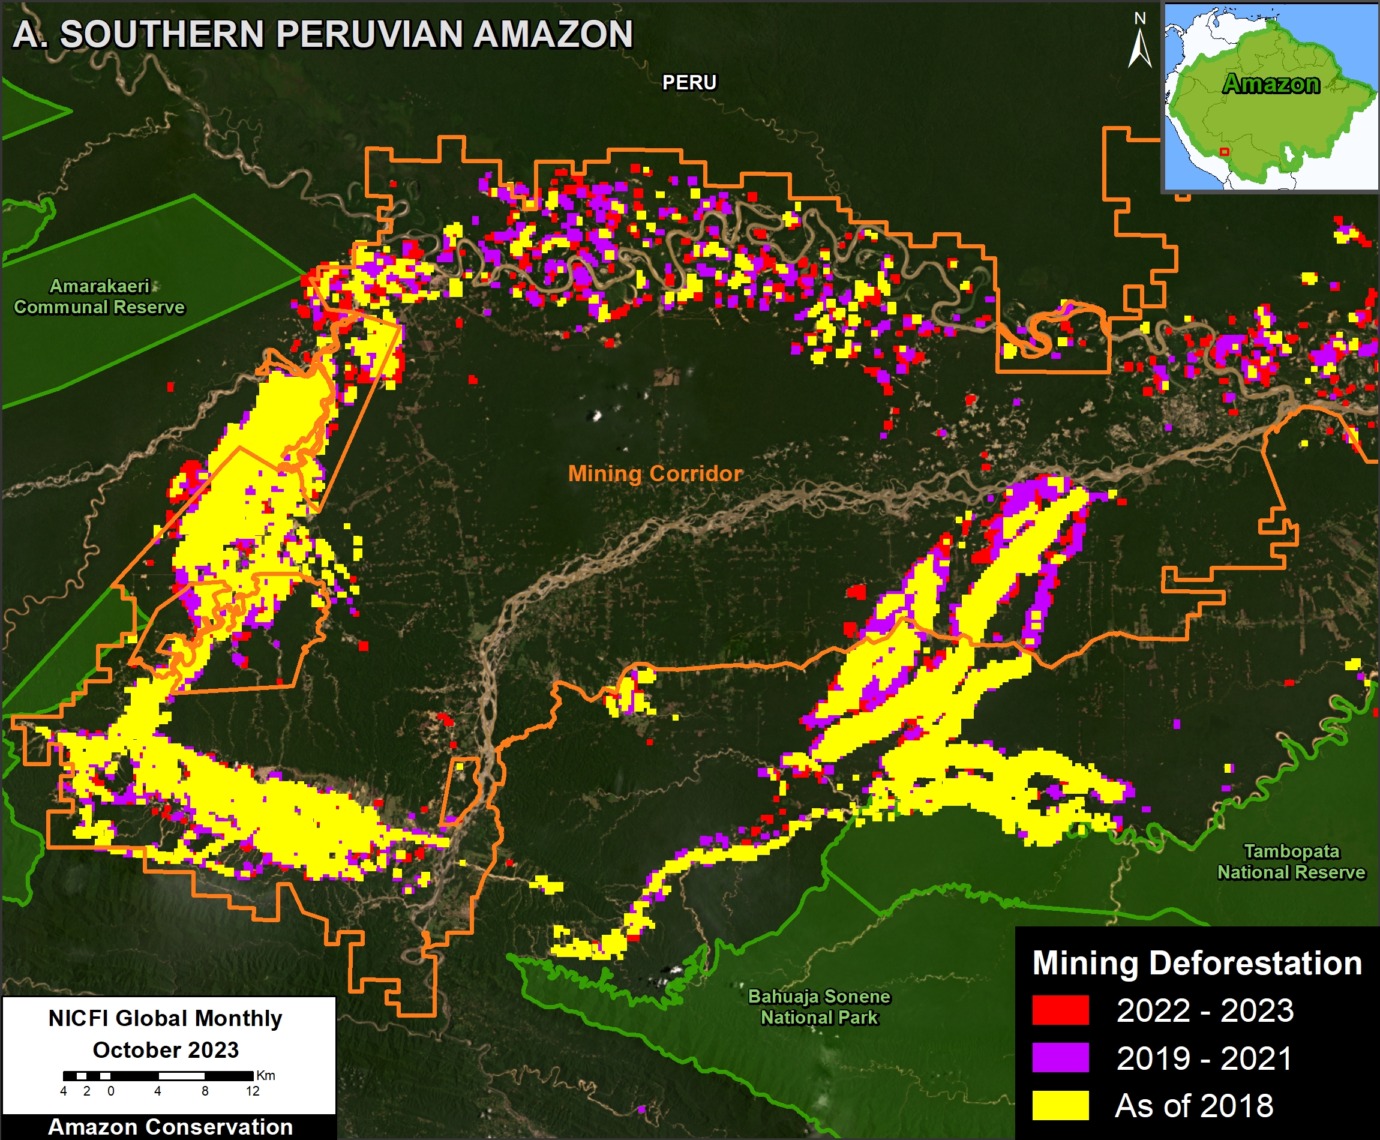
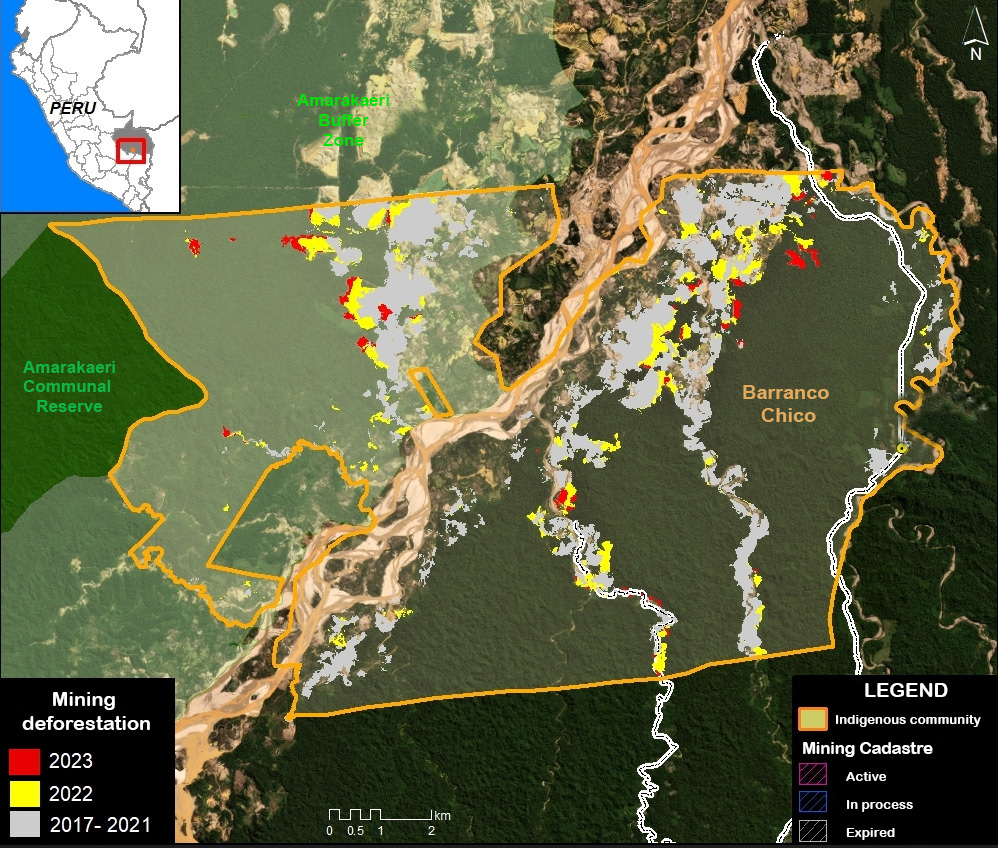
Figure 1. Recent expansion of illegal gold mining in the southern Peruvian Amazon. Data: Planet, NICFI
With the technical support of USAID (United States Agency for International Development) and Norad (Norwegian Agency for Development Cooperation),1 we have published a series of reports on the dynamic situation regarding gold mining in the southern Peruvian Amazon during recent years 2.
Illegal gold mining reached crisis levels between 2017 and 2018 in the area known as La Pampa (Madre de Dios region), eliminating thousands of hectares of primary forest in the buffer zone of the Tambopata National Reserve.
In early 2019, the Peruvian government implemented Operation Mercury, a multi-sectoral intervention against illegal mining, initially focusing on La Pampa. This operation was later replaced (in 2021) by the Restoration Plan, which included interventions in other critical mining areas of the Madre de Dios region in the southern Peruvian Amazon.
In this report, we offer a concise summary of the mining situation during the past three years (between January 2021 and March 2024) in the southern Peruvian Amazon, in the context of the Restoration Plan.
During this period, we recorded a total mining deforestation of 30,846 hectares (76,222 acres), equivalent to over 40,000 soccer fields.8
Of this total, three-quarters (74%) of the deforestation occurred within the official Mining Corridor, a large area (almost half a million hectares) where the government permits artisanal and small-scale mining to organize and promote this activity3. In other words, the vast majority of mining deforestation is not necessarily illegal, because it is in the corridor designated for this activity.
The remaining one-quarter (26%) of the deforestation corresponds to probable illegal mining. That is, mining activities carried out in prohibited areas outside the Mining Corridor, such as protected areas, their buffer zones, territories of Native Communities, and bodies of water.4
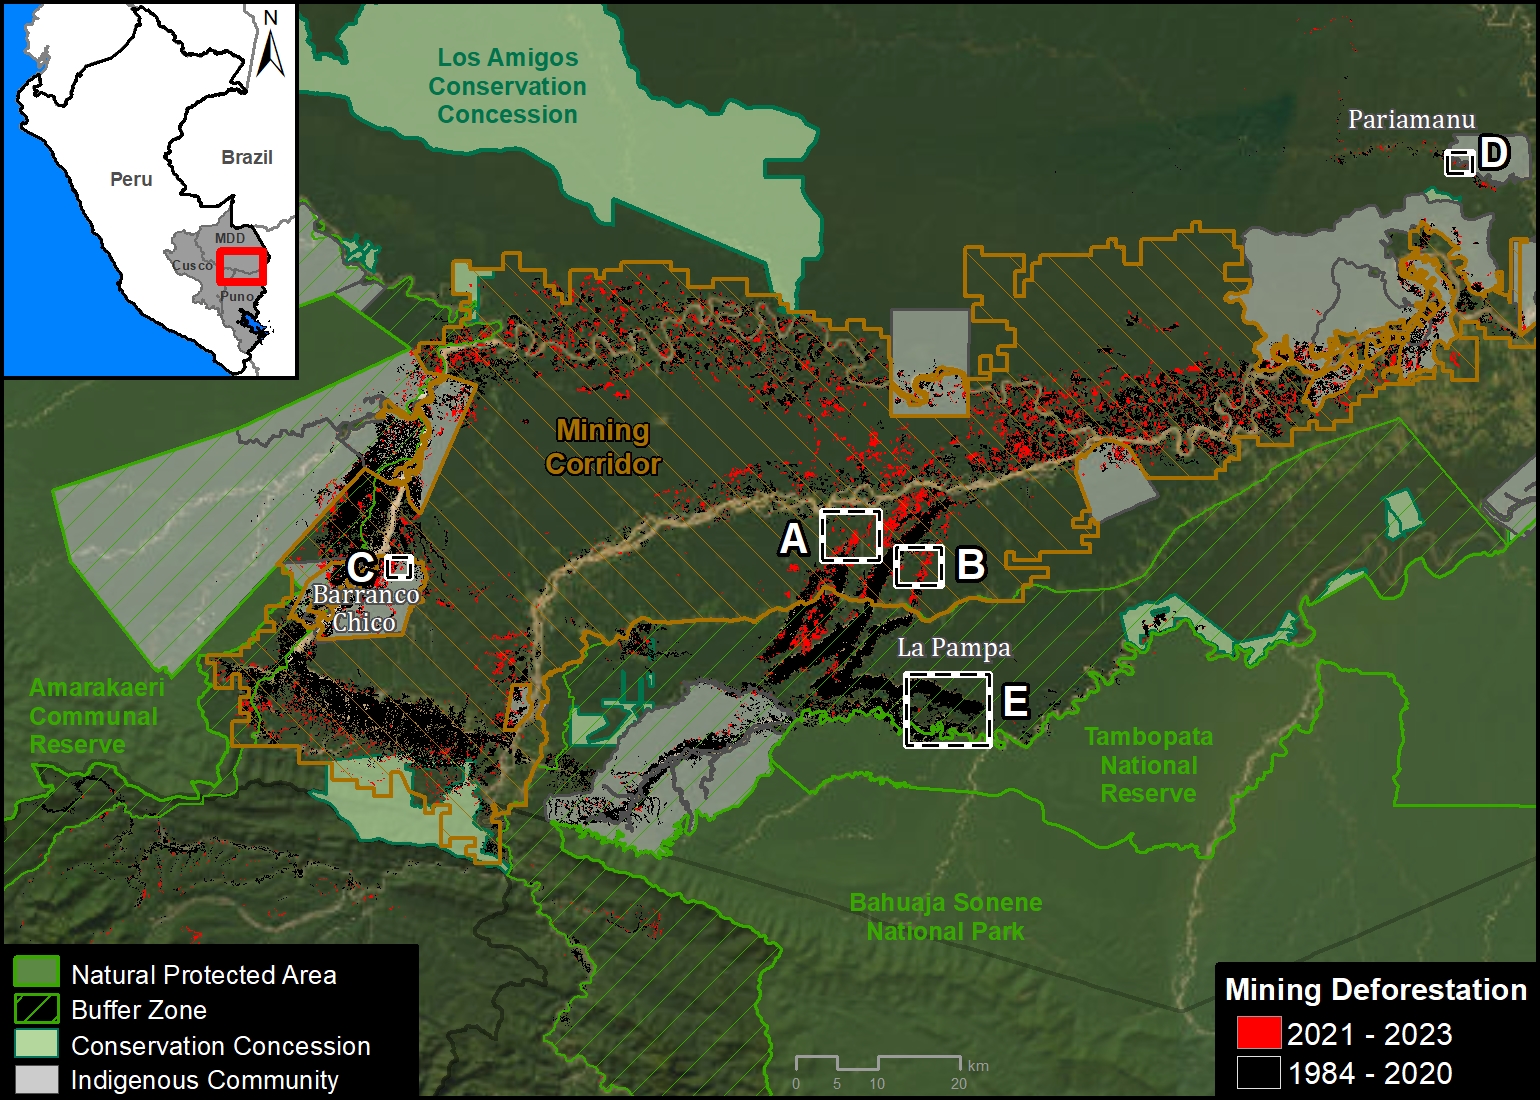
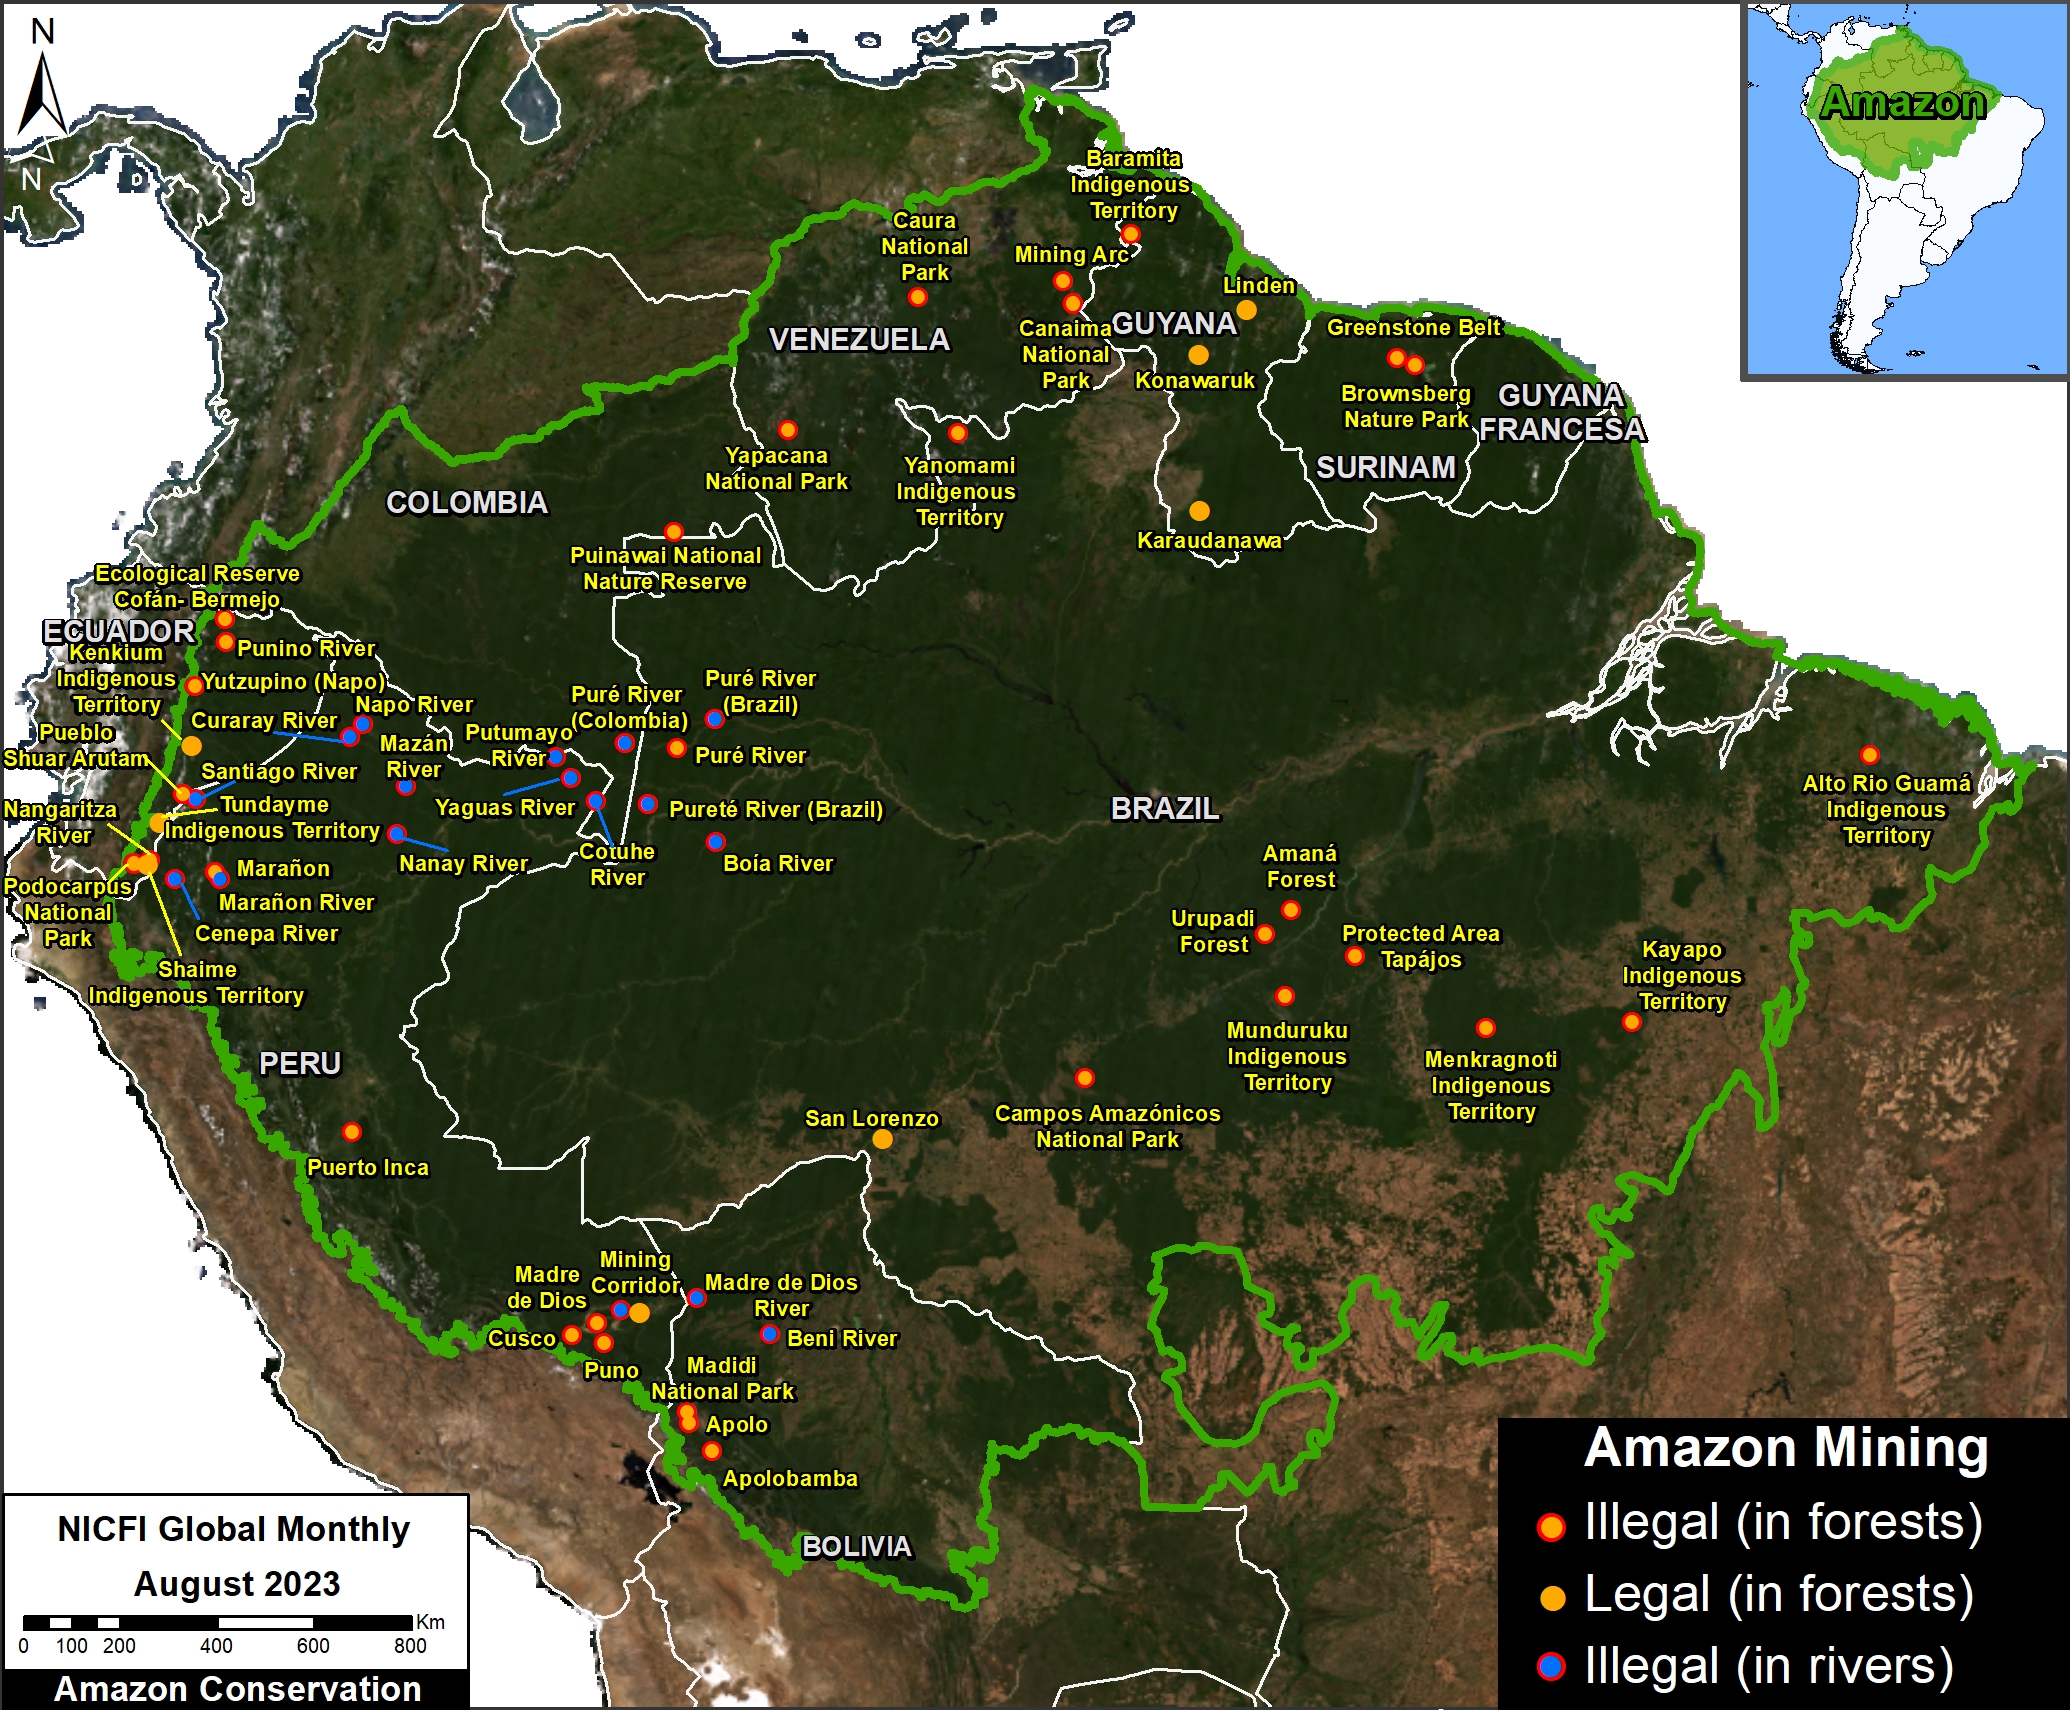
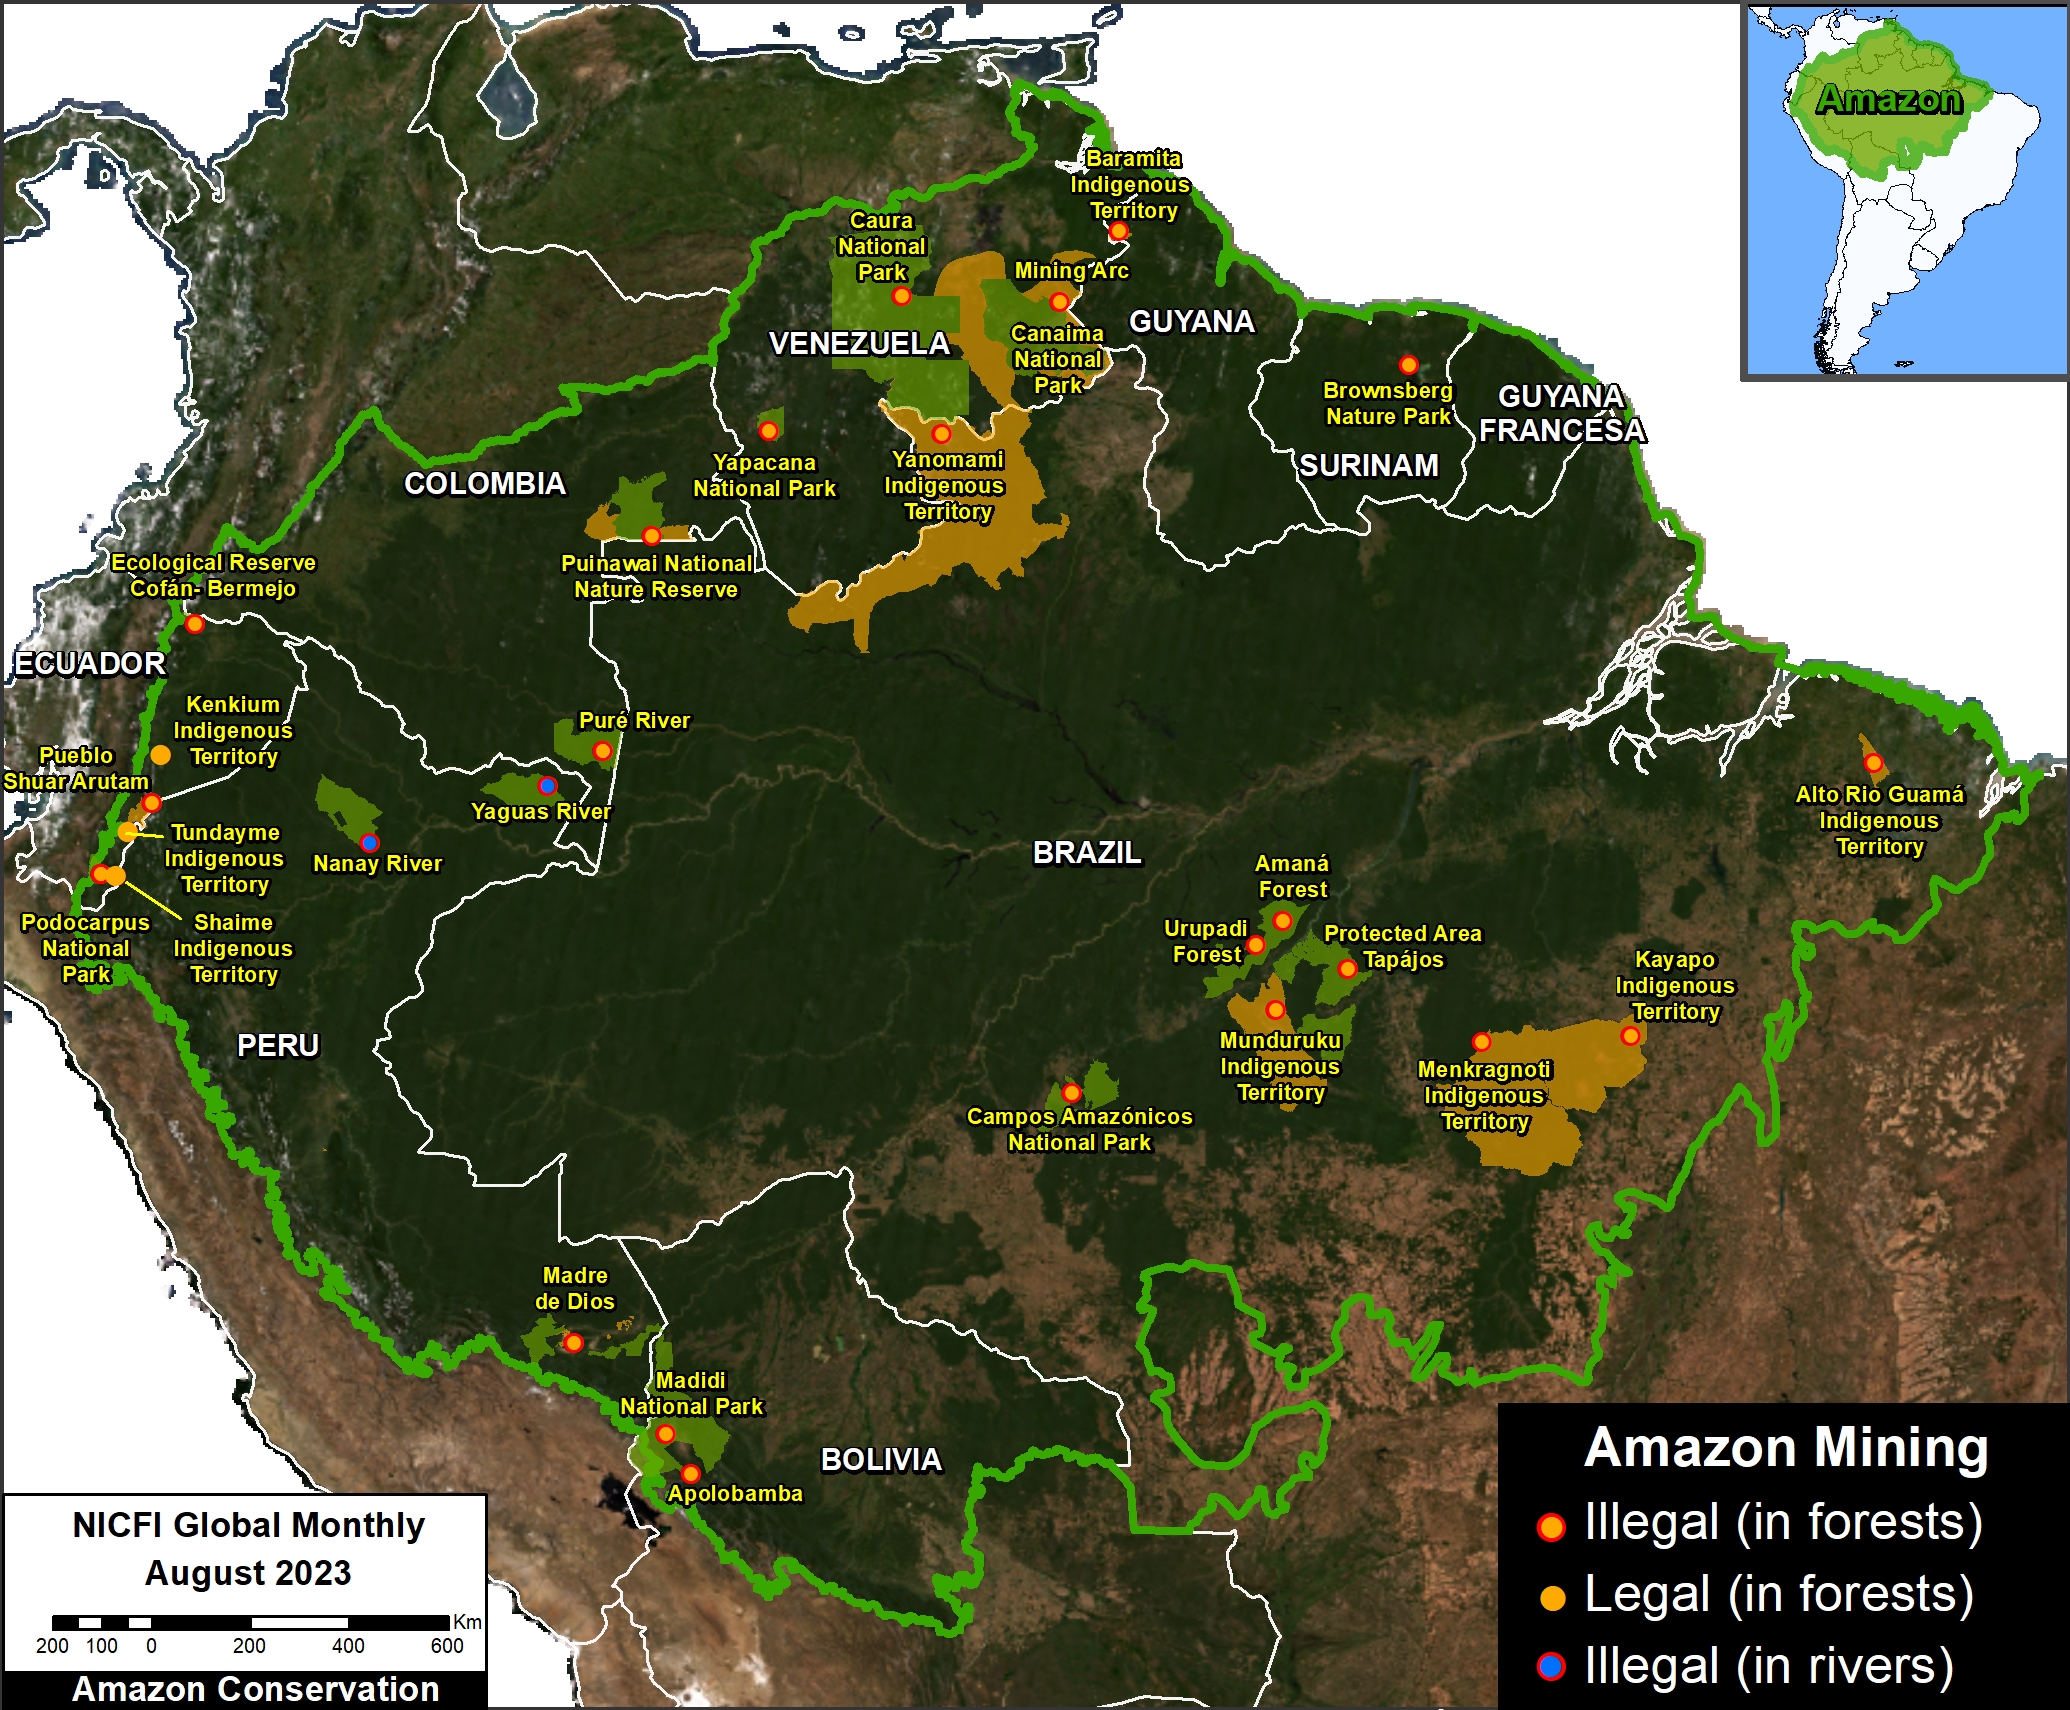
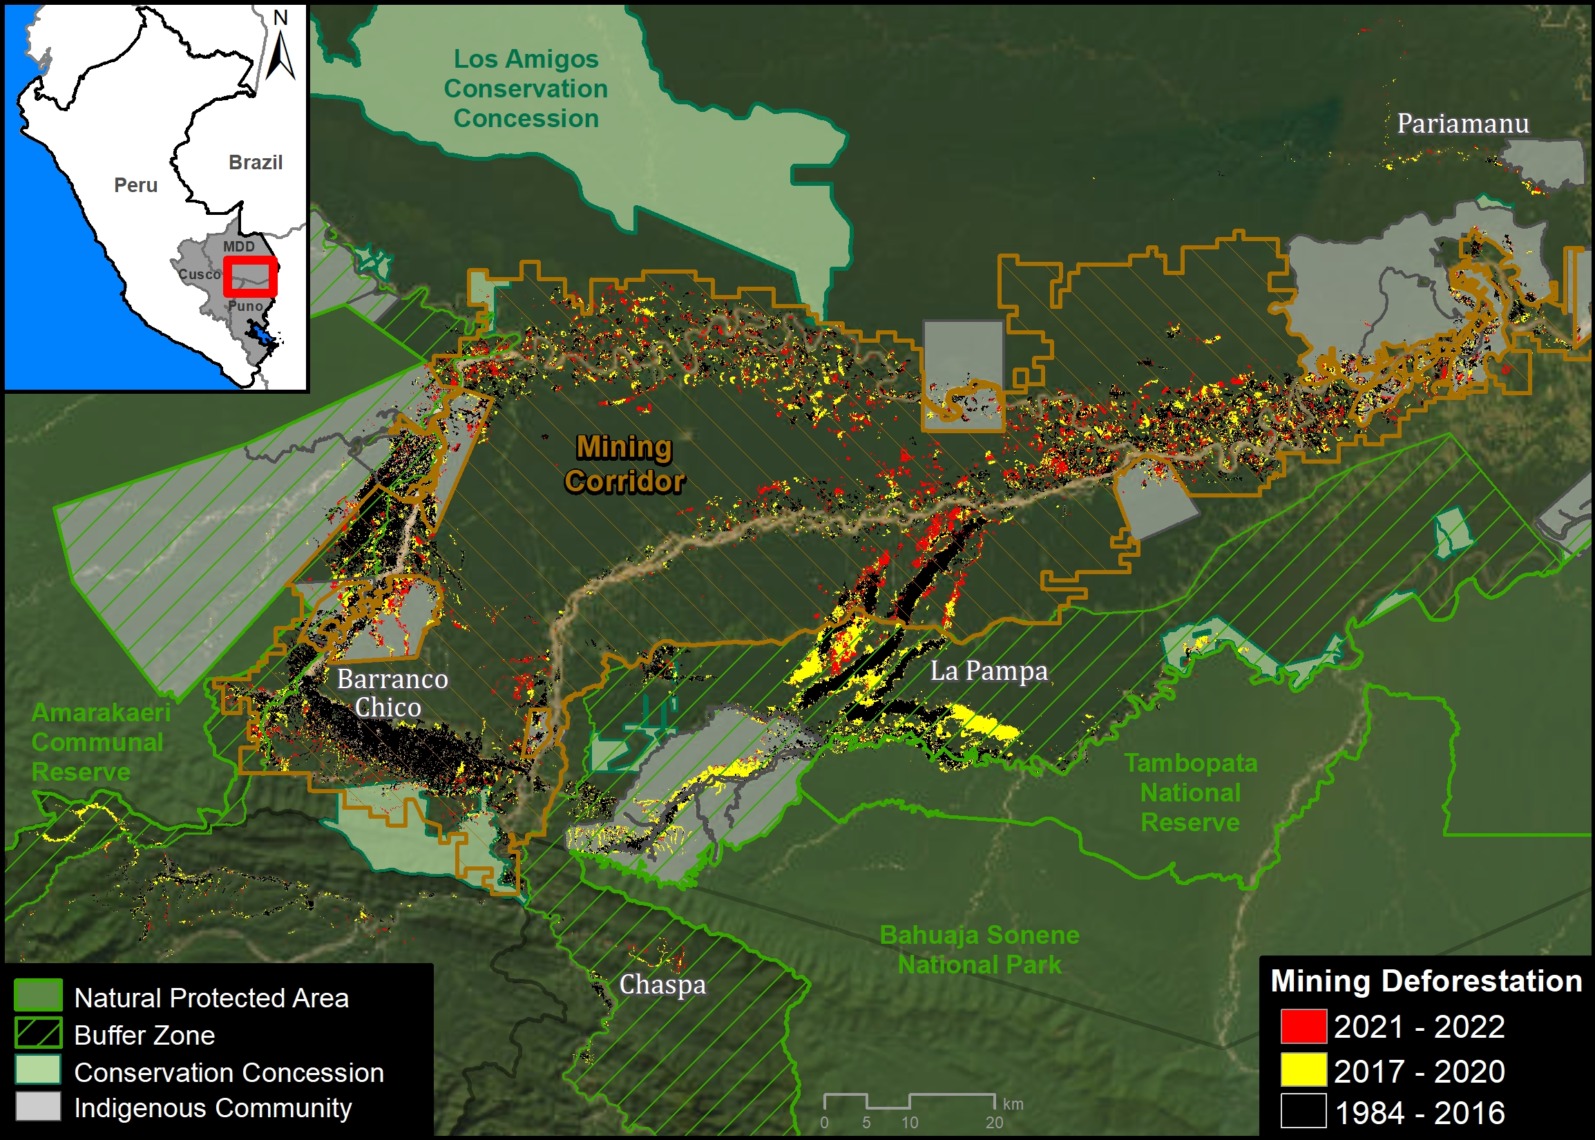
Base Map: Mining deforestation in the southern Peruvian Amazon
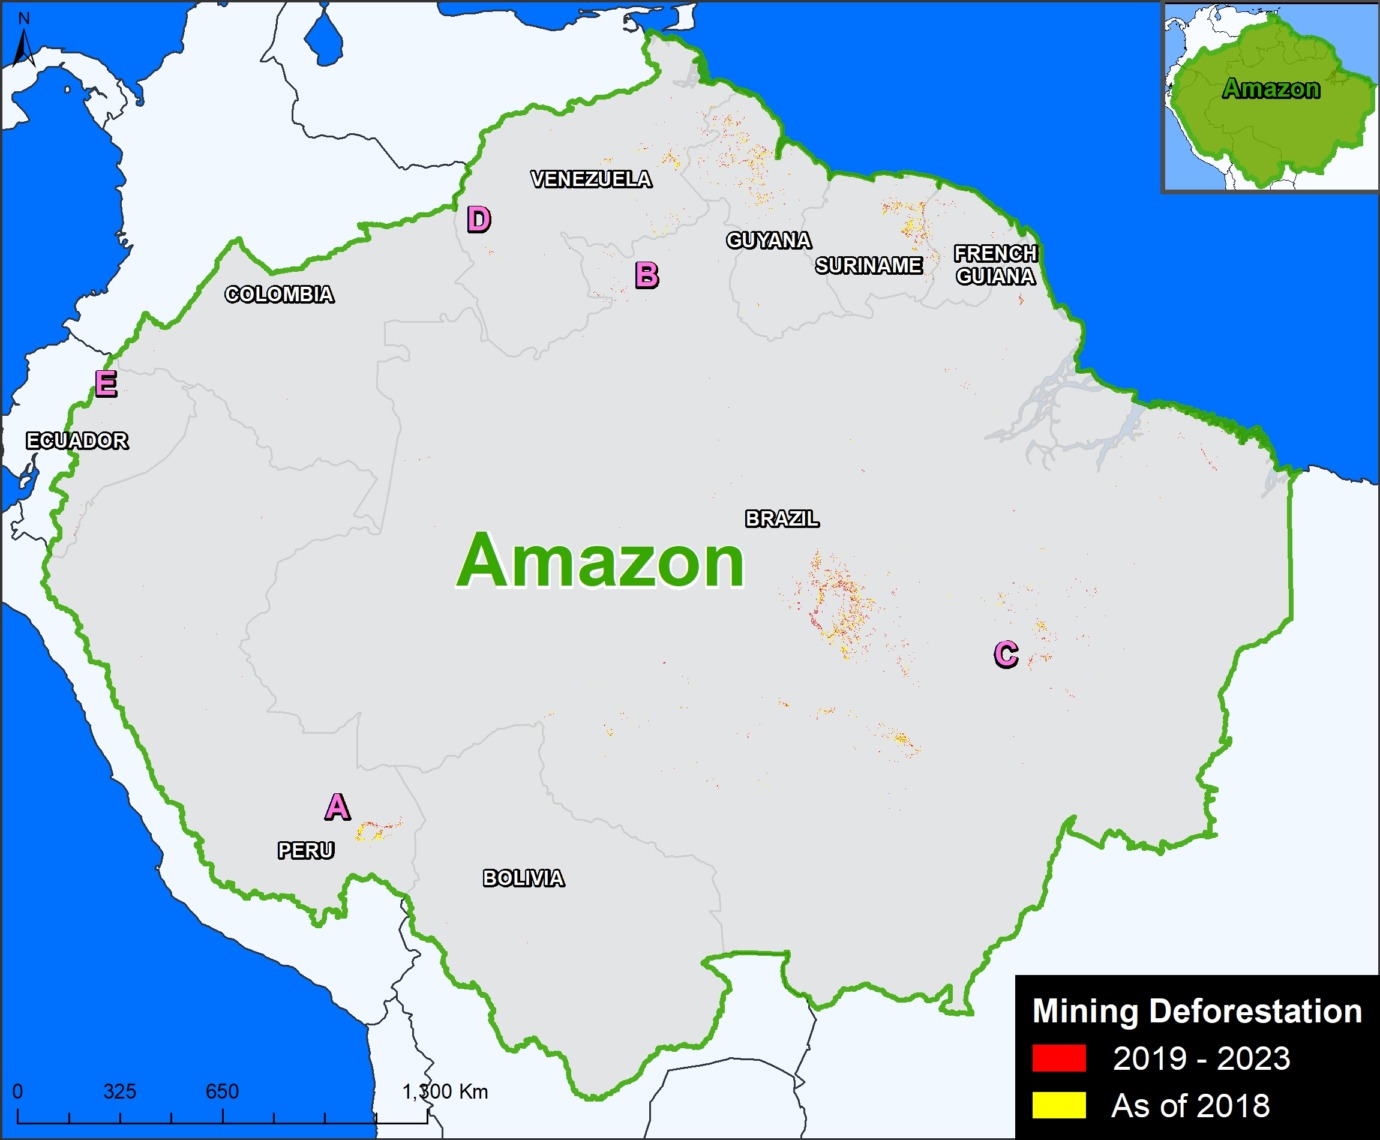
We highlight several important findings illustrated in the Base Map and Table 1, both presented below. In both cases, we highlight recent mining deforestation (between January 2021 and March 2024). Red indicates deforested areas outside of the Mining Corridor (representing our estimate of illegal mining), while yellow indicates recently deforested areas within the Mining Corridor.
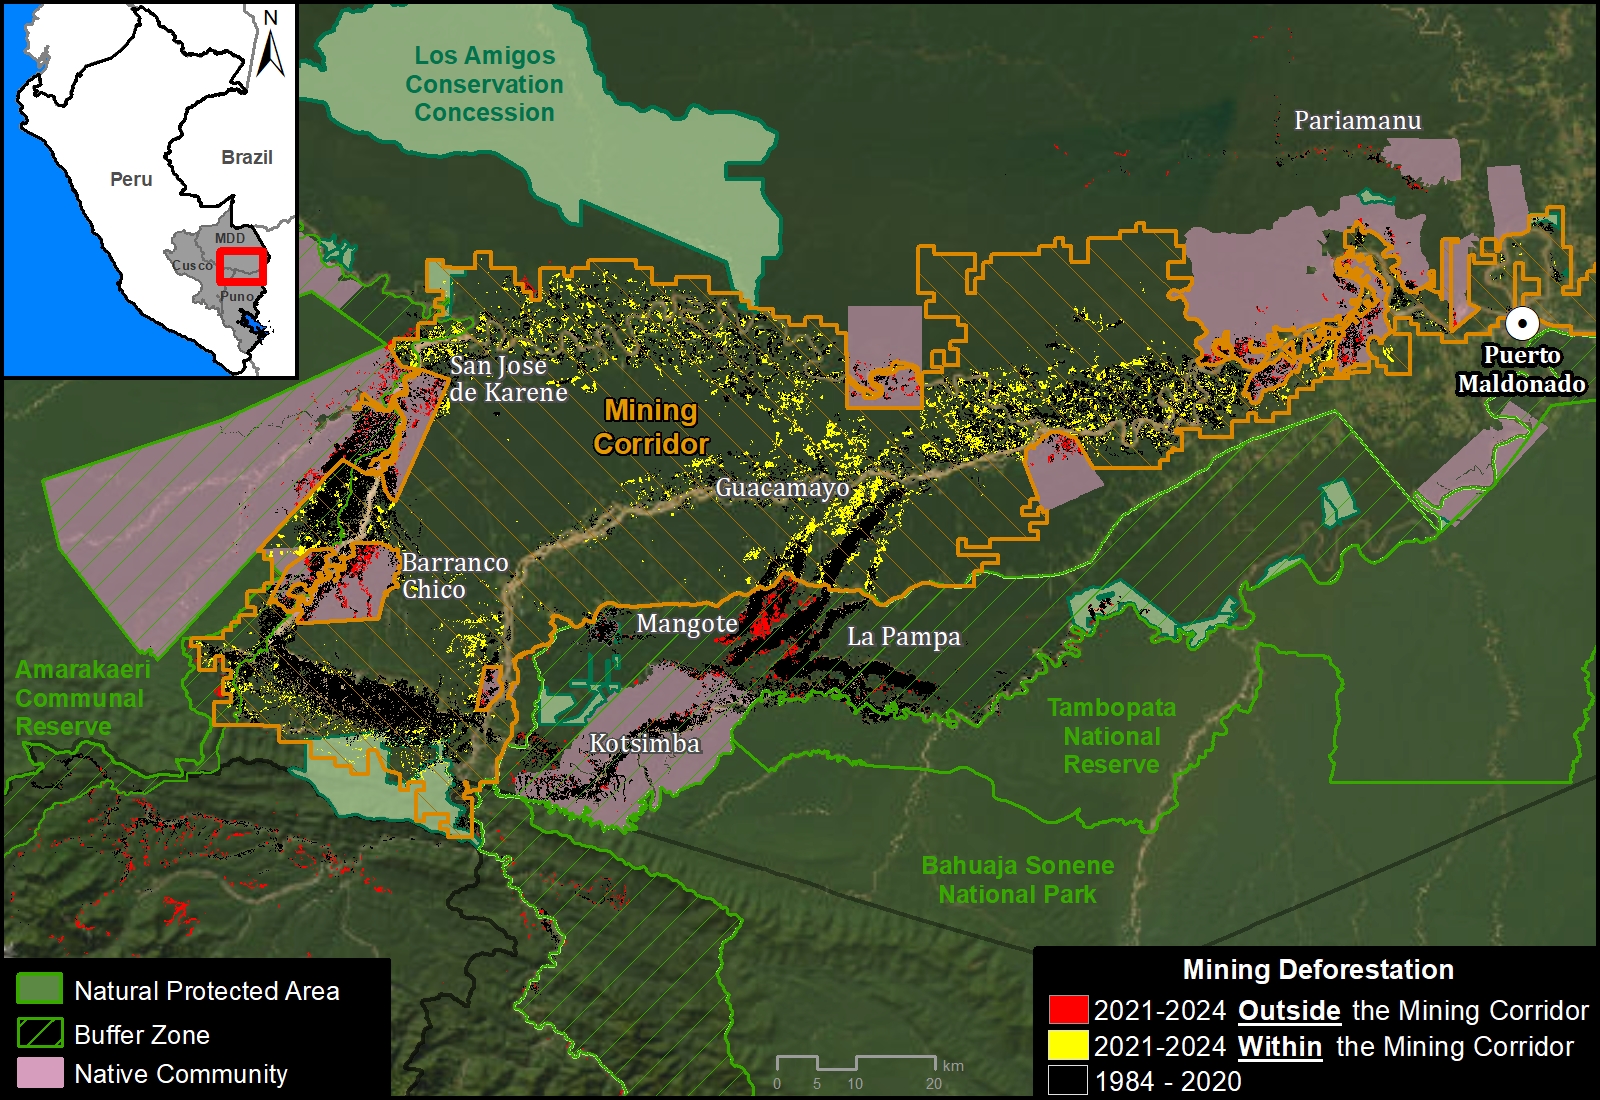
Base Map. Mining deforestation inside and outside the Madre de Dios Mining Corridor, in the southern Peruvian Amazon, between January 2021 and March 2024. Data: ACCA/MAAP.
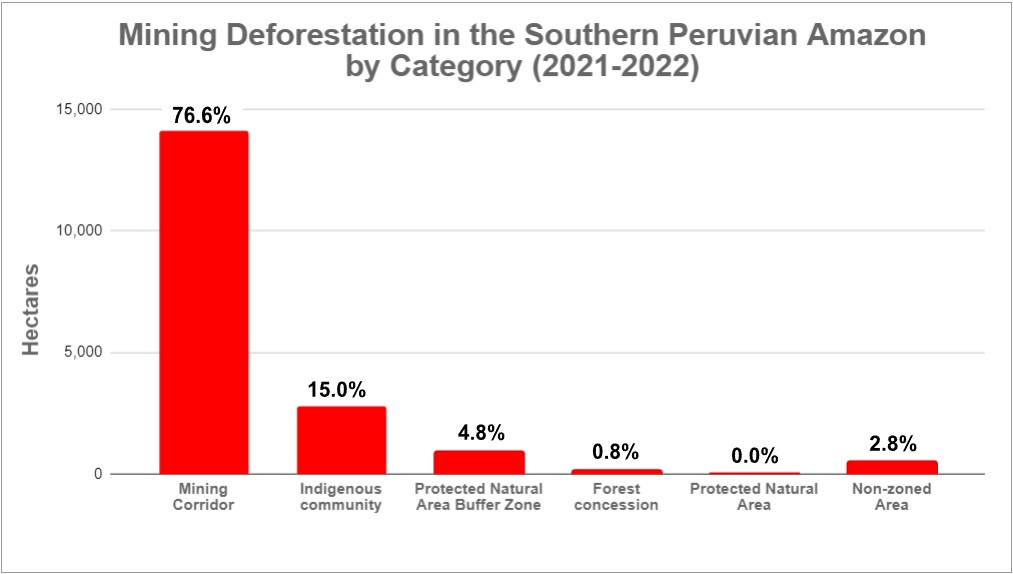
We found that mining deforestation is concentrated within the Mining Corridor, representing 73.8% of the total (22,756 hectares). This is especially evident in the Guacamayo mining area and along the Madre Dios River.
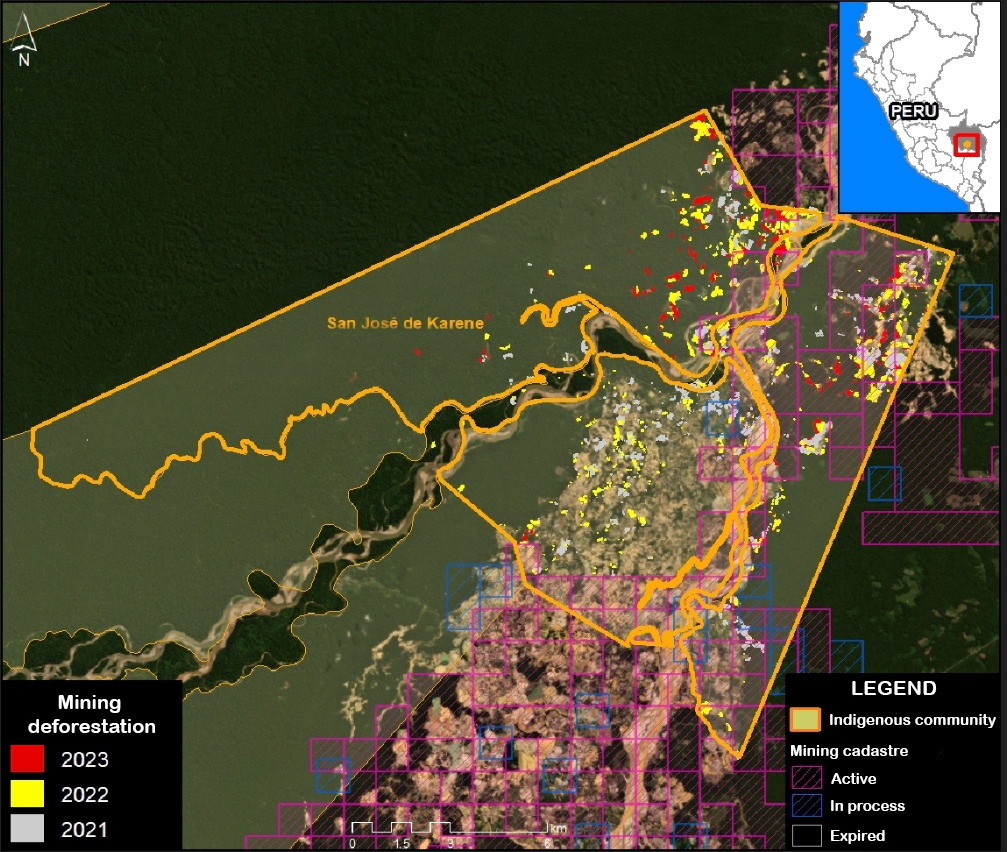
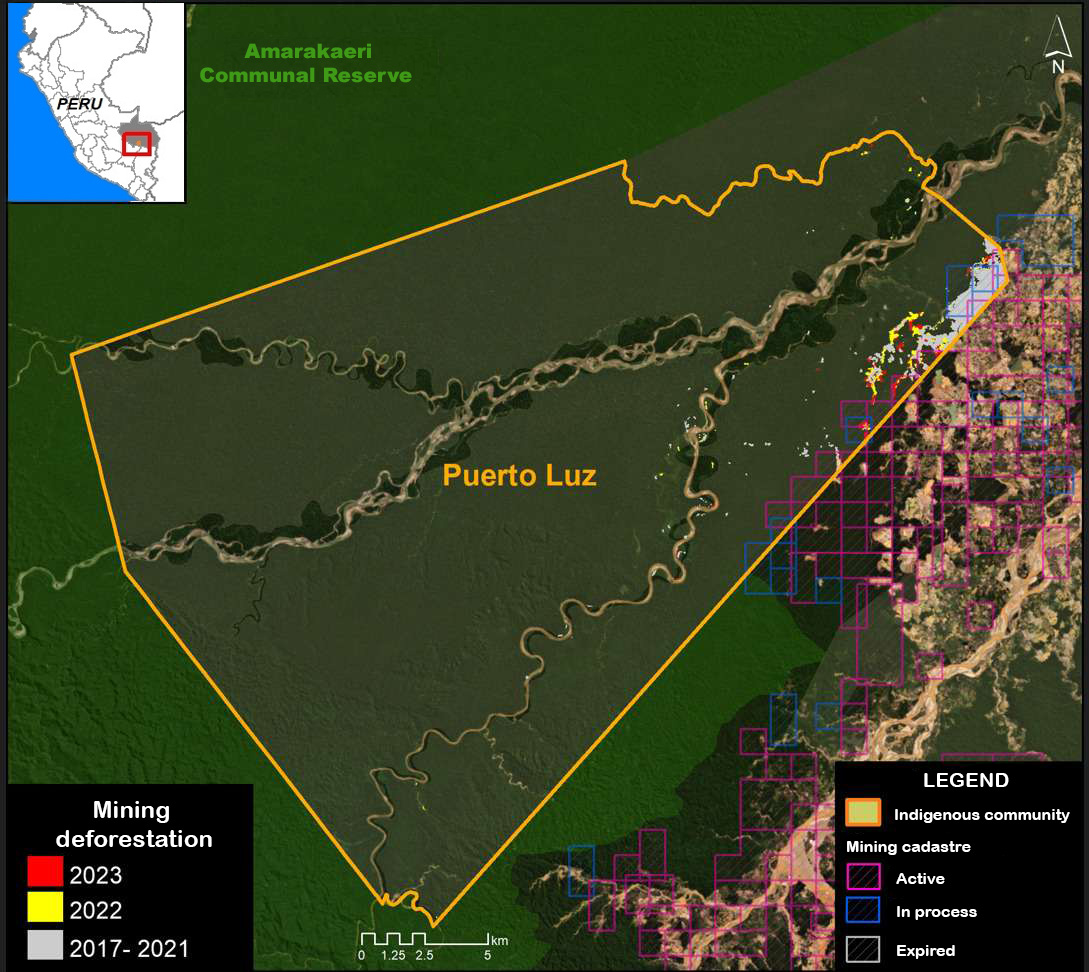
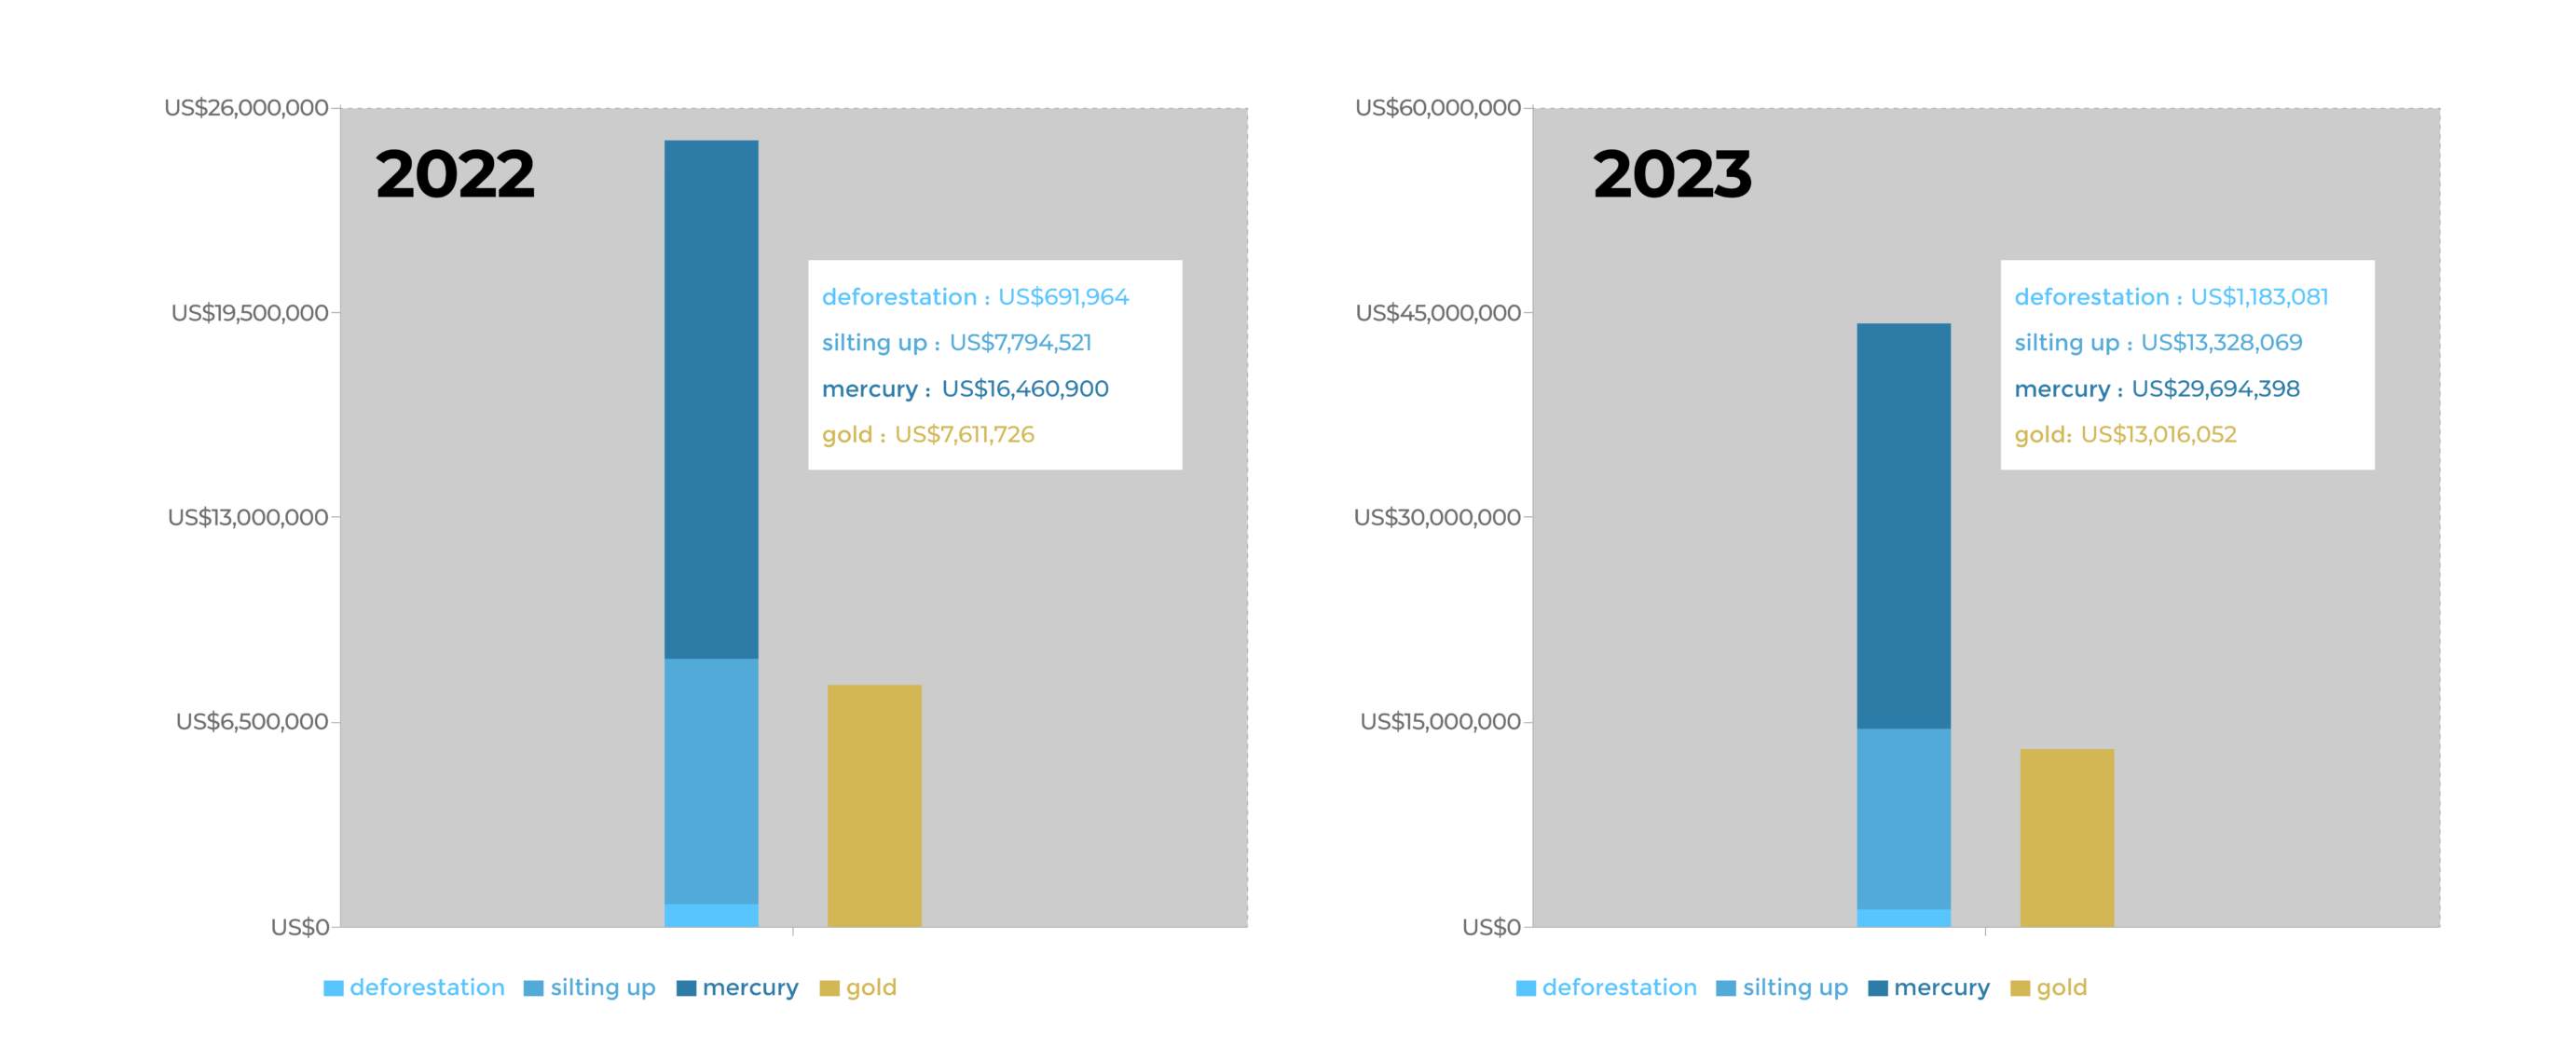
The rest of the mining deforestation (26.2%) is outside the Mining Corridor. The majority of this deforestation (14.6%) is occurring in the 10 Native Communities of the area, covering a total of 4,494 hectares. The most affected communities are San José de Karene (1,099 ha), Barranco Chico (1,008 ha) and Tres Islas (827 ha), followed by Puerto Luz (305 ha), Boca Inambari (305 ha), Kotsimba (297 ha), San Jacinto (269 ha), Shiringayoc (267 ha), Arazaire (78 ha) and El Pilar (40 ha). However, there are different trends. For example, mining deforestation between 2021 and 2024 has decreased in Barranco Chico, while it has increased in San José de Karene, Tres Islas and Boca Inambari.
We also identified mining deforestation of 2,439 hectares (7.9%) in buffer zones of Protected Areas. The most affected are Tambopata National Reserve (such as the Mangote area, see Figure 1), Bahuaja Sonene National Park, and Amarakaeri Communal Reserve. However, it must be emphasized that mining within the actual Protected Areas has been effectively controlled by the Peruvian government, through the National Service of Protected Natural Areas (SERNANP).
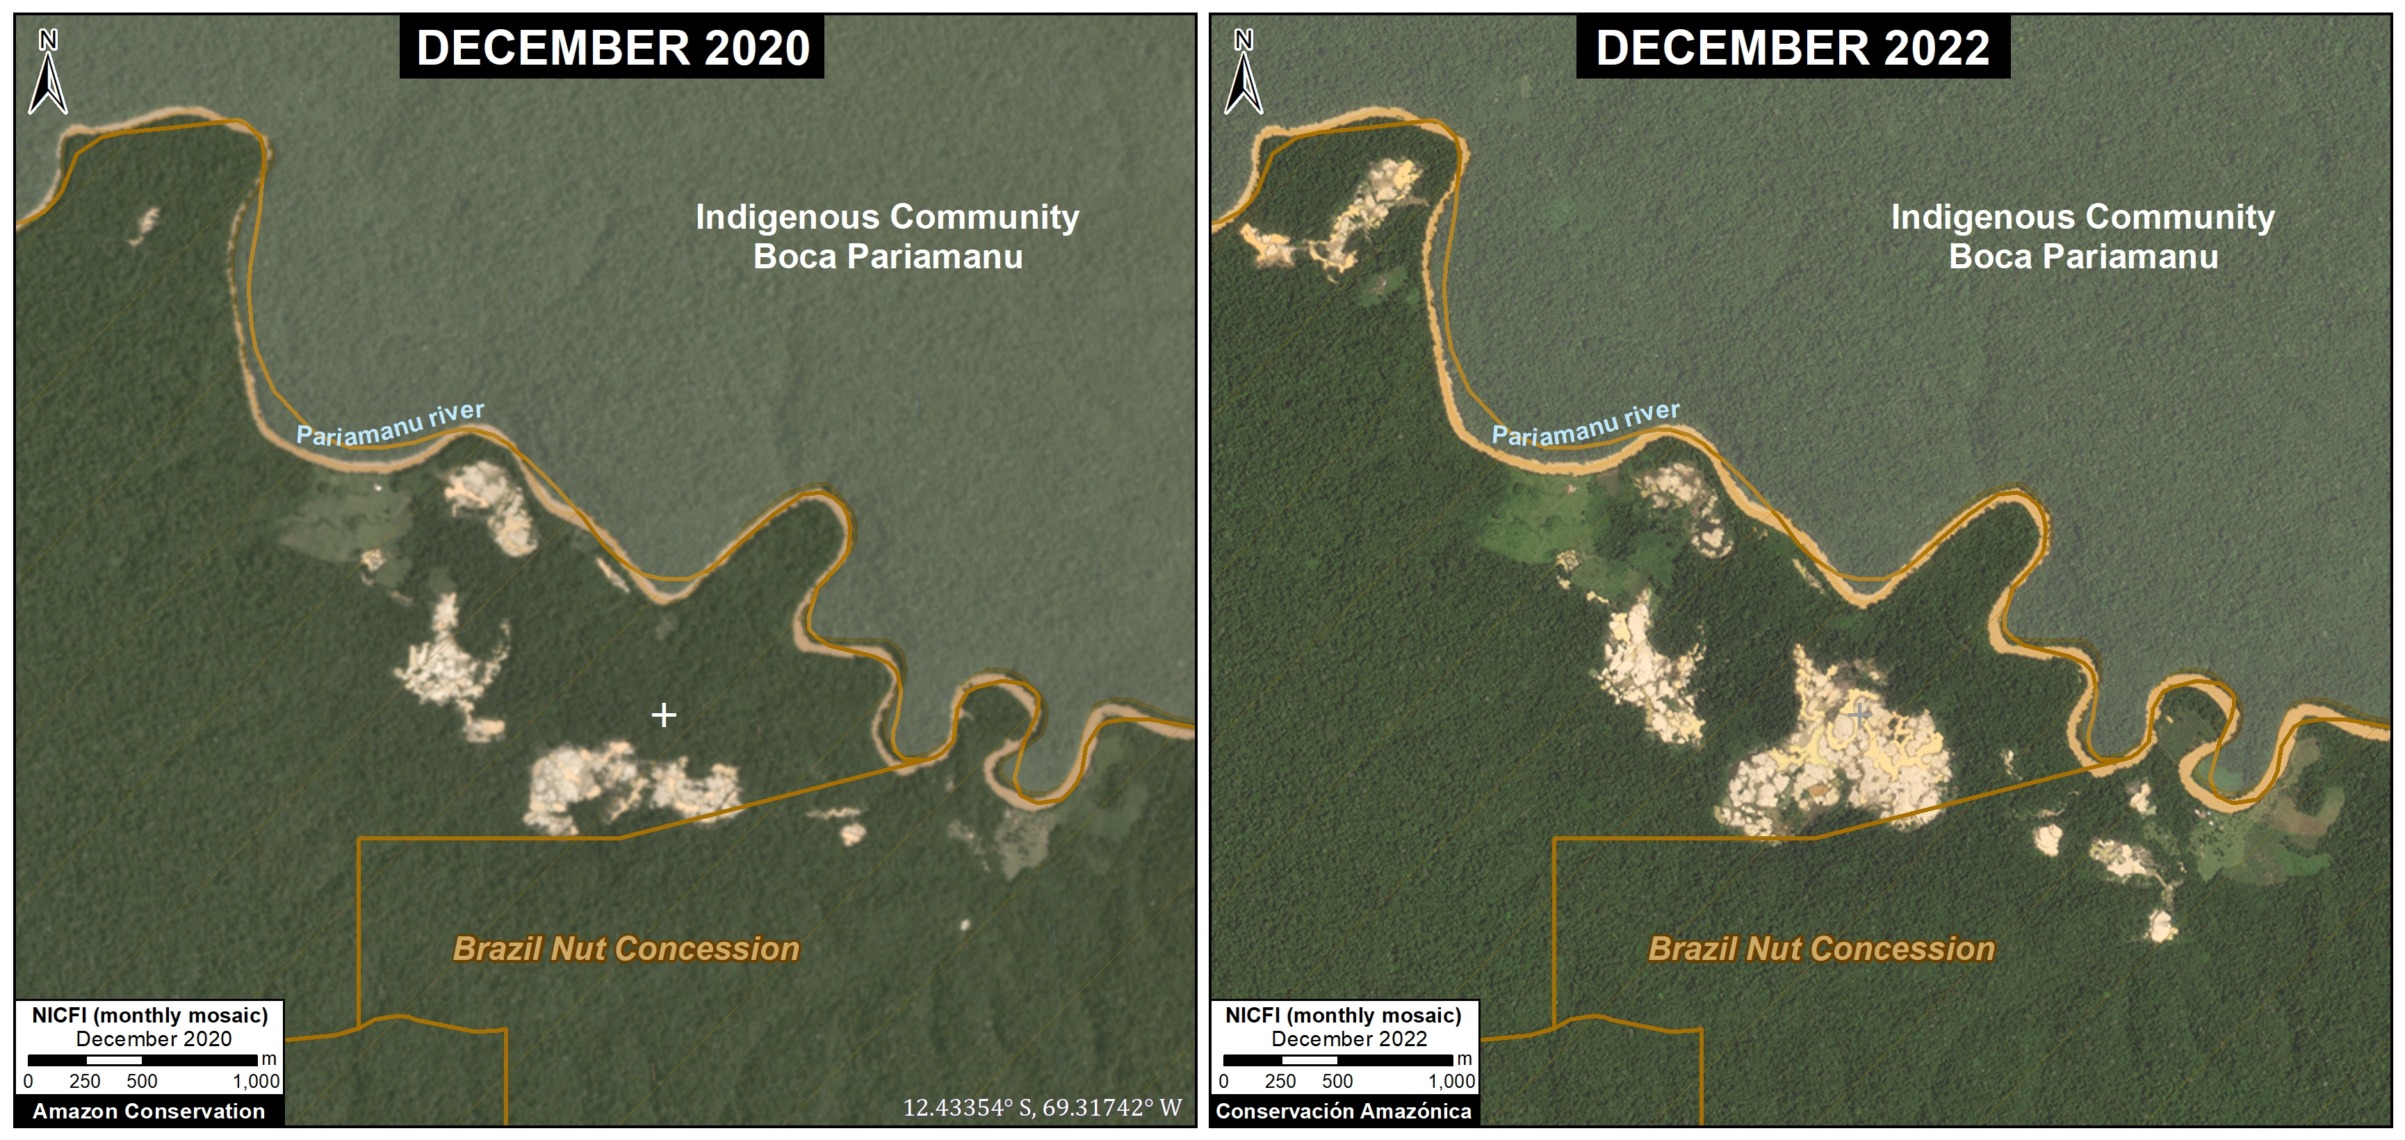
In addition, we detected some mining deforestation (198 hectares) in Brazil nut forestry concessions located in the Pariamanu area.
Finally, it is important to mention that in the critical area known as La Pampa (noted above), the expansion of mining deforestation has been effectively stopped after Operation Mercury. A recent report (MAAP #193), however, showed a large increase in mining activity in previously deforested areas of La Pampa.
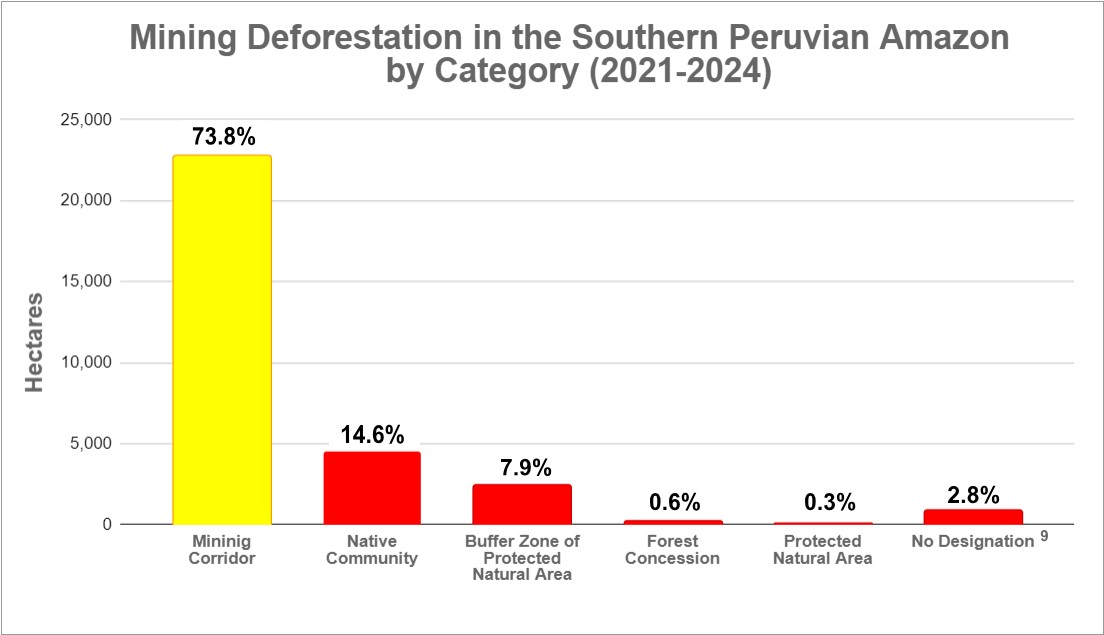
Table 1. Mining deforestation by category in the southern Peruvian Amazon, between January 2021 and March 2024. Data: ACA/MAAP.
Monitoring & Control of Native Communities by FENAMAD
As noted above, a large portion of the illegal mining deforestation in the southern Peruvian Amazon is occurring within the territory of the Native Communities. These Native Communities are part of an articulated federation known as FENAMAD, which is the regional representative organization of the indigenous peoples of the Madre de Dios River basin. FENAMAD defends the fundamental and collective rights of indigenous peoples and native communities, including indigenous peoples in situations of isolation and initial contact.
In a strategic collaboration, FENAMAD has been working together with Amazon Conservation to combat illegal mining that affects the territory of native communities. This collaboration is carried out as follows:
1. First, FENAMAD identifies priority communities threatened by illegal mining and requiring urgent monitoring.
2. Subsequently, Amazon Conservation leads real-time satellite monitoring in these prioritized communities and delivers confidential reports to FENAMAD.
3. FENAMAD then reviews the reports together with the territory monitors and the results are shared with the affected native communities who decide whether these cases require a legal process.
4. FENAMAD formulates the Environmental Legal Complaint files and delivers them to the corresponding government institutions (Prosecutor’s Office Specialized in Environmental Matters of Madre de Dios –FEMA, National Police of Peru –PNP, Ecological Police of Peru, among others).
5. Finally, in selected cases, the government organizes and directs an on-the-ground operation against illegal mining activity and associated equipment.
This process has led to the execution of 5 government-led operations between 2022 and 2024, in three communities: Barranco Chico, Kotsimba and San José de Karene (see Base Map).
Of these operations, 3 took place in the community of Barranco Chico,5 which has been especially affected by illegal mining deforestation (967 hectares in the last three years). Figure 2 indicates the location of these operations. It should be noted that mining deforestation in Barranco Chico has decreased between 2021 and 2024, likely due to these types of interventions.
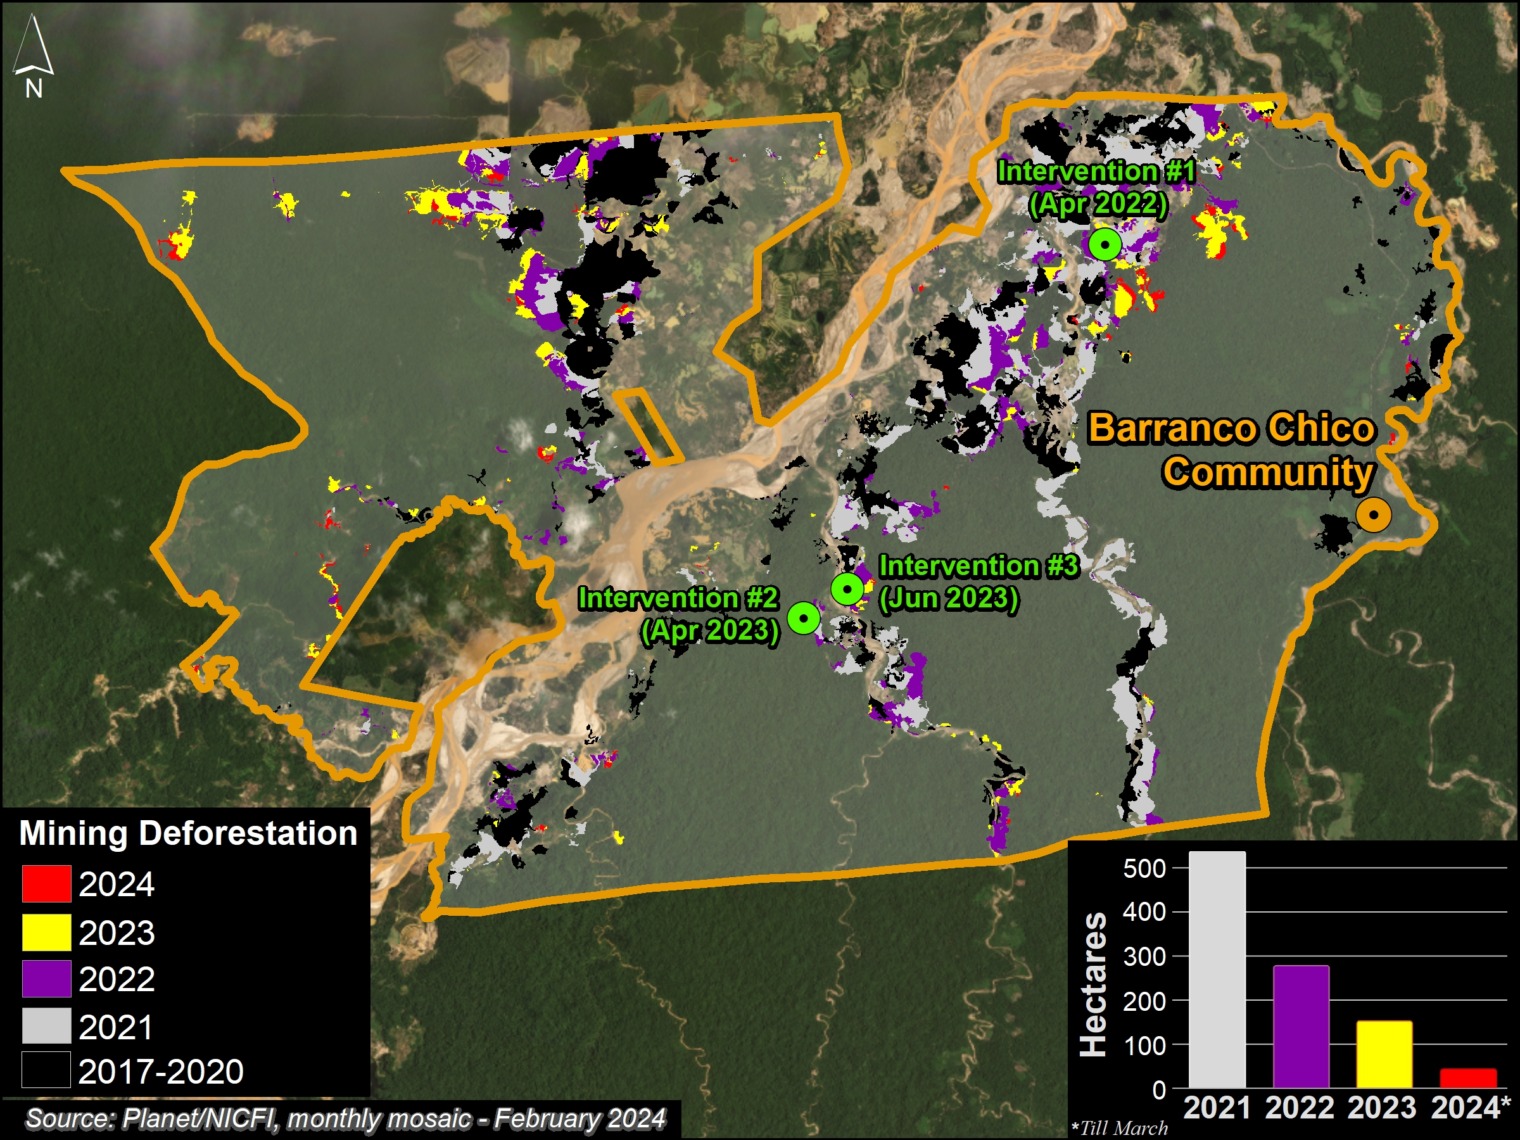
Figure 2. Location of operations against illegal mining in the Barranco Chico Native Community.
The other operations occurred in the communities of Kotsimba6 and San José de Karene7.
It is worth noting that this collaboration between FENAMAD and Amazon Conservation, which is supported by the Norwegian Agency for Development Cooperation (NORAD), is currently expanding to additional native communities within the impacted region.
Notes
1 USAID Prevent works with the Government of Peru, civil society and the private sector to prevent and combat environmental crimes for the conservation of the Peruvian Amazon, particularly in the regions of Loreto, Madre de Dios and Ucayali. USAID’s Prevent Project also has support from the Norwegian Agency for Development Cooperation (NORAD).
2 Previous MAAP reports about gold mining in the southern Peruvian Amazon:
MAAP #195: GOLD MINING DEFORESTATION IN THE SOUTHERN PERUVIAN AMAZON, 2021-2023
https://www.maapprogram.org/2023/mining-deforest-peru
November 2023
MAAP #185: GOLD MINING DEFORESTATION IN THE SOUTHERN PERUVIAN AMAZON: 2021-2022 UPDATE
https://www.maapprogram.org/2023/peru-gold-mining-update/
June 2023
MAAP #171: DEFORESTATION IN MINING CORRIDOR OF PERUVIAN AMAZON (2021-2022)
https://www.maapprogram.org/2022/mining-corridor-peru/
December 2022
MAAP #154: ILLEGAL GOLD MINING IN THE PERUVIAN AMAZON – 2022 UPDATE
https://www.maapprogram.org/2022/gold-mining-peru-update/
May 2022
3 The Mining Corridor, named by Legislative Decree No. 1100, as the “Zone of small mining and artisanal mining in the department of Madre Dios”, catalogs mining activities as:
– Formal: It is carried out with authorization for exploration and exploitation in a specific area, with conditions and operations regulated by the legal framework of the mining sector. It has approved environmental, administrative and operational permits.
– Informal: Artisanal and small-scale mining operates in permitted areas for mineral extraction and uses permitted machinery. Although it does not have authorization to carry out mining activity, it is in the formalization process in accordance with the provisions of Legislative Decree No. 1105, which establishes provisions for the formalization process of small-scale mining and artisanal mining activities. Therefore, it is considered an administrative infraction, but not a crime.
– Illegal: Exploration, extraction and exploitation of mineral resources in prohibited areas (such as Protected Areas and bodies of water) and using prohibited machinery, failing to comply with administrative, technical and environmental requirements established in Peruvian legislation. This is a crime stipulated in article 207-A of the Penal Code, which carries a custodial sentence.
4 Although keep in mind that there may be mining concessions within the Native Community territories.
5 FEMA operations in the Barranco Chico community occurred in April 2022 (América Televisión video), April 2023 (El Comercio) and June 2023. There was an initial operation before the project in 2021.
6 FEMA operation in the Kotsimba community occurred in October 2023.
7 FEMA operation in the community of San José de Karene occurred in April 2024.
8 Of this total (30,846 hectares), 28,292 hectares occurred during 2021-2023, while 2,554 hectares occurred in the first quarter of 2024.
9 Undesignated refers to areas without a formal designation and not included in any of the other categories.
Methodology
We used LandTrendR, a temporal segmentation algorithm that identifies changes in pixel values over time, to detect forest loss within the mining corridor between January 2021 and March 2024 using the Google Earth Engine platform. Importantly, this method was originally designed for moderate resolution Landsat imagery (30 meters)1, but we adapted it for higher spatial resolution (4.7 meters) NICFI-Planet monthly mosaics.2
In addition, we created a baseline for the period 2016 – 2020 to eliminate previously deforested areas (pre 2021), to account for rapid changes in the natural revegetation process.
Finally, we manually separated forest loss from mining vs other causes, to report specifically on direct mining-related impacts between 2021 and 2024. We used several resources to help this manual process, such as alerts with radar images (RAMI) from the SERVIR Amazonía program, historical data from the Amazon Scientific Innovation Center – CINCIA (from 1985 to 2021), and forest loss data from the Peruvian state (National Forest Conservation Program for Climate Change Mitigation) and the University of Maryland.
- Kennedy, R.E., Yang, Z., Gorelick, N., Braaten, J., Cavalcante, L., Cohen, W.B., Healey, S. (2018). Implementation of the LandTrendr Algorithm on Google Earth Engine. Remote Sensing. 10, 691.
- Erik Lindquist, FAO, 2021
Acknowledgments
We especially thank FENAMAD for this important strategic collaboration.
This report was prepared with the technical support of USAID through the Prevent Project. Prevent (Proyecto Prevenir in Spanish) works with the Government of Peru, civil society, and the private sector to prevent and combat environmental crimes for the conservation of the Peruvian Amazon, particularly in the regions of Loreto, Madre de Dios, and Ucayali. USAID’s Prevent Project also has support from the Norwegian Agency for Development Cooperation (NORAD).
This publication is made possible by the generous support of the American people through USAID. The contents are the sole responsibility of the authors and do not necessarily reflect the views of USAID or the United States Government.

Citation
Finer M, Mamani N (2024) Gold mining in the southern Peruvian Amazon, summary 2021-2024. MAAP: 208.


 Last year, in collaboration with the organization