MAAP #116: Amazon Gold Mining, Part 2: Brazil

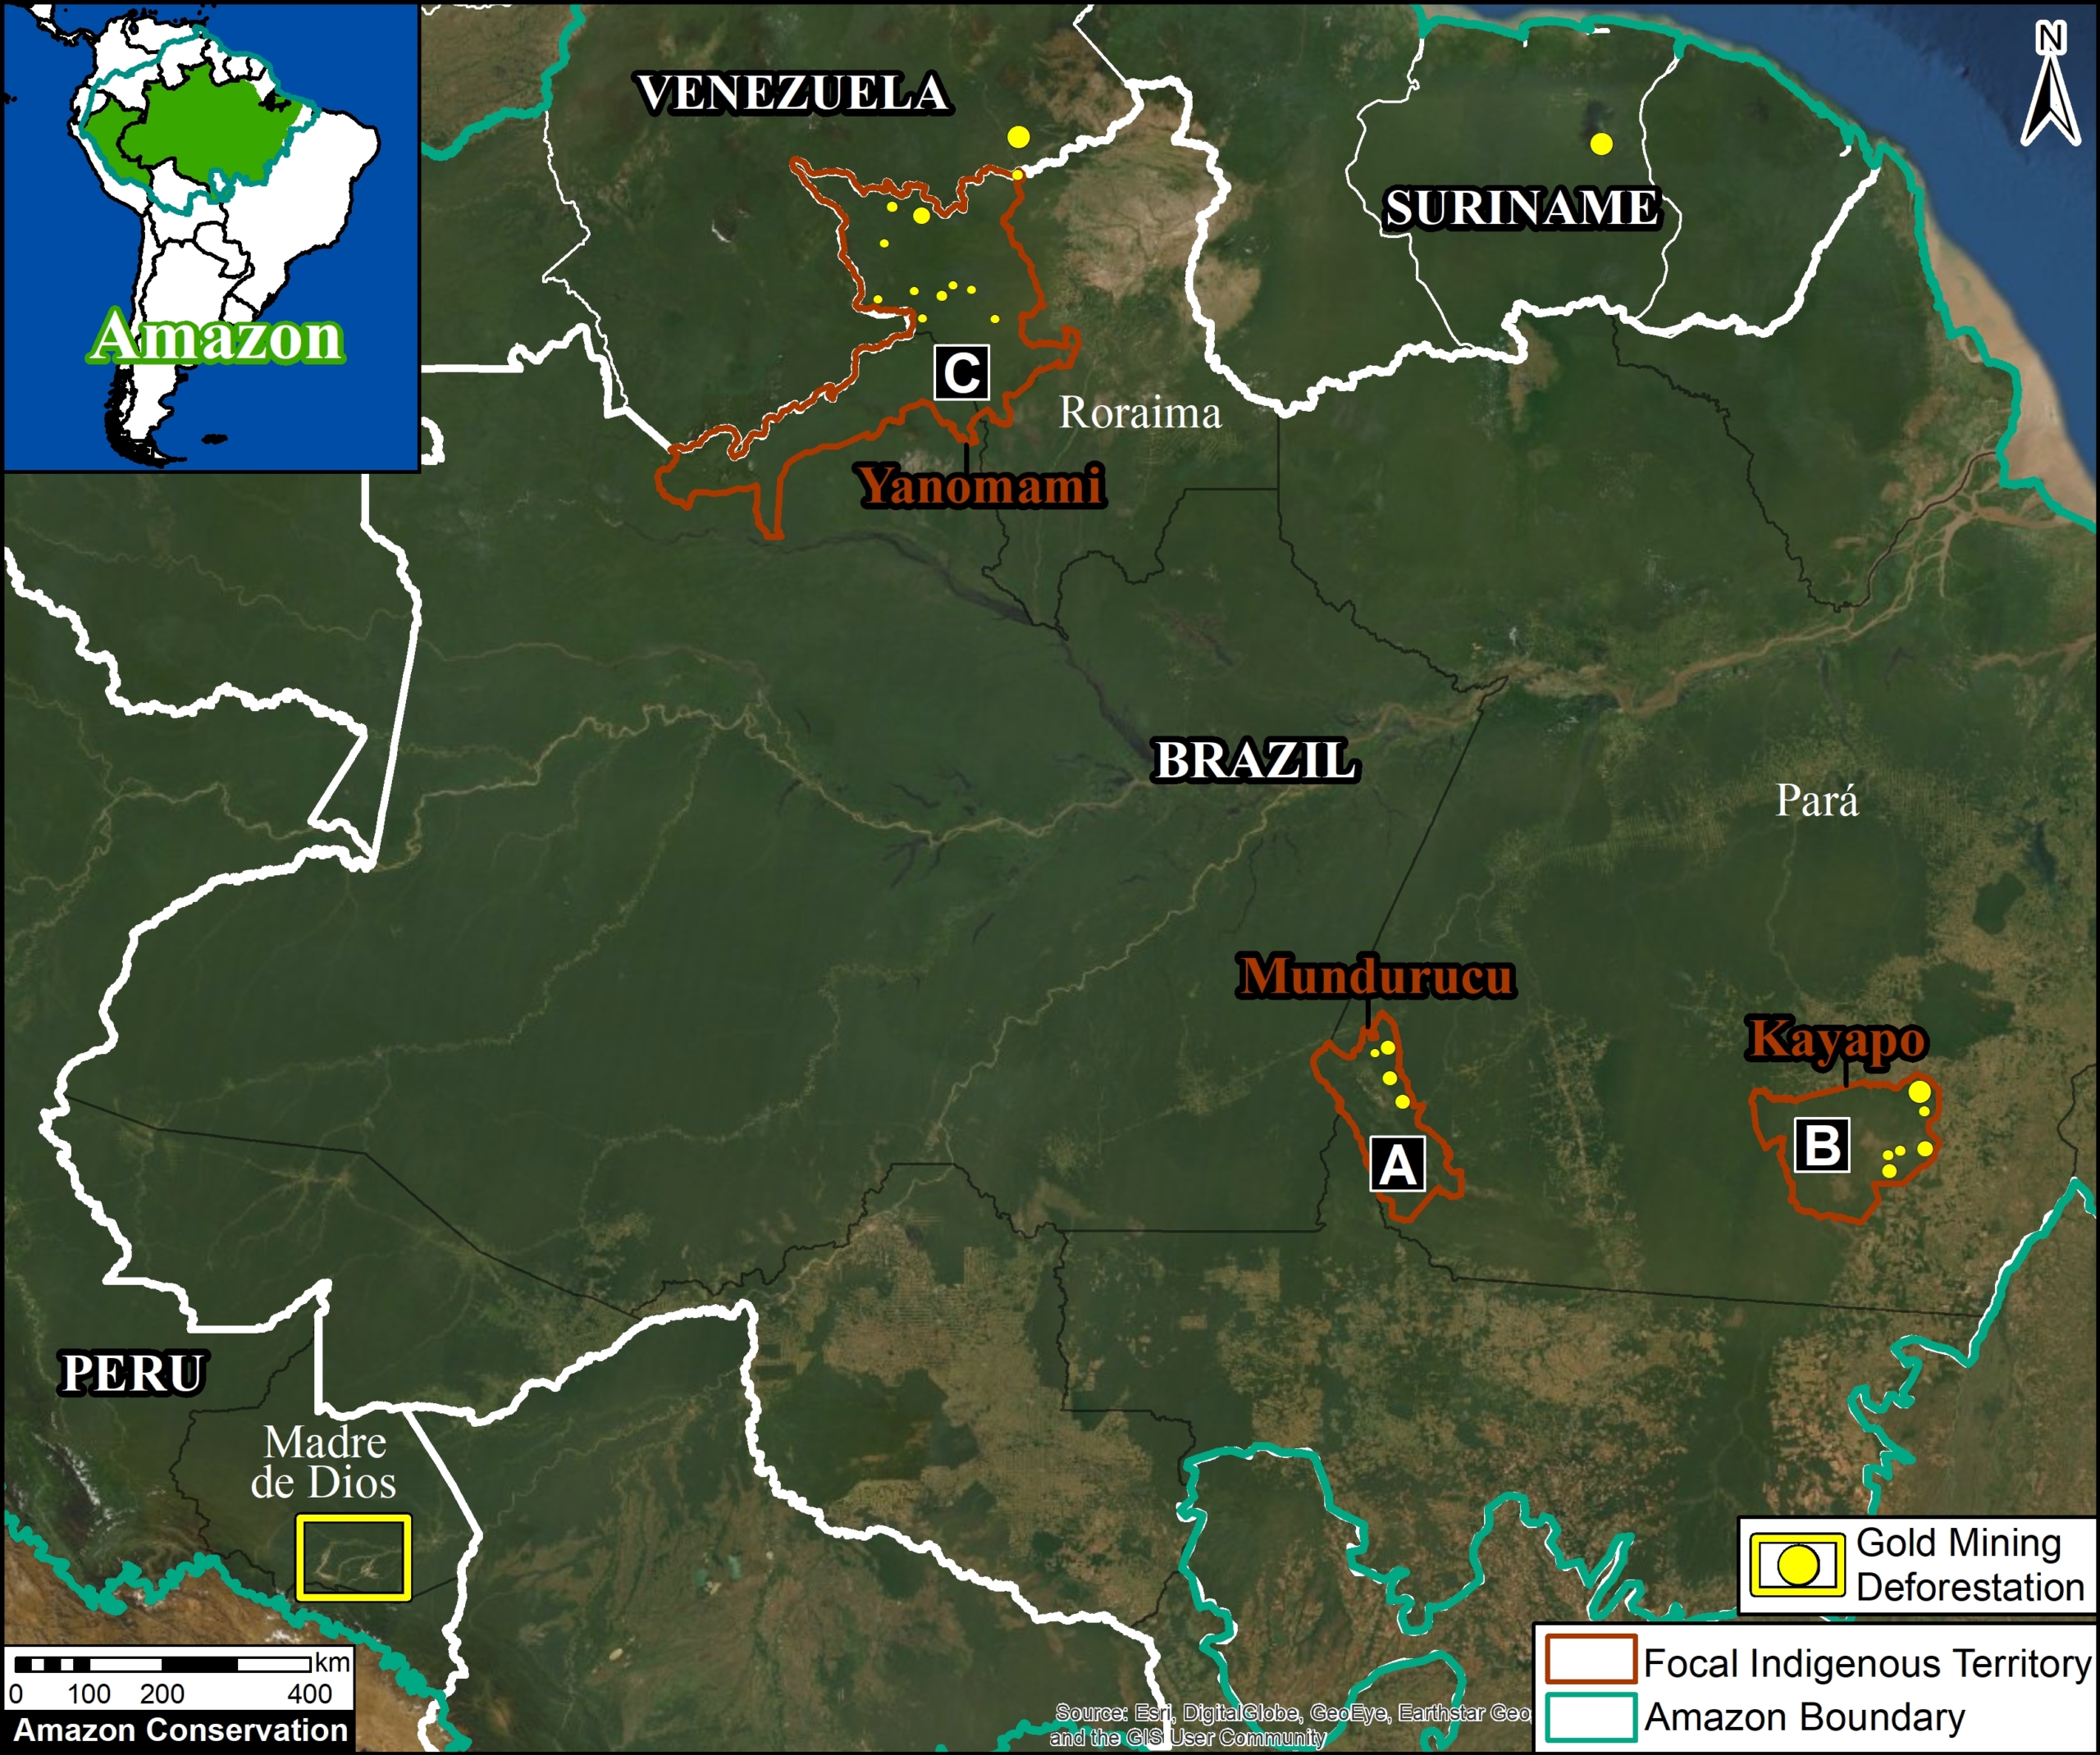
Base Map. Major gold mining deforestation zones across the Amazon. Data: MAAP.

We present the second part of our series on Amazon gold mining, with a focus on the Brazil*

Specifically, we focus on mining in indigenous territories in the Brazilian Amazon.

Extractive activities, such as gold mining, are constitutionally not permitted on indigenous lands, but the Bolsonaro administration is advancing a bill (PL 191) that would reverse this.

The Base Map indicates three Brazilian indigenous territories where we identified recent major gold mining deforestation:

  1. Munduruku (Pará)
  2. Kayapó (Pará)
  3. Yanomami (Roraima)

We documented the gold mining deforestation of 10,245 hectares (25,315 acres) across all three indigenous territories over the past three years (2017 – 2019). That is the equivalent of 14,000 soccer fields.

Below, see more detailed data, including a series of satellite GIFs of the recent gold mining deforestation in each territory.

*Part 1 looked at the Peruvian Amazon (see MAAP #115). For information on Suriname, see this report from Amazon Conservation Team. For all other countries see this resource from RAISG.


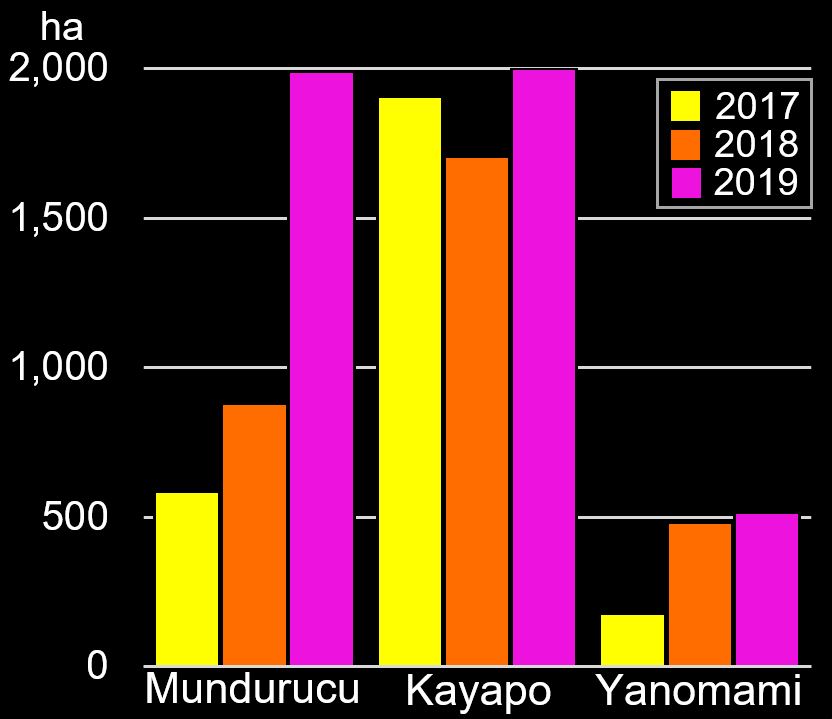
Graph 1. Gold mining deforestation in three indigenous territories in the Brazilian Amazon.

Mining Deforestation Increasing

In 2019, all three territories experienced an increase in gold mining deforestation.

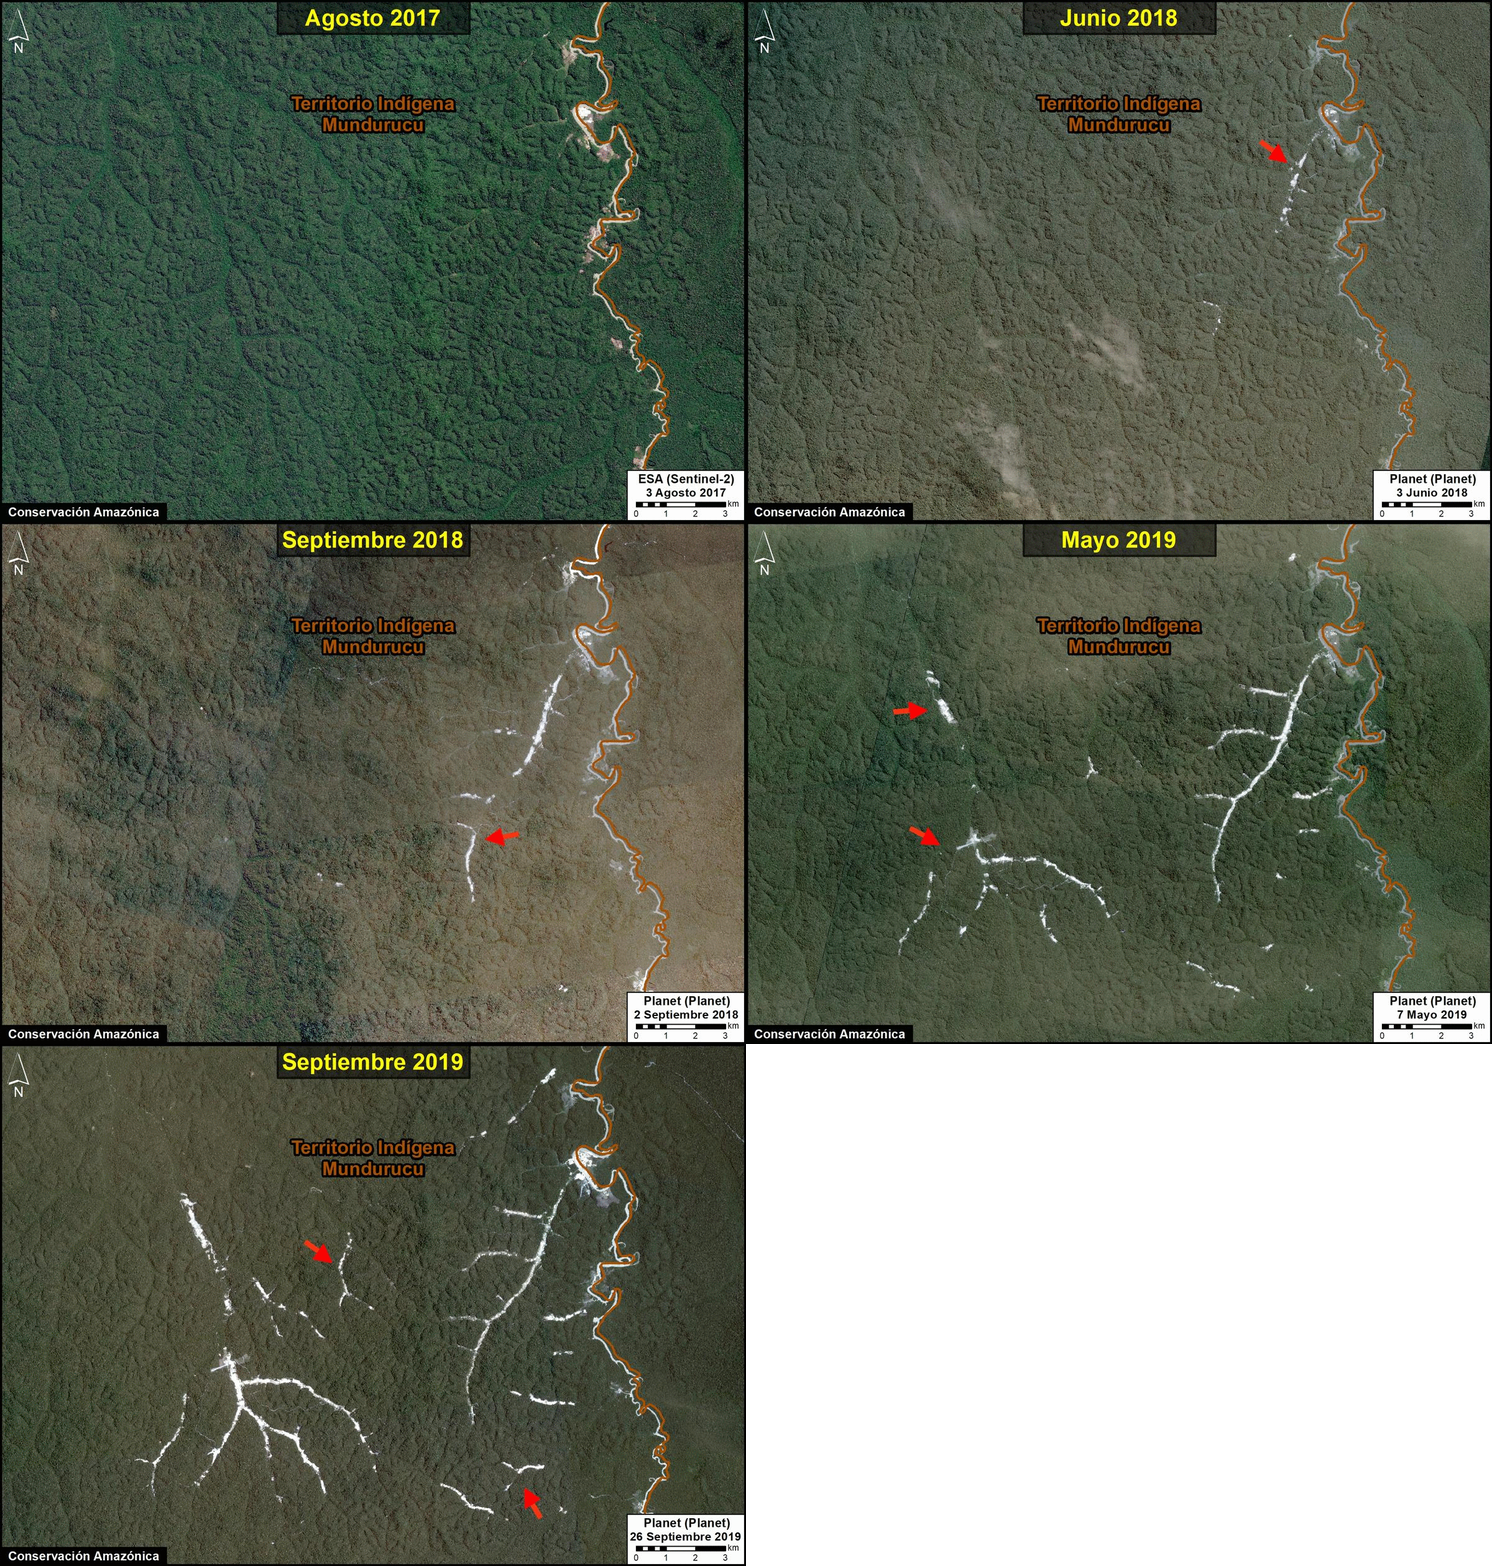
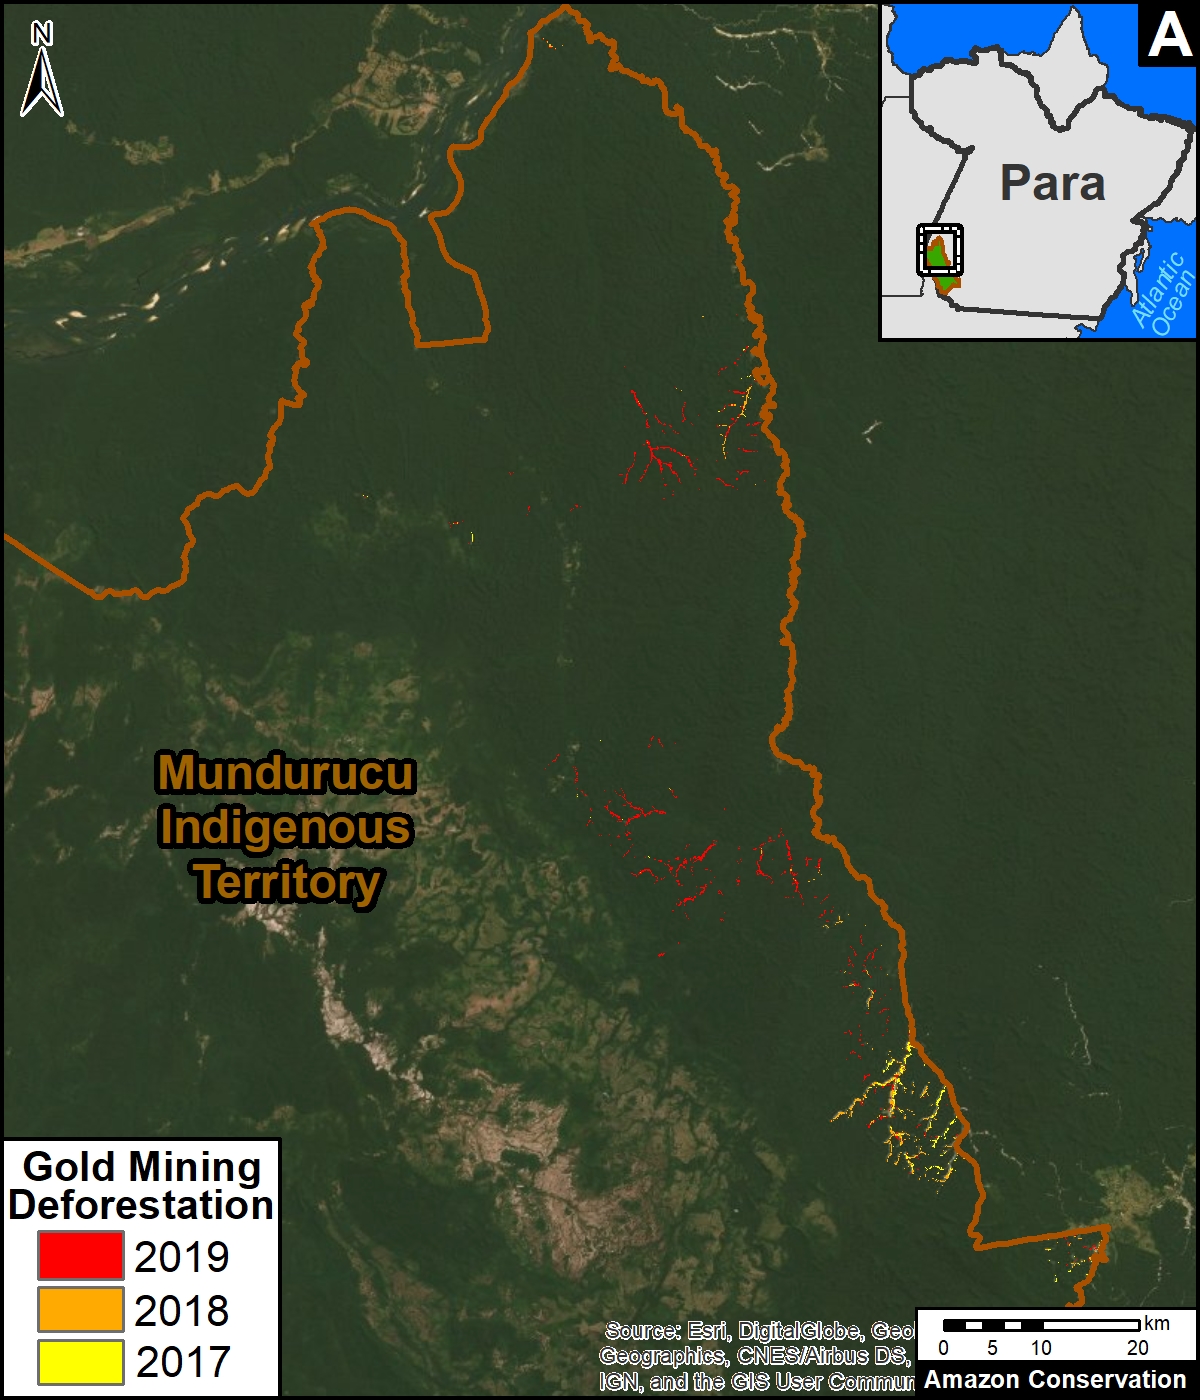
In Munduruku Territory, we documented the loss of 3,456 hectares due to mining activity between 2017 and 2019. Note the major spike in 2019, where mining deforestation reached 2,000 hectares.

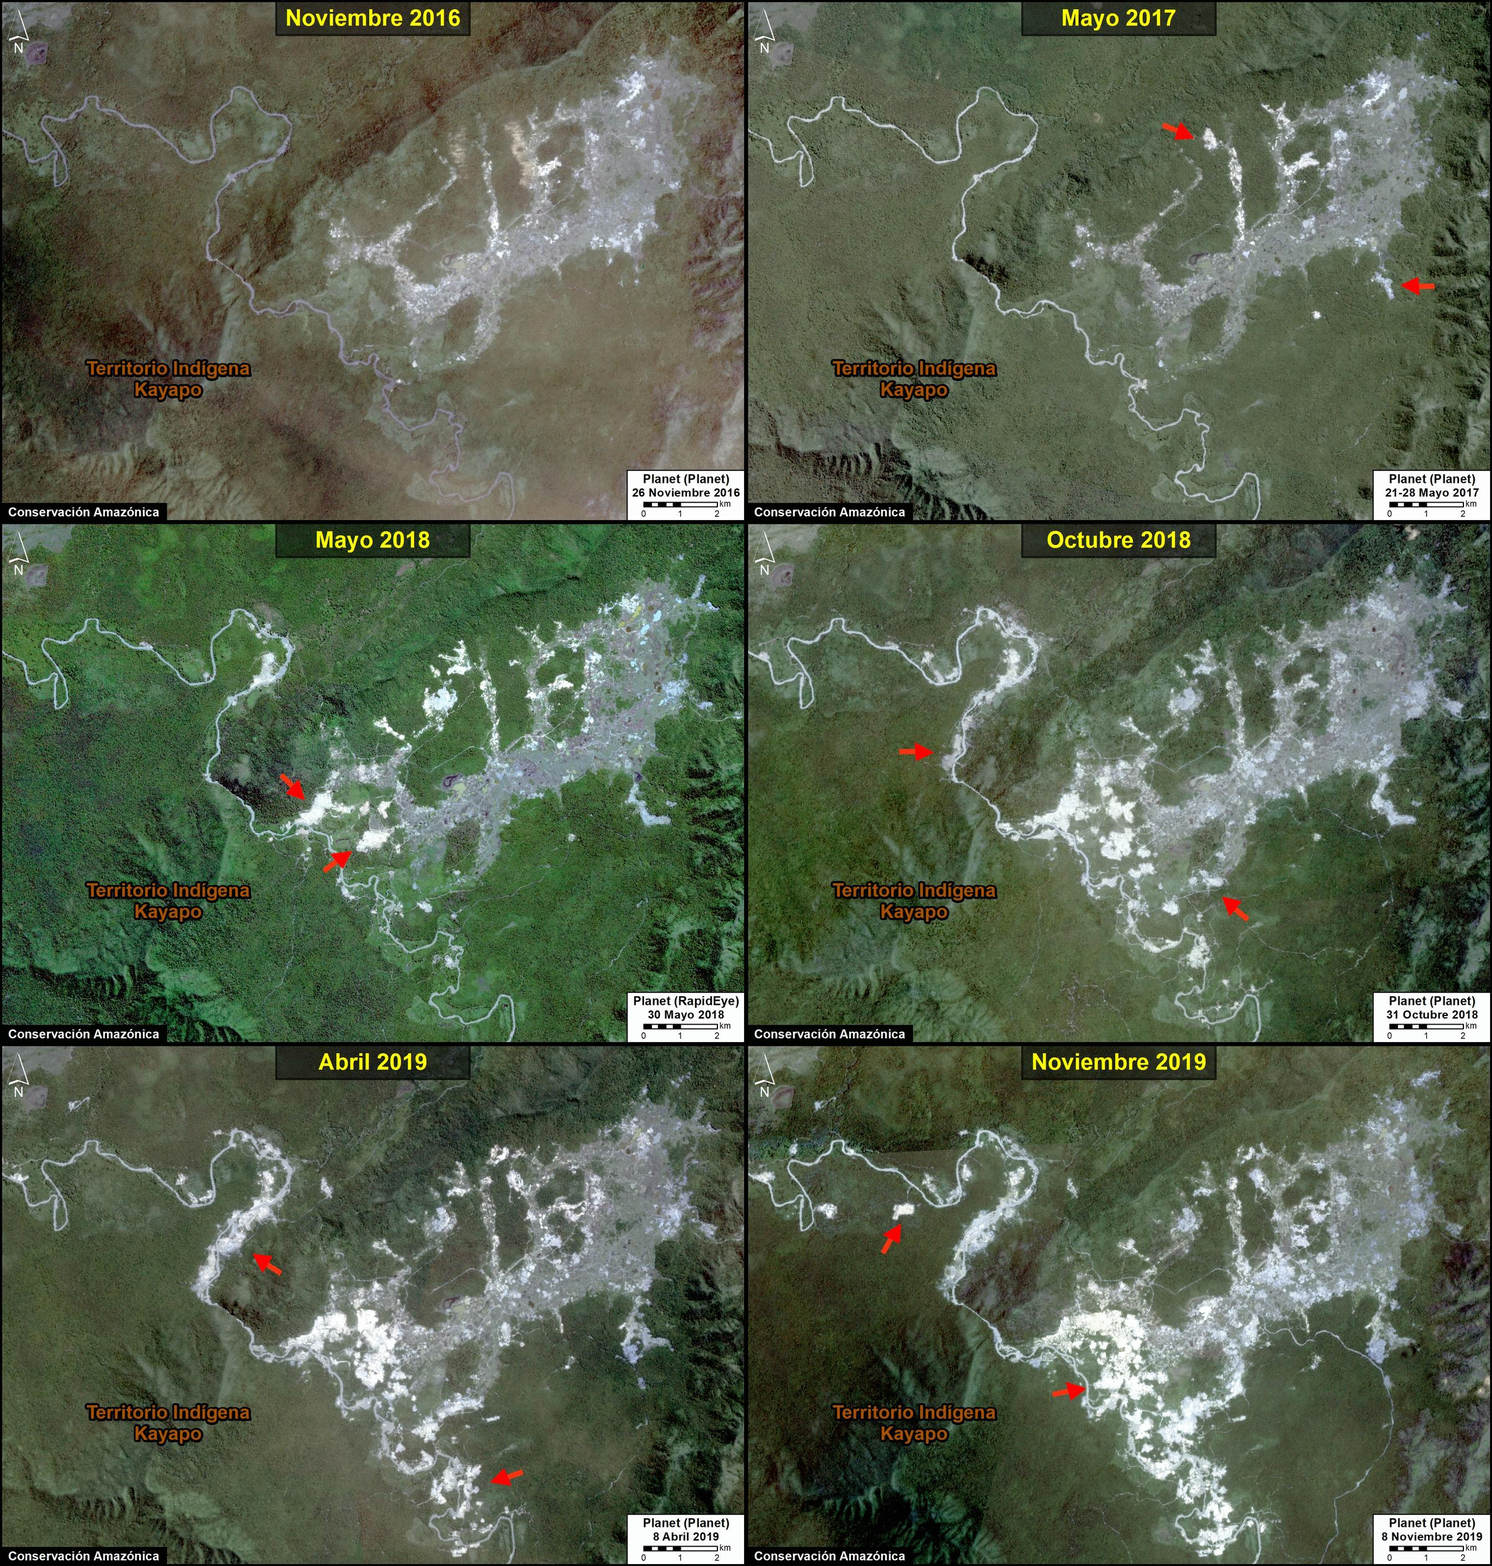
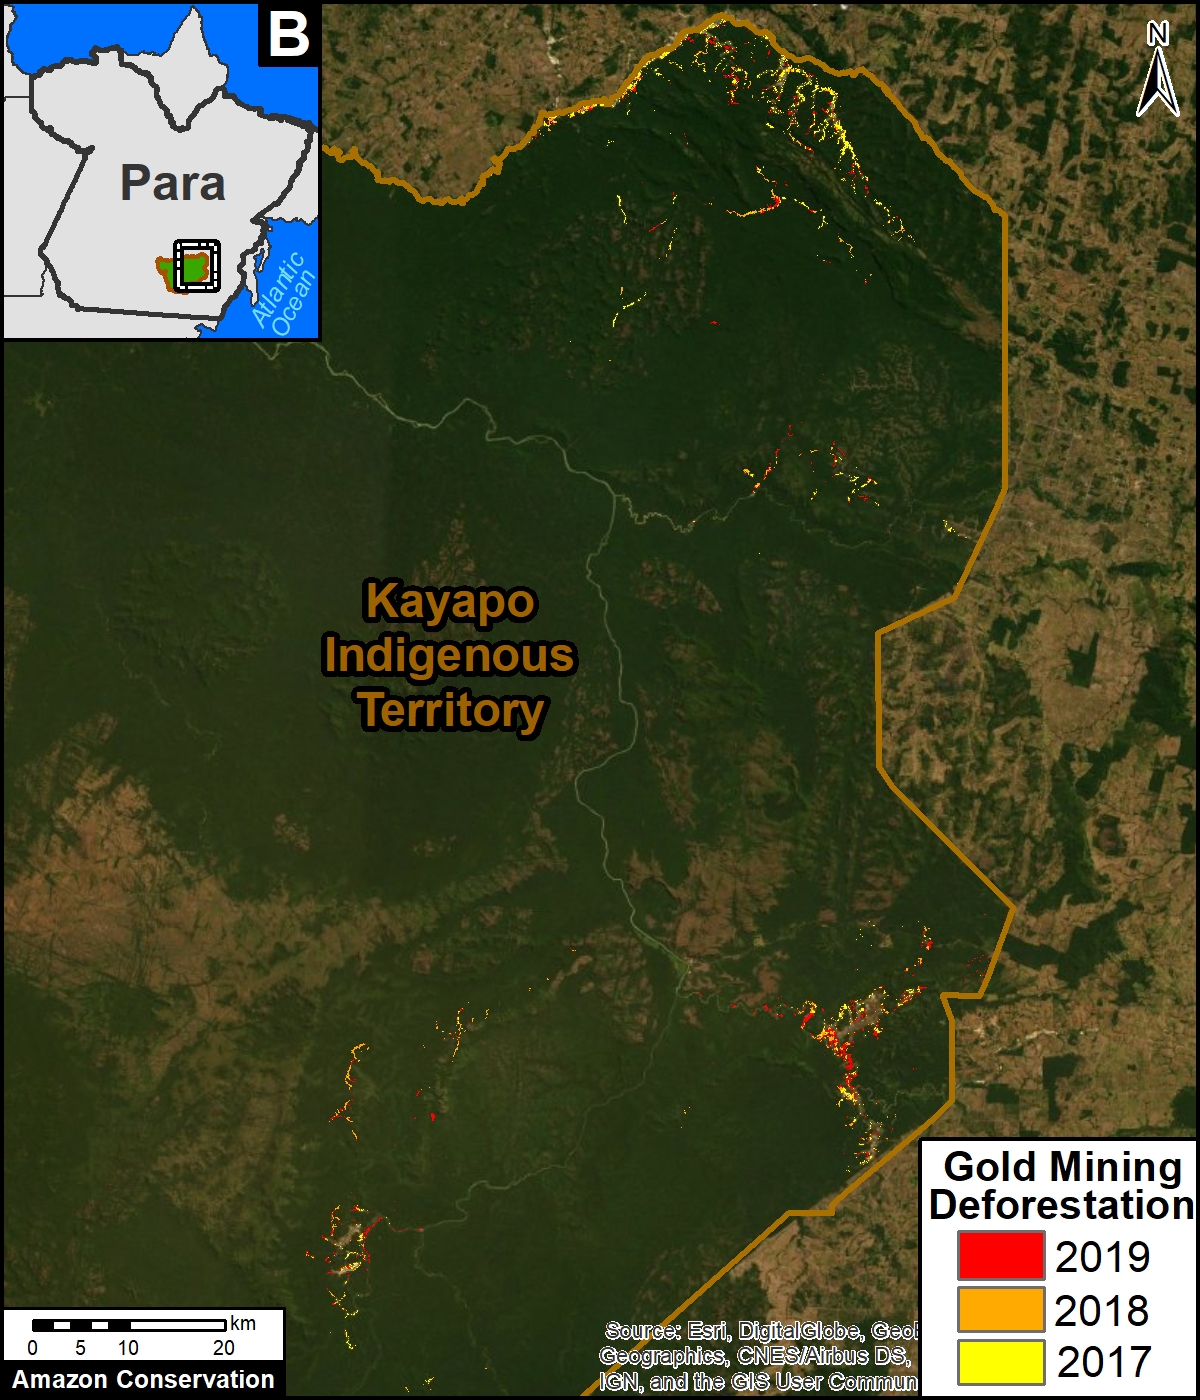
In Kayapó Territory, we documented the loss of 5,614 hectares between 2017 and 2019. Note that mining deforestation also reached 2,000 hectares in 2019.

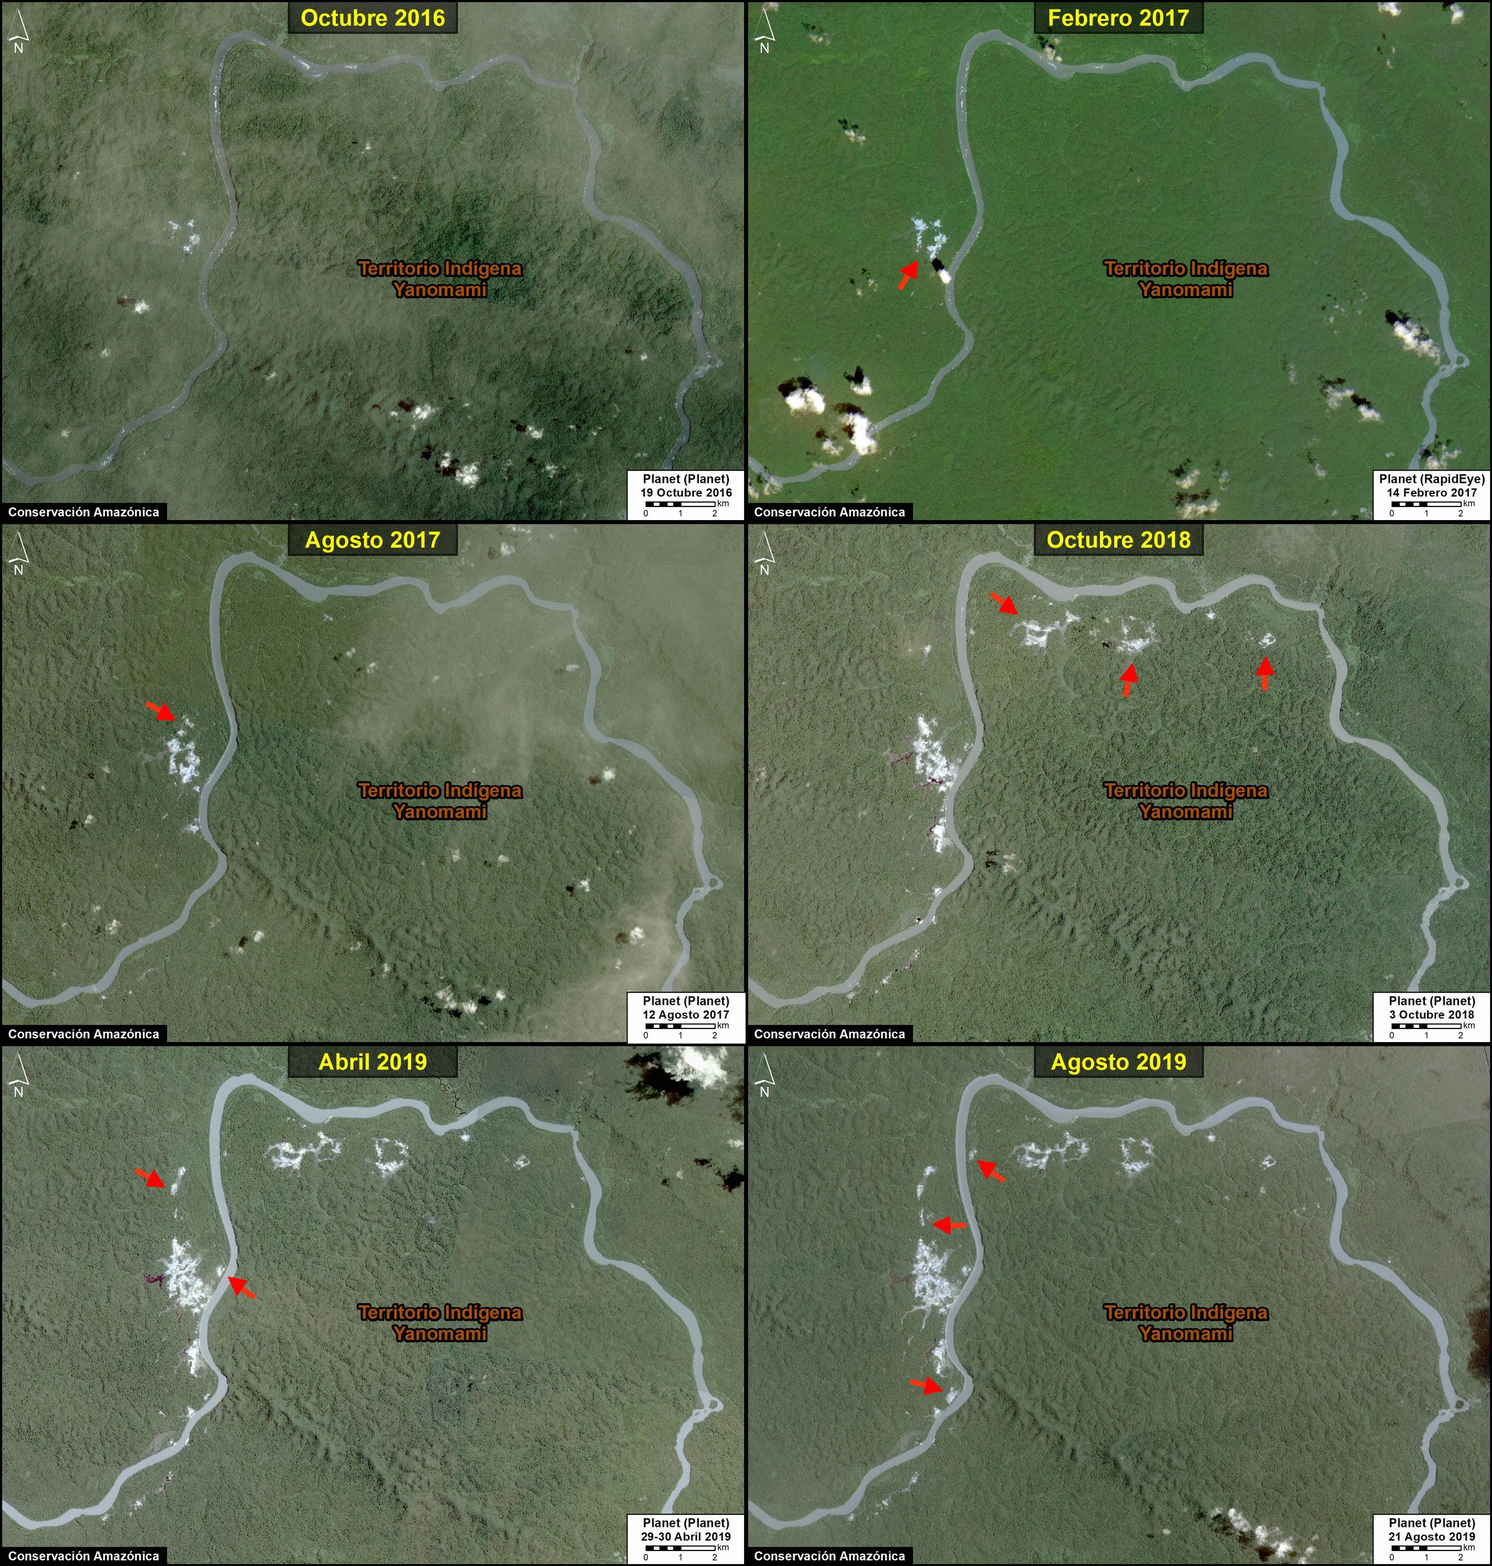
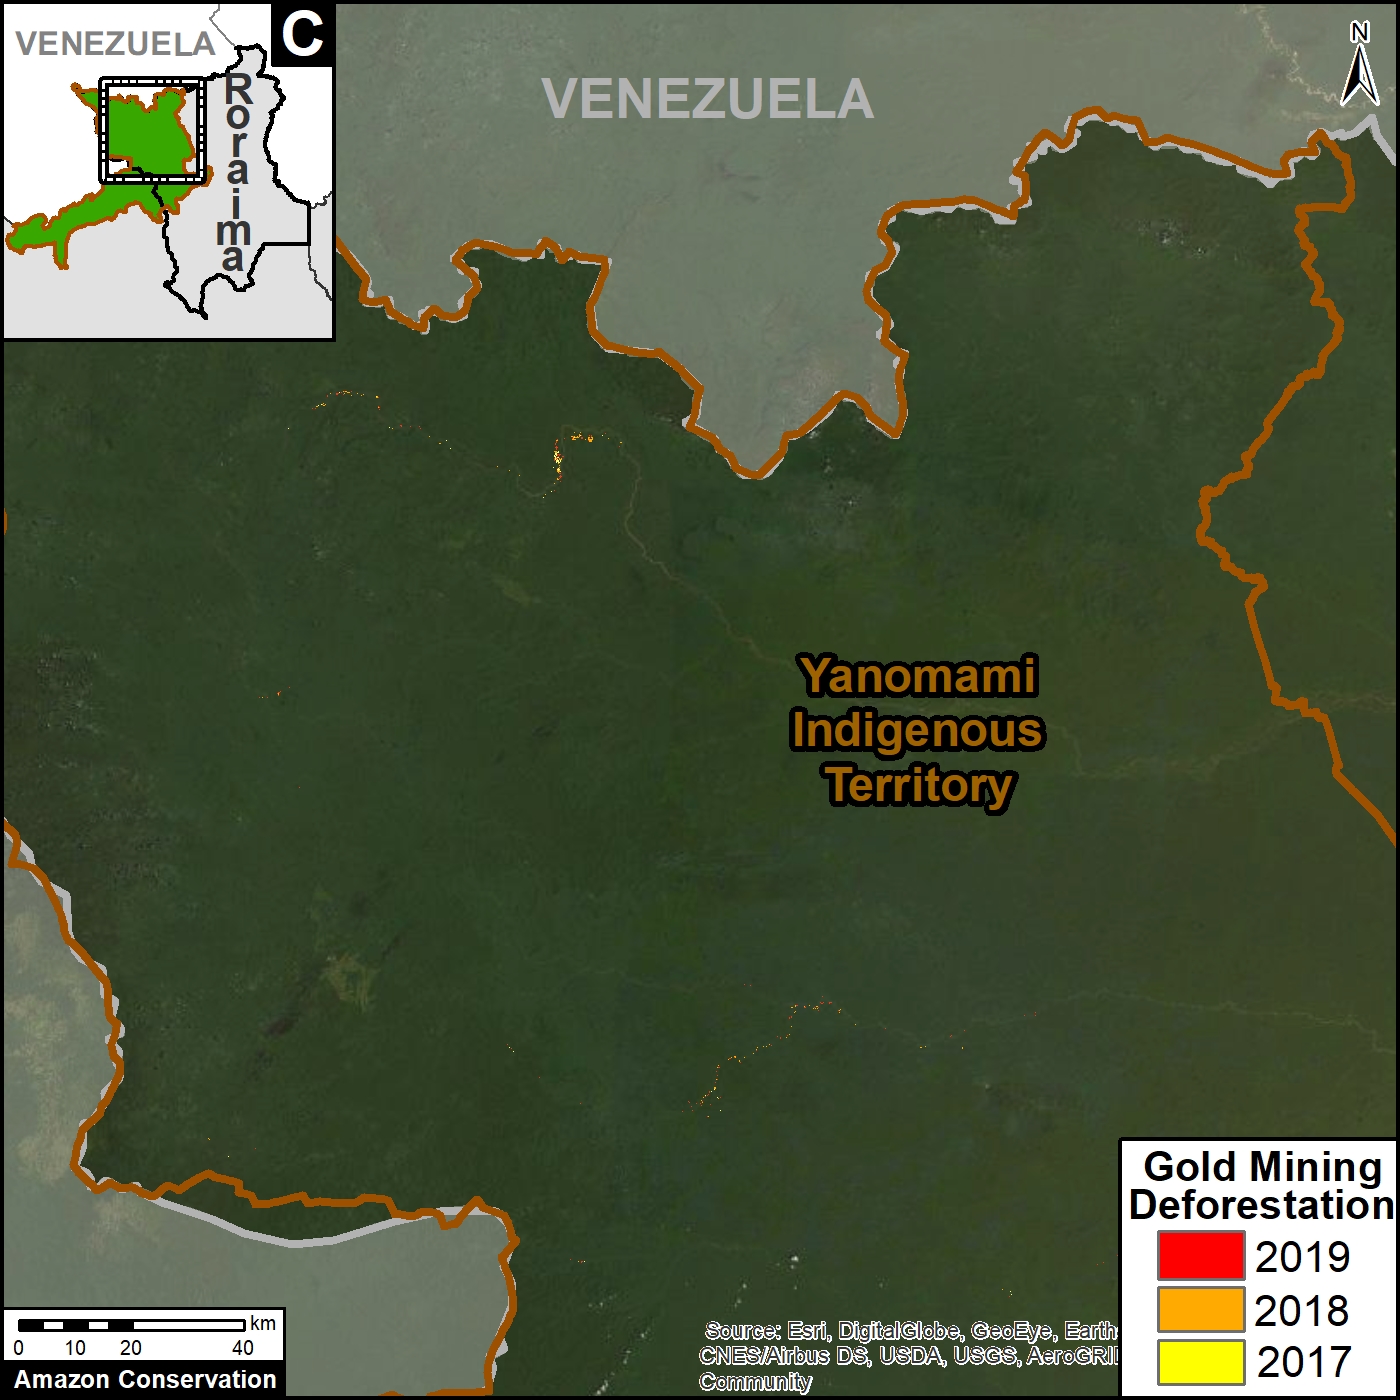
In Yanomami Territory, we documented the loss of 1,174 hectares between 2017 and 2019. Note that mining deforestation reached 500 hectares in 2019.

Overall,  44% (4,500 hectares) of the gold mining deforestation occurred in 2019, indicating an increasing trend.

A. Munduruku (Pará)

The GIF below shows an example of gold mining deforestation in Munduruku Territory between 2017 and 2019.

Gold mining deforestation in Munduruku Territory between 2017 and 2019. Data: Planet, MAAP.

B. Kayapó (Pará)

The GIF below shows an example of gold mining deforestation in Kayapó Territory between 2017 and 2019.

Gold mining deforestation in Kayapó Territory between 2017 and 2019. Data: Planet, MAAP.

C. Yanomami (Roraima)

The GIF below shows an example of gold mining deforestation in Yanomami Territory between 2017 and 2019.

Gold mining deforestation in Yanomami Territory between 2017 and 2019. Data: Planet, MAAP.

Annex: Detailed Territory Maps

Below see detailed gold mining deforestation maps for all three Brazilian indigenous territories detailed in this report. Click each image to enlarge.

Gold mining deforestation in Munduruku Territory between 2017 and 2019. Data: MAAP. Click to enlarge.
Gold mining deforestation in Kayapó Territory between 2017 and 2019. Data: MAAP. Click to enlarge.
Gold mining deforestation in Yanomami Territory between 2017 and 2019. Data: MAAP. Click to enlarge.

Acknowledgements

We thank S. Novoa (ACCA), V. Guidotti de Faria (Imaflora), and G. Palacios for helpful comments to earlier versions of this report.

This work was supported by the following major funders: Global Forest Watch Small Grants Fund (WRI), Norwegian Agency for Development Cooperation (NORAD),  International Conservation Fund of Canada (ICFC), Metabolic Studio, and Erol Foundation.

Citation

Finer M, Mamani N (2020) Amazon Gold Mining, part 2: Brazil. MAAP: 116.

MAAP Synthesis: 2019 Amazon Deforestation Trends and Hotspots

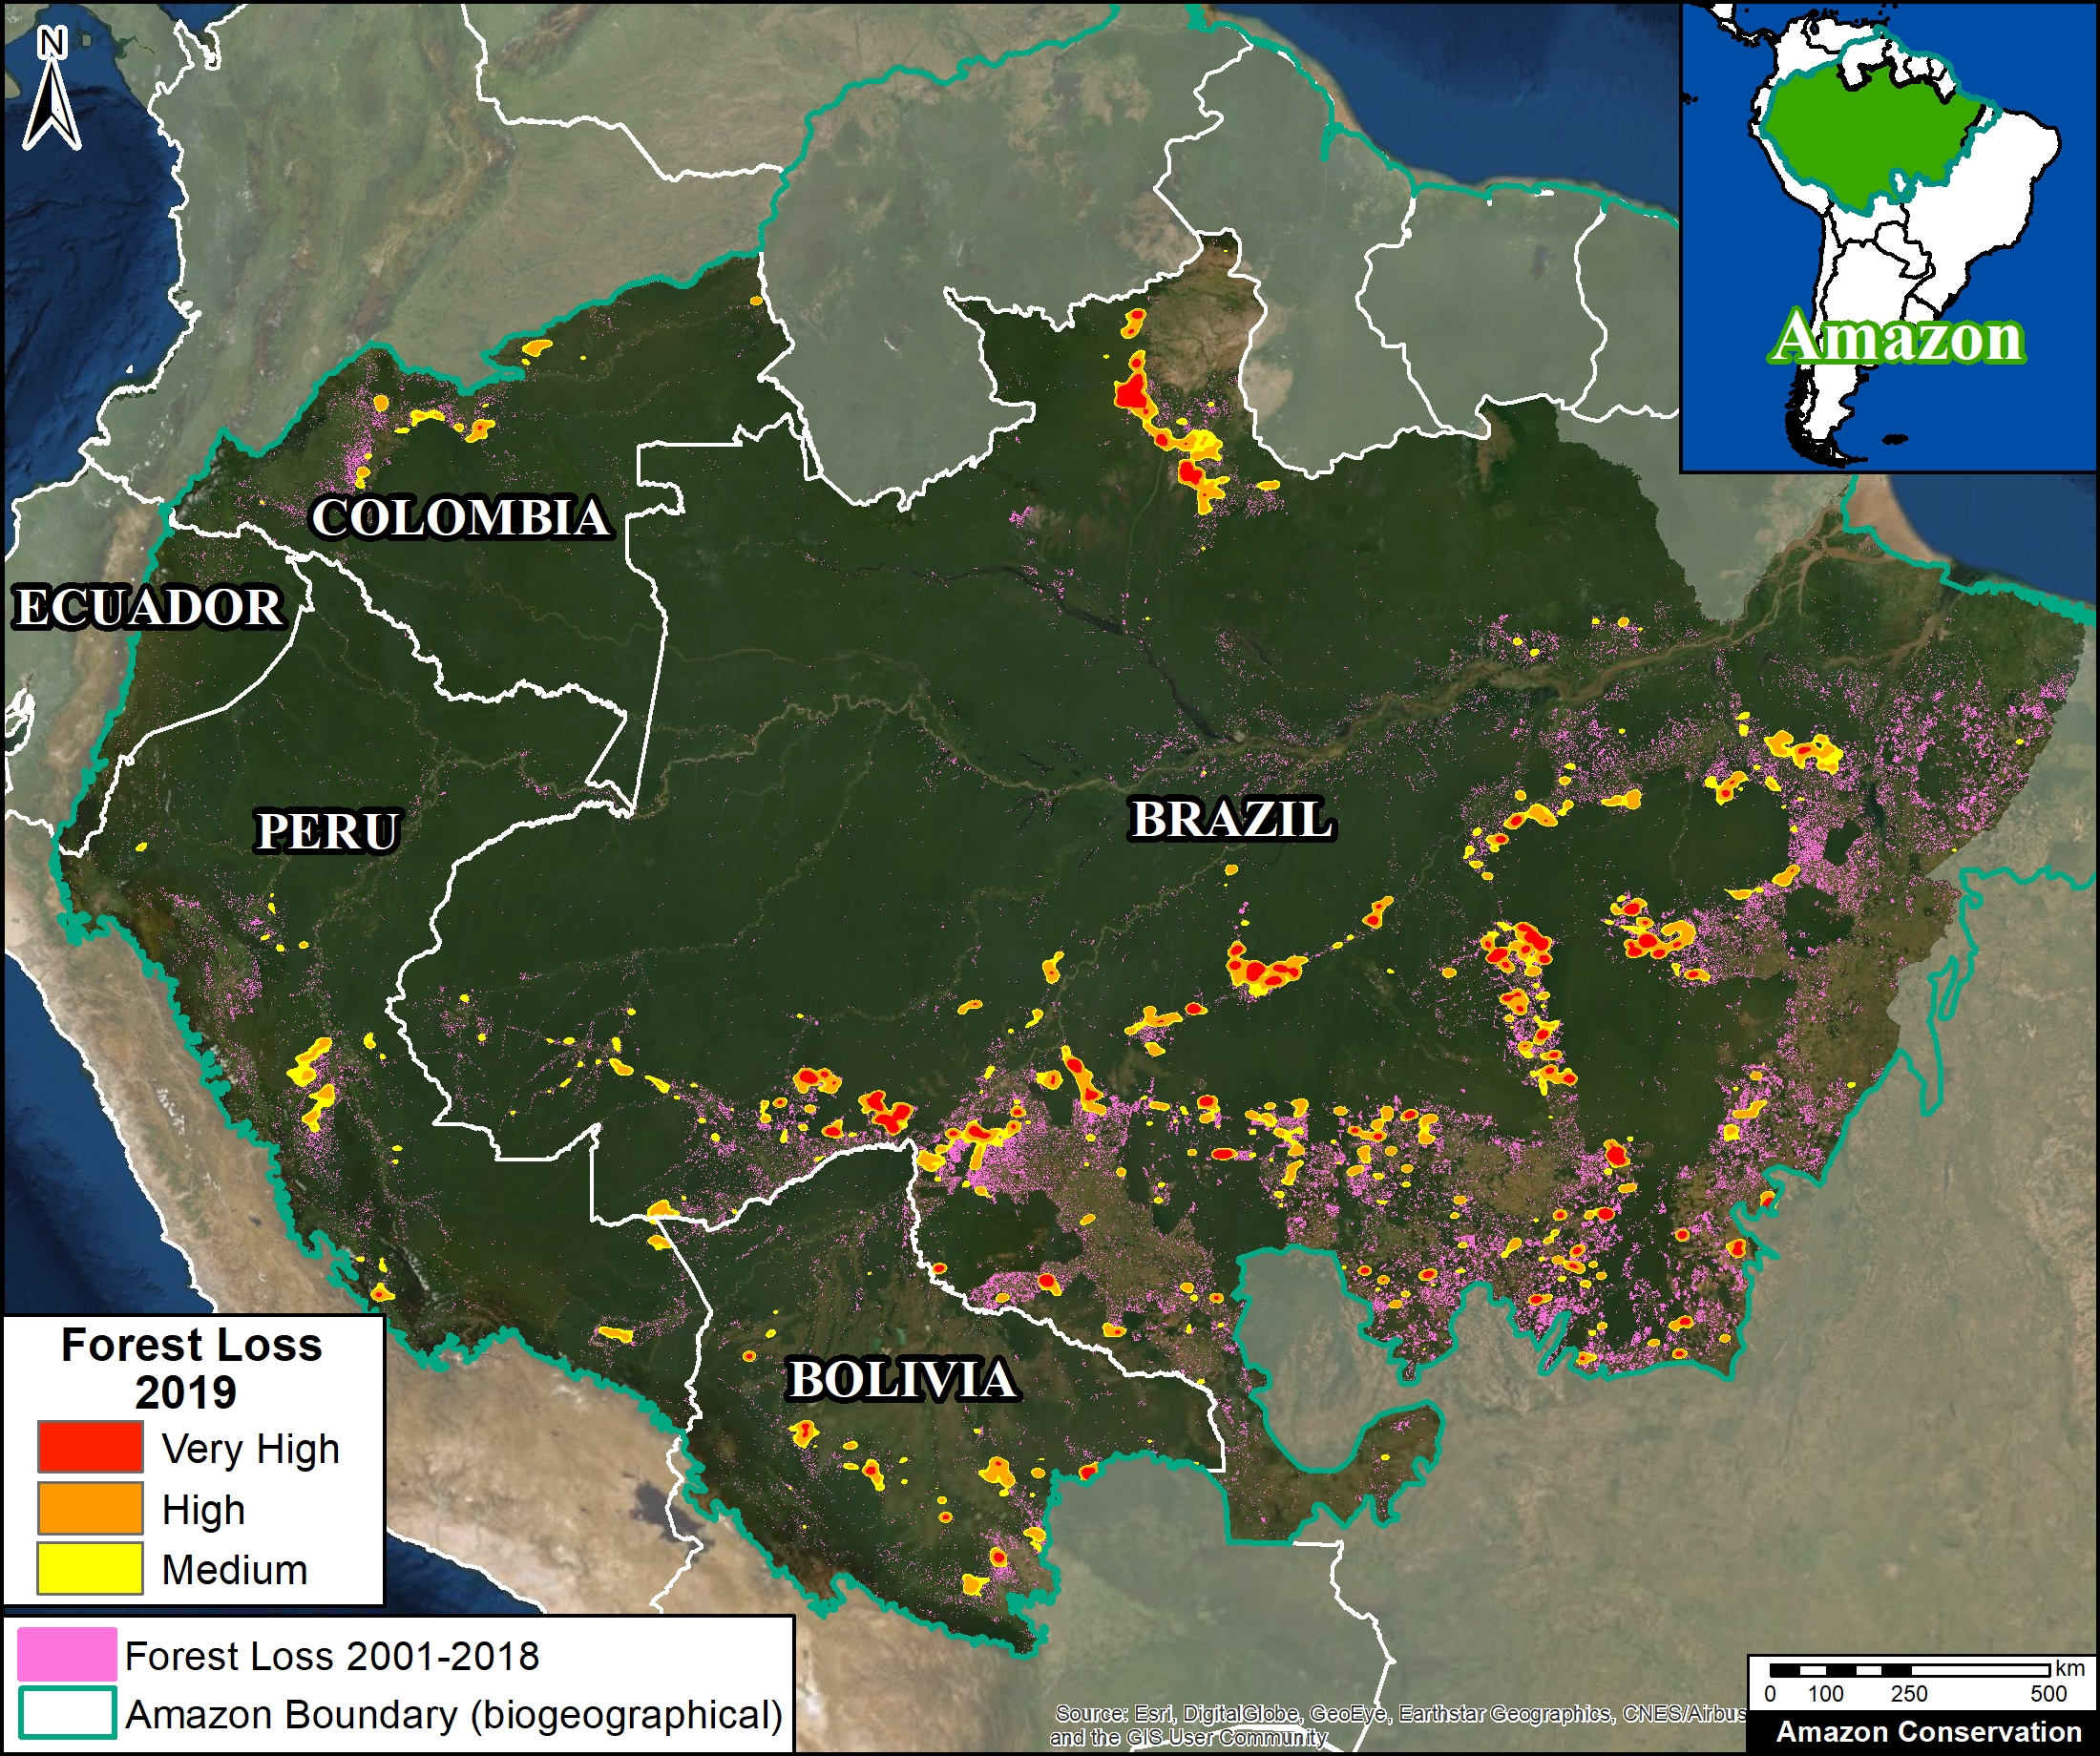
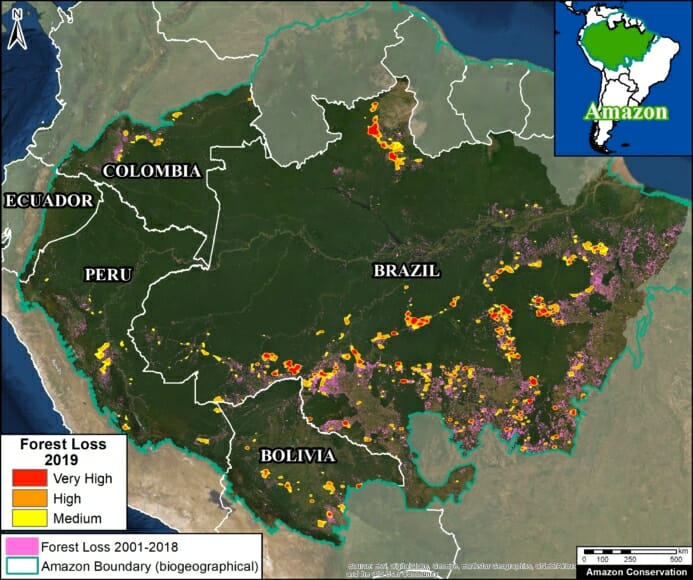
Base Map. Amazon Deforestation, 2001-2019. Data: UMD/GLAD, Hansen/UMD/Google/USGS/NASA, MAAP. 

MAAP, an initiative of Amazon Conservation, specializes in satellite-based, real-time deforestation monitoring of the Amazon. Our geographic focus covers five countries: Bolivia, Brazil, Colombia, Ecuador, and Peru (see Base Map).

We found that, since 2001, this vast area lost 65.8 million acres (26.6 million hectares) of primary forest, an area equivalent to the size of the United Kingdom (or the U.S. state of Colorado).

In 2019, we published 18 high-impact reports on the most urgent cases of deforestation. 2019 highlights include:

  • Fires in the Brazilian Amazon actually burned freshly deforested areas (MAAP #113);
  • Effective illegal gold mining crackdown in the Peruvian Amazon as a result of the government’s Operation Mercury (MAAP #104);
  • Illegal invasion of protected areas in the Colombian Amazon (MAAP #106);
  • Construction of oil-drilling platforms in the mega-diverse Yasuni National Park of the Ecuadorian Amazon (MAAP #114).

Here, in our annual Synthesis Report, we go beyond these emblematic cases and look at the bigger picture for 2019, describing the most important deforestation trends and hotspots across the Amazon.

*Note: to download a PDF, click the “Print” button below the title.

Synthesis Key Findings

Trends: We present a GIF comparing deforestation trends for each country since 2001. The preliminary 2019 estimates have several important headlines:
  • Possible major deforestation decrease in the Colombian Amazon following a dramatic increase over the previous three years;
  • Likely major deforestation increase in the Bolivian Amazon due to forest fires;
  • Downward deforestation trend continues in the Peruvian Amazon, but still historically high;
  • Deforestation of 2.4 million acres in the Brazilian Amazon, but the trend depends on the data source.
Hotspots: We present a Base Map highlighting the major deforestation hotspots in 2019. Results emphasize the deforestation and fires in the Brazilian Amazon, along with several key areas in Colombia, Peru, and Bolivia.
.

Deforestation Trends 2001-2019

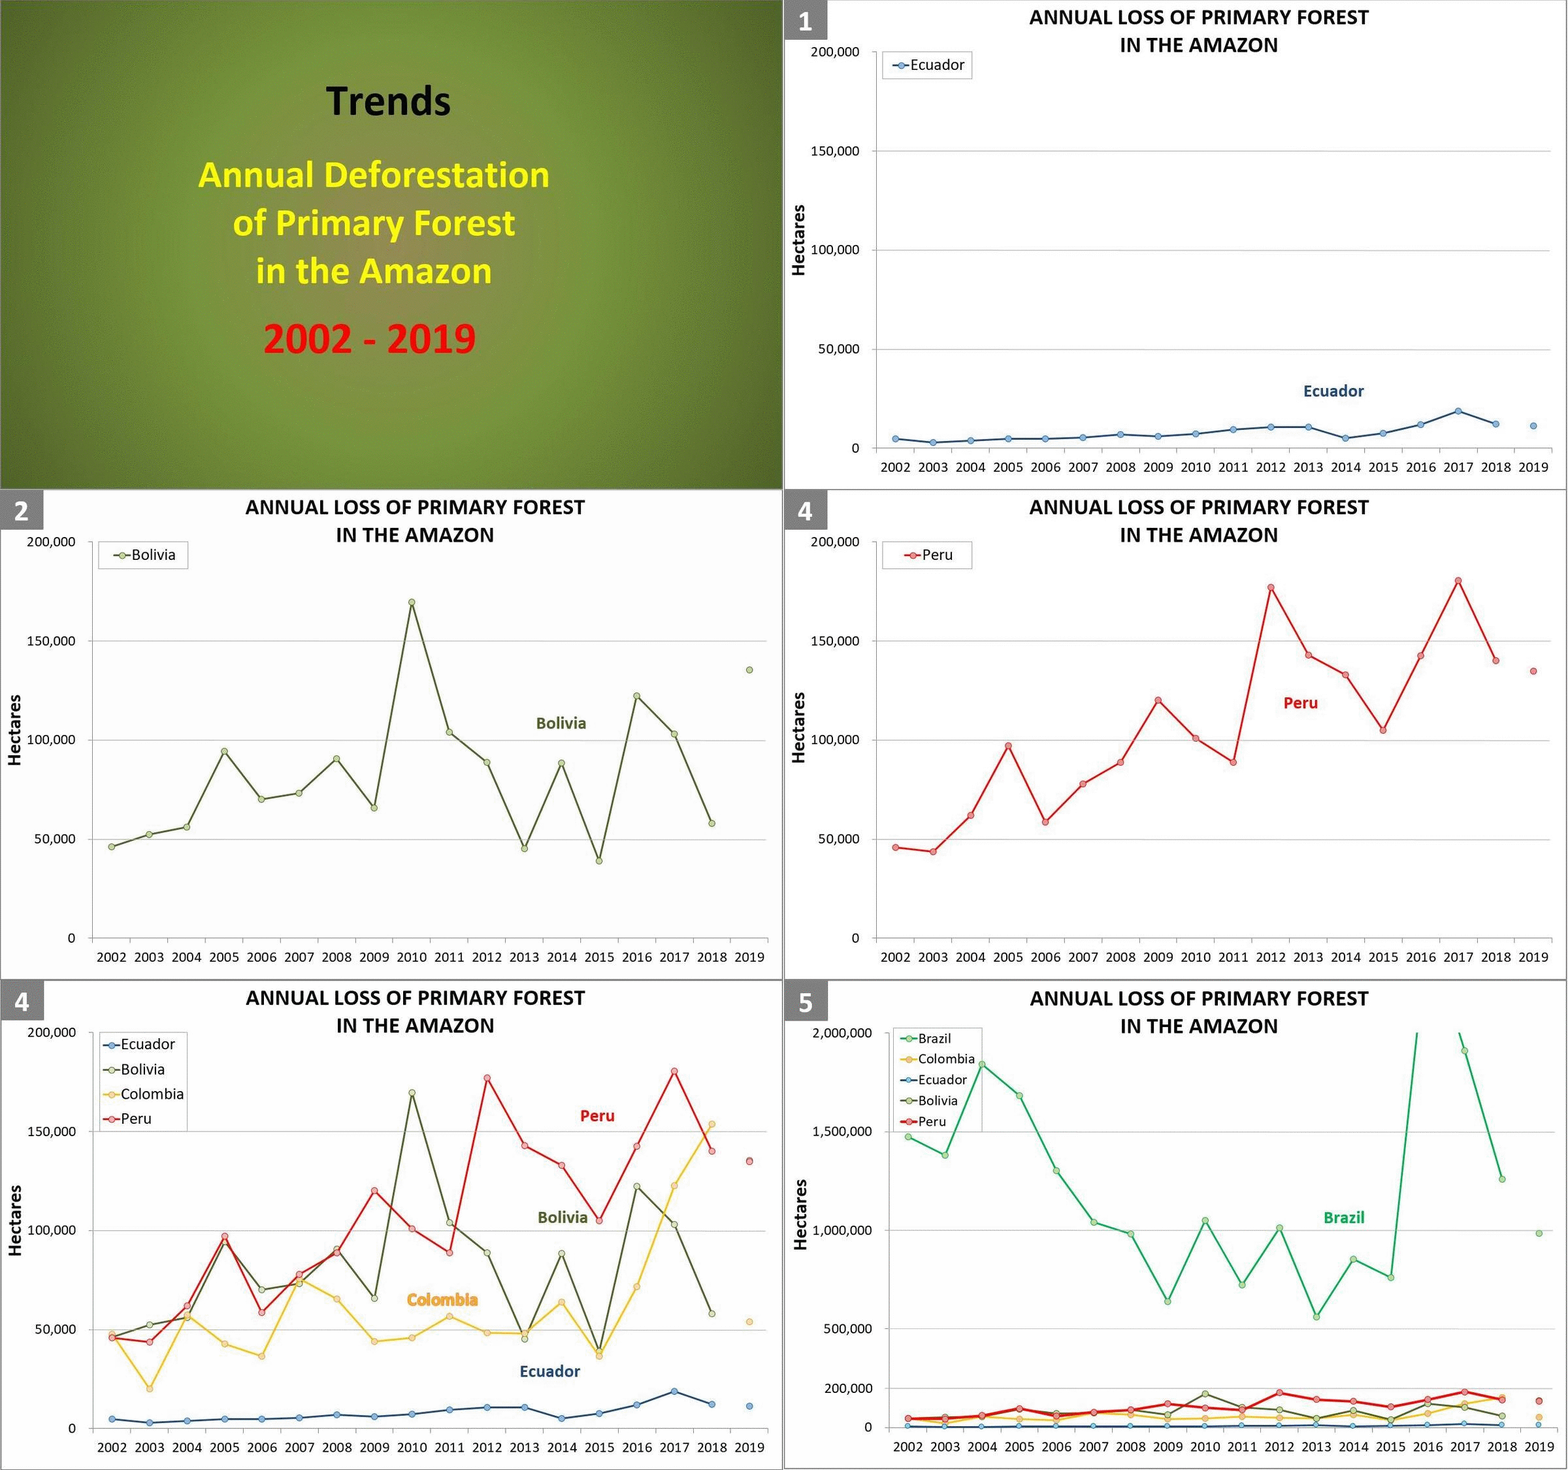
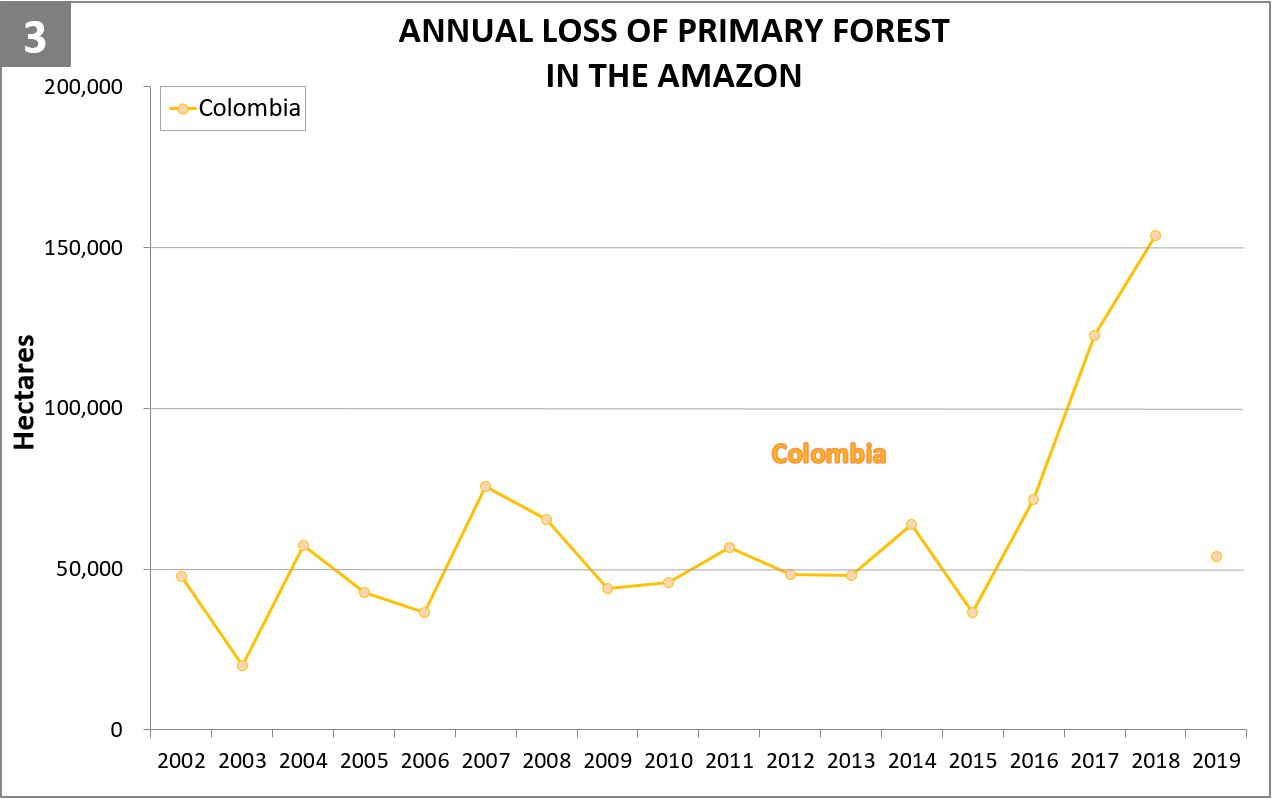
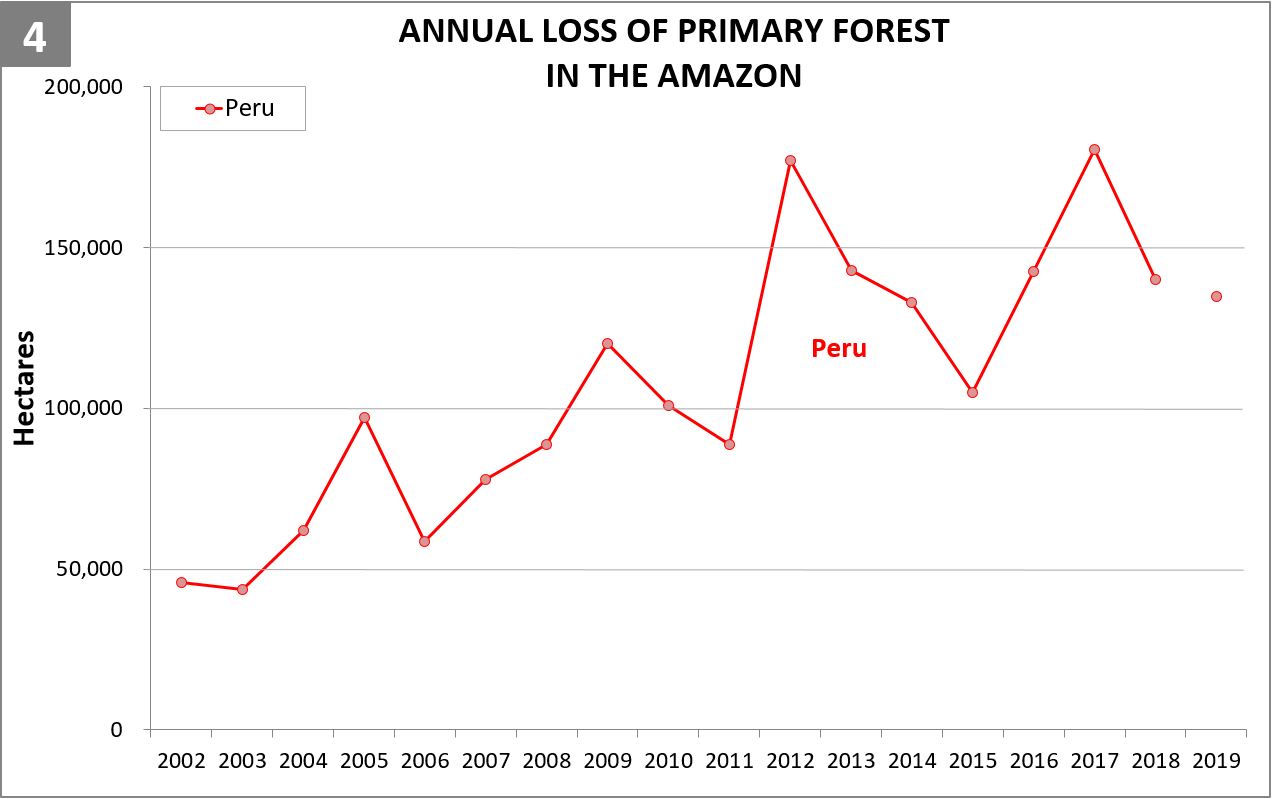
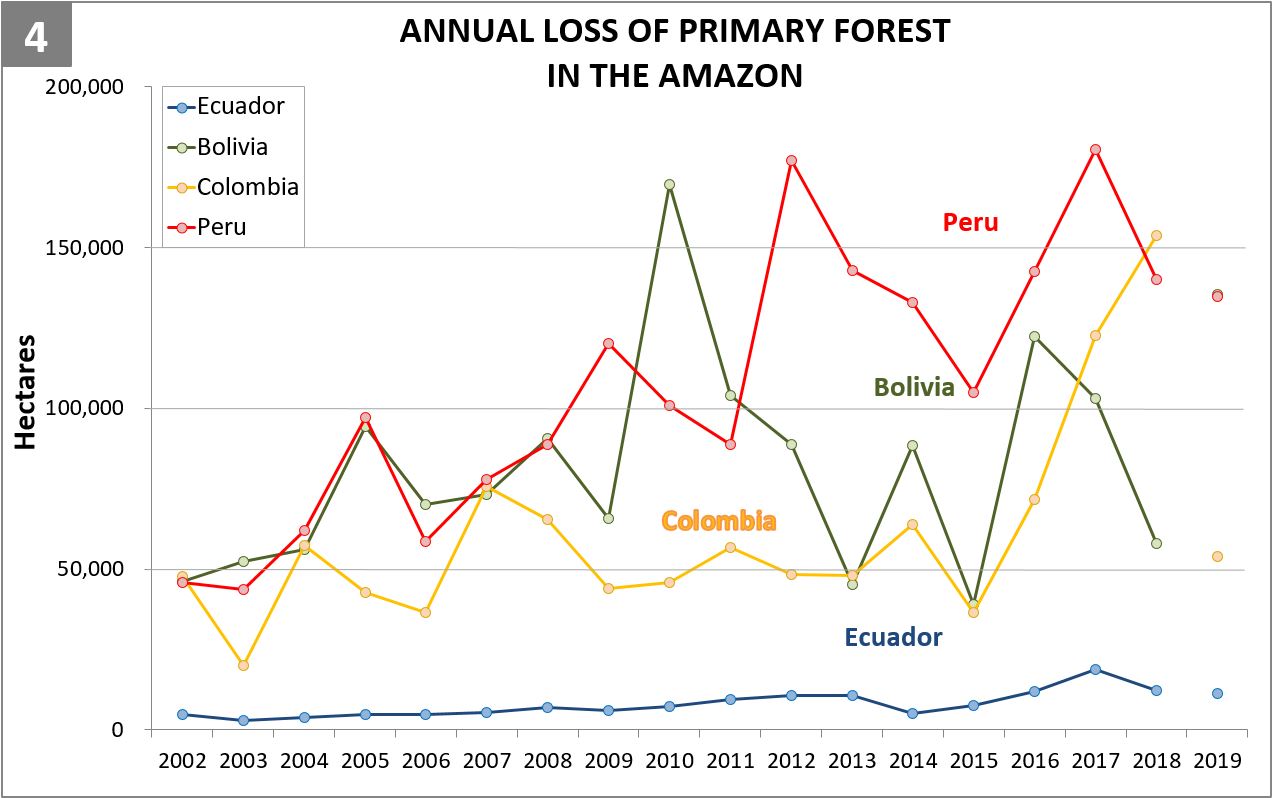
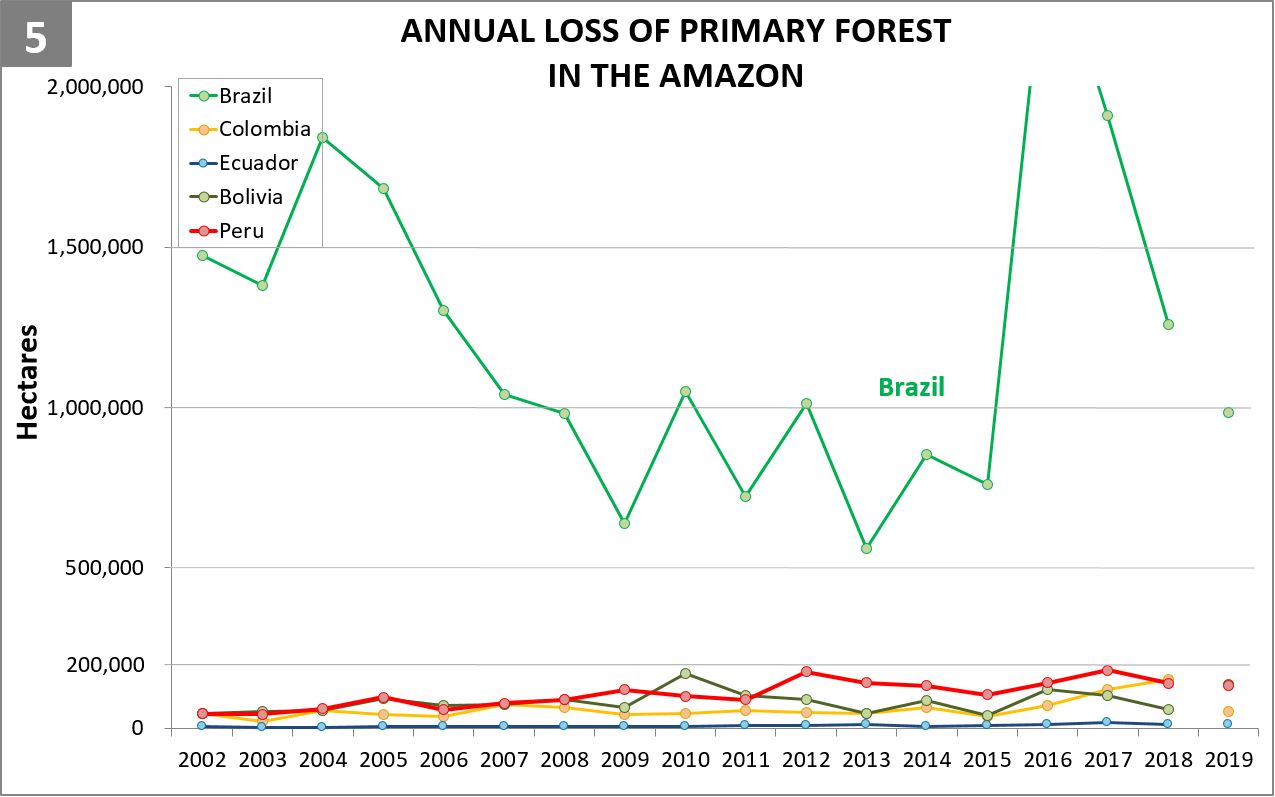
The following GIF shows deforestation trends for each country between 2001 and 2019 (see descriptive notes below). Click here for static versions of each graph.

Three important points about the data: First, as a baseline, we use annual forest loss from the University of Maryland to have a consistent source across all five countries (thus it may differ from official national data). Second, we applied a filter to only include loss of primary forest (see Methodology). Third, the 2019 data represents a preliminary estimate based on early warning alerts.
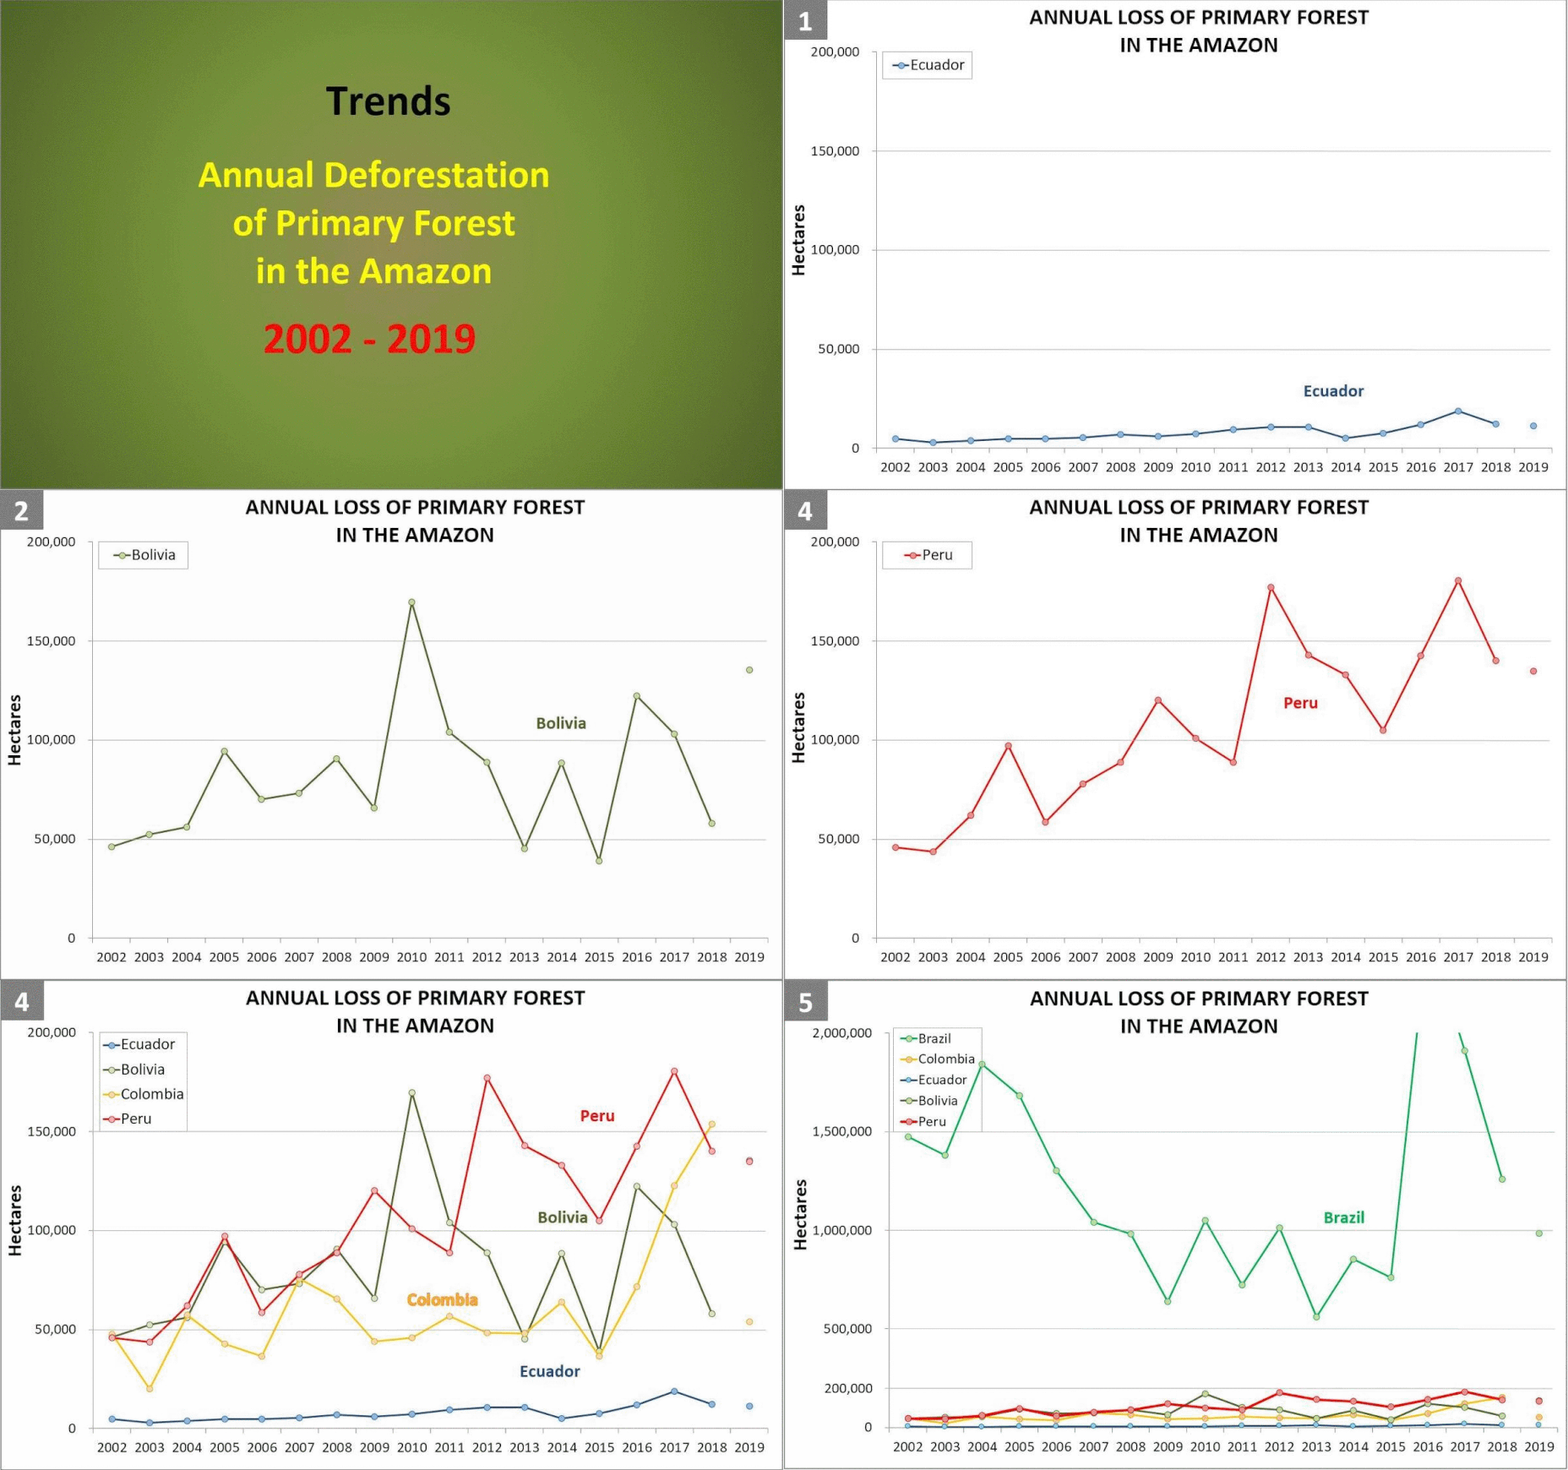
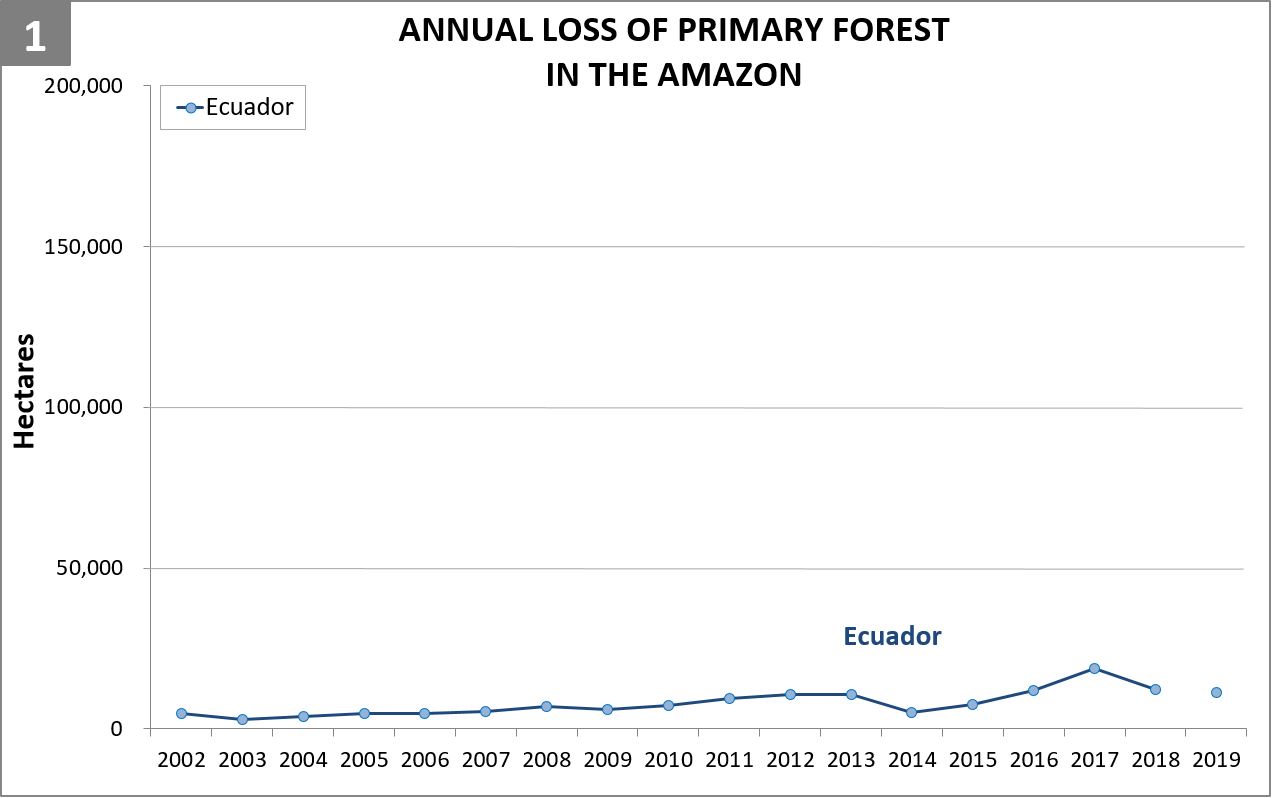
  1. Deforestation in the Ecuadorian Amazon is relatively low, reaching a maximum of 18,800 hectares (46,500 acres) in 2017. The estimate for 2019 is 11,400 hectares (28,000 acres).
    .
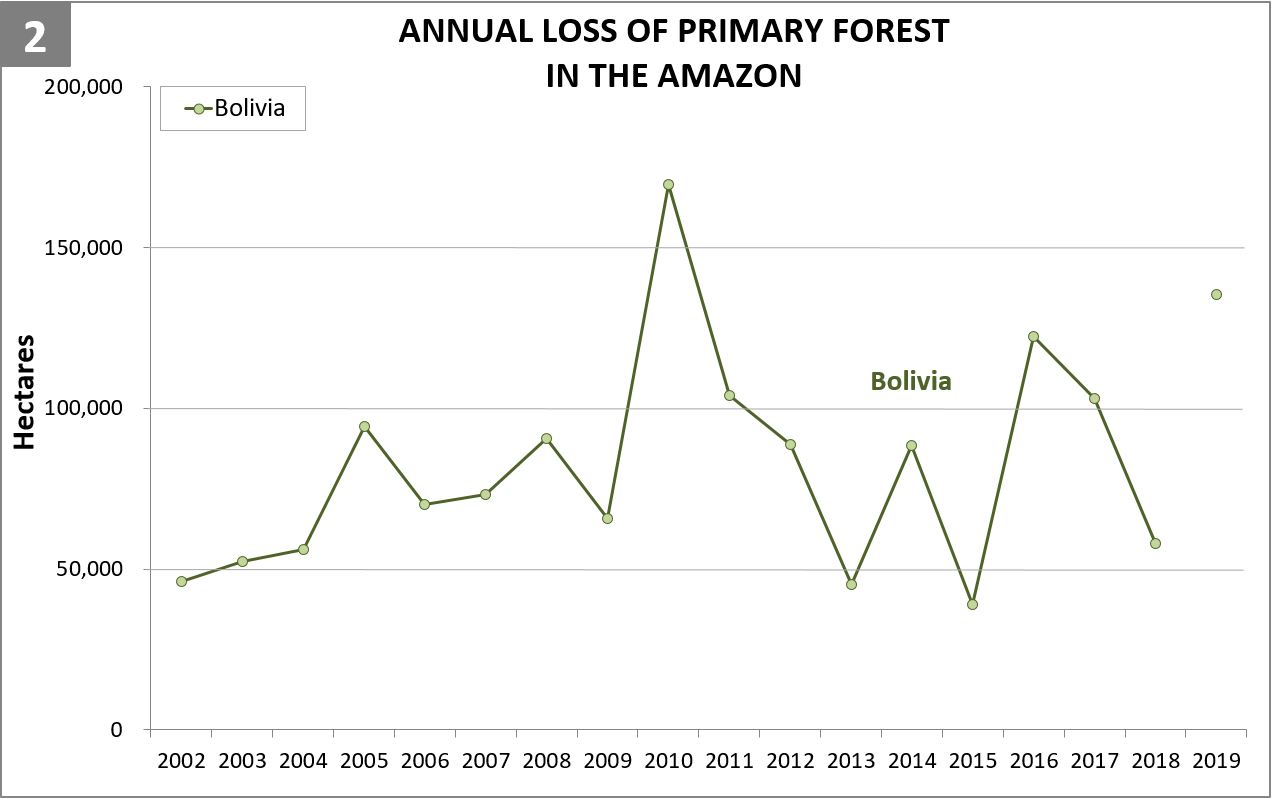
  2. In the Bolivian Amazon, deforestation decreased in 2018 to 58,000 hectares (143,000 acres) after a peak in 2016 of 122,000 hectares (302,000 acres). However, with the recent widespread forest fires, deforestation increased again in 2019, to 135,400 hectares (334,465 acres).
    .
  3. The Colombian Amazon experienced a deforestation boom starting in 2016 (coinciding with the FARC peace accords), reaching an historical high of 153,800 hectares (380,000 acres) in 2018. However, the deforestation estimate for 2019 is back to pre-boom levels at 53,800 hectares (133,000 acres).
    .
  4. Deforestation in the Peruvian Amazon declined in 2018 (compared to 2017) to 140,000 hectares (346,325 acres), but remained relatively high compared to historical data. The official deforestation data from the Peruvian government for 2018 is slightly higher at 154,700 hectares (382,272 acres), but also represents an important reduction compared to 2017. The deforestation estimate for 2019 indicates the continued downward trend to 134,600 hectares (332,670 acres).
    .
  5. Deforestation in the Brazilian Amazon is on another level compared to the other four countries. The 2019 deforestation estimate of 985,000 hectares (2.4 million acres) is consistent with the official data of the Brazilian government. The trend, however, is quite different; we show a decrease in deforestation compared to the previous three years, but the official data indicates an increase. To better understand the differences between data sources (including spatial resolution, inclusion of burned areas, and timeframe), consult this blog by Global Forest Watch.

Deforestation Hotspots 2019
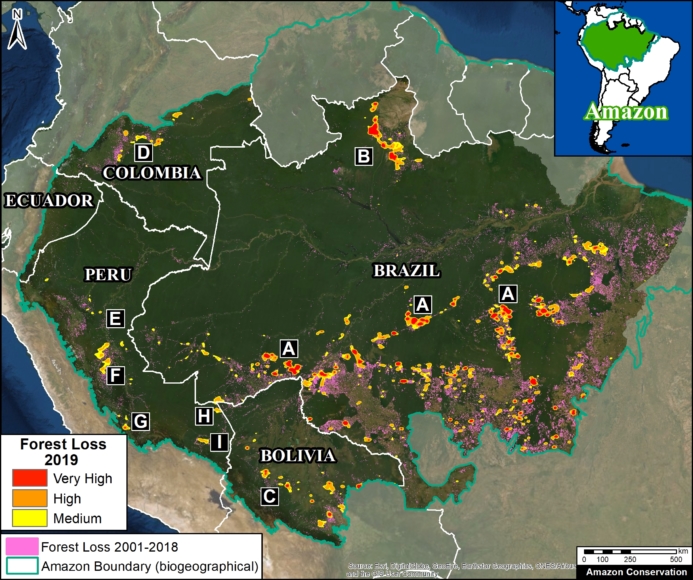
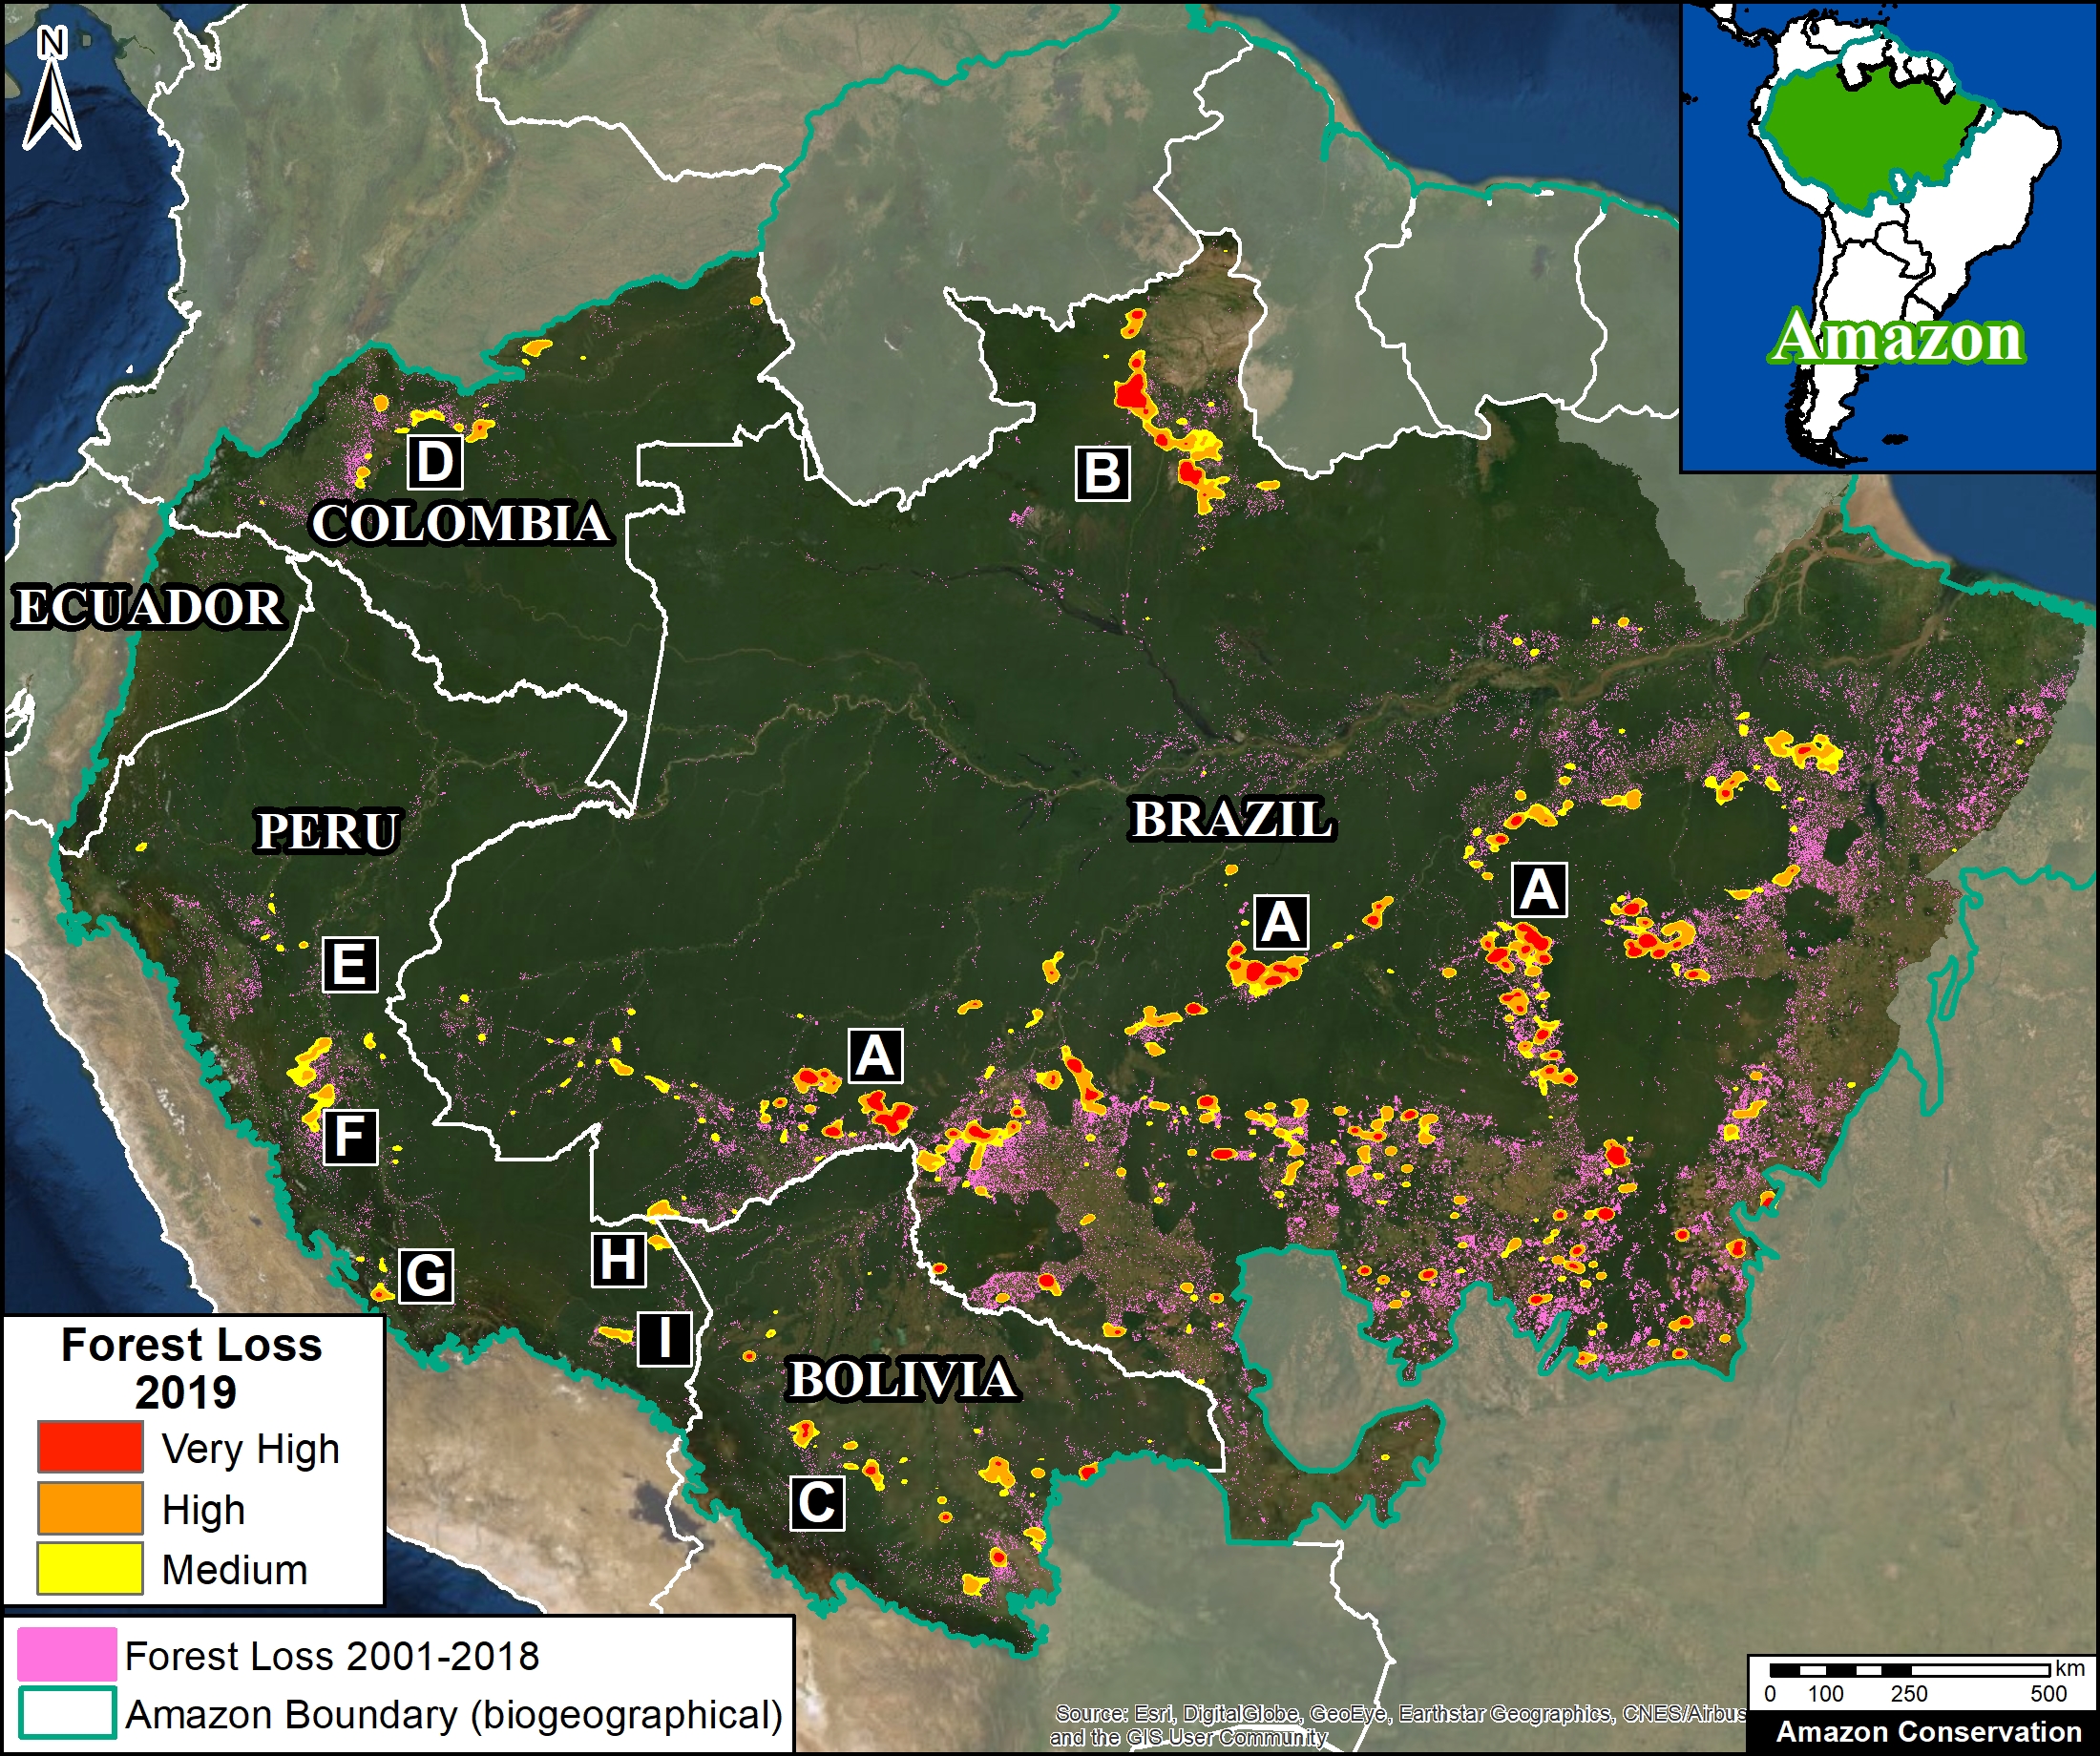
Base Map. Deforestation Hotspots 2019. Data: MAAP, UMD/GLAD, Hansen/UMD/Google/USGS/NASA. Click to see image in high resolution.

The Base Map shows the most intense deforestation hotspots during 2019.

Many of the major deforestation hotspots were in Brazil. The letters A indicate areas deforested between March and July, and then burned starting in August, covering over 735,000 acres in the states of Rondônia, Amazonas, Mato Grosso, Acre, and Pará (MAAP #113). They also indicate areas where fire escaped into the surrounding primary forest, impacting an additional 395,000 acres. There is a concentration of these hotspots along the Trans-Amazonian Highway. The letter B indicates uncontrolled forest fires earlier in the year (March) in the state of Roraima (MAAP #109).

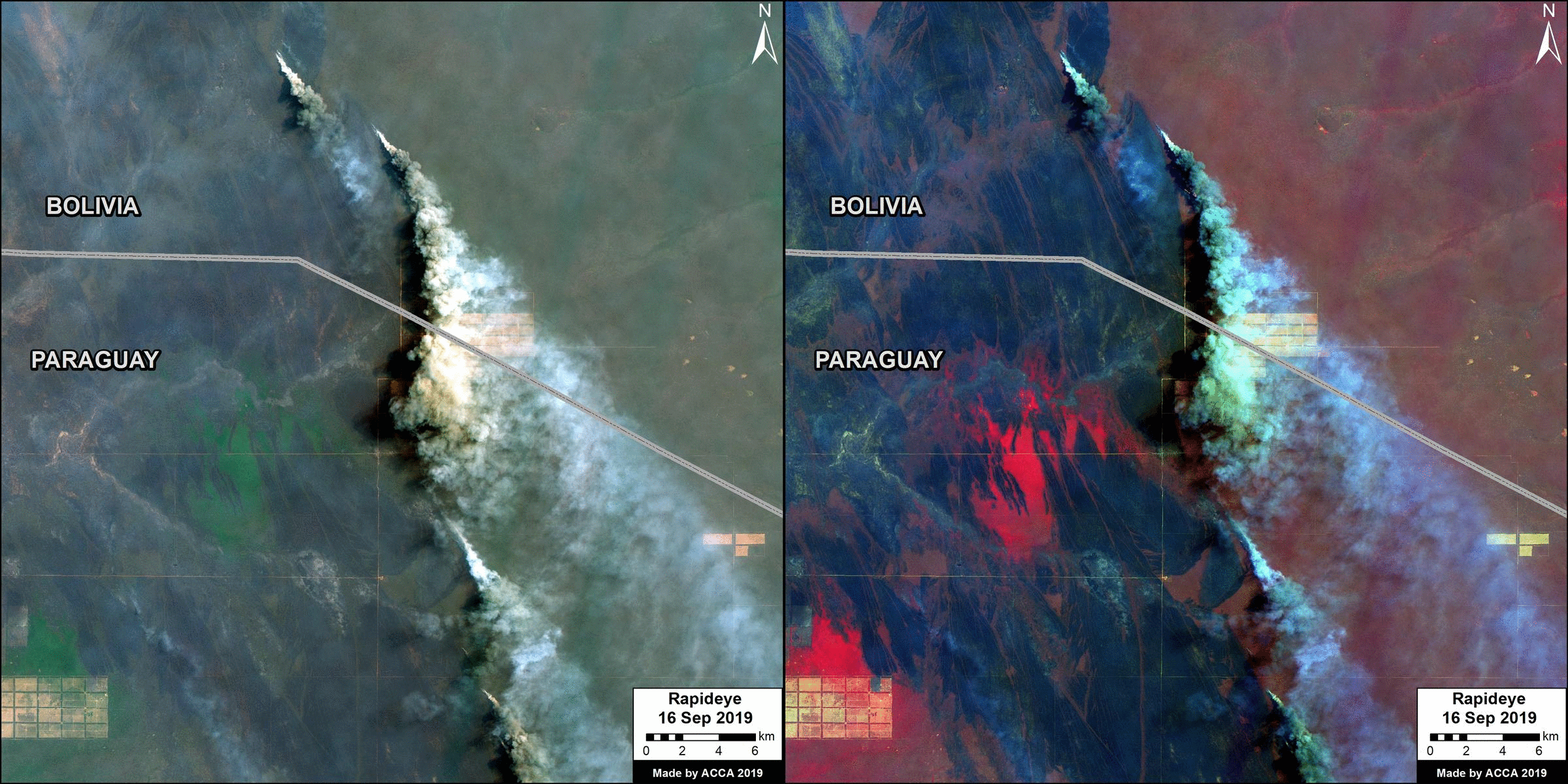
Bolivia also had an intense 2019 fire season. Letter C indicates the area where fires in Amazonian savanna ecosystems escaped to the surrounding forests.

In Colombia, the letter D indicates an area of high deforestation surrounding and within four protected areas: Tinigua, Chiribiquete, and Macarena National Parks, and the Nukak National Reserve (MAAP #106).

In Peru, there are several key areas to highlight. Letter E indicates a new Mennonite colony that has caused the deforestation of 2,500 acres in 2019, near the town of Tierra Blanca in the Loreto region (MAAP #112). Letter F indicates an area of high concentration of small-scale deforestation in the central Amazon (Ucayali and Huánuco regions), with cattle ranching as one of the main causes (MAAP #37). Letter G indicates an area of high concentration of deforestation along the Ene River (Junín and Ayacucho regions). In the south (Madre de Dios region), letter H indicates expanding agricultural activity around the town of Iberia (MAAP #98) and letter I indicates deforestation caused by a combination of gold mining and agricultural activity.

Methodology

As noted above, there are three important considerations about the data in our analysis: First, as a baseline, we use annual forest loss from the University of Maryland to have a consistent source across all five countries. Thus, the values may differ from official national data. Second, we applied a filter to only include loss of primary forest in order to better approximate the official methodology and data. Third, the 2019 data represents a preliminary estimate based on early warning alerts.

The baseline forest loss data presented in this report were generated by the Global Land Analysis and Discovery (GLAD) laboratory at the University of Maryland (Hansen et al 2013) and presented by Global Forest Watch. Our study area is strictly what is highlighted in the Base Map.

Specifically, for our estimate of forest cover loss, we multiplied the annual “forest cover loss” data by the density percentage of the “tree cover” from the year 2001 (values >30%).

For our estimate of primary forest loss, we intersected the forest cover loss data with the additional dataset “primary humid tropical forests” as of 2001 (Turubanova et al 2018). For more details on this part of the methodology, see the Technical Blog from Global Forest Watch (Goldman and Weisse 2019).

All data were processed under the geographical coordinate system WGS 1984. To calculate the areas in metric units the UTM (Universal Transversal Mercator) projection was used: Peru and Ecuador 18 South, Colombia 18 North, Western Brazil 19 South and Bolivia 20 South.

Lastly, to identify the deforestation hotspots, we conducted a kernel density estimate. This type of analysis calculates the magnitude per unit area of a particular phenomenon, in this case forest cover loss. We conducted this analysis using the Kernel Density tool from Spatial Analyst Tool Box of ArcGIS. We used the following parameters:

Search Radius: 15000 layer units (meters)
Kernel Density Function: Quartic kernel function
Cell Size in the map: 200 x 200 meters (4 hectares)
Everything else was left to the default setting.

For the Base Map, we used the following concentration percentages: Medium: 10%-20%; High: 21%-35%; Very High: >35%.

References

Goldman L, Weisse M (2019) Explicación de la Actualización de Datos de 2018 de Global Forest Watch. https://blog.globalforestwatch.org/data-and-research/blog-tecnico-explicacion-de-la-actualizacion-de-datos-de-2018-de-global-forest-watch

Hansen, M. C., P. V. Potapov, R. Moore, M. Hancher, S. A. Turubanova, A. Tyukavina, D. Thau, S. V. Stehman, S. J. Goetz, T. R. Loveland, A. Kommareddy, A. Egorov, L. Chini, C. O. Justice, and J. R. G. Townshend. 2013. “High-Resolution Global Maps of 21st-Century Forest Cover Change.” Science 342 (15 November): 850–53. Data available on-line from: http://earthenginepartners.appspot.com/science-2013-global-forest.

Planet Team (2017). Planet Application Program Interface: In Space for Life on Earth. San Francisco, CA. https://api.planet.com

Turubanova S., Potapov P., Tyukavina, A., and Hansen M. (2018) Ongoing primary forest loss in Brazil, Democratic Republic of the Congo, and Indonesia. Environmental Research Letters  https://doi.org/10.1088/1748-9326/aacd1c 

Acknowledgements

Agradecemos a S. Novoa (ACCA), R. Botero (FCDS), A. Condor (ACCA) y G. Palacios por sus útiles comentarios a este reporte.

Acknowledgements

We thank S. Novoa (ACCA), R. Botero (FCDS), A. Condor (ACCA), A. Folhadella (Amazon Conservation), M. Cohen, and G. Palacios for helpful comments to earlier versions of this report.

This work was supported by the following major funders: NASA/USAID (SERVIR), Norwegian Agency for Development Cooperation (NORAD), Gordon and Betty Moore Foundation, International Conservation Fund of Canada (ICFC), Metabolic Studio, Erol Foundation, MacArthur Foundation, and Global Forest Watch Small Grants Fund (WRI).

Citation

Finer M, Mamani N (2020) MAAP Synthesis: 2019 Amazon Deforestation Trends and Hotspots. MAAP Synthesis #4.
MAAP #115: Illegal Gold Mining in the Amazon, part 1: Peru

Base Map. The main illegal gold mining areas in the Peruvian Amazon. Data: MAAP.

In a new series, we highlight the main illegal gold mining frontiers in the Amazon.

Here, in part 1, we focus on Peru. In the upcoming part 2, we will look at Brazil.

The Base Map indicates our focus areas in Peru*:

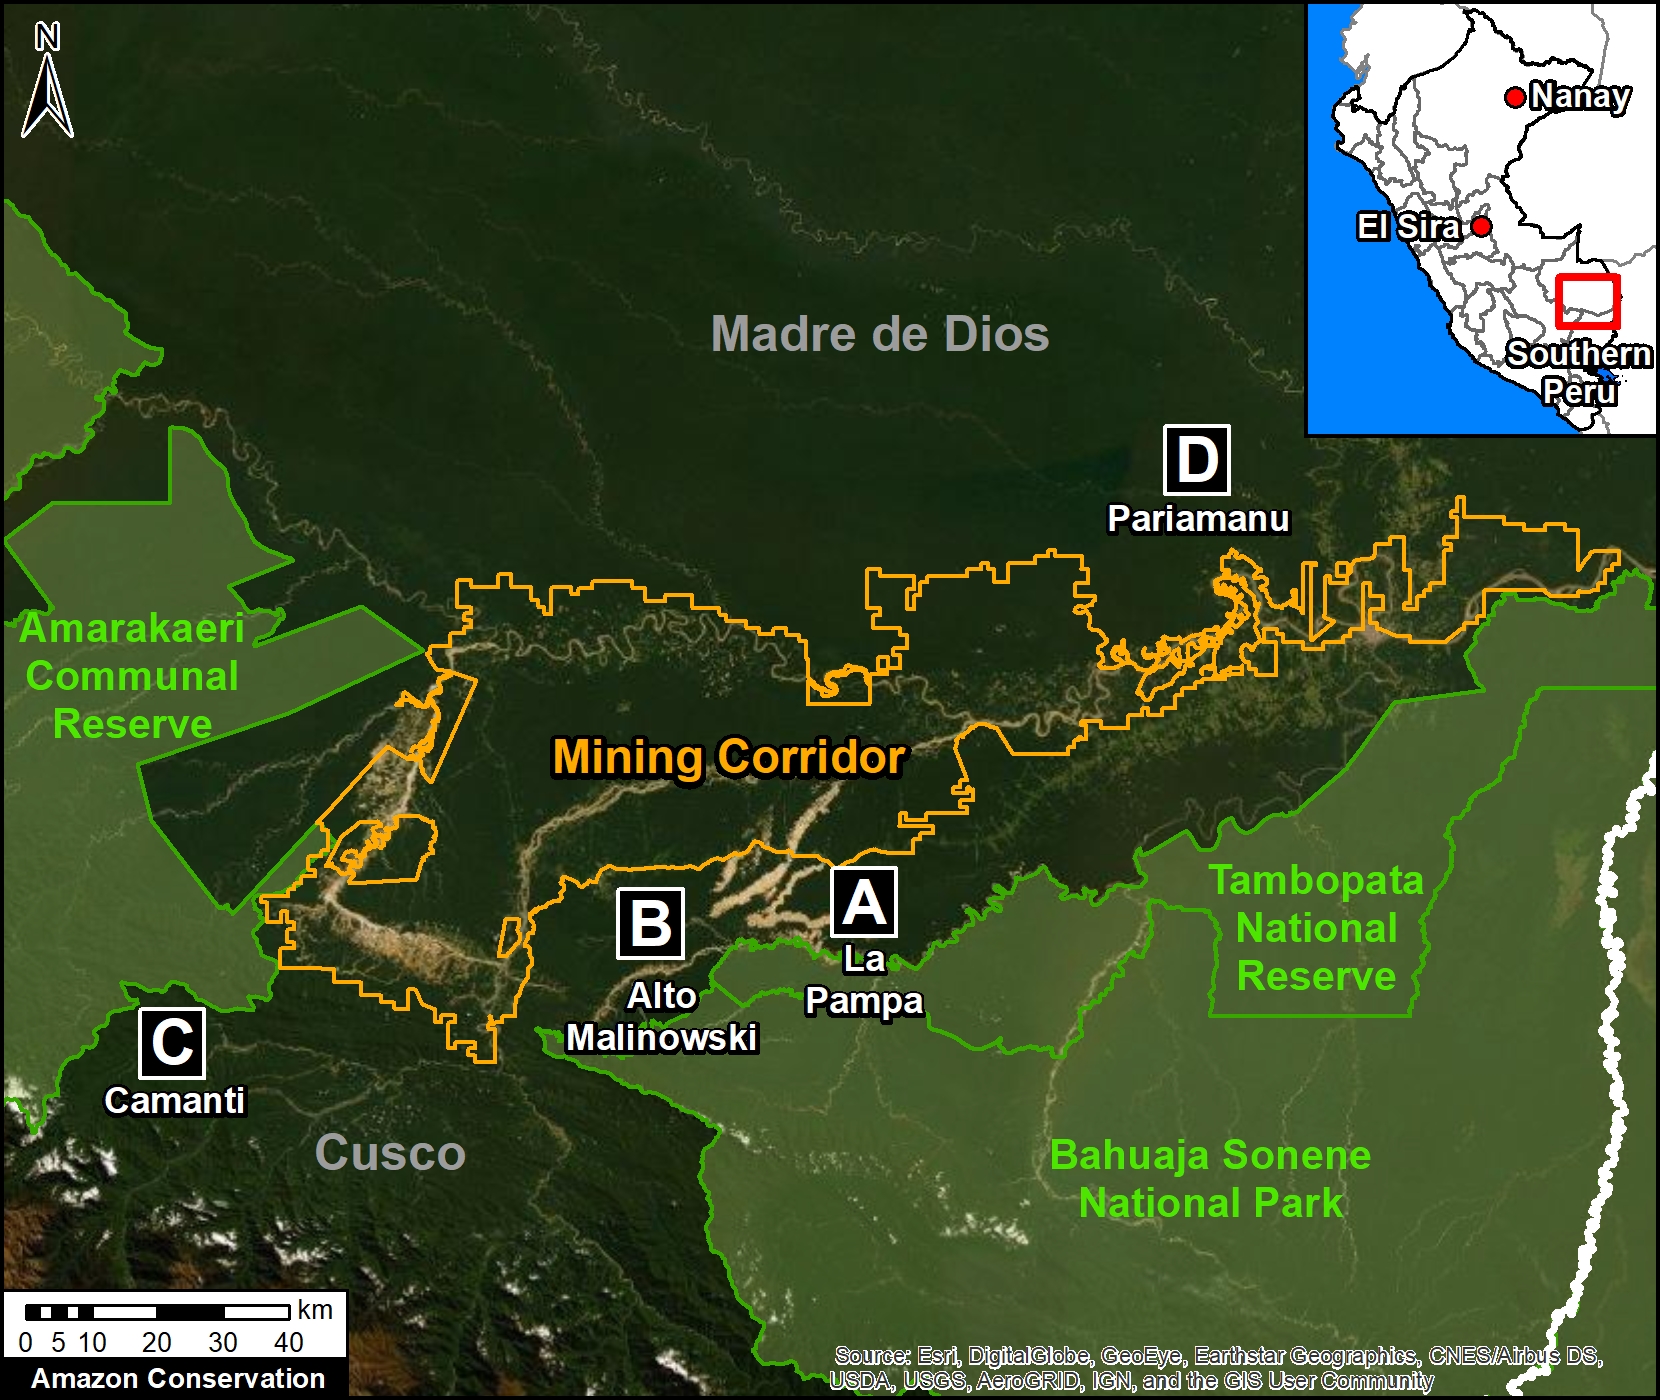
  • Southern Peru (A. La Pampa, B. Alto Malinowski, C. Camanti, D. Pariamanu);
  • Central Peru (E. El Sira).

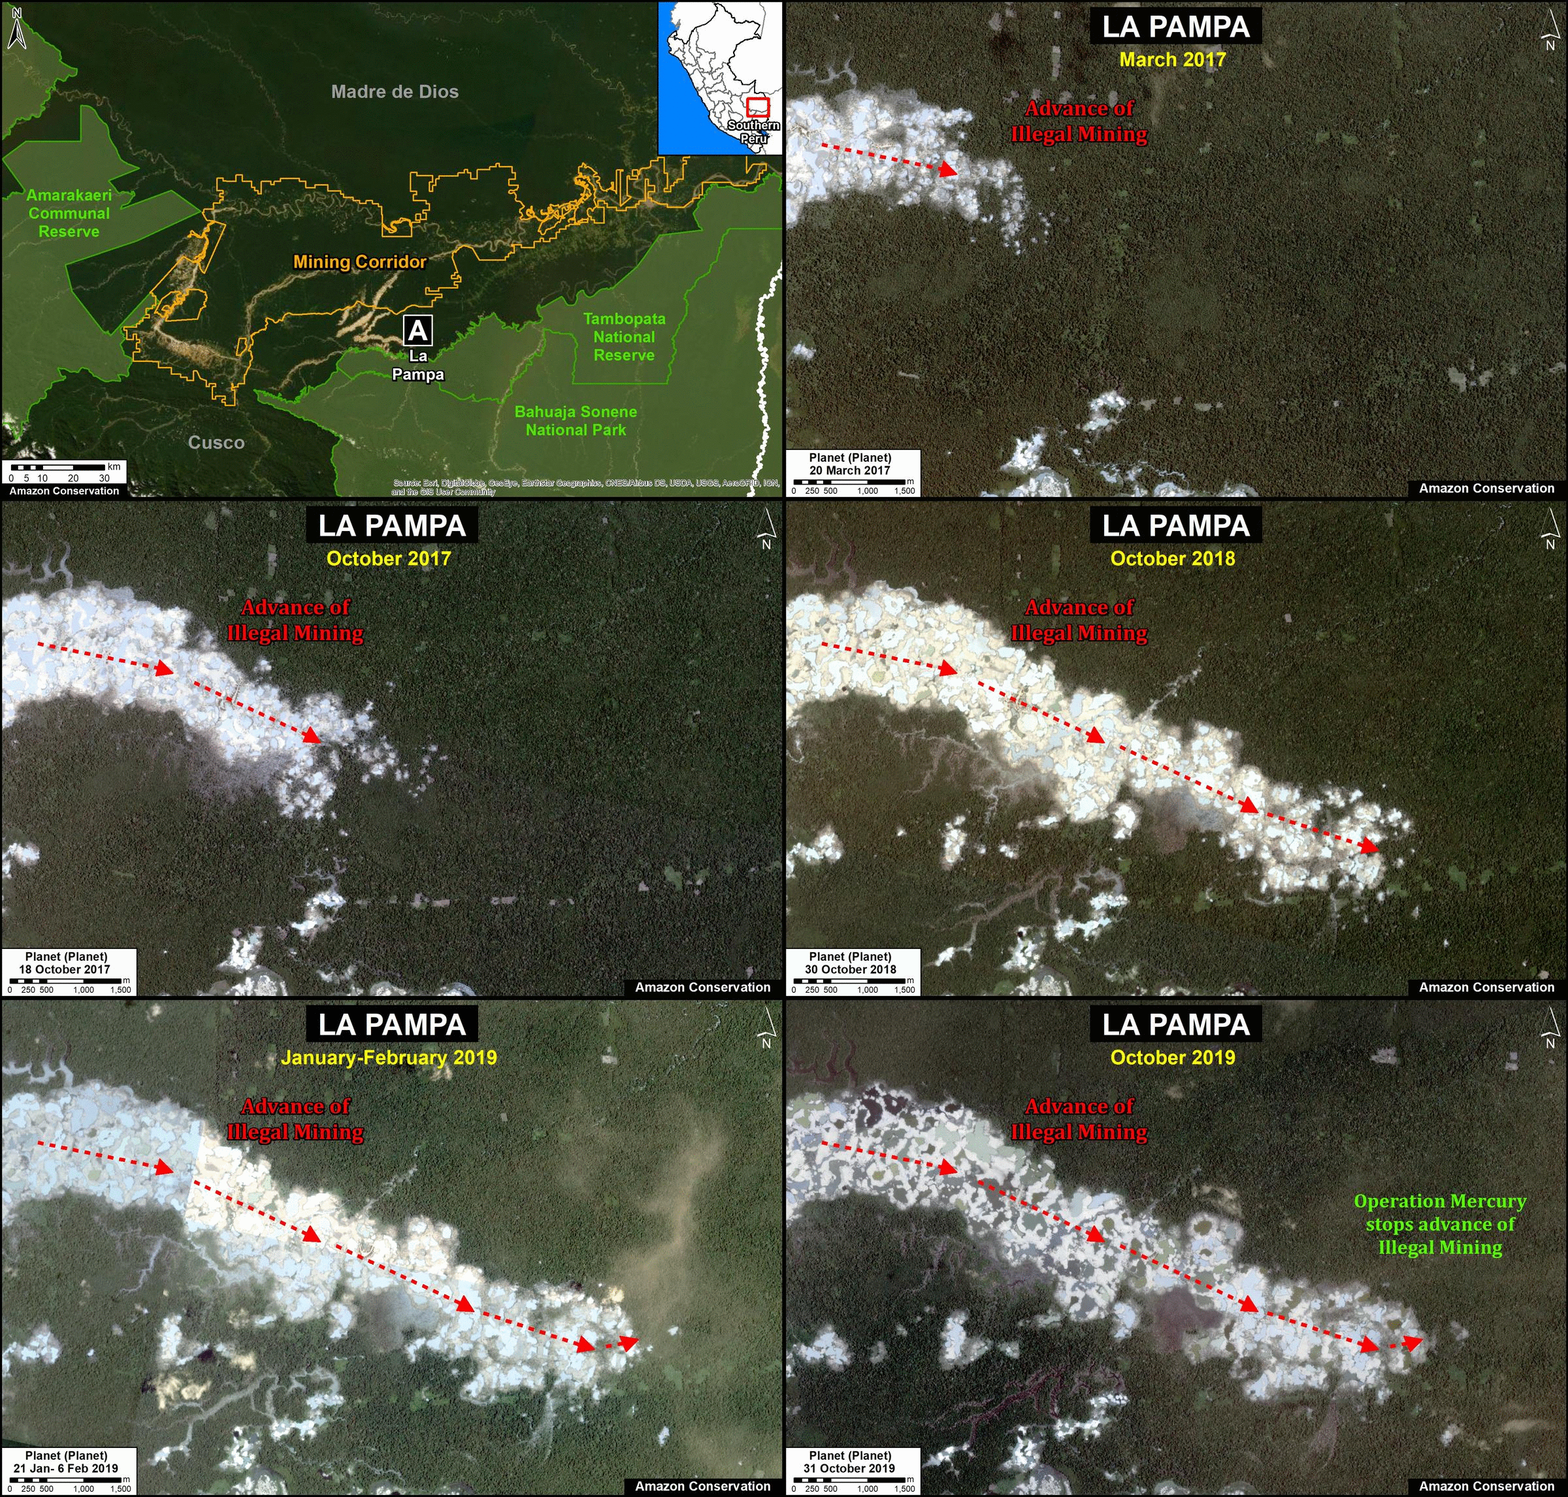
Notably, we found an important reduction in gold mining deforestation in La Pampa (Peru’s worst gold mining area) following the government’s launch of Operation Mercury in February 2019.

Illegal gold mining continues, however, in three other major areas of the southern Peruvian Amazon (Alto Malinowski, Camanti, and Pariamanu), where we estimate the mining deforestation of 5,300 acres (2,150 hectares) since 2017.

Of that total, 22% (1,162 acres) occurred in 2019, indicating that displaced miners from Operation Mercury have NOT caused a surge in these three areas.

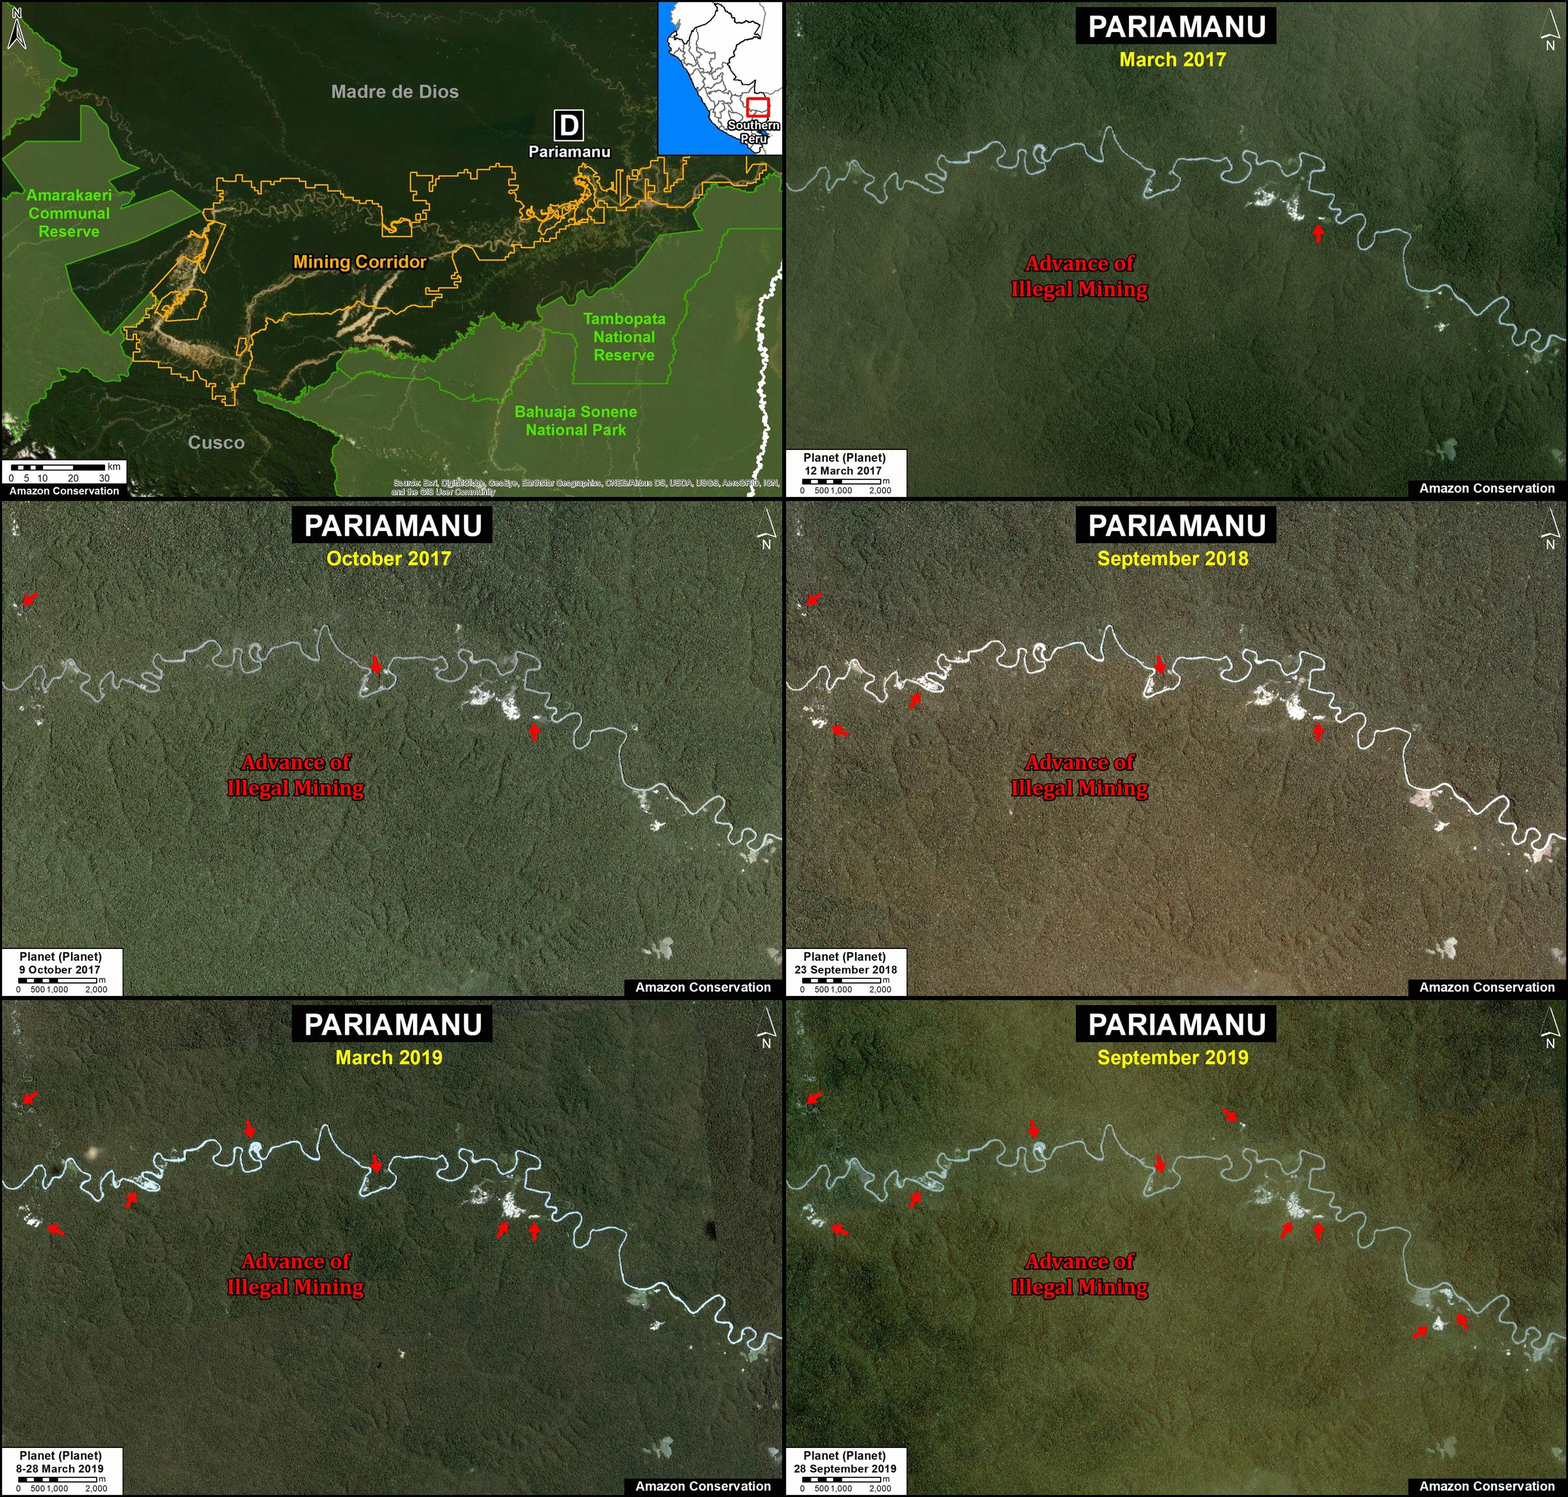
Below, we show a series of satellite videos of the recent gold mining deforestation (2017-19) in each area.

*Recent press reports indicate the increase in illegal gold mining activity in northern Peru (Loreto region), along the Nanay and Napo Rivers, but we have not yet detected associated deforestation.

A. La Pampa (Southern Peru)

In MAAP #104, we reported a major reduction (92%) of gold mining deforestation in La Pampa during the first four months of Operation Mercury, a governmental mega-operation to confront the illegal mining crisis in this area.

The following video shows how gold mining deforestation has declined considerably since February 2019, the beginning of the operation. Note the rapid deforestation during the years 2016-18, followed by a sudden stop in 2019.

B. Alto Malinowski (Southern Peru)

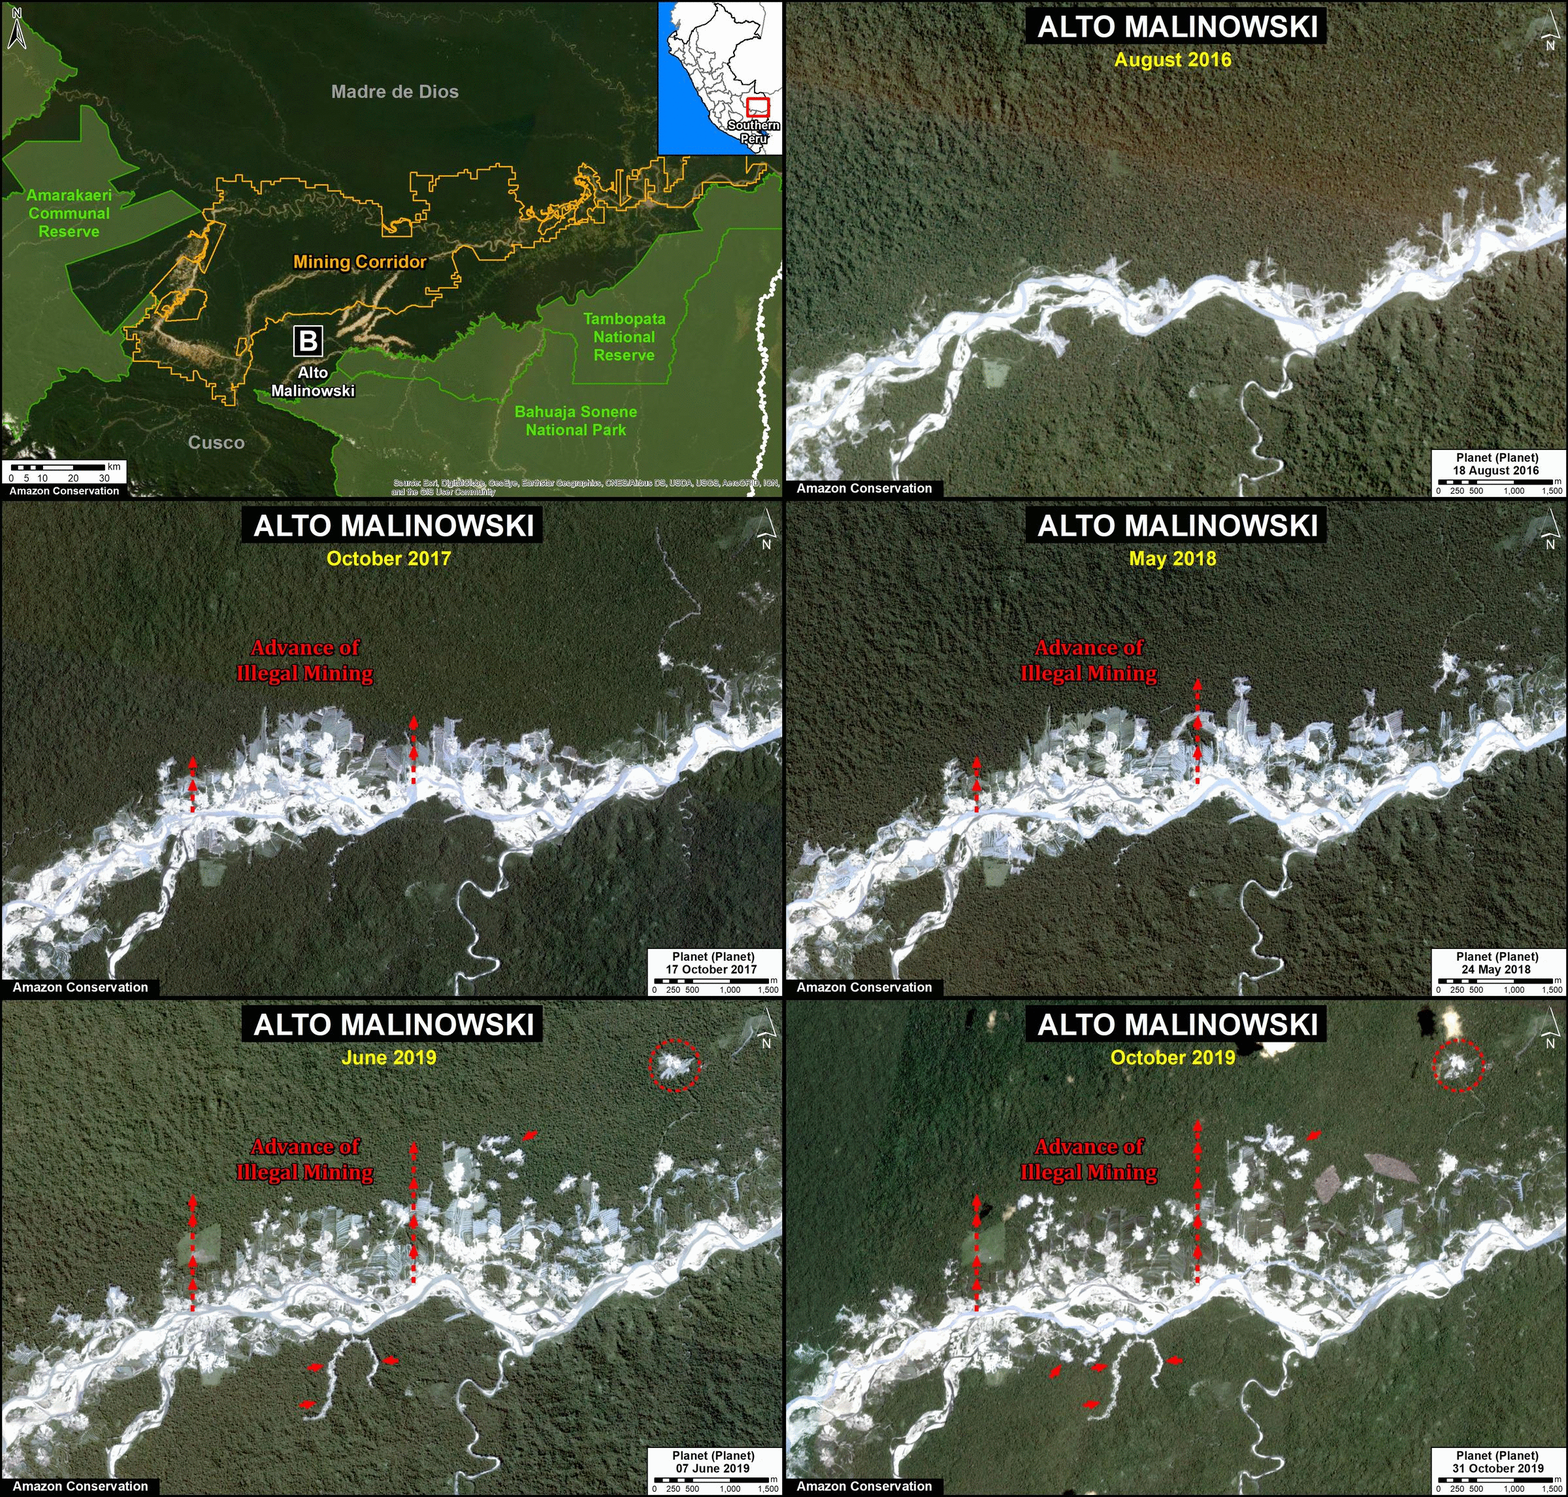
The following video shows gold mining deforestation in a section of the upper Malinowski River (Madre de Dios region). We estimate the mining deforestation of 4,120 acres (1,668 hectares) throughout the Alto Malinowski area during the 2017 – 2019 period.

Of that total, 20% (865 acres) occurred in 2019, indicating that displaced miners from Operation Mercury have not caused a surge in this area adjacent to La Pampa.

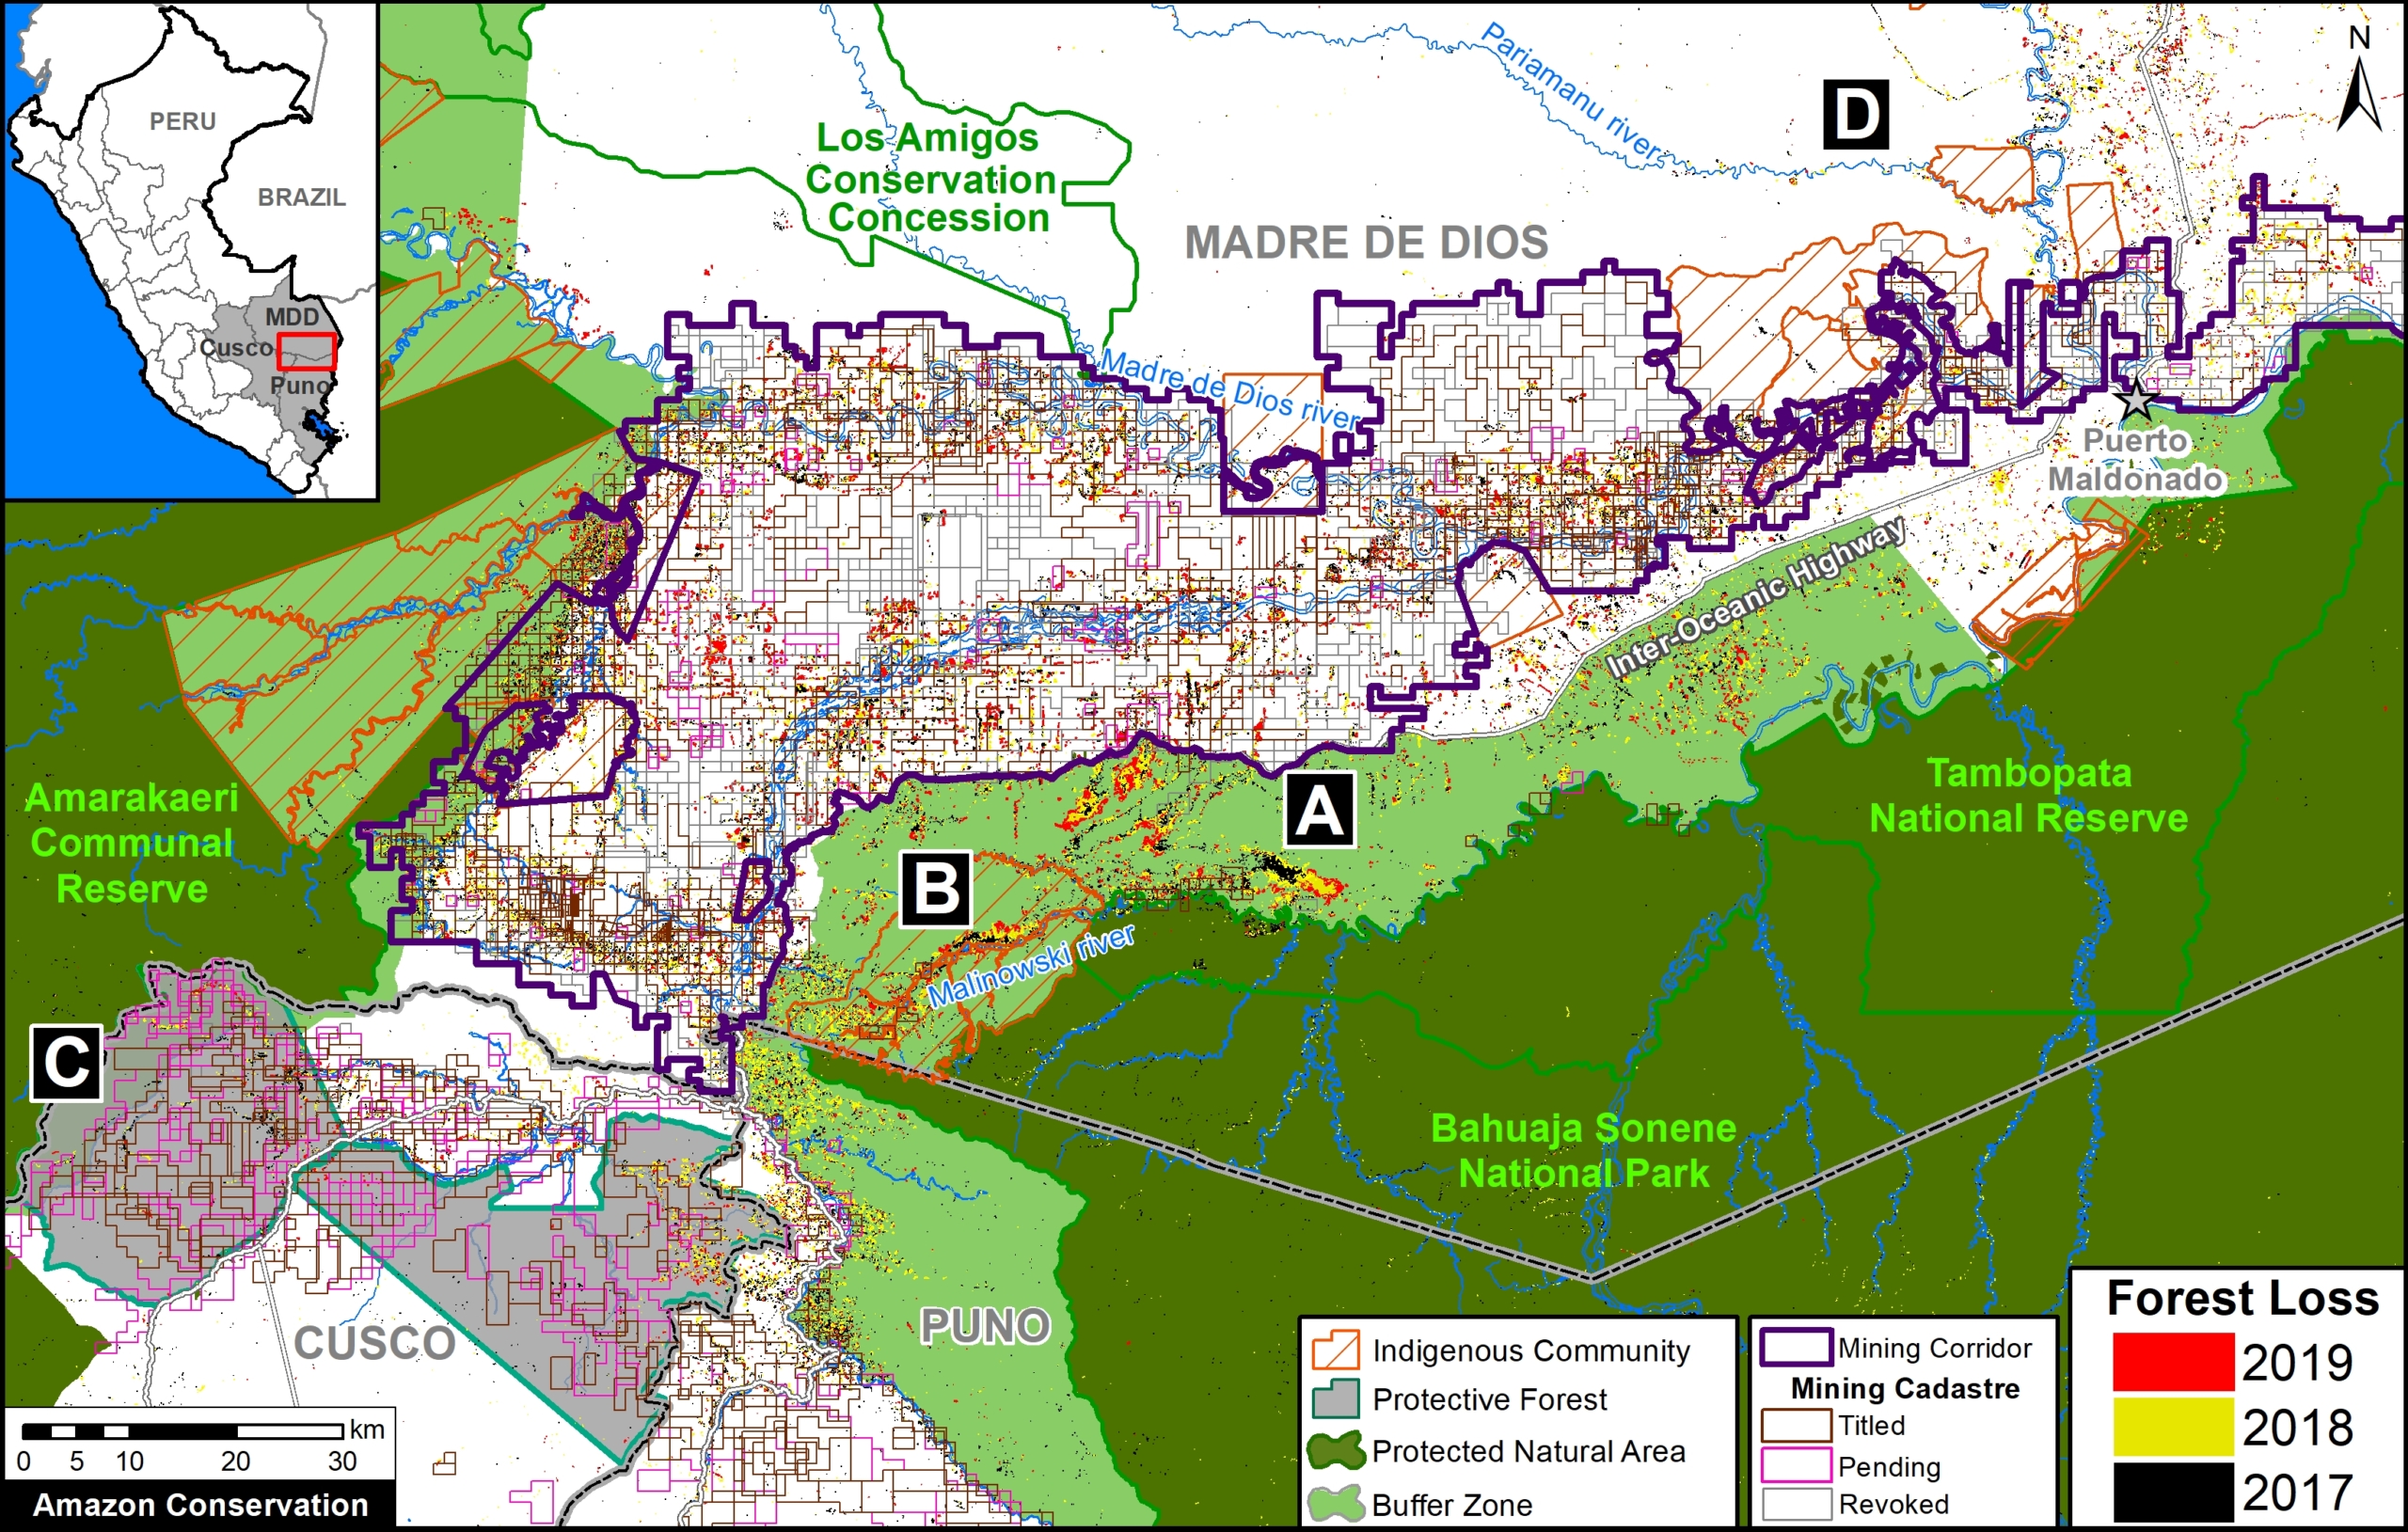
According to our analysis of governmental information (see Annex 2), the recent mining activity is likely illegal because: a) much of it occurs outside of titled mining concessions, b) and all of it occurs outside of the mining corridor established for legal mining activity (see Annex 1).

Note that the mining deforestation is within the Kotsimba Indigenous Community territory. However, it has not penetrated Bahuaja Sonene National Park, in part due to the actions of the Peruvian Protected Areas Service (SERNANP).

C. Camanti (Southern Peru)

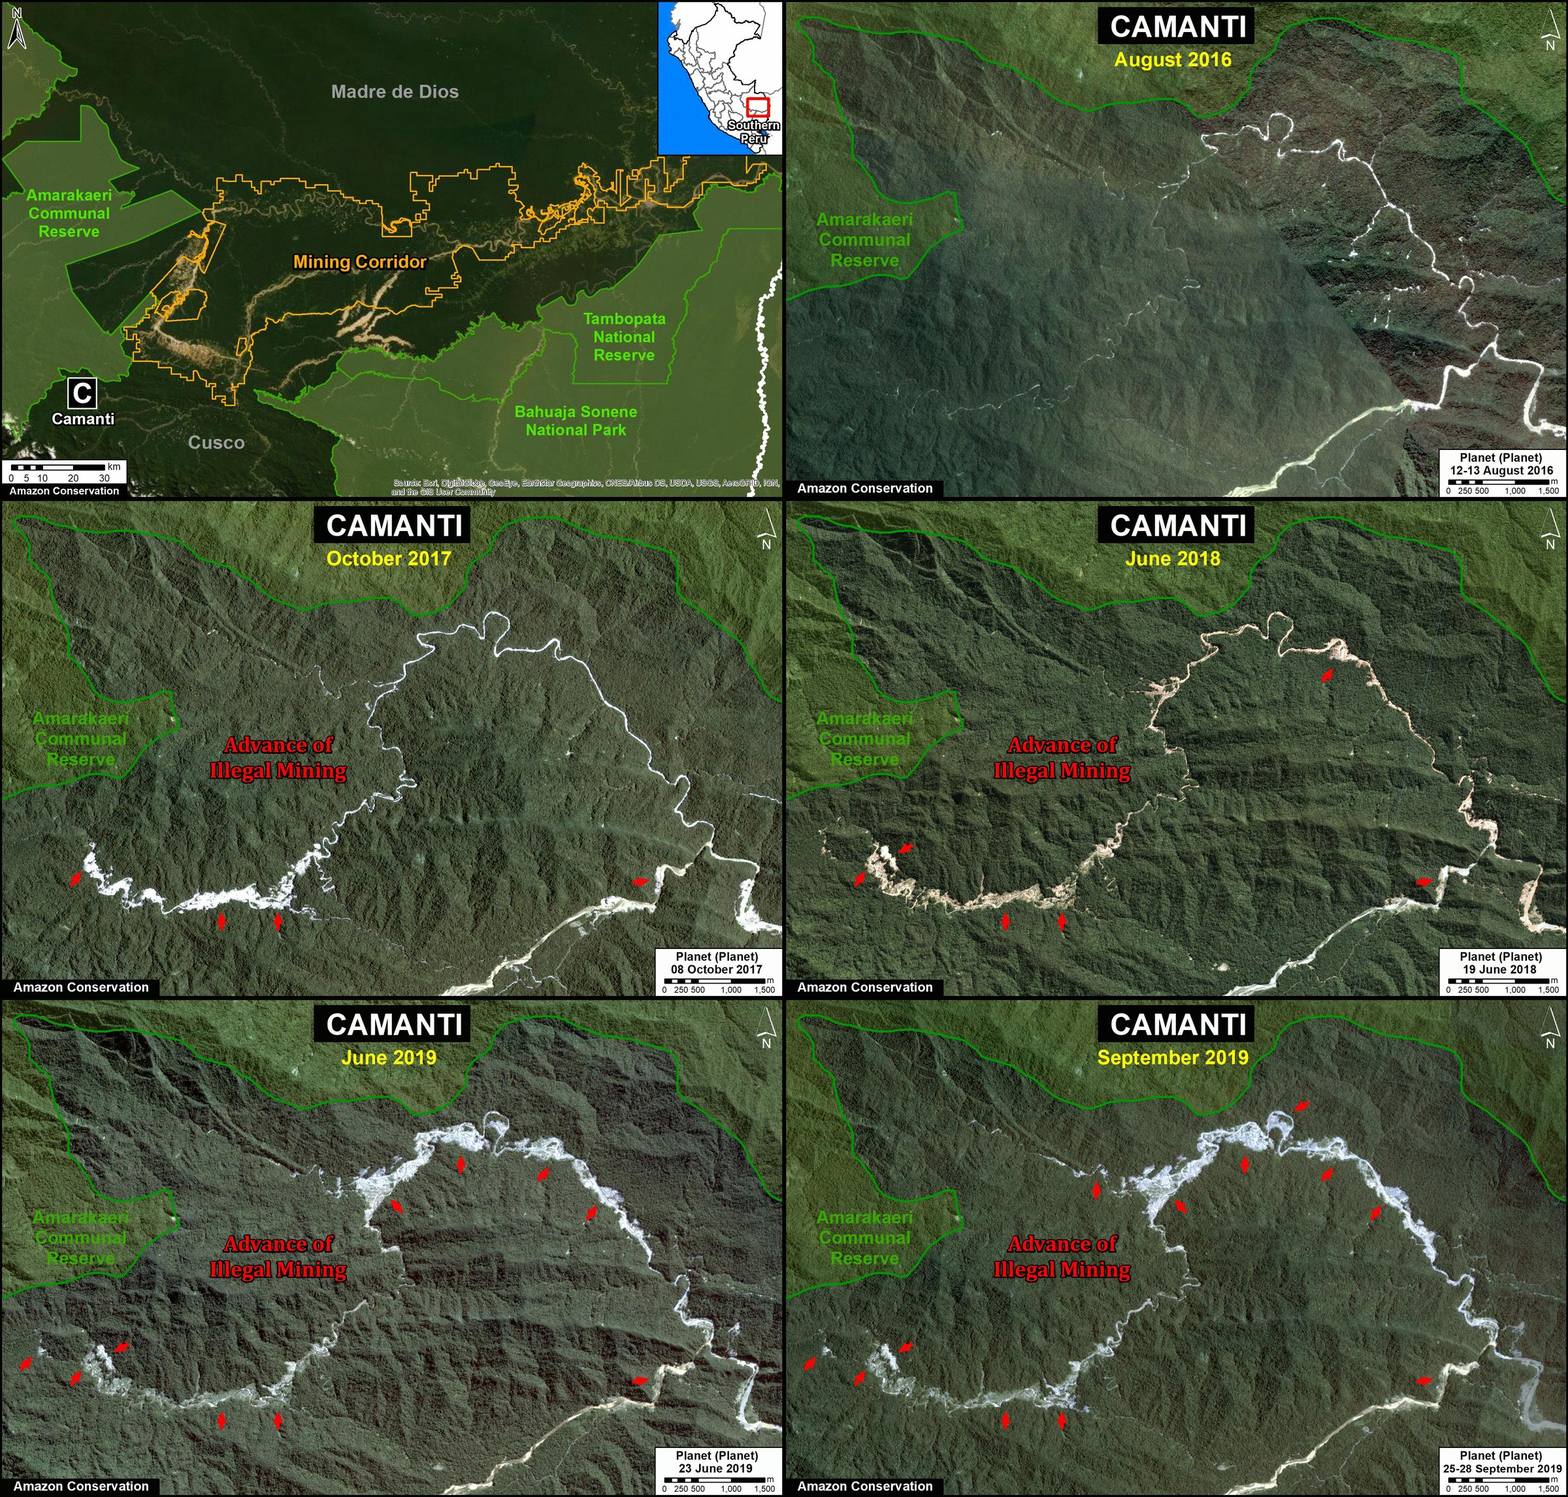
The following video shows the gold mining deforestation of 944 acres (382 hectares) in the Camanti district (Cusco region), during the 2017 – 2019 period.

Of that total, 21% (198 acres) occurred in 2019, indicating that there has been no increase in mining activity in this area since the beginning of Operation Mercury in February (in contrast to press reports that have suggested that many displaced miners have moved to this area).

According to governmental information (see Annex 2), this mining activity is likely illegal because: a) much of it occurs outside of titled mining concessions, b) all occurs outside of the mining corridor, and c) all occurs inside both a protected forest (Bosque Protector) and buffer zone of the Amarakaeri Communal Reserve.

SERNANP (Peruvian Protected Areas Service) informed us that in December 2019, as part of Operation Mercury, the Public Ministry (Ministerio Público) led an interdiction with the support of law enforcement. Machinery, mining camps, and mercury were destroyed or removed during the raid. In 2020, as part of an extension of Operation Mercury, the Environmental Prosecutor’s Office (FEMA) of the Public Ministry announced that the buffer zone of the Amarakaeri Communal Reserve will be constantly monitored.

D. Pariamanu (Southern Peru)

The following video shows gold mining activity along a section of the Pariamanu River (Madre de Dios region). We estimate the gold mining deforestation of 245 acres (99 hectares) in the Pariamanu area, during the 2017 – 2019 period.

Of that total, 40% (99 acres) occurred in 2019, indicating that there has been a slight increase in mining activity since the beginning of Operation Mercury in February. This finding suggests that displaced miners may be moving to this area.

According to governmental information (see Annex 2), this mining activity is likely illegal because it is not within active mining concessions and outside the mining corridor. Morevoer,  the mining deforestation is within Brazil nut forestry concessions.

E. El Sira (Central Peru)

The following video shows the gold mining deforestation of 52 acres (21 hectares) in the buffer zone of El Sira Communal Reserve (Huánuco region), during the 2017 – 2019 period.


Although the mining activity occurs in an active mining concession, a recent report indicates that it is illegal because it does not have the deforestation authorization.

Annex 1: Mining Corridor

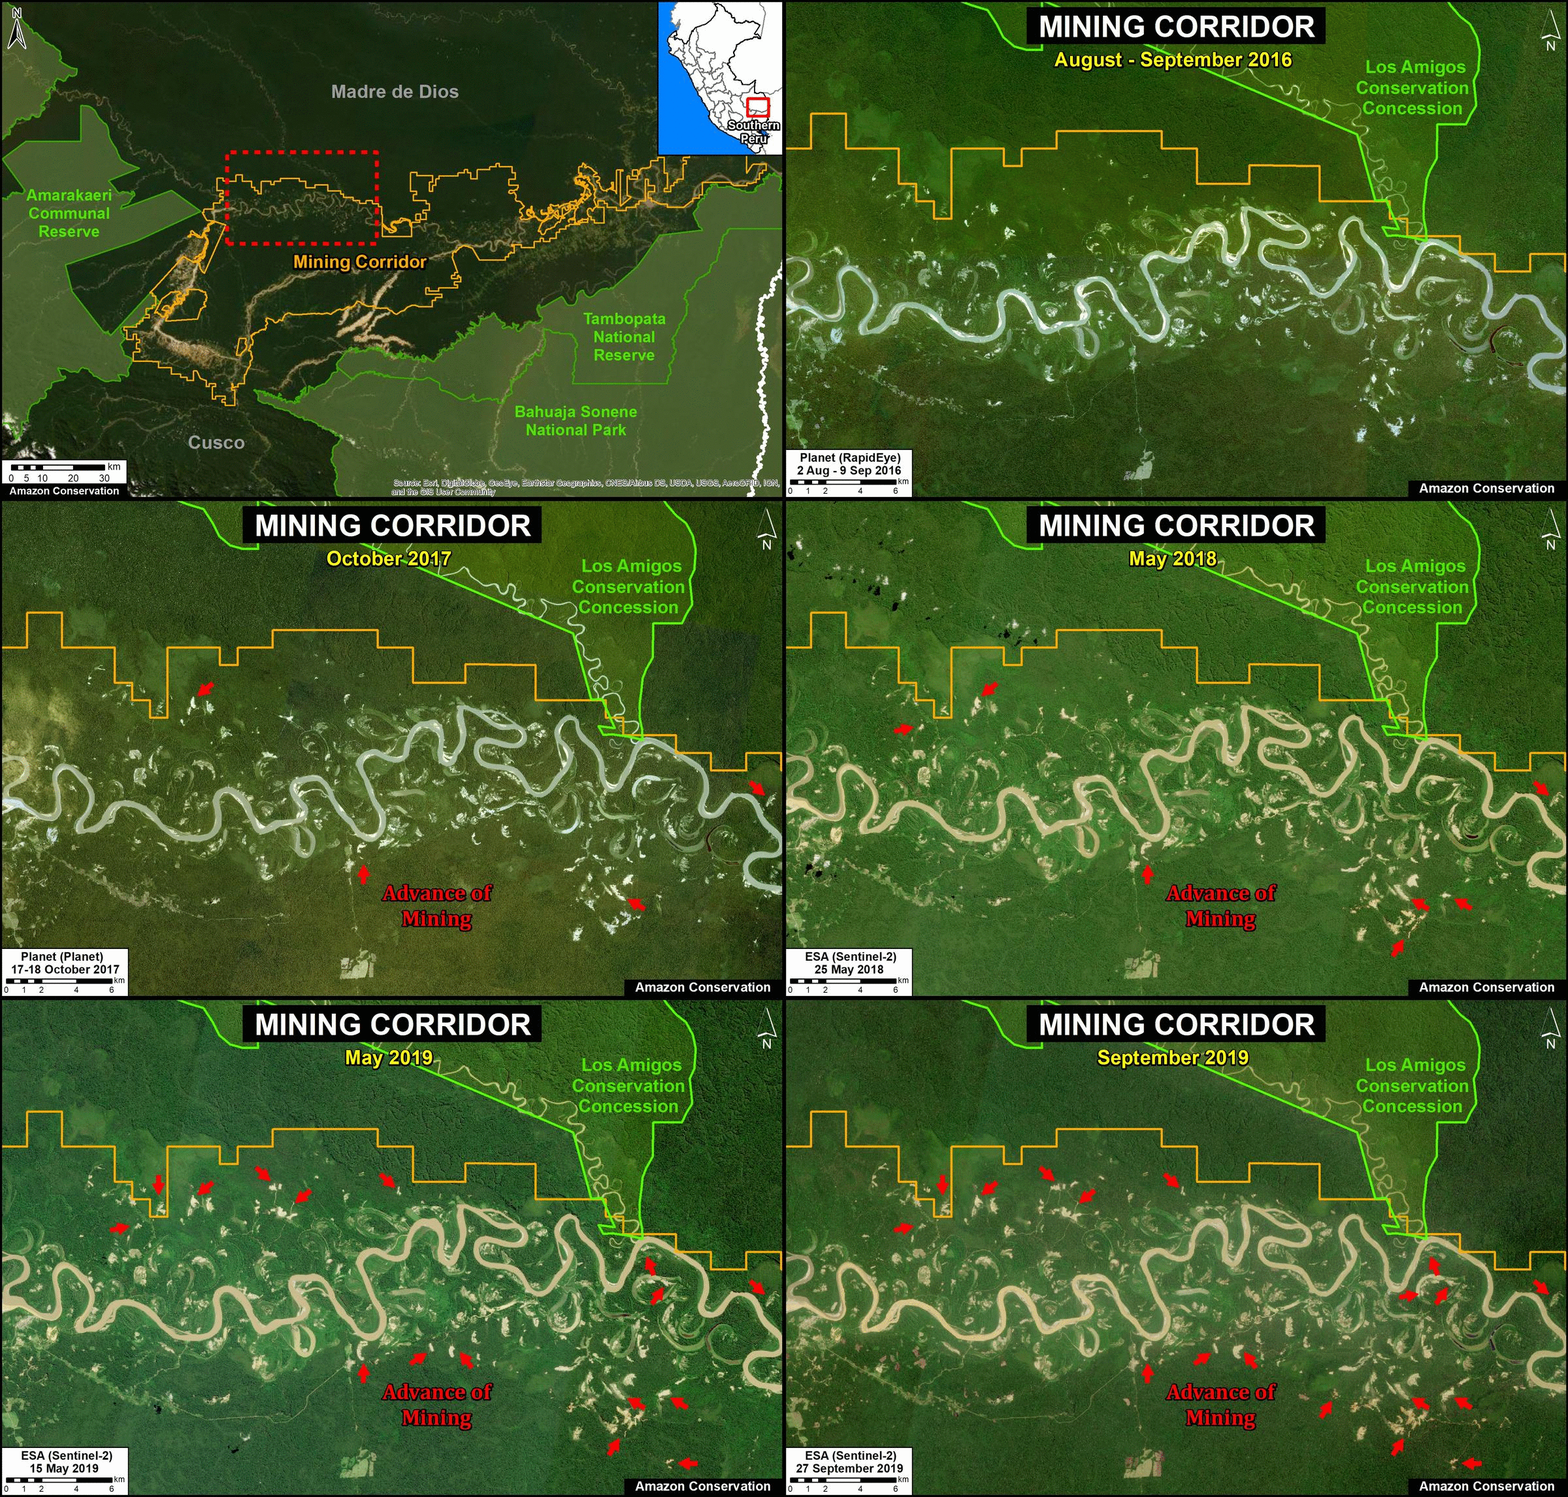
The mining corridor is the area that the Peruvian Government has defined as potentially legal for mining activity in the Madre de Dios region via a formalization process. As of 2019, over 100 miners have been formalized in Madre de Dios.

In general, mining activity in the corridor is considered legal, either formaly (the formalization process is completed with environmental and operational permits approved) or informaly (in the process of formalization). Thus, mining activity within the corridor is not considered illegal since it is not a prohibited area.

The following two videos show examples of gold mining deforestation in the mining corridor during 2019.

Annex 2: Land Use Map

For greater context, we present a map of qualifying titles directly related to the mining sector, in southern Peru. Layers include the mining corridor (see above), mining concession status (titled, pending, revoked), indigenous territories, and protected areas.

Land use map for southern Peruvian Amazon mining areas. Data: GEOCATMIN/INGEMMET. Click to enlarge.

Acknowledgements

We thank E. Ortiz (AAF), A. Flórez (SERNANP), P. Rengifo (ACCA), A. Condor (ACCA), A. Folhadella (Amazon Conservation), and G. Palacios for helpful comments to earlier versions of this report.

This work was supported by the following major funders: NASA/USAID (SERVIR), Norwegian Agency for Development Cooperation (NORAD), Gordon and Betty Moore Foundation, International Conservation Fund of Canada (ICFC), Metabolic Studio, Erol Foundation, MacArthur Foundation, and Global Forest Watch Small Grants Fund (WRI).

Citation

Finer M, Mamani N (2020) Illegal Gold Mining Frontiers, part 1: Peru. MAAP: 115.

MAAP #114: Oil Drilling Pushes Deeper into Yasuni National Park

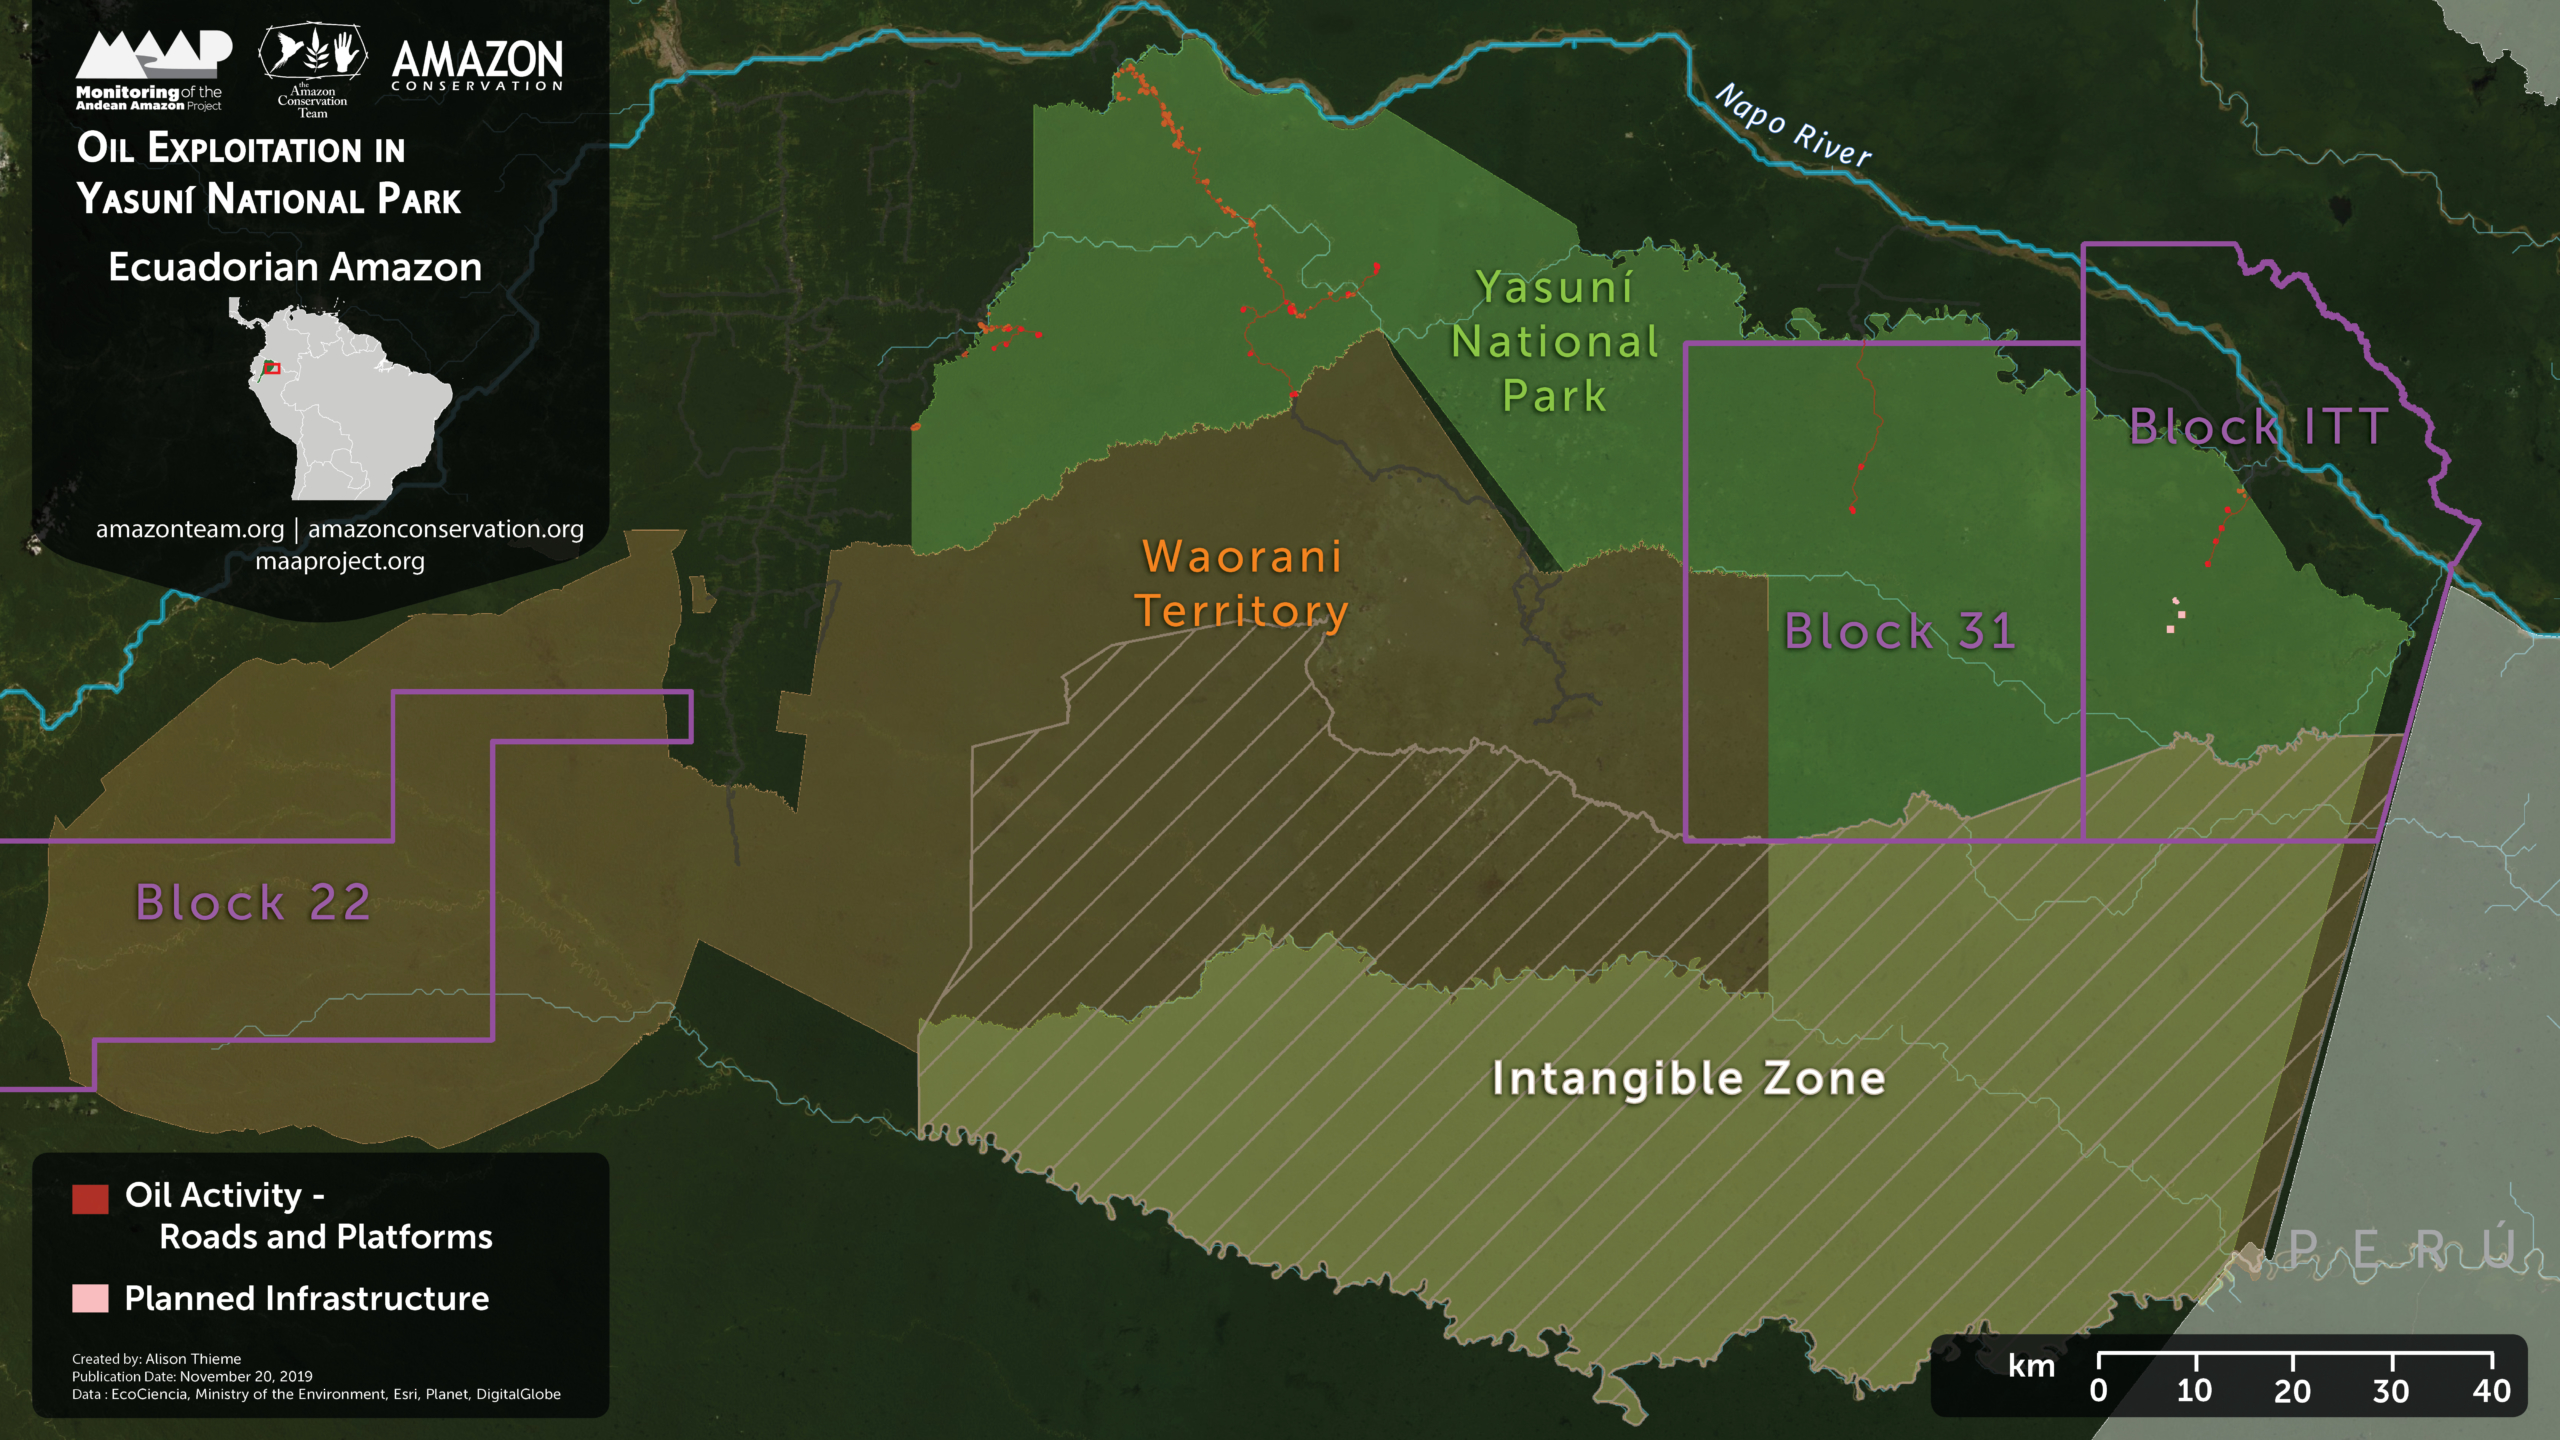
Base Map. Oil Exploitation in Yasuni National Park. Click to enlarge.

Yasuni National Park, located in the heart of the Ecuadorian Amazon, is one of the most biodiverse places in the world and forms part of the ancestral territory of the Waorani (see Base Map).

Under the ground of this vast area, however, are large oil fields.

In July 2019, the Waorani won an important legal victory to prevent oil activity in the western part of their territory (Block 22).

However, here we show the construction of new oil drilling platforms in the controversial ITT Block, in the northeast part of Yasuni National Park.

We calculated the deforestation of 57.3 hectares (141.6 acres) for drilling platforms and access roads within ITT and the adjacent Block 31.

In addition, incorporating edge effects caused by the deforestation, we estimate the impacted area is actually 655 hectares (1,619 acres), exceeding the limit of 300 hectares (741 acres) established in the public referendum of 2018.*


ITT Block

The ITT Block covers one of the most remote and intact parts of Yasuni National Park. In 2007, the Ecuadorian government launched a unique initiative to keep ITT’s oil underground in exchange for economic compensation from the international community (Yasuni-ITT Initiative).

In 2013, however, the Initiative failed and was abandoned. Indeed, the government is now actively advancing it’s ITT oil extraction plans.

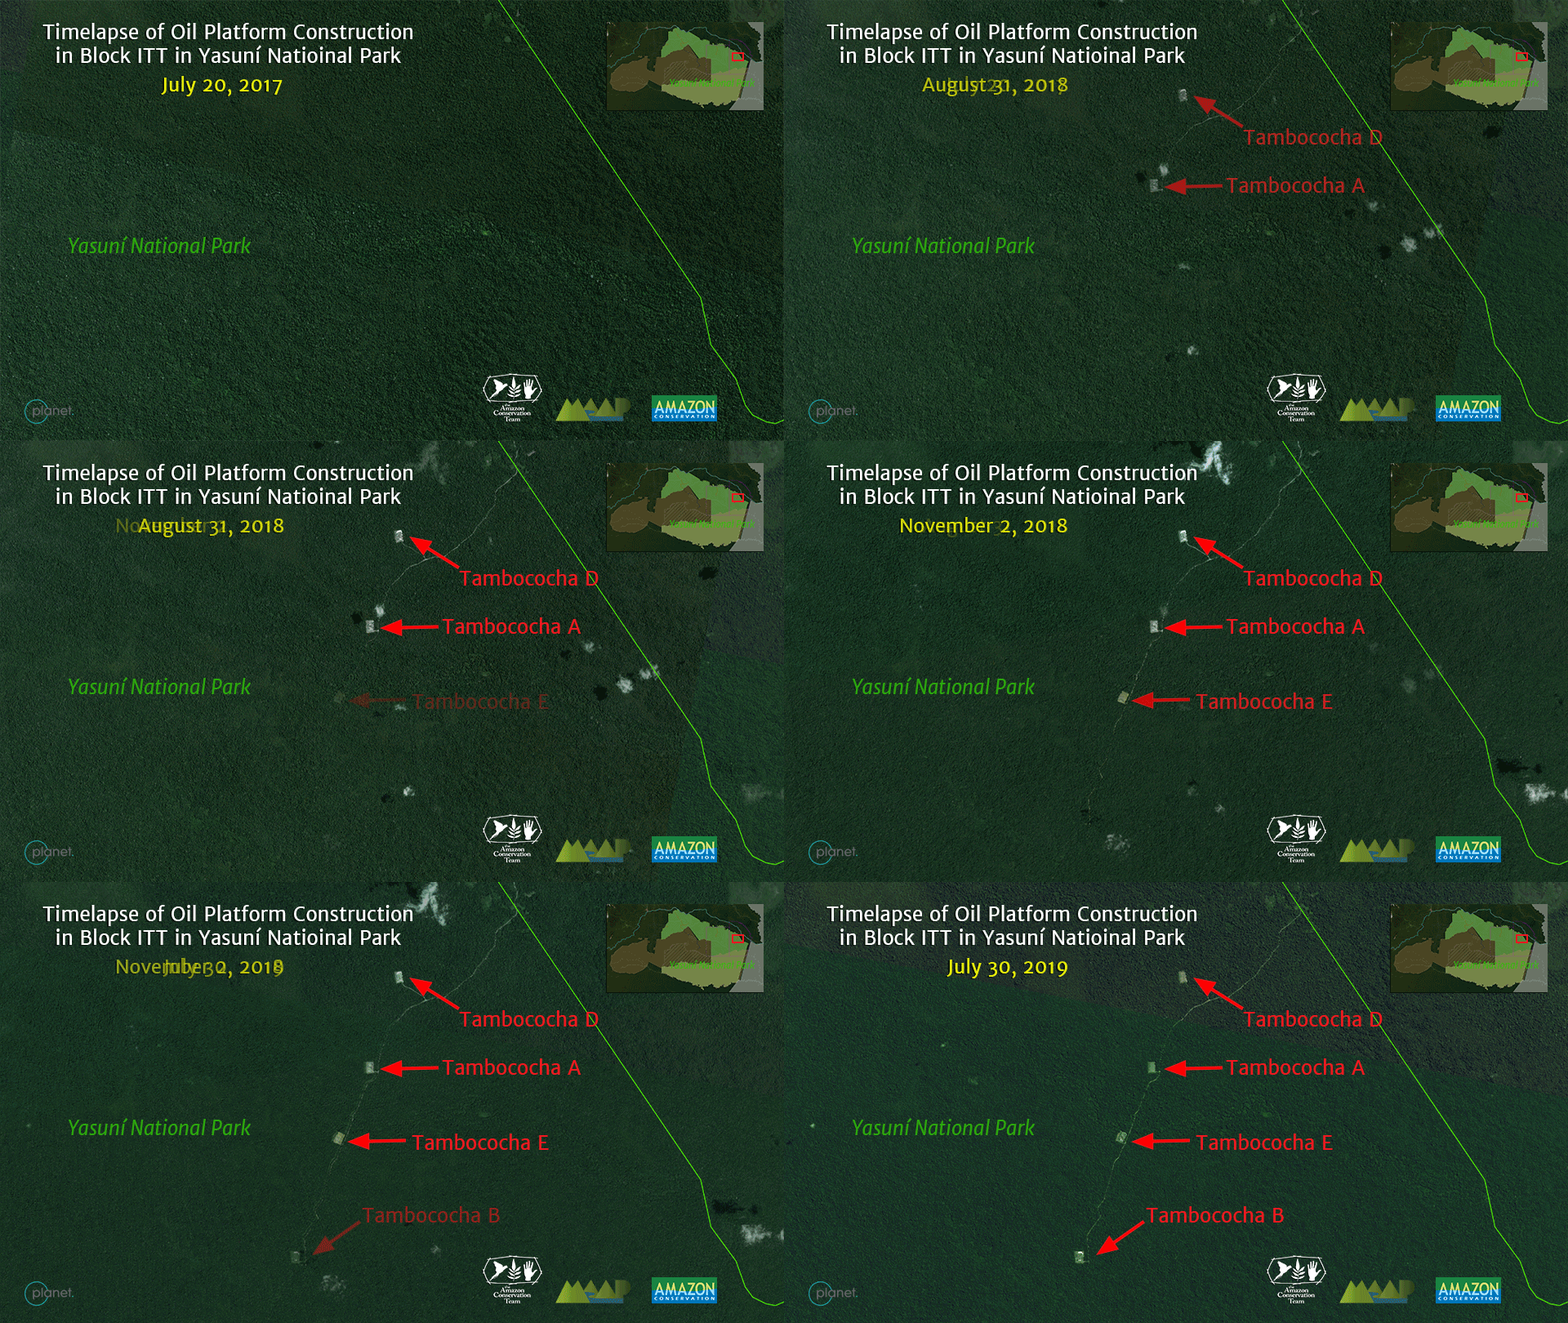
Next, we present a video of satellite images showing the recent oil-related activity inside the ITT Block, within Yasuni National Park. It involves the construction of 4 drilling platforms (Tambococha A,B,D, E) and an access road, between 2017 and 2019. The associated deforestation is 28.5 hectares (70 acres).

Zona Intangible (Untouchable Zone)

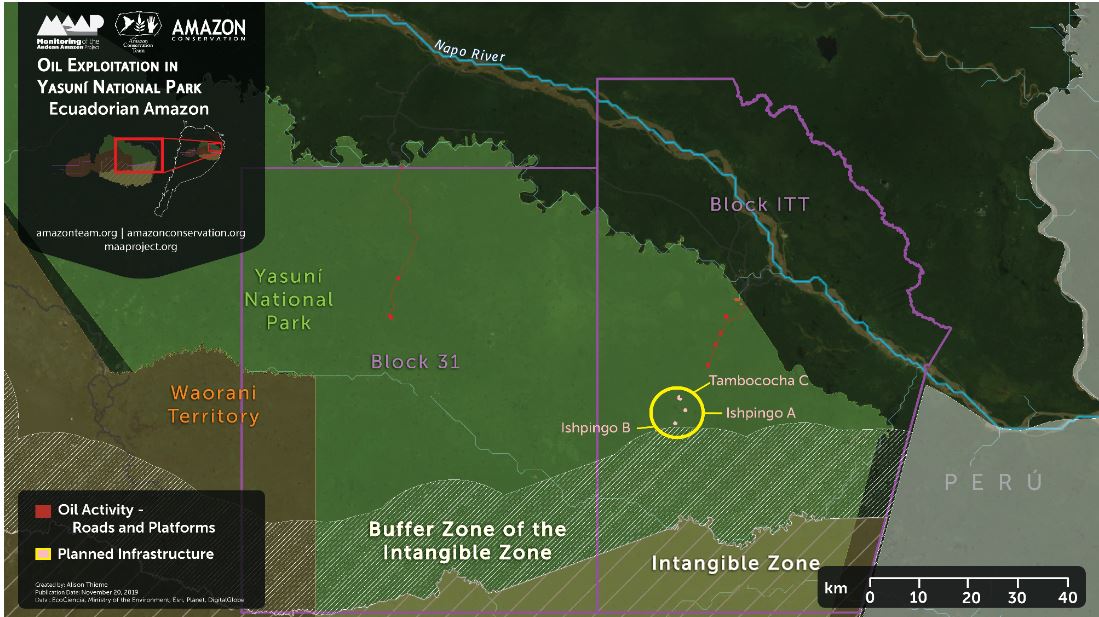
There are plans for at least 3 more drilling platforms deeper into Yasuni National Park (see yellow circle in map below). These platforms would bring oil activity close to the buffer zone of an area known as the Zona Intangible, or Untouchable Zone.

The government established the Zona Intangible in 2007 as an area where extractive activities, including oil, are prohibited to protect the territory of the Waorani relatives in voluntary isolation (Tagaeri and Taromenane).

Planned oil platforms (yellow circle) near the buffer zone of the Zona Intangible. Click to enlarge.

*Notes

Edge effects are the impacts that extend into the surrounding forest from the edge of deforestation. These impacts include changes in forest structure and microclimate, higher tree mortality, and increased susceptibility to fire. Based on Broadbent et al (2008), we incorporated an edge effect of 100 meters, which represents the median distance of edge effects recorded in 62 scientific studies. This is a conservative estimate given that an edge effect of 300-2000 meters could be also be justified according to the data.

In MAAP #82, we documented the oil-related deforestation of more than 400 hectares (990 acres) throughout all of Yasuni National Park.

Referenes

Bass M, Finer M, Jenkins C et al (2010) Global Conservation Significance of Ecuador’s Yasuní National Park. PLOS ONE. Link: https://journals.plos.org/plosone/article?id=10.1371/journal.pone.0008767

Finer M et al (2009) Ecuador’s Yasuní Biosphere Reserve: a brief modern history and conservation challenges. ERL. Link: https://iopscience.iop.org/article/10.1088/1748-9326/4/3/034005/fulltext/

Broadbent EB, Asner GP et al (2008) Forest fragmentation and edge effects from deforestation
and selective logging in the Brazilian Amazon. Bio Cons 141:1745–1757.

Acknowledgements

We thank A. Puyol (EcoCiencia), M. Bayon (Colectivo de Geografía Crítica del Ecuador), E. Martínez,  and G. Palacios for helpful comments to earlier versions of this report.

This work was supported by the following major funders: Norwegian Agency for Development Cooperation (NORAD), MacArthur Foundation, International Conservation Fund of Canada (ICFC), Metabolic Studio, and Global Forest Watch Small Grants Fund (WRI).

Citation

Finer M, Thieme A, Hettler B (2019) Oil Drilling Pushes Deeper into Yasuni National Park (Ecuador). MAAP: 114.
MAAP #113: Satellites Reveal what Fueled Brazilian Amazon Fires

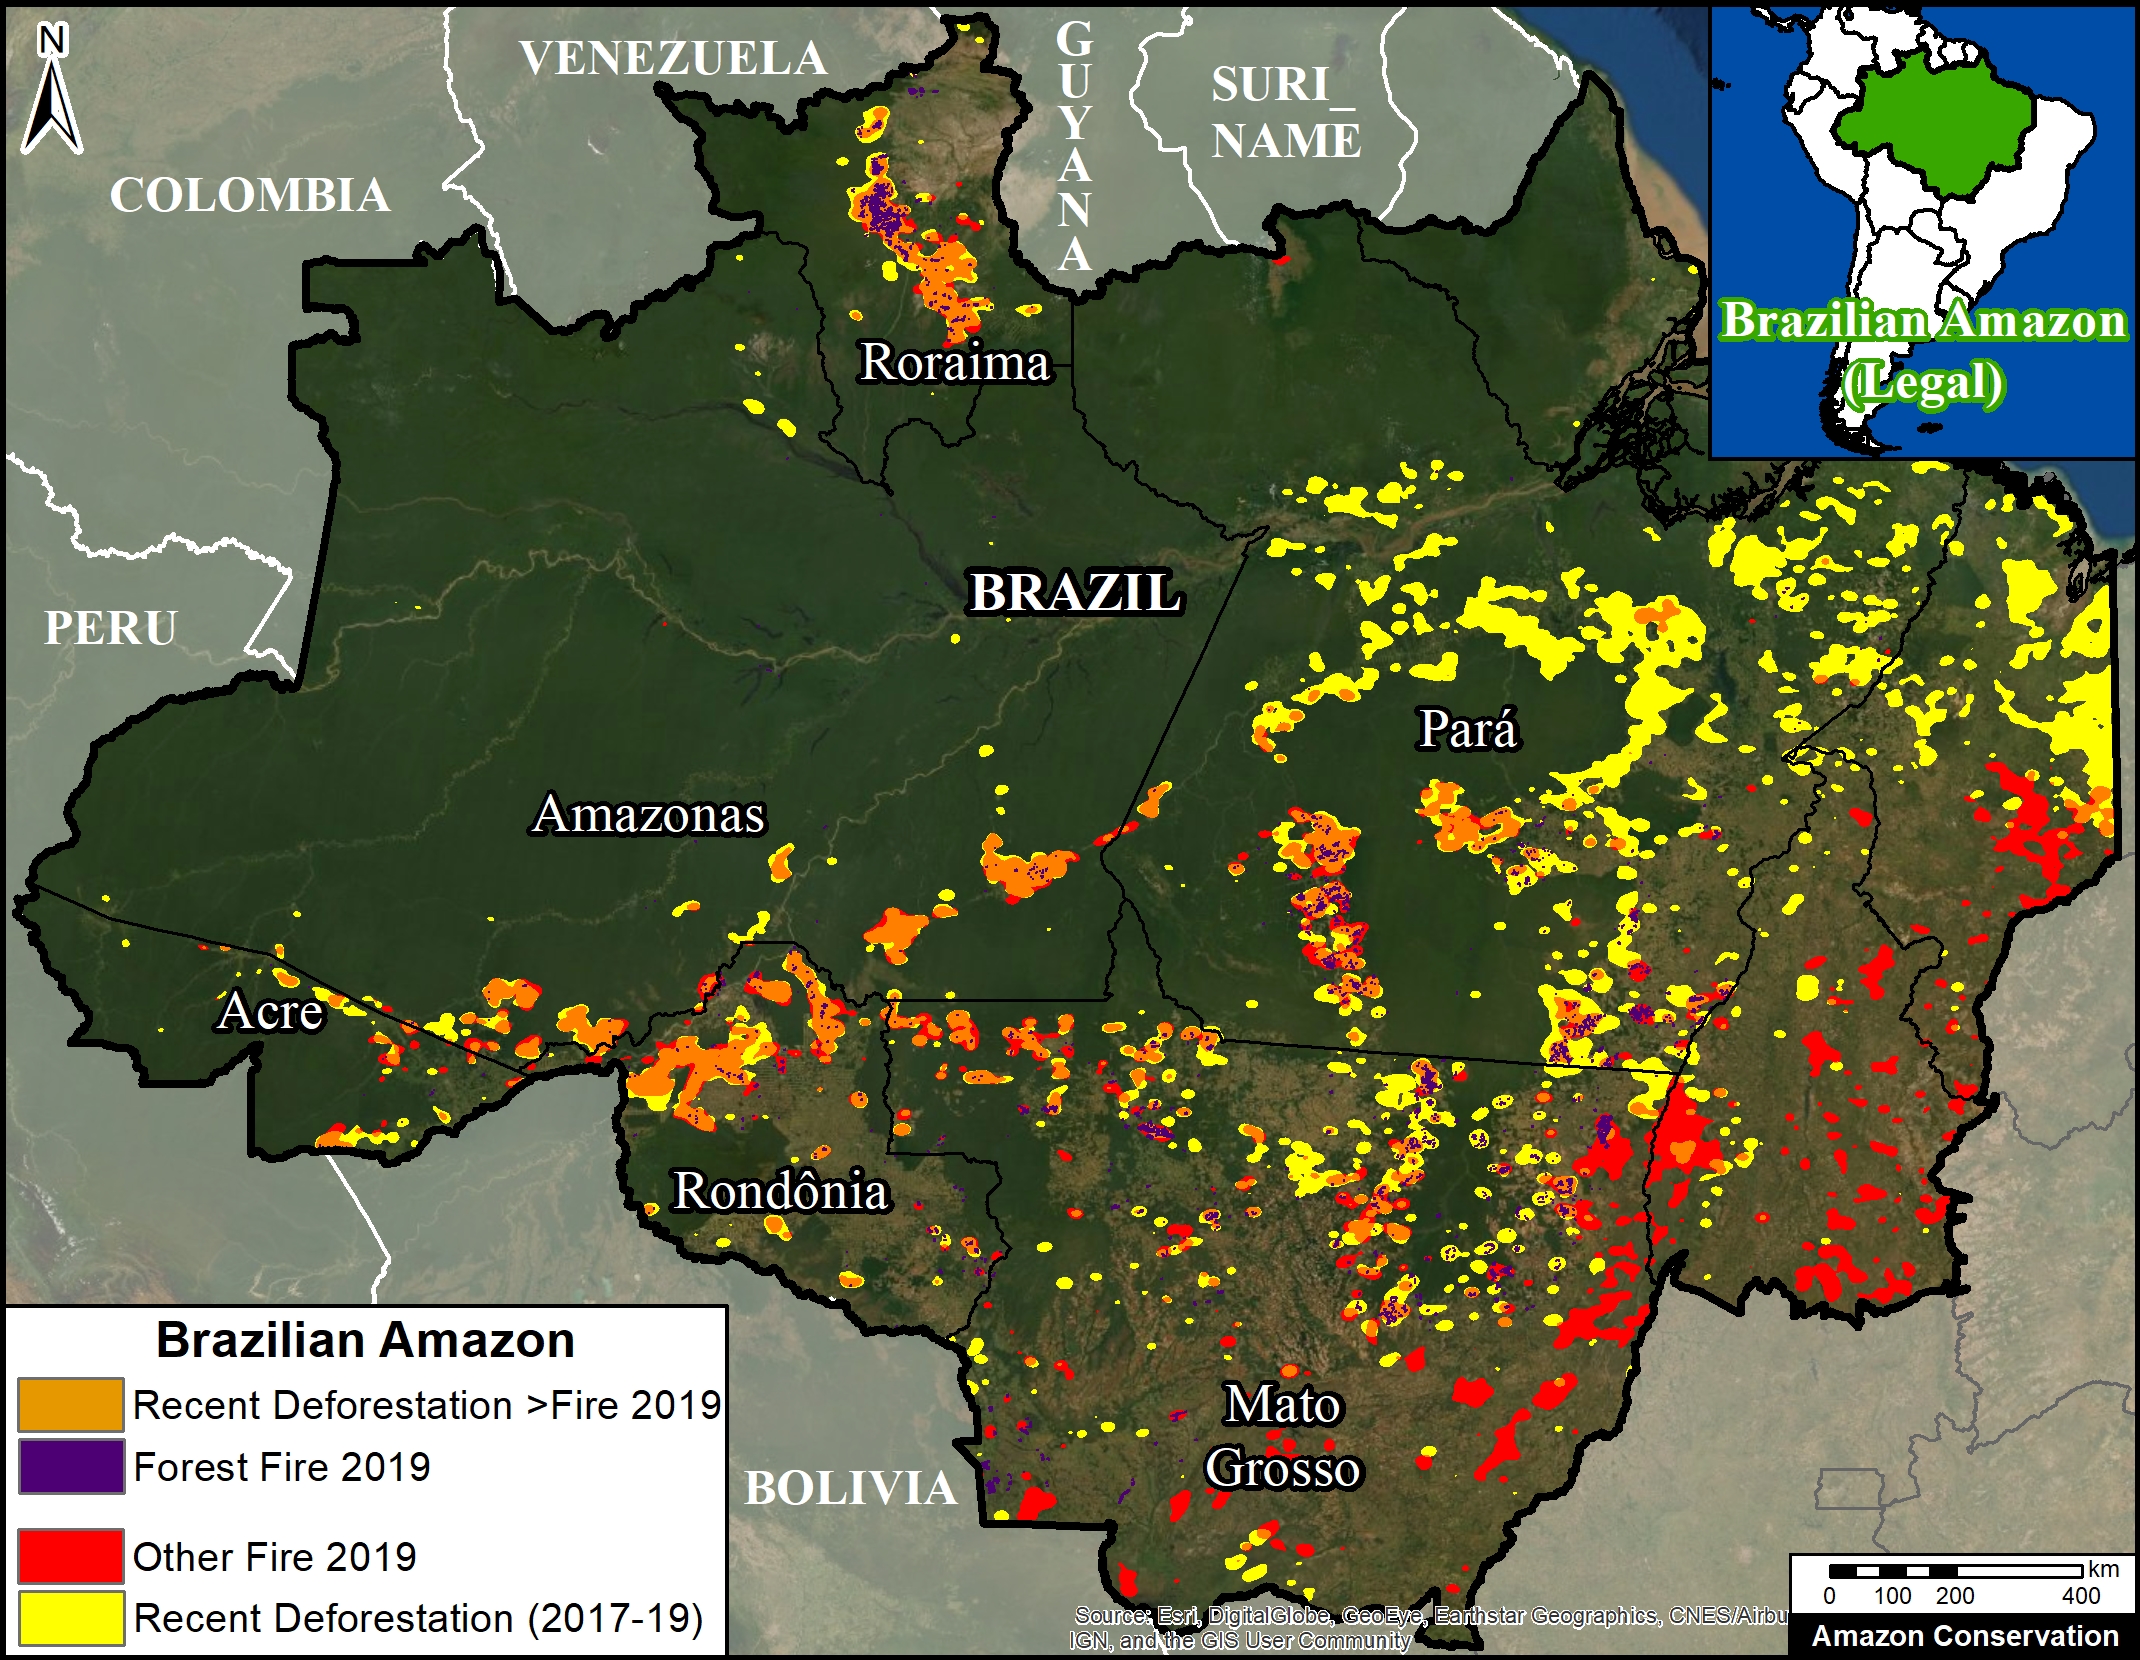
Base Map. Brazilian Amazon 2019. Data: UMD/GLAD, NASA (MODIS), DETER, Hansen/UMD/Google/USGS/NASA.
As part of our ongoing coverage, we present two key new findings about the Brazilian Amazon fires that captured the world’s attention in August (see our novel satellite-based methodology below).

First, we found that many of the fires, covering over 450,000 hectares, burned areas recently deforested since 2017 (orange in Base Map). That is a massive area equivalent to over a million acres (or 830,000 American football fields), mostly in the states Amazonas, Rondônia, and Pará.

Importantly, 65% (298,000 hectares) of this area was both deforested and burned this year, 2019.

Second, we found 160,400 hectares of primary forest burned in 2019 (purple in Base Map).* Most of these areas surround deforested lands in the states of Mato Grosso and Pará, and were likely pasture or agricultural fires that escaped into the forest.

As far as we know, these are the first precise estimates based on detailed analysis of satellite imagery. Other estimates based solely on fire alerts tend to greatly overestimate burned areas due to their large spatial resolution.

Below we present a series of satellite time-lapse videos showing examples of the different types of fires we documented.

Policy Implications

The policy implications of these findings are critically important: national and international focus needs to be on minimizing new deforestation, in addition to fire prevention and management.

That is, we need to recognize that many of the fires are in fact a lagging indicator of previous deforestation, thus to minimize fires we need to minimize deforestation.

For example, one of the leading deforestation drivers in the Brazilian Amazon is cattle ranching (1, 2, 3). What measures can be taken to prevent the further expansion of the ranching frontier?

Satellite Time-lapse Videos

Deforestation Followed by Fire

Video A shows the deforestation of 1,760 hectares (4,350 acres) in Mato Grosso state in 2019 (May to July), followed by fires in August. Planet link.

Video B shows the deforestation of 650 hectares (1,600 acres) in Rondônia state in 2019 (April to July), followed by fire in August. Planet link.

Deforestation Caused by Fire

Videos C-D show 2019 fires burning primary or secondary forest surrounding recently or previously cleared areas.

*Notes

In addition to the finding of 160,400 hectares of primary forest burned in 2019, we also found: 25,800 hectares of secondary forest burned in 2019;
35,640 hectares of primary forest burned in the northern state of Roraima in March 2019 (plus an additional 16,500 hectares of secondary forest.

Methodology

Deforestation Fires

We created two “hotspots” layers, one for deforestation and the other for fires, by conducting a kernel density analysis. This type of analysis calculates the magnitude per unit area of a particular phenomenon, in this case forest loss alerts (proxy for deforestation) and temperature anomaly alerts (proxy for fires)

Specifically, we used the following data three sets:

2019 GLAD alert forest loss data (30 meter resolution) from the University of Maryland and available on Global Forest Watch.

2017 and 2018 forest loss data (30 meter resolution) from the University of Maryland and available on Global Forest Watch (4).

NASA’s Fire Information for Resource Management System (FIRMS) MODIS-based fire alert data (1 km resolution).

We conducted the analysis using the Kernel Density tool from Spatial Analyst Tool Box of ArcGIS, using the following parameters:

Search Radius: 15000 layer units (meters)
Kernel Density Function: Quartic kernel function
Cell Size in the map: 200 x 200 meters (4 hectares)
Everything else was left to the default setting.

For the Base Map, we used the following concentration percentages: Medium: 10%-25%; High: 26%-50%; Very High: >50%. We then combined all three categories into one color (yellow for deforestation and red for fire). Orange indicates areas where both layers overlap. As background layer, we also included pre-2019 deforestation data from Brazil’s PRODES system.

We prioritized the orange overalp areas for further analysis. For the major orange areas in Rondônia, Amazonas, Mato Grosso, Acre, and Pará, we conducted a visual analysis using the satellite company Planet’s online portal, which includes an extensive archive of Planet, RapidEye, Sentinel-2, and Landsat data. Using the archive, we identified areas that we visually confirmed a) were deforested in 2017-19 and b) were later burned in 2019 between July and September. We then used the area measure tool to estimate the size of these areas, which ranged from large plantations ( ~1,000 hectares) to many smaller areas scattered across the focal landscape.

Forest Fires:

To estimate forests burned in 2019 we combined analysis of several datasets. First, we started with 30 meter resolution ‘burn scar’ data produced by INPE (National Institute for Space Research) DETER alerts, updated through October 2019. In order to avoid overlapping areas, we eliminated alerts previously reported from 2016 to 2018, and alerts from other land use categories (selective logging, deforestation, degradation and mining, and other). Second, we eliminated previously reported 2001-18 forest loss from University of Maryland and INPE (PRODES). Third, to distinguish burning of primary and secondary forest, we incorporated primary forest data from the University of Maryland (5).

References

  1. Krauss C, Yaffe-Bellany D, Simões M (2019) Why Amazon Fires Keep Raging 10 Years After a Deal to End Them. New York Times. https://www.nytimes.com/2019/10/10/world/americas/amazon-fires-brazil-cattle.html
  2. Kelly M, Cahlan S (2019) The Brazilian Amazon is still burning. Who is responsible? Washington Post. https://www.washingtonpost.com/politics/2019/10/07/brazilian-amazon-is-still-burning-who-is-responsible/#click=https://t.co/q2XkSQWQ77
  3. Al Jazeera (2019) See How Beef Is Destroying The Amazon. https://www.youtube.com/watch?v=9o2M_KL8X6g&feature=youtu.be
  4. Hansen, M. C., P. V. Potapov, R. Moore, M. Hancher, S. A. Turubanova, A. Tyukavina, D. Thau, S. V. Stehman, S. J. Goetz, T. R. Loveland, A. Kommareddy, A. Egorov, L. Chini, C. O. Justice, and J. R. G. Townshend. 2013. “High-Resolution Global Maps of 21st-Century Forest Cover Change.” Science 342 (15 November): 850–53.
  5. Turubanova S., Potapov P., Tyukavina, A., and Hansen M. (2018) Ongoing primary forest loss in Brazil, Democratic Republic of the Congo, and Indonesia. Environmental Research Letters https://doi.org/10.1088/1748-9326/aacd1c 

Acknowledgements

This work was supported by the following major funders: MacArthur Foundation, International Conservation Fund of Canada (ICFC), Norwegian Agency for Development Cooperation (NORAD), Metabolic Studio, and Global Forest Watch Small Grants Fund (WRI).

Citation

Finer M, Mamani N (2019) Satellites Reveal what Fueled Brazilian Amazon Fires. MAAP: 113.

MAAP #112: Mennonite Colonies – New Deforestation Driver in the Amazon

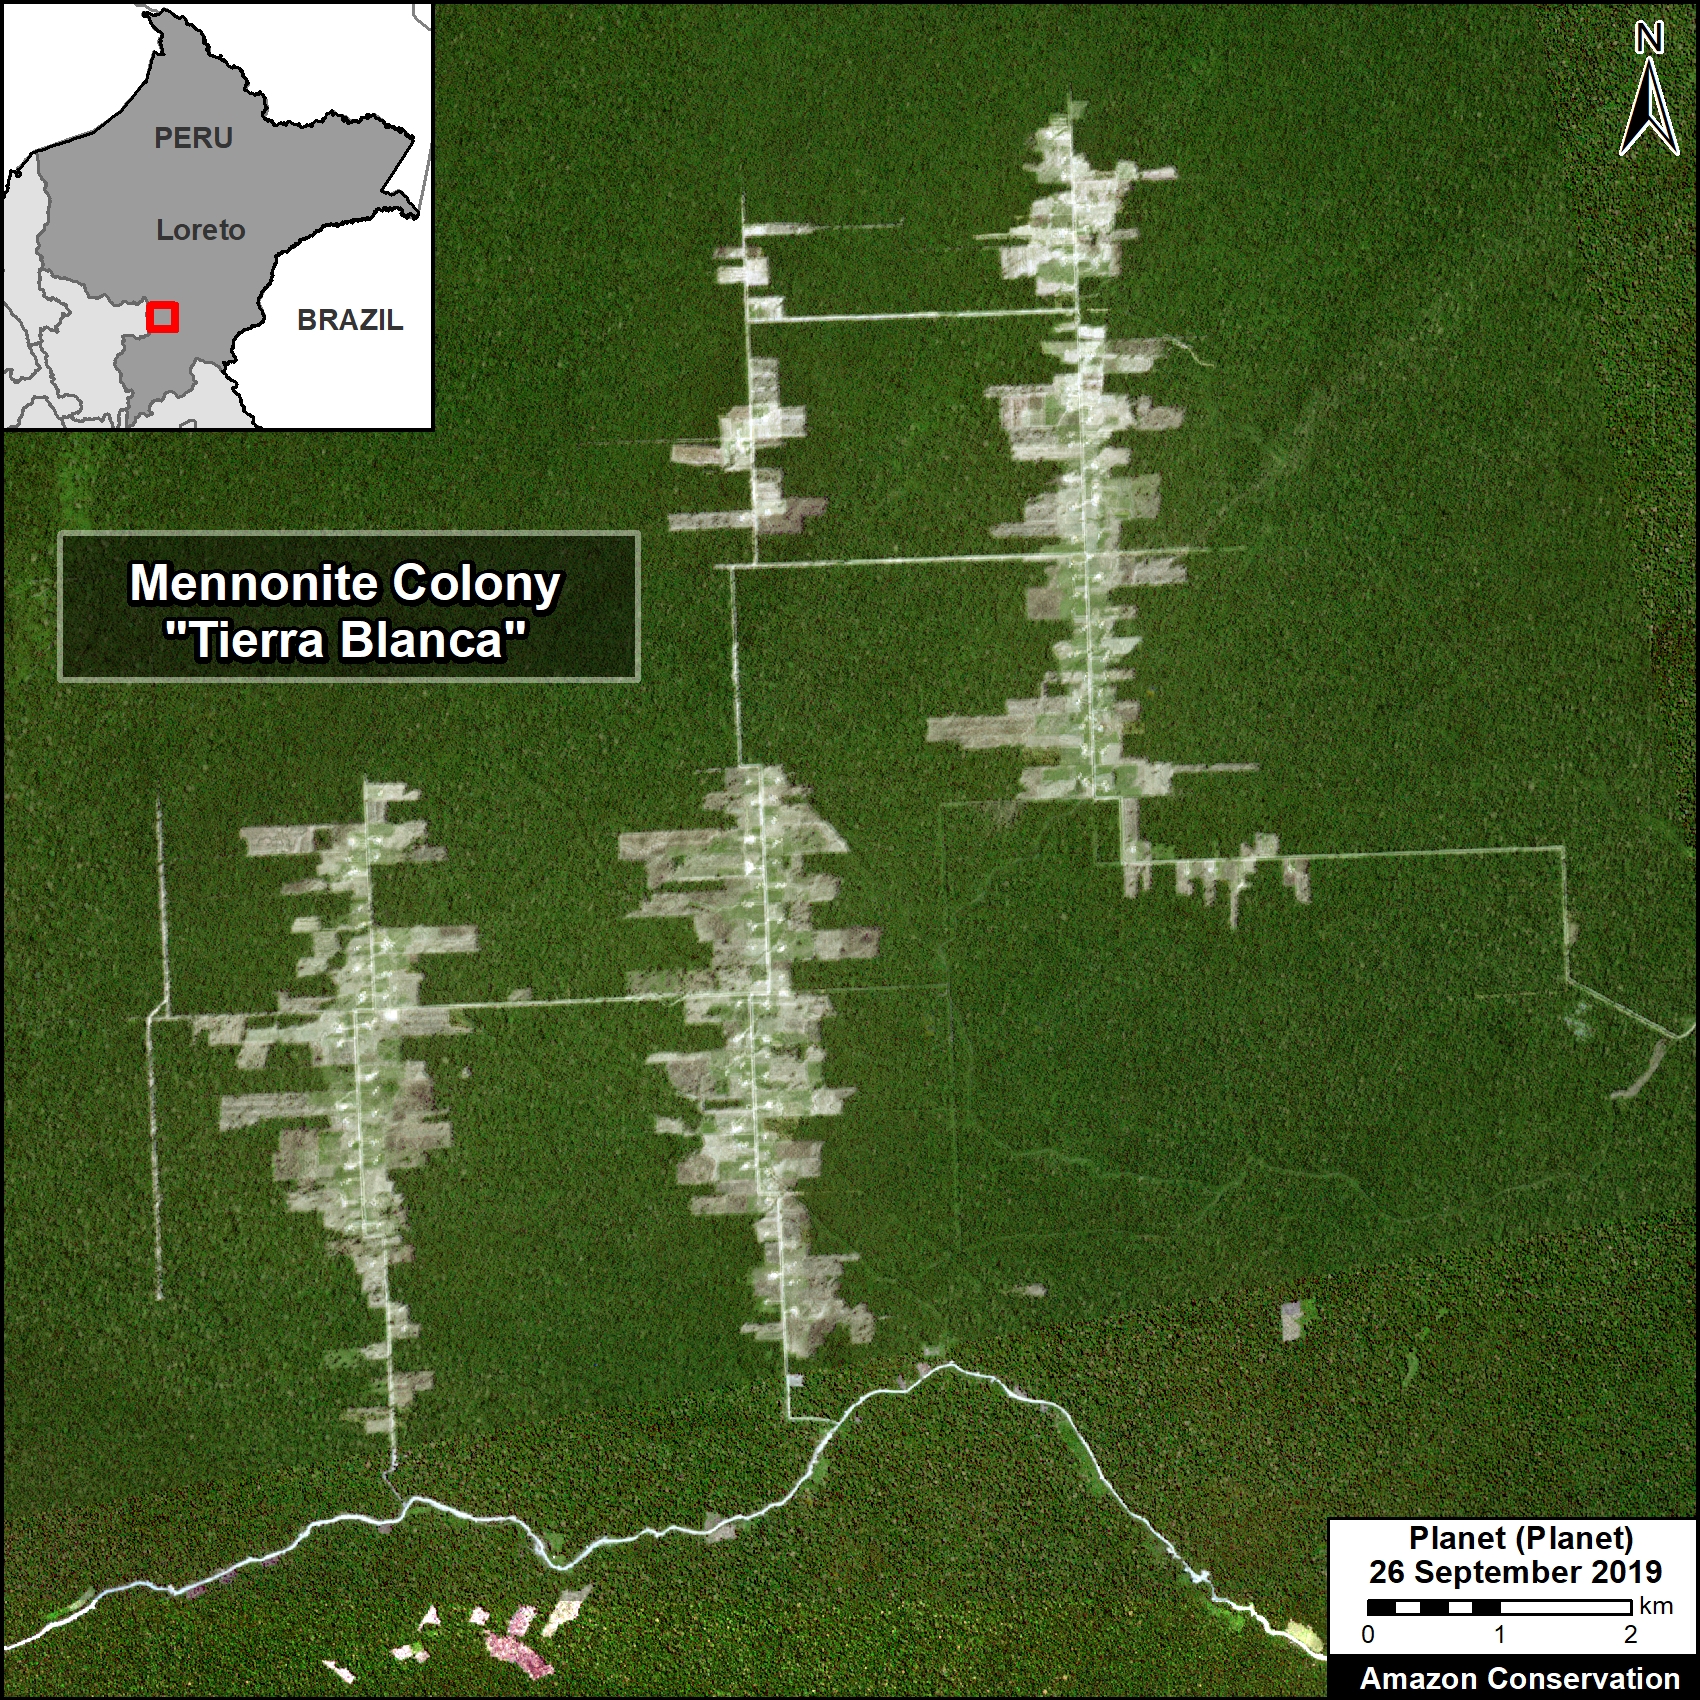
Time-lapse deforestation in the “Tierra Blanca” Mennonite colony in Loreto, Peru. Data: Planet.

The Mennonites, a religious (Christian) group often dedicated to organized agriculture, are increasingly inhabiting the western Amazon (Peru and Bolivia).

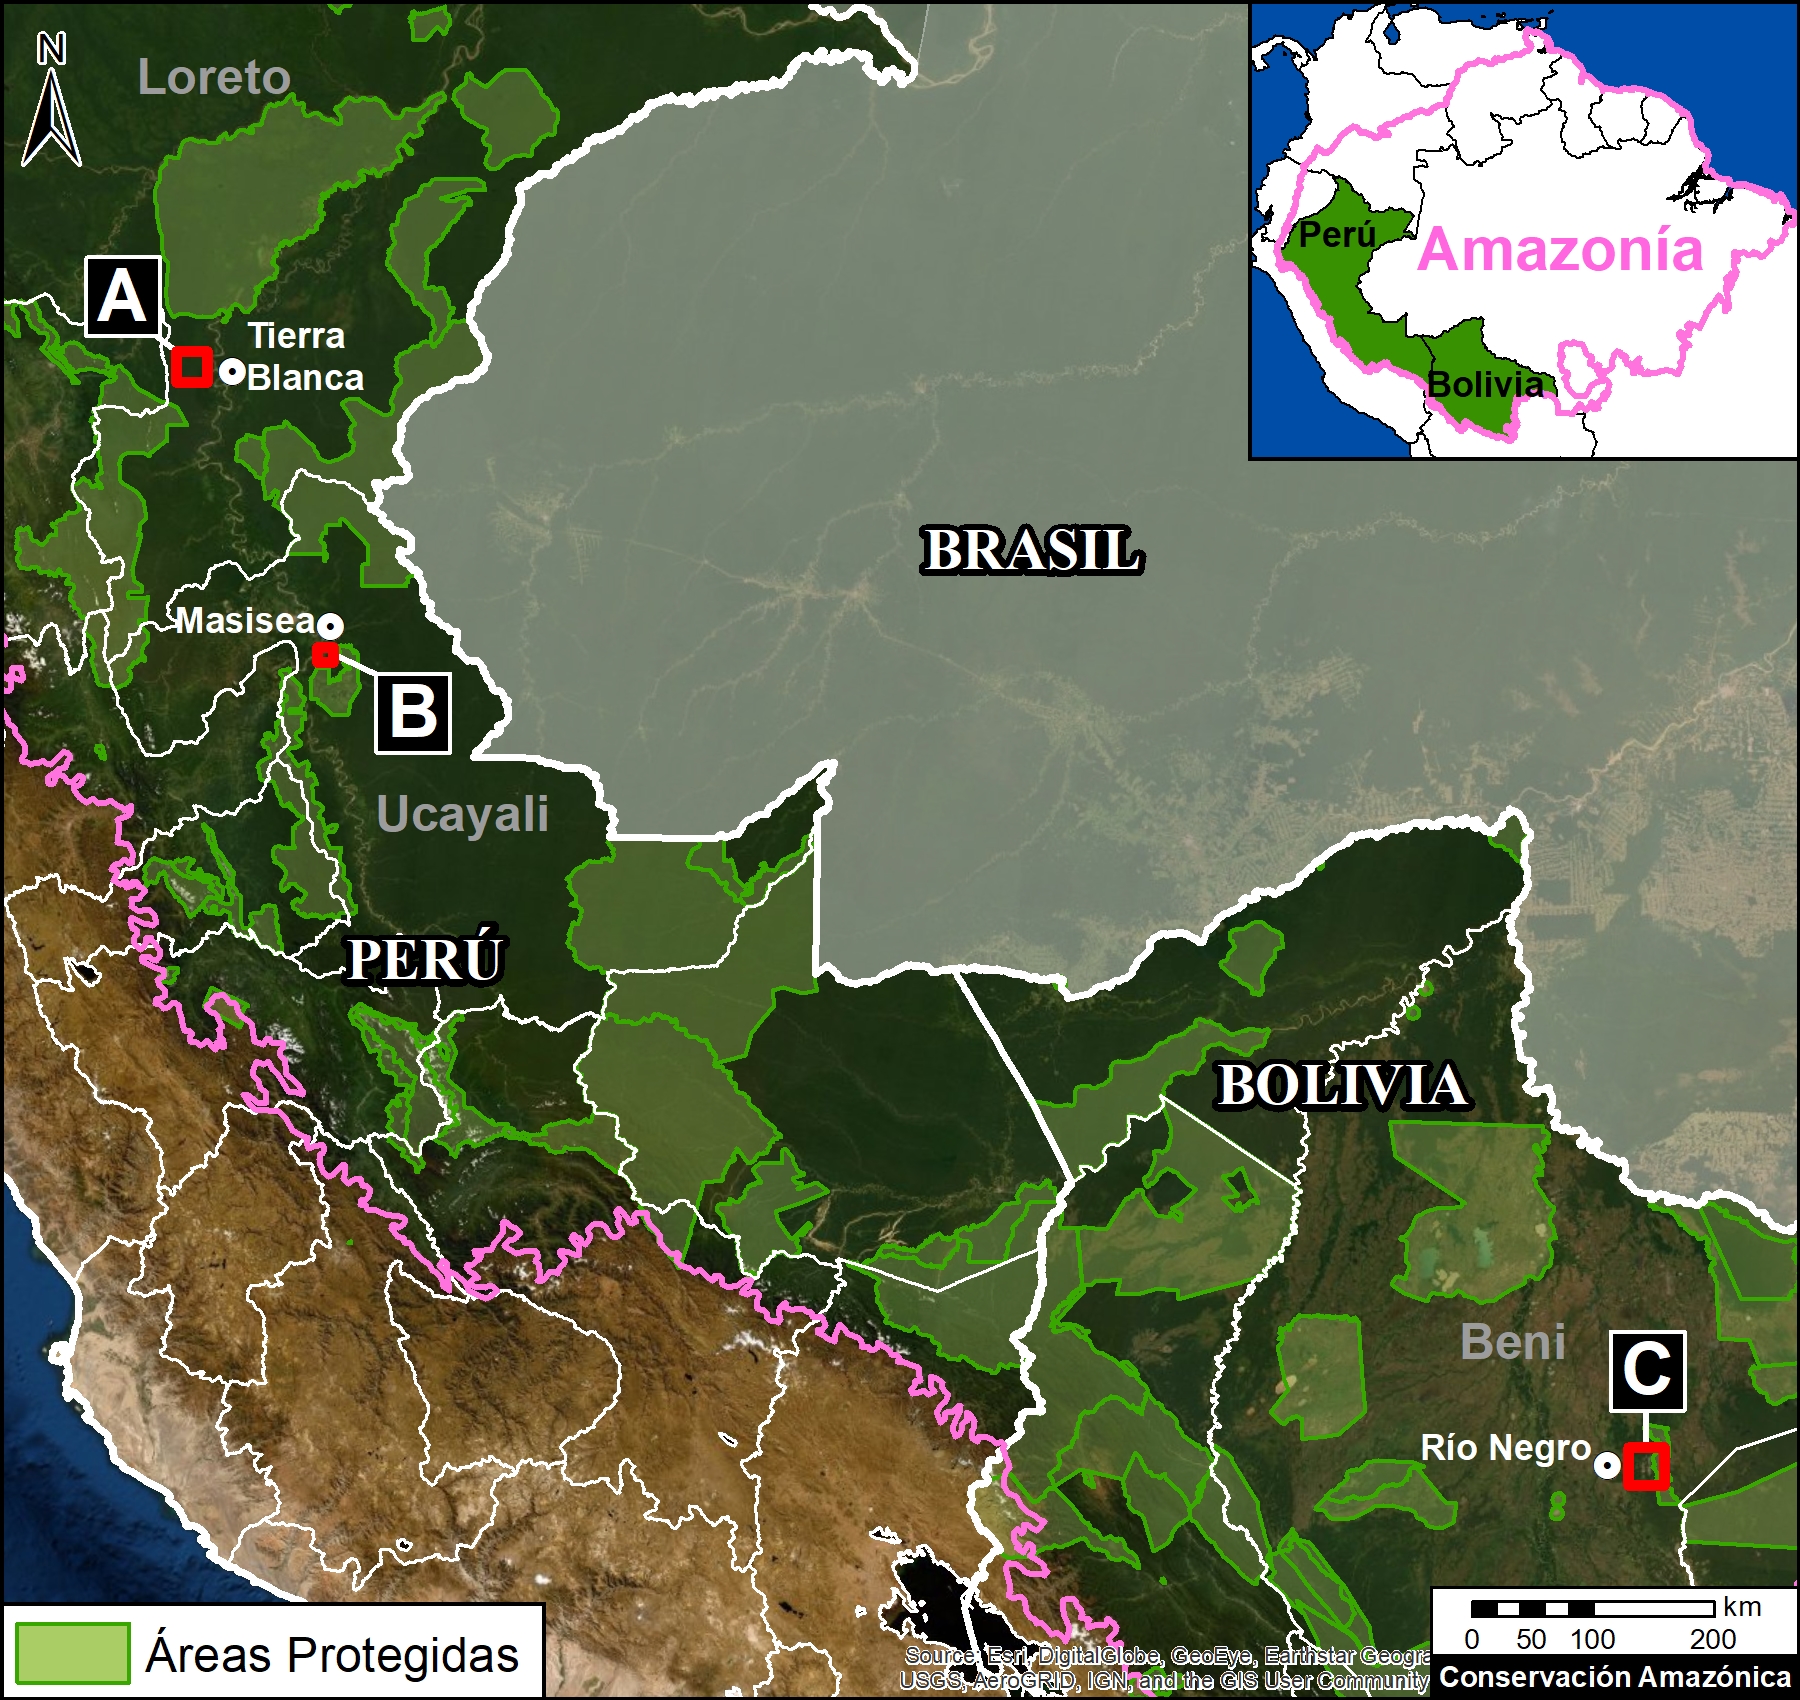
Here, we reveal the recent deforestation of 18,500 acres (7,500 hectares) in three Mennonite colonies (see the Base Map below).

The two colonies in Peru (Tierra Blanca and Masisea) are new, causing the deforestation of 6,200 acres since 2017 (including 3,500 acres in 2019) in the Loreto and Ucayali regions.

The colony in Bolivia (Río Negro) is older, but deforestation recently began to increase again, causing the deforestation of 12,350 acres since 2017 in the department of Beni.

Next, we present a series of satellite image videos showing the deforestation in the three Mennonite colonies.


Tierra Blanca (Perú)

The Mennonite colony referred to here as “Tierra Blanca” is located in southern Loreto region, near the town of Tierra Blanca.

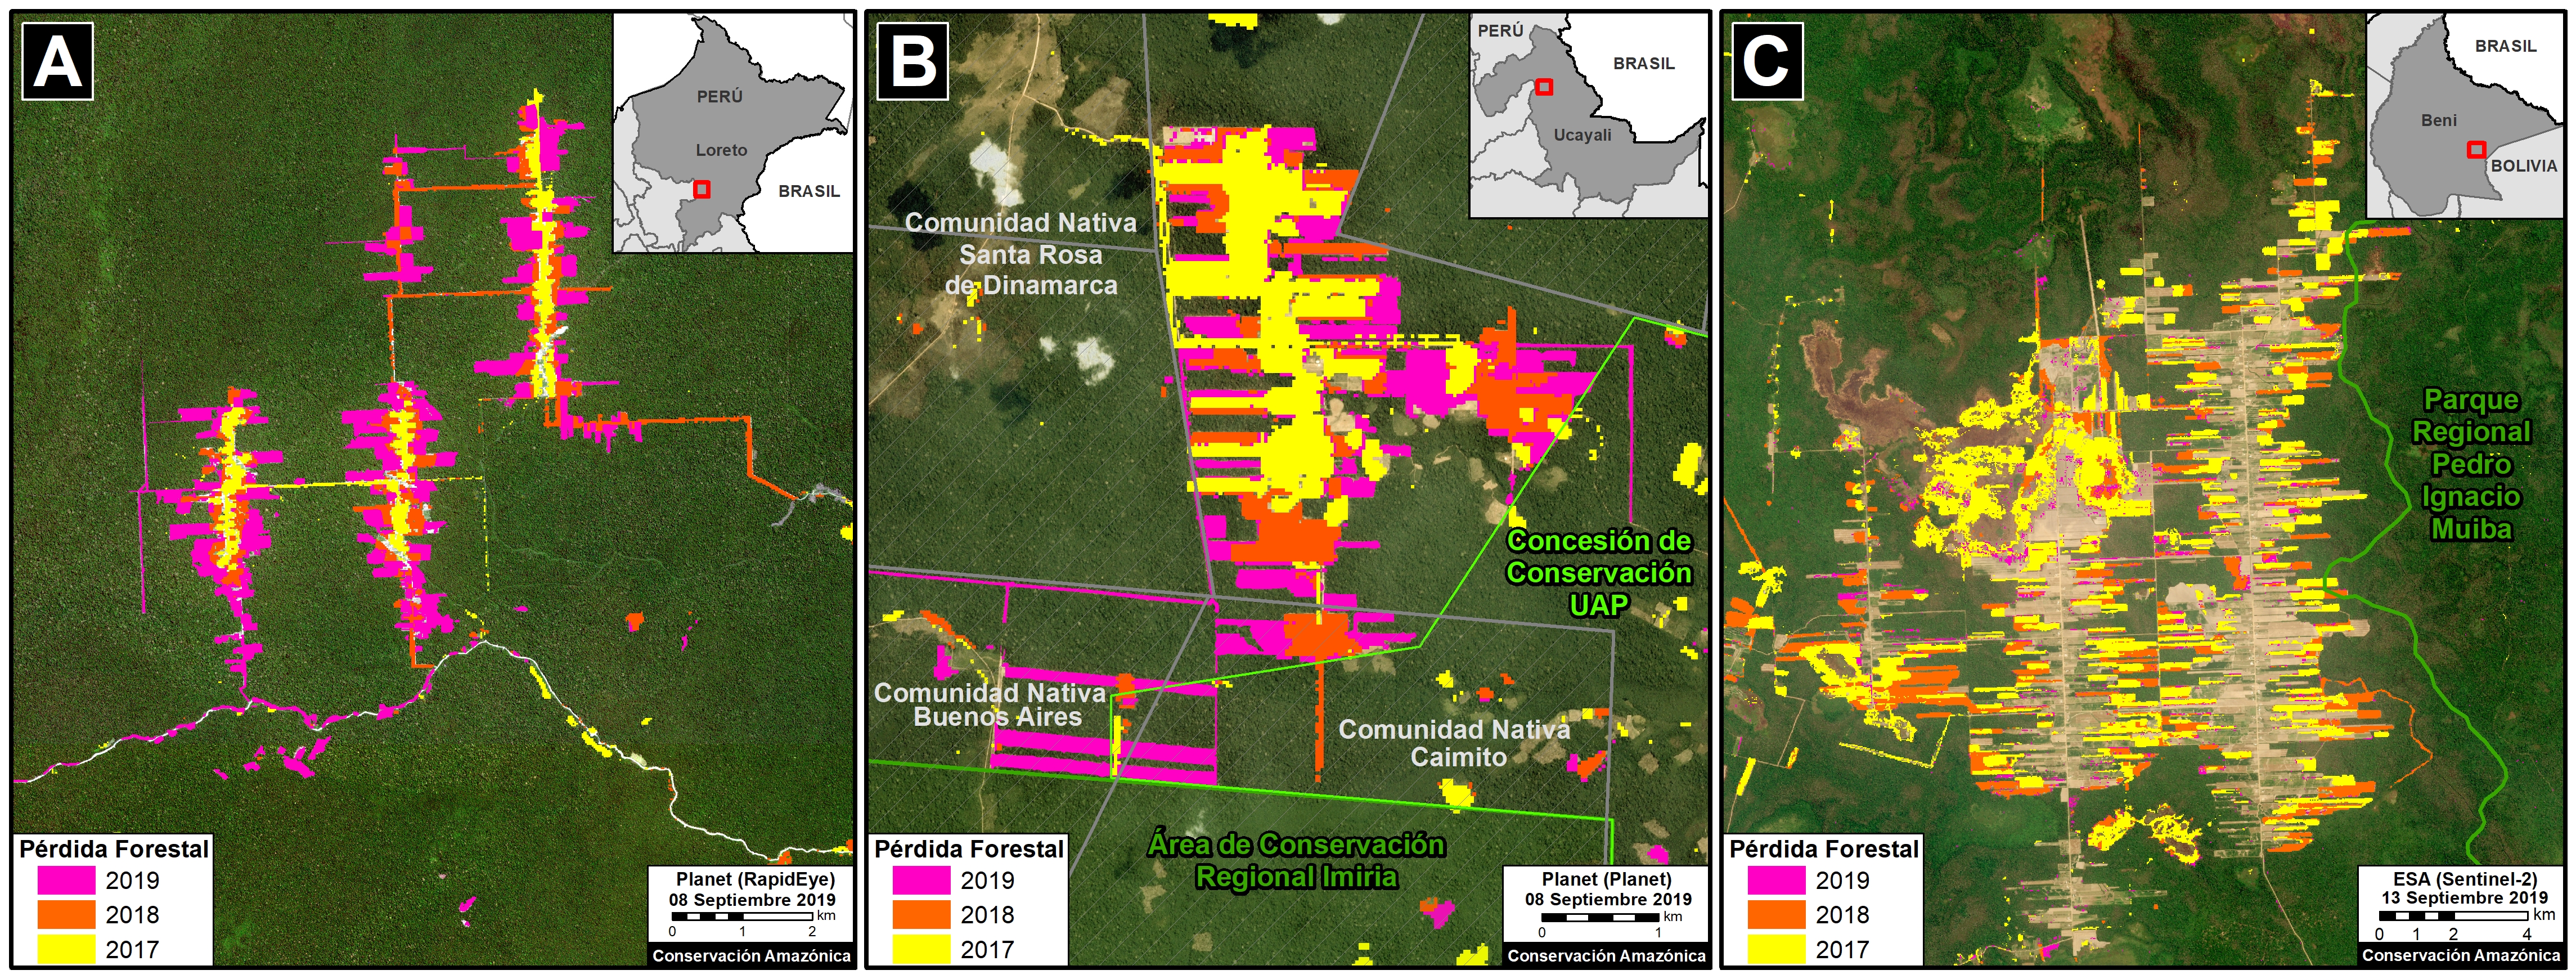
Video A shows the deforestation of 4,200 acres in the Tierra Blanca colony since 2017 (Planet link). We note that 2019 experienced the most deforestation (2,470 acres).


Masisea (Perú)

The Mennonite colony referred to here as “Masisea” is located in northern Ucayali region, near the town of Masisea.

Video B shows the deforestation of 2,000 acres in the Masisea colony since 2017 (Planet link). We note that 2019 experienced the most deforestation (865 acres).


In the detailed map in the Annex, note that the deforestation has reached the limit of a protected area, Imiría Regional Conservation Area. In addition, deforestation has occurred within two native communities (Buenos Aires and Caimito) and a Conservation Concession managed by a Peruvian university.

Río Negro (Bolivia)

The Mennonite colony Río Negro is located in southeastern Beni department. There are several Mennonite colonies in southern Bolivia, but this is one of the first deeper in the Amazon (Kopp, 2015).

Video C shows the deforestation of 12,350 acres in the Río Negro colony since 2017 (Planet link). Much of the deforestation occurred in 2017-18.


Annex 1: Base Map

Base Map of Mennonite colonies in Peru and Bolivia. Data: MAAP.

Annex 2: Detailed Maps

Deforestation in the three colonies A) Tierra Blanca, B) Masisea y C) río Negro. Data: UMD/GLAD, Hansen/UMD/Google/USGS/NASA

References

Kopp Ad (2015) Las colonias menonitas en Bolivia. Tierra. http://www.ftierra.org/index.php/publicacion/libro/147-las-colonias-menonitas-en-bolivia

Planet Team (2017). Planet Application Program Interface: In Space for Life on Earth. San Francisco, CA. https://api.planet.com

Acknowledgements

We thank H. Balbuena, A. Condor, and G. Palacios for helpful comments to earlier versions of this report.

This work was supported by the following major funders: Norwegian Agency for Development Cooperation (NORAD), MacArthur Foundation, International Conservation Fund of Canada (ICFC), Metabolic Studio, and Global Forest Watch Small Grants Fund (WRI).

Citation

Finer M, Mamani N (2019) Mennonite Colonies: New Deforestation Driver in the Amazon. MAAP: 112.


MAAP #111: Fires in the Bolivian Amazon – Using Google Earth Engine to Monitor

Recent fire in the dry forests of the the Bolivian Amazon. Data: Planet.

We begin a new series on how to harness the power of the cloud to improve real-time monitoring in the Amazon and beyond.

As the amount of data from satellite images has skyrocketed, so have the challenges of research teams to fully utilize this abundant and heavy (in  terms of terabytes) information.

In response, tech companies such as Google, Amazon, and Microsoft have been offering their powerful computer power, via the internet (cloud), to help process, analyze, display, and store big data.

Here, we feature Google Earth Engine, which is designed for the free processing of geospatial information (including satellite imagery) and publishing results on web applications.

In our first example, we show the power of Google Earth Engine to help with fire monitoring in the Bolivian Amazon. As noted in our previous reports, the 2019 fire season in Bolivia has been intense, with numerous major fires in the Amazonian dry forests and savannas.

There is currently an urgent need for real-time monitoring of active fires to assist ongoing fire management efforts at the national level. In response, we developed the application described below.


The App “Amazon Fires – Bolivia

Screen shot of the “Amazon Fires – Bolivia” app.

We developed the application “Amazon Fires – Bolivia that allows users to easily access and analyze an archive of recent satellite images of the Bolivian Amazon fires in near real-time.

Specifically, the user can compare aerosol data (from the satellite Sentinel-5P), with recent imagery from five different satellites (Terra, Aqua, Suomi, Sentinel-2, and Sentinel-1 radar).

We recommend viewing the aerosol data on the left panel and most recent imagery on the right panel.

Aeresol data (Ultraviolet Aerosol Index) does a strikingly good job of accurately and precisely highlighting the location of active fires because it is showing the actual emissions (pollutants) from the fires (as opposed to the commonly used fire alert data which detect general temperature anomalies, not actual fires). It is important to note that it can be calculated in the presence of clouds so that daily, global coverage is possible. This app represents one of the first major uses of the aerosol data from Sentinel-5P to detect fires in real-time.

Reds indicate the highest levels of aeresol (and likely the largest fires), followed by orange, yellow, green, light blue, purple, dark blue, and black.

Note that if you zoom out, the aerosol data also covers much of the Brazilian Amazon.

Currently, new images are automatically included in the app when they are added to the Google Earth Engine dataset (typically with a delay of one or two days), but during critical times we will manually upload new imagery daily.

Our hope is that relevant actors, including government and fire-fighting crews, can use this real-time information to better address the fires.

Link to the App “Amazon Fires – Bolivia”:
https://luciovilla.users.earthengine.app/view/monitoring-amazon-fires

Imagery Guide

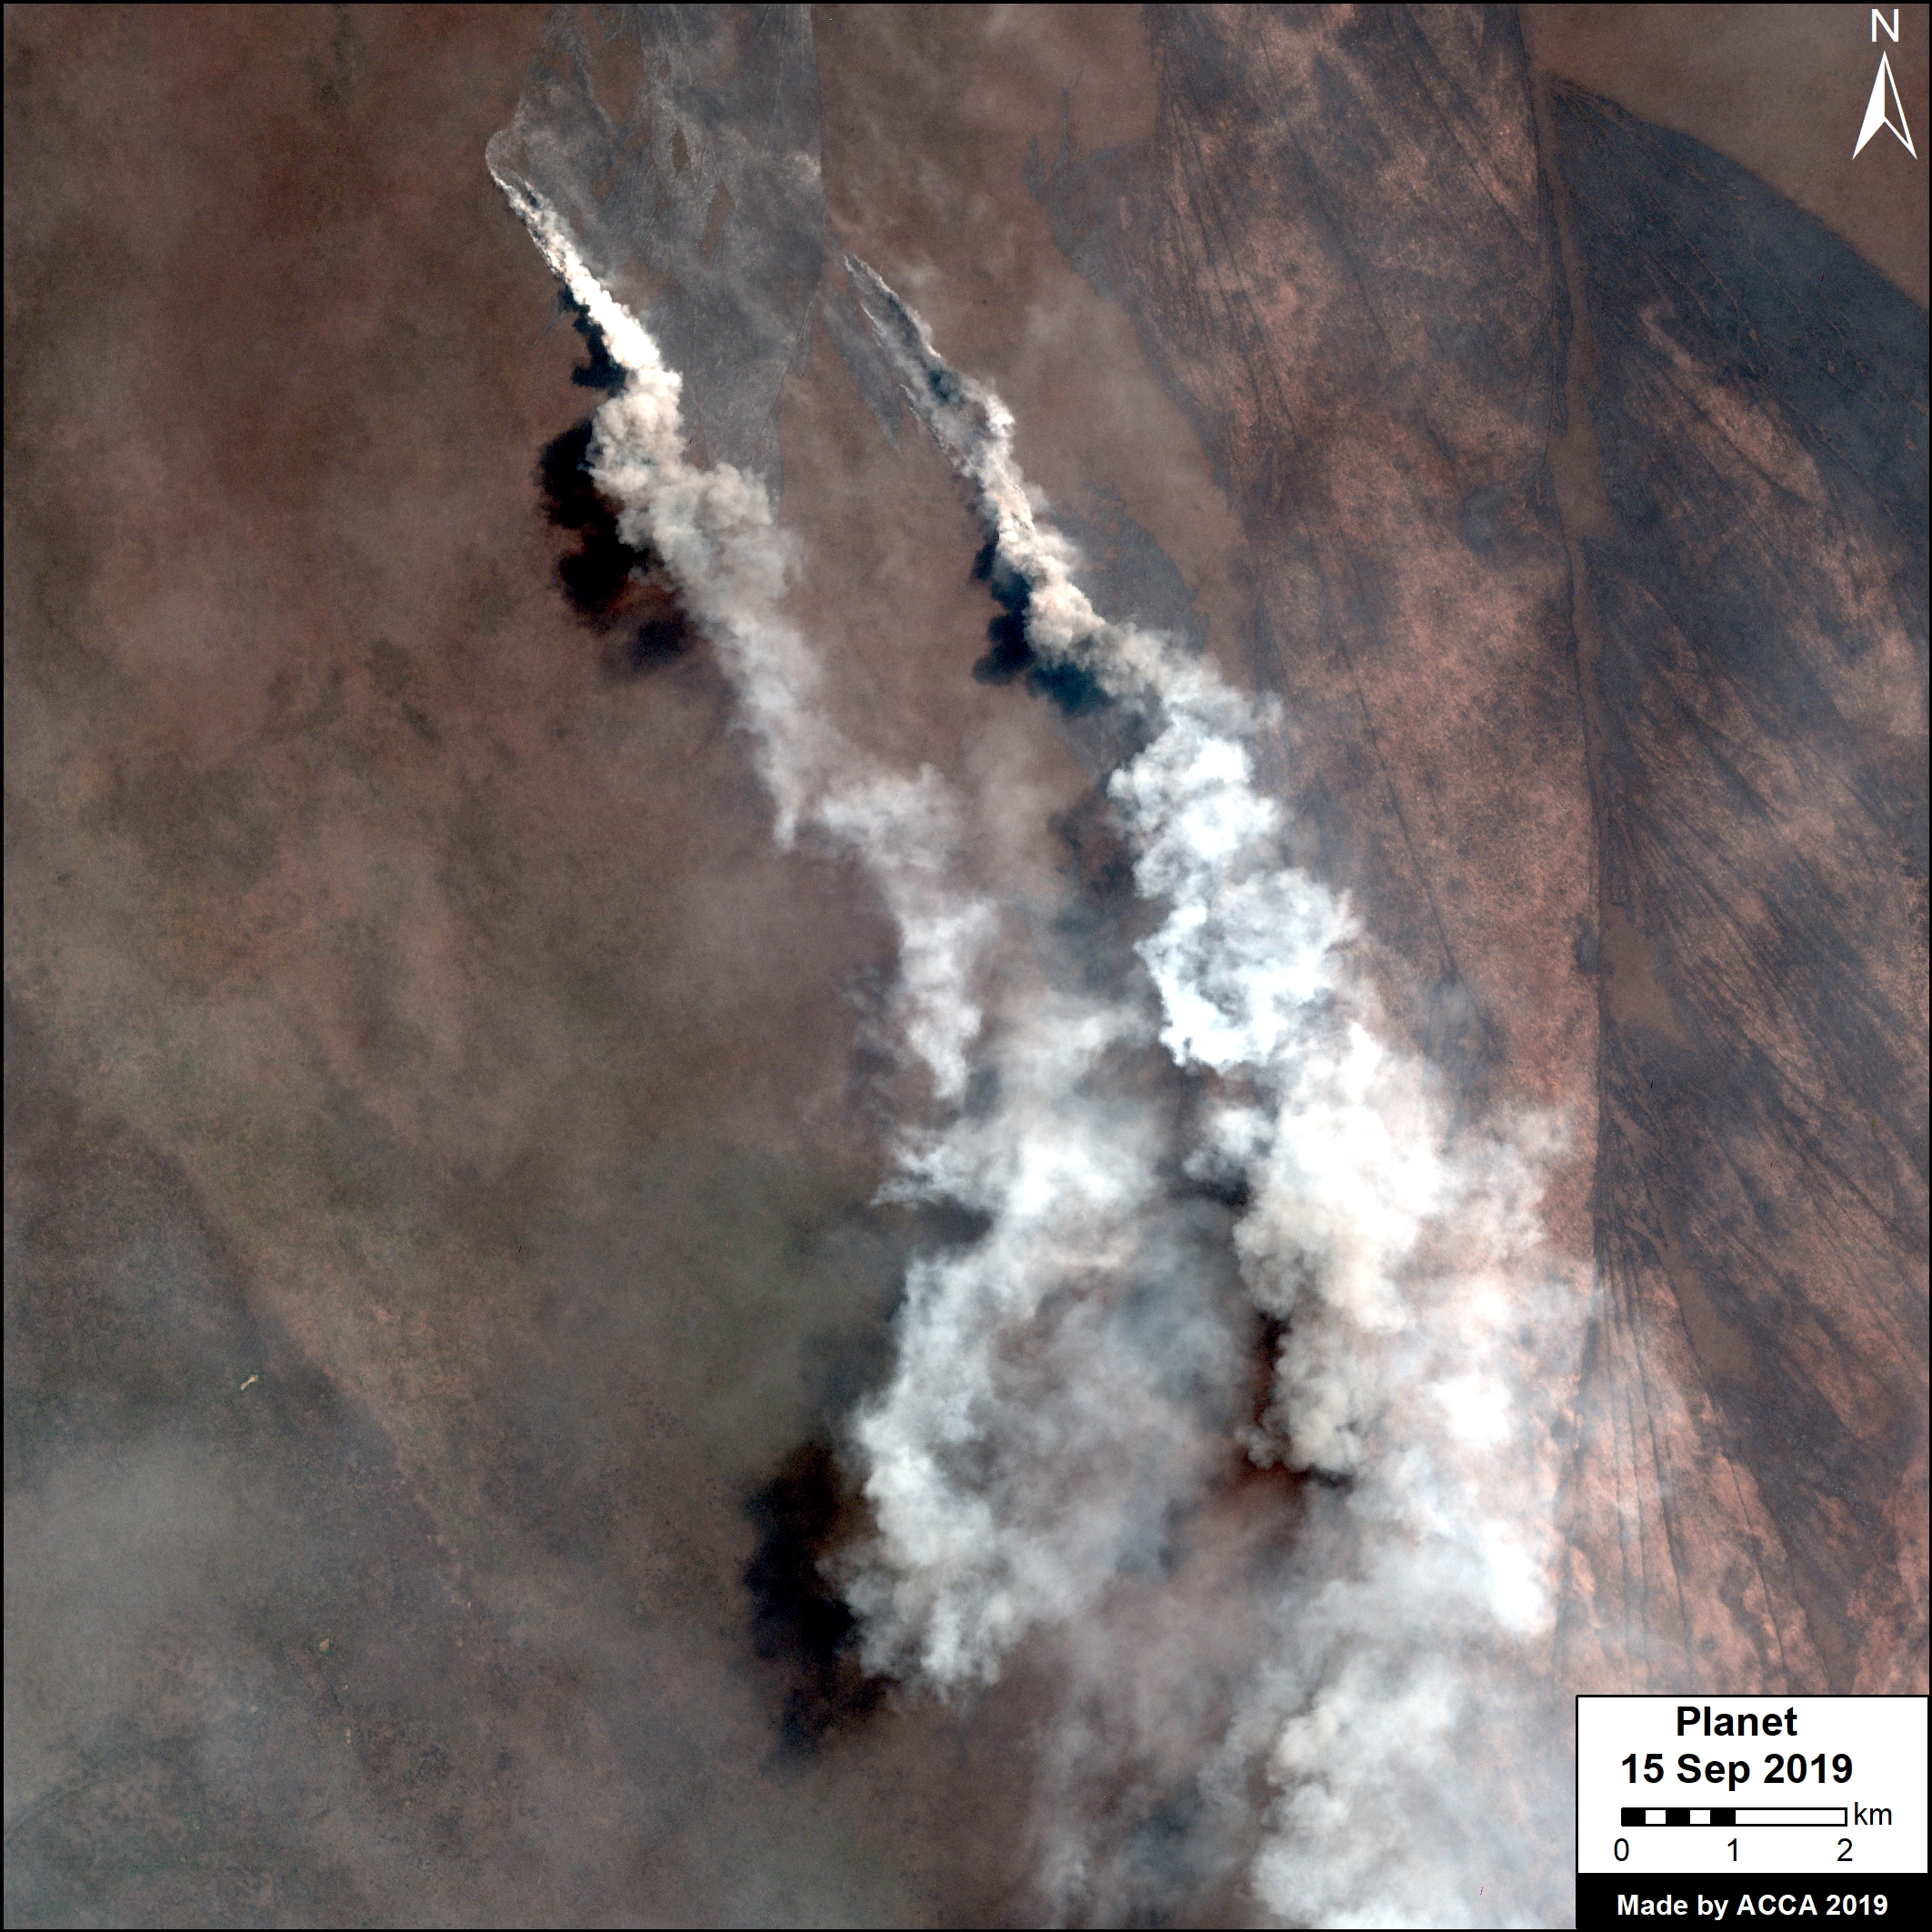
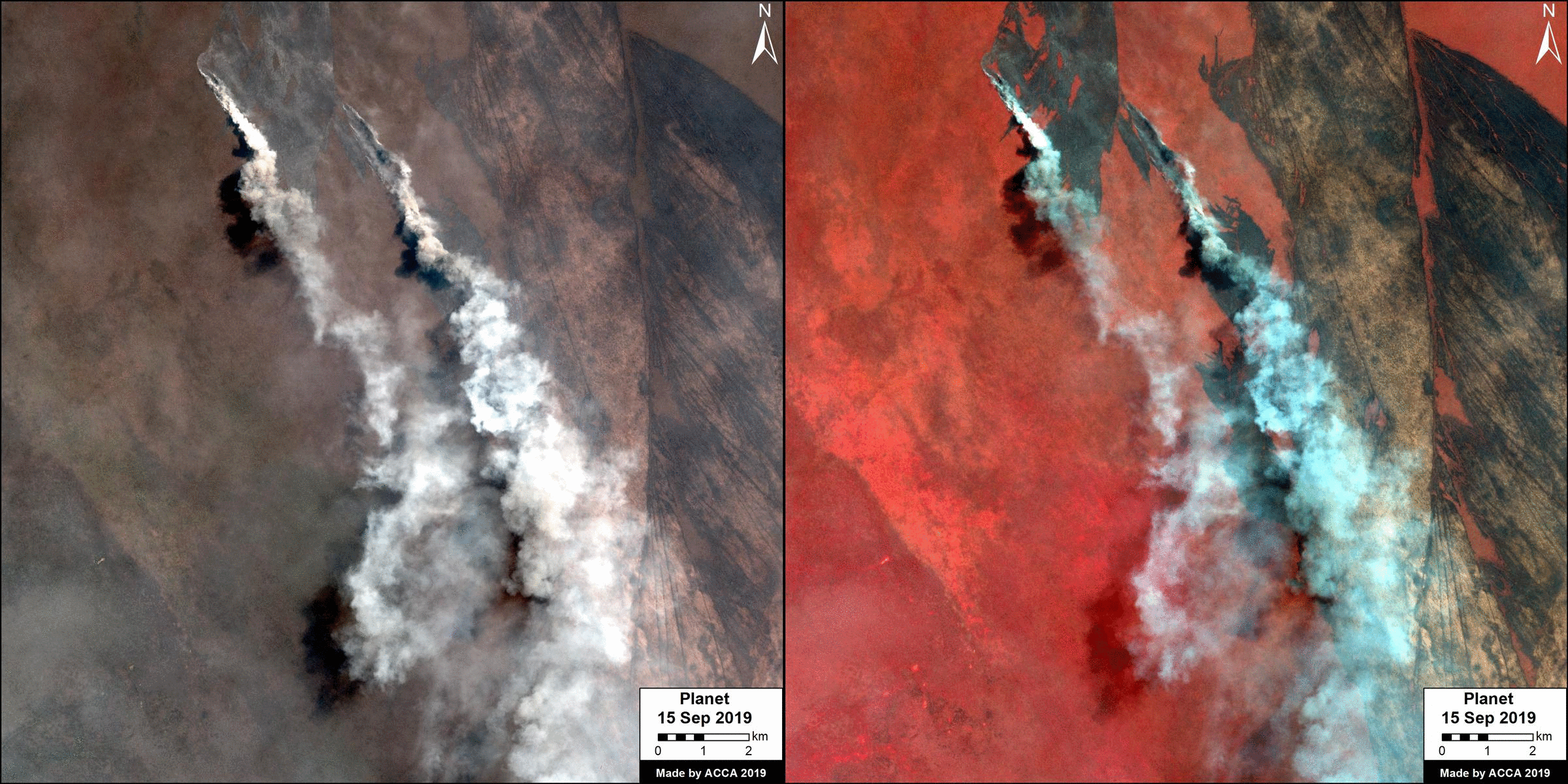
The app shows images in natural color. As a guide, below we show a series of natural color images in relation to “false color” infrared images, which better highlight burn scars (black) in relation to the vegetation (red).

Guide 1. Data: Planet.
Guide 2. Data: Planet.
Guide 3. Data: Planet.

Acknowledgements

We thank D. Larrea (ACEAA), M. Terán (ACEAA), C. de Ugarte (ACEAA), and A. Condor (ACCA) for helpful comments to earlier versions of this report.

The development of this application was made possible thanks to the support provided by the Google Earth Engine team, with the support of SilvaCarbon (technical advisory program that provides spaces for countries to learn about new tools) and the SERVIR Amazonia program.

This work was supported by the following major funders: MacArthur Foundation, International Conservation Fund of Canada (ICFC), Metabolic Studio, and Global Forest Watch Small Grants Fund (WRI).

Citation

Villa L, Finer M (2019) Fires in the Bolivian Amazon – Using Google Earth Engine to Monitor. MAAP: 111.

MAAP #110: Major Finding – Many Brazilian Amazon Fires follow 2019 Deforestation

2019 fire in the Brazilian Amazon (Rondônia) that followed 2019 deforestation. Data: Planet.

In MAAP #109 we reported a major finding critical to understanding this year’s fires in the Brazilian Amazon: many of the 2019 fires followed 2019 deforestation events.

Here, we present our more comprehensive estimate: 125,000 hectares (310,000 acres) deforested in 2019 and then later burned in 2019 (July-September). This is equivalent to 172,000 soccer fields.*

Thus, the issue is both deforestation AND fire; the fires are often a lagging indicator of recent agricultural deforestation.

This key finding flips the widely reported assumption that the fires are burning intact rainforests for crops and cattle.

Instead, we find it’s the other way around, the forests were cut and then burned, presumably to enrich the soils. It is “slash and burn” agriculture, not “burn and slash.”

The policy implications are important: national and international focus needs to be on minimizing new deforestation, in addition to fire prevention and management.

This breakthrough data is based on our analysis of an extensive satellite imagery archive, allowing us to visually confirm areas that were deforested in 2019 and later burned in 2019 (see Methodology).

Below we present a new series of 7 striking timelapse videos that vividly show examples of 2019 deforestation followed by fires (See Base Map below for exact zoom locations).

Timelapse Videos: 2019 Deforestation followed by Fires

Video 1 shows the deforestation of 845 hectares (2,090 acres) in Mato Grosso state in early 2019, followed by fires starting in July. Planet link.


Video 2 shows the deforestation of 910 hectares (2,250 acres) in Amazonas state in early 2019, followed by fires in August. Planet link.


Video 3 shows the deforestation of 650 hectares (1,600 acres) in Rondônia state in early 2019, followed by fire starting in X. Planet link.


Video 4 shows the deforestation of 1,760 hectares (4,350 acres) in Mato Grosso state in early 2019, followed by fires in August. Planet link.


Video 5 shows the deforestation of 350 hectares (865 acres) in Amazonas state in early 2019, followed by fires in August. Planet link.


Video 6 shows the deforestation of 4,275 hectares (10,550 acres) in Pará state in early 2019, followed by fires in August. Planet link.


Video 7 shows the large-scale deforestation of 1,450 hectares (3,600 acres) in Amazonas state between April and August, followed by fire in September. Note this is the same area shown as Zoom A in MAAP #109 for the scenario (Deforestation-No Fire) but it just now was burned. Planet link.

*Notes

It is important to emphasize that we documented this deforestation followed by fire in the moist Amazon rainforest areas of Amazonas (39,100 ha), Rondônia (21,100 ha), Pará (48,704), and Mato Grosso (16,420 ha) states.

In MAAP #109 we reported that another concerning source of many fires is the burning of savannah areas around the rainforest, for example in Mato Grosso.

We continue to monitor for the emergence of uncontained forest fires as the dry season continues.

Methodology

We prioritized areas highlighted in orange in the Base Map presented in MAAP #109. These orange areas indicate the overlap of 2019 forest loss alerts (GLAD alerts from the University of Maryland) and 2019 fire alerts (from NASA’s MODIS satellite sensor).

For the major orange areas in Rondônia, Amazonas, Mato Grosso, Acre, and Pará, we conducted a visual analysis using the satellite company Planet’s online portal, which includes an extensive archive of Planet, RapidEye, Sentinel-2, and Landsat data. Using the archive, we identified areas that we visually confirmed a) were deforested in 2019 and b) were later burned in 2019 between July and September. We then used the area measure tool to estimate the size of these areas, which ranged from large plantations ( ~1,000 hectares) to many smaller areas scattered across the focal landscape.

The data is updated  through mid September 2019.

The Base Map in the Annex indicates the location of the areas featured in the timelapse zooms.

Annex: Base Map

The numbers (1-7) correspond to the location of the areas in the videos above.

Base Map. 2019 deforestation and fire hotspots in the Brazilian Amazon. Data: UMD/GLAD, NASA (MODIS), PRODES

Coordinates:
Video 1. Mato Grosso (11.64° S, 54.77° W)
Video 2. Amazonas (9.07° S, 67.54° W)
Video 3. Rondônia (8.61° S, 63.01° W)
Video 4. Mato Grosso (9.91° S, 60.33° W)
Video 5. Amazonas (6.60° S, 60.10° W)
Video 6. Pará (5.87° S, 53.55° W)
Video 7. Amazonas (8.94° S, 65.91° W)

Acknowledgements

We thank T. Souto (ACA) and A. Folhadella (ACA) for helpful comments to earlier versions of this report.

This work was supported by the following major funders: MacArthur Foundation, International Conservation Fund of Canada (ICFC), Metabolic Studio, and Global Forest Watch Small Grants Fund (WRI).

Citation

Finer M, Mamani N (2019) MAAP #110: Major Finding – Many Brazilian Amazon Fires follow 2019 Deforestation. MAAP: 110.

MAAP #109: Fires and Deforestation in the Brazilian Amazon, 2019

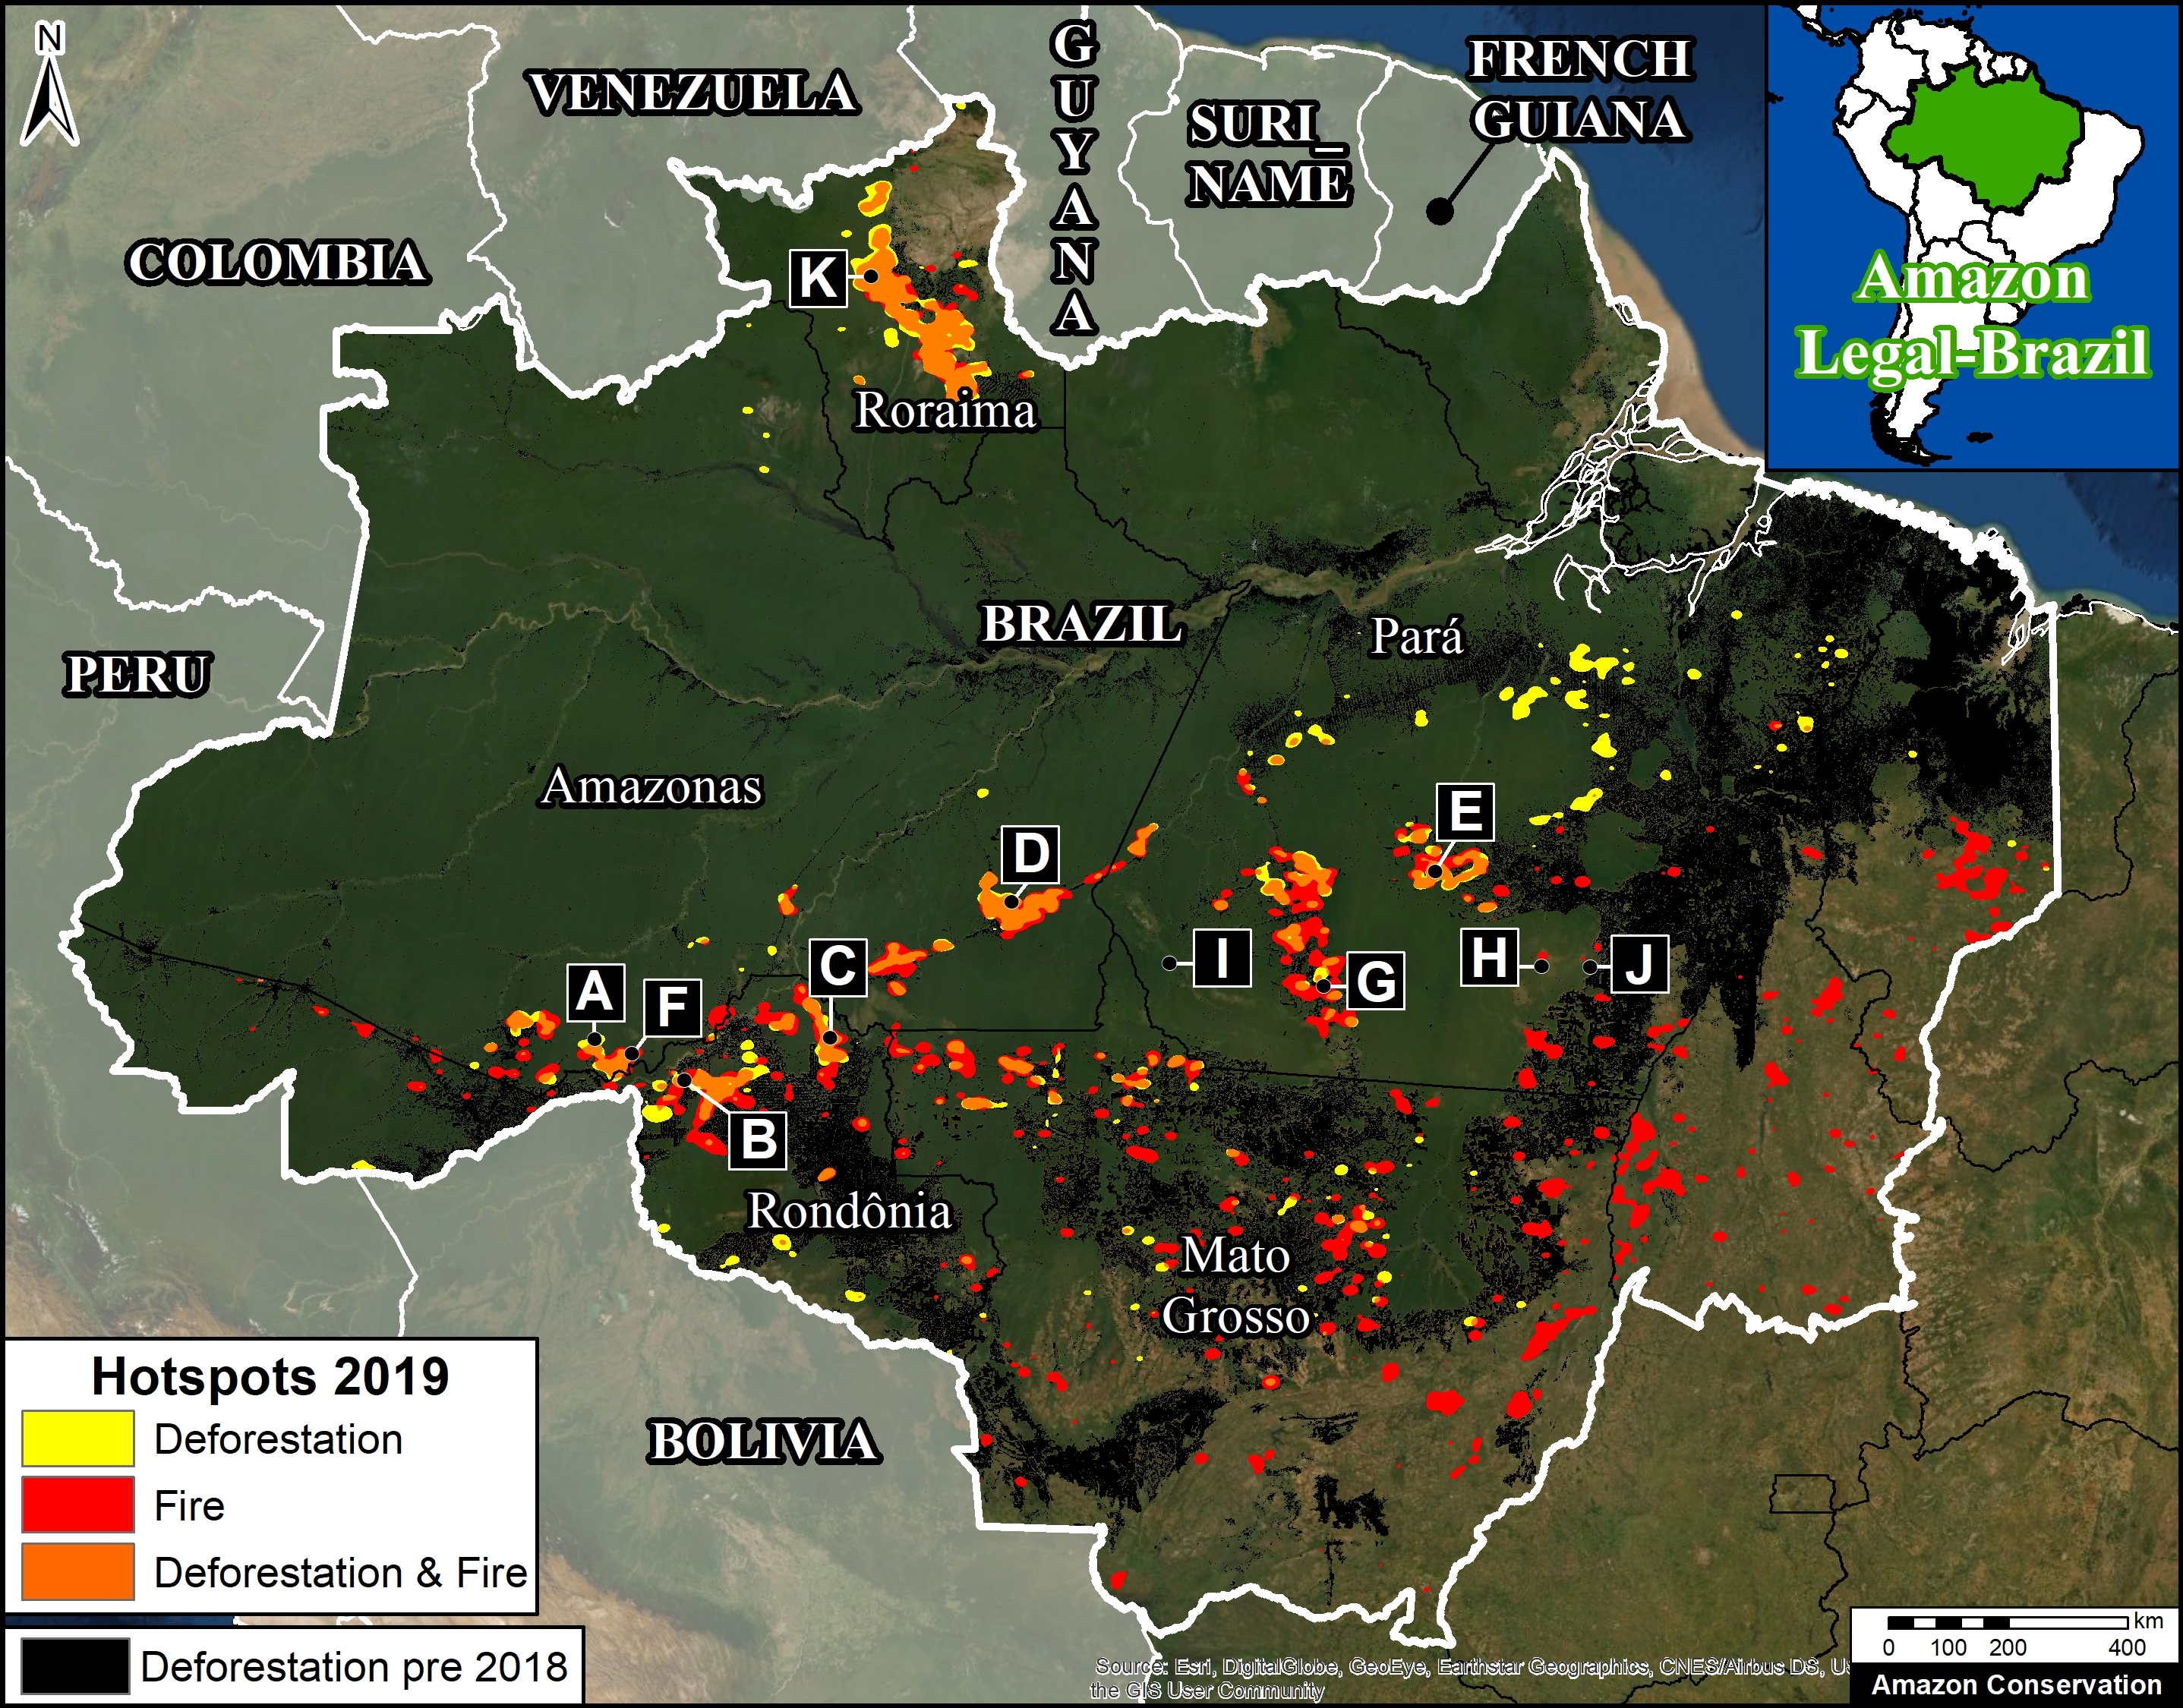
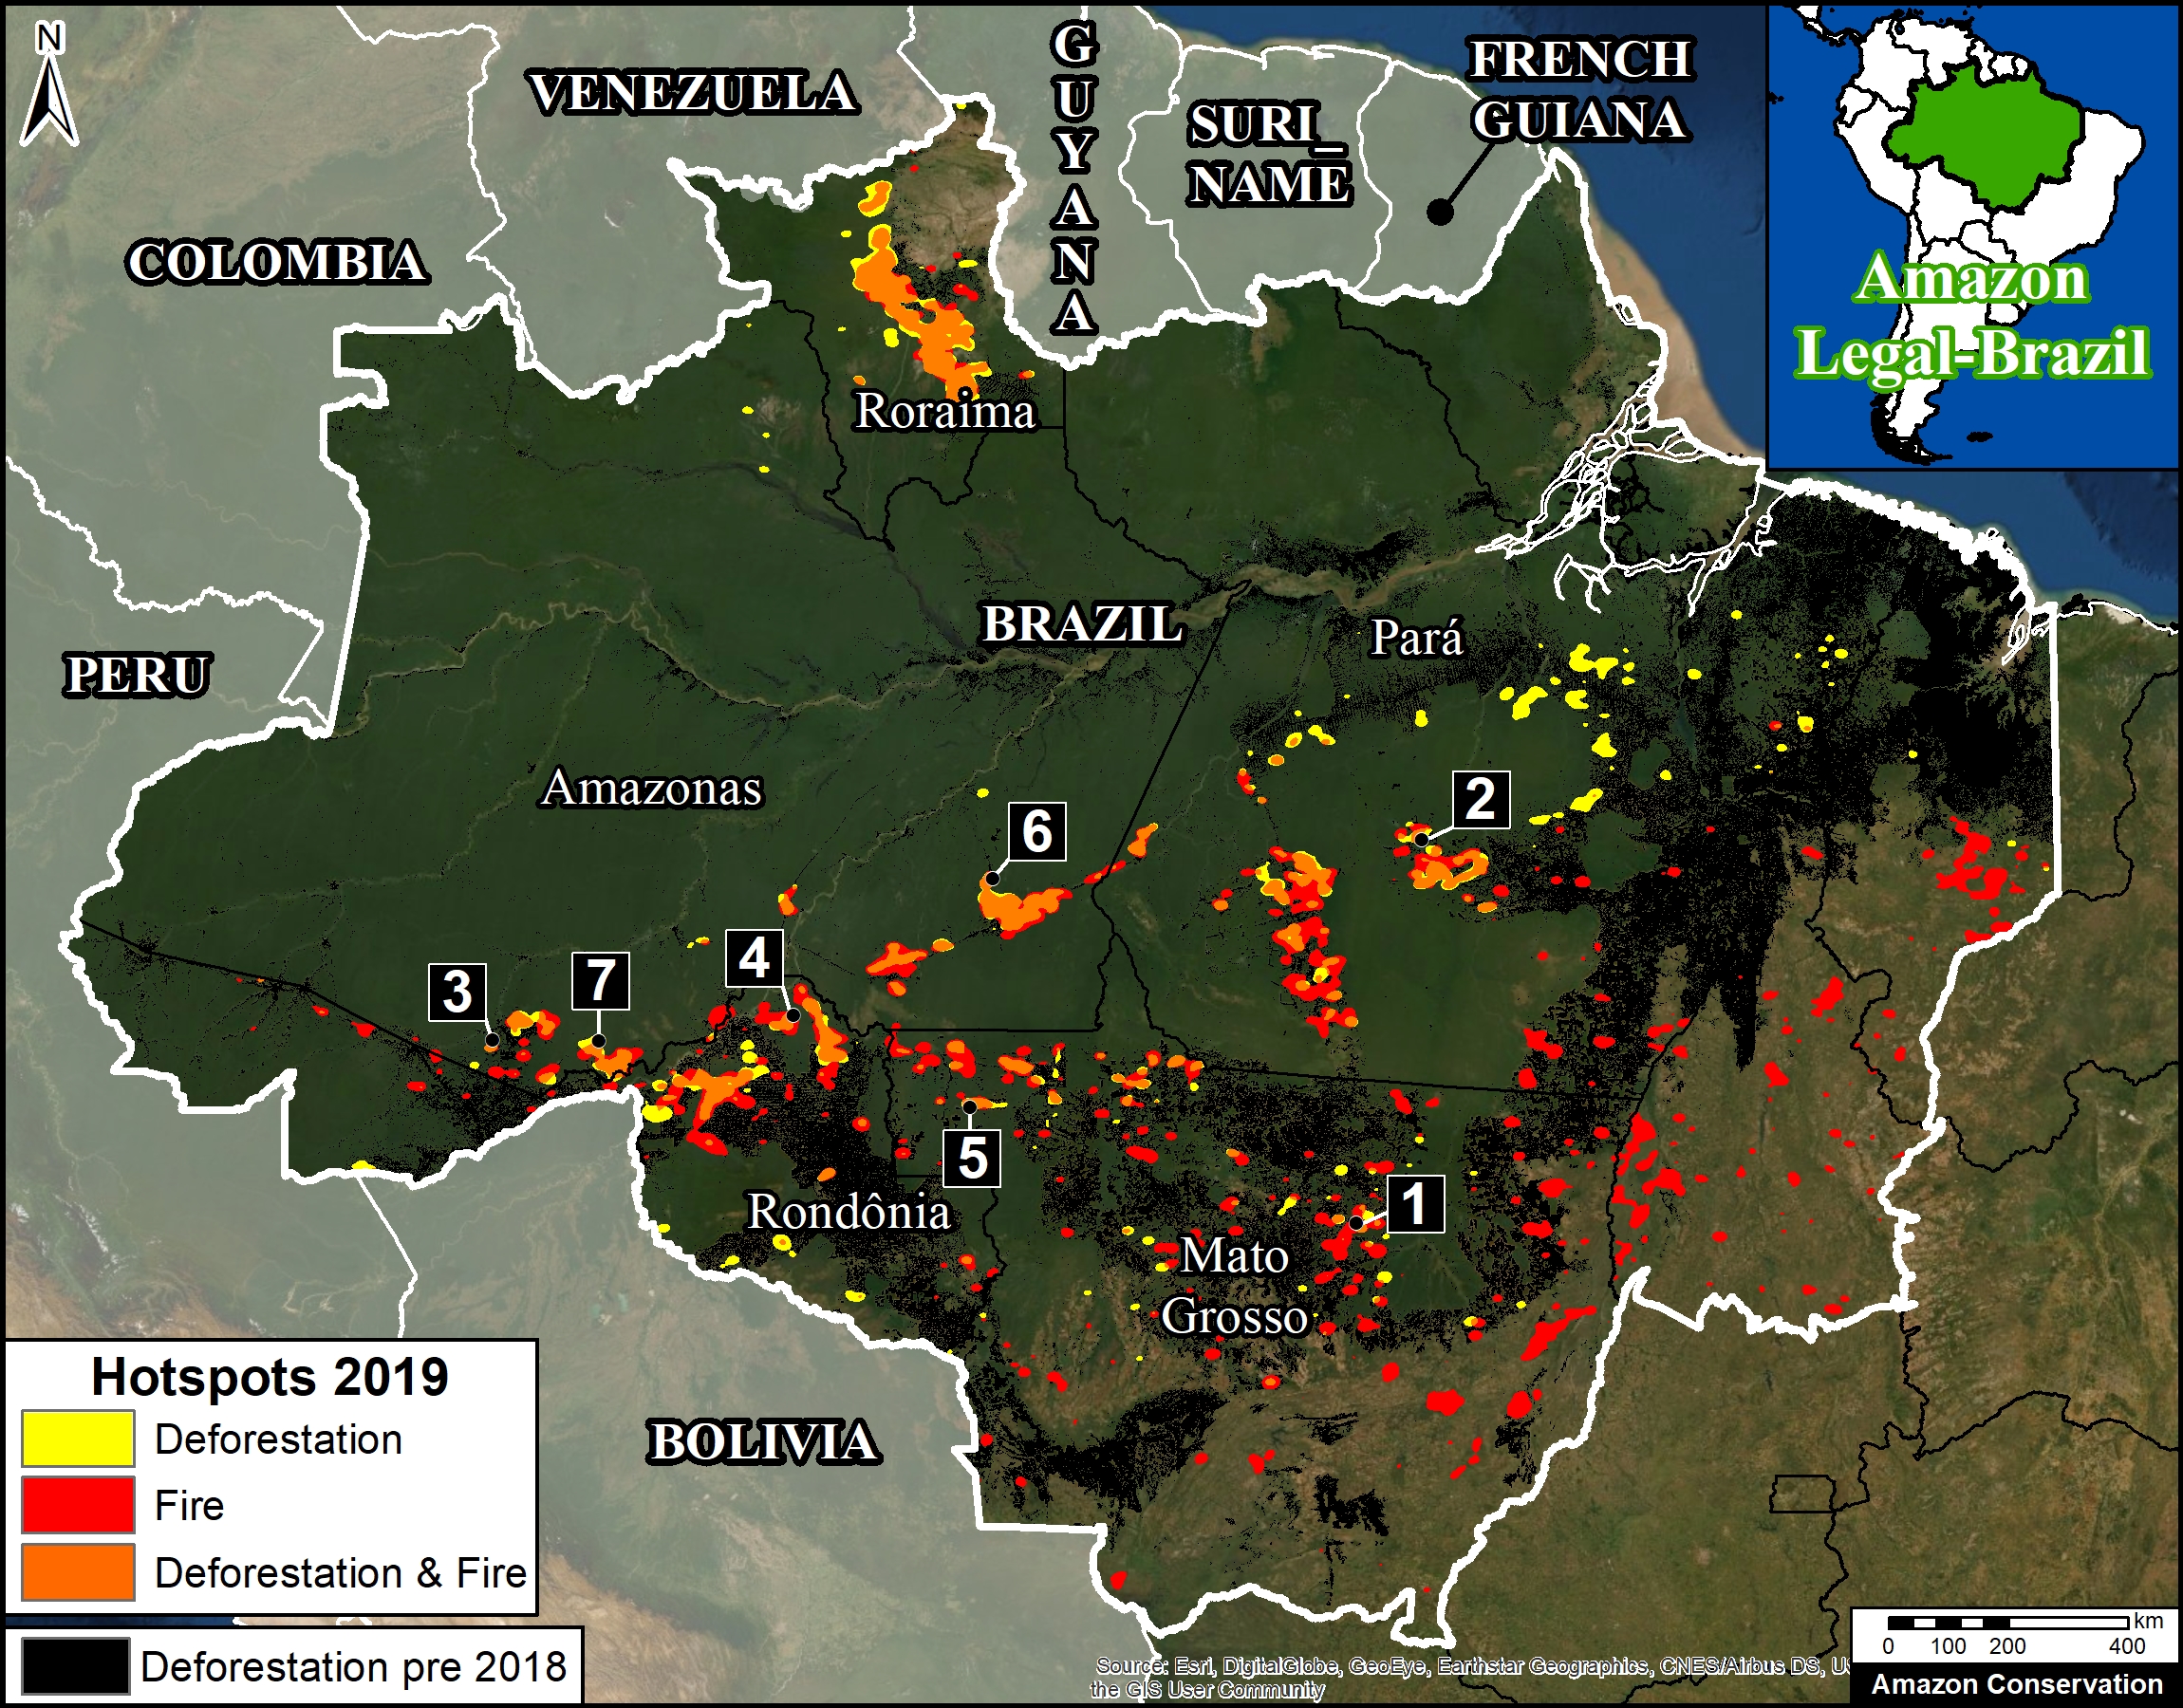
Base Map. 2019 deforestation and fire hotspots in the Brazilian Amazon. Data: UMD/GLAD, NASA (MODIS), PRODES

The fires in the Brazilian Amazon have been the subject of intense global attention over the past month.

As part of our ongoing coverage, we go a step further and analyze the relationship between fire and deforestation in 2019.

First, we present the first known Base Map showing both 2019 deforestation and fire hotspots, and, importantly, the areas of overlap. The letters correspond to Zooms below.

Second, we present a series of 16 high-resolution timelapse videos (Zooms A-K), courtesy of the satellite company Planet. They show five scenarios that we have documented thus far in 2019:

  1. Deforestation (No Fire)
  2. Deforestation (Followed by Fire)
  3. Agriculture Fire
  4. Savanna Fire
  5. Forest Fire

The key finding is that Deforestation (Followed by Fire) is critically important to understandng this year’s fire season (see Zooms B-E).

We documented numerous cases of 2019 deforestation events followed by intense fires, covering at least 52,500 hectares (130,000 acres) and counting. That is equivalent to 72,000 soccer fields.

The other common scenario is Agriculture Fire in areas cleared prior to 2019, but close to surrounding forest (see Zooms F and G).

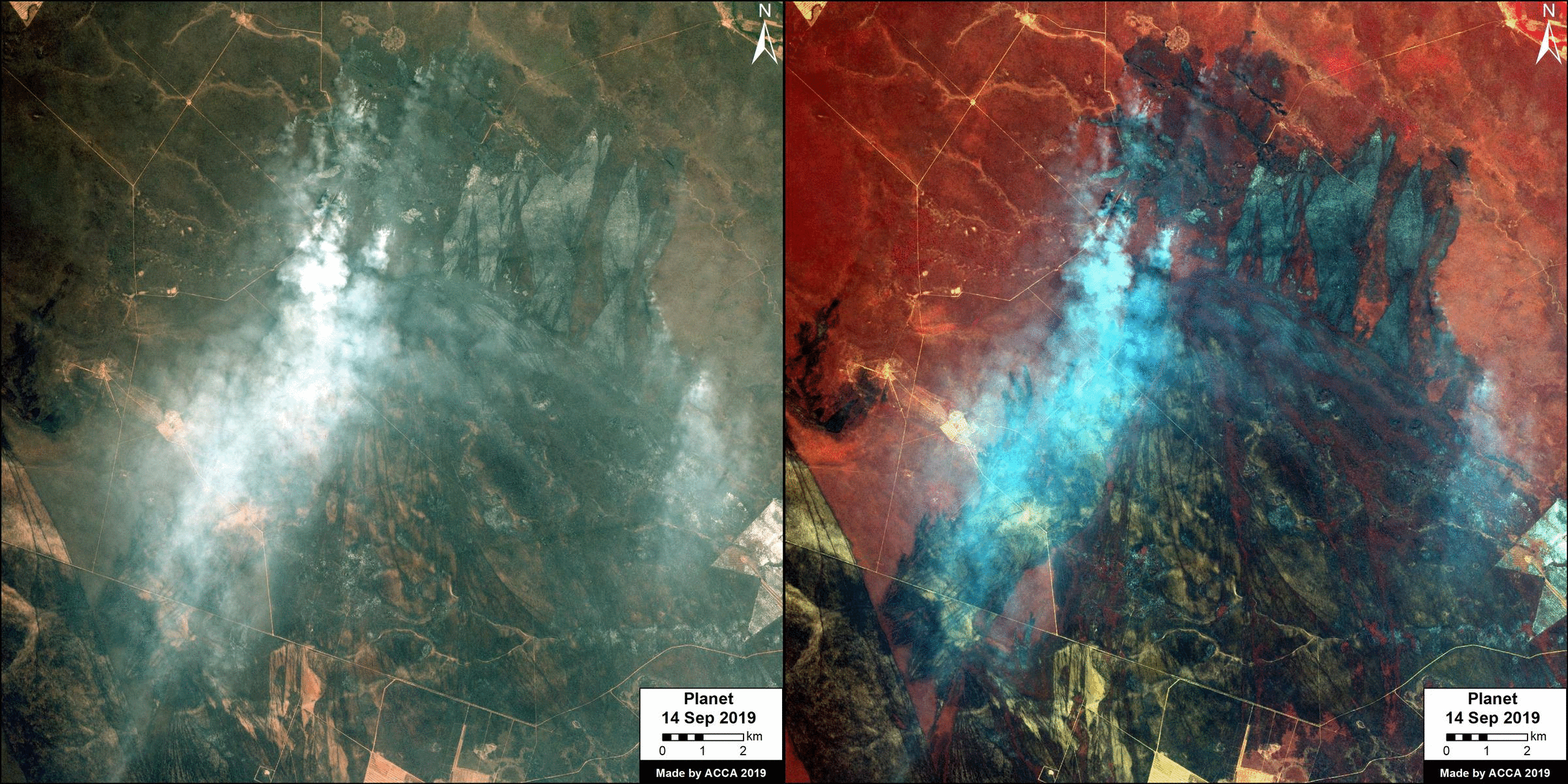
We are also now seeing more examples of Savanna Fire in grassland areas among the rainforest. These fires can be large — we show a 24,000 hectare burn (60,000 acres) in Kayapó indigenous territory (see Zoom H).

We did not observe major Forest Fires in the moist Brazilian Amazon during August, but we did document such fires in early March in Roraima state. As the dry season continues into September and October, however, forest fires become a greater risk.

1. Deforestation (No Fire)

Zoom A shows the large-scale deforestation of 1,450 hectares (3,600 acres) in Amazonas state between April and August 2019. The deforestation seems to be for agricultural purposes and shows no signs of fire.

Zoom A. Deforestation (no Fire). Data: Planet, ESA.

2. Deforestation (Followed by Fire)

The key finding of this analysis was the widespread scenario of major deforestation events followed by intense fires. This (and not Forest Fire) likely explains why many fires were quite smoky. Below we show four examples from the Amazonian states of Rondônia (Zooms B and C), Amazonas (Zoom D), and Pará (Zoom E). In these four examples, we directly measured 8,500 hectares (21,000 acres) that were deforested and then burned in 2019.

Zoom B. Deforestation (Followed by Fire) in Rondônia. Data: Planet, ESA.

Zoom C. Deforestation (Followed by Fire) in Rondônia. Data: Planet, ESA.

Zoom D. Deforestation (Followed by Fire) in Amazonas. Data: Planet, ESA.

Zoom E. Deforestation (Followed by Fire) in Pará. Data: Planet, ESA.

3. Agriculture Fire

Zooms F and G show the other widespread scenario of fires clearing agriculture areas. In most cases, the fires seem contained to the agriculture area, but we have found examples of burning surrounding forest (but not turning into runaway forest fires). As the dry season continues, however, there is an elevated risk of agricultural fires escaping into the surrounding forest and causing larger fires.

Zoom F. Agriculture fire. Data: Planet, ESA.

Zoom G. Agriculture fire. Data: Planet, ESA.

4. Savanna Fire

We have recently been detecting fires burning through drier ecosystems, such as savannas, located in pockets among the moist rainforest. Zooms H and I show savanna fires in Kayapó and Munduruku indigenous territories, respectively. These savanna fires can burn large areas, for example more than 24,000 hectares (60,000 acres) in Kayapó territory , and 700 hectares  (1,700 acres) in Munduruku territory.

Zoom H. Savanna fire in Kayapó indigenous territory. Data: Planet, ESA.

Zoom I. Savanna fire in Munduruku indigenous territory. Data: Planet, ESA.

5. Forest Fire

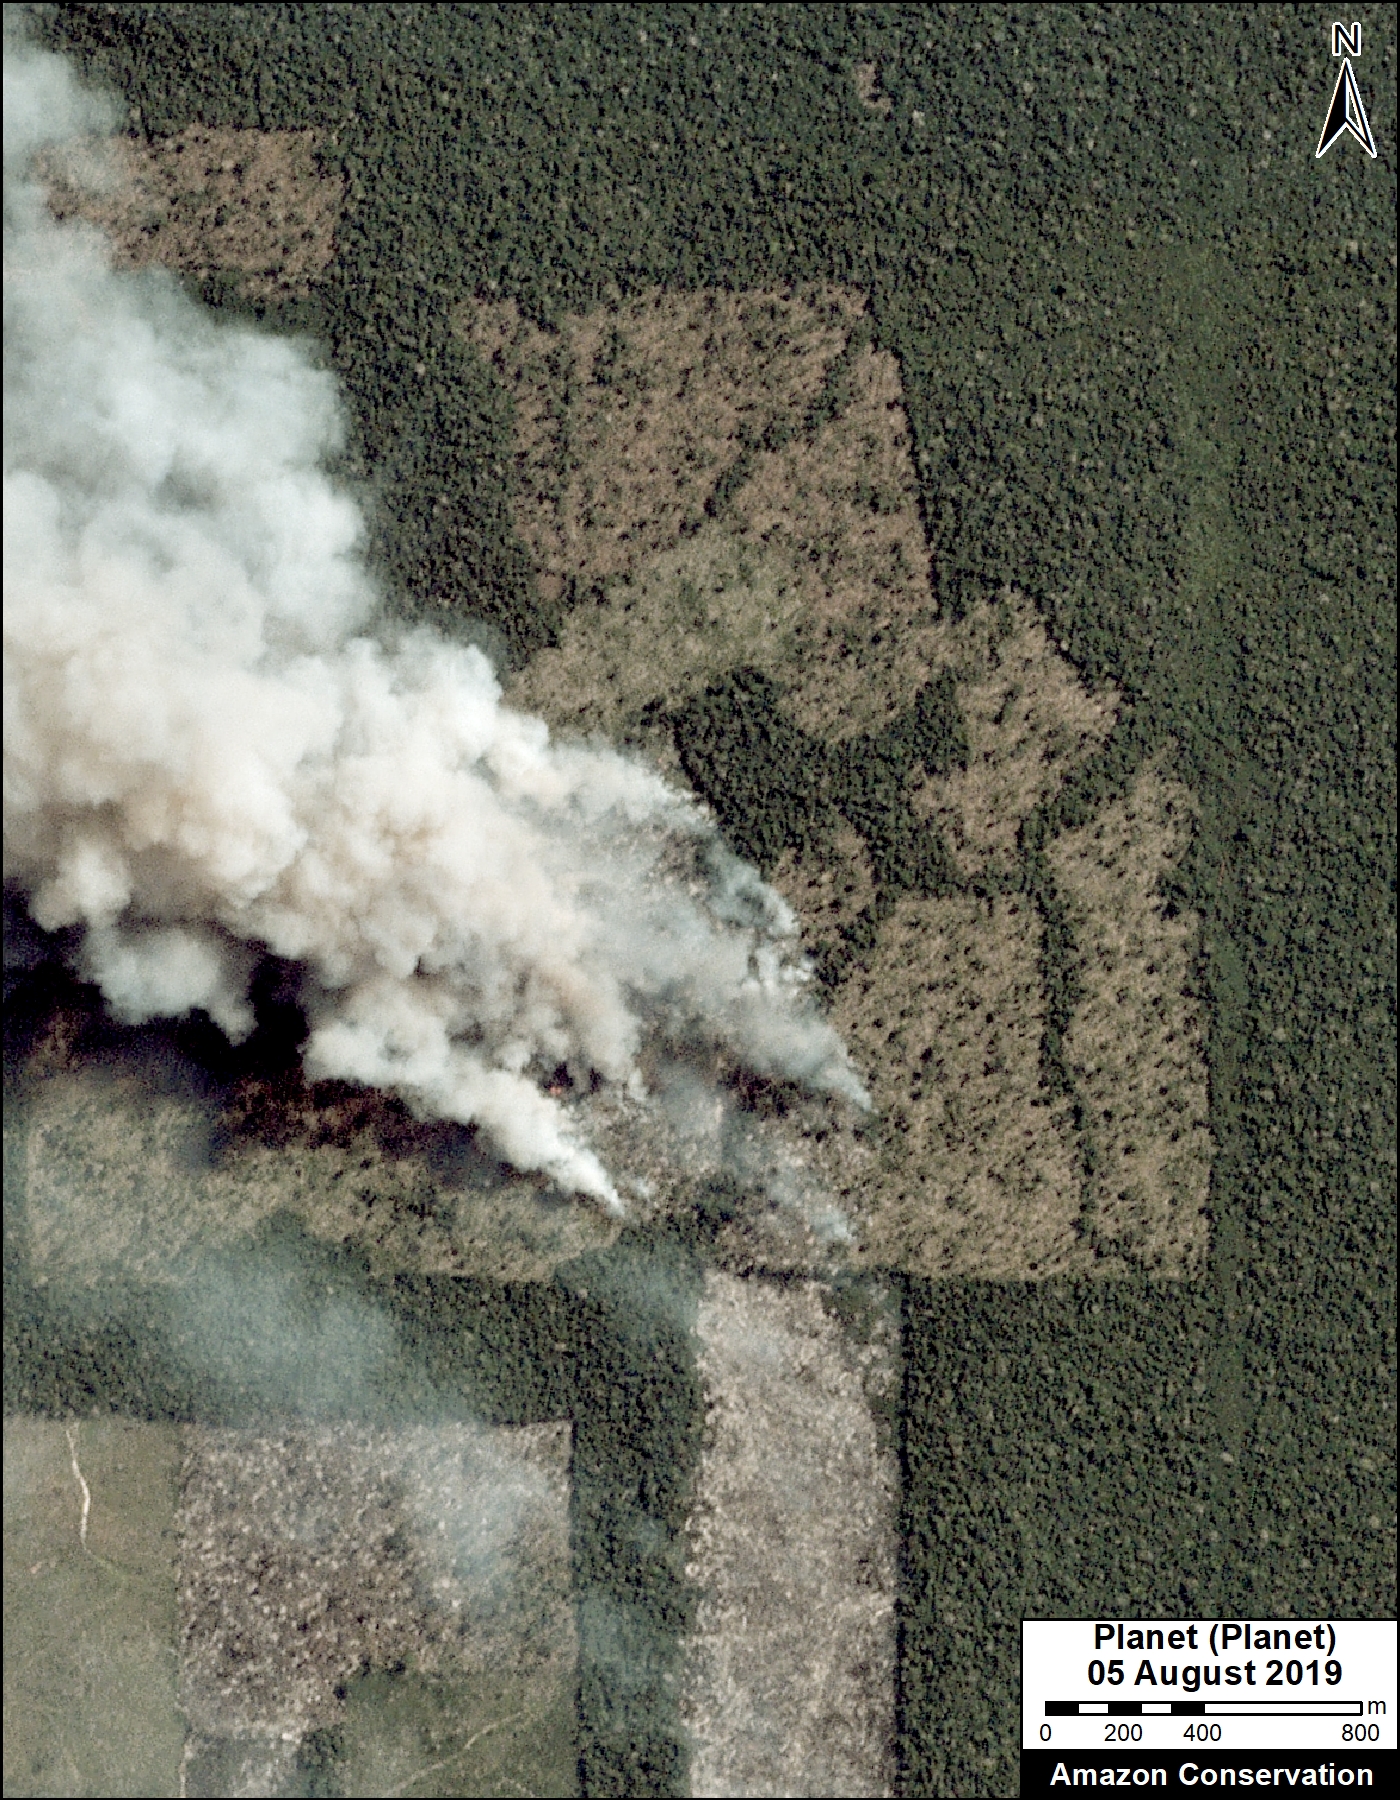
During August we have not documented large forest fires in the moist forests of the western Brazilian Amazon, our main focal area. Forest fires may be more common in the eastern Brazilian Amazon, especially as we get deeper into the burning season. For example, Zoom J shows some recent fires in the ridges of Kayapó indigenous territory that have burned around 930 hectares (2,300 acres).

Zoom J. Forest fire in the ridges of Kayapó indigenous territory. Data: Planet, ESA.

It is important to note that we have not yet documented any large, runaway fires through the moist forests of the Brazilian Amazon that seem to be the media and public perception of the situation. The large fires we have seen are in the dry and scrub forests of the Brazilian and Bolivian Amazon (see MAAP #108). Interestingly however, there were major forest fires earlier in the year (early March) in northern Brazil (Roraima state). Zoom I shows an example of these fires near Yanomami indigenous territory.

Zoom K. Forest fire in early March 2019 in Roraima state. Data: Planet, ESA.

Methods

We created two “hotspots” layers, one for deforestation and the other for fires, by conducting a kernel density analysis. This type of analysis calculates the magnitude per unit area of a particular phenomenon, in this case forest loss alerts (proxy for deforestation) and temperature anomaly/fire alerts.

We used GLAD alert forest loss data (30 meter resolution) from the University of Maryland and available on Global Forest Watch. Data thru August 2019.

We used NASA’s Fire Information for Resource Management System (FIRMS) MODIS-based fire alert data (1 km resolution). Data thru August 2019.

We conducted the analysis using the Kernel Density tool from Spatial Analyst Tool Box of ArcGIS, using the following parameters:

Search Radius: 15000 layer units (meters)
Kernel Density Function: Quartic kernel function
Cell Size in the map: 200 x 200 meters (4 hectares)
Everything else was left to the default setting.

For the Base Map, we used the following concentration percentages: Medium: 10%-25%; High: 26%-50%; Very High: >50%. We then combined all three categories into one color (yellow for deforestation and red for fire). Orange indicates areas where both layers overlap. As background layer, we also included pre-2019 deforestation data from Brazil’s PRODES system.

Acknowledgements

We thank G. Hyman (SIG), A. Flores (NASA-SERVIR), and A. Folhadella (ACA) for helpful comments to earlier versions of this report.

This work was supported by the following major funders: MacArthur Foundation, International Conservation Fund of Canada (ICFC), Metabolic Studio, and Global Forest Watch Small Grants Fund (WRI).

Citation

Finer M, Mamani N (2019) Fires and Deforestation in the Brazilian Amazon, 2019. MAAP: 109.