Amazon Fire Tracker 2020: Brazil Fire #12 (June 29)

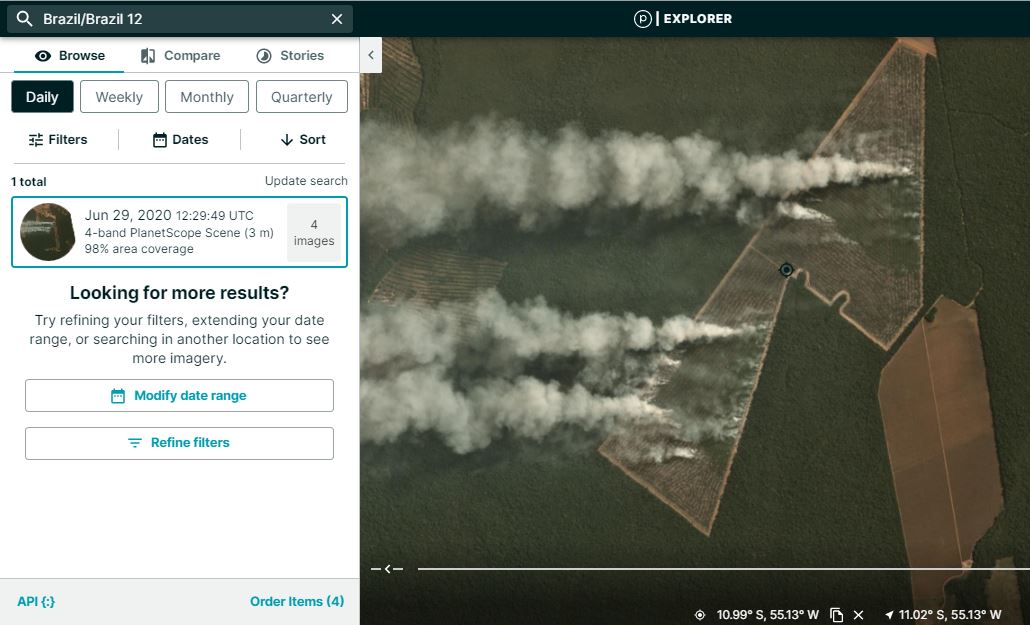
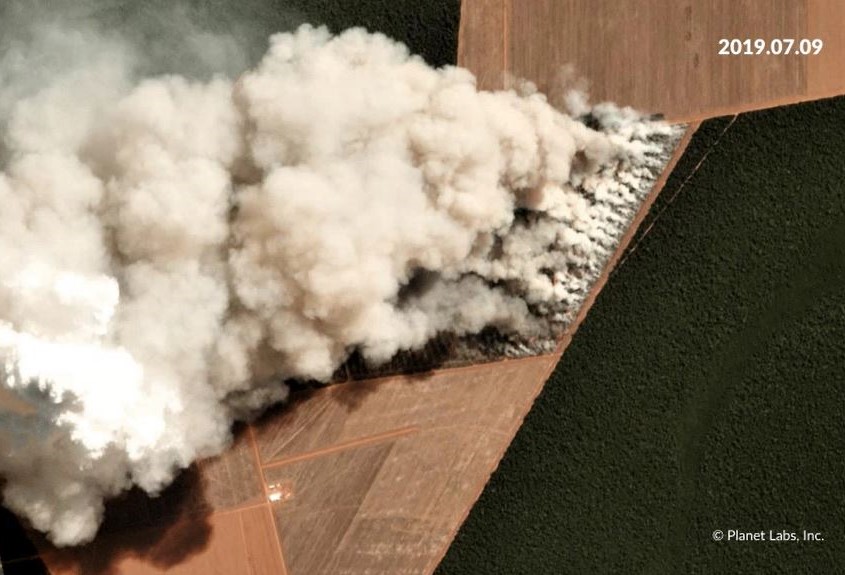
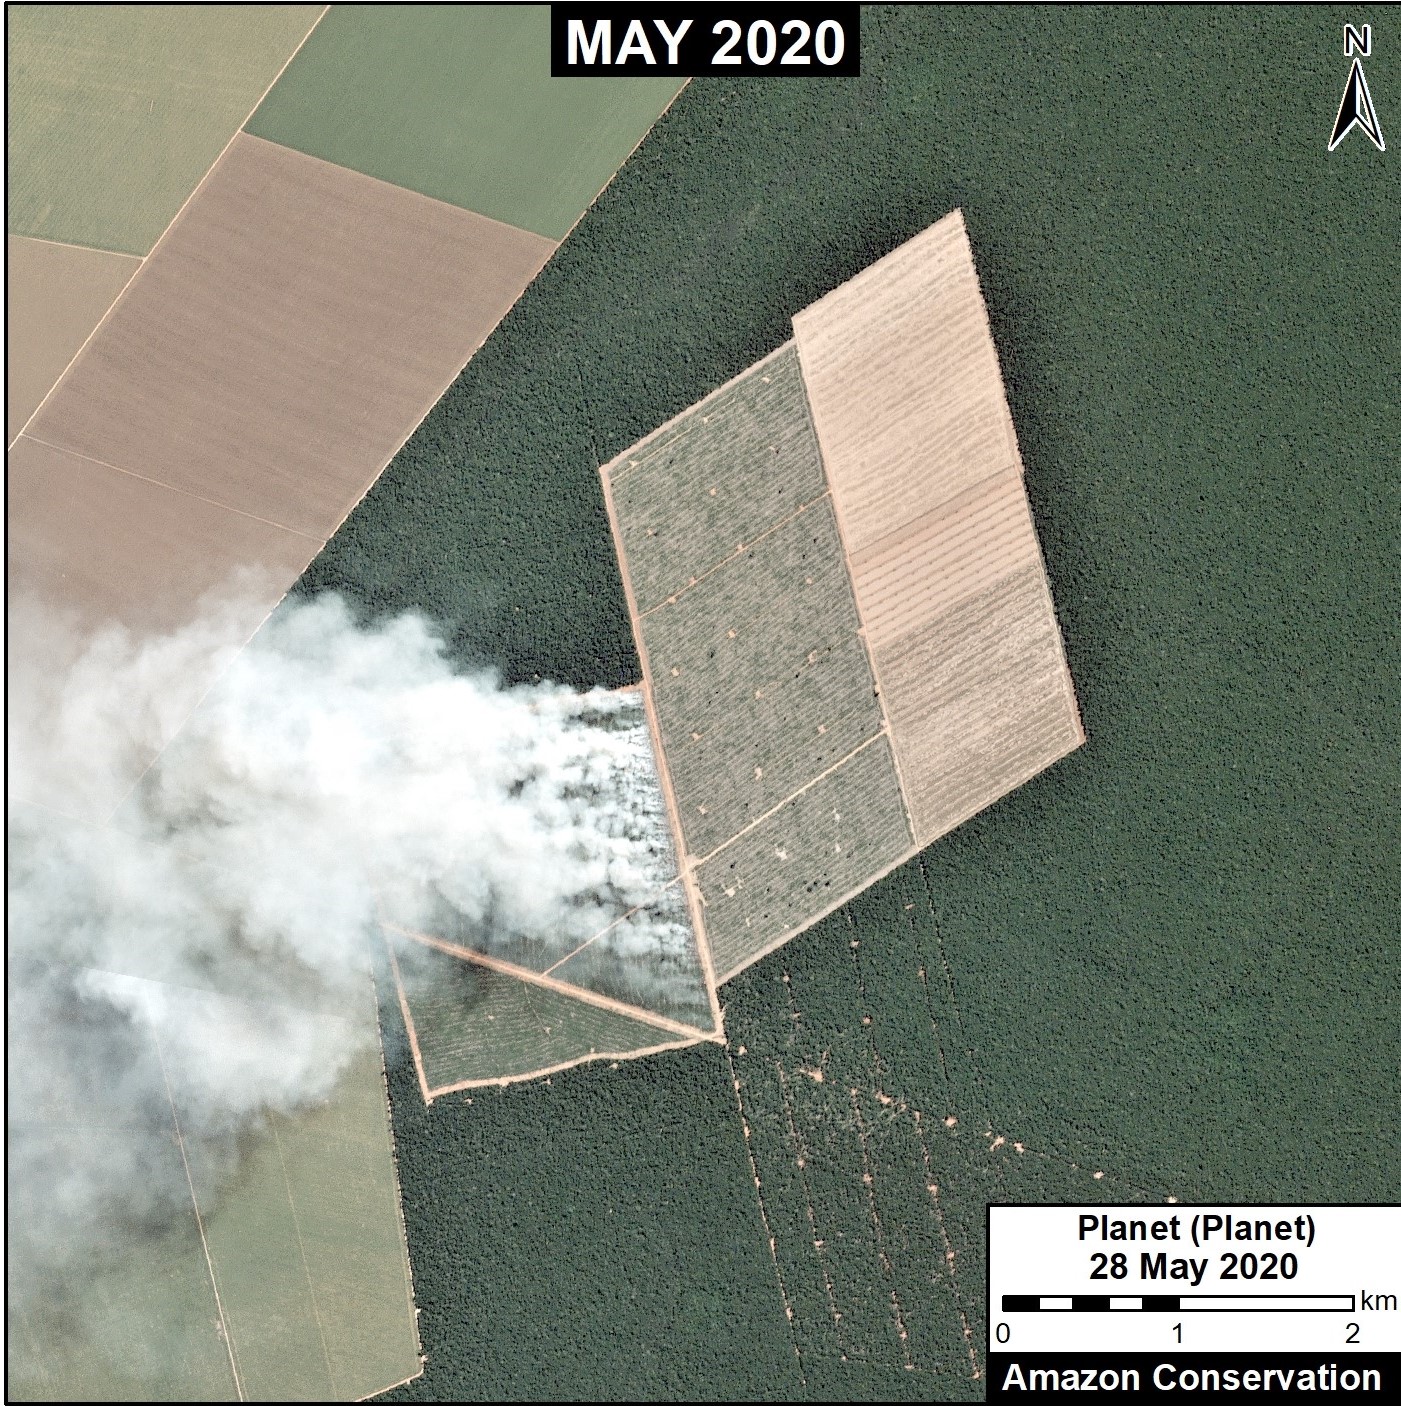
20202 Amazon major fire #12, in Mato Grosso Brazil, on June 29. Data: Planet. Analysis: MAAP/Amazon Conservation.

As presented in MAAP #118, Amazon Conservation launched a real-time fire monitoring app that specializes in the rapid and user-friendly detection and visualization of major Amazon fires.

In a novel approach, the app combines data from the atmosphere (aerosol emissions in smoke) and the ground (heat anomalies) to effectively monitor large Amazon fires.

As detailed below, the app just detected the 12th major Amazon fire of the year on June 29, 2020 (see the high-resolution image to the right).

It burned 587 hectares (1,451 acres) of land deforested in 2019.

Thus far, all 12 major Amazon fires of 2020 have:

  • Occured in the state of Mato Grosso, in the southeastern Brazilian Amazon.
  • Burned recently deforested areas (that is, areas deforested in 2018, 2019, or 2020). In other words, these are not forest fires. See MAAP #113 for background on this important point.

Below, we describe the process of using the app to detect and confirm the fire on June 29.


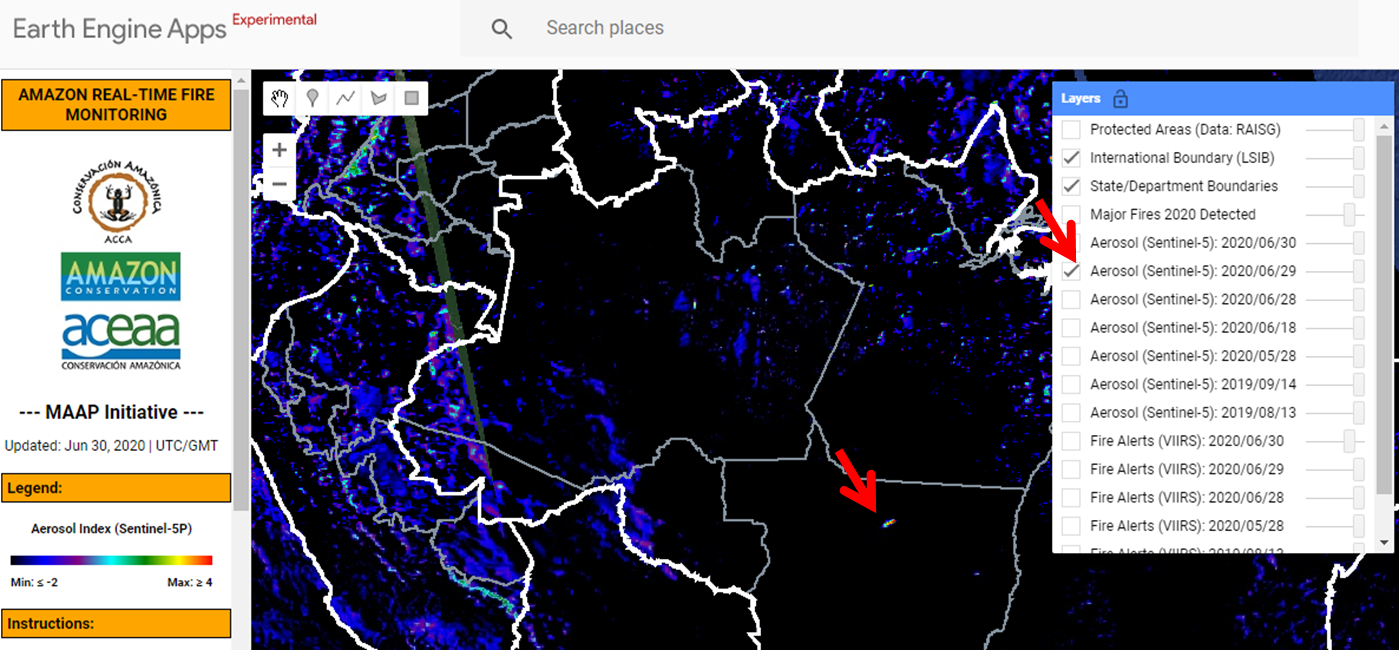
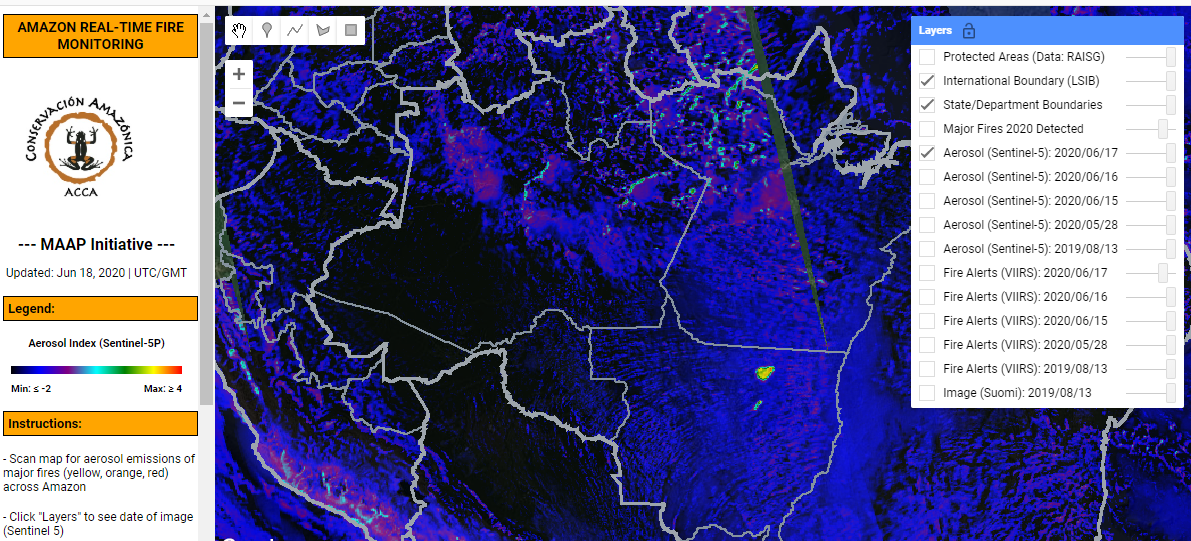
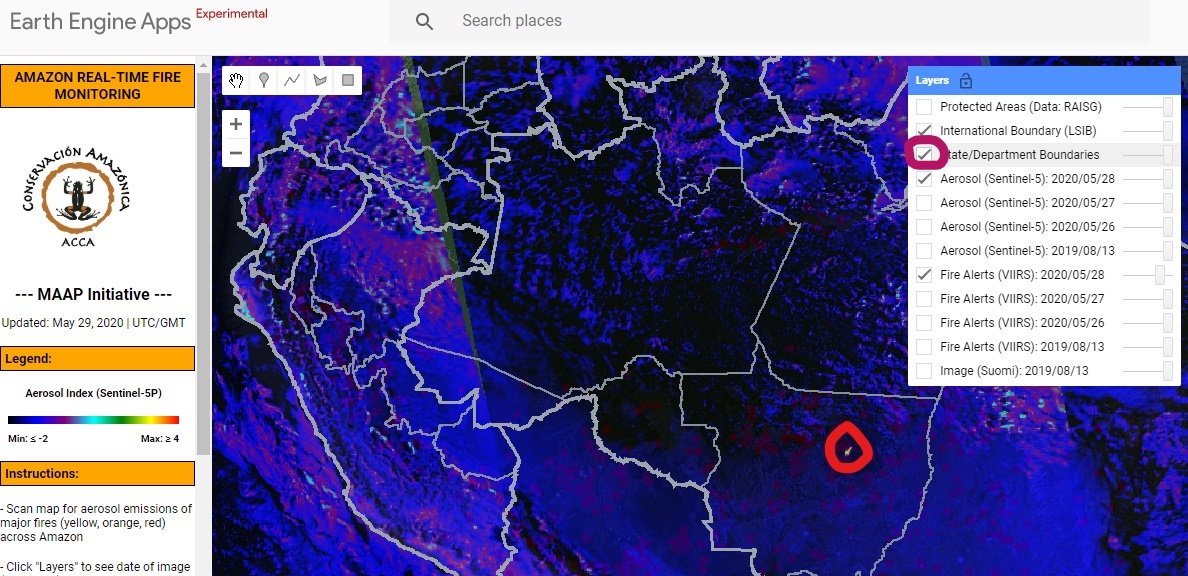
Step 1. Detection of elevated emissions in the southeastern Brazilian Amazon (Mato Grosso).


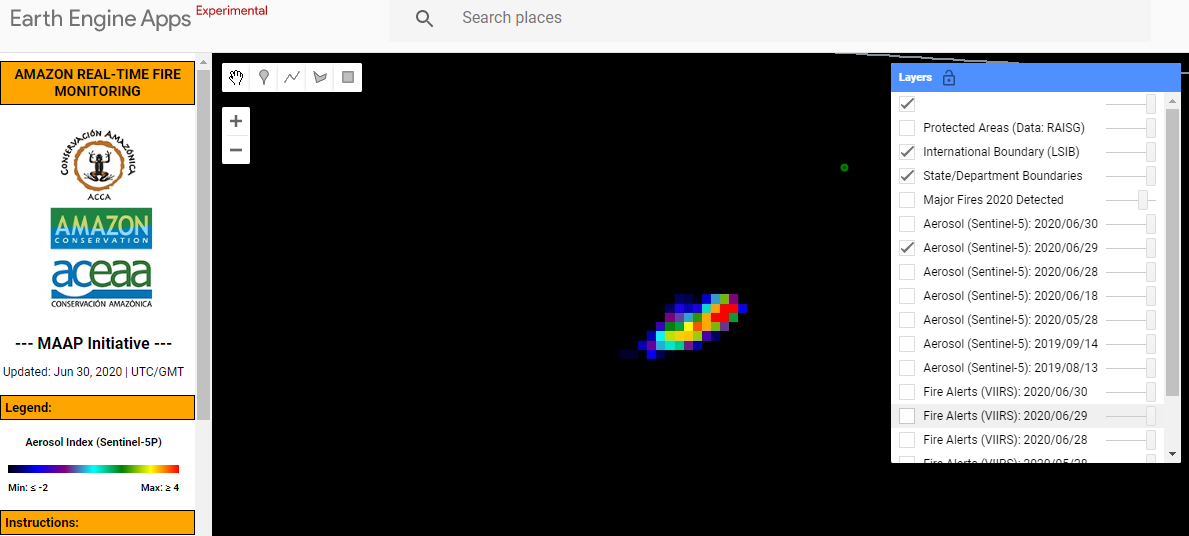
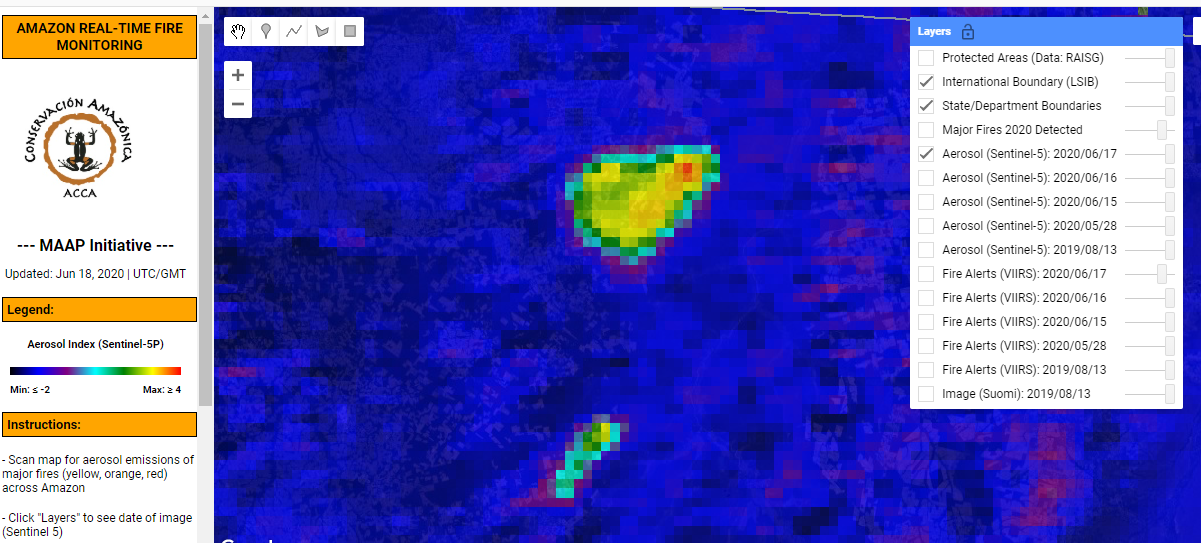
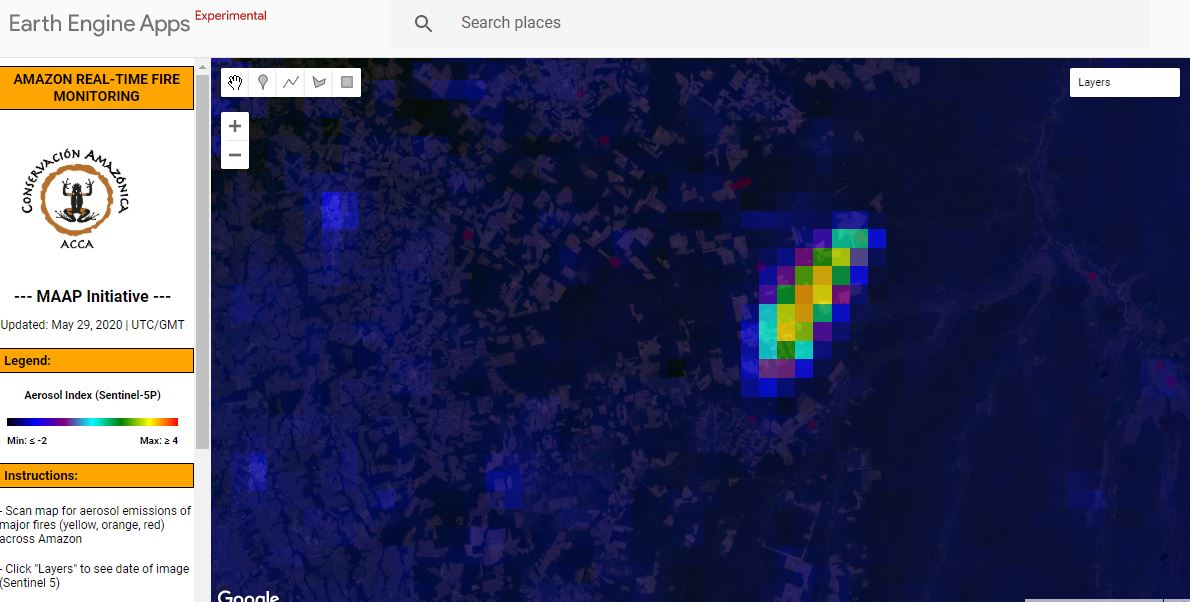
Step 2. Zoom in to confirm the elevated aerosol emissions, indicating the burning of abundant biomass.

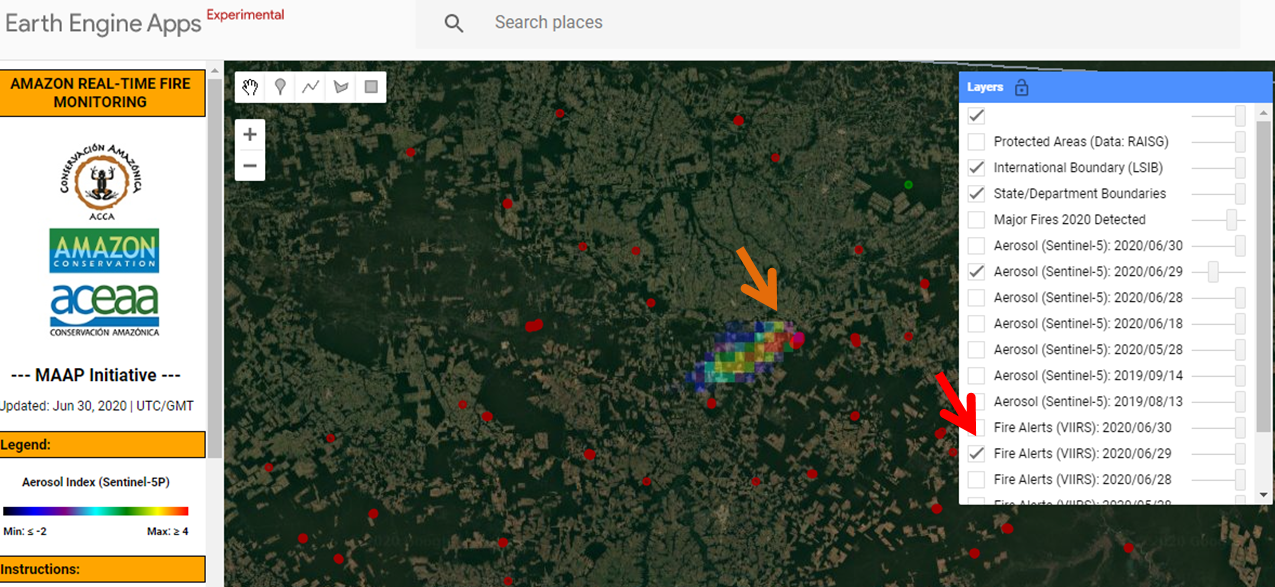
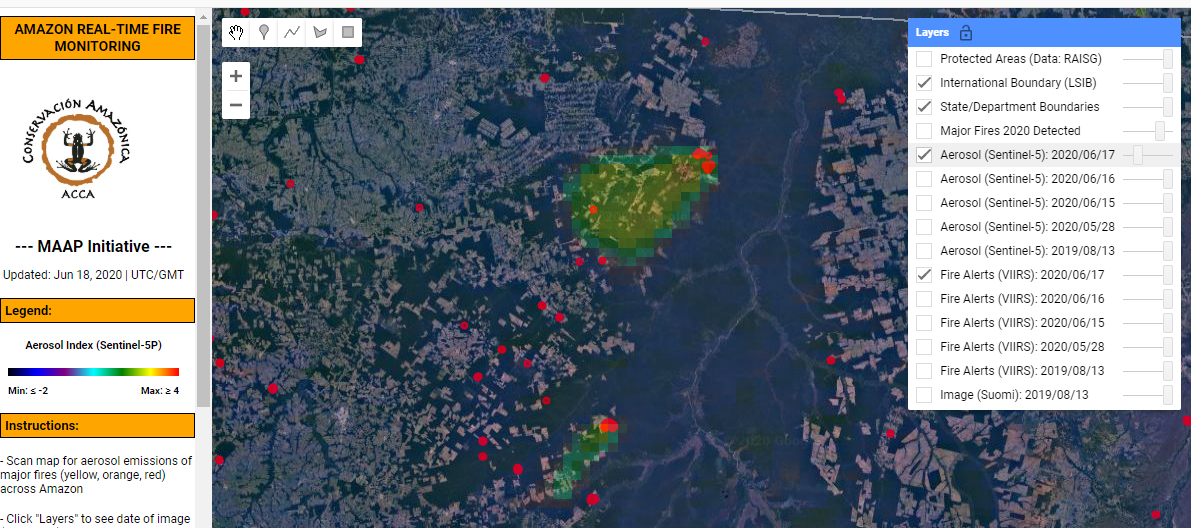
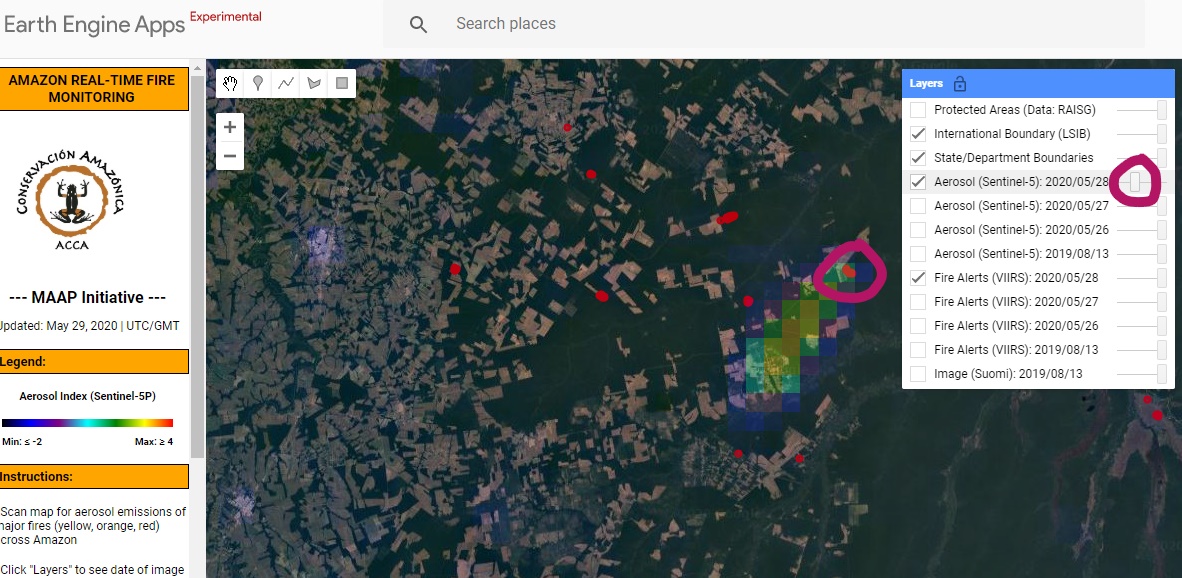
Step 3. Adjust the transparency to see the underlying fire alerts that indicate the exact location of the fires. Obtain coordinates of the source of the fires.


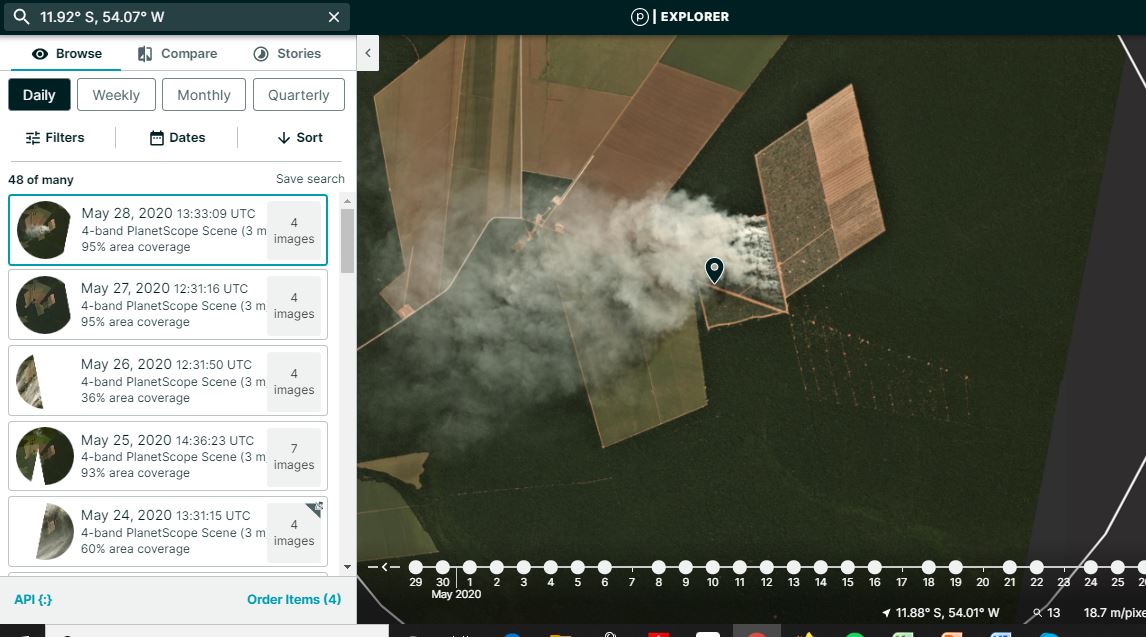
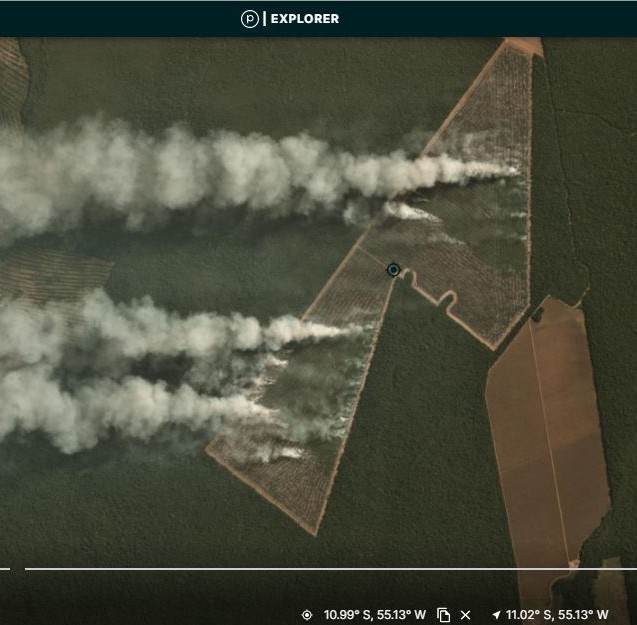
Step 4. Confirm fire with satellite imagery. For example, here is a high resolution image from Planet Explorer showing the fire burning on June 29.

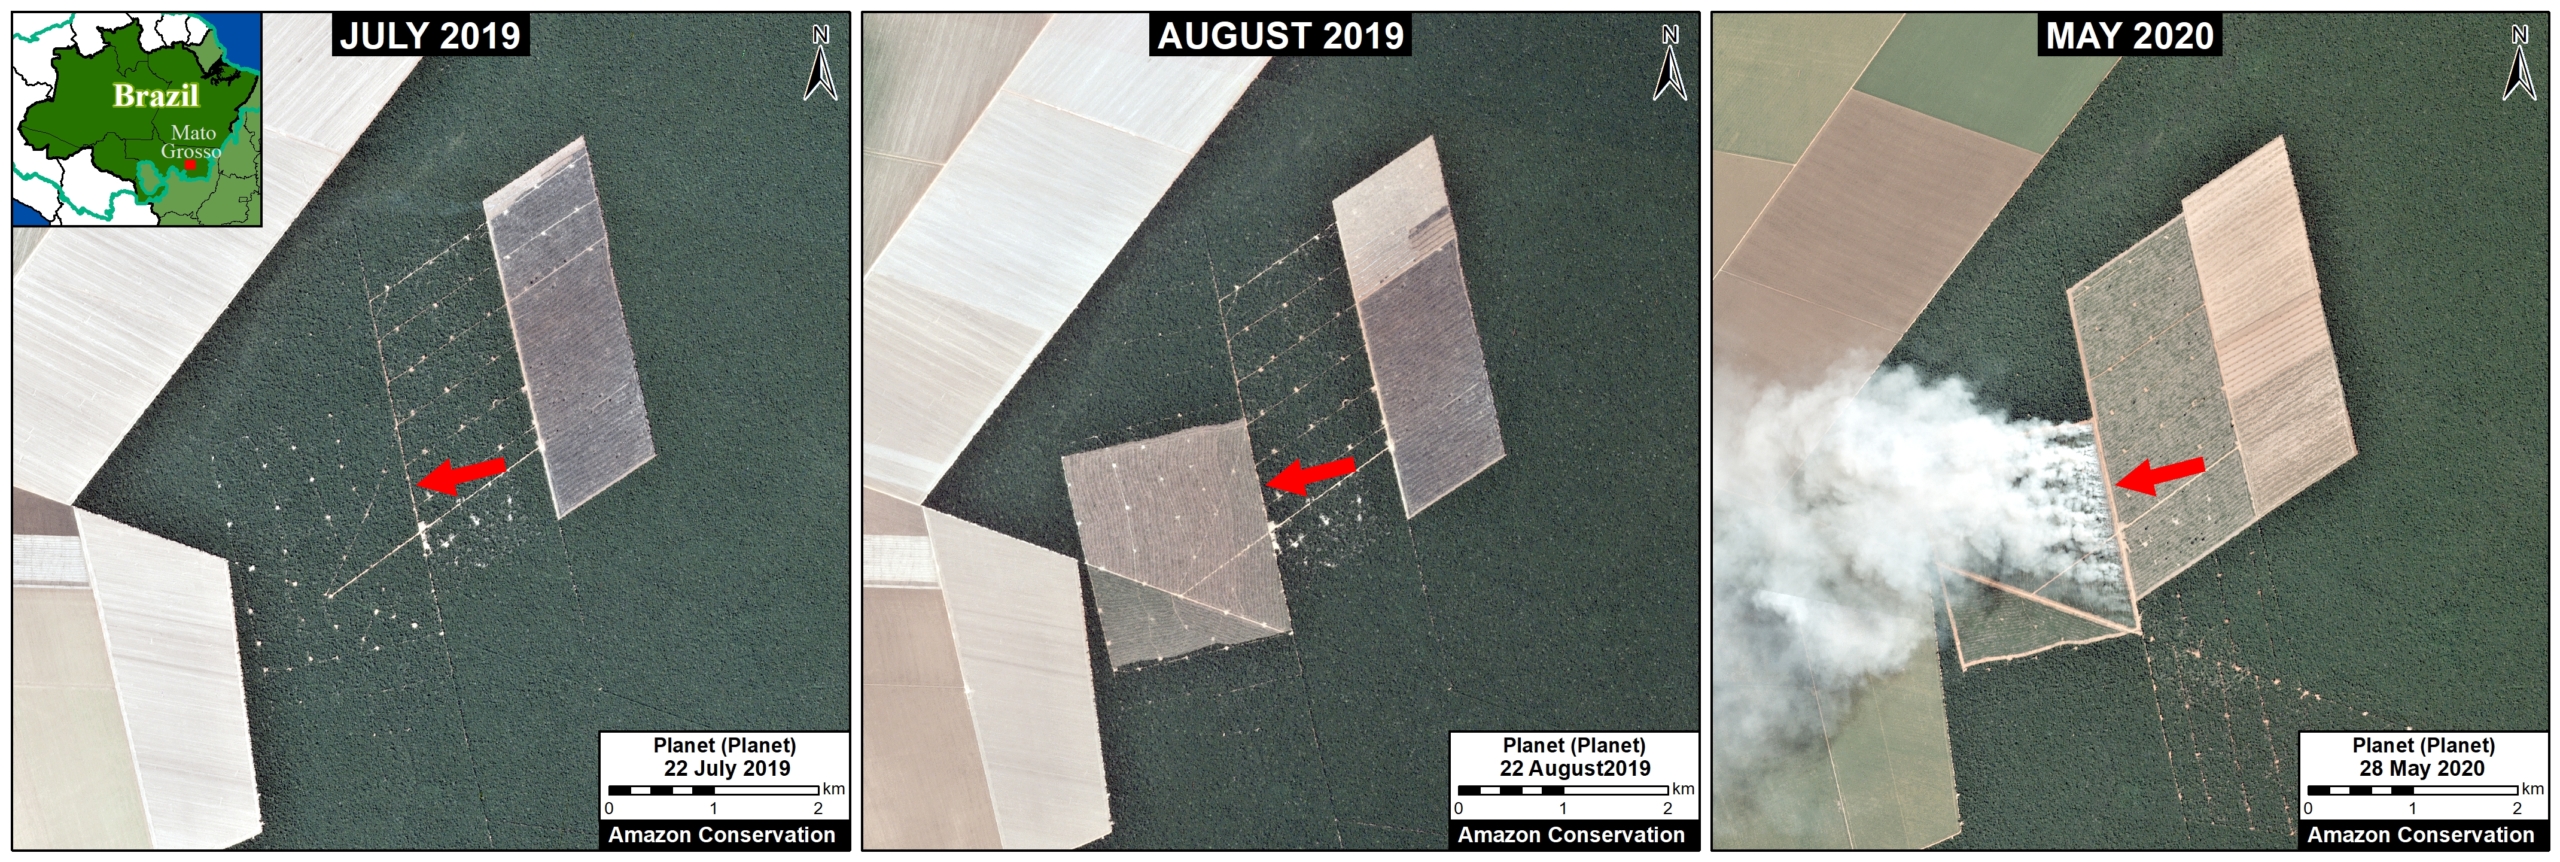
Step 5. Using Planet’s extensive imagery archive, we were able to determine that the fires were burning an area deforested in 2019 (and not a forest fire). In the timelapse below, see that the deforestation occurred between September and October 2019, and then burned on June 29, 2020. The final image shows the day after the fires, June 30, to see the full extent of the burn.

Coordinates

-10.99, -55.13

References

Gorelick, N., Hancher, M., Dixon, M., Ilyushchenko, S., Thau, D., & Moore, R. (2017). Google Earth Engine: Planetary-scale geospatial analysis for everyone. Remote Sensing of Environment.
Planet Team (2017). Planet Application Program Interface: In Space for Life on Earth. San Francisco, CA. https://api.planet.com

Acknowledgements

This work was supported by the following major funders: USAID/NASA (SERVIR), Global Forest Watch Small Grants Fund (WRI), Norwegian Agency for Development Cooperation (NORAD),  International Conservation Fund of Canada (ICFC), Metabolic Studio, and Erol Foundation.

Citation

Finer M, Villa L (2020) Amazon Fire Tracker 2020: Brazil #12 (June 29). MAAP.

MAAP #122: Amazon Deforestation 2019

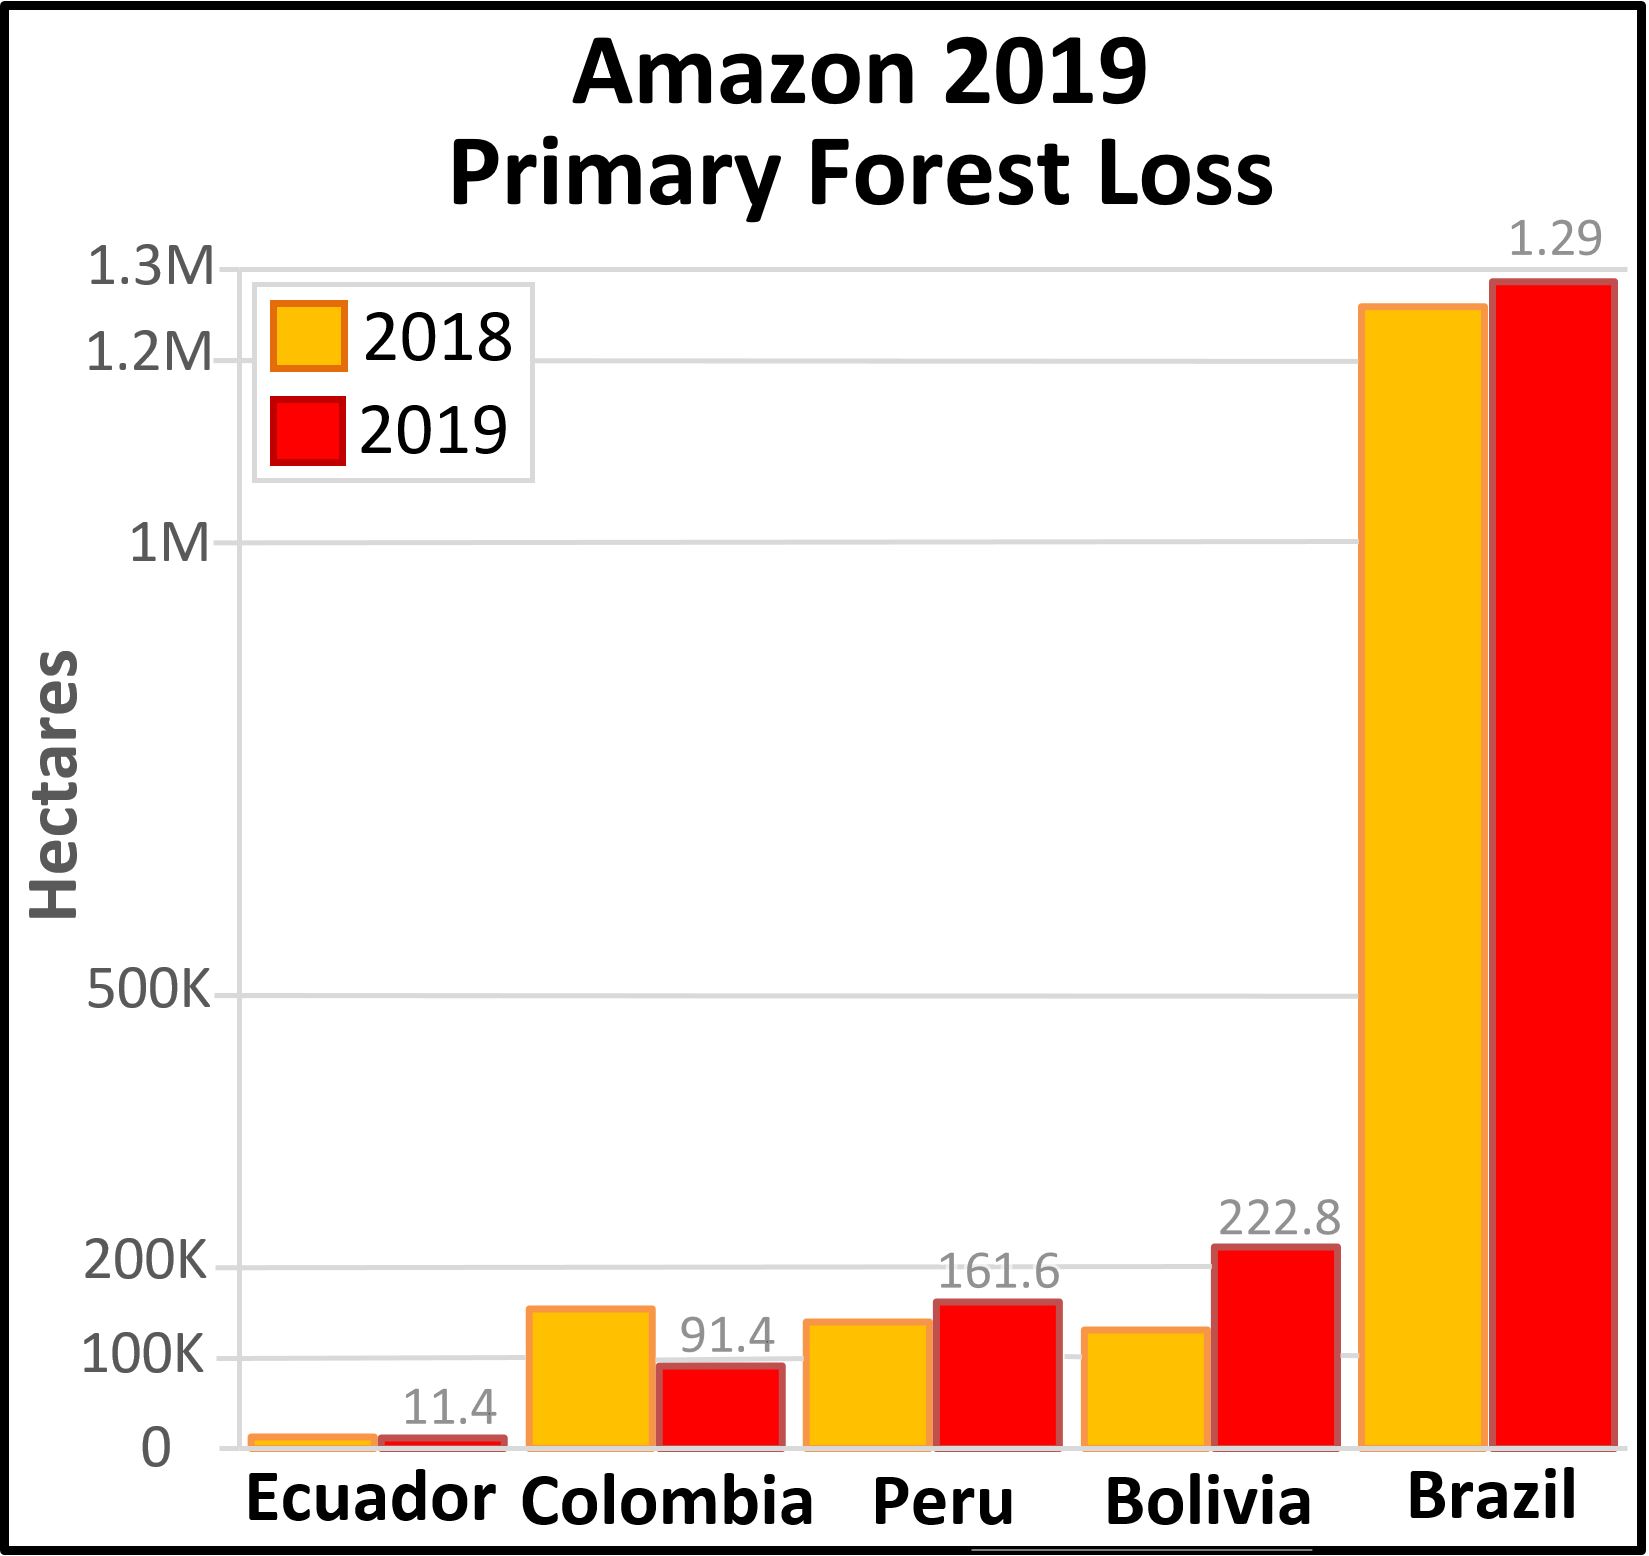
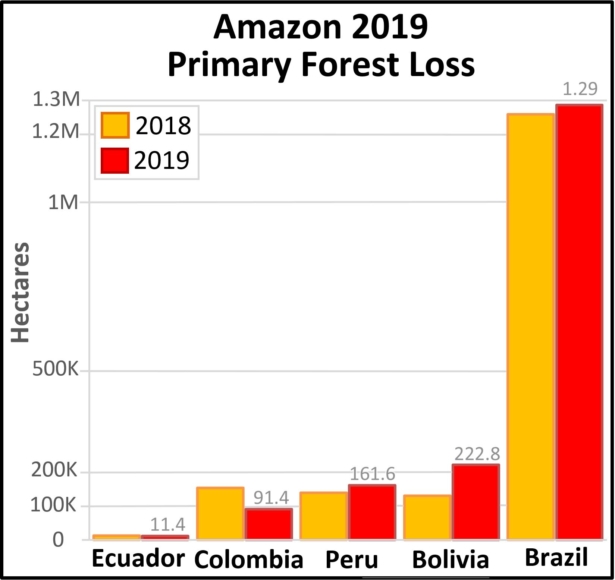
Table 1. Primary forest loss for 2019 (red) compared to 2018 (orange). Data: Hansen/UMD/Google/USGS/NASA, MAAP.

Newly released data for 2019 reveals the loss of over 1.7 million hectares (4.3 million acres) of primary Amazon forest in our 5 country study area (Bolivia, Brazil, Colombia, Ecuador, and Peru).* That is twice the size of Yellowstone National Park.

Table 1 shows 2019 deforestation (red) in relation to 2018 (orange).

Primary forest loss in the Brazilian Amazon (1.29 million hectares) was over 3.5 times higher than the other four countries combined, with a slight increase in 2019 relative to 2018. Many of these areas were cleared in the first half of the year and then burned in August, generating international attention.

Primary forest loss rose sharply in the Bolivian Amazon (222,834 hectares), largely due to uncontrolled fires escaping into the dry forests of the southern Amazon.

Primary forest loss rose slightly in the Peruvian Amazon (161,625 hectares) despite a relatively successful crackdown on illegal gold mining, pointing to small-scale agriculture (and cattle) as the main driver.

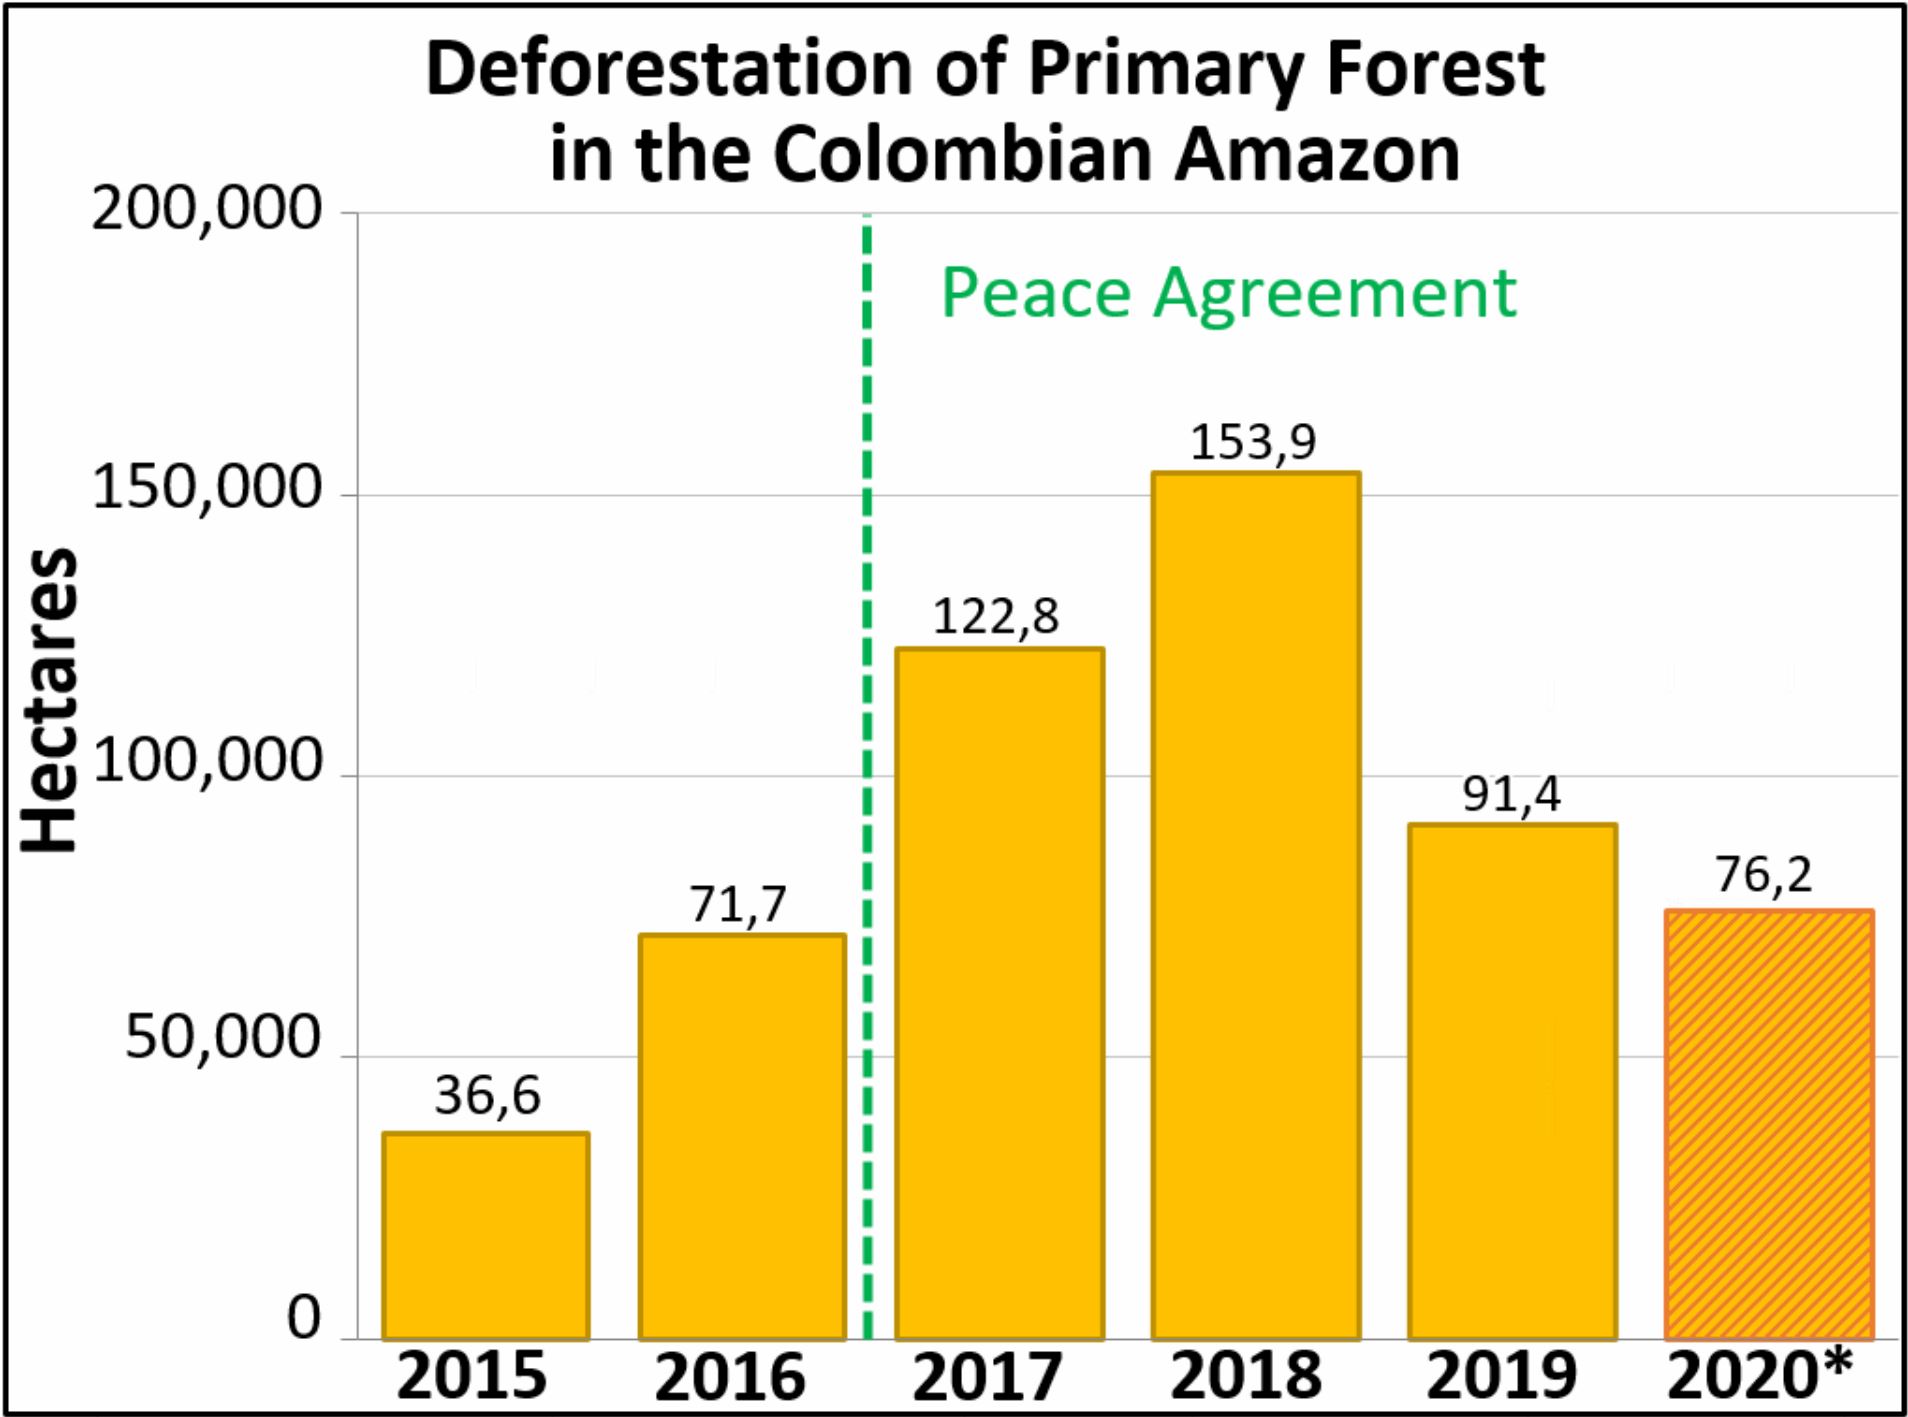
On the positive side, primary forest loss decreased in the Colombian Amazon (91,400 hectares) following a major spike following the 2016 peace accords (between the government and FARC). It is worth noting, however, that we have now documented the loss of 444,000 hectares (over a million acres) of primary forest in the Colombian Amazon in the past four years since the peace agreement (see Annex).

*Two important points about the data. First, we use annual forest loss from the University of Maryland to have a consistent source across all five countries. Second, we applied a filter to only include loss of primary forest (see Methodology).

2019 Deforestation Hotspots Map

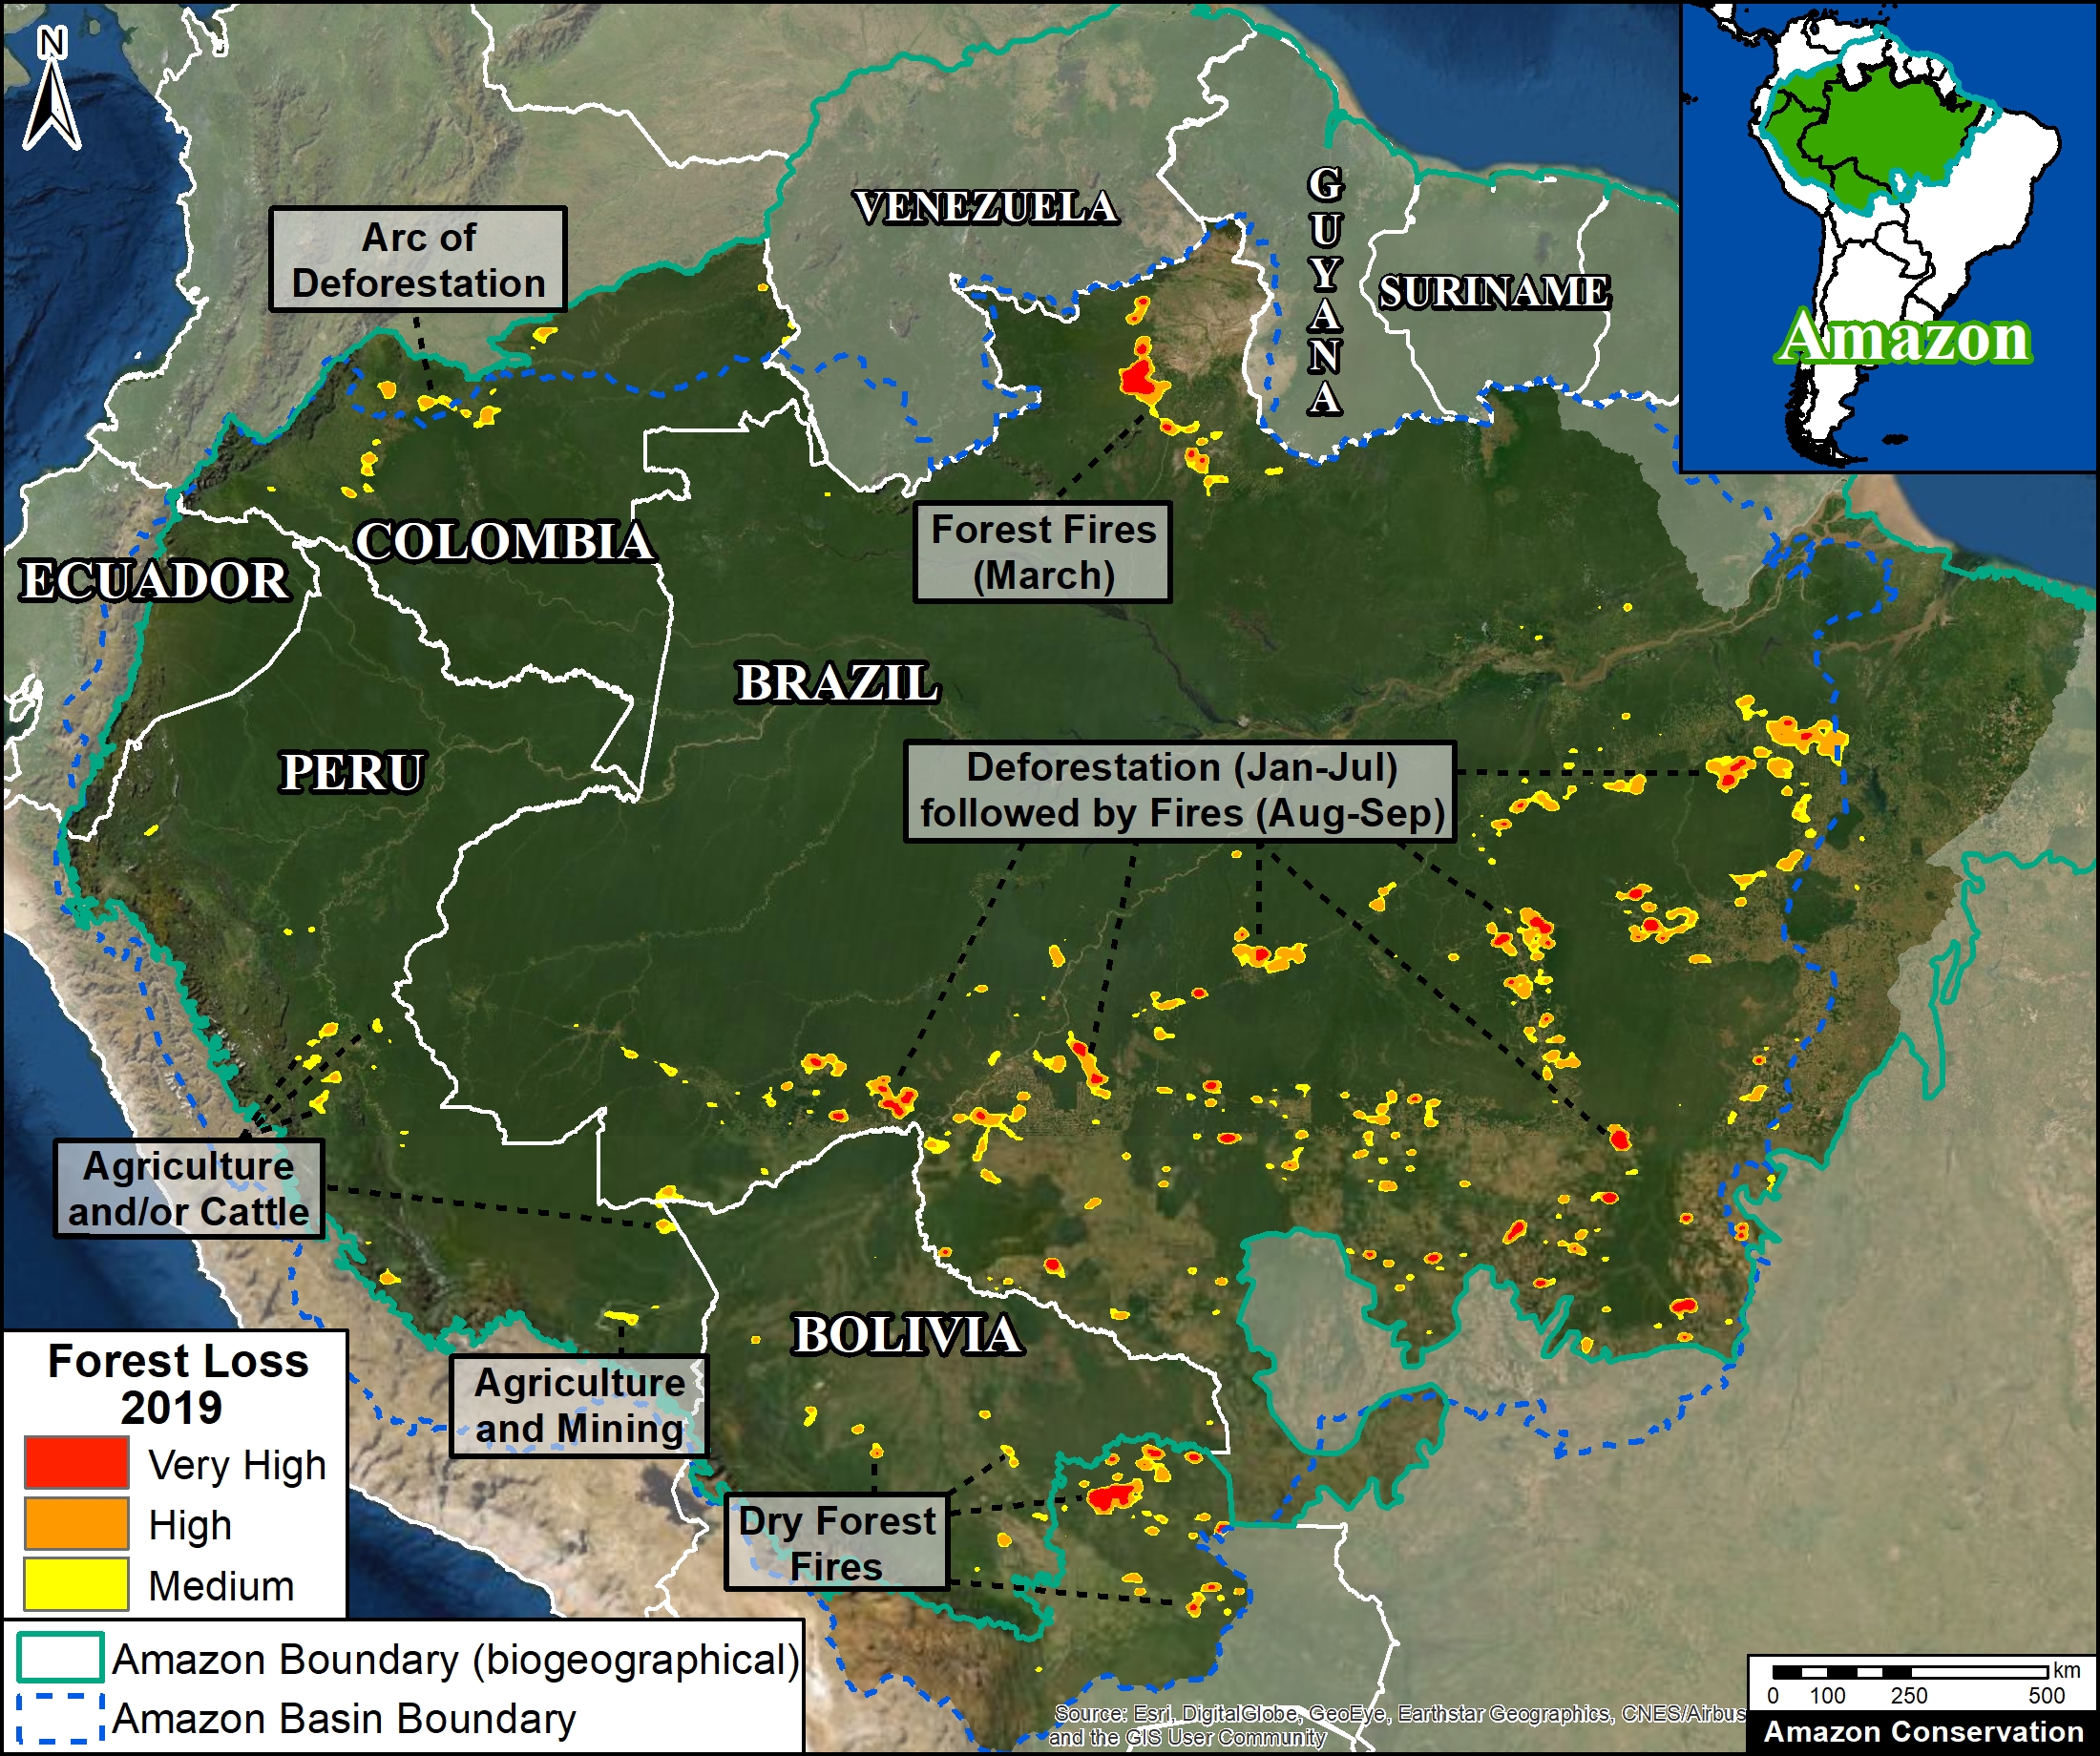
The Base Map below shows the major 2019 deforestation hotspots across the Amazon.
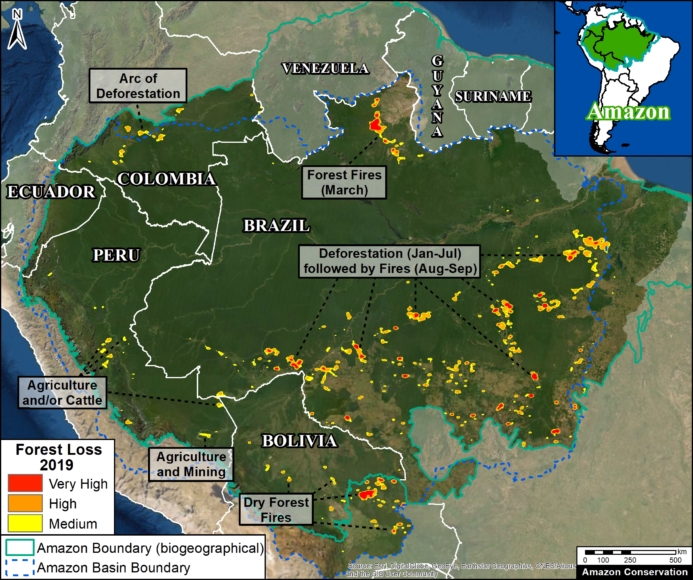
2019 deforestation hotspots across the Amazon. Data: Hansen/UMD/Google/USGS/NASA, MAAP.

Many of the major deforestation hotspots were in Brazil. Early in the year, in March, there were uncontrolled fires up north in the state of Roraima. Further south, along the Trans-Amazonian Highway, much of the deforestation occurred in the first half of the year, followed by the high profile fires starting in late July. Note that many of these fires were burning recently deforested areas, and were not uncontrolled forest fires (MAAP #113).

The Brazilian Amazon also experienced escalating gold mining deforestation in indigenous territories (MAAP #116).

Bolivia also had an intense 2019 fire season. Unlike Brazil, many were uncontrolled fires, particularly in the Beni grasslands and Chiquitano dry forests of the southern Bolivian Amazon (MAAP #108).

In Peru, although illegal gold mining deforestation decreased (MAAP #121), small-scale agriculture (including cattle) continues to be a major driver in the central Amazon (MAAP #112) and an emerging driver in the south.

In Colombia, there is an “arc of deforestation” in the northwestern Amazon. This arc includes four protected areas (Tinigua, Chiribiquete and Macarena National Parks, and Nukak National Reserve) and two Indigenous Reserves (Resguardos Indígenas Nukak-Maku and Llanos del Yari-Yaguara II) experiencing substantial deforestation (MAAP #120). One of the main deforestation drivers in the region is conversion to pasture for land grabbing or cattle ranching.

Annex – Colombia peace accord trend
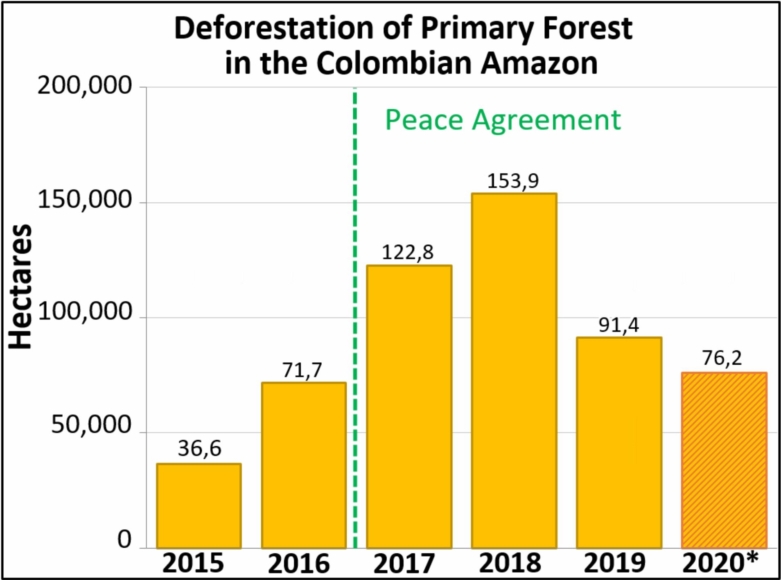
Annex 1. Deforestation of primary forest in the Colombian Amazon, 2015-20. Data: Hansen/UMD/Google/USGS/NASA, UMD/GLAD. *Until May 2020

Methodology

The baseline forest loss data presented in this report were generated by the Global Land Analysis and Discovery (GLAD) laboratory at the University of Maryland (Hansen et al 2013) and presented by Global Forest Watch. Our study area is strictly what is highlighted in the Base Map.

For our estimate of primary forest loss, we used the annual “forest cover loss” data with density >30% of the “tree cover” from the year 2001. Then we intersected the forest cover loss data with the additional dataset “primary humid tropical forests” as of 2001 (Turubanova et al 2018). For more details on this part of the methodology, see the Technical Blog from Global Forest Watch (Goldman and Weisse 2019).

For boundaries, we used the biogeographical limit (as defined by RAISG) for all countries except Bolivia, where we used the Amazon watershed limit (see Base Map).

All data were processed under the geographical coordinate system WGS 1984. To calculate the areas in metric units, the projection was: Peru and Ecuador UTM 18 South, Bolivia UTM 20 South, Colombia MAGNA-Bogotá, and Brazil Eckert IV.

Lastly, to identify the deforestation hotspots, we conducted a kernel density estimate. This type of analysis calculates the magnitude per unit area of a particular phenomenon, in this case forest cover loss. We conducted this analysis using the Kernel Density tool from Spatial Analyst Tool Box of ArcGIS. We used the following parameters:

Search Radius: 15000 layer units (meters)
Kernel Density Function: Quartic kernel function
Cell Size in the map: 200 x 200 meters (4 hectares)
Everything else was left to the default setting.

For the Base Map, we used the following concentration percentages: Medium: 7%-10%; High: 11%-20%; Very High: >20%.

References

Goldman L, Weisse M (2019) Explicación de la Actualización de Datos de 2018 de Global Forest Watch. https://blog.globalforestwatch.org/data-and-research/blog-tecnico-explicacion-de-la-actualizacion-de-datos-de-2018-de-global-forest-watch

Hansen, M. C., P. V. Potapov, R. Moore, M. Hancher, S. A. Turubanova, A. Tyukavina, D. Thau, S. V. Stehman, S. J. Goetz, T. R. Loveland, A. Kommareddy, A. Egorov, L. Chini, C. O. Justice, and J. R. G. Townshend. 2013. “High-Resolution Global Maps of 21st-Century Forest Cover Change.” Science 342 (15 November): 850–53. Data available on-line from: http://earthenginepartners.appspot.com/science-2013-global-forest.

Turubanova S., Potapov P., Tyukavina, A., and Hansen M. (2018) Ongoing primary forest loss in Brazil, Democratic Republic of the Congo, and Indonesia. Environmental Research Letters  https://doi.org/10.1088/1748-9326/aacd1c 

Acknowledgements

We thank G. Palacios for helpful comments to earlier versions of this report.

This work was supported by the following major funders: Norwegian Agency for Development Cooperation (NORAD), Gordon and Betty Moore Foundation, International Conservation Fund of Canada (ICFC), Metabolic Studio, Erol Foundation, MacArthur Foundation, and Global Forest Watch Small Grants Fund (WRI).

Citation

Finer M, Mamani N (2020) 2019 Amazon Deforestation. MAAP: 122.
MAAP #121: Reduction of Illegal Gold Mining in the Peruvian Amazon

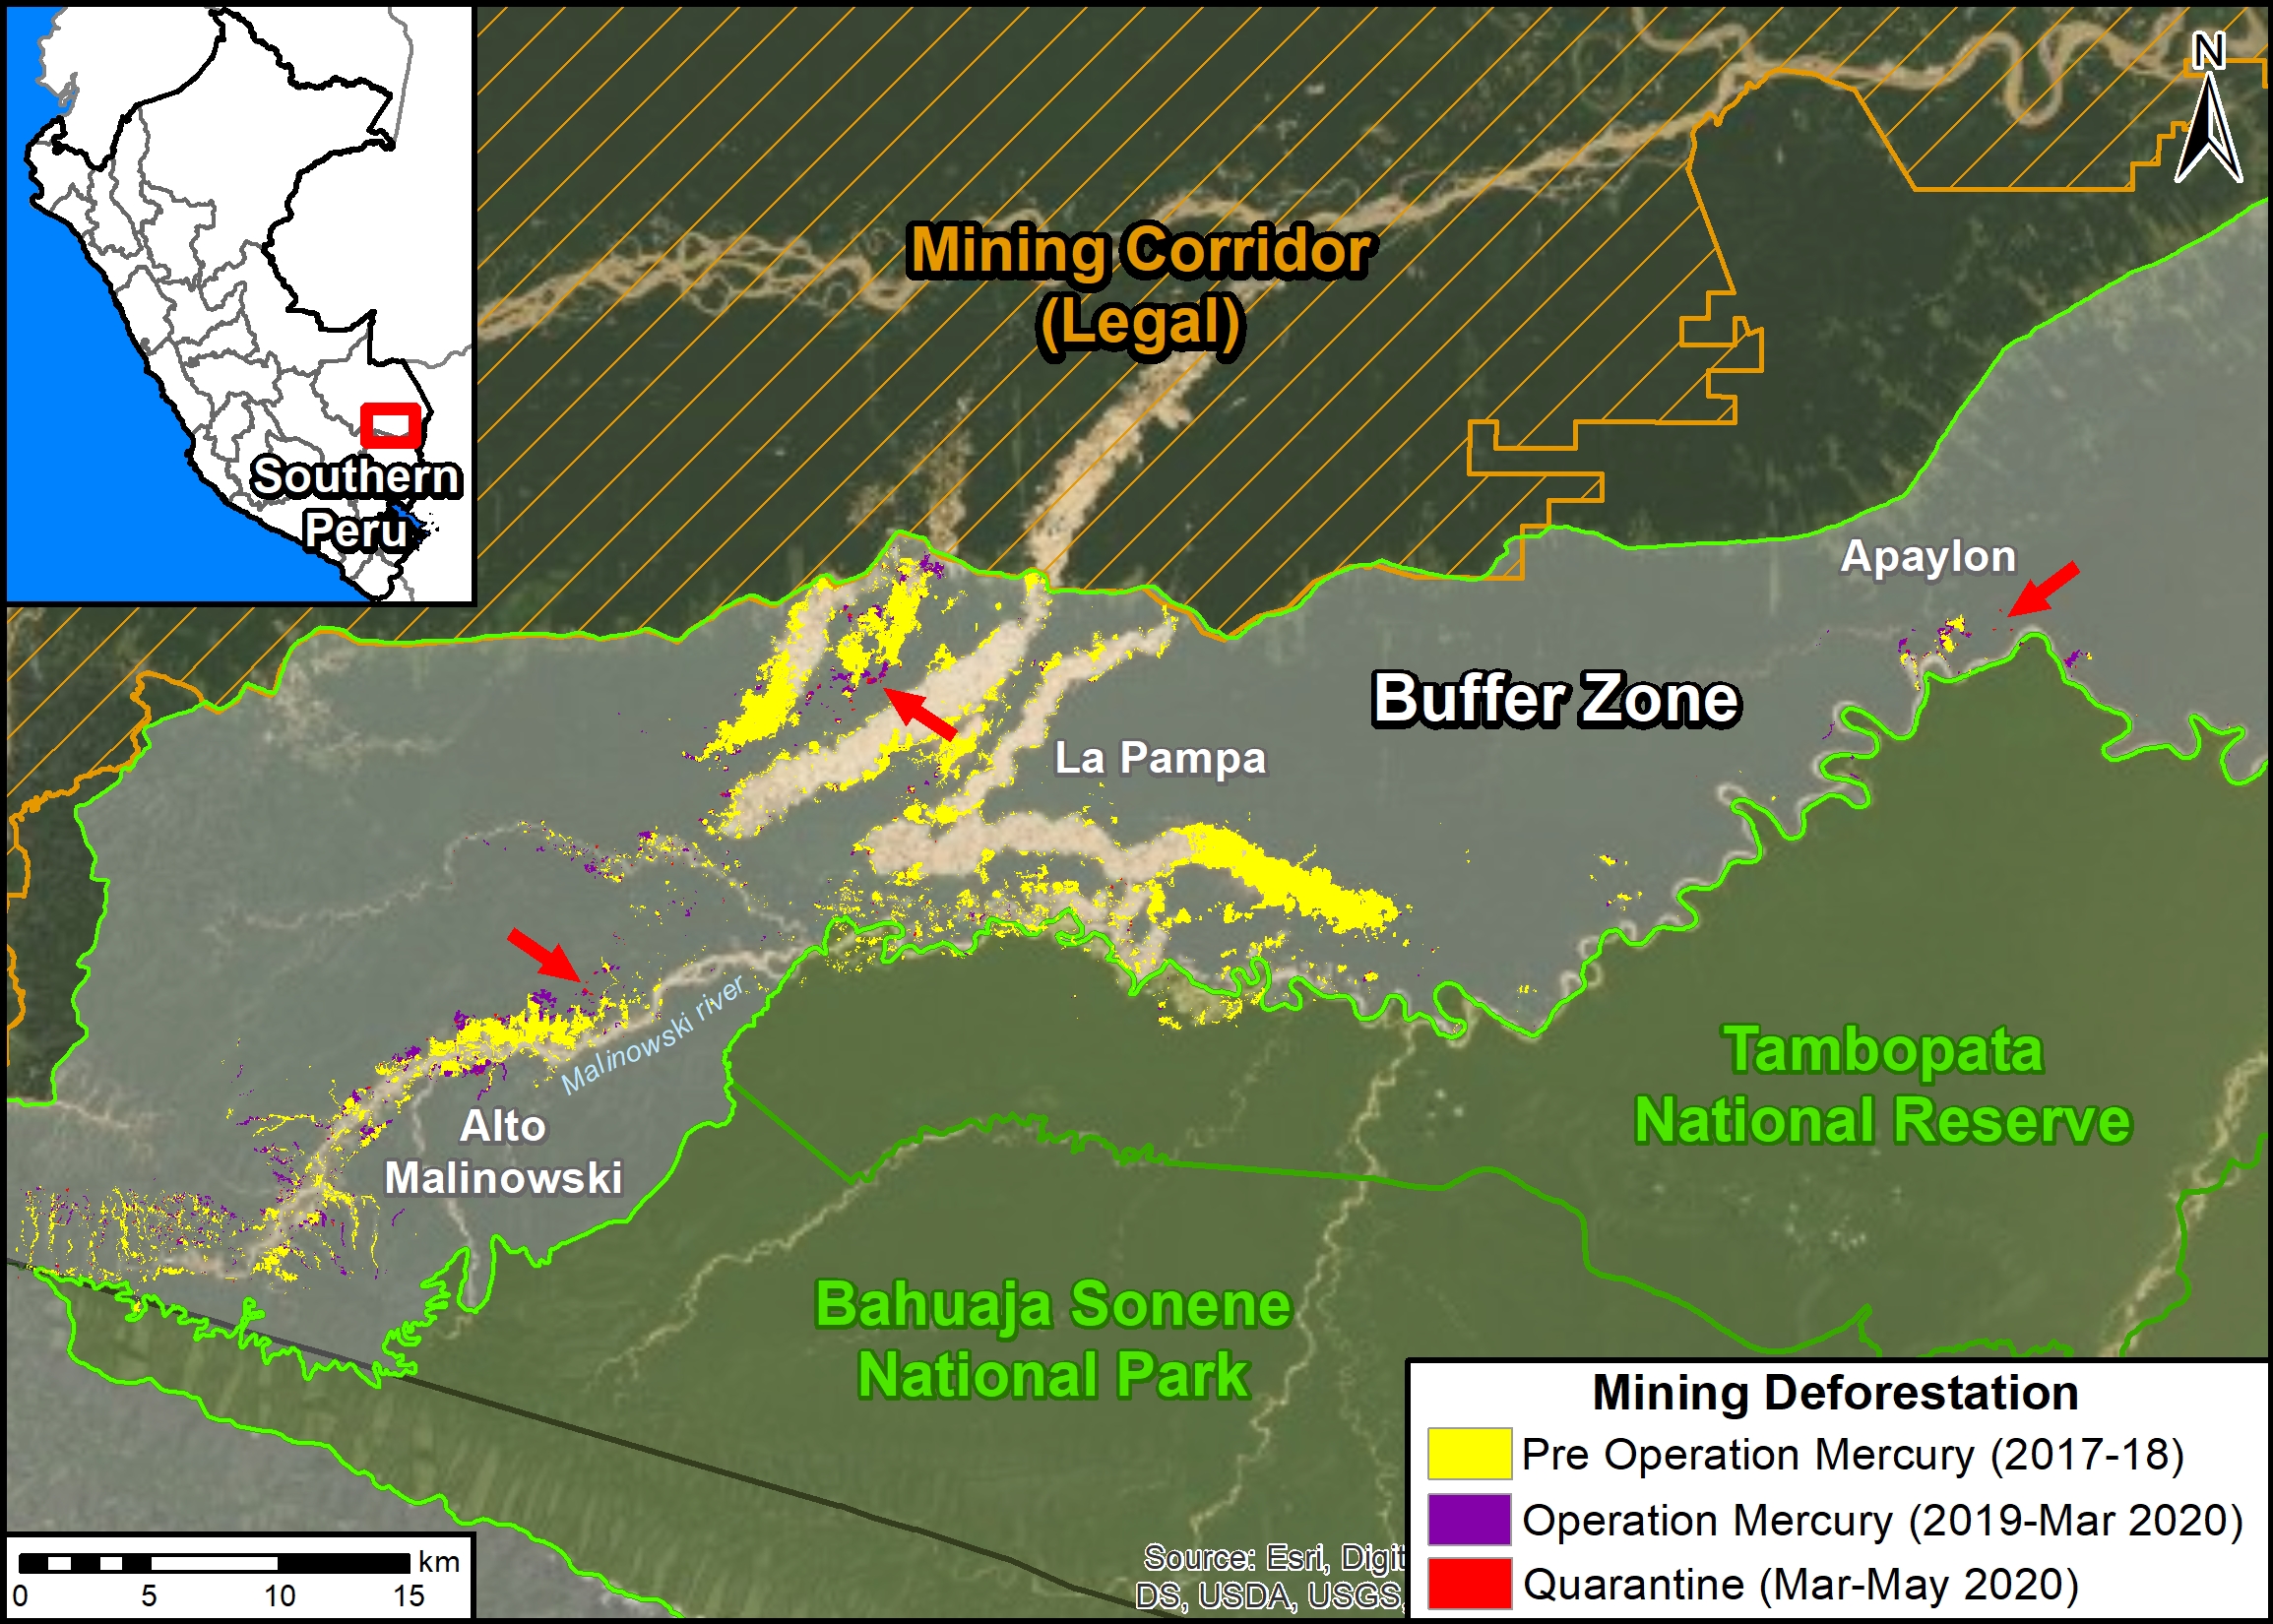
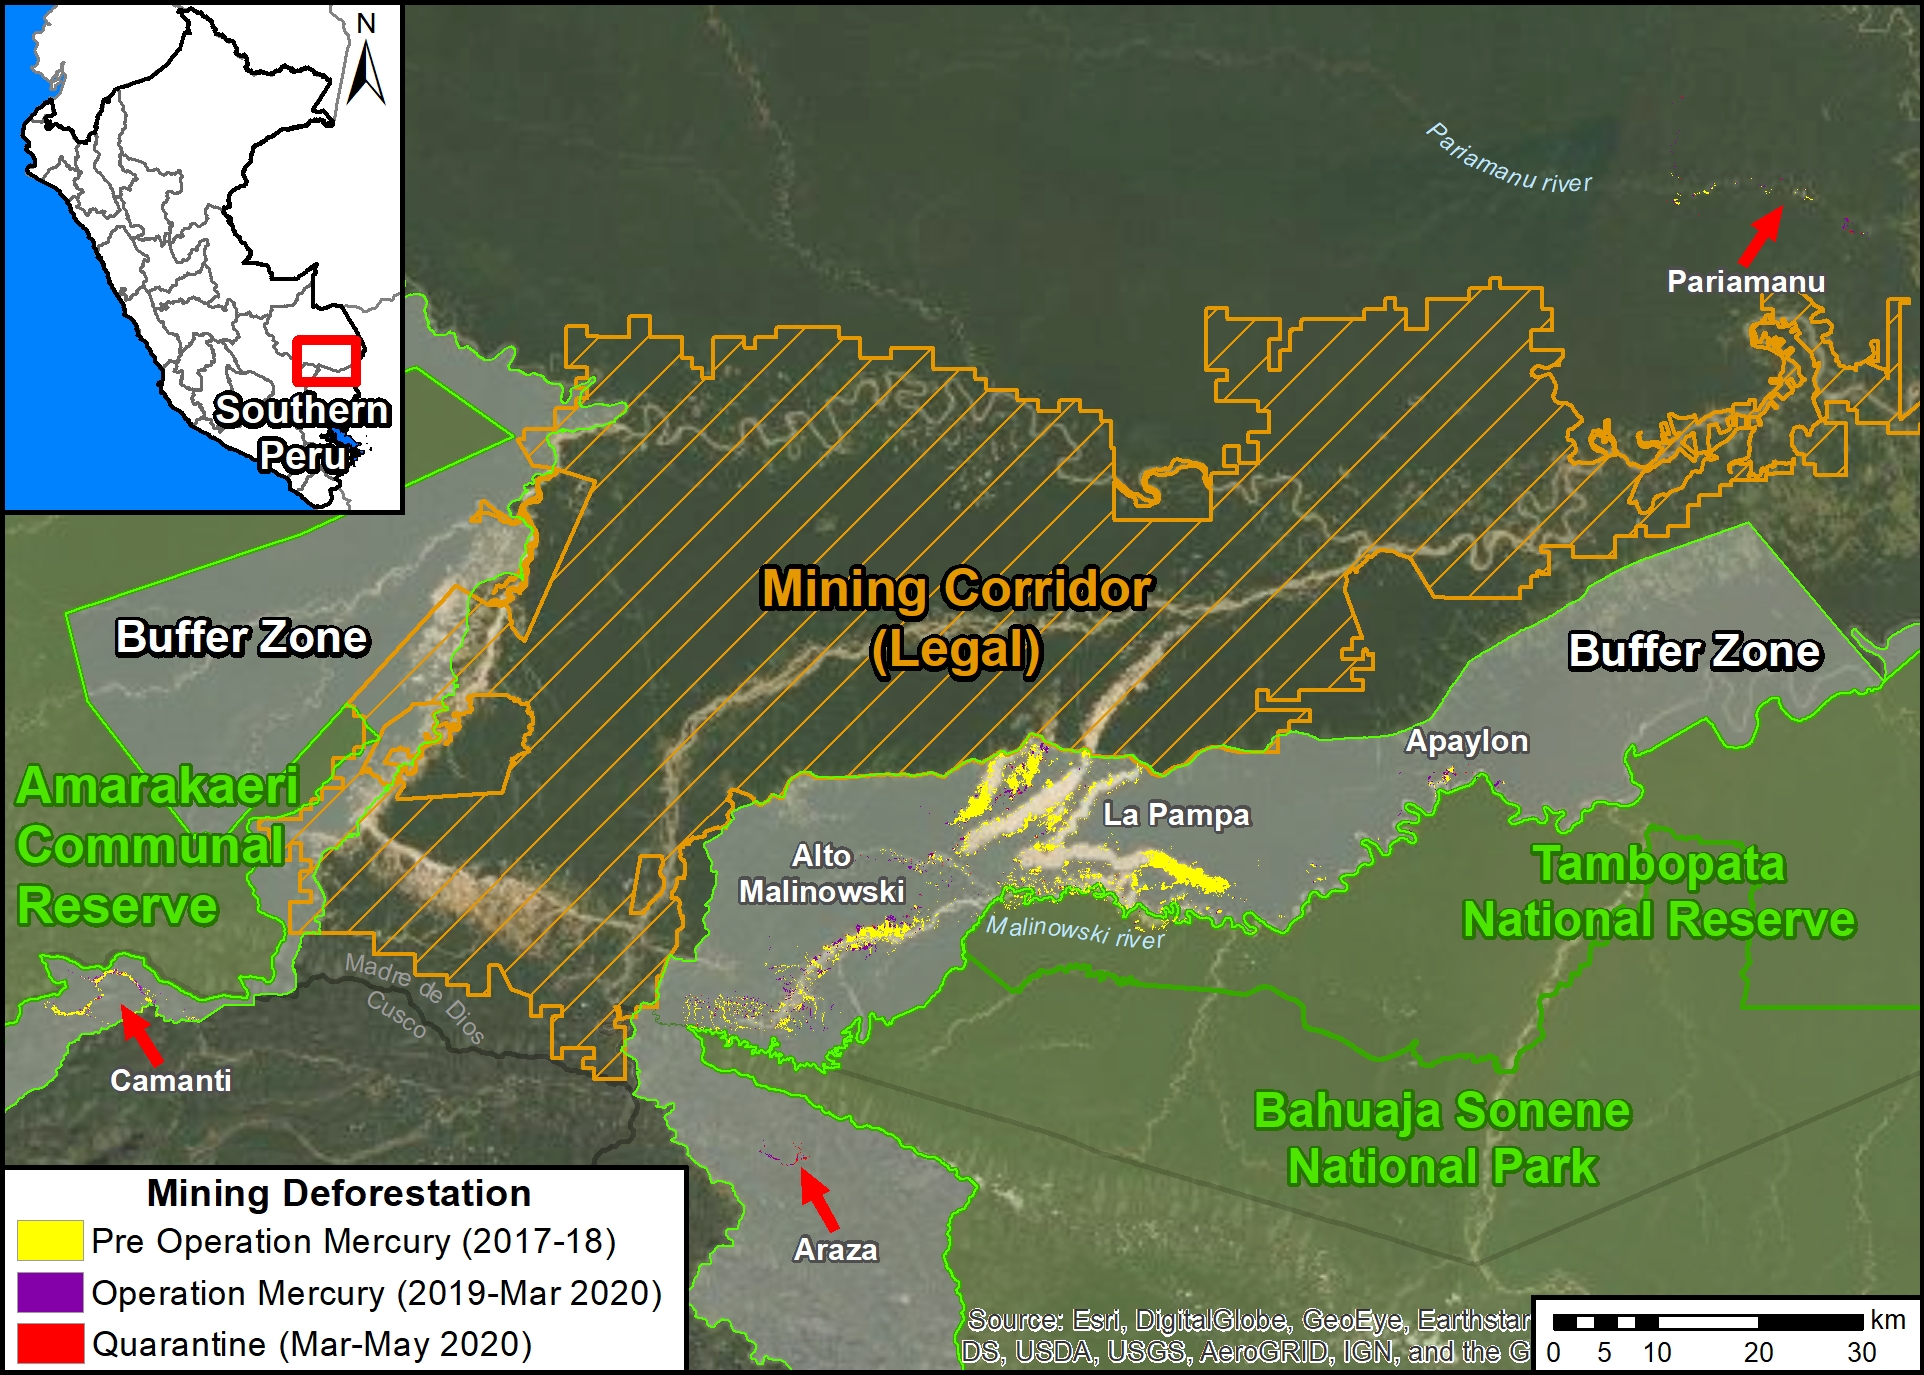
Base Map. Illegal gold mining deforestacion in the protected area buffer zones of the southern Peruvian Amazon, 2017-2019. Data: MAAP.

Thanks to the support of the USAID, via the Prevent Project, dedicated to the prevention and combat of environmental crimes in the Amazon, we conducted a detailed analysis of recent illegal gold mining deforestation in the southern Peruvian Amazon.

The objective is to understand the trends from early 2017 to June 2020 (which includes the first part of the mandatory quarantine issued by the Peruvian government as of March 16, 2020 due to the coronavirus pandemic).

We focus on the buffer zones of two protected areas in the Madre de Dios region: Tambopata National Reserve and Bahuaja Sonene National Park (see Base Map).*

This area includes La Pampa, the current highest intensity illegal mining zone in the country. In February 2019, the Peruvian government launched Operation Mercury  to confront the illegality in La Pampa and surrounding areas.

The Base Map shows that gold mining deforestation in La Pampa decreased over 90% following Operation Mercury.

However, illegal gold mining does continue after Operation Mercury (including during the coronavirus state of emergency), but at lower rates. Thus, current snapshots may be misleading and recent context is important.

On the Base Map, the red arrows indicate the areas with the most recent illegal activity (click the image to enlarge). See below for more details.

Main Results

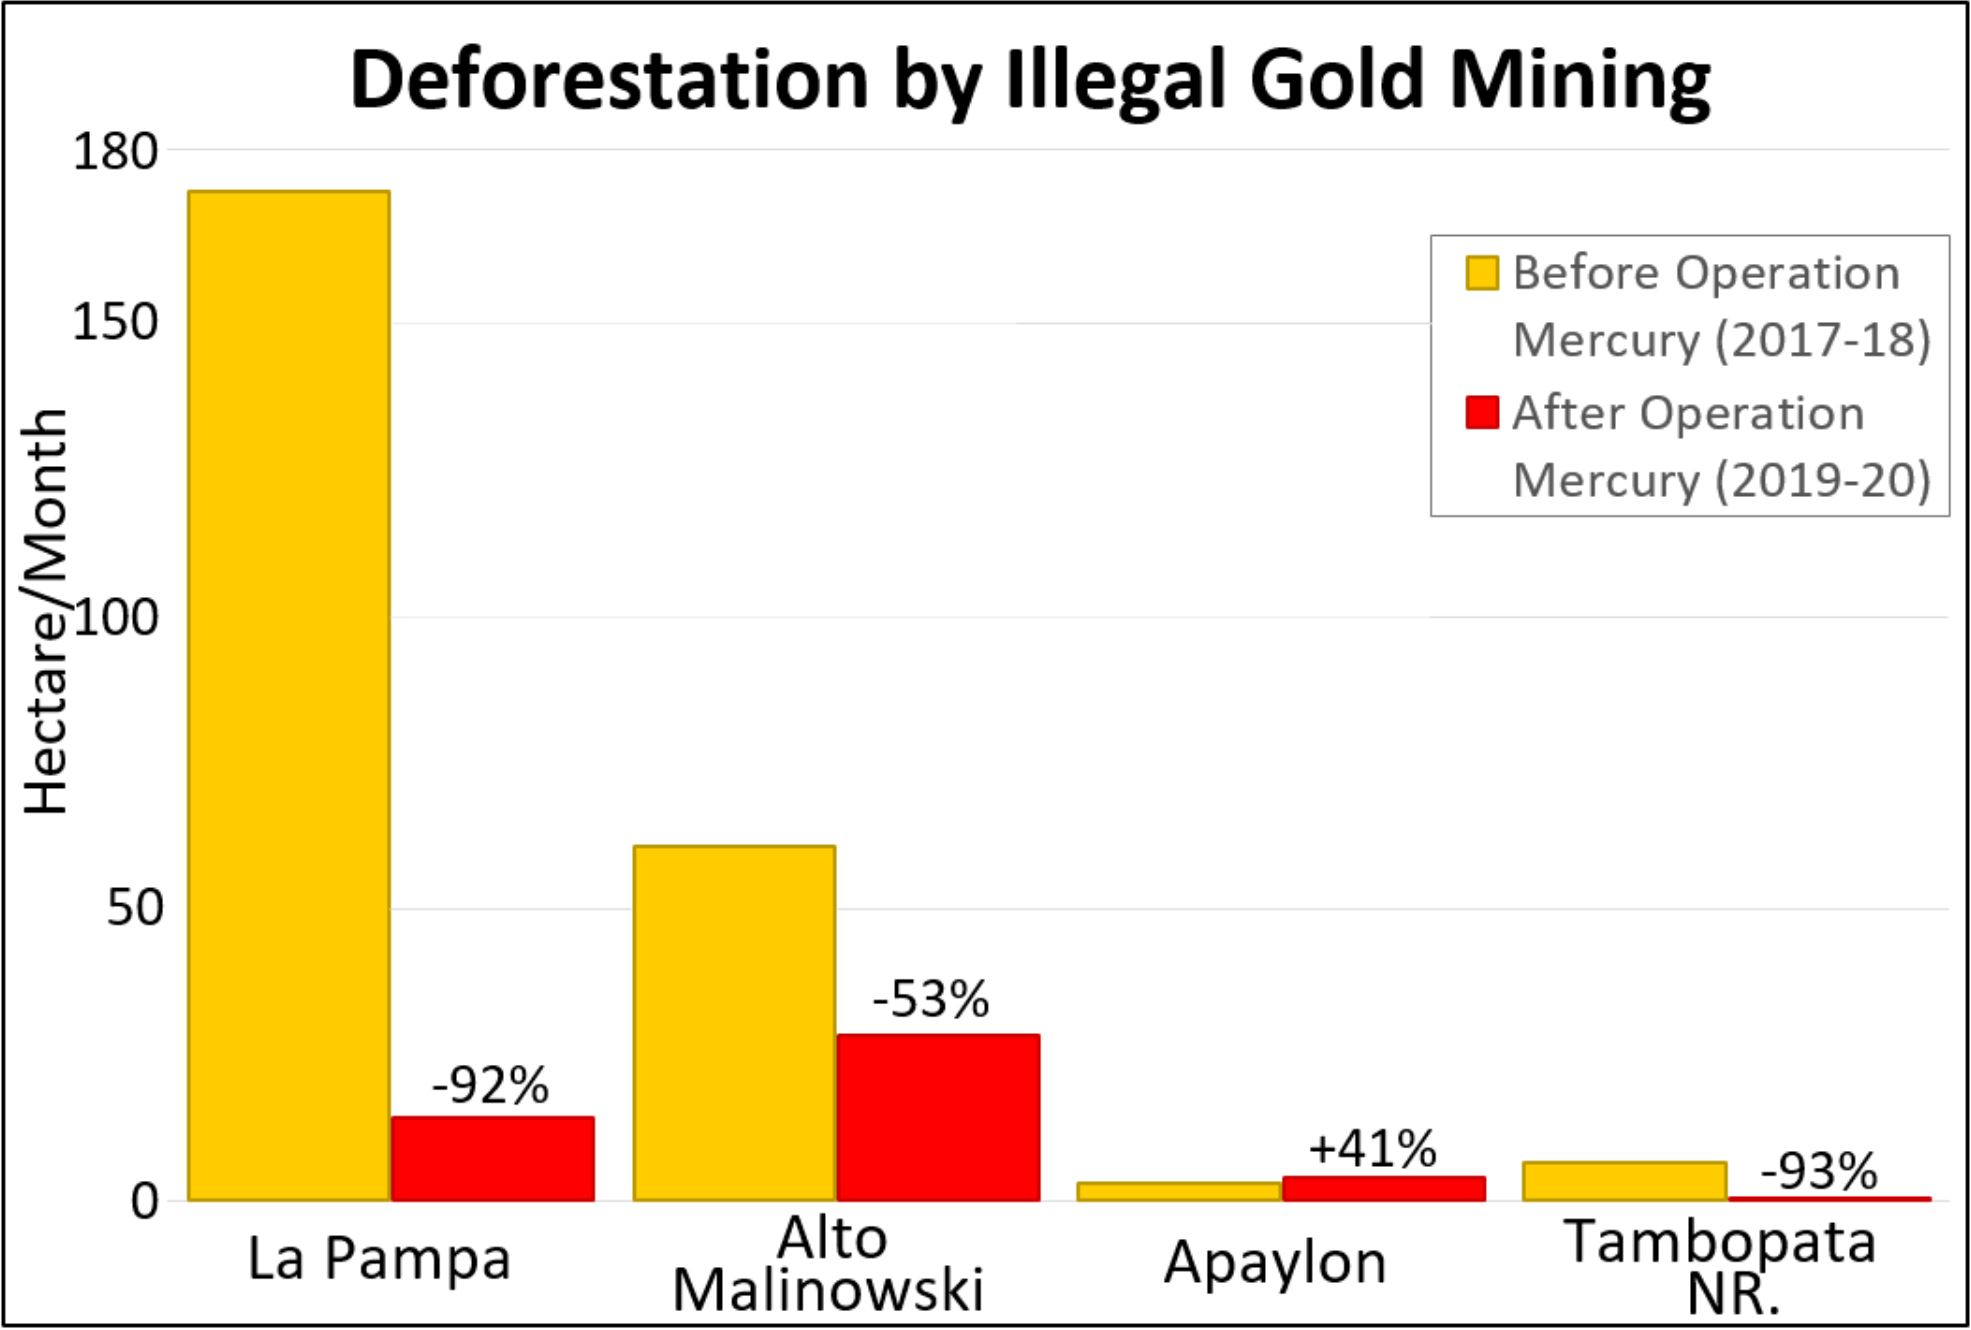
Table 1. Illegal gold mining deforestation before (yellow) and after (red) Operation Mercury in the buffer zones of Madre de Dios. Data: MAAP.

The Base Map and Table 1 illustrate the following key results:

  • In La Pampa, we documented mining deforestation of 173 hectares (428 acres) per month before Operation Mercury (January 2018 – February 2019). After the intervention, deforestation was reduced to 14 hectares (36 acres) per month (March 2019 – May 2020), a decrease of 92%.
    .
  • Upstream, in the Alto Malinowski, we documented the mining deforestation of 61 hectares (150 acres) per month before Operation Mercury. After the intervention, deforestation was reduced to 28 hectares (69 acres) per month, a decrease of 53%.
    .
  • Downstream, in the Apaylon area, we documented the mining deforestation of 2.9 hectares (7 acres) per month, before Operation Mercury. After the intervention, deforestation increased to 4 hectares (10 acres) per month, an increase of 41%. Apaylon is main area in the buffer zone where deforestation has increased.
    .
  • Within Tambopata National Reserve, we documented the mining deforestation of 6.5 hectares (16 acres) per month, before Operation Mercury. After the intervention, deforestation was reduced to 0.5 hectares (1.2 acres) per month, a decrease of 93%.
    .
  • Overall, illegal gold mining does continue in the buffer zones of Madre de Dios, but at lower rates than the previous two years. We documented the gold mining deforestation of 797 hectares (1,670 acres) after Operation Mercury.
    .
  • Regarding the speculation that illegal activity would increase during the coronavirus pandemic, we have not documented any major increase or surge in the buffer zones of Madre de Dios.* Illegal mining does continue, however, we documented the deforestation of 80 hectares (198 acres) during the quarantine.
    .

Reduction of 90% in La Pampa

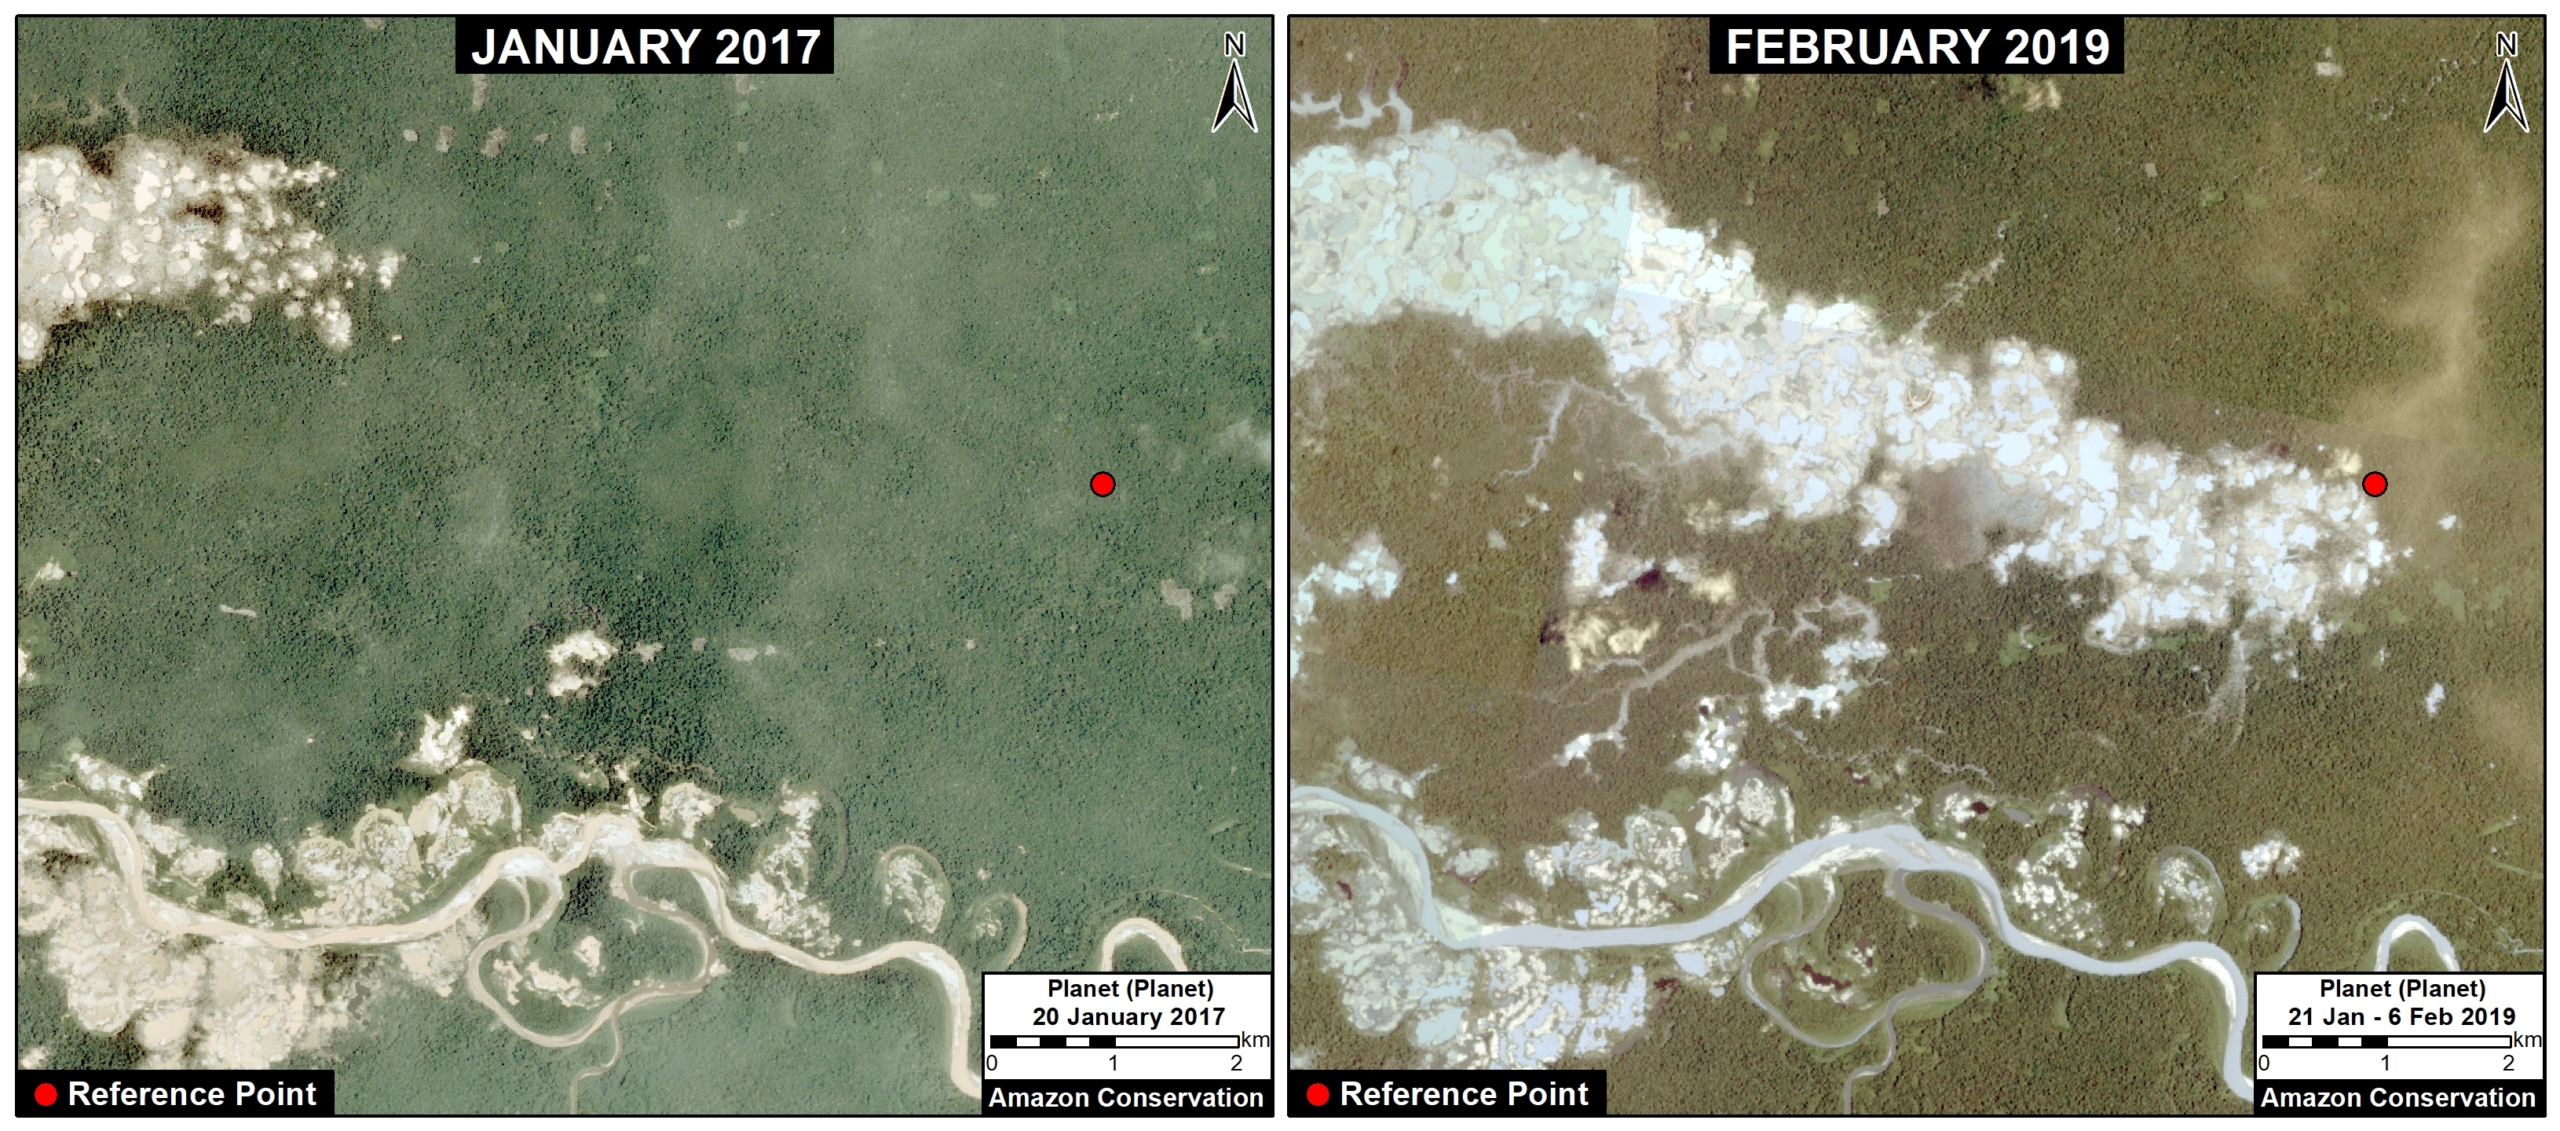
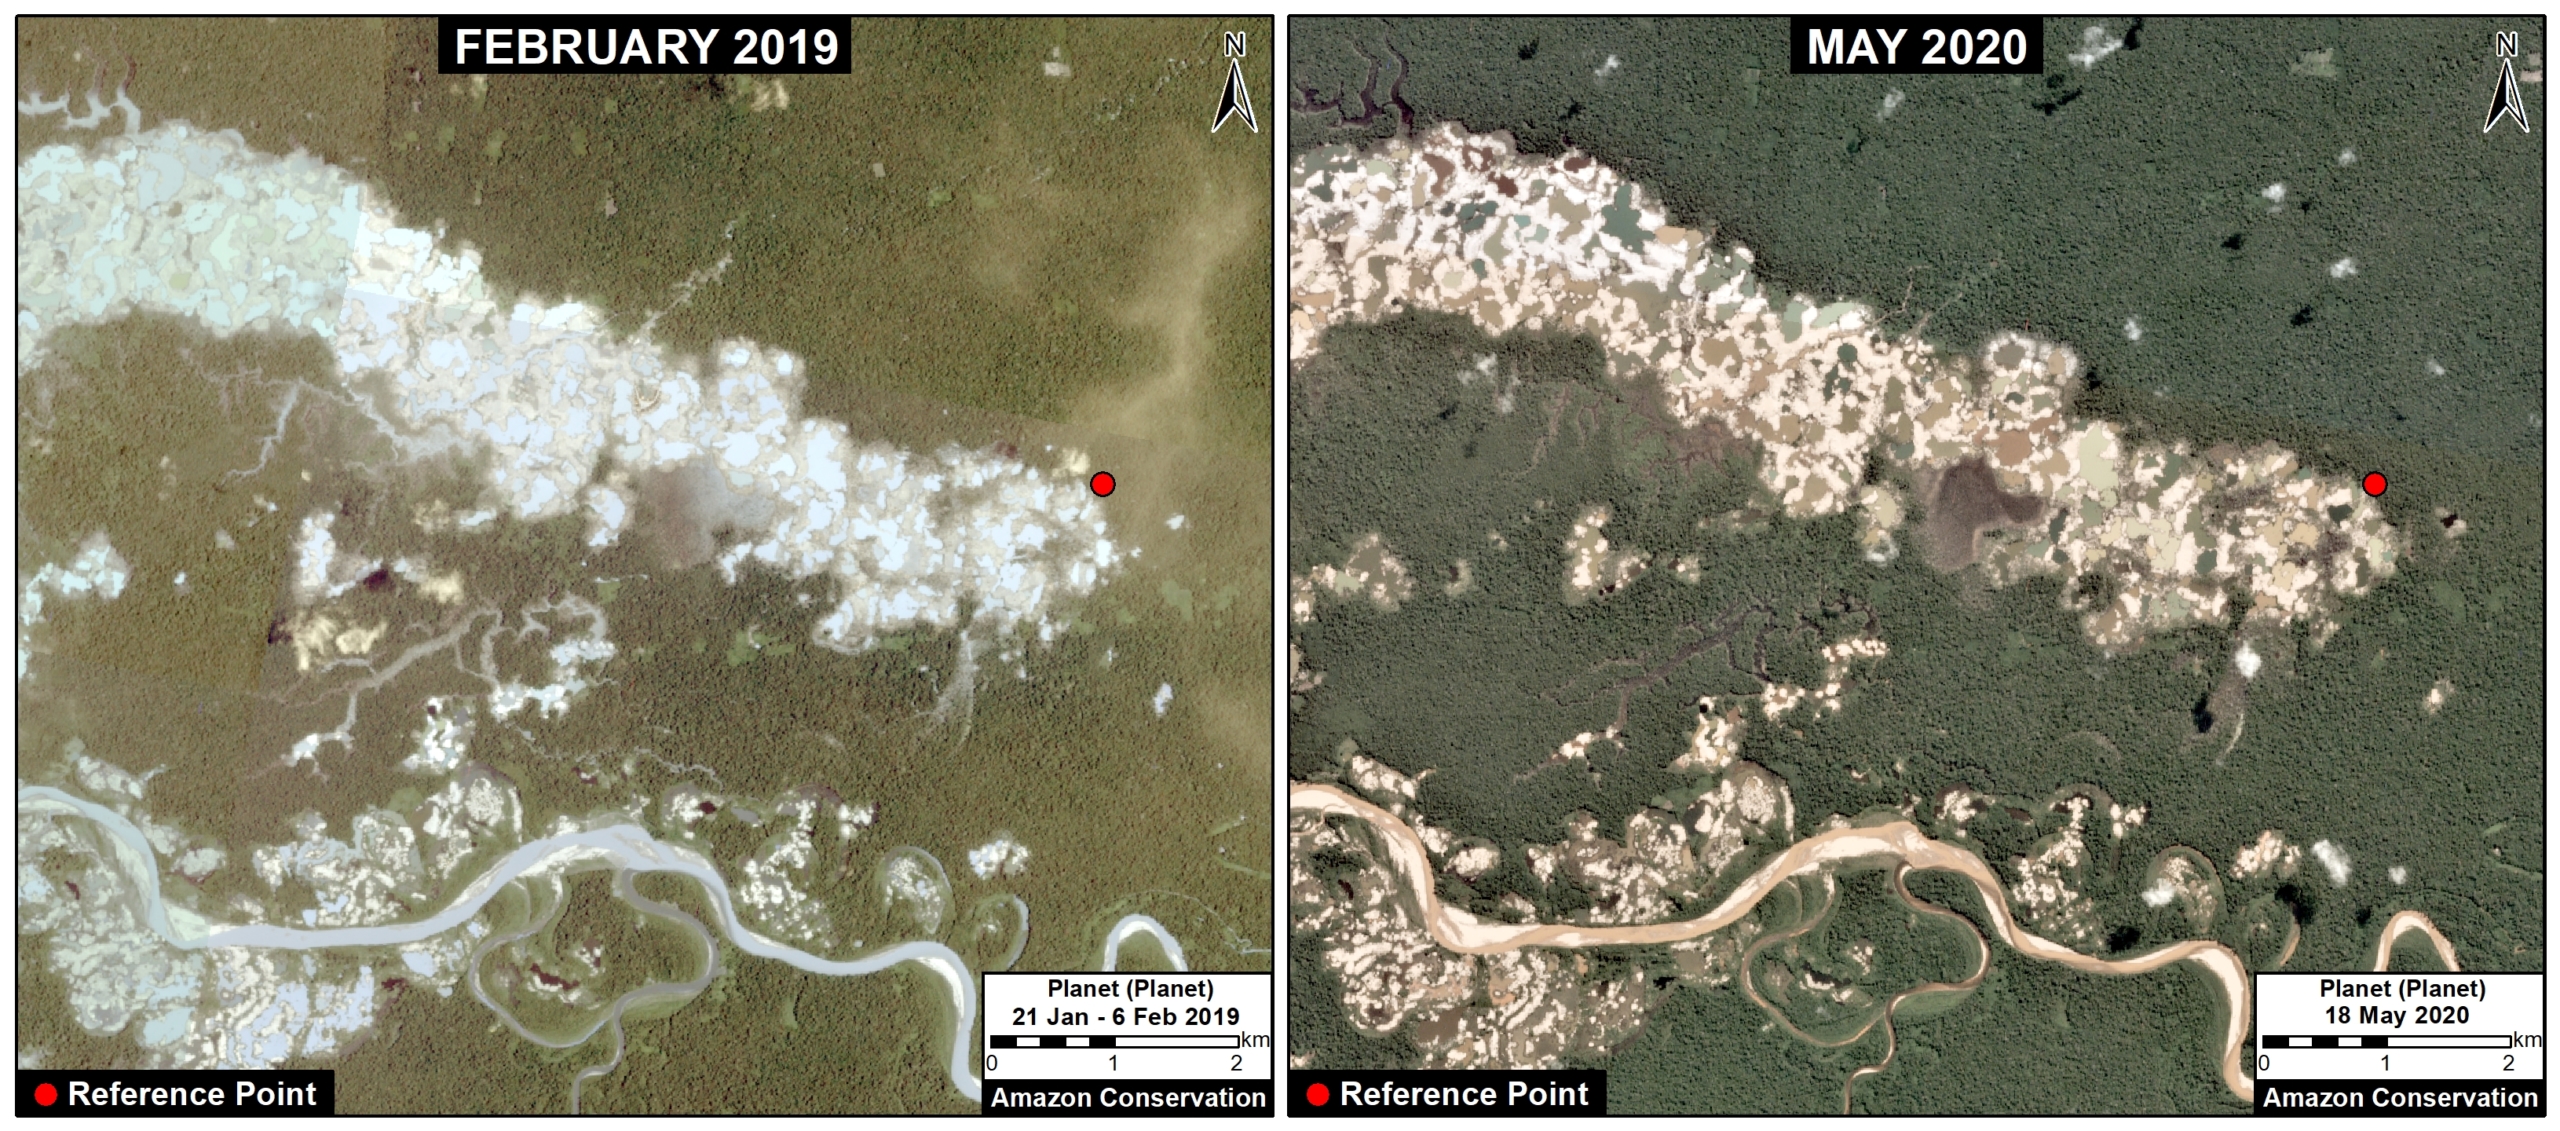
The following images show the major decrease in gold mining deforestation in La Pampa after Operation Mercury. Image 1 shows the rapid deforestation before Operation Mercury, between January 2017 (left panel) and February 2019 (right panel). Image 2 shows how the deforestation decreased after Operation Mercury, between February 2019 (left panel) and May 2020 (right panel). The red dot represents a reference point between the images.

Image 1. Rapid gold mining deforestation in La Pampa before Operation Mercury, between January 2017 (left panel) and February 2019 (right panel). Data: Planet.
Image 2. Mining deforestation decreased in La Pampa after Operation Mercury, between February 2019 (left panel) and May 2020 (right panel). Data: Planet.
Displaced Miners?

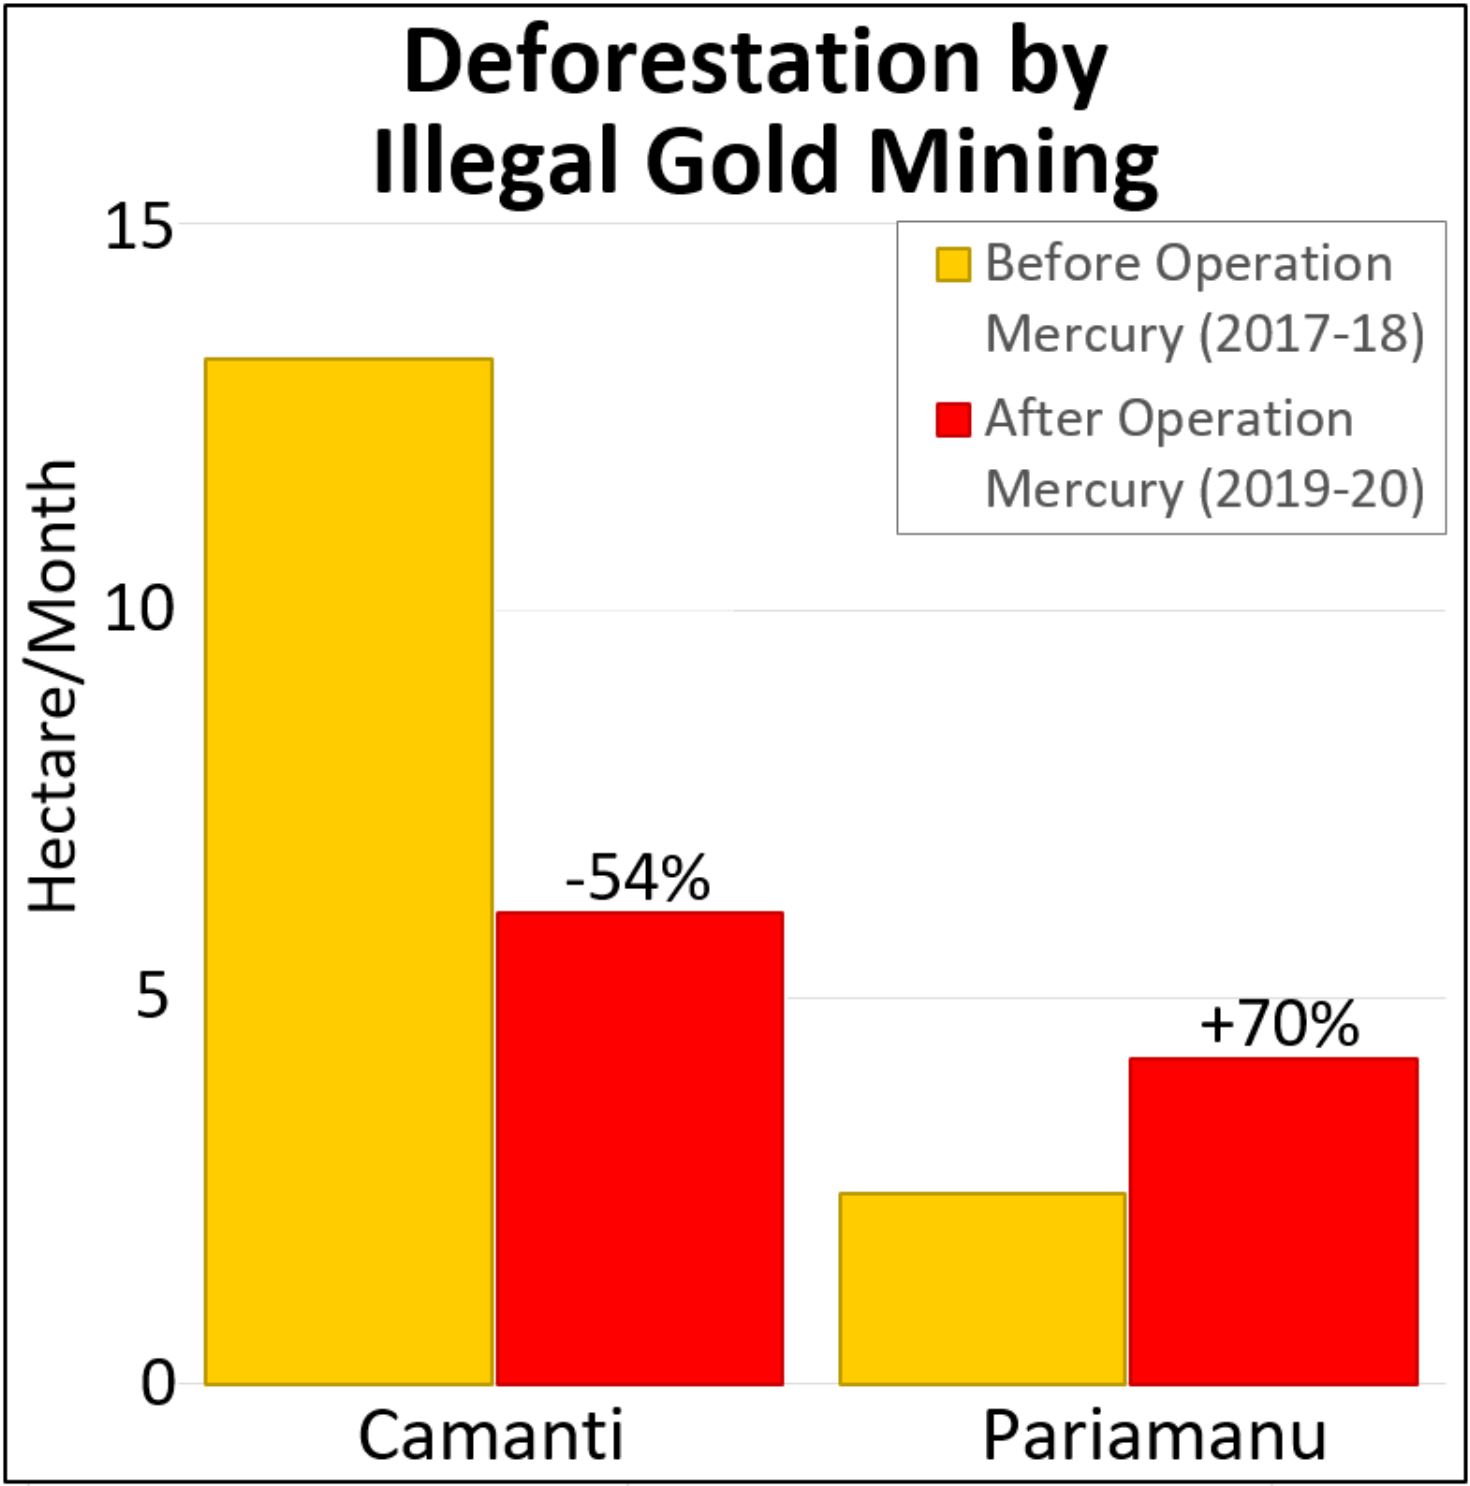
Table 2. Deforestation by illegal gold mining before (yellow) and after (red) Operation Mercury in two other threatened areas. Data: MAAP.

There has also been speculation that the focus of Operation Mercury in La Pampa would lead to illegal miners moving to other areas.* Base Map 2 shows two of the most threatened areas: Camanti and Pariamanu.

These are the main results for these two areas:

  • In Camanti (located in the buffer zone of Amarakaeri Communal Reserve), we documented the gold mining deforestation of 13.3 hectares (33 acres) per month before Operation Mercury. After the intervention, deforestation was reduced to 6.1 hectares (15 acres) per month, a decrease of 54%.
    .
  • In Pariamanu, we documented  the mining deforestation of 2.5 hectares (6 acres) per month before Operation Mercury. After the intervention, it increased to 4.2 hectares (10 acres) per month, an increase of 70%.
    .
  • In summary, illegal gold mining continues in these two areas outside La Pampa. We documented the mining deforestation of 175 hectares (432 acres) after Operation Mercury (including 22 hectares during the pandemic). There is some evidence that miners are being displaced to Pariamanu, but there has not been a surge in Camanti.
Base Map 2. Main mining areas in the south of the Peruvian Amazon. Click to enlarge image.

Statement of the Peruvian Protected Area Agency (SERNANP)

El Servicio Nacional de Áreas Naturales Protegidas por el Estado (SERNANP) nos ha comunicado lo siguiente:

  • La actividad de control y vigilancia en la Reserva Nacional Tambopata es permanente y las autoridades (SERNANP, Policía Nacional del Perú, Fiscalías Especializadas en Materia Ambiental, y Marina de Guerra del Perú) continúan interviniendo a todas las actividades de minería ilegal, manteniendo el 100%.
  • Las zonas de amortiguamiento son espacios que están sujetos a la intervención de las autoridades de la Operación Mercurio (no del SERNANP). Se han realizado intervenciones continuas e interdicciones tanto en  las zonas indicadas en el reporte, como en Apaylon y Camanti.
    ,
  • Cabe mencionar que la Operación Mercurio, durante el 2019 y sobre todo en el 2020 (Incluyendo el período de cuarentena) ha ampliado sus operativos mas allá de la Pampa, lo cual explica porque en Camanti las cifras también se ha reducido.  En el segundo semestre de 2020 y en el 2021, se espera que los operativos es amplíen a otras zonas de Madre de Dios.

*Notes

Acknowledgments

We thank R. Segura, M. Castro, E. Ortiz, M. Silman, M. E. Gutierrez, S. Novoa, H. Balbuena, M. Allemant, and G. Palacios for their helpful comments on this report.

This report was conducted with technical assistance from USAID, via the Prevent project. Prevent is an initiative that, over the next 5 years, will work with the Government of Peru, civil society, and the private sector to prevent and combat environmental crimes in Loreto, Ucayali and Madre de Dios, in order to conserve the Peruvian Amazon.

This publication is made possible with the support of the American people through USAID. Its content is the sole responsibility of the authors and does not necessarily reflect the views of USAID or the US government.

Citation

Finer M, Mamani N (2020) Reduction of Illegal Gold Mining in the Peruvian Amazon. MAAP:

Fire Alert vs. Aerosol Emission Data

Fire Alert vs. Aerosol Emission Data

This slider shows us how aerosol emission data allows users to prioritize hundreds (or thousands) of heat-based fire alerts. In other words, the aerosol data indicates just the fires that are  actually burning lots of biomass and putting out abundant smoke.

[twenty20 img1=”9170″ img2=”9169″ offset=”0.5″]

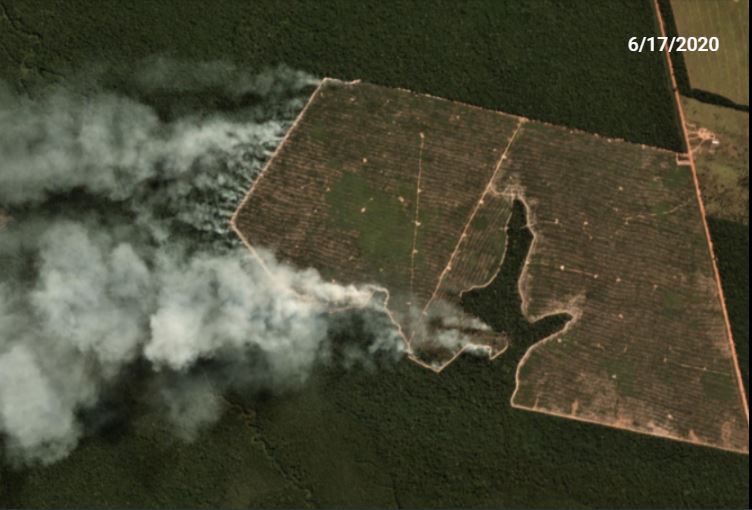
Amazon Fire Tracker 2020: Brazil #4 (June 17, 2020)

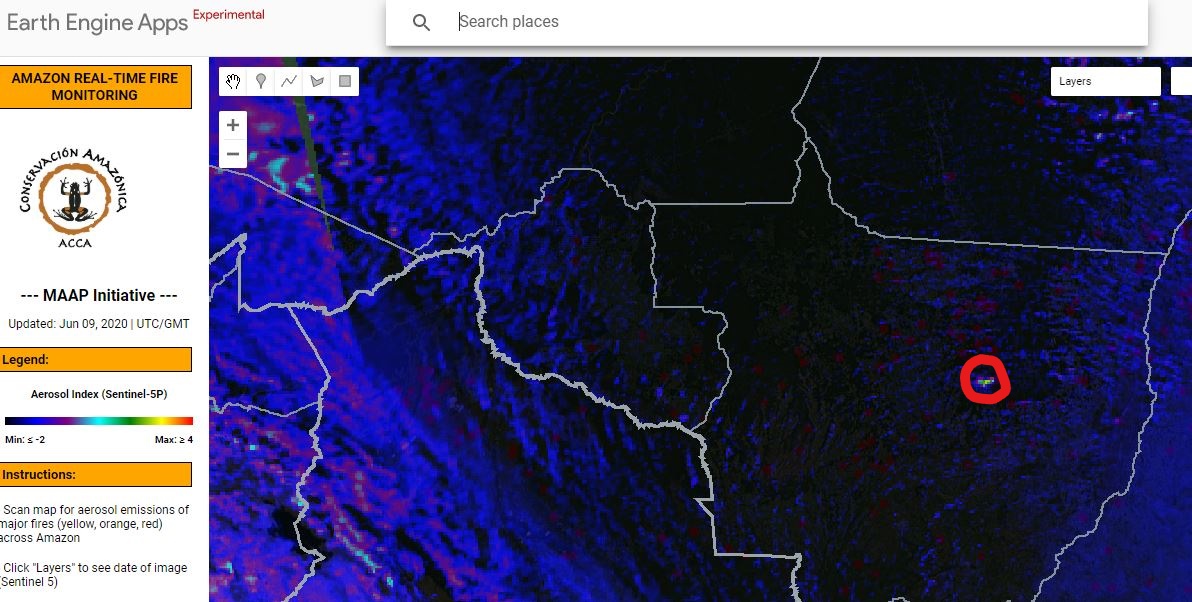
As presented in MAAP #118, Amazon Conservation launched a real-time fire monitoring app that specializes in detection of elevated aerosol emissions in the smoke coming from burning Amazon fires. As detailed below, the app just detected the fourth major Amazon fire of 2020 on June 17. All four fires thus far have been in the state of Mato Grosso and burning recently deforested areas (see MAAP #113 for background).

Step 1. Detection of elevated emissions in the southeastern Brazilian Amazon (Mato Grosso).


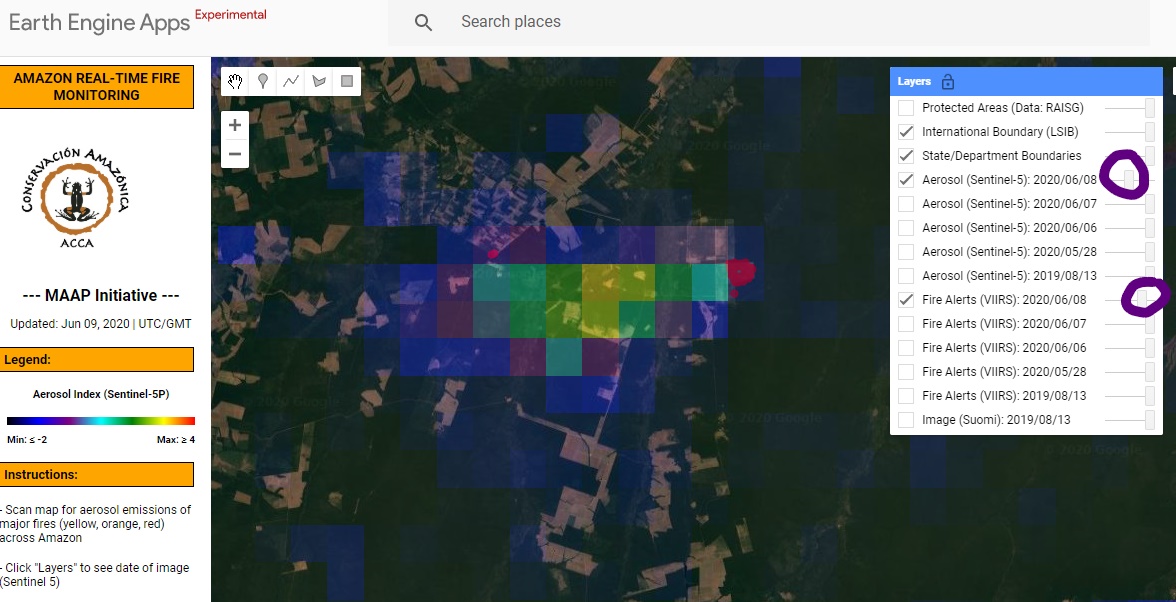
Step 2. Zoom in on the emissions.

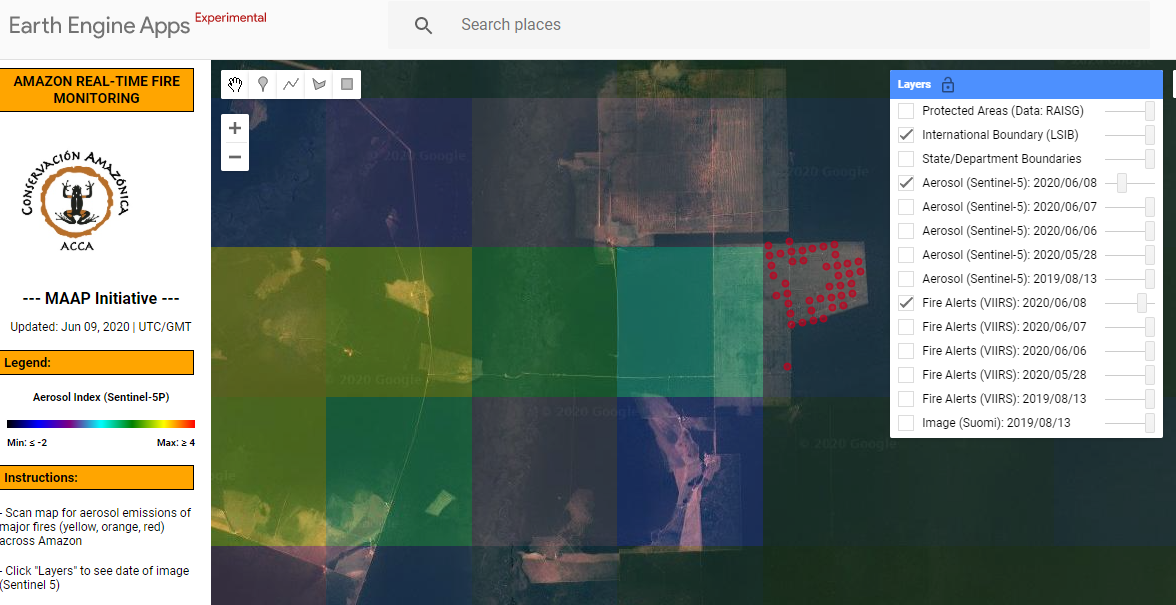
Step 3. Adjust the transparency to see the underlying fire alerts that indicate the exact location of the fires. Obtain coordinates of the source of the fires.


Step 4. Check the satellite imagery in Planet Explorer. Here is a high resolution Planet image showing the fire burning on June 17. Also see the slider below, comparing the the June 17 fires with a pre-fire image from June 10.

Imagery source: Planet.

[twenty20 img1=”9167″ img2=”9168″ width=”75%” offset=”0.5″]

Imagery source: Planet.

Step 5. Using Planet’s extensive imagery archive, we were able to determine that the fires were burning an area deforested in 2019 (and not a forest fire).

Coordinates: -10.45, -53.55

Annex – Fire Alert vs. Aerosol Emission Data

This slider shows us how aerosol emission data allows users to prioritize hundreds (or thousands) of heat-based fire alerts. In other words, the aerosol data indicates just the fires that are  actually burning lots of biomass and putting out abundant smoke.

[twenty20 img1=”9170″ img2=”9169″ offset=”0.5″]

References

Gorelick, N., Hancher, M., Dixon, M., Ilyushchenko, S., Thau, D., & Moore, R. (2017). Google Earth Engine: Planetary-scale geospatial analysis for everyone. Remote Sensing of Environment.”
https://earthengine.google.com/faq/
Planet Team (2017). Planet Application Program Interface: In Space for Life on Earth. San Francisco, CA. https://api.planet.com

Acknowledgements

This work was supported by the following major funders: USAID/NASA (SERVIR), Global Forest Watch Small Grants Fund (WRI), Norwegian Agency for Development Cooperation (NORAD),  International Conservation Fund of Canada (ICFC), Metabolic Studio, and Erol Foundation.

Citation

Finer M, Villa L (2020) Amazon Fire Tracker 2020: Brazil #4 (June 17, 2020). MAAP.

MAAP: Amazon Fire Tracker #2 – Brazil, June 8 2020

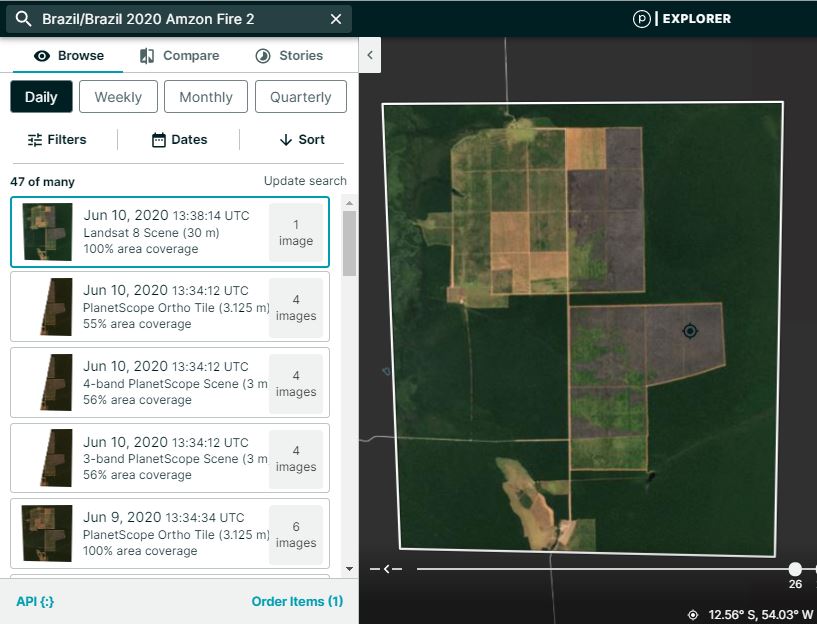
As presented in MAAP #118, Amazon Conservation launched a real-time fire monitoring app that specializes in detection of elevated aerosol emissions from burning Amazon fires. As detailed below, the app detected the second major 2020 fire on June 8, 2020 in Mato Grosso, Brazil.

Step 1. Detection of elevated emissions in the southeastern Brazilian Amazon (Mato Grosso).


Step 2. Zoom in on the emissions, adjust the transparency to see the underlying fire alerts that indicate the fire location.


Step 3. Zoom in again to see precisely the fire location and obtain coordinates.

Step 4. Check the satellite imagery archive in Planet Explorer. Here is a Landsat image (30 meter resolution) showing the fire burned around 3,000 hectares (7,400 acres) of an area deforested in July 2018. Note that MAAP #113 made the important discovery that most of the 2019 Brazilian Amazon fires were burning recently deforested areas (and not uncontrolled forest fires).


Coordinates

lat: -12.57, lon: -54.06

References

Gorelick, N., Hancher, M., Dixon, M., Ilyushchenko, S., Thau, D., & Moore, R. (2017). Google Earth Engine: Planetary-scale geospatial analysis for everyone. Remote Sensing of Environment.”
https://earthengine.google.com/faq/

Acknowledgements

This work was supported by the following major funders: USAID/NASA (SERVIR), Global Forest Watch Small Grants Fund (WRI), Norwegian Agency for Development Cooperation (NORAD),  International Conservation Fund of Canada (ICFC), Metabolic Studio, and Erol Foundation.

Citation

Finer M, Villa L (2020) Amazon 2020 Fire Tracker #2 – Brazil, June 8. MAAP.

MAAP #120: Deforestation in the Colombian Amazon – 2020

Table 1. Deforestation of primary forest in the Colombian Amazon, 2015-20. Data: Hansen/UMD/Google/USGS/NASA, UMD/GLAD. *Until May 2020

Here we present a first look at 2020 deforestation of primary forest in the Colombian Amazon, in relation to the new published annual data for 2019.*

This new data confirms that deforestation decreased in 2019 (91,400 hectares) after a peak in 2018 (153,900 hectares).

Table 1 shows the recent trend: a major deforestation spike following the 2016 peace agreement (between the Colombian government and the FARC) with a peak in 2018, followed by a major decrease in 2019.

In our first look at 2020, we estimate the deforestation of 76,200 hectares (188,295 acres) of primary forest through June.

Note that we have documented the deforestation of 444,000 hectares (over a million acres) of primary forest in the Colombian Amazon in the past four years since the peace agreement.

*Global Forest Watch recently released the annual forest loss data for 2019.

Deforestation Hotspots – 2020

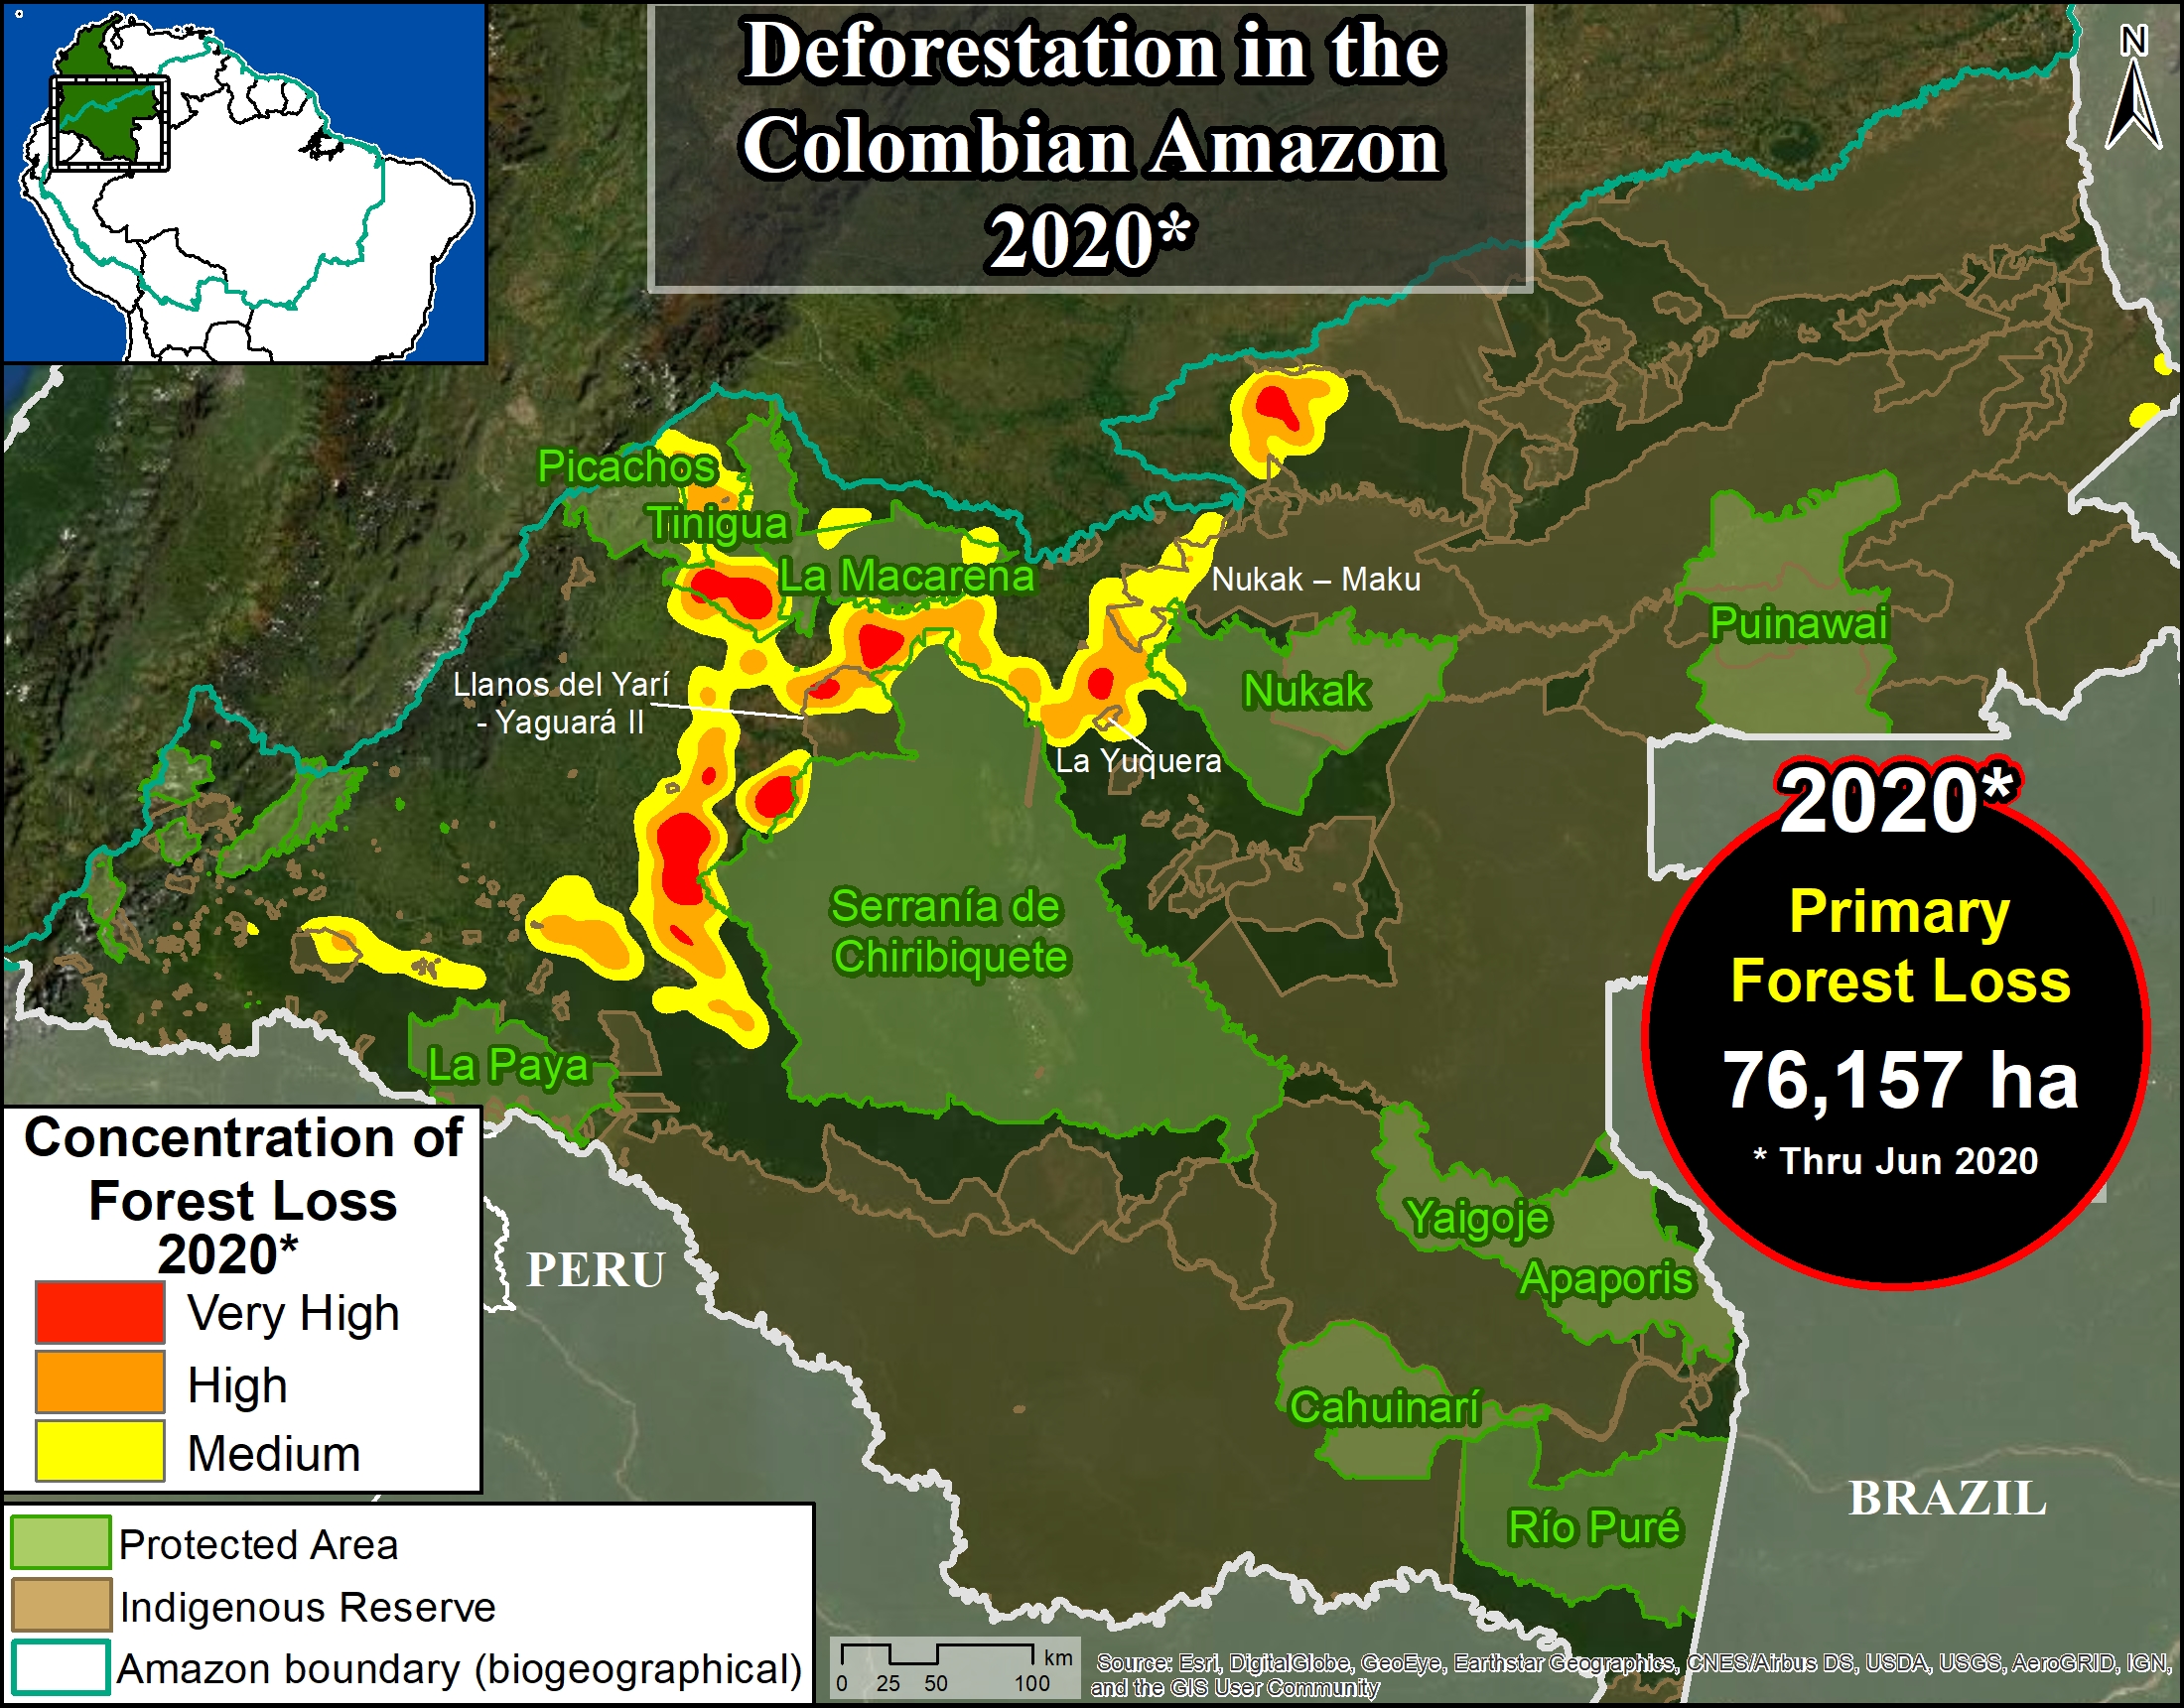
Base Map. 2020 Deforestation hotspots in the Colombian Amazon. Data: UMD/GLAD.

The Base Map shows the 2020 deforestation hotspots.*

As in previous years, they are concentrated in an “arc of deforestation” in the northwest Colombian Amazon.

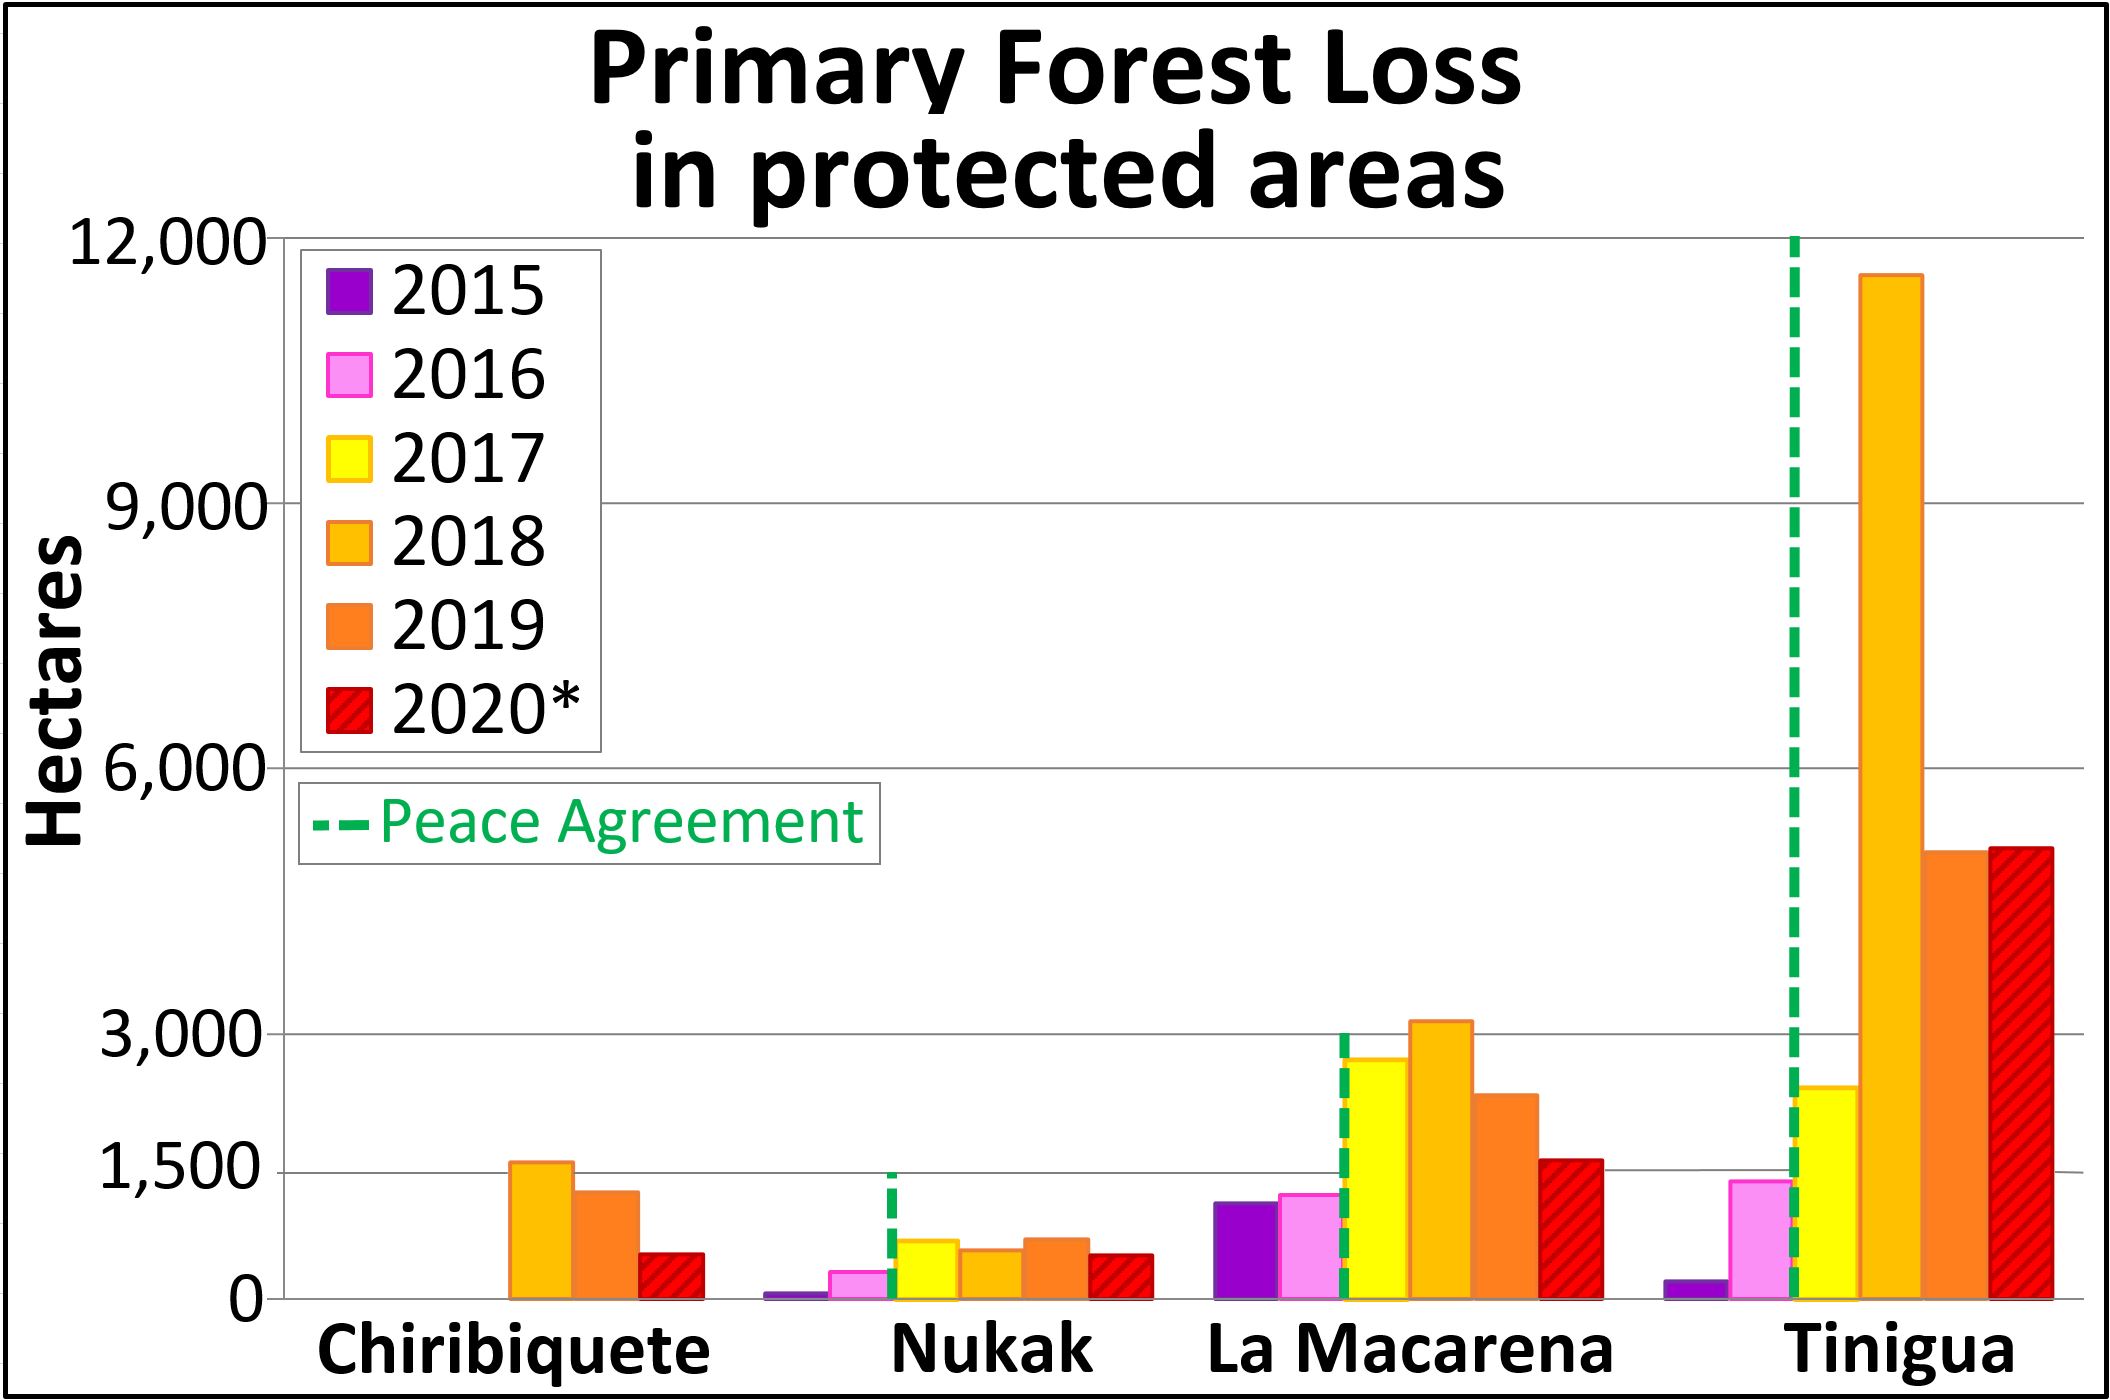
This arc includes four protected areas (Tinigua, Chiribiquete and Macarena National Parks, and Nukak National Reserve) that lost 0ver 7,700 hectares (19,000 acres) of primary forest in 2020 (see Table 2).

Tinigua National Park is the most impacted protected area with the deforestation of 5,100 hectares (12,600 acres). Note the rare occurrence of a major deforestation hotspot in the middle of a national park.

Chiribiquete National Park lost 510 hectares (1,260 acres) in the recently expanded sections of the park.

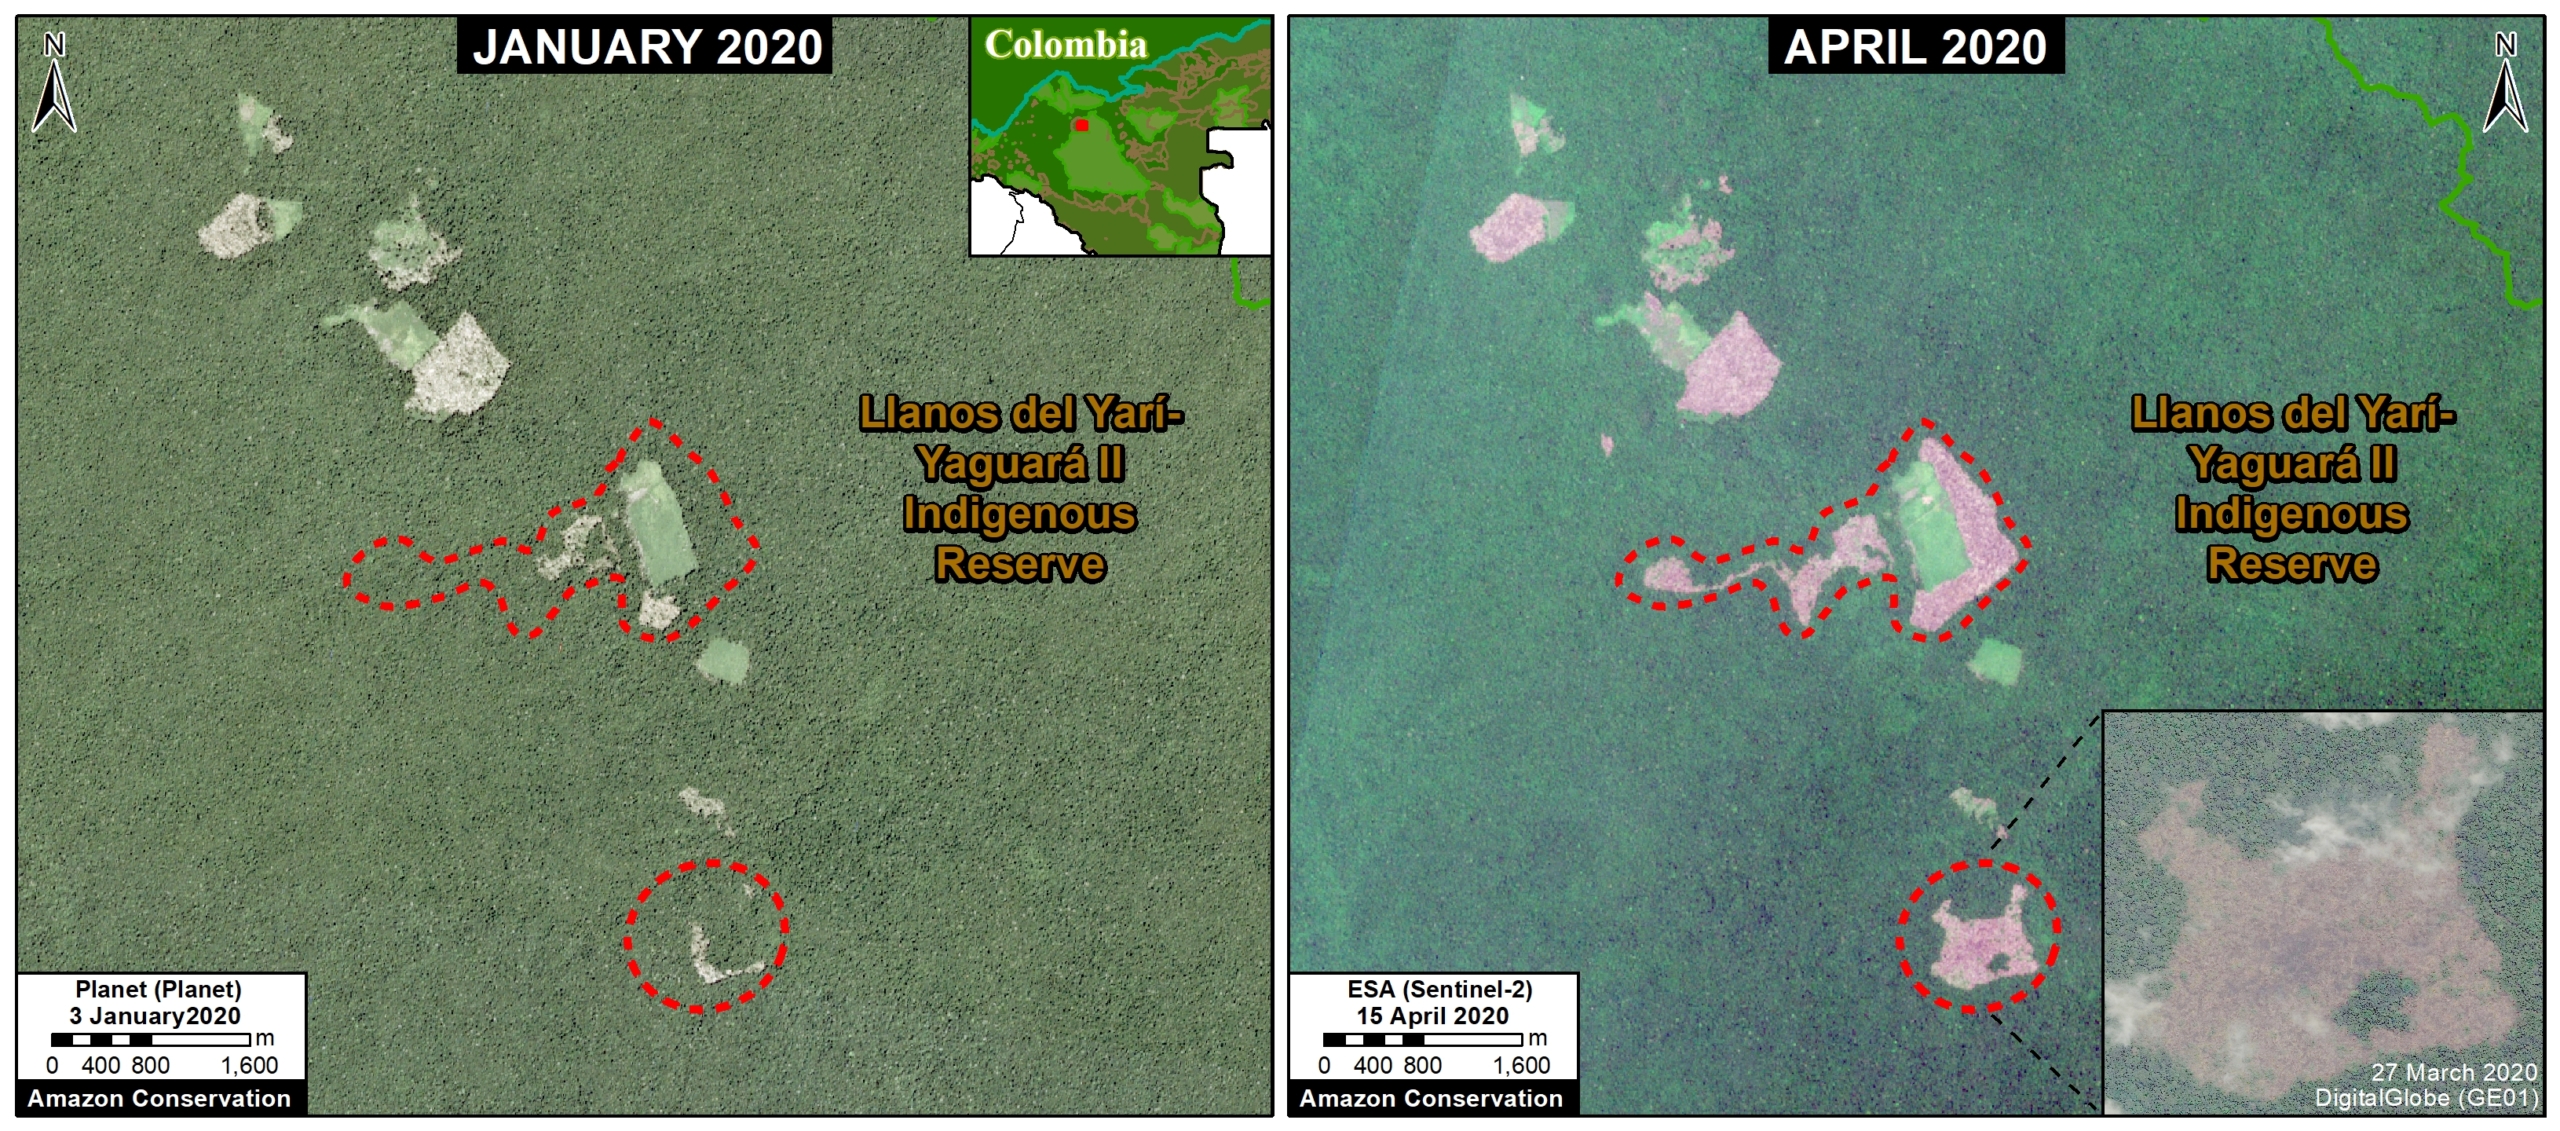
The arc of deforestation also includes two Indigenous Reserves (Resguardos Indígenas Nukak-Maku and Llanos del Yari-Yaguara II) that lost 4,000 hectares (9,885 acres) so far in 2020.

*To see detailed map of the 2019-20 primary forest deforestation in the Colombian Amazon, click here.

Deforestation in Protected Areas and Indigenous Lands – 2020

Below, we show 2020 examples within the arc of deforestation in the northwest Colombian Amazon.

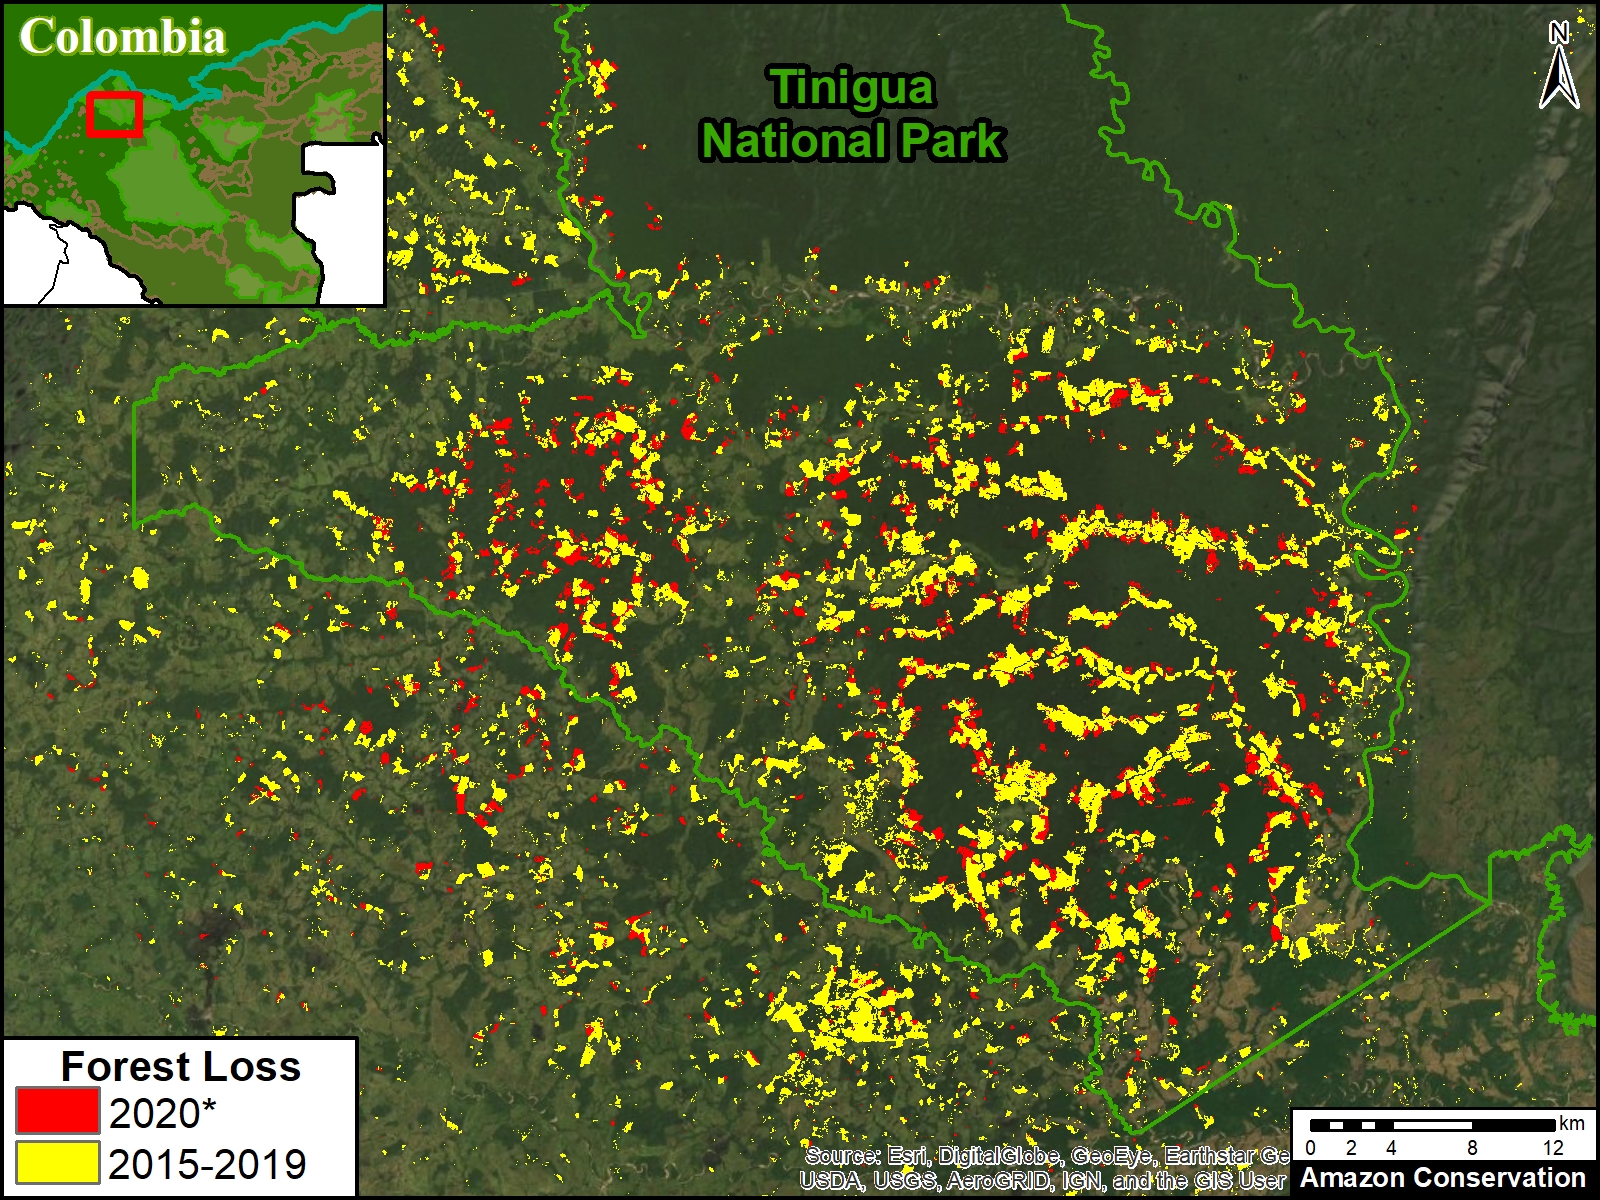
Image 1 illustrates the extensive deforestation within Tinigua National Park over the last five years continuing in 2020.

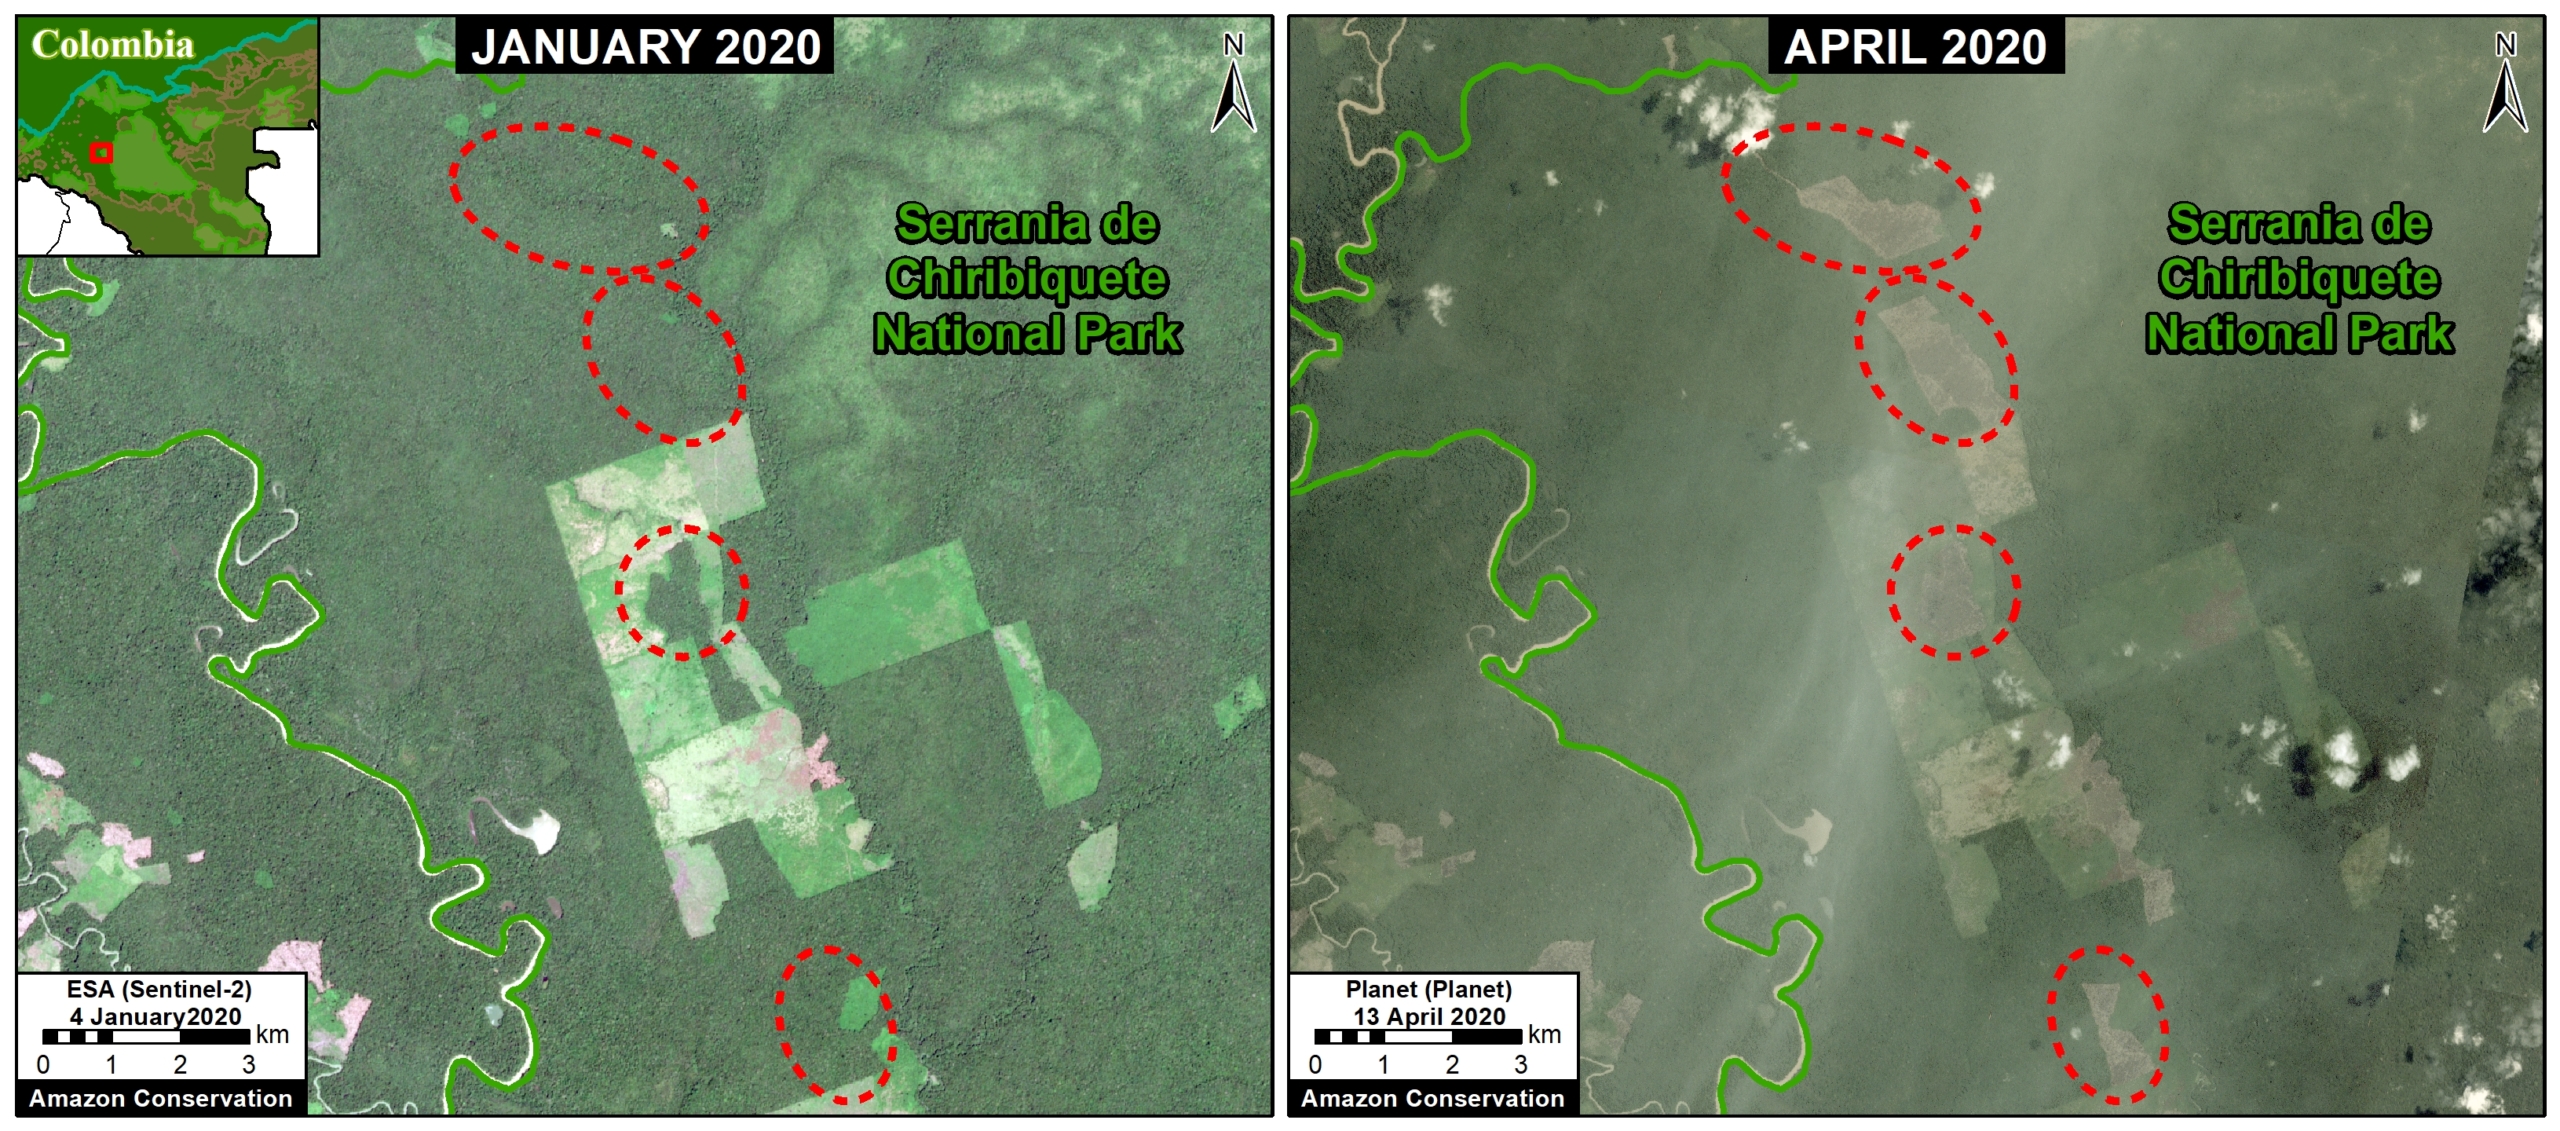
Image 2 shows an example of deforestation within Chiribiquete National Park (western sector) between January (left panel) and April (right panel) of 2020.

Image 3 shows an example of deforestation within the Llanos del Yari-Yaguara II Indigenous Reserve between January (left panel) and April (right panel) of 2020.

Image 1. Extensive deforestation within Tinigua National Park over the last five years, continuing in 2020. Data: Hansen/UMD/Google/USGS/NASA, UMD/GLAD.
Image 2. Deforestation in Chirbiquete National Park (western sector) between January (left panel) and April (right panel) of 2020. Data: ESA, Planet, MAAP.
Image 3. Deforestation in Llanos del Yari-Yaguara II Indigenous Reserve. Data: ESA, Planet, MAAP.

Deforestation in Protected Areas, 2015-20

Table 2 shows the loss of primary forest in four protected areas located in the arc of deforestation arc in the northwestern Colombian Amazon, between 2015 and 2020.

Table 2. Primary forest loss in four protected areas in the northwestern Colombian Amazon, between 2015 and 2020. Data: Hansen/UMD/Google/USGS/NASA, UMD/GLAD.

Methodology

The data presented in this report were generated by the Global Land Analysis and Discovery (GLAD) laboratory at the University of Maryland (Hansen et al 2013) and presented by Global Forest Watch. For the years 2015-18, we used annual forest loss data. For the years 2019-20, we used early warning alerts (GLAD alerts), and thus represent an estimate. Note that some forest loss detected early in the year may include events from late the preceding year.

Our study area is the Amazon biogeographical limit (not strict Amazon watershed) as highlighted in the Base Map.

Specifically, for our estimate of forest cover loss, we multiplied the annual “forest cover loss” data by the density percentage of the “tree cover” from the year 2001 (values >30%).

For our estimate of primary forest loss, we intersected the forest cover loss data with the additional dataset “primary humid tropical forests” as of 2001 (Turubanova et al 2018). For more details on this part of the methodology, see the Technical Blog from Global Forest Watch (Goldman and Weisse 2019).

All data were processed under the geographical coordinate system WGS 1984. To calculate the areas in metric units the UTM (Universal Transversal Mercator) projection was used: Colombia 18 North.

Lastly, to identify the deforestation hotspots, we conducted a kernel density estimate. This type of analysis calculates the magnitude per unit area of a particular phenomenon, in this case forest cover loss. We conducted this analysis using the Kernel Density tool from Spatial Analyst Tool Box of ArcGIS. We used the following parameters:

Search Radius: 15000 layer units (meters)
Kernel Density Function: Quartic kernel function
Cell Size in the map: 200 x 200 meters (4 hectares)
Everything else was left to the default setting.

For the Base Map, we used the following concentration percentages: Medium: 10%-20%; High: 21%-35%; Very High: >35%.

Acknowledgements

We thank R. Botero (FCDS), E. Ortiz (AAF), and G. Palacios for helpful comments to earlier versions of this report.

This work was supported by the following major funders: Norwegian Agency for Development Cooperation (NORAD), Gordon and Betty Moore Foundation, International Conservation Fund of Canada (ICFC), Metabolic Studio, Erol Foundation, MacArthur Foundation, and Global Forest Watch Small Grants Fund (WRI).

Citation

Finer M, Mamani N (2020) Deforestation in the Colombian Amazon – 2020. MAAP #120.

MAAP #119: Predicting 2020 Brazilian Amazon Fires

2019 Brazilian Amazon fire burning recently deforested area, not uncontrolled forest fire. Data: Planet; Analysis: MAAP.

The Brazilian Amazon fires made international headlines last year.

By analyzing an archive of satellite imagery (from Planet Explorer), we made the major discovery that many of the 2019 fires were actually burning recently deforested areas (MAAP #113). In fact, many of the fires were burning areas deforested earlier that same year of 2019.

Thus, we may predict 2020 fire locations based on identifying major deforestation events in the early months of this year.

Using a novel methodology*, we estimate the deforestation of over 150,000 hectares (373,240 acres) of primary forest in the Brazilian Amazon thus far in 2020 (through May 25). Thus, there is high potential for another intense fire season.

Below, we illustrate the process of predicting 2020 fires based on recent deforestation.

Note: In MAAP #118 we just reported that the first major fires of 2020 were in fact burning recently deforested areas (2018-19).


Predicting 2020 fires

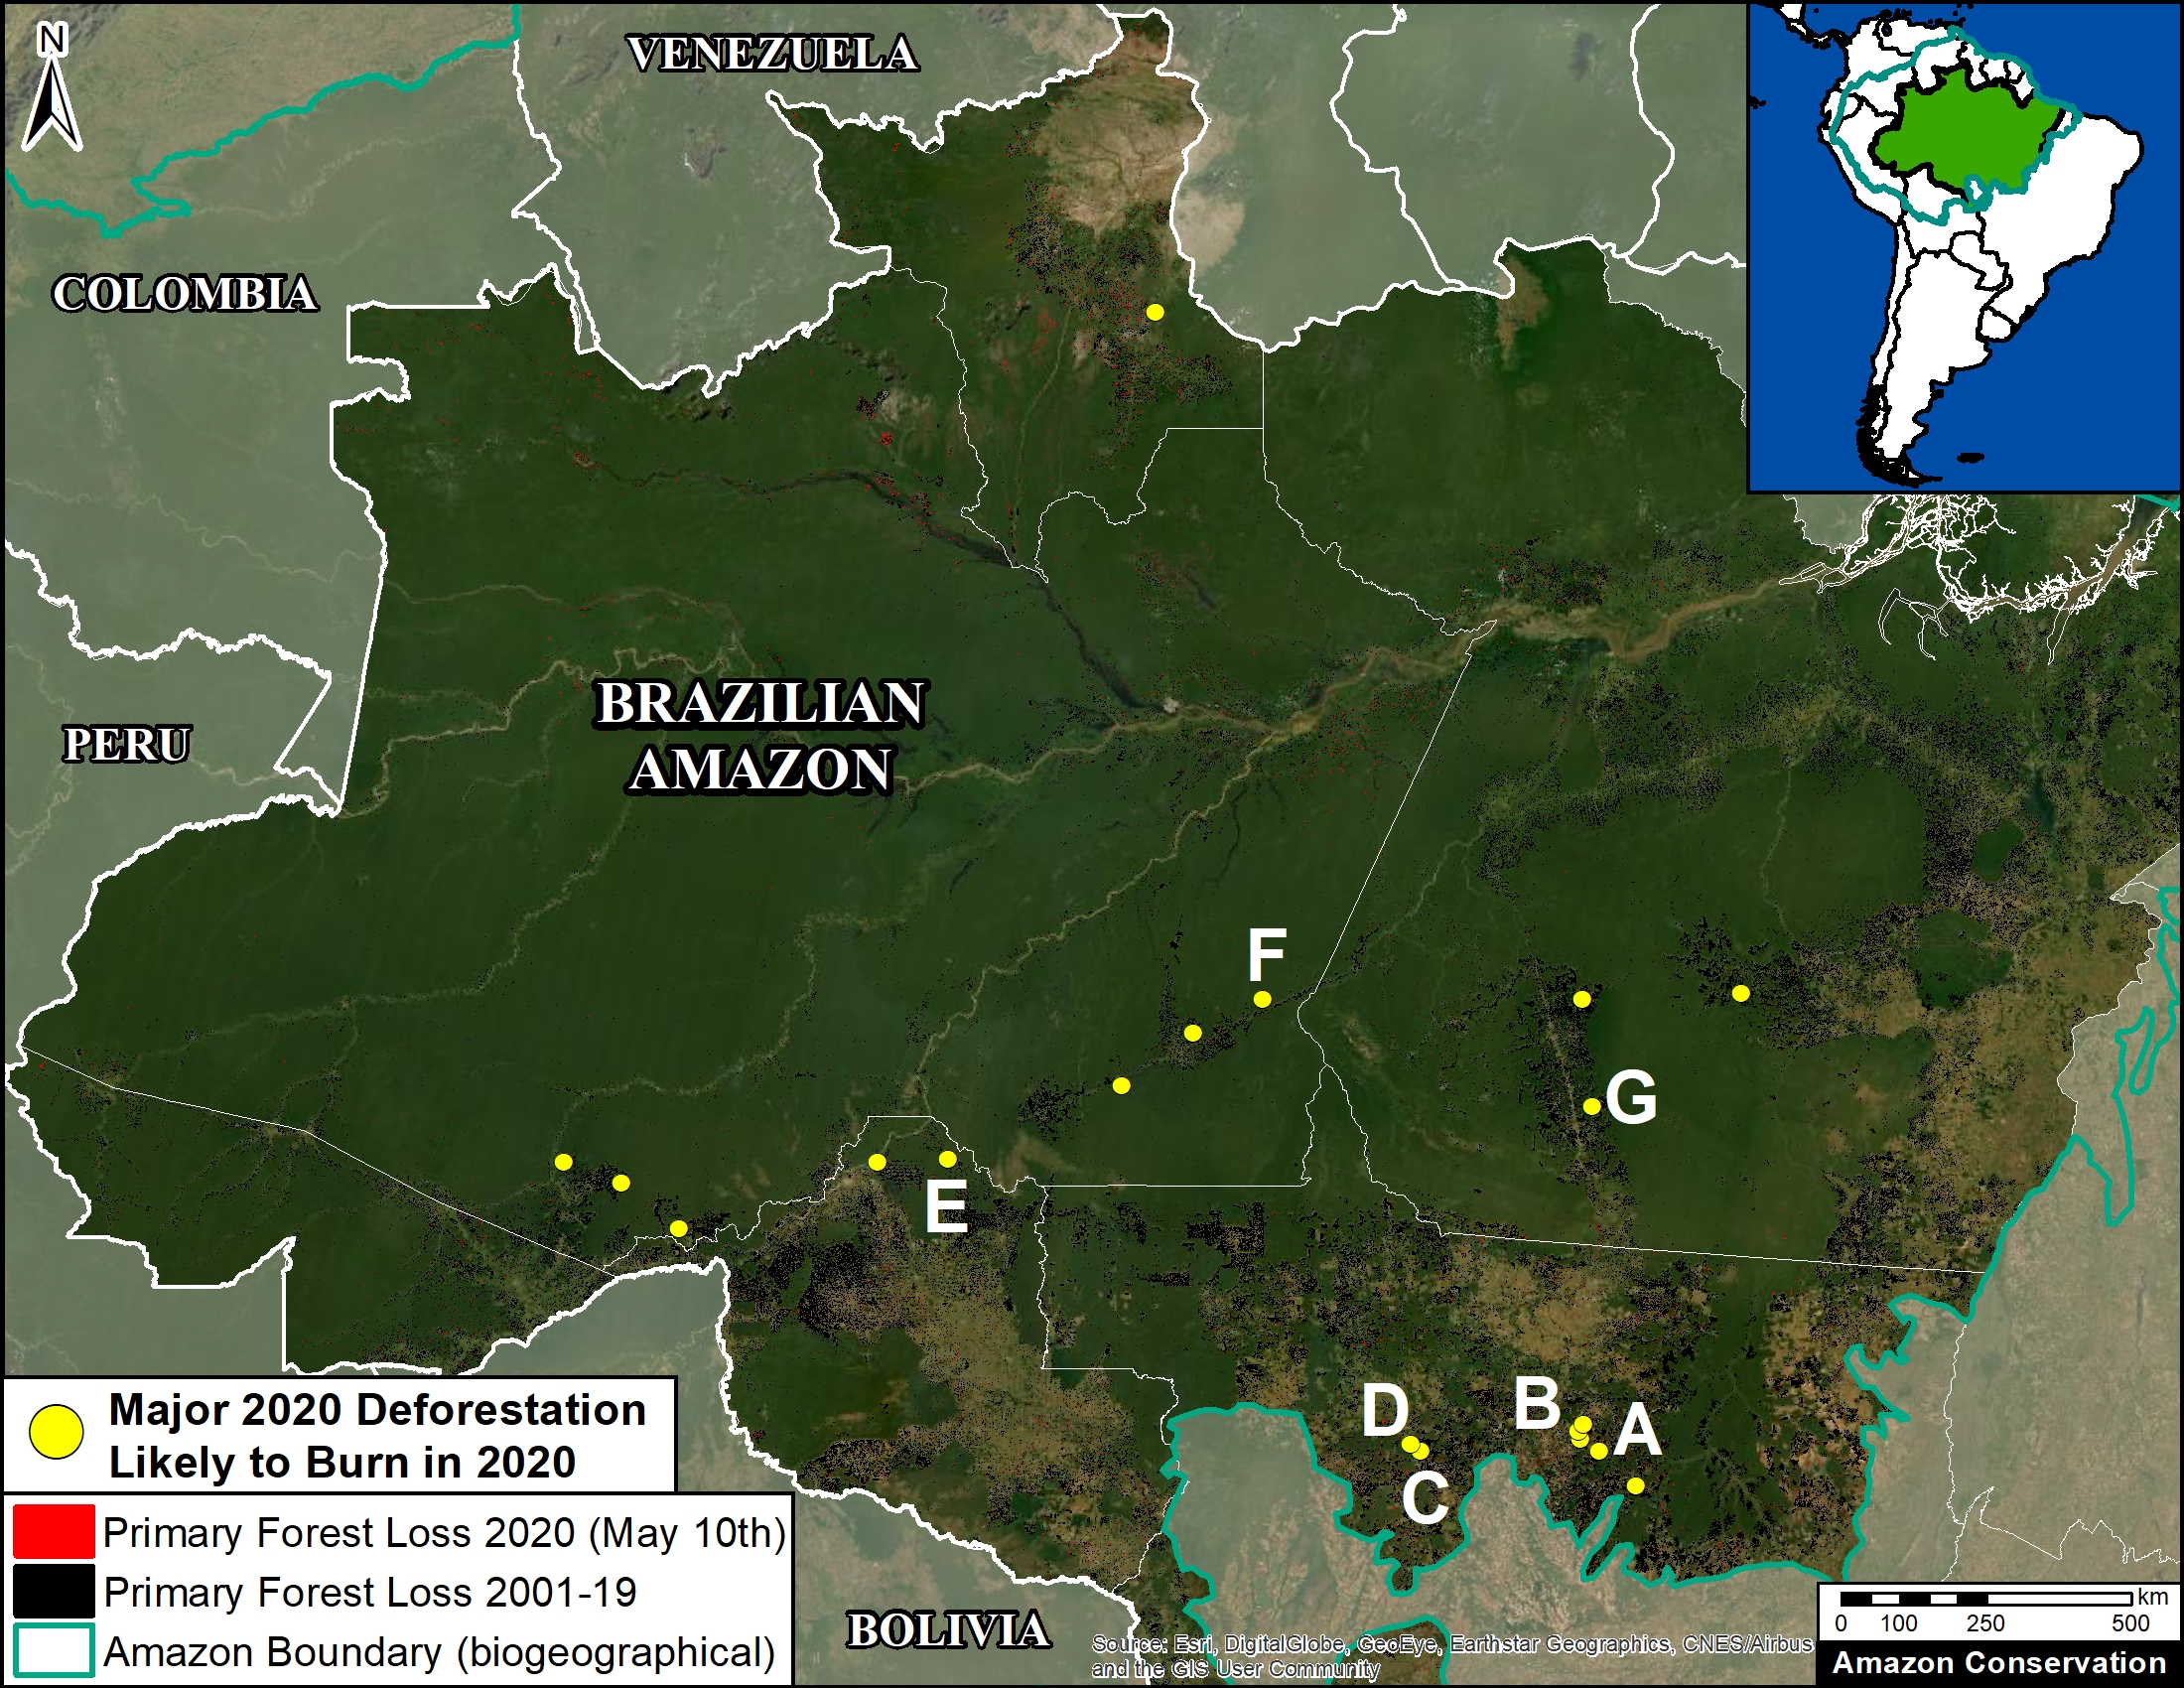
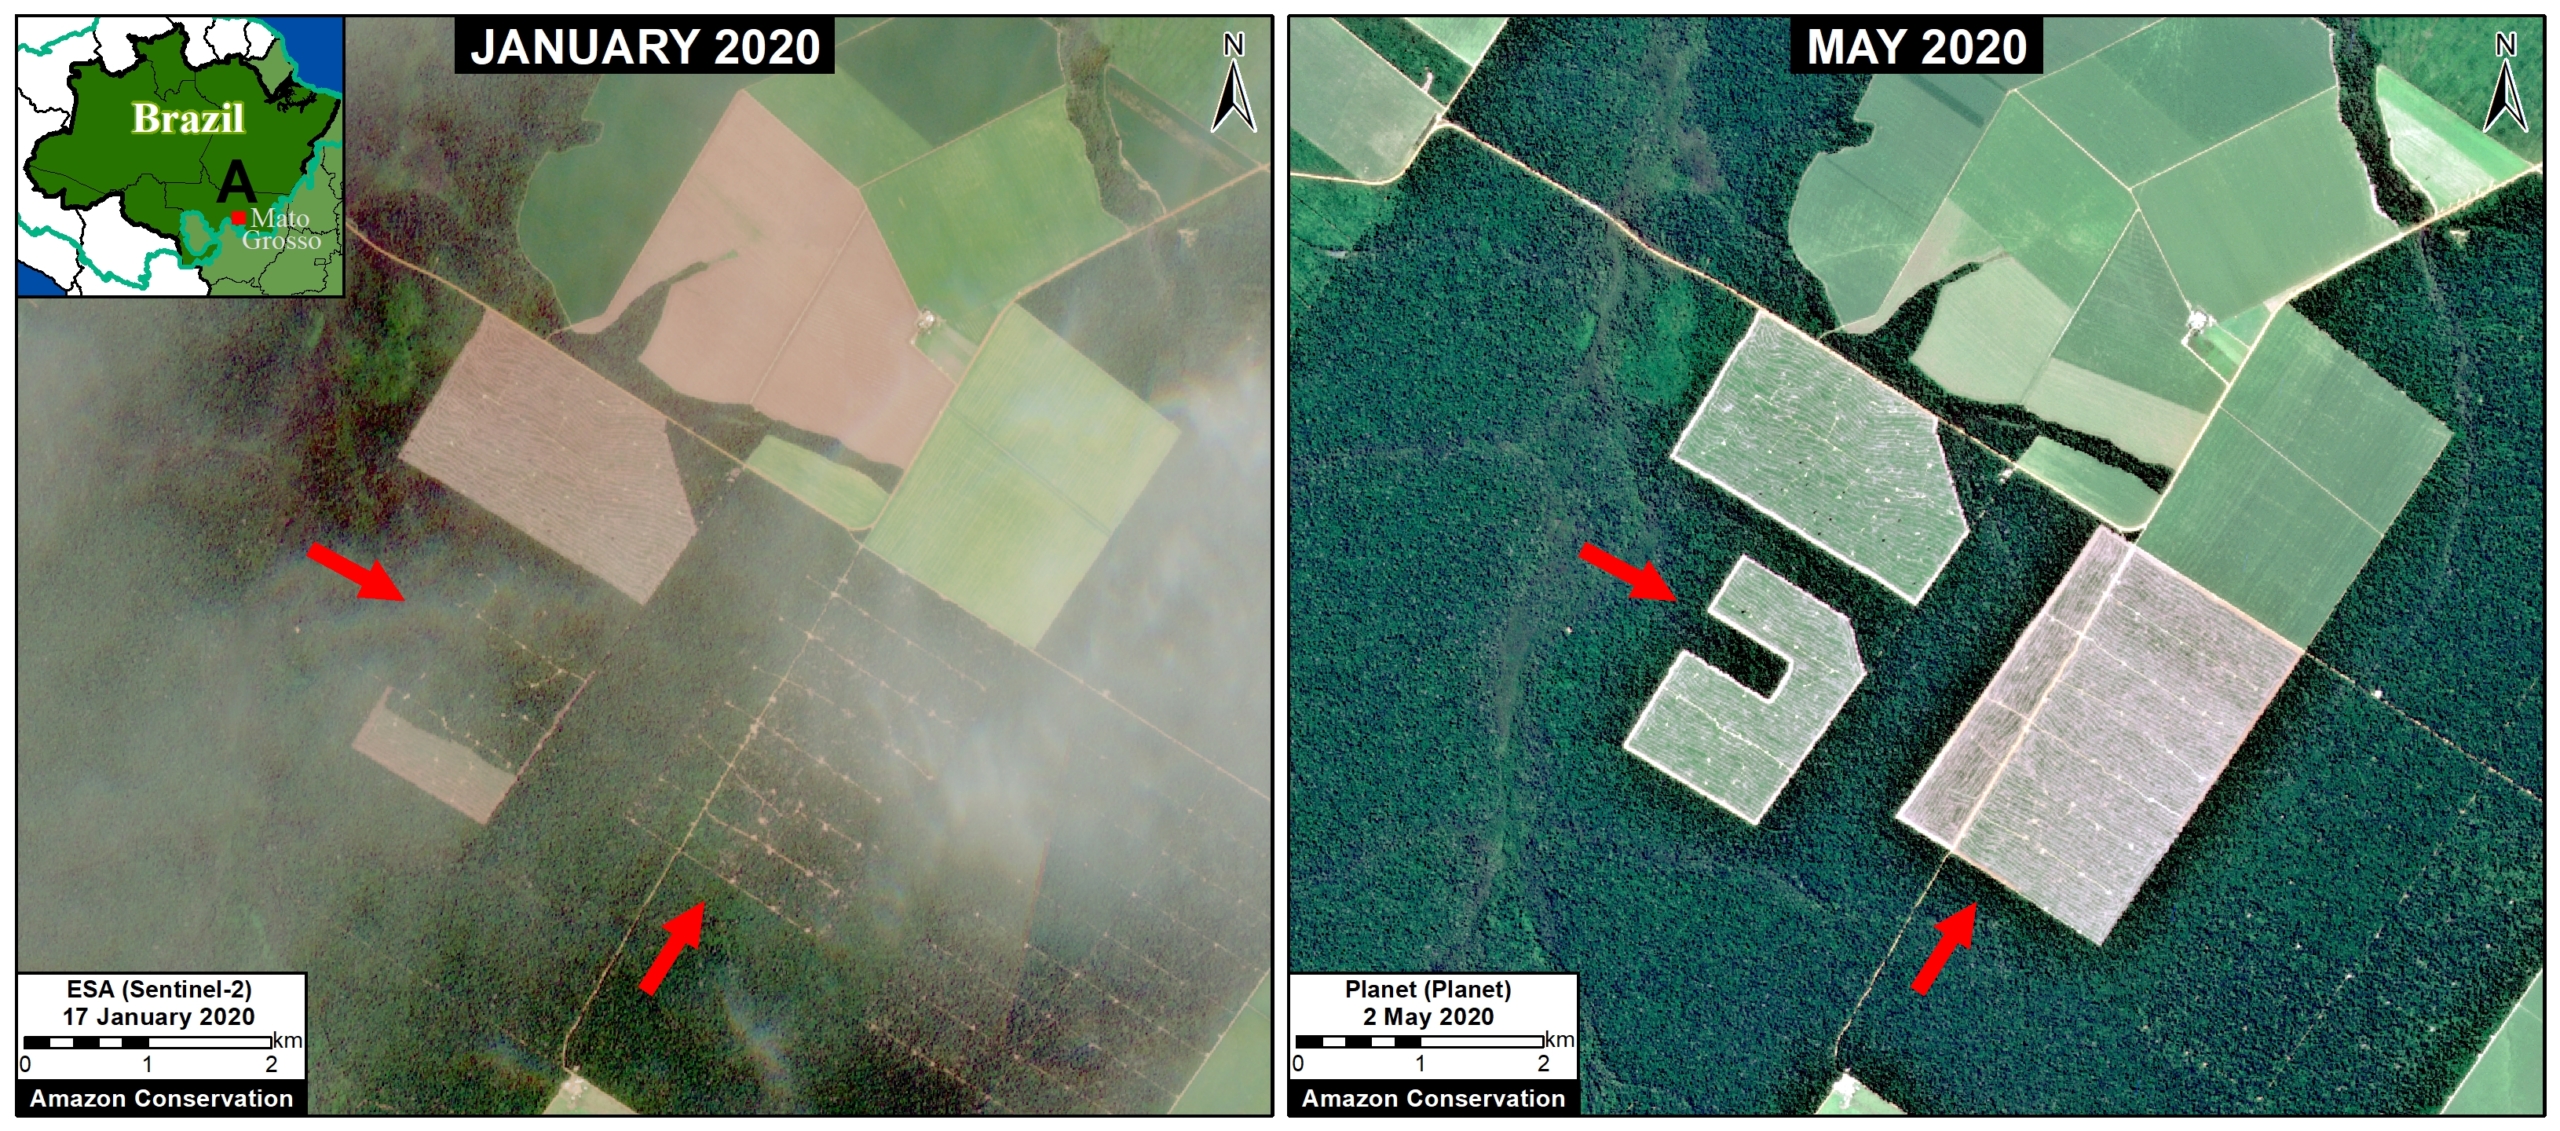
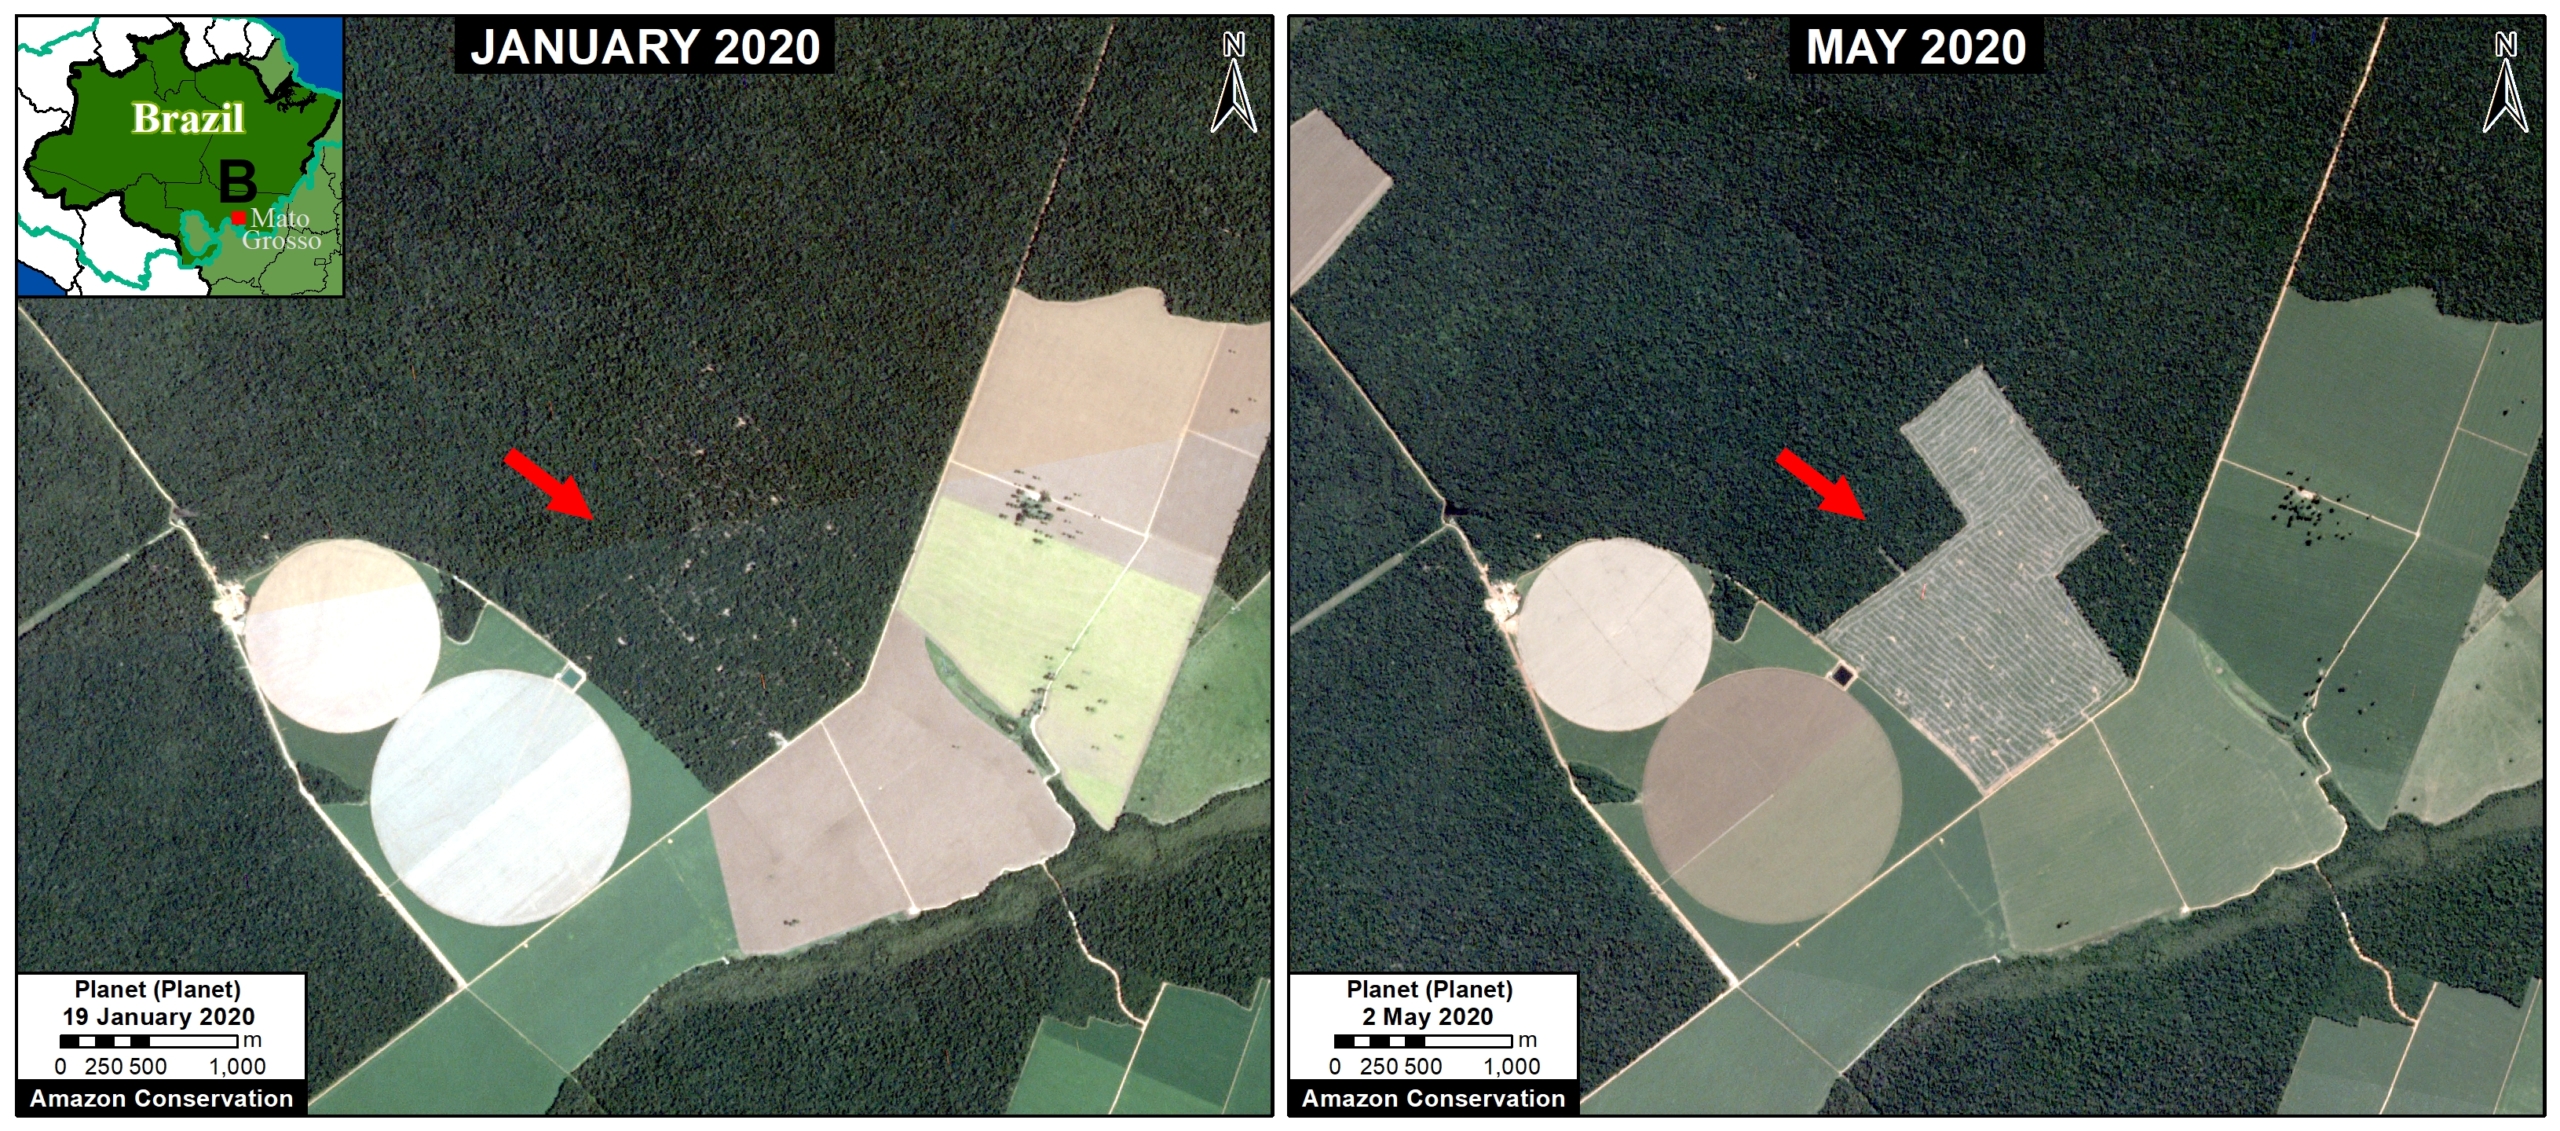
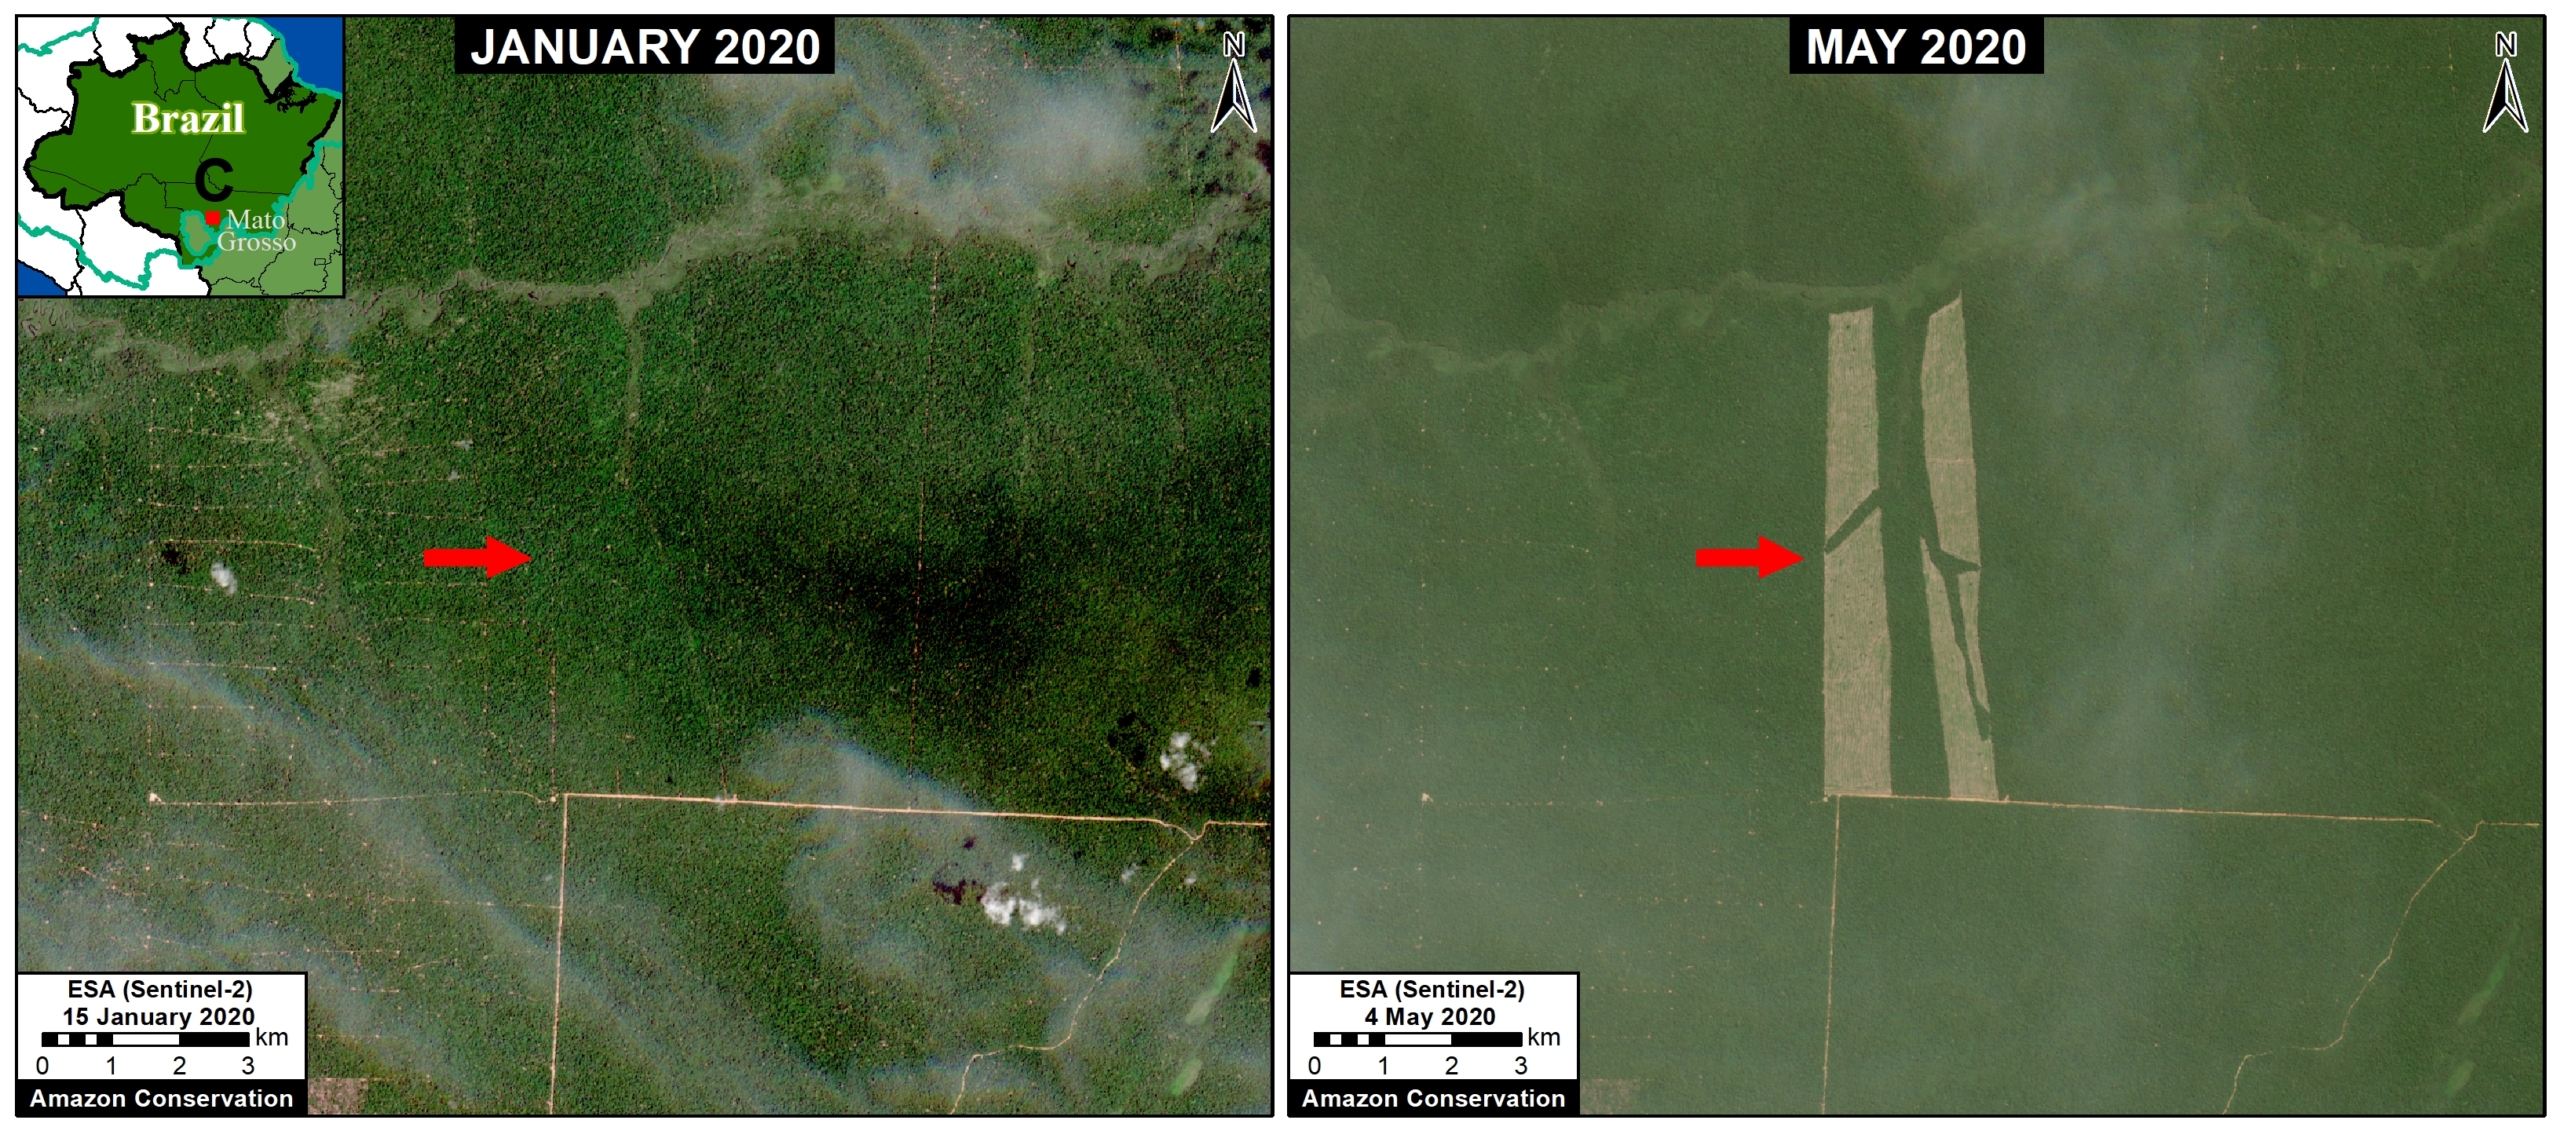
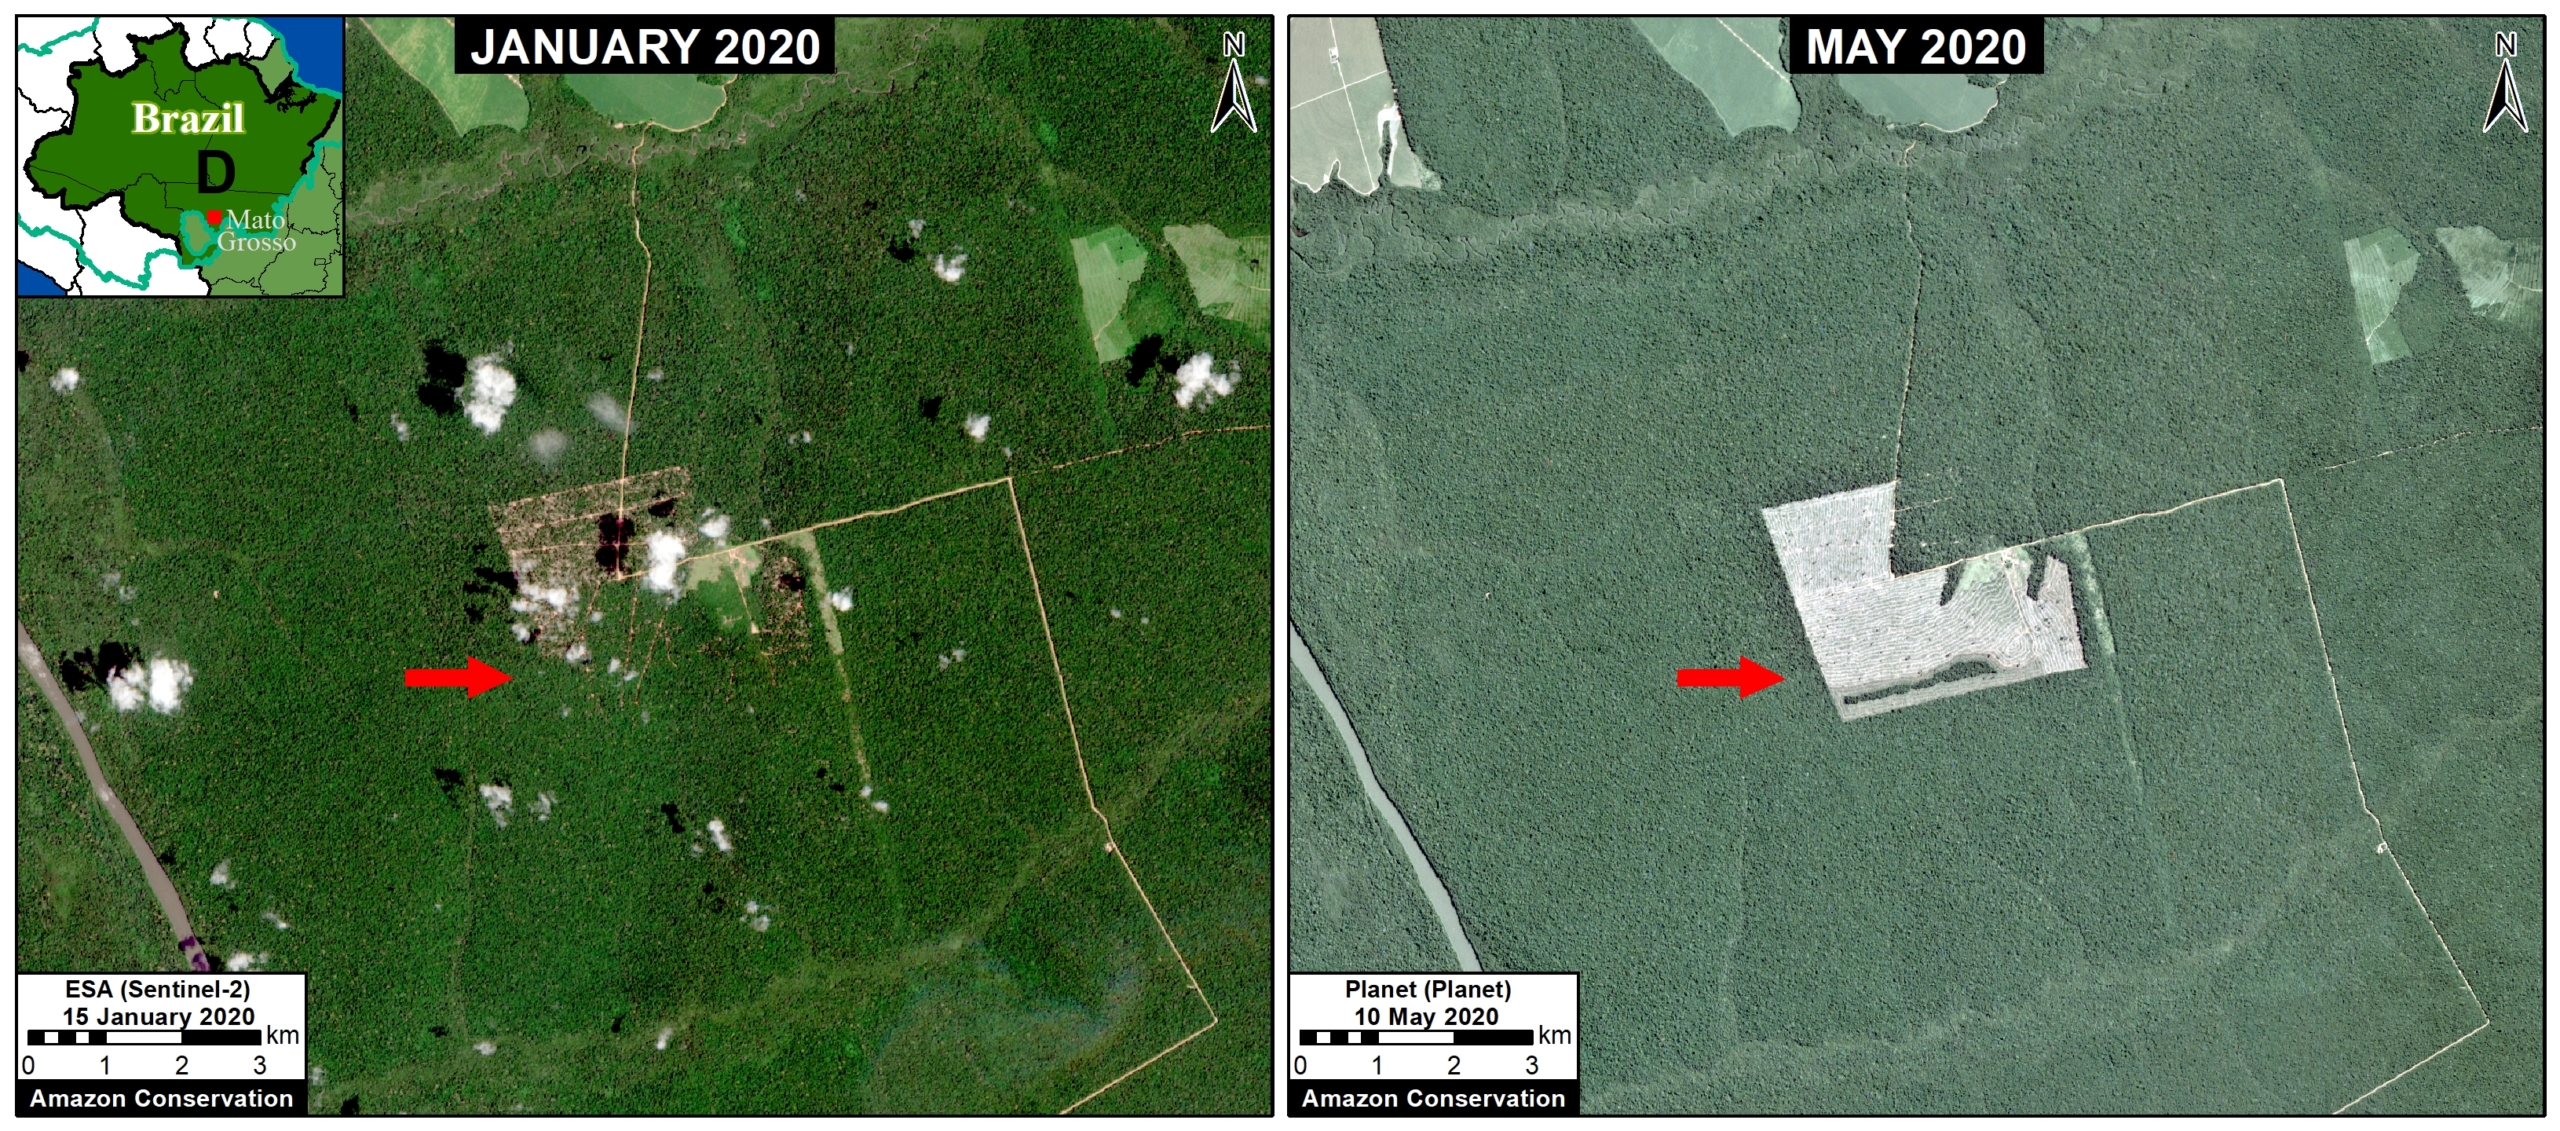
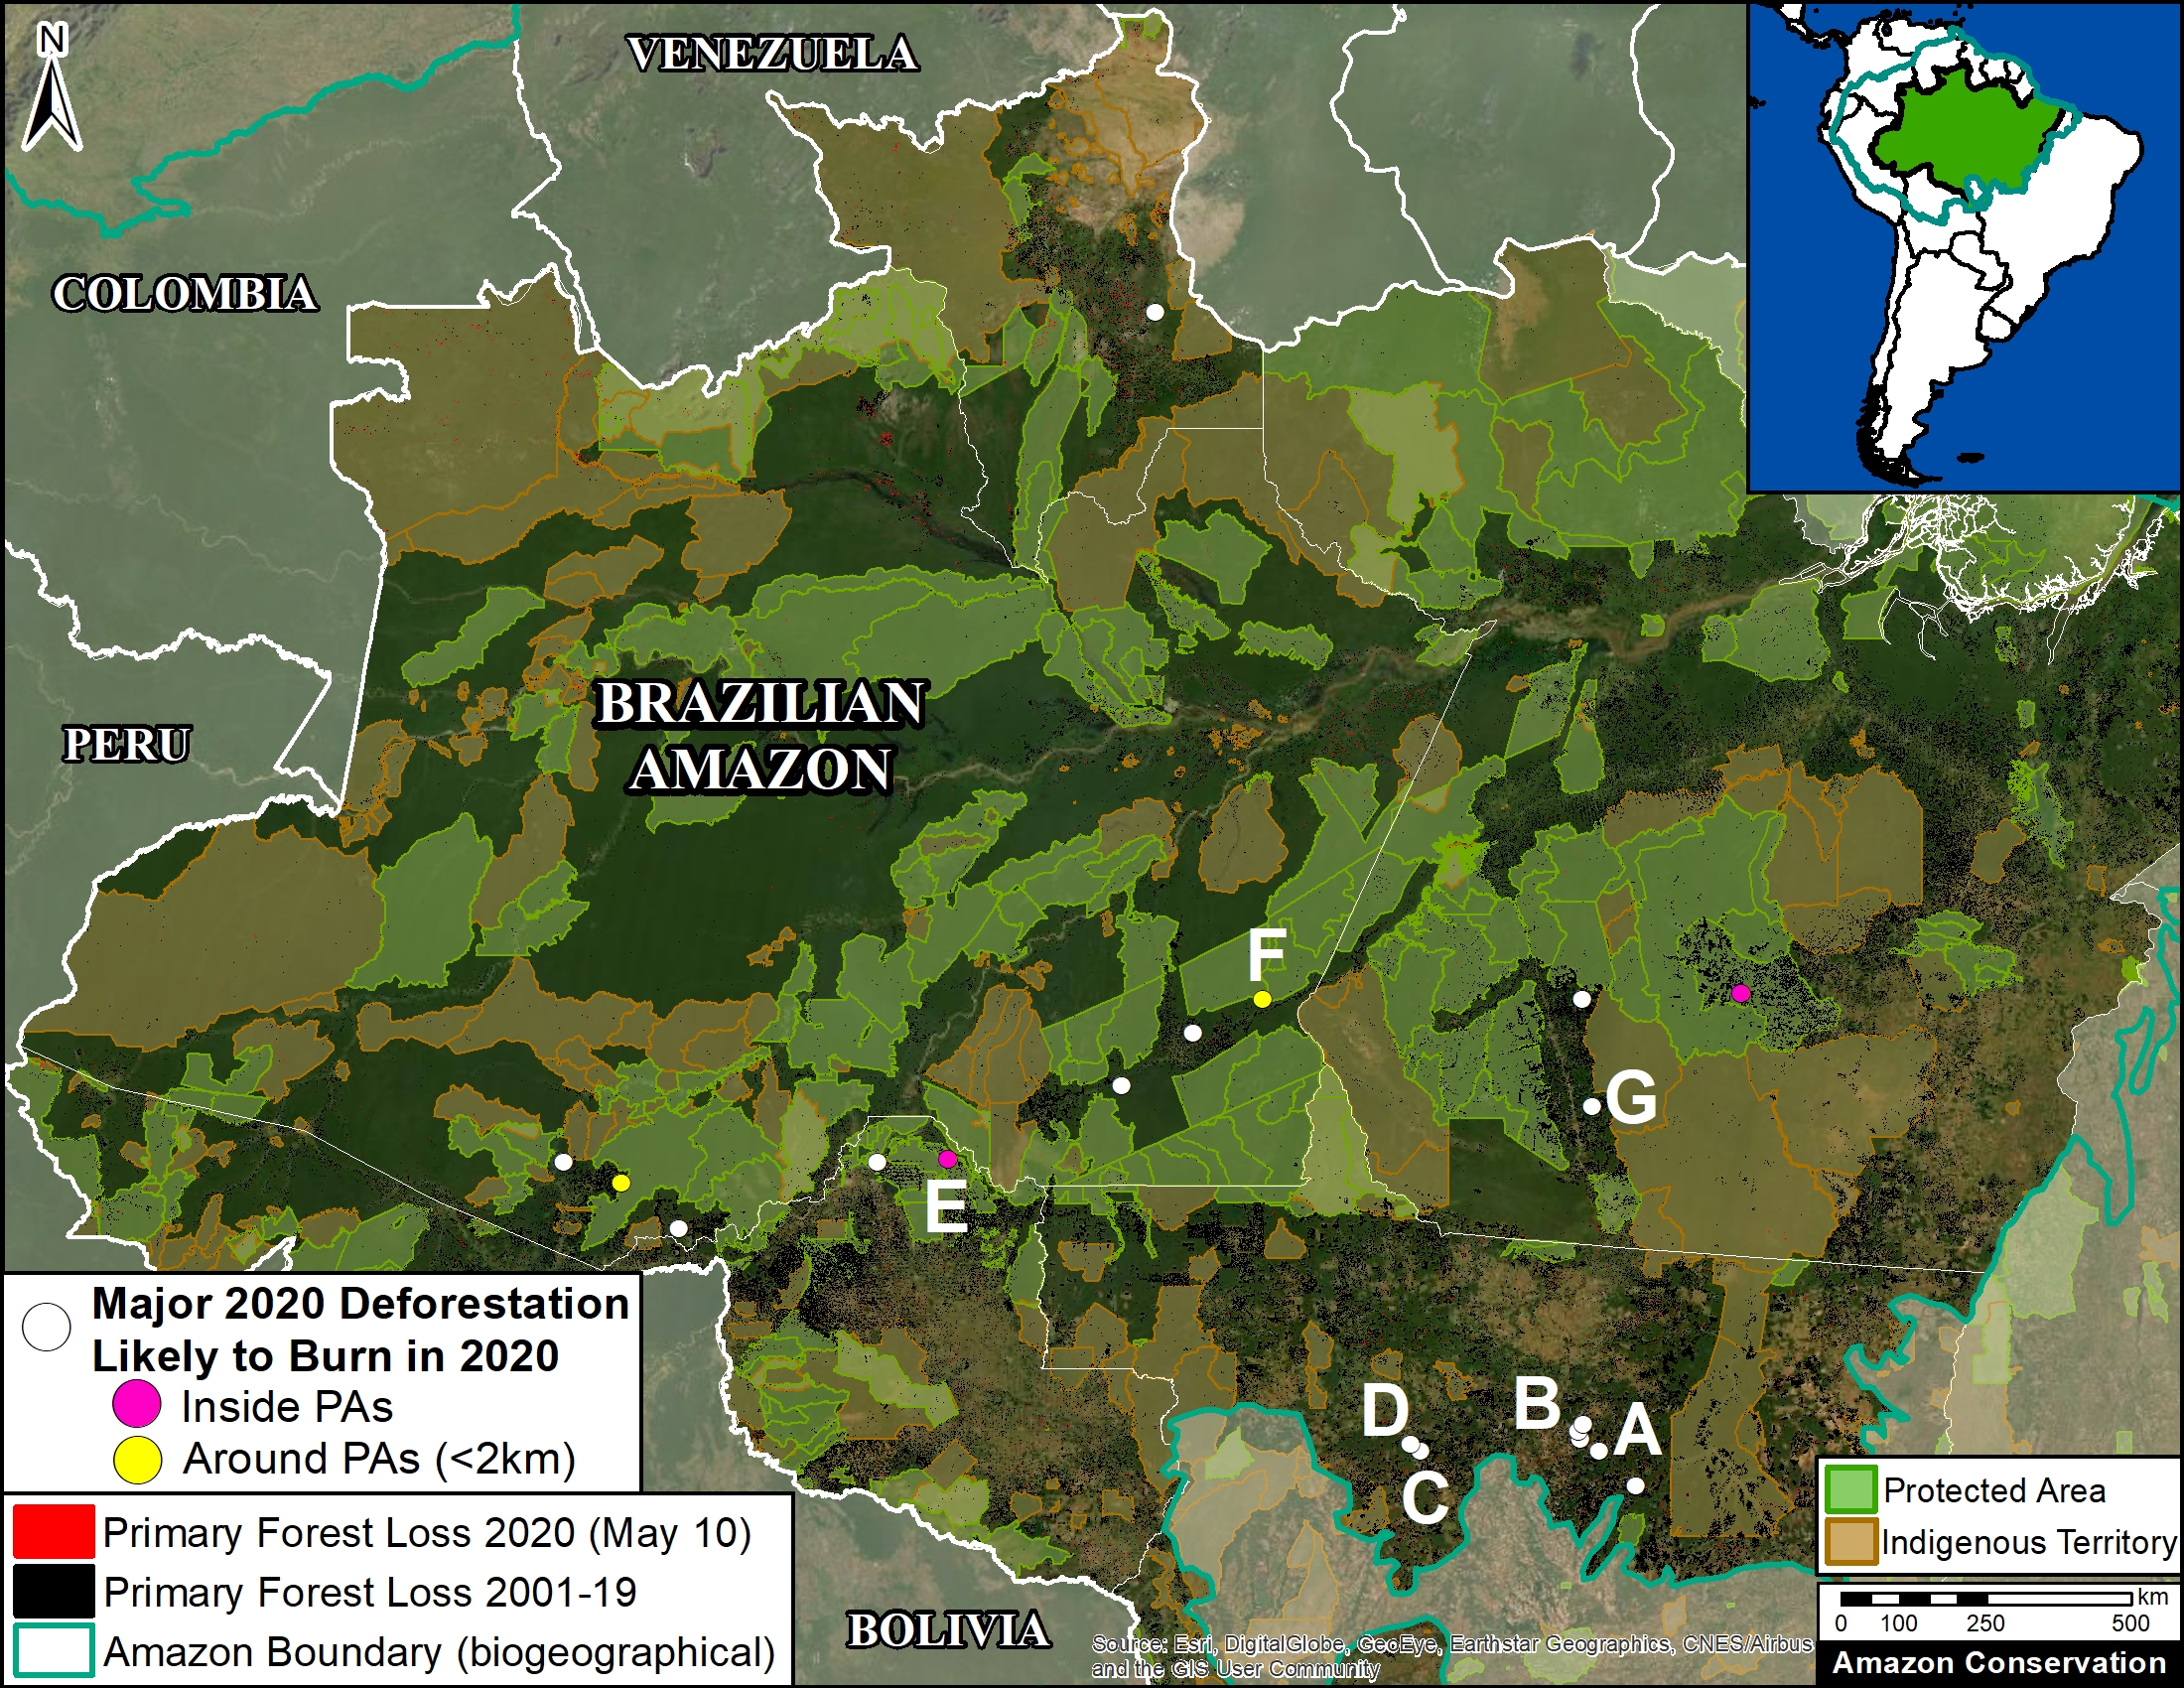
In the Base Map, the yellow dots indicate the largest new deforestation events that we predict are likely 2020 fire locations. See below for satellite imagery examples (letters A-G). Two of the likely fire points are within protected areas (see Annex).

Base Map. Major 2020 deforestation events (yellow dots) as predictors of 2020 fire events. Data: Hansen/UMD/Google/USGS/NASA, UMD/GLAD, RAISG, MAAP. Click to Enlarge.

Examples of Major 2020 Deforestation Events

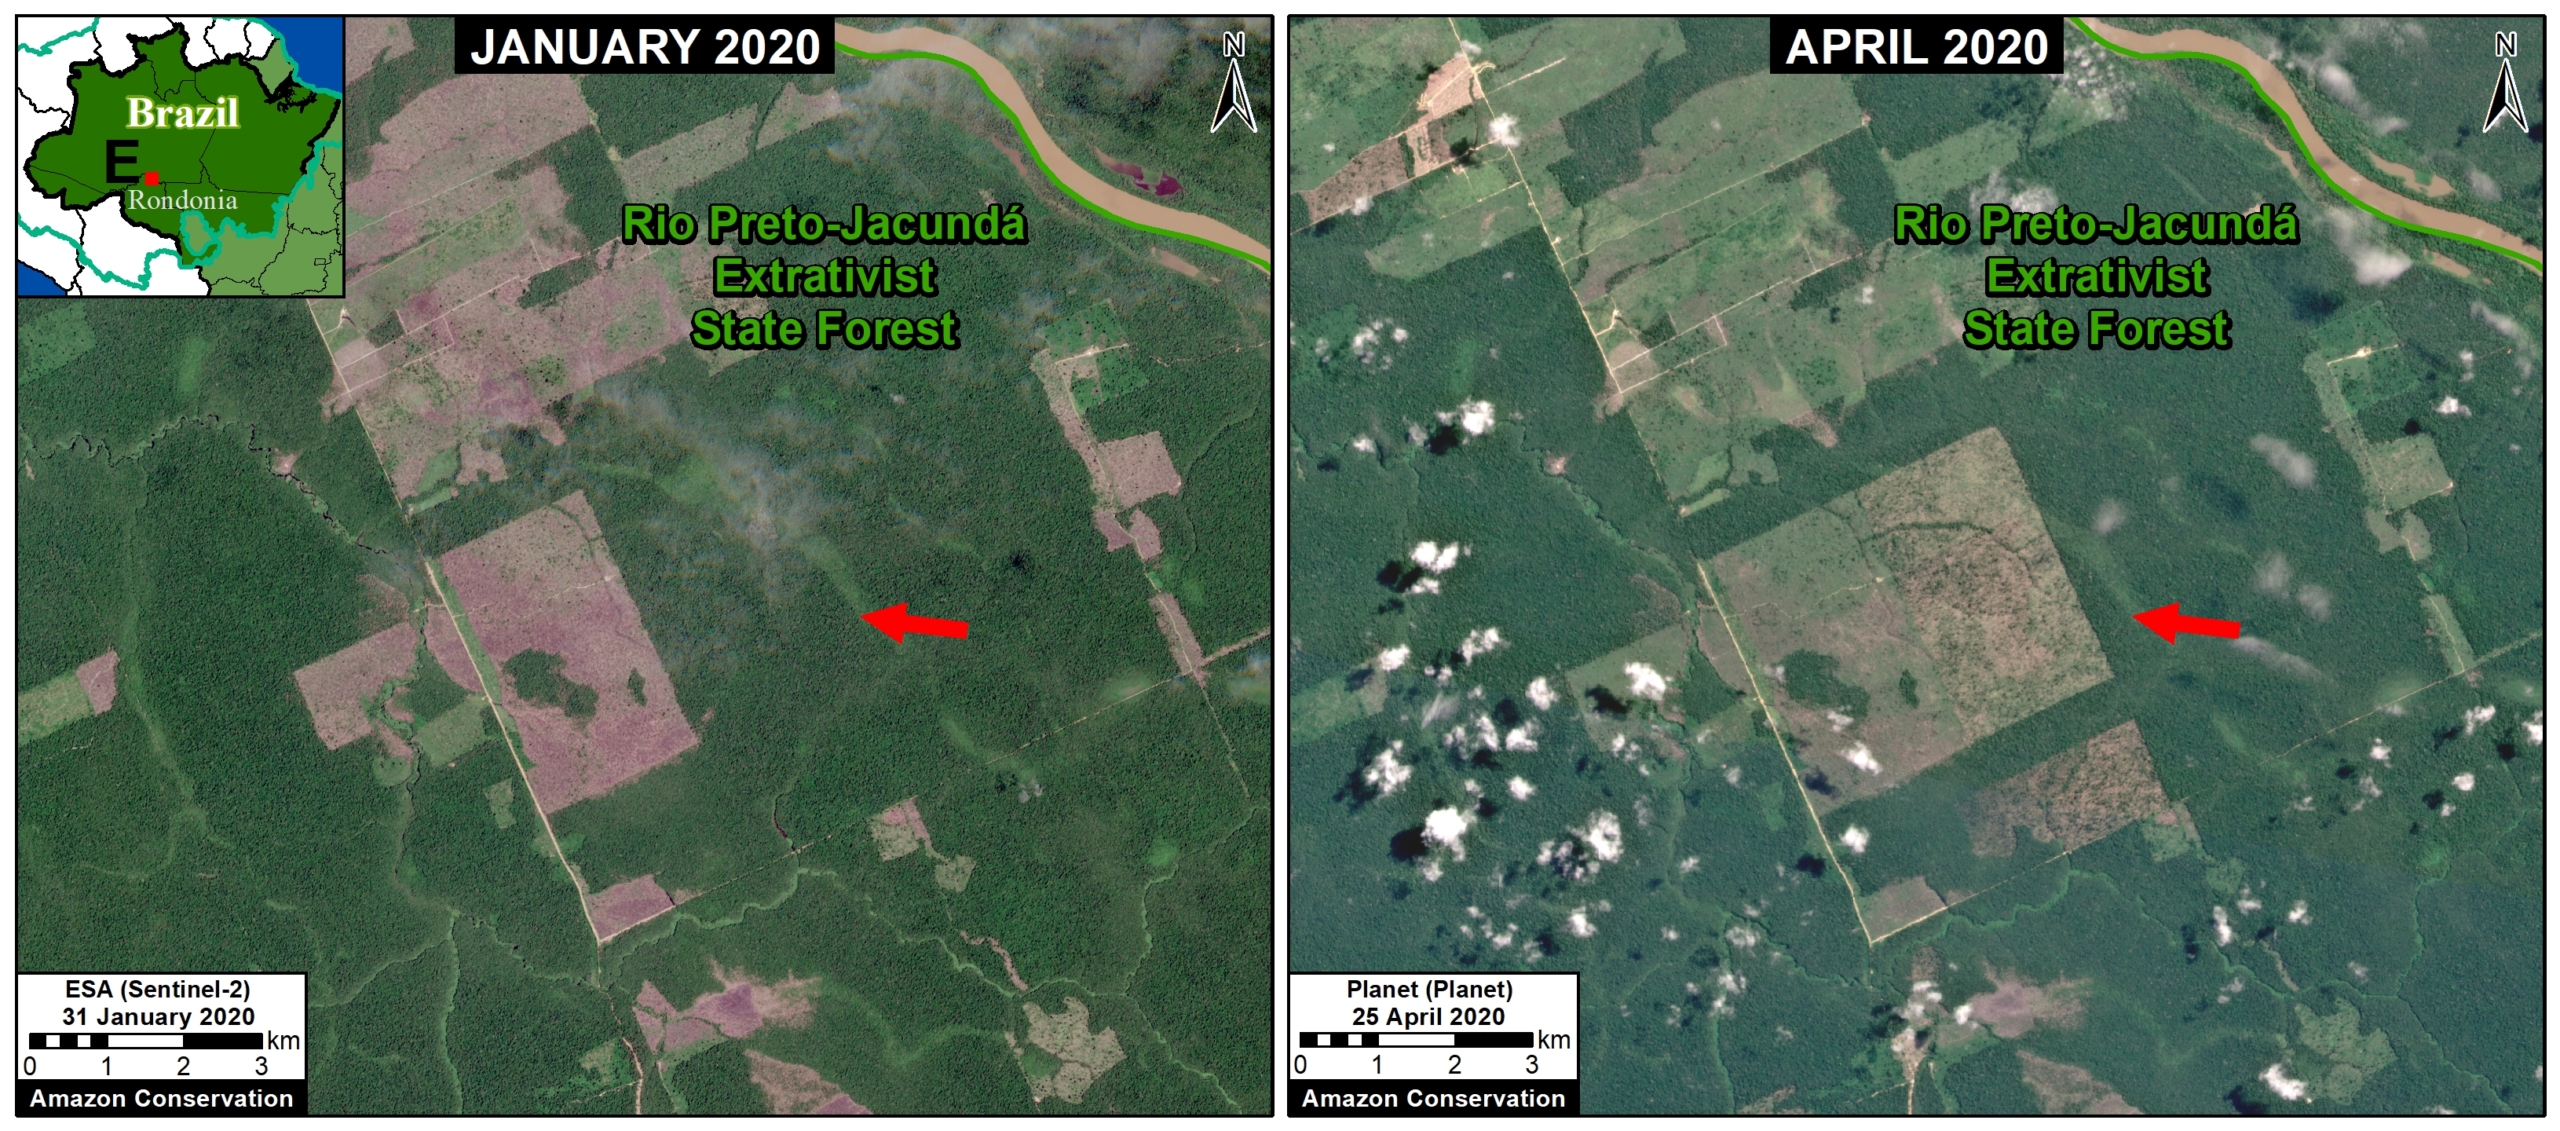
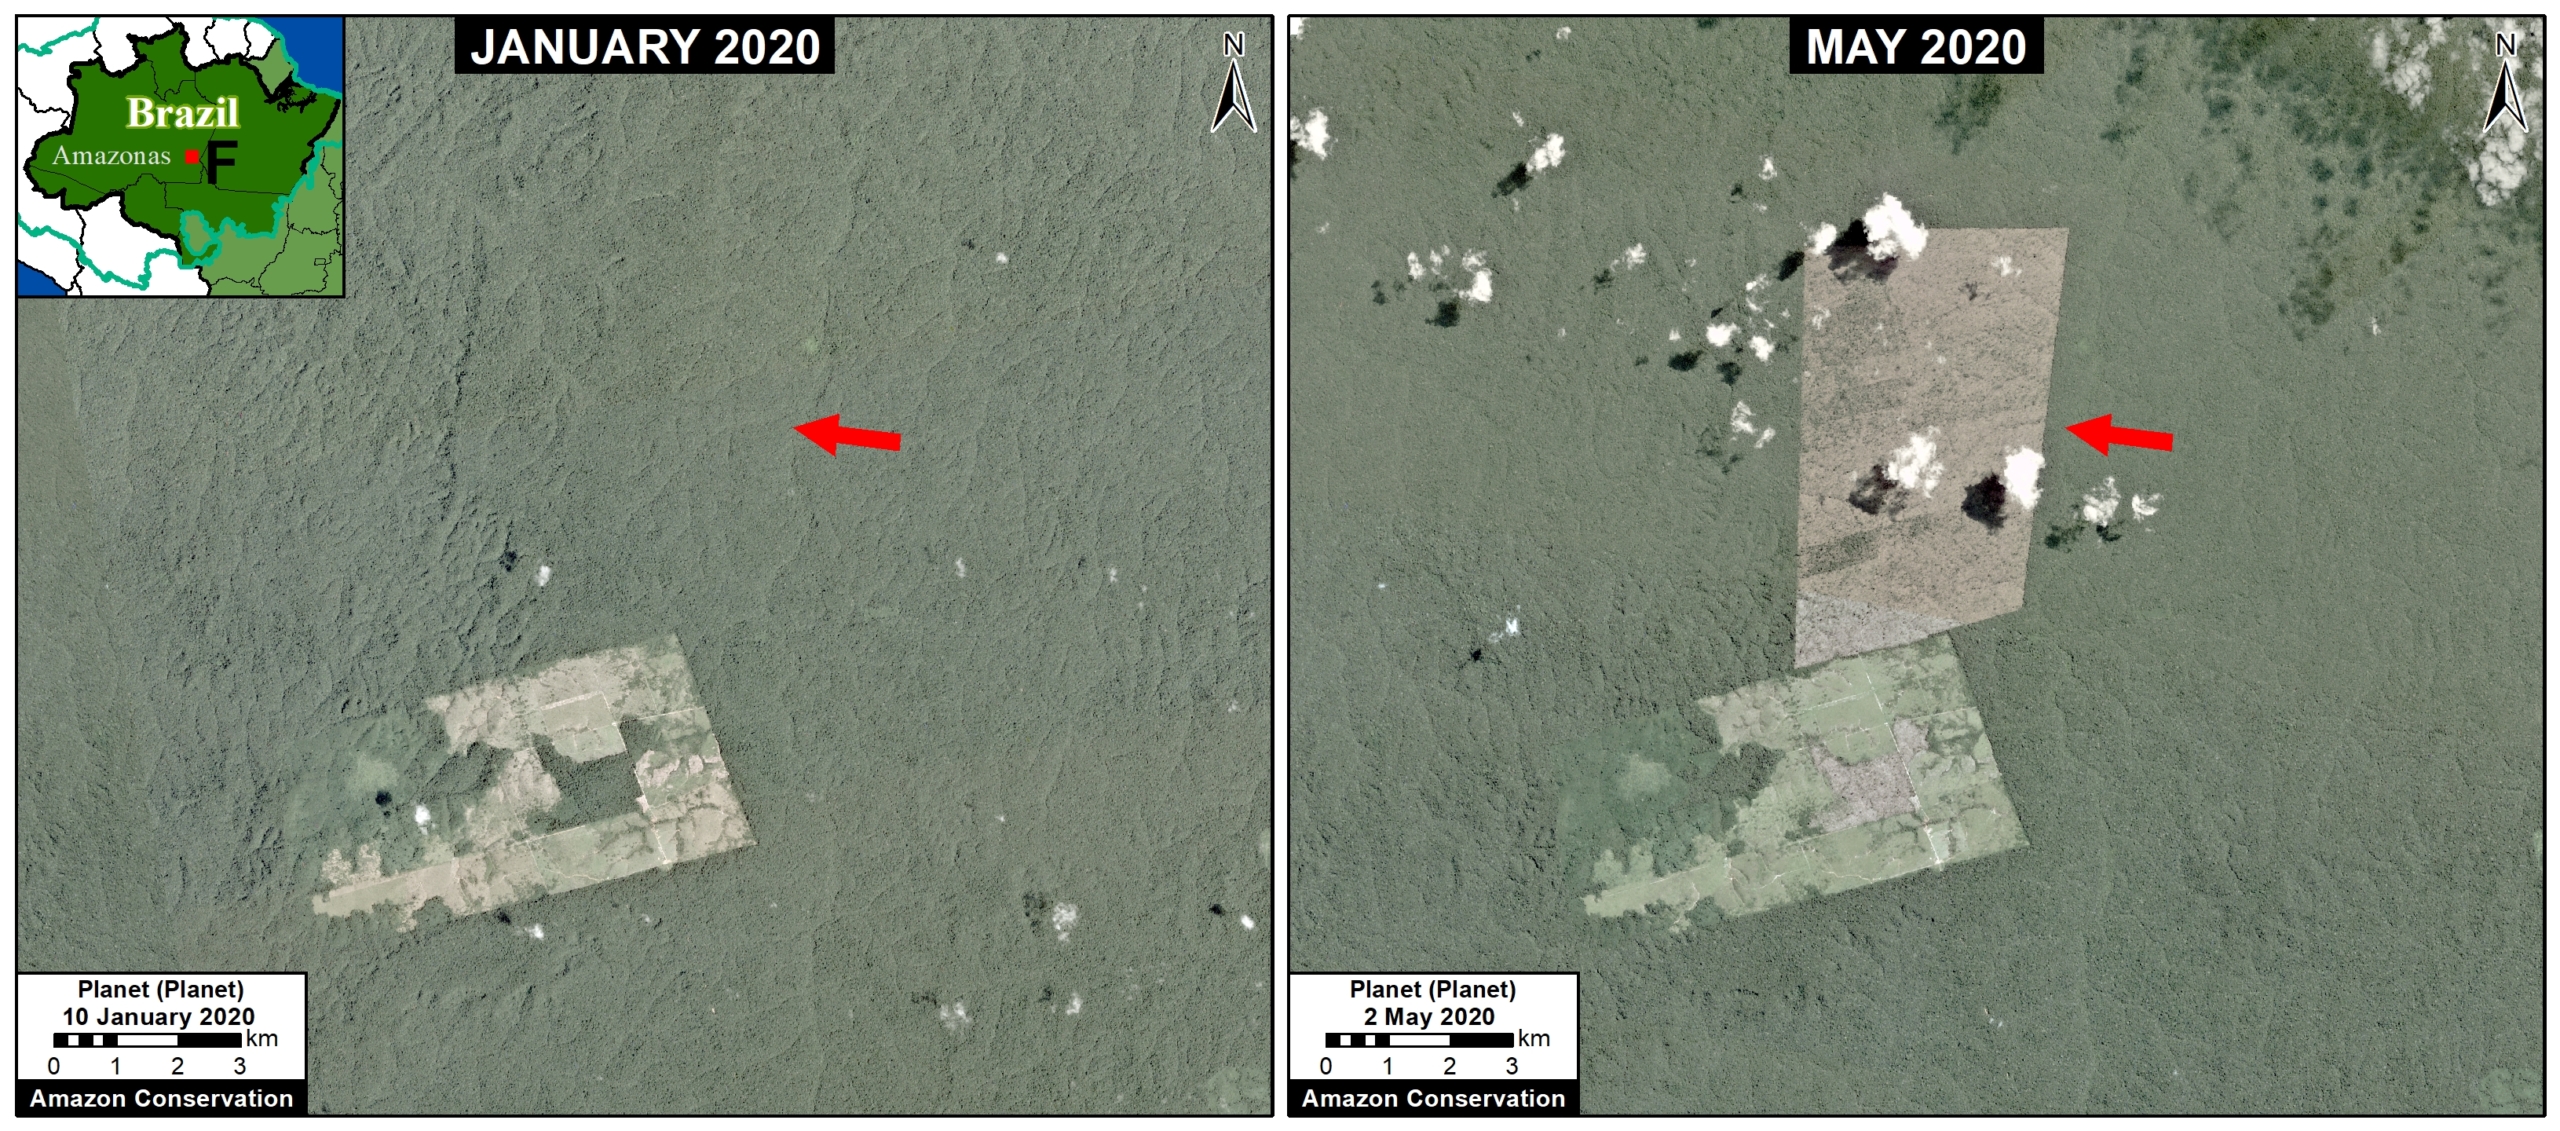
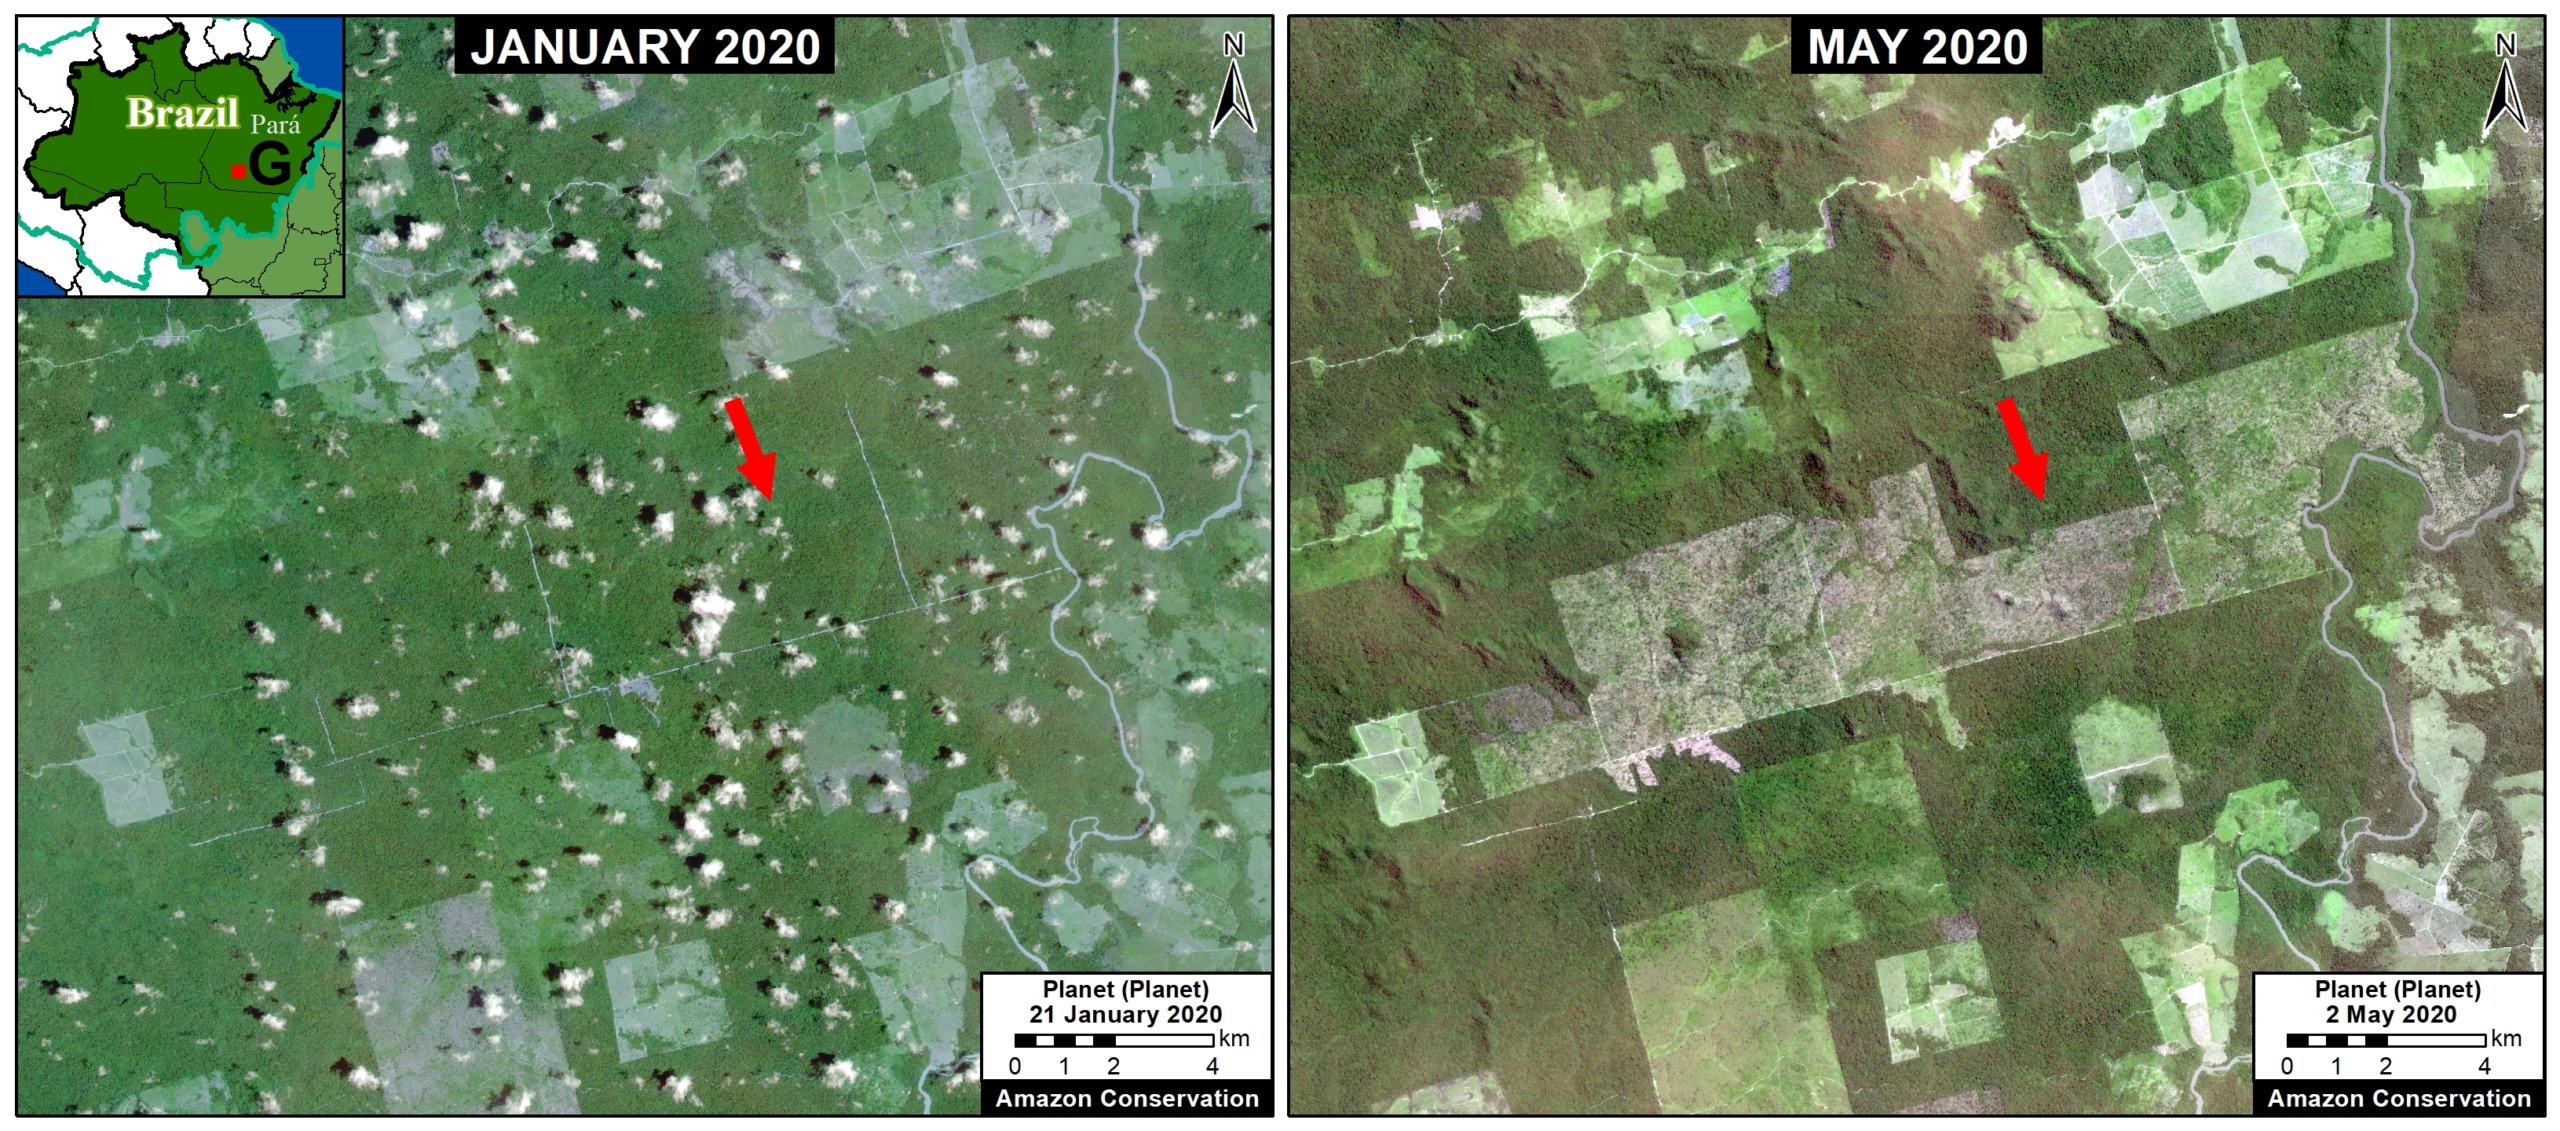
Below is a series of images showing the major deforestation events of 2020 that we predict are likely upcoming fire locations (see letters A-G on the Base Map above for context). The red arrows point to the major deforestation events. Note that all of the deforestation areas are surrounded by primary forest that could be impacted if fires escape. Also note that several deforestation areas are quite large, over 2,000 hectares (5,000 acres).

Zoom A (Mato Grosso)

Zoom A shows the deforestation of 775 hectares (1,915 acres) between January (left panel) and May 2020 (right panel), in the state of Mato Grosso.

Zoom A. Click to enlarge.

Zoom B (Mato Grosso)

Zoom B shows the deforestation of 205 hectares (510 acres) between January (left panel) and May 2020 (right panel), in the state of Mato Grosso.

Zoom B. Click to enlarge.

Zoom C (Mato Grosso)

Zoom C shows the deforestation of 395 hectares (980 acres) between January (left panel) and May 2020 (right panel), in the state of Mato Grosso.

Zoom C. Click to enlarge.

Zoom D (Mato Grosso)

Zoom D shows the deforestation of 300 hectares (735 acres) between January (left panel) and May 2020 (right panel), in the state of Mato Grosso.

Zoom D. Click to enlarge.

Zoom E (Rondônia)

Zoom E shows the deforestation of 840 hectares (2,075 acres) between January (left panel) and April 2020 (right panel), in the state of Rondônia.

Zoom F (Amazonas)

Zoom F shows the deforestation of 2,395 hectares (5,920 acres) between January (left panel) and May 2020 (right panel), in the state of Amazonas.

Zoom F. Click to enlarge.

Zoom G (Pará)

Zoom G shows the deforestation of 5,990 hectares (14,800 acres) between January (left panel) and May 2020 (right panel), in the state of Pará.

Zoom G. Click to enlarge.

Coordinates

World Eckert IV (Decimal Degrees) (X,Y)

Zoom A: -54.862624, -11.971904
Zoom B: -55.087026, -11.836788
Zoom C: -56.999405, -11.979054
Zoom D: -57.128192, -11.896948
Zoom E: -62.658907, -8.477944
Zoom F: -58.892358, -6.567775
Zoom G: -54.948419, -7.853721

2020 Fire Forecast

The July – September 2020 forecast points to an active fire season in most of the western Amazon – much of central and southern Peru, northern Bolivia and the Brazilian states of Acre and Rondônia. This year’s forecast indicates an active fire season of similar magnitude to those of 2005 and 2010, when widespread fires were observed in the region.

To more information check:https://firecast.cast.uark.edu/

Annex – Likely 2020 fire locations in relation to Protected Areas and Indigenous Territories


Methodology

*We developed a novel methodology to estimate deforestation of primary forest in the Brazilian Amazon. For 2020 data, we merged confirmed GLAD alerts (University of Maryland) with select DETER alerts from the Brazilian space  agency (INPE). This methodology takes advantage of the higher resolution of the GLAD alerts (30 meters vs 64 meters from DETER), but also the national expertise of the Brazilian government.

For the DETER data, we used the three deforestation and mining categories (DESMATAMENTO CR, DESMATAMENTO Vegetal, and MINERACAO). We avoided overlapping areas with the GLAD alerts.

Finally, we filtered the data for only primary forest loss. For our estimate of primary forest loss, we intersected the forest cover loss data with the additional dataset “primary humid tropical forests” as of 2001 (Turubanova et al 2018). We also removed all previous forest loss data 2001-19.

Acknowledgements

We thank J. Beavers, S. Novoa, K. Fernandes, and G. Palacios for helpful comments to earlier versions of this report.

This work was supported by the following major funders: Global Forest Watch Small Grants Fund (WRI), Norwegian Agency for Development Cooperation (NORAD),  International Conservation Fund of Canada (ICFC), Metabolic Studio, and Erol Foundation.

Citation

Finer M, Mamani N (2020) Deforestation and Fires in the Brazilian Amazon – 2020. MAAP:

MAAP #118: Aplicativo de monitoramento de incêndios na Amazônia em tempo real

Imagem 1. Primeiro grande incêndio na Amazônia em 2020, em Mato Grosso, Brasil. Dados: Planet.

A tempo para a próxima temporada de incêndios, estamos relançando uma versão aprimorada do nosso  aplicativo de monitoramento de incêndios em tempo real da Amazon , hospedado pelo Google Earth Engine.

Quando os incêndios queimam, eles emitem gases e aerossóis.* Um novo satélite (Sentinel-5P da Agência Espacial Europeia) detecta essas  emissões de aerossóis .*

O principal recurso do aplicativo é  a identificação fácil de usar e em tempo real de grandes incêndios  na Amazônia, com base nas emissões de aerossóis detectadas pelo Sentinel-5P.

O aplicativo também contém os comumente usados ​​“ alertas de incêndio ”, que são dados baseados em satélite de anomalias de temperatura.*
.
Assim, o usuário combina dados da atmosfera (aerossol) com dados do solo (temperatura) para  identificar a origem dos grandes incêndios .

Como os dados são atualizados diariamente e não são impactados por nuvens,  o monitoramento em tempo real  realmente é possível. Nossa meta é carregar a nova imagem de cada dia até a meia-noite.

Usando o aplicativo, identificamos recentemente o primeiro grande incêndio na Amazônia de 2020 em 28 de maio, no estado do Mato Grosso, no Brasil. Ele estava queimando uma área recentemente desmatada em julho de 2019.

Abaixo, fornecemos instruções sobre como usar o aplicativo, usando o incêndio de 28 de maio como exemplo.


Instruções e
como identificamos o primeiro grande incêndio na Amazônia brasileira em 2020

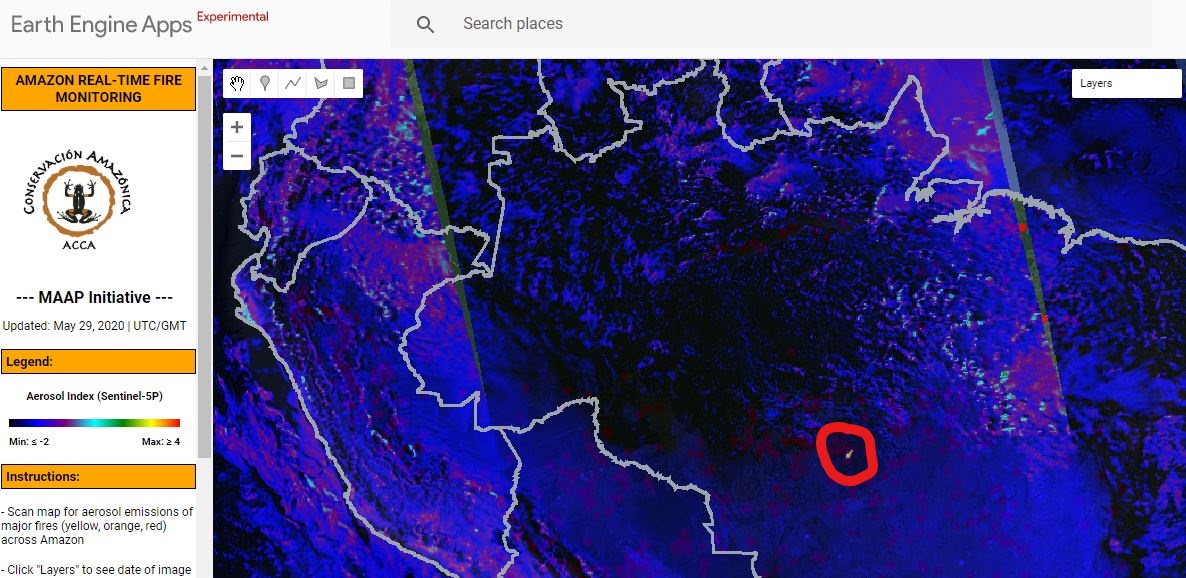
Etapa 1. Abra o aplicativo de monitoramento de incêndios em tempo real , hospedado pelo Google Earth Engine. Examine a Amazônia em busca de  emissões de aerossóis de grandes incêndios (indicados em amarelo, laranja e vermelho ). Neste caso, identificamos emissões elevadas no sudeste da Amazônia brasileira (em 28 de maio de 2020).


Etapa 2. Clique no menu “ Layers ” no canto superior direito para mais opções. Por exemplo, clicando em “ State/Department Boundaries ” vemos que as emissões estão vindo do Mato Grosso. Note que você também pode adicionar “ Protected Areas ” e verificar as datas das imagens e alertas.

Etapa 3. Aumente o zoom nas emissões de aerossóis.

Etapa 4. Ajuste (deslize para baixo) a transparência da camada de emissões para ver os alertas de incêndio subjacentes . Usamos os alertas para localizar a fonte das emissões (veja o círculo roxo). Obtenha as coordenadas dos alertas clicando no mapa e, em seguida, verificando a barra “Coordenadas” à esquerda (abaixo das Instruções).

Etapa 5. Entramos com as coordenadas no Planet Explorer e encontramos uma imagem de alta resolução para o mesmo dia (28 de maio), confirmando o primeiro grande incêndio na Amazônia de 2020. A área queimada foi de 357 hectares (882 acres).

Previsão dos incêndios na Amazônia brasileira em 2020

Usando o arquivo Planet, descobrimos que essa área exata foi desmatada entre julho e agosto de 2019 e depois queimada em maio de 2020. Isso se encaixa em nossa descoberta importante recente de que muitos incêndios na Amazônia brasileira estão, na verdade, queimando áreas recentemente desmatadas ( MAAP #113 ). Para mais informações sobre como prever incêndios futuros com base no desmatamento recente, consulte MAAP #119 .

Previsão de incêndios para 2020

A previsão de julho a setembro de 2020 aponta para uma temporada ativa de incêndios na maior parte da Amazônia ocidental – grande parte do centro e sul do Peru, norte da Bolívia e os estados brasileiros do Acre e Rondônia. A previsão deste ano indica uma temporada ativa de incêndios de magnitude semelhante às de 2005 e 2010, quando incêndios generalizados foram observados na região.

Para mais informações, consulte: https://firecast.cast.uark.edu/

*Notas

  • Definição de aerossol: Suspensão de partículas sólidas finas ou gotículas de líquido no ar ou outro gás.
  • Os altos valores nos índices de aerossol (AI) também podem ser devidos a outras razões, como emissões de cinzas vulcânicas ou poeira do deserto. Por isso, algumas áreas, como o Salar de Uyuni, no oeste da Bolívia, frequentemente apresentam tons alaranjados ou vermelhos.
  • A resolução espacial dos dados do aerossol é de 7,5 km²
  • Os alertas de incêndio são dados de satélite de anomalias de temperatura no solo com resolução de 375 m
  • Coordenadas do primeiro grande incêndio na Amazônia em 2020: 11,92° S, 54,06°
  • Aqui está o link para uma breve história sobre o segundo grande incêndio na Amazônia em 2020 , também no Mato Grosso, em 8 de junho. Ele queimou uma área desmatada em 2018. Coordenadas: 12,56° S, 54,03° W.

Referências

Gorelick, N., Hancher, M., Dixon, M., Ilyushchenko, S., Thau, D., & Moore, R. (2017). Google Earth Engine: Análise geoespacial em escala planetária para todos. Sensoriamento remoto do ambiente.”
https://earthengine.google.com/faq/

Agradecimentos

Agradecemos a E. Ortiz, S. Novoa, K. Fernandes, G. Palacios pelos comentários úteis às versões anteriores deste relatório.

Este trabalho foi apoiado pelos seguintes financiadores principais: USAID/NASA (SERVIR), Global Forest Watch Small Grants Fund (WRI), Agência Norueguesa para Cooperação para o Desenvolvimento (NORAD), Fundo Internacional de Conservação do Canadá (ICFC), Metabolic Studio e Erol Foundation.

Citação

Finer M, Villa L, Mamani N (2020) Aplicativo de monitoramento de incêndios na Amazônia em tempo real. MAAP: #118.

MAAP #117: New Oil Road Deeper into Yasuni National Park (Ecuador), Towards Uncontacted Indigenous Reserve

Yasuní National Park, located in the heart of the Ecuadorian Amazon, is one of the most biodiverse spots in the world and overlaps ancestral Waorani territory. In the recent MAAP #114, we showed the construction of four new oil drilling platforms (and access road) in the controversial ITT oil block, located in the heart of Yasuní.

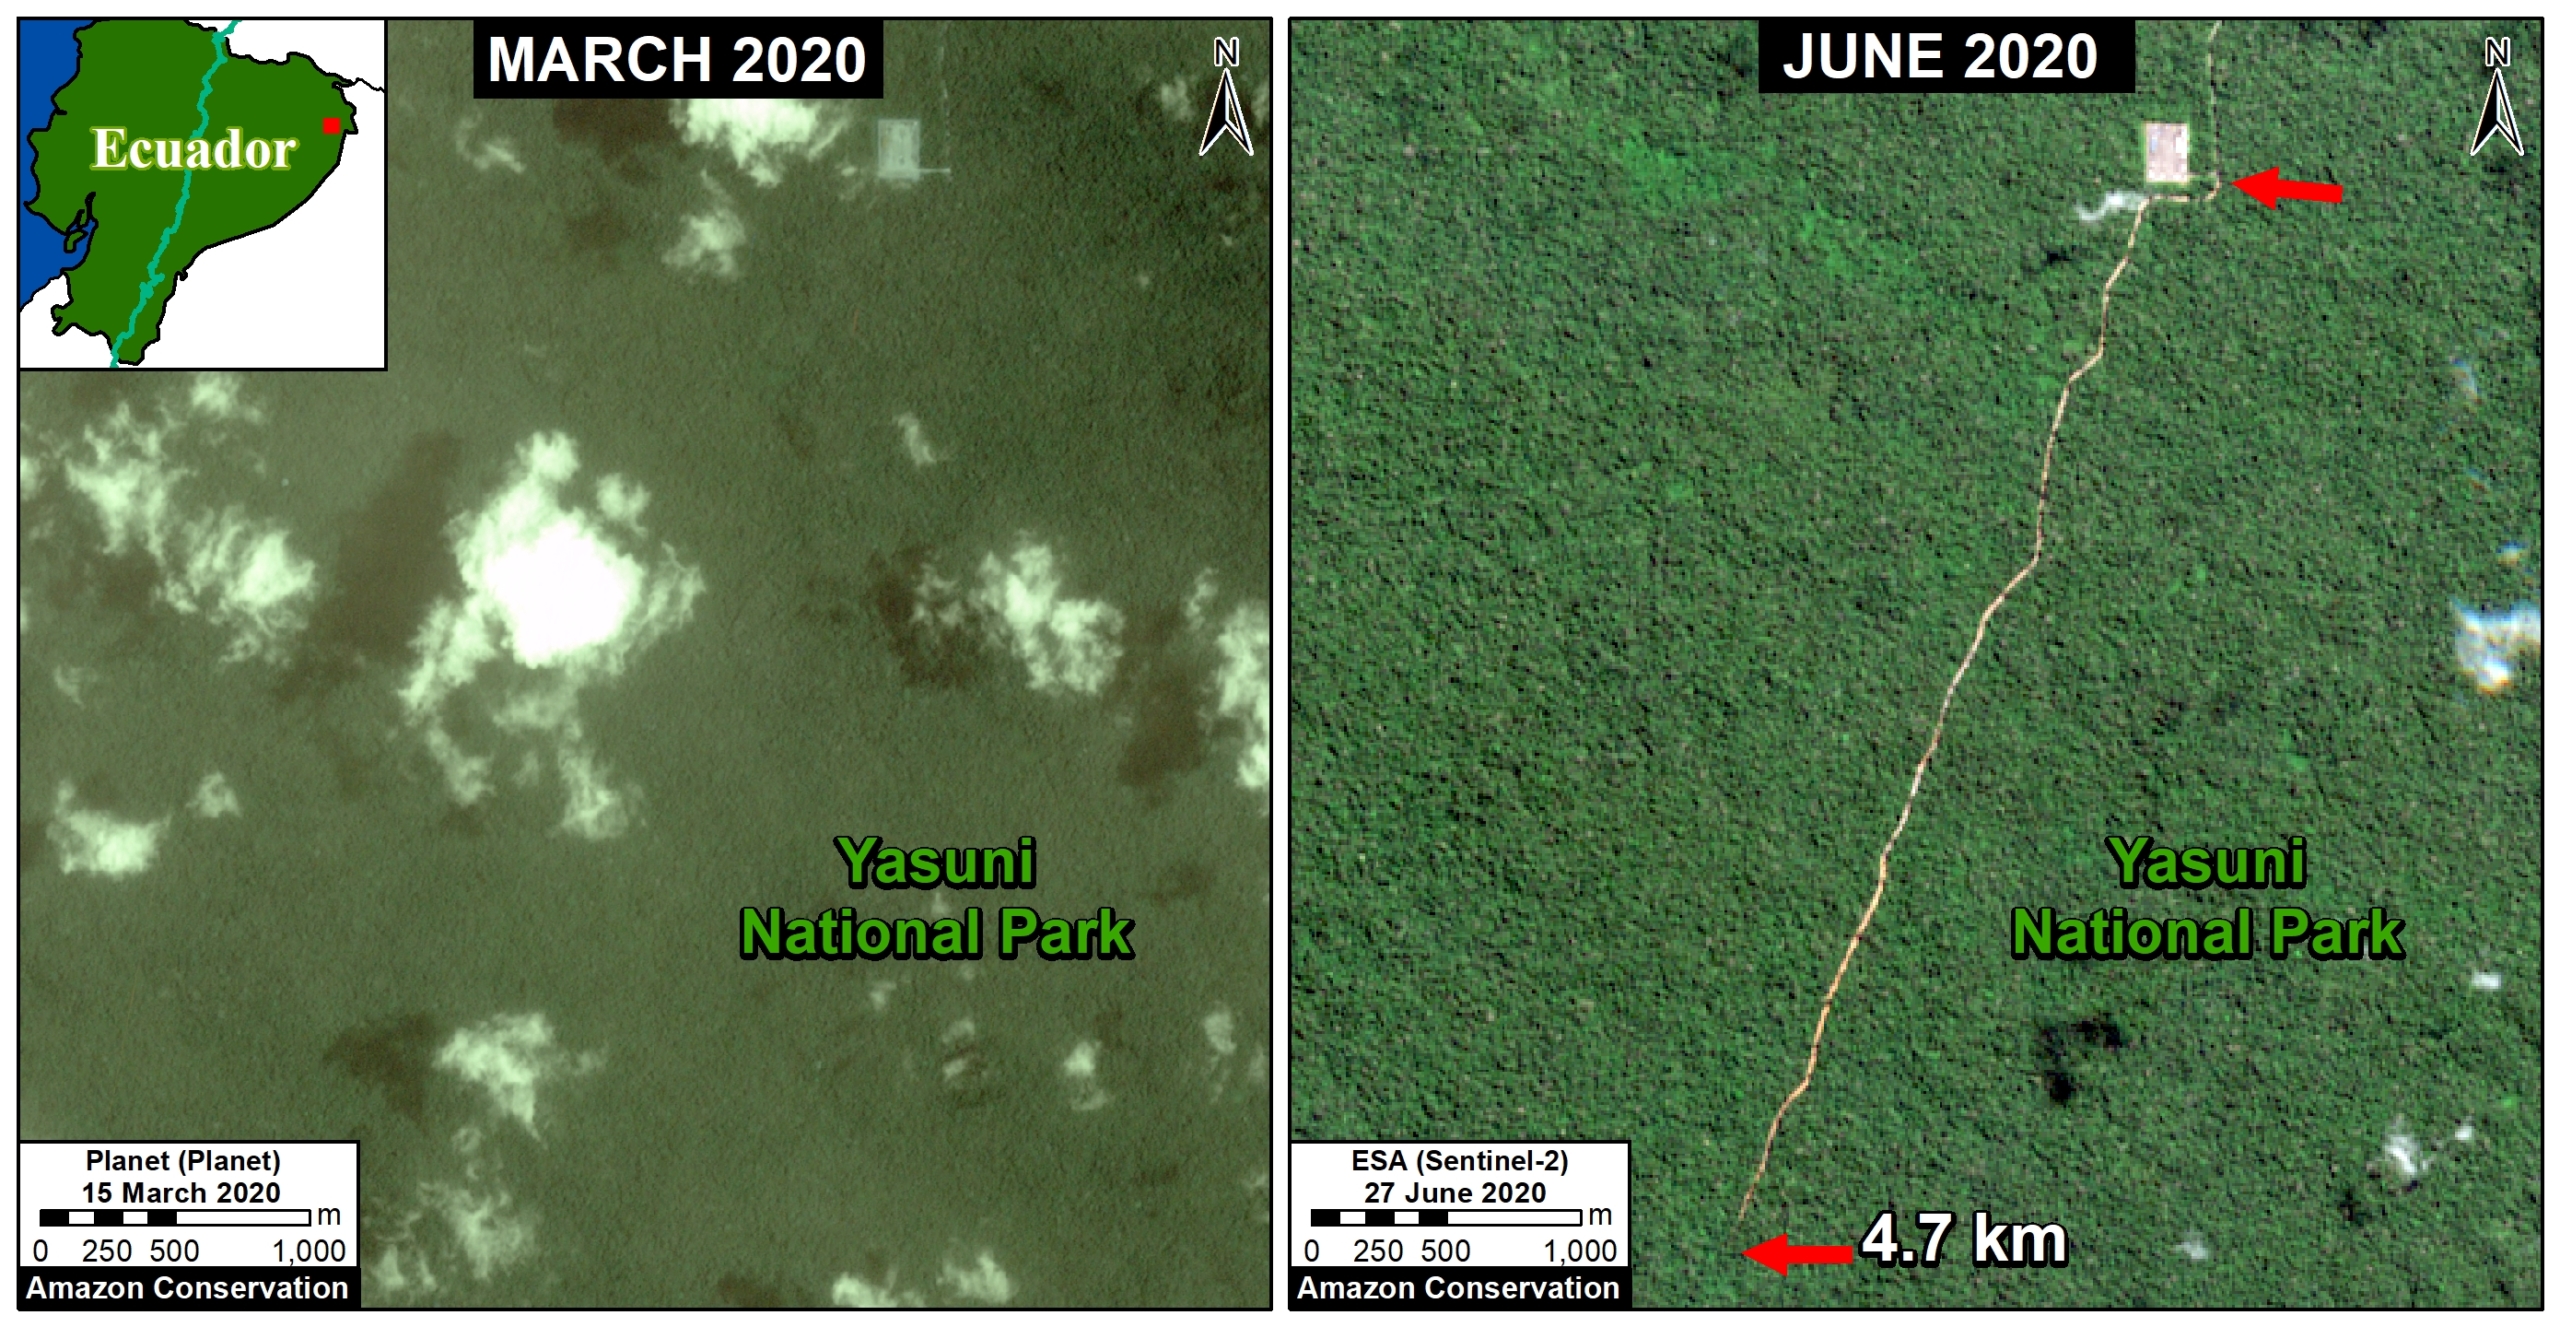
Here, we show that, beginning in mid-March 2020, we detected the construction of a new access road heading further south from the last platform (Image 1). As of early May, this road construction was 4.7 km through primary forest.

Updated: June 30 (4.7 km); June 14 (3.7 km); May 17 (2.2 km).

Image 1. Construction of a new 4.7 km oil access road deeper into Yasuni National Park between March (left panel) and June (right panel) 2020. Click to enlarge.

Implications of the New Oil Road

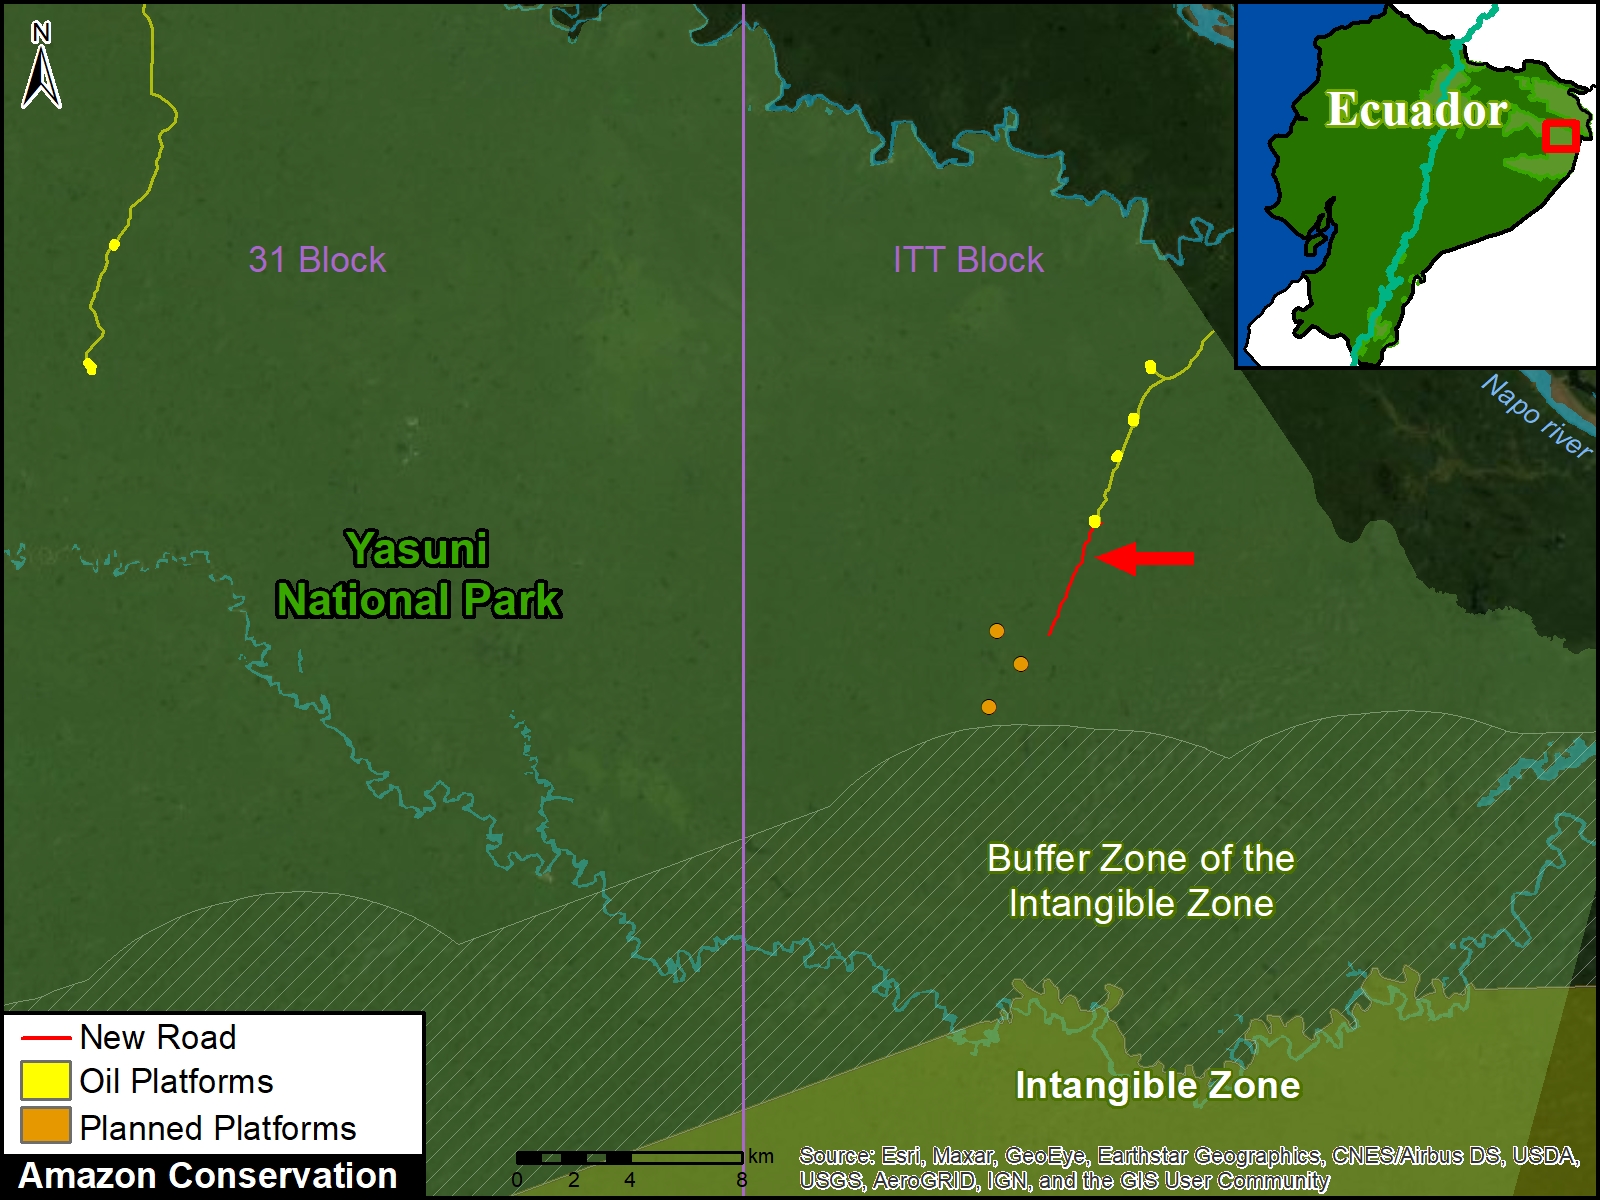
This finding is concerning because it brings oil development closer to the “Zona Intangible,” a reserve created to protect the territory of indigenous people in voluntary isolation (Tagaeri, Taromenane), isolated relatives of the Waorani.

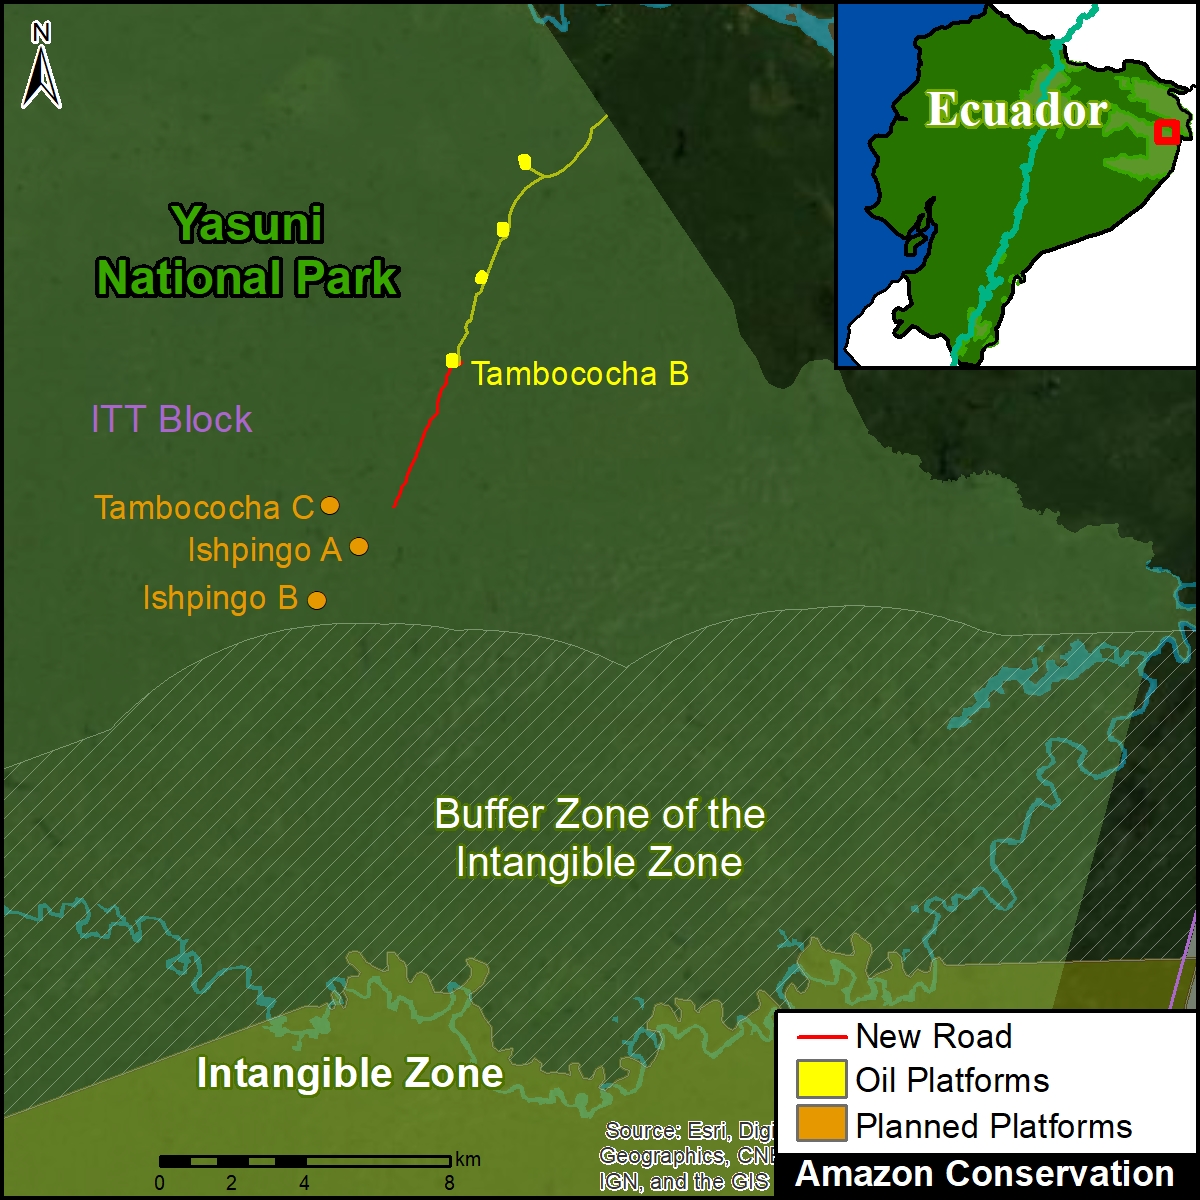
In Image 2, the location of the new road (indicated in red) is shown approaching several planned oil drilling platforms just outside the buffer zone of the Zona Intangible. Image 3 shows a zoom of this area.

It is also concerning because construction is occurring during the coronavirus pandemic.

Image 2. The new oil acces road (in red) approaching the Zona Intangible.

Very High Resolution Image

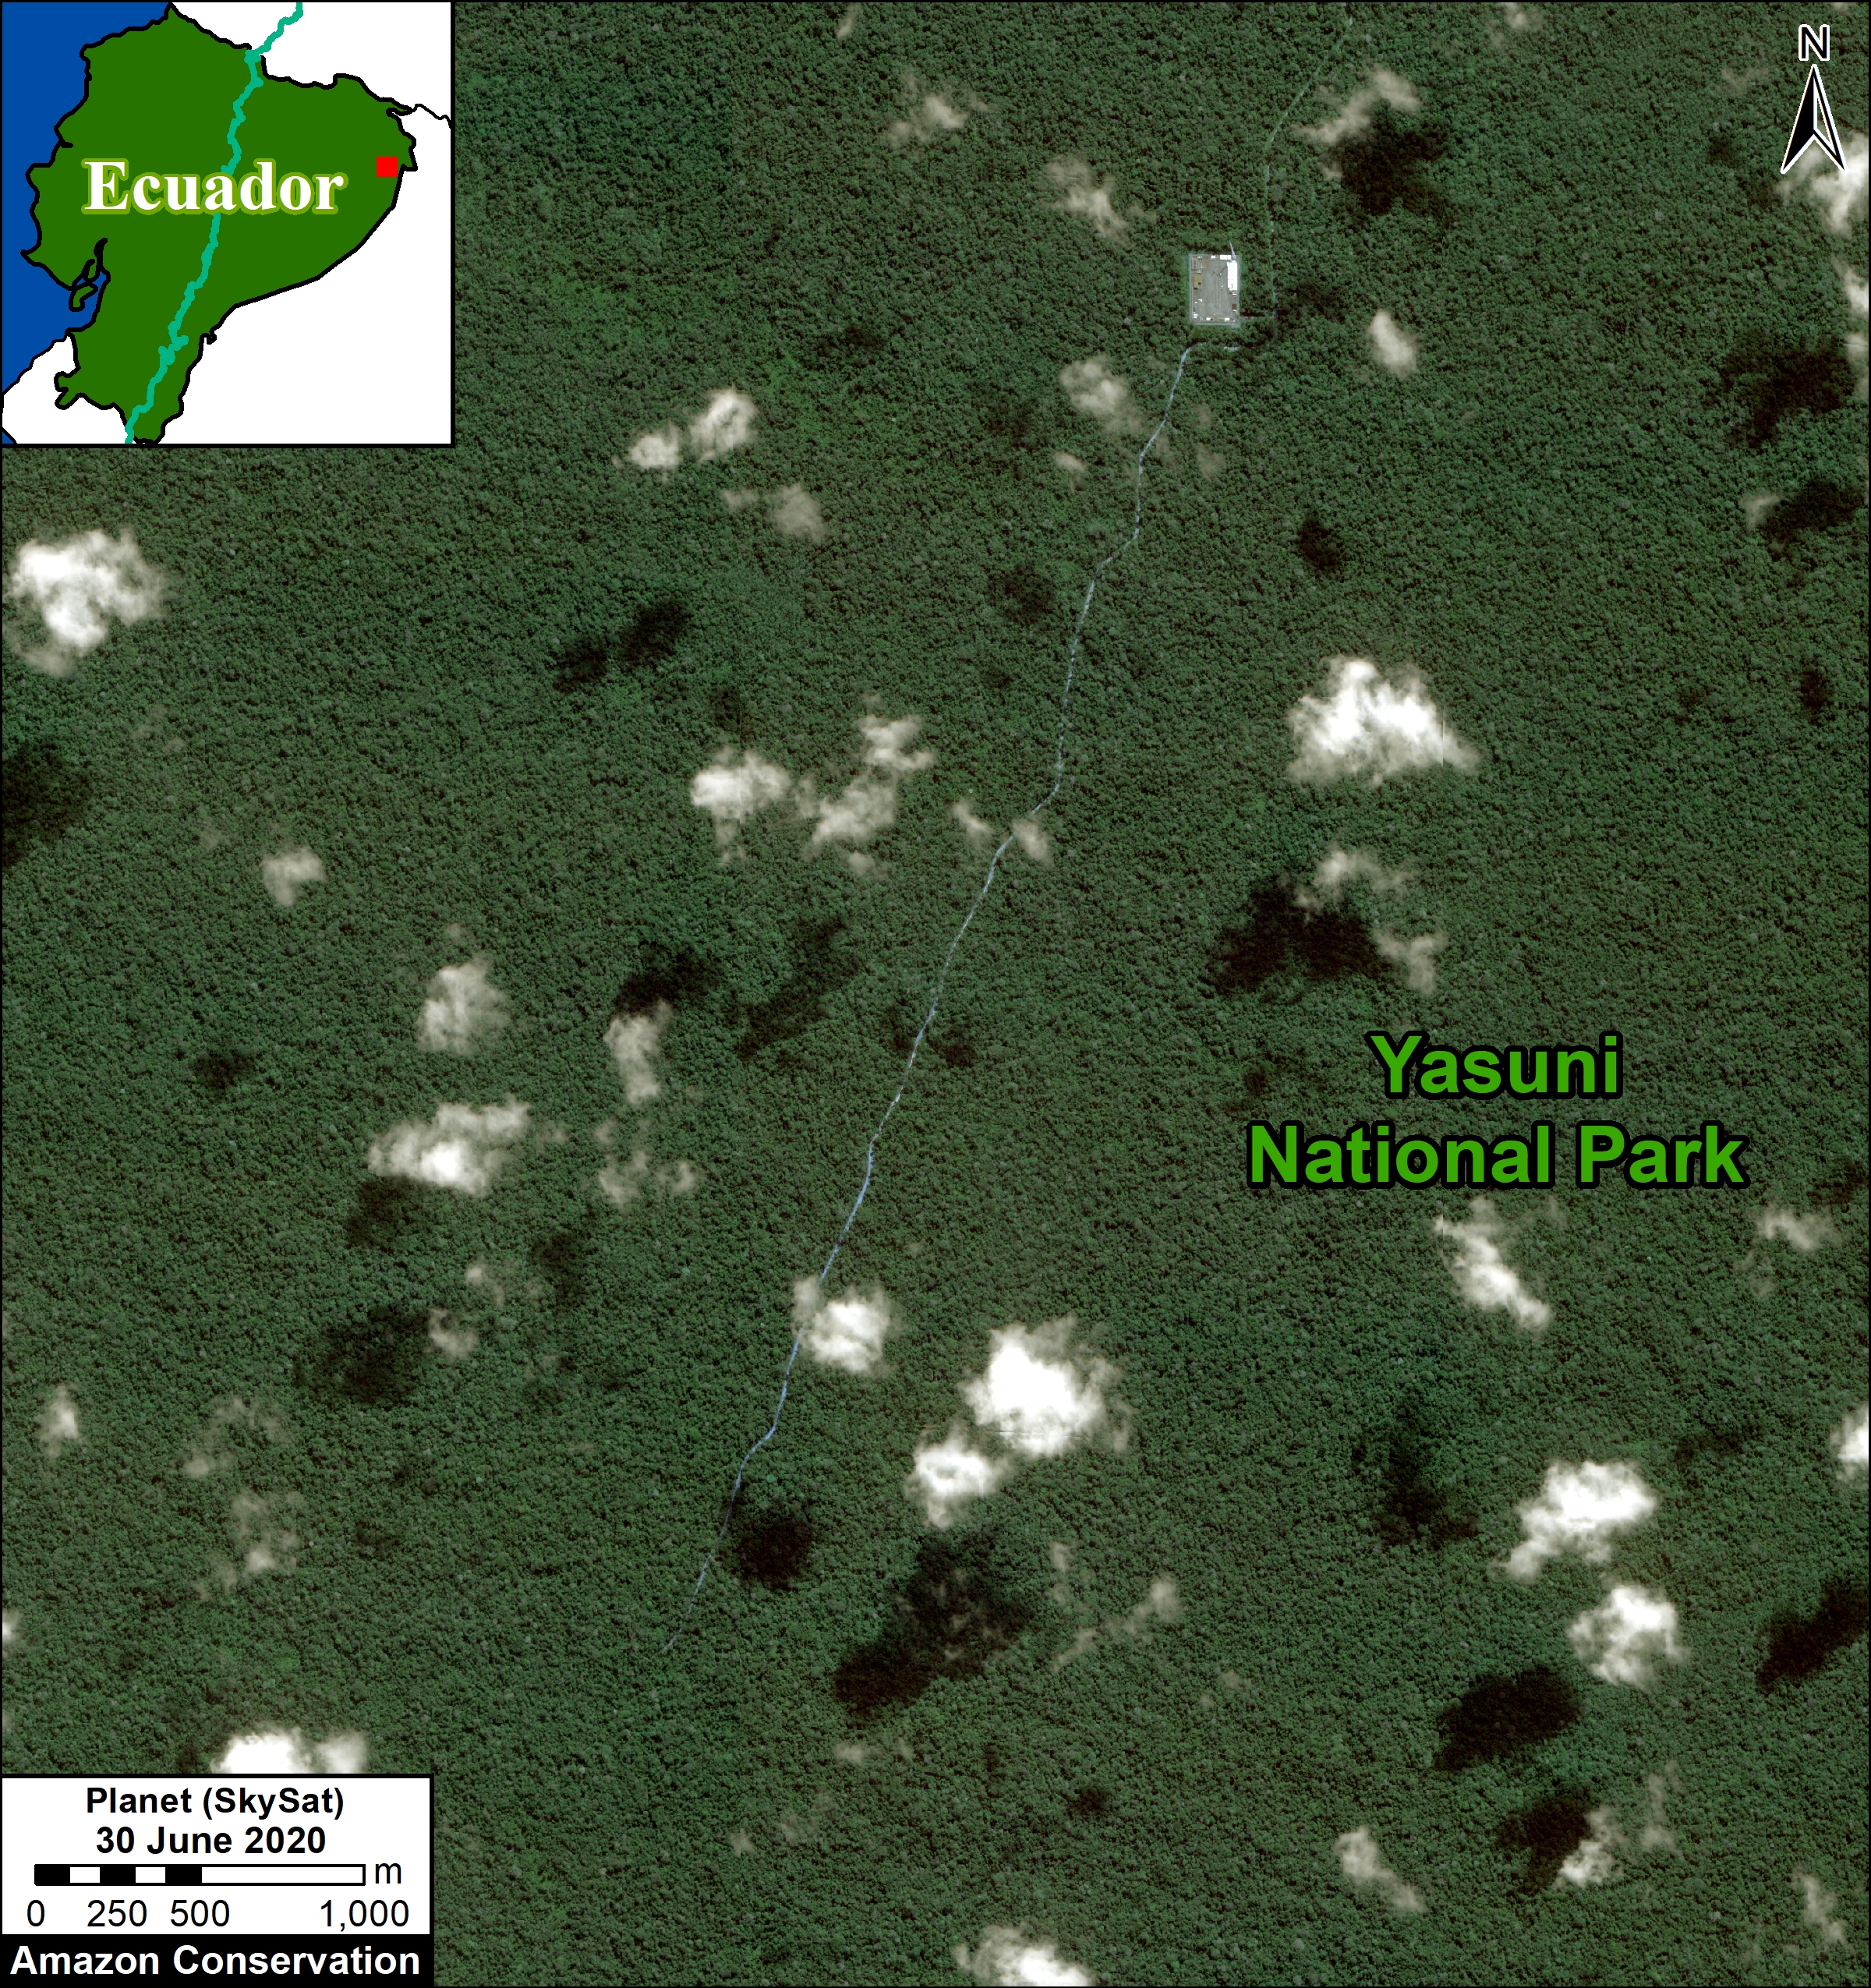
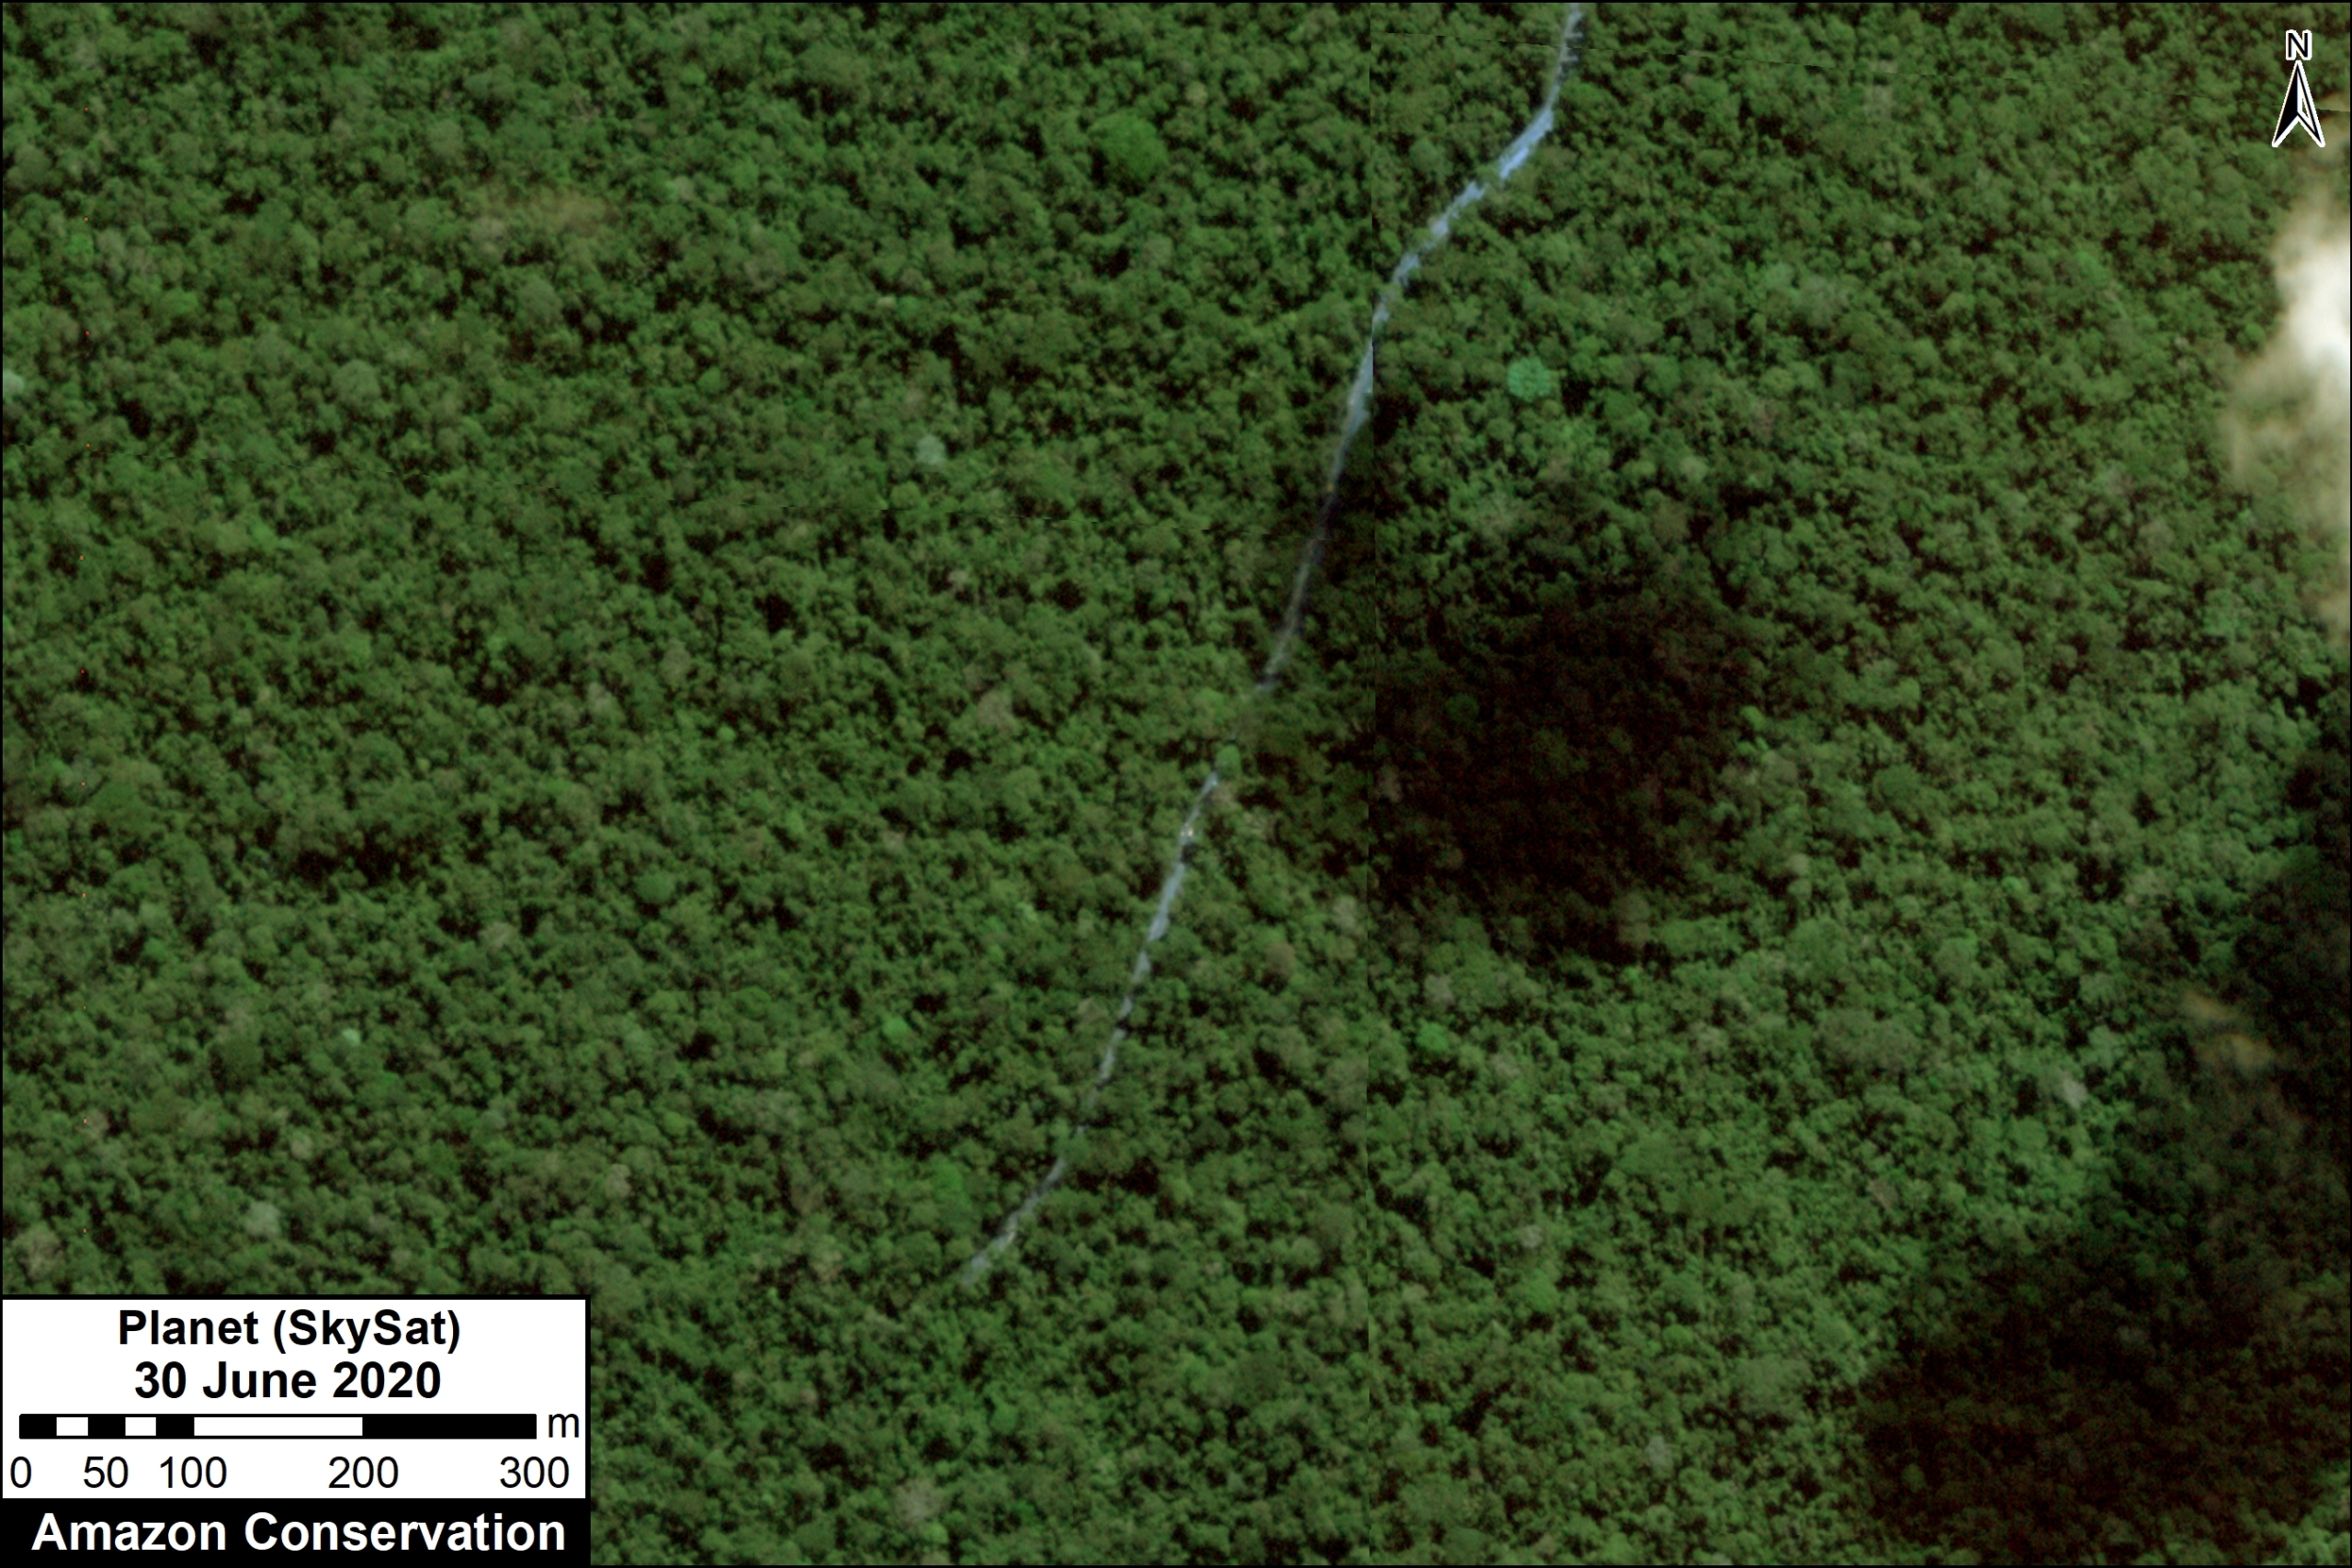
We have also obtained a very high resolution satellite image (Skysat, 0.8 meters) of the new oil access road. Below are two examples of this image; the first shows the complete route of the new highway and the second is a zoom of the most recent expansion to the south. Click to enlarge.

Finer M, Mamani N (2020) New Oil Road Deeper into Yasuni National Park. MAAP: 116.