MAAP #88: Deforestation Hotspots in the Ecuadorian Amazon

MAAP #88:
Deforestation Hotspots in the Ecuadorian Amazon
https://www.maapprogram.org/ecuador-hotspots/

Hotspots de deforestación en la Amazonía Ecuatoriana

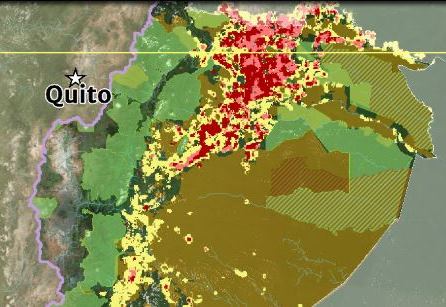
Here, we highlight deforestation hotspots, the areas with the highest deforestation densities, in the mega-diverse Ecuadorian Amazon.

We then zoom in and focus on a dynamic area in the north that is located between three important protected areas (Sumaco, Yasuní y Cuyabeno).

We show a series of satellite images that indicate that the primary deforestation drivers (causes) in these hotspots are oil palm and other agricultural activities.

*The Ecuador series is a collaboration between Amazon Conservation, Amazon Conservation Team, and EcoCiencia, funded by the MacArthur Foundation

MAAP #88: Deforestation Hotspots in the Ecuadorian Amazon
https://www.maapprogram.org/ecuador-hotspots/


MAAP #87: Gold Mining deforestation continues in the Peruvian Amazon

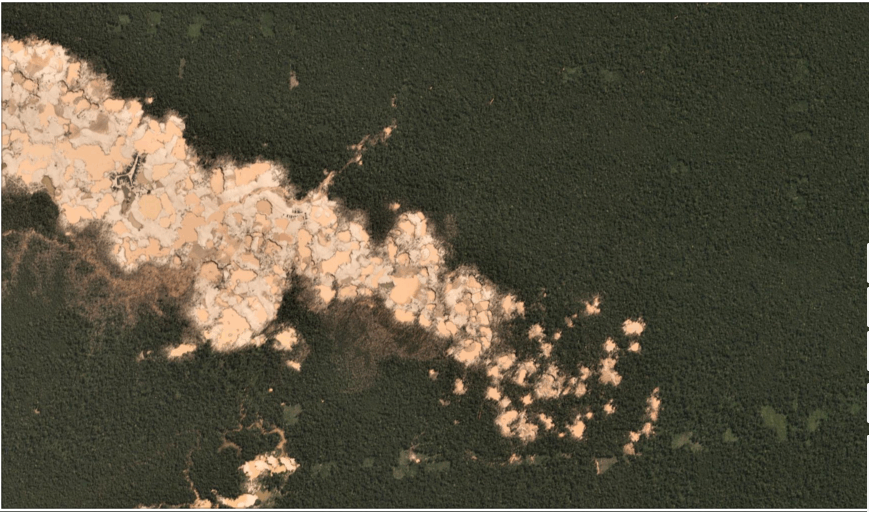
Expansión hacia el este de mineria aurífera en La Pampa. Fuente: Planet.

We have reported extensively on the ongoing gold mining deforestation crisis in the southern Peruvian Amazon (see Archive), estimating the loss of over 17,500 acres in the five years between 2013 and 2017.

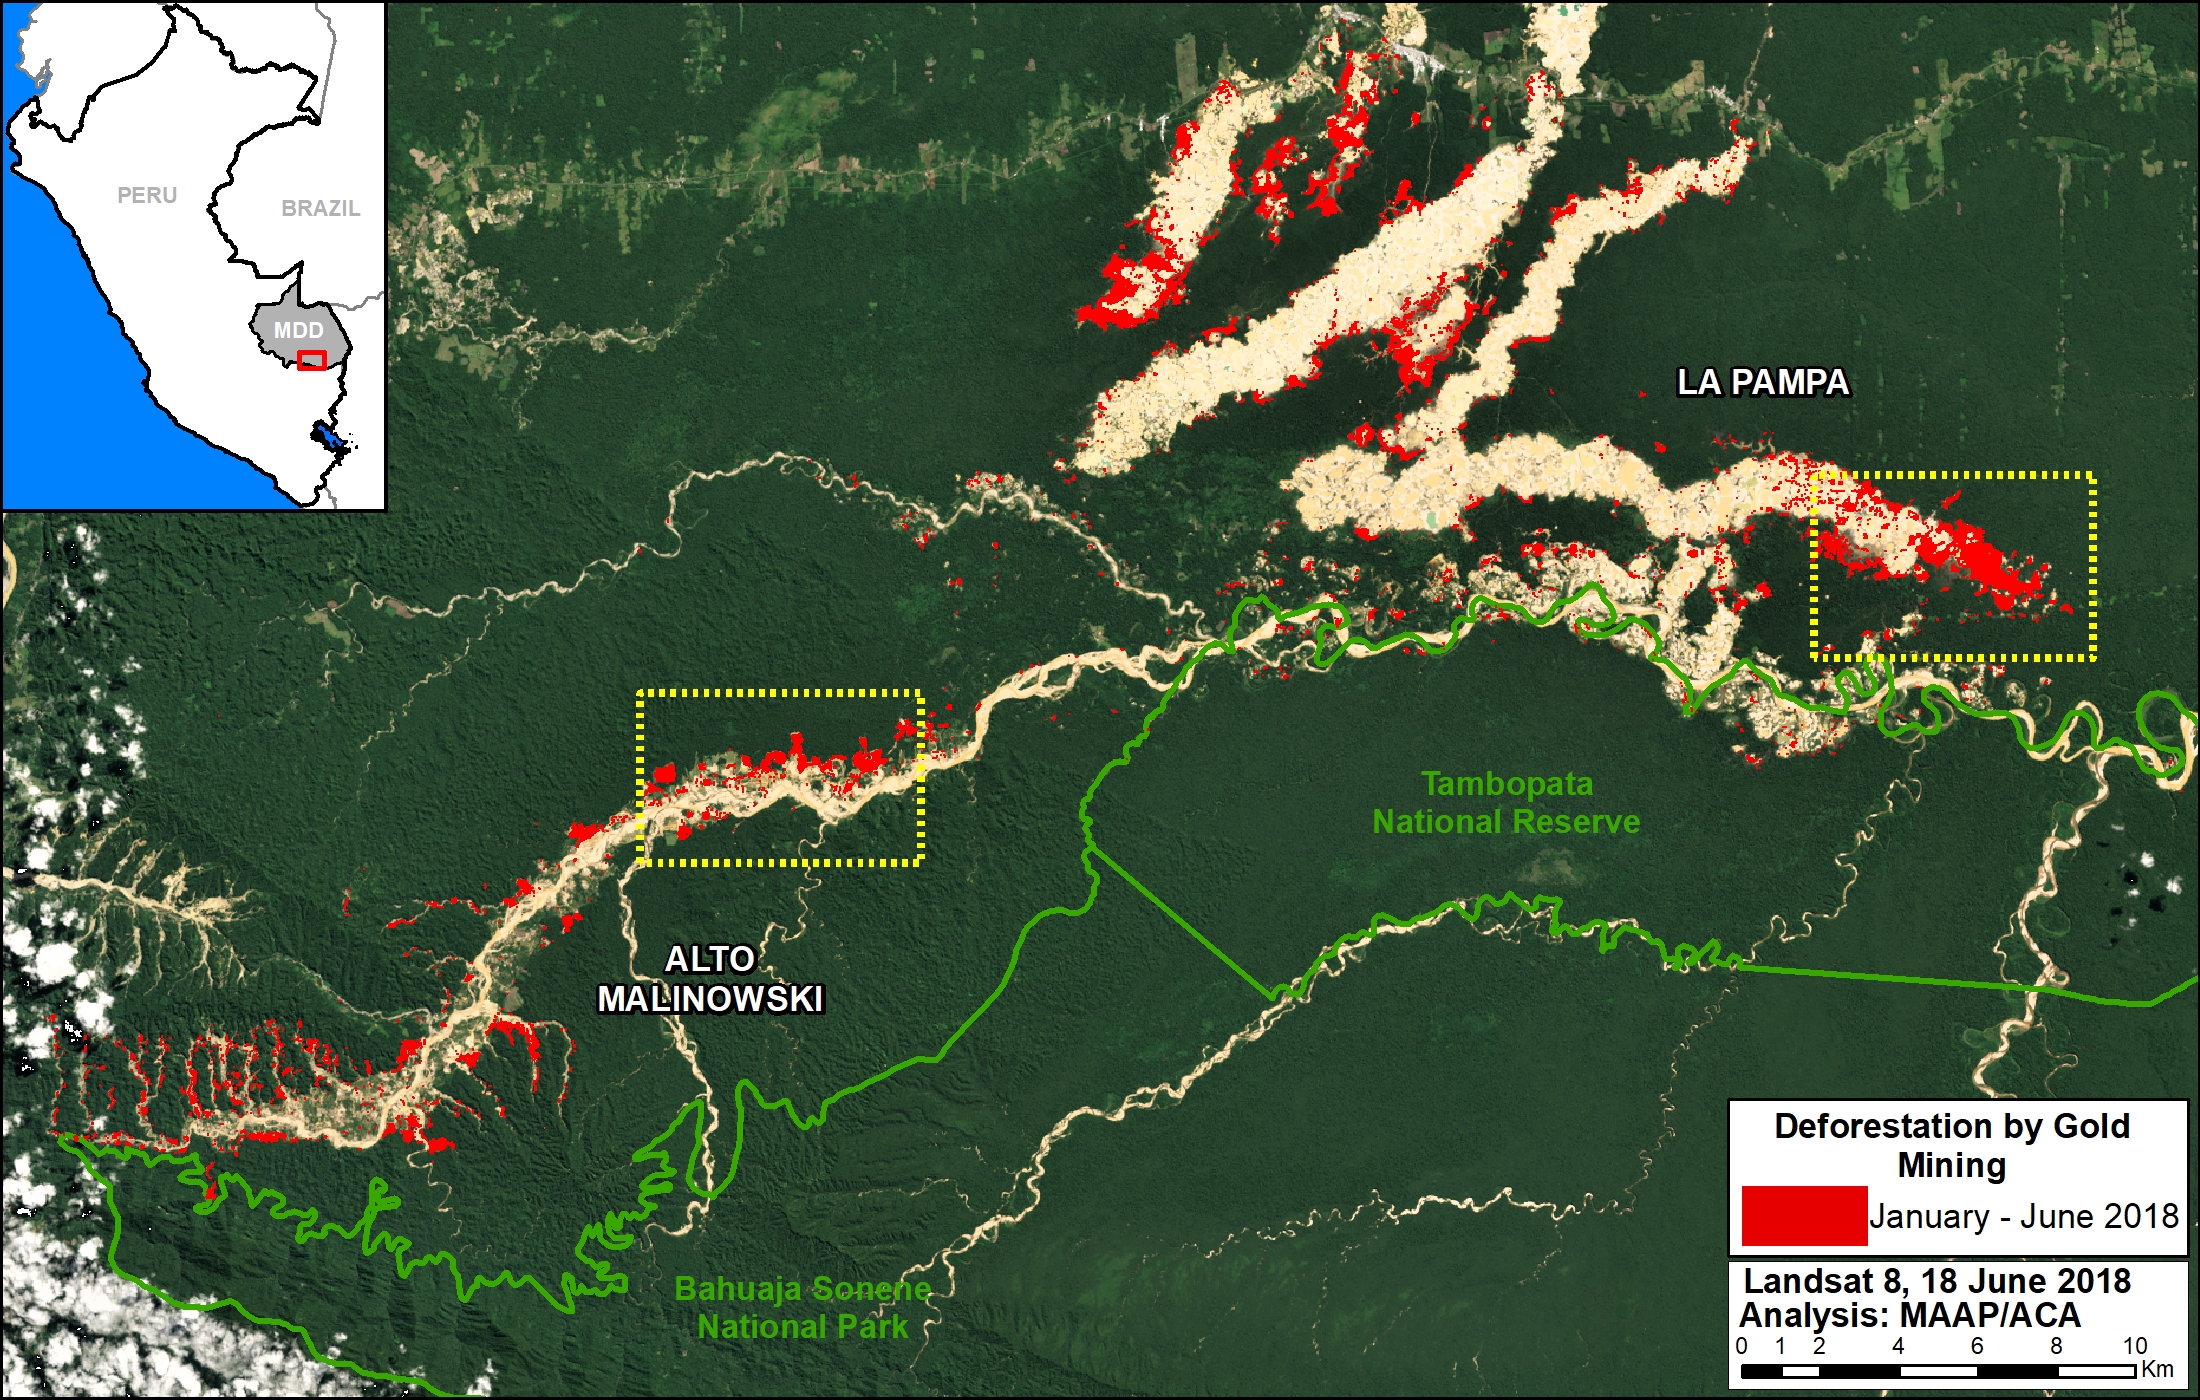
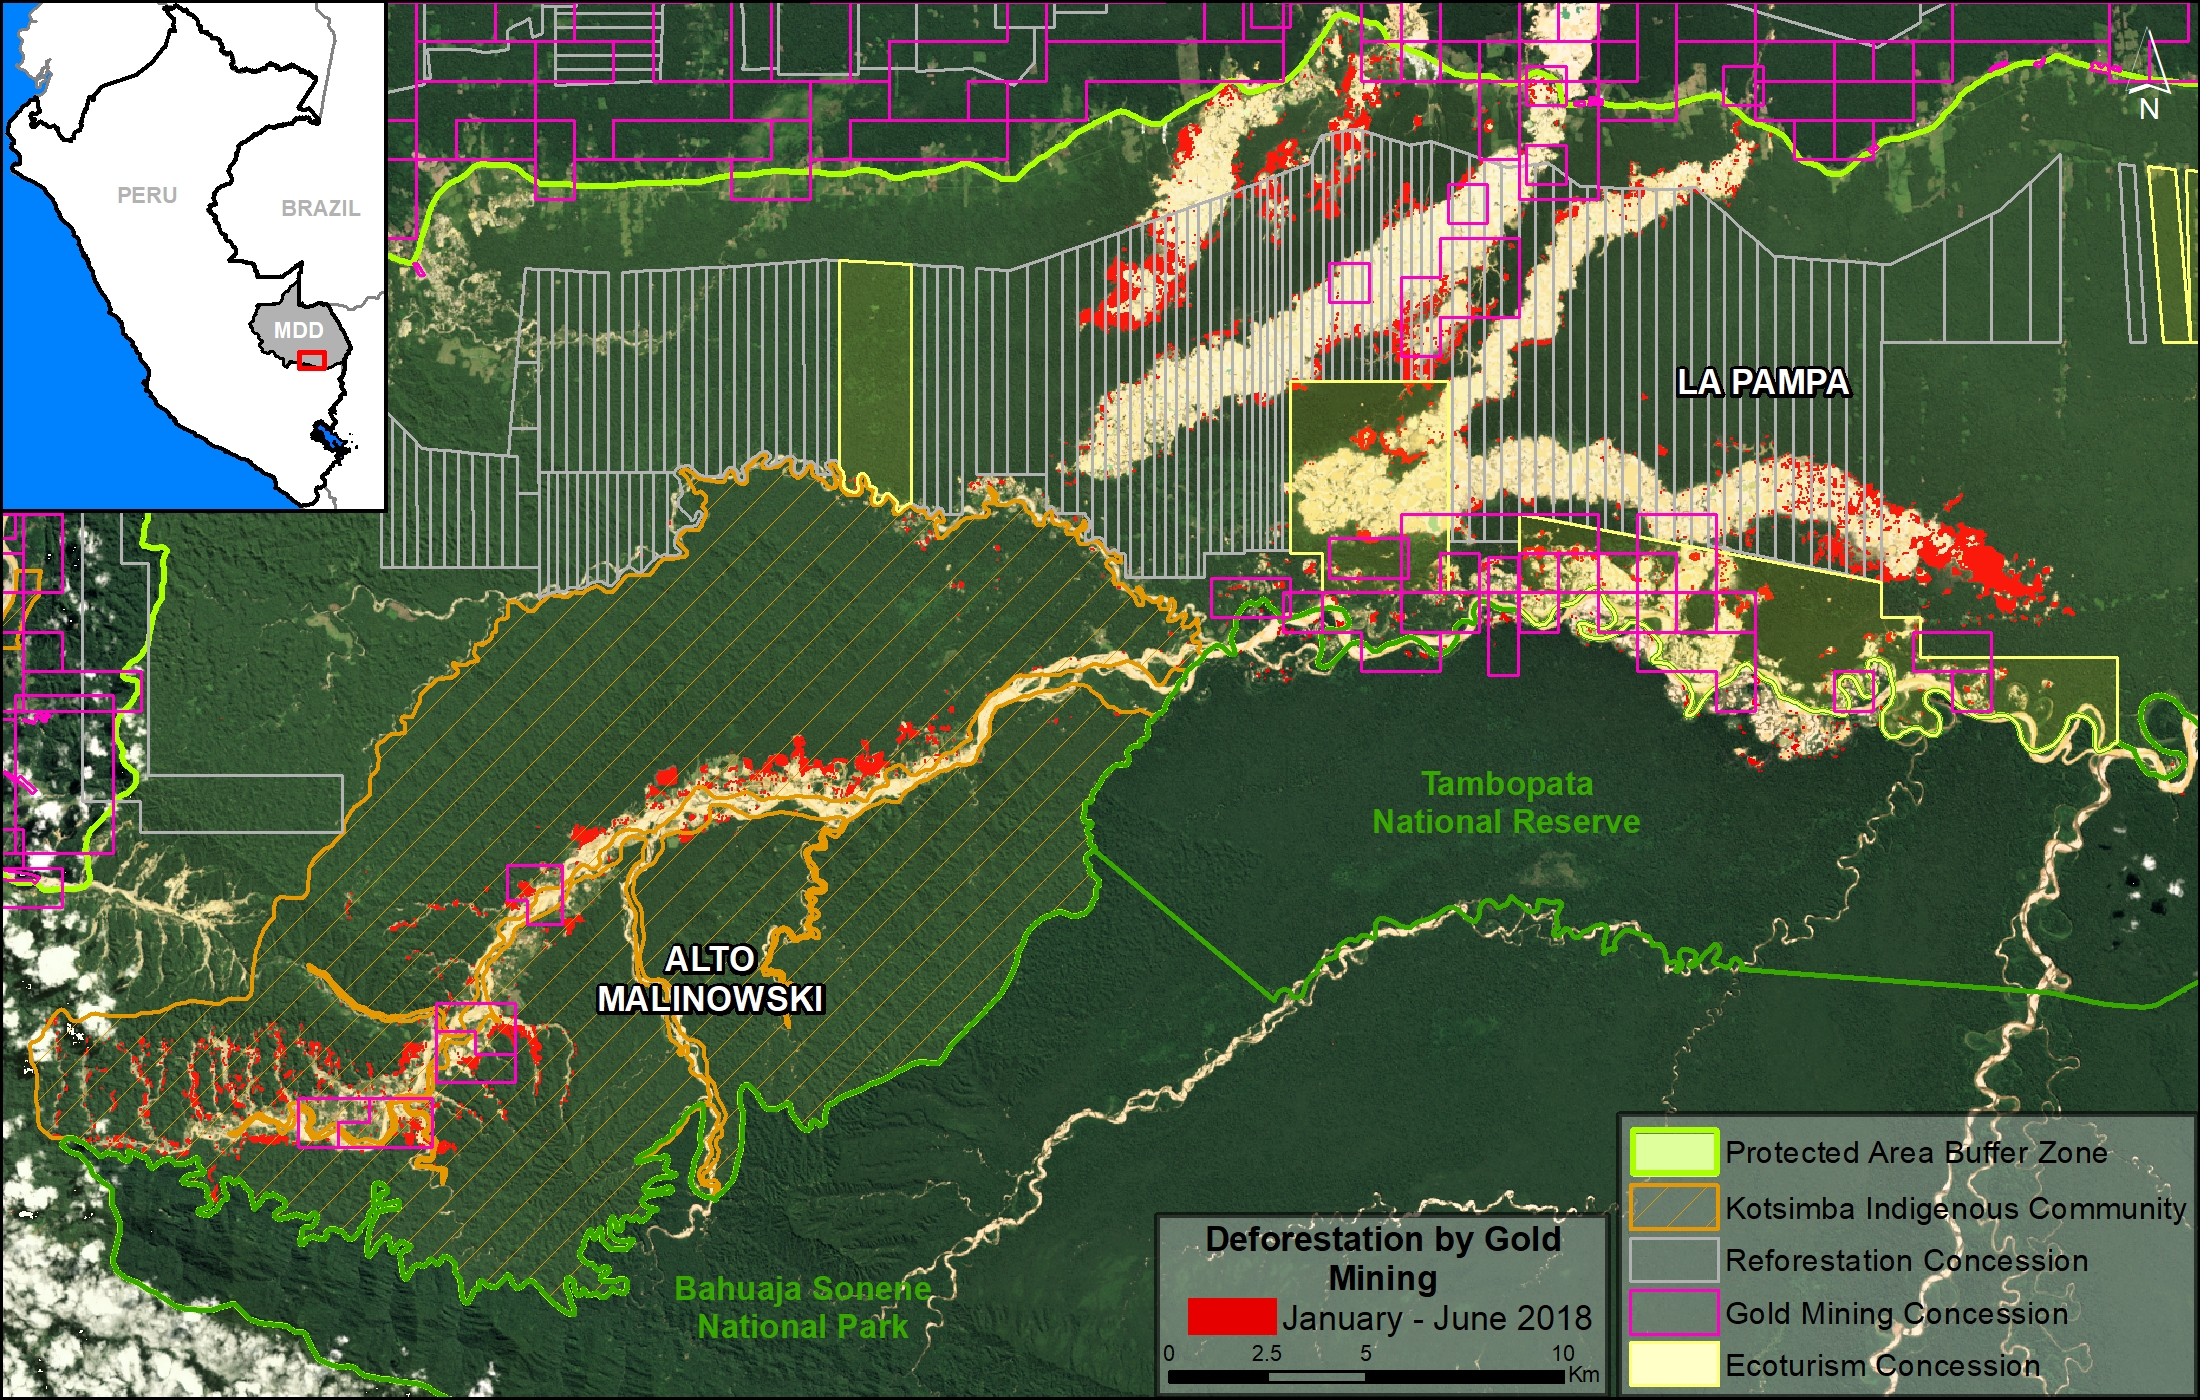
Here, we present new analysis showing that the destruction continues in 2018: we estimate an additional 4,265 acres during the first six months (January – June). This most recent deforestation is concentrated in two critical areas: La Pampa and Alto Malinowski. Most, if not all, of the mining appears to be illegal (see Annex).

This brings the total gold mining deforestation since 2013 to over 21,750 acres.

Next, we show a series of satellite images of the recent deforestation in La Pampa and Alto Malinowski.


Base Map

The Base Map highlights the most recent (2018) gold mining deforestation in red. We estimate this deforestation to be around 4,265 acres in the two most critical zones: La Pampa and Alto Malinowski. The yellow boxes indicate the location of the zooms described below. At the end of the article, in the Annex, we present the same base map but with all the overlapping land designations as well to illustrate the complexity of the situation.

Base Map. 2018 gold mining deforestation in southern Peruvian Amazon. Data: Planet, UMD/GLAD, MINAM/PNCB

La Pampa

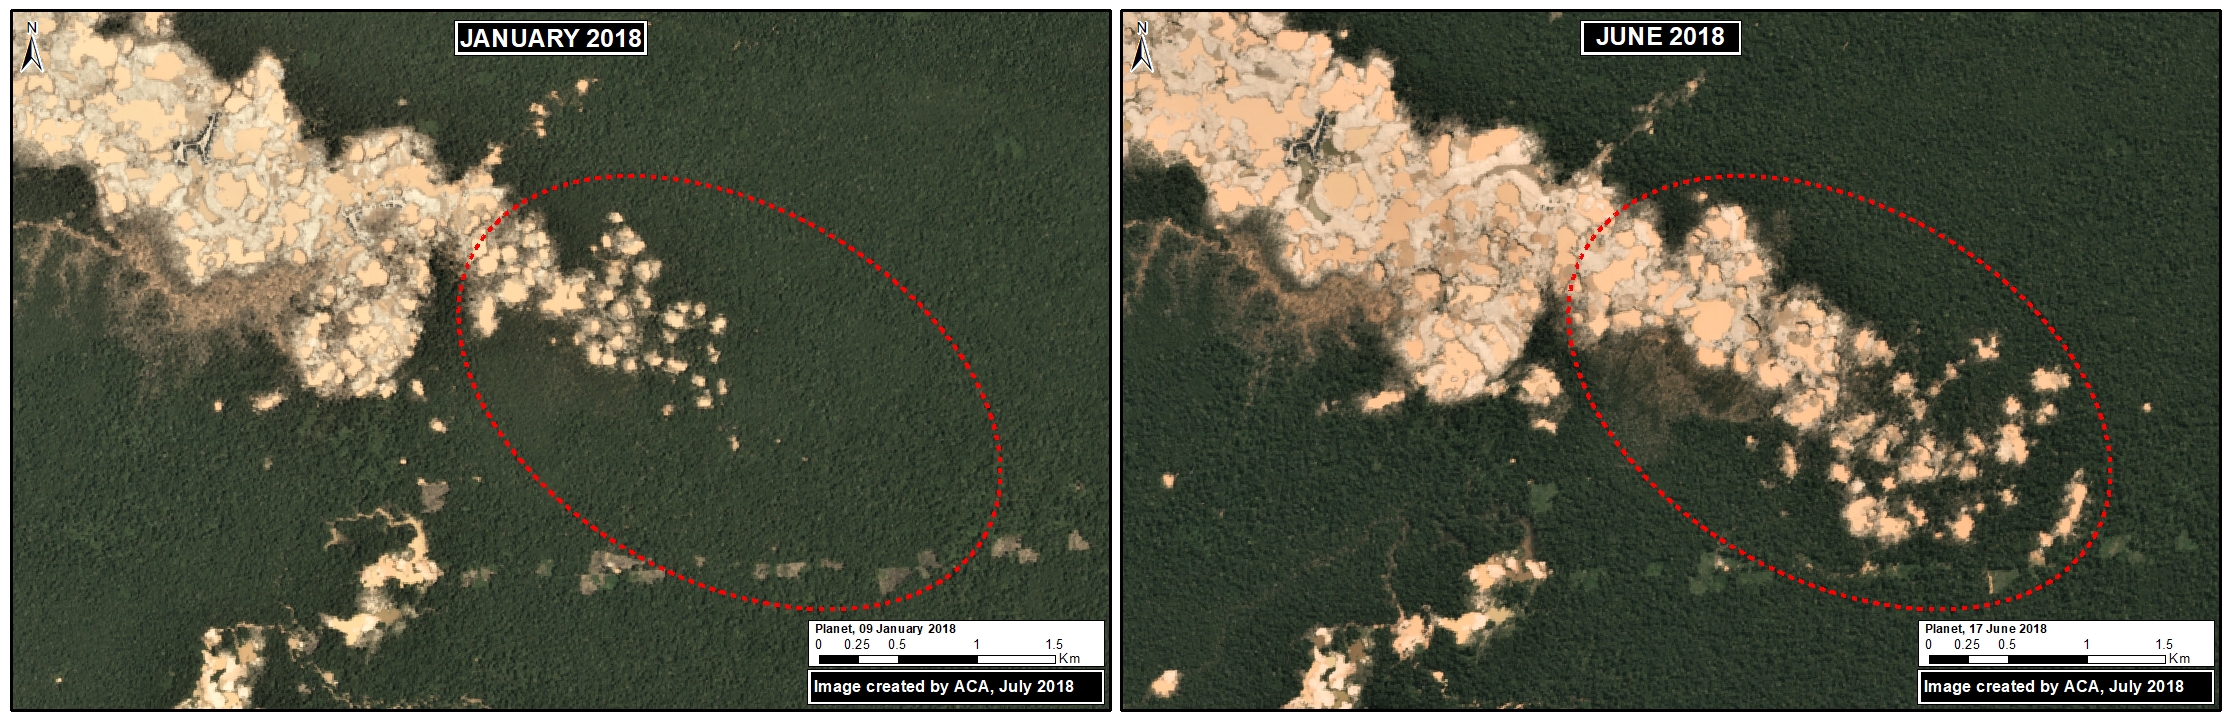
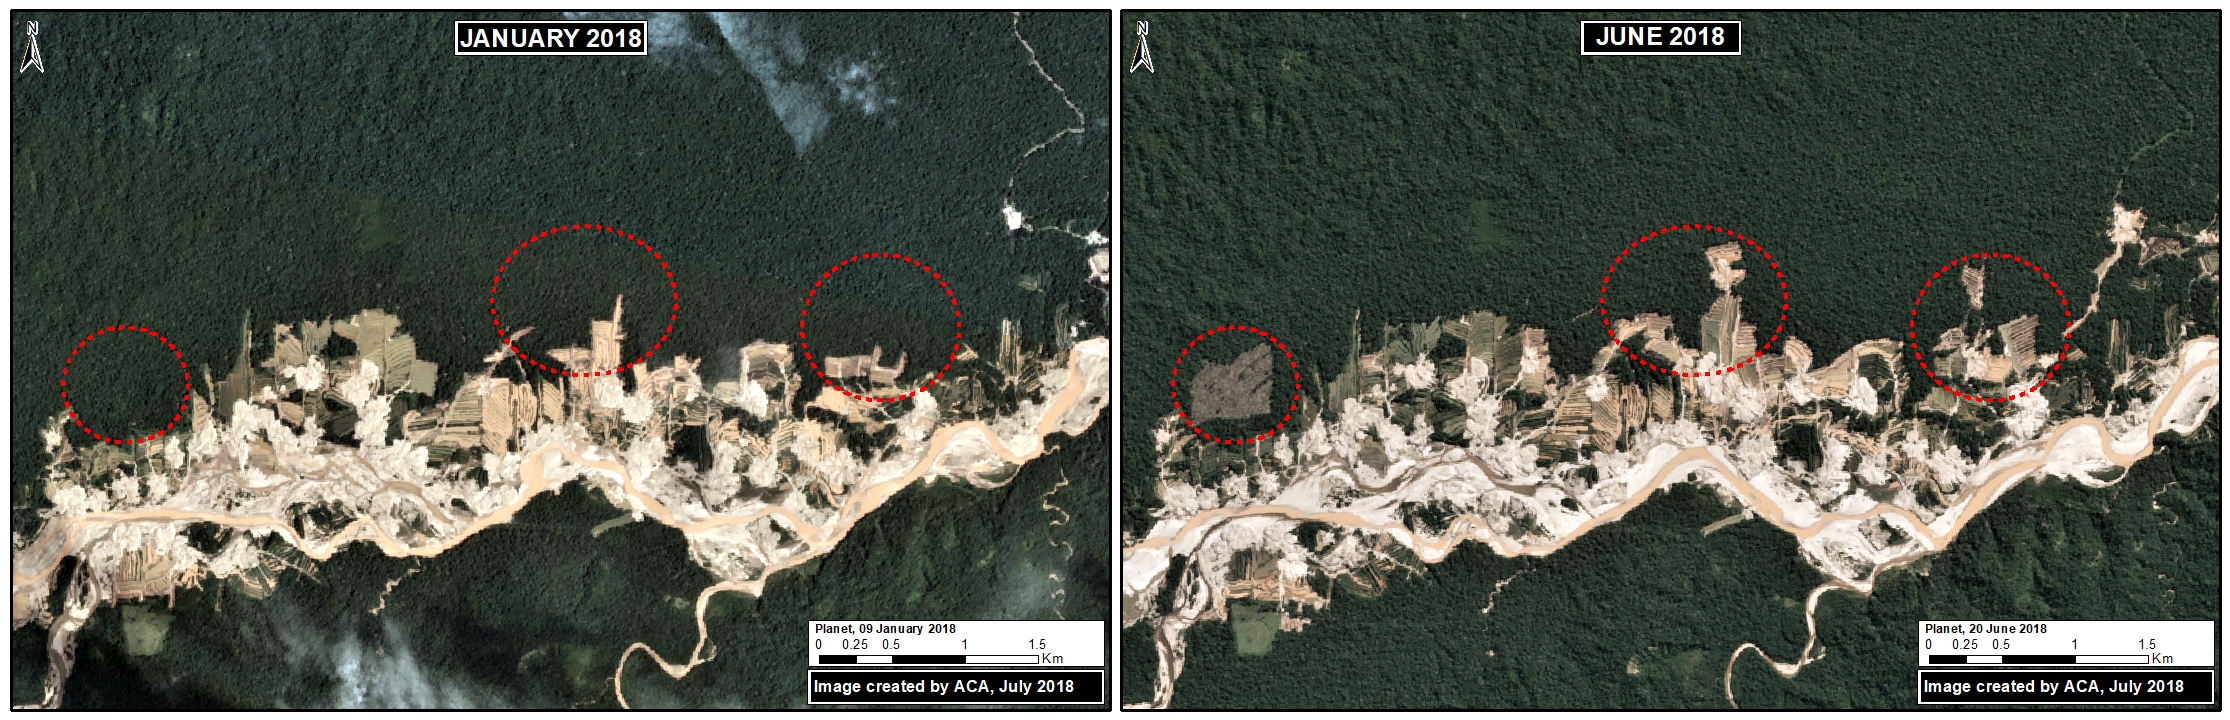
The following images show the gold mining deforestation in the area known as “La Pampa” between January (left panel) and May (right panel) 2018. Note that the second image is in slider format.

Zoom de La Pampa. Datos: Planet, MAAP

[twenty20 img1=”7415″ img2=”7416″ width=”80%” offset=”0.5″]

Alto Malinowski

The following images show the gold mining deforestation in the area known as “Alto Malinowski” between January (left panel) and May (right panel) 2018. Note that the second image is in slider format.

[twenty20 img1=”7417″ img2=”7418″ width=”80%” offset=”0.5″]

Annex

We present the same base map as above, but also with relevant land designations.  Note that much of the deforestation is concentrated in forestry concessions (ironically, in “reforestation” concessions) and in the Kotsimba Native Community, both of which are outside the legal mining corridor and within the buffer zones of Tambopata National Reserve and Bahuaja Sonene National Park. Thus, most, if not all, of the mining activity appears to be illegal.

Citation

Finer M, Villa L, Mamani N (2018) Gold Mining continues to ravage the Peruvian Amazon. MAAP: 87.

MAAP Colombia: Chiribiquete – Deforestation Hotspots in the Colombian Amazon, part 3

MAAP #86: Deforestation Hotspots in the Colombian Amazon, part 3: Chiribiquete-Macarena

We present our third report* in a series investigating deforestation hotspots in the Colombian Amazon. Here, we focus on the “Chiribiquete-Macarena” hotspot, located between the Chiribiquete and La Macarena National Parks.

The Colombian government is finalizing plans to expand the boundaries of Chiribiquete National Park, an important step for conservation. However, we show (with high-resolution images) that deforestation is surging in the area and rapidly expanding towards these new boundaries. In fact, in 2018, deforestation has entered the newly expanded park.

MAAP #86: Deforestation Hotspots in the Colombian Amazon, part 3: Chiribiquete-Macarena

https://www.maapprogram.org/chiribiquete/


*The first report focused on the “Caguan” hotspot in the department of Caquetá. The second report focused on the “La Paya” hotspot in the department of Putumayo.

Science Magazine_Combating Deforestation: From Satellite to Intervention

**************************************************************************************************

Science Magazine: Combating deforestation: From satellite to intervention
Full text
Reprint (PDF)
:

*Note: The article can only be viewed for free via this author page.

************************************************************************************************

A new policy article entitled “Combating deforestation: From satellite to intervention” was just published in Science, one of the leading journals in the world.

The authors include members of Amazon Conservation, World Resources Institute (Global Forest Watch), and Planet.

We first describe how rapidly improving satellite technology has created an unprecedented moment for near real-time monitoring.

We then outline a five-step protocol for near real-time tropical deforestation monitoring, with the goal of bridging the gap between technology and policy.

Satellite image of expanding gold mining deforestation in Peru. Image: Planet.

MAAP #85: Illegal Logging in the Peruvian Amazon, and how Satellites can help address it

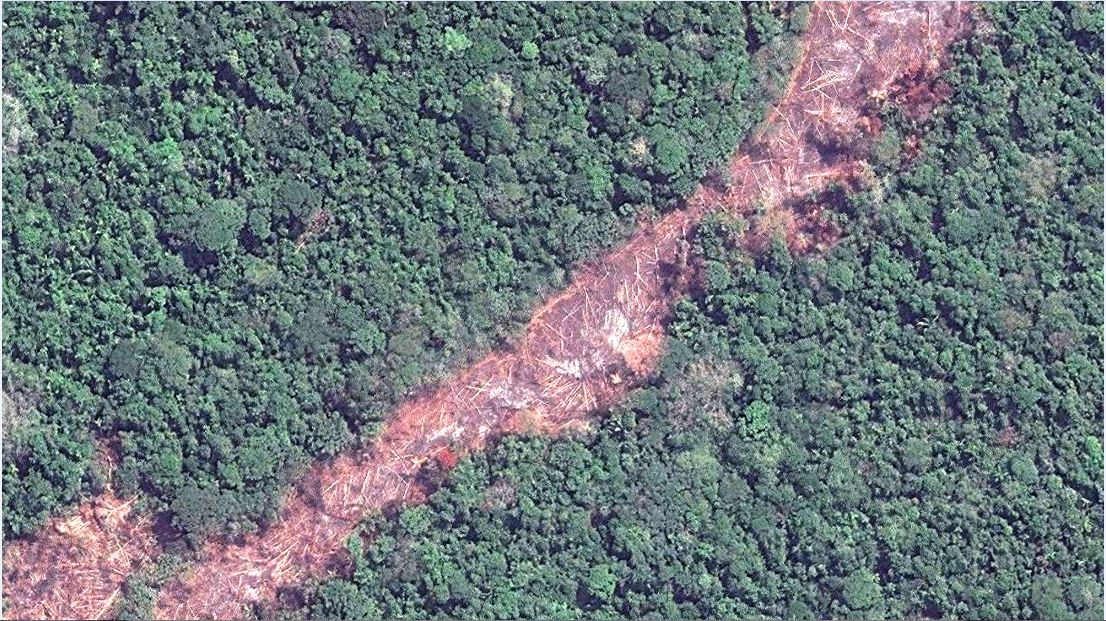
Example of new logging road in the Peruvian Amazon. Data: Planet

We propose a new tool to address illegal logging in the Peruvian Amazon: using cutting-edge satellites to monitor logging road construction in near real-time.

Illegal logging in the Amazon is difficult to detect because it is selective logging of individual valuable trees, not large clear-cuts.

However, a new generation of satellites can quickly detect new logging roads, which in turn may indicate the leading edge of illegal logging.

Here, we analyzed satellite imagery to identify all new logging roads built in the Peruvian Amazon over the past three years (2015-17).

We then show how it is possible to track logging road construction in near-real time, using three satellite-based systems: GLAD alerts, Sentinel-1 (radar satellites), and Planet (optical satellites).


The Technology

GLAD alerts. Source: GFW

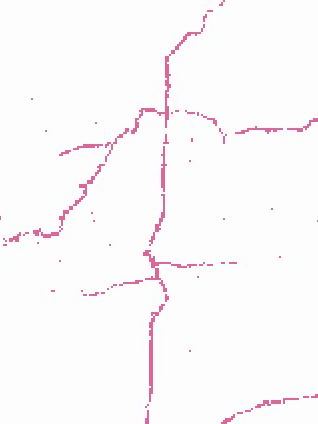
GLAD alerts quickly detect areas of recent forest loss (based on 30 meter resolution Landsat imagery) and highlight those pixels. For example, the image on the right shows GLAD alerts for a recent logging road. The satellites described below can then zoom in on these highlighted areas and continue the monitoring in near real-time.

The European Space Agency’s Sentinel-1 satellites freely offer a new image every 12 days no matter the weather conditions, as radar technology allows it to penetrate clouds (see MAAP #79).

The company Planet has a fleet of 175+ mini satellites, lined up like pearls in a necklace, that are able to capture a high-resolution optical image almost daily, though clouds remain an issue (see MAAP #59).


Key Findings

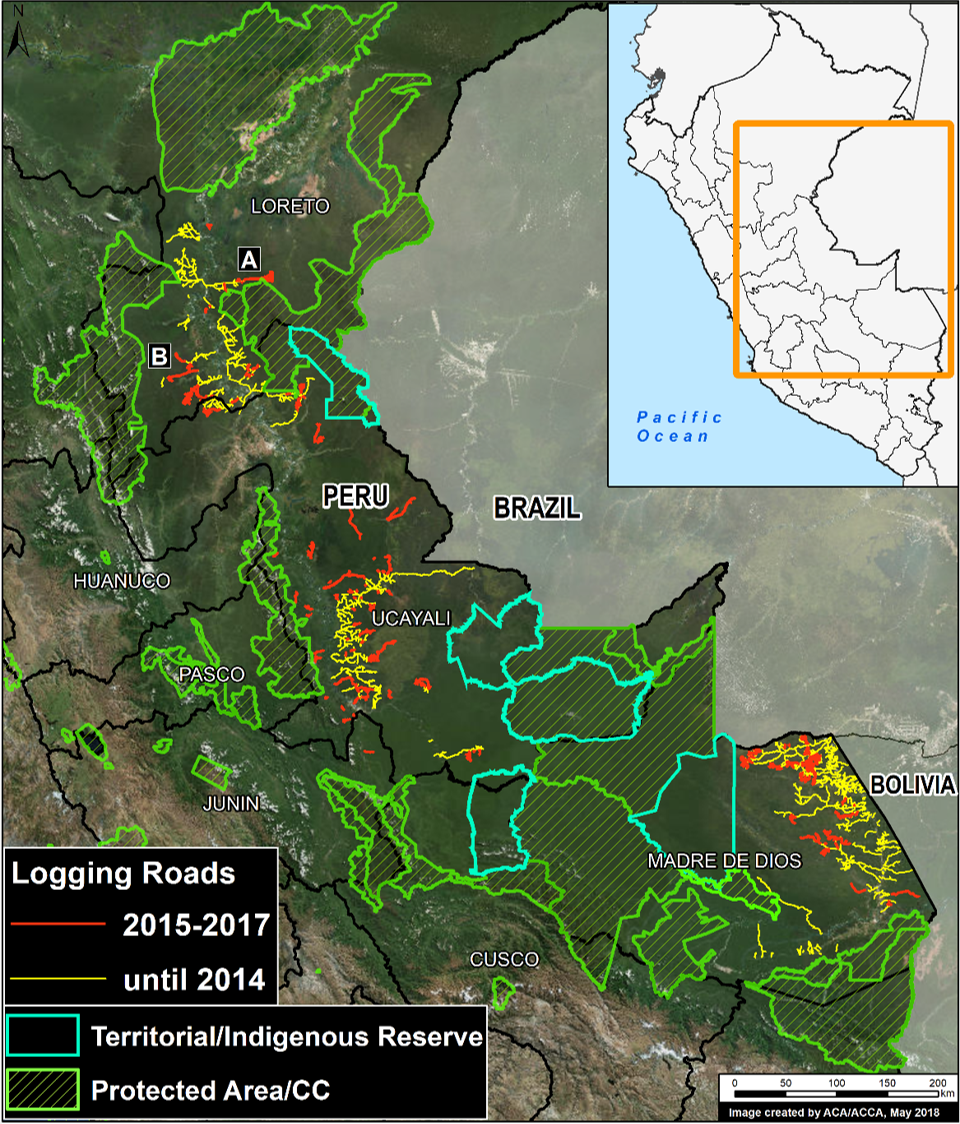
Base Map. Logging roads in the Peruvian Amazon. Data: MAAP, SERNANP, IBC. Click to enlarge.

The Base Map illustrates the location of all logging roads built in the Peruvian Amazon since 2001.

We estimate the construction of 1,365 miles (2,200 km) of logging roads during the last three years (2015-17). We indicate these roads in red.

Note that the roads are concentrated in three zones:

  • Southern Loreto, between Cordillera Azul and Sierra del Divisor National Parks;
  • Southern Ucayali; and
  • Northeast Madre de Dios.

Another important finding is the potential rapid speed of logging road construction: up to 1.5 miles (2.5 km) per week.

Next, we focus on two emblematic logging roads (near Sierra del Divisor and Cordillera Azul National Parks, respectively) to demonstrate the feasibility of near real-time monitoring based on Sentinel-1 and Planet satellites.


A. Logging Road near Sierra del Divisor

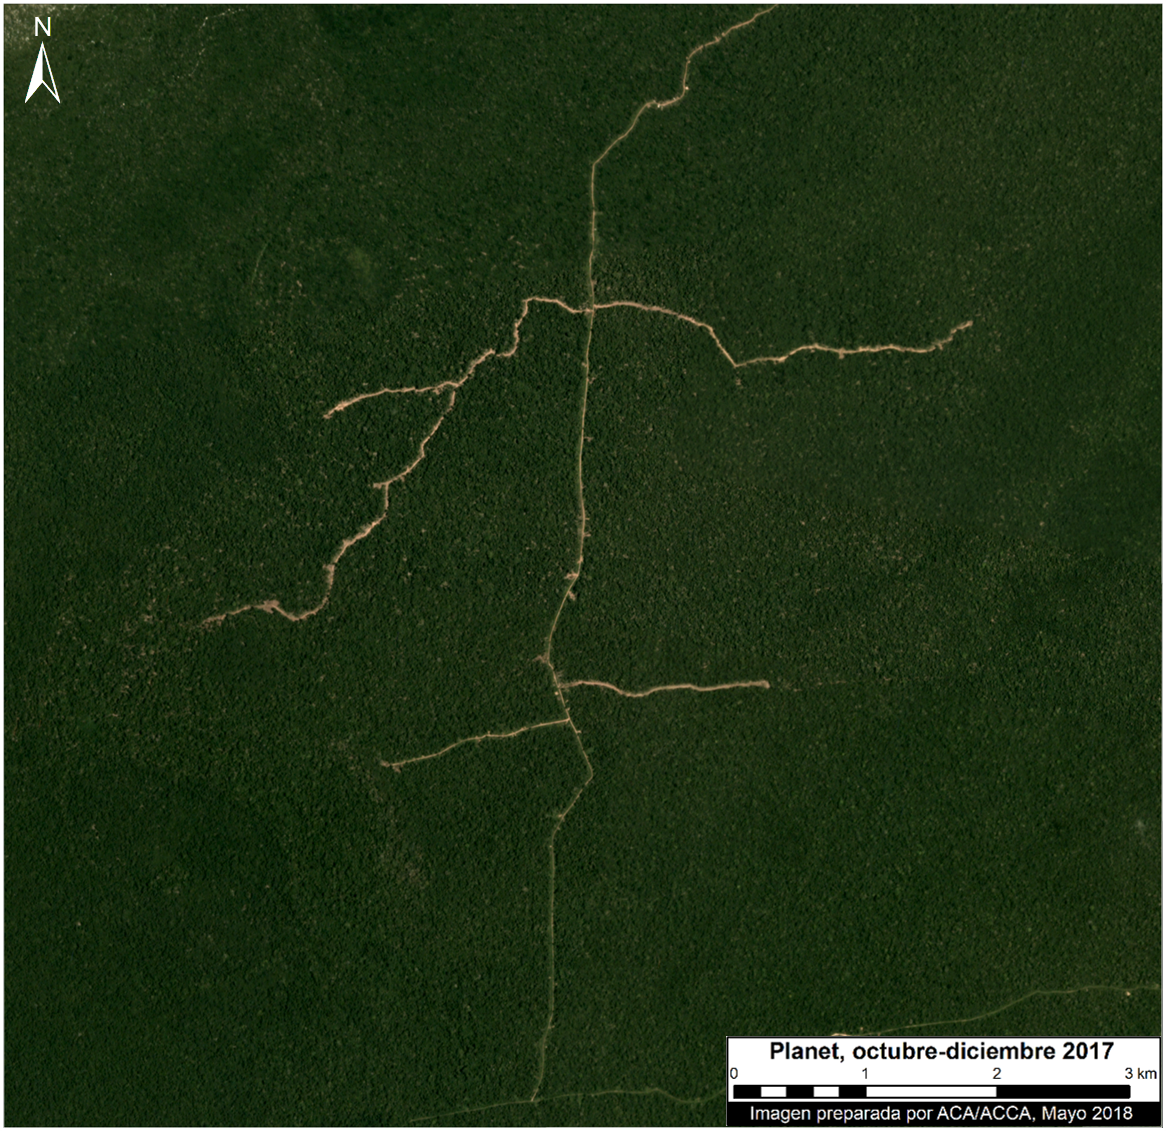
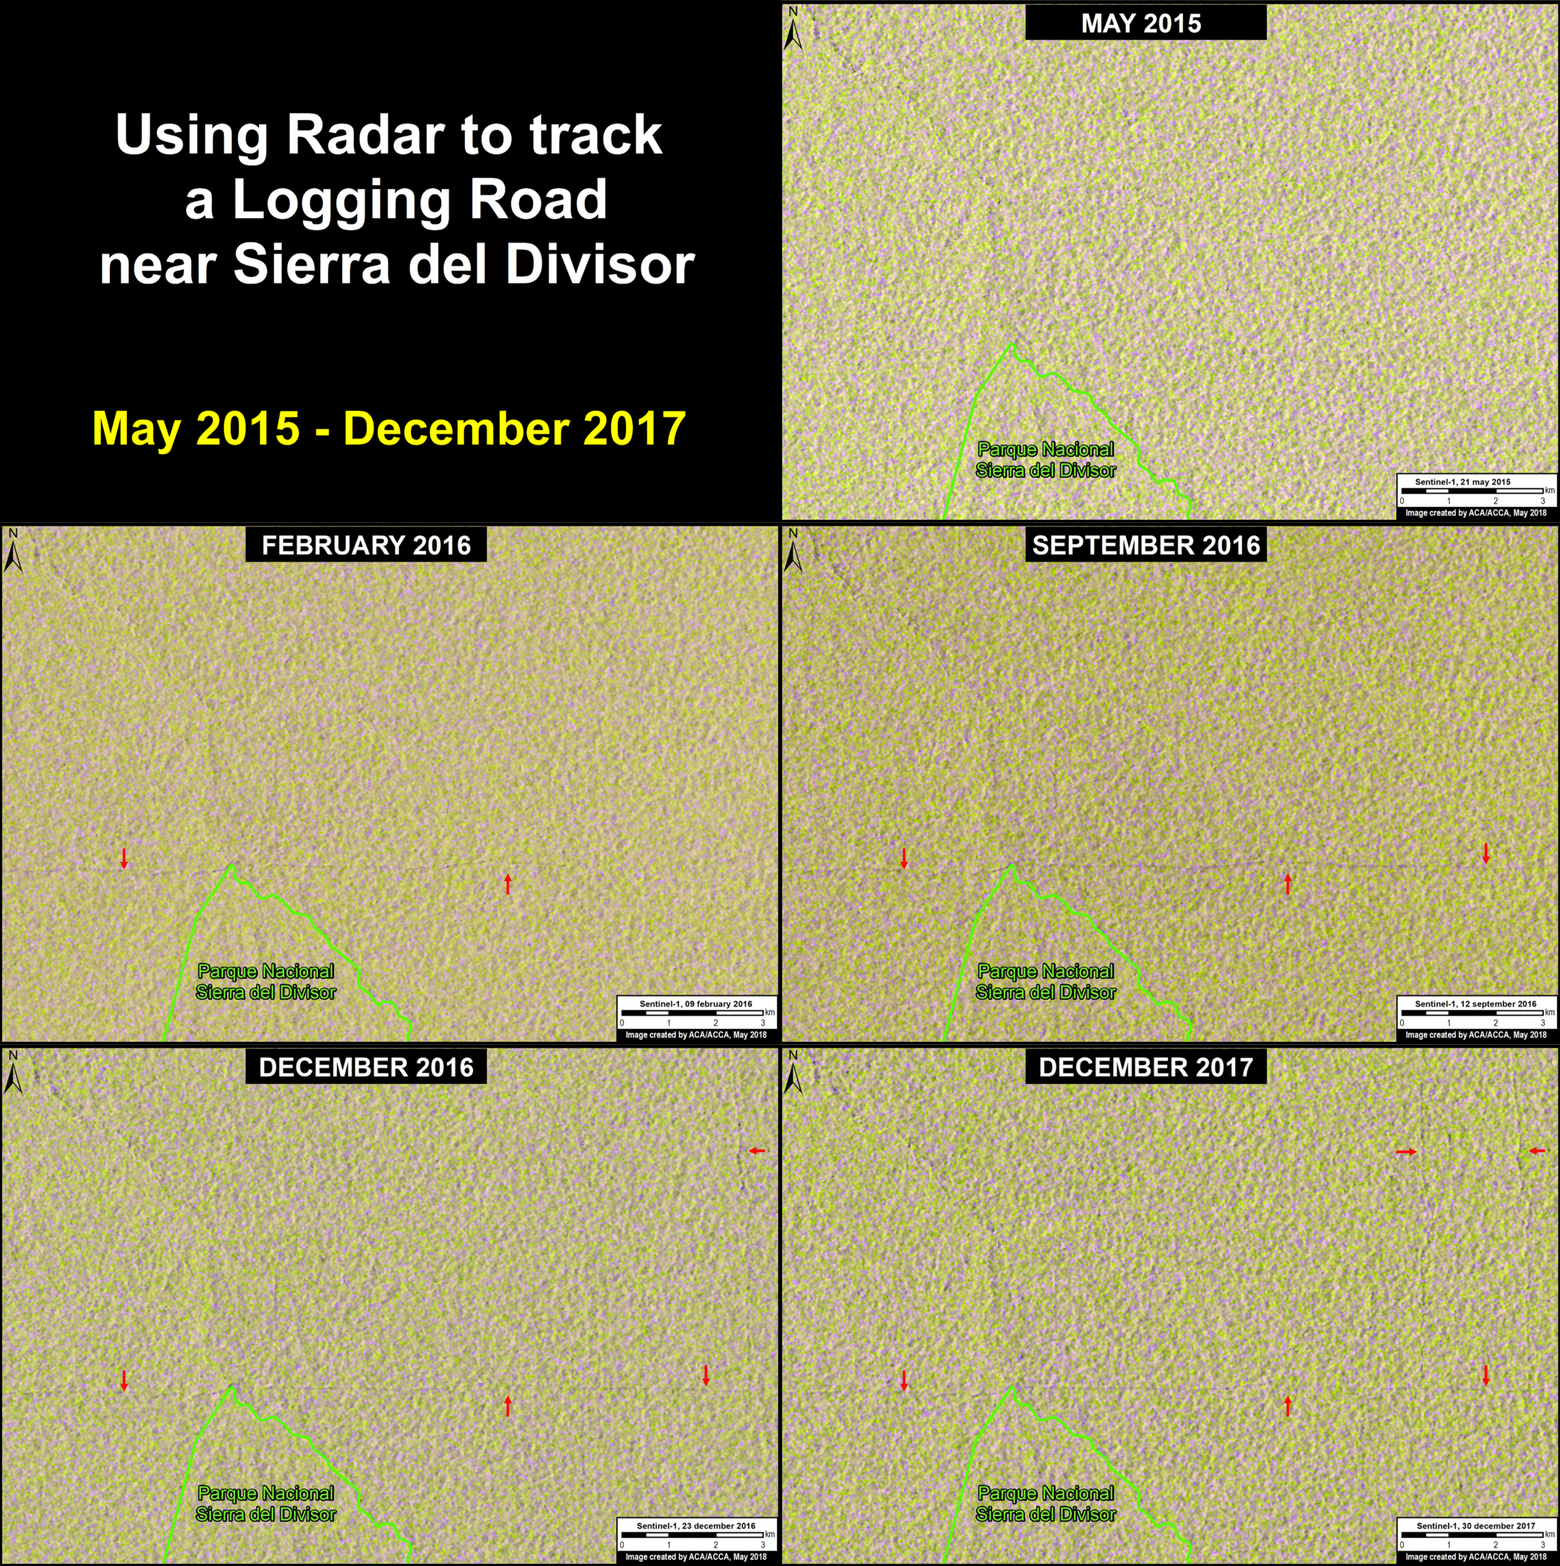
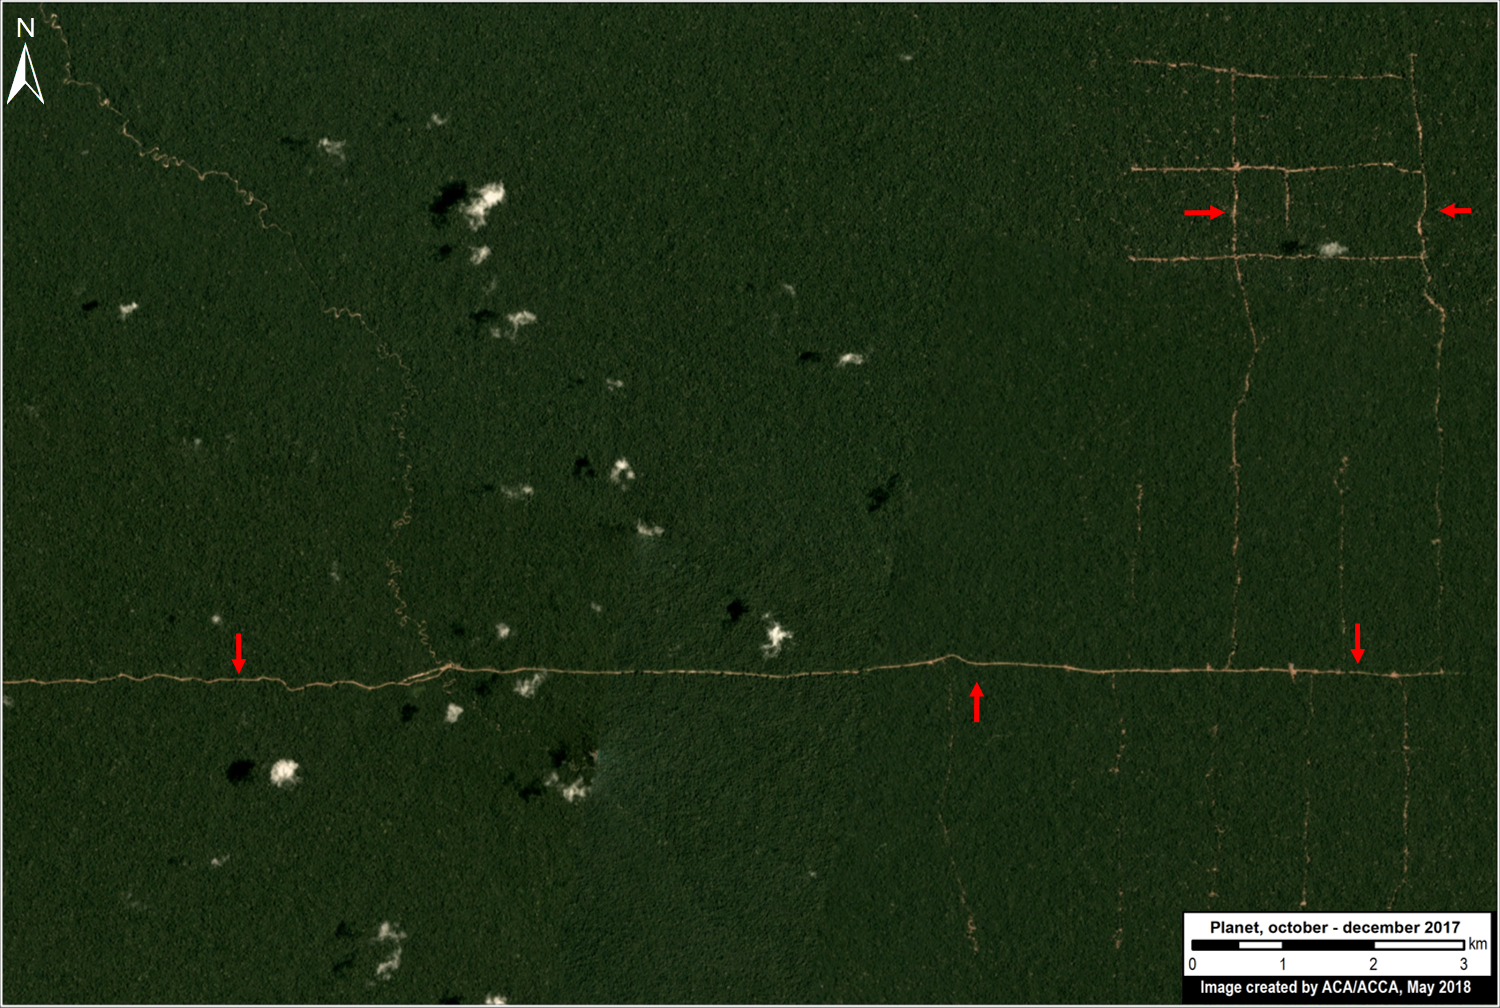
Image A1 is a GIF that shows a series of radar images (Sentinel-1) of the construction of a logging road between 2015 and 2017 just north of Sierra del Divisor National Park. The length of the road is 43 miles (69 km). Image A2 is a Planet image showing the status of the road as of the end of 2017.

Image A1. Construction of logging road near Sierra del Divisor. Data: ESA
Image A2. Logging road near Sierra del Divisor. Data: Planet

B. Logging Road near Cordillera Azul

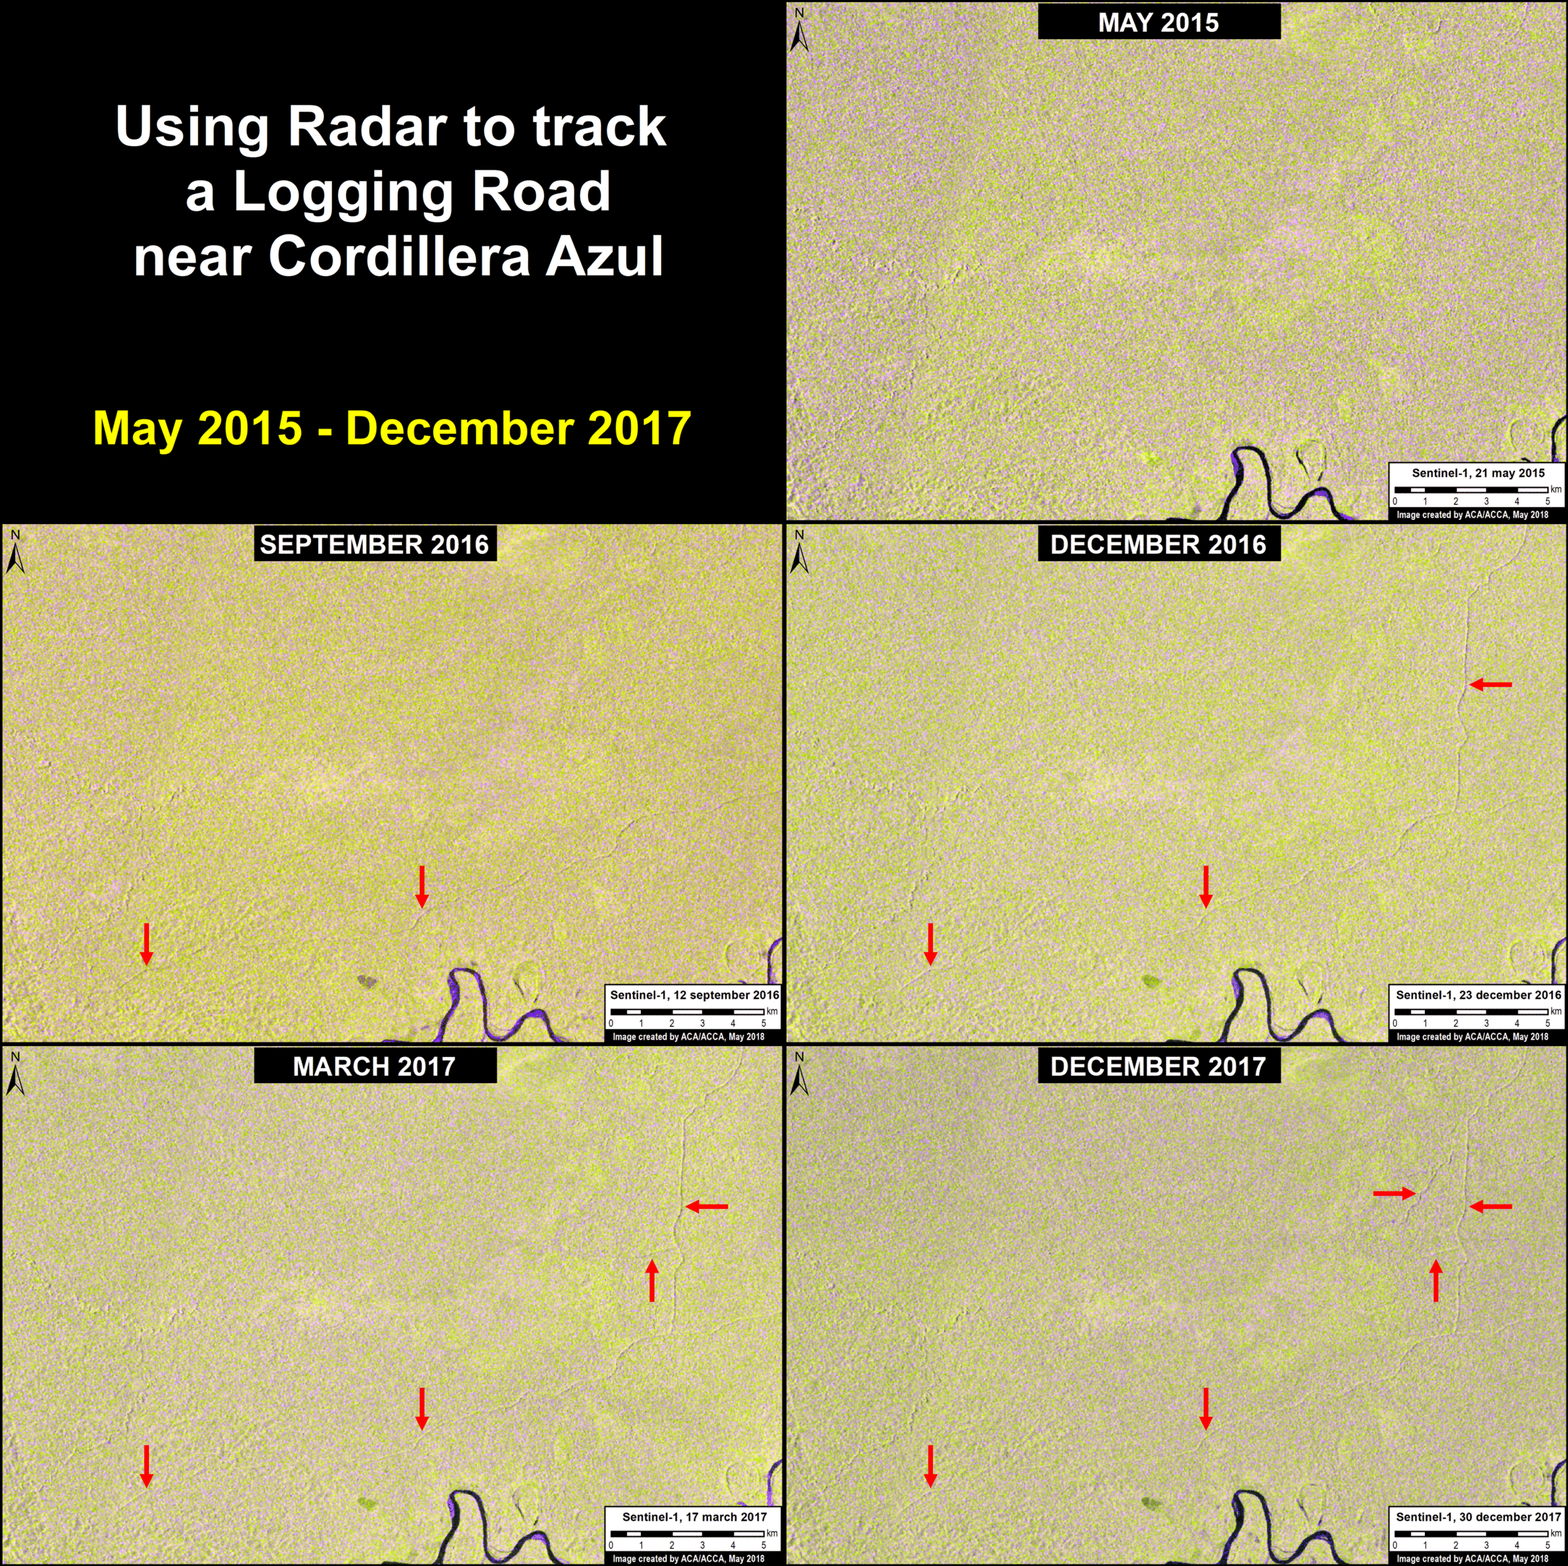
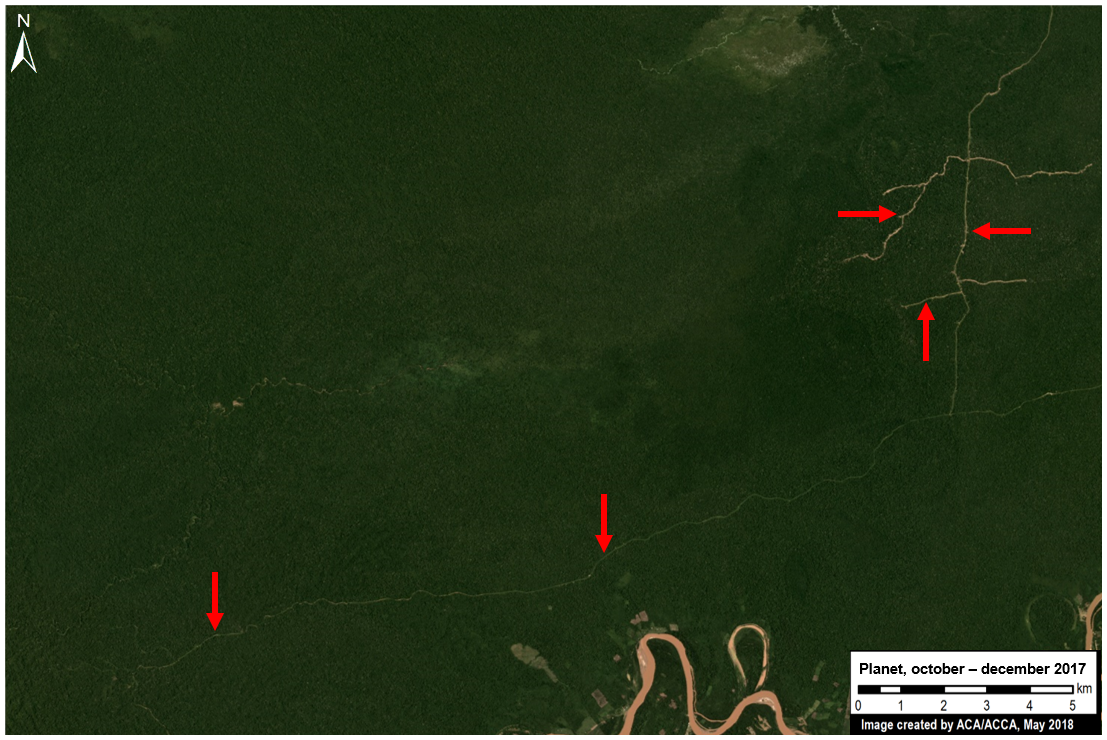
Image B1 is a GIF that shows a series of radar images (Sentinel-1) of the construction of a logging road between 2015 and 2017 east of Cordillera Azu National Park. The length of the road is 33 miles (53 km). Image B2 is a Planet image showing the status of the road as of the end of 2017.

Image B1. Construction of logging road near Cordillera Azul. Data: ESA
Image B2. Logging road near Cordillera Azul. Data: Planet

Notes

Not all illegal logging requires roads, but logging roads may indicate some of the most organized, financed, and large-scale operations.

Coordinates

Zona A: -6.966982,-74.6521
Zona B: -7.650428,-75.552979

Citation

Villa L, Finer M (2018) Illegal Logging in the Peruvian Amazon, and how Satellites can help. MAAP: 85.

MAAP #84: New Threats to the Peruvian Amazon (Part 1: Yurimaguas-Jeberos Road)

Image A: New Yurimaguas-Jeberos road crossing primary forest. Data: Planet

The efforts and international commitments of the Peruvian Government to reduce deforestation may be compromised by new projects do not have adequate environmental assessment.

In this series, we address the most urgent of these projects, those that threaten large areas of primary Amazonian forest.

We believe that these projects require urgent attention from both government and civil society to ensure an adequate response and avoid irreversible damage. For example, in the case below, it is not known whether there is an environmental impact study.

The first report of this series focuses on a new road (Jeberos – Yurimaguas) that threatens a large expanse of primary forest in the northern Peruvian Amazon (see Image A).


Yurimaguas-Jeberos Road

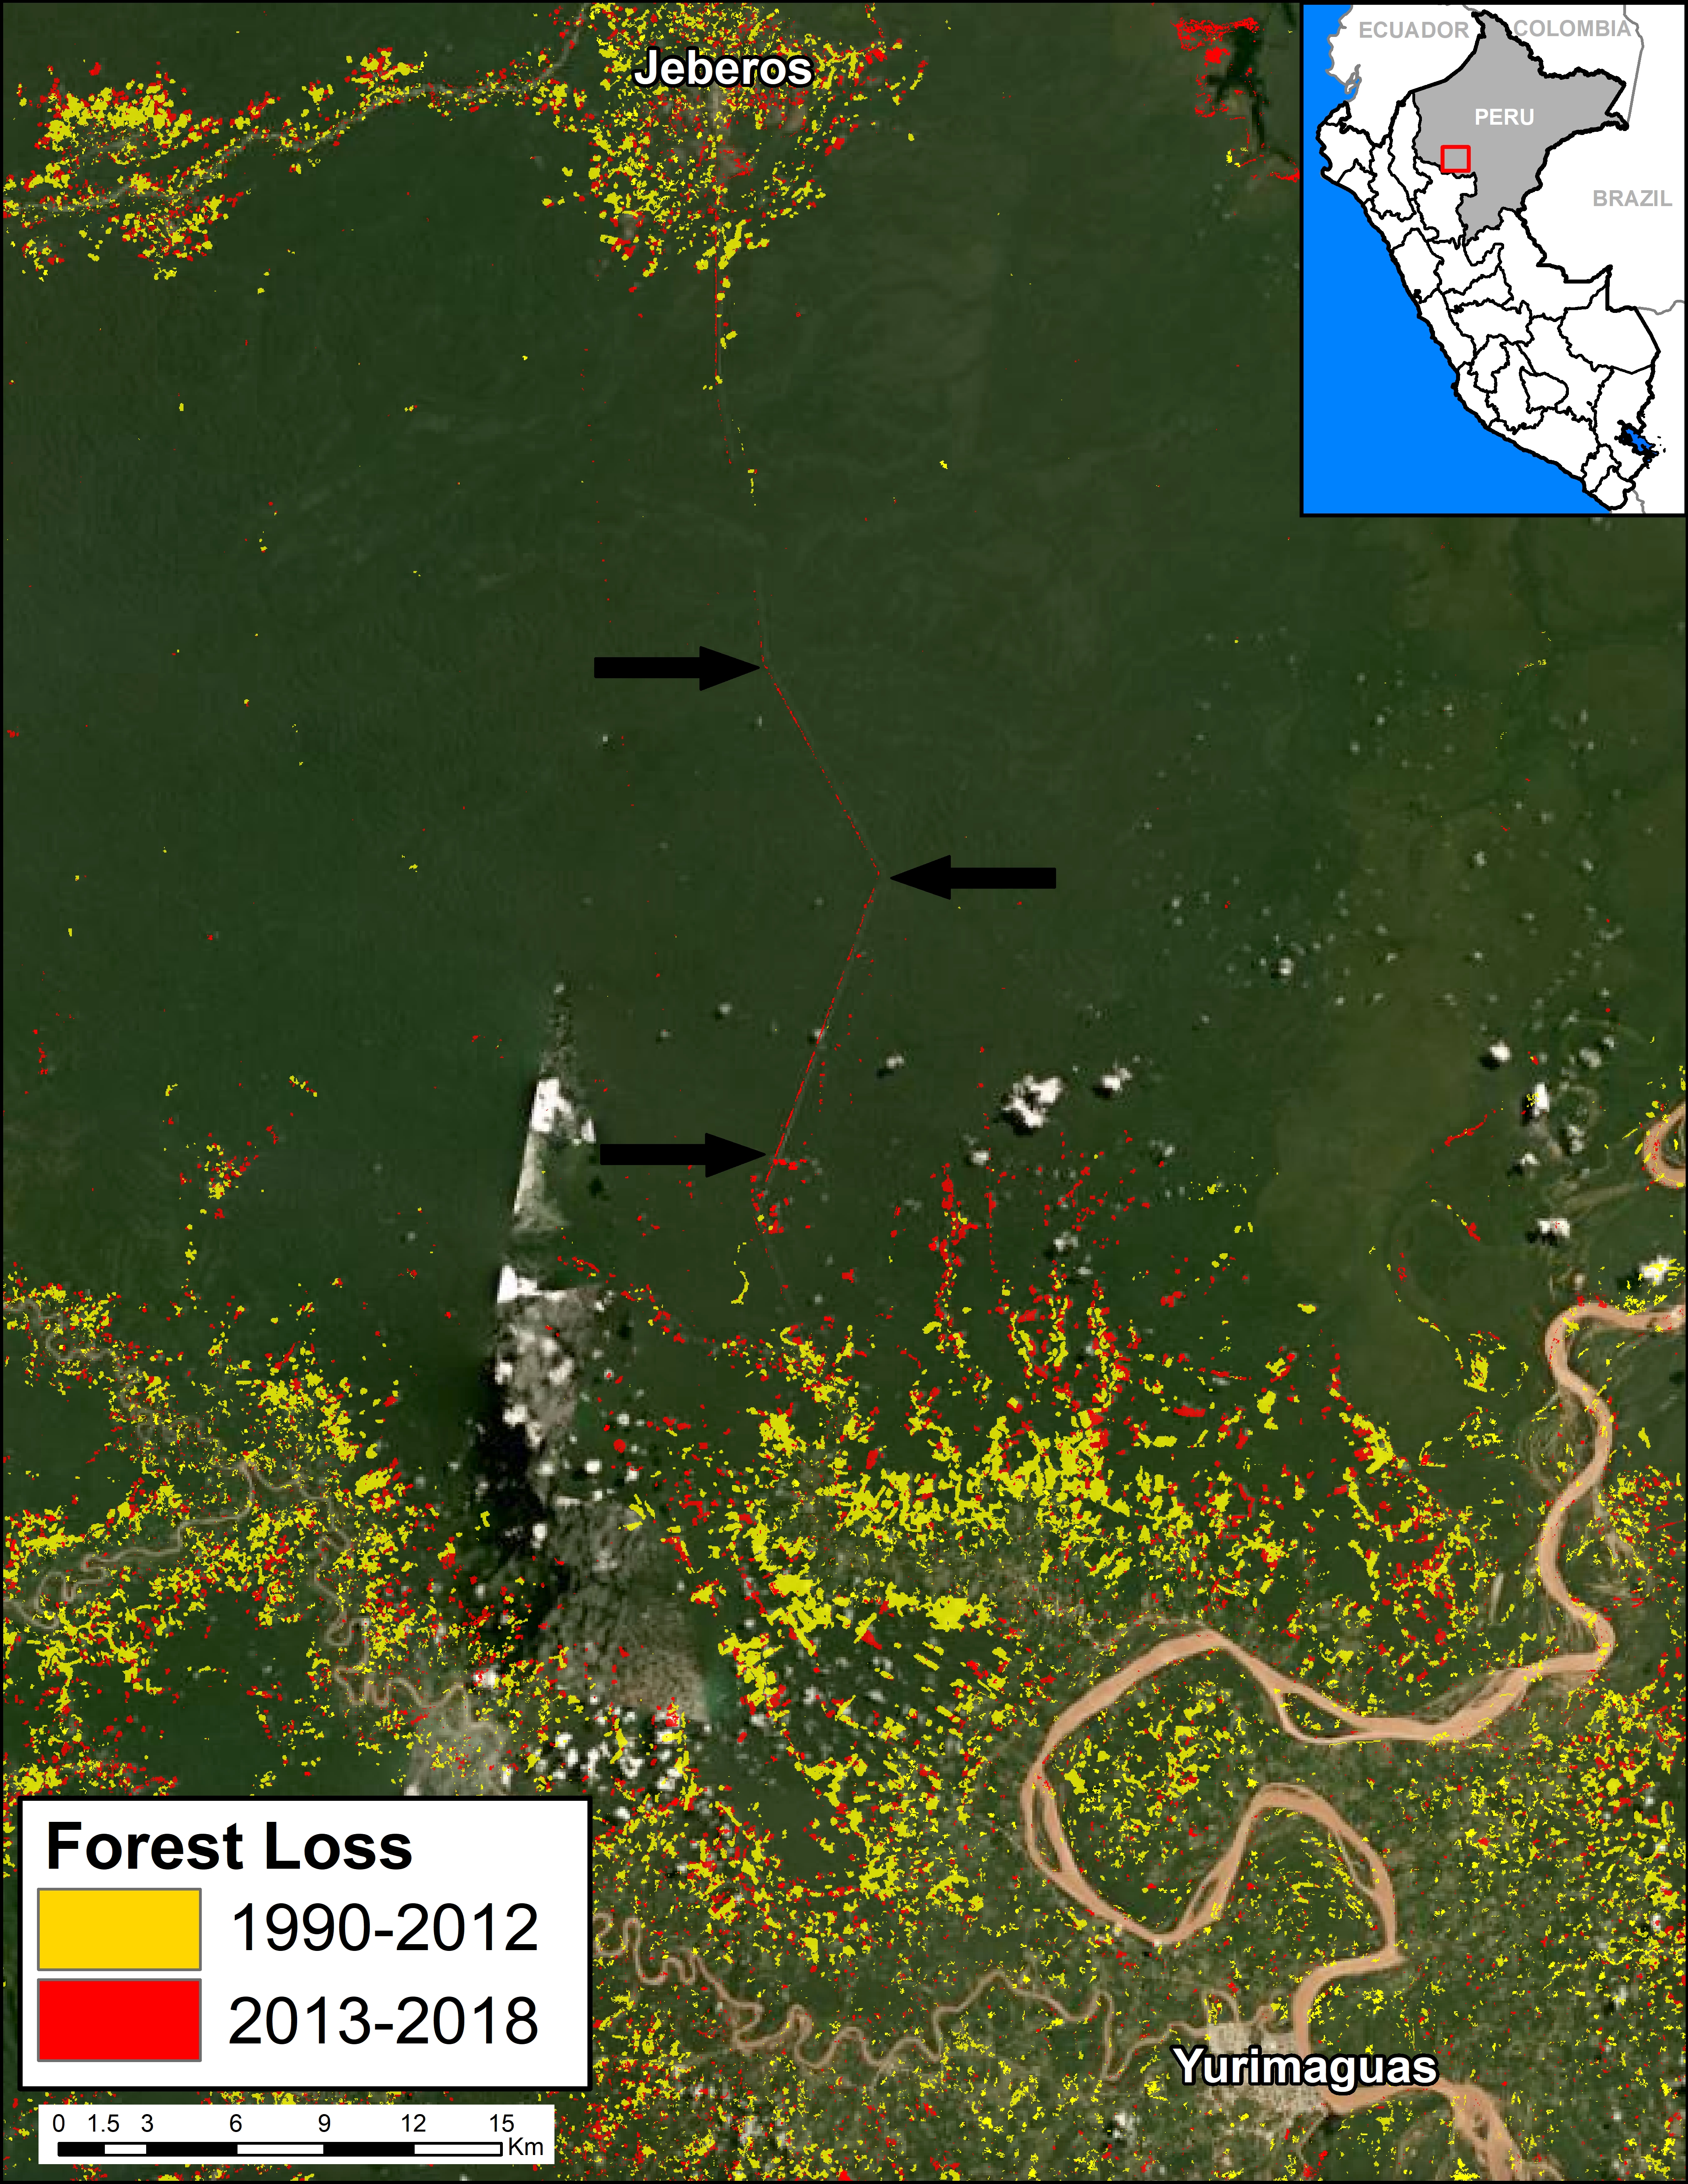
Image B. Data: GLAD/UMD, PNCB/MINAM, Hansen/UMD/Google/USGS/NASA

Early warning forest loss alerts (GLAD alerts from the University of Maryland and Global Forest Watch) have detected the construction of a new road between the city of Yurimaguas and the town of Jeberos, in southern Loreto region (see Image B).

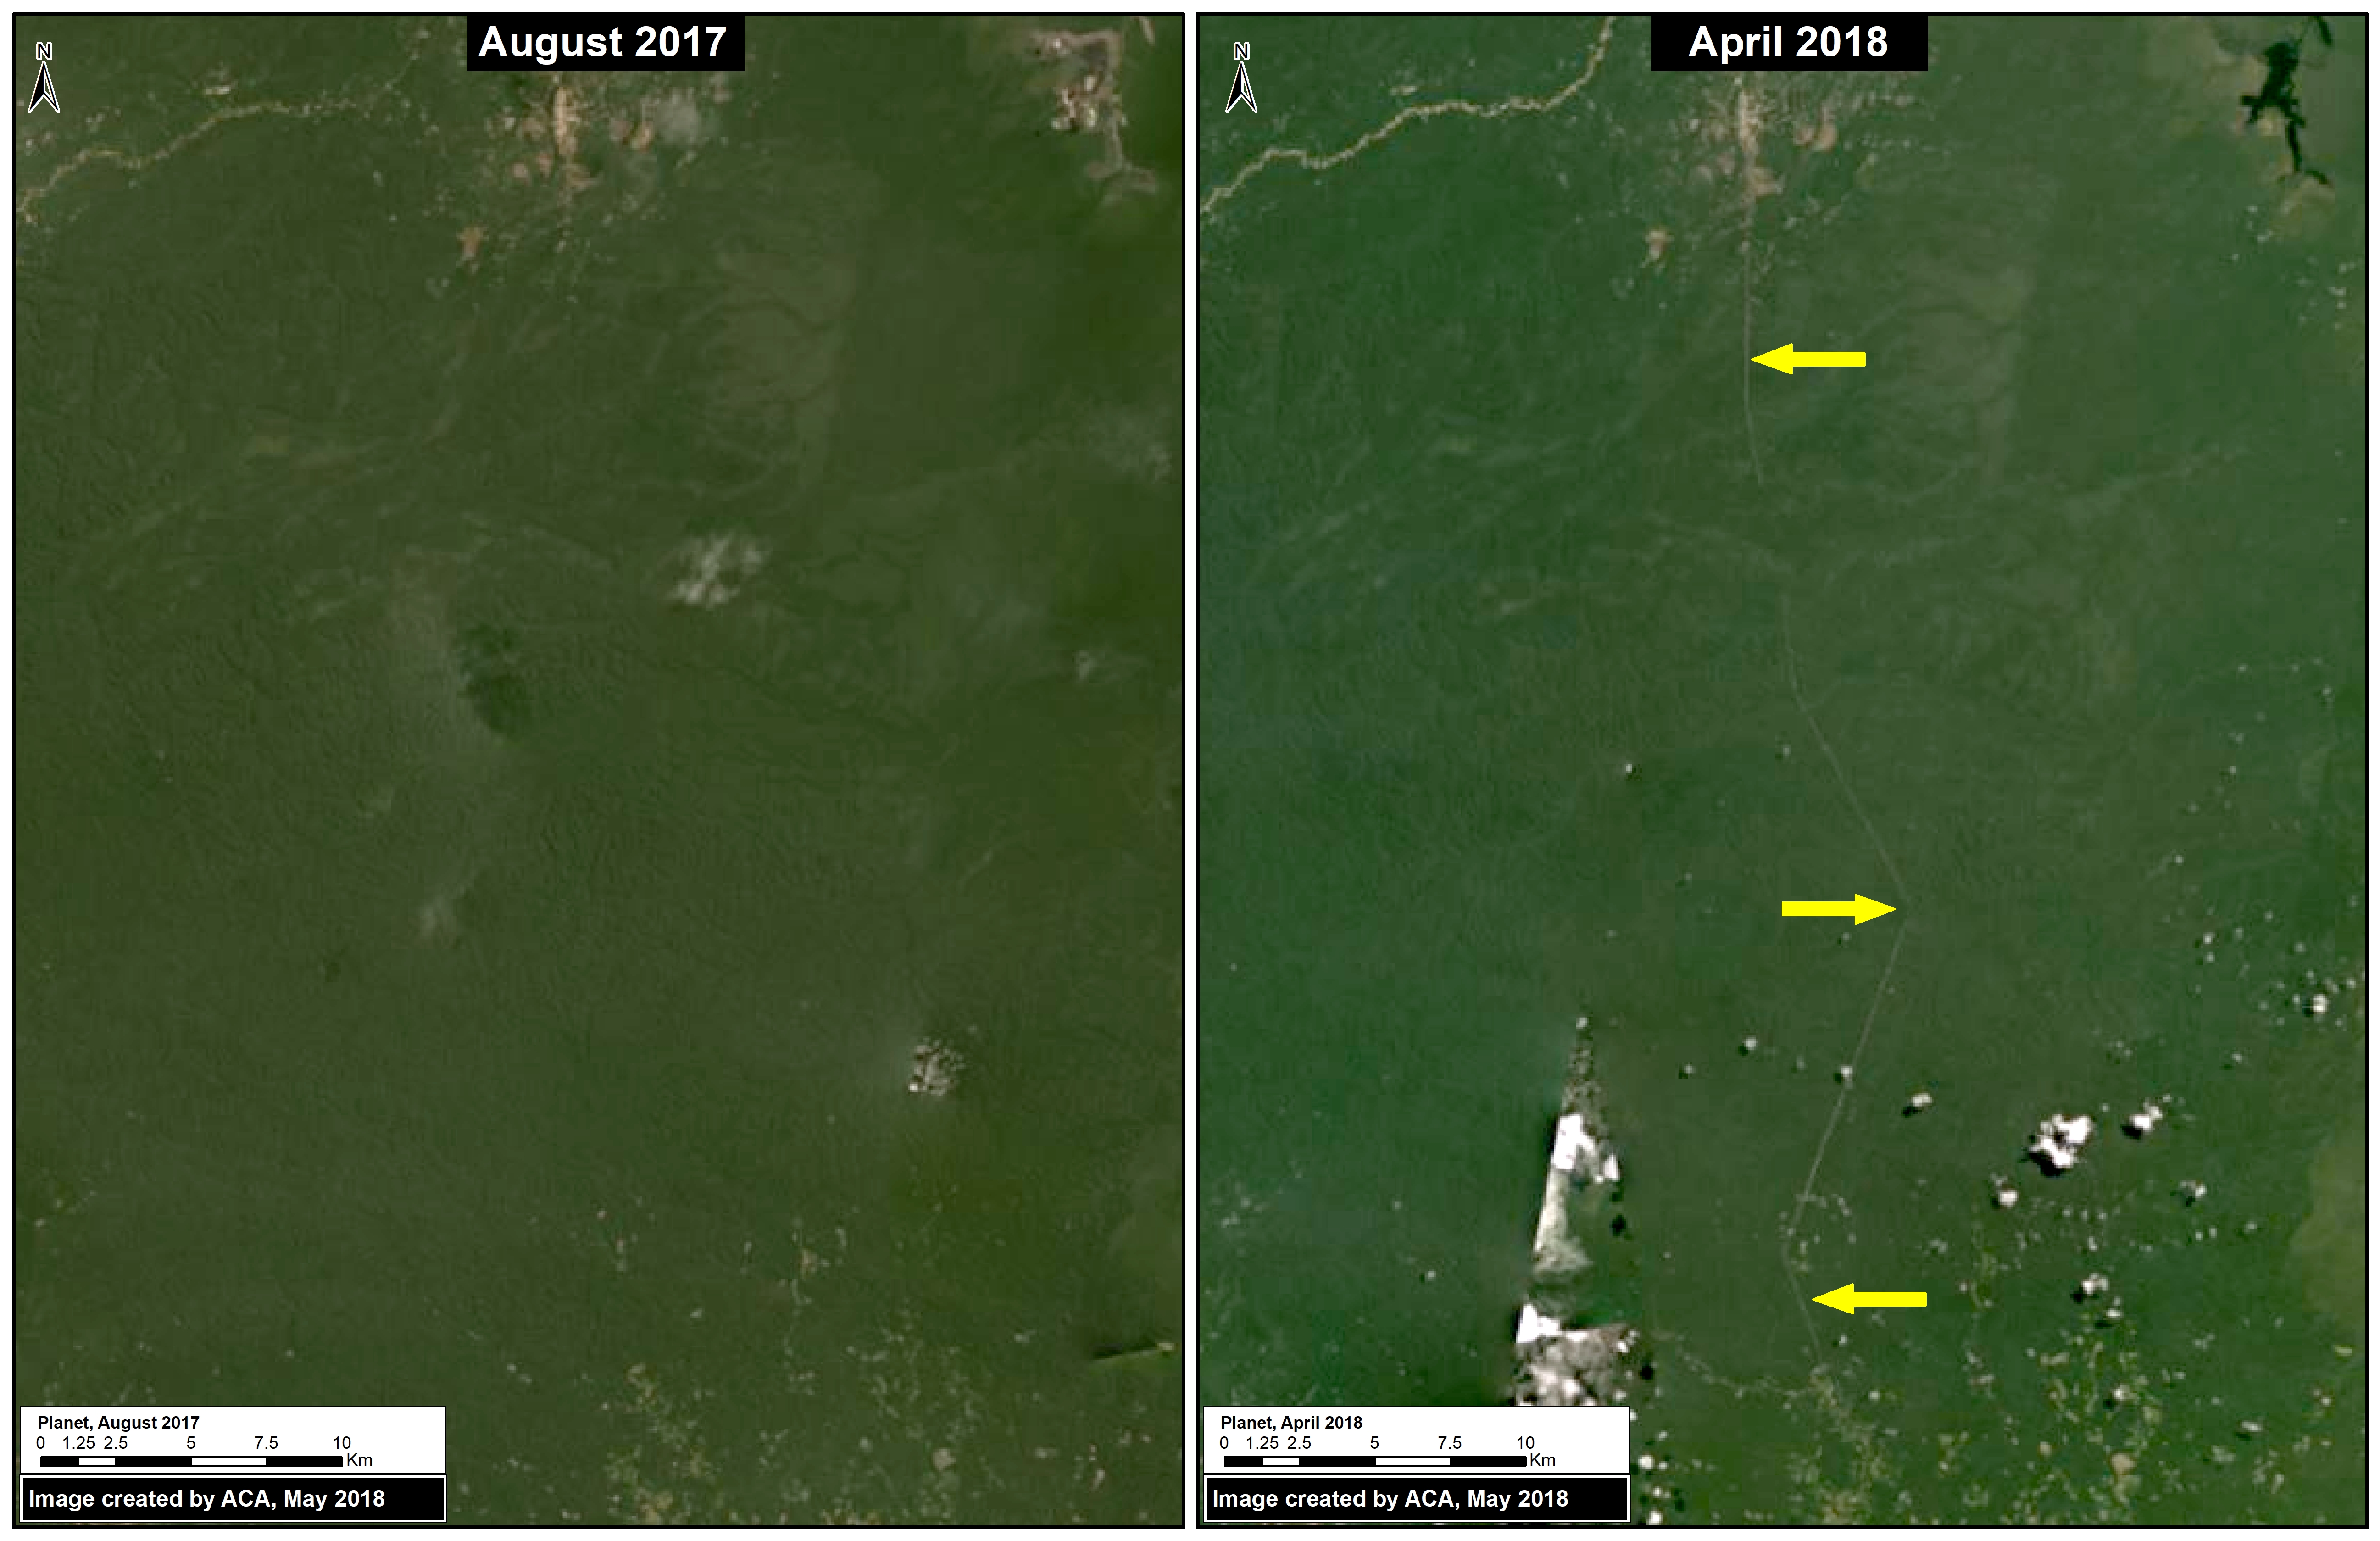
We estimate that the new road is 65 km (40 miles). In the image, the arrows indicate part of the route crossing primary forest (indicated in dark green).

Although the road improves the connectivity of an isolated town, the problem is that much of it crosses primary Amazon forest and may trigger massive deforestation. It is well documented that roads are one of the main drivers of deforestation in the Amazon (see MAAP #76).

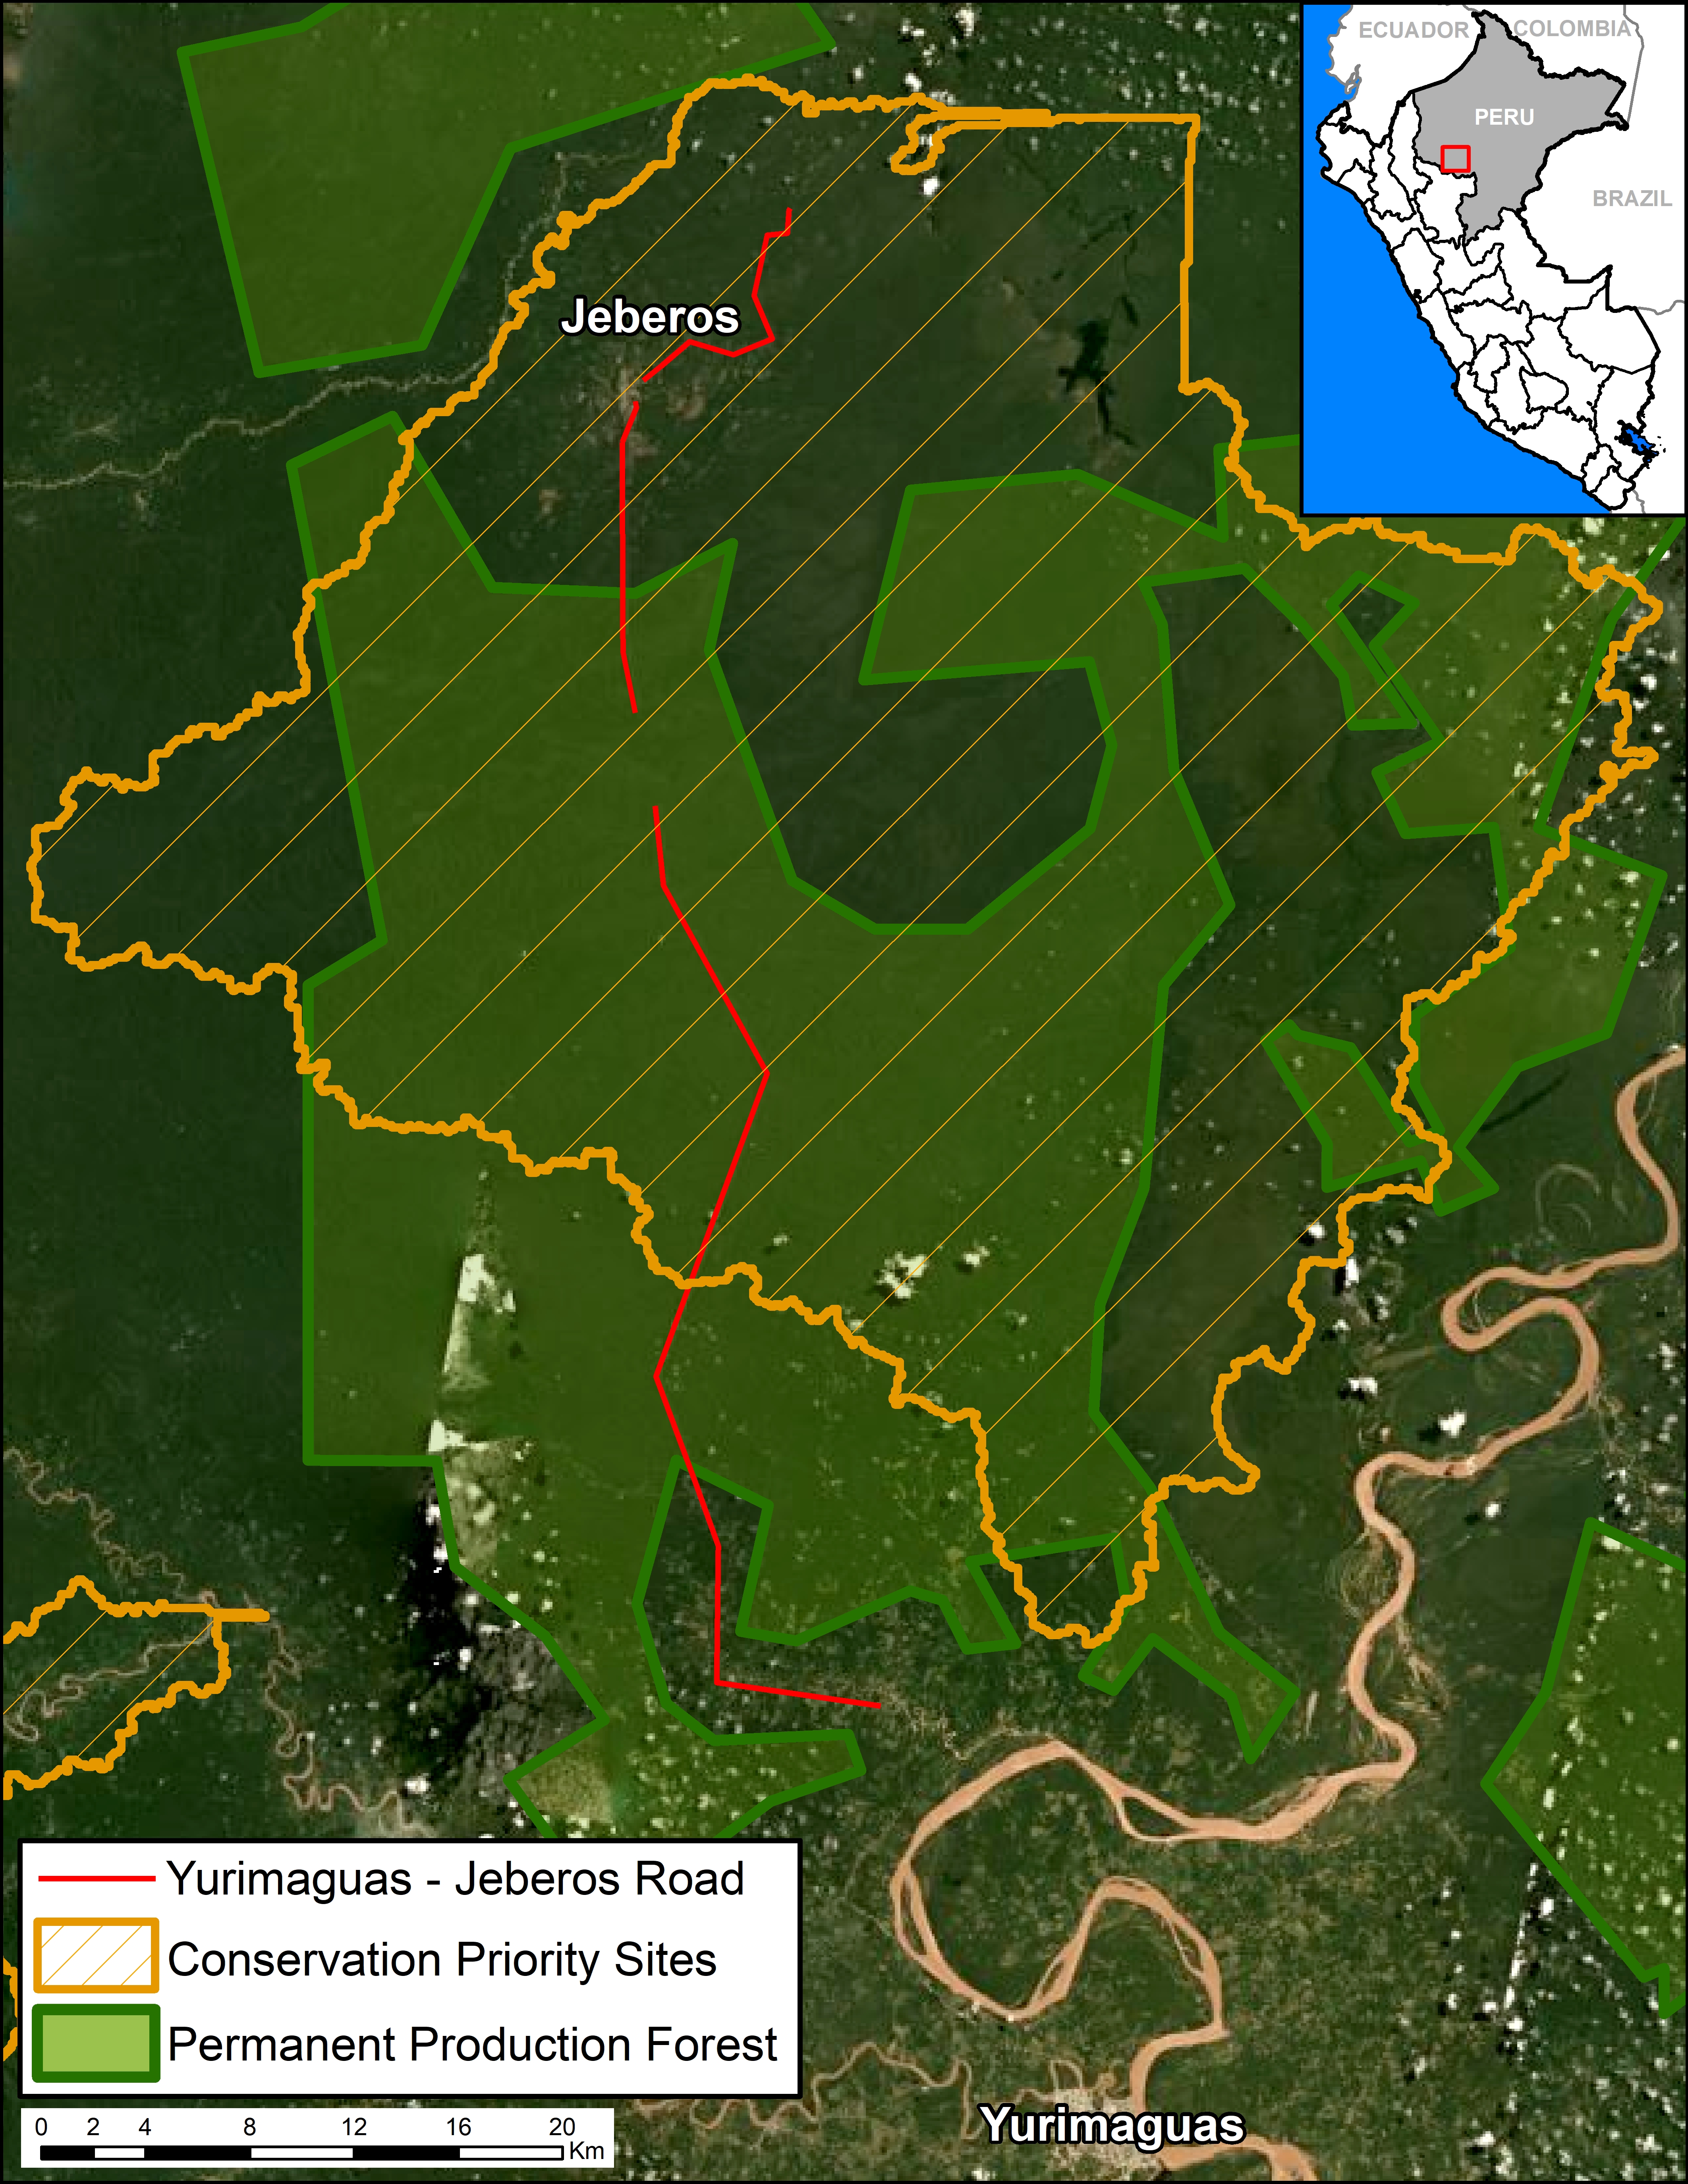
In addition, most of the route crosses “Permanent Production Forest“, a legal land classification restricted to forestry activities, not agriculture or infrastructure (Image D). The route also crosses a regional conservation priority site (Image D).

It is important to note that the Regional Government of Loreto, which is promoting and financing the project, specifically said in a press statement that the road will “encourage the expansion of the agricultural and livestock frontier in this part of the region.” That phrase can be interpreted as frankly stating that the road will cause extensive deforestation. It is a particularly troubling scenario given that Yurimaguas is already a deforestation hotspot.


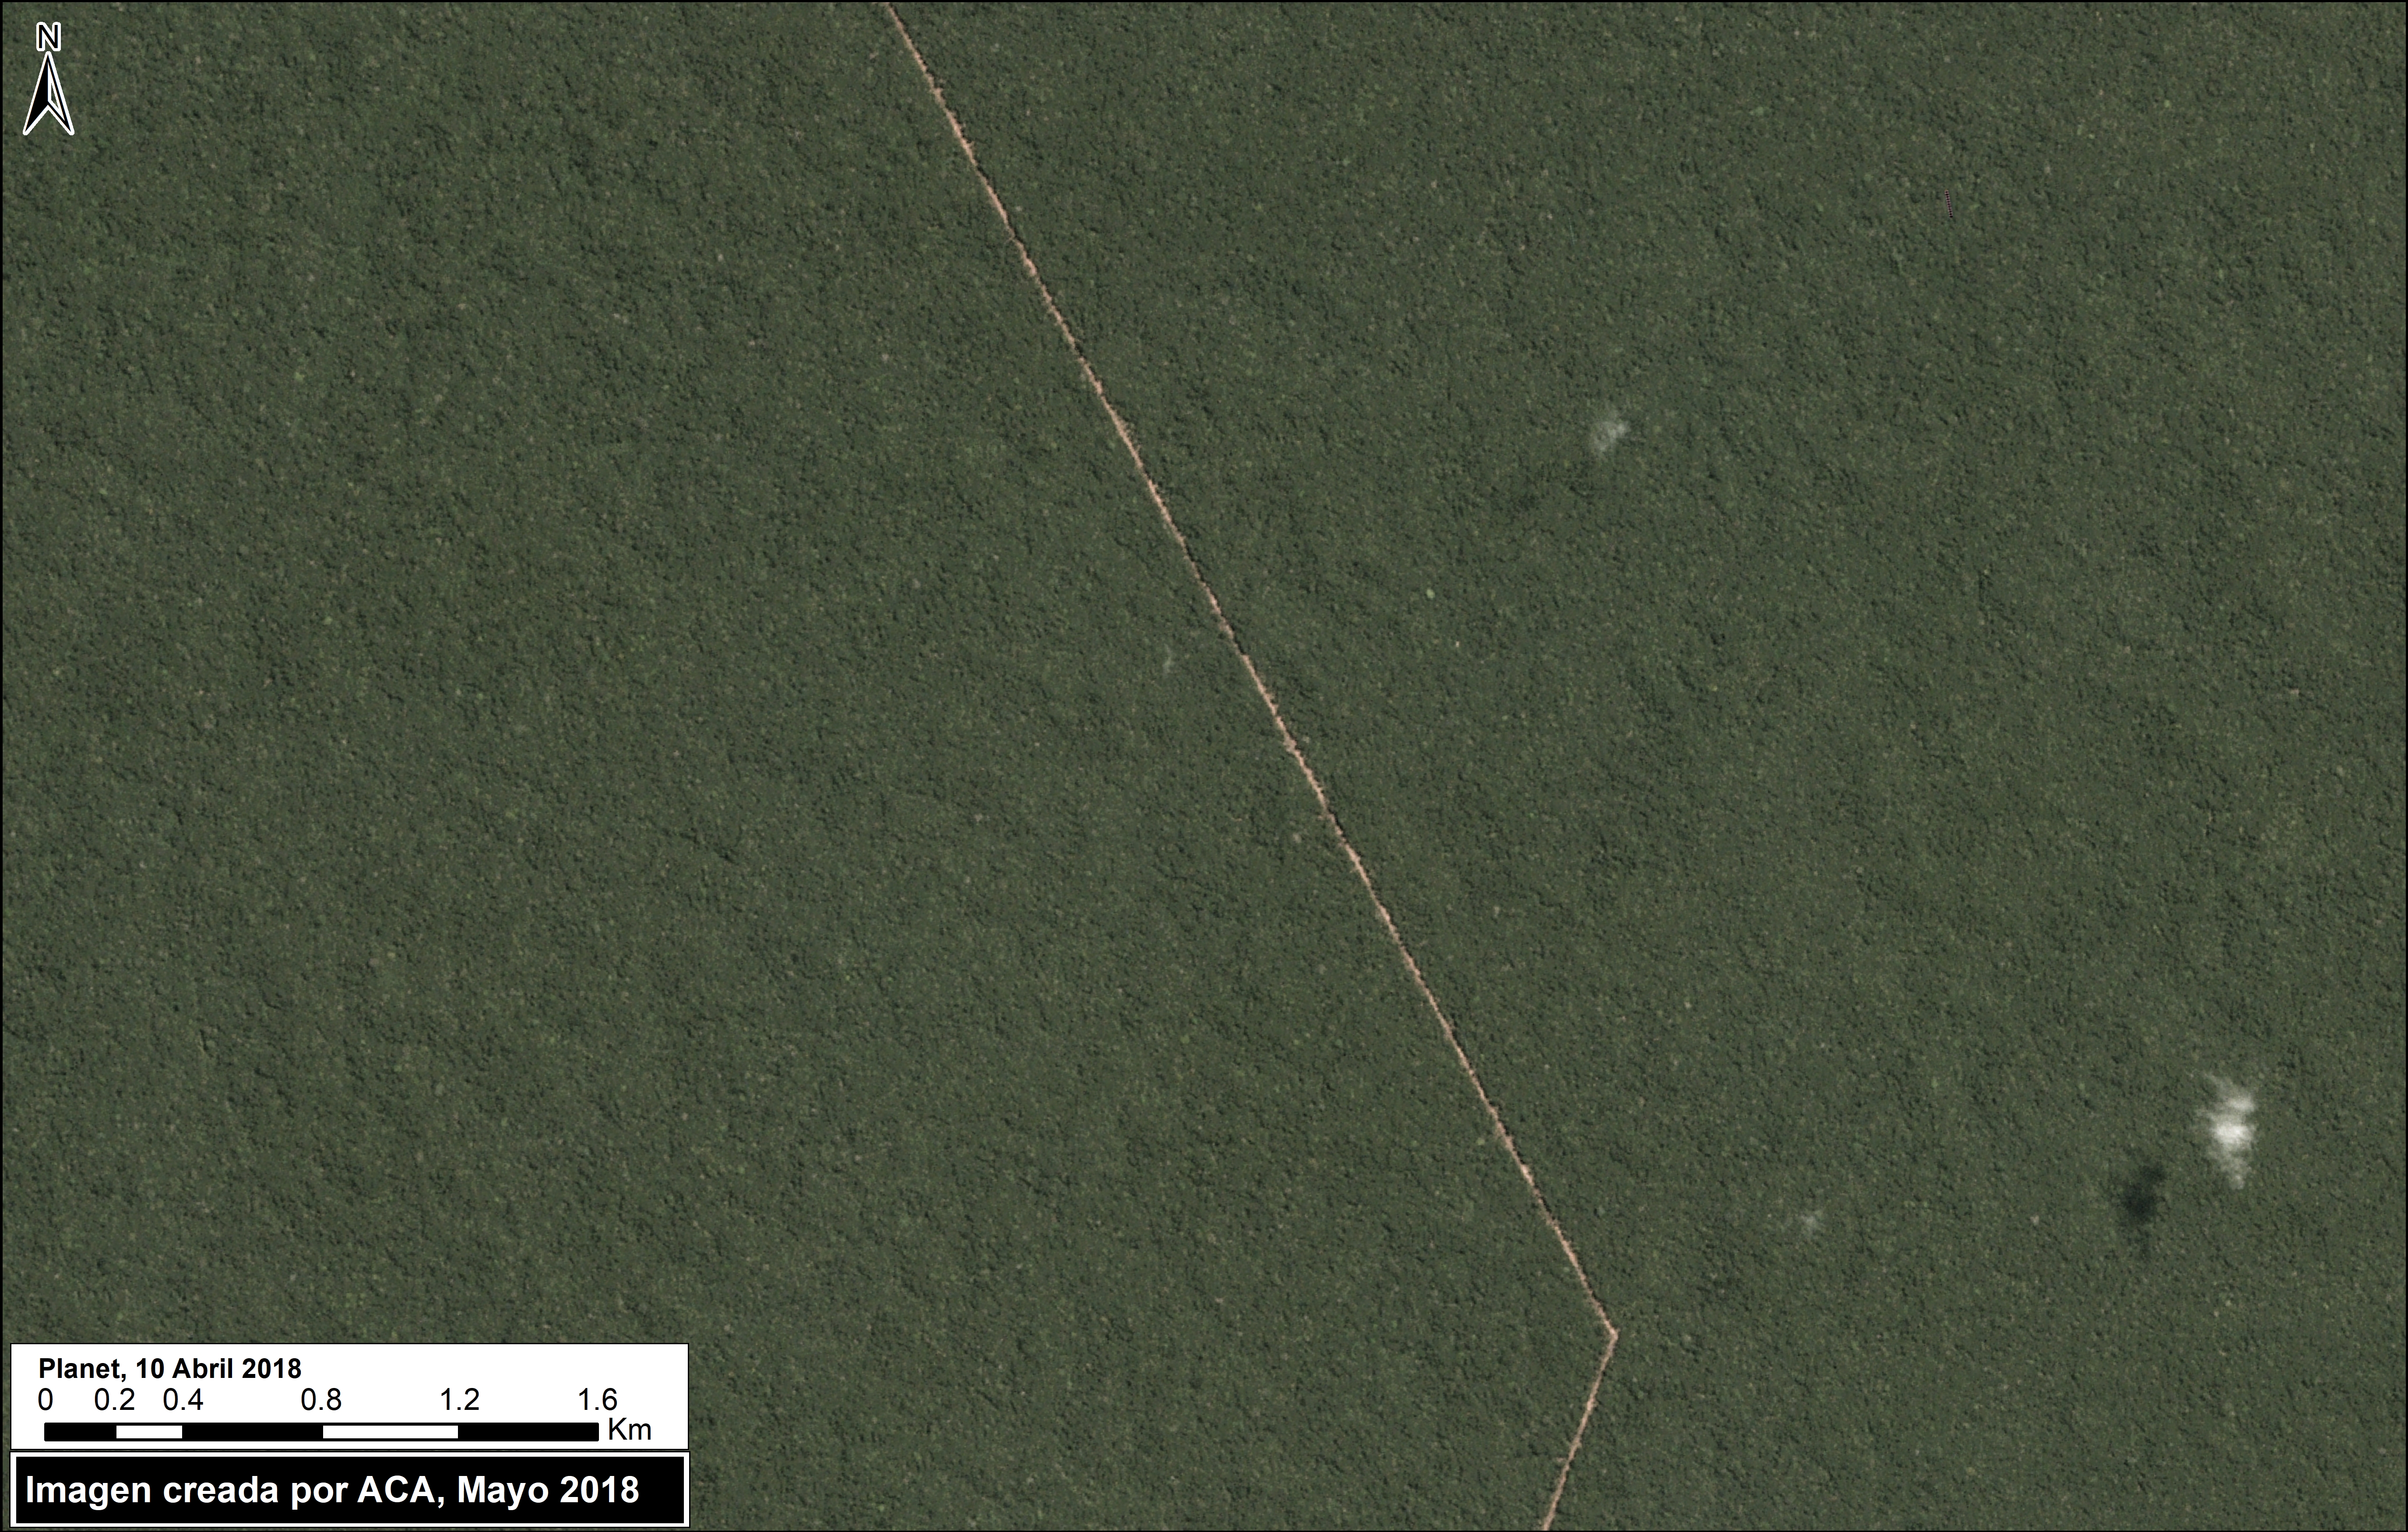
Image C shows the beginning of road construction between August 2017 (left panel) and April 2018 (right panel).

Image C. Road construction. Data: Planet.

Image D shows how the road crosses Permanent Production Forest and a regional conservation priority site.

Image D. Data: GOREL, MINAGRI, MAAP

Citation

Finer M, Mamani N (2018) New Threats to the Peruvian Amazon (Part 1: Yurimaguas-Jeberos Road). MAAP: 84.

MAAP #83: Climate Change Defense: Amazon Protected Areas and Indigenous Lands

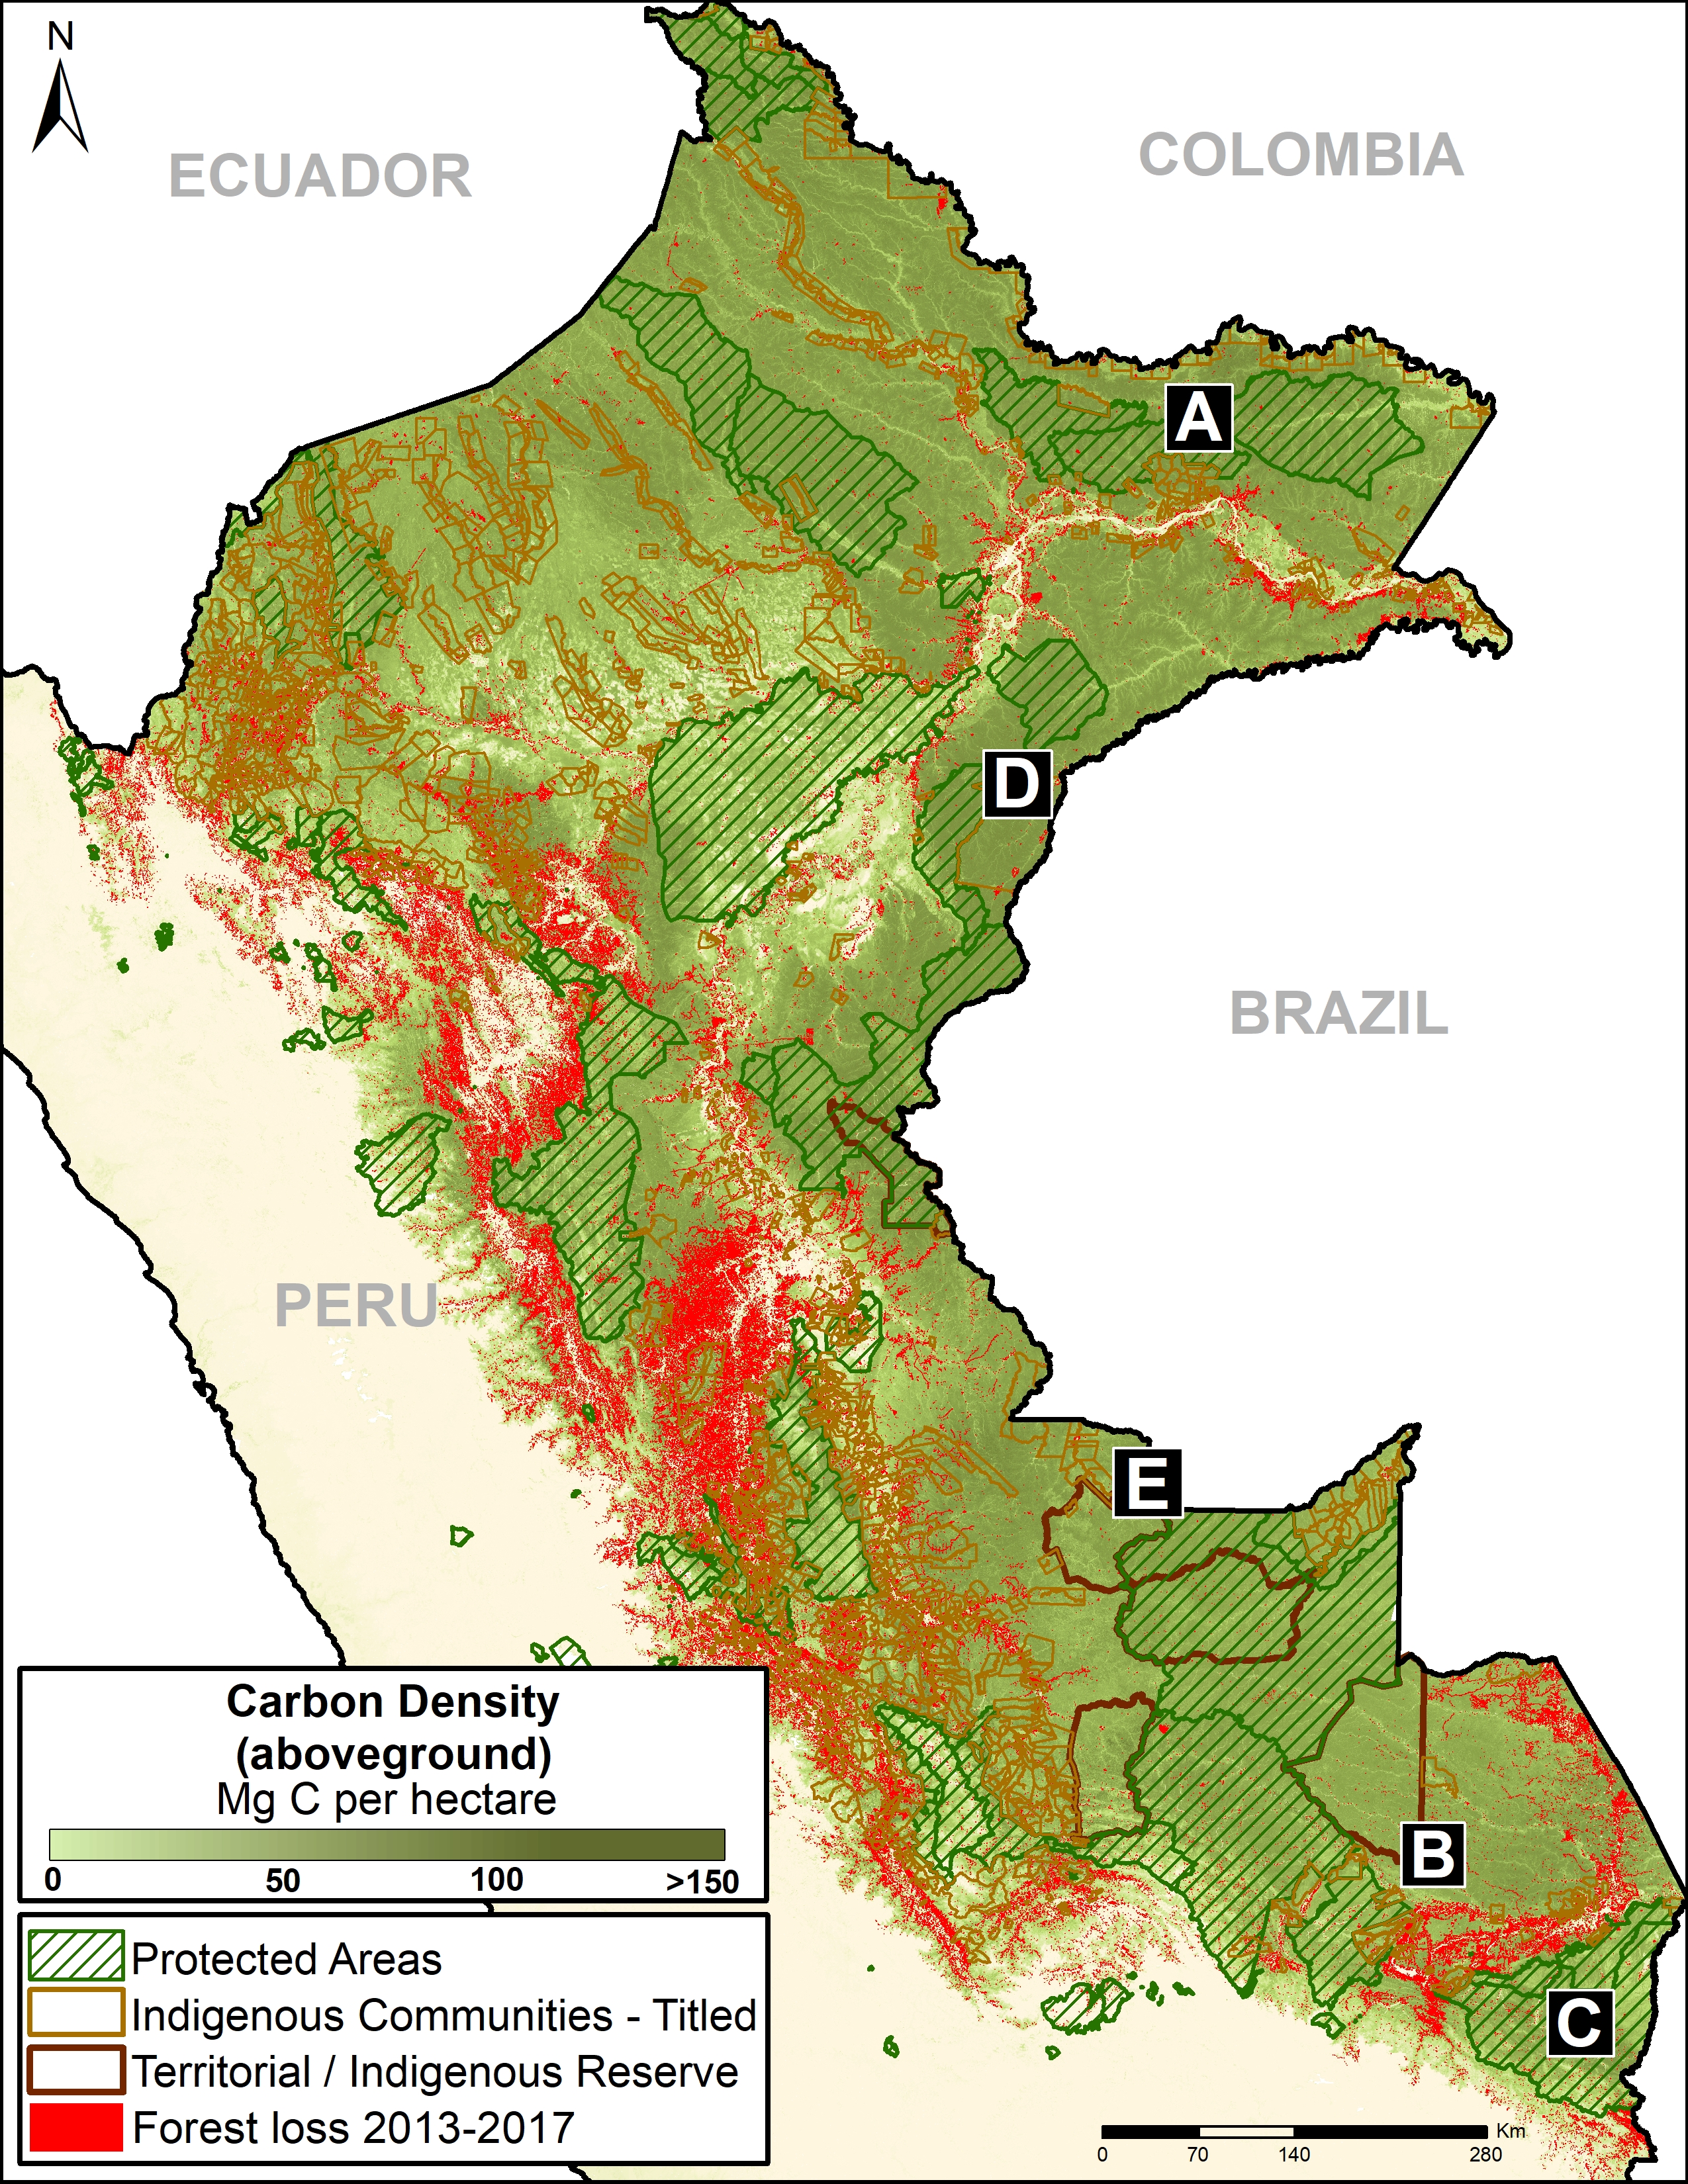
Base Map. Data: Asner et al 2014, MINAM/PNCB, SERNANP, IBC

Tropical forests, especially the Amazon, sequester huge amounts of carbon, one of the main greenhouse gases driving climate change.

Here, we show the importance of protected areas and indigenous lands to safeguard these carbon stocks.

In MAAP #81, we estimated the loss of 59 million metric tons of carbon in the Peruvian Amazon during the last five years (2013-17) due to forest loss, especially deforestation from mining and agricultural activities.

This finding reveals that forest loss represents nearly half (47%) of Peru’s annual carbon emissions, including from burning fossil fuels.1,2

In contrast, here we show that protected areas and indigenous lands have safeguarded 3.17 billion metric tons of carbon, as of 2017.3,4

The Base Map (on the right) shows, in shades of green, the current carbon densities in relation to these areas.

The breakdown of results are:
1.85 billion tons safeguarded in the Peruvian national protected areas system;
1.15 billion tons safeguarded in titled native community lands; and
309.7 million tons safeguarded in Territorial Reserves for indigenous peoples in voluntary isolation.

The total safeguarded carbon (3.17 billion metric tons) is the equivalent to 2.5 years of carbon emissions from the United States.5

Below, we show several examples of how protected areas and indigenous lands are safeguarding carbon reservoirs in important areas, indicated by insets A-E.

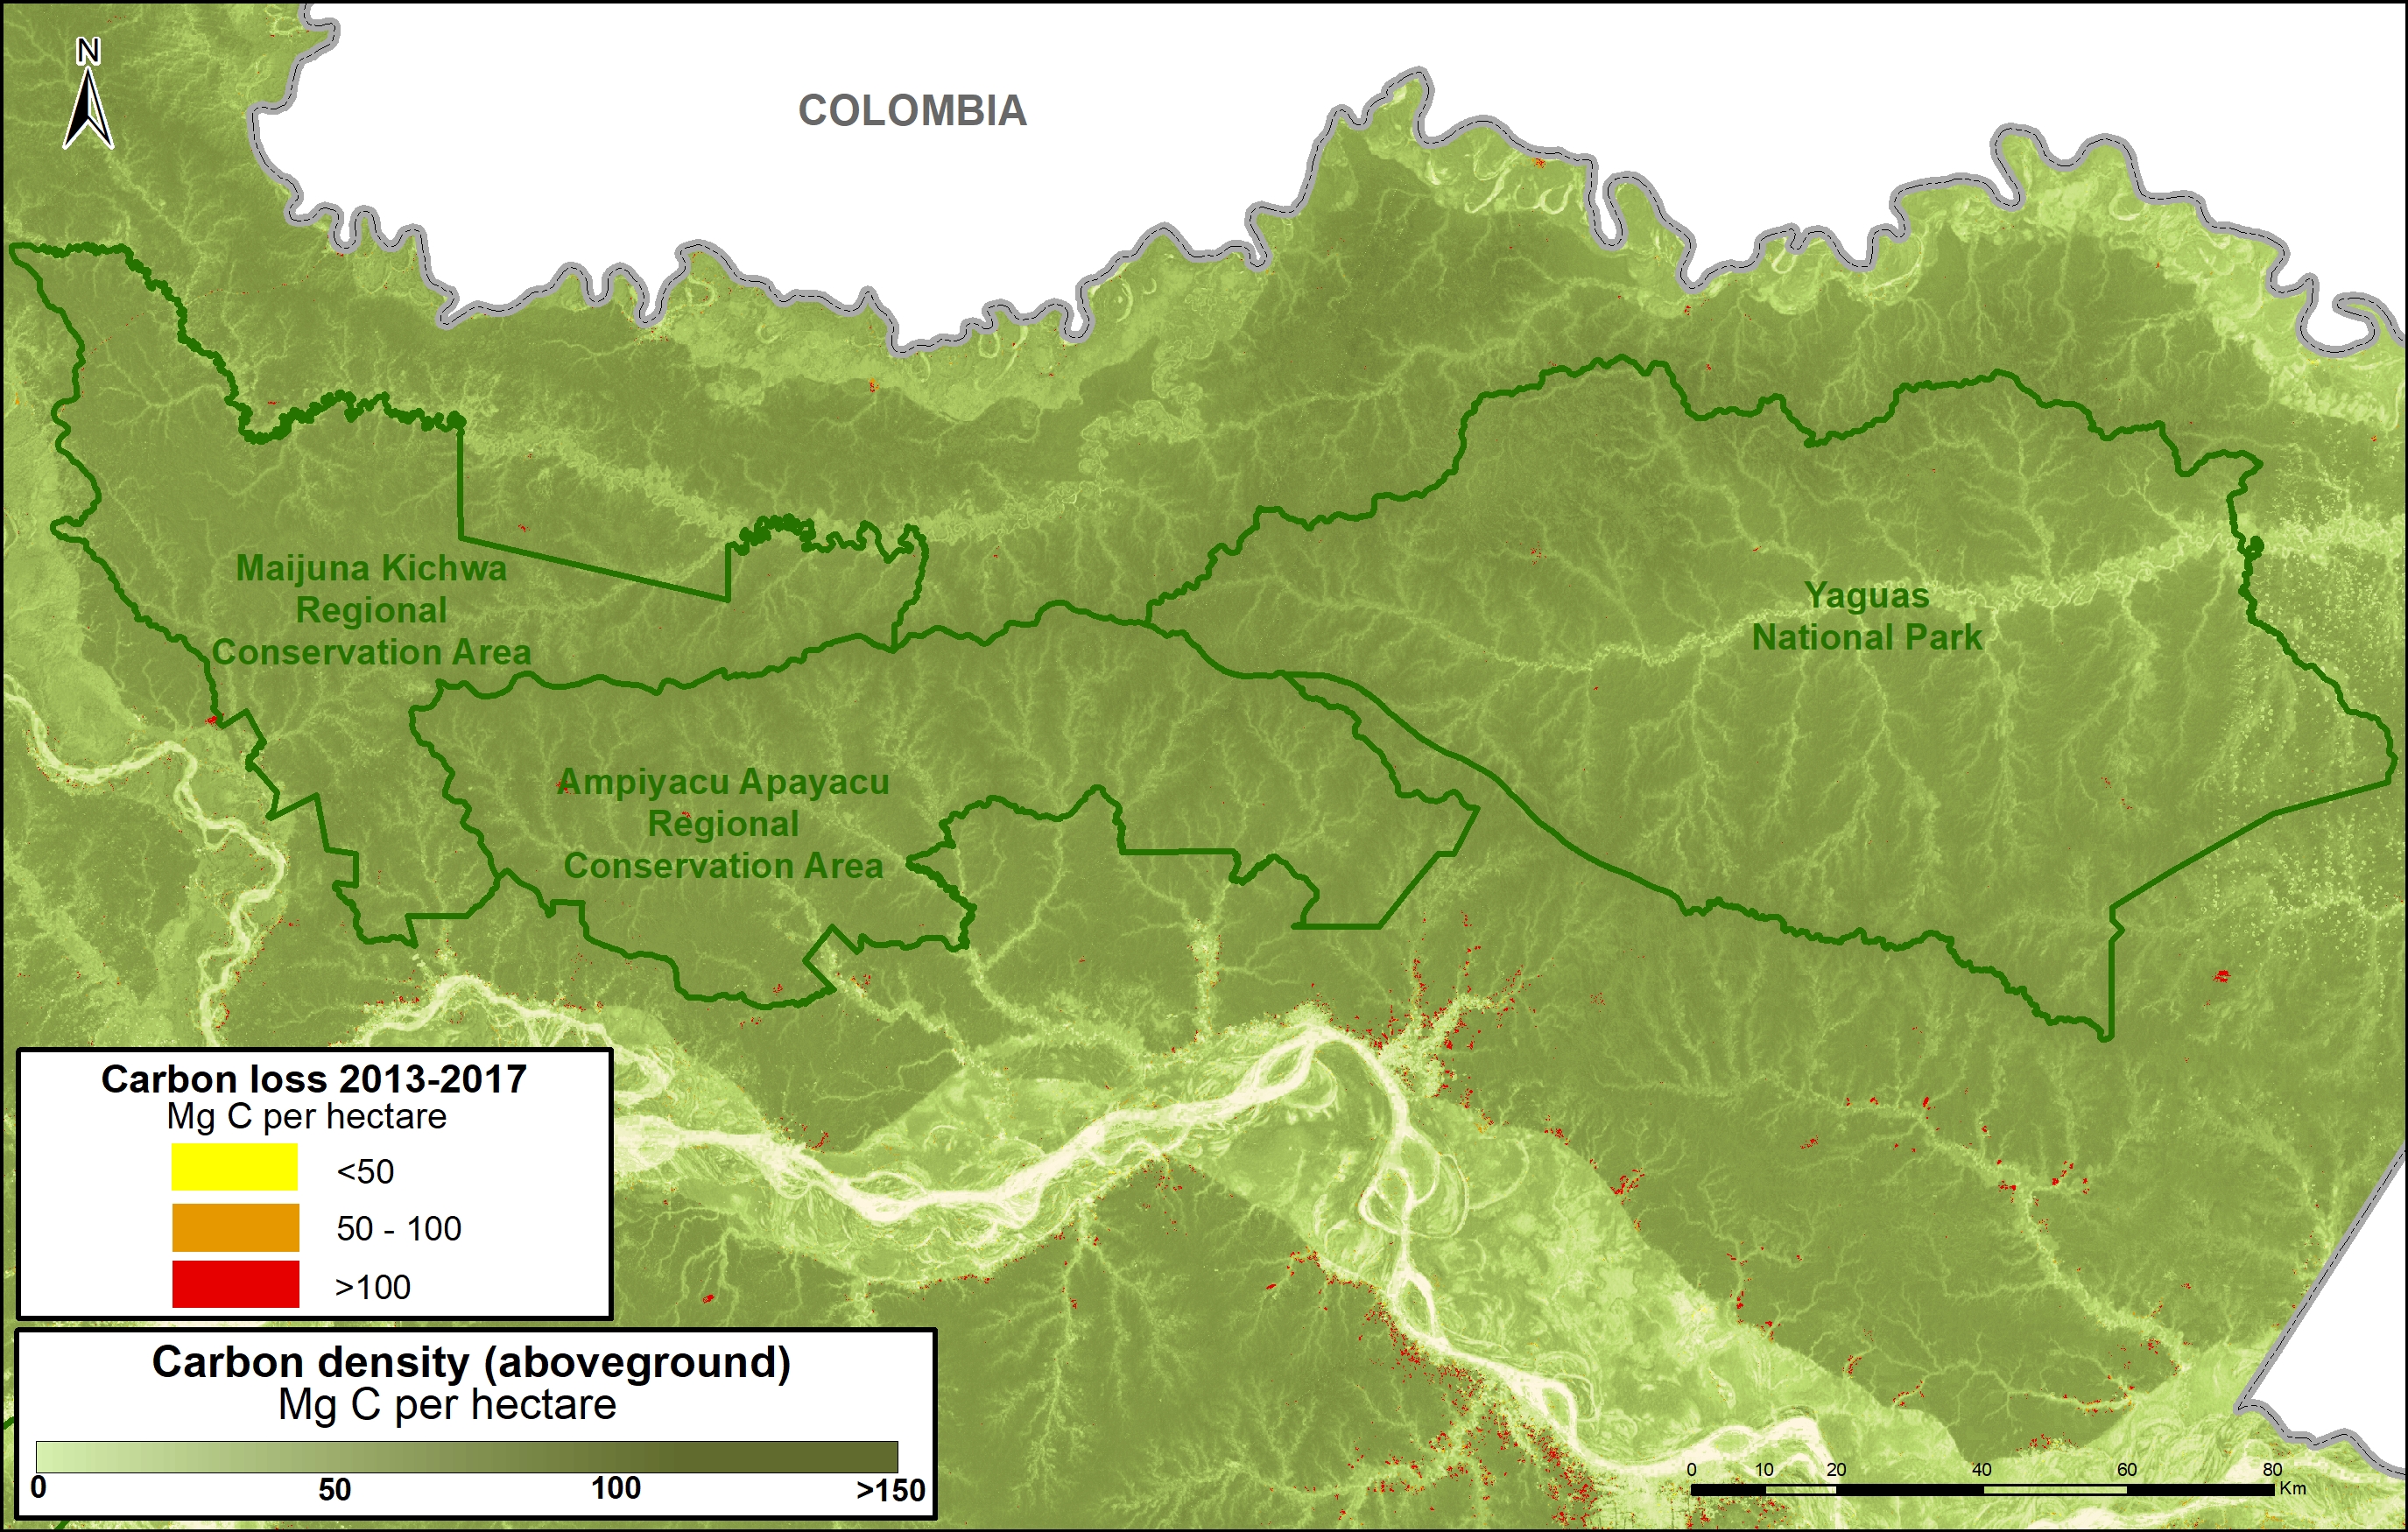
A. Yaguas National Park

The following Image A shows how three protected areas, including the new Yaguas National Park, are effectively safeguarding 202 million metric tons of carbon in the northeastern Peruvian Amazon. This area is home to some of the highest carbon densities in the country.

Image 83a. Yaguas. Data: Asner et al 2014, MINAM/PNCB, SERNANP

B. Manu National Park, Amarakaeri Communal Reserve, CC Los Amigos

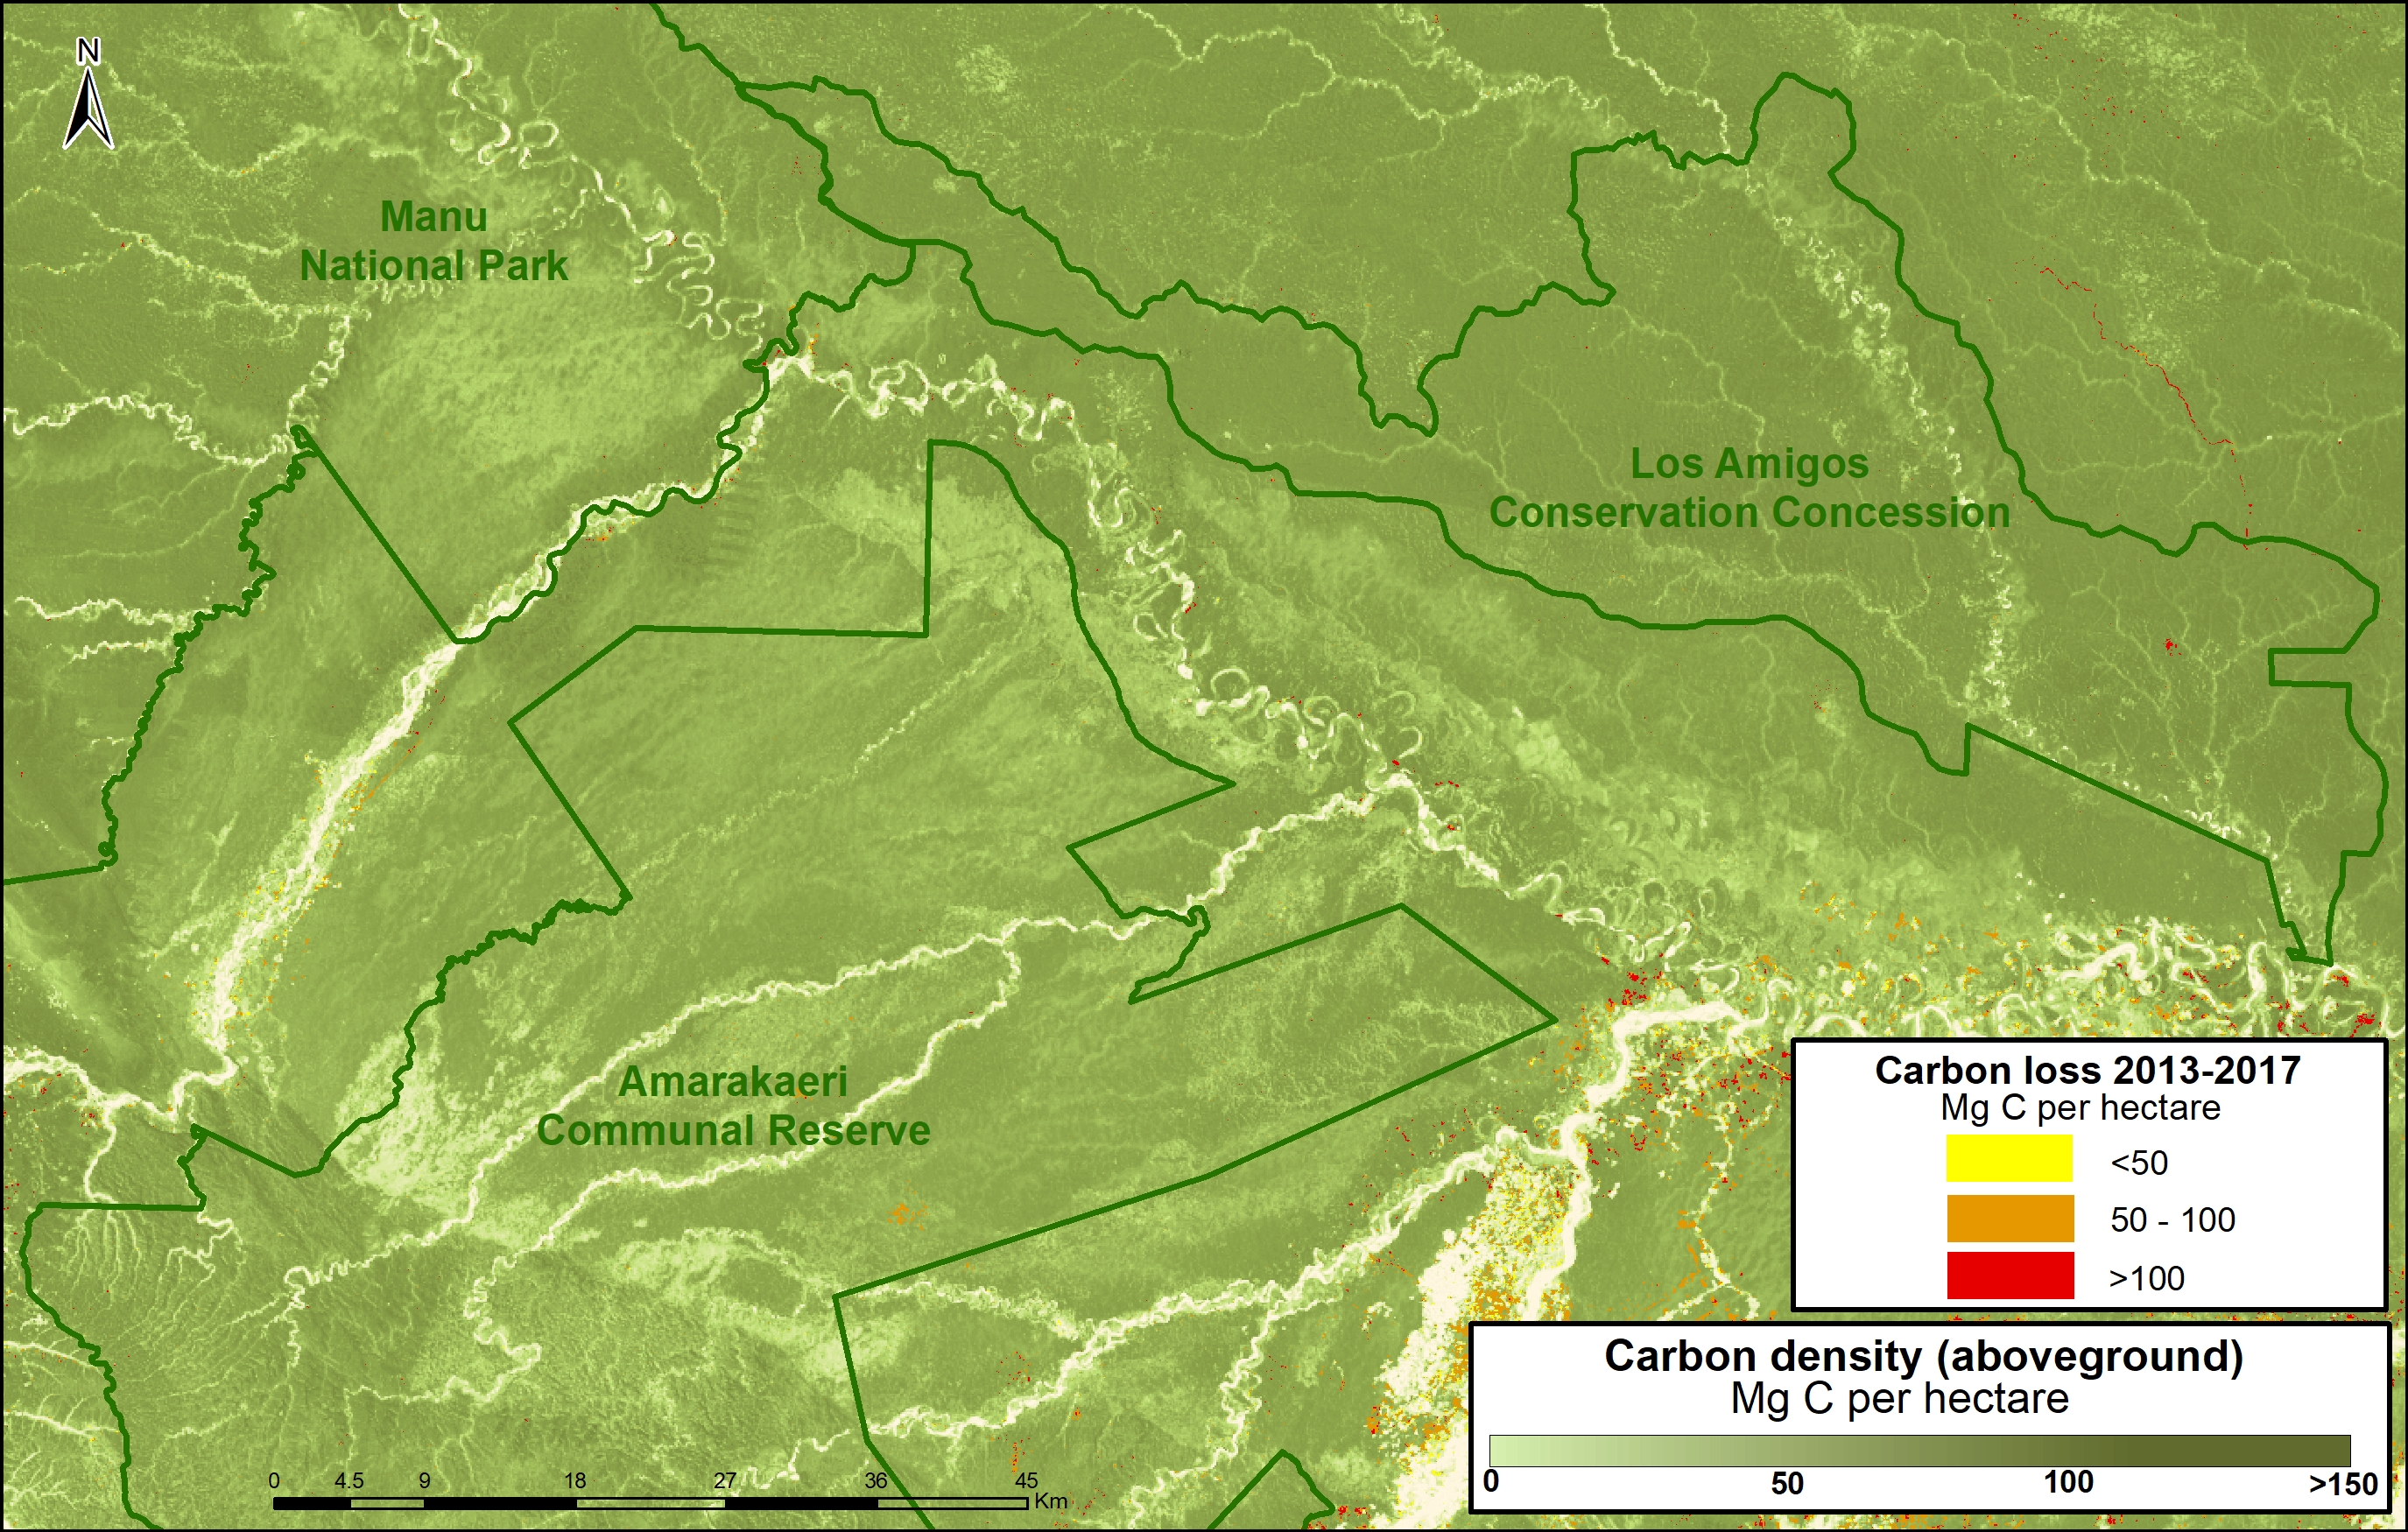
The following Image B shows how Los Amigos, the world’s first conservation concession, is effectively safeguarding 15 million metric tons of carbon in the southern Peruvian Amazon. Two surrounding protected areas, Manu National Park and Amarakaeri Communal Reserve, safeguard an additional 194 million metric tons. This area is home to some of the highest carbon densities in the country.

Image 83b. Los Amigos-Manu-Amarakaeri. Data: Asner et al 2014, MINAM/PNCB, SERNANP, ACCA

C. Tambopata National Reserve, Bahuaja Sonene National Park

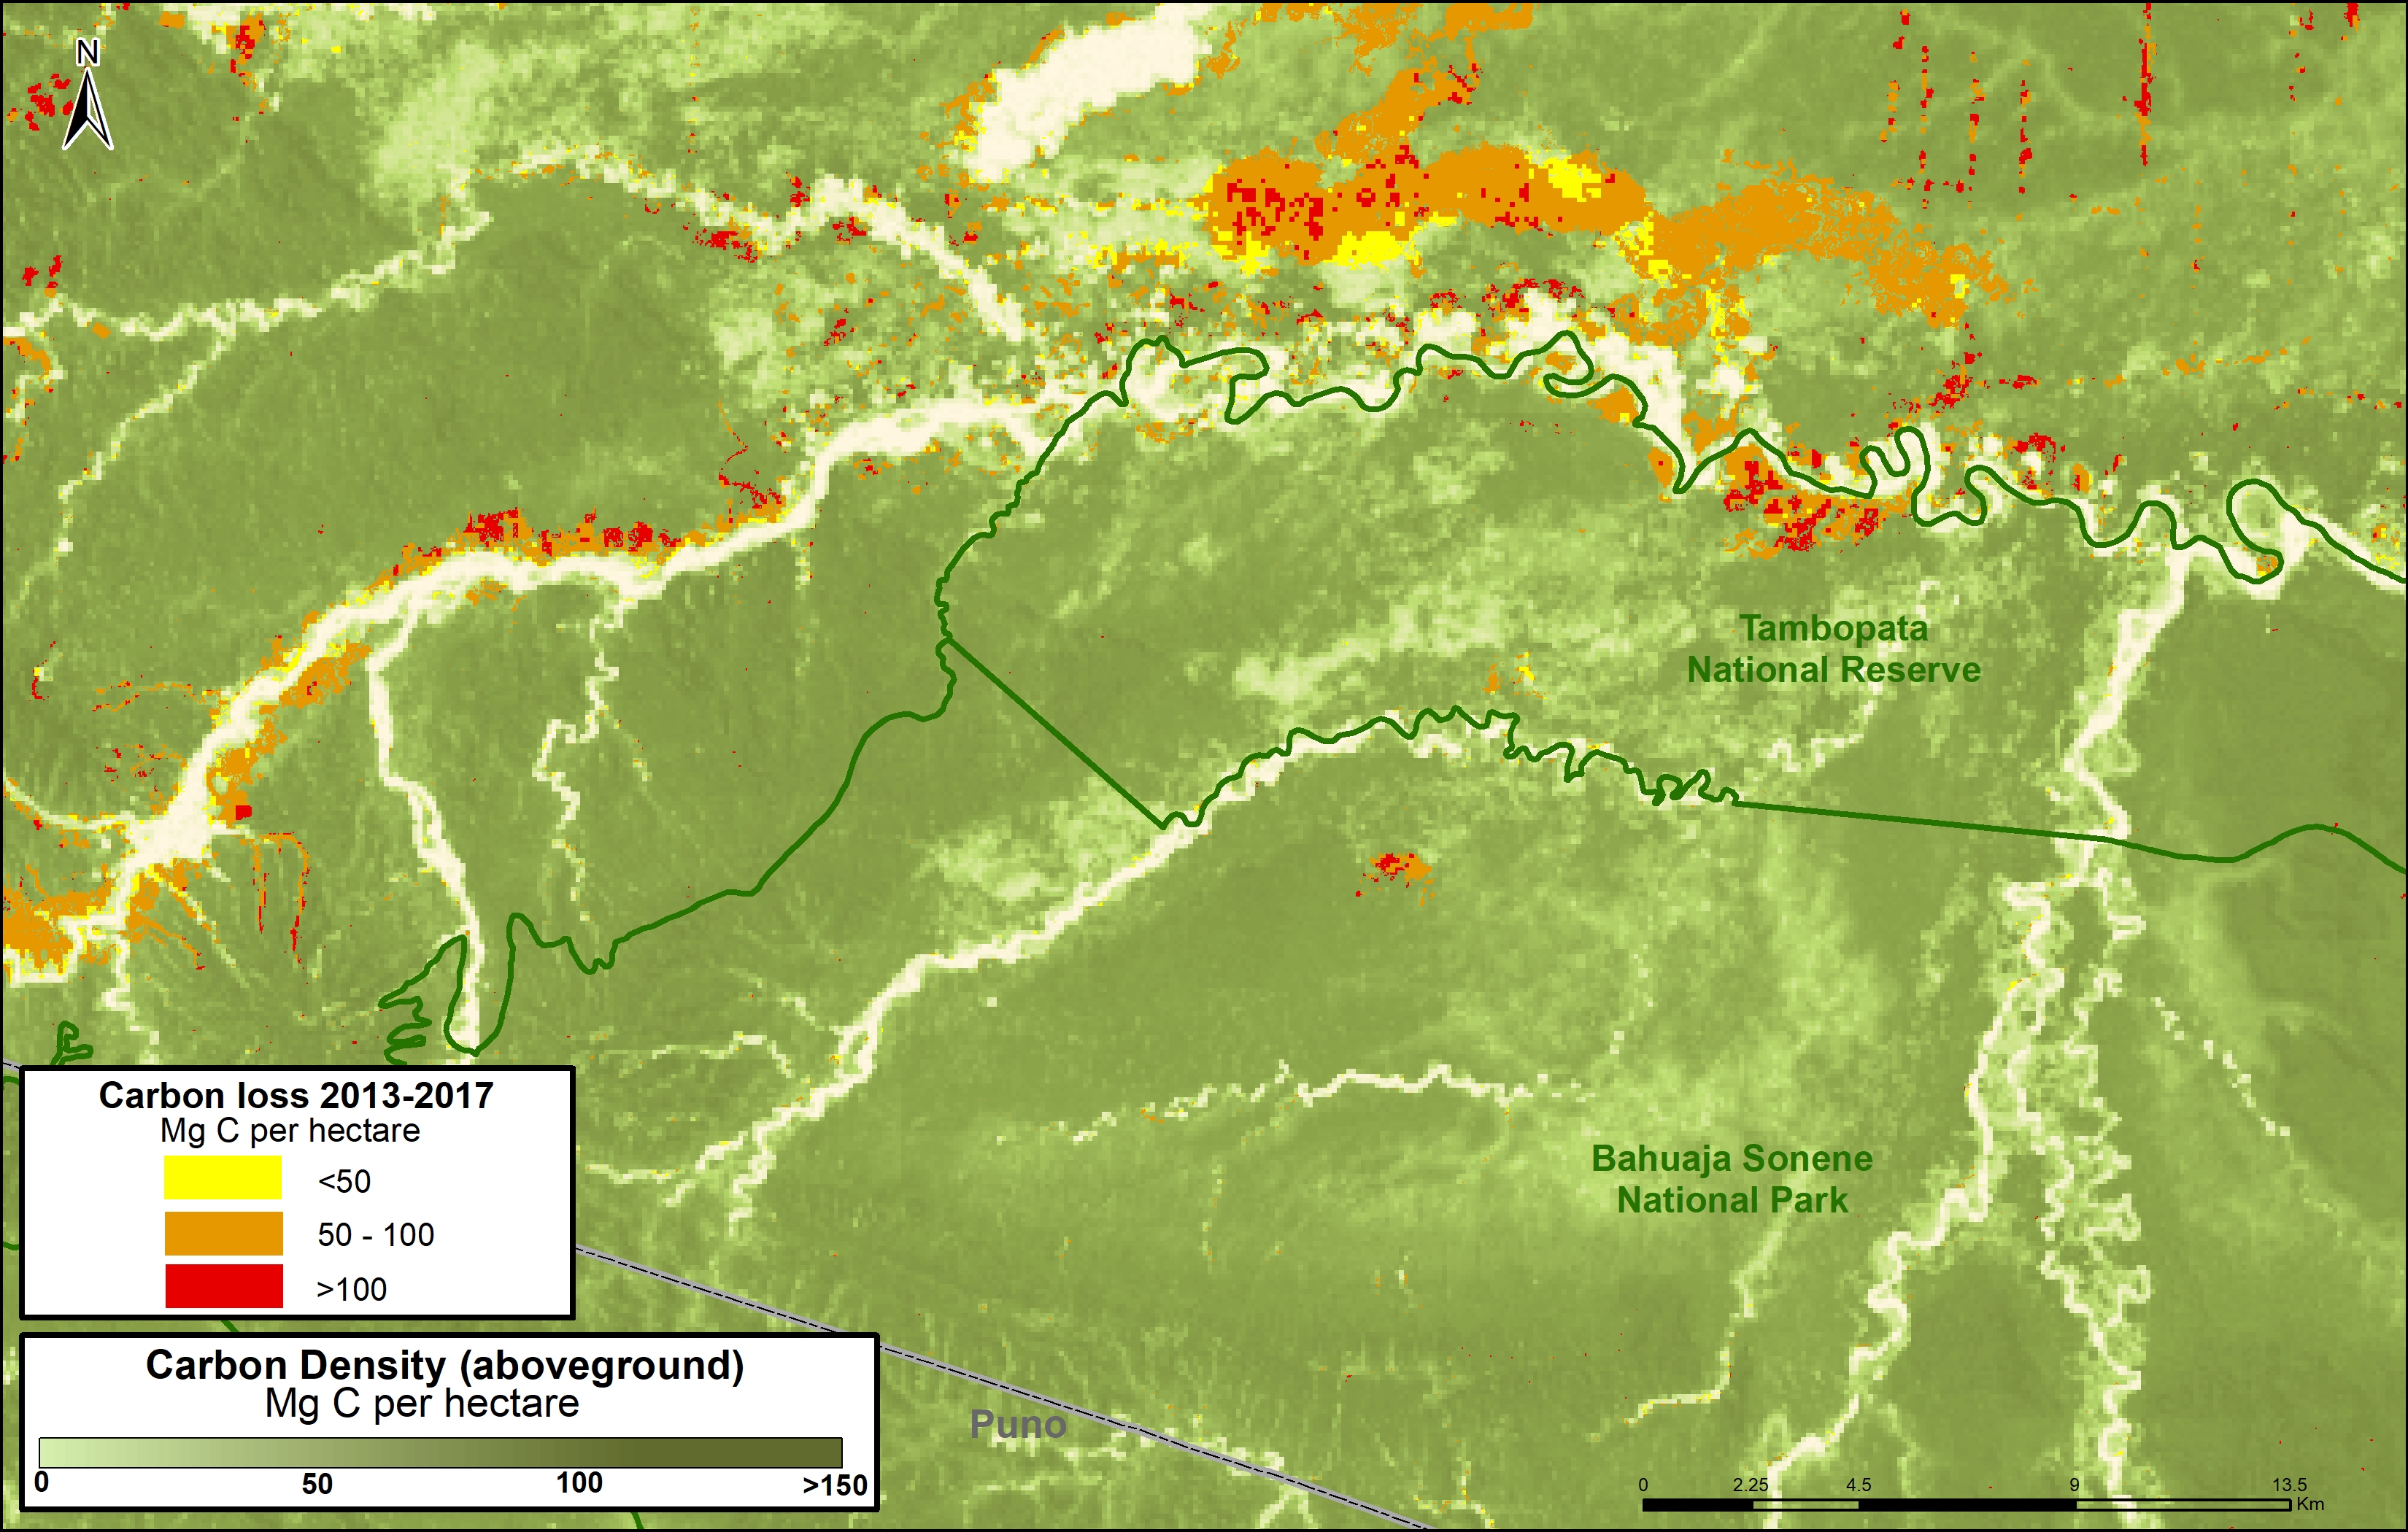
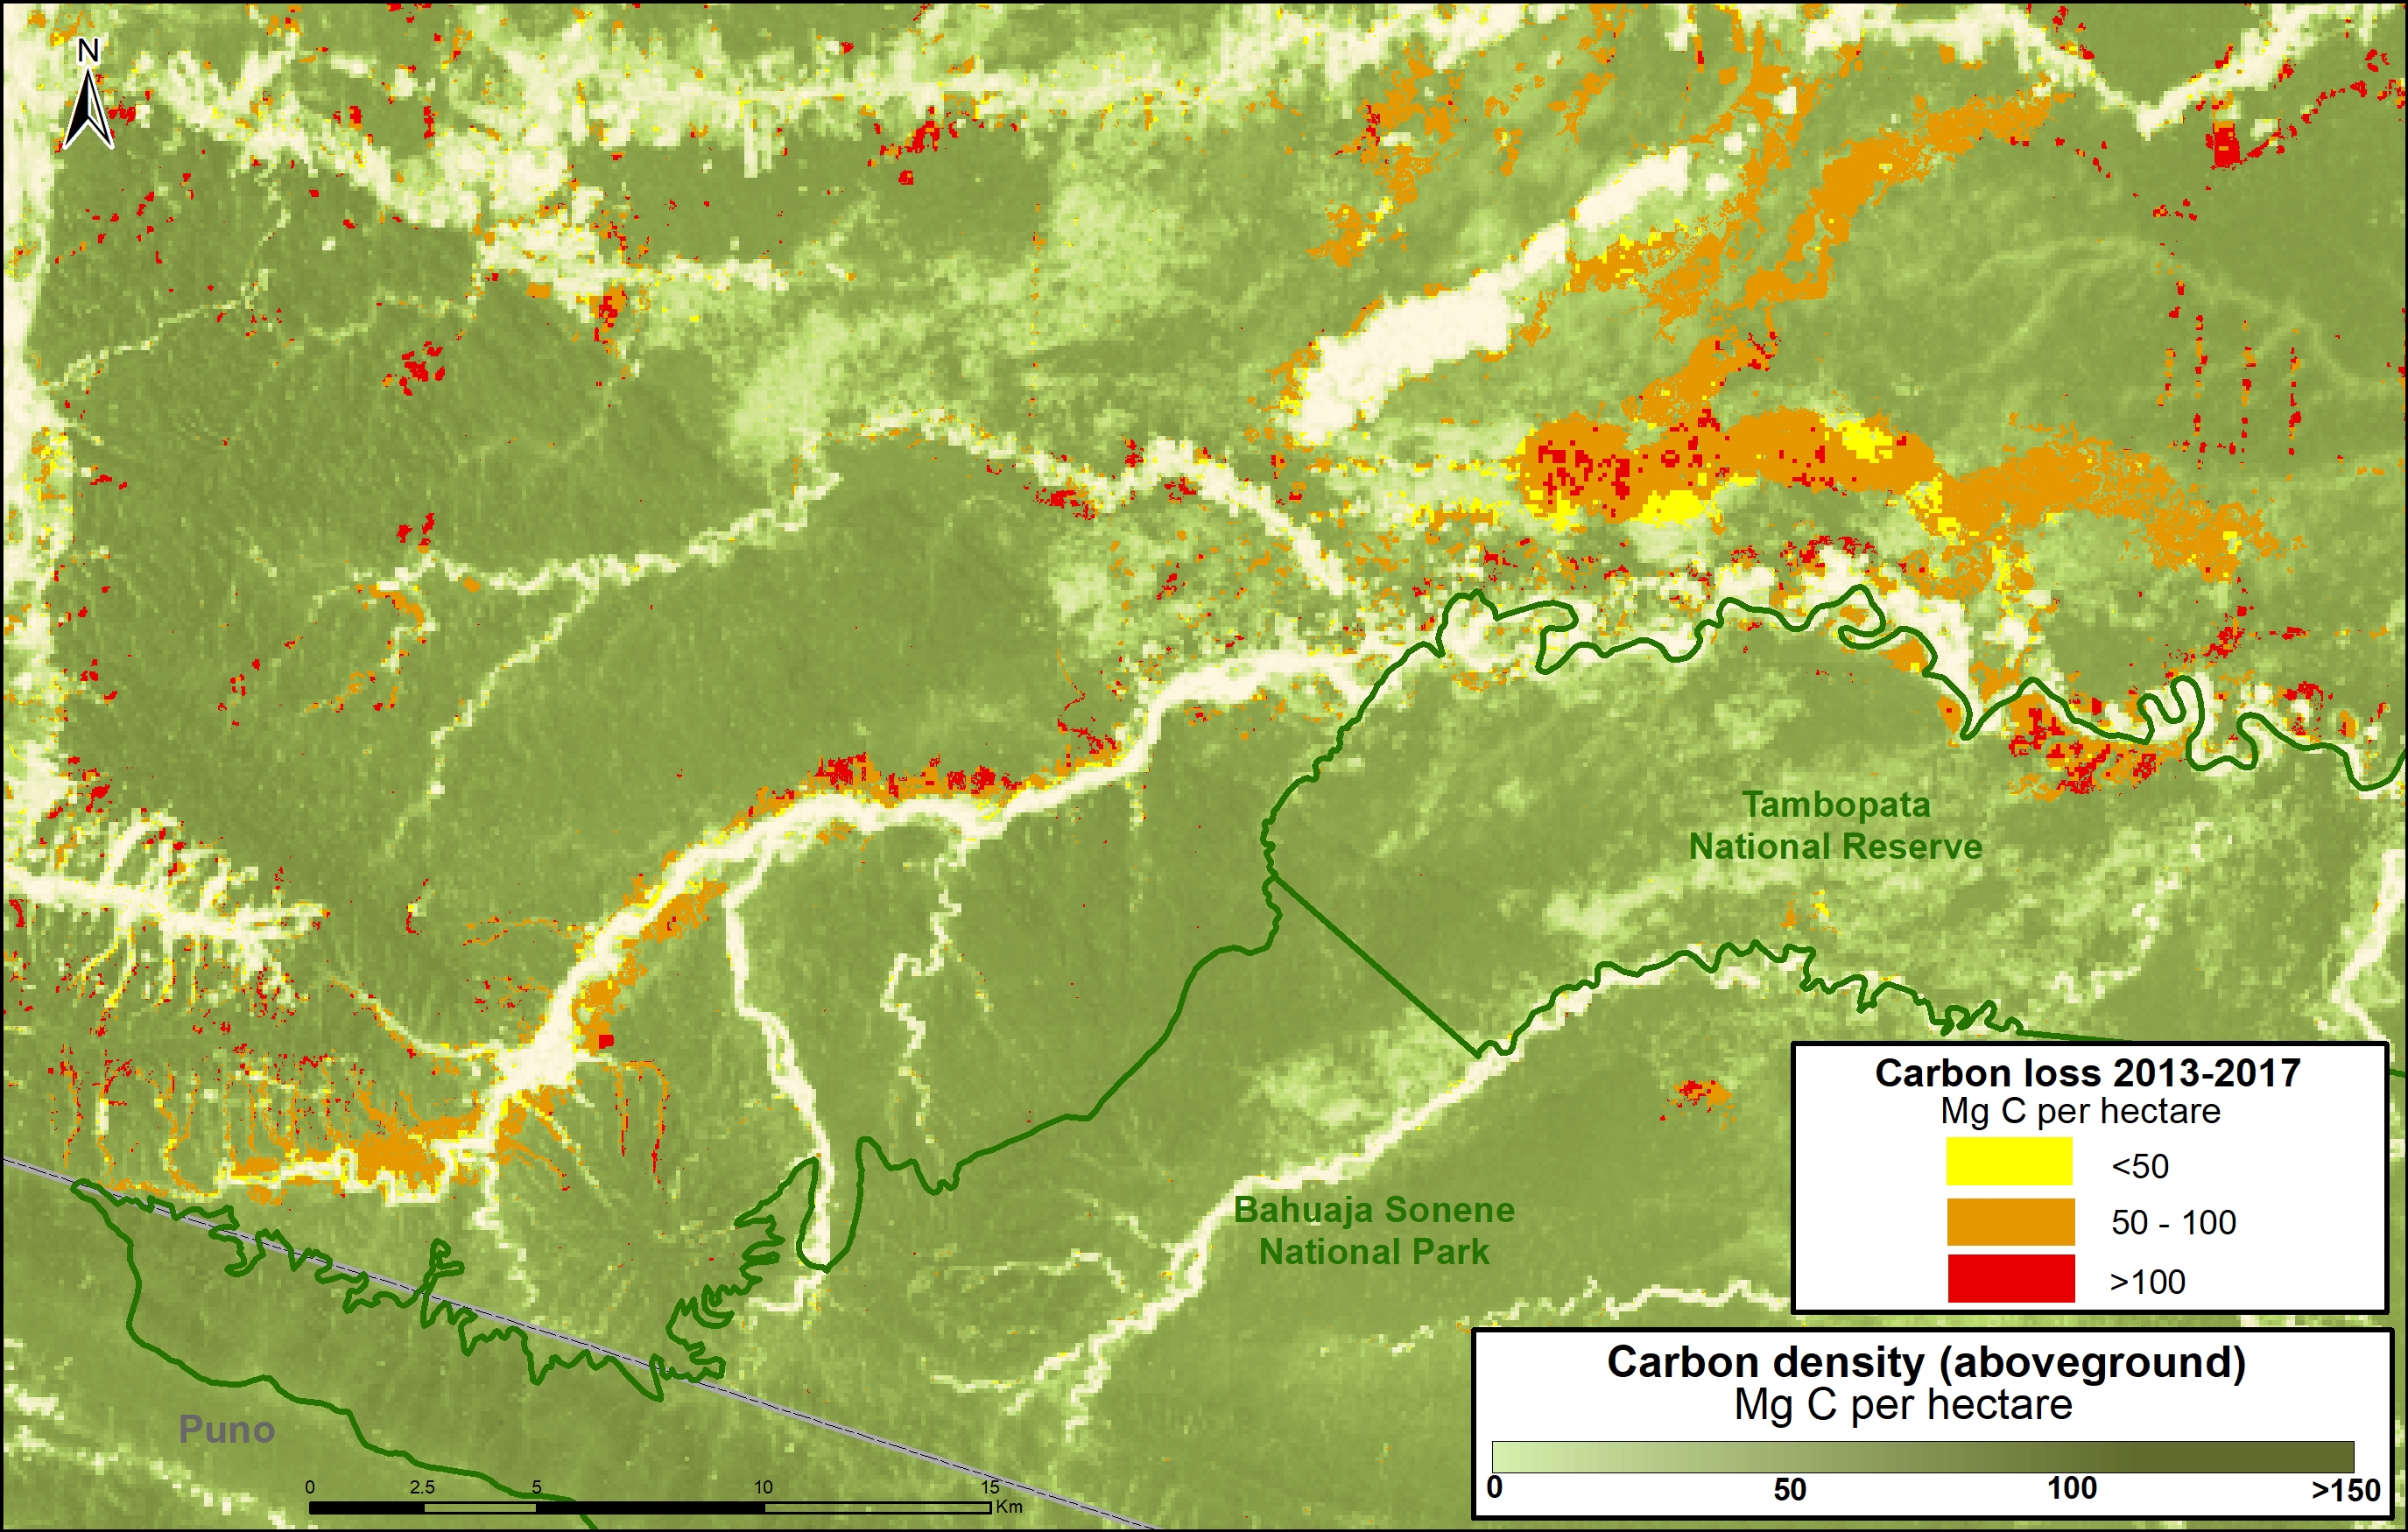
The following Image C shows how two important natural protected areas, Tambopata National Reserve and Bahuaja Sonene National Park, are helping conserve carbon stocks in an area with intense illegal gold mining activity.

D. Sierra del Divisor National Park, National Reserve Matsés

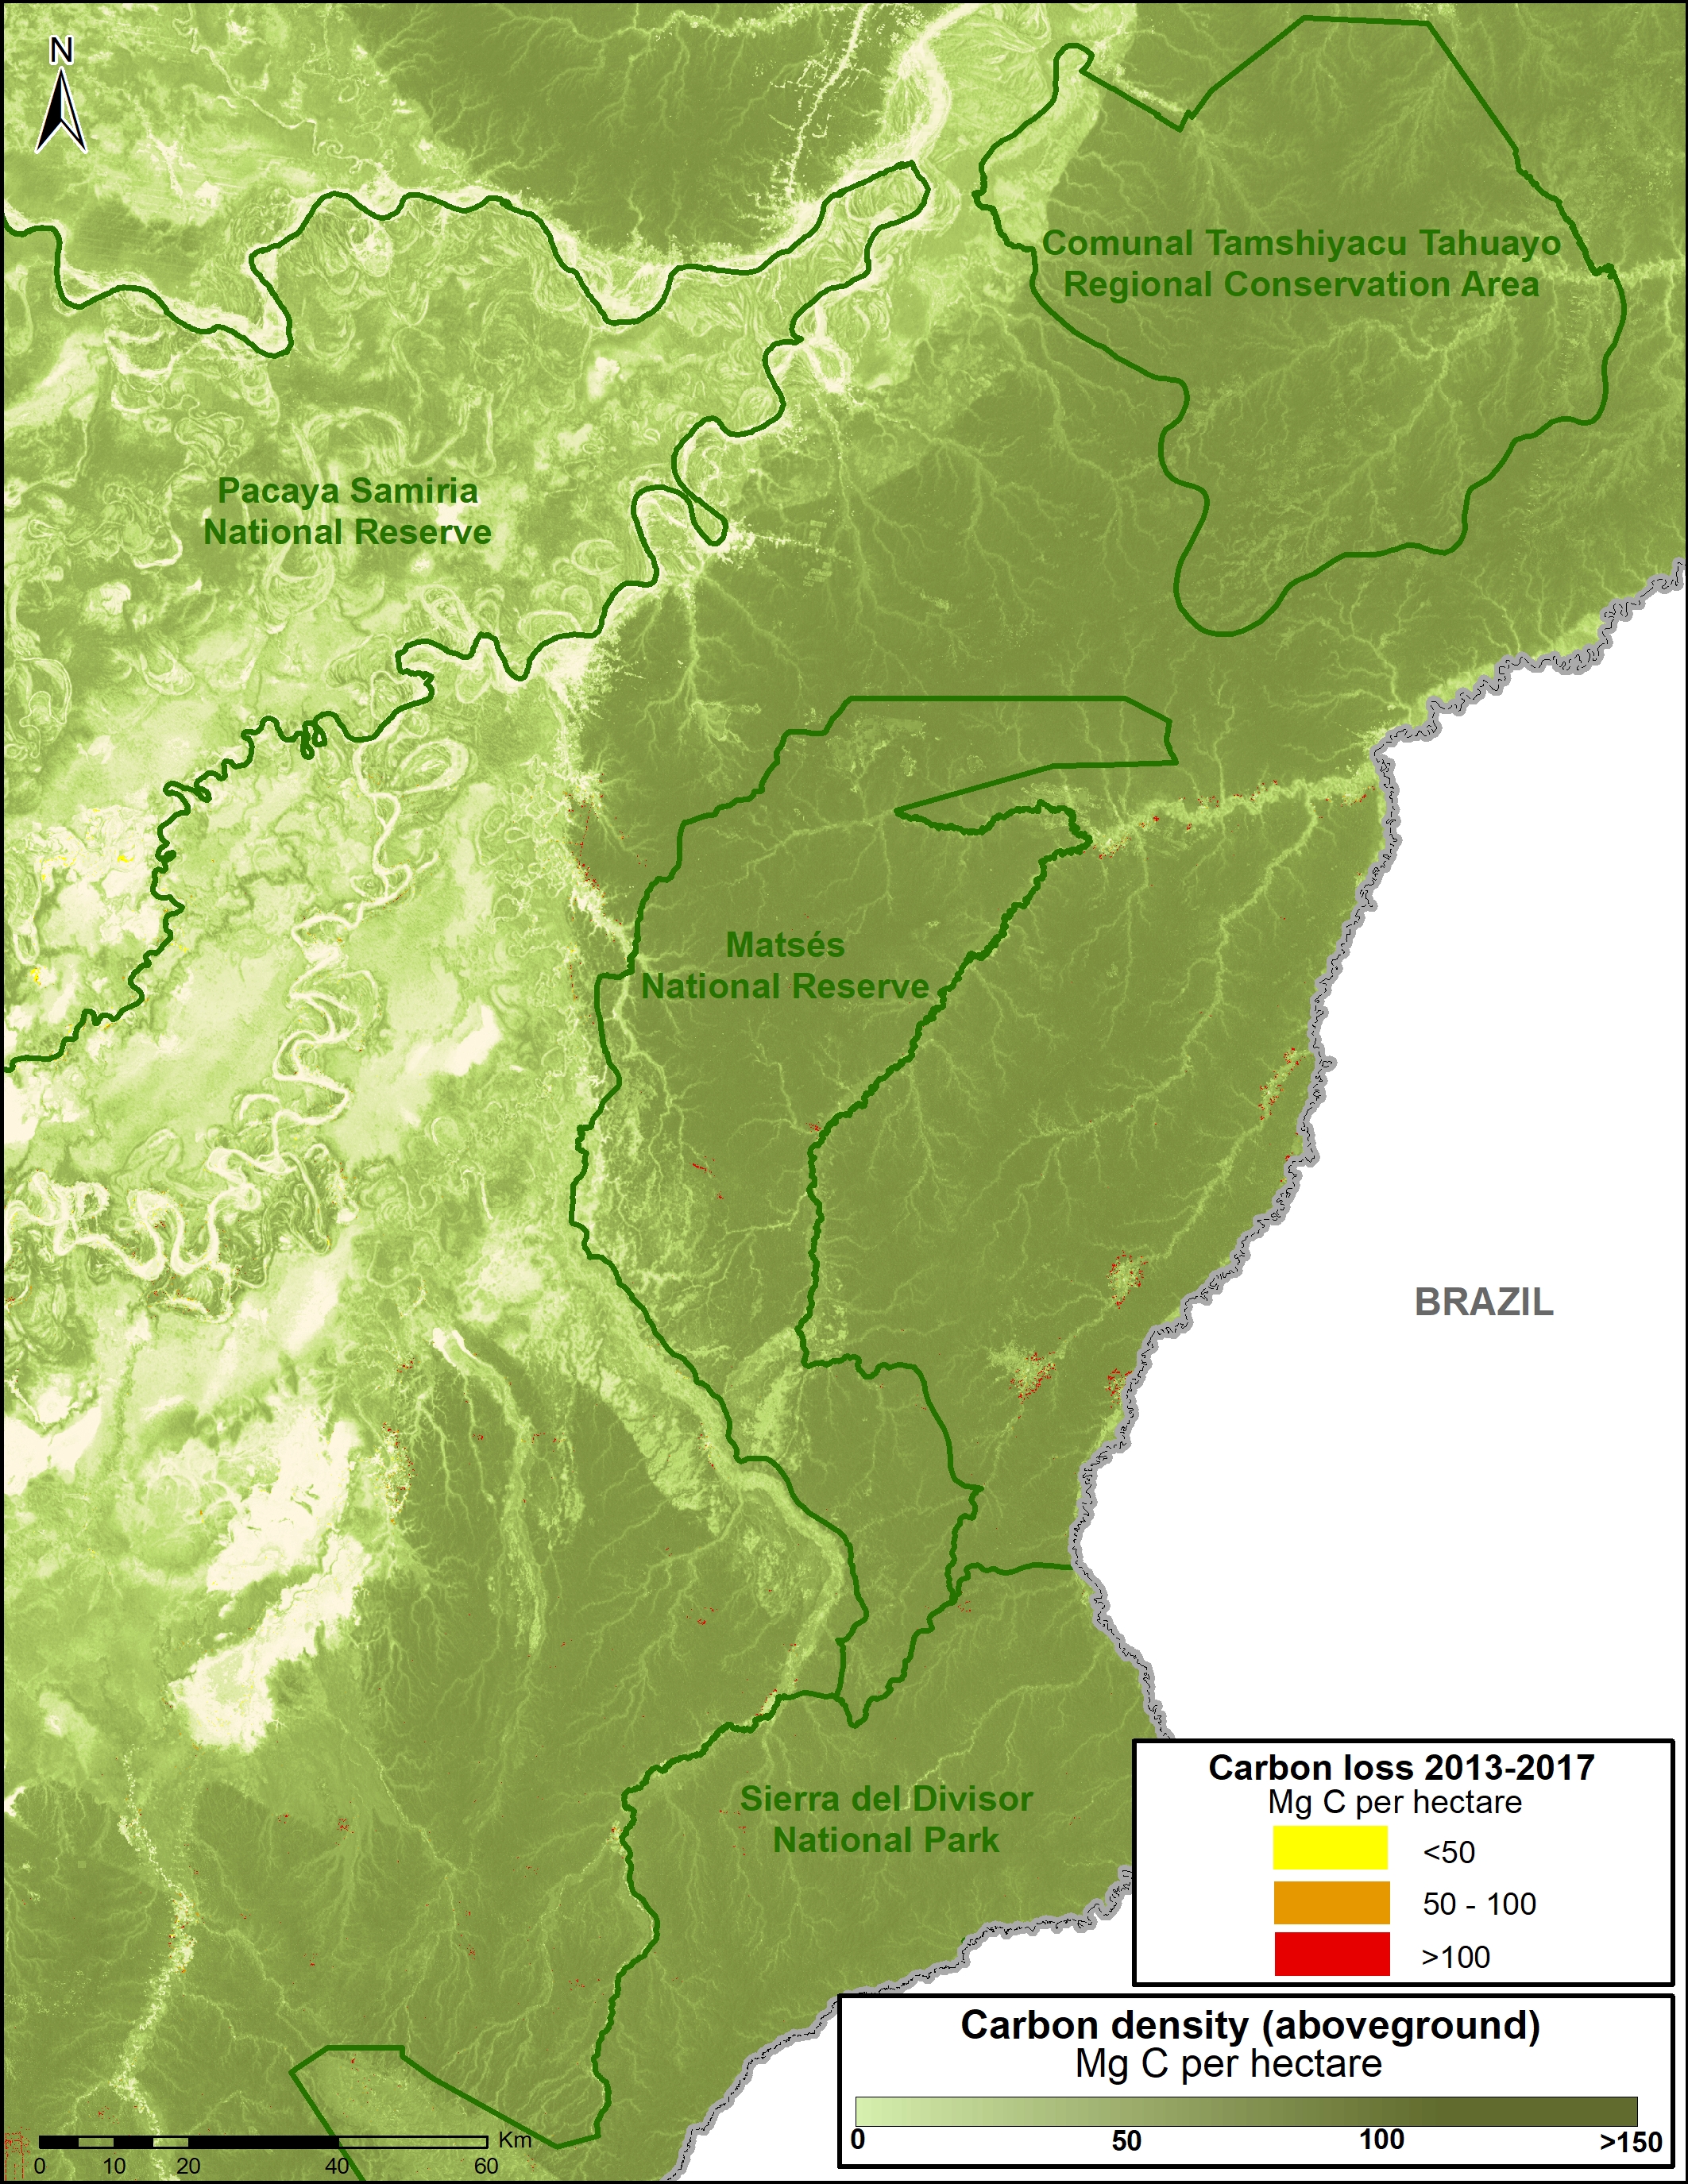
Image 83d. Data: Asner et al 2014, MINAM/PNCB, SERNANP

The following Image D shows how four protected areas, including the new Sierra del Divisor National Park, and adjacent National Reserve Matsés are effectively safeguarding 270 million metric tons of carbon in the eastern Peruvian Amazon.

This area is home to some of the highest carbon densities in the country.

E. Murunahua Indigenous Reserve

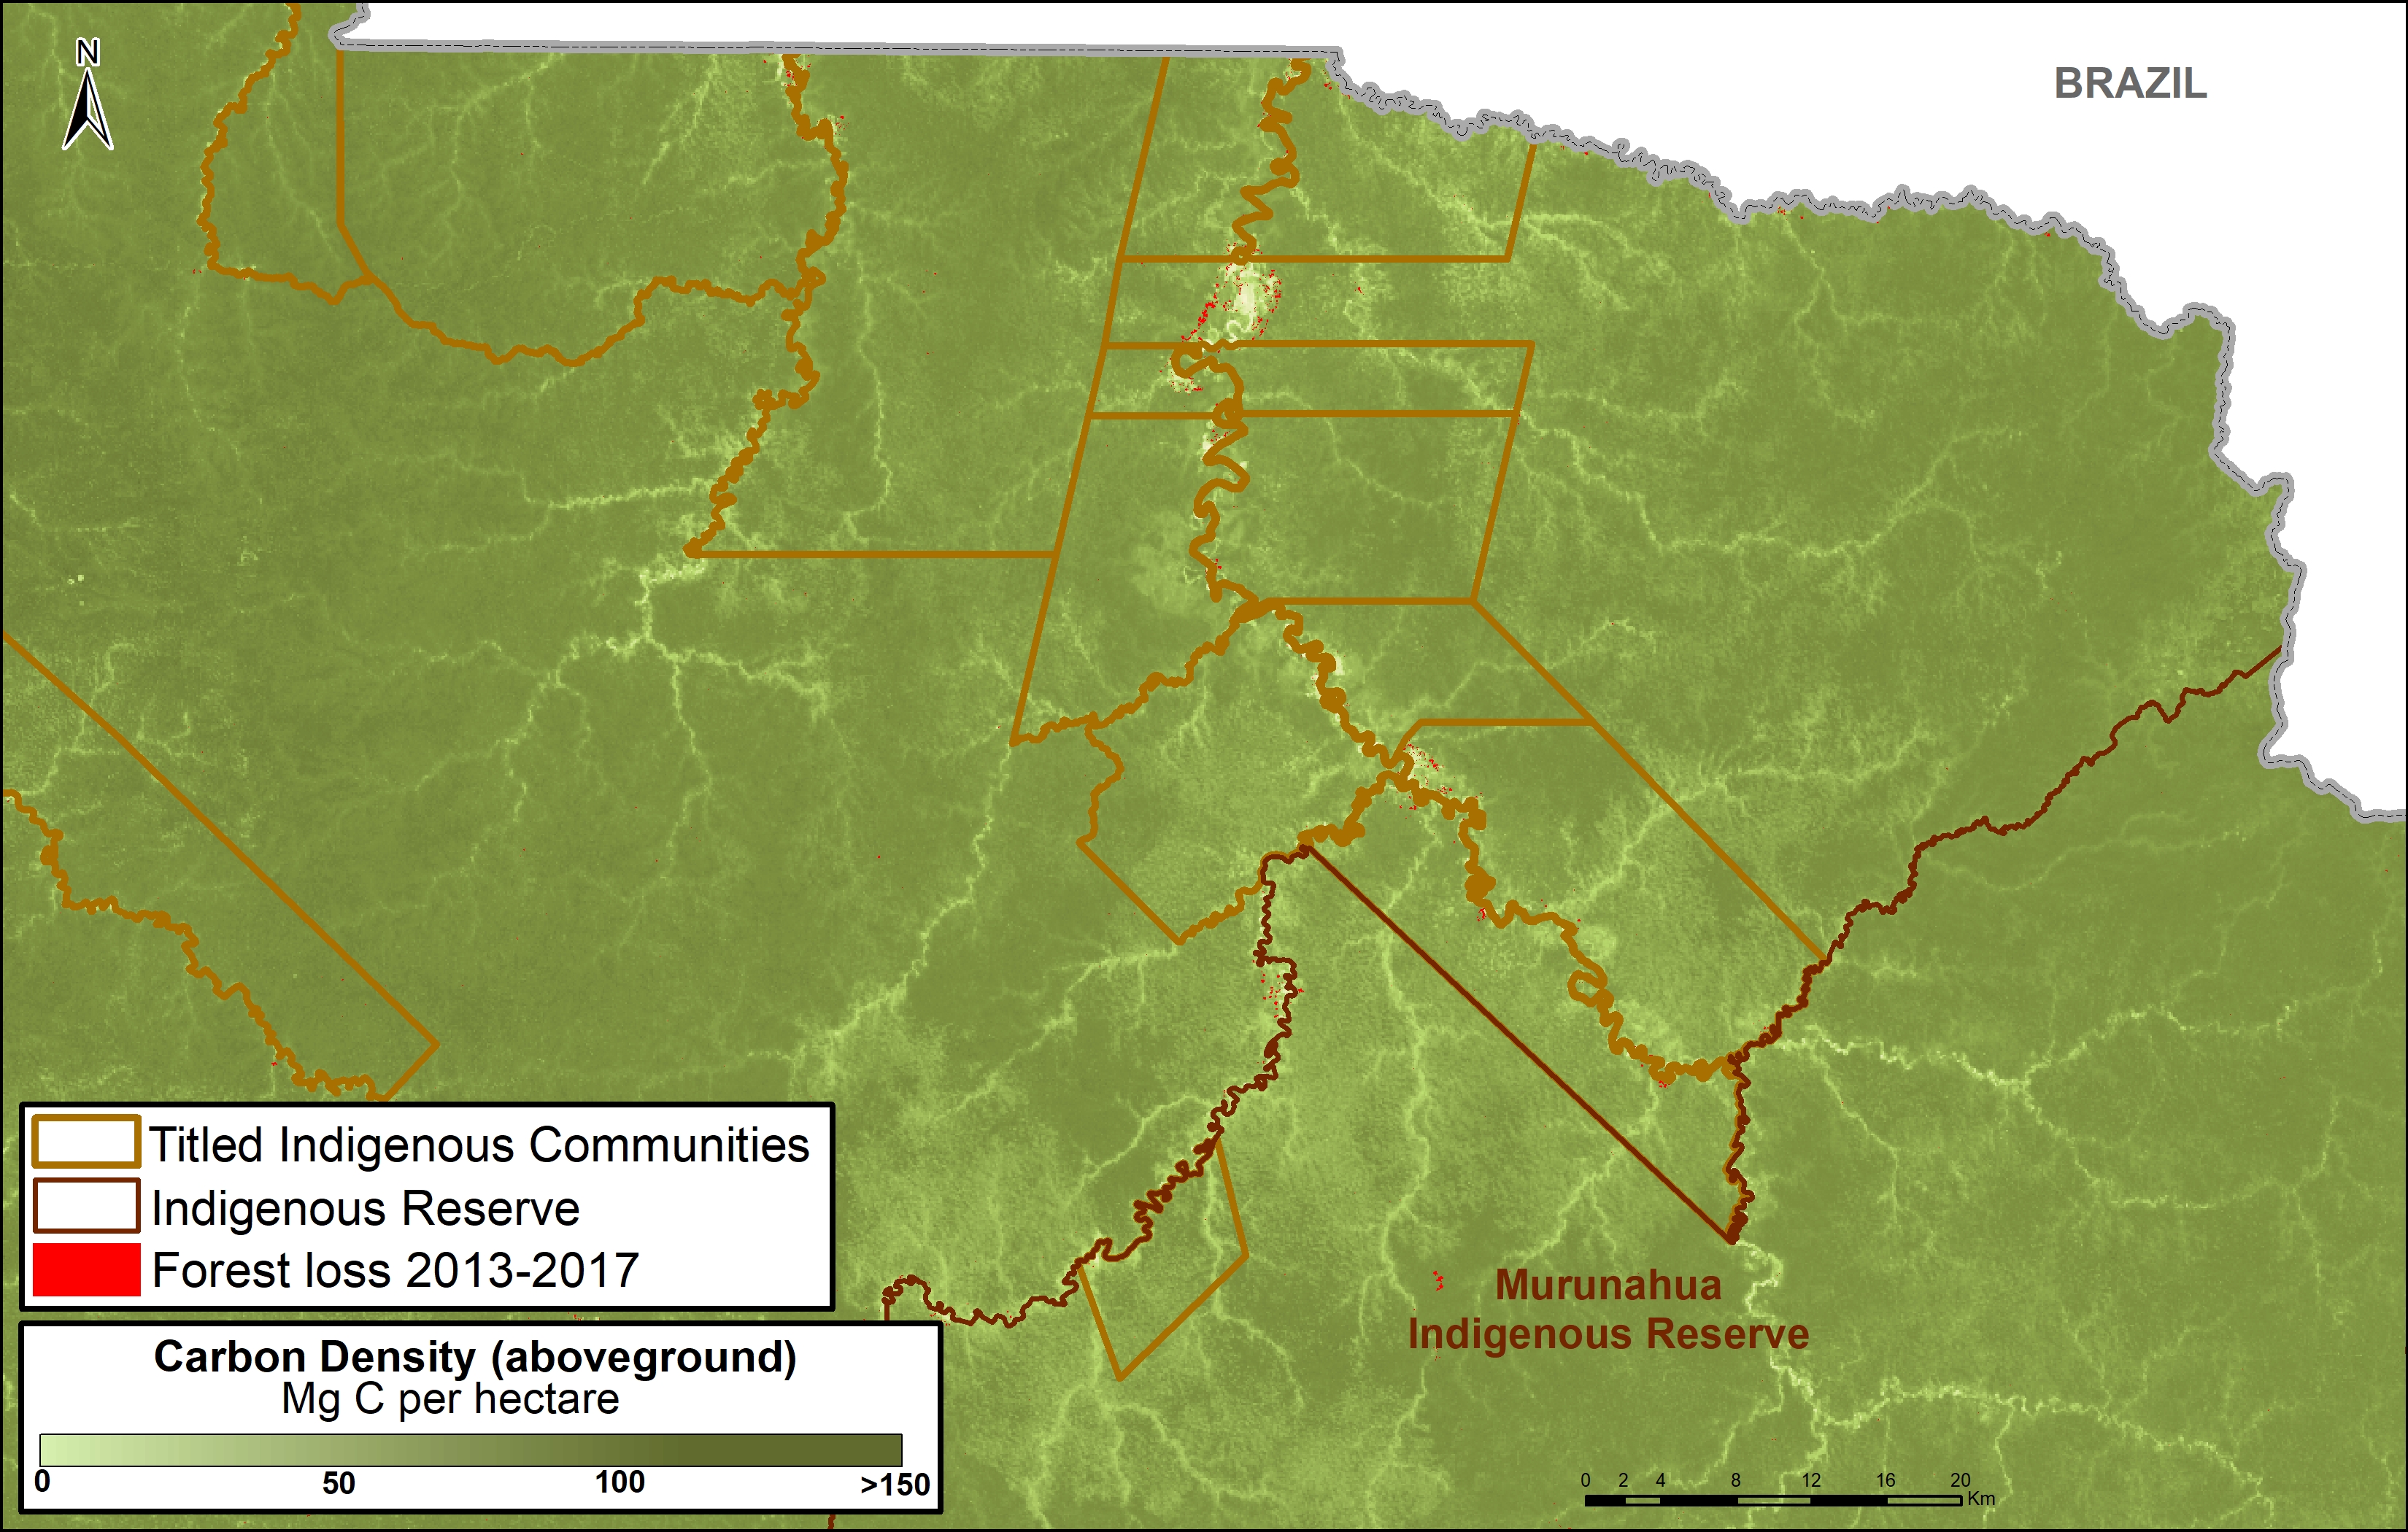
The following Image E shows the carbon protected in the Murunahua Indigenous Reserve (for indigenous peoples in voluntary isolation) and the surrounding titled native communities.

Imagen 83e. Datos: Asner et al 2014, MINAM/PNCB, SERNANP

References

1  UNFCCC. Emissions Summary for Peru. http://di.unfccc.int/ghg_profile_non_annex1

2  No incluye las emisiones por la degradación de bosques

Asner GP et al (2014). The High-Resolution Carbon Geography of Perú. Carnegie Institution for Science. ftp://dge.stanford.edu/pub/asner/carbonreport/CarnegiePeruCarbonReport-English.pdf

Sistema de Áreas Naturales Protegidas del Perú, que incluye áreas de administración nacional, regional, y privado. Datos de las tierras indígenas son de Instituto de Bien Común. Datos de pérdida forestal son de la Programa Nacional de Conservación de Bosques para la Mitigación del Cambio Climático (MINAM/PNCB).

UNFCCC. Emissions Summary for United States. http://di.unfccc.int/ghg_profile_annex1

Citation

Finer M, Mamani N (2017). Climate Change Defense: Amazon Protected Areas and Indigenous Lands. MAAP: 83.

Acknowledgments

This report was made possible by the generous support of the Norwegian Agency for Development Cooperation (NORAD).

MAAP #82: Oil-related Deforestation in Yasuni National Park, Ecuadorian Amazon

MAAP #82: Oil-related Deforestation in Yasuni National Park, Ecuadorian Amazon
https://www.maapprogram.org/yasuni_eng/ 

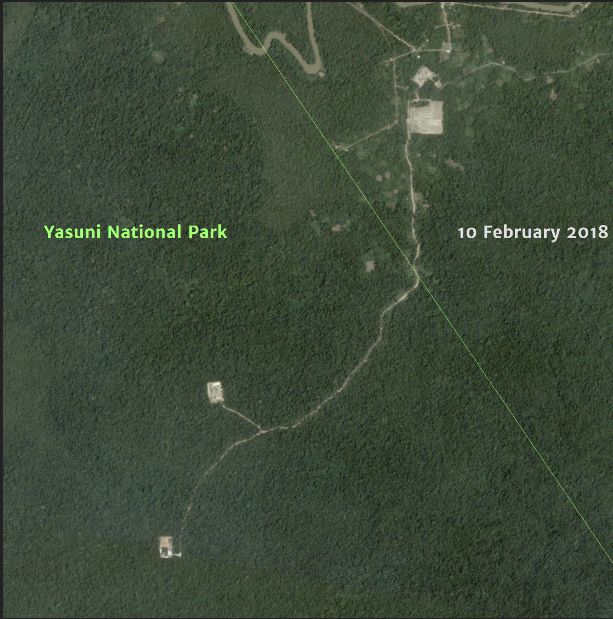
Yasuni National Park, located in the heart of the Ecuadorian Amazon, is arguably the most biodiverse area in the world. It is also the ancestral territory of the Waorani, and their relatives in voluntary isolation.

However, underneath the park are large oil fields, setting up the constant conflict looming over Yasuni. In fact, in a recent referendum, Ecuadorian voters approved limiting the oil extraction area within Yasuni National Park to 300 hectares (740 acres).

Here, we analyze high-resolution satellite imagery to estimate both direct and indirect oil-related deforestation within Yasuní National Park.

For direct impact, we document the deforestation of 169 hectares (418 acres) within the park for oil-related infrastructure.
For indirect impact, we document the deforestation of 248 hectares (613 acres) due to colonization along an oil access road.
The total direct and indirect deforestation due to oil extraction is 417 hectares (1,030 acres).

Thus, one could argue that the oil-related deforestation has already exceeded the 300 hectares (740 acres) approved by the voters.

We illustrate these results in a Story Map.

MAAP #82: Oil-related Deforestation in Yasuni National Park, Ecuadorian Amazon
https://www.maapprogram.org/yasuni_eng/ 

MAAP #81: Carbon loss from deforestation in the Peruvian Amazon

Base Map. Data: MINAM/PNCB, Asner et al 2014

When tropical forests are cleared, the enormous amount of carbon stored in the trees is released to the atmosphere, making it a major source of global greenhouse gas emissions (CO2) that drive climate change.

In fact, a recent study revealed that deforestation and degradation are turning tropical forests into a new net carbon source for the atmosphere, exacerbating climate change.1

The Amazon is the world’s largest tropical forest, and Peru is a key piece of that. Researchers (led by Greg Asner at the Carnegie Institution for Science) recently published the first high-resolution estimate of aboveground carbon in the Peruvian Amazon, documenting 6.83 billion metric tons.2

Here, we analyze this same dataset to estimate the total carbon emissions from deforestation in the Peruvian Amazon between 2013 and 2017. We estimate the loss of 59 million metric tons of carbon during these last five years, the equivalent of around 4% of annual United States fossil fuel emissions.3

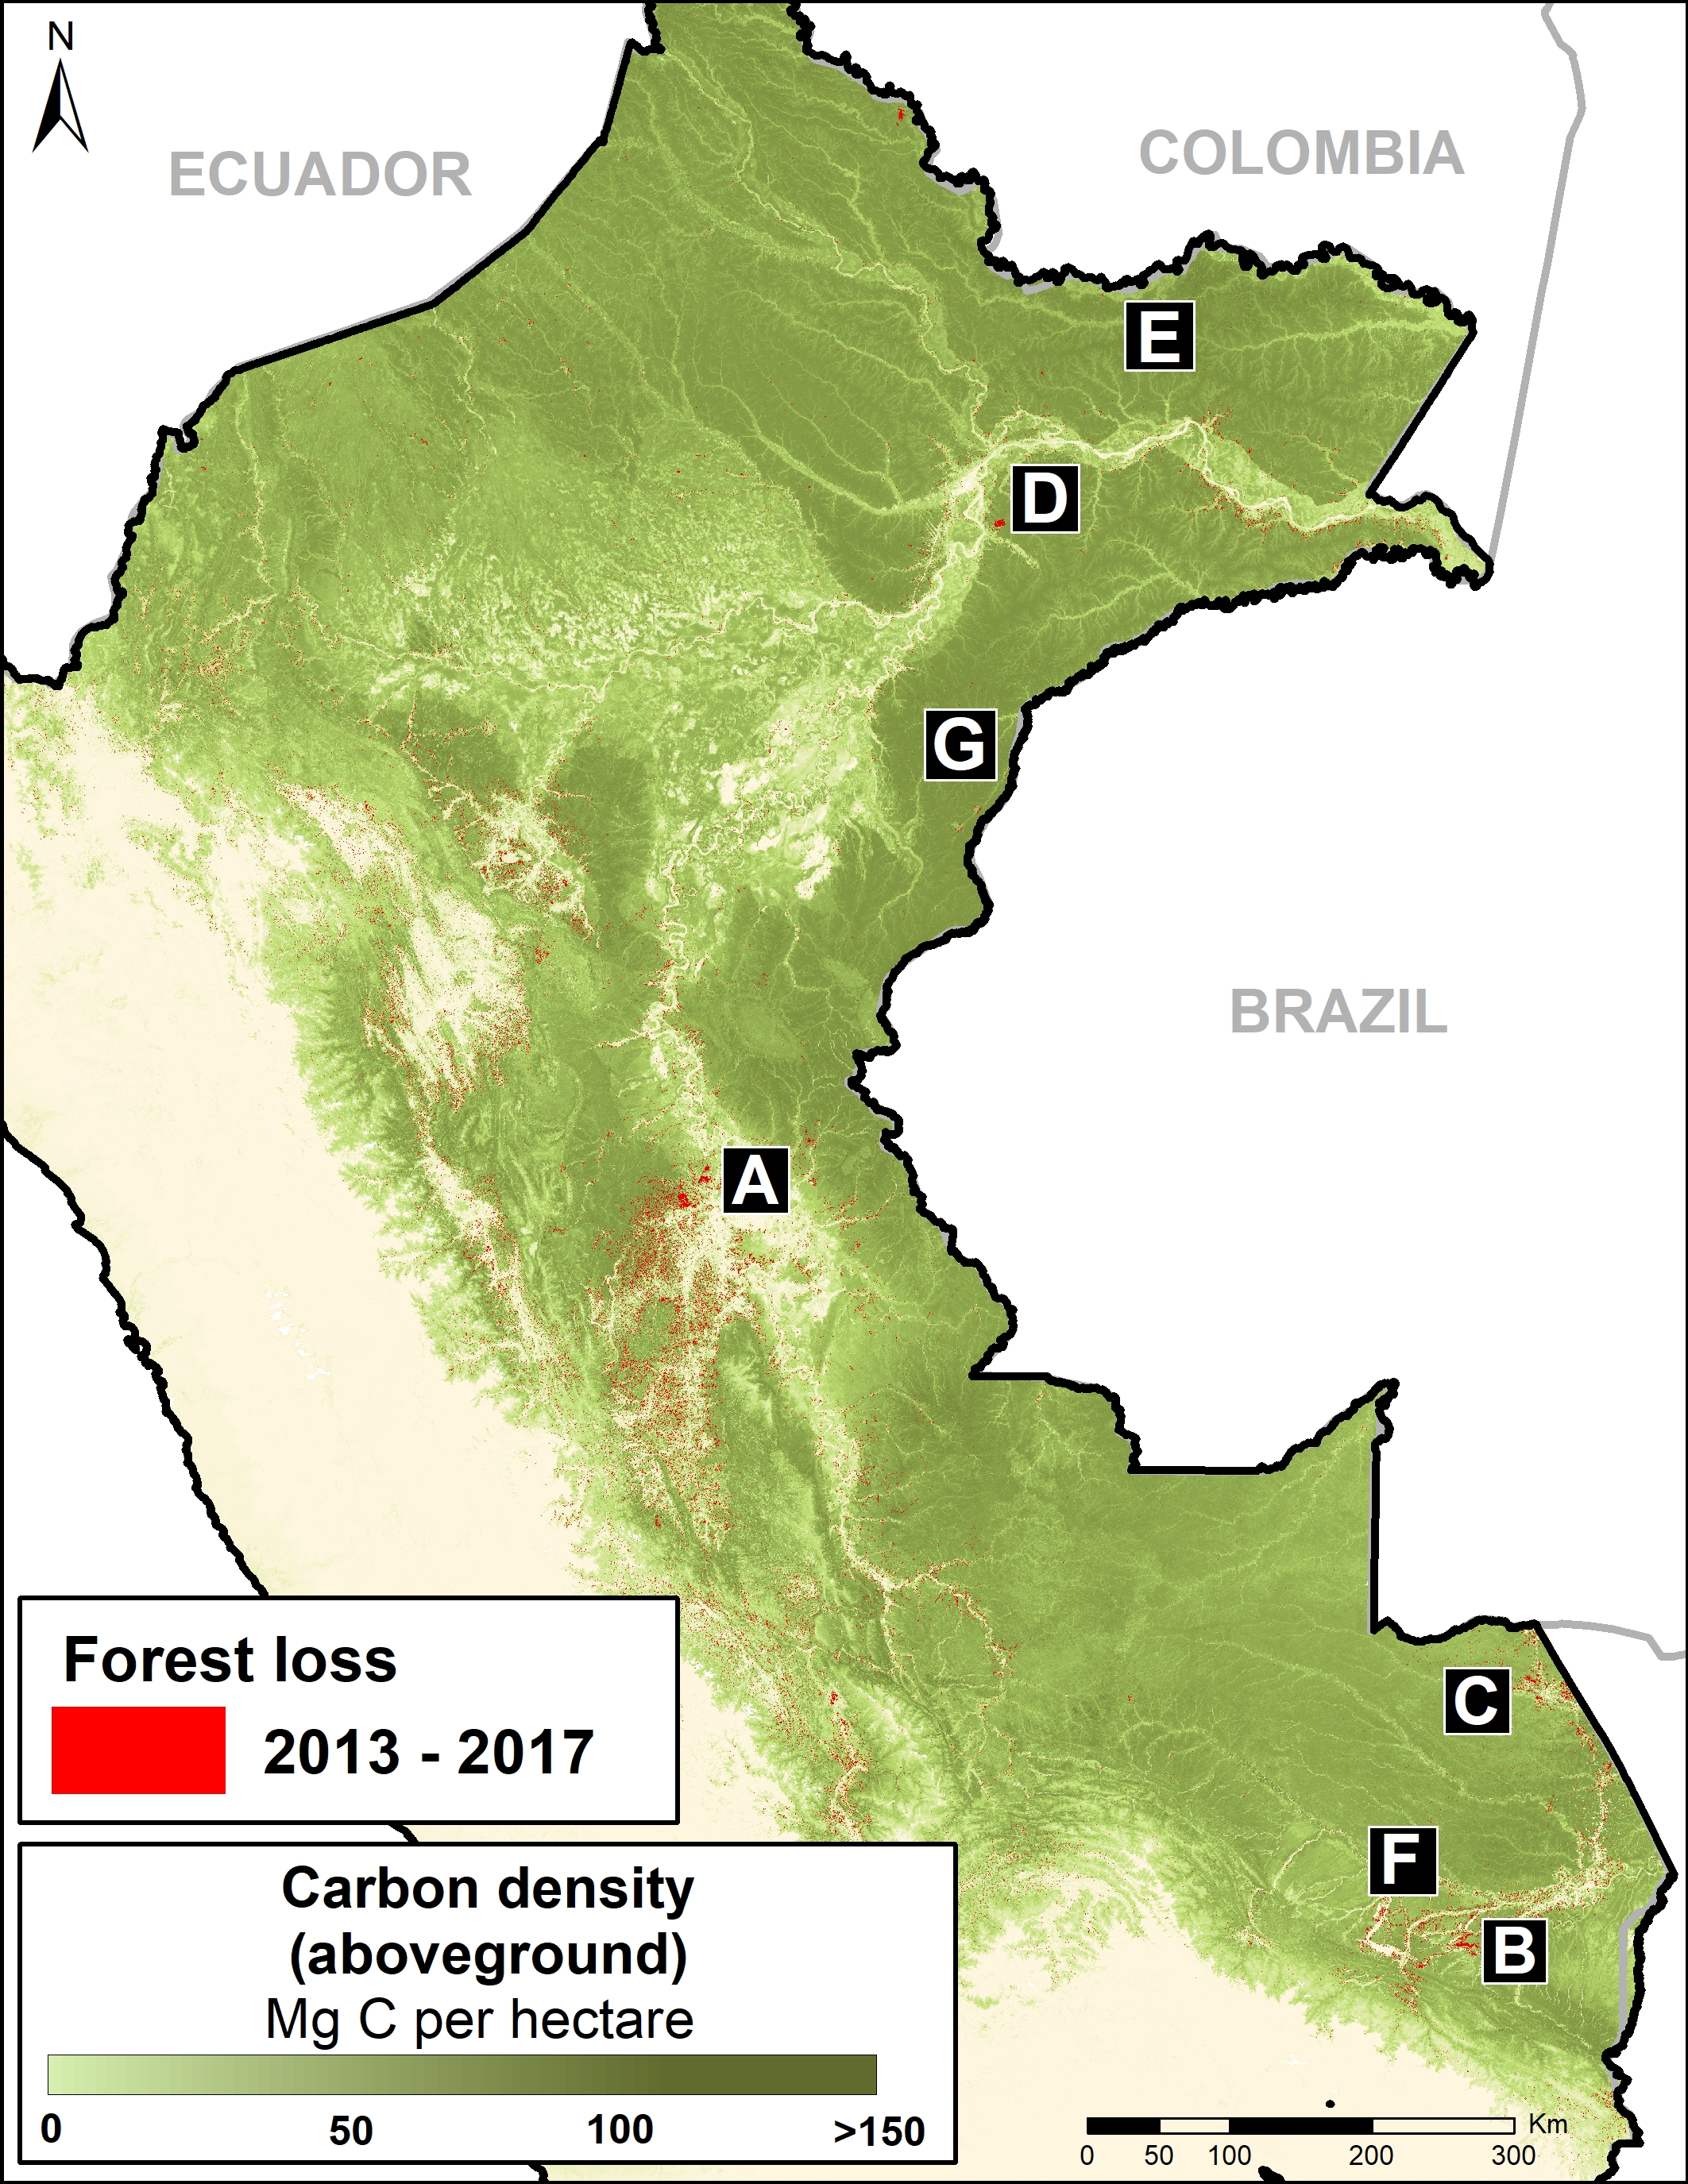
We present a series of zoom images to show how carbon loss happened in several key areas impacted by the major deforestation drivers: gold mining, large-scale oil palm and cacao plantations, and smaller-scale agriculture. The labels A-G correspond to the zooms below.

We also show how protected areas are protecting hundreds of millions of metric tons of carbon in some of the most important areas in the country.

On the positive side, having this detailed information may provide added incentives to slow deforestation and degradation as part of critical climate change strategies.


Major Findings

Data: Asner et al 2014

The base map (see above) shows, in shades of green, carbon densities across Peru. It also shows, in red, the forest loss layer from 2013 to 2017.

We calculated the estimated amount of carbon emissions from forest loss during these five years: 59.029 teragrams, or 59 million metric tons.

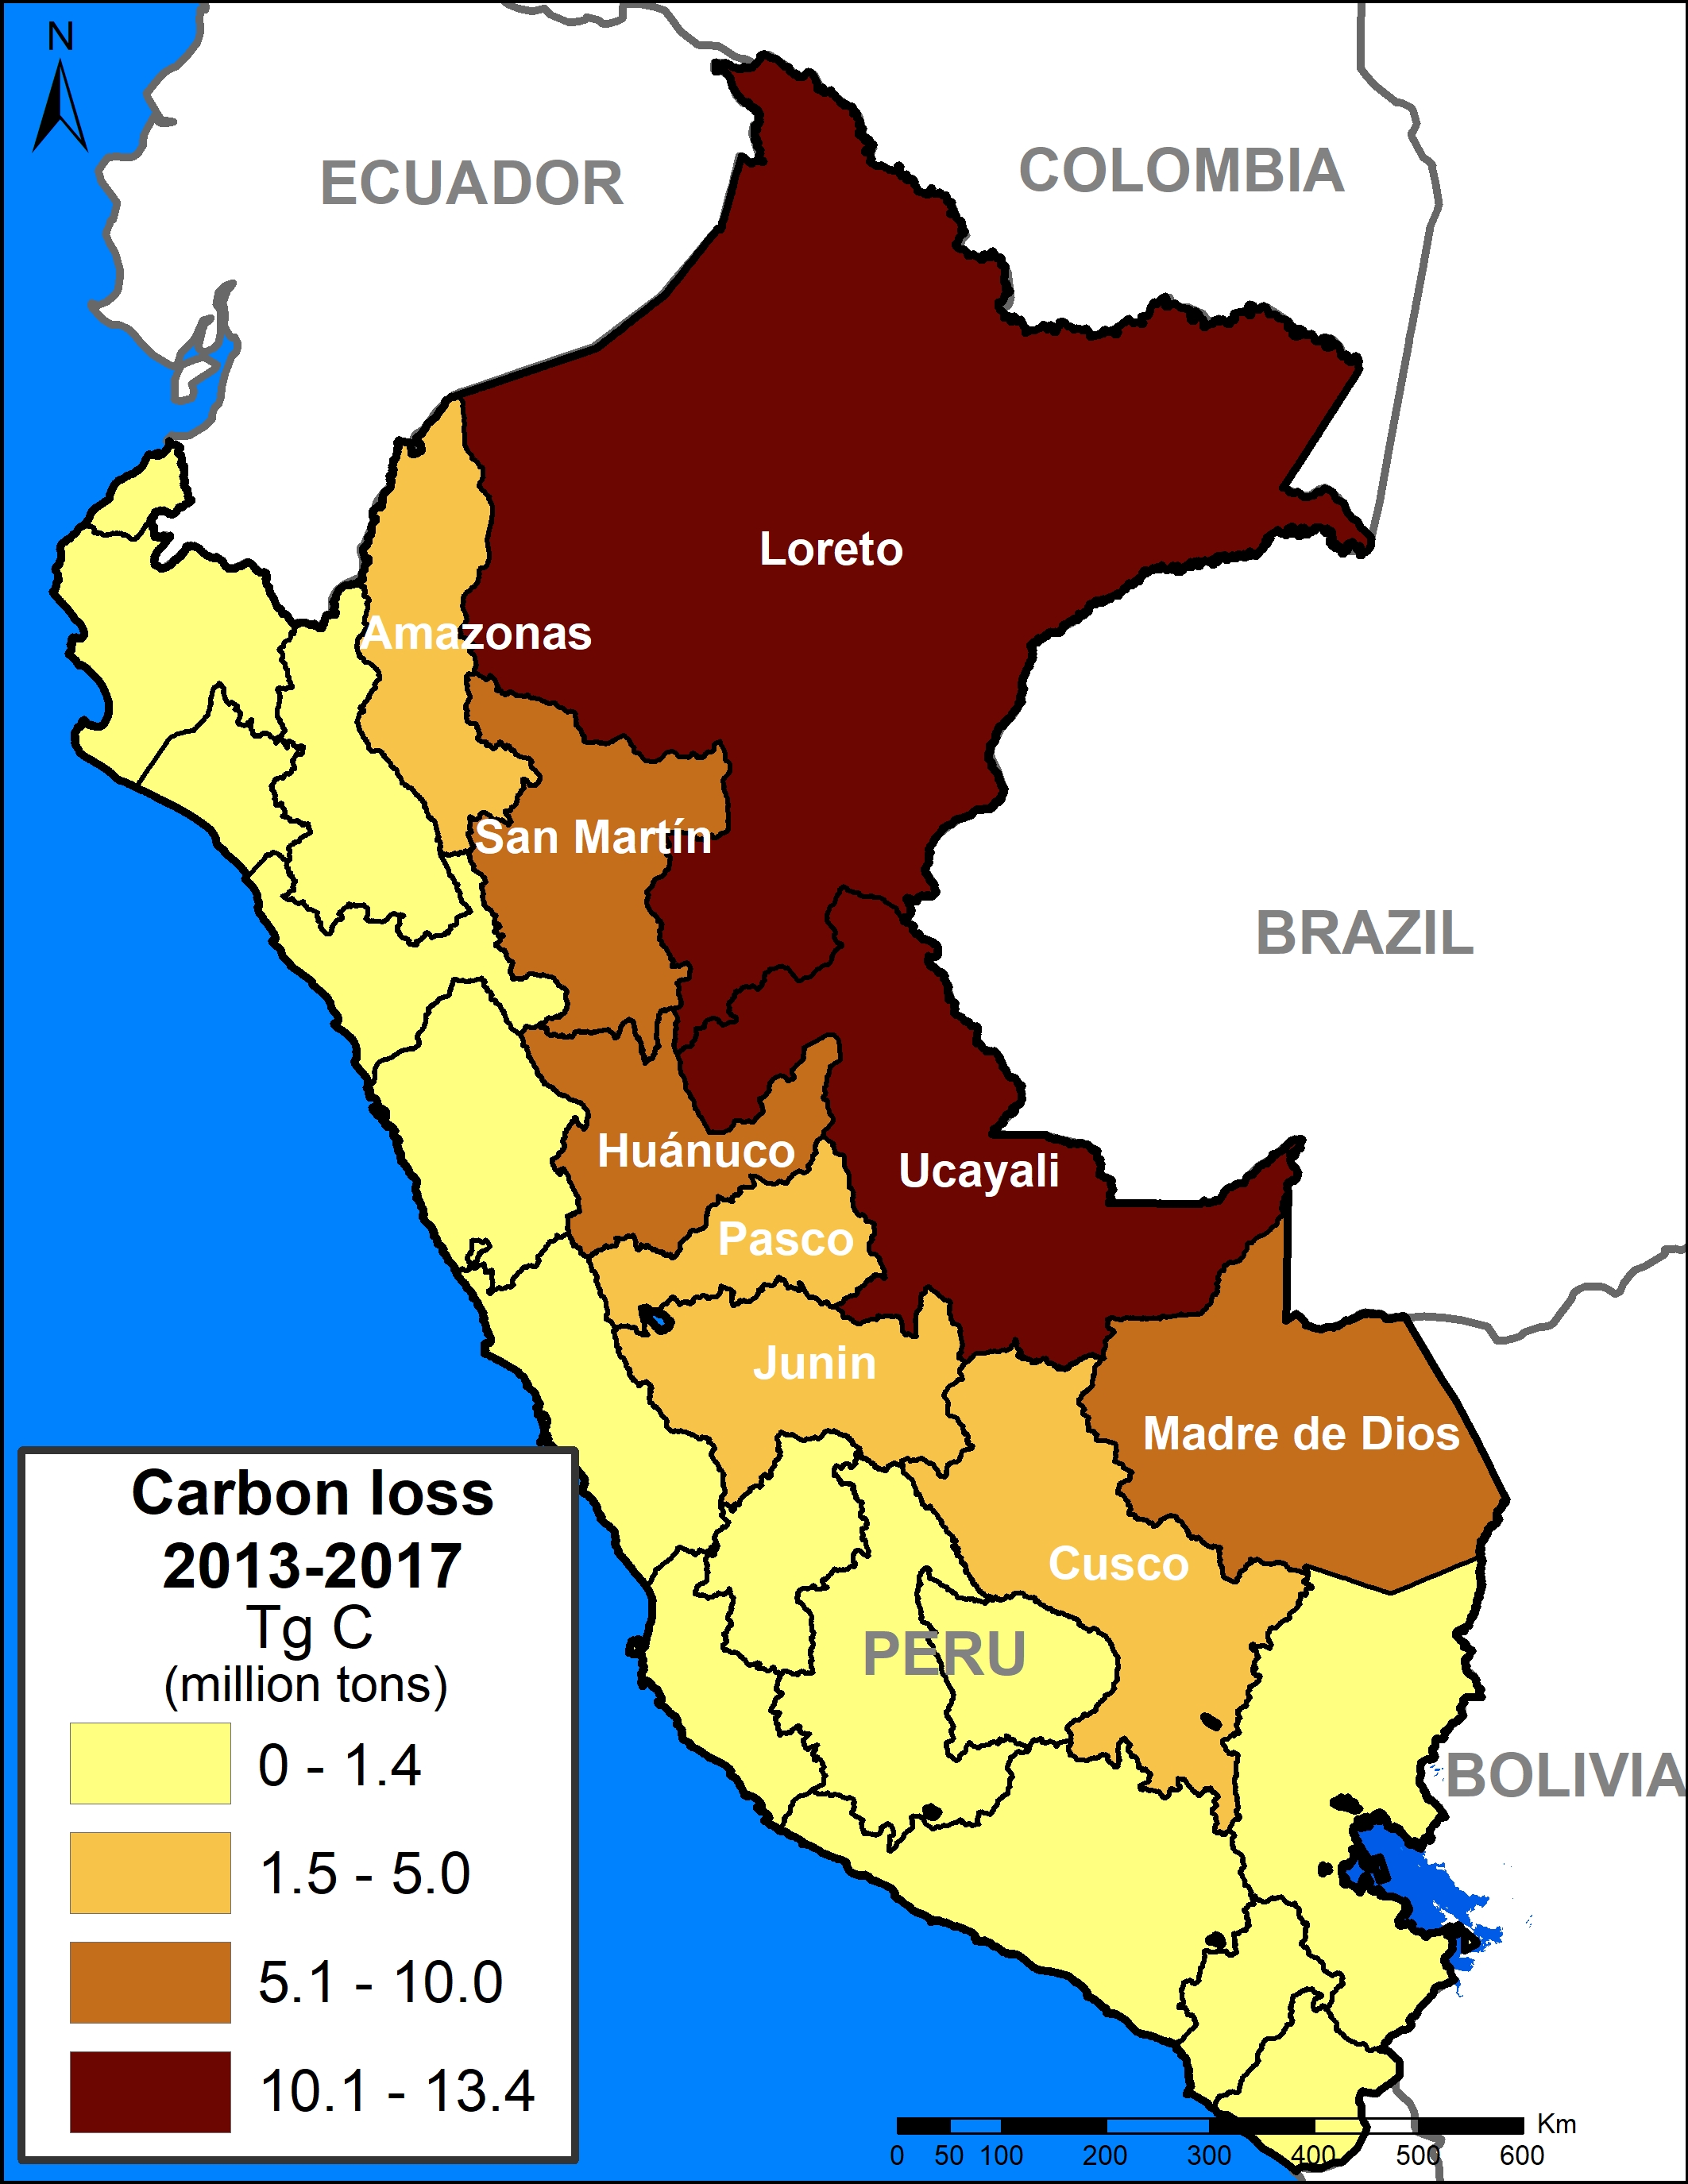
The regions with the most carbon loss are 1) Loreto (13.4 million metric tons), 2) Ucayali (13.2 million), 3) Huánuco (7.3 million), 4) Madre de Dios (7 million), and 5) San Martin (6.9 million).

These values include some natural forest loss. Overall, however, they should be considered underestimates because they do not include forest degradation (for example, selective logging).

A recent study revealed that degradation may account for 70% of emissions, thus total carbon emissions from forests in the Peruvian Amazon may be closer to 200 million metric tons.

Next, we show a series of zoom images to show how carbon loss happened in several key areas. We also show how protected areas and conservation concessions are protecting the most important carbon reserves.


Zoom A: Central Peruvian Amazon

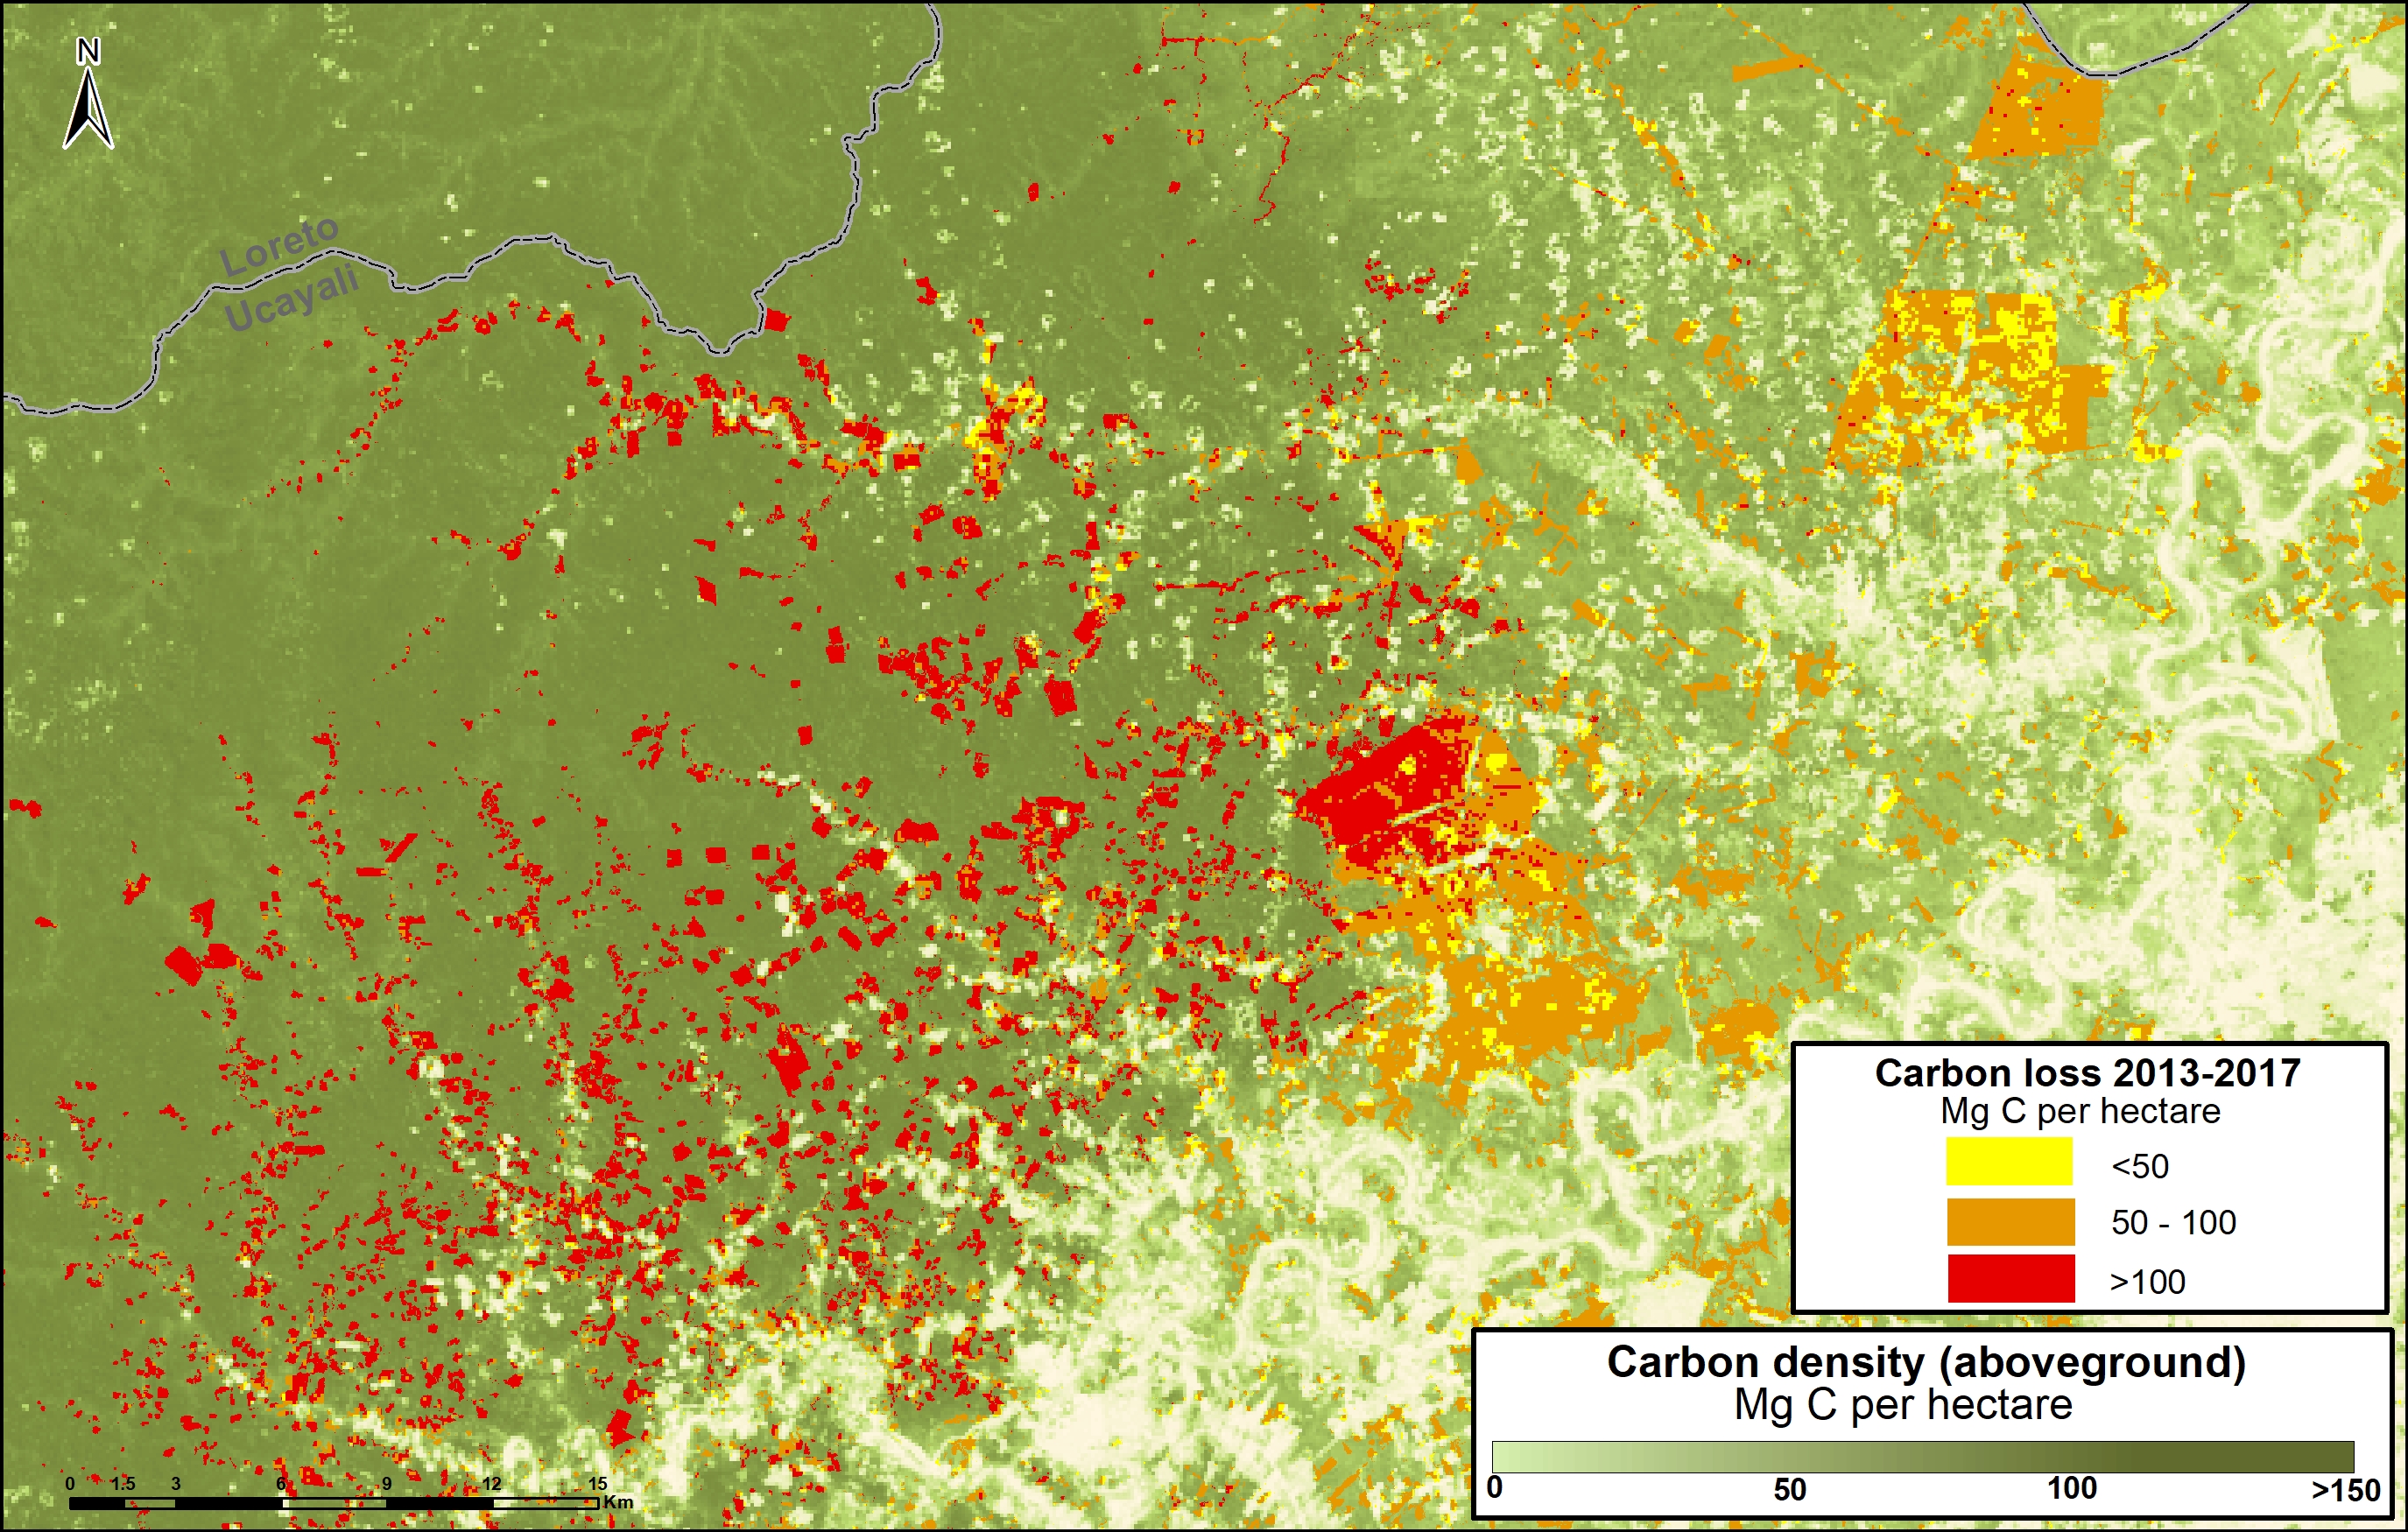
Image A shows the loss of 2.8 million metric tons of carbon in a section of the central Peruvian Amazon (Ucayali region). On the east side of image, note the loss due to two large-scale oil palm plantations (649,000 metric tons); on the west side, note small-scale agriculture penetrating deeper into high carbon density forest.

Image A. Central Peruvian Amazon. Data: Asner et al 2014, MINAM/PNCB

Zoom B: Southern Peruvian Amazon (gold mining) 

Image B shows the loss of 756 thousand metric tons of carbon due to gold mining in the southern Peruvian Amazon (Madre de Dios region). On the east side of image is the sector known as La Pampa; west side is Upper Malinowski.

Image B. Gold mining. Data: Asner et al 2014, MINAM/PNCB

Zoom C: Southern Peruvian Amazon (agriculture)

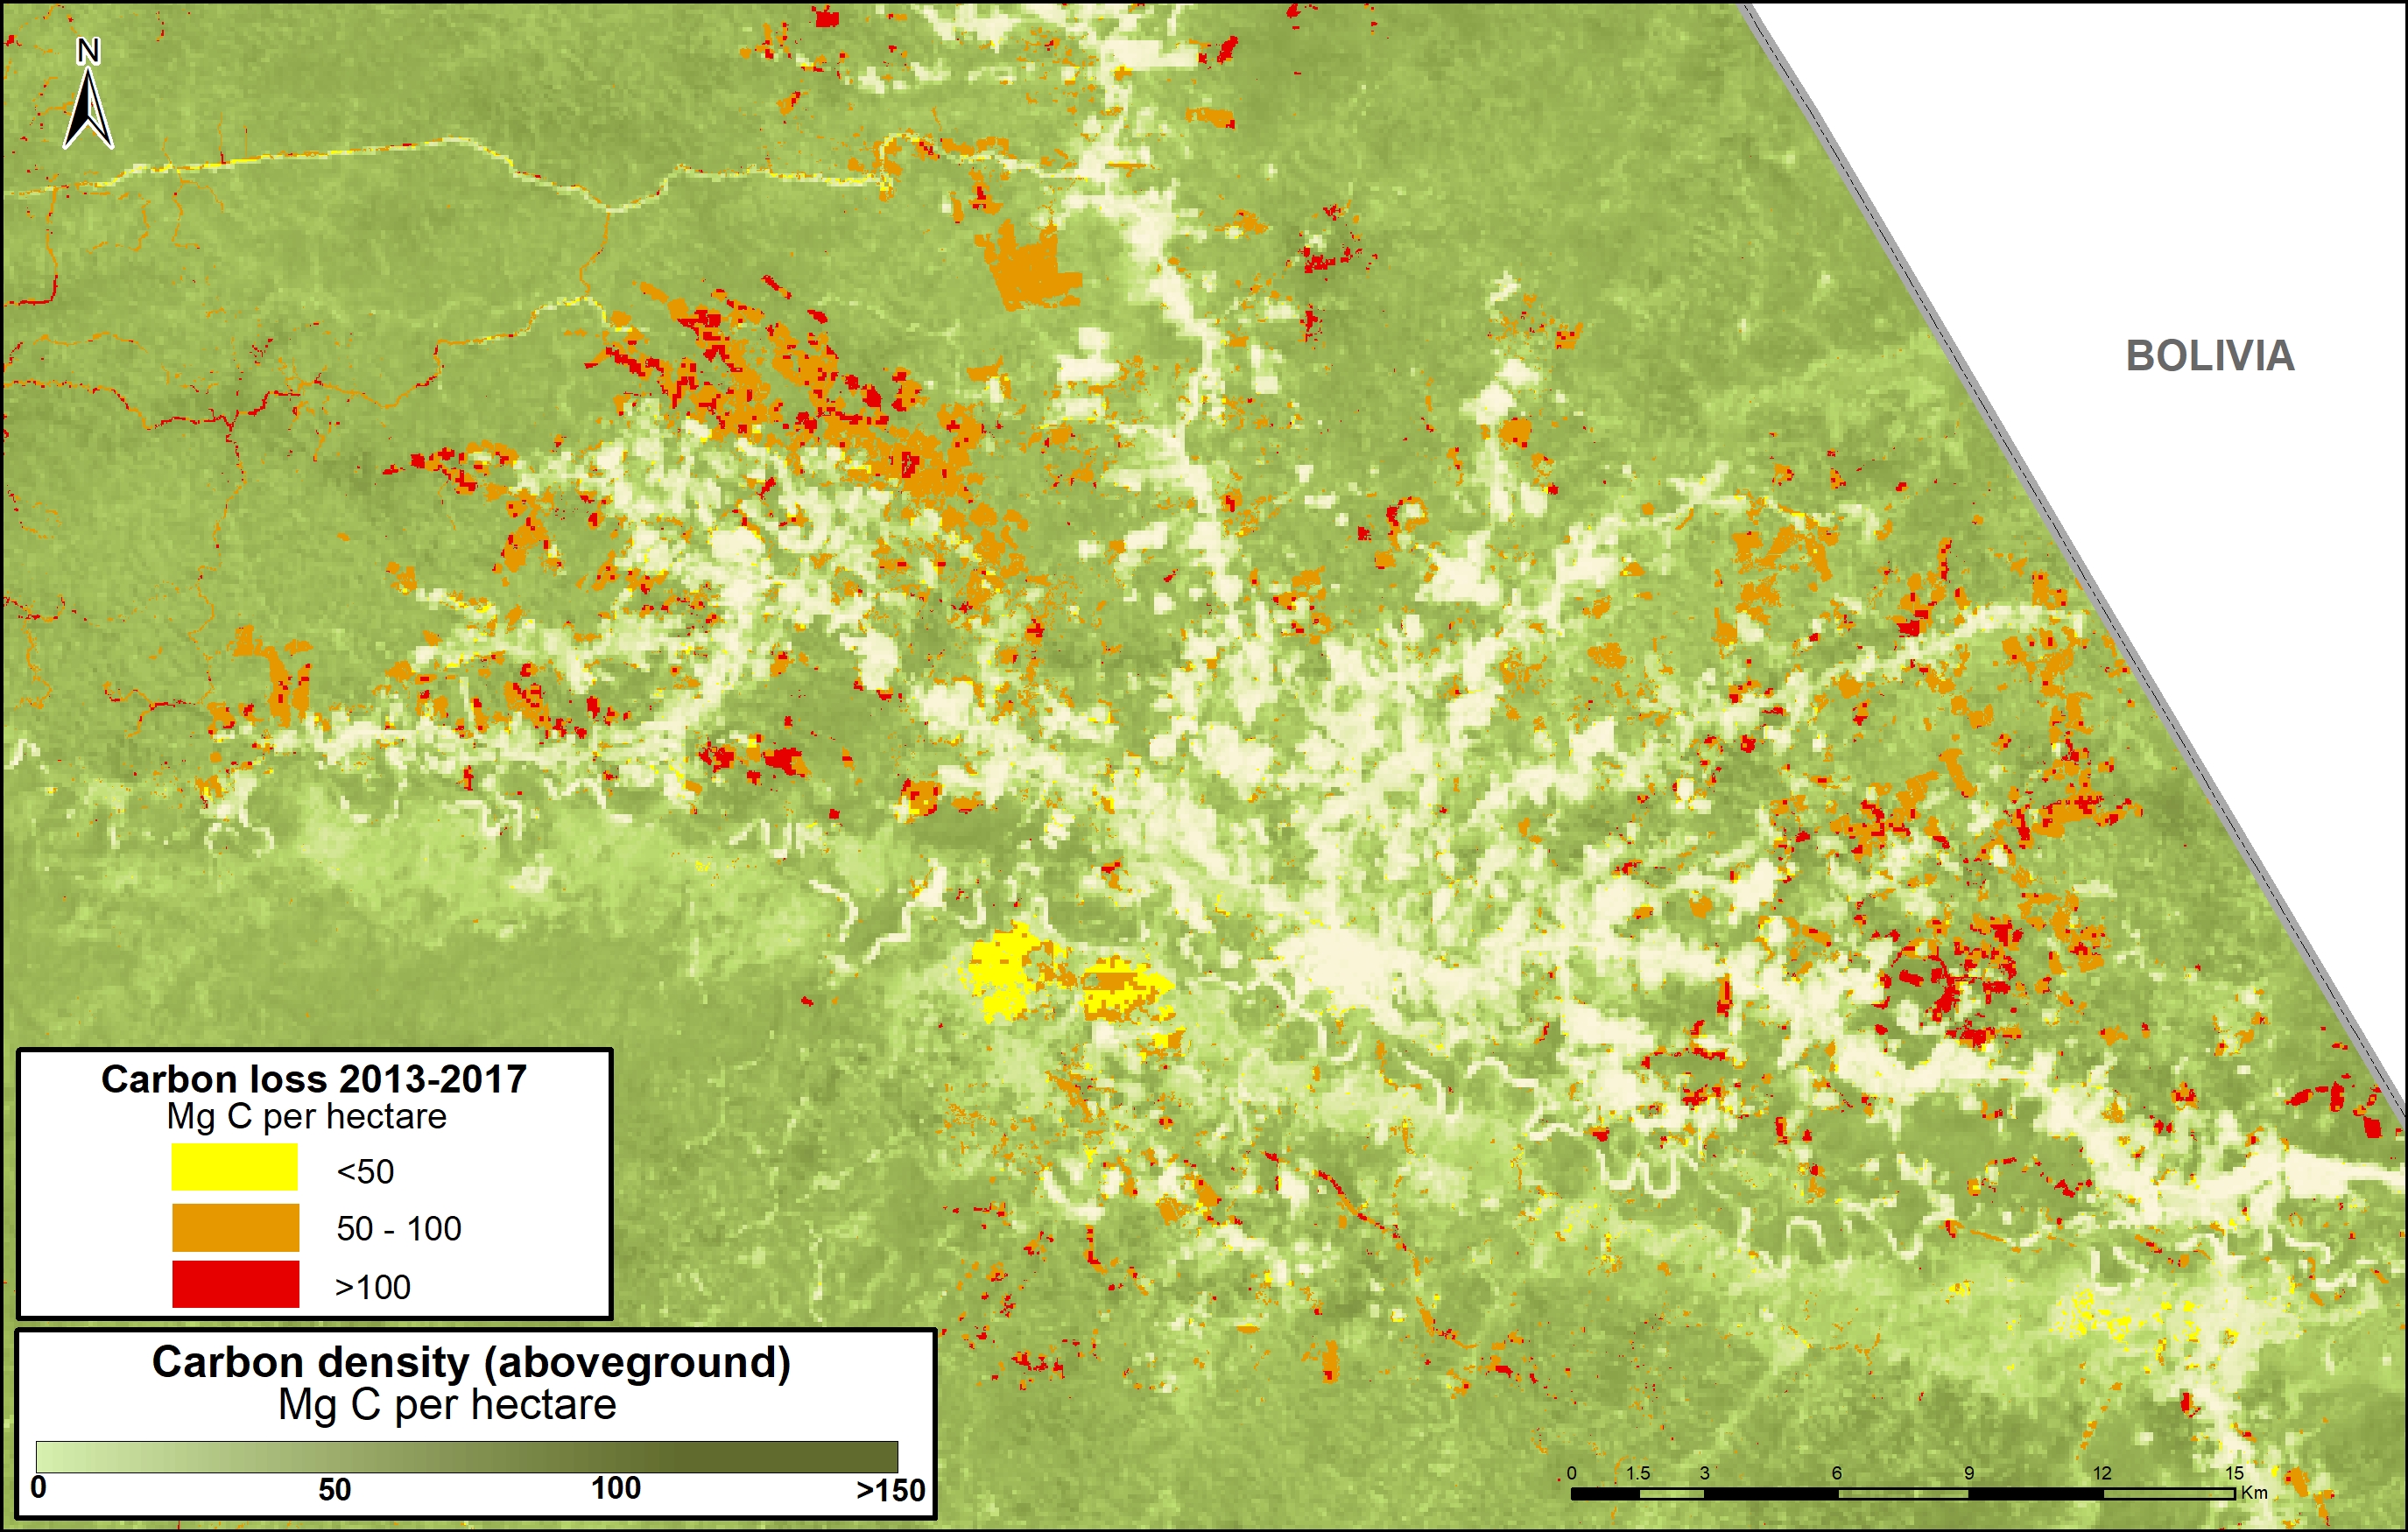
Image C shows the loss of 876 thousand metric tons of carbon in the southern Peruvian Amazon around the town of Iberia (Madre de Dios region). Note the expanding carbon loss along both sides of the Interoceanic Highway that crosses the image.

Image C. Iberia. Data: Asner et al 2014, MINAM/PNCB

Zoom D: United Cacao

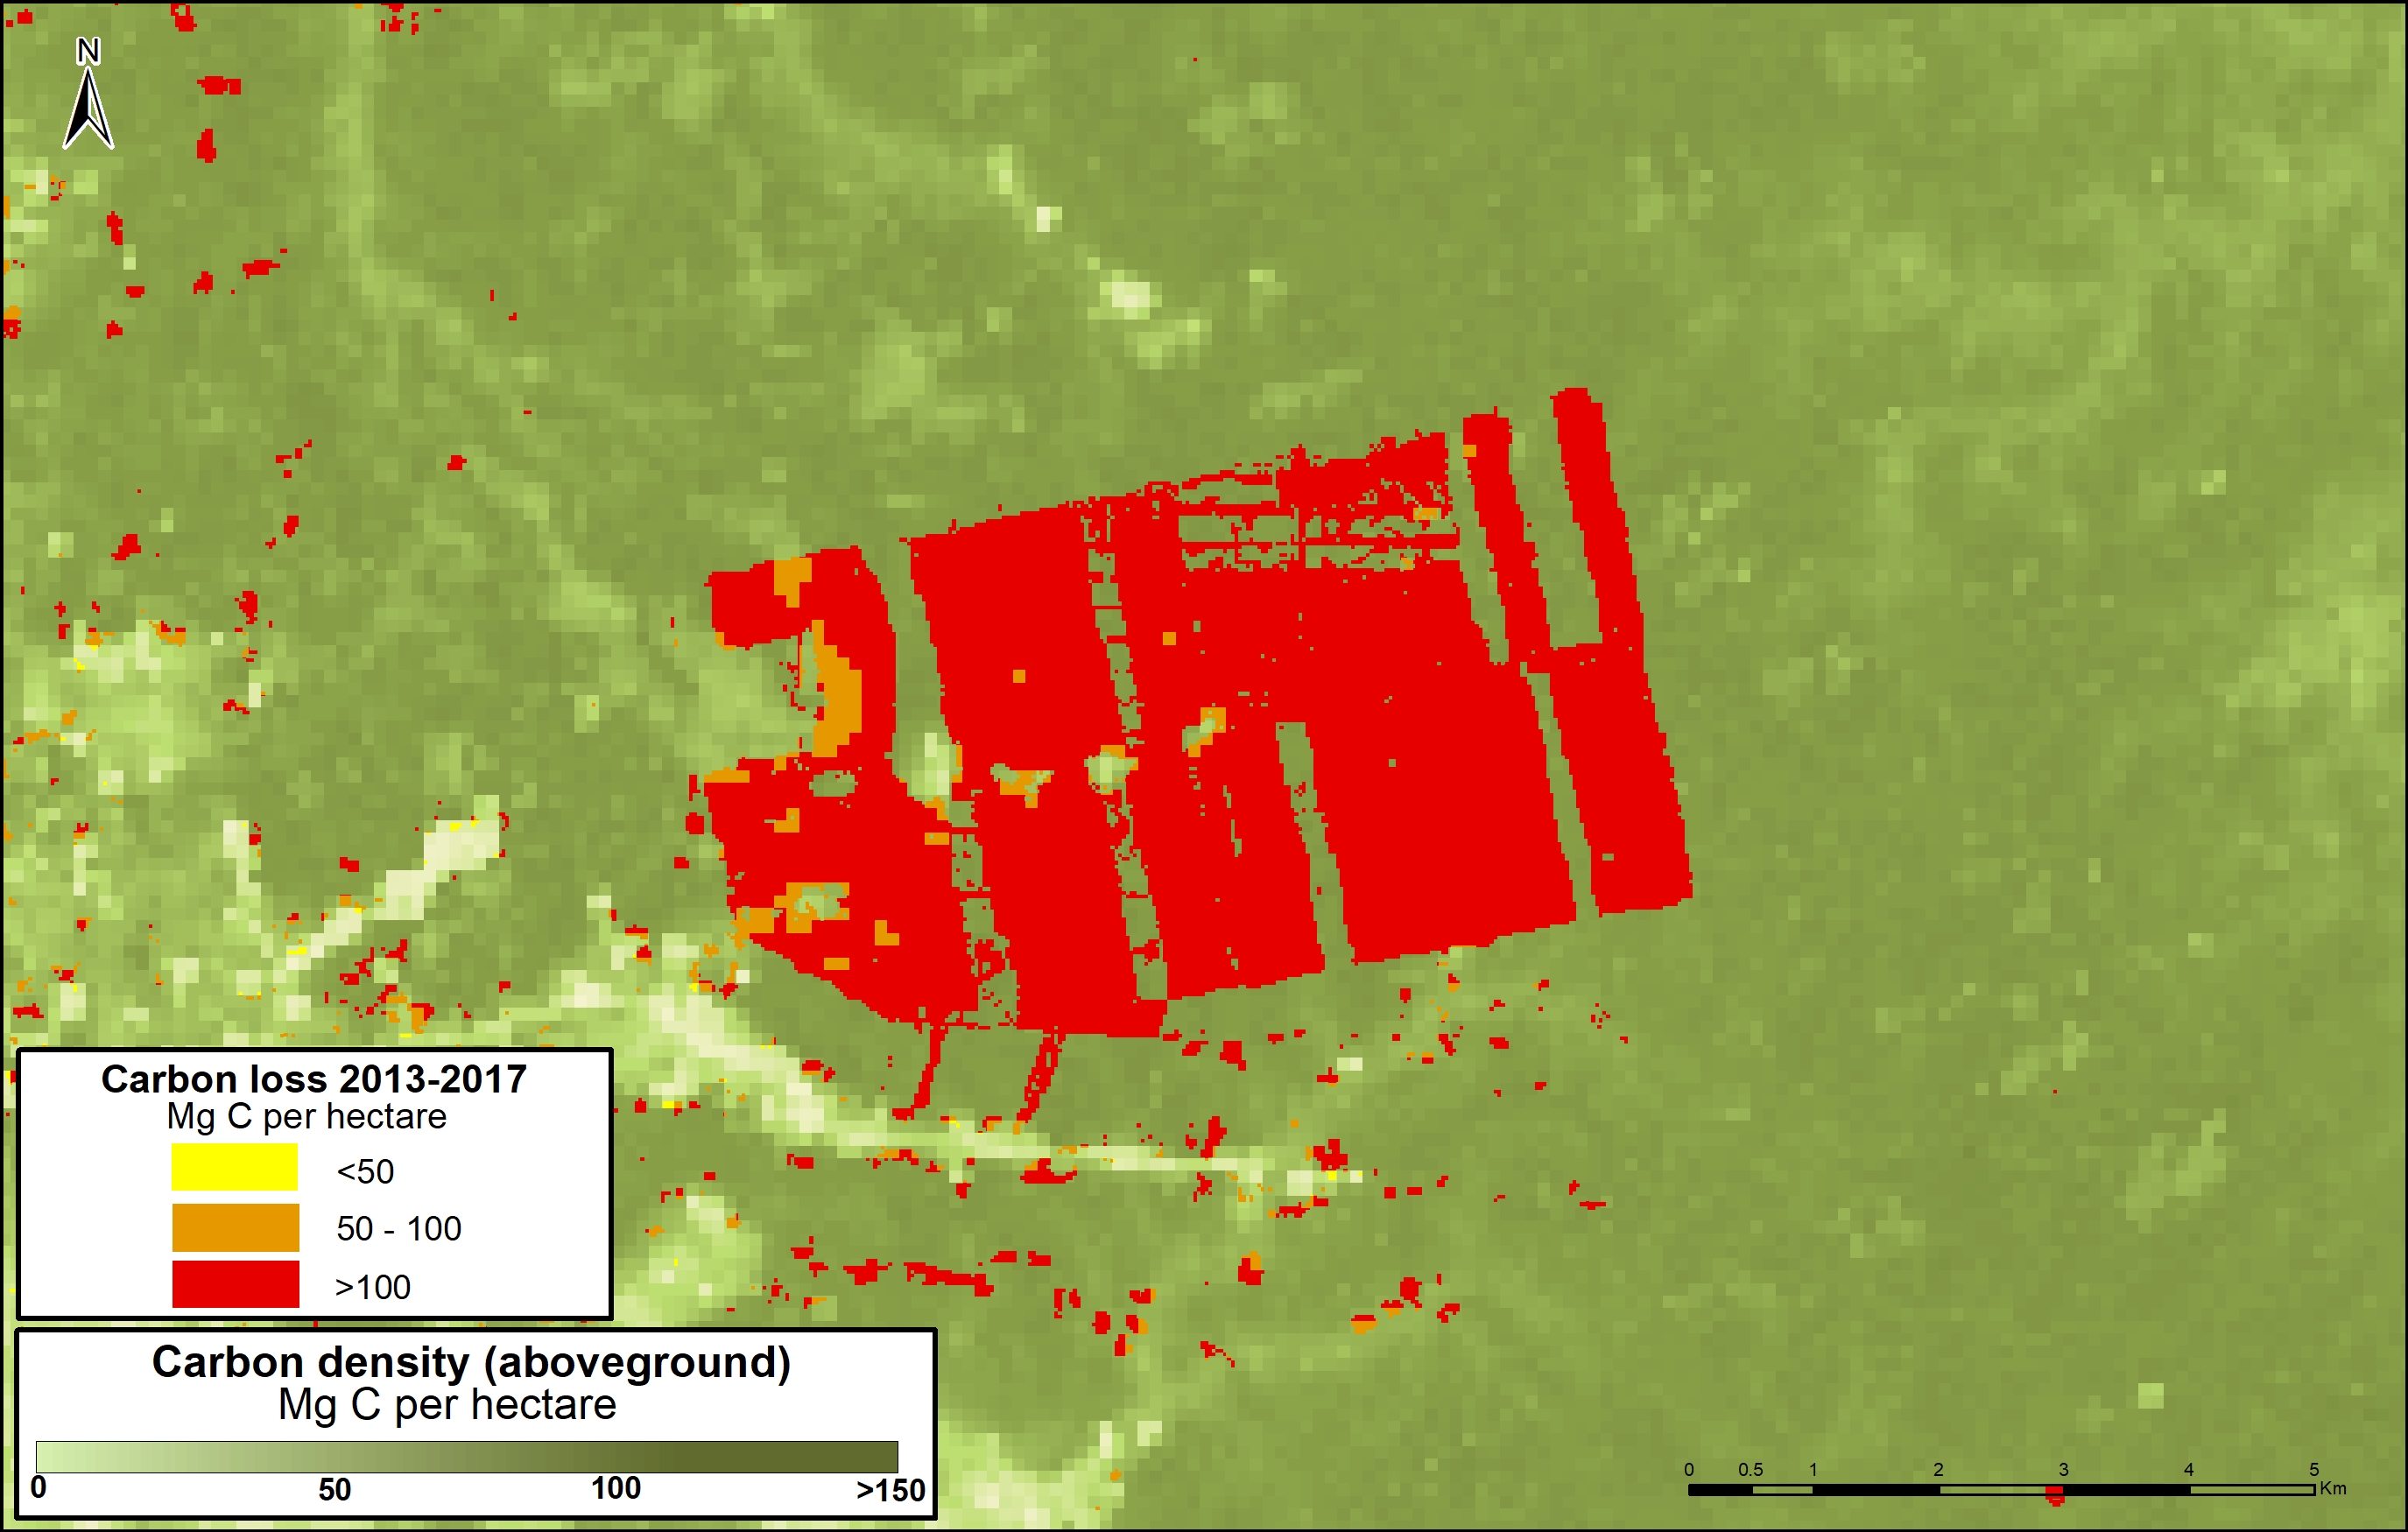
Image D shows the loss of 291 thousand metric tons of carbon for a large-scale cacao project (United Cacao) in the northern Peruvian Amazon (Loreto region). Note that nearly all the forest clearing occurred in high carbon density forest. This is another line of evidence that the company cleared primary forest, contrary to their claims that the area was already degraded.

Image D. United Cacao. Data: Asner et al 2014, MINAM/PNCB

Zoom E: Yaguas National Park

Image E shows how three protected areas, including the new Yaguas National Park, are effectively safeguarding 202 million metric tons of carbon in the northeastern Peruvian Amazon. This area is home to some of the highest carbon densities in the country.

Image E. Yaguas. Data: Asner et al 2014, MINAM/PNCB

Zoom F: Los Amigos Conservation Concession

Image F shows how Los Amigos, the world’s first conservation concession, is effectively safeguarding 15 million metric tons of carbon in the southern Peruvian Amazon. Two surrounding protected areas, Manu National Park and Amarakaeri Communal Reserve, safeguard an additional 194 million metric tons. This area is home to some of the highest carbon densities in the country.

Image F. Los Amigos. Data: Asner et al 2014, MINAM/PNCB

Zoom G: Sierra del Divisor National Park

Image G. Data: Asner et al 2014, MINAM/PNCB

Image G shows how three protected areas, including the new Sierra del Divisor National Park, are effectively safeguarding 270 million metric tons of carbon in the eastern Peruvian Amazon.

This area is home to some of the highest carbon densities in the country.


Methodology

Para el análisis se utilizó los datos de carbono sobre el suelo  generados por Asner et al 2014, y los datos de pérdida de bosques identificados por el Programa Nacional de Conservación de Bosques (PNBC-MINAM) de los años 2013 al 2016 así como las alertas tempranas del año 2017. Primero uniformizamos los datos de pérdida de bosque 2013-2016 con las alertas tempranas del año 2017 para evitar superposición y tener un solo dato 2013-2017. Posteriormente, extraemos los datos de carbono de las áreas de pérdida de bosque del 2013-2017, este proceso permitió obtener la densidad de carbono (por hectárea) en relación al área de la pérdida de bosque para finalmente estimar el total de stocks de carbono perdido entre el año 2013 al 2017.

References

Baccini A, Walker W, Carvalho L, Farina M, Sulla-Menashe D, Houghton RA (2017) Tropical forests are a net carbon source based on aboveground measurements of gain and loss. Science. 13;358(6360):230-4.

Asner GP et al (2014). The High-Resolution Carbon Geography of Perú. Carnegie Institution for Science.

Boden TA, Andres RJ, Marland G (2017) National CO2 Emissions from Fossil-Fuel Burning, Cement Manufacture, and Gas Flaring: 1751-2014. DOI 10.3334/CDIAC/00001_V2017

Citation

Finer M, Mamani N (2017). Carbon loss from deforestation in the Peruvian Amazon. MAAP: 81.

Acknowledgments

This report was made possible by the generous support of the Norwegian Agency for Development Cooperation (NORAD).


MAAP #80: Amazon Beauty, in High-Resolution

Image 80. Base Map. Data: SERNANP, MAAP

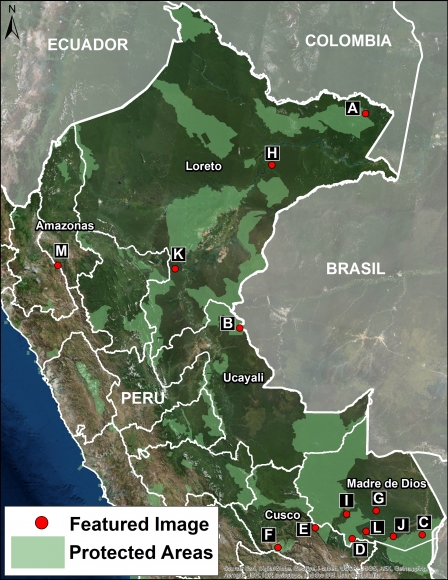
MAAP tracks the most urgent deforestation cases in the Andean Amazon, thus it can be a bit depressing. However, it is important to remember why we do it: the Amazon is spectacular.

Here, we present a series of high-resolution satellite images to show the incredible beauty of the Peruvian Amazon, and help remind us all why it is so important to protect.

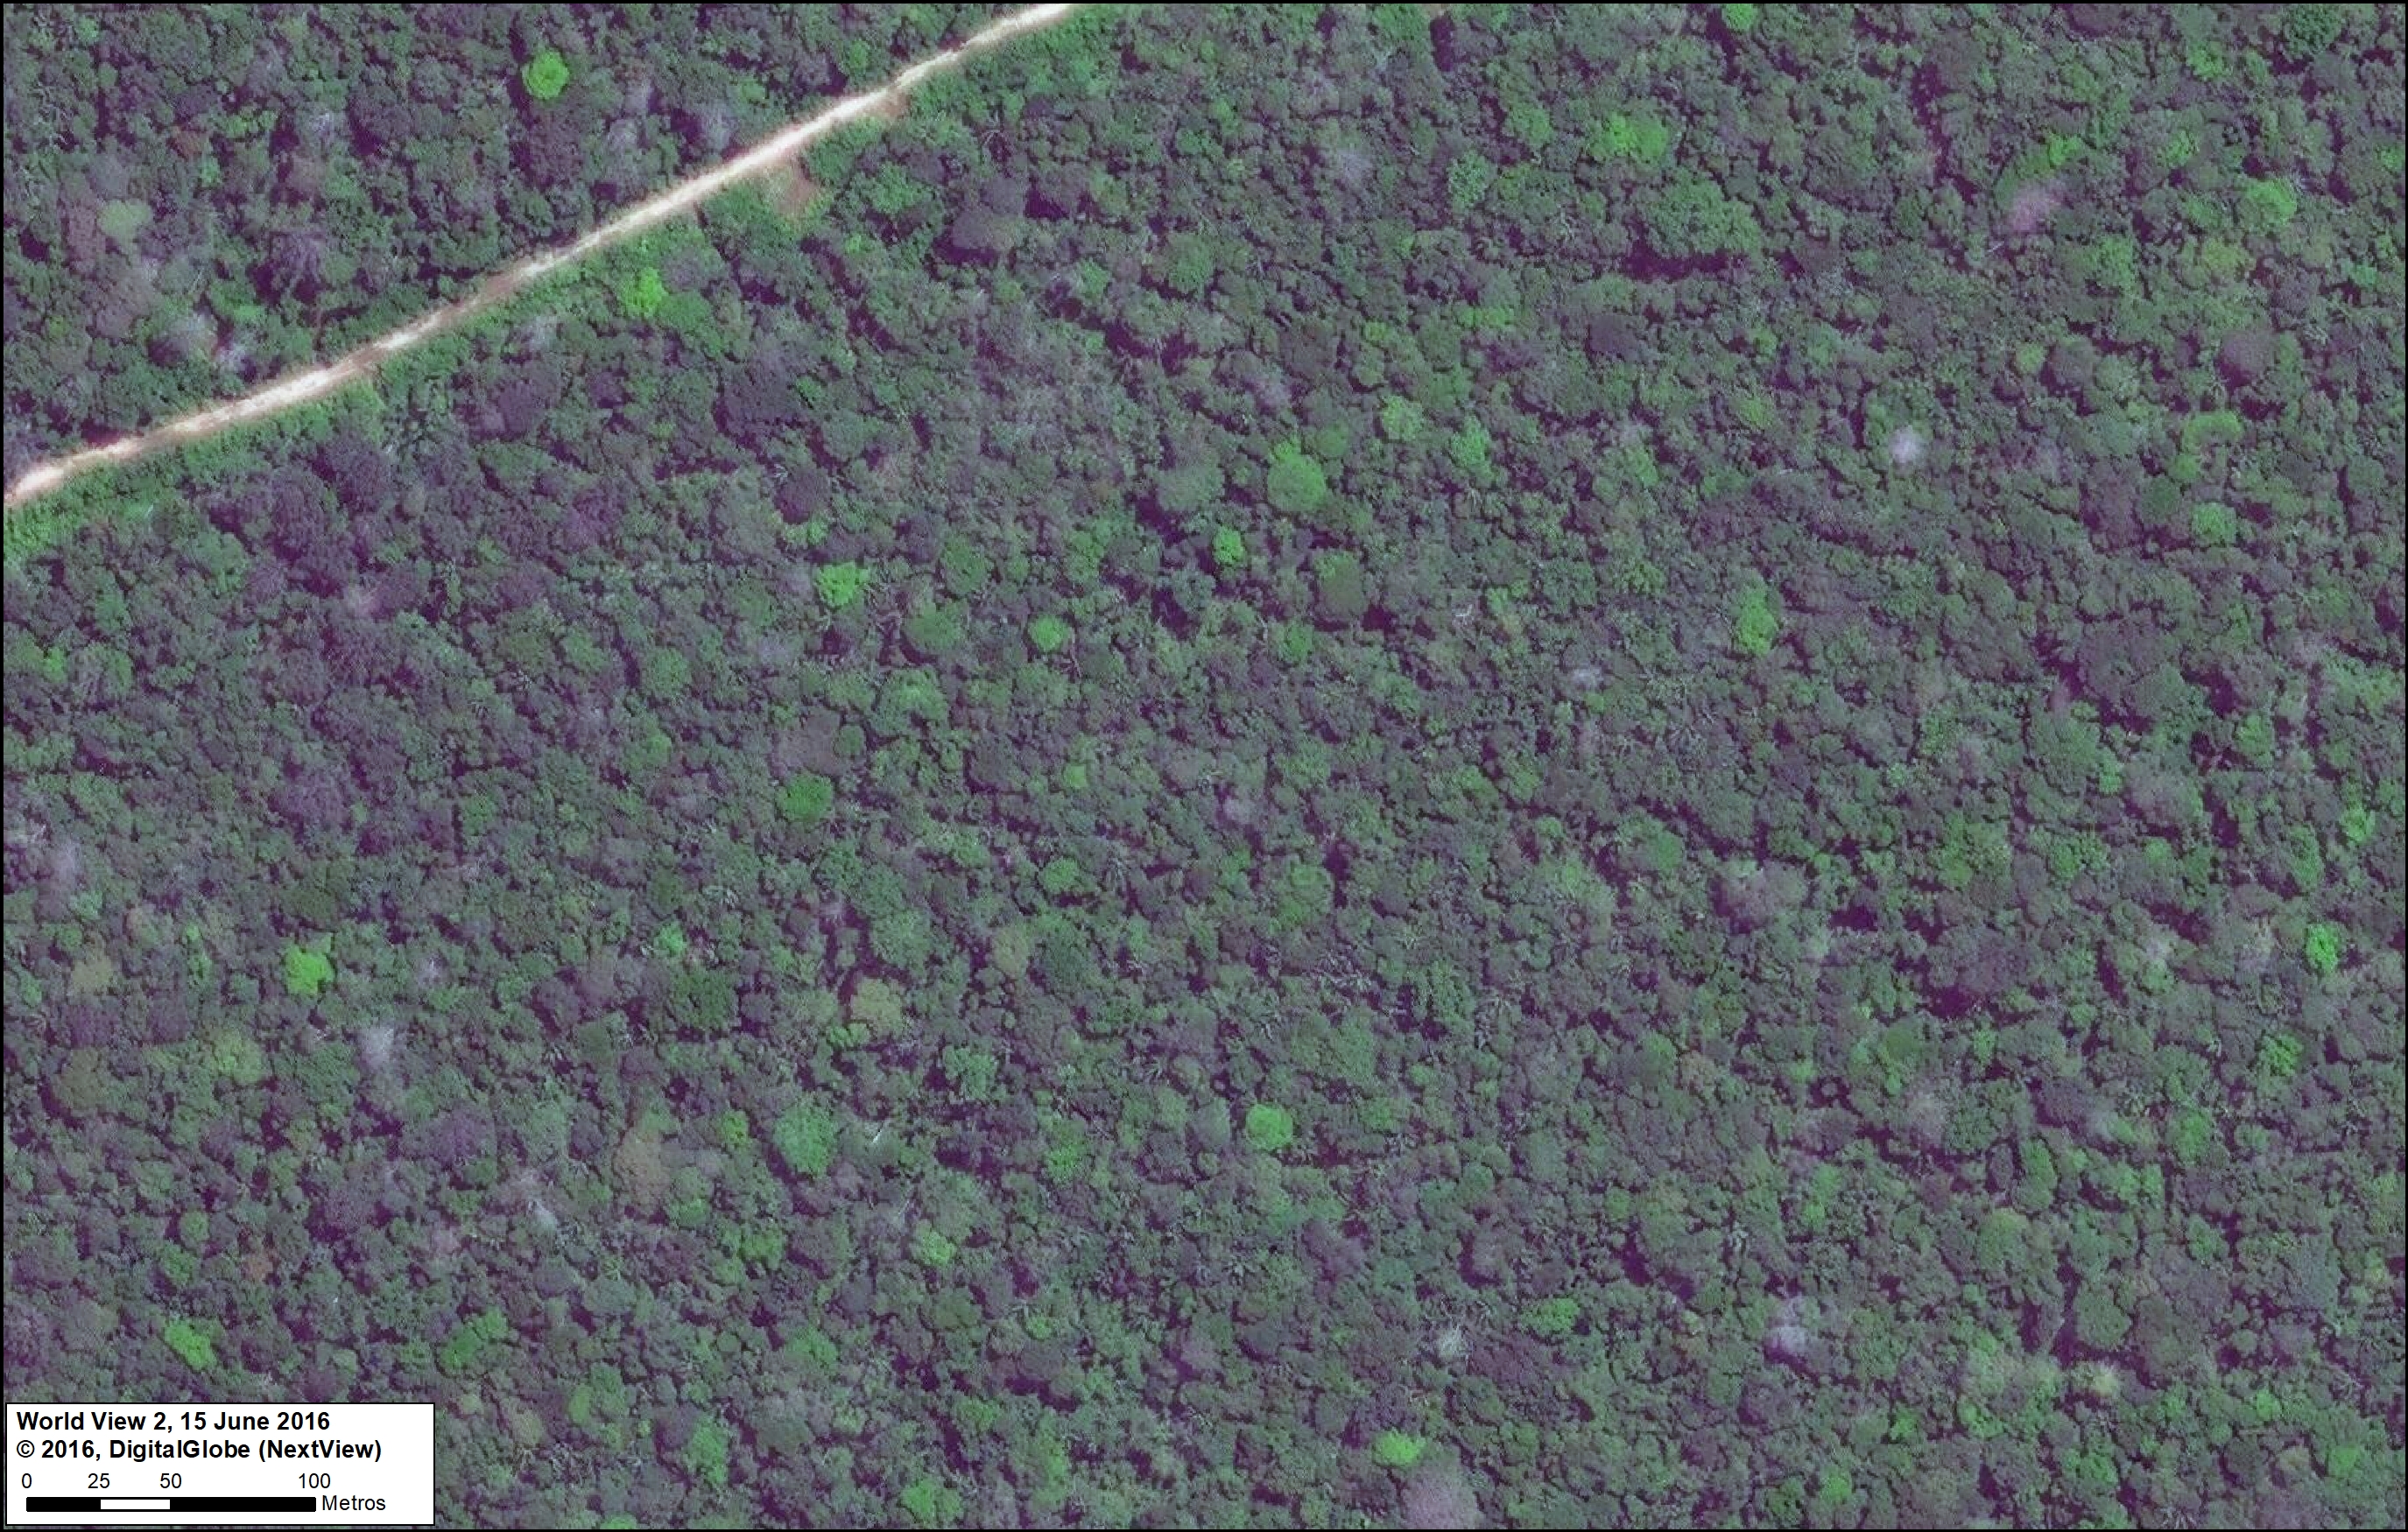
All the images, obtained from DigitalGlobe, are both recent and very high resolution (less than 0.5 meters). Together, they form an art exhibition, starring the forests, rivers, and mountains of the Peruvian Amazon.

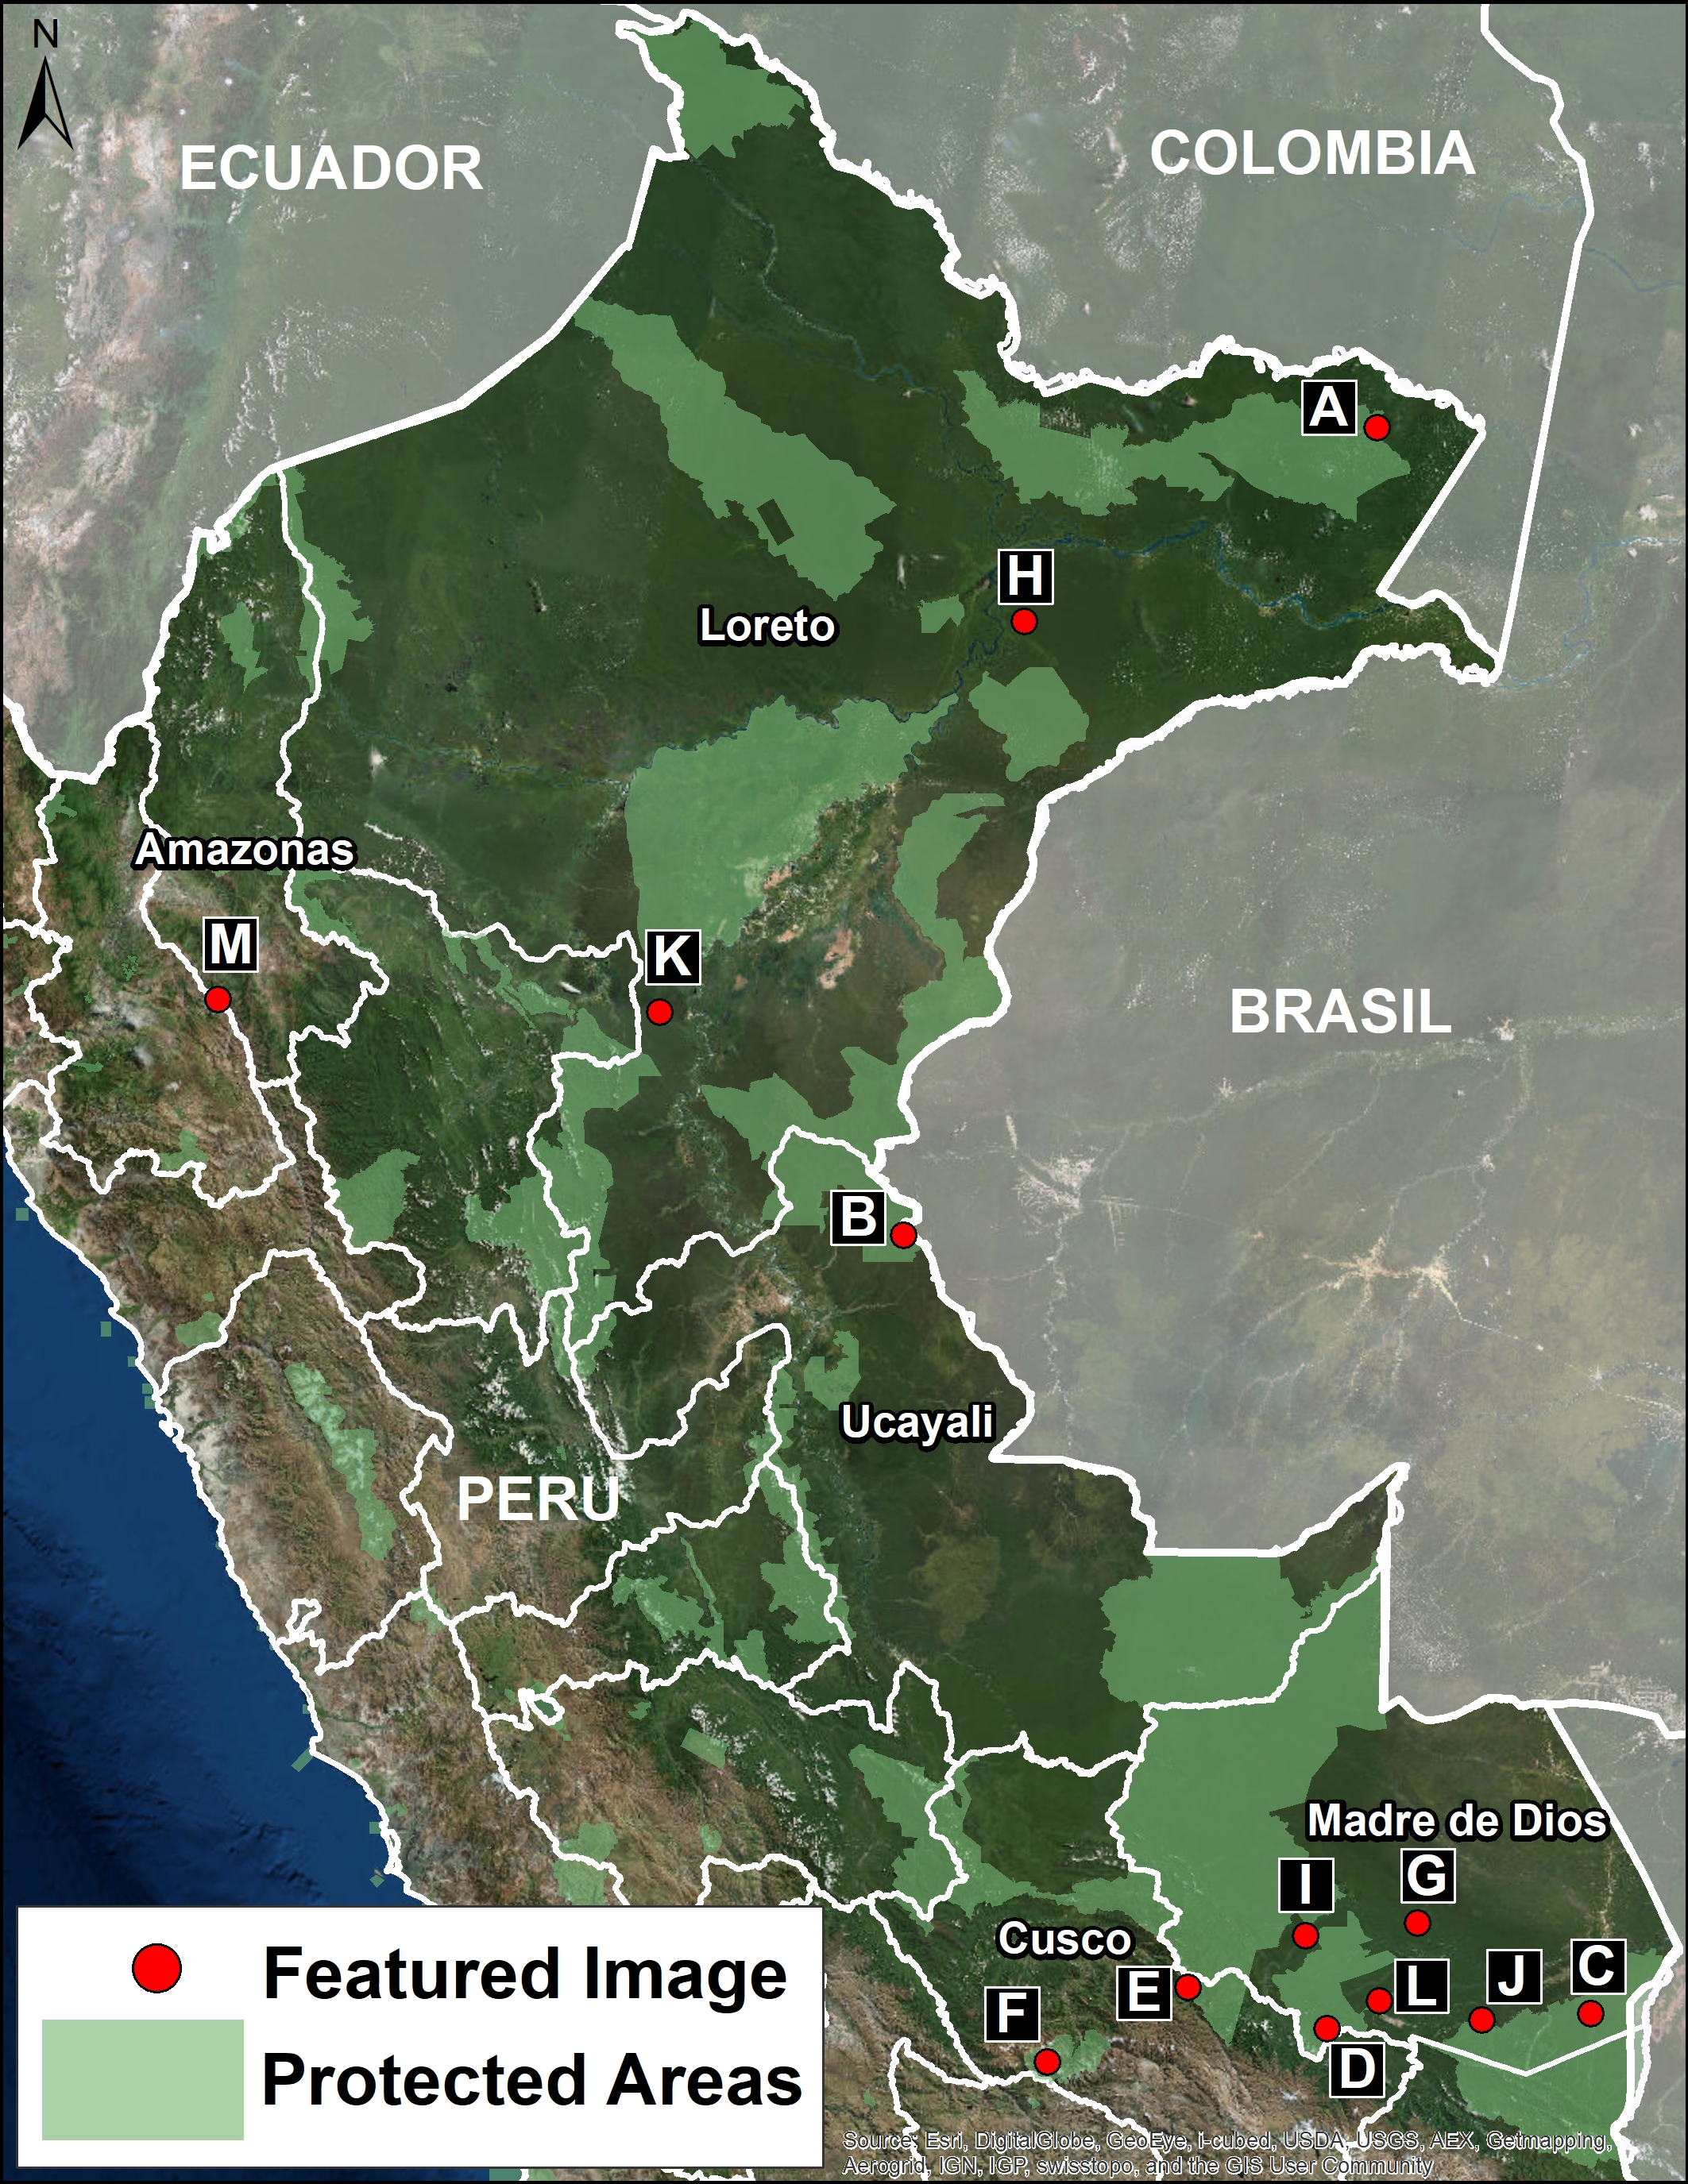
The categories of the images are: “Protected Areas” and “Threatened Areas.”

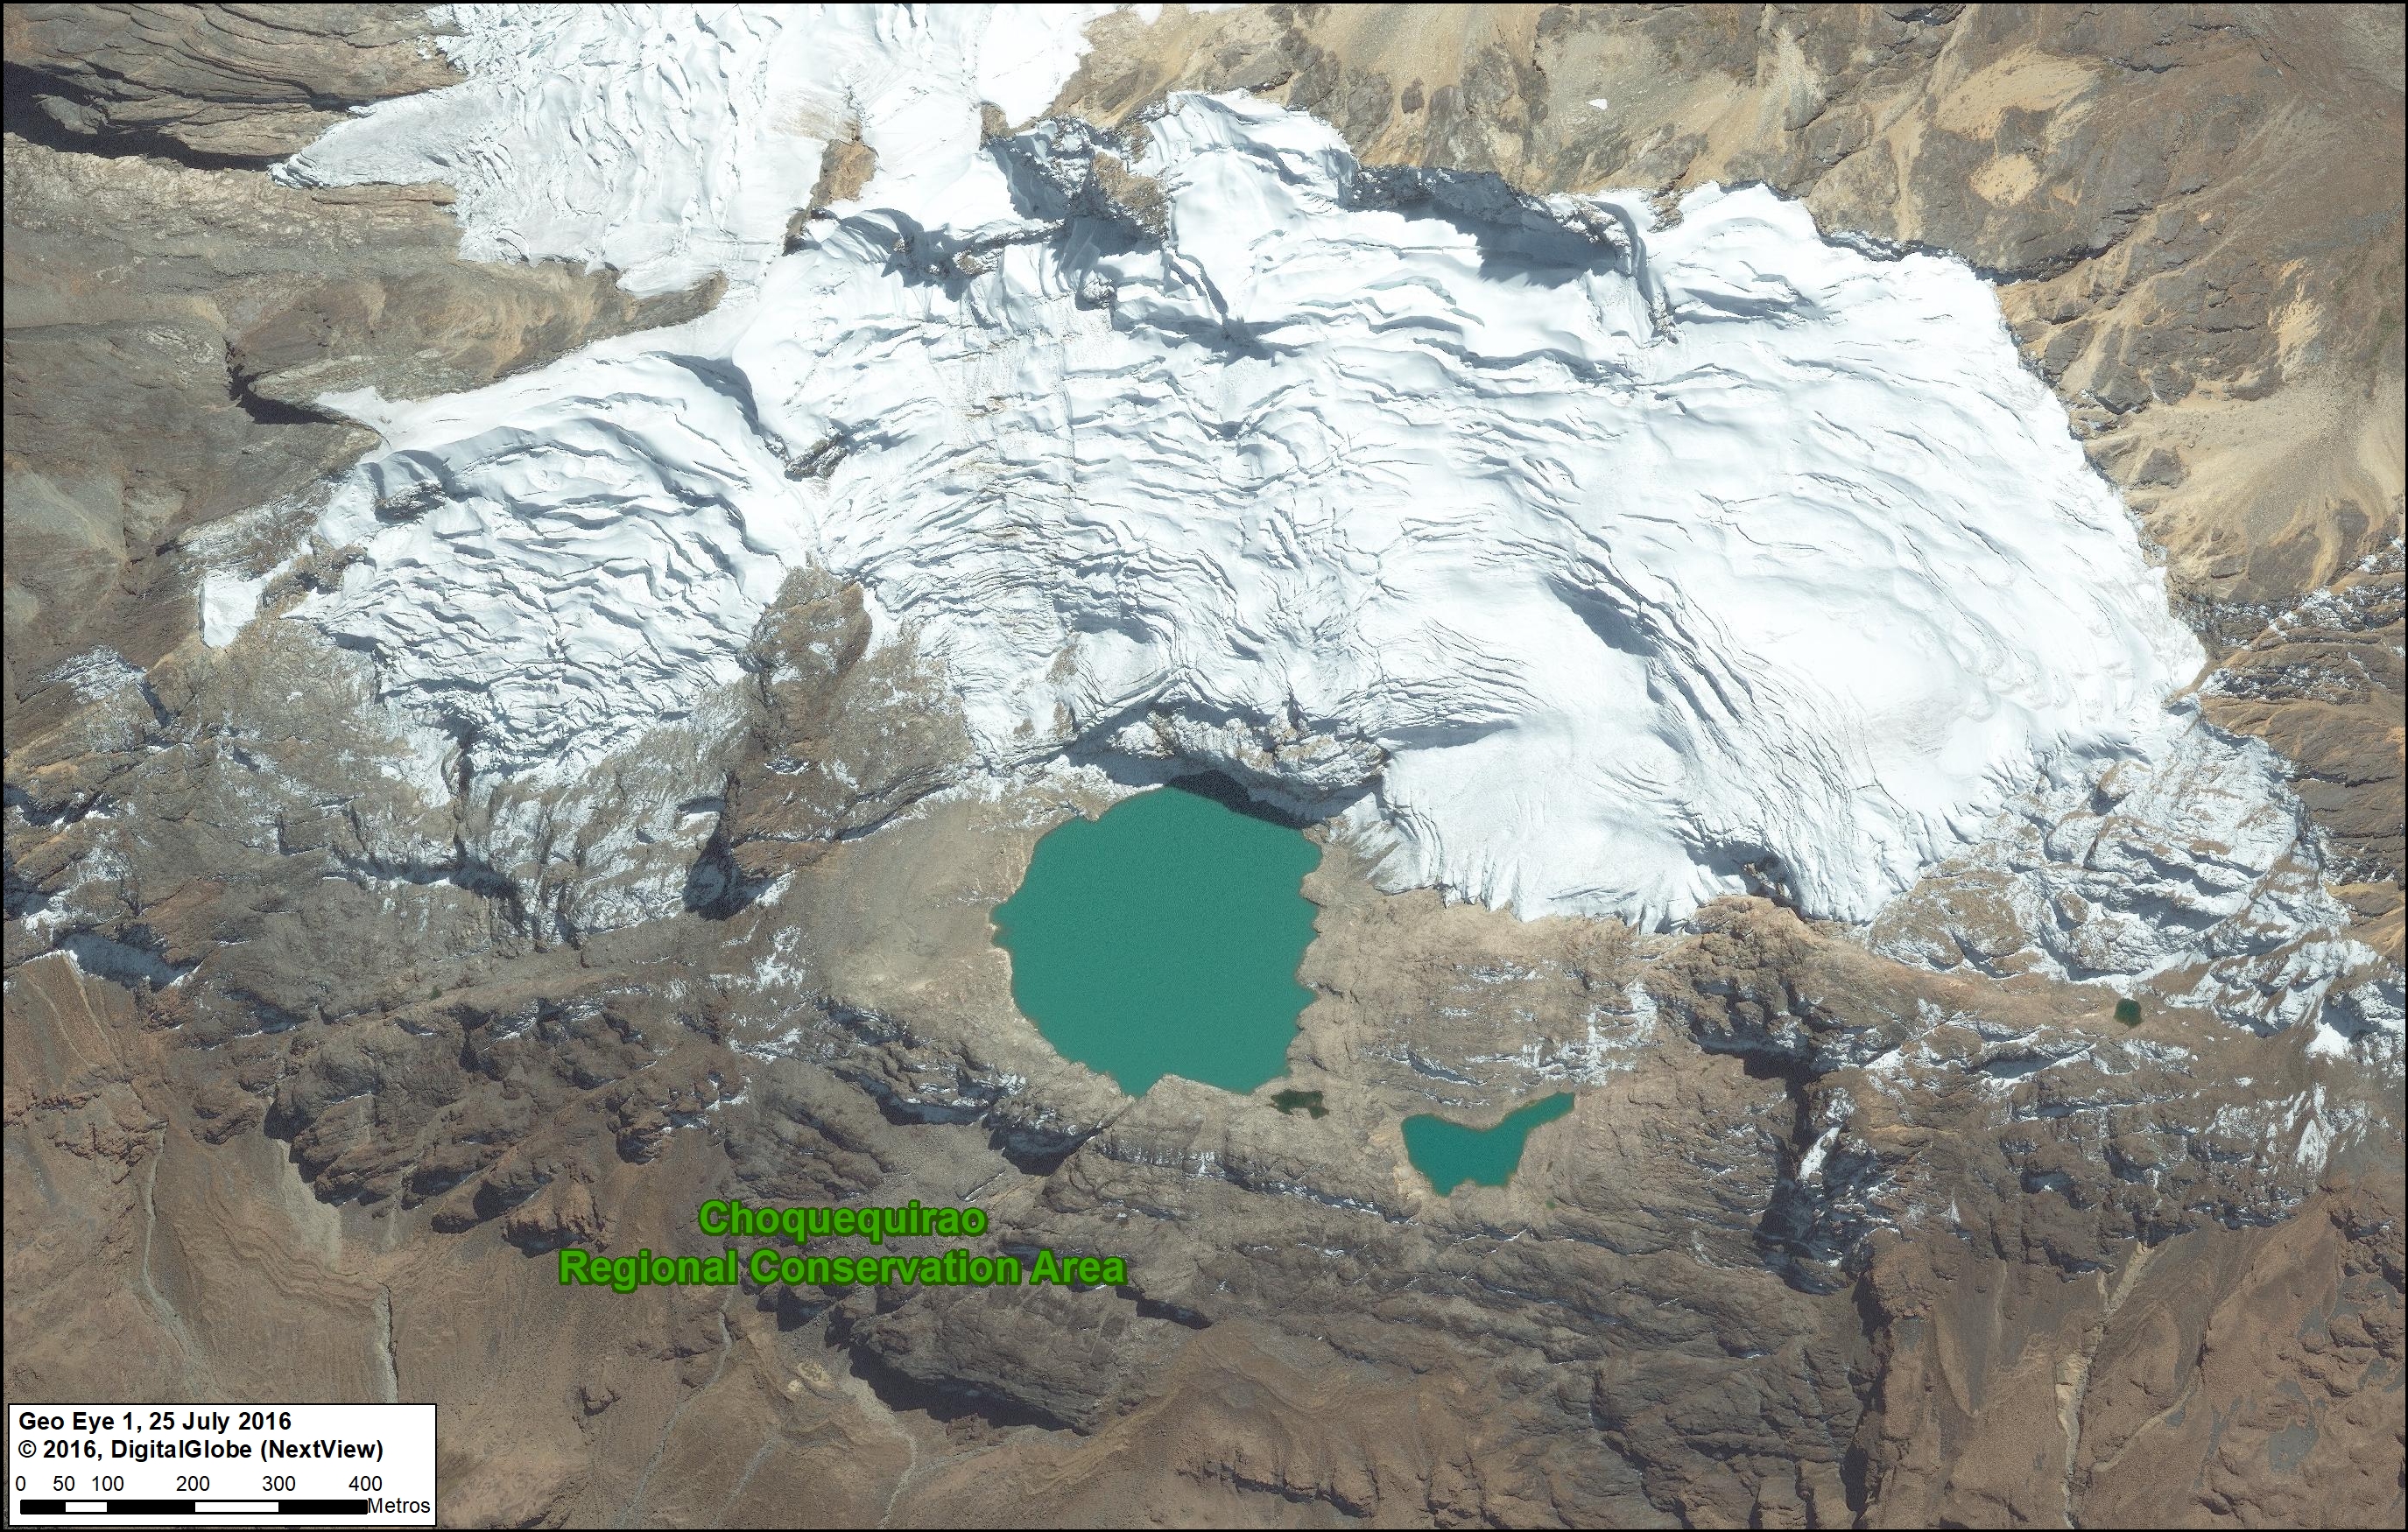
The Protected Areas include National Parks (Yaguas, Sierra del Divisor, and Manu); National Reserve (Tambopata); Communal Reserve (Amarakaeri); and Regional Conservation Area (Choquequirao).

The Threatened Areas include areas at risk due to gold mining, road construction, hydroelectric dams, and new oil palm and cacao plantations.

Click on each image to enlarge. See the base map for the location of each image (A-M).


Protected Areas

A. Yaguas National Park (Loreto)

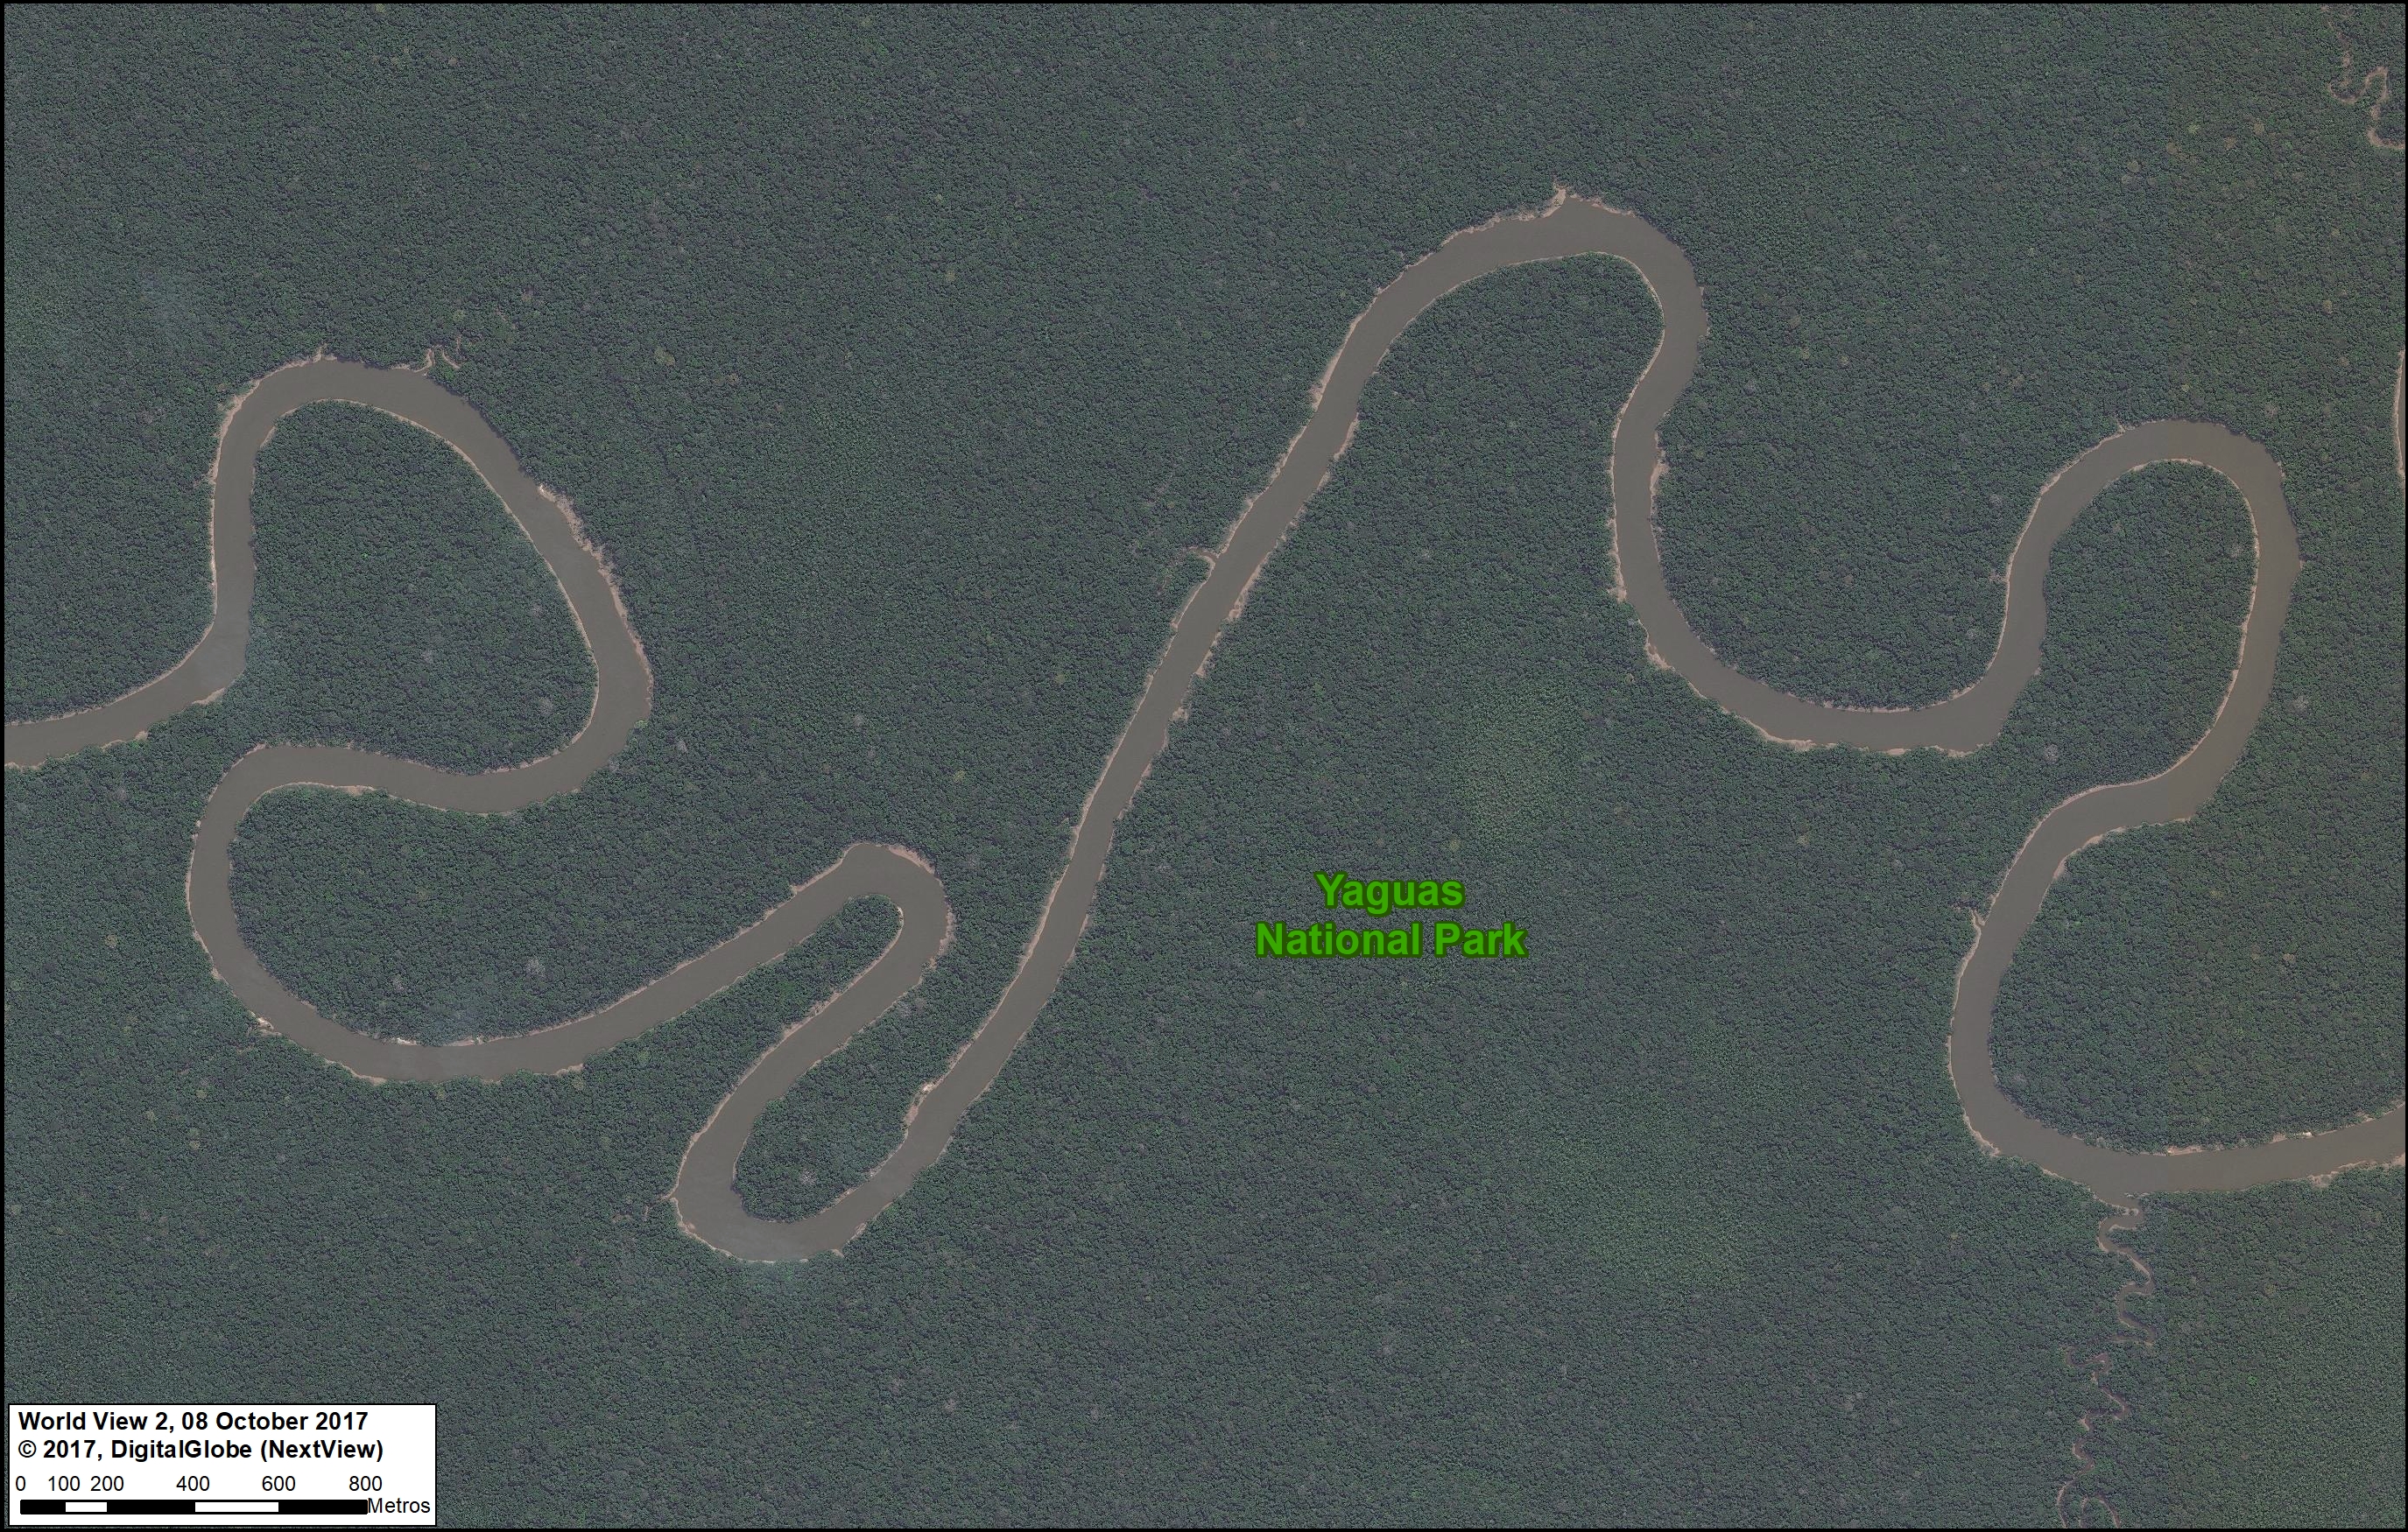
As Peru’s newest national park, created in January 2018, Yaguas National Park now protects a large (2,147,345 acres) and nearly intact stretch of the northern Peruvian Amazon. In featured Image A, we show the Yaguas River meandering through the primary forest of the eastern section of the new park.
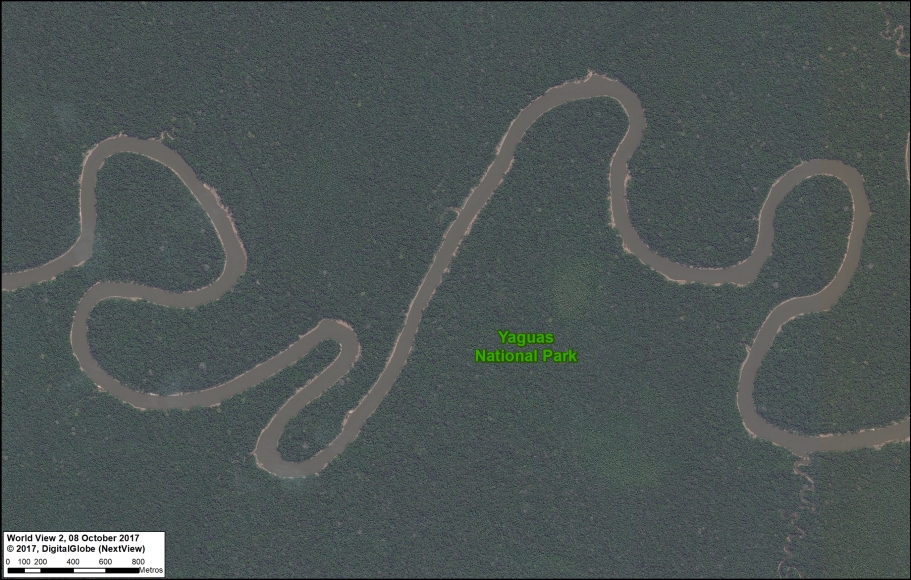
Image 80_A. Parque Nacional Yaguas. Data: DigitalGlobe (Nextview)

B. Sierra del Divisor National Park (Ucayali)

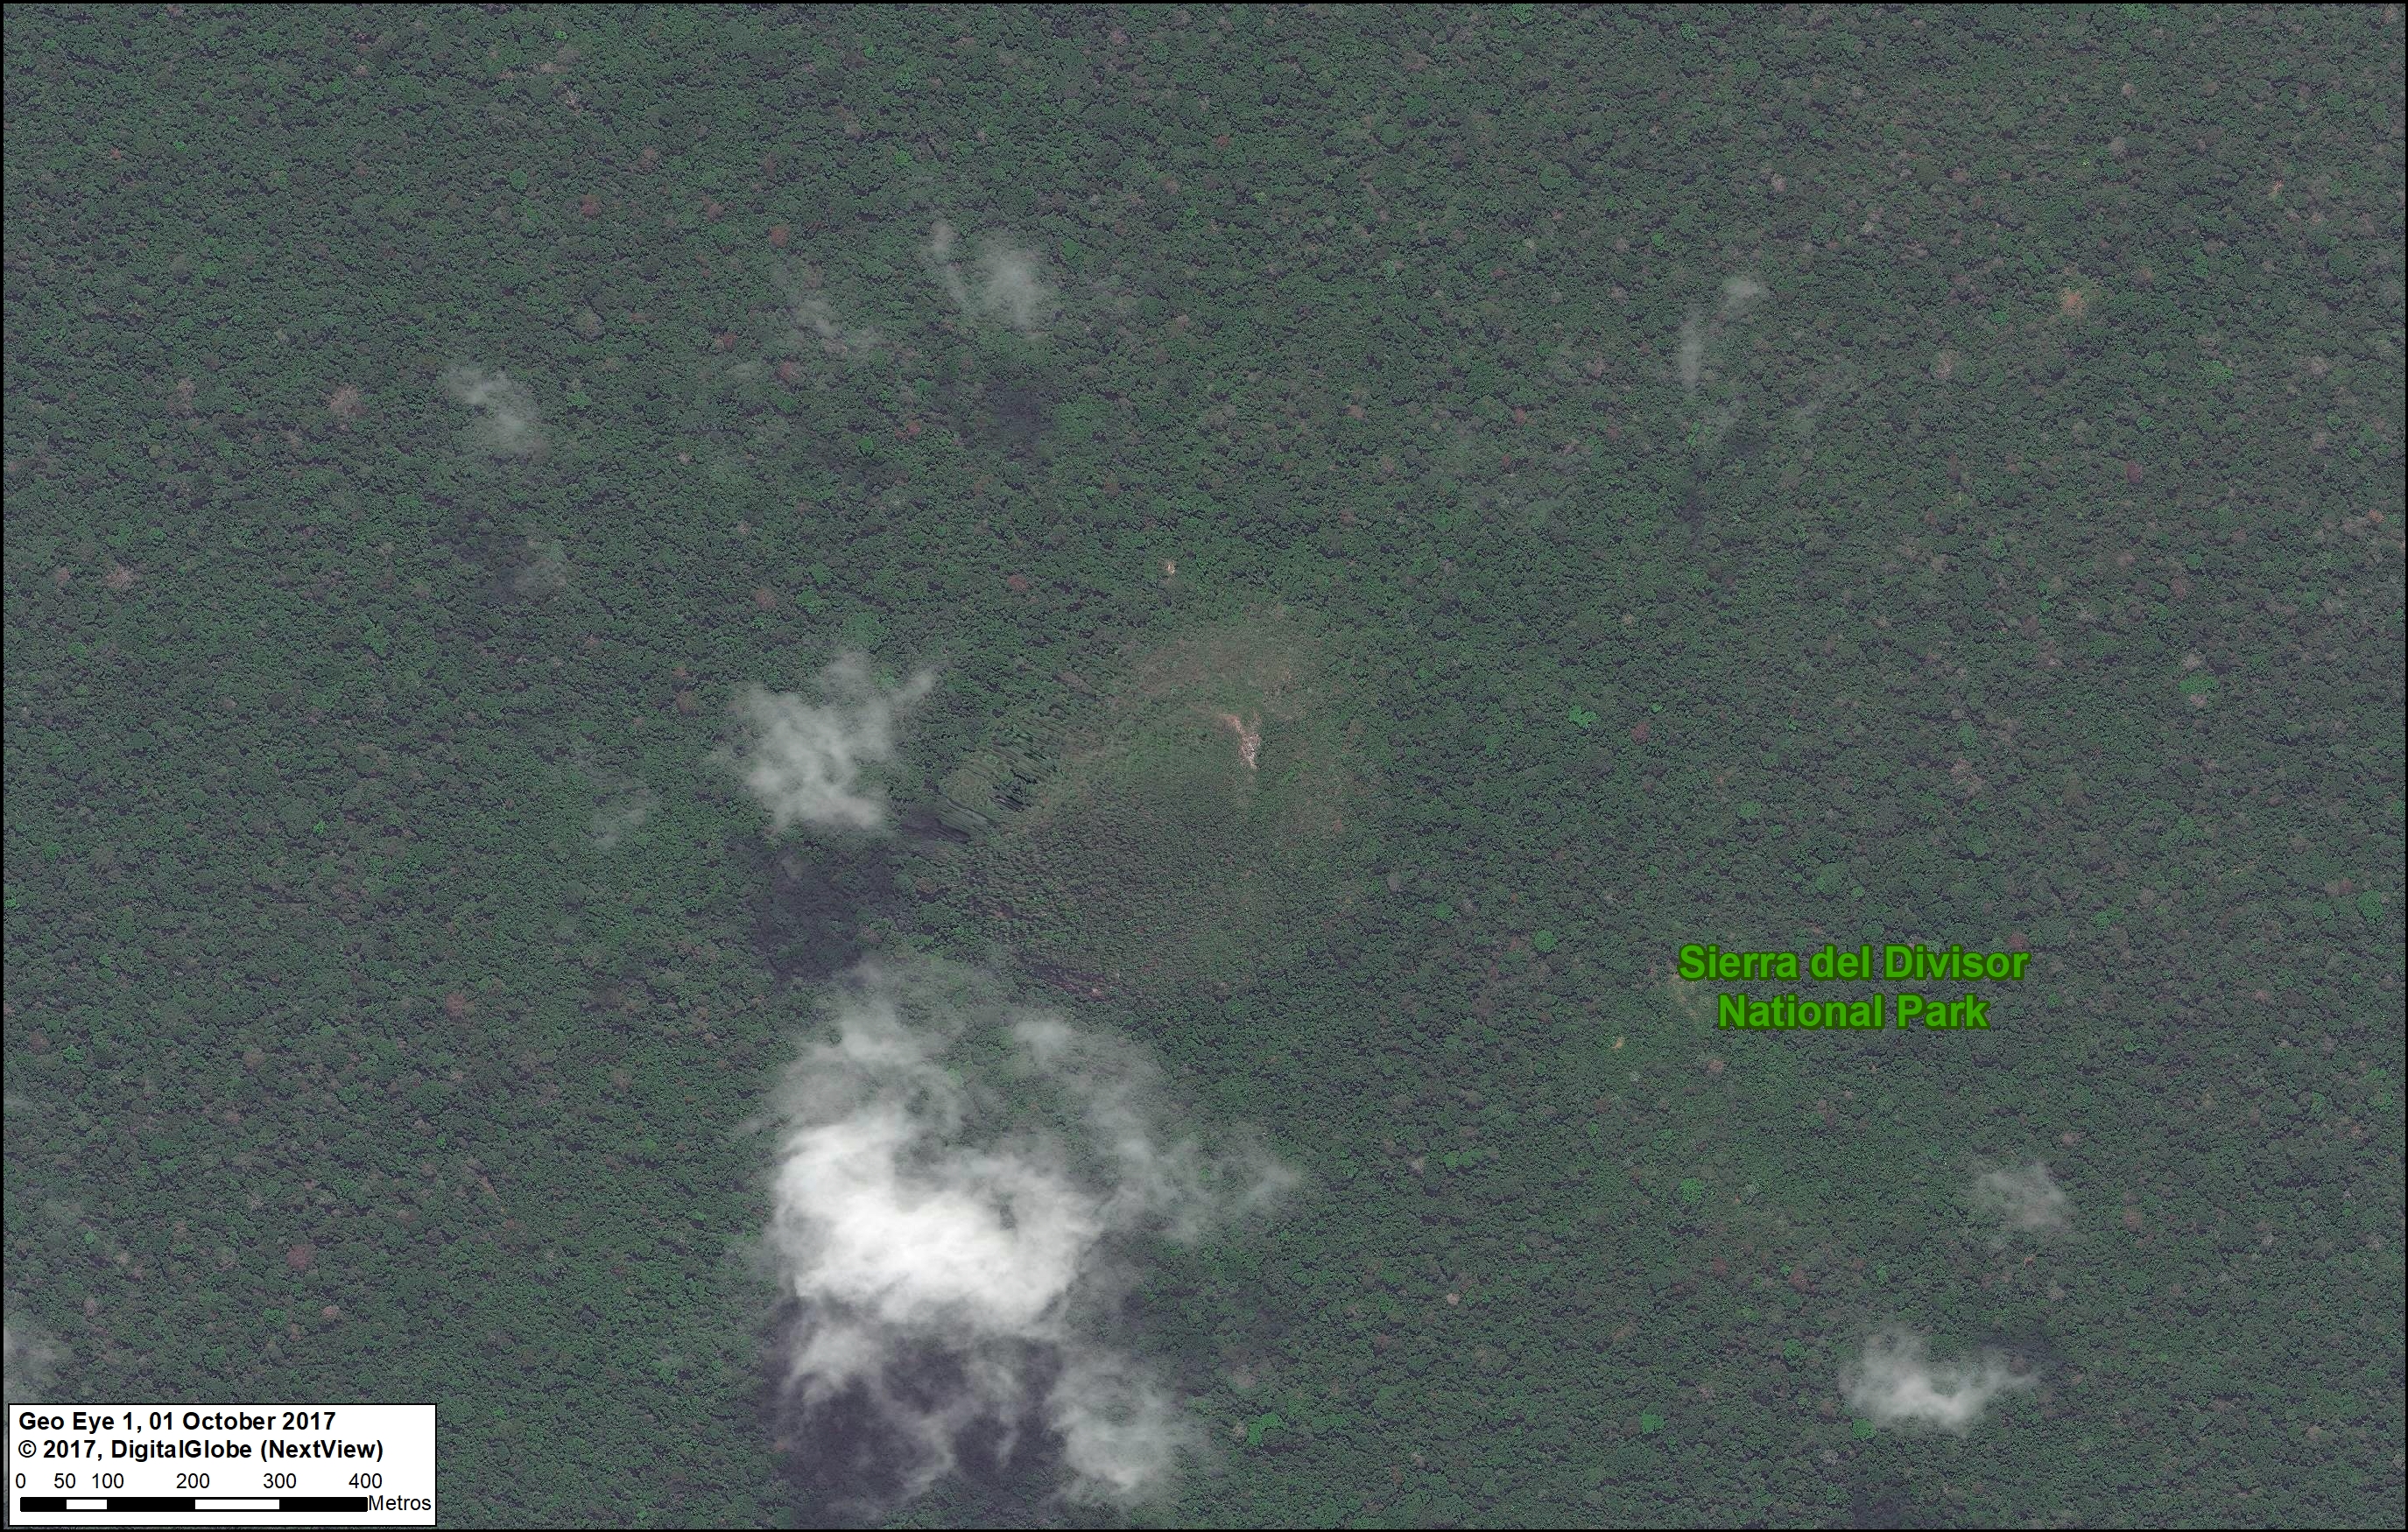
The second newest national park in Peru is Sierra del Divisor, created in 2015. Sierra del Divisor National Park protects more than three million acres in the remote central Peruvian Amazon, along the border with Brazil. Featured Image B shows an aerial view of the famous cone mountain in the southern part of the park.
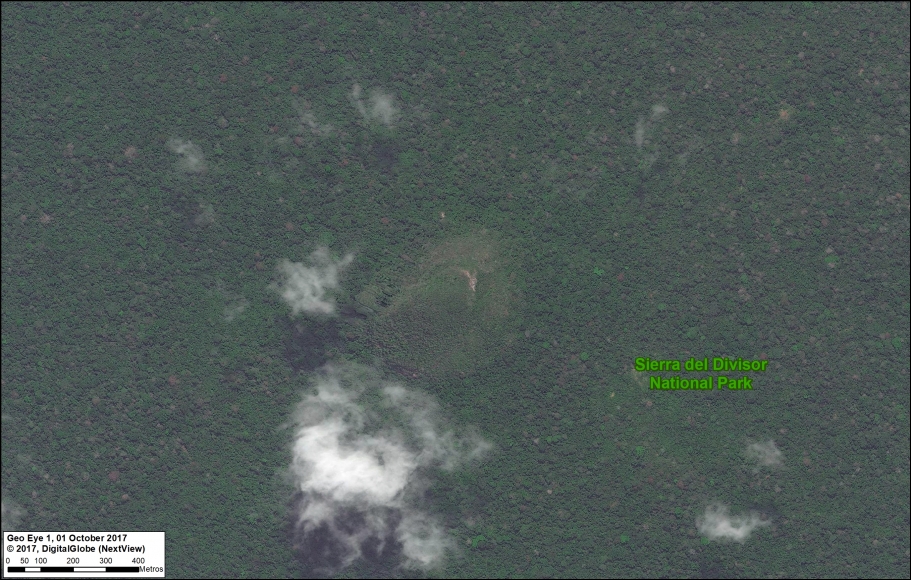
Image B. Parque Nacional Sierra del Divisor. Data: DigitalGlobe (Nextview)

C. Tambopata National Reserve (Madre de Dios)

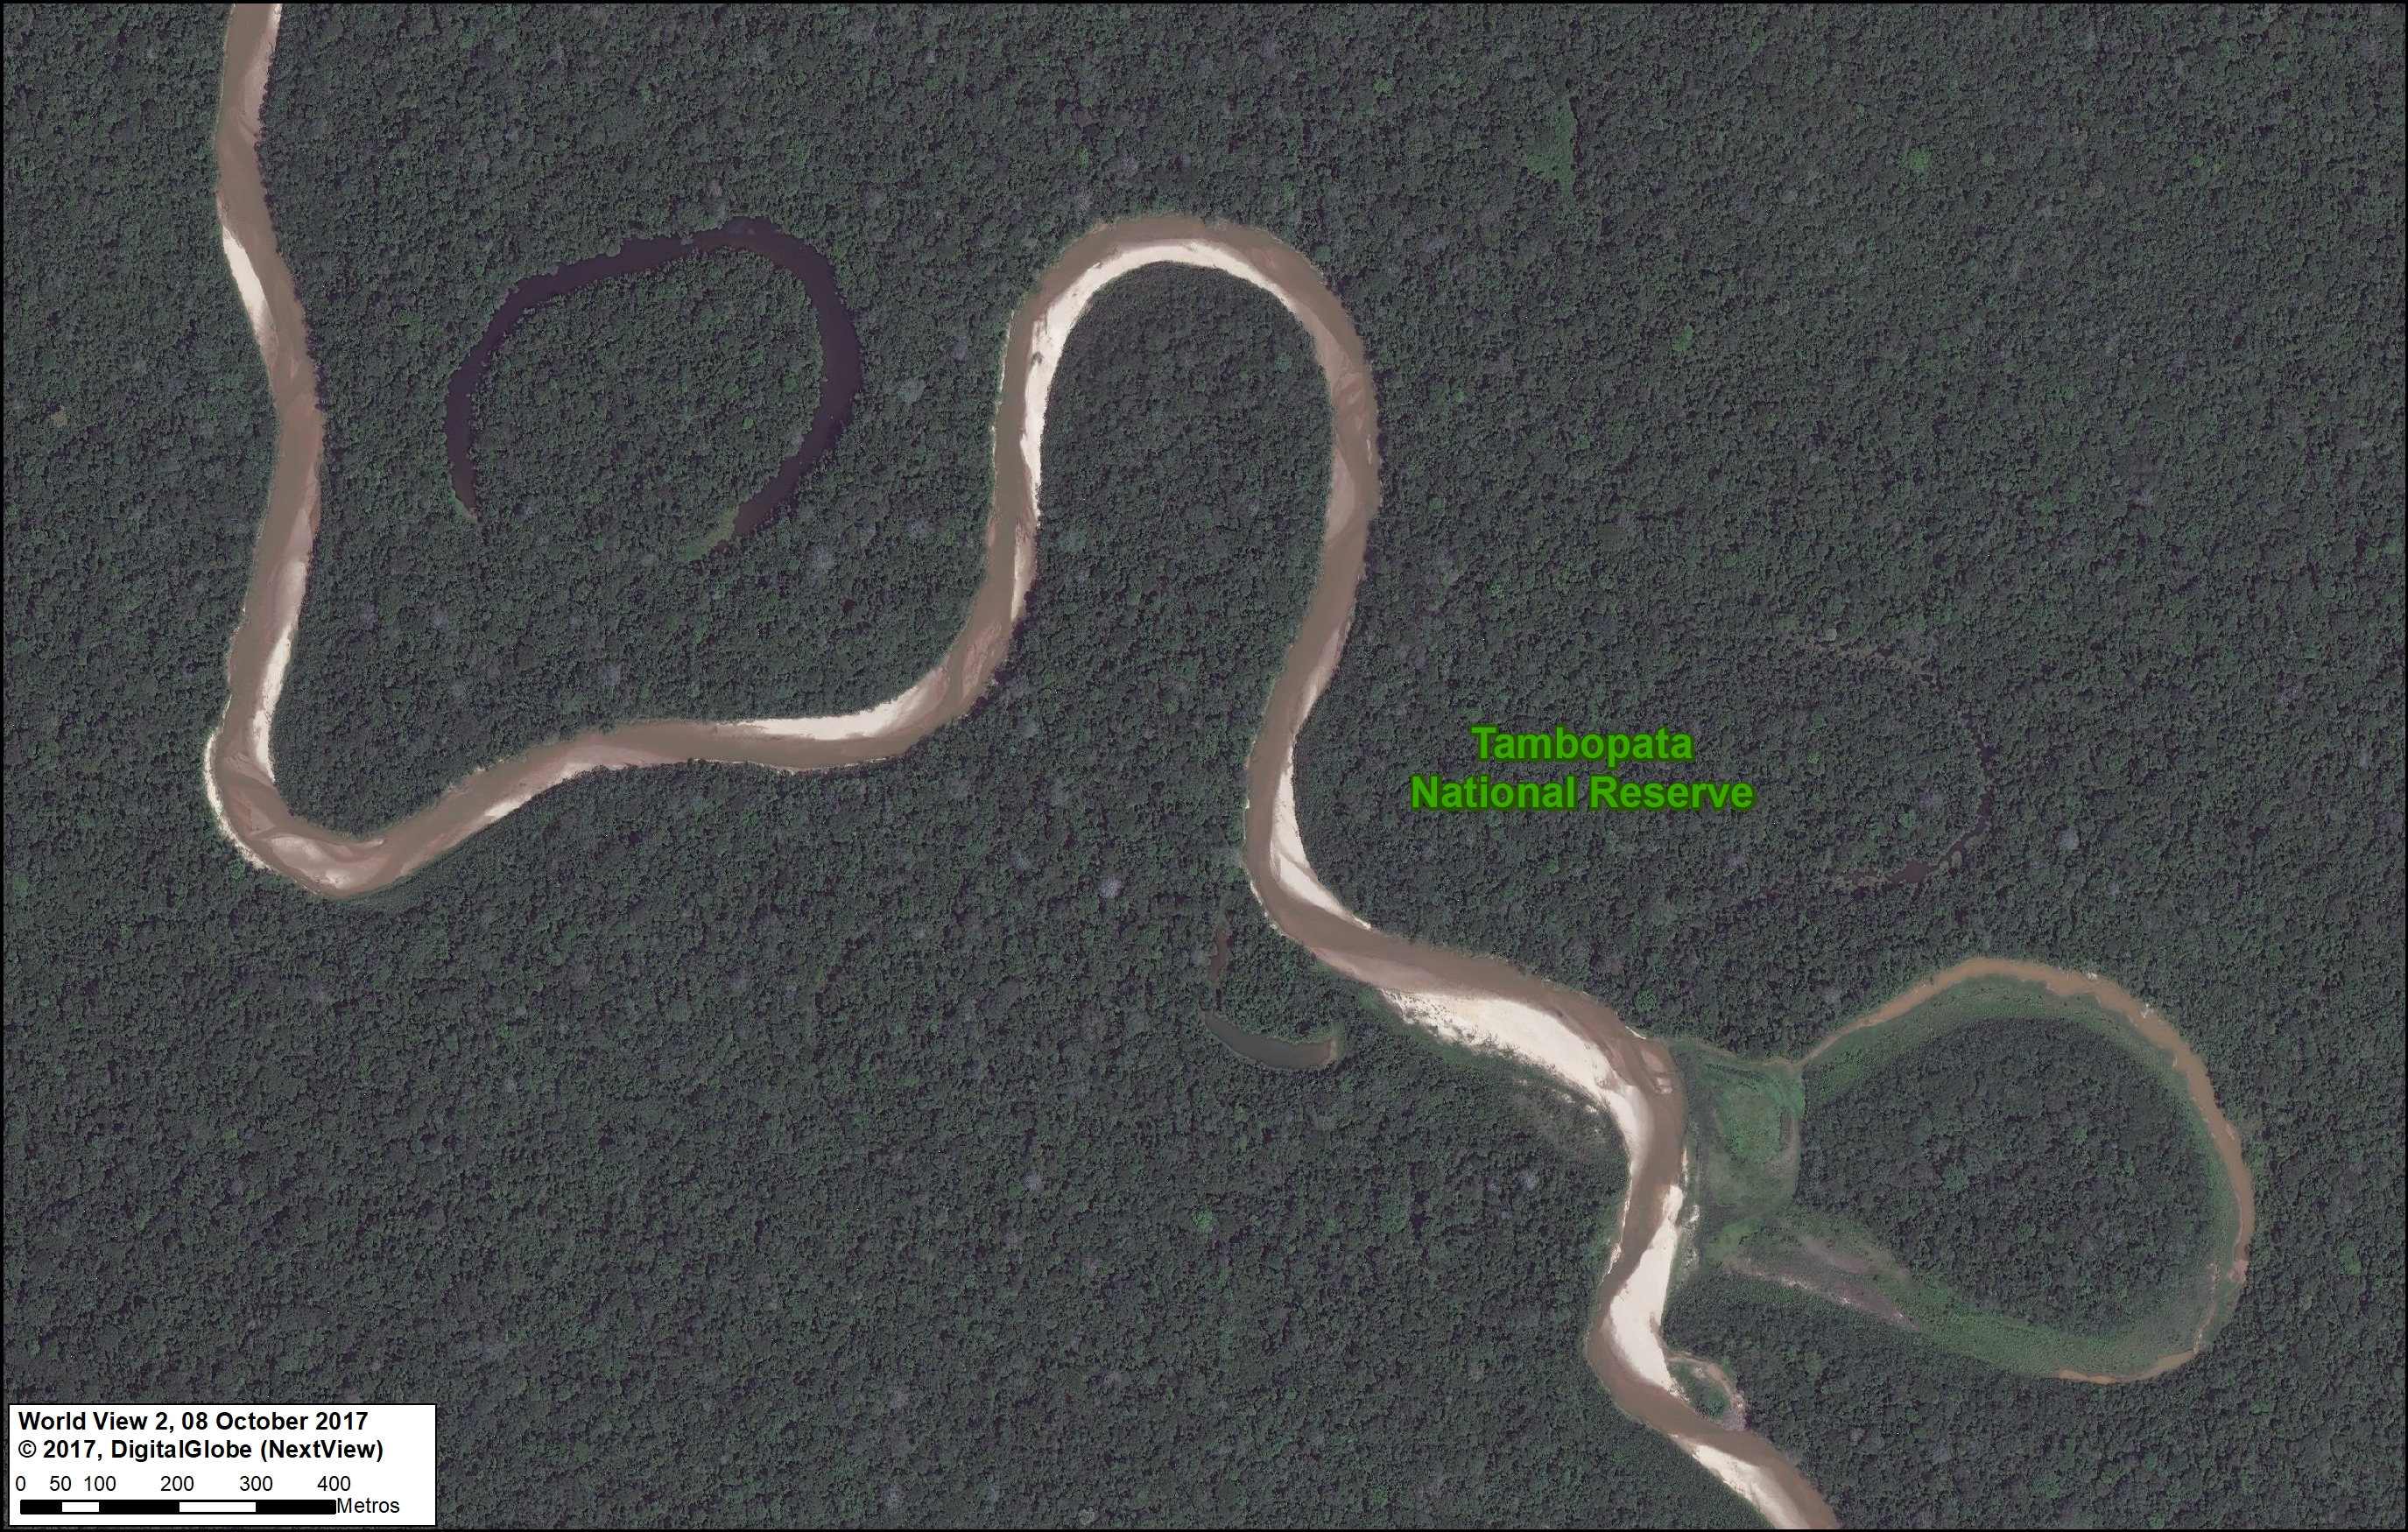
Tambopata National Reserve made headlines in 2015 due to an illegal gold mining invasion that has since been contained (MAAP #61). Fortunately, Tambopata, located in the southern Peruvian Amazon, is best known for its world-renowned biodiversity. Featured Image C shows a meandering tributary of the Tambopata River and the subsequent formation of oxbow lakes.
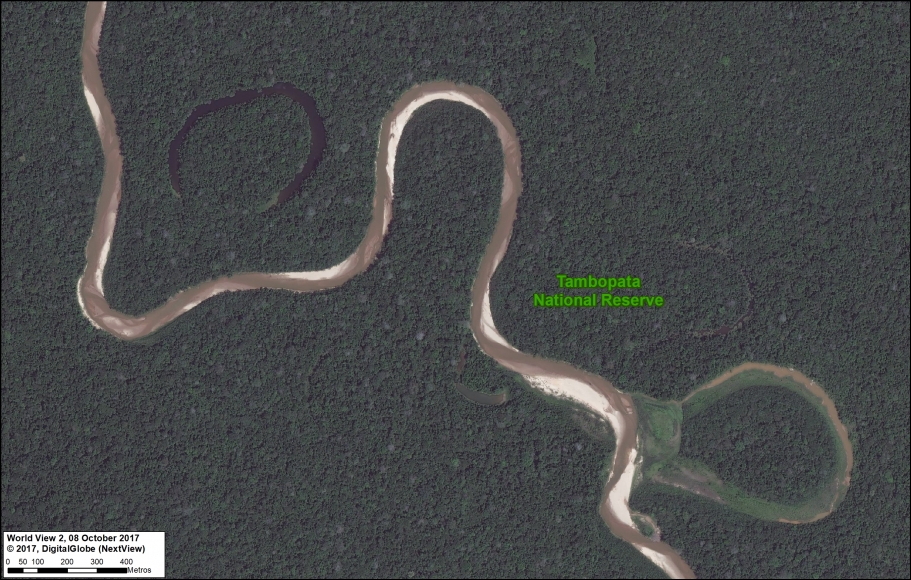
Image C. Reserva Nacional Tambopata. Data: DigitalGlobe (Nextview)

D. Amarakaeri Communal Reserve (Madre de Dios)

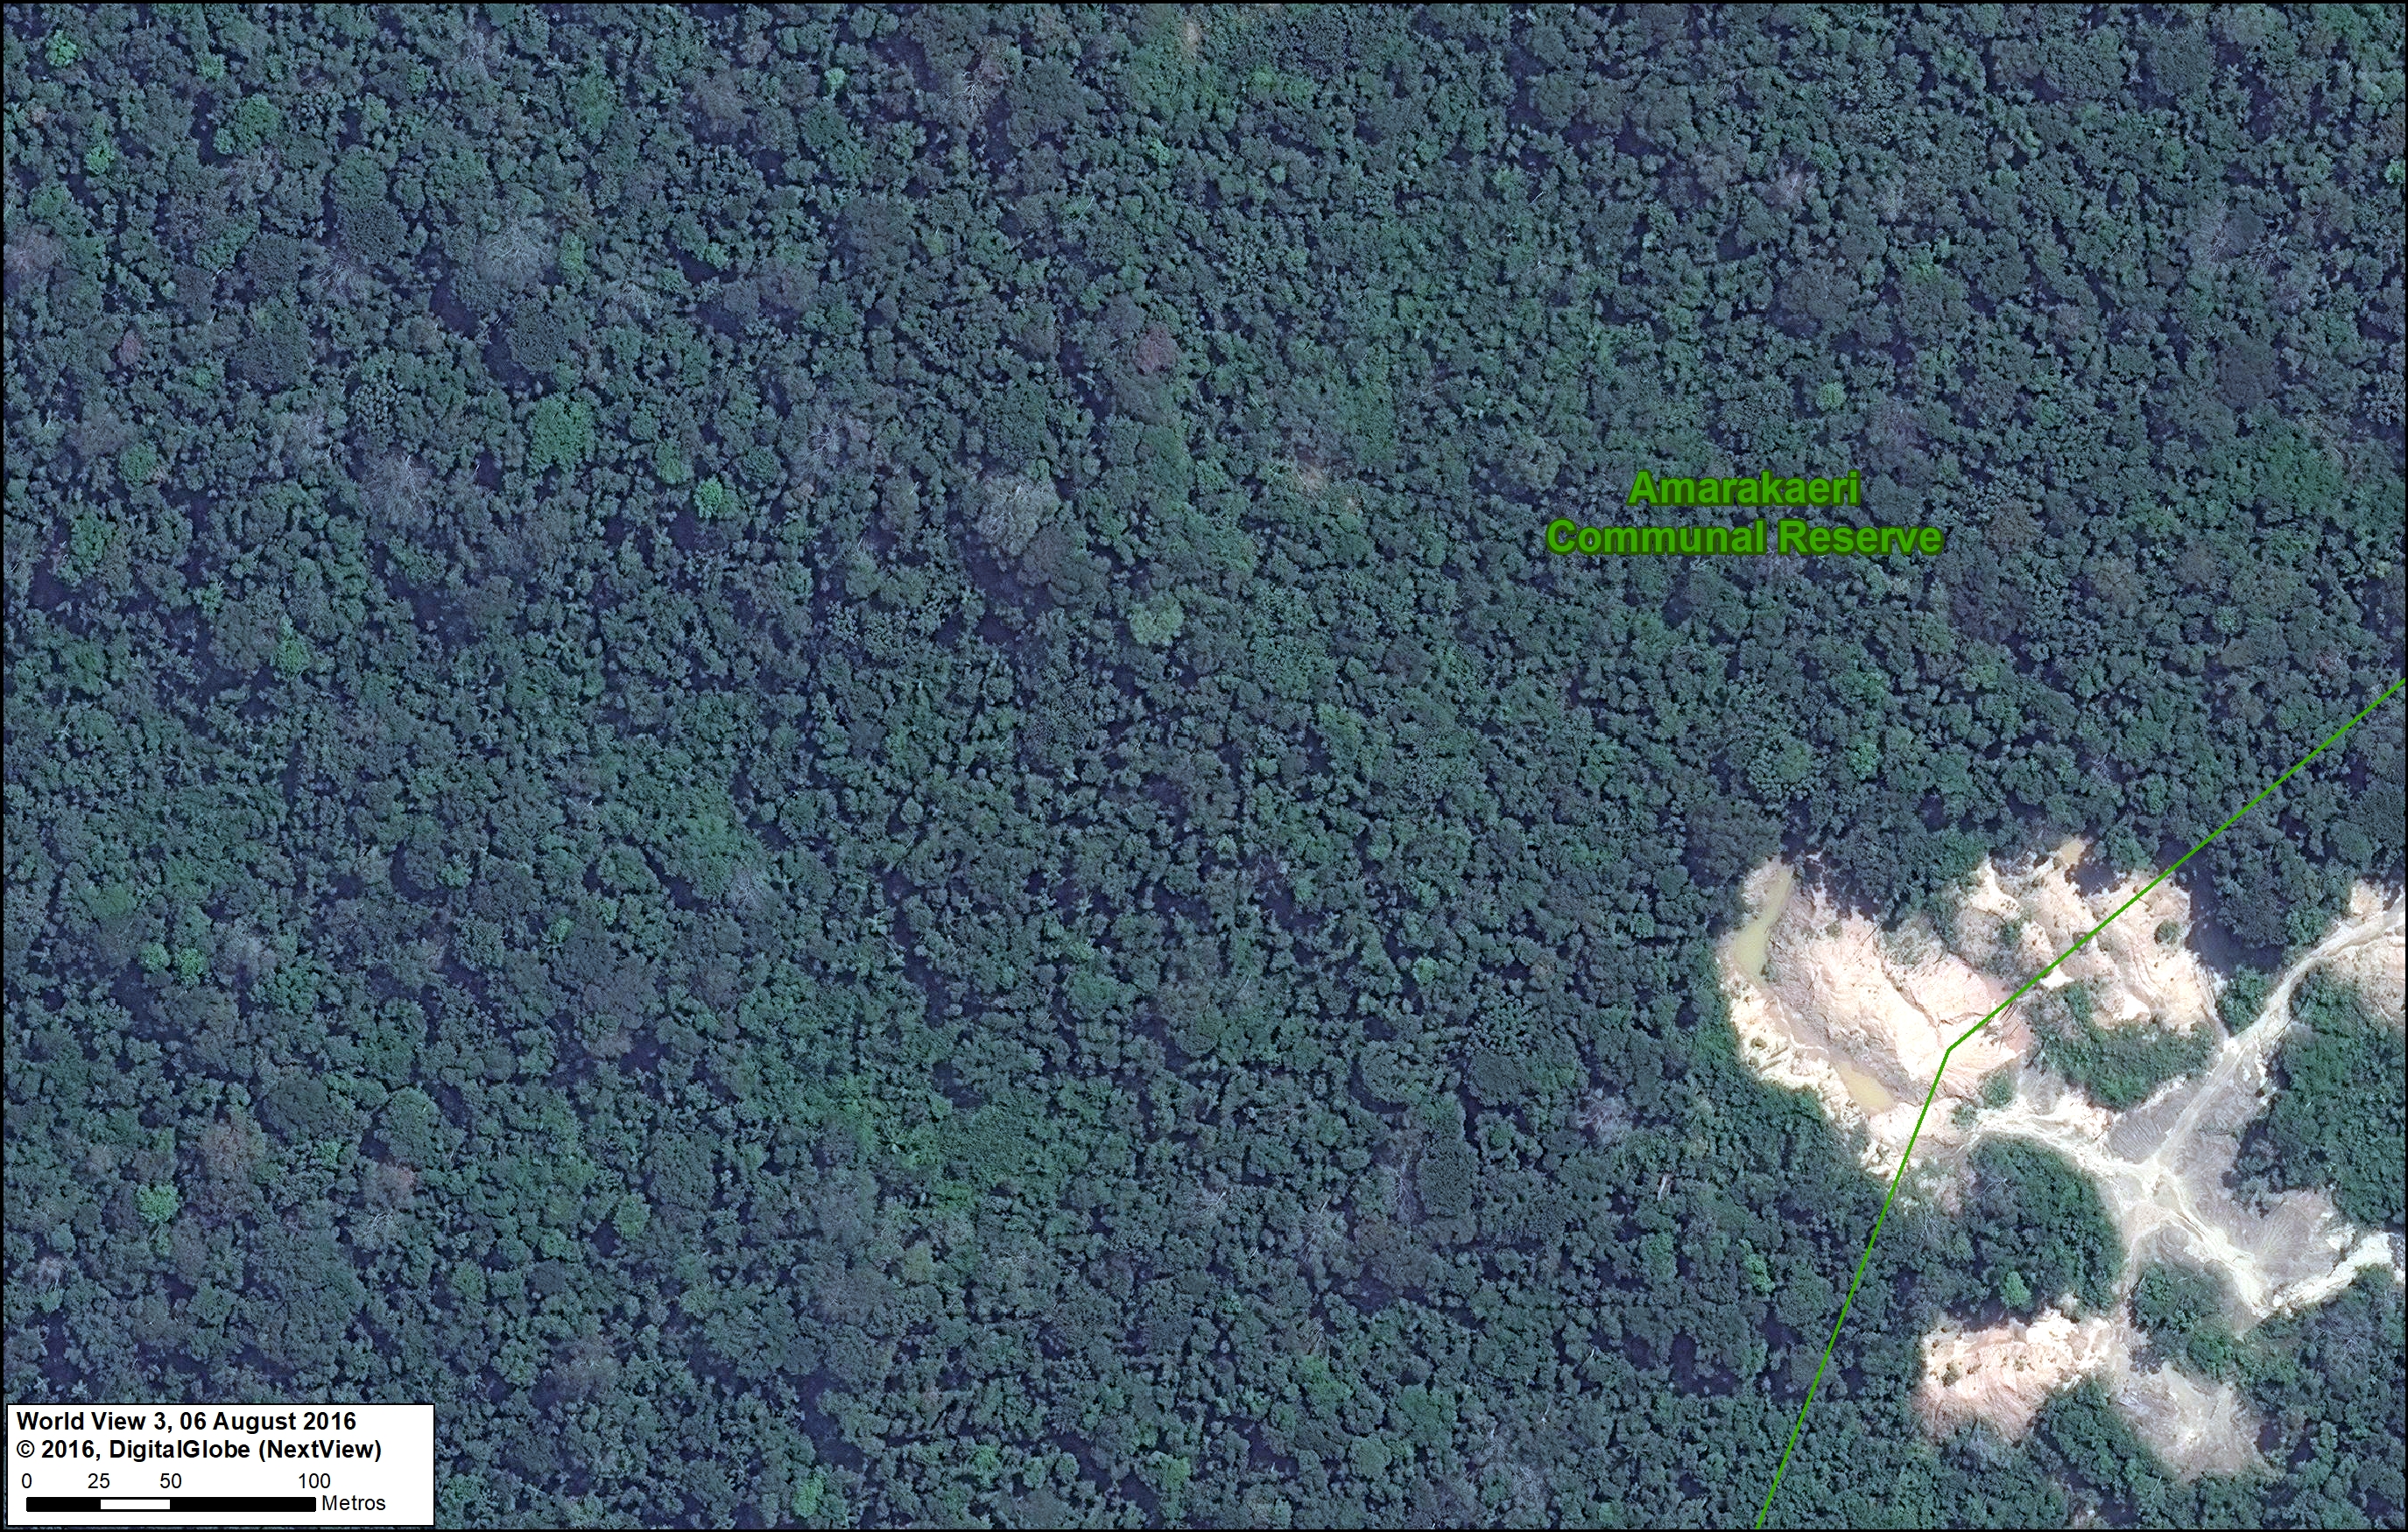
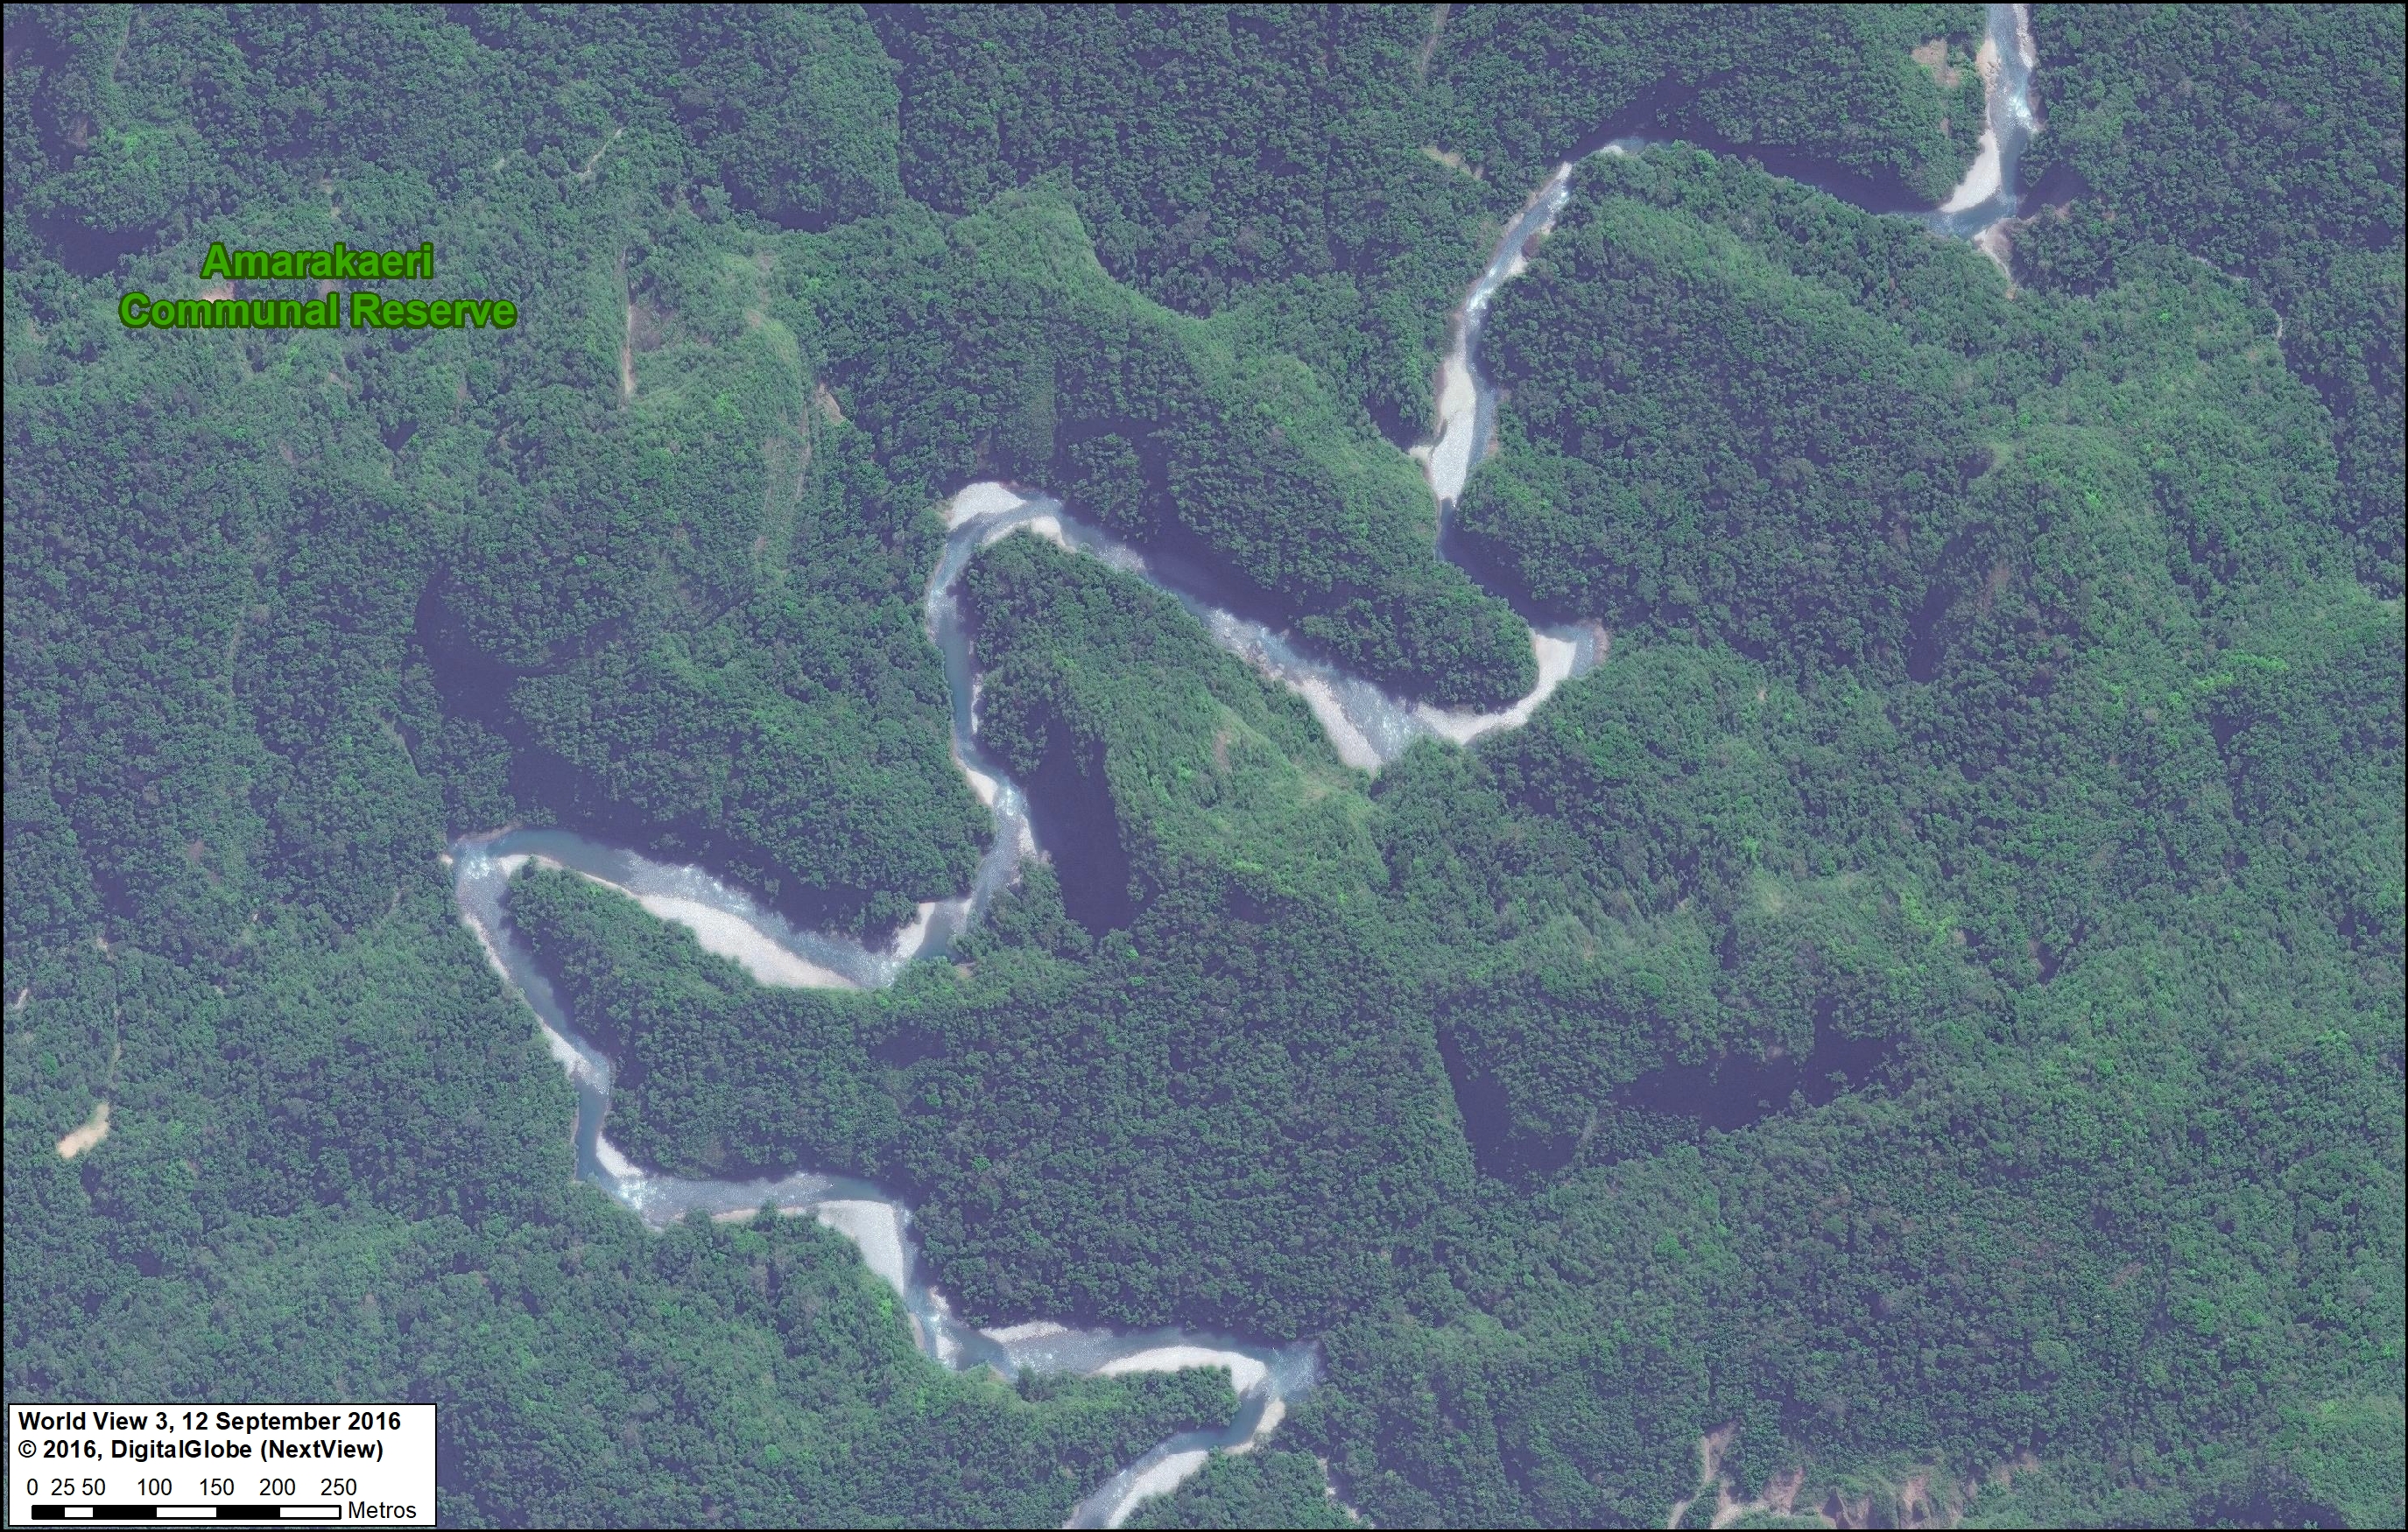
Amarakaeri Communal Reserve is an important protected area in the southern Peruvian Amazon that is jointly managed by indigenous communities (ECA Amarakaeri) and the national protected areas agency (SERNANP). Featured Image D shows a wild river winding through the rugged foothills of the southern portion of the reserve.
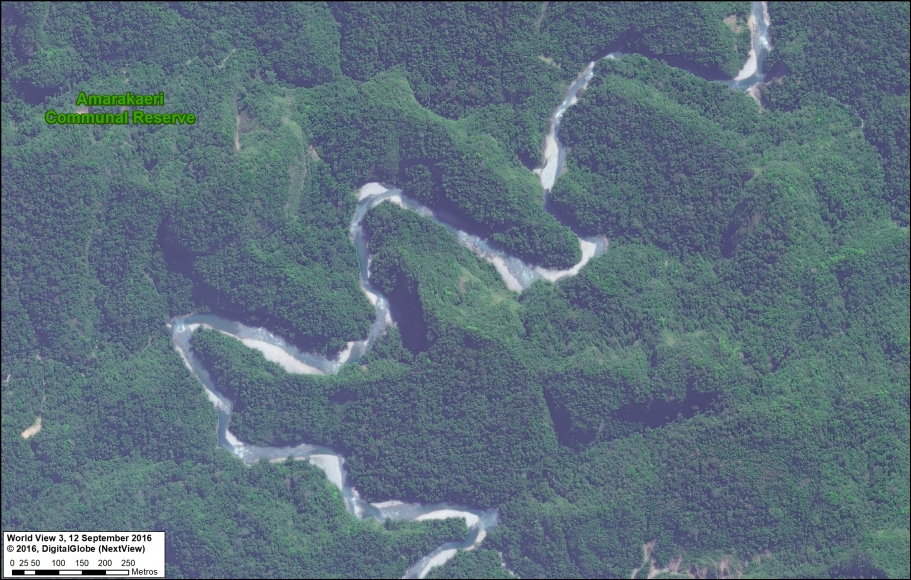
Image D. Reserva Comunal Amarakaeri. Data: DigitalGlobe (Nextview), SERNANP

E. Manu National Park (Cusco sector)

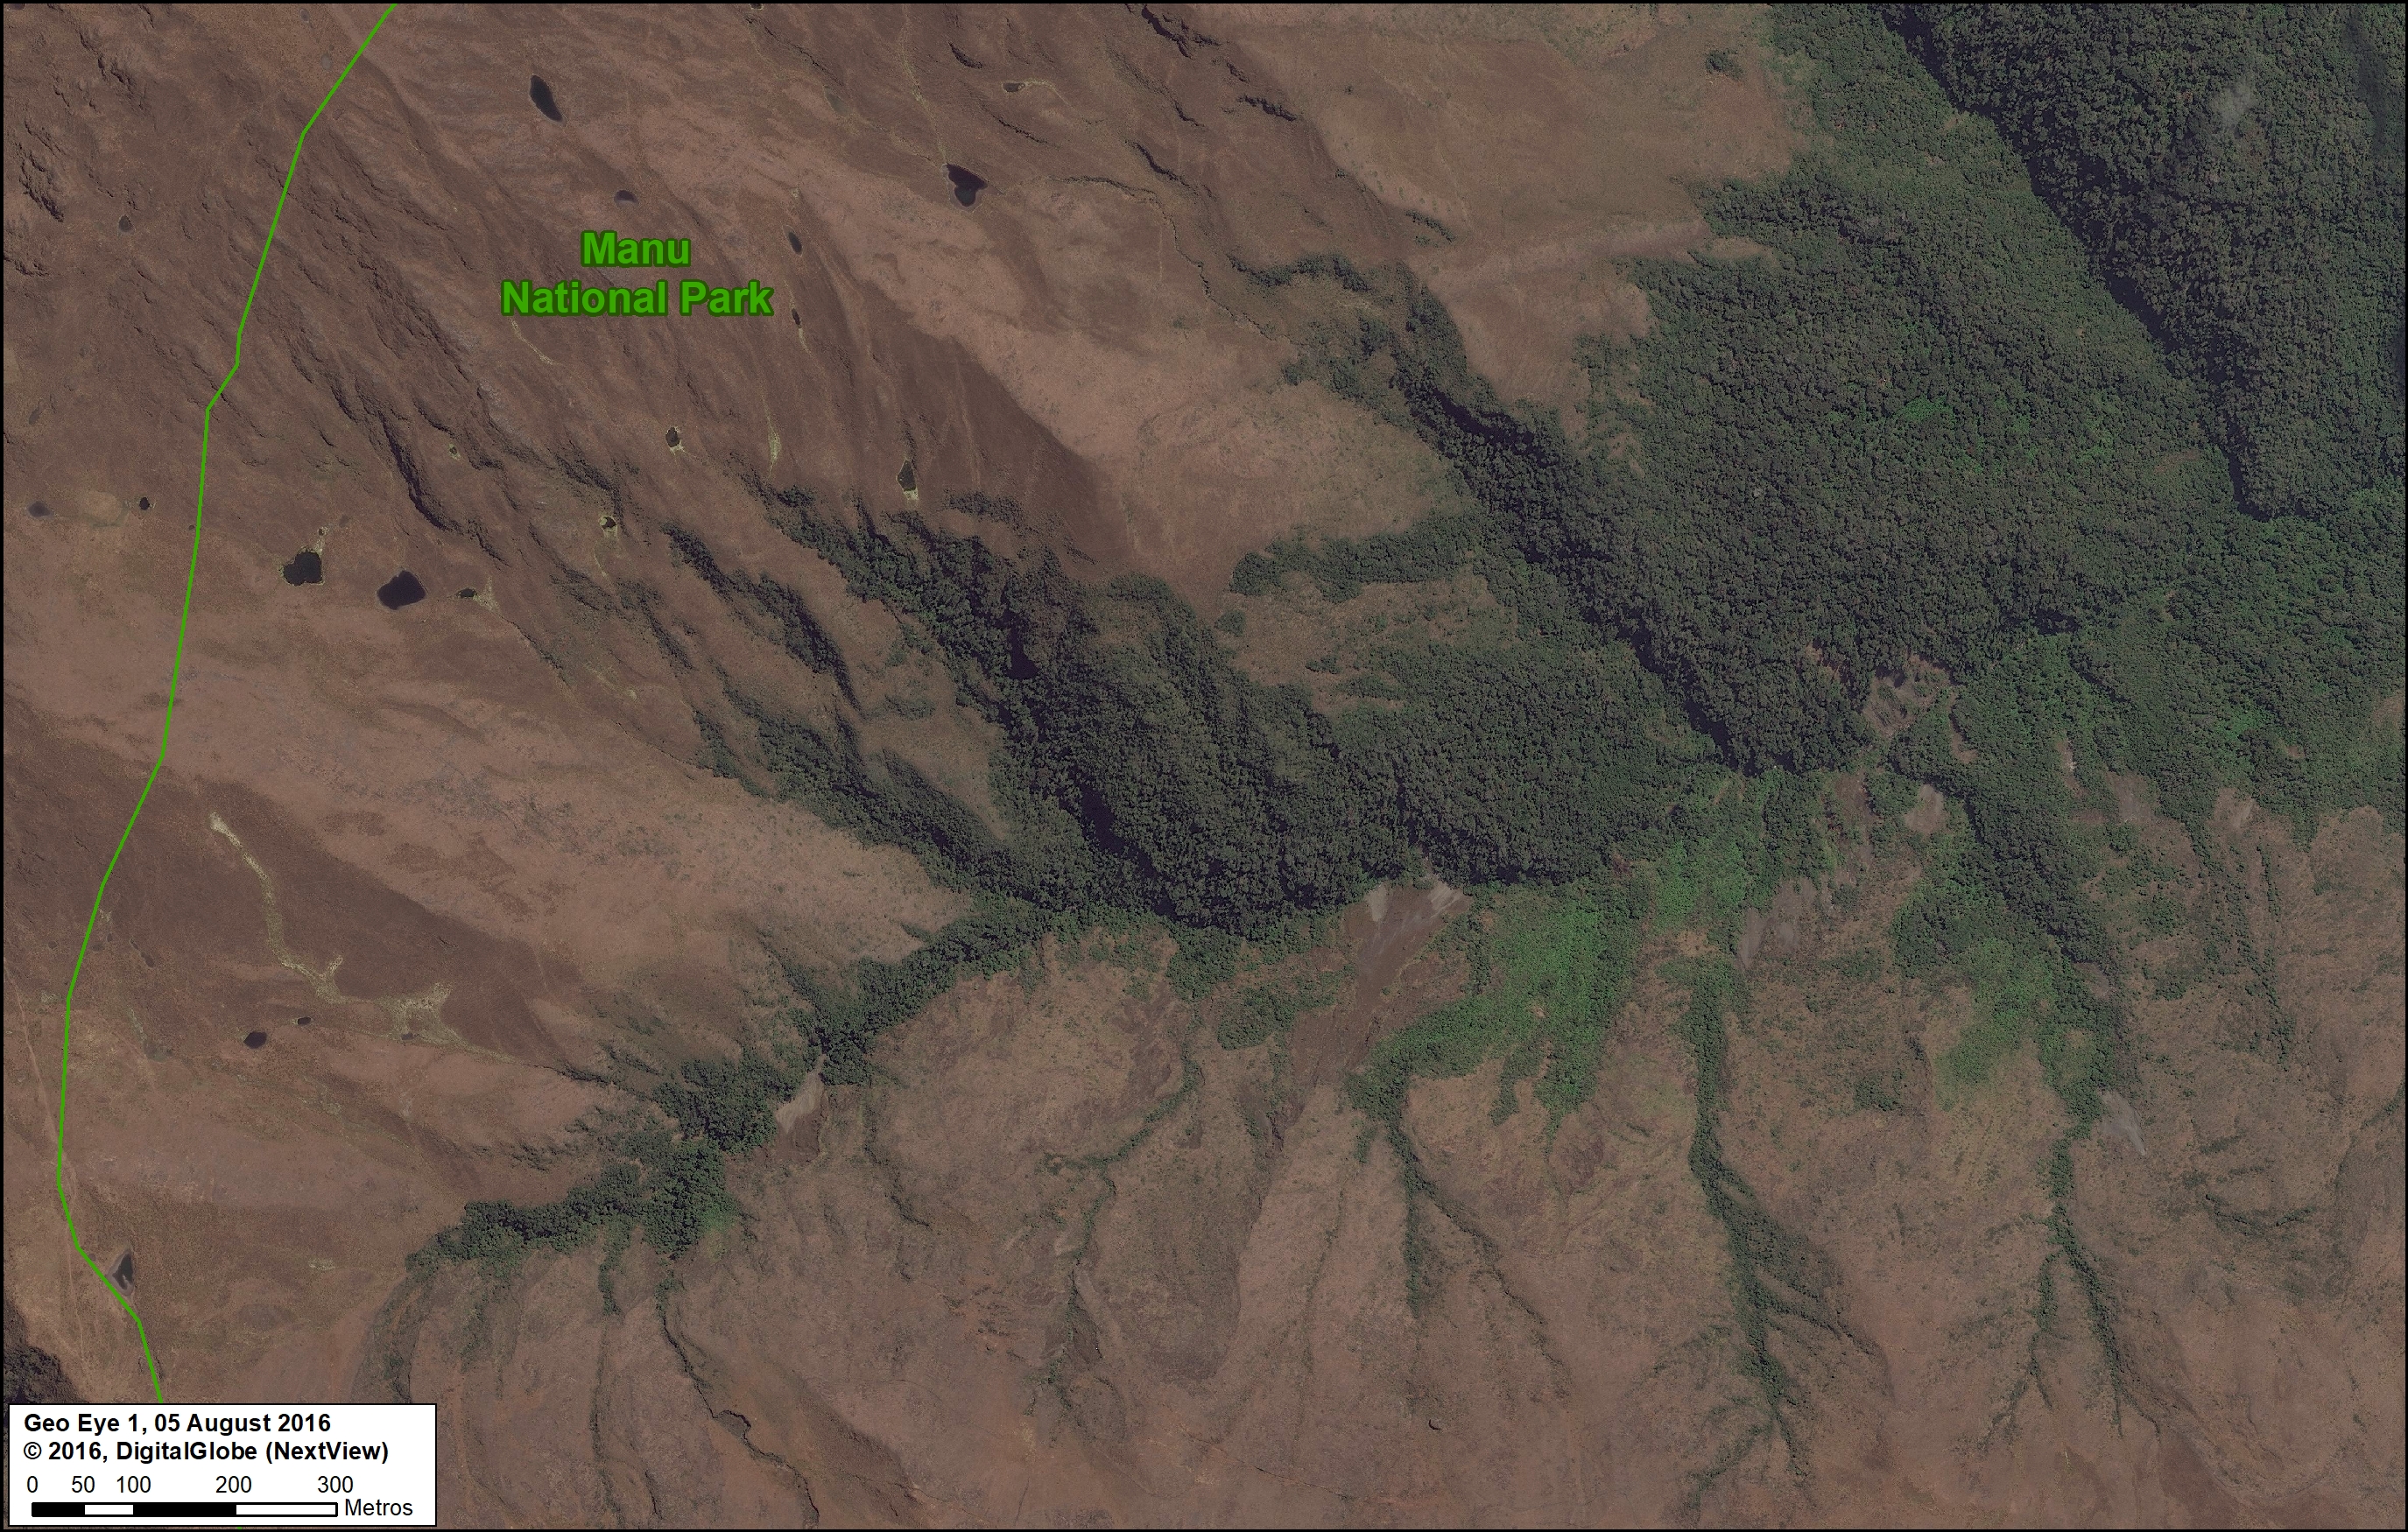
Manu is one of the most famous national parks in the world, known for its diversity of habitats in the southern Peruvian Amazon, including lowland rainforest. Featured Image E shows the other extreme, the highlands and the transition beyond treeline to an ecosystem known as puna. Interestingly, this image shown an example of the upper-most headwaters where Amazonian rivers are born.
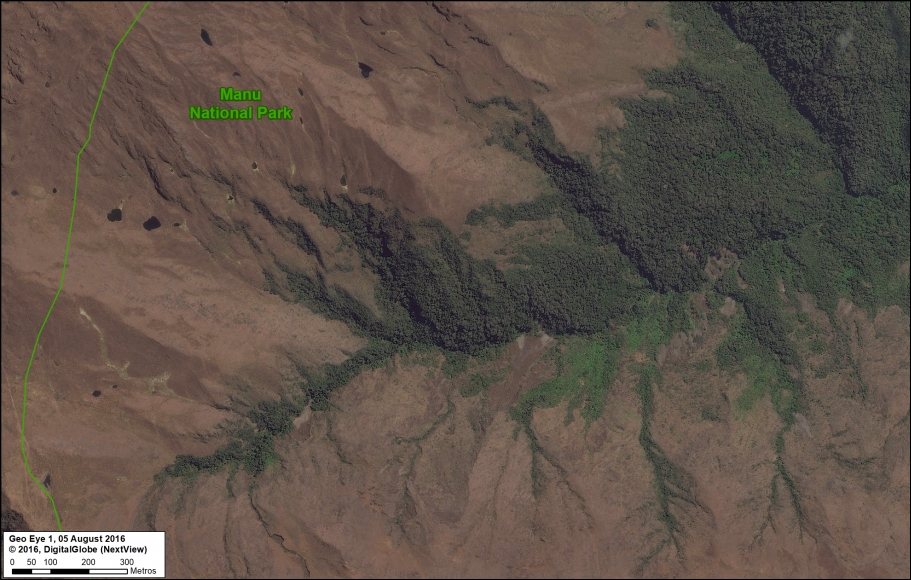
Image E. Parque Nacional Manu. Data: DigitalGlobe (Nextview), SERNANP

F. Regional Conservation Area Choquequirao (Cusco)

Choquequirao, one of the first examples of a regional conservation area in southern Peru, is located next to Machu Picchu. Featured Image F shows a high-elevation scene in the heart of the reserve, near the mountain peak known as Nevado Sacsarayoc.
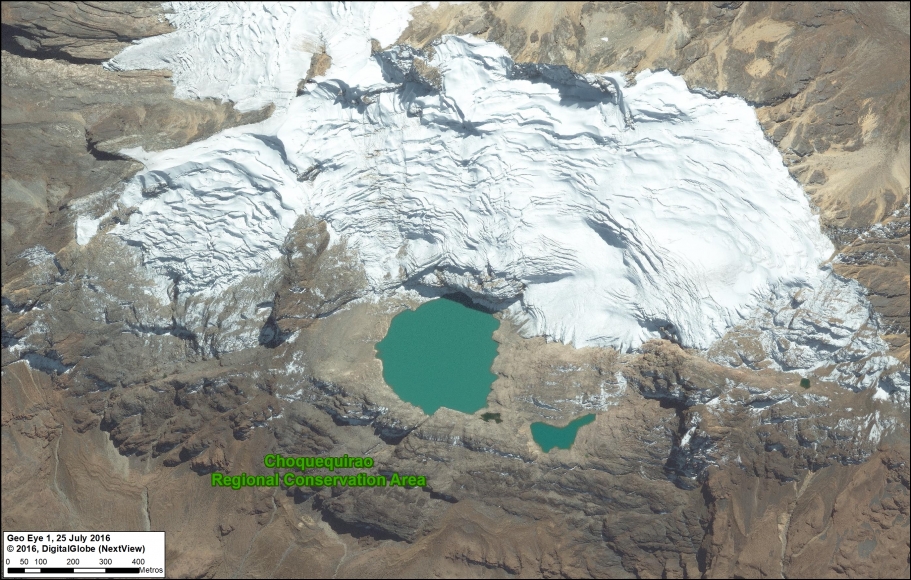
Image F. Choquequirao. Data: DigitalGlobe (Nextview)

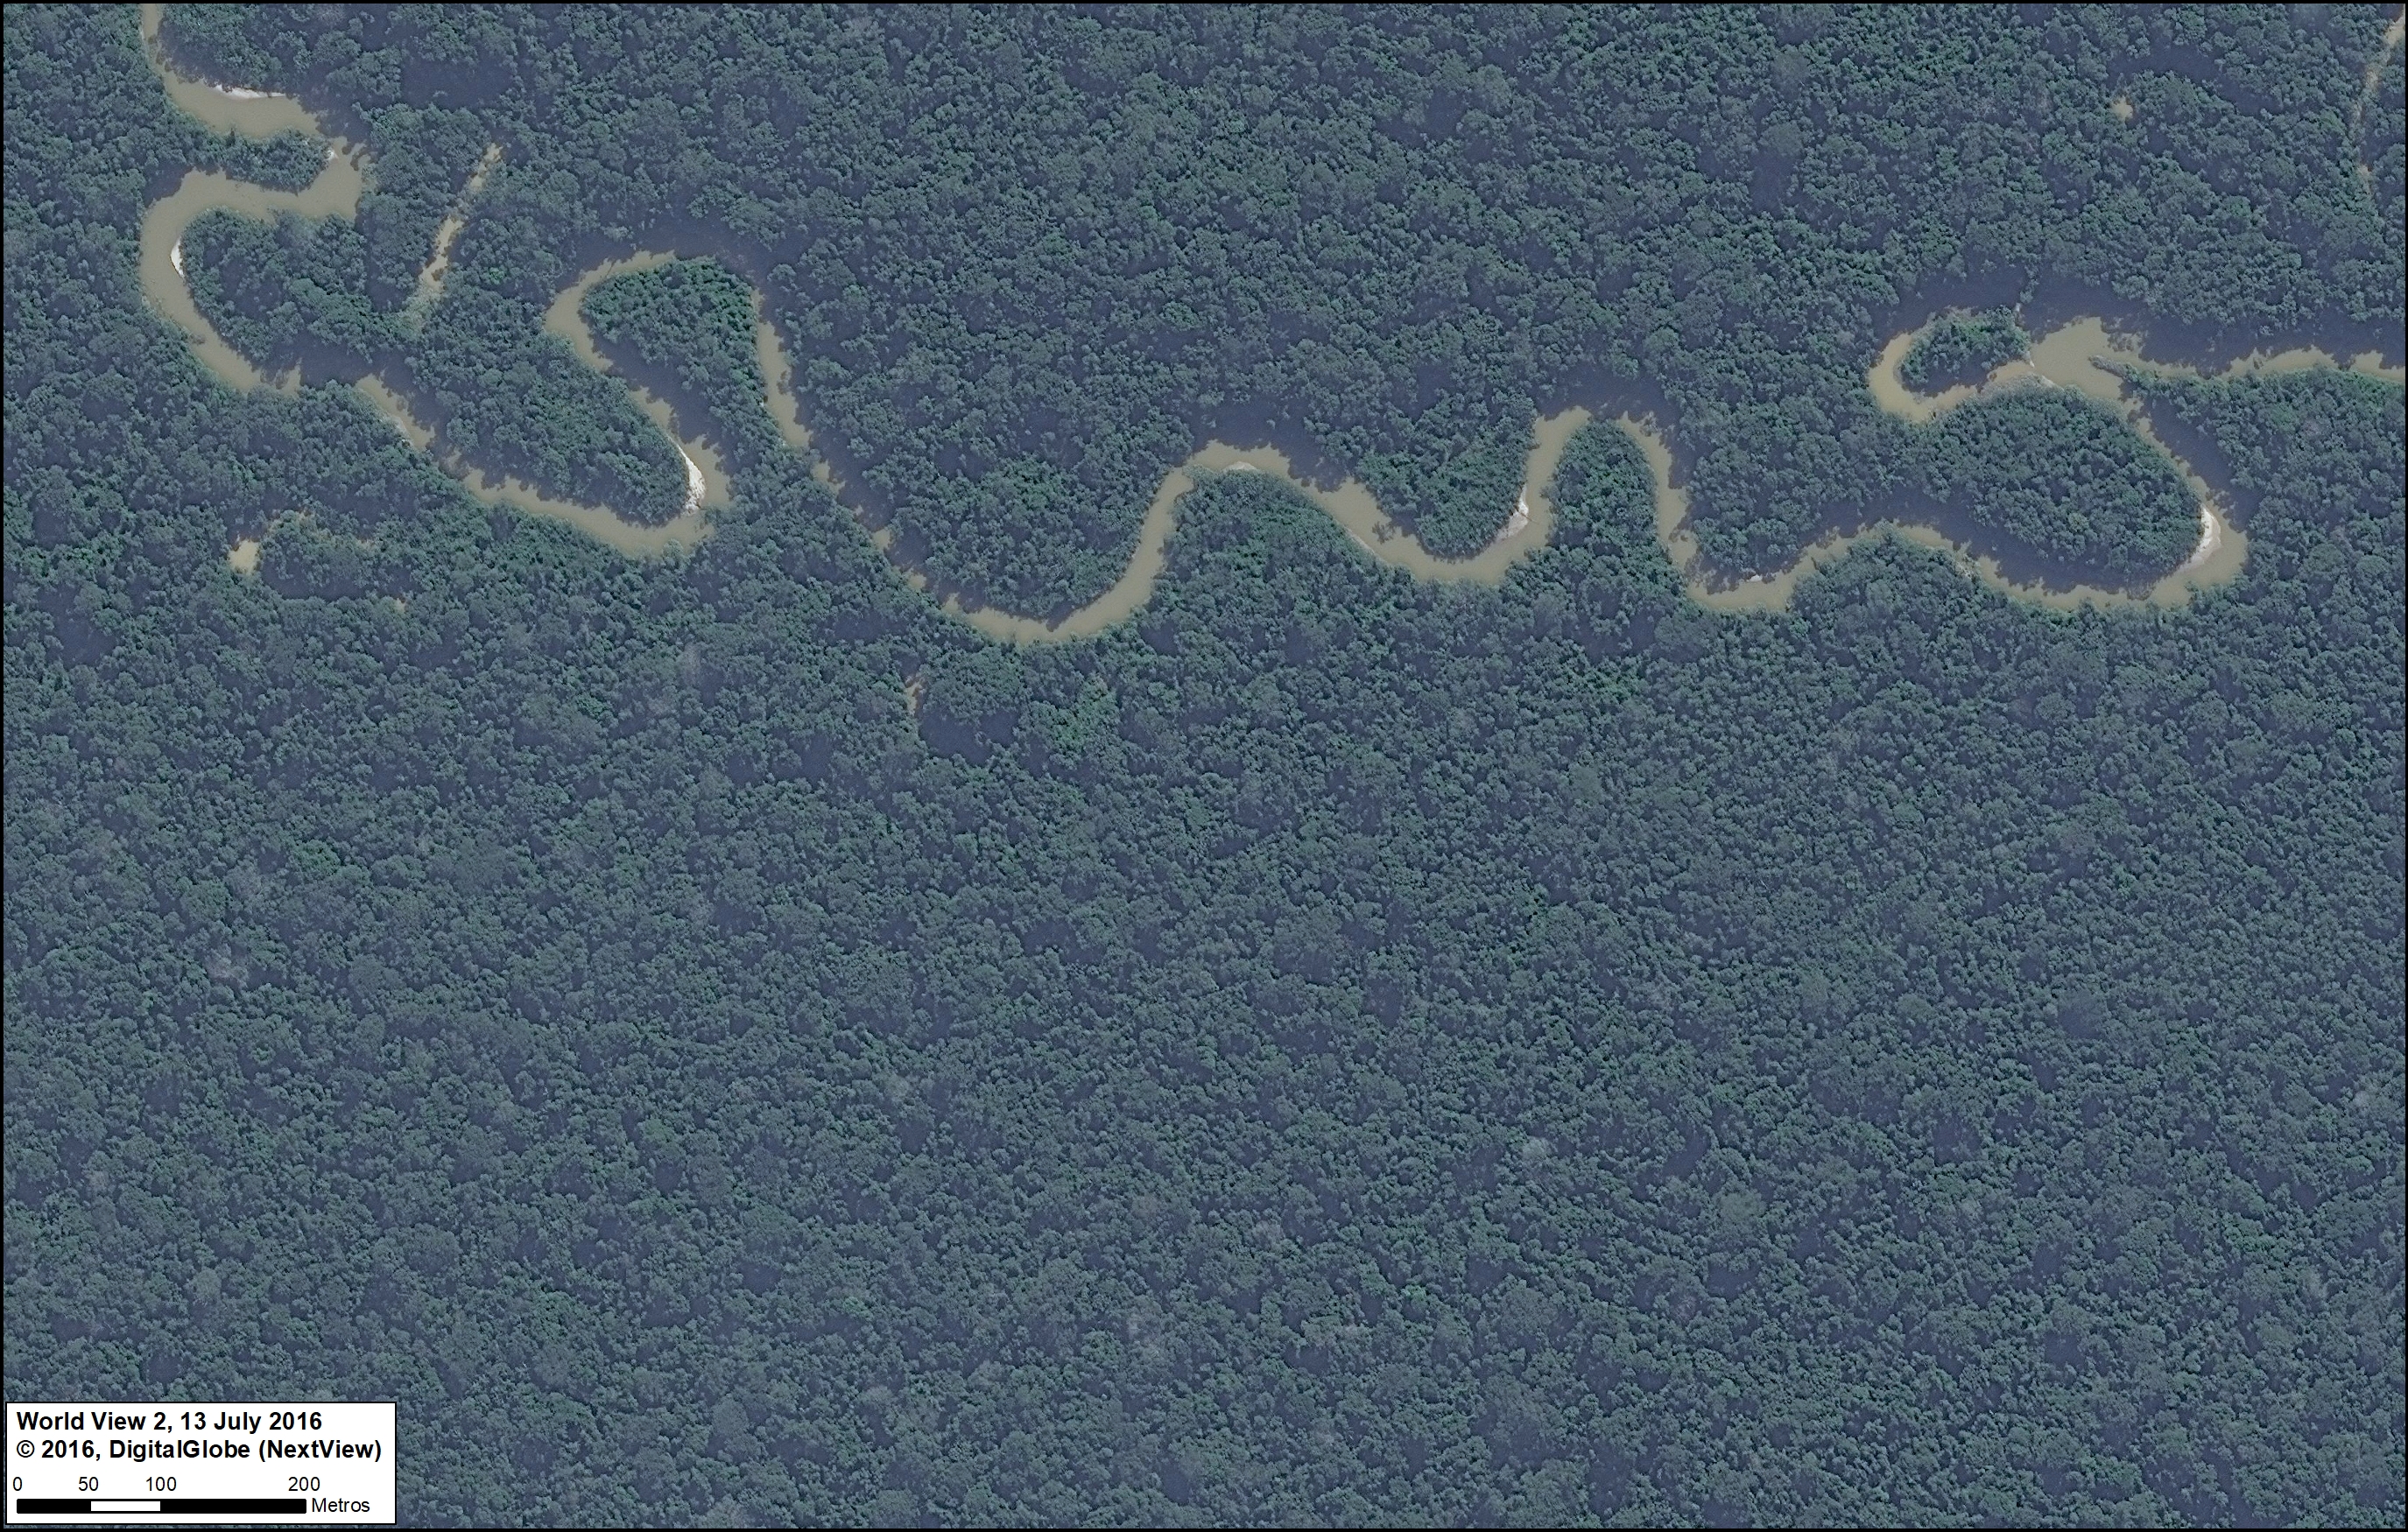
G. Los Amigos Conservation Concession (Madre de Dios)

It’s not technically a protected area, but a forestry concession in the southern Peruvian Amazon. In fact, Los Amigos is the first private conservation concession in the world. Featured Image G shows the meandering course of a tributary of the Los Amigos river, and the surrounding primary forest, deep in the concession.
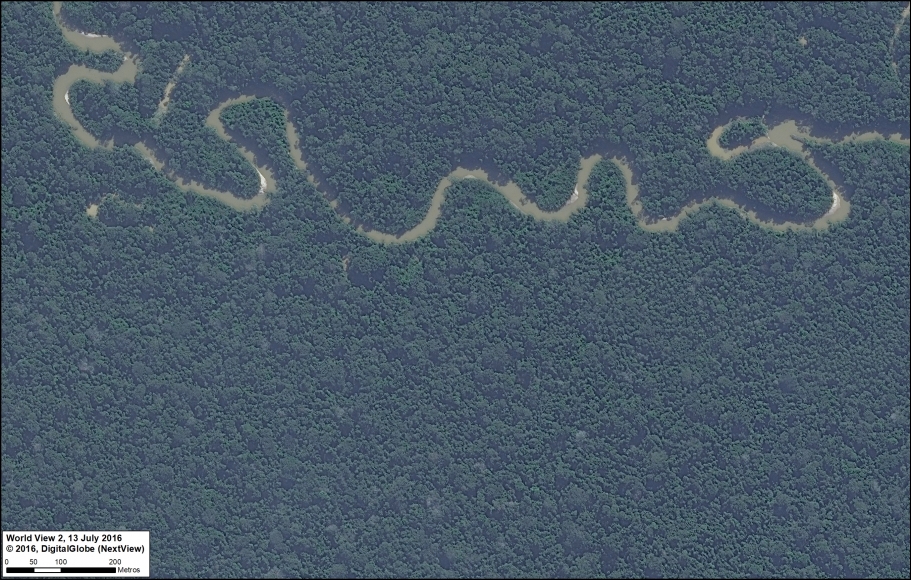
Image G. Los Amigos. Data: DigitalGlobe (Nextview)

Threatened Areas

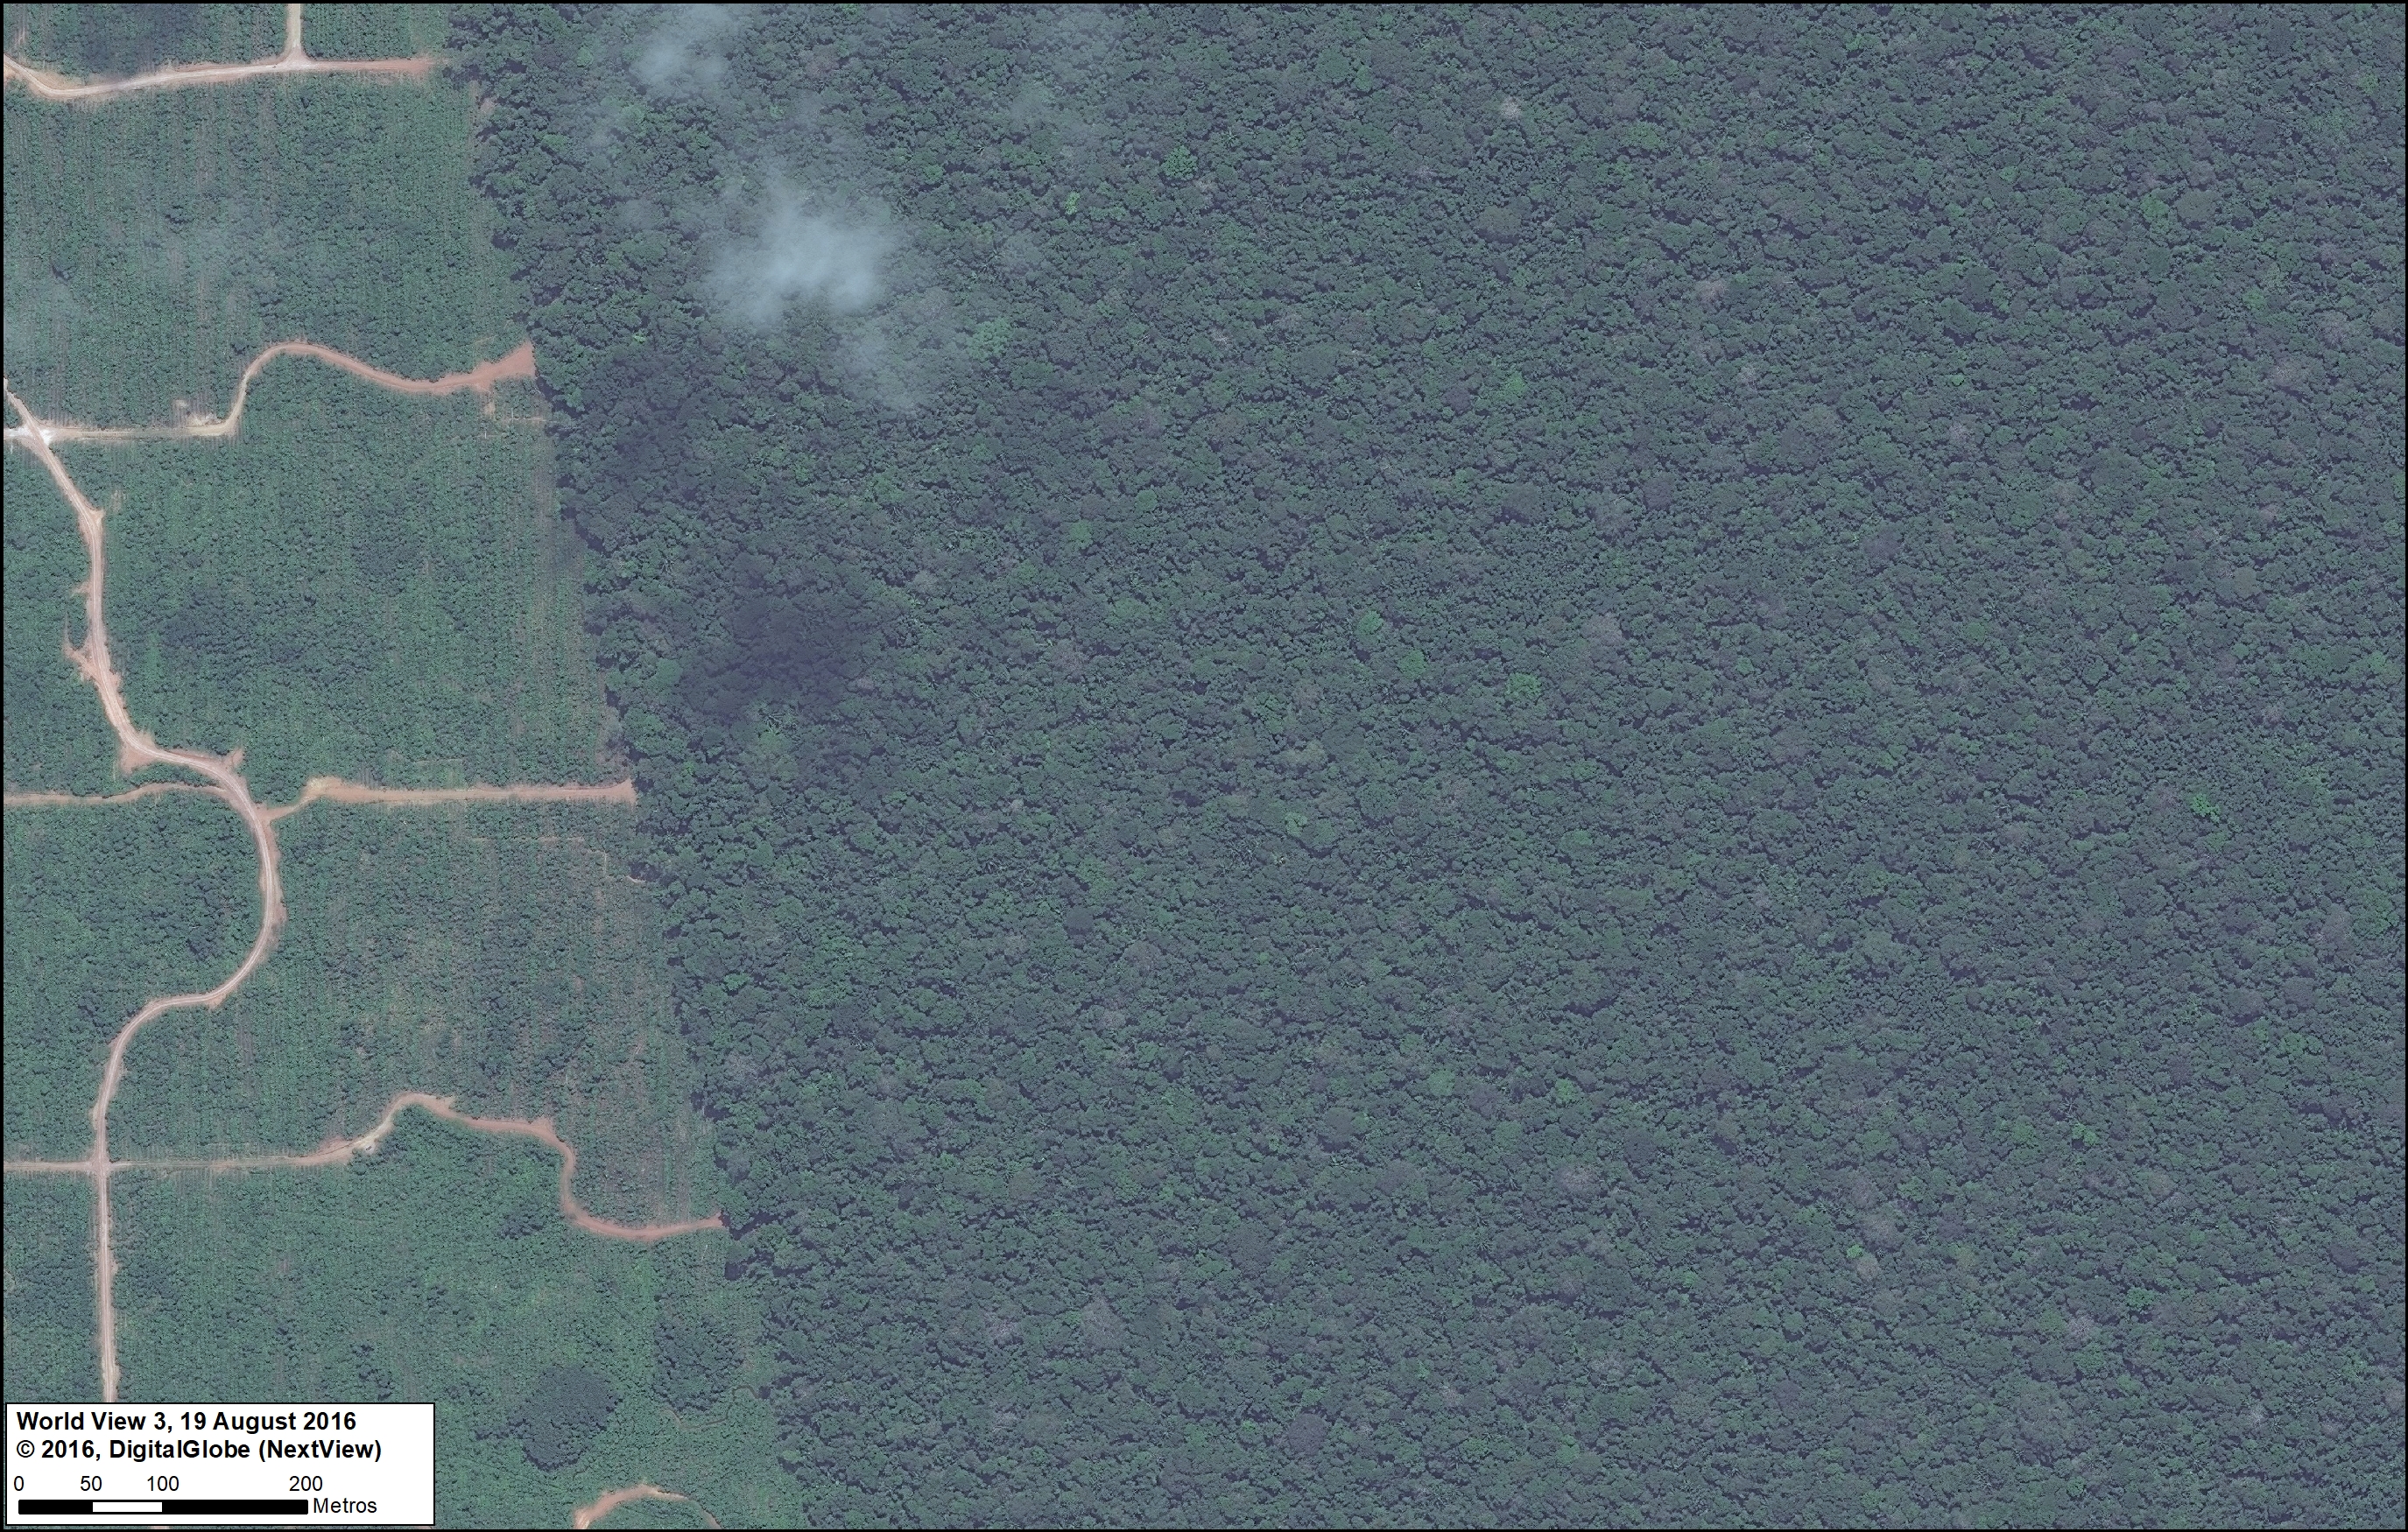
H. Tamshiyacu (Loreto)

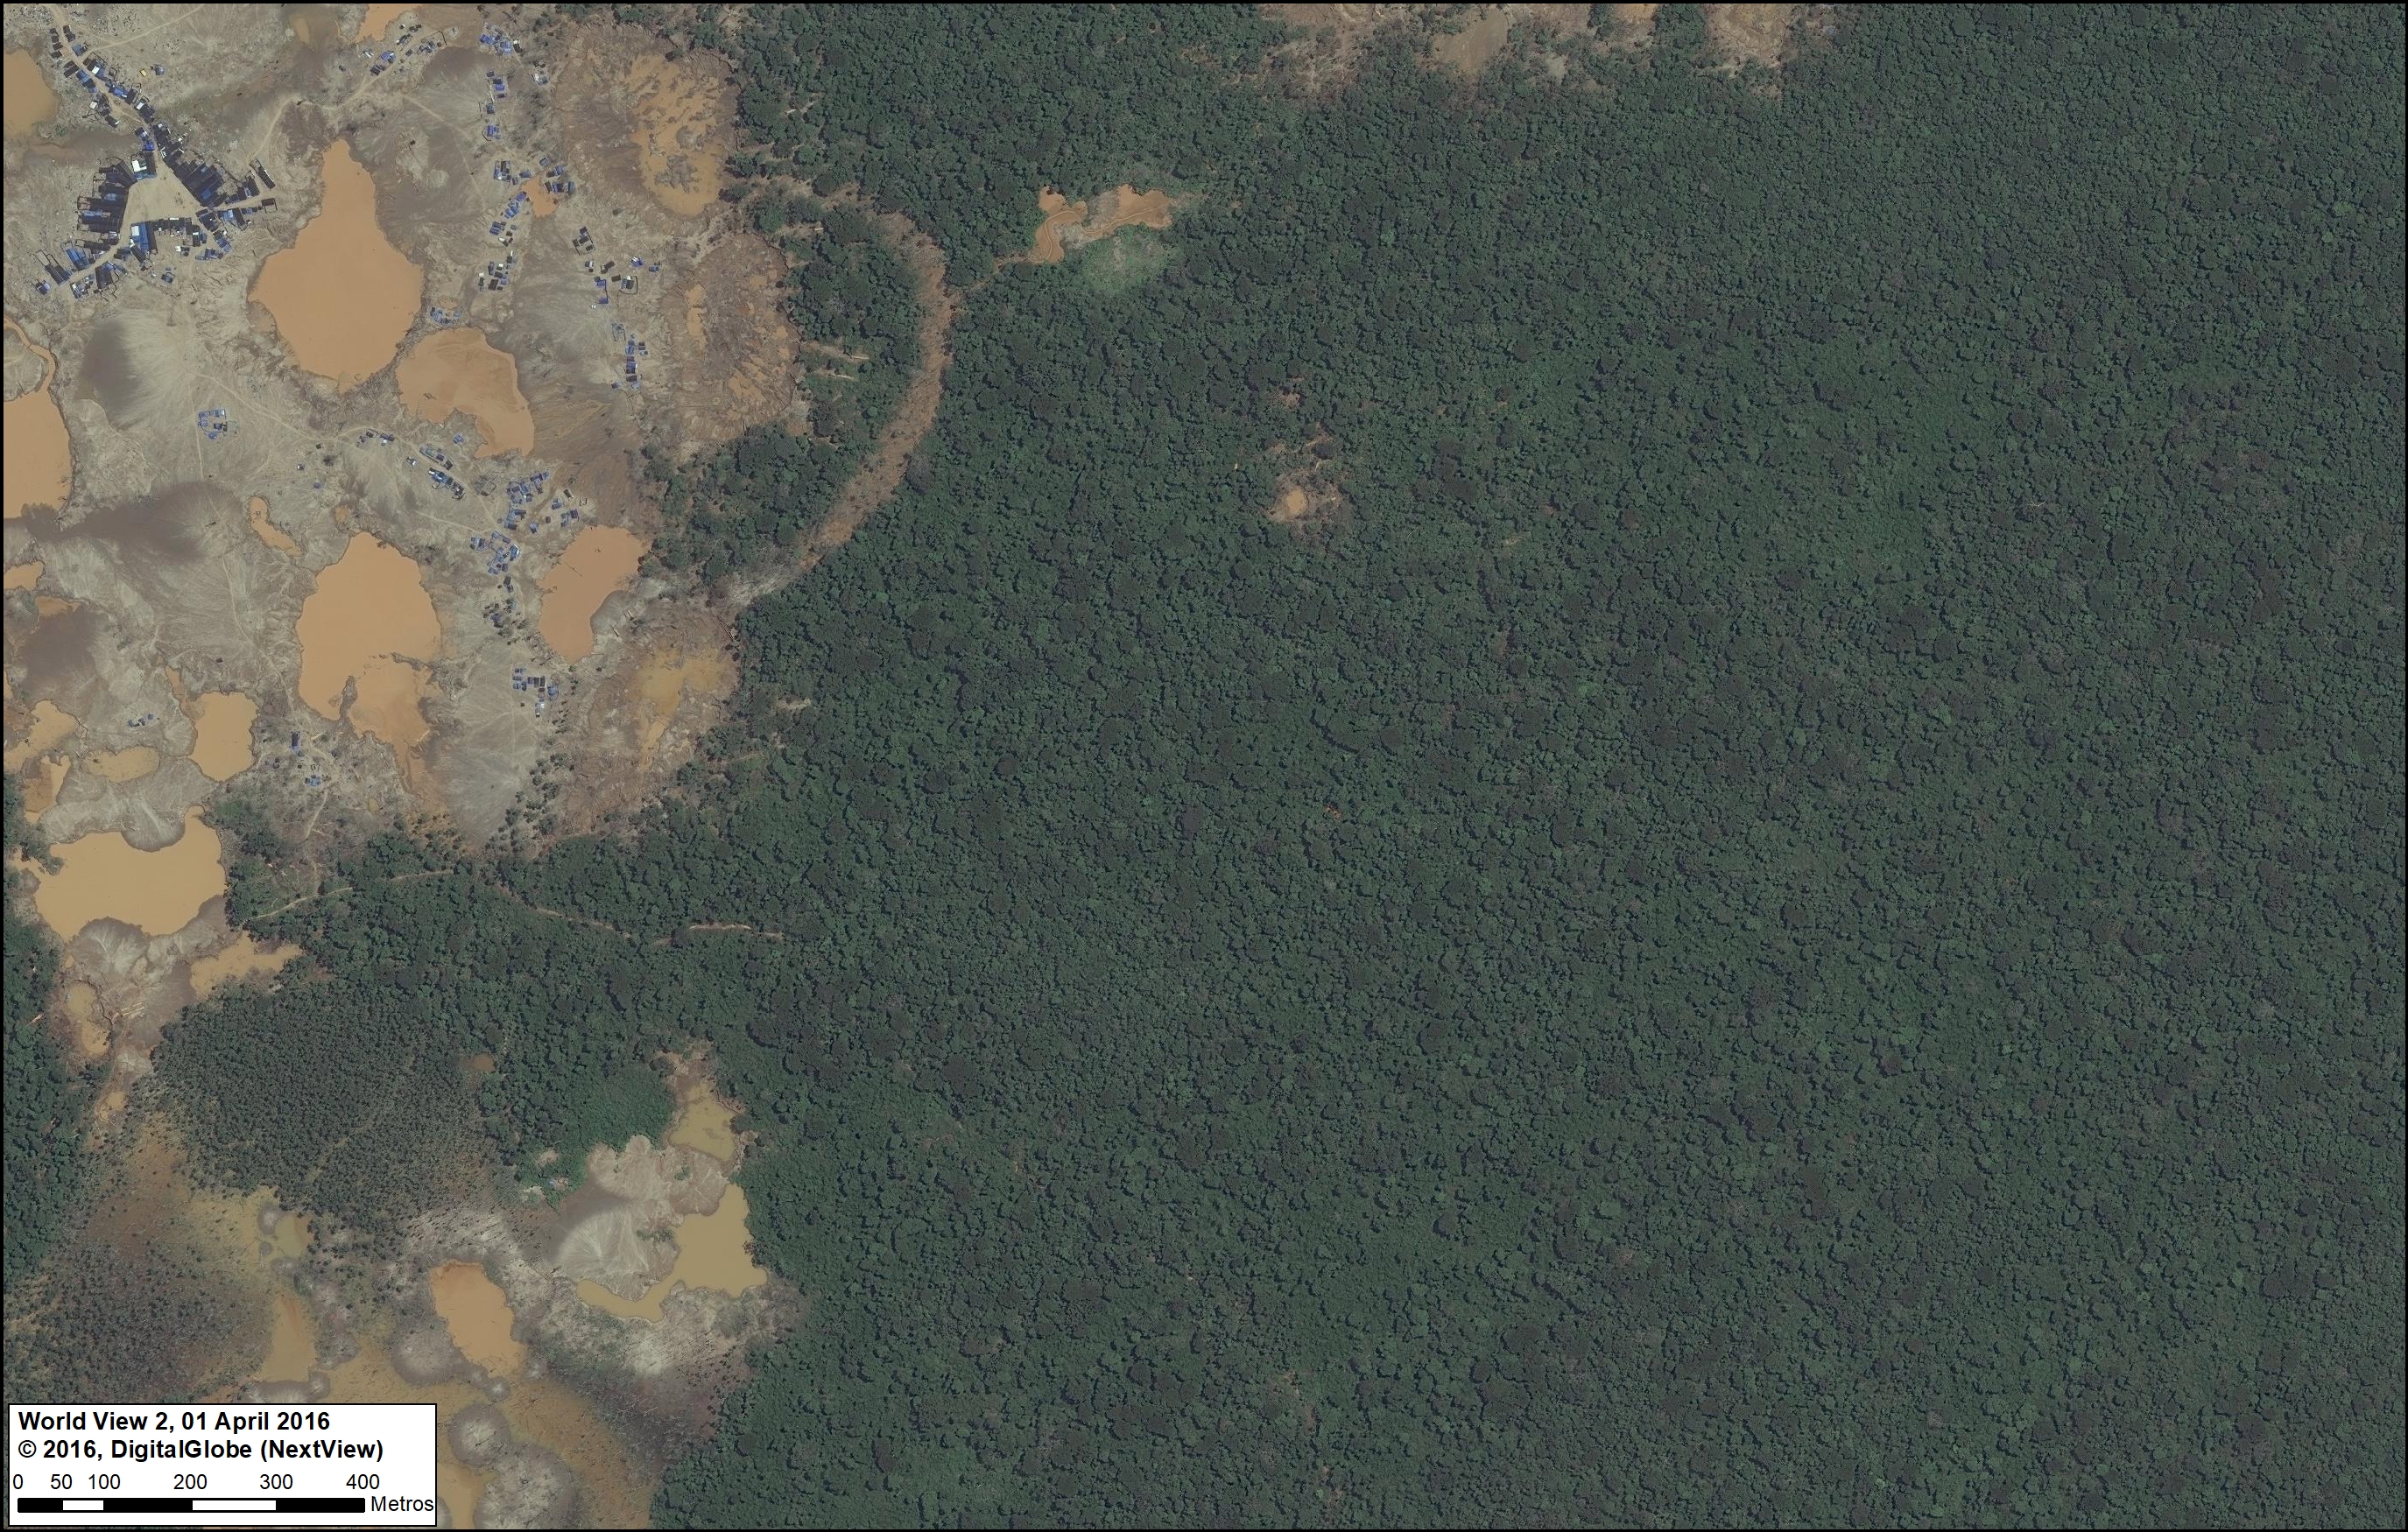
The company United Cacao clearcut 5,880 acres of primary forest near the town of Tamshiycacu in the northern Peruvian Amazon between 2013 and 2015 (MAAP #35). Featured Image H shows the abrupt transition between plantation and primary forest at the eastern end of the project area, where plans exist to expand for more large-scale cacao operations.
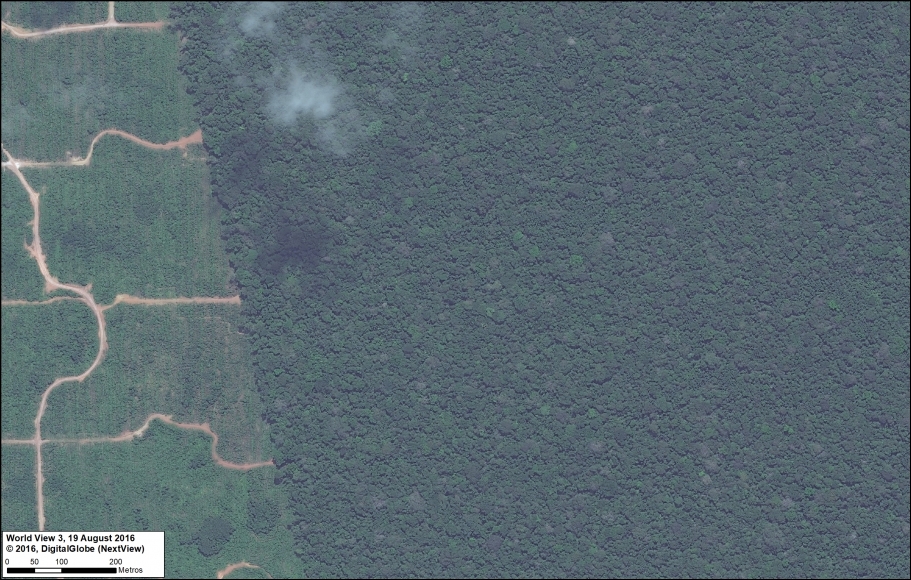
Image H. United Cacao. Data: DigitalGlobe (Nextview)

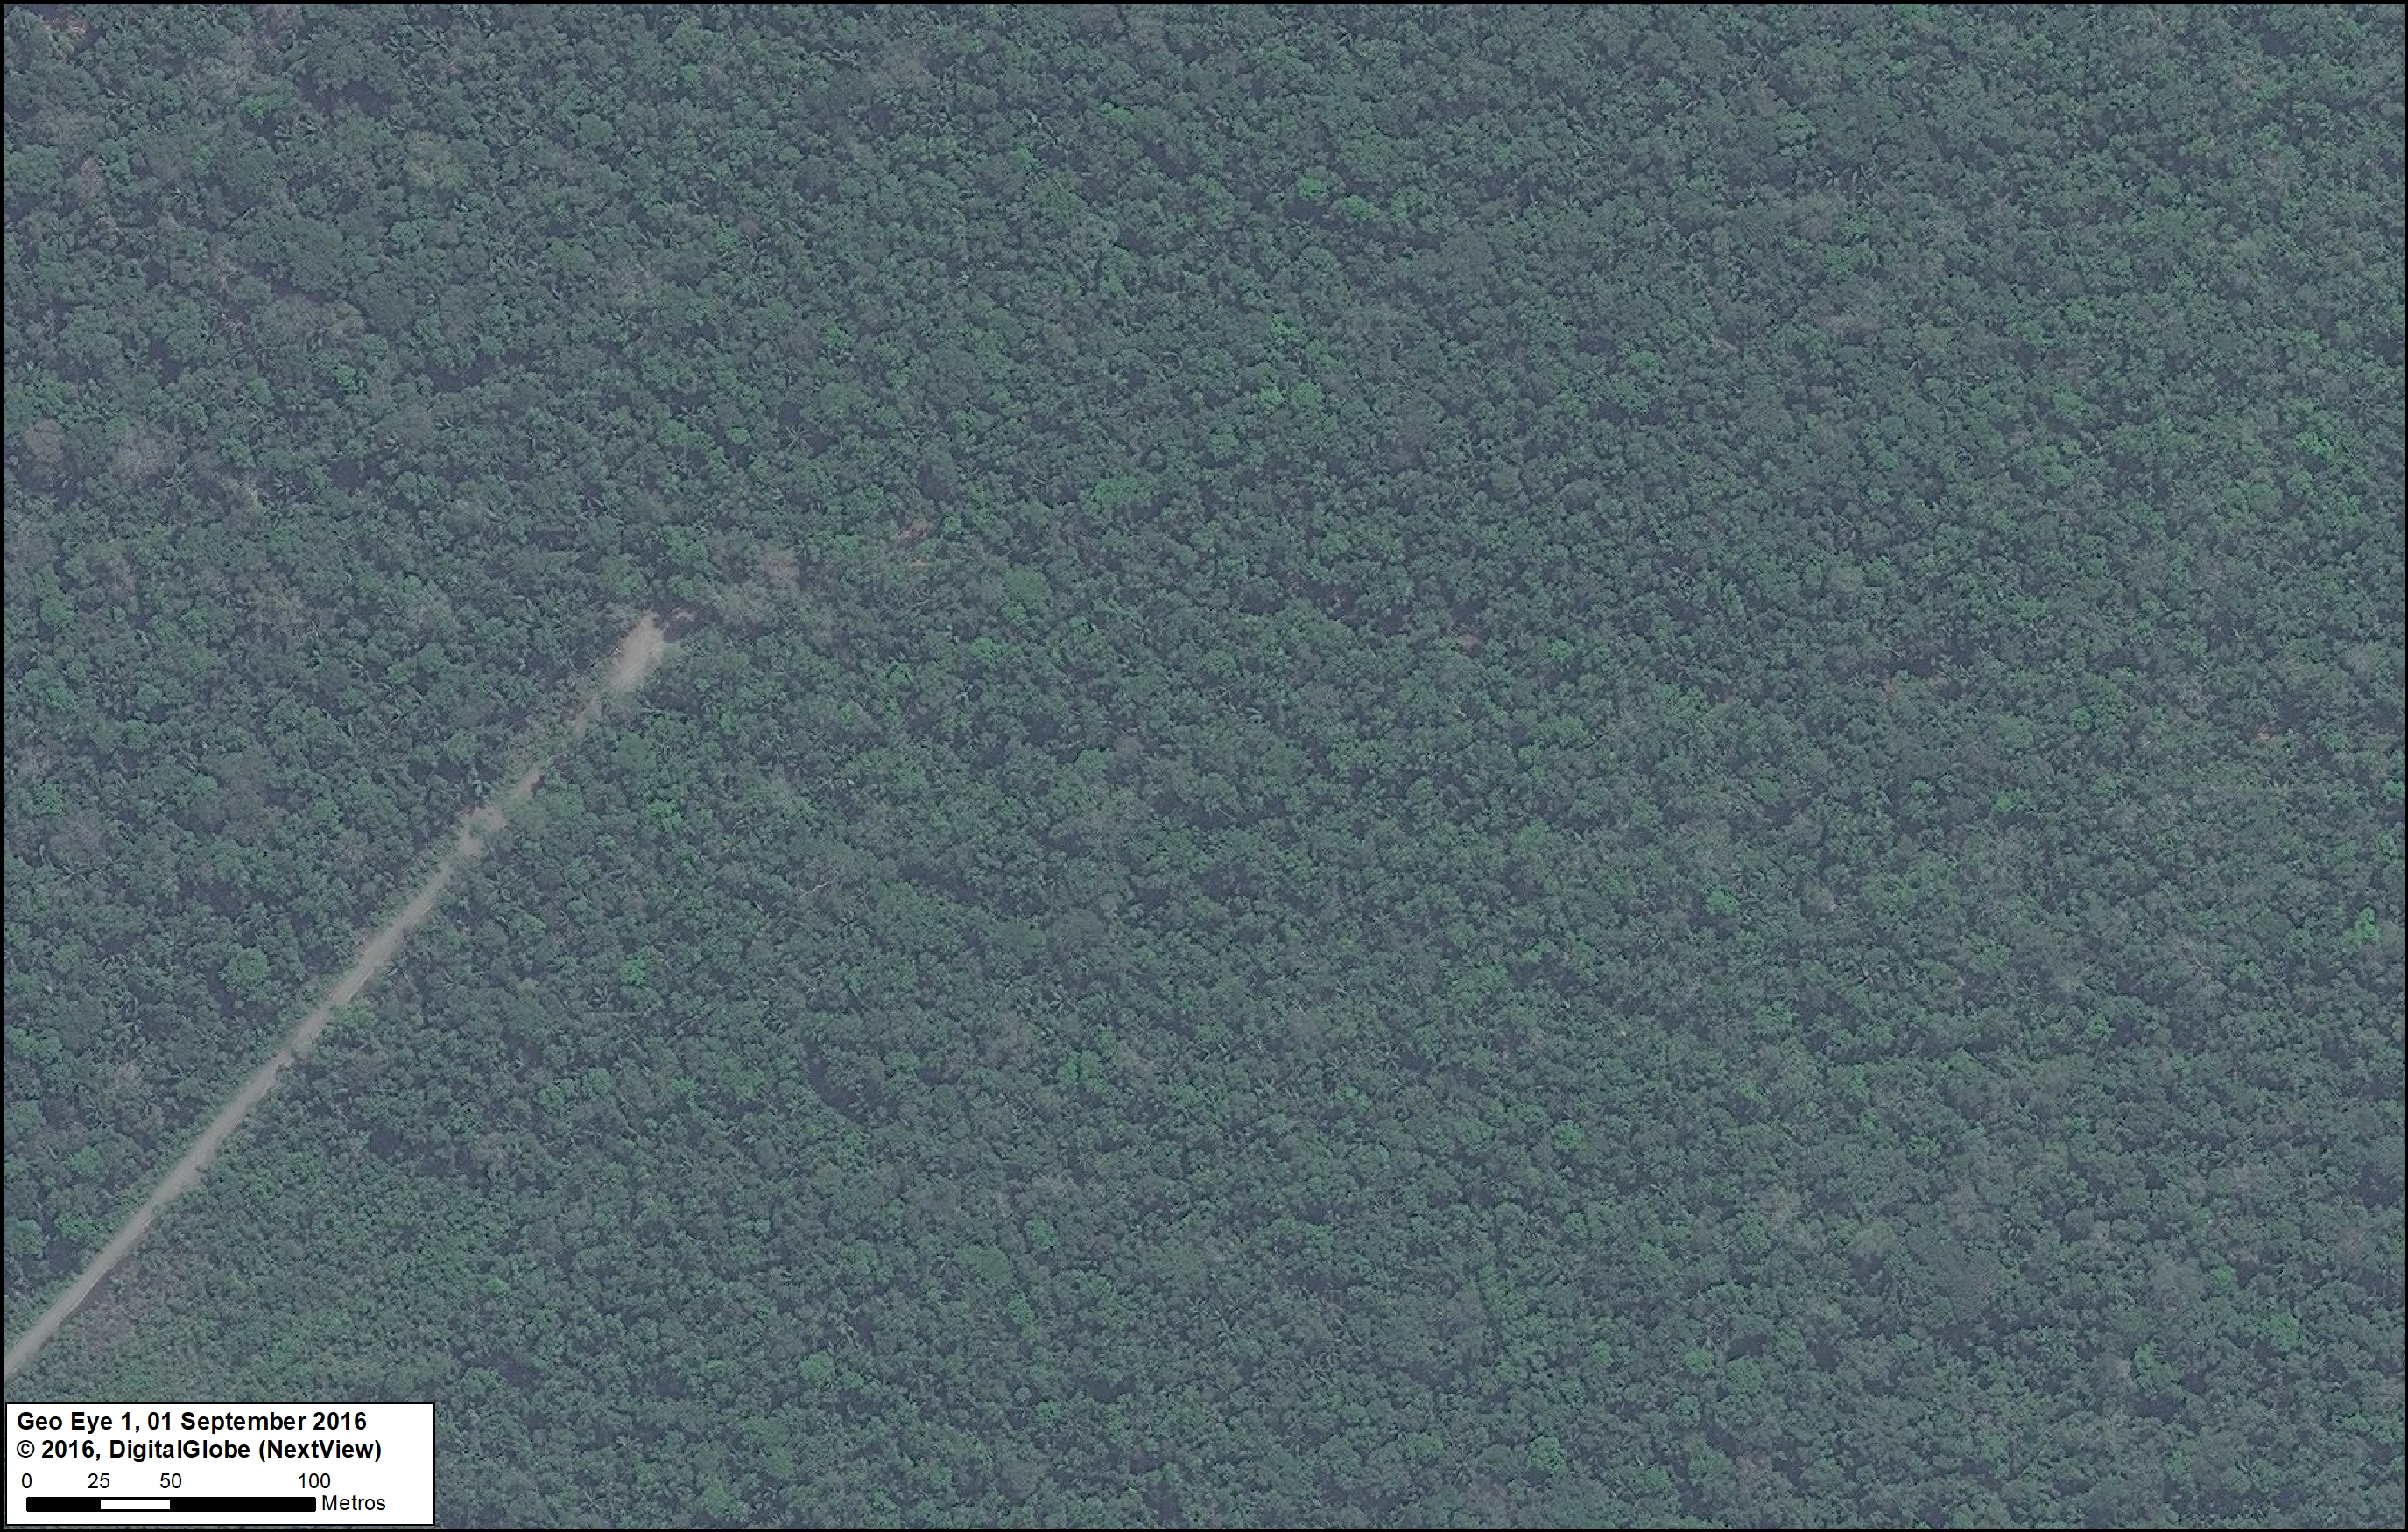
I. Manu-Amarakaeri Highway (Madre de Dios)

A controversial road construction project would cross the buffer zones of two important protected areas in the southern Peruvian Amazon, Amarakaeri Communal Reserve and Manu National Park. Initial construction began in 2015 before being halted by the courts, but the project continues to be a long-term threat to the area. Featured Image I shows the leading edge of the road construction, surrounded by primary forest.
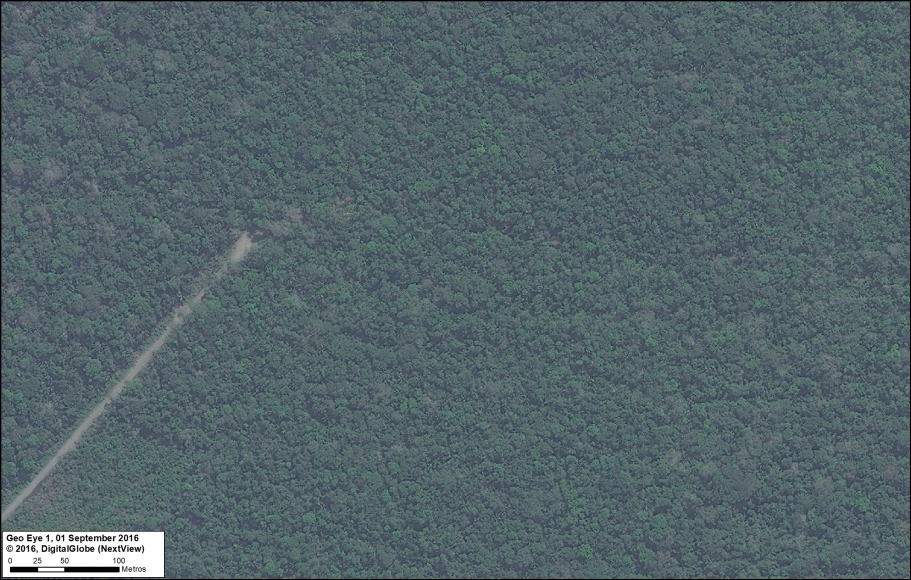
Image I. Amarakaeri/Manu road. Data: DigitalGlobe (Nextview)

J. La Pampa (Madre de Dios)

MAAP has documented the rapid expansion of gold mining deforestation in an area known as La Pampa, in the southern Peruvian Amazon (MAAP #75). Alarmingly, over 11,250 acres has been cleared since 2013. Featured Image J shows the most active mining deforestation front penetrating the primary forests to the east. Note the temporary and mobile mining camp city that has been formed near the leading edge of mining deforestation.
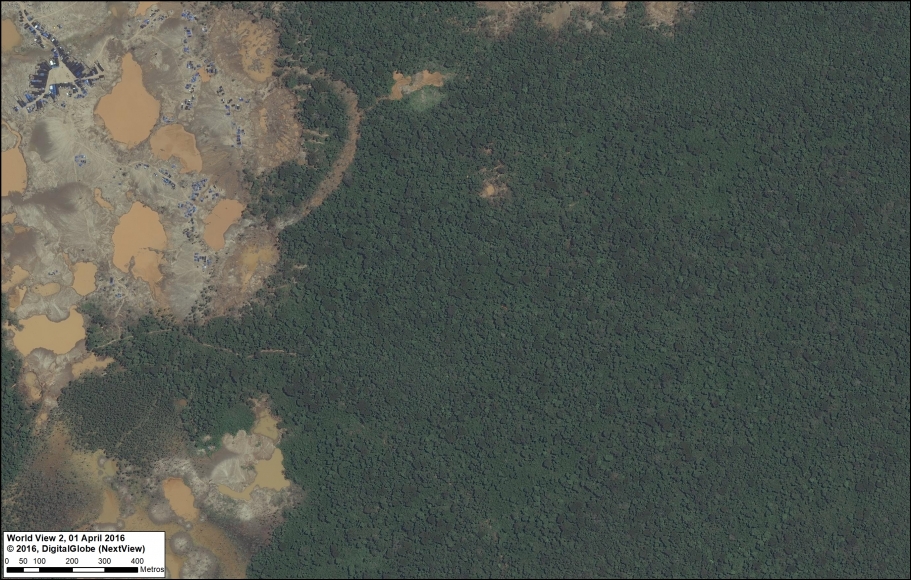
Image J. La Pampa. Data: DigitalGlobe (Nextview)

K. Tierra Blanca (Loreto)

The Peruvian company Grupo Romero had plans to clearcut thousands of hectares of primary forest for four large-scale oil palm plantations. There are reports that the company has abandoned the projects, in part due to pressure from civil society. Featured Image K shows the spared primary forest in one of the proposed plantations, Tierra Blanca. Note the recent construction (2014) of a logging road that still endangers the area.
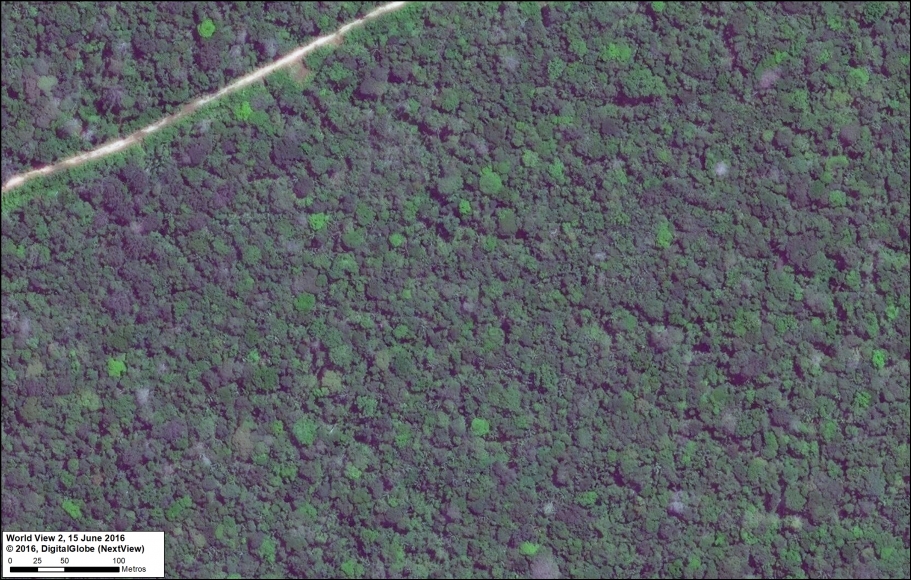
Image K. Tierra Blanca. Data: DigitalGlobe (Nextview)

L. Amarakaeri Communal Reserve (Madre de Dios)

Immediately following a gold mining invasion in 2015, the co-administrators of Amarakaeri Communal Reserve (SERNANP and ECA Amarakaeri) took action against the illegal activities (see MAAP #44). Featured Image L shows the spared primary forest surrounding the abandoned invasion front at the border of the reserve.
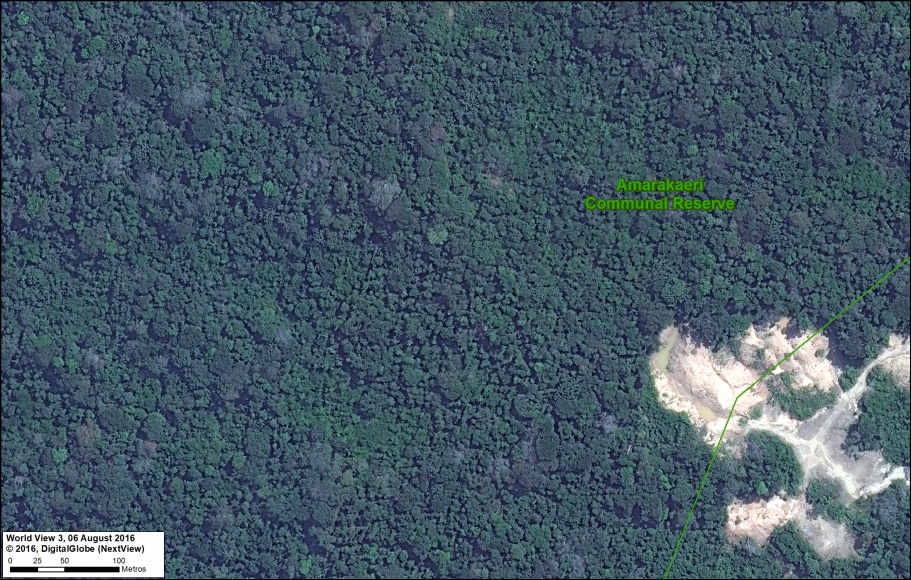
Image L. Reserva Comunal Amarakaeri. Data: DigitalGlobe (Nextview), SERNANP

Marañon River (sector Amazonas/Cajamarca)

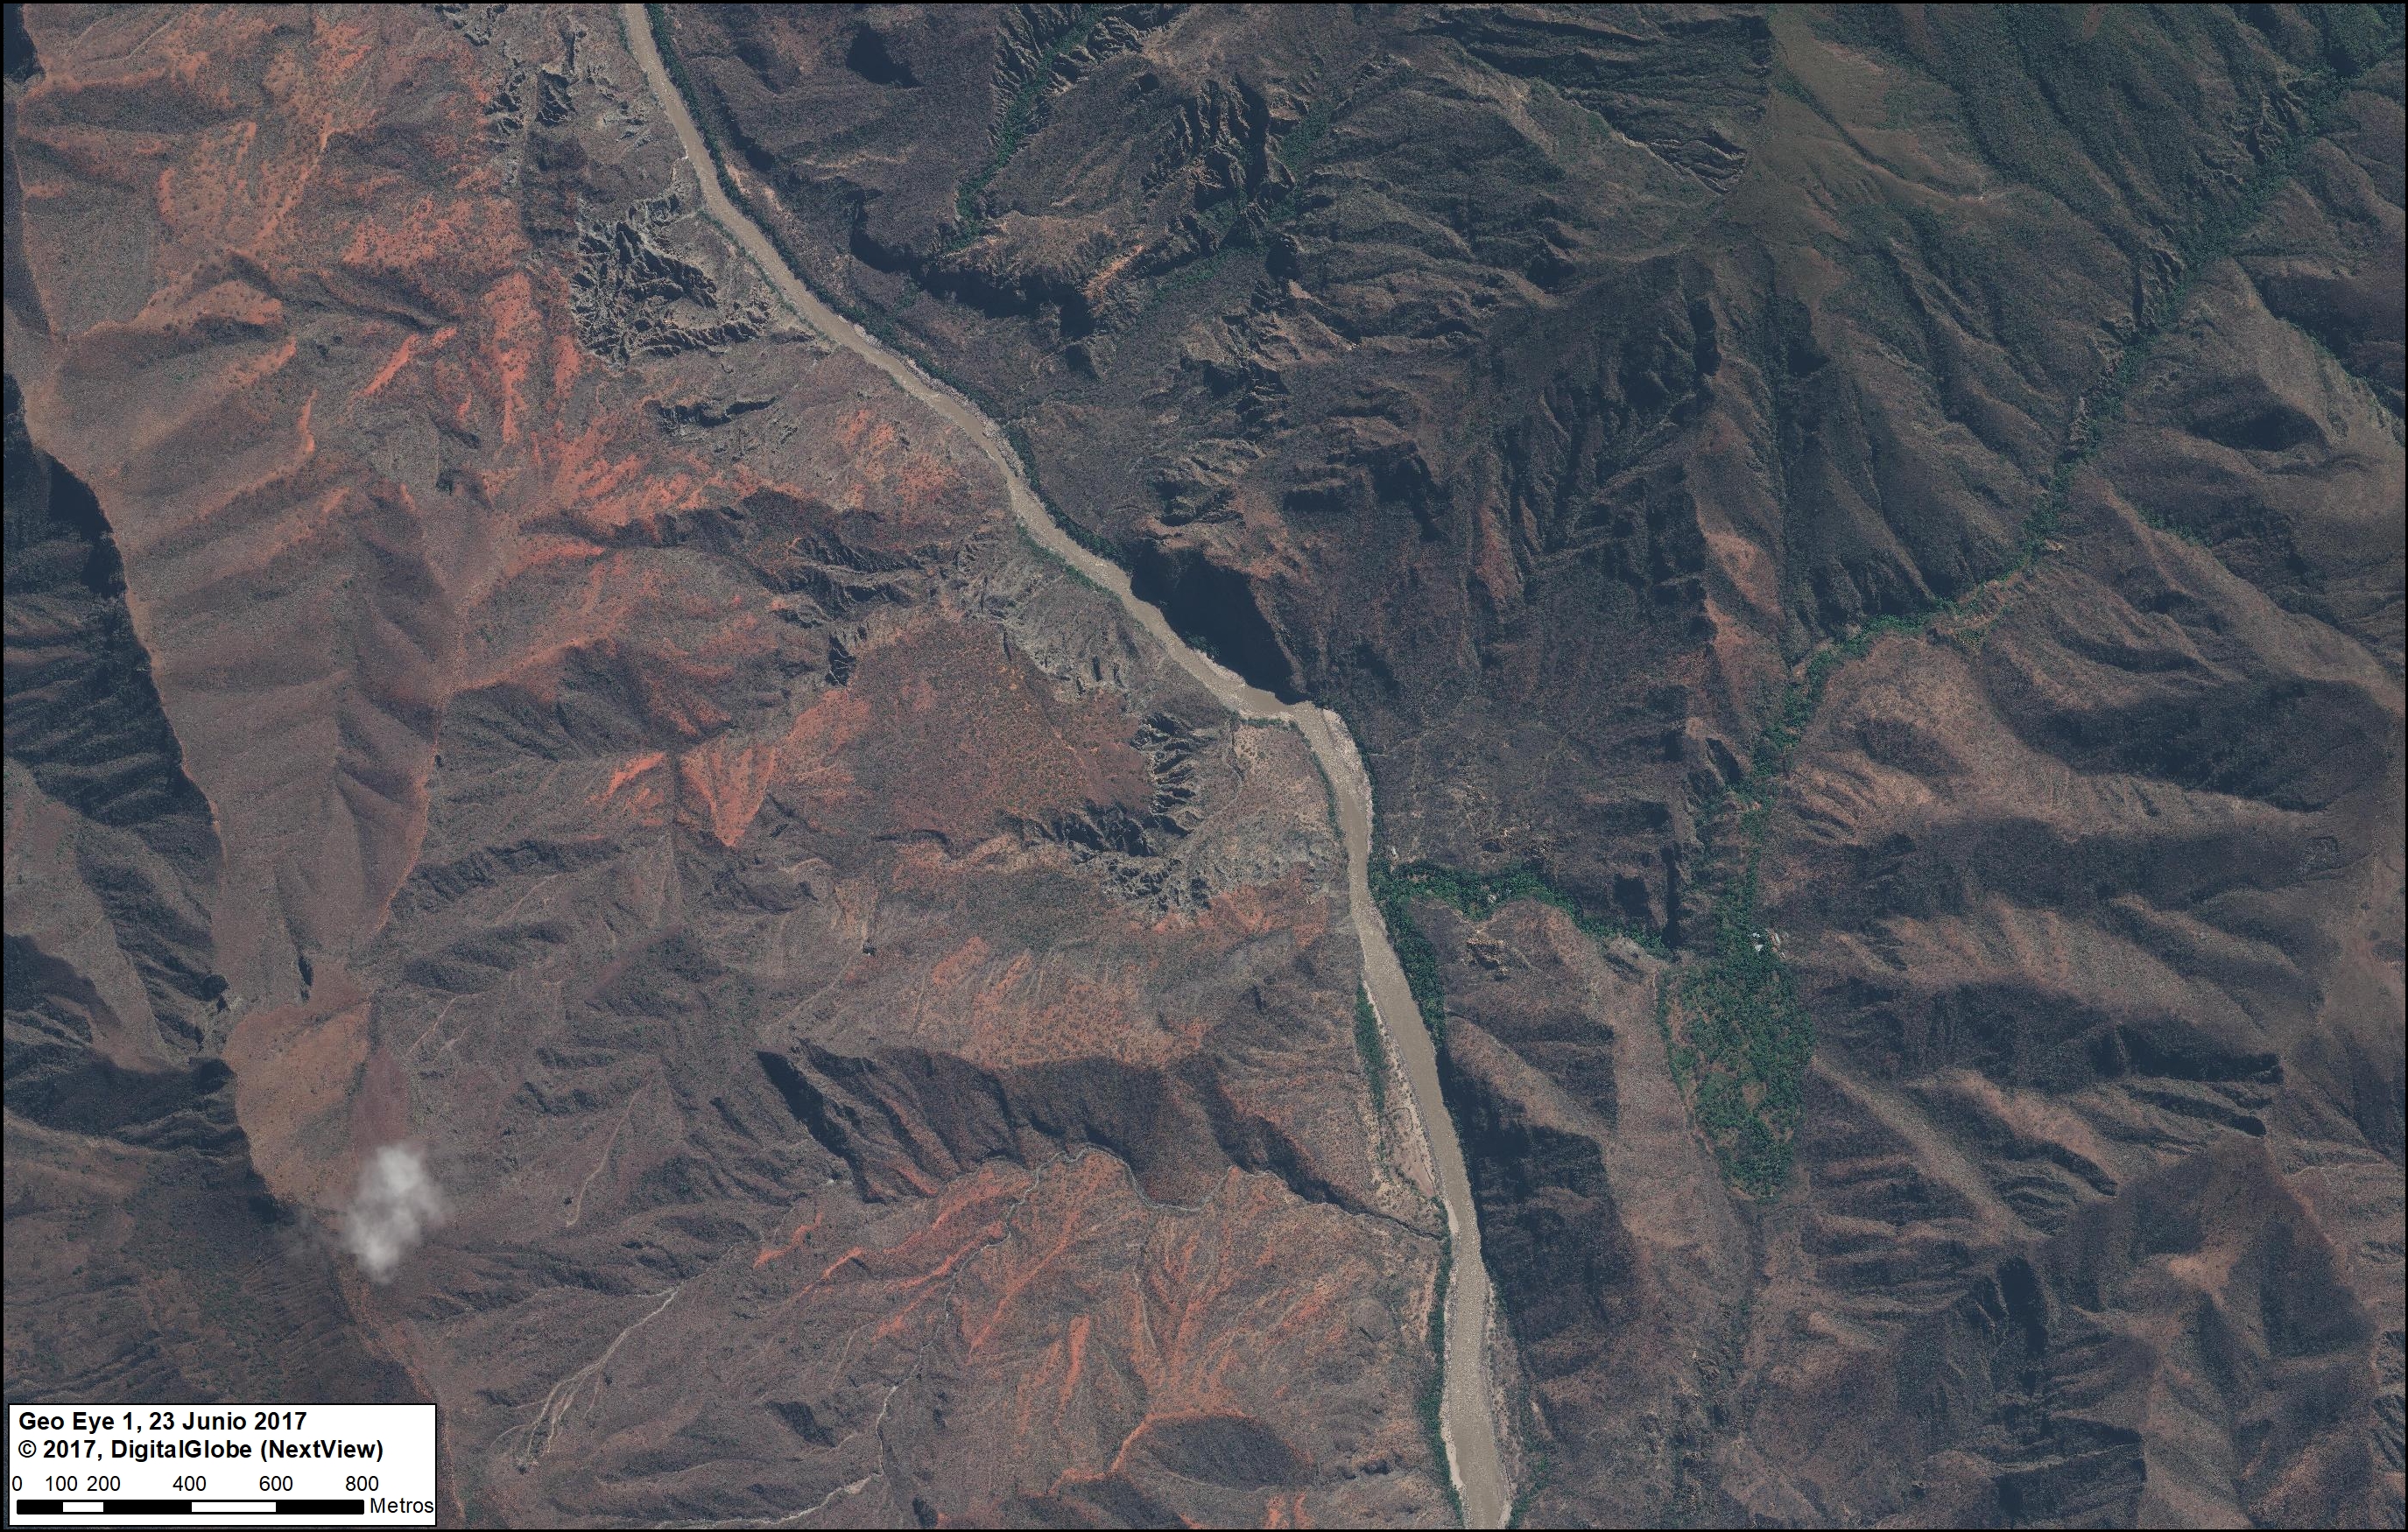
Featured Image M shows the exact location of a proposed hydroelctric dam, Chadín 2. It is one of the most advanced of the controversial 20 proposed dams along the Marañón River in the western Peruvian Amazon. It would be a large dam with the capacity to produce 600 MW of energy, and will create a flooding reservoir of over 8,000 acres. The project’s environmental impact study was approved in 2014, but construction has not yet started.
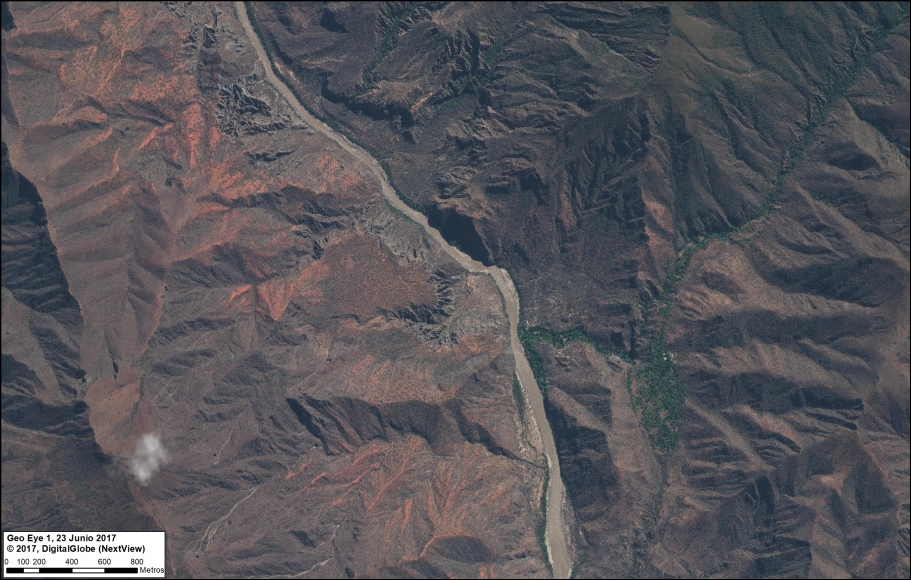
Image M. Rio Maranon. Data: DigitalGlobe (Nextview)
Coordinates

A. Yaguas: -2.72314, -70.746635
B. Sierra del Divisor: -7.962626, -73.781751
C. Tambopata: -12.93985, -69.233005
D. Amarakaeri: -13.073707, -70.966423
E. Manu: -12.816693, -71.886345
F. Choquequirao: -13.30926, -72.808164
G. Los Amigos: -12.377288, -70.380948
H. Tamshiyacu: -3.983962, -73.013498
I. Carretera Manu/Amarakaeri: -12.473042, -71.114976
J. La Pampa: -12.997284, -69.94845
K. Tierra Blanca: -6.517934, -75.366485
L. Amarakaeri: -12.88521, -70.626946
M. Chadin 2: -6.423889, -78.223333

Citation

Finer M, Mamani N (2018) Amazon Beauty, in High-Resolution. MAAP: 80.