MAAP #248: Implications of upcoming major El Niño event on Amazon fires

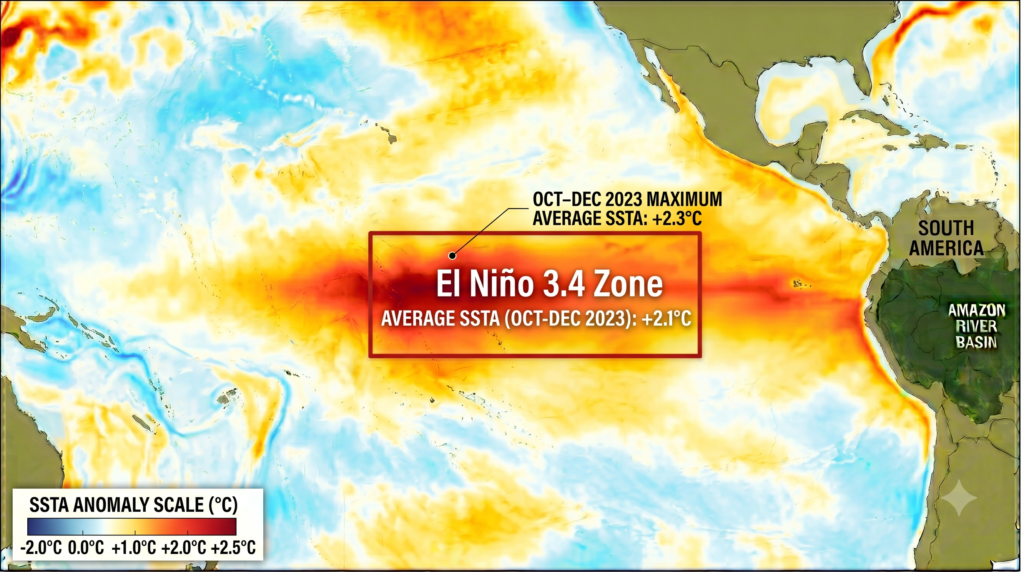
Figure 1. El Niño 2023. Data: Google Gemini

In our annual series on forest loss trends in the Amazon (MAAP #244 & MAAP #229), we observed that the two most recent intense fire seasons, 2016 and 2024, immediately followed major El Niño events

For example, extreme drought conditions created by a strong El Niño in late 2023 created extreme drought conditions the following year, enabling widespread fires across the Amazon in 2024. In contrast, the reduced fires of 2025 were associated with the moister conditions of La Niña.

For background, the definition of El Niño is based on warm sea surface temperature in a specific zone of the Pacific Ocean several hundred kilometers off the coast of South America (Figure 1).

Specifically, a Sea Surface Temperature Anomaly (SSTA) above 0.5 degrees Celsius in the El Niño 3.4 Zone is classified as an El Niño event (See Methods section for details). Anomalies above 1 degree C are a moderate event, and above 2 degrees C, a very strong event.

We took this SSTA data annually from 2002 to 2025 for the 3-month period of October-November-December, which typically correlates with peak temperature anomalies.

We then analyzed this data in relation to the following year’s fire-caused primary forest loss (data from the University of Maryland). We focused the analysis on years with at least a weak El Niño (SSTA > 0.5).

Results
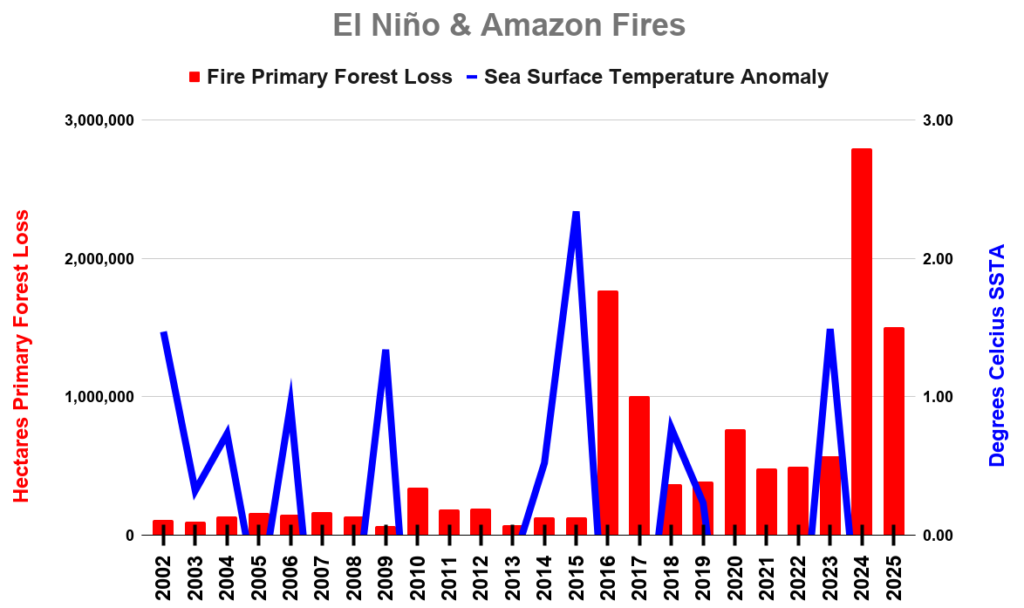
Figure 2. El Niño and Amazon Fires. Data: UMD, NOAA

Filtering the dataset for El Niño years (SSTA > 0.5 degrees C) isolates 8 specific historical events (2002, 2004, 2006, 2009, 2014, 2015, 2018, and 2023). 

Of these events:

Four were Weak El Niño (SSTA 0.5- 0.9): 2004, 2006, 2014, and 2018;

Two were Moderate (SSTA 1.0 – 1.4): 2002, 2009;

One was Strong (SSTA 1.5 to 1.9): 2023;

And one was Very Strong (SSTA ≥ 2.0): 2015.

To analyze the delayed (lagged) impact, the SSTA from each year (Year t) is paired directly with the Fire Primary Forest Loss Area from the following year (Year t+1). 

See Figure 2 for the visual correlation between El Niño events (blue) and primary forest loss from fires (red).

Note the initial observation that prompted this study: the major peak in fires in 2016 following the Very Strong El Niño of 2015, followed by the record-breaking fire season in 2024 following the Strong El Niño of 2023.

Despite a limited sample size (only 8 El Niño events since 2000) and limited statistical power, the analysis reveals a clear, strong positive relationship between the strength of El Niño events (that is, magnitude of the sea surface temperature anomaly) and the severity of the following fire season. 

The strength of this relationship approaches the traditional margin of statistical significance (probability value under  0.05), with a probability value of 0.08 (see the Annex for details).

Thus, the data do indicate a potential escalating relationship between El Niño and Amazon fires.

Most notably, the two highest sea surface temperature anomalies —2015 (+2.34) and 2023 (+1.49)—directly preceded the two largest fire seasons, 2016 (1.76 million hectares) and 2024 (2.79 million hectares), respectively.

Low-tier warm anomalies (like +0.52 or +0.73) correspond to lagged fire sizes under 160,000 hectares.

Discussion

As detailed above, the available data indicates a strong positive correlation between the severity of El Niño events and the intensity of the Amazon fire season the following year.

This correlation is anchored by two key events that prompted this analysis in the first place: the peak fire season in 2016 following the Very Strong El Niño of 2015; and the record-breaking fire season in 2024 (see MAAP #229) following the Strong El Niño of 2023.

There is currently an urgency regarding these findings due to the predicted Very Strong El Niño event (that is, SSTA > 2 degrees C) in late 2026 and implications for the 2027 fire season. Some predictions have the SSTA as the highest on record, even approaching 3 degrees C by November to December 2026. 

The current SSTA (for May-June-July 2026) is +0.98 degrees C (Weak to Moderate El Niño), rapidly coming out of last year’s La Niña phase, and warming fast.

Thus, the best recent analogue is the Very Strong El Niño of 2015, and the subsequent burning of nearly 1.8 million hectares of primary Amazon forest the following year in 2016. The most recent analogue is 2023 (see Figure 1), and the subsequent record-breaking fire season of 2024.

We also raise the possibility that the impact on fires carries over to a second year following a major El Niño – this could account for the severe fire seasons of 2017 (1 million hectares) and 2025 (1.5 million hectares).

The weaker El Niño years show a consistent directional pattern but without the same magnitude response.

We also note a major structural break in the data: in general, fires are much greater starting in 2016 (average fire area pre-2016: ~150k ha; Post-2016: ~1.0M ha). This time frame slightly precedes, overlaps, and then continues after the President Bolsonaro administration (2019-2023), which weakened illegal deforestation enforcement policies. Thus, there may be a new modern elevated baseline of fire activity in the Brazilian Amazon.

Since El Niño typically peaks in November to December, which corresponds to the onset of the wet (monsoon) season, the mechanism for this correlation may be shutting down the convection engine driving the rainy season. The disruption of the wet season moisture flow could extend the dry and transition seasons, reducing precipitation, creating drier conditions, and preventing the soil from recovering its moisture, setting up the Amazon for an intense fire season.

It is worth noting that another recent study found that the years with the largest burned areas in the Peruvian Amazon between 2013 and 2024 coincide with the occurrence of El Niño events and drought conditions (Reference 10).

How ready are Amazonian countries for the upcoming 2027 El Niño fire season?

Experience of 2024

The 2023 El Niño and subsequent 2024 fire season exposed the depth of the preparedness gap across the Amazon basin. The responses that emerged were largely reactive, deployed well into a crisis that monitoring systems had anticipated months earlier. Brazil, Peru, and especially Bolivia were most affected among the Amazonian countries, and this review of institutional preparedness focuses on these three countries. Drier conditions created by El Niño, however, created an increased fire risk across the entire biome, affecting all countries.

Brazil mounted the most substantial national response, though it arrived belatedly. By August 2024 — almost three months since the wildfires started — a state of emergency was decreed in 45 municipalities and 48 Brazilian cities were put on high alert (Reference 1). In the end, fires directly impacted 1.9 million hectares, the highest on record (MAAP #229).

Peru also declared a national emergency during the 2024 crisis, unlocking emergency coordination powers and international assistance. In the end, however, fires impacted 47,574 hectares, more than double the previous high (MAAP #229).

Bolivia also had its worst fire season on record in 2024, as fires directly impacted  779,960 hectares, far surpassing the previous record (MAAP #229). The main cause of deforestation and subsequent fires was likely agrarian speculation. Two supreme decrees in 2024 granted zero tariffs and tax incentives to agribusiness, which triggered a surge in demand for land for monocultures of soy, sugarcane, and seed oils. This expansion was supported by existing regulations that expedite the clearing of up to 20 hectares.  The government declared a national emergency and later a national disaster, but the response was hampered by weak enforcement: Bolivia’s fines for illegal forest burning (under $20/hectare) are roughly 2% of Brazil’s, and tensions between national and local government further slowed emergency coordination. To contain the disaster, the government declared an Ecological Environmental Pause, which suspended burning permits and placed the burned public lands under quarantine for five years. The Inter-American Commission on Human Rights’ special rapporteur documented how tensions between national and local governments hindered emergency responses, while policies aimed at aggressively expanding industrial agriculture had dried out large areas of the country, leaving ecosystems vulnerable to fire.

Changes implemented in 2025

Fire impact was much lower in 2025 relative to 2024 (1.5 million vs 2.8 million hectares of primary forest burned, respectively) (MAAP #244). Several Amazonian countries implemented stronger fire management policies in response to the 2024 fire season. The reduced burnt area, however, cannot be solely attributed to better institutional preparedness, as climate conditions were also more favorable, with La Niña bringing relief through higher humidity levels across the biome. 

In February 2025, Brazil’s Environment Minister Marina Silva decreed a pre-emptive environmental emergency ahead of the fire season, giving authorities extra powers and resources to contain wildfires before they spread. The federal government committed to hiring an additional 250 federal firefighters and allocated 45 million reais to bolster state-level fire brigades across six Amazonian states (Reference 3). Other structural measures followed: Brazil’s Supreme Court ordered the federal government and all Amazon and Pantanal states to draw up emergency fire management plans, while the Ministry of Environment announced “governance offices” in 70 Amazon municipalities — supported by FUNBIO and UNDP — to provide vehicles, boats, drones, and training for fire prevention (Reference 4). The Prevfogo program, managed by IBAMA, was expanded as a platform integrating satellite-based detection with ground response. These combined efforts contributed to a measurable decline in fire activity in 2025 compared with the previous year (MAAP #244).

In Peru, in response to the 2024 events, the Ministry of Environment proposed a Forest Fire Prevention and Control Law to establish regional firefighting brigades and prohibit land-use change in areas affected by wildfires, though recent amendments to the Forest Law (Law No. 31973) may undermine this approach (Reference 5). Seven of Peru’s 24 regions have published forest fire prevention and risk reduction plans, and a Multisectoral Plan for Wildfire Response 2025–2027 is currently being developed, drawing on risk assessments that classify nearly 20% of national territory as high or very high fire risk.

In Bolivia, the legislative trajectory since 2024 has moved in the opposite direction. Agribusiness lobbies have pressured to roll back burning fines, and a land reform that would have accelerated deforestation in Santa Cruz and Beni, the departments that burned most severely in 2024, was enacted in the first half of 2026, and then repealed in the face of social protests (Reference 6). The country has been navigating its worst economic and political crisis in decades, and institutional preparedness for the 2027 fire season could be severely challenged under these conditions. 

In terms of regional cooperation, the most significant recent development is the Operational Understanding for Preparedness and Response, approved by ACTO member countries in early 2026. This non-binding regional cooperation framework establishes mechanisms for coordinating mutual assistance among Amazonian countries when the magnitude of forest fires requires a joint response, facilitating the articulation of national capacities, exchange of operational information, and technical support during fire-related emergencies. Concurrent with its adoption, member countries agreed to establish the Forest Fire Response Committee (CRIF), a regional body tasked with developing technical instruments, operational procedures, and coordination mechanisms to improve preparedness and joint response (Reference 7).

In conclusion, the reduction in burnt area observed across the three countries in 2025 occurred under favorable climate conditions, which, as our analysis shows, are unlikely to be seen in 2027. The true test of institutional preparedness will come under El Niño-driven stress. The regional architecture, meanwhile, can only perform as well as its weakest national link. Under a degraded political landscape and without policy improvements since 2024, Bolivia could become the epicenter of the 2027 fire season.

Outlook for 2026 – 2027

From the FAO’s El Niño Fire Readiness checklist (Reference 8), there are five major components of readiness for next year’s 2027 fire season.

First is “Fire Awareness”, which includes understanding historical trends that distinguish an average season from an anomaly season, and what drives major fires (such as fuel load from recently deforested areas) that could be incorporated into Risk Reduction strategies.

As noted above, annual MAAP reports (MAAP #229, MAAP #244) provide historical trends for the Amazon regarding fire impact to primary forests. These reports allow for the identification of intense, or anomalous, fire seasons (such as 2024).

In terms of what drives major fires, previous MAAP reports have revealed the tight link between deforestation and fires in the Amazon (MAAP #189). That is, most major fires are burning recently deforested areas, and then may escape into surrounding forests, especially with extended dry conditions such as 2016 and 2024. For example, over 70% of major fires in the Brazilian Amazon burn recently deforested areas  (MAAP #189). There is also a strong link between deforestation and fire in the Bolivian Amazon, where deforestation also often precedes fires, which may then escape into surrounding forests or savannahs.

Thus, one of the key strategies to minimize major fires in 2027 is to minimize new deforestation in 2026.

Second is the establishment of “Fire Danger Rating and Early Warning” systems and the provision of this information to stakeholders.

As the El Niño intensifies throughout 2026, this could include the monitoring of moisture or drought conditions and issuing respective warnings.

Third is “Fire Preparedness,” and includes guidance for prevention, detection, and suppression of fires based on the above rating and warning system.

In terms of prevention, fire-free agricultural practices could be promoted in 2026 and more strictly enforced in 2027, coordinating closely with local rural unions and cooperatives (Reference 9). Local community initiatives represent a critical component of this preparedness, serving as tangible examples of prevention, detection, and suppression mechanisms.

For instance, the Territorial Strengthening Actions implemented across the Amazon basin demonstrate this integrated approach: communities in Colombia, Peru, Bolivia and Ecuador are actively developing local capacities for fire detection, sustainable management (safe fire use) and early response, while promoting alternative practices to slash-and-burn agriculture. 

This community-based approach is further strengthened by broader regional efforts, such as the CoRAmazonia program. This initiative promotes an Integrated Fire Management strategy that integrates technical, scientific, and traditional indigenous knowledge. Through platforms like ExpoMIF and the Amazon Network for Integrated Fire Management (RAMIF), the program highlights the crucial role of Indigenous peoples and traditional communities in fire governance, emphasizing the importance of community brigades, territorial monitoring, and the rescue of affected wildlife.

Fourth is “Pre-fire Season Activities,” which highlights whether agencies are adequately engaging stakeholders and setting up national agreements.

Fifth is “Fire Detection, Communication, and Dispatching,” which forms the real-time fire Response procedures and mechanisms.

In terms of detection, real-time fire monitoring should be integrated into national response protocols and field-level coordination.

For communication and dispatching, there could be the establishment of contingency plans to extinguish forest fires rapidly before they spread, focusing heavily on fires starting in recently deforested areas and expanding towards protected areas or Indigenous territories.

In Peru specifically (Reference 10), the most critical districts are concentrated in the Ucayali, Madre de Dios, and Huánuco regions. Regarding public budget allocation, there are gaps in the prevention of and response to forest fires, resulting in limited operational capabilities and significant disparities in the allocation and execution of public resources for disaster risk management. Overall, there is the need to strengthen systems for monitoring, early warning, planning, and institutional response regarding forest fires, prioritizing areas with the greatest historical vulnerability.

Methods

The analysis combined two primary data sources: 1) Relative Oceanic Niño Index (RONI) based on sea surface temperature anomaly (SSTA) and 2) annual primary forest loss from fires.

RONI, the standard used by NOAA for classifying El Niño (warm) and La Niña (cool) events in the eastern tropical Pacific, is the running 3-month average sea surface temperature (SST) for the Niño 3.4 region, minus the overall average tropical 3-month sea surface temperature anomaly (SSTA). For this study, we used the 3-month period of October-December for each year. 

Events are defined as 5 consecutive overlapping 3-month periods at or above the +0.5 anomaly for warm (El Niño) events and at or below the -0.5 anomaly for cool (La Niña) events.  The threshold is further broken down into Weak (with a 0.5 to 0.9 SST anomaly), Moderate (1.0 to 1.4), Strong (1.5 to 1.9), and Very Strong (≥ 2.0) events. 

In addition to warm SSTA in the Pacific Ocean, Amazon drought conditions may also be influenced by warm SSTA in the North Tropical Atlantic Ocean (Reference 10), but our study did not account for this.

The fire analysis was based on 30-meter resolution annual forest loss data produced by the University of Maryland and also presented by Global Forest Watch. This Global Forest Loss due to fire dataset is unique in terms of being consistent across the Amazon (in contrast to country-specific estimates) and distinguishes forest loss caused directly by fire (note that virtually all Amazon fires are human-caused). The values included were ‘medium’ and ‘high’ confidence levels (code 3-4).

For the baseline, it was defined to establish areas with >30% tree canopy density in 2000. Importantly, we applied a filter to calculate only primary forest loss by intersecting the forest cover loss data with the additional dataset “primary humid tropical forests” as of 2001 (Turubanova et al 2018). For more details on this part of the methodology, see the Technical Blog from Global Forest Watch (Goldman and Weisse 2019).

The analysis was supported and reviewed by AI: Gemini and Claude

Annex

Because we have a constrained subset (N = 8), the statistical power is limited, but a clear, strong positive pattern is evident across several major metrics.

The Pearson Linear Correlation indicates a strong positive linear relationship between the magnitude of the warm anomaly and the next year’s fire area (r = +0.6146), approaching the traditional margin of statistical significance (p-value = 0.1049). This correlation is even stronger when we take the natural log of the fire area to account for natural fire activity  (p-value = 0.0827).

Spearman Rank Correlation reaffirms that higher SSTA values rank alongside worse fire outcomes in the succeeding year ( +0.5476; p-value= 0.1600).

  • Log-Transformed Pearson Correlation (r log): +0.6474
  • Wildfire spread typically behaves exponentially rather than linearly. When we take the natural log of the fire area (ln{Fire}_t+1) to correct for this, the correlation strengthens to nearly +0.65, approaching the traditional margin of statistical significance (p < 0.10).

References

1. Lancet Regional Health – Americas / PMC. (2025). The 2024 South America ablaze: Health impacts and policy imperatives for protecting population health in an era of wildfires

2. IACHR (2025) REDESCA publishes report on wildfires in Bolivia and calls for urgent action to address impacts on human rights and ecosystems

3. Mongabay (2025). Brazil declares environmental emergency ahead of 2025 fire season.

4. Muggah, R., & Szabo, I. / Mongabay. (2025). Brazil is speeding-up forest fire prevention to avoid dangerous tipping points in the Amazon. 

5. Lancet Regional Health – Americas / PMC. (2025). The 2024 South America ablaze. (See footnote 3.) Peru-specific governance section

6. Copa Pabón, M. V. (2026, May 15). Indigenous protest forces repeal of land privatization law in Bolivia.

7. ACTO. (2026, February–March). ACTO member countries approve Operational Understanding for Preparedness and Response to Forest Fires in the Amazon Region.

8. FAO El Niño Fire Readiness checklist (2024) As presented in the Global Fire Management Hub and informed by its Integrated Fire Management Voluntary Guidelines

9. Brown F, et al (2026). Alert related to the coming severe dry period, heat waves, fires, smoke and climate in the Madre de Dios-Peru, Acre-Brazil, Pando-Bolivia (MAP) Region – 30 April 2026. Foster Brown

10. ACCA (2026) El Niño y los incendios forestales en la Amazonía peruana, ¿qué podemos esperar para la temporada 2026-2027?

Citation

Finer M, Bodin B (2026) Implications of upcoming major El Niño event on Amazon fires. MAAP: 248.

Acknowledgements

We thank colleagues from the following organizations for helpful comments on the report: Conservación Amazónica – ACEAA in Bolivia and Conservación Amazónica – ACCA in Peru.

This work was supported by Norad (Norwegian Agency for Development Cooperation).

MAAP #225: Carbon in the Amazon (part 4): Protected Areas & Indigenous Territories

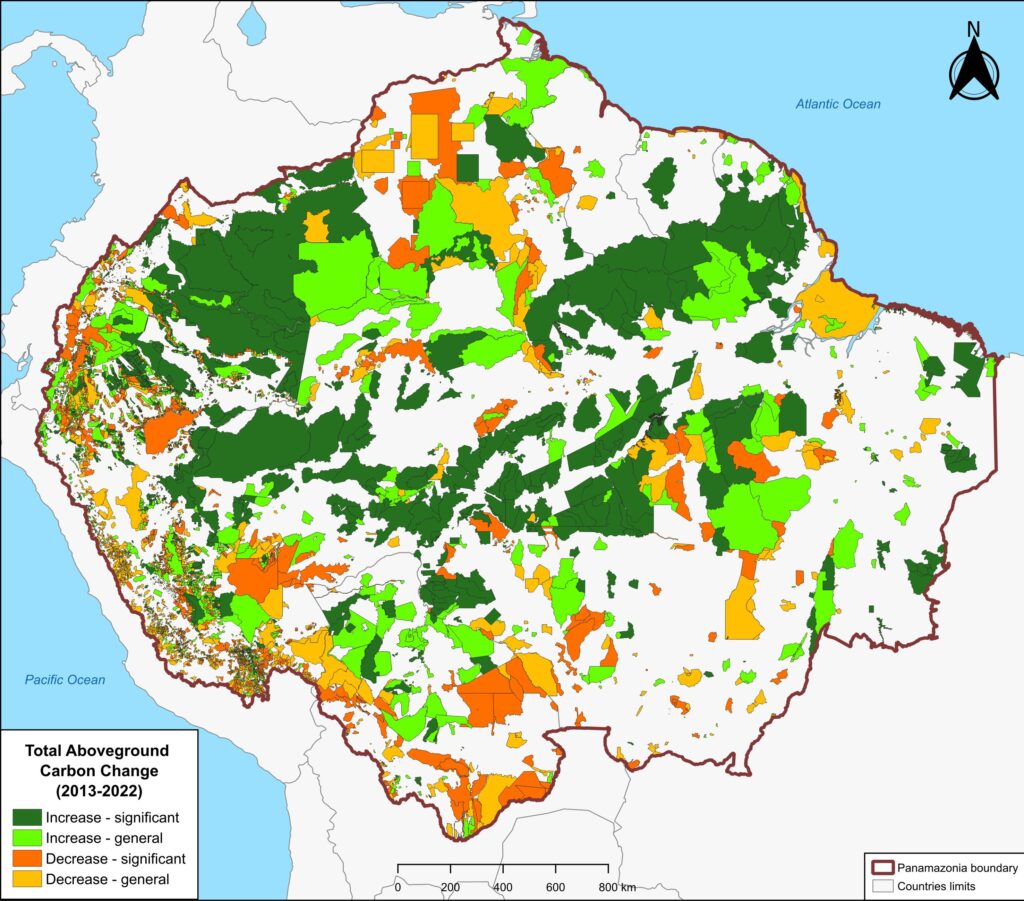
Figure 1. Total aboveground carbon change, Amazon protected areas & Indigenous territories 2013-2022. Data: Planet, ACA/MAAP.

We continue our ongoing series about carbon in the Amazon.

In part 1 (MAAP #215), we introduced a new dataset (Planet’s Forest Carbon Diligence) with wall-to-wall estimates for aboveground carbon at an unprecedented 30-meter resolution between 2013 and 2022. In part 2 (MAAP #217), we highlighted which parts of the Amazon are currently home to the highest (peak) carbon stocks. In part 3 (MAAP #220), we showed key cases of carbon loss (deforestation) and gain across the Amazon.

A key finding from this series is that the Amazon biome is teetering between a carbon source and sink. That is, historically the Amazon has functioned as a critical sink, with its forests accumulating carbon if left undisturbed. However, relative to the 2013 baseline, the Amazon flipped to a source during the high deforestation, drought, and fire seasons of 2015-2017. It then rebounded as a narrow carbon sink in 2022.

Here, in part 4, we focus on the importance of aboveground carbon in protected areas and Indigenous territories, which together cover 49.5% (414.9 million hectares) of the Amazon biome (see Figure 1).

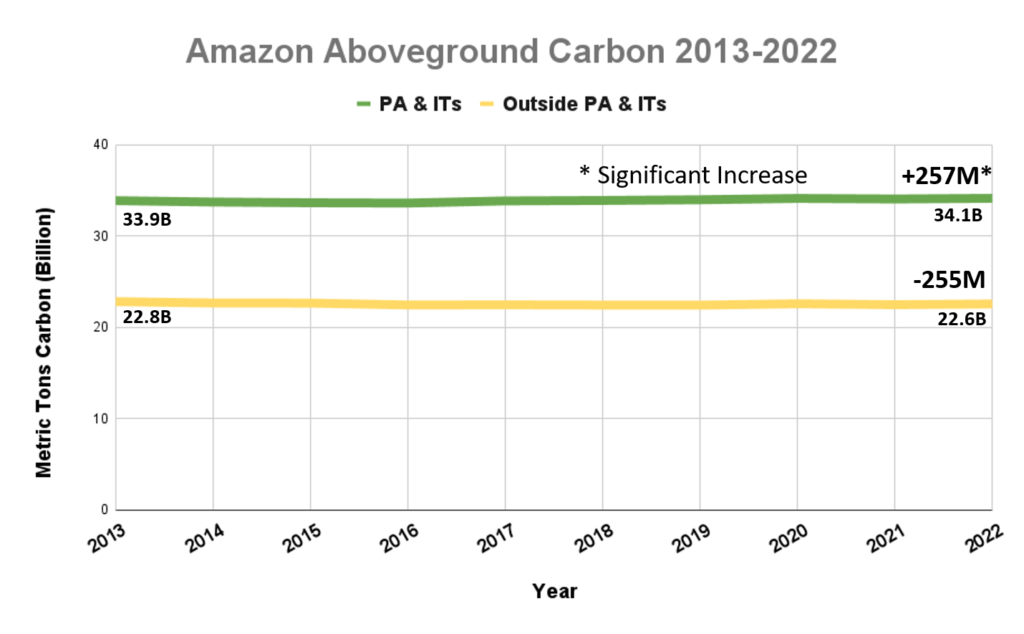
We find that, as of 2022, Amazonian protected areas and Indigenous territories contained 34.1 billion metric tons of aboveground carbon (60% of the Amazon’s total). Importantly, in the ten years between 2013 and 2022, they functioned as a significant carbon sink, gaining 257 million metric tons.

With this data, we can also analyze aboveground carbon for each protected area and Indigenous territory. For example, Figure 1 illustrates aboveground carbon loss vs. gain for each protected area and Indigenous territory during the 10-year period of 2013 – 2022 (see details below).

Below, we further explain and illustrate the key findings.

Amazon-wide & Country-level Results

Amazonian protected areas and Indigenous territories currently cover nearly half (49.5%) of the Amazon biome, but contain 60% of the aboveground carbon. Together they contained 34.1 billion metric tons of aboveground carbon as of 2022, gaining 257 million metric tons since 2013, thus functioning as a carbon sink (Figure 2).1,2 

In contrast, areas outside of protected areas and Indigenous territories (424 million hectares) contained 22.6 billion metric tons of aboveground carbon as of 2022, losing 255 million metric tons since 2013, thus functioning as an overall carbon source.

Thus, the carbon sink function of protected areas and Indigenous territories narrowly offsets the emissions in the rest of the Amazon.

We emphasize that the protected areas and Indigenous territories functioned as a significant carbon sink (p-value = 0.01), while the outside areas were not a significant source (p-value= 0.15).

Regarding results by country, protected areas and Indigenous territories were significant carbon sinks in Colombia, Brazil, Suriname, and French Guiana (Guyana gained carbon but not significantly). In contrast, they were significant carbon sources in Bolivia and Venezuela (Peru and Ecuador lost carbon but not significantly).

Figure 2. Amazon aboveground carbon 2013-2022, within vs. outside protected areas and Indigenous territories. Data: Planet, ACA/MAAP.

Individual Protected Area & Indigenous Territory Results

Figure 1 (see above) illustrates total aboveground carbon loss vs. gain for each protected area and Indigenous territory during the 10-year period of 2013 – 2022. 

Overall, we found 1,103 areas that served as significant carbon sinks (dark green) during this period (238 protected areas and 865 Indigenous territories). These areas are concentrated in the northern and central Amazon. See Annex 1 for a list of specific areas that were significant carbon sinks.

It is important to note that deforestation pressures currently threaten several of these significant carbon sinks, including Chiribiquete National Park and Nukak-Maku Indigenous Reserve in Colombia, Sierra del Divisor National Park in Peru, and Canaima National Park in Venezuela.

In contrast, we found 1,439 areas (156 protected areas and 1,283 Indigenous territories) that served as significant carbon sources. It is important to note that some areas with little documented deforestation, such as Alto Purus National Park, may have carbon loss from natural causes.

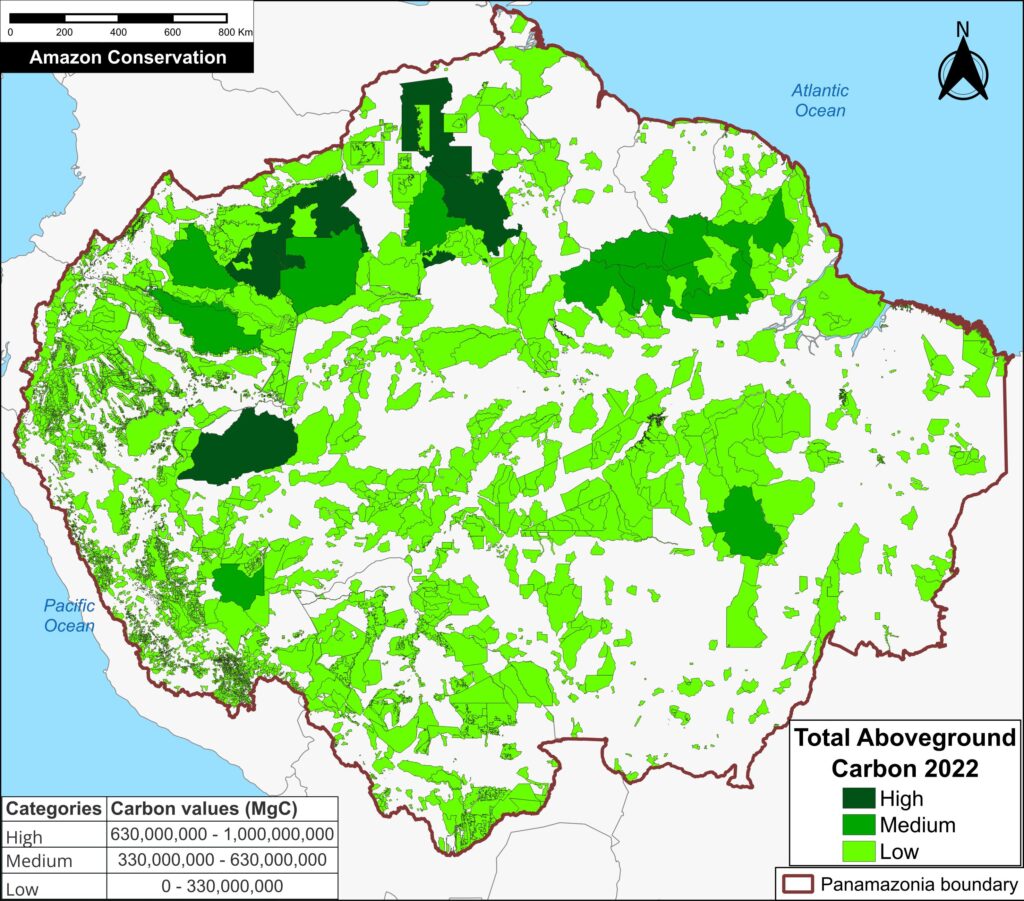
Figure 3. Total aboveground carbon stocks in each protected area and Indigenous territory. Data: Planet, ACA/MAAP.

Figure 3 offers the most recent snapshot of total aboveground carbon stocks in each protected area and Indigenous territory.

It presents data for 2022 categorized into three groups of High, Medium, and Low. Note that the highest carbon totals (over 330 million metric tons) are concentrated across the large designated areas of the northern Amazon.

These High and Medium carbon areas may be considered to have the highest overall conservation value purely in terms of total carbon.

See Annex 1 for specific areas with the highest carbon stocks as of 2022.


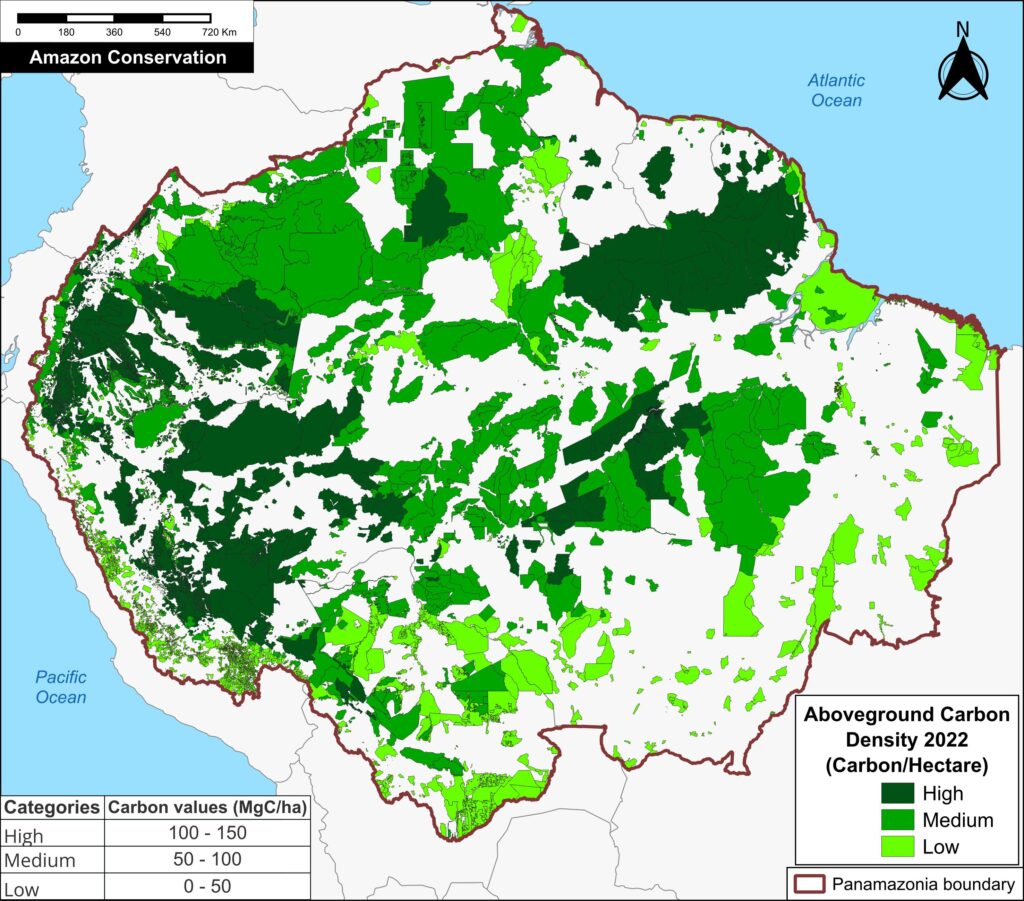
Figure 4. Aboveground carbon density in each protected area and Indigenous territory (2022). Data: Planet, ACA/MAAP

Finally, Figure 4 also displays the most recent data (2022) in each protected area and Indigenous territory, but standardized for area (aboveground carbon/hectare).

Note that the highest carbon totals (over 50 metric tons per hectare) are more evenly concentrated across the Amazon.

These High and Medium carbon areas may be considered to have the highest carbon conservation value per hectare.


Policy Implications:
Unlocking the Climate Value of Protected Areas and Indigenous Territories in the Amazon

Policy and finance for tropical forests as a climate solution have largely focused on reducing emissions from deforestation and forest degradation (REDD+). These efforts have made important strides in slowing and directing finance to tackle forest loss, particularly in high-deforestation regions. However, this emphasis on avoided emissions overlooks a critical component of the global carbon cycle: the carbon sink function (gaining of carbon over time) of primary tropical forests — which this analysis using Planet’s Forest Carbon Diligence data show is both measurable and significant.

This omission leaves a major flux in the carbon system—ongoing carbon sequestration in old-growth forests—outside the scope of existing market or non-market incentives. Critically, many of these carbon-absorbing forests are already located within established protected areas and indigenous territories. These areas are globally recognized for their importance in biodiversity conservation and for the stewardship provided by Indigenous Peoples and local communities. 

As global attention increasingly turns to engineered carbon removal strategies such as BECCS (Bioenergy with carbon capture and storage) and Direct Air Capture, there is an urgent need to recognize that Amazonian forests are already performing this function—naturally and at scale. Yet the value of Protected Areas and Indigenous territories as a potent carbon sink is neither monetized nor rewarded under current frameworks, unless they can demonstrate that they are under threat from deforestation or degradation in order to access REDD+ finance. An emerging exception is the High Integrity Forests Investment Initiative (HIFOR), which recognizes the value of carbon sequestration in old-growth forests, but does not generate tradable credits for each ton absorbed.5 The Tropical Forests Forever Fund (TFFF) proposed by Brazil for adoption at COP 30, would also reward forest countries at a rate of approximately US$ 4.00/year for every hectare of tropical forest they protect, regardless of whether they are under threat.6

To date, however, protected areas and Indigenous territories, despite their proven climate contribution, often lack the financial support necessary to ensure long-term effectiveness and resilience. As a result, they often face chronic underfunding,7 limiting their long-term effectiveness and resilience. Policy innovation is needed to close this gap and integrate the carbon sink function of mature forests into funding mechanisms for forest protection. Doing so would unlock meaningful incentives for the continued, long-term stewardship of these high-carbon ecosystems and would ensure that one of the planet’s most effective natural climate solutions receives the attention and resources it deserves.

Annex 1

Specific areas that were significant carbon sinks include:

Otishi, Sierra del Divisor, Güeppí-Sekime and Yaguas National Parks, Matsés, and Pucacuro National Reserves, Ashaninka Communal Reserve, and Cordillera Escalera and Alto Nanay- Pintuyacu Chambira Regional Conservation Area, Matses, Pampa Hermosa, and Yavarí – Tapiche Indigenous Reserves, and Kugapakori, Nahua, Nanti Territorial Reserve in Peru;

Amacayacu, Chiribiquete, Cahuinari, Rio Pure, and Yaigoje Apaporis National Parks, Nukak Natural Reserve, Amazonas Forest Reserve, and Putumayo and Nukak-Maku, Yaigoje Rio Apaporis and Vaupes Indigenous Reserve in Colombia;

Campos Amazônicos, Juruena, Mapinguari, Nascentes do Lago Jari, Serra do Divisor, and Montanhas do Tumucumaque National Parks, Amanã, Aripuanã, Crepori, Tapajós, and Tefé National Forests in Brazil, Itaituba and Jatuarana National Forests, and Alto Rio Negro, Baú, Aripuanã, Aripuanã, Apyterewa, Mundurucu, and Vale do Javari Indigenous Territories in Brazil.

Achuar Indigenous Territory and Zona Intangible Tagaeri – Taromenane in Ecuador; Manuripi Heath National Reserve and Takana, Takana II, and Yuracare Indigenous Reserves in Bolivia; Central Suriname and Sipaliwini Nature Reserves in Suriname; Canaima National Park in Venezuela; and Parc Amazonien de Guyane National Park in French Guiana, 

Specific areas with the highest carbon stocks, as of 2022, include:

Alto Purús, Manu, Sierra del Divisor, and Cordillera National Parks in Peru; Chiribiquete National Park in Colombia; Montanhas do Tumucumaque, Pico da Neblina, Jaú, and Juruena National Parks and Yanomami, Menkragnoti, Kayapó, Mundurucu, and Vale do Javari Indigenous Territories in Brazil; Caura and Canaima National Parks in Venezuela; and Parc Amazonien de Guyane National Park in French Guiana;

Methodology

We analyzed Planet Forest Carbon Diligence, a cutting-edge new dataset from the satellite-based company Planet, featuring a 10-year historical time series (2013 – 2022) with wall-to-wall estimates for aboveground carbon density at 30-meter resolution.3,4

One notable caveat of this data is that it does not distinguish aboveground carbon loss from natural vs human-caused drivers, so additional information may be incorporated to understand the context of each area. 

Based on these data, annual aboveground carbon values ​​were estimated in Amazonian protected areas and Indigenous territories to obtain a time series for 2013-2022. In addition, the Mann-Kendall test was used to analyze trends in the generated time series.

Our data source for protected areas and Indigenous territories is from RAISG (Amazon Network of Georeferenced Socio-Environmental Information), a consortium of civil society organizations in the Amazon countries. This source (accessed in December 2024) contains spatial data for 5,943 protected areas and Indigenous territories, covering 414.9 million hectares across the Amazon.

We determined that many of these areas (4,000) did not include creation date metadata, prohibiting any time-series control for that variable. Instead, we used the most current extent of protected areas and Indigenous territories as a proxy for those that existed from 2013 to 2022.

There was substantial overlap between protected areas and Indigenous territories, but we accounted for this to avoid double counting of the overlapping areas.

The aboveground carbon values for protected areas and Indigenous territories were calculated for each country and then summed across the Amazon.

The remaining areas were combined into the category of “Outside protected areas and Indigenous territories” and also calculated for each country and summed across the Amazon.

Our geographic range for the Amazon is a hybrid designed for maximum inclusion: biogeographic boundary (as defined by RAISG) for all countries, except for Bolivia and Peru, where we use the watershed boundary, and Brazil, where we use the Legal Amazon boundary. Our area estimate for this definition of the Amazon biome is 839.2 million hectares.

Notes

1 Breaking down the results by category, protected areas contained nearly 21.1 billion metric tons of aboveground carbon as of 2022, gaining over 204 million metric tons since 2013, while Indigenous territories contained over 16.8 billion metric tons of aboveground carbon as of 2022, gaining over 132 million metric tons since 2013. Note that protected areas and Indigenous territories overlap in many areas.

2 Standardizing for area (that is, calculating the results per hectare), protected areas and Indigenous territories contained 82.2 metric tons of aboveground carbon per hectare as of 2022, gaining a net 0.6 metric tons per hectare since 2013. In contrast, areas outside of protected areas and Indigenous territories contained 53.2 metric tons of aboveground carbon per hectare as of 2022, losing a net 0.6 metric tons per hectare since 2013.

3 Anderson C (2024) Forest Carbon Diligence: Breaking Down the Validation and Intercomparison Report. https://www.planet.com/pulse/forest-carbon-diligence-breaking-down-the-validation-and-intercomparison-report/

4 In terms of the limitations of Planet’s Forest Carbon Diligence data, Duncanson et al (2025) recently wrote a Letter in Science focused on spatial resolution for forest carbon maps. Given the natural constraint of the size of a tree, they discuss the challenge of pixel-level validation below 5 meters for forest carbon monitoring. The authors state that spatial resolution should at minimum exceed the crown diameter of a typical large tree, which is about 20 meters for tropical forests. In this sense, the 30-meter product exceeds this limitation.

Duncanson et al (2025) Spatial resolution for forest carbon maps. Science 387: 370-71.

5 WCS High Integrity Forest Investment Initiative (HIFOR): The Science Basis

6 https://www.bloomberg.com/news/newsletters/2025-04-04/too-big-to-fell-brazil-takes-trees-to-wall-street?cmpid=BBD040425_GR

7 UNEP-WCMC, IUCN, and NGS. (2022). Protected Planet Report 2022. Cambridge, UK: UNEP-WCMC.

Acknowledgments

Through a generous sharing agreement with the satellite company Planet, we have been granted access to this data across the entire Amazon biome for the analysis presented in this series.

We thank colleagues from the following organizations for helpful comments on this report: Planet, Conservación Amazónica – ACCA, Conservación Amazónica -ACEAA, Gaia Amazonas, Ecociencia, and Instituto del Bien Común.

We especially thank colleagues at Conservación Amazónica – ACCA for help with the 10-year data analysis.

This report was made possible by the generous support of the Norwegian Agency for Development Cooperation (NORAD)

Citation

Bodin B, Finer M, Castillo H, Mamani N (2025) Carbon in the Amazon (part 4): Protected Areas & Indigenous Territories. MAAP: 225.

MAAP Synthesis #3: Deforestation in the Andean Amazon (Trends, Hotspots, Drivers)

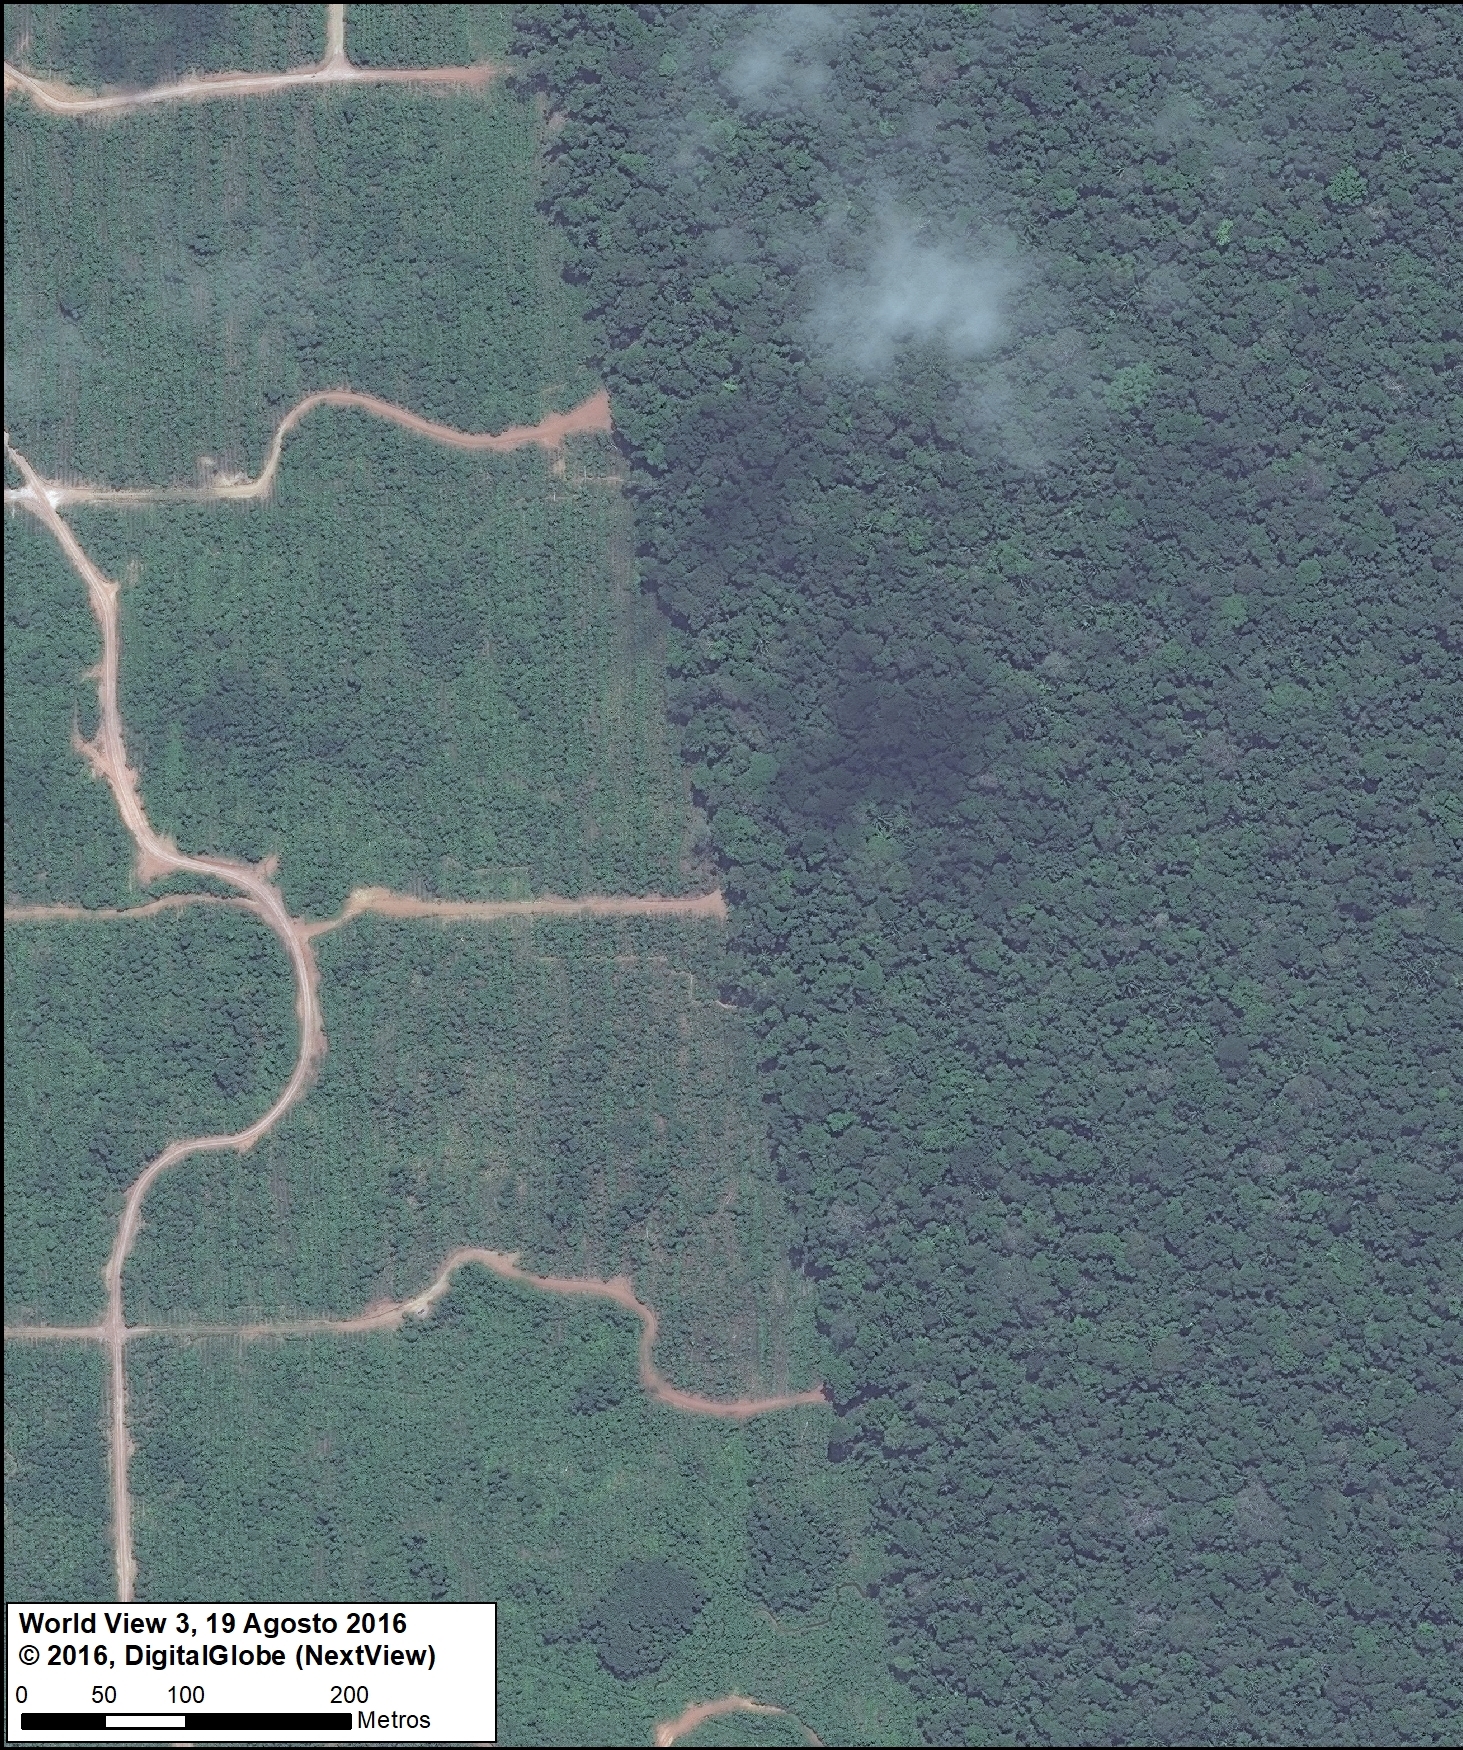
Satellite image of the deforestation produced by United Cacao. Source: DigitalGlobe (Nextview)

MAAP, an initiative of the organization Amazon Conservation, uses cutting-edge satellite technology to monitor deforestation in near real-time in the megadiverse Andean Amazon (Peru, Colombia, Ecuador, and Bolivia).

The monitoring is based on 5 satellite systems: Landsat (NASA/USGS), Sentinel (European Space Agency), PeruSAT-1, and the companies Planet and DigitalGlobe. For more information about our innovative methodology, see this recent paper in Science Magazine.

Launched in 2015, MAAP has published nearly 100 high-impact reports on the major Amazonian deforestation issues of the day.

Here, we present our third annual synthesis report with the objective to concisely describe the bigger picture: Deforestation trends, patterns, hotspots and drivers across the Andean Amazon.

Our principal findings include:

Trends: Deforestation across the Andean Amazon has reached 4.2 million hectares (10.4 million acres) since 2001. Annual deforestation has been increasing in recent years, with a peak in 2017 (426,000 hectares). Peru has had the highest annual deforestation, followed by surging Colombia (in fact, Colombia surpassed Peru in 2017). The vast majority of the deforestation events are small-scale (‹5 hectares).

Hotspots: We present the first regional-scale deforestation hotspots map for the Andean Amazon, allowing for spatial comparisons between Peru, Colombia, and Ecuador.  We discuss six of the most important hotspots.

Drivers: We present MAAP Interactive, a dynamic map with detailed information on the major deforestation drivers: gold mining, agriculture (oil palm and cacao), cattle ranching, logging, and dams. Agriculture and ranching cause the most widespread impact across the region, while gold mining is most intense southern Peru.

Climate Change. We estimated the loss of 59 million metric tons of carbon in the Peruvian Amazon during the last five years (2013-17) due to forest loss. In contrast, we also show that protected areas and indigenous lands have safeguarded 3.17 billion metric tons of carbon.

I. Deforestation Trends

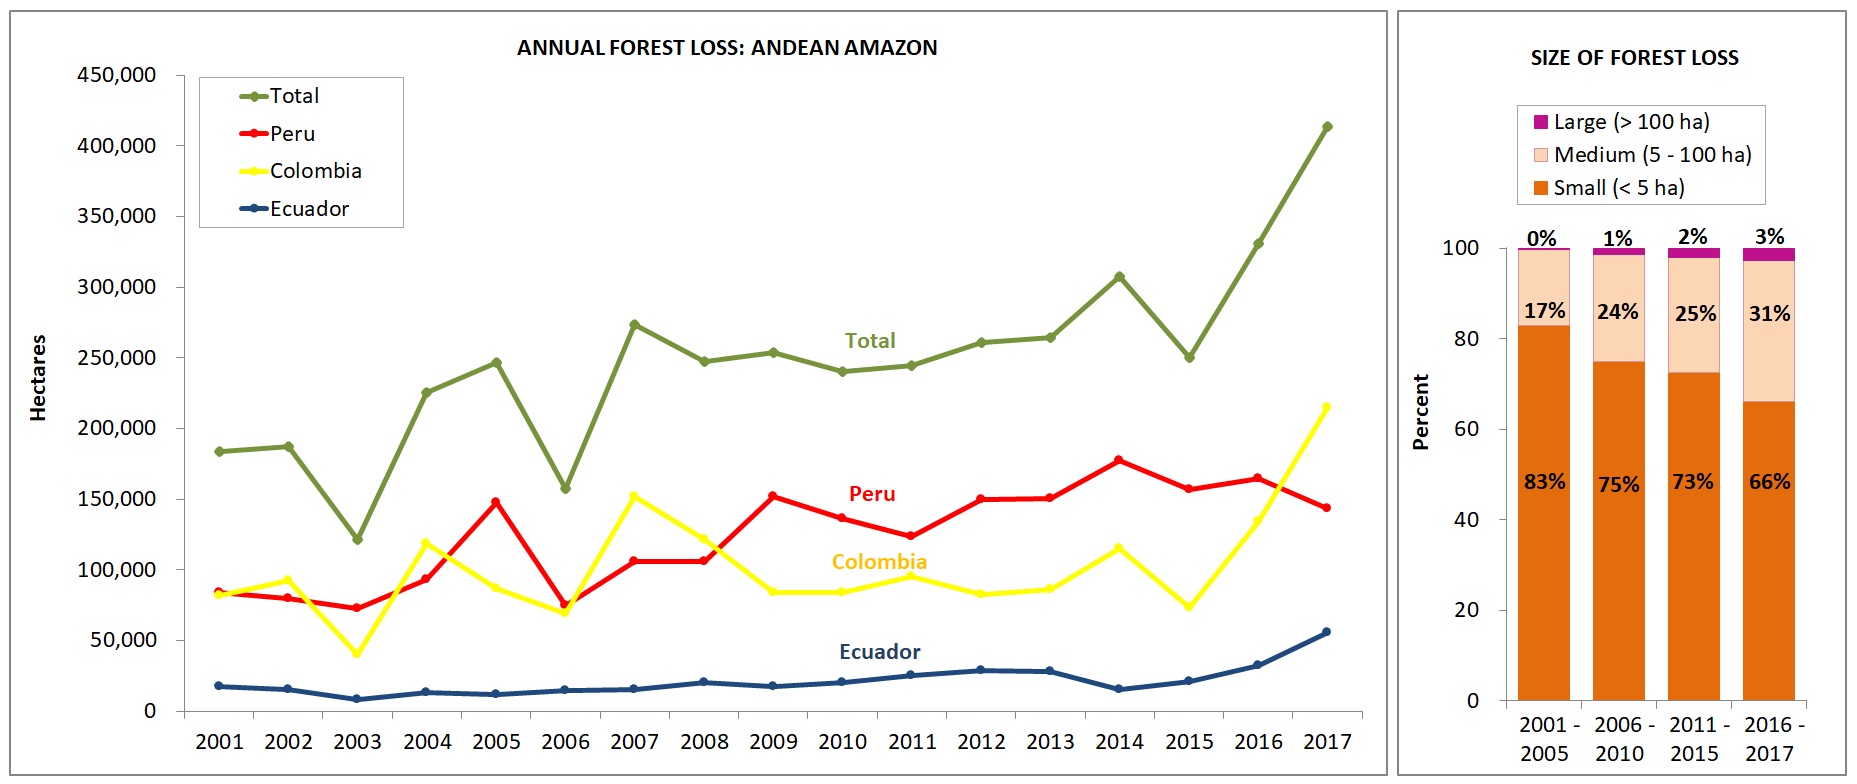
Image 1 shows forest loss trends in the Andean Amazon between 2001 and 2017.*  The left graph shows data by country, while the right graph shows data by forest loss event size.

Image 1. Annual forest loss by country and size. Data: Hansen/UMD/Google/USGS/NASA, UMD/GLAD, Global Forest Watch, MINAM/PNCB, RAISG.

Trends by Country

Over the past 17 years (2001-2017), deforestation has surpassed 4.2 million hectares (10.4 million acres) in the Andean Amazon (see green line). Of this total, 50% is Peru (2.1 million hectares/5.2 million acres), 41% Colombia (1.7 million hectares/4.27 million acres), and 9% Ecuador (887,000 acres/359,000 hectares). This analysis did not include Bolivia.

Since 2007, there has been an increasing deforestation trend, peaking during the past two years (2016-17). In fact, 2017 has the highest annual forest loss on record with 426,000 hectares (over one million acres), more than double the total forest loss in 2006.

Peru had the highest average annual Amazonian deforestation between 2009 and 2016. The past four years have the highest annual deforestation totals on record in the country, with peaks in 2014 (177,566 hectares/439,000 acres) and 2016 (164,662 hectares/406,888 acres). According to new data from the Peruvian Environment Ministry, there was an important decline in 2017 (155,914 hectares/385,272 acres), but it is still the fourth highest annual total on record.

There has been a surge of deforestation in Colombia during the past two years. Note that in 2017, Colombia surpassed Peru with a record high of 214,700 hectares (530,400 acres) deforested.

Deforestation is also increasing in Ecuador, with highs of 32,000 hectares (79,000 acres) in 2016 and 55,500 hectares (137,000) acres in 2017.

For context, Brazil has had an average deforestation loss rate of 639,403 hectares (1.58 million acres) over the past several years.

* Data: Colombia & Ecuador: Hansen/UMD/Google/USGS/NASA; Peru: MINAM/PNCB, UMD/GLAD. While this information includes natural forest loss events, it serves as our best estimate of deforestation resulting from anthropogenic causes.  It is estimated that the non-anthropic loss comprises approximately 3.5% of the total loss. Note that the analysis does not include Bolivia.

Trends by Size

The pattern related to the size of deforestation events in the Andean Amazon remained relatively consistent over the last 17 years. Most noteworthy: the vast majority (74%) of the deforestation events are small-scale (‹5 hectares). Only 2% of deforestation events are large-scale (>100 hectares). The remaining 24% are medium-scale (5-100 hectares).

These results are important for conservation efforts.  Addressing this complex situation – in which most of the deforestation events are small-scale – requires significantly more attention and resources.  In addition, while large-scale deforestation (usually associated with agro-industrial practices) is not that common, it nonetheless represents a serious latent threat, due to the fact that only a small number of agro-industrial projects (for example, oil palm) are able to rapidly destroy thousands of acres of primary forest.

II. Deforestation Hotspots

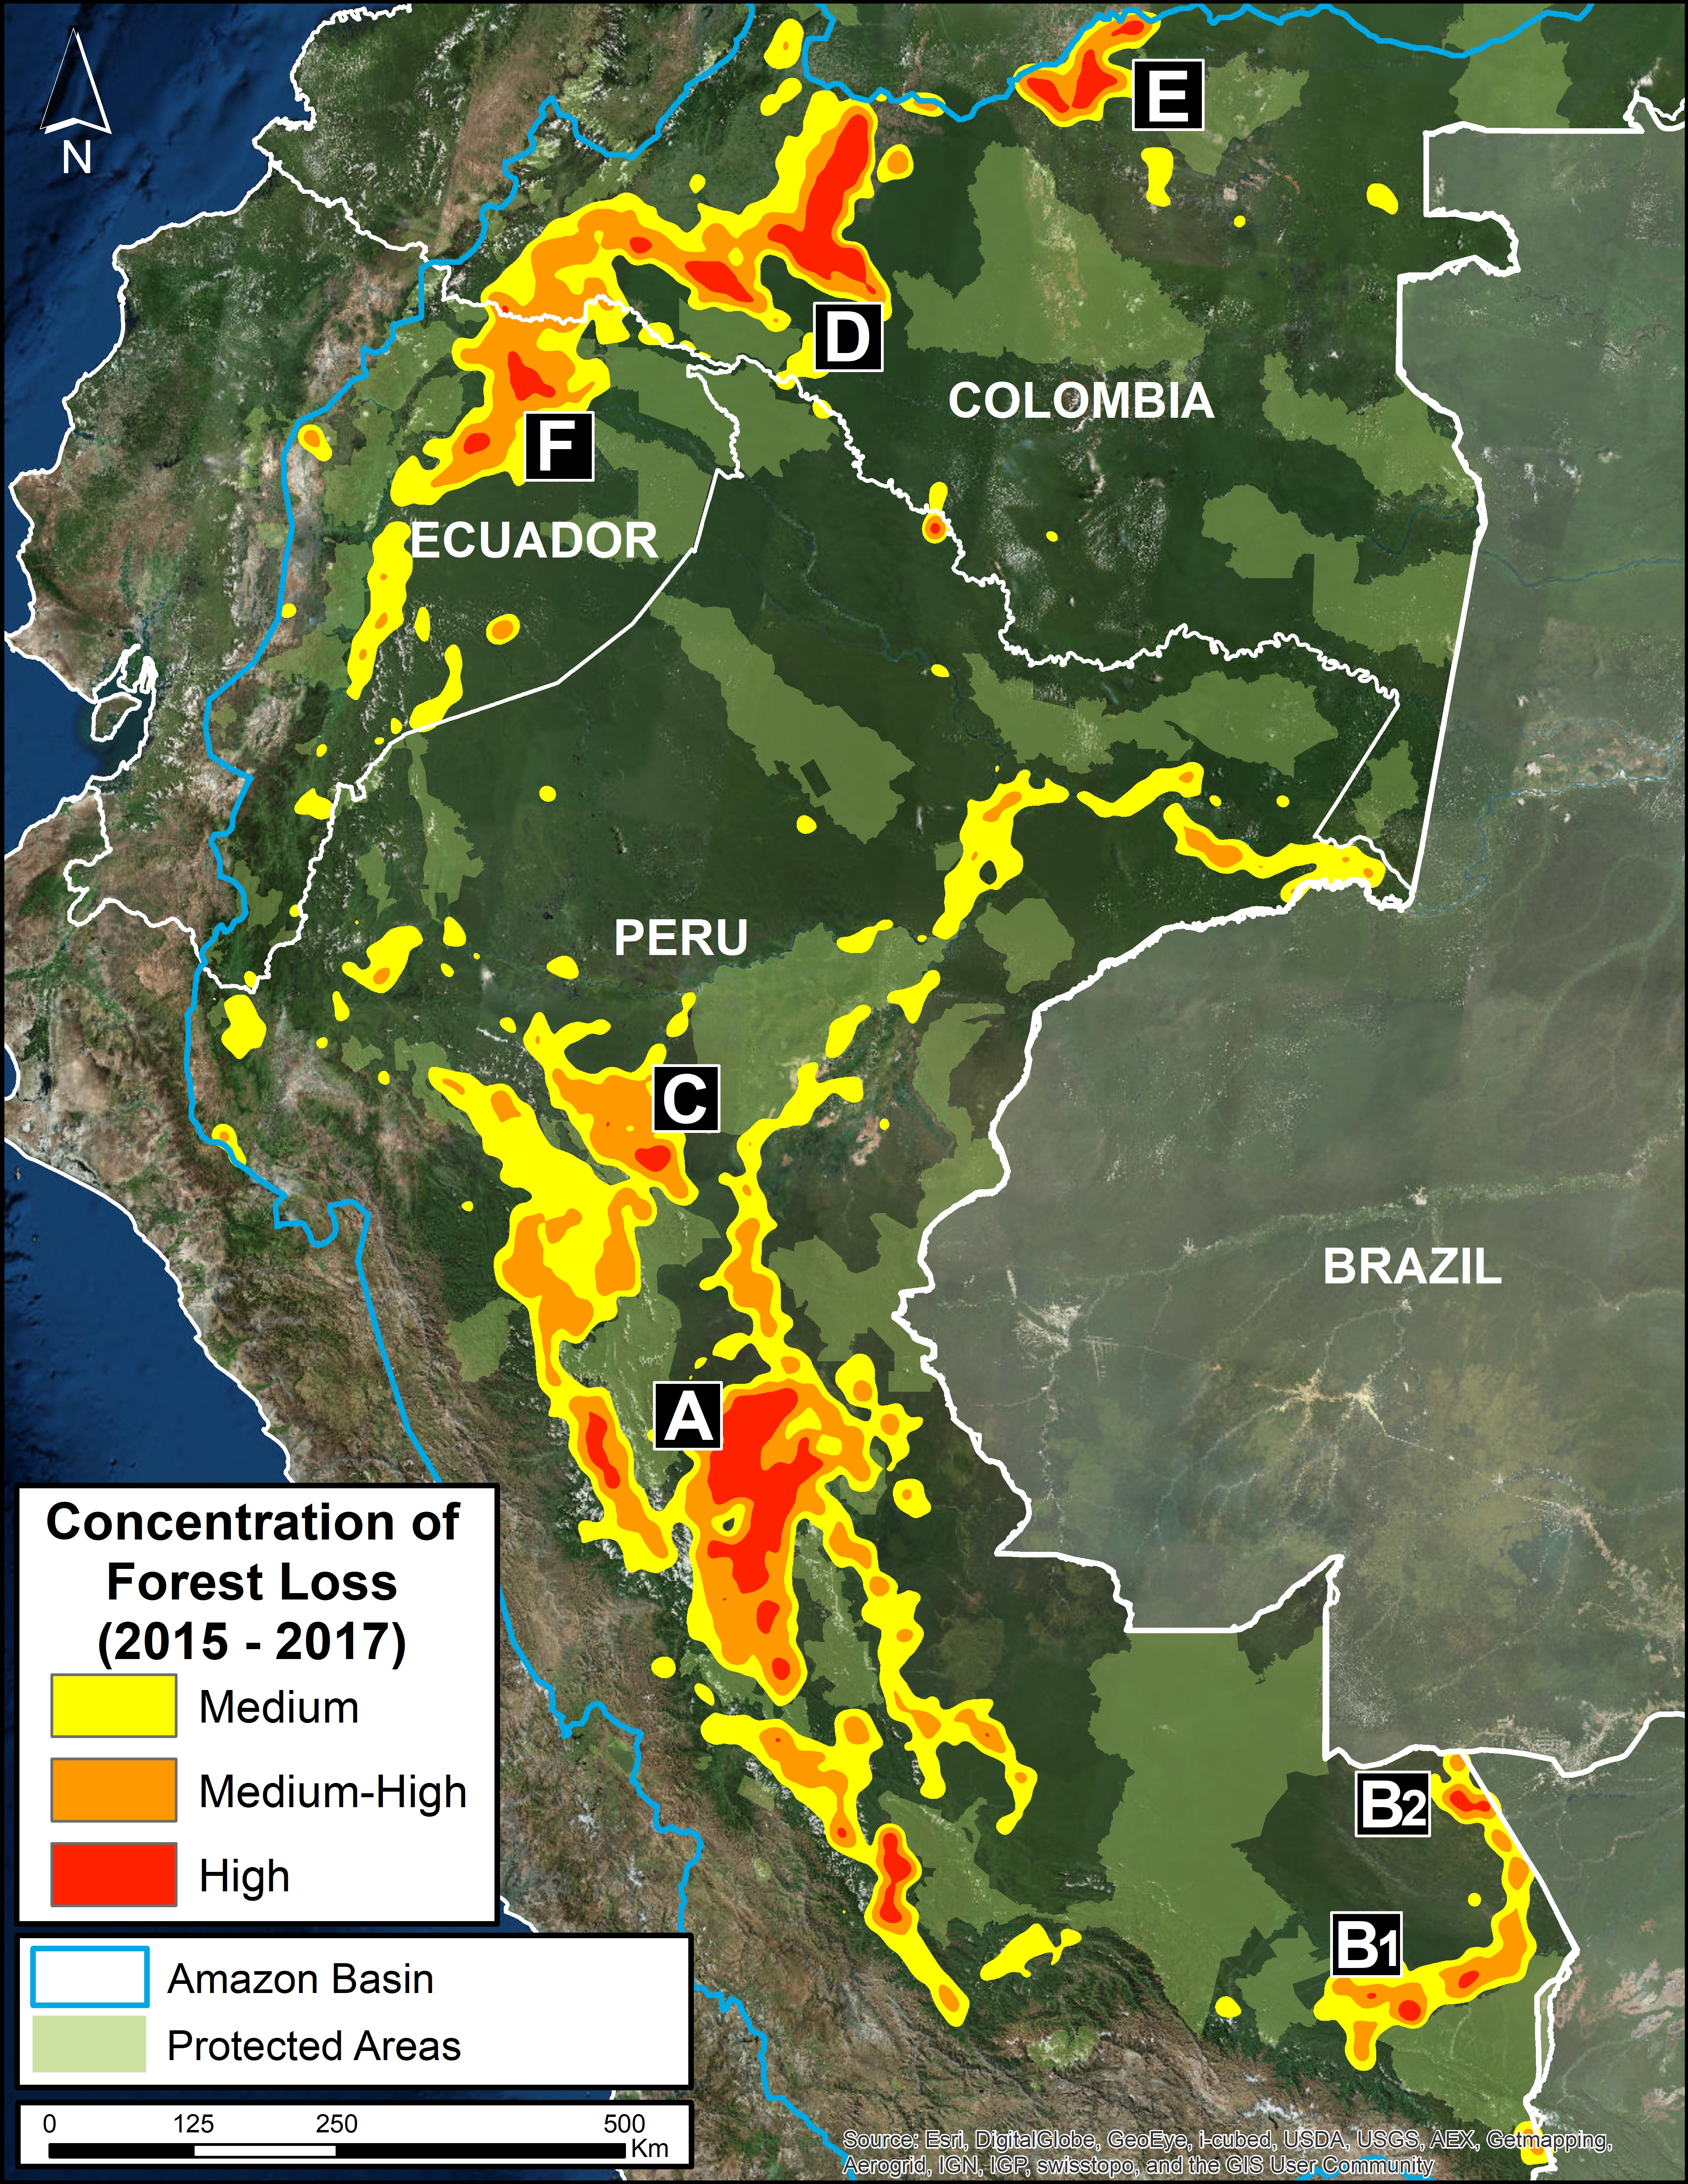
Image 2: Deforestation hotspots 2015-2017. Data: Hansen/UMD/Google/USGS/NASA.

We present the first regional-scale deforestation hotspots map across the Andean Amazon (Colombia, Ecuador, Peru).  Image 2 shows the results for the past three, 2015 – 2017.

The most critical zones (“high” deforestation density) are indicated in red. They include:

A. Central Peruvian Amazon: Over the last 10 years, this zone, located in the Ucayali and Huánuco regions, has consistently had one of the largest concentrations of deforestation in Peru (Inset A).  Its principal drivers include oil palm and cattle grazing.

B. Southern Peruvian Amazon: This zone, located in the Madre de Dios region, is impacted by gold mining (Inset B1), and increasingly by small- and medium-scale agriculture along the Interoceanic Highway (Inset B2).

C. Central Peruvian Amazon: A new oil palm plantation located in the San Martín region has been identified as a recent large-scale deforestation event in this zone (Inset C).

D. Southwestern Colombian Amazon: Cattle grazing is the principal deforestation driver documented in this zone, located in the departments of Caquetá and Putumayo (Inset D).

E. Northern Colombian Amazon: There is expanding deforestation along a new road in this zone, located in the department of Guaviare (Inset E).

F. Northern Ecuadoran Amazon: This zone is located in the Orellana province, where small- and medium-scale agriculture, including oil palm, is the principal driver of deforestation (Inset F).


III. Drivers of Deforestation     

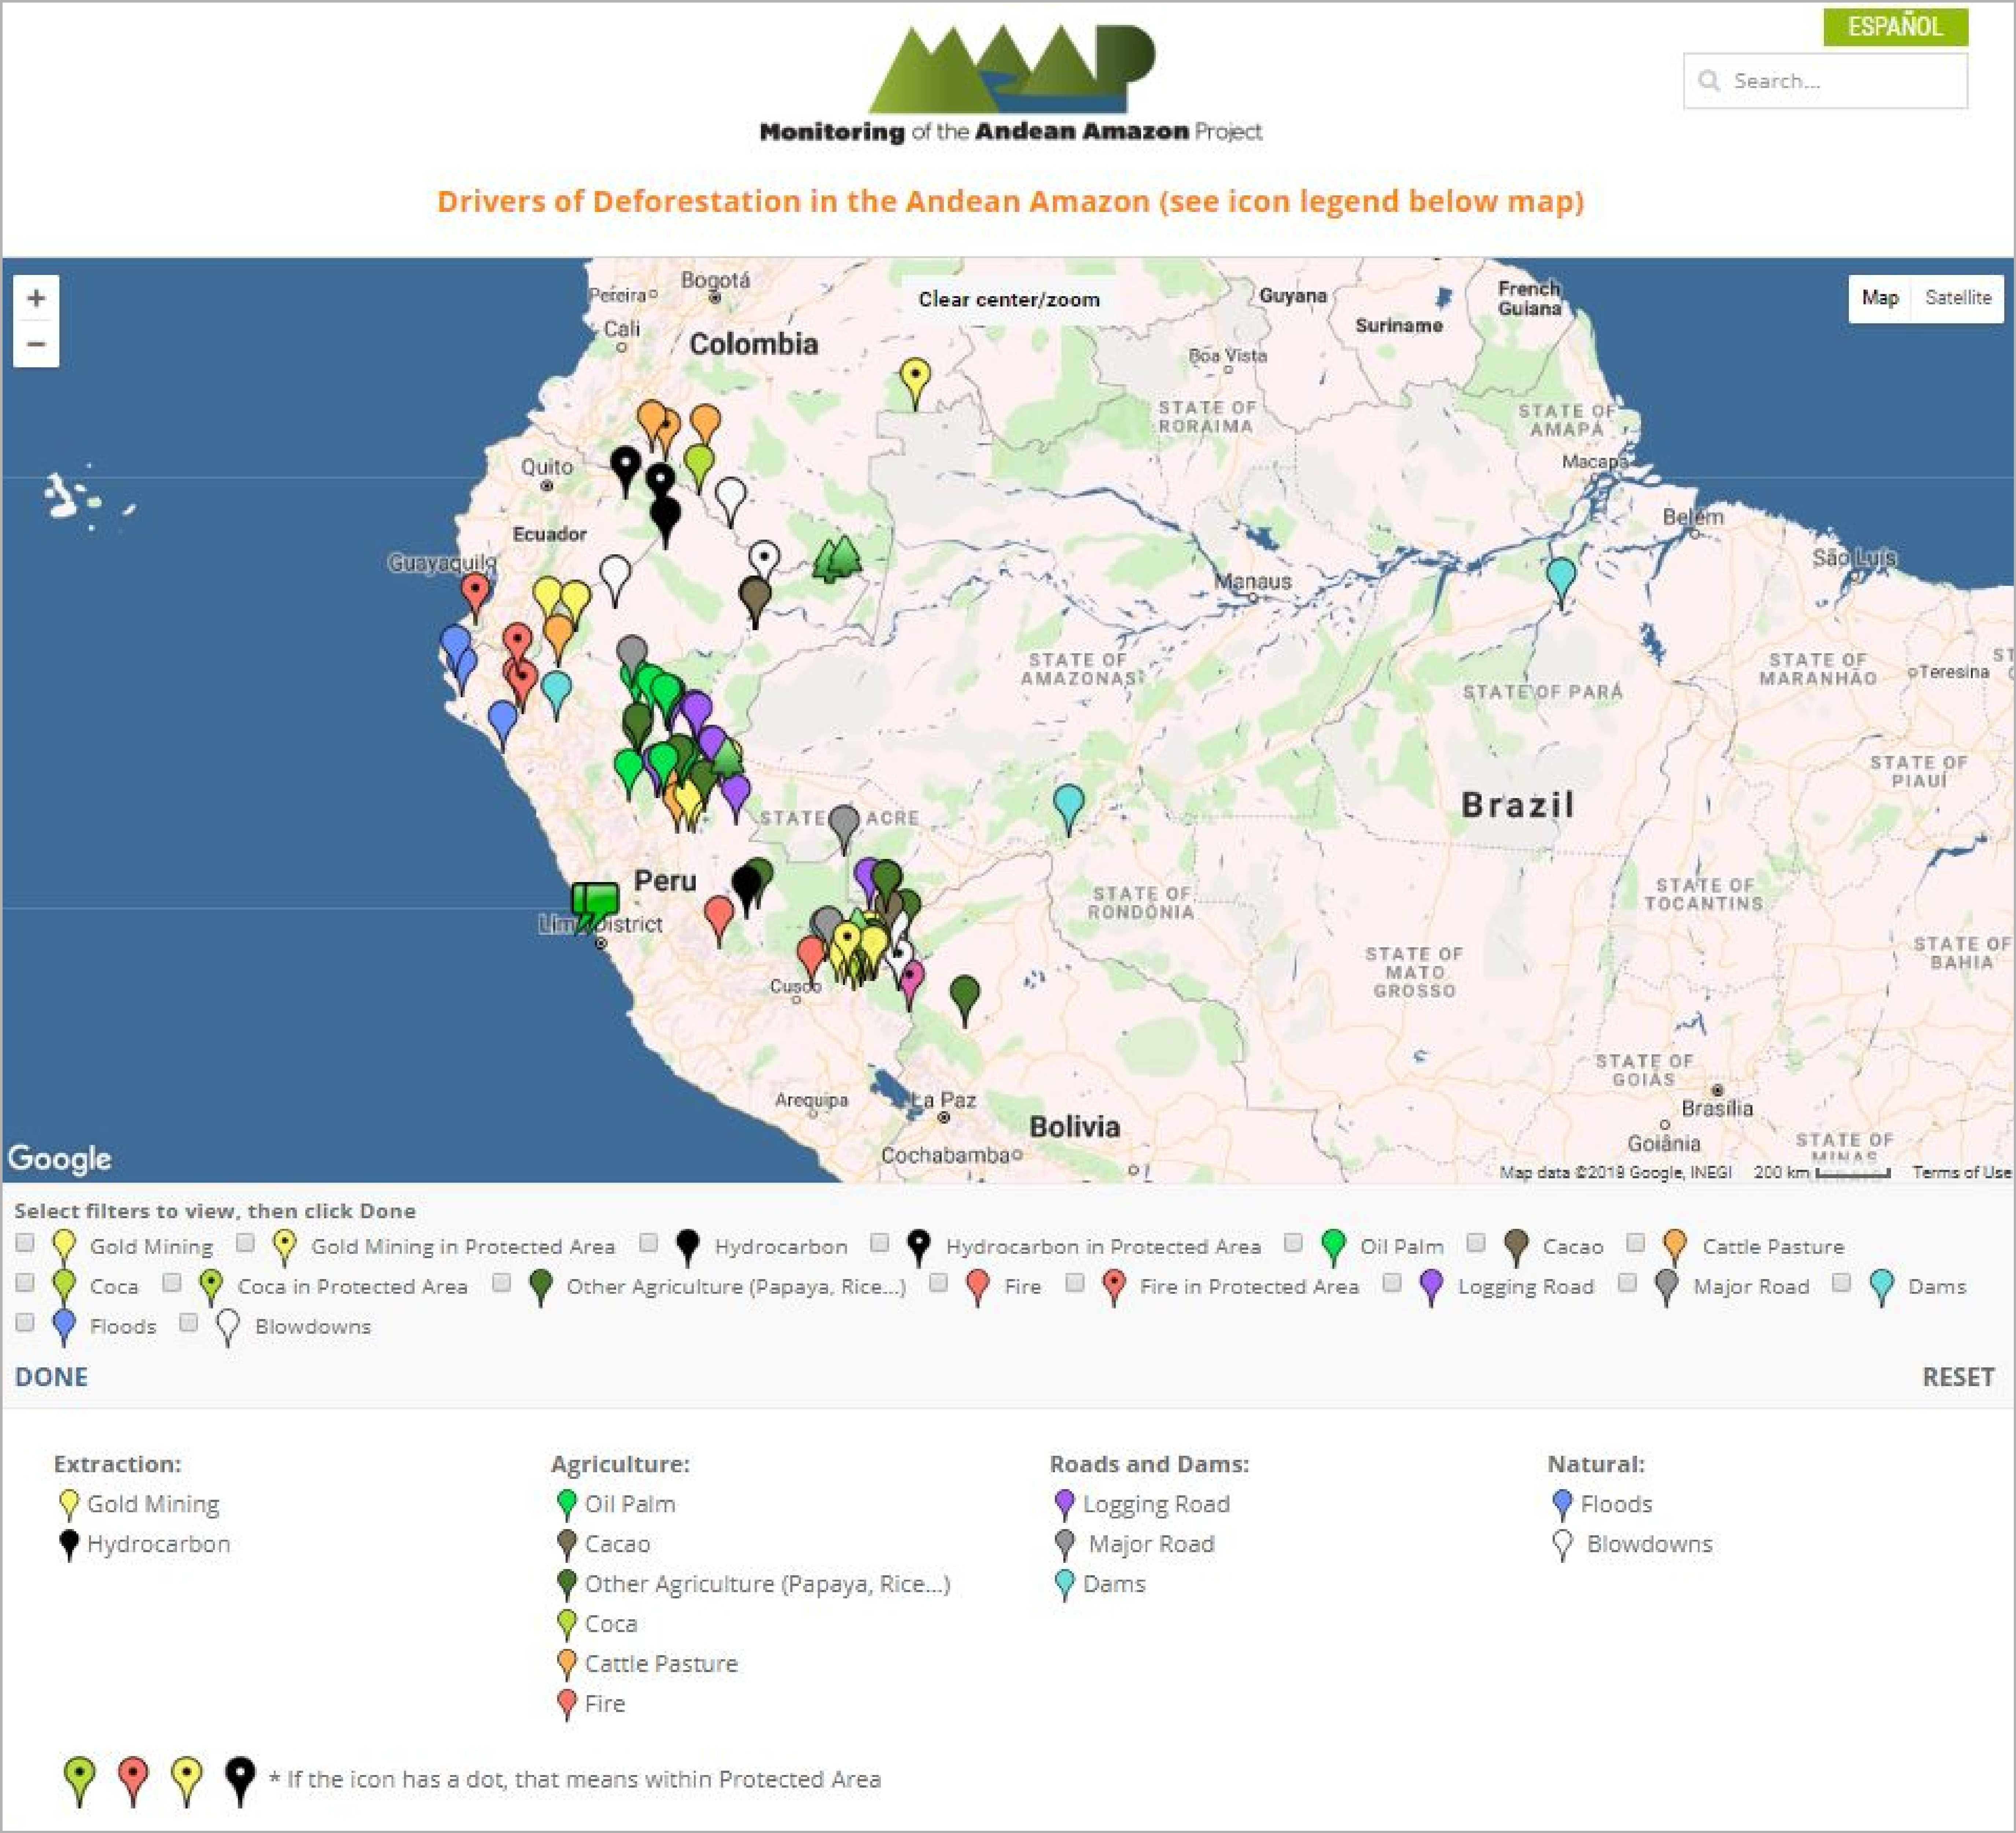
MAAP Interactive (screenshot)

One of the main objectives of MAAP is to improve the availability of precise and up-to-date information regarding the current drivers (causes) of deforestation in the Andean Amazon.  Indeed, one of our most important advances has been the use of high-resolution imagery to identify current deforestation drivers.

In order to improve the analysis and understanding of the identified drivers, we have created an Interactive Map that displays the spatial location of each driver associated with every MAAP report.  An important characteristic of this map is the ability to filter the data by driver, by selecting the boxes of interest.

Image 3 shows a screenshot of the Interactive Map.  Note that it contains detailed information on these principal drivers: gold mining, oil palm, cacao, small-scale agriculture, cattle pasture, logging roads, and dams.  It also includes natural causes such as floods, forest fires, and blowdowns.  In addition, it highlights deforestation events in protected areas.

Below, we discuss the principal drivers of deforestation and degradation in greater detail.


Agriculture  oil palm, cacao, and other crops

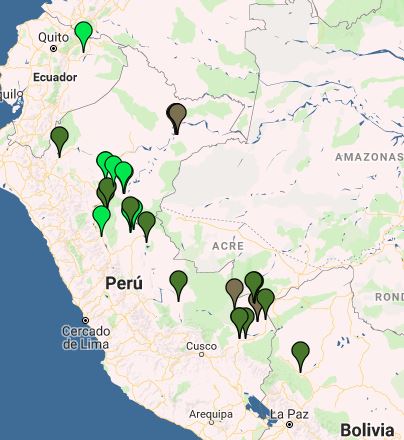
Image 4: Interactive Map, agriculture. Data: MAAP.

Image 4 shows the results of the interactive map when applying the agriculture-related filters.

Legend:
Oil palm (bright green)
Cacao (brown)
Other crops (dark green)

Agricultural activity is one of the principal causes of deforestation in the Andean Amazon.

The majority of agriculture-related deforestation is caused by small- and medium-scale plantations (‹50 hectares).

Deforestation for large-scale, agro-industrial plantations is much less common, but represents a critical latent threat.


Large-scale Agriculture

We have documented five major deforestation events produced by large-scale plantations since 2007:  four of these occurred in Peru (three of which are related to oil palm and one to cacao) and one in Bolivia (resulting from sugar cane plantations).

First, between 2007 and 2011, two large-scale oil palm plantations caused the deforestation of 7,000 hectares on the border between Loreto and San Martín (MAAP #16).  Subsequent plantations in the surrounding area caused the additional deforestation of 9,800 hectares.

It is importnat to note that the Peruvian company Grupo Palmas is now working towards a zero deforestation value chain and has a new sustainability policy (see Case C of MAAP #64).

Next, between 2012 and 2015, two other large-scale oil palm plantations deforested 12,000 hectares in Ucayali  (MAAP #4, MAAP #41).

Between 2013 and 2015, the company United Cacao deforested 2,380 hectares for cacao plantations in Loreto (MAAP #9, MAAP #13, MAAP #27, MAAP #35).

Deforestation from large-scale agriculture decreased in Peru between 2016 and 2017, but there was one notable event: an oil palm plantation of 740 hectares in San Martín (MAAP #78).

Another notable case of deforestation related to large-scale agriculture has been occurring in Bolivia, where a new sugarcane plantation has caused the deforestation of more than 2,500 hectares in the department of La Paz.

Additionally, we found three new zones in Peru characterized by the deforestation pattern produced by the construction of organized access roads which have the potential of becoming large-scale agriculture areas (MAAP #69).

Small and Medium-scale Agriculture

Deforestation caused by small- and medium-scale agriculture is much more widespread, but it is often difficult to identify the driver from satellite imagery.

We have identified some specific cases of oil palm in Huánuco, Ucayali, Loreto, and San Martín (MAAP #48, MAAP #26, MAAP #16).

Cacao and papaya are emerging drivers in Madre de Dios.  We have documented cacao deforestation along the Las Piedras River (MAAP #23, MAAP #40) and papaya along the Interoceanic Highway (MAAP #42).

Corn and rice cultivation appear to be turning the area around the town of Iberia into a deforestation hotspot (MAAP #28).  In other cases, we have documented deforestation resulting from small- and medium-scale agriculture, though it has not been possible to identify the type of crop (MAAP #75, MAAP #78).

Additionally, small-scale agriculture is possibly a determining factor in the forest fires that degrade the Amazon during the dry season (MAAP #45, MAAP #47).

The cultivation of illicit coca is a cause of deforestation in some areas of Peru and Colombia.  For example, in southern Peru, the cultivation of coca is generating deforestation within the Bahuaja Sonene National Park and its surrounding areas.

Cattle Ranching

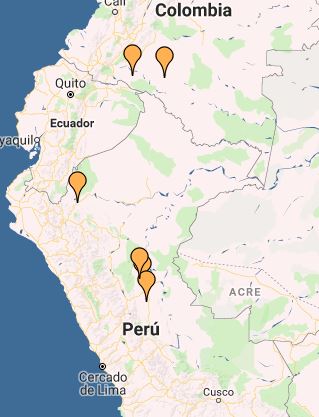
Image 5: Interactive Map, cattle ranching. Data: MAAP.

By analyzing high-resolution satellite imagery, we have developed a methodology for identifying areas deforestated by cattle ranching.*

Image 5 shows the results of the Interactive Map when applying the “Cattle pasture” filter, indicating the documented examples in Peru and Colombia.

Legend:
Cattle ranching (orange)

Cattle ranching is the principal driver of deforestation in the central Peruvian Amazon (MAAP #26, MAAP #37, MAAP #45, MAAP #78). We also identified recent deforestation from cattle ranching in northeastern Peru (MAAP #78).

In the Colombian Amazon, cattle ranching is one the primary direct drivers in the country’s most intense deforestation hotspots (MAAP #63, MAAP #77).

* Immediately following a major deforestation event, the landscape of felled trees is similar for both agriculture and cattle pasture.  However, by studying an archive of images and going back in time to analyze older deforestation cases, it is possible to distinguish between the drivers.  For example, after one or two years, agriculture and cattle pasture appear very different in the images. Ther former tends to have organized rows of new plantings, while the latter is mostly grassland.


Gold Mining

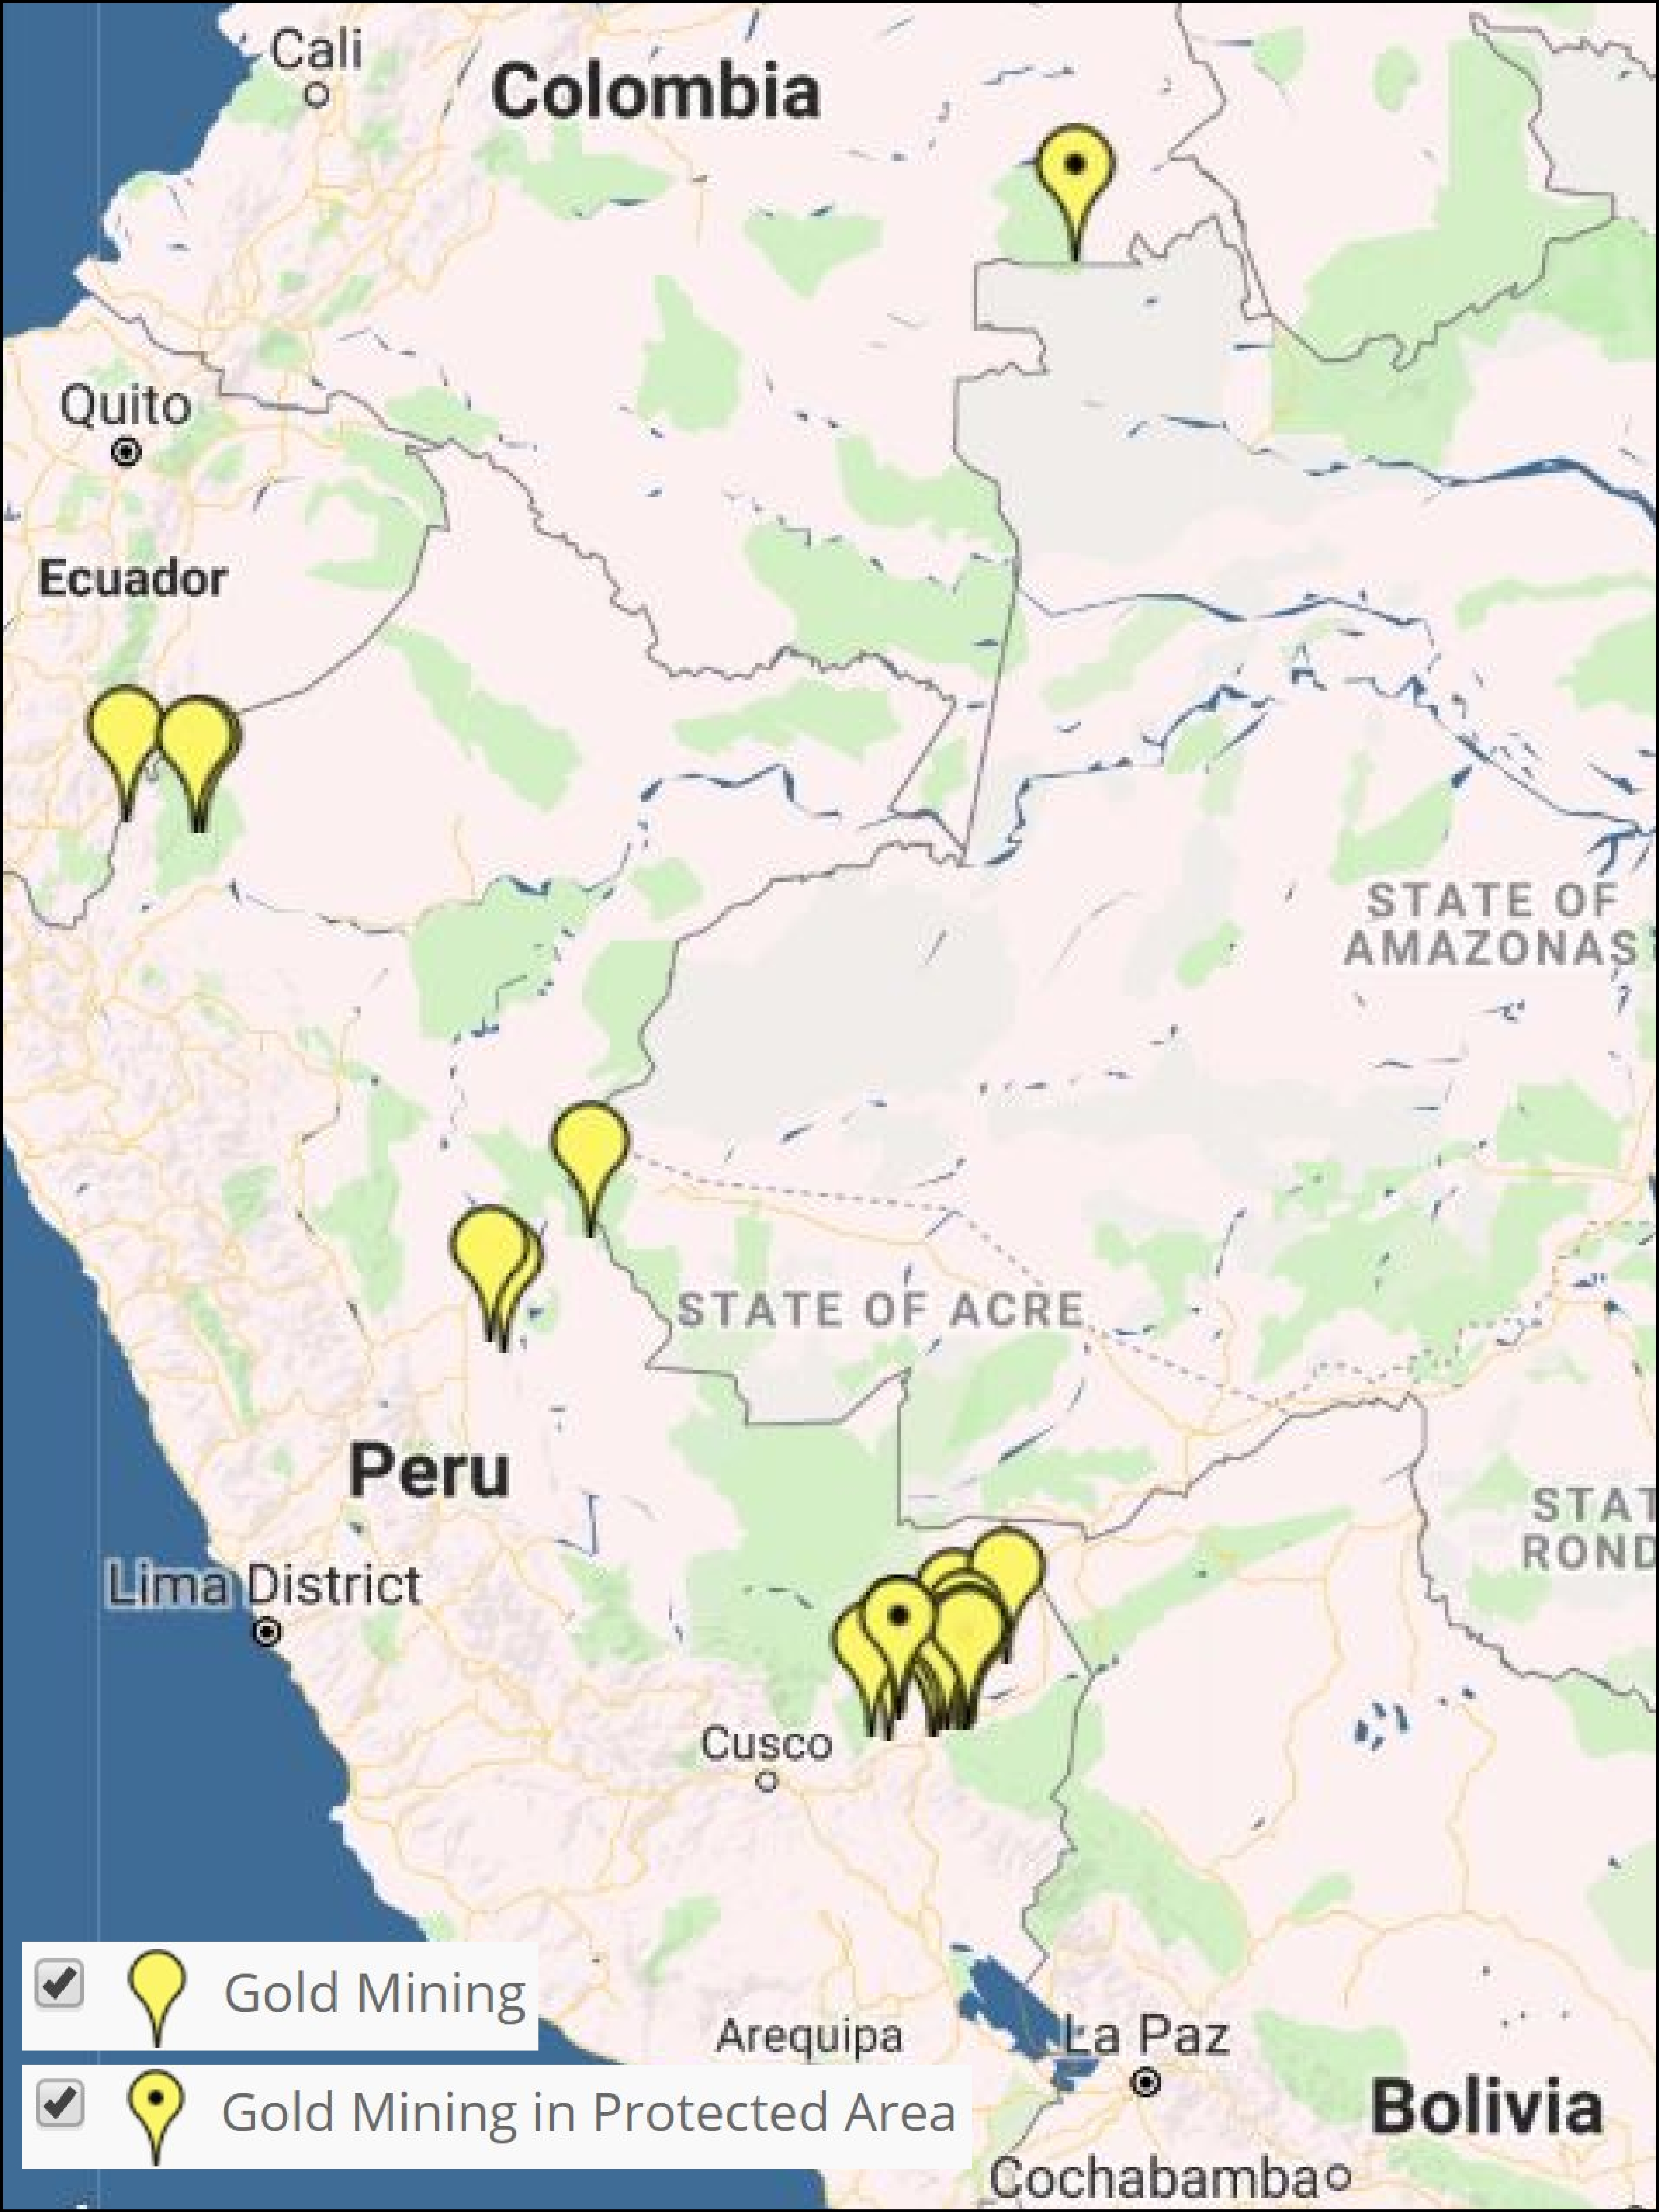
Image 6: Interactive Map, gold mining. Data: MAAP.

Image 6 shows the results of the Interactive Map when applying the “Gold mining” filter.

Legend:
Gold Mining (yellow)
*With dot indicates within protected area

The area that has been most impacted by gold mining is clearly the southern Peruvian Amazon, where we estimate the total deforestation of more than 63,800 hectares. Of this, at least 7,000 hectares have been lost since 2013.  The two most critical zones are La Pampa and Alto Malinowski in Madre de Dios (MAAP #87, MAAP #75, MAAP #79).  Another critical area exists in Cusco in the buffer zone of the Amarakaeri Communal Reserve, where mining deforestation is now less than one kilometer from the boundary of the protected area (MAAP #71).

It is important to highlight two important cases in which the Peruvian government has taken effective actions to halt illegal mining within protected areas (MAAP #64).  In September 2015, illegal miners invaded Tambopata National Reserve and deforested 550 hectares over the course of a two-year period.  At the end of 2016, the government intensified its interventions and the invasion was halted in 2017. In regards to Amarakaeri Communal Reserve, in June 2015 we revealed the mining invasion deforestation of 11 hectares.  Over the course of the following weeks, SERNANP and ECA Amarakaeri implemented measures and rapidly halted the illegal activity.

Other small gold-mining fronts are emerging in the northern and central Peruvian Amazon (MAAP #45, MAAP #49).

In addition, we have also documented deforestation linked to illegal gold-mining activities in the Puinawai National Park in the Colombian Amazon.

Logging

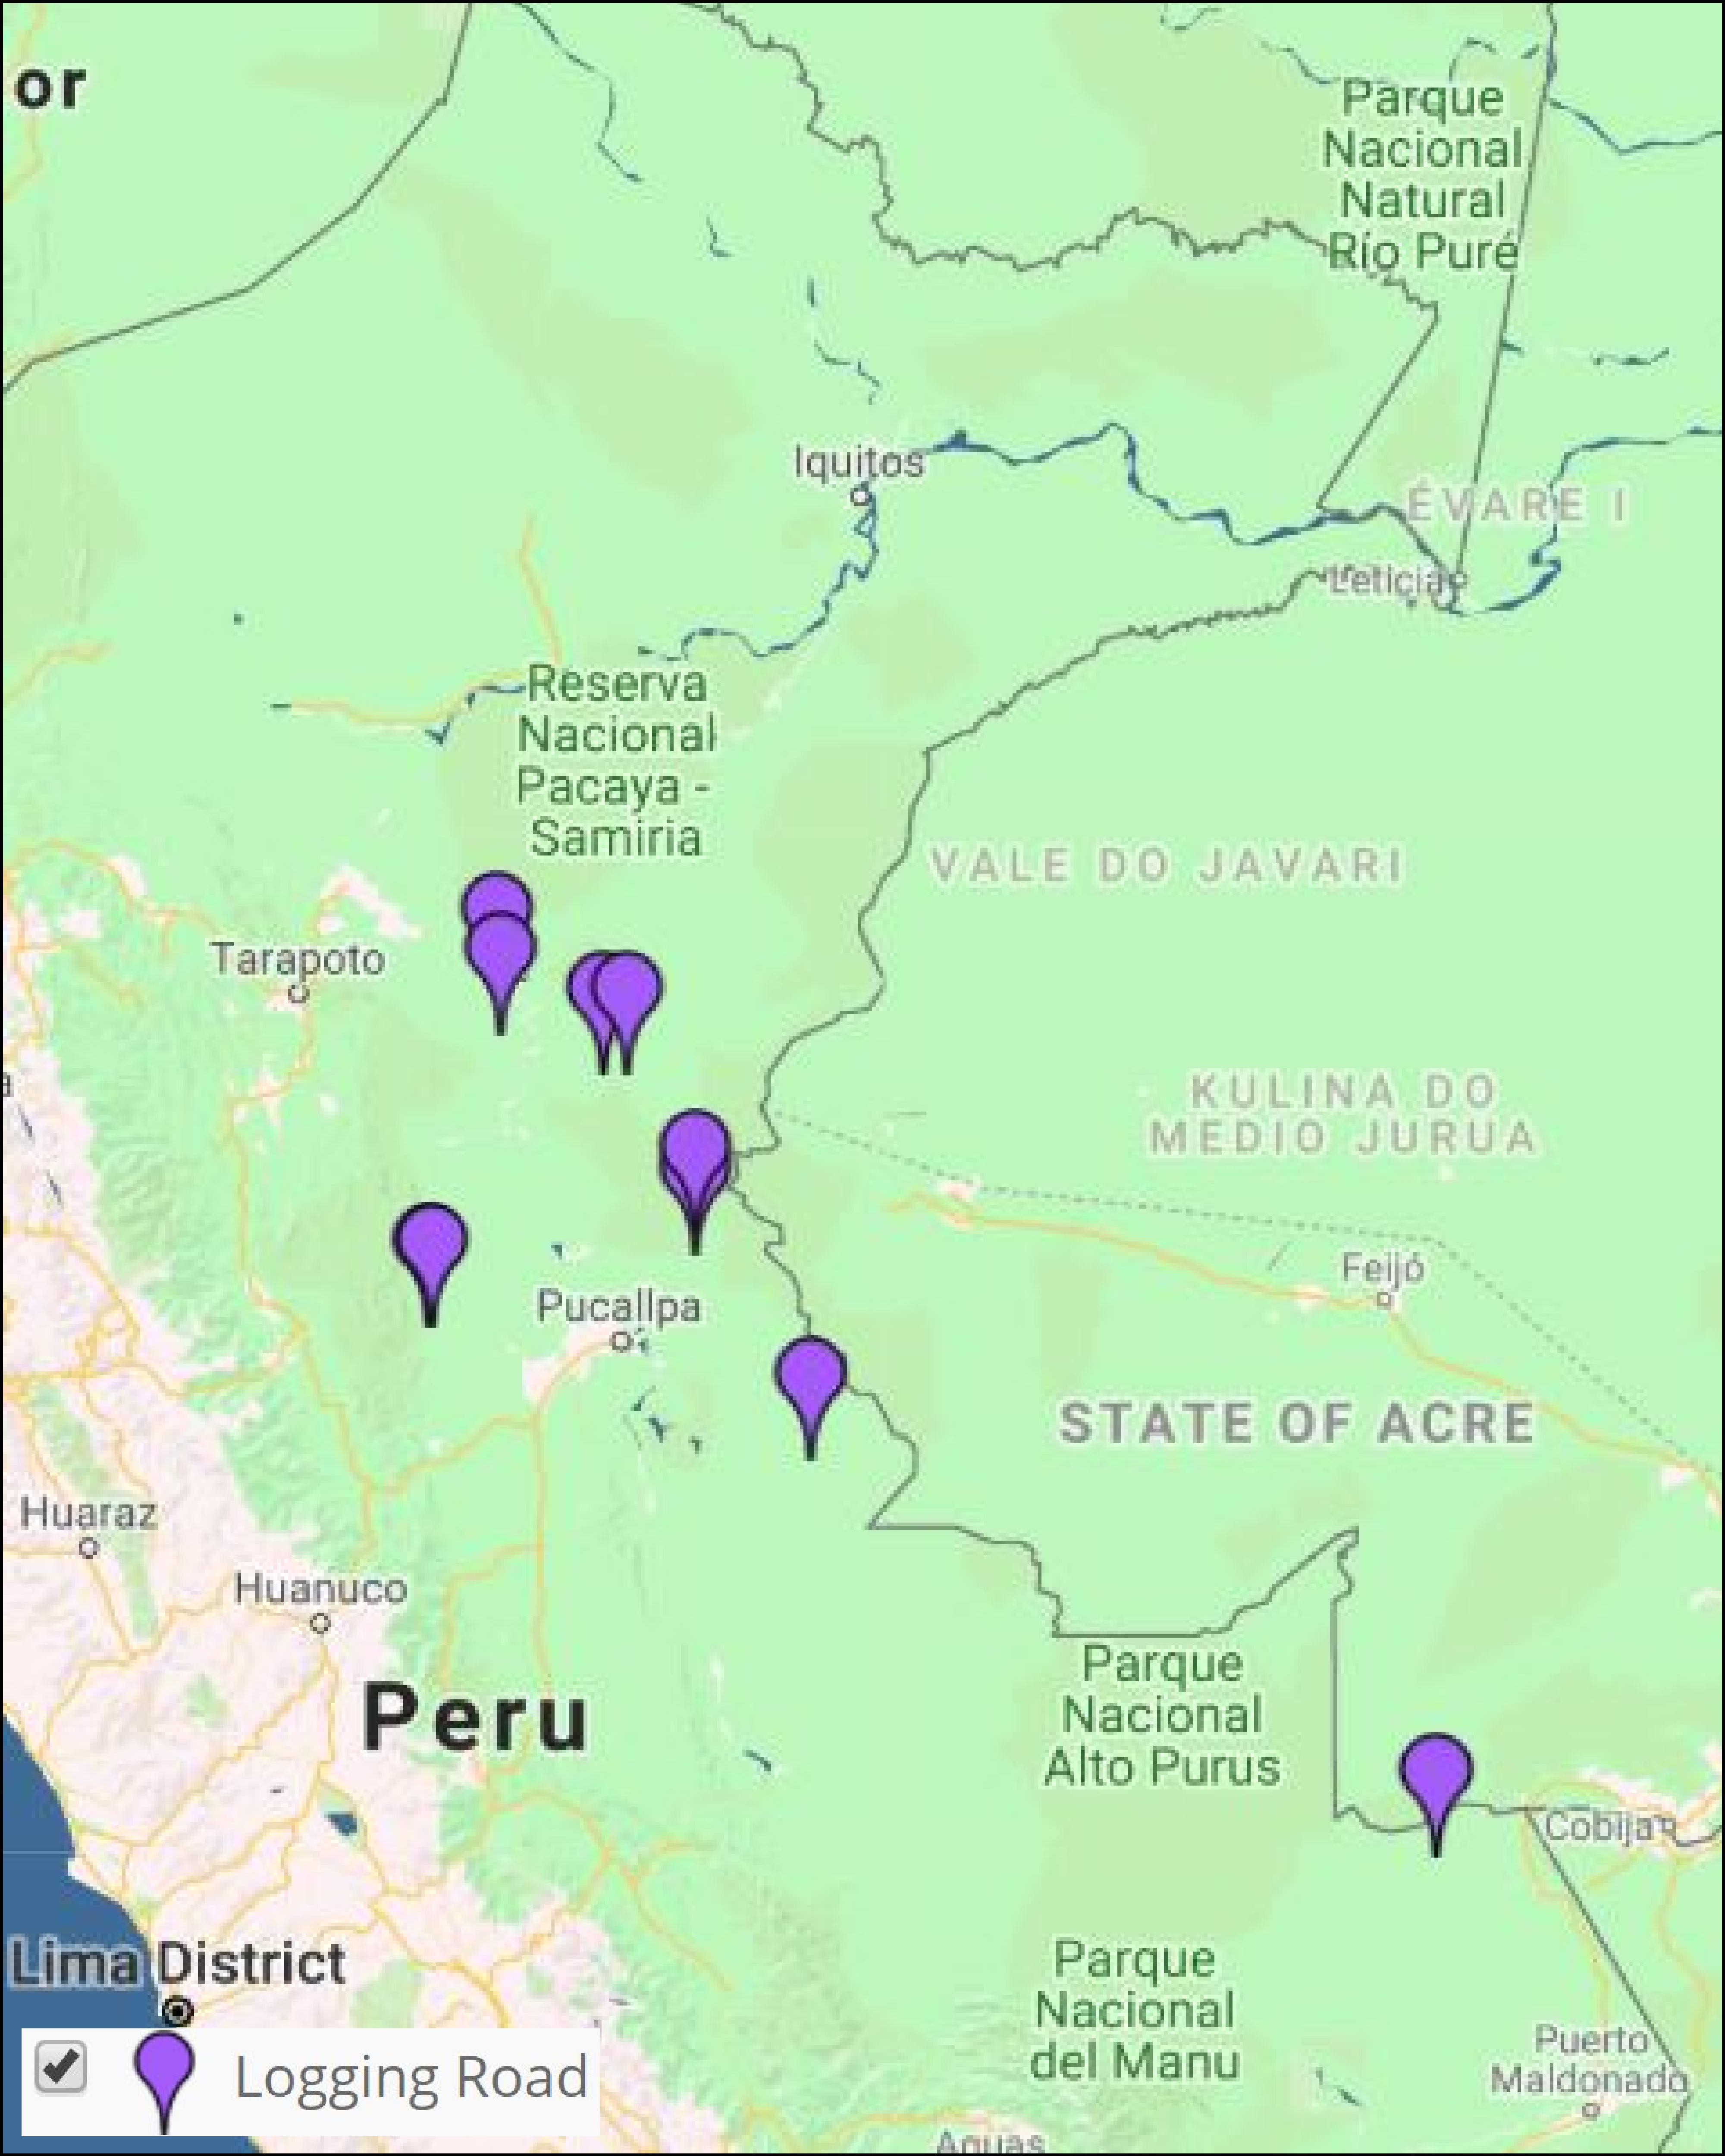
Image 7: Interactive Map, logging roads. Data: MAAP.

In MAAP #85 we proposed a new tool to address illegal logging in the Peruvian Amazon: utilize satellite imagery to monitor construction of logging roads in near real-time.

Image 7 shows the results of the Interactive Map when applying the “Logging roads” filter.

Legend:
Logging Road (purple)

We estimate that 2,200 kilometers of forest roads have been constructed in the Peruvian Amazon during the last three years (2015-2017).  The roads are concentrated in southern Loreto, Ucayali, and northwestern Madre de Dios.


Roads

Image 8: Interactive map, roads. Data: MAAP.

It has been well-documented that roads are one of the most important drivers of deforestation in the Amazon, particularly due to the fact that they facilitate human access and activities related to agriculture, cattle ranching, mining, and logging.

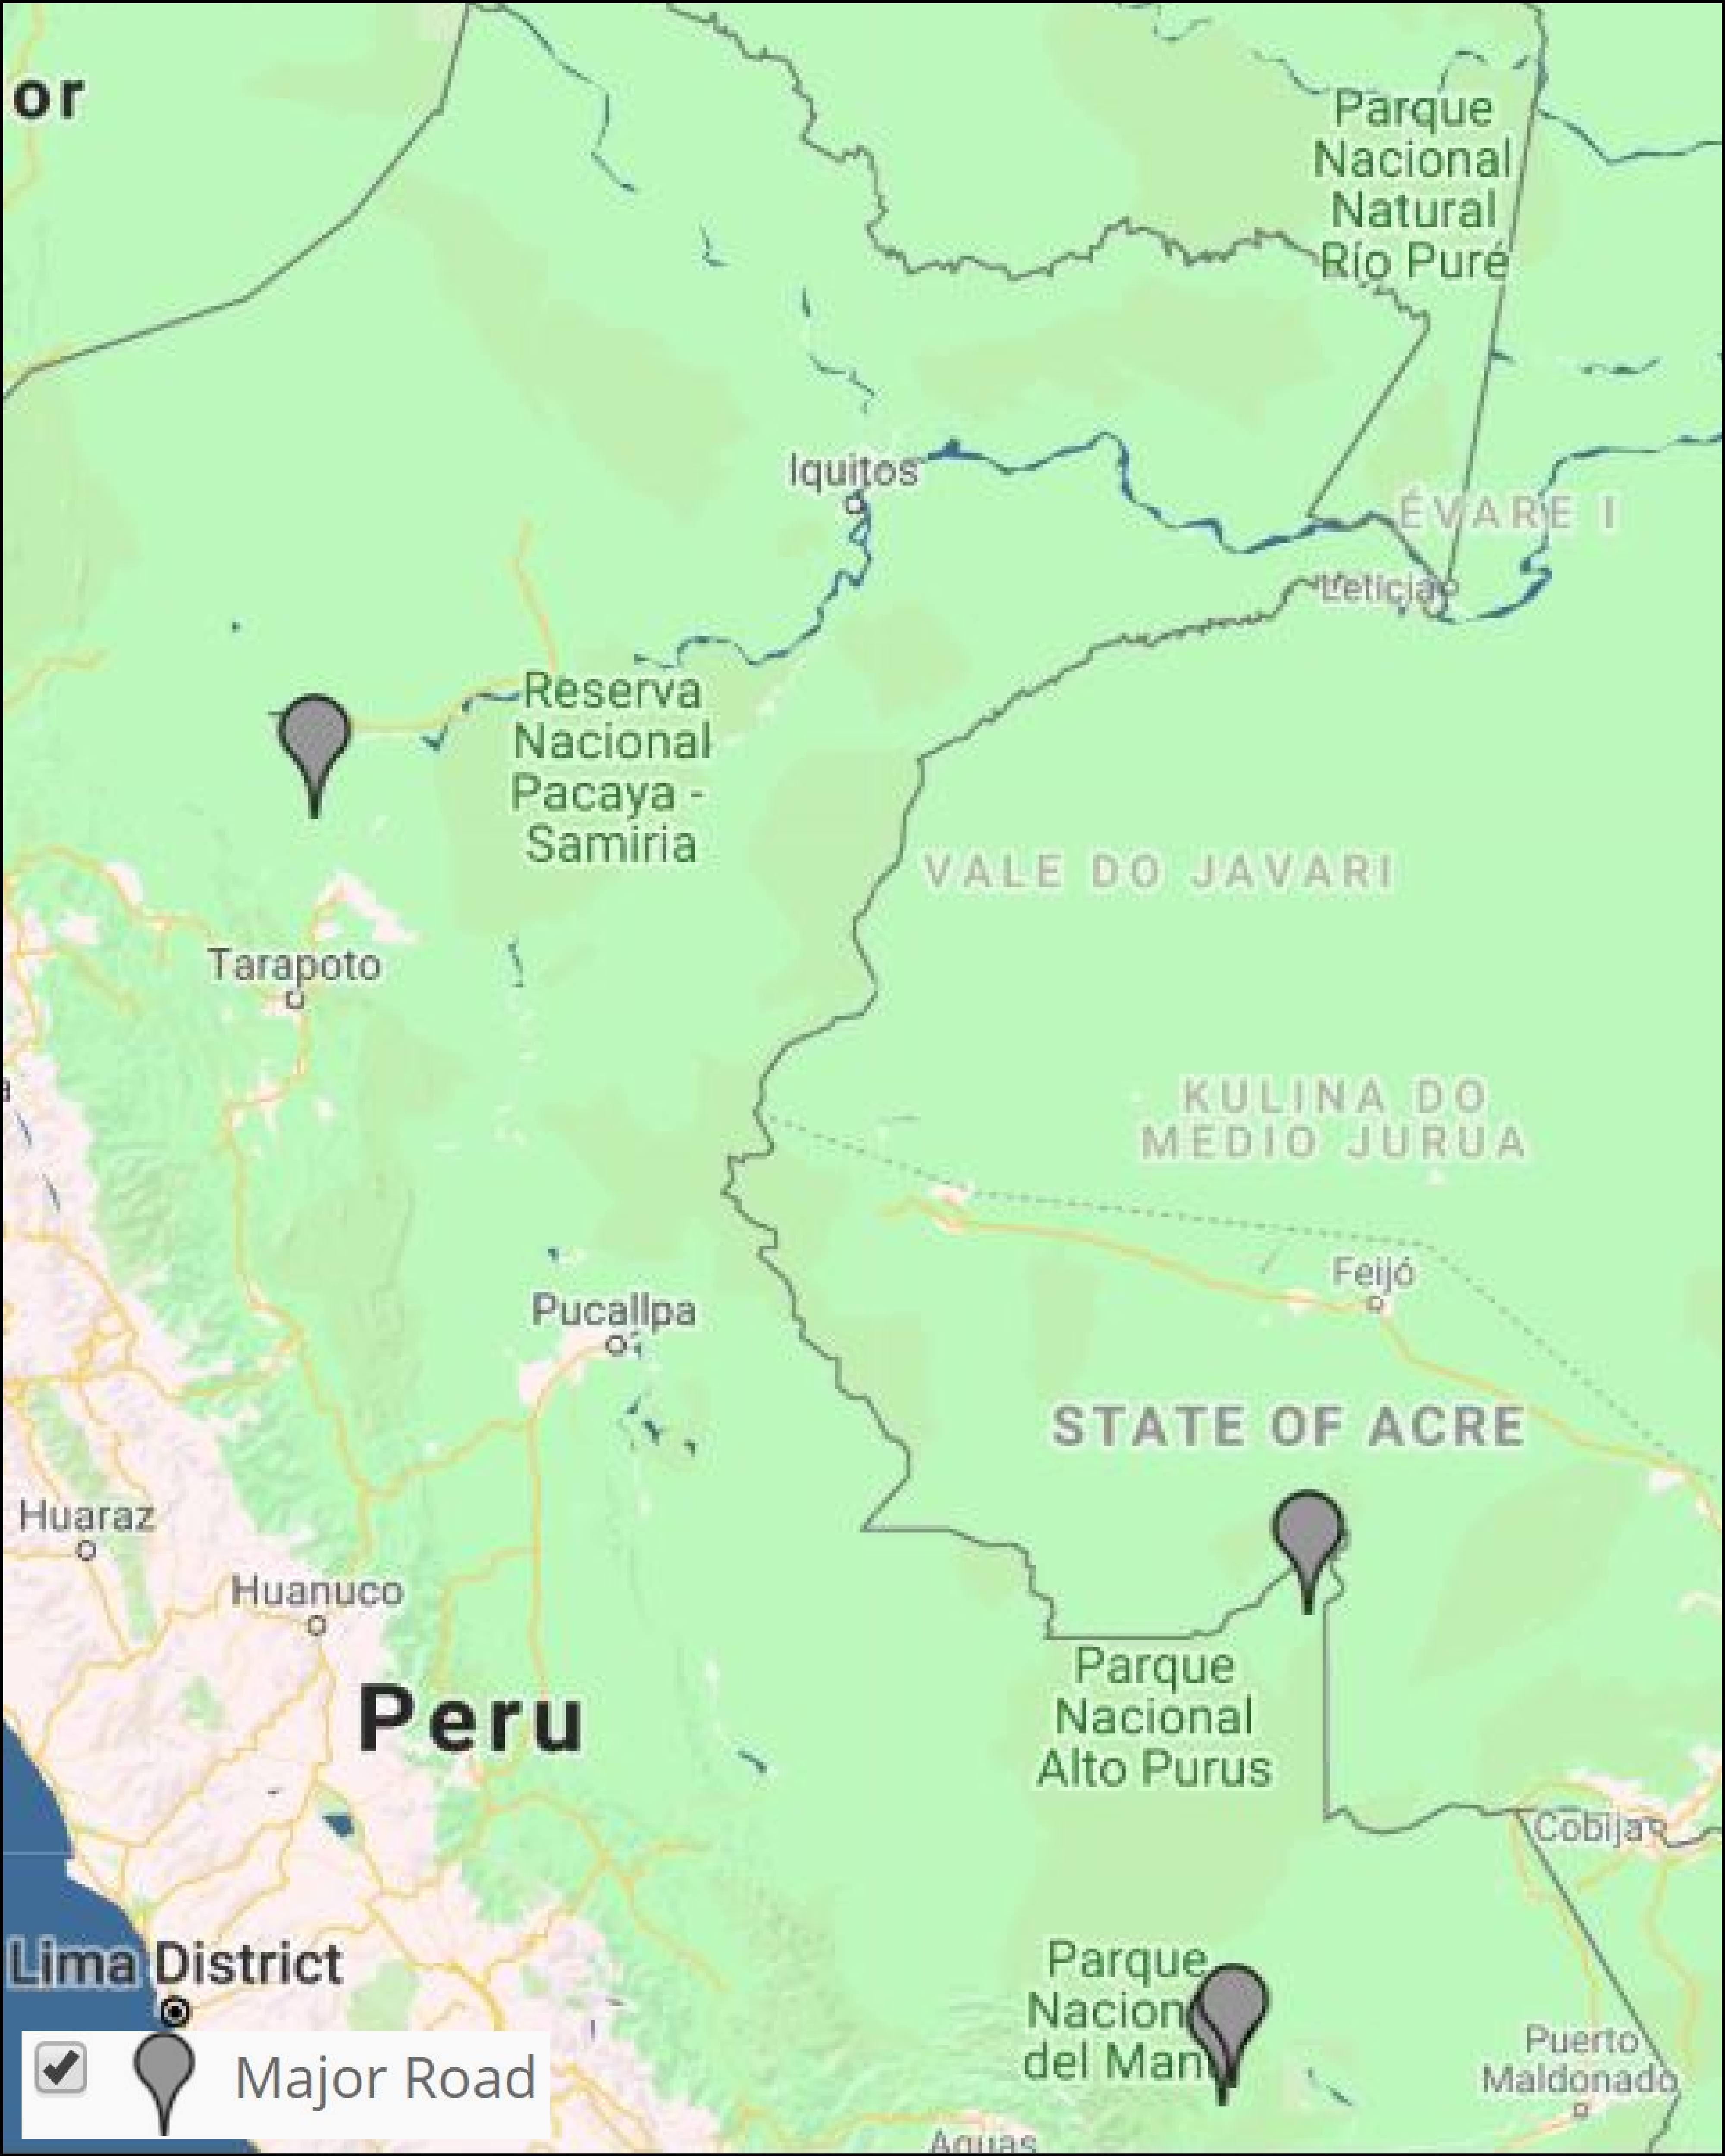
Image 8 shows the results of the Interactive Map when applying the “Roads” filter.

Legend:
Road (gray)

We have analyzed two controversial proposed roads in Madre de Dios, Peru.

The Nuevo Edén – Boca Manu – Boca Colorado road would traverse the buffer zone of two protected areas: Amarakaeri Communal Reserve and Manu National Park (MAAP #29).

The other, the Puerto Esperanza-Iñapari road, would traverse the Purús National Park and threaten the territory of the indigenous peoples in voluntary isolation who live in this remote area (MAAP #76).


Hydroelectric dams

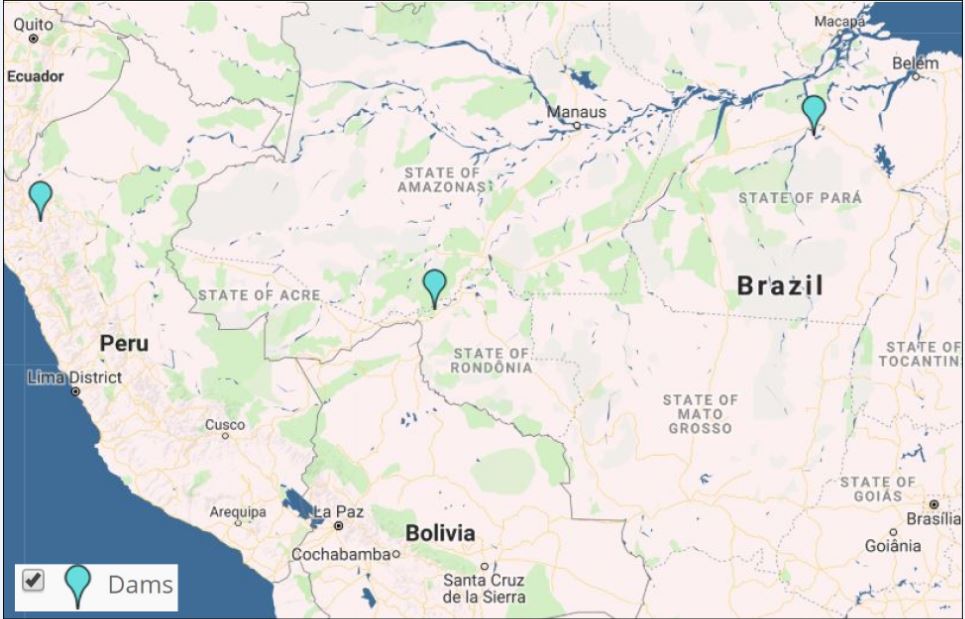
Image 9 shows the results of the Interactive Map when applying the “Dams” filter.

Legend:
Hydroelectric Dam (light blue)

To date, we have analyzed three hydroelectric dams located in Brazil.  We have documented the loss of 36,100 hectares of forest associated with flooding produced by two dams (San Antonio and Jirau) on the Madeira River near the border with Bolivia (MAAP #34).  We also analyzed the controversial Belo Monte hydroelectrical complex located on the Xingú River, adn estimate that 19,880 hectares of land have been flooded. According to the imagery, this land is a combination of forested areas and agricultural areas (MAAP #66).

Additionally, we show a very high-resolution image of the exact location of the proposed Chadín-2 hydroelectric dam on the Marañón River in Peru (MAAP #80).

Hydrocarbon (oil and gas)

Image 10: Interactive map, hidrocarbon. Data: MAAP.

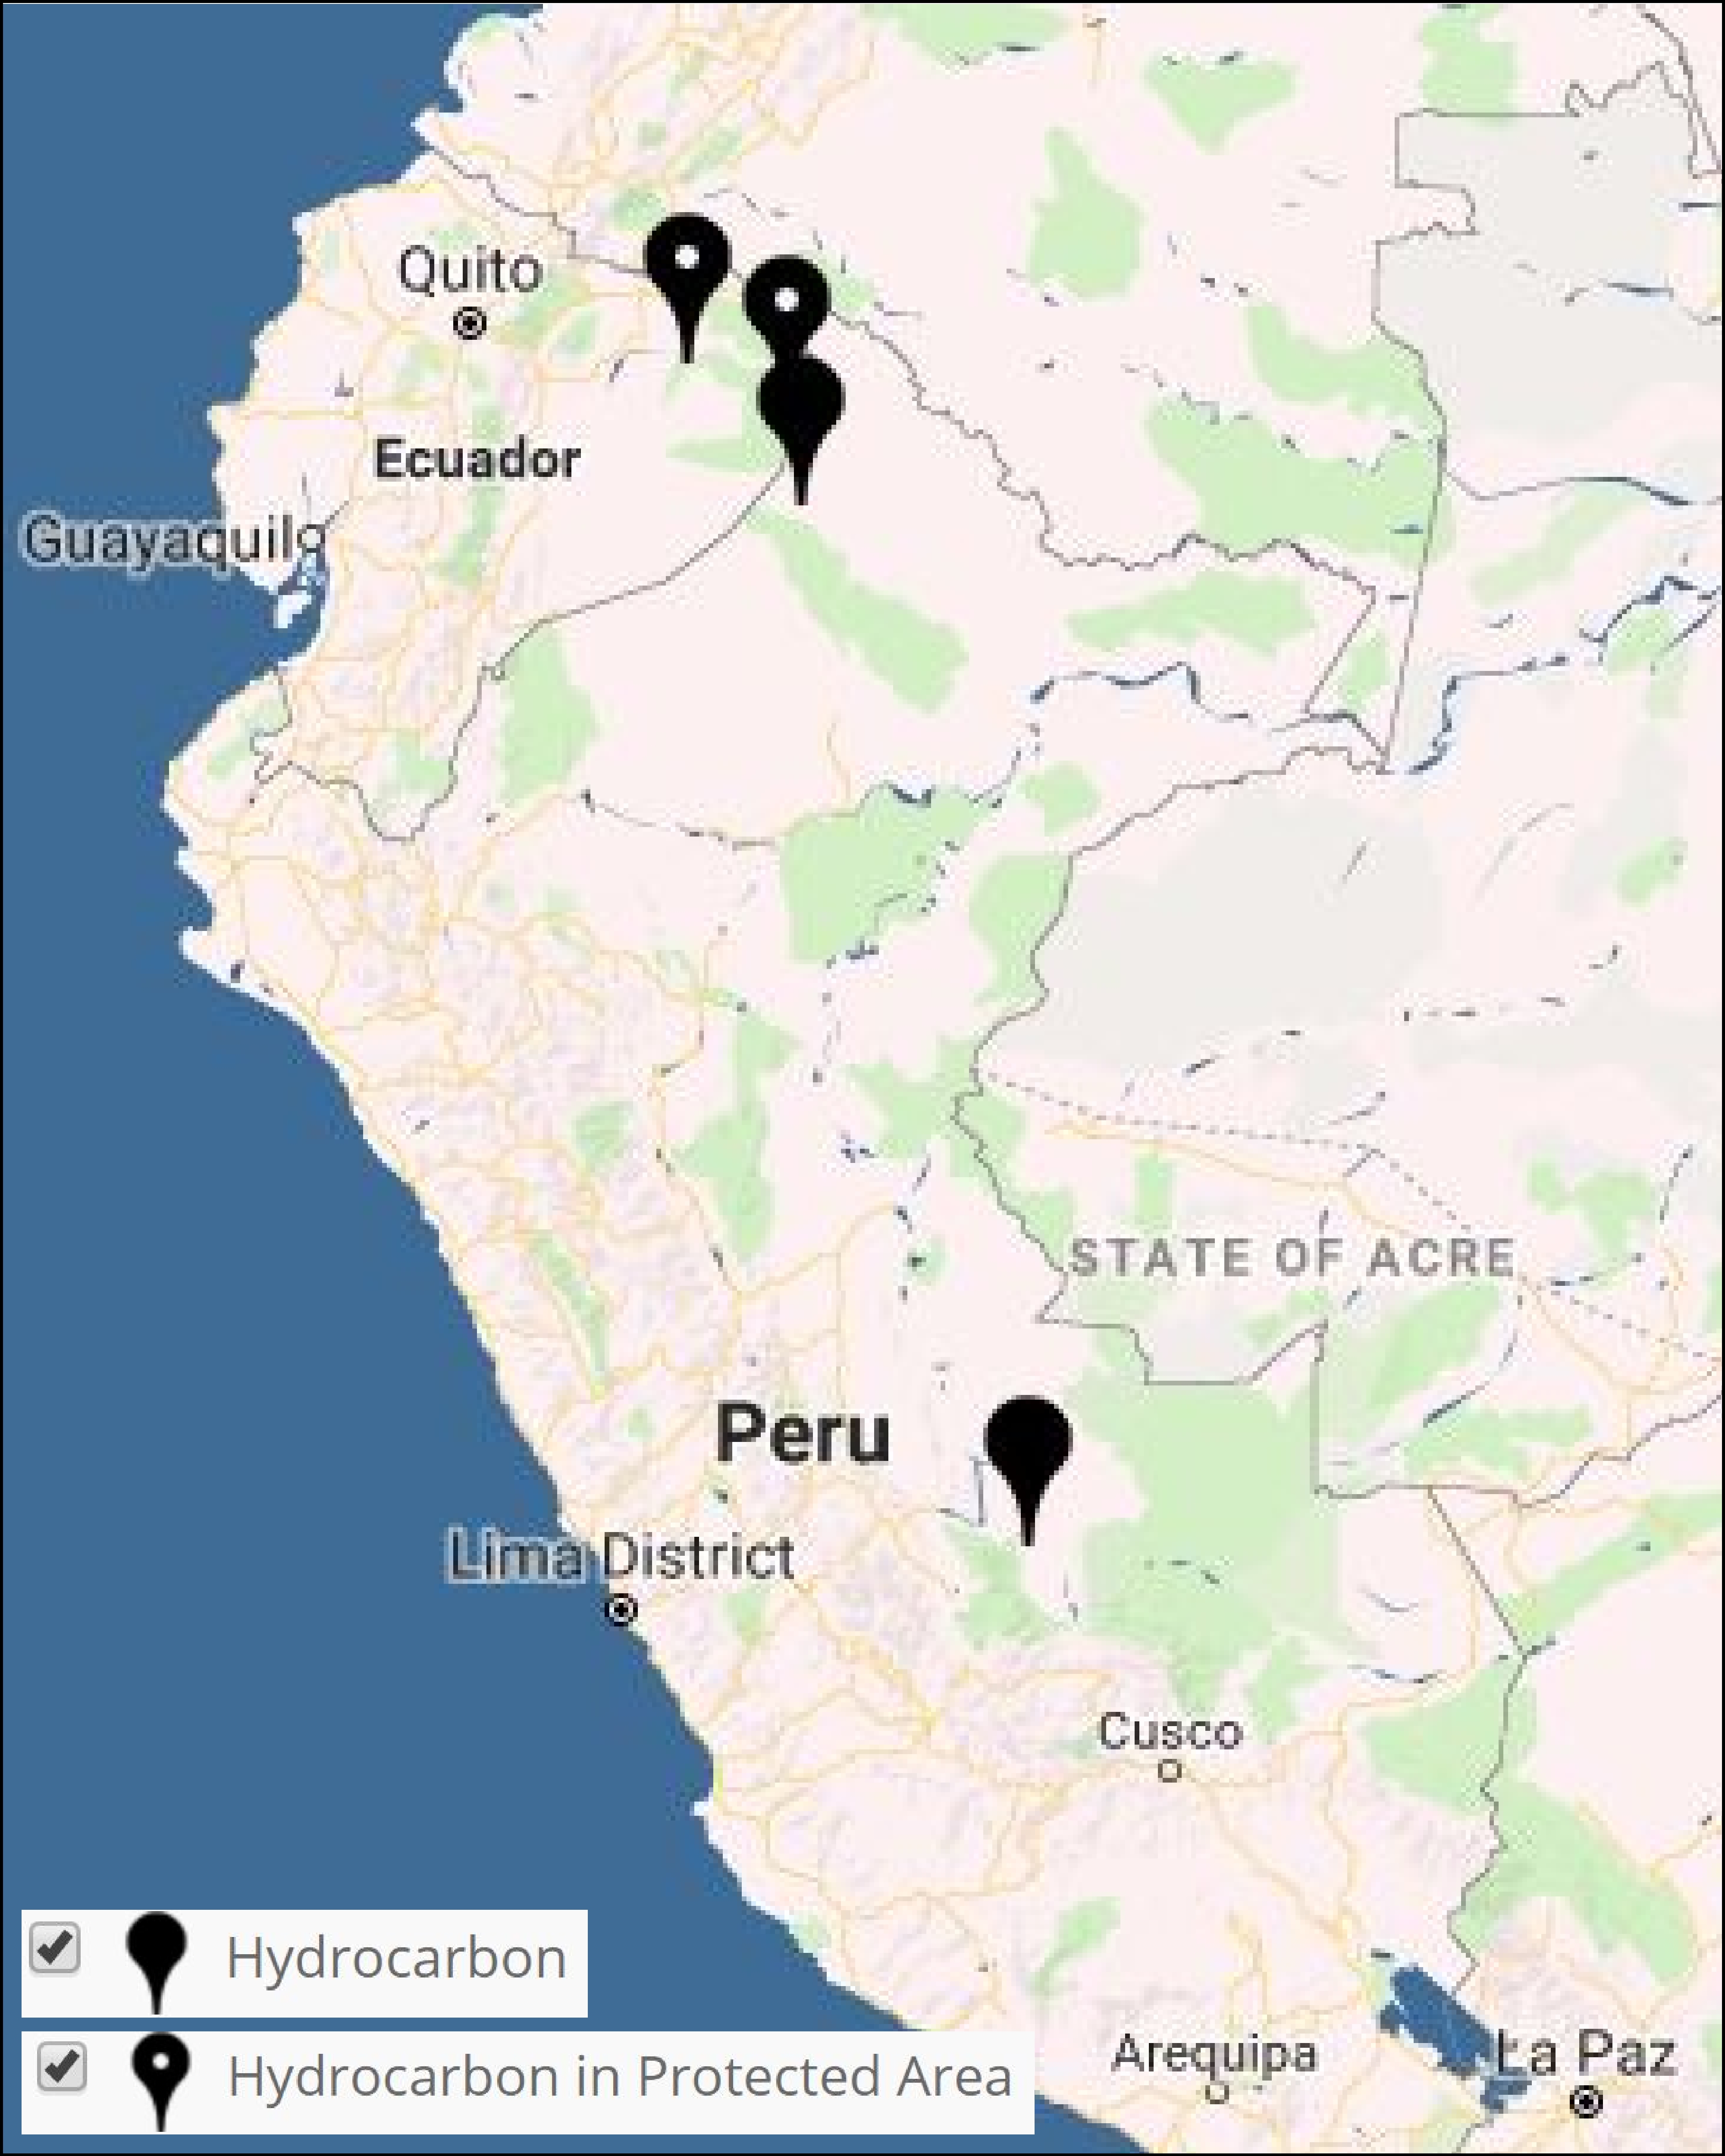
Image 10 shows the results of the Interactive Map when applying the “Hydrocarbon filter.

Legend:
Hydrocarbon (black)

Our first report on this sector focused on Yasuní National Park in the Ecuadorian Amazon.  We documented the direct and indirect deforestation amounts of 417 hectares (MAAP #82).

We also show the location of recent deforestation in two hydrocarbon block in Peru: Block 67 in the north and Blocks 57 in the south.


Climate Change

Tropical forests, especially the Amazon, sequester huge amounts of carbon, one of the main greenhouse gases driving climate change.

In MAAP #81, we estimated the loss of 59 million metric tons of carbon in the Peruian Amazon during the last five years (2013-17) due to forest loss, especially deforestation from mining and agricultural activities. This finding reveals that forest loss represents nearly half (47%) of Peru’s annual carbon emissions, including from burning fossil fuels.

In contrast, in MAAP #83 we show that protected areas and indigenous lands have safeguarded 3.17 billion metric tons of carbon, as of 2017. That is the equivalent to 2.5 years of carbon emissions from the United States.

The breakdown of results are:
1.85 billion tons safeguarded in the Peruvian national protected areas system;
1.15 billion tons safeguarded in titled native community lands; and
309.7 million tons safeguarded in Territorial Reserves for indigenous peoples in voluntary isolation.

Citation

Finer M, Mamani N (2018) Deforestation in the Andean Amazon (Trends, Hotspots, Drivers). MAAP Synthesis #3.

MAAP #83: Climate Change Defense: Amazon Protected Areas and Indigenous Lands

Base Map. Data: Asner et al 2014, MINAM/PNCB, SERNANP, IBC

Tropical forests, especially the Amazon, sequester huge amounts of carbon, one of the main greenhouse gases driving climate change.

Here, we show the importance of protected areas and indigenous lands to safeguard these carbon stocks.

In MAAP #81, we estimated the loss of 59 million metric tons of carbon in the Peruvian Amazon during the last five years (2013-17) due to forest loss, especially deforestation from mining and agricultural activities.

This finding reveals that forest loss represents nearly half (47%) of Peru’s annual carbon emissions, including from burning fossil fuels.1,2

In contrast, here we show that protected areas and indigenous lands have safeguarded 3.17 billion metric tons of carbon, as of 2017.3,4

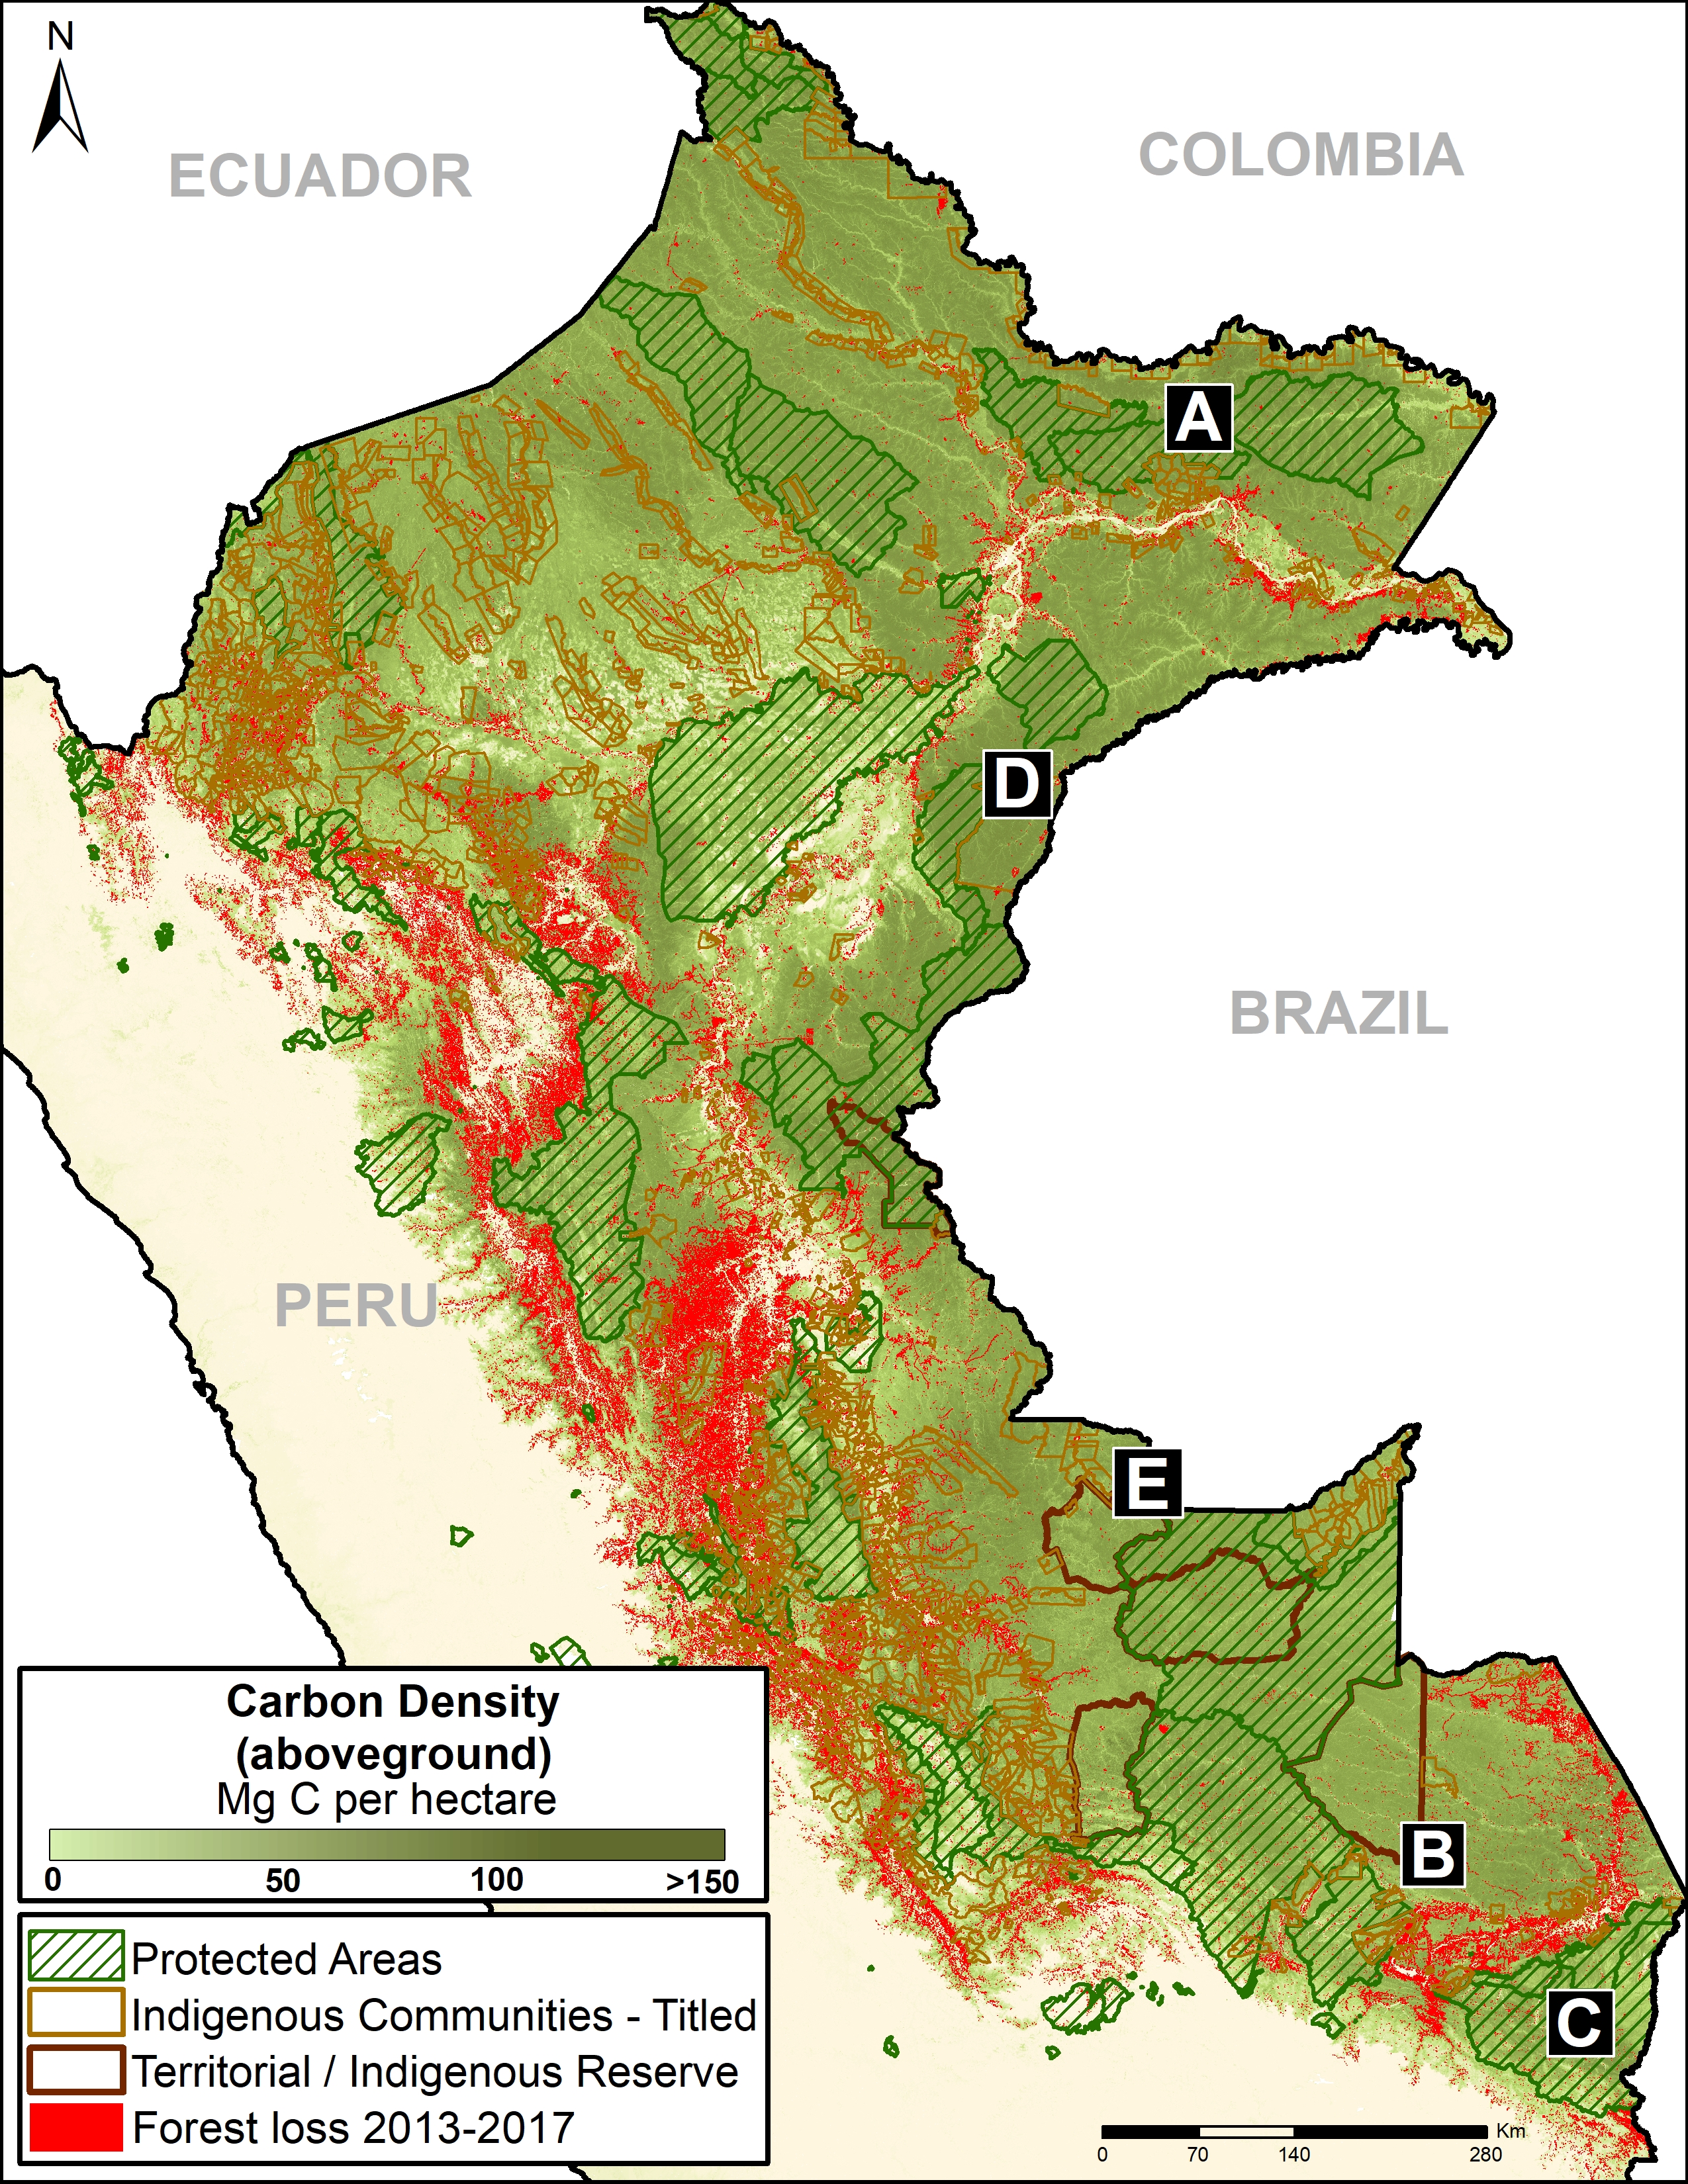
The Base Map (on the right) shows, in shades of green, the current carbon densities in relation to these areas.

The breakdown of results are:
1.85 billion tons safeguarded in the Peruvian national protected areas system;
1.15 billion tons safeguarded in titled native community lands; and
309.7 million tons safeguarded in Territorial Reserves for indigenous peoples in voluntary isolation.

The total safeguarded carbon (3.17 billion metric tons) is the equivalent to 2.5 years of carbon emissions from the United States.5

Below, we show several examples of how protected areas and indigenous lands are safeguarding carbon reservoirs in important areas, indicated by insets A-E.

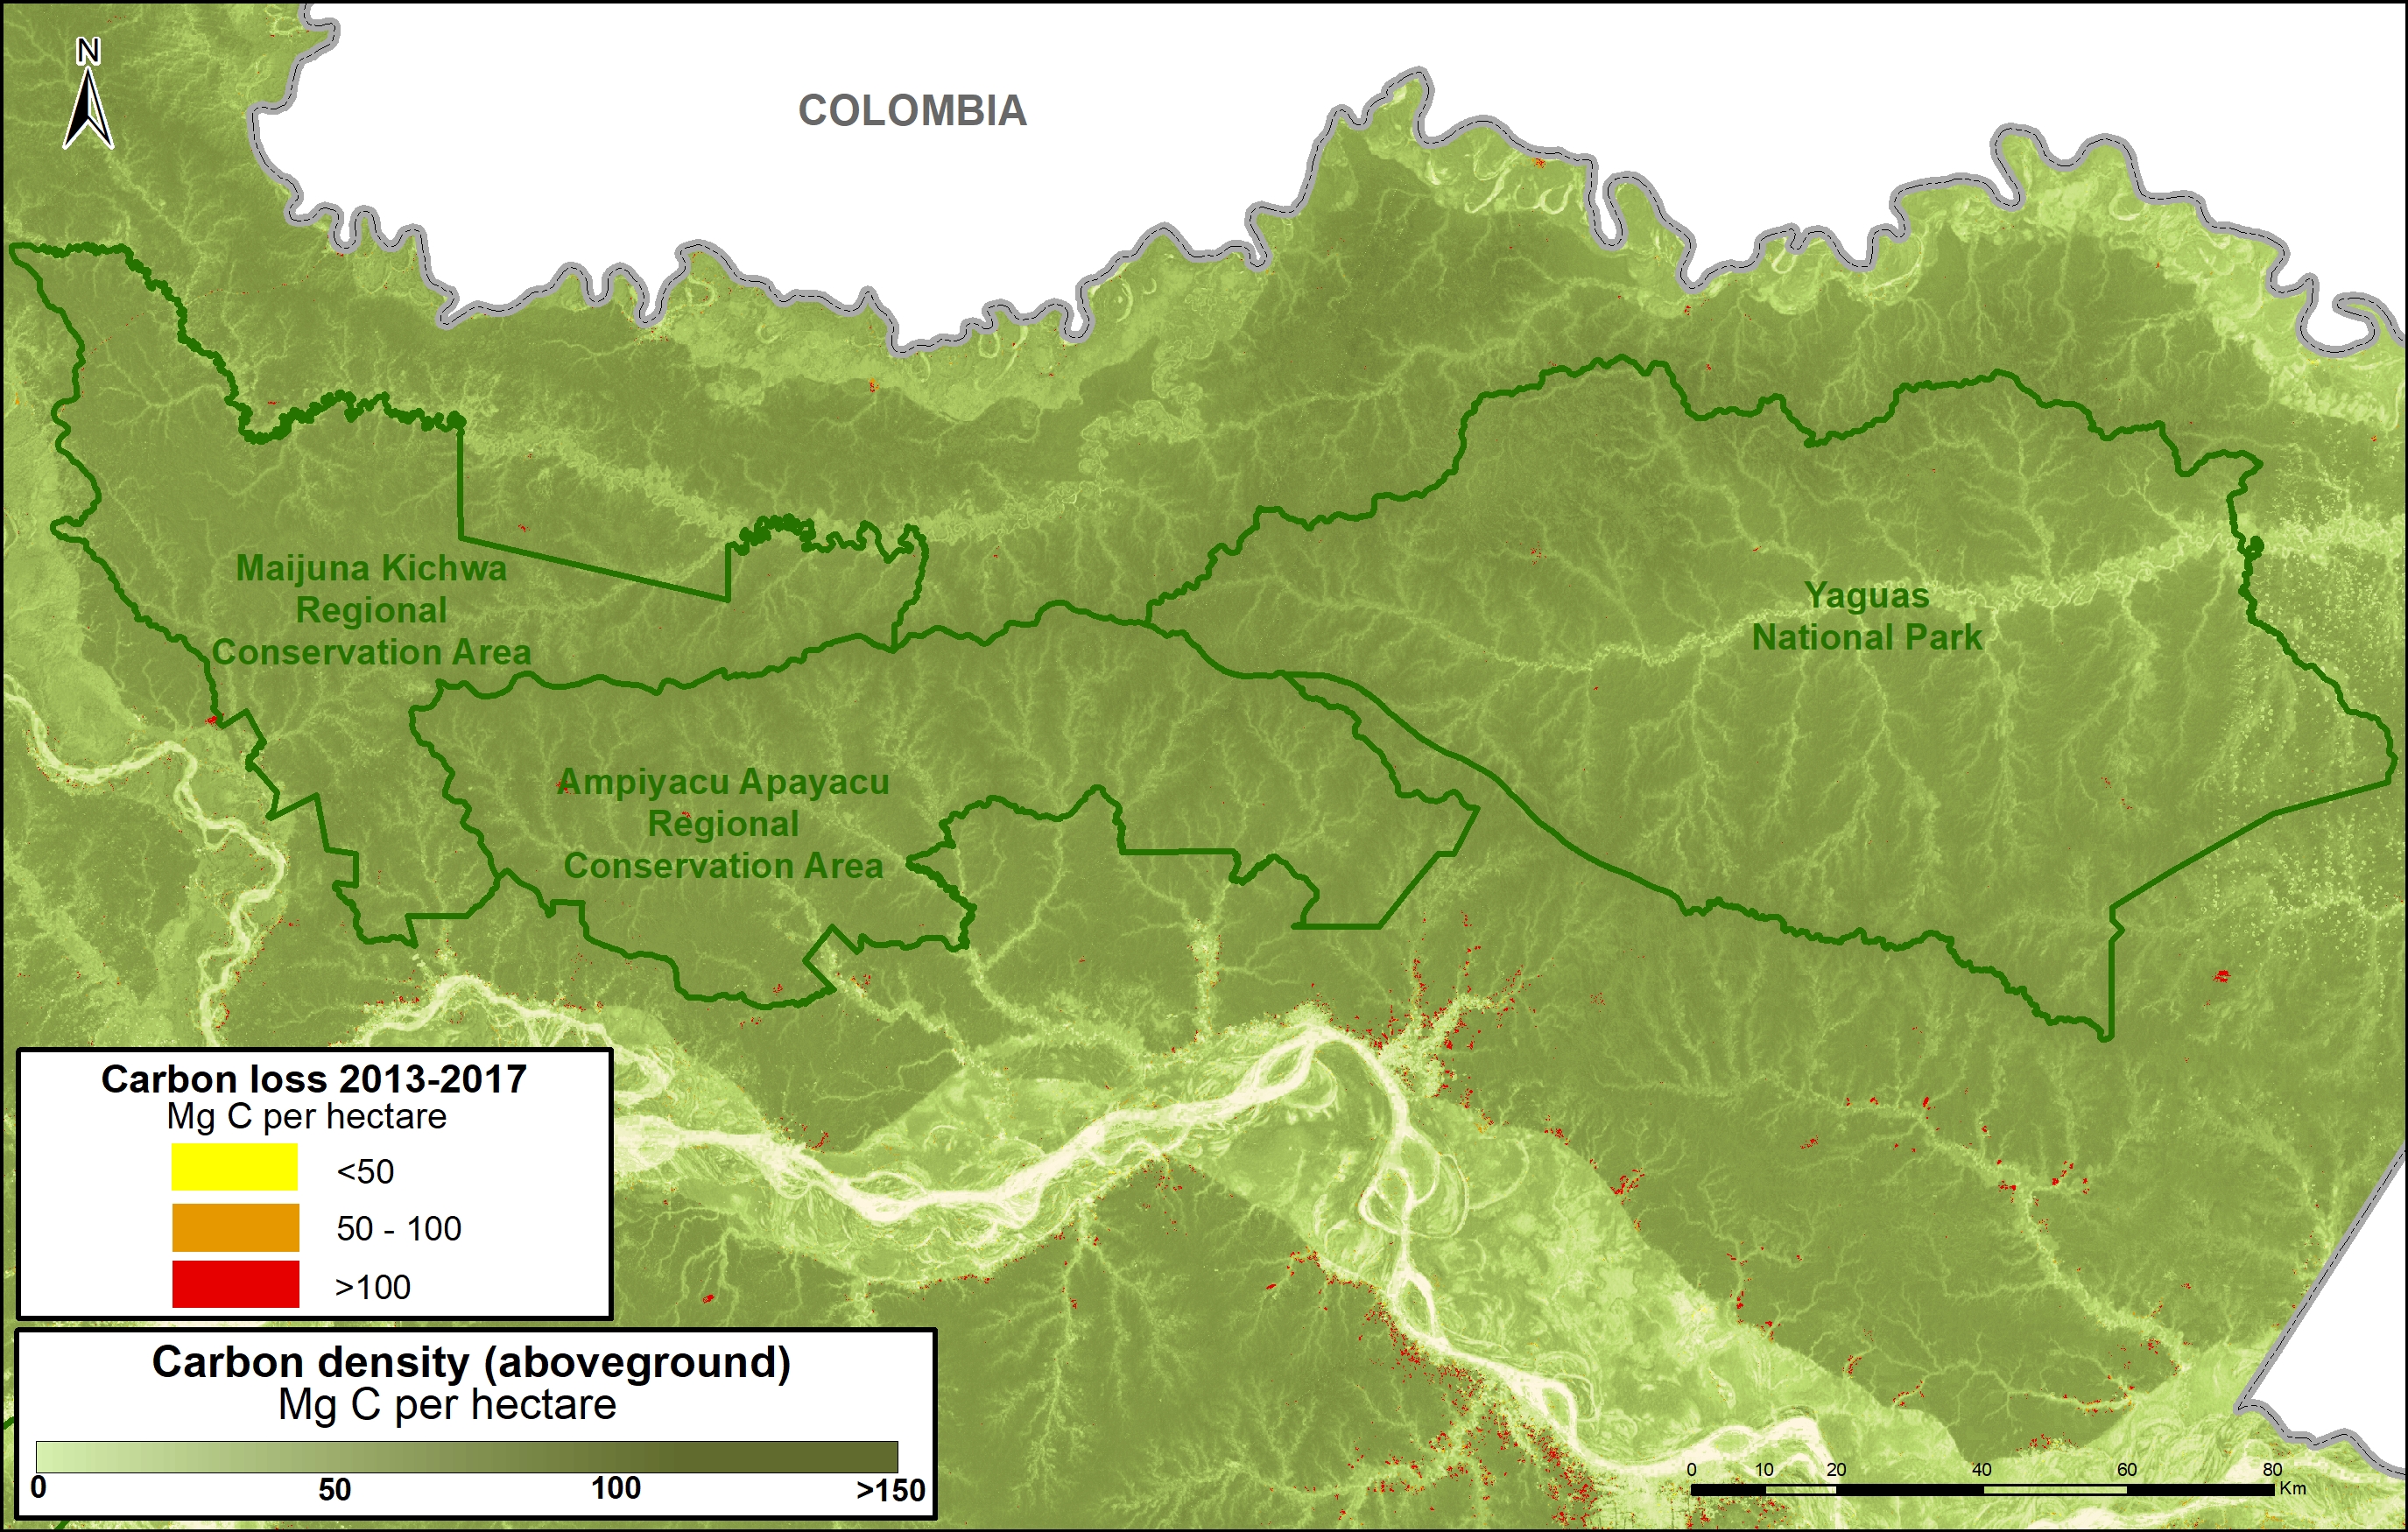
A. Yaguas National Park

The following Image A shows how three protected areas, including the new Yaguas National Park, are effectively safeguarding 202 million metric tons of carbon in the northeastern Peruvian Amazon. This area is home to some of the highest carbon densities in the country.

Image 83a. Yaguas. Data: Asner et al 2014, MINAM/PNCB, SERNANP

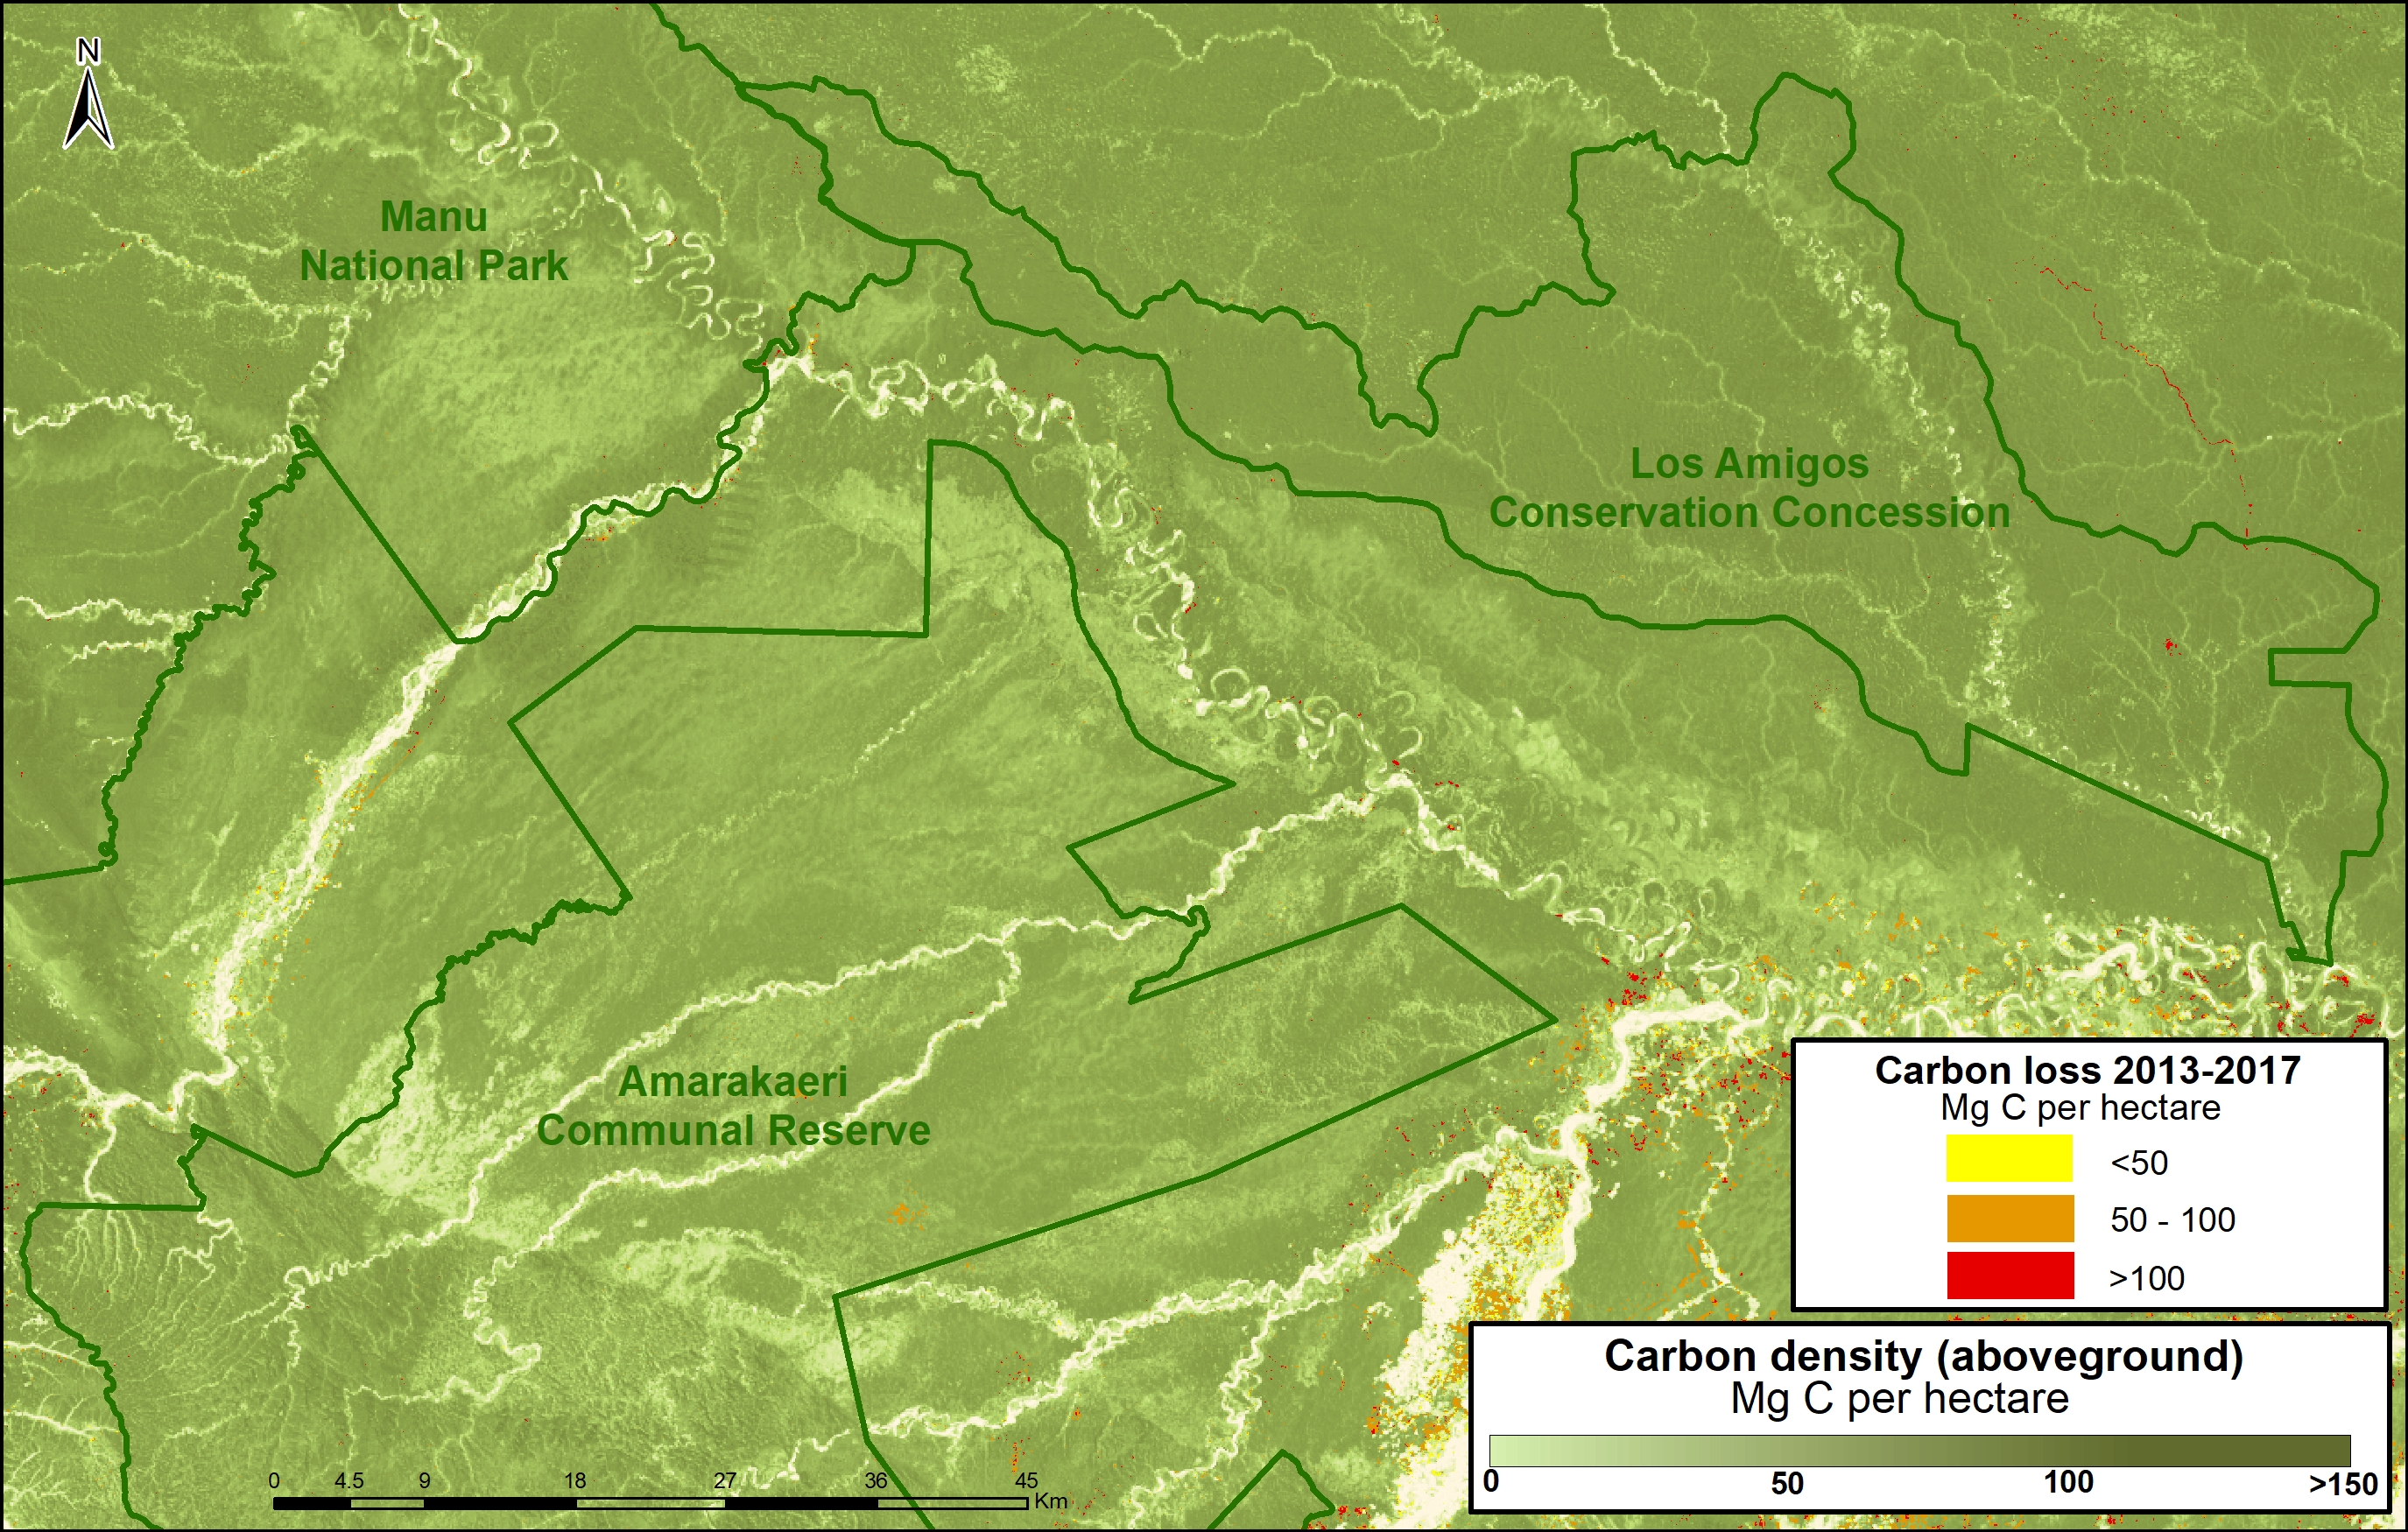
B. Manu National Park, Amarakaeri Communal Reserve, CC Los Amigos

The following Image B shows how Los Amigos, the world’s first conservation concession, is effectively safeguarding 15 million metric tons of carbon in the southern Peruvian Amazon. Two surrounding protected areas, Manu National Park and Amarakaeri Communal Reserve, safeguard an additional 194 million metric tons. This area is home to some of the highest carbon densities in the country.

Image 83b. Los Amigos-Manu-Amarakaeri. Data: Asner et al 2014, MINAM/PNCB, SERNANP, ACCA

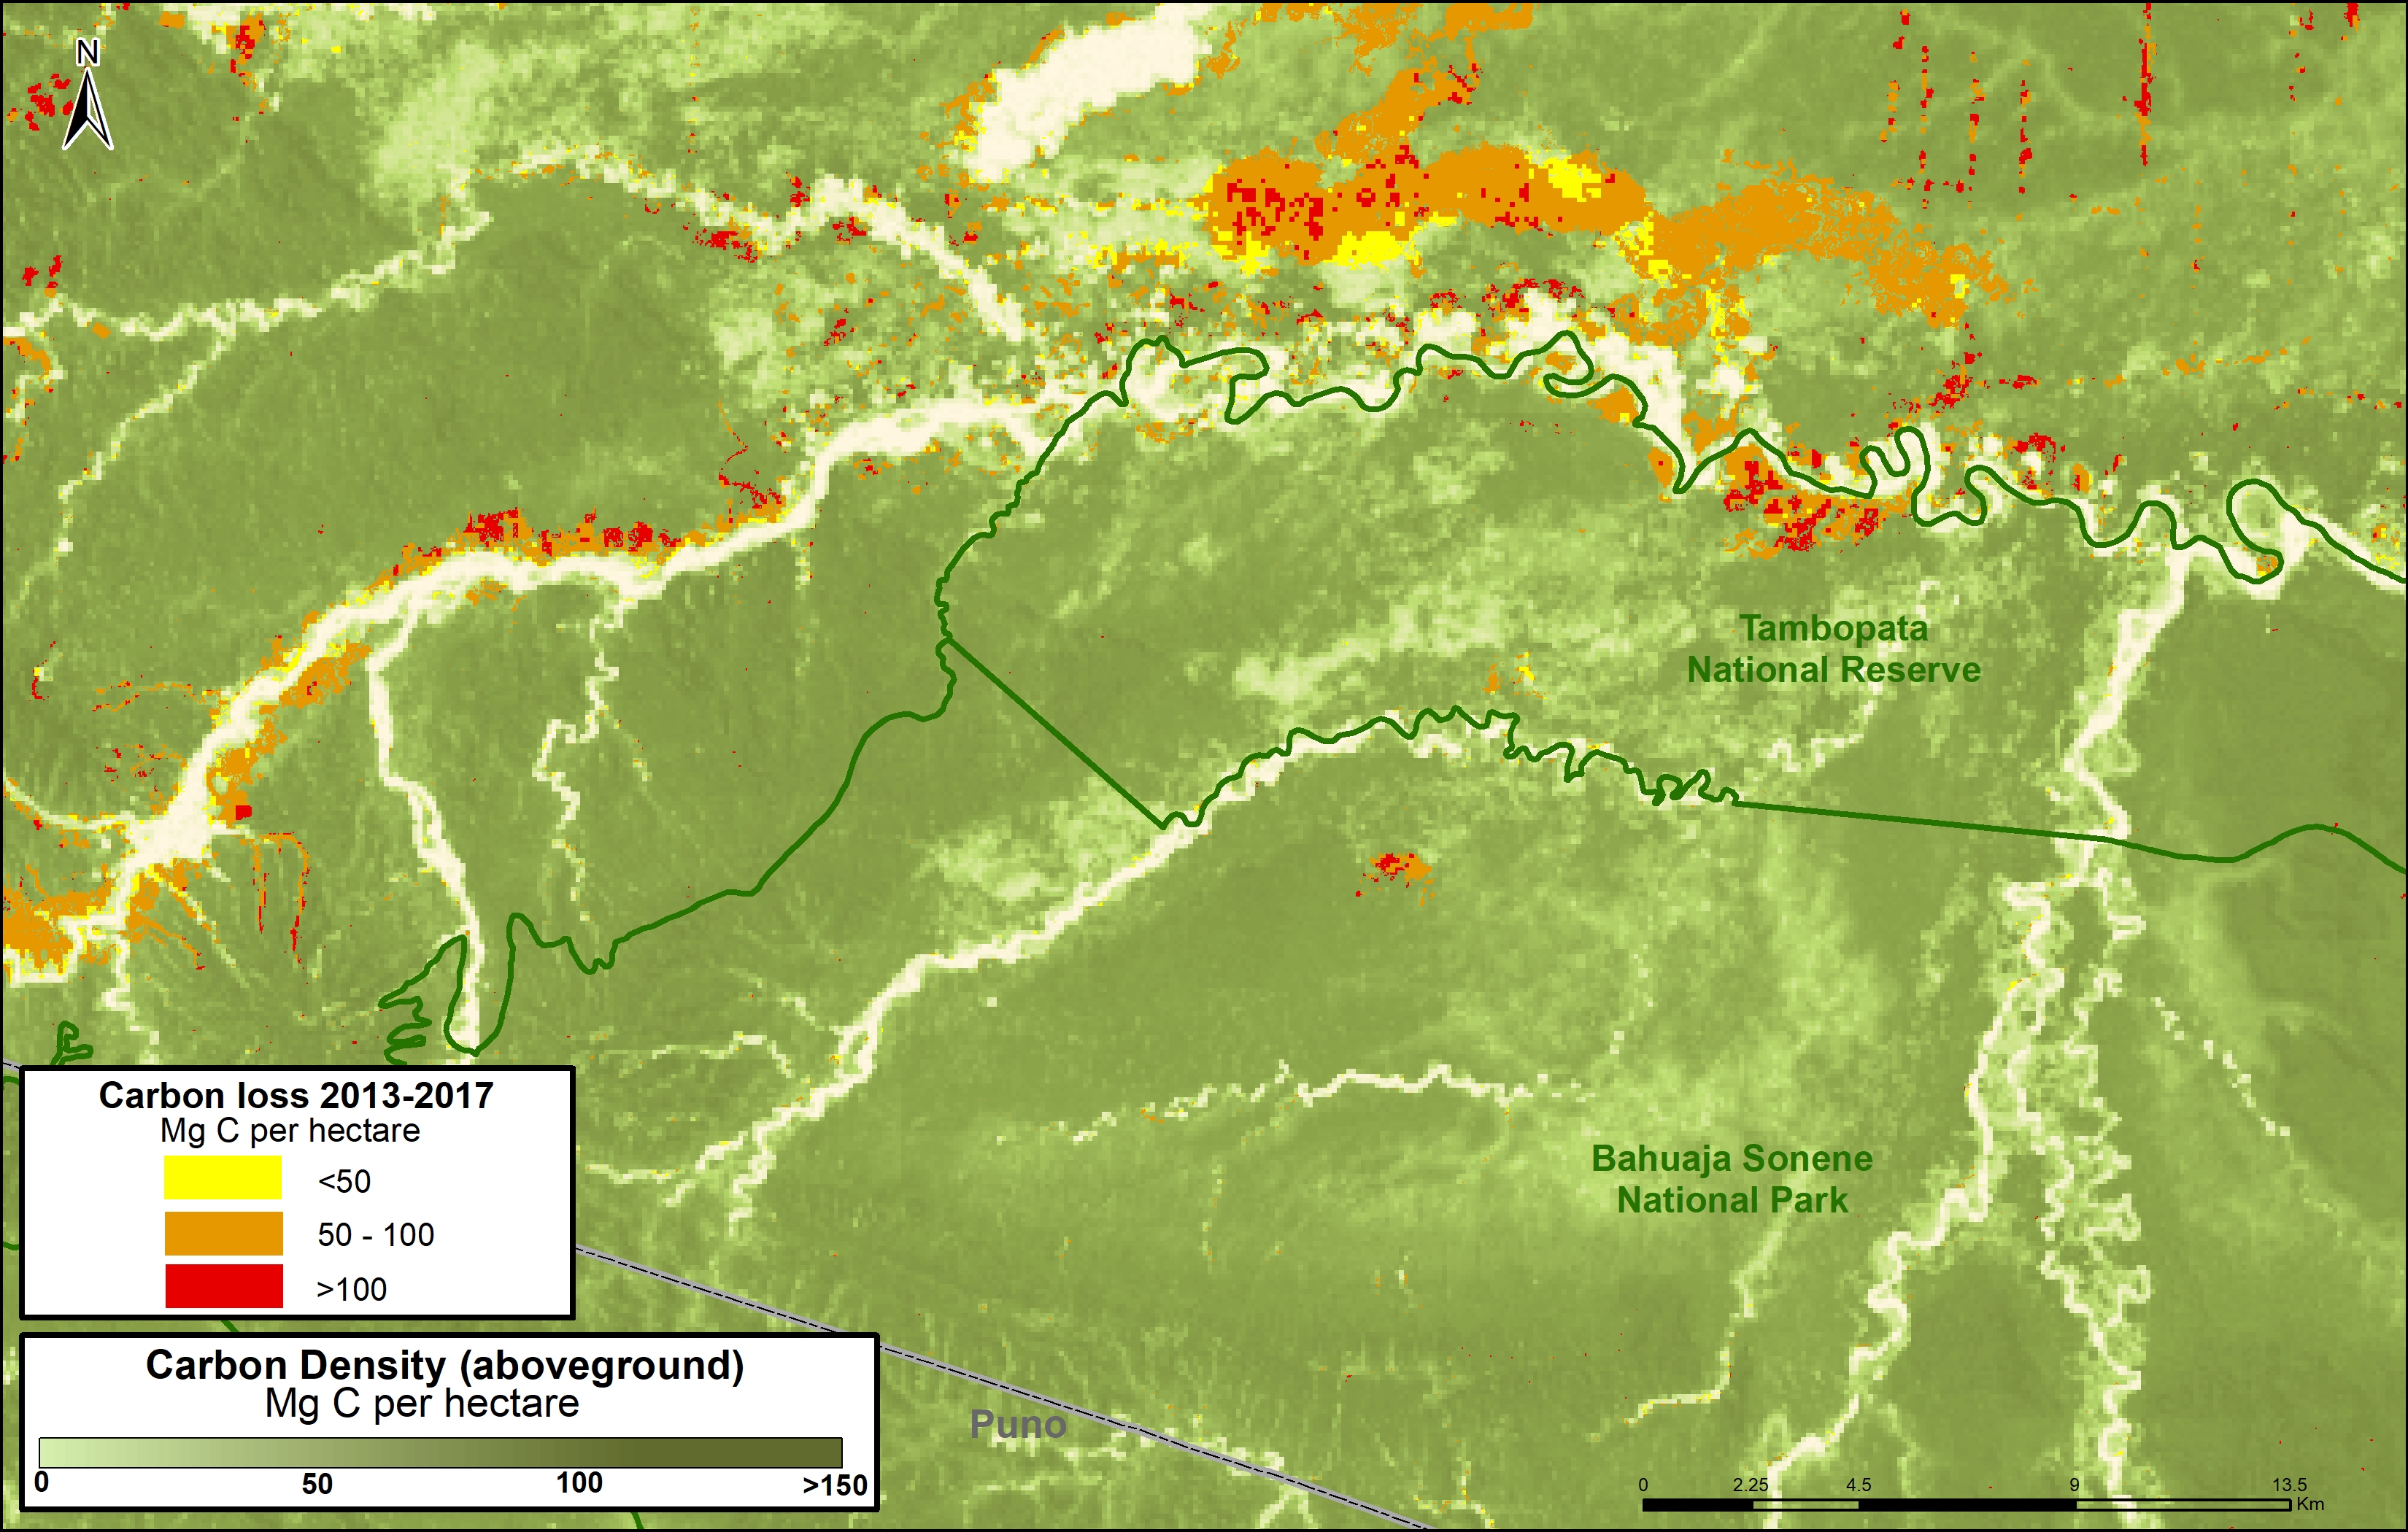
C. Tambopata National Reserve, Bahuaja Sonene National Park

The following Image C shows how two important natural protected areas, Tambopata National Reserve and Bahuaja Sonene National Park, are helping conserve carbon stocks in an area with intense illegal gold mining activity.

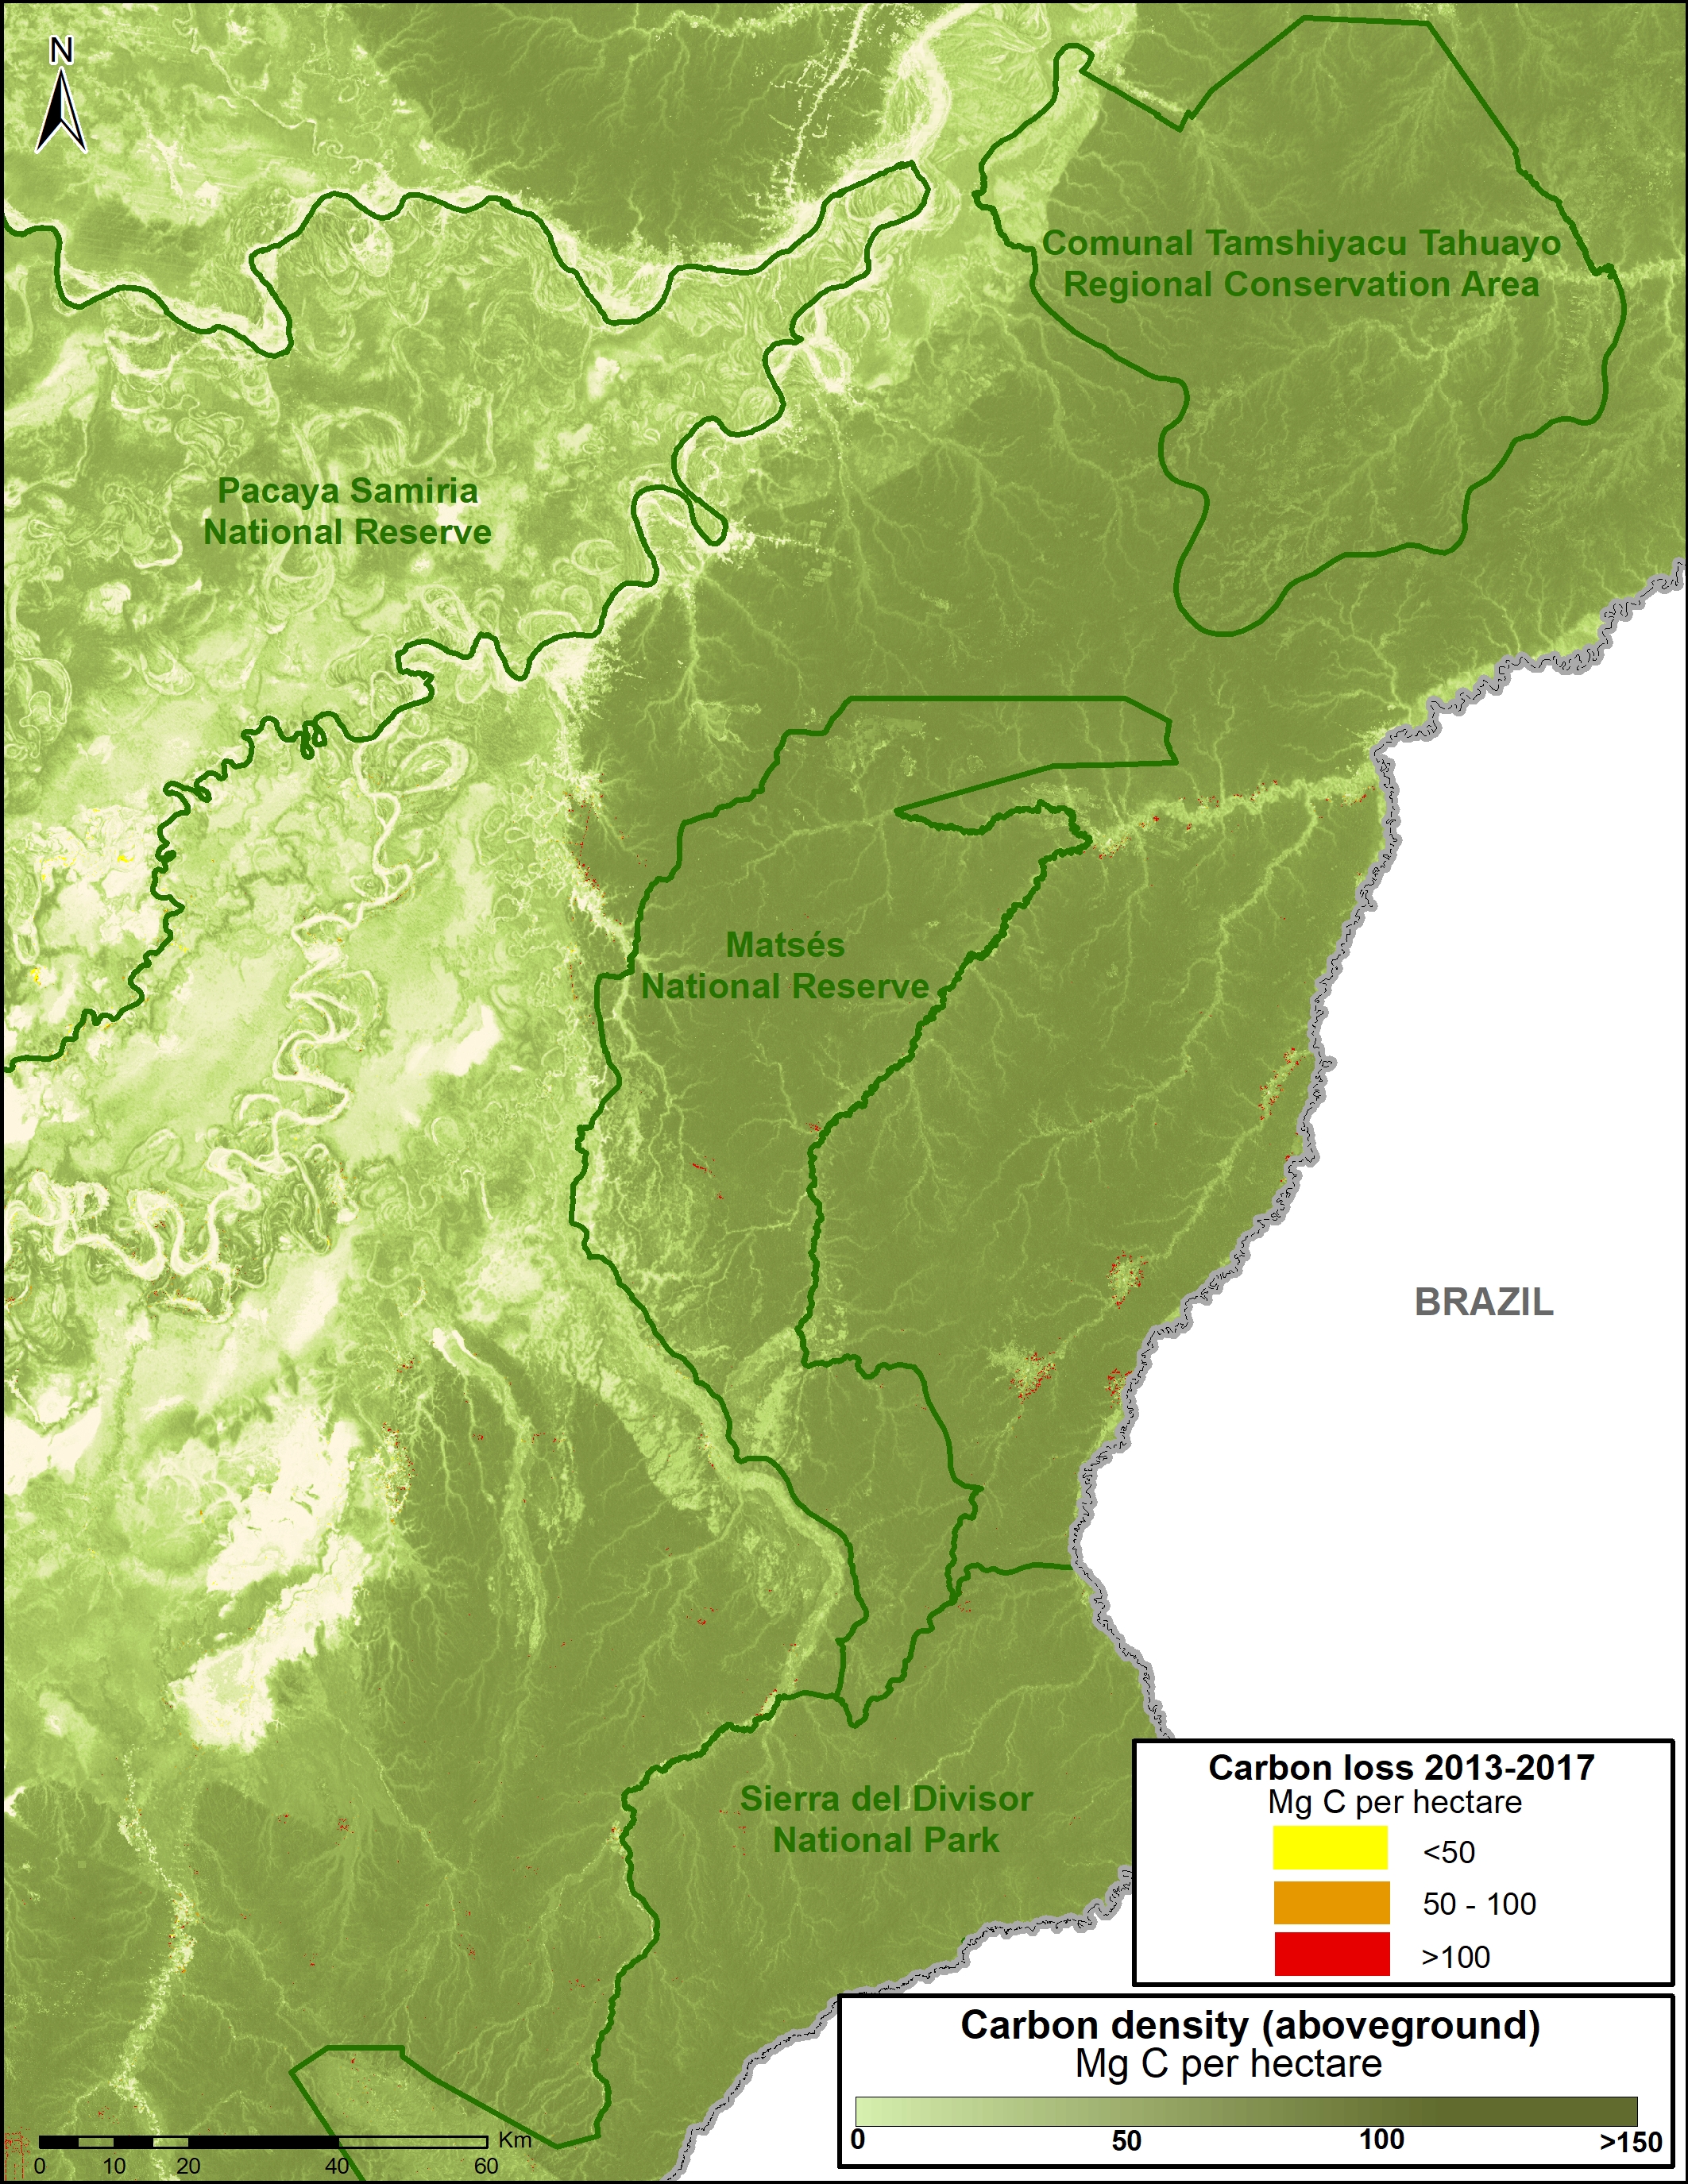
D. Sierra del Divisor National Park, National Reserve Matsés

Image 83d. Data: Asner et al 2014, MINAM/PNCB, SERNANP

The following Image D shows how four protected areas, including the new Sierra del Divisor National Park, and adjacent National Reserve Matsés are effectively safeguarding 270 million metric tons of carbon in the eastern Peruvian Amazon.

This area is home to some of the highest carbon densities in the country.

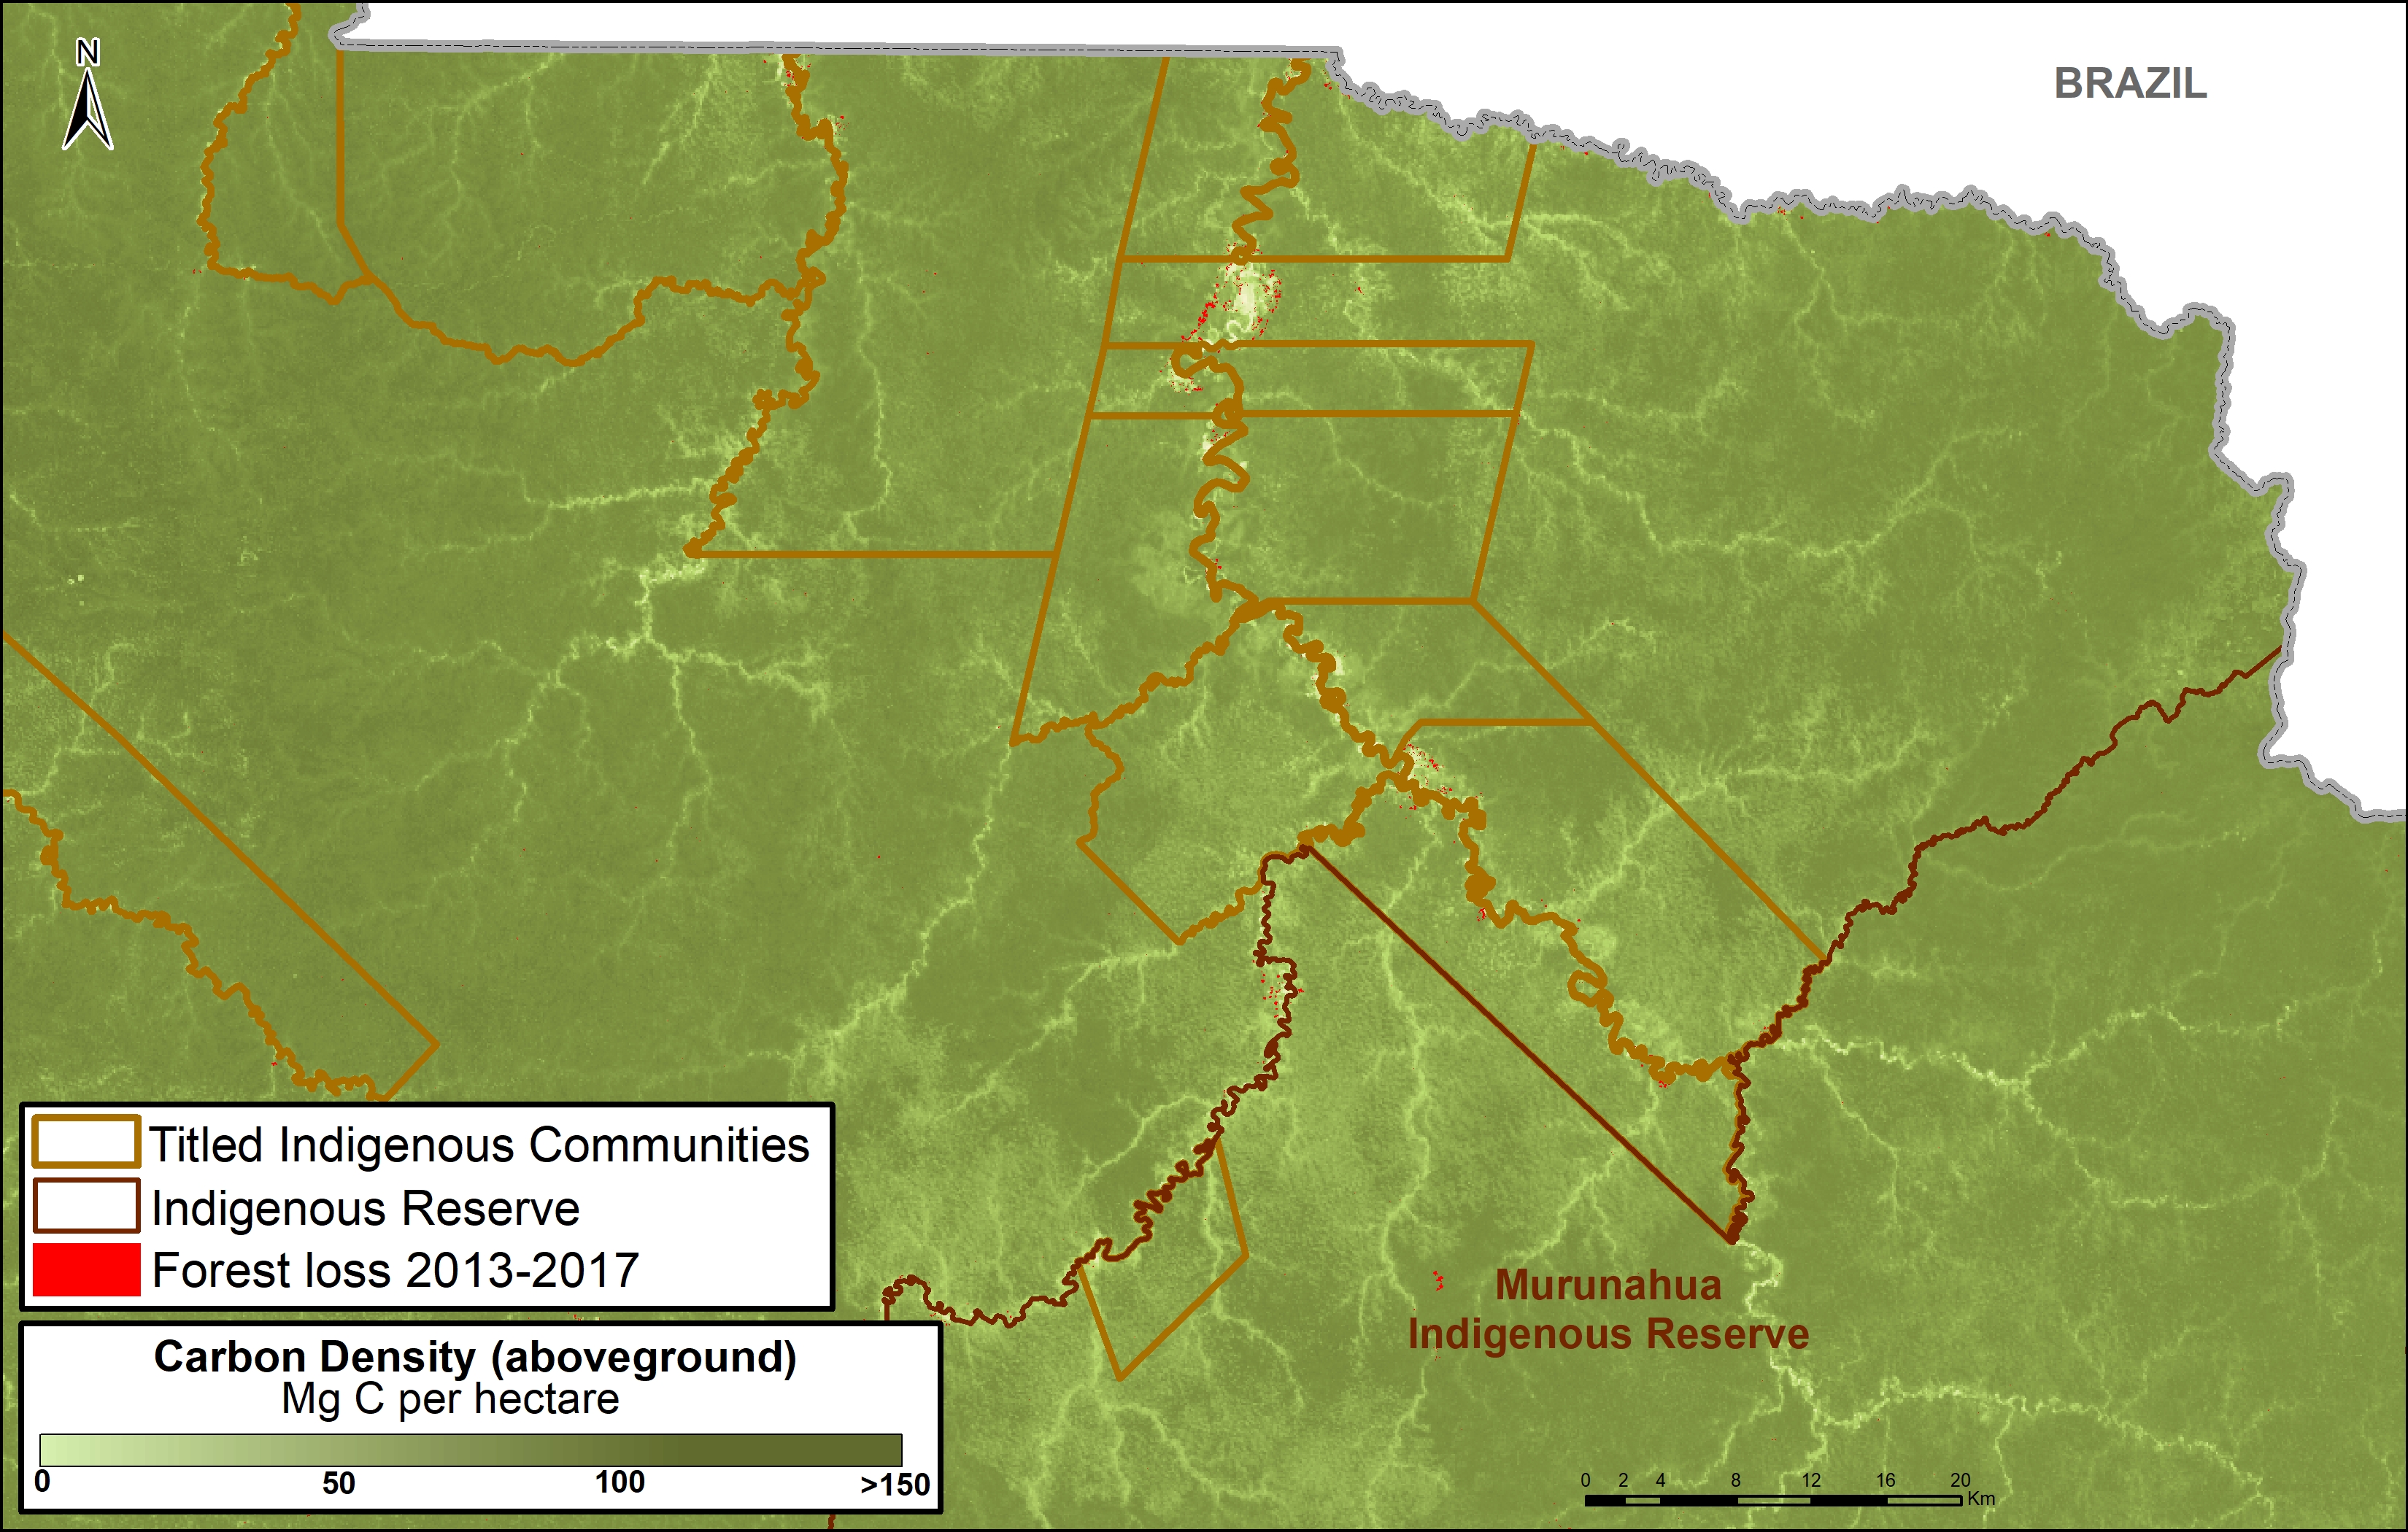
E. Murunahua Indigenous Reserve

The following Image E shows the carbon protected in the Murunahua Indigenous Reserve (for indigenous peoples in voluntary isolation) and the surrounding titled native communities.

Imagen 83e. Datos: Asner et al 2014, MINAM/PNCB, SERNANP

References

1  UNFCCC. Emissions Summary for Peru. http://di.unfccc.int/ghg_profile_non_annex1

2  No incluye las emisiones por la degradación de bosques

Asner GP et al (2014). The High-Resolution Carbon Geography of Perú. Carnegie Institution for Science. ftp://dge.stanford.edu/pub/asner/carbonreport/CarnegiePeruCarbonReport-English.pdf

Sistema de Áreas Naturales Protegidas del Perú, que incluye áreas de administración nacional, regional, y privado. Datos de las tierras indígenas son de Instituto de Bien Común. Datos de pérdida forestal son de la Programa Nacional de Conservación de Bosques para la Mitigación del Cambio Climático (MINAM/PNCB).

UNFCCC. Emissions Summary for United States. http://di.unfccc.int/ghg_profile_annex1

Citation

Finer M, Mamani N (2017). Climate Change Defense: Amazon Protected Areas and Indigenous Lands. MAAP: 83.

Acknowledgments

This report was made possible by the generous support of the Norwegian Agency for Development Cooperation (NORAD).