MAAP #232: The Amazon Tipping Point – Importance of Flying Rivers Connecting the Amazon

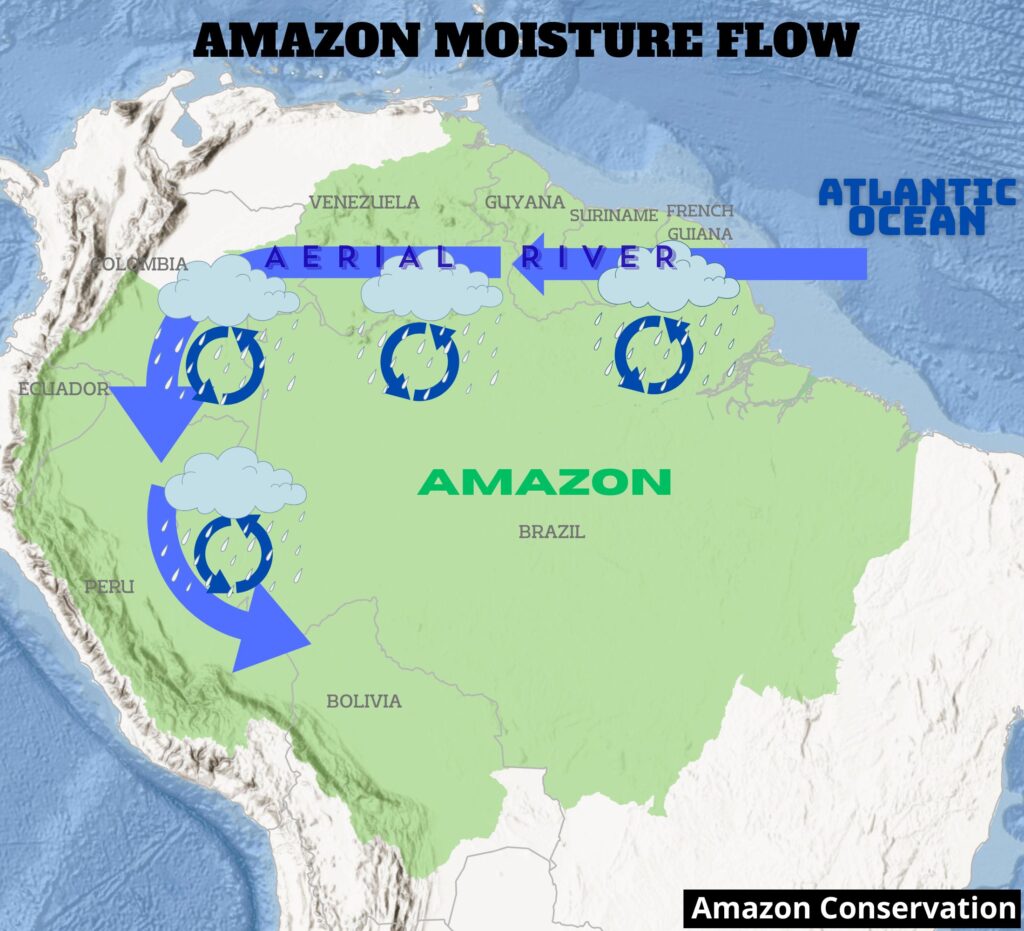
Intro Map. Amazon moisture flow (aerial river) for the southwest Amazon. Source: Amazon Conservation/MAAP

The Amazon biome, stretching over a vast area across nine countries in northern South America, is renowned for its extreme diversity (biological and cultural) and its abundant water resources. Indeed, the major features of the Amazon are linked by interconnected water flows, both on land and in the air (Beveridge et al. 2024).

The natural phenomenon of aerial moisture transport and recycling, also known as “aerial rivers” and popularized in the press as “flying rivers,” has emerged as an essential concept related to the conservation of the Amazon. In short, moisture flows from the Atlantic Ocean across the Amazon, uniquely facilitated by the rainforest itself. As they move westward, these flying rivers drop water onto the forest below. The forest subsequently transpires moisture back into them, thus recycling water and supporting rainforest ecosystems far from the Ocean source. For example, the Intro Map illustrates the aerial river for the southwest Amazon.

Continued deforestation and forest degradation, however, will disrupt and diminish the critical east-to-west aerial water flow, inducing a “tipping point” of impacted regions that would transition from rainforest to drier savannah ecosystems. 

In this report, we aim to both summarize the current state of knowledge on the movement of atmospheric moisture across the Amazon and develop novel analyses based on this information. Overall, we aim to show the critical connections between the eastern and western Amazon, and how these connections change during the major seasons (wet, dry, and transition) of the year.

Our analysis is divided into three main parts:

First, we summarize the state of knowledge on the movement of atmospheric moisture across the Amazon, drawing on a review of recent literature and exchanges with experts. Second, we identify the sensitive areas that are the most vulnerable to deforestation-caused disruption of moisture recycling. Third, we relate these sensitive areas in the west to their respective eastern key source areas for moisture for each of the three Amazonian seasons: wet, dry, and transition.

In summary, we identified the sensitive areas that are the most vulnerable to deforestation-caused disruption of moisture recycling from the Atlantic Ocean source are mostly located in the southwestern Amazon (Peru and Bolivia). For the wet season, much of the moisture flow to these sensitive areas crosses the continuous primary (non-deforested) forests of the northern Amazon. For the dry and transition seasons, however, the moisture flow to the sensitive areas must cross several major deforestation fronts located in the eastern Brazilian Amazon.

Thus, an important contribution of this work is to reveal that, contrary to the common perception that the tipping point is a single Amazon-wide event, certain parts of the Amazon are more vulnerable than others. Most notably, the southwestern Amazon (Peru and Bolivia) is most vulnerable to a possible tipping point, particularly stressed by disrupted dry season moisture flows over major deforestation fronts.

1. Movement of aerial moisture across the Amazon (moisture flow)

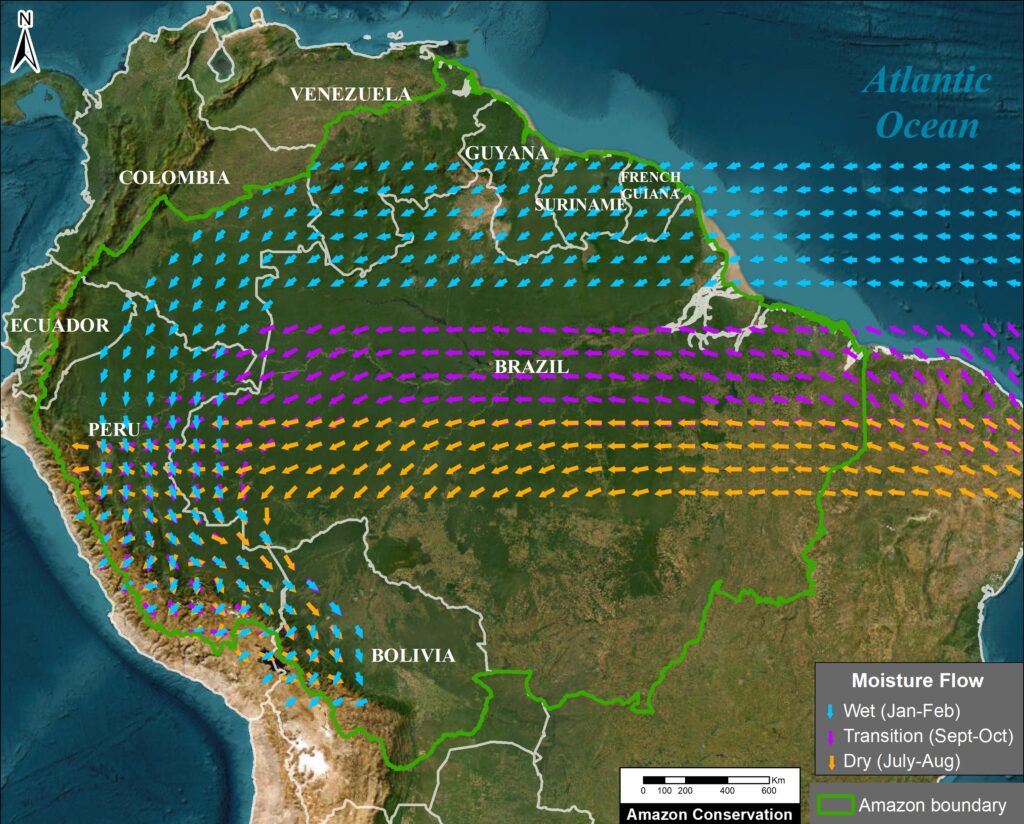
Figure 1. Amazon moisture flows by season for the SW Amazon. Data: ERA5, ACA/MAAP

Driven by permanent trade windsaerial (atmospheric) moisture flows westward from its source in the Atlantic Ocean, across the Amazon lowlands, and toward the Andes Mountains. These moisture routes are recharged by evapotranspiration and discharged by precipitation, creating moisture recycling systems (Beveridge 2024, Weng et al. 2018, Staal 2018, Weng 2019). Evaporation recycling reloads atmospheric moisture after rainfall, while precipitation recycling removes this moisture. The Amazon forest is therefore a key component of a giant water pump, starting with water transported from the tropical Atlantic Ocean and helping push it westward  (Zemp 2017, Boers 2017). Aerial rivers are the long-term and large-scale preferential pathways of the moisture flows driving this pump (Arraut et al. 2012) (see Intro Image). Thus, aerial rivers are the overall average (coarse-scale) moisture flow pattern, while moisture recycling focuses more on the seasonal differences (finer-scale). 

Of all the rainfall in the Amazon, its trees have directly transpired 20% of it (Staal et al. 2018). Half of this precipitation (10%) is from moisture from one recycling event, and the other half (10%) is from multiple recycling events. This latter process of cascading precipitation, or cascading moisture recycling (Zemp et al. 2014), may happen multiple times (up to five or six), recycling water from the eastern to western Amazon, to areas increasingly distant from the Atlantic Ocean source (Lovejoy and Nobre 2019, Beveridge et al, 2024). Precipitation tends to increase exponentially as moist air travels over forests, but then drops off sharply once it moves beyond them, showing just how vital forests are in sustaining rainfall across large regions (Molina et al. 2019). Transpiration-driven moisture recycling is especially important during the dry season (Staal et al. 2018, Nehemy et al. 2025).

Thus, there are transboundary implications, as actions occurring in an eastern country can have an impact on a western country downwind of the moisture cascade. For example, deforestation in eastern Brazil can negatively impact moisture flow going to Colombia, Ecuador, Peru, and Bolivia, including the tropical Andean mountains (Ruiz-Vasquez et al., 2020; Sierra et al. 2022, Flores et al 2024). As moisture recycling also continues beyond the boundaries of the Amazon, there may also be impacts to agricultural areas in southern Brazil, Paraguay, northern Argentina, and northern Colombia (Martinez and Dominguez 2014; Ruiz-Vasquez et al., 2020).

The resulting terrestrial flow of water from the Andes mountains through the Amazon lowlands and back to the Atlantic Ocean as runoff and flow of the Amazon river and its tributaries results in the emerging concept known as the “Andes–Amazon– Atlantic” (AAA) pathway (Beveridge et al, 2024).

Importantly, the moisture flows change seasonally in the Amazon. Figure 1 illustrates these seasonal changes for the southwest Amazon, as an example.

In the rainy season (January–February), the moisture flow is both westward and southward, creating a giant arc (Arraut 2012). Thus, the continental moisture source is the northeast Amazon (Boers 2017, Weng et al. 2018, Sierra et al. 2022). 

In the dry (July–August) and the dry-to-wet transition (September-October) seasons, the moisture flow shifts more directly westward (Arraut 2012, Staal et al, 2018). Therefore, the continental moisture source is the southeast Amazon, and some studies have identified this region as the most important for maintaining overall Amazonian resilience (Zemp et al. 2017, Staal et al. 2018).

There is increasing evidence that future deforestation will reduce rainfall downwind – further west – of the moisture recycling networks, inducing a “tipping point” of impacted regions that would transition from rainforest to savannah ecosystems (Boers 2017, Staal 2018, Lovejoy & Nobre 2018). This has led to calls for forest protection strategies to maintain the cascading moisture recycling system fueling the pathway (Zemp 2017, Encalada et al. 2021). A recent review indicates limited evidence for a single, system-wide tipping point; instead, specific areas of the Amazon may be more vulnerable (Brando et al, 2025).

Scientists are already documenting impacts linked to increasing forest loss.  Several recent studies have found that Amazon deforestation has already caused a significant decrease in precipitation in the southeast Amazon, particularly during the dry season (Qin et al, 2025, Liu et al, 2025, Franco et al. 2025). Moreover, deforestation reduces rainfall upwind of the cleared areas, impacting the western Amazon as well (Qin et al, 2025). In addition, recent studies have shown that Amazon deforestation delays the onset of the wet season in southern Amazonia (Ruiz-Vasquez et al., 2020; Commar et al., 2023; Sierra et al., 2023).

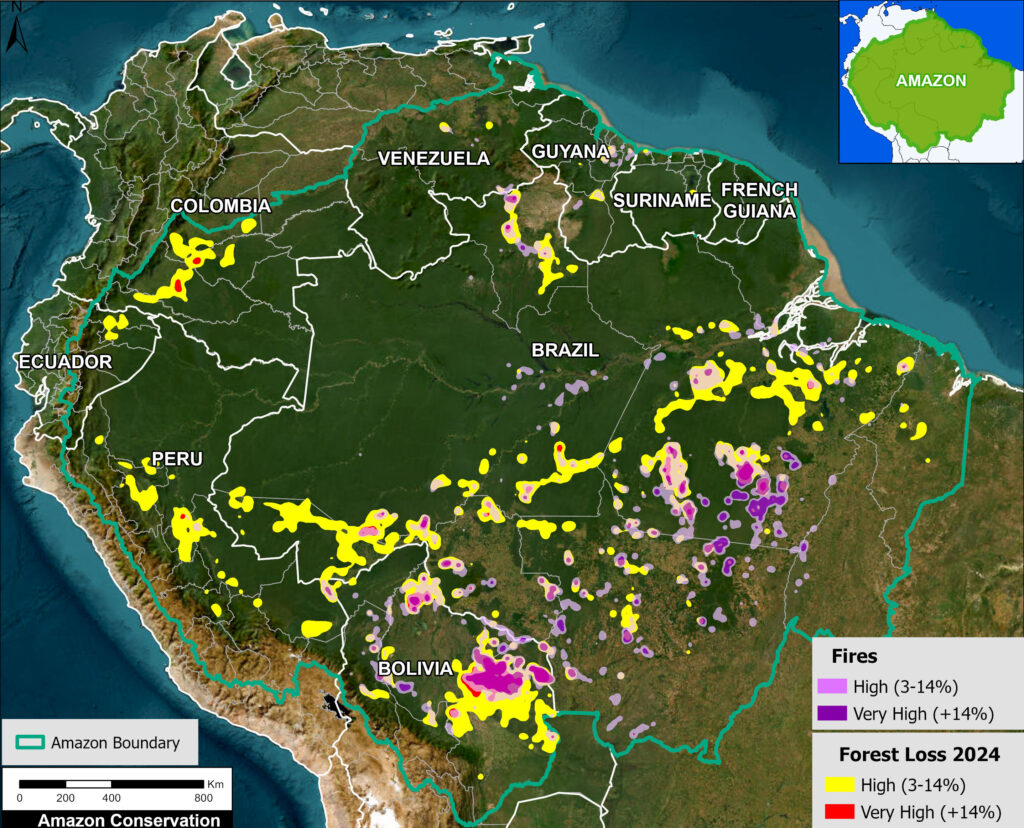
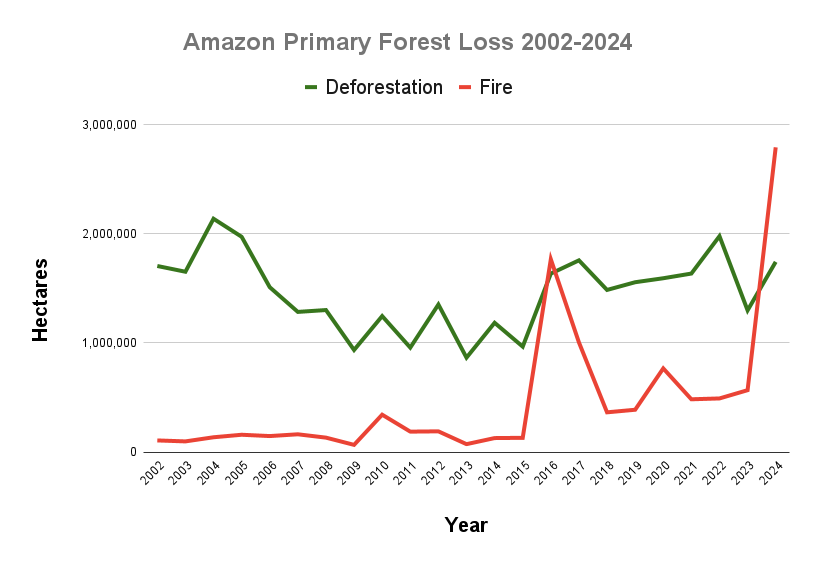
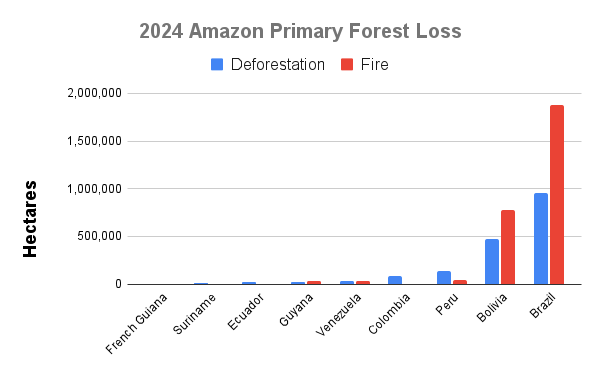
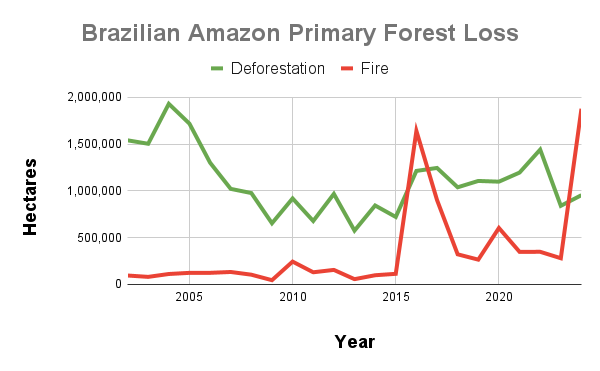
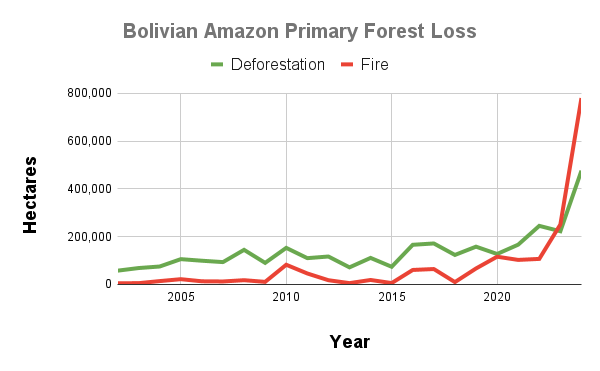
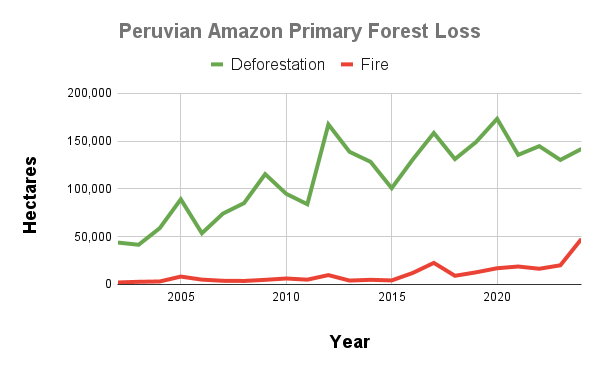
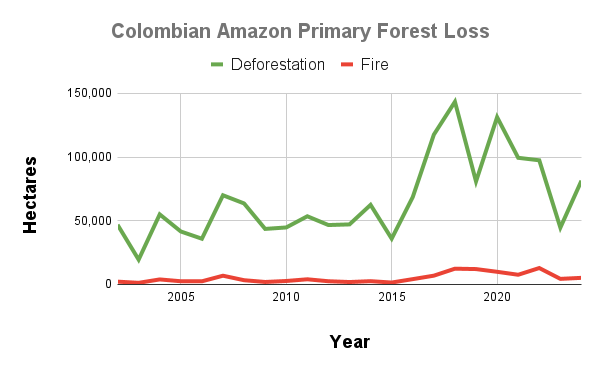
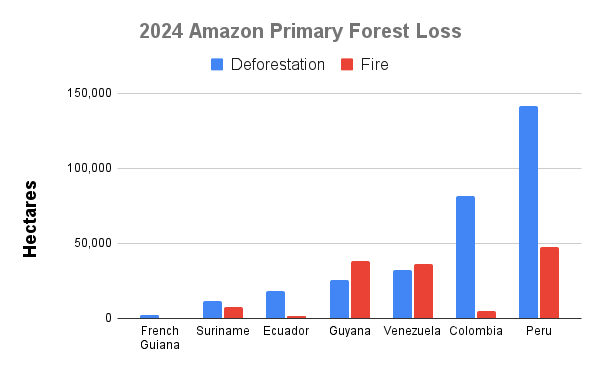
Related to deforestation, additional climatic factors, such as increased temperature and the length of the dry season, are also contributing to the tipping point (Flores et al. 2024). Multiple sources have reported on the lengthening of the dry season in southern and eastern Amazonia in recent decades, with the largest dry season observed in 2023-2024 during the major drought reported in Amazonia (Marengo el al 2024; Espinoza et al., 2024). As a result of these drier conditions, recent years have experienced record-breaking fire seasons, most notably during the El Niño years of 2016 and 2024 (Finer et al 2025). Notably,  the predicted forest-to-savannah change is already happening in places experiencing increased wildfire frequency due to these hot and dry conditions (Flores et al. 2021).

2. Areas most dependent on moisture recycling in the Amazon (sensitive areas)

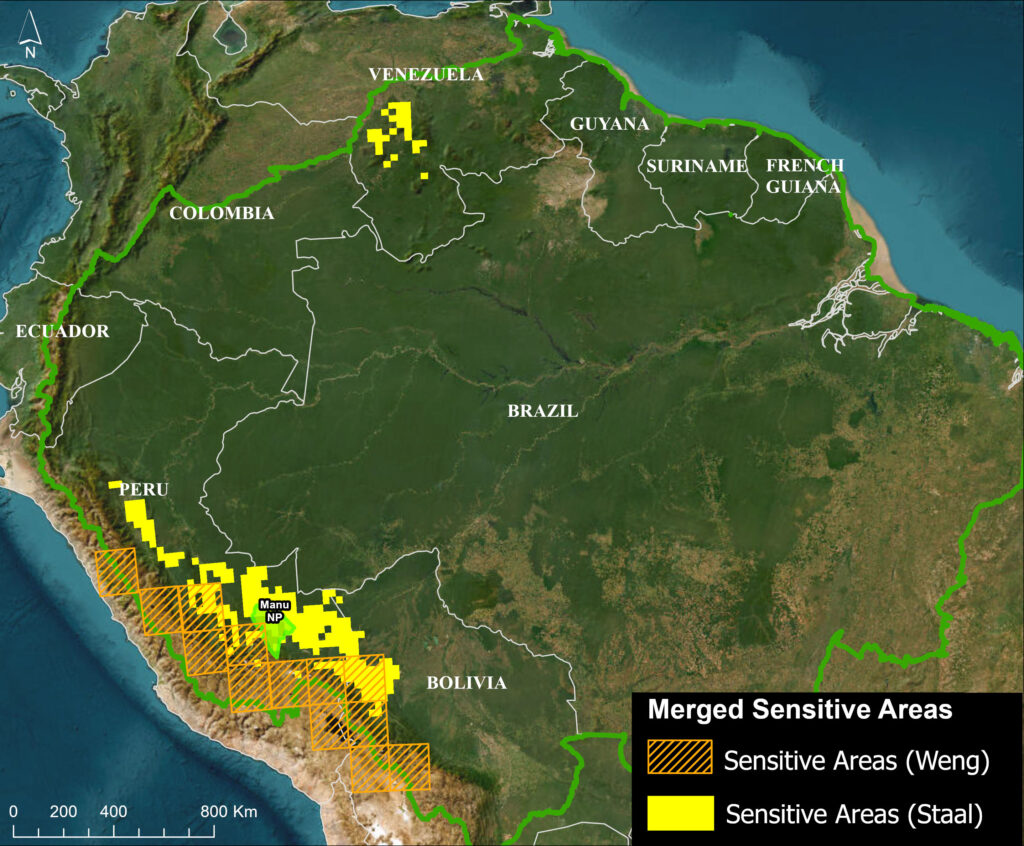
Figure 2. Merged sensitive areas. Data: Staal 2018, Weng 2018, Amazon Conservation/MAAP

A series of recent empirical and modeling studies indicate that the southwest Amazon (including the Peruvian and Bolivian ranges of the tropical Andes) is the major moisture sink – the area where precipitation is most dependent on moisture recycling (Boers et al. 2017, Zemp et al. 2017, Weng et al. 2018, Staal et al. 2018, Sierra et al. 2022). In fact, tree-transpired rainfall is greater than 70% in this region (Staal et al. 2018, Weng et al. 2018). 

Given its dependence on transpiration-driven precipitation, the impact of a reduction in rainfall from cascading moisture recycling is predicted to be greatest in the southwest Amazon (Zemp et al. 2017, Weng et al. 2018, Staal 2018, Sierra et al. 2022, Beveridge 2024). Indeed, the southwest Amazon forest may enter the bioclimatic equilibrium of savannas following projected extensive Amazon deforestation scenarios (Zemp, 2017). Forests in the northwest and Guyana Shield are also relatively dependent on forest-rainfall cascades (Hoyos et al 2018; Staal et al. 2018).

To precisely identify the most vulnerable areas in the Amazon to disruptions of transpiration-based moisture recycling in a spatially explicit manner, we merged two key studies featuring spatially explicit model outputs (Weng 2018, Staal 2018). These studies cover data for the dry season (Staal 2018) and yearly (both dry and wet seasons) (Weng 2018). 

Weng 2018 identifies “sensitive areas,” defined as areas having more than 50% of rainfall coming from Amazonian evapotranspiration (representing the 98th percentile of the highest sensitivity to Amazonian land use change). Staal 2018 estimates the effect of Amazon tree transpiration on Amazon forest resilience. We selected the areas with the highest resilience loss (0.8 and higher), quantified as the fraction of resilience that would be lost in the absence of tree transpiration by Amazonian trees.

Figure 2 illustrates the merged dataset, which we refer to as “merged sensitive areas.” Notably, both studies concur that the most vulnerable areas are located in the southwest Amazon, spanning the lowlands of only two of the nine countries of the Amazon Basin: Peru and Bolivia. This merged sensitive area covers a 1,750-kilometer-long swath along the Peruvian and Bolivian Andes. In this merged data map, we include Manu National Park as a reference point, located roughly in the middle of the sensitive areas. 

Weng et al. identified higher elevation areas of the Andean-Amazon transition area in both Peru (Junín, Cusco, and Puno regions) and Bolivia, while Staal et al (2018) identified slightly lower elevation areas in this same range. These regions are consistent with predicted areas of higher rainfall reduction due to deforestation (Sierra et al. 2022). Also, note that Staal indicates an additional area in the Venezuelan Amazon.

Although, as noted above, forests in the northwest and northeast (Guyana Shield) are also relatively dependent on forest-rainfall cascades, the forests of the southwest are the most dependent, likely given their location at the far end of the Atlantic-Amazon-Andes pathway.

3. Moisture flows to sensitive areas (by season)

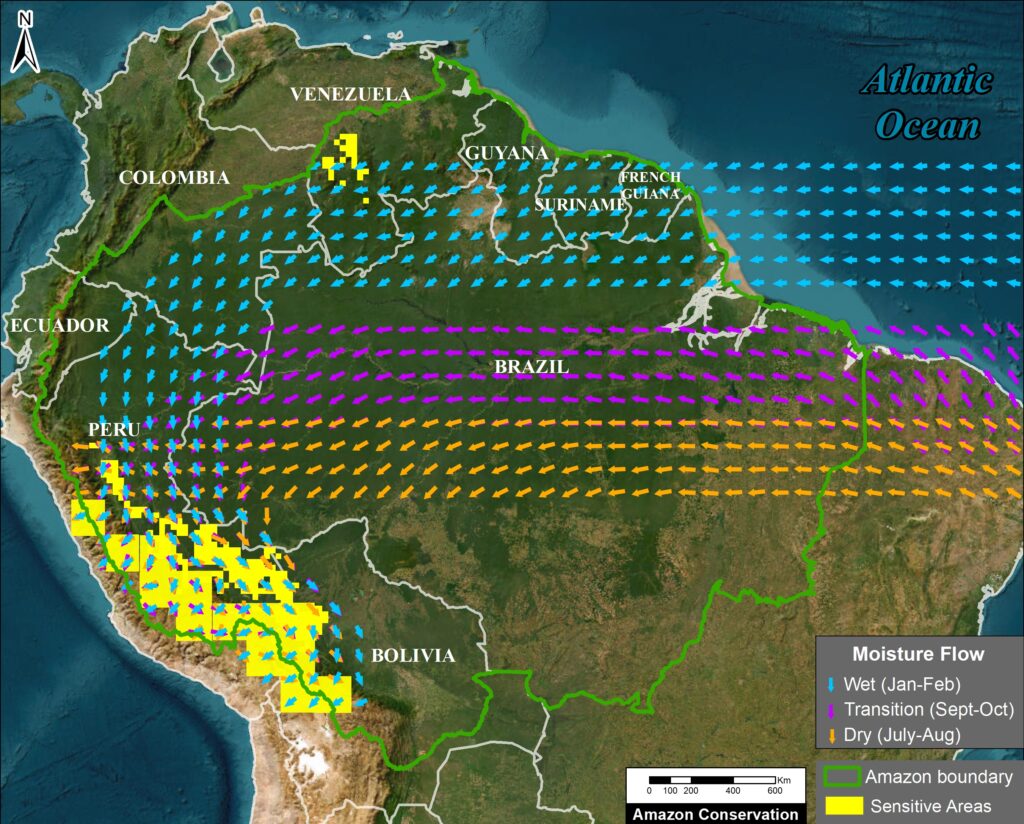
Figure 3. Amazon moisture flows by season relative to sensitive areas in the southwest Amazon. Data: ERA5, ACA/MAAP

Given the reliance of western, especially southwest, Amazon forests on cascading moisture recycling, a key challenge is to identify the most important moisture source areas in the eastern Amazon. In this respect, the literature provides a less definitive answer, likely because the moisture recycling routes change with seasons, in contrast to the long-term path of the aerial rivers that represent overall preferential pathways (Arraut 2012, Staal 2018, Weng et al. 2018). 

We correlate the merged sensitive areas in the southwest Amazon with their respective moisture source areas by back-tracking the moisture flows upwind. This component of the work was inspired by the precipitation-shed concept, defined here as the terrestrial upwind surface areas providing evapotranspiration to a specific area’s precipitation (Keys et al. 2012, Weng et al. 2018). 

We determined that analyzing all three major seasons is essential because of the major seasonal variability (Staal et al, 2018) and that each plays a key role in the stability of the rainforests: During the wet season, nearly 50% of total annual precipitation falls over the region, and these wet periods recharge Amazonian groundwater reserves vital for sustaining forest transpiration rates during dry months (Miguez-Macho and Fan 2012, Sierra et al 2022). During the dry season, moisture recycling processes are particularly important to ensure that some of the limited precipitation reaches the western Amazon (Beveridge et al, 2024). Tree-transpired rainfall then peaks during September to November, when large parts of the Amazon are at the end of the dry season and transitioning to the wet season (Zanin et al., 2024).

To map the pathway of moisture flow between the western Amazon merged sensitive areas and their eastern moisture sources, we utilize moisture flow data from the ERA5 reanalysis (Hersbach 2023). Specifically, we merged vertically integrated data for both northward and eastward water vapour flux. We chose data from 2022 as a recent year not heavily influenced by extreme weather events such as El Niño or drought (Espinoza et al., 2024). For 2022, we downloaded and analyzed the moisture flow data for three separate time periods: January-February (representing the wet or monsoon season), July-August (dry season), and September-October (dry-to-wet transition season).

The results for all three seasons are illustrated in Figure 3, where the arrows represent the ERA5 reanalysis moisture flow data from the Atlantic Ocean to the merged sensitive areas in the southwest Amazon. 

Note that in the wet season (January-February), moisture flows from the Atlantic Ocean over the northeast Amazon (northern Brazil, French Guiana, Suriname, Guyana, and Venezuela) before taking a major southern turn (arc) through the southeast Colombian Amazon and northern Peru before reaching the Sensitive Areas. This general pattern is consistent with other studies focused on the wet season (Arraut 2012, Boers 2017, Sierra et al. 2022) and year-round (Weng et al. 2018).

In contrast, in the dry (July-August) and transition (September-October) seasons, the moisture flows from the Atlantic Ocean further south across the central Brazilian Amazon, and has a less pronounced arc near the border with Peru. Specifically, the dry season pattern is consistent with other studies focused on the dry season (Arraut 2012, Staal 2018, Zemp 2017 NC).  Note that the transition season flow is located between the wet season to the north and the dry season to the south.

For all three seasons, we emphasize that the entire trajectory from east to west is important for conservation regarding cascading moisture recycling. That is, the farthest away areas in the east represent the full cascading trajectory, while the closest areas in the west exert the strongest direct influence (Weng et al. 2018). 

While moisture recycling covers a vast area from east to west, much of the tree-induced rainfall in the southwest Amazon is transpired nearby (Stall 2018). That is, areas exerting the strongest and most efficient influence on the southwest Amazon are located just upwind, in the central-west Amazon (Weng 2018; Wongchuig et al., 2023). In sum, extensive forest loss anywhere along the cascading moisture pathway from the eastern to the western Amazon, far or near, may affect transpiration-based precipitation in the western Amazon, adding to its sensitivity.

The overall annual pattern, accounting for all three seasons, could then be described as aerial rivers. As indicated by Weng et al. (2018), this mostly matches the pattern of the wet season.

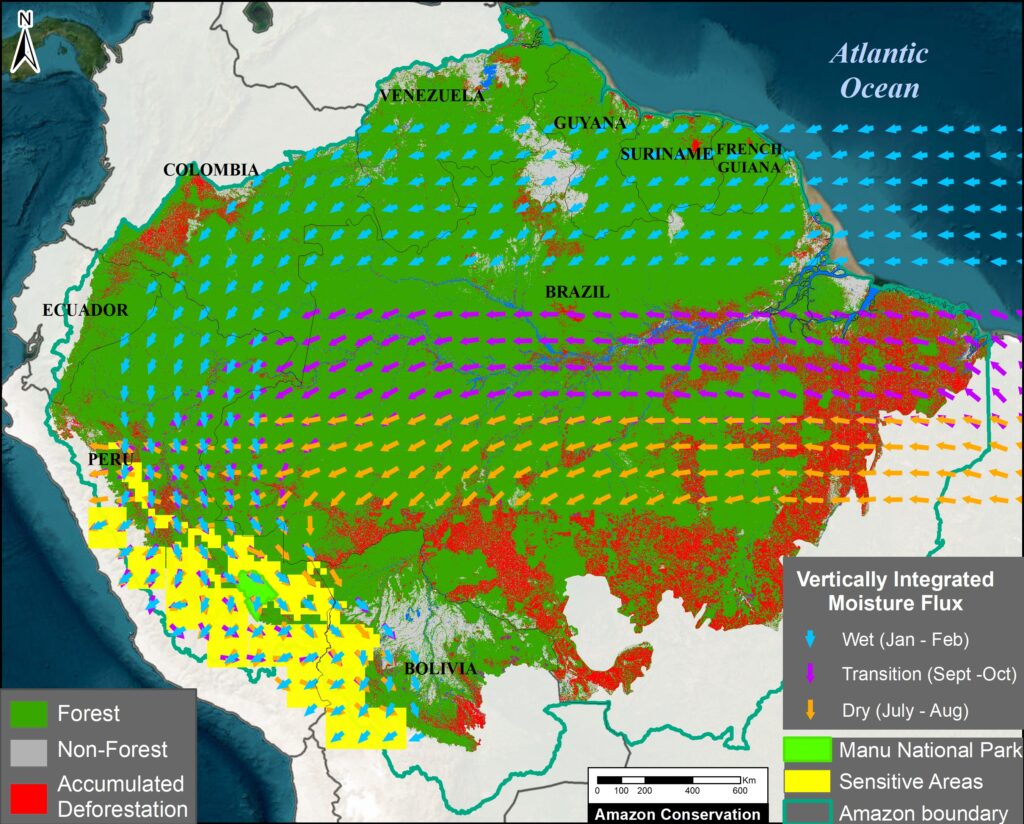
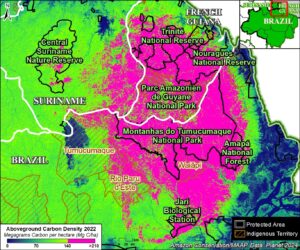
Figure 4. As in Figure 3, plus forest cover. Data: ERA5, Amazon Conservation/MAAP

For additional context, Figure 4 incorporates current land classification broken down into three major categories based on satellite imagery analysis: Forest, Non-forest (such as savannah), and accumulated Deforestation areas (as of 2022).

For January-February (wet season), note that much of the moisture flow crosses the continuous primary forest of the northern Amazon. That is, the moisture crosses predominantly non-deforested areas of northern Brazil, French Guiana, Suriname, Guyana, Venezuela, southeast Colombia, and northern Peru.

In contrast, the moisture flows for July-August (dry season) and September-October (transition season) cross several major deforestation fronts in the central Amazon, particularly during the dry season.

During the critical dry-to-wet transition season, the role of the local area’s tree evapotranspiration is especially important. The southern Amazon presents lower overall evapotranspiration values (Fassoni-Andrade 2021; Zanin et al., 2024). Due to the greater access of forest roots to deep soil water, however, evapotranspiration over forested areas is higher than croplands/grasslands during this time (von Randow et al. 2004). Since, during this transition season, the moisture transport to the southwestern Amazon passes over large deforested areas, the conservation of the remaining forest along this pathway is critical.

In addition, recent studies show that the main patterns of moisture flux can be altered at a continental scale due to deforestation (Commar et al., 2023; Sierra et al., 2023). As a result, reduced moisture transport from the Atlantic to the continent and delays in the onset of the wet season may occur in the future due to Amazon deforestation and climate change (Agudelo et al., 2023).

Conclusion

Above, in this initial technical report, we merged three key points that are critical to understanding the tipping point concept in the Amazon.

First, we presented an overview of aerial moisture flows originating from the Atlantic Ocean and then moving and recycling from the eastern to the western Amazon. Second, we identified the “sensitive areas” that are the most vulnerable to deforestation-caused disruption of moisture recycling, mostly located in the western Amazon (Peru and Bolivia).  Third, we relate these sensitive areas in the west to their respective eastern key source areas for moisture for each of the three Amazonian seasons: wet, dry, and transition. 

Incorporating updated land-use data, we found important differences by season. For the wet season, much of the moisture flow crosses the continuous primary (non-deforested) forests of the northern Amazon. For the dry and transition seasons, however, the moisture flow must cross several major deforestation fronts mainly located in the central Amazon.

Thus, an important contribution of this work is to reveal that, contrary to the common perception that the tipping point is a single Amazon-wide event, certain parts of the Amazon are more vulnerable than others. Most notably, the southwestern Amazon (Peru and Bolivia) is most vulnerable to a possible tipping point, particularly stressed by disrupted dry season moisture flows over major deforestation fronts.

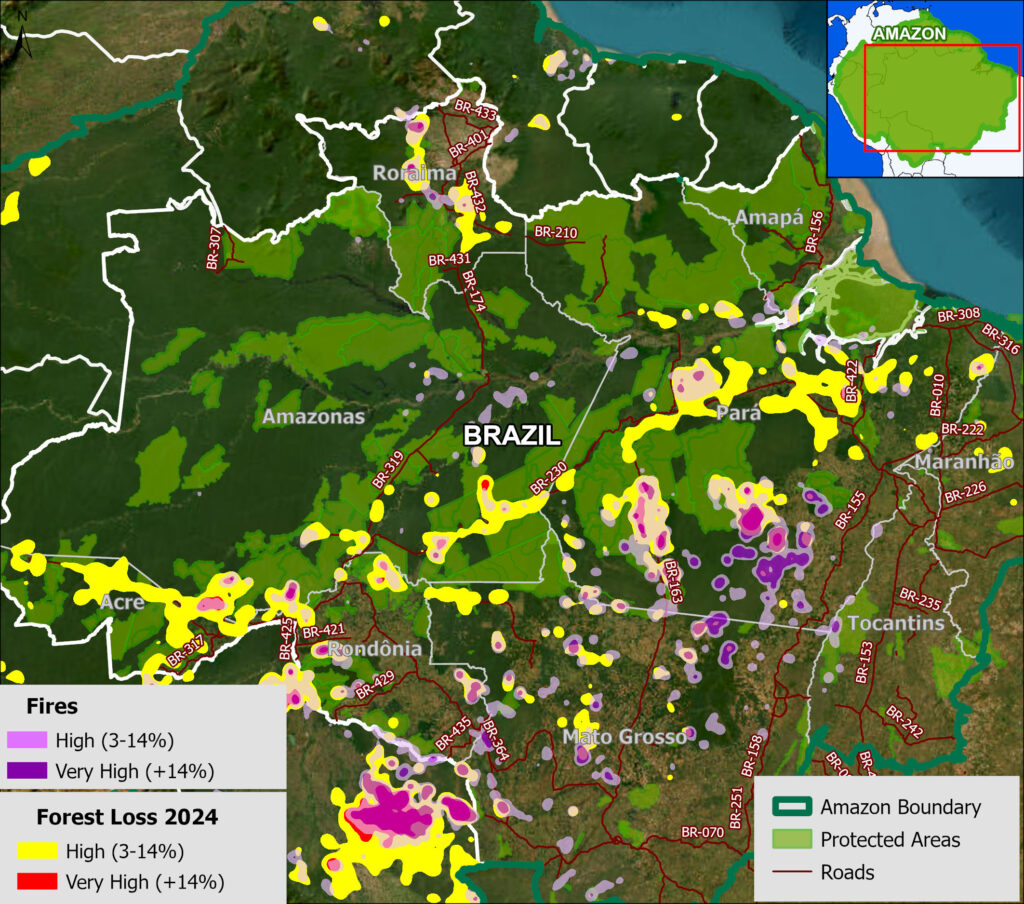
We will soon build off of these results in an upcoming policy-focused report that presents the major implications of the maintenance of aerial moisture flows for conservation. This analysis will include how to identify key conservation areas for each season based on the key concept of maintaining cascading moisture flow to the sensitive areas, in relation to protected areas, Indigenous territories, and major road networks. It will also reveal several policy implications that require urgent attention and new approaches to national governance and international cooperation. For example, It considers the implications of planned roads (most notably BR-319) and fortifying existing conservation areas and creating new ones in undesignated public lands.

Acknowledgements

This work was supported by the Leo Model Foundation.

We thank the following colleagues for datasets and/or comments on earlier versions of the report:

Wei Weng
Potsdam Institute for Climate Impact Research
Potsdam, Germany  

Arie Staal
Assistant Professor
Environmental Sciences
Copernicus Institute of Sustainable Development
Utrecht University

Juan Pablo Sierra
Institut des Géosciences de l’Environnement,
Université Grenoble Alpes, IRD, CNRS,
Grenoble, France  

Jhan-Carlo Espinoza
Directeur de Recherche, Institut de Recherche pour le Developpement (IRD)
IGE Univ. Grenoble Alpes, IRD, CNRS (UMR 5001 / UR 252) – France
Pontificia Universidad Católica del Perú. Lima – Perú

Co-chair of ANDEX: A regional Hydroclimate Initiative for the AndesGEWEX
Coordinator of the AMANECER Project (Amazon-Andes Connectivity)

Corine Vriesendorp
Director of Science
Conservación Amazónica – ACCA

Federico E. Viscarra
Science Officer
Science Panel for the Amazon

Daniel Larrea
Director of the Science & Technology Program
Amazon Conservation – Bolivia (ACEAA)

Citation

Finer M, Ariñez A, Sierra JP, Espinoza JC,, Weng W, Vriesendorp C, Bodin B, Beavers J (2025) MAAP: 232.

Literature Cited

Agudelo, J., Espinoza, J.C., Junquas, C., Arias, P. A., Sierra, J. P., Olmo, M. E (2023) Future projections of low-level atmospheric circulation patterns over South Tropical South America: Impacts on precipitation and Amazon dry season length. Journal of Geophysical Research: Atmospheres.

Beveridge et al (2024) The Andes–Amazon–Atlantic pathway: A foundational hydroclimate system for social–ecological system sustainability. PNAS 121 (22) e2306229121

Boers N, Marwan N, Barbosa HM, and Kurths J. (2017) A deforestation-induced tipping point for the South American monsoon system. Scientific reports, 7(1), 41489.

Brando PM, Barlow J, Macedo MN, Silvério DV, Ferreira JN, et al (2025) Tipping Points of Amazonian Forests: Beyond Myths and Toward Solutions. Annual Review of Environment and Resources. Vol. 50.

Commar, L.F.S., Abrahão, G.M., & Costa, M.H. (2023) A possible deforestation-induced synoptic-scale circulation that delays the rainy season onset in Amazonia. Environ. Res. Lett. 18, 044041.

Delphine Clara Zemp, Carl-Friedrich Schleussner, Henrique M. J. Barbosa, Marina Hirota, Vincent Montade, Gilvan Sampaio, Arie Staal, Lan Wang-Erlandsson & Anja Rammig (2017) Nat Comms 8: 14681  

Encalada A.C., Adalberto L. Val, Simone Athayde, Jhan Carlo Espinoza, Marcia Macedo, Mirian Marmontel, Guido Miranda, Maria Tereza Fernandez Piedade, Tiago da Mota e Silva & Julia Arieira (2021) Conserving the Amazon’s freshwater ecosystems’ health and connectivity. SPA Policy Brief.

Espinoza JC., Jimenez J.C., Marengo J.A. Schongart J., Ronchail J., Lavado-Casimiro W. Ribeiro JVM (2024) The new record of drought and warmth in the Amazon in 2023 related to regional and global climatic features. Sci Rep 14, 8107. 

Fassoni-Andrade, A. C., Fleischmann, A. S., Papa, F., Paiva, R. C. D. d., Wongchuig, S., Melack, J. M., et al. (2021). Amazon hydrology from space: Scientific advances and future challenges. Reviews of Geophysics, 59, e2020RG000728.  

Finer M, Ariñez A, Mamani N, Cohen M, Santana A (2025) Amazon Deforestation & Fire Hotspots 2024. MAAP: 229.

Flores, B.M., Holmgren, M (2021) White-Sand Savannas Expand at the Core of the Amazon After Forest Wildfires. Ecosystems 24, 1624–1637.

Flores et al. (2024) Critical transitions in the Amazon forest system. Nature, 262 (555–564).

Franco et al. (2025) How climate change and deforestation interact in the transformation of the Amazon rainforest. Nature Communications 16:7944.

Hersbach, H., Bell, B., Berrisford, P., Biavati, G., Horányi, A., Muñoz Sabater, J., Nicolas, J., Peubey, C., Radu, R., Rozum, I., Schepers, D., Simmons, A., Soci, C., Dee, D., Thépaut, J-N. (2023): ERA5 hourly data on single levels from 1940 to present. Copernicus Climate Change Service (C3S) Climate Data Store (CDS).

Hoyos, F. Dominguez, J. Cañón-Barriga, J. A. Martínez, R. Nieto, L. Gimeno & P. A. Dirmeyer (2018) Moisture origin and transport processes in Colombia, northern South America. Climate Dynamics. Volume 50, pages 971–990

Josefina Moraes Arraut, Carlos Nobre, Henrique M. J. Barbosa, Guillermo Obregon, and José Marengo (2012) Aerial Rivers and Lakes: Looking at Large-Scale Moisture Transport and Its Relation to Amazonia and to Subtropical Rainfall in South America. Journal of Climate 25 (2):543-556.

Keys, P. W., Van Der Ent, R. J., Gordon, L. J., Hoff, H., Nikoli, R., and Savenije, H. H. G. (2012) Analyzing precipitation sheds to understand the vulnerability of rainfall dependent regions, Biogeosciences, 9, 733–746.

Lovejoy T. & Nobre C. (2018) Amazon tipping point. Science Advances, 4(2)

Lovejoy T.E., C. Nobre (2019) Amazon tipping point: Last chance for action. Sci. Adv. 5, eaba 2949.

Marengo, J. , Cunha, A. , Espinoza, J.C. , Fu, R. , Schöngart, J. , Jimenez, J. , Costa, M. , Ribeiro, J. , Wongchuig, S. and Zhao, S (2024) The Drought of Amazonia in 2023-2024. American Journal of Climate Change, 13, 567-597. 

Martinez J.A. and Dominguez F. (2014) Sources of Atmospheric Moisture for the La Plata River Basin. 27 (17) 6737–6753.

Miguez-Macho G, Fan Y (2012) The role of groundwater in the Amazon water cycle: 1. Influence on seasonal streamflow, flooding and wetlands. J Geophys Res Atmos. 

Molina, R. D., Salazar, J. F., Martínez, J. A., Villegas, J. C., & Arias, P. A. (2019). Forest-induced exponential growth of precipitation
along climatological wind streamlines over the Amazon. Journal of Geophysical Research: Atmospheres, 124, 2589–2599.

Nehemy MF et al. (2025)   Embolism resistance supports the contribution of dry-season precipitation to transpiration in eastern Amazon forests. PNAS 122: 33.

Qin, Y., Wang, D., Ziegler, A.D. et al. (2025) Impact of Amazonian deforestation on precipitation reverses between seasons. Nature 639, 102–108.

Ruiz-Vásquez M. Arias PA., Martinez JA., Espinoza JC. (2020) Effects of Amazon basin deforestation on regional atmospheric circulation and water vapor transport towards tropical South America. Climate Dynamics. 

Sierra, J.P., Junquas, C., Espinoza, J.C., Segura, H., Condom, T., Andrade, M., Molina-Carpio, J., Ticona, L., Mardoñez, V., Blacutt, L., Polcher, J., Rabatel, A., Sicart, J. E. (2022) Deforestation Impacts on Amazon-Andes Hydroclimatic Connectivity. Climate Dynamics.

Sierra, J.P., Espinoza, JC., Junquas, C. Wongchuig S., Polcher J., Moron V., Fita L., Arias PA., Schrapffer A., Pennel R. (2023) Impacts of land-surface heterogeneities and Amazonian deforestation on the wet season onset in southern Amazon. Clim Dyn. 

Staal, A., Tuinenburg, O.A., Bosmans, J.H.C. et al. (2018) Forest-rainfall cascades buffer against drought across the Amazon. Nature Clim Change 8, 539–543.

von Randow C, Manzi AO, Kruijt B et al (2004) Comparative measurements and seasonal variations in energy and carbon exchange over forest and pasture in South West Amazonia. Theor Appl Climatol 78:5–26.

WCS (2023) High Integrity Forest Investment Initiative (HIFOR): The Science Basis

Weng W. (2019), Aerial river management for future water in the context of land use change in Amazonia   

Weng, Wei, Matthias K. B. Luedeke, Delphine C. Zemp, Tobia Lakes, and Juergen P. Kropp. (2018) “Aerial and Surface Rivers: Downwind Impacts on Water Availability from Land Use Changes in Amazonia.” Hydrology and Earth System Sciences 22 (1): 911–27

Wongchuig S, Espinoza JC, Condom T, Junquas C, Sierra JP, Fita L, Sörensson A, Polcher J. 2023. Changes in the surface and atmospheric water budget due to projected Amazon deforestation: Lessons from a fully coupled model simulation, Journal of Hydrology, Volume 625.

Zanin PR, Pareja-Quispe D, Espinoza JC. (2024) Evapotranspiration in the Amazon Basin: Couplings, hydrological memory and water feedback. Agricultural and Forest Meteorology. 

Zemp, D. C., C-F Schleussner, H. M. J. Barbosa, and A. Rammig. (2017)  “Deforestation Effects on Amazon Forest Resilience.” Geophysical Research Letters 44 (12): 6182–90 

Zemp, D. C., Schleussner, C.-F., Barbosa, H. M. J., van der Ent, R. J., Donges, J. F., Heinke, J., Sampaio, G., and Rammig, A.(2017) On the importance of cascading moisture recycling in South America, Atmos. Chem. Phys., 14, 13337–13359, https://doi.org/10.5194/acp-14-13337-2014, 2014.

MAAP #229: Amazon Deforestation & Fire Hotspots 2024

Base Map. Deforestation and fire hotspots across the Amazon in 2024. Data: UMD/GLAD, Amazon Conservation/MAAP.

Continuing our annual series, we present a detailed look at the major 2024 Amazon forest loss hotspots, based on the final annual data recently released by the University of Maryland and featured on Global Forest Watch. As in other reports of the series, we take this global dataset and analyze it for the Amazon specifically.

This forest loss dataset serves as a consistent source across all nine countries of the Amazon, distinguishing forest loss from fire and non-fire causes. We use the non-fire forest loss as a proxy for human-caused deforestation, although it also includes some natural loss (such as landslides and windstorms). Previous research has confirmed that nearly all Amazon fires are human-caused (MAAP #189).

With this context, we are able to present both estimated deforestation and fire hotspots across the Amazon (see Base Map and Graph 1). 

In 2024, the deforestation was the fifth highest on record (since 2002), at over 1.7 million hectares (4.3 million acres) across the Amazon. This value represents a major increase (34%) from 2023, but a decrease (12%) from the recent peak in 2022 (1.98 million hectares). The majority of the deforestation occurred in Brazil (54.7%), followed by Bolivia (27.3%)Peru (8.1%), and Colombia (4.7%) as the clear top four in 2024.

The big story in 2024, however, was the record-breaking impact of fires on primary forests, with a total of 2.8 million hectares (6.9 million acres). This total shattered the previous record of 1.7 million hectares in 2016. The vast majority (95%) of this fire impact occurred in just two countries: Brazil and Bolivia, which both set annual fire records of their own (along with Peru, Guyana, Suriname, and French Guiana). Overall, this fire data may be interpreted as forest degradation, in contrast to the more permanent impacts of deforestation.

In terms of spatial patterns, the Base Map indicates that most of the intense forest loss hotspots were due to fire. These fire hotspots were especially concentrated in the soy and cattle frontiers of the southeast Brazilian Amazon and southeast Bolivian Amazon. The deforestation hotspots (without major associated fires) were largely due to agriculture and gold mining across the Amazon, notably in Bolivia, Brazil, Colombia, Ecuador, and Peru. See Annex 1 for the overall forest loss hotspots (without the specific fire loss data).

Previous research has revealed the tight link between deforestation and fires in the Amazon (MAAP #189). That is, many major fires are burning recently deforested areas, and sometimes escape into surrounding forests, especially with extended dry conditions.

In total, 4.5 million hectares (11.2 million acres) of primary forest were impacted by deforestation and fire combined. This total is the highest on record by far, surpassing 2016 (3.4 million hectares) by over a million hectares.

Since 2002, we estimate the deforestation of 33.7 million hectares (83.4 million acres) of primary forest, greater than the size of the state of New Mexico. An additional 10.6 million hectares (26.2 million acres) have been impacted by fires.

Below, we zoom in on the four countries with the highest deforestation (Brazil, Bolivia, Peru, and Colombia), plus additional highlights from around the Amazon (Guyana, Venezuela, and Ecuador).

Amazon Primary Forest Loss, 2002-2024

Graph 1 shows the historical trend of Amazonian primary forest loss, from 2022 to present.

Graph 1. Amazon Forest Loss, 2002-24. Data: UMD/GLAD, Amazon Conservation/MAAP.

Amazon Primary Forest Loss (By Country), 2002-2024

Graph 2a shows 2024 Amazon primary forest loss for all nine countries. In Annex 2, Graph 2b removes Brazil and Bolivia to see the other countries in greater detail.

Graph 2a. Amazon primary forest loss for all nine countries. Data: UMD

Brazilian Amazon

Figure 2. Deforestation and fire hotspots in the Brazilian Amazon. Data: UMD.

In 2024, the Brazilian Amazon lost 954,126 hectares (2.4 million acres) of primary forest to deforestation. Although this total marked a 13.6% increase from 2023, it was historically relatively low (16th highest overall since 2002).

The bigger story is that fires directly impacted an additional 1.9 million hectares (4.6 million acres). This fire impact was the highest on record, surpassing the previous high of 2016 (1.6 million hectares).

All of the most intense forest loss hotspots were characterized by intense fires. Many of these hotspots were concentrated in the southeast Brazilian Amazon (Figure 2). These areas include along the major north-south road in the state of Pará (BR-163), and further to the east of this road. The hotpots also expanded south into the soy frontier of Mato Grosso state.

Fire hotspots were also located in the northern state Roraima, and along the other major road networks, especially road BR-230 (Trans-Amazonian Highway) in the states of Pará and Amazonas, and road BR-364 in the state of Acre.

Previous research has revealed that over 70% of major fires in the Brazilian Amazon are burning recently deforested areas (MAAP #189). In extended dry conditions, such as 2016 and 2024, these major fires escape into surrounding forests.


Graph 3. Deforestation and fire trends in the Brazilian Amazon. Data: UMD.

Bolivian Amazon

Figure 3. Deforestation and fire hotspots in the Bolivian Amazon. Data: UMD.

In 2024, the Bolivian Amazon lost 476,030 hectares (1.2 million acres) of primary forest to deforestation. This total was the highest on record, surpassing the previous high of 2022 (245,177 hectares).

In an even bigger shattering record, fires directly impacted an additional 779,960 hectares (1.9 million acres). This total crushed the previous record of 2023 (250,843 hectares).

Like Brazil, the most intense forest loss hotspots were characterized by intense fires.

These fires were concentrated in the soy frontier located in the southeastern department of Santa Cruz (Figure 3). We emphasize that this particular hotspot is further north than in previous years, indicating a northern expansion of soy plantations.

There was also a concentration of fire hotspots along the Beni and Pando departments’ border, and closer to the Andes Mountains in the departments of La Paz and Beni.

Deforestation hotspots (without fires) were concentrated in the soy frontier in the southeast.


Graph 4. Deforestation and fire trends in the Bolivian Amazon. Data: UMD.

Peruvian Amazon

Figure 4. Deforestation and fire hotspots in the Peruvian Amazon. Data: UMD.

In 2024, the Peruvian Amazon lost 141,781 hectares (350,341 acres) of primary forest to deforestation. This total marks the 6th highest on record since 2002.

Breaking a record, fires impacted an additional 47,574 hectares (117,554 acres). This total more than doubled the previous high of 2023 (20,042 hectares). As noted above, this fire data may be interpreted as forest degradation, in contrast to the more permanent impacts of deforestation.

Like both Brazil and Bolivia, all of the most intense forest loss hotspots were characterized by intense fires. These fires were concentrated in the central and southeast Amazon (Ucayali and Madre de Dios regions, respectively) (Figure 4).

Deforestation hotspots were concentrated in the gold mining frontier in the southern Amazon and throughout the central Amazon. The very high hotspot in central Peru corresponds to the latest deforestation by Mennonite colonies (see MAAP #222 for context).


Graph 5. Deforestation and fire trends in the Peruvian Amazon. Data: UMD

Colombian Amazon

Figure 5. Deforestation and fire hotspots in the Colombian Amazon. Data: UMD.

In 2024, the Colombian Amazon lost 81,396 hectares (201,129 acres) of primary forest to deforestation. This total marked a striking 82.5% increase from the recent low recorded in 2023. It was the 7th highest on record, continuing the trend of elevated forest loss since the FARC peace agreement in 2016 (all top seven deforestation annual totals have occurred since 2016).

Major fires were less of an issue in the Colombian Amazon, but did directly impact an additional 5,184 hectares (8th highest on record).

As described in previous reports (see MAAP #120), Figure 5 shows that there continues to be an “arc of deforestation” in the northwest Colombian Amazon (Caqueta, Meta, Putumayo and Guaviare departments). Most notably, there is a pair of very high deforestation areas surrounding Chiribiquete National Park, and high deforestation areas within Tinigua and Macarena National Parks.

This arc impacts numerous Protected Areas (particularly Tinigua and Chiribiquete National Parks) and Indigenous Reserves (particularly Yari-Yaguara II and Nukak Maku).


Graph 6. Deforestation and fire trends in the Colombian Amazon. Data: UMD.

Rest of the Amazon

Other important highlights from around the Amazon include:

Deforestation and fire hotspots in northeast Guyana. In total, Guyana lost 25,858 hectares of primary forest to deforestation, and an additional 38,314 hectares to fires, both of which shattered previous records.

Deforestation in the Venezuelan Amazon was the highest on record (32,240 hectares), and additional fire impacts were the second highest (36,471 hectares).

Deforestation in the Ecuadorian Amazon was the second highest on record (18,615 hectares), just behind 2022 (18,902 hectares). Deforestation hotspots were concentrated in the northern Amazon, areas characterized by high gold mining activity (MAAP #227, MAAP #221, MAAP #219). As in Colombia, major fires were less of an issue in the northwest Amazon overall, but did directly impact an additional 1,540 hectares (4th highest on record).

Fires were the highest on record in Suriname (7,926 ha) and French Guiana (635 ha).

Policy Implications

The dominant policy development of 2024 was the record-breaking fire season across the Amazon. These fire records were not only region-wide but also country-specific, occurring in Brazil, Bolivia, Peru, Guyana, Suriname, and French Guiana.

The 2024 records are particularly significant given that the Amazon has experienced several intense fire years over the past two decades. The most notable, and previous record-breaker, occurred in 2016, following the “Godzilla” El Niño event of 2015-16. However, the extreme drought conditions of 2023 and 2024, also associated with El Niño,  exceeded those past benchmarks, creating extreme conditions for widespread fires across the Amazon.

As a result, fire policy is now emerging as a central pillar of Amazon conservation, alongside longstanding efforts to curb deforestation. This growing prominence is directly related to climate change, both in terms of intensifying dry seasons and the projected increase in the frequency, length, and severity of El Niño events.

These policies must be centered on how to avoid fires in the first place, and then how to effectively respond to major fires once they appear.

Previous research has revealed the tight link between deforestation and fires in the Brazilian Amazon (MAAP #189). That is, many major fires are burning recently deforested areas, and sometimes escape into surrounding forests, especially with extended dry conditions. Therefore, strengthening deforestation control remains one of the most effective fire mitigation strategies in Brazil and other Amazonian countries.

There is also a strong link between deforestation and fire in the Bolivian Amazon. While deforestation often precedes fires, as in Brazil, there is also a second round of deforestation following the fires

In both contexts, real-time fire monitoring, such as the MAAP Fire Tracker,  should be integrated into national response protocols and field-level coordination. 

Beyond fire, high rates of forest loss continue to be driven by deforestation across other parts of the Amazon. In Colombia’s arc of deforestation, we detected very high deforestation around Chiribiquete National Park, as well as high deforestation within Tinigua and Macarena National Parks. Although the national government is engaged on the issue of deforestation, these losses are closely tied to the presence and influence of armed groups in the country, which exert substantial control over land-use and deforestation dynamics (explaining shifts such as the dip in 2023 and the rise again in 2024). The major deforestation drivers in Colombia are roads, land grabbing (and associated cattle pastures), and coca cultivation.

Other high forest loss areas include gold mining fronts in northern Ecuador and southern Peru, Mennonite colonies in central Peru, the soy frontier in southeast Bolivia, and along major existing roads in Brazil. Although there is gold mining in both Venezuela and Guyana, the most intense forest loss hotspots were associated with fires surrounding agricultural areas.

It is important to note that the data presented here may differ from national data presented by governments. This difference may be due to methodology (we focus on impact on primary forests), spatial resolution (30 meters in our case), and Amazon boundaries (we employ a hybrid boundary designed for maximum inclusion of both watershed and biogeography). Due to these potential differences among sources, it is best to focus on the convergence of overall trends and patterns, and not overly focus on absolute numerical differences. 

Annex 1

Annex 1. Forest loss hotspots in relation to fire specific hotspots across the Amazon in 2024. Data: UMD/GLAD, ACA/MAAP.


Annex 2

Graph 2b. Amazon primary forest loss for seven countries (except Brazil and Bolivia). Data: UMD

Methodology

The analysis was based on 30-meter resolution annual forest loss data produced by the University of Maryland and also presented by Global Forest Watch.

This data was complemented with the Global Forest Loss due to fire dataset that is unique in terms of being consistent across the Amazon (in contrast to country specific estimates) and distinguishes forest loss caused directly by fire (note that virtually all Amazon fires are human-caused). The values included were ‘medium’ and ‘high’ confidence levels (code 3-4). This fire data may be interpreted as forest degradation, in contrast to the more permanent impacts of deforestation.

The remaining forest loss serves as a likely close proxy for deforestation, with the only remaining exception being natural events such as landslides, wind storms, and meandering rivers. The values used to estimate this category was ‘low’ certainty of forest loss due to fire (code 2), and forest loss due to other ‘non-fire’ drivers (code 1).

For the baseline, it was defined to establish areas with >30% tree canopy density in 2000. Importantly, we applied a filter to calculate only primary forest loss by intersecting the forest cover loss data with the additional dataset “primary humid tropical forests” as of 2001 (Turubanova et al 2018). For more details on this part of the methodology, see the Technical Blog from Global Forest Watch (Goldman and Weisse 2019).

Our geographic range for the Amazon is a hybrid designed for maximum inclusion: biogeographic boundary (as defined by RAISG) for all countries, except for Bolivia and Peru, where we use the watershed boundary, and Brazil, where we use the Legal Amazon boundary.

To identify the deforestation hotspots, we conducted a kernel density estimate. This type of analysis calculates the magnitude per unit area of a particular phenomenon, in this case, forest cover loss. We conducted this analysis using the Kernel Density tool from the Spatial Analyst Tool Box of ArcGIS. We used the following parameters:

Search Radius: 15000 layer units (meters)
Kernel Density Function: Quartic kernel function
Cell Size in the map: 50 x 50 meters (0.25 hectares)
Everything else was left to the default setting.

For the Base Map, we used the following concentration percentages: High: 3-14%; Very High: >14%. These percentages correspond to the concentration of forest loss pixels, with a pixel size of 50 x 50 meters (0.25 hectares).

Acknowledgements

We thank colleagues at Global Forest Watch (GFW), an initiative of the World Resources Institute (WRI) for early access to data.

We also thank colleagues from the following organizations for helpful comments on the report: Conservación Amazónica – ACEAA in Bolivia, Conservación Amazónica – ACCA in Peru, Fundación EcoCiencia in Ecuador, and Instituto Centro de Vida (ICV) in Brazil.

This work was supported by Norad (Norwegian Agency for Development Cooperation).

Citation

Finer M, Ariñez A, Mamani N, Cohen M, Santana A (2025) Amazon Deforestation & Fire Hotspots 2024. MAAP: 229.

MAAP #228: Illegal Gold Mining in the Puré and Cotuhé Rivers in the Colombian Amazon

Base Map. Illegal gold mining in the Puré & Cotuhé Rivers, Colombian Amazon. Data: ACA/MAAP, FCDS, RAISG

Illegal gold mining poses a challenge to environmental sustainability, governance, and security for all nine countries of the Amazon. The high price of gold on the international market has fueled the growth of this activity, combined with other factors such as the scarcity of economic alternatives, the presence of illicit groups, corruption, and a lack of effective government action.

In the Amazon, illegal mining has generated massive deforestation (MAAP #226), contamination of water sources due to the use of mercury, and expansion of illicit economies, with gold becoming a key source of financing for organized armed groups (Note 1).

In a series of reports, MAAP has detailed and illustrated cases of illegal mining in many parts of the Amazon, including Peru, Ecuador, Brazil, and Venezuela. These reports include both forest-based mining causing deforestation, and river-based mining causing mercury contamination.

In this report, we focus on river-based mining in the northwestern Amazon, specifically the triple border region between Colombia, Brazil, and Peru (see Base Map).In this area, illegal mining activities impact several rivers that connect these countries: the Puré, Cotuhé, Caquetá, Amazonas, Apaporis, and Putumayo Rivers in Colombia; the Napo, Curaray, Putumayo, Yaguas, Nanay, and Mazán Rivers in Peru; and the Puruí and Japurá Rivers in Brazil.

Although it doesn’t cause deforestation, this type of mining activity directly impacts not only the rivers but all ecosystems interconnected with them, due to the use of dredges and mercury. This mercury contamination spreads through the food chain, accumulating in species consumed by the local population, harming their health. This type of mining can extract up to three kilograms of gold per month, equivalent to approximately $275,000 per month (Notes 2-3).

Specifically, this report examines the current situation of the Puré and Cotuhé Rivers, in their southeastern reaches, located in the Colombian Amazon (see Base Map). These rivers are located in the department of Amazonas, along the borders of Brazil and Peru.

In both cases, we analyzed these river stretches using a combination of very high-resolution satellite images (0.5 meters, Planet/Skysat) and overflight photographs (courtesy of the Amazon Alliance for the Reduction of the Impacts of Gold Mining – AARIMO in Spanish).

This report was produced in collaboration with our Colombian partner, the Foundation for Conservation and Sustainable Development (FCDS), and with financial support from the Overbrook Foundation and Gordon and Betty Moore Foundation..

Detection of mining activity in the Puré River

The Puré River flows through the core of the Río Puré National Park in the southeastern Colombian Amazon (see Base Map).

This protected area, in addition to its extraordinary biodiversity and high carbon levels, also plays a role as a food source for Indigenous communities and is recognized as home to Indigenous peoples in voluntary isolation, including the Yurí–Passé, whose high vulnerability has been widely recognized internationally.

This protected area faces pressures and threats primarily associated with alluvial mining activities, which are increasingly occurring along the Puré River from the border with Brazil. The impacts of this activity include mercury contamination of water and fish, destruction of aquatic habitats and ecosystems, hunting, logging, and impacts on food security and the environment where communities in voluntary isolation live.

Despite interventions by the Colombian government and ongoing monitoring by organizations, mining activities continue, with increased intensity during periods when the river flow is lowest.Analyzing a Skysat image from November 2024, we found 29 dredges along the Puré River (see red dots in Figure 1). Figures 1J-L show examples of these findings. In other Skysat images from March and April 2025, we identified 27 dredges (see yellow dots in Figure 1).

Figure 1. Detected gold mining activity in the Puré River. Data: Amazon Conservation/MAAP, FCDS.

Overflight photos – Puré River

The following photos (corresponding to points 1-3 in Figure 1) were taken during a low-altitude overflight conducted by FCDS in September 2024. This additional resolution provides additional information on mining methods and their impacts (AARIMO 2024).

Punto 1

Overflight photo, Point 1. Green-roof dredger, with Starlink. Data: FCDS.

Punto 2

Overflight photo, Point 2. Three dredgers with barges and skidders. Data: FCDS.

Punto 3

Overflight photo. Point 3. Dredges and heavy machinery. Data: FCDS.

Detection of mining activity in the Cotuhé River

The Cotuhé River borders the north of Amacayacu National Park (see Base Map) and passes through the Cotuhé Putumayo Indigenous Reserve (see Figure 2), in the southeast Colombian Amazon, on the borders with Peru and Brazil.

Analyzing a Skysat image from November 30, 2024, we found five dredges (Figure 2). Figures 2A-D show examples of these findings.

Figure 2. Detected gold mining activity in the Cotuhé River. Data: Amazon Conservation/MAAP, FCDS.

Overflight photos – Cotuhé River

The following photos (corresponding to points 4-5 in Figure 2) were taken from a low-altitude overflight conducted by FCDS in September 2024 (AARIMO 2024).

Punto 4

Overflight photo, Point 4. Dredger in operation with Starlink antenna. Data: FCDS
Overflight photo, Point 5. Dredger. Data: FCDS

Policy Implications

The illegal river-based mining analyzed here occurs within two important Colombian protected areas, Río Puré and Amacayacu National Parks. In these areas, no mining operations of any kind are permitted, due to impacts on biodiversity, Indigenous communities in voluntary isolation, and local Indigenous communities that depend on natural resources for their survival, putting their food security at risk.

An important factor that has intensified mining activity in the area has been the significant upward trend in the price of gold. In January 2008, an ounce of gold was quoted at around $812. By July 2024, this value reached $2,514, representing an increase of more than 200% over that period. Furthermore, recent changes in tariff policies have further boosted demand for gold (GoldMarket, 2024). Consequently, in February 2025, gold reached new highs, approaching $3,000 per ounce, substantially driven by central bank purchases (El País, 2025a).

Although Law 1658 of 2013 initiated the ban on the use of mercury in Colombia, it was not fully implemented until 2023. This ban includes the import and export of mercury to and from Colombia. However, despite the ban in Colombia, this element is used in considerable quantities for illegal gold mining in border areas, such as those observed in this report. Thus, Colombia, Brazil, and Peru face a significant challenge in complying with the law, as controls on the sale and use of this element in border areas are very complex due to the fact that these are difficult-to-access areas.

In general, a correlation has been observed between the granting of mining concessions in cross-border areas and the increase in informal mining in the Amazon subregion. For example, in the case of the Río Puré National Park, the presence of mining dredges has increased within protected areas. These dredges enter the Puré River from the Brazilian side, where therea area a large number of formal mining concessions.

A key challenge is to strengthen operational capacities and coordinate control actions among the three border countries (Colombia, Peru, and Brazil) to combat environmental crimes associated with illegal mining. These operations must be effective and not result in actions that harm the local communities and Indigenous peoples in voluntary isolation in the region, as this exacerbates the internal conflict in Colombia.

Notes

1 Ministerio de Minas y Energía, 2023

2 Ebus & Pedroso, 2023

3 Bullion Vault, 2025

Acknowledgments

This report was produced in collaboration with our Colombian partner, the Foundation for Conservation and Sustainable Development (FCDS), and with financial support from the Overbrook Foundation and Gordon and Betty Moore Foundation.

FCDS Logo

MAAP #226: AI to detect Amazon gold mining deforestation – 2024 update

Intro Image. Amazon Mining Watch interactive map.

As gold prices continue to increase, small-scale gold mining activity also continues to be one of the major deforestation drivers across the Amazon

It often targets remote areas, thus impacting carbon-rich primary forests. Moreover, in many cases, we presume that this mining is illegal based on its location within conservation areas (such as protected areas and Indigenous territories) and outside mining concessions.

Given the vastness of the Amazon, however, it has been a challenge to accurately and regularly monitor mining deforestation across all nine countries of the biome, in order to better inform related policies in a timely manner.

In a previous report (MAAP #212) we presented the initial results of the new AI-based dashboard (known as Amazon Mining Watch) designed to address the issue of gold mining and related policy implications. Amazon Mining Watch (AMW) is a partnership between Earth Genome, the Pulitzer Center’s Rainforest Investigations Network, and Amazon Conservation.

This online tool (see Intro Image) analyzes satellite imagery archives to estimate annual mining deforestation footprints across the entire Amazon, from 2018 to 2024 (Note 1). Although the data is not designed for precise area measurements,  it can be used to give timely estimates needed for management and conservation purposes.  

For example, the cumulative data can be used to estimate and visualize the overall Amazon-wide mining deforestation footprint, and the annual data can be used to identify trends and emerging new mining areas. The algorithm is based on 10-meter resolution imagery from the European Space Agency’s Sentinel-2 satellite and produces 480-meter resolution pixelated mining deforestation alerts.

The only tool of this kind to be truly regional (Amazon-wide) in coverage, AMW can also help foster regional cooperation, in particular in transfrontier areas where a lack of interoperability between official monitoring systems might hamper interventions.

The Amazon Mining Watch partnership is currently working to enhance the functionality and conservation impact of the dashboard, AMW will be a one-stop shop platform including real-time visualization of: 1) AI-based detection of mining deforestation across all nine Amazonian countries, with quarterly updates; 2) Hotspots of urgent mining cases, including river-based mining; and 3) the socio-environmental costs of illegal gold mining with the Conservation Strategy Fund (CSF) Mining Impacts Calculator.

Here, we present an update focused on the newly added 2024 data and its context within the cumulative dataset (since 2018).

MAJOR FINDINGS

In  the following sections, we highlight several major findings:

  • Gold mining is actively causing deforestation in all nine countries of the Amazon. This impact is concentrated in three major areas: southeast Brazil, the Guyana Shield, and southern Peru. In addition, mining in Ecuador is escalating.
  • The cumulative mining deforestation footprint in 2024 was over 2 million hectares (nearly 5 million acres) and has increased by over 50% in the past six years.
  • Over half of all Amazon mining deforestation occurred in Brazil, followed by Guyana, Suriname, Venezuela, and Peru.
  • While the cumulative footprint continues to grow, the rate of increase slowed in 2023 and 2024 after peaking in 2022, likely due to increased enforcement in Brazil.
  • Over one-third of the mining deforestation has occurred within protected areas and Indigenous territories, where much of it is likely illegal. We highlight the most impacted areas.
  • These results have important policy implications.
Base Map. Mining deforestation footprints, 2018-2024. Data: AMW, Amazon Conservation/MAAP.

Amazon & National Scale Patterns

The Base Map presents the gold mining footprint across the Amazon, as detected by the AMW algorithm. This data serves as our estimate of gold mining deforestation.

Yellow indicates the accumulated mining deforestation footprint for the years 2018- 2023; that is, all areas that the algorithm classified as a mining site vs other types of terrain, such as forest or agriculture. Red indicates the new mining areas detected in 2024.

Three major Amazon gold mining regions stand out: southeast Brazil (between the Tapajos, Xingu, and Tocantis Rivers), Guyana Shield (Venezuela, Guyana, Suriname, and French Guiana), and southern Peru (Madre de Dios).  In addition, Ecuador has emerged as an important mining deforestation front.


Graph 1. Amazon mining deforestation footprint. Data: AMW

Graph 1 quantifies the spatial data detected by the AMW algorithm

The cumulative mining deforestation footprint in 2024 was 2.02 million hectares (4.99 million acres)

For context, the initial mining deforestation footprint was around 970,000 hectares in 2018, the first year of Amazon Mining Watch data.

Between 2019 and 2024, we estimate that the gold mining deforestation grew by 1.06 million hectares (2.61 million acres).

Thus, over half (52.3%) of the cumulative footprint has occurred in just the past six years.

Note that while the cumulative footprint continues to grow, the rate of increase slowed in 2023 and 2024 after peaking in 2022.


Graph 2 shows that, of the total accumulated mining (2.02 million hectares), over half has occurred in Brazil (55.3%), followed by Guyana (15.4%), Suriname (12.4%), Venezuela (7.3%), and Peru (7.0%).

Graph 2. Gold mining deforestation across the Amazon, by country. Data: AMW, Amazon Conservation/MAAP

Graph 3 digs deeper into the AMW data, revealing additional trends between years. This data highlights the annual changes in detected mining deforestation. Note the trend across the entire Amazon at the top in green for overall context, followed by each country. Note that Brazil (orange line) accounts for much of the annual mining (over 50%).

In 2024, we documented the new gold mining deforestation of 111,603 hectares (275,777 acres). This total represents a decrease of 35% relative to the previous year 2023 and 45% relative to the peak year 2022.

The countries with the highest levels of new gold mining deforestation in 2024 were 1) Brazil (57,240 ha), 2) Guyana (19,372 ha), 3) Suriname (15,323 ha), 4) Venezuela (9,531 ha), and 5) Peru (6,020 ha). However, all five of these countries saw a major decrease in 2024, between 33% (Brazil and Suriname) and 46% (Peru).

Graph 3. Annual changes in new mining deforestation. Data: AMW
Figure 1. Protected areas & Indigenous territories impacted by mining deforestation. Data: AMW, ACA/MAAP.

Protected Areas & Indigenous Territories

We estimate that 36% of the accumulated mining deforestation in 2024 (over 725,000 hectares) occurred within protected areas and Indigenous territories (Figure 1; Note 2), where much of it is likely illegal.

Notably, the vast majority of this overall mining deforestation in protected areas and Indigenous territories has occurred in Brazil (88%).


Figure 2a. Top 10 impacted protected areas & Indigenous territories. Data: AMW, ACA/MAAP.

Figure 2a illustrates the top ten for both protected areas and Indigenous territories, in terms of both accumulated mining deforestation footprint and new mining deforestation in 2024. Figures 2b-d show zooms of the three main mining areas: southeast Brazil (2b), Guyana Shield (2c), and southern Peru (2d).

The top nine most impacted protected areas (in terms of accumulated footprint) are all in Brazil, led by Tapajós Environmental Protection Area. This area has lost over 377,000 hectares, followed by Amanã and Crepori National Forests, Rio Novo National Park, Urupadi, Jamanxim, and Itaituba National Forests, Jamanxim National Park, and Altamira National Forest. The top ten is rounded out by Yapacana National Park in Venezuela.

The three most impacted Indigenous territories are also in Brazil: Kayapó, Mundurucu, and Yanomami. Together, these three territories had a mining footprint of nearly 120,000 hectares. Fourth on the list is Ikabaru in Venezuela, followed by three in southern Peru (San Jose de Karene, Barranco Chico, and Kotsimba) with mining impact of over 17,000 hectares. Rounding out the top ten are Sai Cinza and Trincheira/Bacajá in Brazil, and San Jacinto in Peru.

We also estimate the expansion of over 38,000 hectares of new mining deforestation in protected areas and Indigenous territories in 2024. The protected area with the highest levels of new mining deforestation in 2024 was Tapajós Environmental Protection Area (nearly 19,000 hectares), followed by Amanã and Urupadi National Forests in Brazil, Rio Novo and Jamanxim National Parks in Brazil, Crepori National Forest in Brazil, Campos Amazonicos National Park in Brazil, Yapacan National Park in Venezuela, Guyane Regional Park in French Guiana, and Brownsberg Nature Reserve in Suriname.

Finally, the Indigenous territory with the highest levels of new mining deforestation in 2024 was Kayapó in Brazil (over 2,100 hectares), followed by Ikabaru in Venezuela, Yanomami, Aripuana, and Mundurucu in Brazil, Baramita in Guyana, Kuruáya in Brazil, Isseneru and Kamarang Keng, San Jose de Karene in Peu. It is worth noting that Kayapó, Mundurucu, and Yanomami territories in Brazil all experienced declines in the mining deforestation rate in 2024. For example, Yanomami went from its peak in 2021 to the lowest on record in 2024.

Most impacted areas in eastern Brazilian Amazon

Figure 2b. Most impacted areas in eastern Brazilian Amazon. Data: AMW, Amazon Conservation/MAAP.

Most impacted areas in the Guyana Shield

Figure 2c. Most impacted areas in the Guyana Shield. Data: AMW, Amazon Conservation/MAAP.

Most impacted areas in the southern Peruvian Amazon

Figure 2d. Most impacted areas in the southern Peruvian Amazon. Data: AMW, Amazon Conservation/MAAP.

Conclusion & Policy Implications

Despite a recent downward trend in the rate of gold mining deforestation, the cumulative gold mining deforestation footprint continues to grow across the Amazon.

Our analysis shows that over one-third of this mining occurs within protected areas and Indigenous territories, the vast majority in Brazil. However, since the return of the Lula administration in 2023, Brazil has been ramping up enforcement efforts. This has contributed to the rapid decrease in area lost to mining across the Amazon, given Brazil’s outsized contribution to regional figures. This highlights again the importance of protected areas and Indigenous territories as a crucial policy instrument for the protection of the region’s ecosystems.

Although advances have been made in reducing illegal mining from protected areas in southern Peru, it continues to impact several Indigenous territories (MAAP #208, MAAP #196), particularly those surrounding the government-designated Mining Corridor. In fact, the most affected Indigenous territory in Peru, San Jose de Karene, has already lost over a third of its total area to illegal gold mining.  These territories are part of a regional organization known as FENAMAD, which has been supporting legal actions to help the government make decisions for a rapid response to illicit activities (such as illegal mining) that affect indigenous territories. This process led to five government-led operations between 2022 and 2024, in three communities: Barranco Chico, Kotsimba and San José de Karene (MAAP #208).

In Ecuador, mining deforestation continues to threaten numerous sites, including protected areas and Indigenous territories, along the Andes-Amazon transition zone (MAAP #206, MAAP #221, MAAP #219). An upcoming series of reports will detail these threats.

AMW is an emerging and powerful new tool, but it does have some caveats. One is that any mining activity less than 500 square meters may not be accurately detected. For example, we have been monitoring small-scale mining in several protected areas, such as Madidi National Park in Bolivia and Puinawai National Park in Colombia, that are not yet detected by the algorithm. In these cases, direct real-time monitoring with satellites is still needed. These areas will soon be added to the AMW as mining “Hotspots” (MAAP#197).

This is also the case for river-based mining that does not cause a large footprint on the ground. Imagery with very high resolution has revealed active river barge mining in northern Peru (MAAP #189) and along the Colombia/Brazil border (MAAP#197). These areas will also soon be added to the AMW as mining “Hotspots.”

Gold mining in the Amazon is certain to stay a major issue in the coming years as gold prices continue to skyrocket, reaching over $3,000 an ounce in April 2025, driven by global economic uncertainty. While there are encouraging signs of effective enforcement in Brazil, governments here and across the region will have to compete with this rising financial incentive for mining activities.

Tools such as the Amazon Mining Watch, which will eventually publish quarterly updates of newly detected mining deforestation areas, can help governments, civil society, and local community defenders spot new fronts of gold mining and take action in near real-time. In a feature developed by Conservation Strategy Fund (CSF), it will also evaluate the economic costs of socio-environmental mining damages necessary for communities and managers to declare punitive damages.

The only dashboard of this kind to be fully regional in coverage, the AMW can also help foster regional cooperation, in particular in transfrontier areas where a lack of interoperability between official monitoring systems might hamper interventions that are aimed at combating a phenomenon that is linked to other nature crimes and is mostly controlled by international organized crime. 

In the coming years, the MAAP and AMW teams will continue to publish both quarterly and annual reports of the dynamic mining situation in each country and across the Amazon, in addition to confidential reports directly to governments and community leaders on the most urgent cases.

Notes

1. Note that in this report, we focus on mining activity that causes deforestation. The vast majority is artisanal or small-scale gold mining, but other mining activities have also been detected, such as iron, aluminum, and nickel mines in Brazil and Colombia. Additional critical gold mining areas in rivers that are not yet causing deforestation (such as in northern Peru, southeast Colombia, and northwest Brazil; see MAAP #197), are not included in this report. This information is not yet displayed in Amazon Mining Watch, but future updates will include river-based mining hotspots. 

2. Our data source for protected areas and Indigenous territories is from RAISG (Amazon Network of Georeferenced Socio-Environmental Information), a consortium of civil society organizations in the Amazon countries. This source (accessed in December 2024) contains spatial data for 5,943 protected areas and Indigenous territories, covering 414.9 million hectares across the Amazon.

Acknowledgments

We thank colleagues from partner organizations around the Amazon for helpful comments on the report, including: Earth Genome, Conservación Amazónica (ACCA & ACEAA) & Federación Nativa del Río Madre de Dios y Afluentes (FENAMAD), Fundación EcoCiencia, Fundación para la Conservación y el Desarrollo Sostenible (FCDS), and Instituto Centro de Vida (ICV) & Instituto Socioambiental (ISA).

This report was made possible by the generous support of the Gordon and Betty Moore Foundation.

MAAP #225: Carbon in the Amazon (part 4): Protected Areas & Indigenous Territories

Figure 1. Total aboveground carbon change, Amazon protected areas & Indigenous territories 2013-2022. Data: Planet, ACA/MAAP.

We continue our ongoing series about carbon in the Amazon.

In part 1 (MAAP #215), we introduced a new dataset (Planet’s Forest Carbon Diligence) with wall-to-wall estimates for aboveground carbon at an unprecedented 30-meter resolution between 2013 and 2022. In part 2 (MAAP #217), we highlighted which parts of the Amazon are currently home to the highest (peak) carbon stocks. In part 3 (MAAP #220), we showed key cases of carbon loss (deforestation) and gain across the Amazon.

A key finding from this series is that the Amazon biome is teetering between a carbon source and sink. That is, historically the Amazon has functioned as a critical sink, with its forests accumulating carbon if left undisturbed. However, relative to the 2013 baseline, the Amazon flipped to a source during the high deforestation, drought, and fire seasons of 2015-2017. It then rebounded as a narrow carbon sink in 2022.

Here, in part 4, we focus on the importance of aboveground carbon in protected areas and Indigenous territories, which together cover 49.5% (414.9 million hectares) of the Amazon biome (see Figure 1).

We find that, as of 2022, Amazonian protected areas and Indigenous territories contained 34.1 billion metric tons of aboveground carbon (60% of the Amazon’s total). Importantly, in the ten years between 2013 and 2022, they functioned as a significant carbon sink, gaining 257 million metric tons.

With this data, we can also analyze aboveground carbon for each protected area and Indigenous territory. For example, Figure 1 illustrates aboveground carbon loss vs. gain for each protected area and Indigenous territory during the 10-year period of 2013 – 2022 (see details below).

Below, we further explain and illustrate the key findings.

Amazon-wide & Country-level Results

Amazonian protected areas and Indigenous territories currently cover nearly half (49.5%) of the Amazon biome, but contain 60% of the aboveground carbon. Together they contained 34.1 billion metric tons of aboveground carbon as of 2022, gaining 257 million metric tons since 2013, thus functioning as a carbon sink (Figure 2).1,2 

In contrast, areas outside of protected areas and Indigenous territories (424 million hectares) contained 22.6 billion metric tons of aboveground carbon as of 2022, losing 255 million metric tons since 2013, thus functioning as an overall carbon source.

Thus, the carbon sink function of protected areas and Indigenous territories narrowly offsets the emissions in the rest of the Amazon.

We emphasize that the protected areas and Indigenous territories functioned as a significant carbon sink (p-value = 0.01), while the outside areas were not a significant source (p-value= 0.15).

Regarding results by country, protected areas and Indigenous territories were significant carbon sinks in Colombia, Brazil, Suriname, and French Guiana (Guyana gained carbon but not significantly). In contrast, they were significant carbon sources in Bolivia and Venezuela (Peru and Ecuador lost carbon but not significantly).

Figure 2. Amazon aboveground carbon 2013-2022, within vs. outside protected areas and Indigenous territories. Data: Planet, ACA/MAAP.

Individual Protected Area & Indigenous Territory Results

Figure 1 (see above) illustrates total aboveground carbon loss vs. gain for each protected area and Indigenous territory during the 10-year period of 2013 – 2022. 

Overall, we found 1,103 areas that served as significant carbon sinks (dark green) during this period (238 protected areas and 865 Indigenous territories). These areas are concentrated in the northern and central Amazon. See Annex 1 for a list of specific areas that were significant carbon sinks.

It is important to note that deforestation pressures currently threaten several of these significant carbon sinks, including Chiribiquete National Park and Nukak-Maku Indigenous Reserve in Colombia, Sierra del Divisor National Park in Peru, and Canaima National Park in Venezuela.

In contrast, we found 1,439 areas (156 protected areas and 1,283 Indigenous territories) that served as significant carbon sources. It is important to note that some areas with little documented deforestation, such as Alto Purus National Park, may have carbon loss from natural causes.

Figure 3. Total aboveground carbon stocks in each protected area and Indigenous territory. Data: Planet, ACA/MAAP.

Figure 3 offers the most recent snapshot of total aboveground carbon stocks in each protected area and Indigenous territory.

It presents data for 2022 categorized into three groups of High, Medium, and Low. Note that the highest carbon totals (over 330 million metric tons) are concentrated across the large designated areas of the northern Amazon.

These High and Medium carbon areas may be considered to have the highest overall conservation value purely in terms of total carbon.

See Annex 1 for specific areas with the highest carbon stocks as of 2022.


Figure 4. Aboveground carbon density in each protected area and Indigenous territory (2022). Data: Planet, ACA/MAAP

Finally, Figure 4 also displays the most recent data (2022) in each protected area and Indigenous territory, but standardized for area (aboveground carbon/hectare).

Note that the highest carbon totals (over 50 metric tons per hectare) are more evenly concentrated across the Amazon.

These High and Medium carbon areas may be considered to have the highest carbon conservation value per hectare.


Policy Implications:
Unlocking the Climate Value of Protected Areas and Indigenous Territories in the Amazon

Policy and finance for tropical forests as a climate solution have largely focused on reducing emissions from deforestation and forest degradation (REDD+). These efforts have made important strides in slowing and directing finance to tackle forest loss, particularly in high-deforestation regions. However, this emphasis on avoided emissions overlooks a critical component of the global carbon cycle: the carbon sink function (gaining of carbon over time) of primary tropical forests — which this analysis using Planet’s Forest Carbon Diligence data show is both measurable and significant.

This omission leaves a major flux in the carbon system—ongoing carbon sequestration in old-growth forests—outside the scope of existing market or non-market incentives. Critically, many of these carbon-absorbing forests are already located within established protected areas and indigenous territories. These areas are globally recognized for their importance in biodiversity conservation and for the stewardship provided by Indigenous Peoples and local communities. 

As global attention increasingly turns to engineered carbon removal strategies such as BECCS (Bioenergy with carbon capture and storage) and Direct Air Capture, there is an urgent need to recognize that Amazonian forests are already performing this function—naturally and at scale. Yet the value of Protected Areas and Indigenous territories as a potent carbon sink is neither monetized nor rewarded under current frameworks, unless they can demonstrate that they are under threat from deforestation or degradation in order to access REDD+ finance. An emerging exception is the High Integrity Forests Investment Initiative (HIFOR), which recognizes the value of carbon sequestration in old-growth forests, but does not generate tradable credits for each ton absorbed.5 The Tropical Forests Forever Fund (TFFF) proposed by Brazil for adoption at COP 30, would also reward forest countries at a rate of approximately US$ 4.00/year for every hectare of tropical forest they protect, regardless of whether they are under threat.6

To date, however, protected areas and Indigenous territories, despite their proven climate contribution, often lack the financial support necessary to ensure long-term effectiveness and resilience. As a result, they often face chronic underfunding,7 limiting their long-term effectiveness and resilience. Policy innovation is needed to close this gap and integrate the carbon sink function of mature forests into funding mechanisms for forest protection. Doing so would unlock meaningful incentives for the continued, long-term stewardship of these high-carbon ecosystems and would ensure that one of the planet’s most effective natural climate solutions receives the attention and resources it deserves.

Annex 1

Specific areas that were significant carbon sinks include:

Otishi, Sierra del Divisor, Güeppí-Sekime and Yaguas National Parks, Matsés, and Pucacuro National Reserves, Ashaninka Communal Reserve, and Cordillera Escalera and Alto Nanay- Pintuyacu Chambira Regional Conservation Area, Matses, Pampa Hermosa, and Yavarí – Tapiche Indigenous Reserves, and Kugapakori, Nahua, Nanti Territorial Reserve in Peru;

Amacayacu, Chiribiquete, Cahuinari, Rio Pure, and Yaigoje Apaporis National Parks, Nukak Natural Reserve, Amazonas Forest Reserve, and Putumayo and Nukak-Maku, Yaigoje Rio Apaporis and Vaupes Indigenous Reserve in Colombia;

Campos Amazônicos, Juruena, Mapinguari, Nascentes do Lago Jari, Serra do Divisor, and Montanhas do Tumucumaque National Parks, Amanã, Aripuanã, Crepori, Tapajós, and Tefé National Forests in Brazil, Itaituba and Jatuarana National Forests, and Alto Rio Negro, Baú, Aripuanã, Aripuanã, Apyterewa, Mundurucu, and Vale do Javari Indigenous Territories in Brazil.

Achuar Indigenous Territory and Zona Intangible Tagaeri – Taromenane in Ecuador; Manuripi Heath National Reserve and Takana, Takana II, and Yuracare Indigenous Reserves in Bolivia; Central Suriname and Sipaliwini Nature Reserves in Suriname; Canaima National Park in Venezuela; and Parc Amazonien de Guyane National Park in French Guiana, 

Specific areas with the highest carbon stocks, as of 2022, include:

Alto Purús, Manu, Sierra del Divisor, and Cordillera National Parks in Peru; Chiribiquete National Park in Colombia; Montanhas do Tumucumaque, Pico da Neblina, Jaú, and Juruena National Parks and Yanomami, Menkragnoti, Kayapó, Mundurucu, and Vale do Javari Indigenous Territories in Brazil; Caura and Canaima National Parks in Venezuela; and Parc Amazonien de Guyane National Park in French Guiana;

Methodology

We analyzed Planet Forest Carbon Diligence, a cutting-edge new dataset from the satellite-based company Planet, featuring a 10-year historical time series (2013 – 2022) with wall-to-wall estimates for aboveground carbon density at 30-meter resolution.3,4

One notable caveat of this data is that it does not distinguish aboveground carbon loss from natural vs human-caused drivers, so additional information may be incorporated to understand the context of each area. 

Based on these data, annual aboveground carbon values ​​were estimated in Amazonian protected areas and Indigenous territories to obtain a time series for 2013-2022. In addition, the Mann-Kendall test was used to analyze trends in the generated time series.

Our data source for protected areas and Indigenous territories is from RAISG (Amazon Network of Georeferenced Socio-Environmental Information), a consortium of civil society organizations in the Amazon countries. This source (accessed in December 2024) contains spatial data for 5,943 protected areas and Indigenous territories, covering 414.9 million hectares across the Amazon.

We determined that many of these areas (4,000) did not include creation date metadata, prohibiting any time-series control for that variable. Instead, we used the most current extent of protected areas and Indigenous territories as a proxy for those that existed from 2013 to 2022.

There was substantial overlap between protected areas and Indigenous territories, but we accounted for this to avoid double counting of the overlapping areas.

The aboveground carbon values for protected areas and Indigenous territories were calculated for each country and then summed across the Amazon.

The remaining areas were combined into the category of “Outside protected areas and Indigenous territories” and also calculated for each country and summed across the Amazon.

Our geographic range for the Amazon is a hybrid designed for maximum inclusion: biogeographic boundary (as defined by RAISG) for all countries, except for Bolivia and Peru, where we use the watershed boundary, and Brazil, where we use the Legal Amazon boundary. Our area estimate for this definition of the Amazon biome is 839.2 million hectares.

Notes

1 Breaking down the results by category, protected areas contained nearly 21.1 billion metric tons of aboveground carbon as of 2022, gaining over 204 million metric tons since 2013, while Indigenous territories contained over 16.8 billion metric tons of aboveground carbon as of 2022, gaining over 132 million metric tons since 2013. Note that protected areas and Indigenous territories overlap in many areas.

2 Standardizing for area (that is, calculating the results per hectare), protected areas and Indigenous territories contained 82.2 metric tons of aboveground carbon per hectare as of 2022, gaining a net 0.6 metric tons per hectare since 2013. In contrast, areas outside of protected areas and Indigenous territories contained 53.2 metric tons of aboveground carbon per hectare as of 2022, losing a net 0.6 metric tons per hectare since 2013.

3 Anderson C (2024) Forest Carbon Diligence: Breaking Down the Validation and Intercomparison Report. https://www.planet.com/pulse/forest-carbon-diligence-breaking-down-the-validation-and-intercomparison-report/

4 In terms of the limitations of Planet’s Forest Carbon Diligence data, Duncanson et al (2025) recently wrote a Letter in Science focused on spatial resolution for forest carbon maps. Given the natural constraint of the size of a tree, they discuss the challenge of pixel-level validation below 5 meters for forest carbon monitoring. The authors state that spatial resolution should at minimum exceed the crown diameter of a typical large tree, which is about 20 meters for tropical forests. In this sense, the 30-meter product exceeds this limitation.

Duncanson et al (2025) Spatial resolution for forest carbon maps. Science 387: 370-71.

5 WCS High Integrity Forest Investment Initiative (HIFOR): The Science Basis

6 https://www.bloomberg.com/news/newsletters/2025-04-04/too-big-to-fell-brazil-takes-trees-to-wall-street?cmpid=BBD040425_GR

7 UNEP-WCMC, IUCN, and NGS. (2022). Protected Planet Report 2022. Cambridge, UK: UNEP-WCMC.

Acknowledgments

Through a generous sharing agreement with the satellite company Planet, we have been granted access to this data across the entire Amazon biome for the analysis presented in this series.

We thank colleagues from the following organizations for helpful comments on this report: Planet, Conservación Amazónica – ACCA, Conservación Amazónica -ACEAA, Gaia Amazonas, Ecociencia, and Instituto del Bien Común.

We especially thank colleagues at Conservación Amazónica – ACCA for help with the 10-year data analysis.

This report was made possible by the generous support of the Norwegian Agency for Development Cooperation (NORAD)

Citation

Bodin B, Finer M, Castillo H, Mamani N (2025) Carbon in the Amazon (part 4): Protected Areas & Indigenous Territories. MAAP: 225.

MAAP #224: Illegal Deforestation in the Colombian Amazon – Chiribiquete National Park & Llanos del Yarí – Yaguará II Indigenous Reserve

Graph 1. Deforestation in the Colombian Amazon, 2013-2024. Data: IDEAM, UMD/GFW

The Colombian Environment Ministry recently announced that, after the country experienced its lowest deforestation in over 20 years in 2023, forest clearing rose 35% in 2024 (Graph 1). In addition, the Ministry reported an increase in medium-sized clearing, indicating relatively organized and funded operations (Note 1).

Over the past 10 years, 60% of the national deforestation has occurred in the Colombian Amazon. As Graph 1 indicates, there was a large increase in 2017 following the peace accords with the guerrilla group FARC, and a subsequent decrease in 2022 and 2023 (Note 2). Initial estimates indicate an increase for 2024 (Note 3). Overall, there have been nearly 1,200,000 hectares of deforestation across the Colombian Amazon over the past 10 years.

Much of the clearing in the Colombian Amazon is likely illegal (Law of 2021), occurring in national protected areas and Indigenous reserves.

Base Map: Focal area of the report. Data: ACA/MAAP, FCDS.

Here, we highlight recent 2024-25 deforestation in two key areas in the core of the Colombian Amazon: Chiribiquete National Park (Parque Nacional Natural Serranía de Chiribiquete) and the adjacent Llanos del Yarí – Yaguará II Indigenous Reserve (Resguardo Indígena Llanos del Yarí – Yaguará II). See the Base Map for additional context.

These areas are affected by several deforestation pressures, such as the expansion of road infrastructure, extensive livestock farming, pasture expansion, land grabbing, and illicit crops (coca). These pressures often interact, with access roads facilitating livestock farming and pasture expansion, which then facilitates land grabbing.

These drivers have led to the deforestation of over 7,100 hectares in Chiribiquete National Park since its most recent expansion in 2018 (see Annex 1).

Most recently, we estimate the deforestation of 525 hectares in Chiribiquete National Park (concentrated in the northern sector) during 2024-25, plus an additional 856 hectares in Llanos del Yarí – Yaguará II Indigenous Reserve. Note that most of the deforestation follows access roads.

Below, we illustrate the key cases of recent deforestation in both areas, highlighting the role of access roads as facilitators of illegal clearing. These case studies feature satellite images and overflight photos.

Any deforestation in these areas is noteworthy not only due to its impacts on primary forests, biodiversity, and Indigenous groups, but also on carbon reserves. In an upcoming report, we reveal that Chiribiquete National Park is one of the Amazon’s most important and significant carbon sinks.

This report was conducted in collaboration with our Colombian partner Foundation for Conservation and Sustainable Development (Fundación para la Conservación y el Desarrollo Sostenible – FCDS), and with financial support from the Overbrook Foundation.

Illegal Deforestation Cases

Zoom 1. Chiribiquete National Park. Data: ACA/MAAP, FCDS.

Chiribiquete National Park: Sector el Camuya

Zoom 1 shows the deforestation of 198 hectares during 2024 and early 2025 (indicated by red circles), along the Tunia-Ajaju road in the northwest sector of Chiribiquete National Park.

This road extends 45.3 kilometers into the park.


Photo 1A. Data: FCDS.

In January 2025, FCDS conducted a low-altitude overflight over this sector (see Photos 1A-C).

These photos bring an added level of spatial resolution and perspective, providing greater insight into the cause of the recent deforestation.

Photo 1A highlights deforestation associated with the opening of access roads in the park.


Photo 1B. Data: FCDS.

Photos 1B-C illustrate more clearly the fresh deforestation for expansion of the agricultural frontier.


Photo 1C. Data: FCDS.


Zoom 2. Chiribiquete National Park. Data: ACA/MAAP, FCDS.

Chiribiquete National Park: Sector El Palmar

Zoom 2 shows the deforestation of 179 hectares during 2024 and early 2025 (indicated by red circles), along the Cachicamo-Tunia road in the northern sector of Chiribiquete National Park.

This road extends 21 kilometers inside the park.


Zoom 3. Chiribiquete National Park. Data: ACA/MAAP, FCDS.

Chiribiquete National Park: Sector Norte

Zoom 3 shows the deforestation of 148 hectares during 2024 and early 2025 (indicated by red circles) along or near new access roads in the northeast sector of Chiribiquete National Park.

We estimate the construction of 15.2 kilometers inside the park during this period (also indicated by red circles).


Zoom 4. Yarí – Yaguará II Indigenous Reserve. Data: ACA/MAAP, FCDS.

Yarí – Yaguará II Indigenous Reserve 

Zoom 4 shows the major deforestation of 1,070 hectares during 2024 and early 2025 along or near a new illegal road in the northern part of Yarí – Yaguará II Indigenous Reserve.

This road extends 22 kilometers inside the reserve.


Photo 4D. Data: FCDS.

In January 2025, FCDS conducted a low-altitude overflight over this area, confirming and documenting the new patches of deforestation (see Photos 4D-E).

As noted above, these photos bring an added level of spatial resolution and perspective, providing greater insight into the cause of the recent deforestation.

Both Photos 4D-E indicate the expansion of livestock agricultural activities.


Photo 4E. Data: FCDS.


Policy Implications

The recent deforestation in protected areas and Indigenous territories described above highlights the shortcomings of several current policies of the State of Colombia, which have failed to stem the expansion of cattle ranching and illicit crops as a first step towards land grabbing and permanent deforestation. Several steps could be taken to overcome that failure:

  • Improved coordination between public entities concerned with law enforcement against drivers of deforestation, shortening investigation processes and leading to more effective and comprehensive responses.
  • The inclusion of targets for the reduction of deforestation and the mitigation of impacts on natural forests in agreements for the cessation of hostilities and the de-escalation of the conflict between the national government and armed groups.
  • Monitoring and regulation of public investments for the expansion of livestock farming by local and national governments, to reduce public incentives for deforestation.

Annex 1.

Annex 1. Data: FCDS

Notes

1 Griffin, O (2025) Colombia deforestation rose 35% in 2024, minister says

https://www.reuters.com/business/environment/colombia-deforestation-rose-35-2024-minister-says-2025-02-20/

2 Based on data from Colombia’s Institute of Hydrology, Meteorology and Environmental Studies (Instituto de Hidrología, Meteorología y Estudios Ambientales – IDEAM), a government agency of the Ministry of Environment and Sustainable Development.

3 Based on data from the University of Maryland/Global Forest Watch.

Acknowledgments

This report was conducted in collaboration with our Colombian partner Foundation for Conservation and Sustainable Development (Fundación para la Conservación y el Desarrollo Sostenible – FCDS), and with financial support from the Overbrook Foundation.

MAAP #220: Carbon across the Amazon (part 3): Key Cases of Carbon Loss & Gain

Graph 1. The Amazon biome functions as a narrow carbon sink from 2013 to 2022. Data: Planet, ACA/MAAP.

In part 1 of this series (MAAP #215), we introduced a critical new dataset (Planet’s Forest Carbon Diligence) with wall-to-wall estimates for aboveground carbon at an unprecedented 30-meter resolution between 2013 and 2022. This data uniquely merges machine learning, satellite imagery, airborne lasers, and a global biomass dataset from GEDI, a NASA mission.

In part 2 (MAAP #217), we highlighted which parts of the Amazon are currently home to the highest (peak) aboveground carbon levels and the importance of protecting these high-integrity forests (see Annex 1).

Here, in part 3, we focus on aboveground carbon loss and gain across the Amazon over the 10 years for which we have data (2013-22; see Base Map below).

The Amazon loses carbon to the atmosphere due to deforestation, logging, human-caused fires, and natural disturbances, while it gains carbon from forest regeneration and old-growth forests continuing to sequester atmospheric carbon.4

Overall, we find that the Amazon still narrowly functions as a carbon sink (meaning the carbon gain is greater than the loss) during this period, gaining 64.7 million metric tons of aboveground carbon between 2013 and 2022 (see Graph 1).

This finding underscores the importance of both primary and secondary forests in countering widespread deforestation. Moreover, it highlights the critical potential of primary forests to continue accumulating carbon if left undisturbed.

This gain, however, is quite small relative to the total 56.8 billion metric tons of aboveground carbon contained in the Amazon biome (that is, a gain of just +0.1%), reinforcing concerns that the Amazon could flip to a carbon source in the coming years (with carbon loss becoming greater than its gain) due to increasing deforestation, degradation, and fires.1  See Annex 2 for more details, including how the Amazon became a carbon sink following the 2015 drought, but since rebounded.

The countries with the largest carbon gain are 1) Brazil, 2) Colombia, 3) Suriname, 4) Guyana, and 5) French Guiana. In contrast, the countries with the greatest carbon loss are 1) Bolivia, 2) Venezuela, 3) Peru, and 4) Ecuador.

Zooming in to the site level yields additional insights. For example, we can now estimate the carbon loss from major deforestation events across the Amazon from 2013 to 2022. On the flip side, we can also calculate the carbon gain from both secondary and primary forests.

Areas with carbon gain in intact areas indicate excellent candidates for the High Integrity Forest (HIFOR) initiative, a new financing instrument uniquely focused on maintaining intact tropical forests.2 Importantly, a HIFOR unit represents a hectare of high-integrity tropical forest within a high-integrity landscape that has been “well-conserved” for over a decade.Intact areas with carbon gain between 2013-22 may indicate decadally “well-conserved” areas that can be overlapped with areas of high ecological integrity.

Below, we illustrate these findings with a series of novel maps zooming in on emblematic cases of large carbon loss and gain across the Amazon from 2013 – 2022. These cases include forest loss driven by agriculture, gold mining, and roads, as well as forest gain in remote primary forests.

Base Map – Amazon Carbon Loss & Gain (2013-2022)

The Base Map shows wall-to-wall estimates of aboveground carbon loss and gain across the Amazon between 2013 and 2022.

Carbon loss is indicated by yellow to red, indicating low to high carbon loss. Carbon gain is indicated by light to dark green, indicating low to high carbon gains.

Below, we present a series of notable cases of high carbon loss and gain indicated in Insets A-I.

Base Map. Areas of major carbon loss and gain across the Amazon between 2013 and 2022. Source: Amazon Conservation/MAAP, Planet.

Emblematic Cases of Carbon Loss & Gain

Figure 1 highlights emblematic cases of carbon loss (Insets A-F in red) and carbon gain (Insets G-I in green). Below we highlight a series of emblematic cases.

Figure 1. Emblematic cases of carbon loss and gain across the Amazon. Source: Amazon Conservation/MAAP, Planet.

Carbon Loss

We can now estimate the carbon loss from major deforestation events across the Amazon during the past ten years, directly from a single dataset. These cases include forest loss from agriculture, gold mining, and roads. Note that the presented values represent just the carbon loss featured in the selected area.

A. Colombia – Arc of Deforestation

Figure 1A. Carbon loss in the Colombian Amazon’s arc of deforestation. Source: Amazon Conservation/MAAP, Planet.

Figure 1A shows the extensive carbon emissions (39.5 million metric tons) associated with the major deforestation within and surrounding protected areas and Indigenous territories in the Colombian Amazon‘s arc of deforestation.

The carbon loss within the protected areas and Indigenous territories is likely from illegal deforestation.

See MAAP #211 for more details.


B. Peru – Mennonite Colonies

Figure 1B. Carbon loss by new Mennonite colonies in the Peruvian Amazon. Source: Amazon Conservation/MAAP, Planet.

Figure 1B shows the carbon emissions of 224,300 metric tons associated with the recent deforestation carried out by new Mennonite colonies arriving in the central Peruvian Amazon starting in 2017.

See MAAP #188 for more details, including information regarding the legality of  the deforestation causing the carbon loss.


C. Peru – Gold Mining

Figure 1C. Carbon loss associated with gold mining deforestation in  southern Peruvian Amazon. Source: ACA/MAAP, Planet.

Figure 1C shows the extensive carbon emissions (11.3 million metric tons) associated with gold mining deforestation in the southern Peruvian Amazon.

Most of the carbon loss within the protected areas (and their buffer zones) and Indigenous territories is likely from illegal deforestation.

See MAAP #208 for more information, including details regarding the legality of the deforestation causing the carbon loss.


D. Brazil – Road BR-364

Figure 1D. Carbon loss along BR-364 in the southwest Brazilian Amazon. Source: ACA/MAAP, Planet.

Figure 1D shows the carbon emissions along road BR-364 that crosses the state of Acre in the southwest Brazilian Amazon.

This road was opened in the 1960s and paved in the 1980s.


E. Brazil – Road BR-319

Figure 1E. Carbon loss along paved roads. Source: ACA/MAAP, Planet.

Figure 1E shows a controversial road paving project that would effectively link the arc of deforestation to the south with more intact forests to the north in Amazonas and Roraima states.

Note that the current carbon loss is concentrated along the paved roads.

The paving of road BR-319 has recently caused headlines as President Luiz Inácio Lula da Silva recently authorized the paving of 20 km of the road and plans to bid for an additional 32 km (thus, paving of 52 km in total).

Modeling studies predict extensive new deforestation from this road construction, and thus additional associated carbon loss.


F. Brazil – Road BR-163

Figure 1F. Carbon loss along BR-163 in the eastern Brazilian Amazon. Source: ACA/MAAP, Planet.

Figure 1F shows the extensive carbon emissions (71.4 million metric tons) along a recently paved stretch of road BR-163 which crosses the state of Pará in the eastern Brazilian Amazon.

Importantly, this stretch of road has been presented as a case study of what may happen along road BR-319 if it is paved.


Carbon Gain

We can also calculate the carbon gain from both secondary and primary forests. These cases include forest gain from remote primary forests that may be good candidates for the HIFOR initiative.

Figure 1G. Carbon gains in the southeast Colombian Amazon. Source: ACA/MAAP, Planet.

G. Southeast Colombia

Figure 1G shows the carbon gain of over 52.5 million metric tons in the remote southeast Colombian Amazon.

This area is anchored by three national parks and several large indigenous territories.


Figure 1H. Carbon gains along the border of eastern Ecuador and northern Peru. Source: ACA/MAAP, Planet.

H. Ecuador – Peru border

Figure 1H shows the carbon gain of nearly 40 million metric tons along the border in eastern Ecuador and northern Peru.

Note this area is anchored by numerous protected areas, including Yasuni National Park in Ecuador and Pucacuro National Reserve in Peru, and Indigenous territories.


Figure 1I. Carbon gains in the tri-border region of the northeast Amazon. Source: ACA/MAAP, Planet.

I. Northeast Amazon

Figure 1I shows the carbon gain of 164.7 million metric tons in the tri-border region of the northeast Amazon (northern Brazil, French Guiana, and Suriname).

For example, note the carbon gains in Montanhas do Tumucumaque National Park and Tumucumaque Indigenous territory in northeast Brazil.

Also note that this was an Amazonian “peak carbon area,” as described in MAAP #217.


Annex 1

Annex 1. Peak carbon areas in relation to the carbon loss and gain data. Source: Amazon Conservation/MAAP, Planet.

In part 2 of this series (MAAP #217), we highlighted which parts of the Amazon are currently home to the highest (peak) aboveground carbon levels.

Annex 1 shows these peak carbon areas in relation to the carbon loss and gain data presented above.

Note that both peak carbon areas (southeast and northeast Amazon) are largely characterized by carbon gain.


Annex 2

Annex 2. Amazon biome functions as a narrow carbon sink from 2013 to 2022, but became a source in between. Data: Planet, ACA/MAAP.

Annex 2 shows all ten years of aboveground carbon data grouped by two-year intervals (thus, it is an extension of Graph 1 above, adding data for the intermediate years).

In this context, black indicates our baseline of 2013-14, red indicates a decrease from the baseline (carbon source), and green indicates an increase from the baseline (carbon sink).

Importantly, there was a decrease in aboveground carbon from 2015-18, which likely reflects the severe droughts of 2015 and 2016 and subsequent severe fire seasons of 2016 and 2017. Aboveground carbon rebounded from 2019-22.

This trend supports the hypothesis that the Amazon biome is teetering on being an aboveground carbon source vs sink.

It also raises the possibility that the Amazon may return to being a carbon source following the intense drought and fires of 2024.

.

.

Notes

1 In part 1 of this series (MAAP #215), we found the Amazon “is still functioning as a critical carbon sink”. As pointed out in a companion blog by Planet, however, the net carbon sink of +64 million metric tons is quite small relative to the total estimate of 56.8 billion metric tons of aboveground carbon across the Amazon. That is a net positive change of just +0.1%. As the blog notes, that’s a “very small buffer” and there’s “reason to worry that the biome could flip from sink to source with ongoing deforestation.”

2 High Integrity Forest (HIFOR) units are a new, non-offset asset that recognizes and rewards the essential climate services and biodiversity conservation that intact tropical forests provide, including ongoing net removal of CO2 from the atmosphere. HIFOR rewards the climate services that intact tropical forests provide, including ongoing net carbon removal from the atmosphere, and complements existing instruments to reduce emissions from deforestation and degradation (REDD+) by focusing on tropical forests that are largely undegraded. A HIFOR unit represents a hectare of well-conserved, high-integrity tropical forest where ‘well-conserved’ means that high ecological integrity is maintained over a decade of monitoring as part of equitable, effective management of a site and ‘high ecological integrity’ means a score of >9.6 on the Forest Landscape Integrity Index. For more information see https://www.wcs.org/our-work/climate-change/forests-and-climate-change/hifor

3 Two additional important references regarding HIFOR methodology and application:

High Integrity Forest Investment Initiative, Methodology for HIFOR units, April 2024. Downloaded from https://www.wcs.org/our-work/climate-change/forests-and-climate-change/hifor

Forest Landscape Integrity Index metric used by HIFOR: www.forestintegrity.com

4 In Planet’s Forest Carbon Diligence product, carbon loss and gain are detected via changes in canopy cover and canopy height during the given periods (in this case, 2013 vs 2022).

Acknowledgments

Through a generous sharing agreement with the satellite company Planet, we have been granted access to this data across the entire Amazon biome for the analysis presented in this series.

We also thank D. Zarin (WCS) for helpful comments regarding the implications of our findings for the HIFOR initiative.

This report was made possible by the generous support of the Norwegian Agency for Development Cooperation (NORAD)

Citation

Finer M, Mamani N, Anderson C, Rosenthal A (2024) Carbon across the Amazon (part 3): Key Cases of Carbon Loss & Gain. MAAP: 220.

MAAP #217: Carbon across the Amazon (part 2): Peak Carbon Areas

Figure 1. Example of peak carbon areas in southern Peru and adjacent western Brazil. Data: Planet.

In part 1 of this series (MAAP #215), we introduced a critical new resource (Planet Forest Carbon Diligence) that provides wall-to-wall estimates for aboveground carbon density at an unprecedented 30-meter resolution. This data uniquely merges machine learning, satellite imagery, airborne lasers, and a global biomass dataset from GEDI, a NASA mission.4

In that report, we showed that the Amazon contains 56.8 billion metric tons of aboveground carbon (as of 2022), and described key patterns across all nine countries of the Amazon biome over the past decade.

Here, in part 2, we focus on the peak carbon areas of the Amazon that are home to the highest aboveground carbon levels.

These peak carbon areas correspond to the upper one-third of aboveground carbon density levels (>140 metric tons per hectare).1

They likely have experienced minimal degradation (such as selective logging, fire, and edge/fragmentation effects)2 and are thus a good proxy for high-integrity forests.

Figure 1 shows an important example of peak carbon areas in southern Peru and adjacent western Brazil.

The peak carbon areas are often found in the remote primary forests of protected areas and Indigenous territories, but some are located in forestry concessions (specifically, logging concessions) or undesignated lands (also referred to as undesignated public forests).

Our goal in this report is to leverage unprecedented aboveground carbon data to reinforce the importance of these designated areas and draw attention to the remaining undesignated lands.

For example, peak carbon areas would be excellent candidates for the High Integrity Forest (HIFOR) initiative, a new financing instrument that uniquely focuses on maintaining intact tropical forests.3 HIFOR rewards the climate services that intact tropical forests provide, including ongoing net carbon removal from the atmosphere, and complements existing instruments to reduce emissions from deforestation and degradation (REDD+) by focusing on tropical forests that are largely undegraded.

Below, we detail the major findings and then zoom in on the peak carbon areas in the northeast and southwest Amazon.

Peak Carbon Areas in the Amazon   

The Base Map below illustrates our major findings.

The peak carbon areas (>140 metric tons per hectare; indicated in pink) are concentrated in the southwest and northeast Amazon, covering 27.8 million hectares (11 million ha in the southwest and 16.8 million ha in the northeast).
k

Base Map. Planet Forest Carbon Diligence across the Amazon biome for the year 2022. Data: Planet.

In the southwest Amazon, peak carbon levels are found in southern & central Peru, and adjacent western Brazil.

In the northeast Amazon, peak carbon levels are found in northeast Brazil, much of French Guiana, and parts of Suriname.

By country, Brazil and Peru have the largest area of peak carbon (10.9 million and 10.1 million hectares respectively), followed by French Guiana (4.7 million ha), and Suriname (2.1 million ha).

Protected areas and Indigenous territories cover much (61%) of the peak carbon area (16.9 million hectares).

The remaining 39% remains unprotected, and arguably threatened, in undesignated lands (9.4 million hectares) and forestry concessions (1.5 million ha), respectively.

In addition, high carbon areas (>70 metric tons per hectare; indicated by the greenish-yellow coloration in the Base Map) are found in all nine countries of the Amazon biome, notably Colombia, Ecuador, Bolivia, Venezuela, and Guyana.

Southwest Amazon

­Southern Peru

Figure 2a. Peak carbon area in the southern Peruvian Amazon. Data: Planet, SERNANP, RAISG.

Figure 2a zooms in on the peak carbon area covering 7.9 million hectares in southern Peru (regions of Madre de Dios, Cusco, and Ucayali) and adjacent southwest Brazil (Acre).

Several protected areas (such as Manu and Alto Purús National Parks, and Machiguenga Communal Reserve) anchor this area.

It is also home to numerous Indigenous territories (such as Mashco Piro, Madre de Dios, and Kugapakori, Nahua, Nanti & Others Indigenous Reserves).


Figure 2b highlights the major land designations within the peak carbon area of southern Peru.

Figure 2b. Peak carbon areas (outlined in pink), categorized by land designation in southern Peru and adjacent western Brazil. Data: Planet, NICFI, SERNANP, SERFOR, RAISG.

Protected areas and Indigenous territories cover 77% of this area (green and brown, respectively).

The remaining 23% could be considered threatened, as they are located in forestry concessions or undesignated lands (orange and red, respectively). Thus, these areas are ideal candidates for increased protection to maintain their peak carbon levels.


Central Peru

Figure 3a. Peak carbon area in the central Peruvian Amazon. Data: Planet, SERNANP, RAISG.

Figure 3a zooms in on the peak carbon area in the central Peruvian Amazon, which covers 3.1 million hectares in the regions of Ucayali, Loreto, Huánuco, Pasco, and San Martin.

Several protected areas (including Sierra del Divisor, Cordillera Azul, Rio Abiseo, and Yanachaga–Chemillén National Parks, and El Sira Communal Reserve) anchor this area.

It is also home to numerous Indigenous territories (such as Kakataibo, Isconahua, and Yavarí Tapiche Indigenous Reserves).


Figure 3b. Peak carbon areas (outlined in pink), categorized by land designation in central Peru. Data: Planet, NICFI, SERNANP, SERFOR, RAISG.

Figure 3b highlights the major land designations within the peak carbon area of central Peru.

Protected areas and Indigenous territories cover 69% of this area (green and brown, respectively).

The remaining 31% could be considered threatened, as they are located in forestry concessions or undesignated lands (orange and red, respectively), and are ideal candidates for increased protection.


Northeast Amazon

Figure 4a. Peak carbon area in the tri-border region of the northeast Amazon. Data: Planet, RAISG.

Figure 4a zooms in on the peak carbon area in the tri-border region of the northeast Amazon, which covers 16.8 million hectares in northern Brazil, French Guiana, and Suriname.

Several protected areas (including Montanhas do Tumucumaque National Park in northeast Brazil, Amazonien de Guyane National Park in French Guiana, and Central Suriname Nature Reserve) anchor this area.

It is also home to numerous Indigenous territories (such as Tumucumaque, Rio Paru de Este, and Wayãpi in northeast Brazil).


Figure 4b. Peak carbon areas (outlined in pink), categorized by land designation in northeast Amazon. Data: Planet, NICFI, RAISG.

Figure 4b highlights the major land designations within the peak carbon area of the northeast Amazon.

Protected areas and Indigenous territories cover just over half (51%) of this area (green and brown, respectively).

The remaining 49% could be considered threatened, as they are located in undesignated lands, and are ideal candidates for increased protection.


Notes

1 We selected this value (upper 33%) to capture the highest aboveground carbon areas and include a range of high carbon areas. Additional analyses could target different values, such as the highest 10% or 20% of aboveground carbon.

2  A recent paper documented a strong relationship between selective logging and aboveground carbon loss (Csillik et al. 2024, PNAS). The link between forest edges and carbon is presented in Silva Junior et al, Science Advances.

3 High Integrity Forest (HIFOR) units are a new tradable asset that recognizes and rewards the essential climate services and biodiversity conservation that intact tropical forests provide, including ongoing net removal of CO2 from the atmosphere. For more information see https://www.wcs.org/our-work/climate-change/forests-and-climate-change/hifor

4 For more information, see the “What is Forest Carbon Diligence?” section in this recent blog from Planet.

Citation

Finer M, Mamani N, Anderson C, Rosenthal A (2024) Carbon across the Amazon (part 2): Peak Carbon Areas. MAAP #217.

Acknowledgments

This report was made possible by the generous support of the Norwegian Agency for Development Cooperation (NORAD)

MAAP #215: Unprecedented Look at Carbon across the Amazon (part 1)

Figure 1. Example of Planet Forest Carbon Diligence, focused on southern Peru and adjacent western Brazil.

The Amazon biome has long been one of the world’s largest carbon sinks, helping stabilize the global climate.

Precisely estimating this carbon, however, has been a challenge. Fortunately, new satellite-based technologies are providing major advances, most notably NASA’s GEDI mission (see MAAP #213) and, most recently, Planet Forest Carbon Diligence.1

Here, we focus on the latter, analyzing Planet’s cutting-edge new dataset, featuring a 10-year historical time series (2013 – 2022) with wall-to-wall estimates for aboveground carbon density at 30-meter resolution.

As a result, we can produce high-resolution aboveground carbon maps and estimates for anywhere and everywhere across the vast Amazon (see Figure 1).

Through a generous sharing agreement with Planet, we have been granted access to this data across the entire Amazon biome for the analysis presented in the following three-part series:

  1. Estimate and illustrate total aboveground forest carbon across the Amazon biome in unprecedented detail (see results of this first report, below).
    j
  2. Highlight which parts of the Amazon are home to the highest aboveground carbon levels, including protected areas and Indigenous territories (see second report, MAAP #217).
    l
  3. Present emblematic deforestation cases that have resulted in the highest aboveground carbon emissions across the Amazon (see third report, MAAP #220).

Major Results

Carbon across the Amazon

Based on our analysis of Planet Forest Carbon Diligence, we estimate that the Amazon contained 56.8 billion metric tons of aboveground carbon, as of 2022 (see Base Map). Applying a standard root-to-shoot ratio conversion (26%), this estimate increases to 71.5 billion metric tons of above and belowground carbon. This total is equivalent to nearly two years of global carbon dioxide emissions at the peak 2022 level (37.15 billion metric tons).5

The peak carbon levels are largely concentrated in the southwest Amazon (southern Peru and adjacent western Brazil) and northeast Amazon (northeast Brazil, French Guiana, and Suriname).

Base Map. Planet Forest Carbon Diligence across the Amazon biome.

Total Carbon by Country

As shown in Graph 1, countries with the most aboveground carbon are 1) Brazil (57%; 32.1 billion metric tons), 2) Peru (15%; 8.3 billion metric tons), 3) Colombia (7%; 4 billion metric tons), 4) Venezuela (6%; 3.3 billion metric tons), and 5) Bolivia (6%; 3.2 billion metric tons). These countries are followed by Guyana (3%; 2 billion metric tons), Suriname (3%; 1.6 billion metric tons), Ecuador (2%; 1.2 billion metric tons), and French Guiana (2%; 1.1 billion metric tons).

Overall, we documented the total gain of 64.7 million metric tons of aboveground carbon across the Amazon during the ten years between 2013 and 2022.2 In other words, the Amazon is still functioning as a critical carbon sink.

The countries with the most aboveground carbon gain over the past ten years are 1) Brazil, 2) Colombia, 3) Suriname, 4) Guyana, and 5) French Guiana. Note that we show Brazil as a carbon sink (gain of 102.8 million metric tons), despite other recent studies showing it as a carbon source.3 Also note the important gains in aboveground carbon across several key High Forest cover, Low Deforestation (HFLD) countries, namely Colombia, Suriname, Guyana, and French Guiana.4

In contrast, the countries with the most aboveground carbon loss over the past ten years are 1) Bolivia, 2) Venezuela, 3) Peru, and 4) Ecuador.

Graph 1. Planet Forest Carbon Diligence data across the Amazon biome, comparing 2013-14 with 2021-22. Note that a “+” symbol indicates that the country gained aboveground carbon, while a “-“ symbol indicates that the country lost aboveground carbon.

Carbon Density by Country

Standardizing for area, Graph 2 shows that countries with the highest aboveground carbon density (that is, aboveground carbon per hectare as of 2021-22) are located in the northeast Amazon: French Guiana (134 metric tons/hectare), Suriname (122 metric tons/hectare), and Guyana (85 metric tons/hectare). Ecuador is also high (94 metric tons/hectare).

Note that countries in the northeast Amazon (French Guiana, Suriname, and Guyana) have lower total aboveground carbon due to their smaller size (Graph 1), but high aboveground carbon density per hectare (Graph 2). This also applies to Ecuador.

Graph 2. Planet Forest Carbon Diligence data for aboveground carbon density by country across the Amazon, comparing 2013-14 with 2021-22. Note that a “+” symbol indicates that the country gained aboveground carbon, while a “-“ symbol indicates that the country lost aboveground carbon.

Notes & Citations

1 Anderson C (2024) Forest Carbon Diligence: Breaking Down The Validation And Intercomparison Report. https://www.planet.com/pulse/forest-carbon-diligence-breaking-down-the-validation-and-intercomparison-report/

2 In terms of uncertainty, the data contains pixel-level estimates, but not yet at national levels. To minimize annual uncertainty at the country level, we averaged 2013 and 2014 for the baseline and 2021 and 2022 for the current state.

3 Recently, in MAAP #144, we showed Brazil as a carbon source, based on data from 2001 to 2020. In contrast, Planet Forest Carbon Diligence is based on data from 2013 to 2022. Thus, one interpretation of the difference is that most carbon loss occurred in the first decade of the 2000s, which is consistent with historical deforestation data showing peaks in the early 2000s. It also highlights the likely importance of the interplay between forest loss/degradation (carbon loss) and forest regeneration (carbon gain) in terms of whether a country is a carbon source or sink during a given timeframe.

4 HFDL, or “High Forest cover, Low Deforestation” describes countries with both a) high forest cover (>50%) and low deforestation rates (<0.22% per year). For more information on HFDL, see https://www.conservation.org/blog/what-on-earth-is-hfld-hint-its-about-forests

5 Annual carbon dioxide (CO₂) emissions worldwide from 1940 to 2023

Citation

Finer M, Mamani N, Anderson C, Rosenthal A (2024) Unprecedented Look at Carbon across the Amazon. MAAP  #215.

Acknowledgments

This report was made possible by the generous support of the Norwegian Agency for Development Cooperation (NORAD)


MAAP #213: Estimating Carbon in Amazon Protected Areas & Indigenous Territories

Intro Image. Screenshot of OBI-WAN forest carbon reporting app.

In a recent report (MAAP #199), we presented the updated version of NASA’s GEDI data,1 which uses lasers aboard the International Space Station to provide cutting-edge estimates of aboveground carbon globally, including our focal area, the Amazon.

These lasers, however, have not yet achieved full coverage, leaving considerable gaps in the data and resulting maps.

Here, we feature two new tools that allow us to fill in these gaps and provide detailed wall-to-wall estimates of aboveground biomass for specific areas, which can then be converted to aboveground carbon estimates.

The first is the OBI-WAN forest carbon reporting app (see Intro Image), which uses statistical inference to produce mean, total, and uncertainty estimates for biomass baselines at any given scale (from local to worldwide).2

The second is a fused product from GEDI and TanDEM-X missions.3 The combination of lidar (GEDI) and radar (TanDEM-X) has started to produce unmatched maps that combine the ability of lidar to retrieve forest structure and the ability of radar to offer wall-to-wall coverage at multiple resolutions (see Figures 1-5 below for examples at 25m resolution).

Employing these two tools, we focus on estimating aboveground carbon for select examples of two critical land designations in the Amazon: protected areas and indigenous territories. Both are critical to the long-term conservation of the core Amazon (MAAP #183). We hope that providing precise carbon data will provide additional incentives for their long-term conservation.

We select 5 focal areas (3 National Parks and 2 Indigenous Territories; see list below) across the Amazon to demonstrate the power of these datasets. Together, these five areas are currently home to over 1.4 billion metric tons of aboveground carbon.

  • Protected Areas (National Parks)
    Chirbiquete National Park (Colombian Amazon)
    Manu National Park (Peruvian Amazon)
    Madidi National Park (Bolivian Amazon)
    k
  • Indigenous Territories
    Kayapó Indigenous Territory (Brazilian Amazon)
    Barranco Chico Indigenous Territory (Peruvian Amazon)

Focal Areas

As noted above, the aboveground carbon estimates below are based on the aboveground biomass estimates from the OBI-WAN forest carbon reporting app and GEDI-TanDEM-X data. Figures 1 – 5 are based on GEDI-TanDEM-X, at 25 meter resolution.

National Parks

Chirbiquete National Park (Colombian Amazon)

Chirbiquete National Park covers over 4.2 million hectares in the heart of the Colombian Amazon (Guaviare and Caqueta departments). Both datasets converge in the estimate of around 600 metric tons of aboveground biomass, equating to over 300 million metric tons of aboveground carbon across the park (80.5 tons of carbon per hectare). Figure 1 shows the detailed spatial distribution of this biomass across Chirbiquete National Park. Note that the GEDI-TanDEM-X data misses the western tip of the park.

Figure 1. Aboveground biomass across Chiribiquete National Park (Colombian Amazon). Data: GEDI-TanDEM-X


Manu National Park (Peruvian Amazon)

Figure 2. Aboveground biomass across Manu National Park (Peruvian Amazon). Data: GEDI-TanDEM-X

Manu National Park covers over 1.7 million hectares in the southern Peruvian Amazon (Madre de Dios and Cusco regions).

Both datasets converge in the estimate of over 450 metric tons of aboveground biomass, equating to over 215 million metric tons of aboveground carbon across the territory (126.8 tons of carbon per hectare).

Figure 2 shows the detailed spatial distribution of this biomass across Manu National Park.


Madidi National Park (Bolivian Amazon)

Figure 3. Aboveground biomass across Madidi National Park (Bolivian Amazon). Data: GEDI-TanDEM-X

Madidi National Park and Integrated Management Area covers over 1.8 million hectares in the western Bolivian Amazon (La Paz department).

Both datasets converge in the estimate of over 350 metric tons of aboveground biomass, equating to over 160 million metric tons of aboveground carbon across the park (85.3 tons of carbon per hectare).

Figure 3 shows the detailed spatial distribution of this biomass across Madidi National Park. Note that the GEDI-TanDEM-X data misses the southern tip of the park.


Indigenous Territories

Kayapó Indigenous Territory (Brazilian Amazon)

Kayapó Indigenous Territory covers over 3.2 million hectares in the eastern Brazilian Amazon (Pará state). Both datasets converge in the estimate of over 413,000 metric tons of aboveground biomass, equating to over 198 million metric tons of aboveground carbon across the territory. Figure 4 shows the detailed spatial distribution of this biomass across Kayapó and four neighboring Indigenous Territories. Totaling across these five territories (10.4 million hectares), the data sets converge on over 1.5 billion metric tons of aboveground biomass, and 730 million metric tons of aboveground carbon (70 tons per hectare).

Figure 4. Aboveground biomass across Kayapó and neighboring Indigenous Territories (Brazilian Amazon). Data: GEDI-TanDEM-X

Barranco Chico Indigenous Territory (Peruvian Amazon)

Barranco Chico Indigenous Territory covers over 12,600 hectares in the southern Peruvian Amazon (Madre de Dios region). Both datasets converge in the estimate of over 2 million metric tons of aboveground biomass, equating to over 1 million metric tons of aboveground carbon. Figure 5 shows the detailed spatial distribution of this biomass across Barranco Chico and two neighboring Indigenous Territories (Puerto Luz and San Jose de Karene). Totaling across these three territories (nearly 90,000 hectares), the data sets converge on over 19 million metric tons of aboveground biomass, and over 9 million metric tons of aboveground carbon (102 tons per hectare).

Figure 5. Aboveground biomass across Barranco Chico and neighboring Indigenous Territories (Peruvian Amazon). Data: GEDI-TanDEM-X

Notes

1 GEDI L4B Gridded Aboveground Biomass Density, Version 2.1. This data is measured in megagrams of aboveground biomass per hectare (Mg/ha) at a 1-kilometer resolution, with the period of April 2019 – March 2023. This serves as our estimate for aboveground carbon reserves, with the science-based assumption that 48% of recorded biomass is carbon.

The approach relies on the foundational paper from Patterson et al., (2019) and it is used by the GEDI mission to estimate mean and total biomass worldwide (Dubayh et al., 2022, Armston et al., 2023). The method considers the spatial distribution of GEDI tracks within a given user-specify boundary to infer the sampling error component of the total uncertainty that also includes the error from the GEDI L4A models used to predict biomass from canopy height estimates (Keller et al., 2022). For more information on the OBI-WAN app, see Healey and Yang 2022.

3 GEDI-TanDEM-X (GTDX) is a fusion of GEDI Version 2 and TanDEM-X (TDX) Interferometric Synthetic Aperture Radar (InSAR) images (from Jan 2011 to December 2020). It also incorporates annual forest loss data to account for deforestation during this time. The GTDX aboveground biomass maps were produced based on a generalized hierarchical model-based (GHMB) framework that utilizes GEDI biomass as training data to establish models for estimating biomass based on the GTDX canopy height. The combination of lidar (GEDI) and radar (TanDEM-X) has started to produce unmatched maps that combine the ability of lidar to retrieve forest structure and the ability of radar to offer wall-to-wall coverage (Qi et al.,2023, Dubayah et a;., 2023). This fused product is a wall-to-wall gap-free map that was produced at multiple resolutions: 25m, 100m and 1ha. Ongoing processing over the Pantropic region will be made available over the next months but some geographies have been already mapped such as most of the Amazon Basin (Dubayah et al., 2023). The data we used is publicly available.

References

Armston, J., Dubayah, R. O., Healey, S. P., Yang, Z., Patterson, P. L., Saarela, S., Stahl, G., Duncanson, L., Kellner, J. R., Pascual, A., & Bruening, J. (2023). Global Ecosystem Dynamics Investigation (GEDI)GEDI L4B Country-level Summaries of Aboveground Biomass [CSV]. 0 MB. https://doi.org/10.3334/ORNLDAAC/2321

Dubayah, R. O., Armston, J., Healey, S. P., Yang, Z., Patterson, P. L., Saarela, S., Stahl, G., Duncanson, L., Kellner, J. R., Bruening, J., & Pascual, A. (2023). Global Ecosystem Dynamics Investigation (GEDI)GEDI L4B Gridded Aboveground Biomass Density, Version 2.1 [COG]. 0 MB. https://doi.org/10.3334/ORNLDAAC/2299

Dubayah, R., Armston, J., Healey, S. P., Bruening, J. M., Patterson, P. L., Kellner, J. R., Duncanson, L., Saarela, S., Ståhl, G., Yang, Z., Tang, H., Blair, J. B., Fatoyinbo, L., Goetz, S., Hancock, S., Hansen, M., Hofton, M., Hurtt, G., & Luthcke, S. (2022). GEDI launches a new era of biomass inference from space. Environmental Research Letters, 17(9), 095001. https://doi.org/10.1088/1748-9326/ac8694

Dubayah, R., Blair, J. B., Goetz, S., Fatoyinbo, L., Hansen, M., Healey, S., Hofton, M., Hurtt, G., Kellner, J., Luthcke, S., Armston, J., Tang, H., Duncanson, L., Hancock, S., Jantz, P., Marselis, S., Patterson, P. L., Qi, W., & Silva, C. (2020). The Global Ecosystem Dynamics Investigation: High-resolution laser ranging of the Earth’s forests and topography. Science of Remote Sensing, 1, 100002. https://doi.org/10.1016/j.srs.2020.100002

Healey S, Yang Z (2022) The OBIWAN App: Estimating Property-Level Carbon Storage Using NASA’s GEDI Lidar. https://www.fs.usda.gov/research/rmrs/understory/obiwan-app-estimating-property-level-carbon-storage-using-nasas-gedi-lidar

Kellner, J. R., Armston, J., & Duncanson, L. (2022). Algorithm Theoretical Basis Document for GEDI Footprint Aboveground Biomass Density. Earth and Space Science, 10(4), e2022EA002516. https://doi.org/10.1029/2022EA002516

Dubayah, R.O., W. Qi, J. Armston, T. Fatoyinbo, K. Papathanassiou, M. Pardini, A. Stovall, C. Choi, and V. Cazcarra-Bes. 2023. Pantropical Forest Height and Biomass from GEDI and TanDEM-X Data Fusion. ORNL DAAC, Oak Ridge, Tennessee, USA. https://doi.org/10.3334/ORNLDAAC/2298

Qi, W., J. Armston, C. Choi, A. Stovall, S. Saarela, M. Pardini, L. Fatoyinbo, K. Papathanasiou, and R. Dubayah. 2023. Mapping large-scale pantropical forest canopy height by integrating GEDI lidar and TanDEM-X InSAR data. Research Square. https://doi.org/10.21203/rs.3.rs-3306982/v1

Krieger, G., M. Zink, M. Bachmann, B. Bräutigam, D. Schulze, M. Martone, P. Rizzoli, U. Steinbrecher, J. Walter Antony, F. De Zan, I. Hajnsek, K. Papathanassiou, F. Kugler, M. Rodriguez Cassola, M. Younis, S. Baumgartner, P. López-Dekker, P. Prats, and A. Moreira. 2013. TanDEM-X: A radar interferometer with two formation-flying satellites. Acta Astronautica 89:83–98. https://doi.org/10.1016/j.actaastro.2013.03.008

Acknowledgments

We greatly thank the University of Maryland’s GEDI team for data access and reviewing this report. In particular, we thank Ralph Dubayah, Matheus Nunes, and Sean Healey.

This report was made possible by the generous support of the Norwegian Agency for Development Cooperation (NORAD)

Citation

Mamani N, Pascual A, Finer M (2024) Estimating Carbon in Amazon Protected Areas & Indigenous Territories. MAAP: 213