MAAP #132: Amazon Deforestation Hotspots 2020

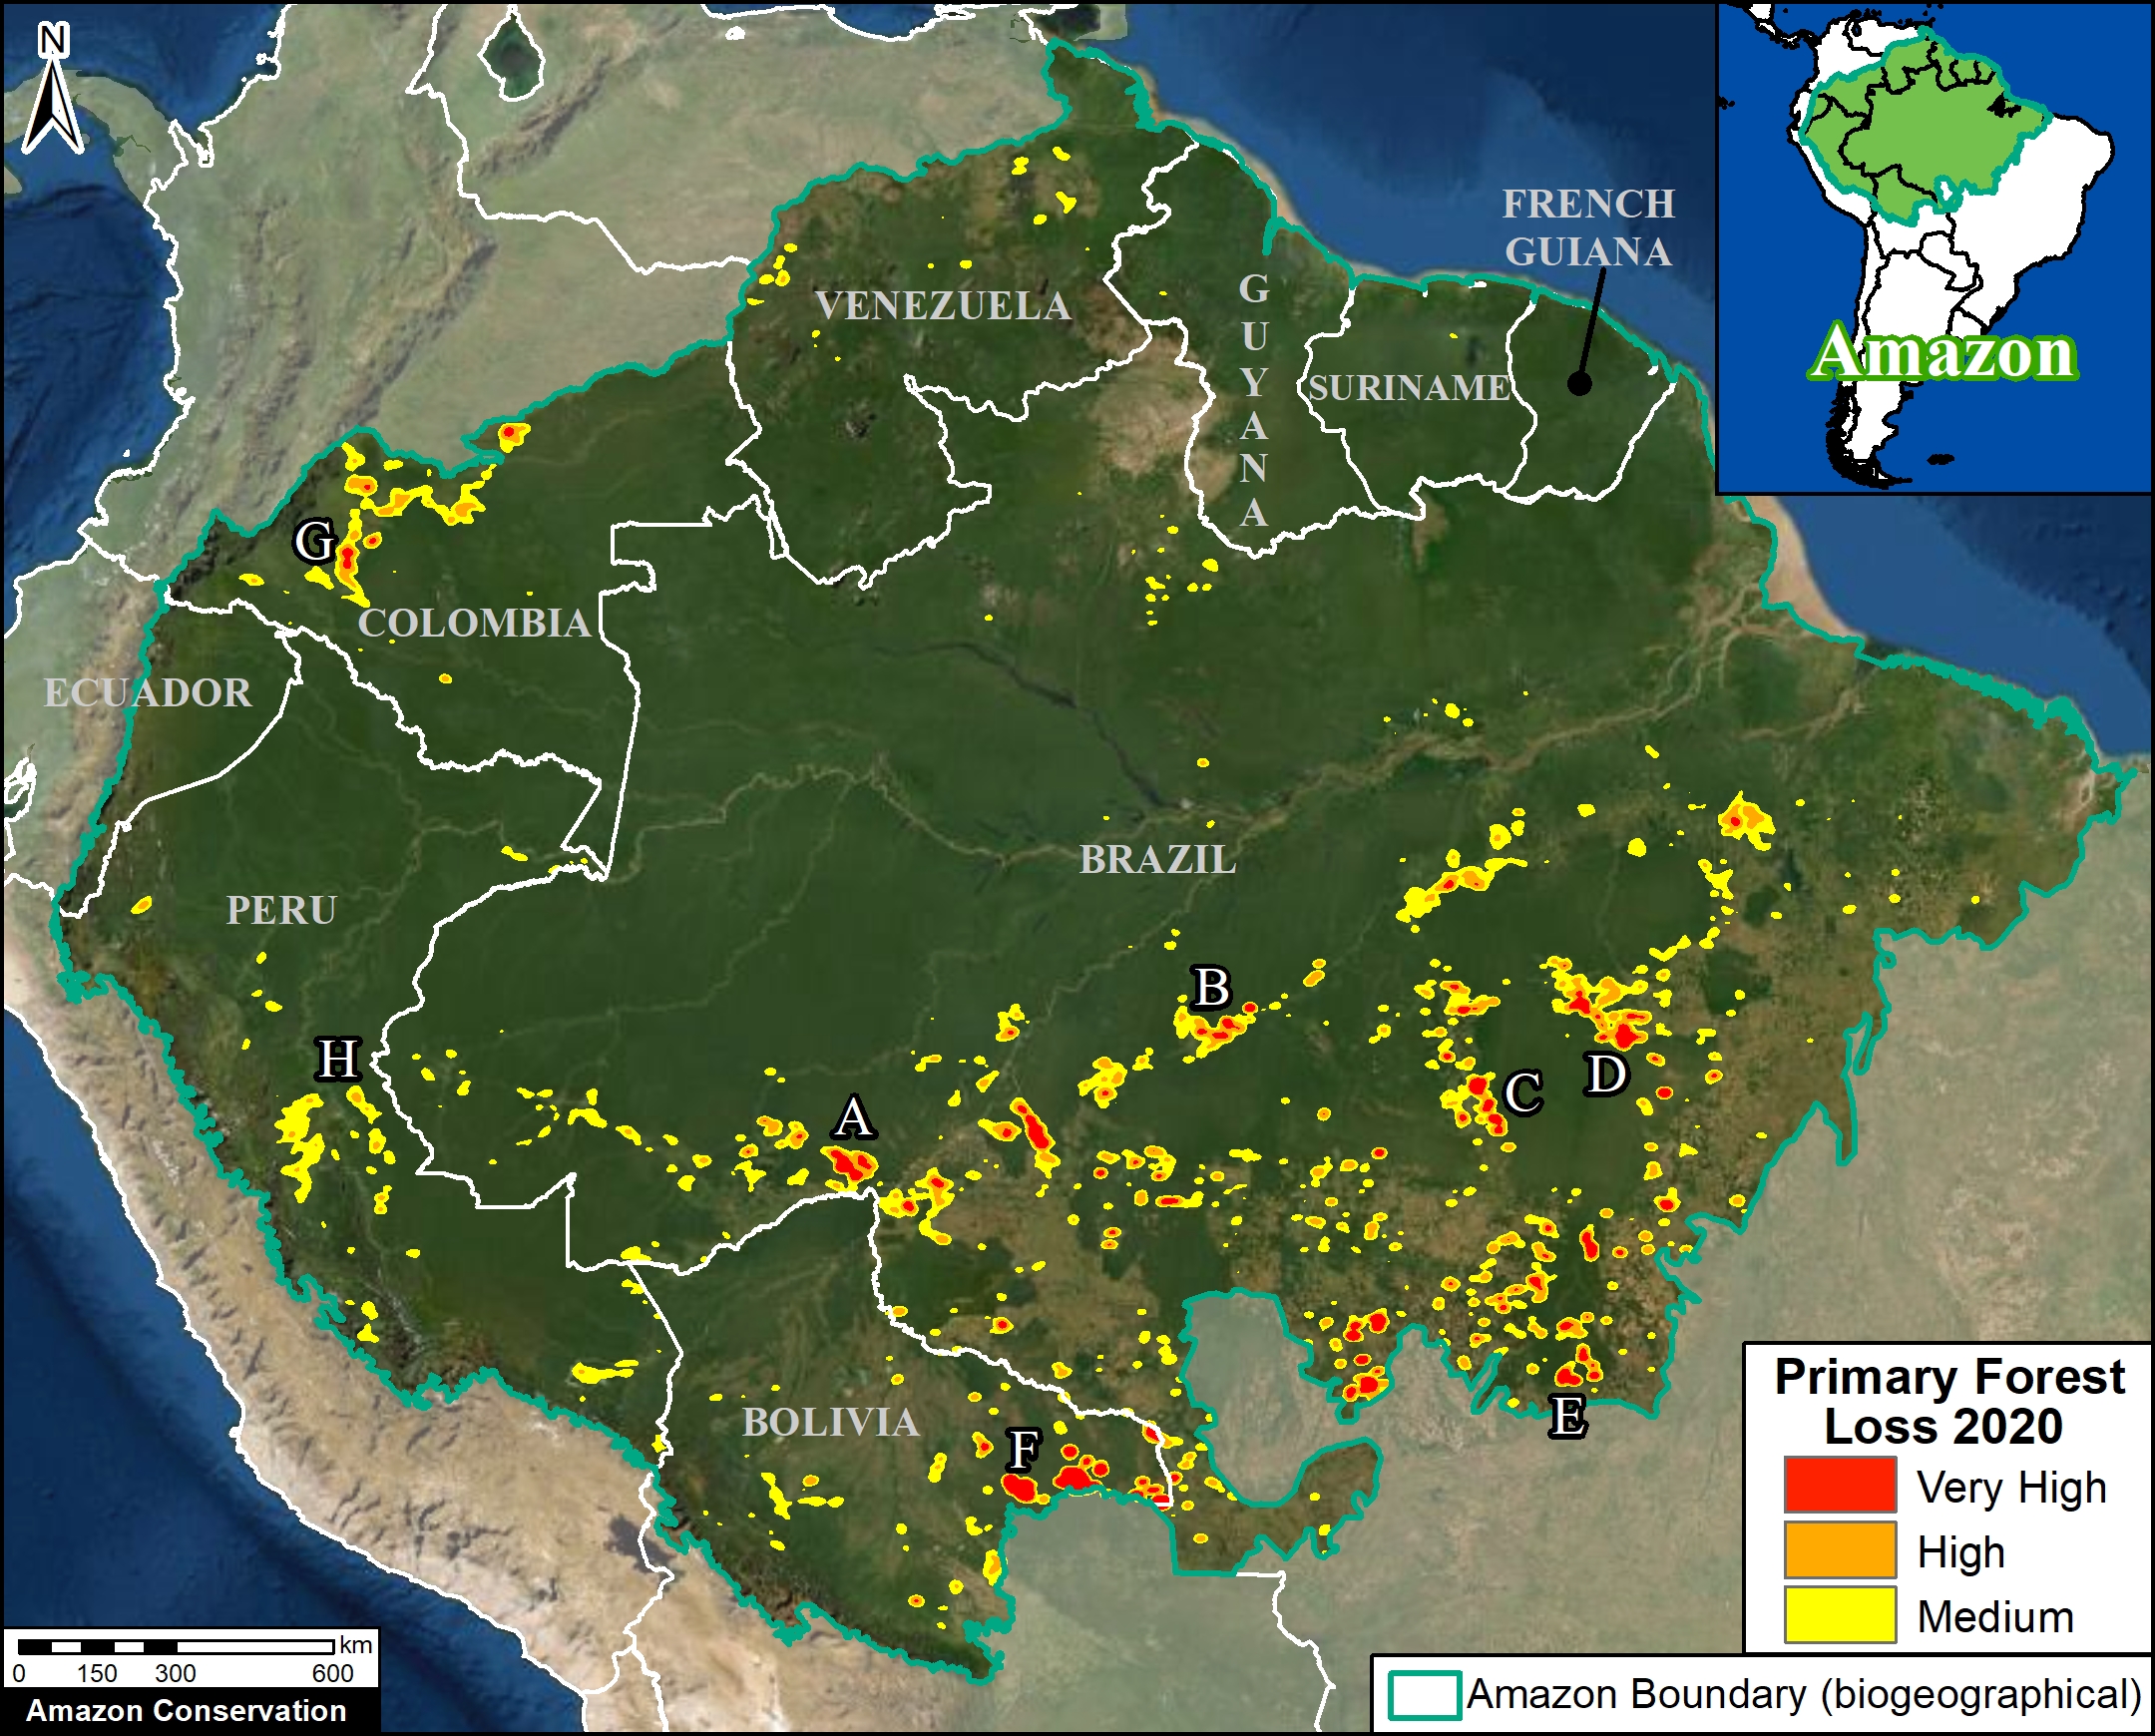
Base Map. Forest loss hotspots across the Amazon in 2020. Data: UMD/GLAD, RAISG, MAAP. The letters A-G correspond to the zoom examples below.

We present a first look at the major hotspots of primary forest loss across the Amazon in 2020 (see Base Map).*

There are several major headlines:

  • We estimate over 2 million hectares (5 million acres) of primary forest loss across the nine countries of the Amazon in 2020.*
    p
  • The countries with the highest 2020 primary forest loss are 1) Brazil, 2) Bolivia, 3) Peru, 4) Colombia, 5) Venezuela, and 6) Ecuador.
    p
  • The majority of the hotspots occurred in the Brazilian Amazon, where massive deforestation stretched across nearly the entire southern region. Many of these areas were cleared in the first half of the year and then burned in July and August. In September, there was a shift to actual forest fires (see MAAP #129).
    p
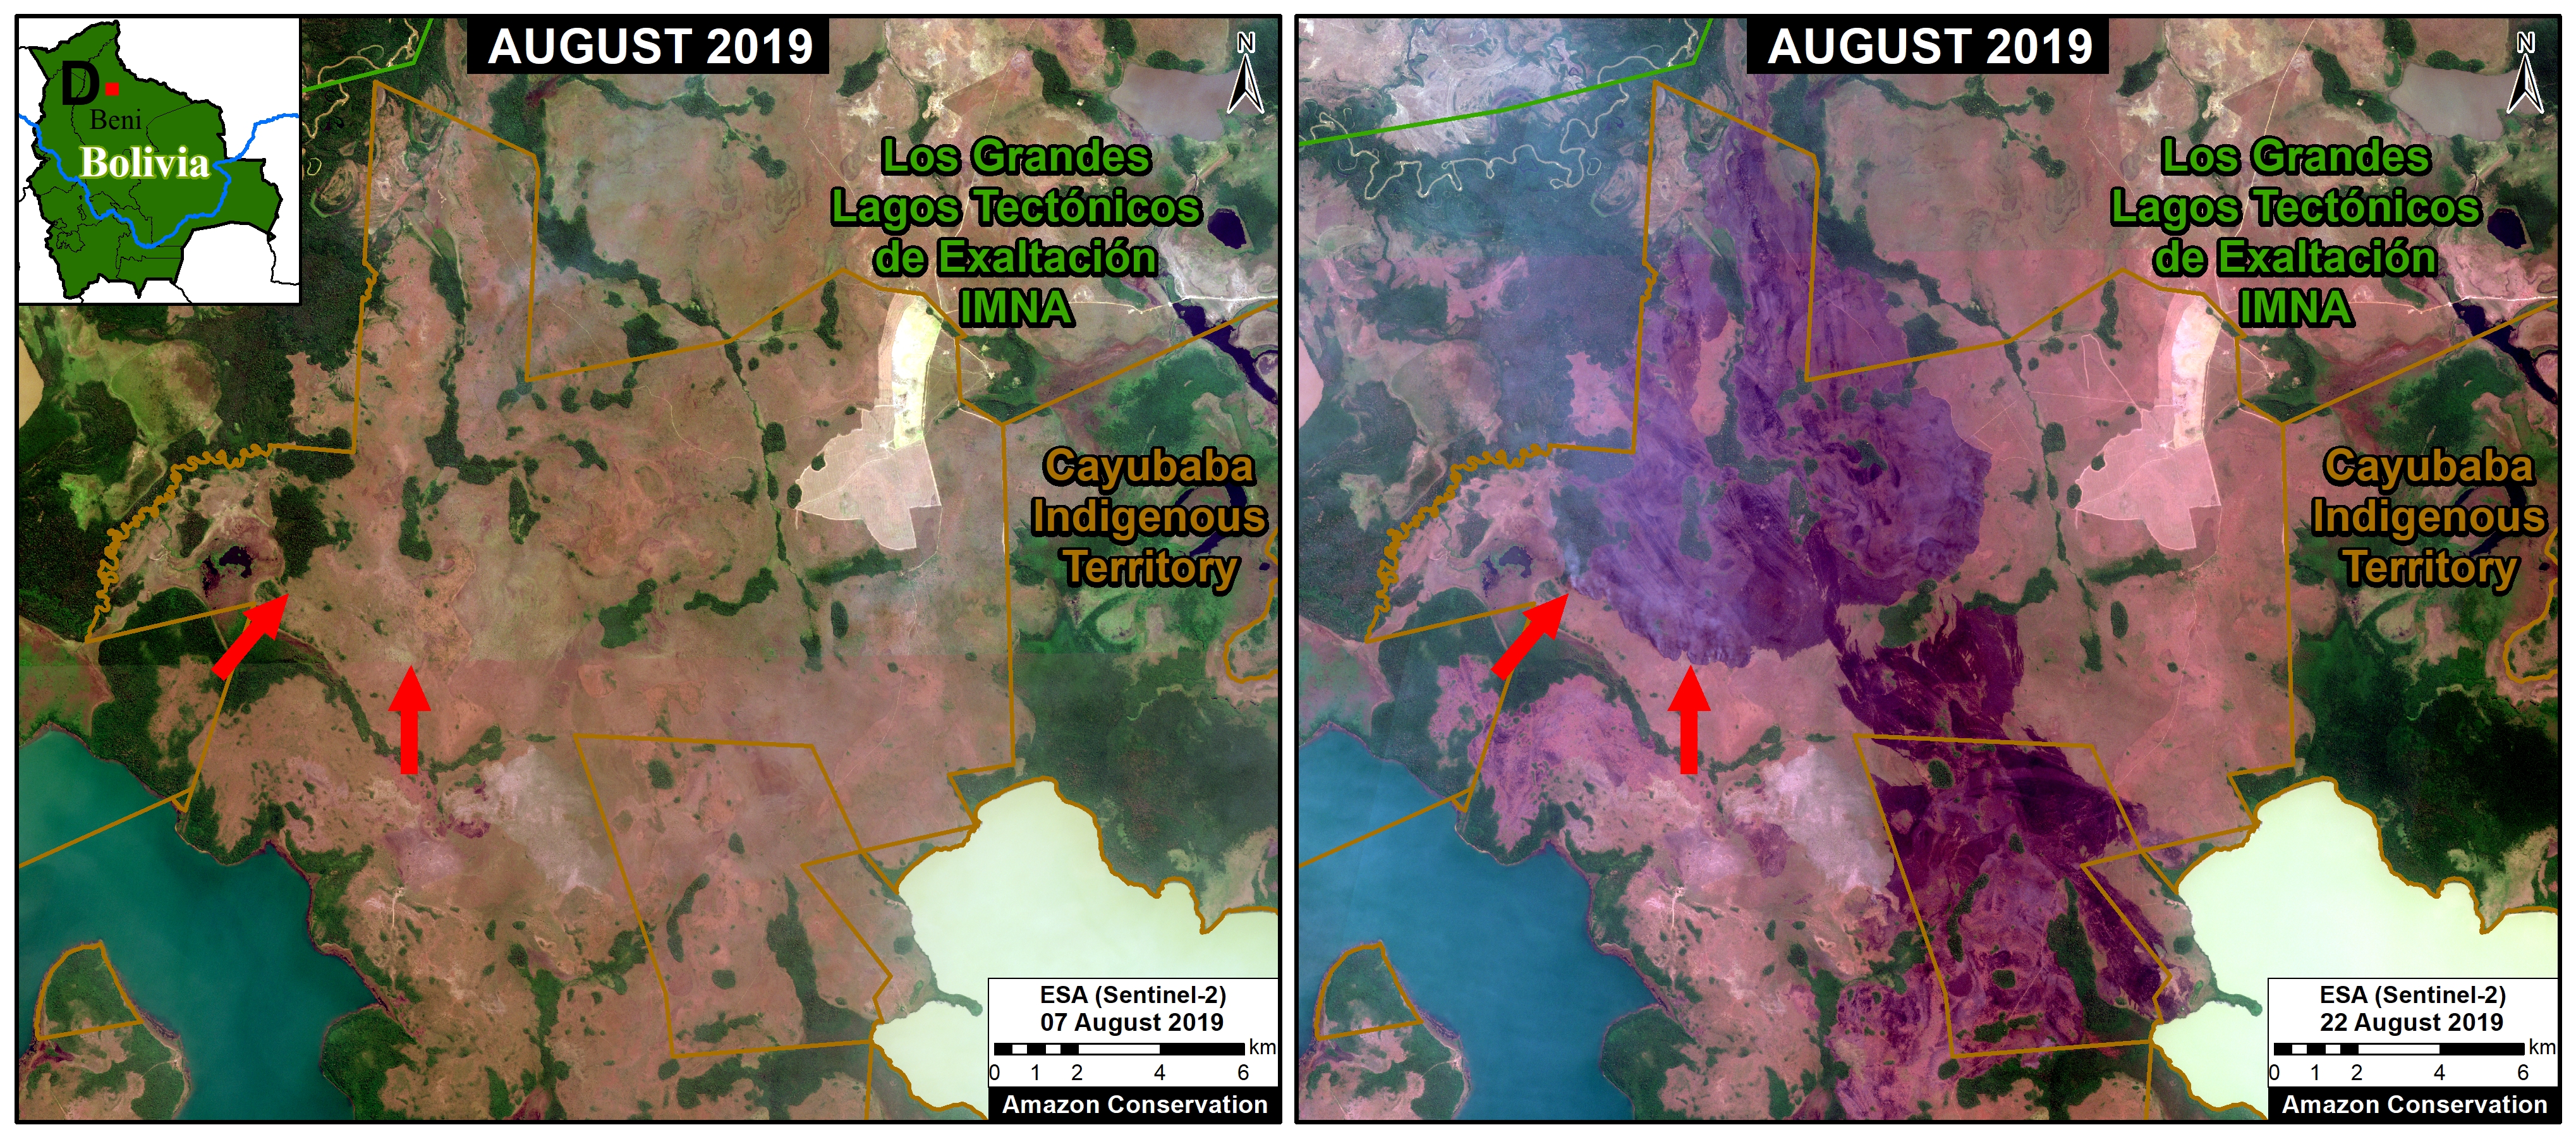
  • Several of the most intense hotspots were in the Bolivian Amazon, where fires raged through the dry forests (known as the Chiquitano) in the southeast region.
    p
  • There continues to be an arc of deforestation in the northwestern Colombian Amazon, impacting numerous protected areas.
    p
  • In the Peruvian Amazon, deforestation continues to impact the central region. On the positive, the illegal gold mining that plagued the southern region has decreased thanks to effective government action (see MAAP #130).

Below, we show a striking series of high-resolution satellite images that illustrate some of the major deforestation events across the Amazon in 2020 (indicated A-G on the Base Map).

Widespread Deforestation in the Brazilian Amazon

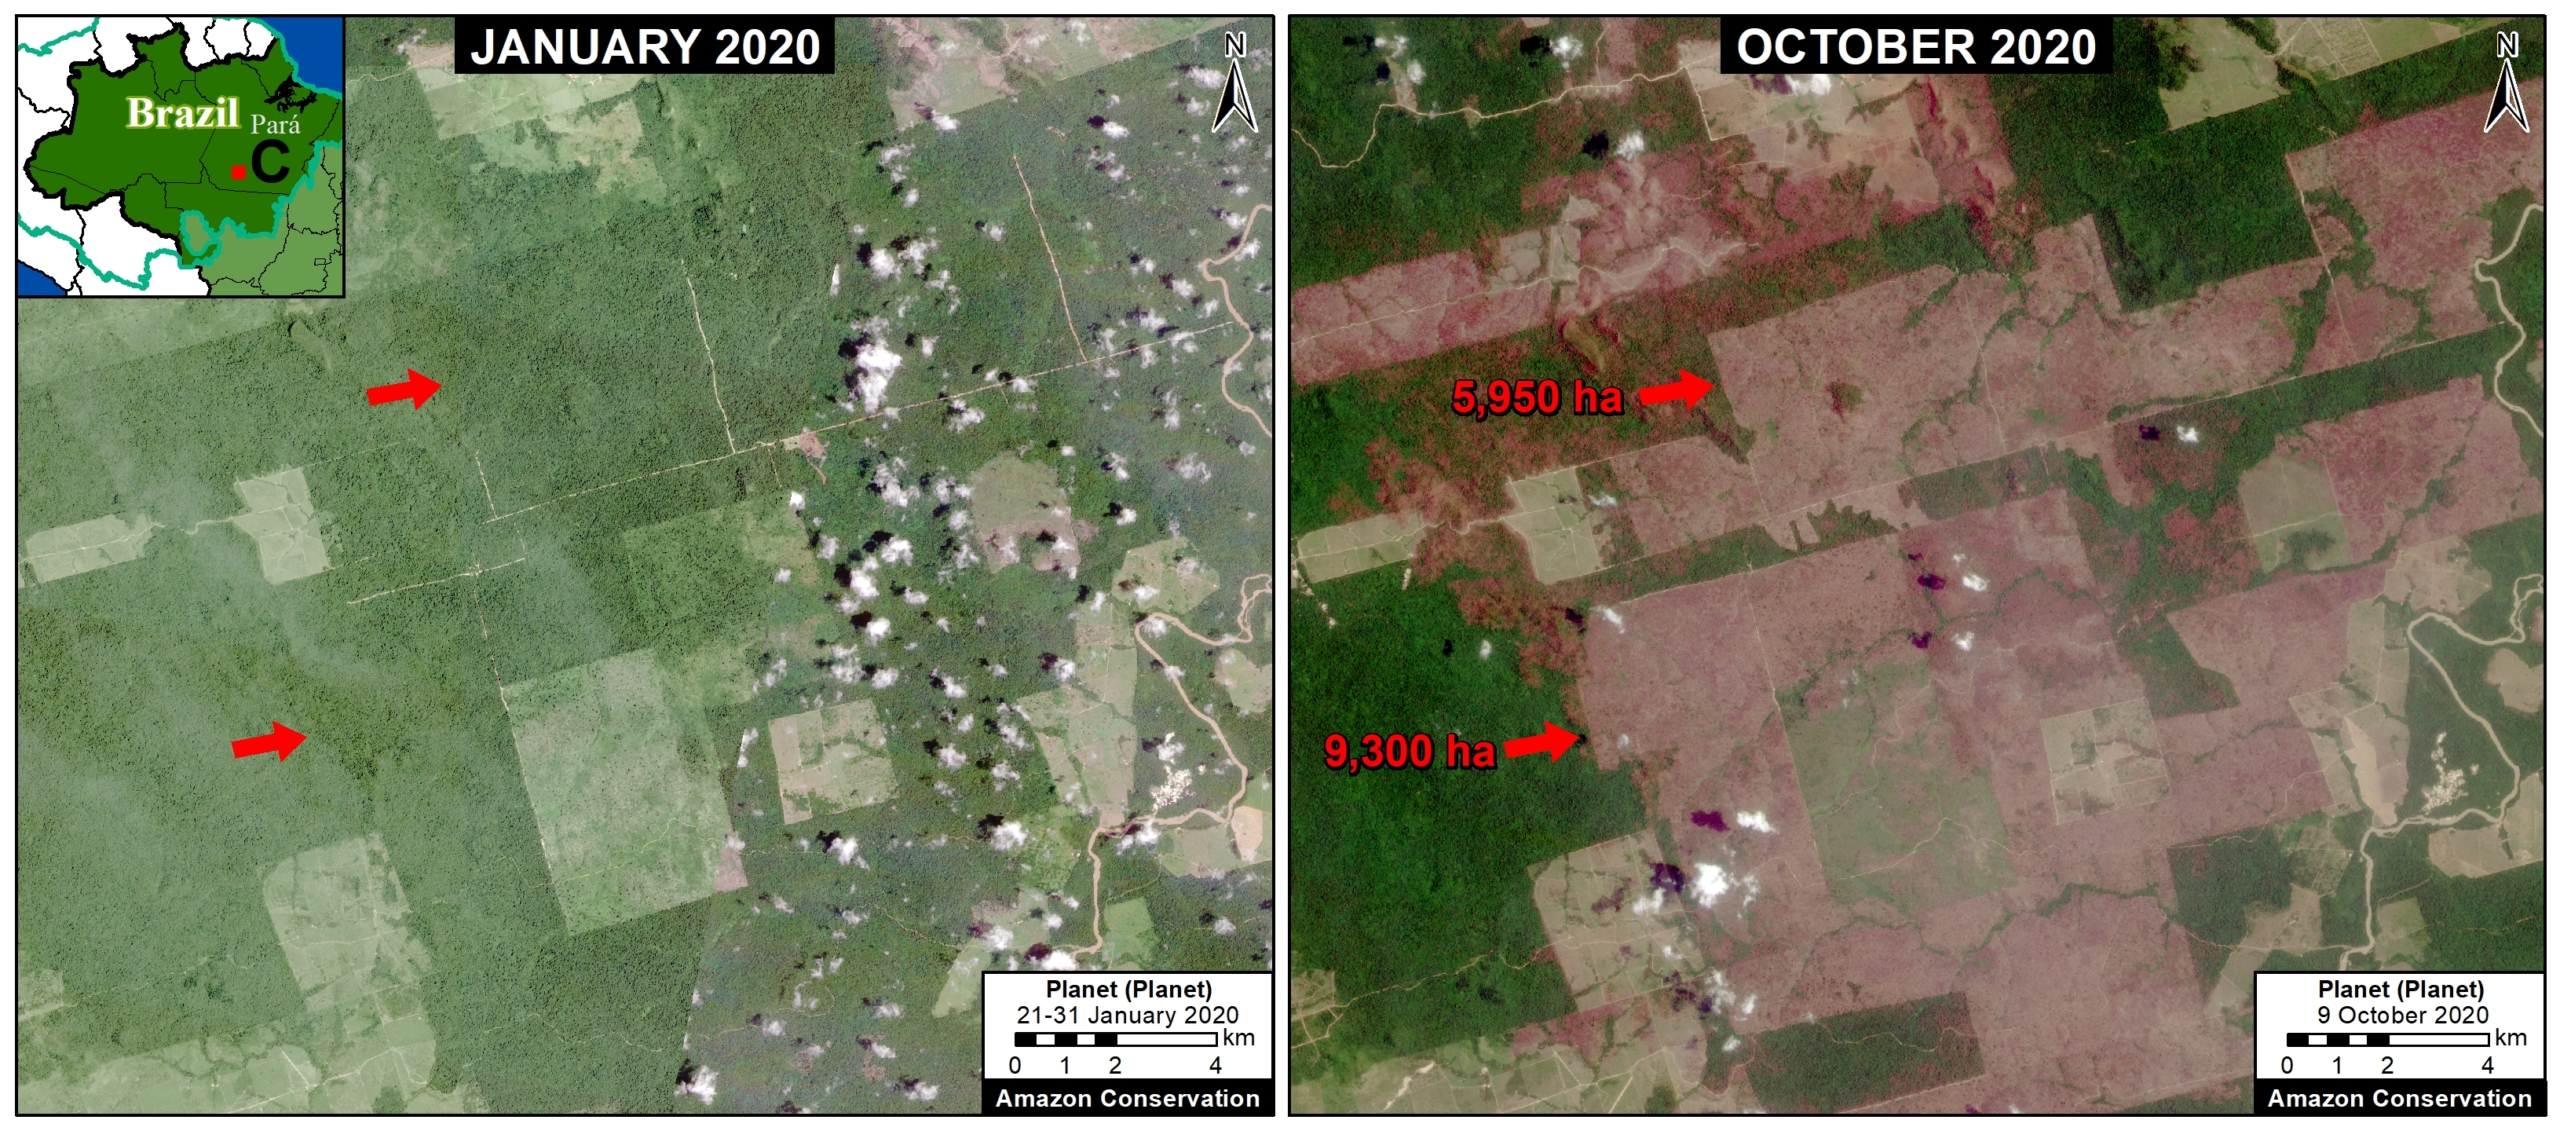
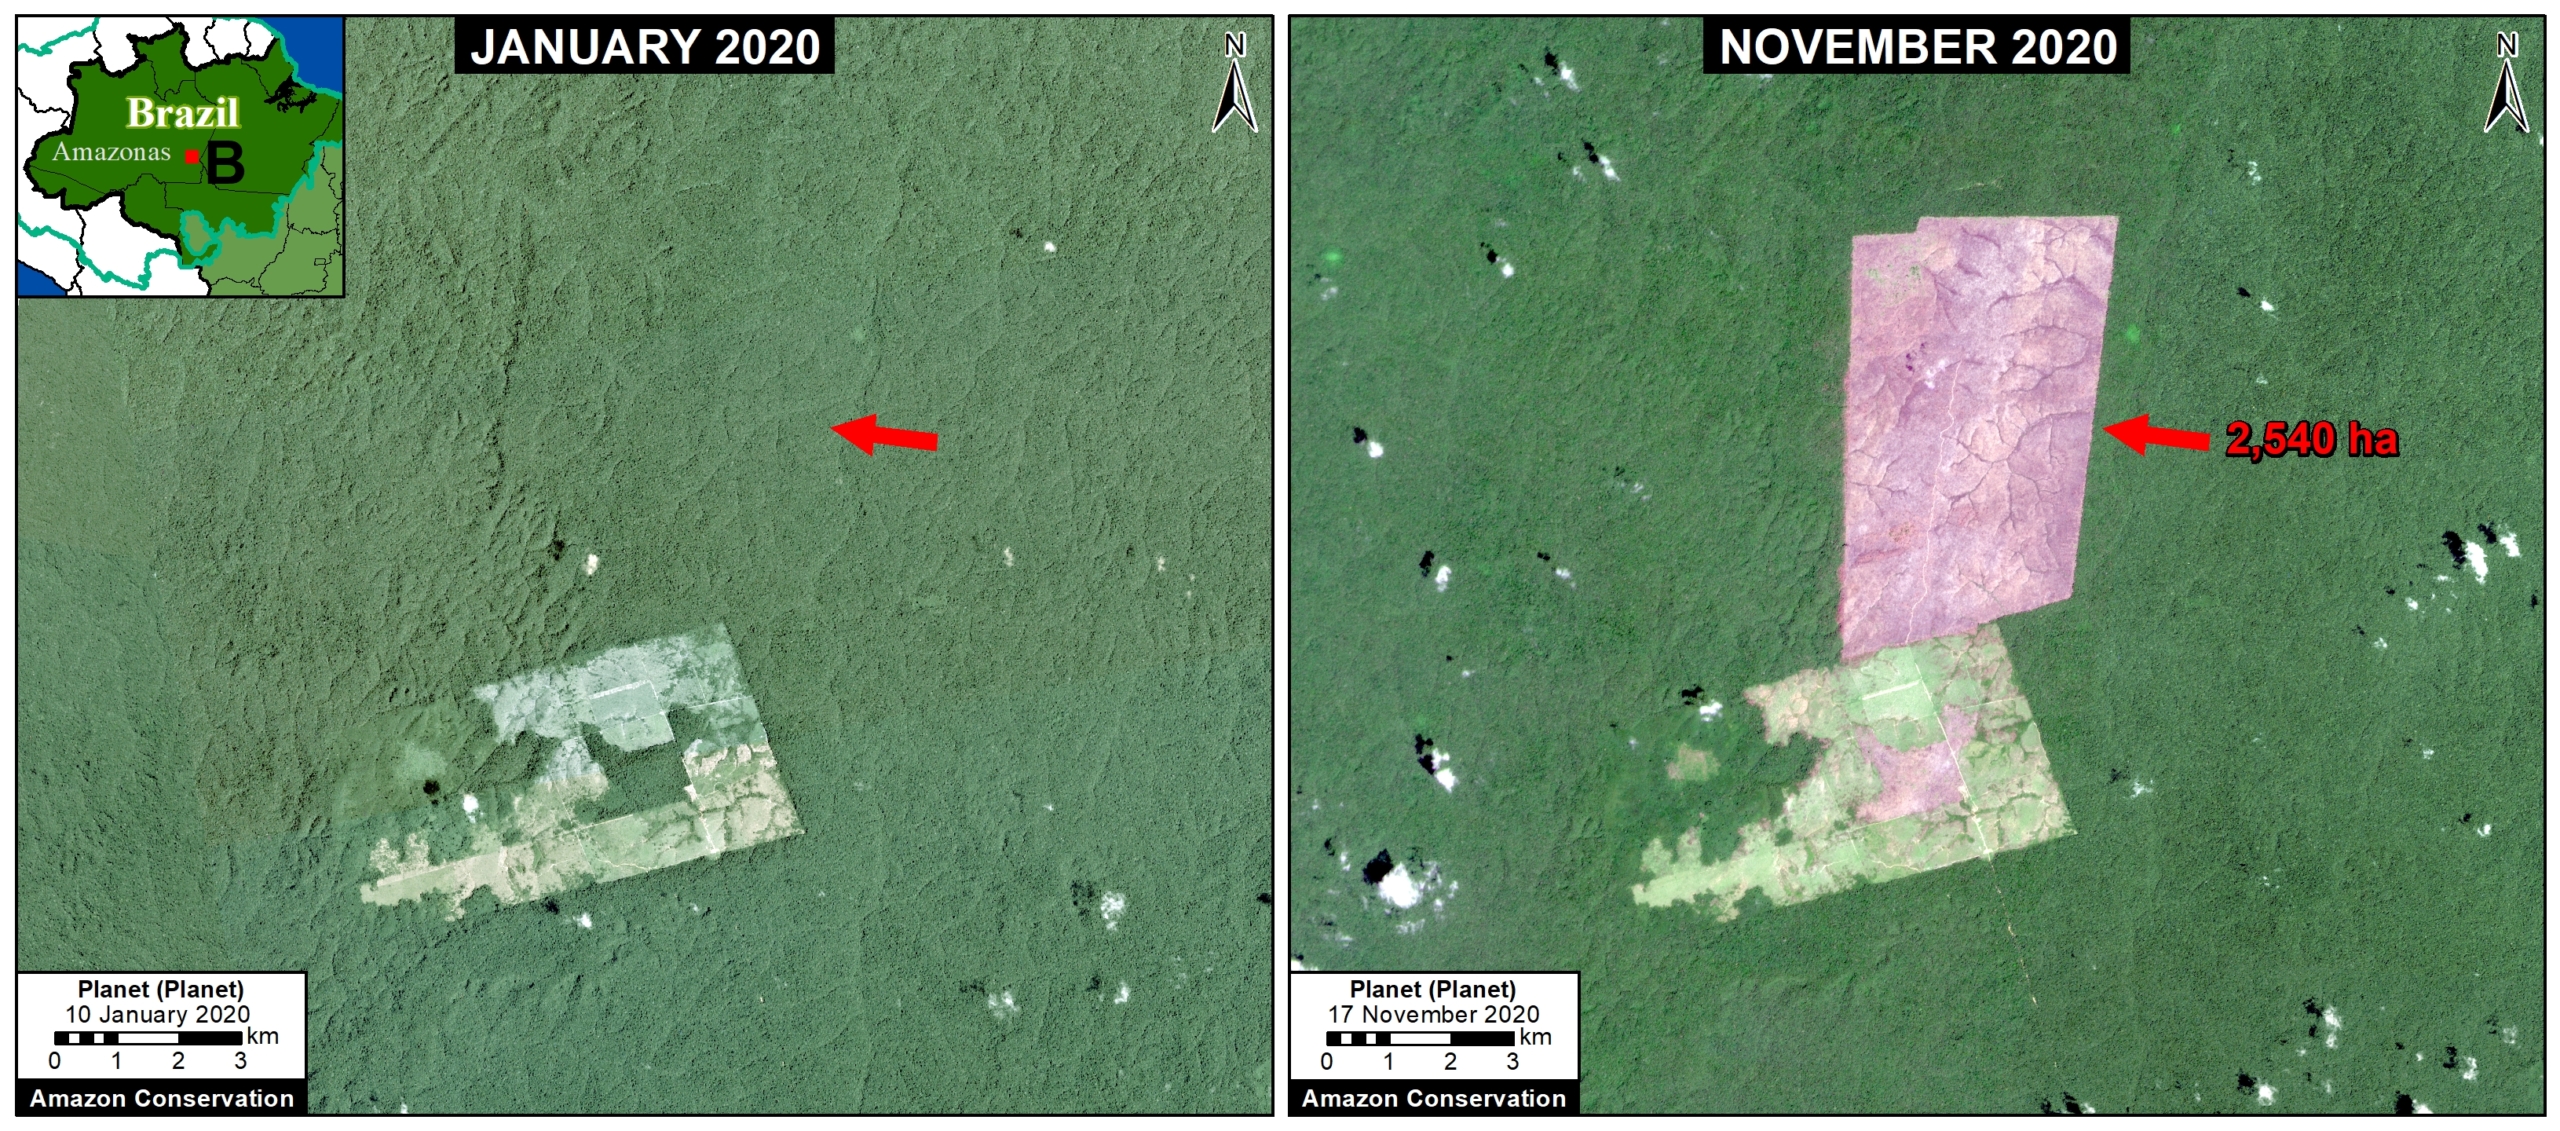
Zooms A-C show examples of a troublingly common phenomenon in the Brazilian Amazon: large-scale deforestation events in the first half of the year that are later burned in July and August, causing major fires due to the abundant recently-cut biomass. Much of the deforestation in these areas appears to associated with clearing rainforests for cattle pastures. The three examples below show the striking loss of over 21,000 hectares of primary forest in 2020.
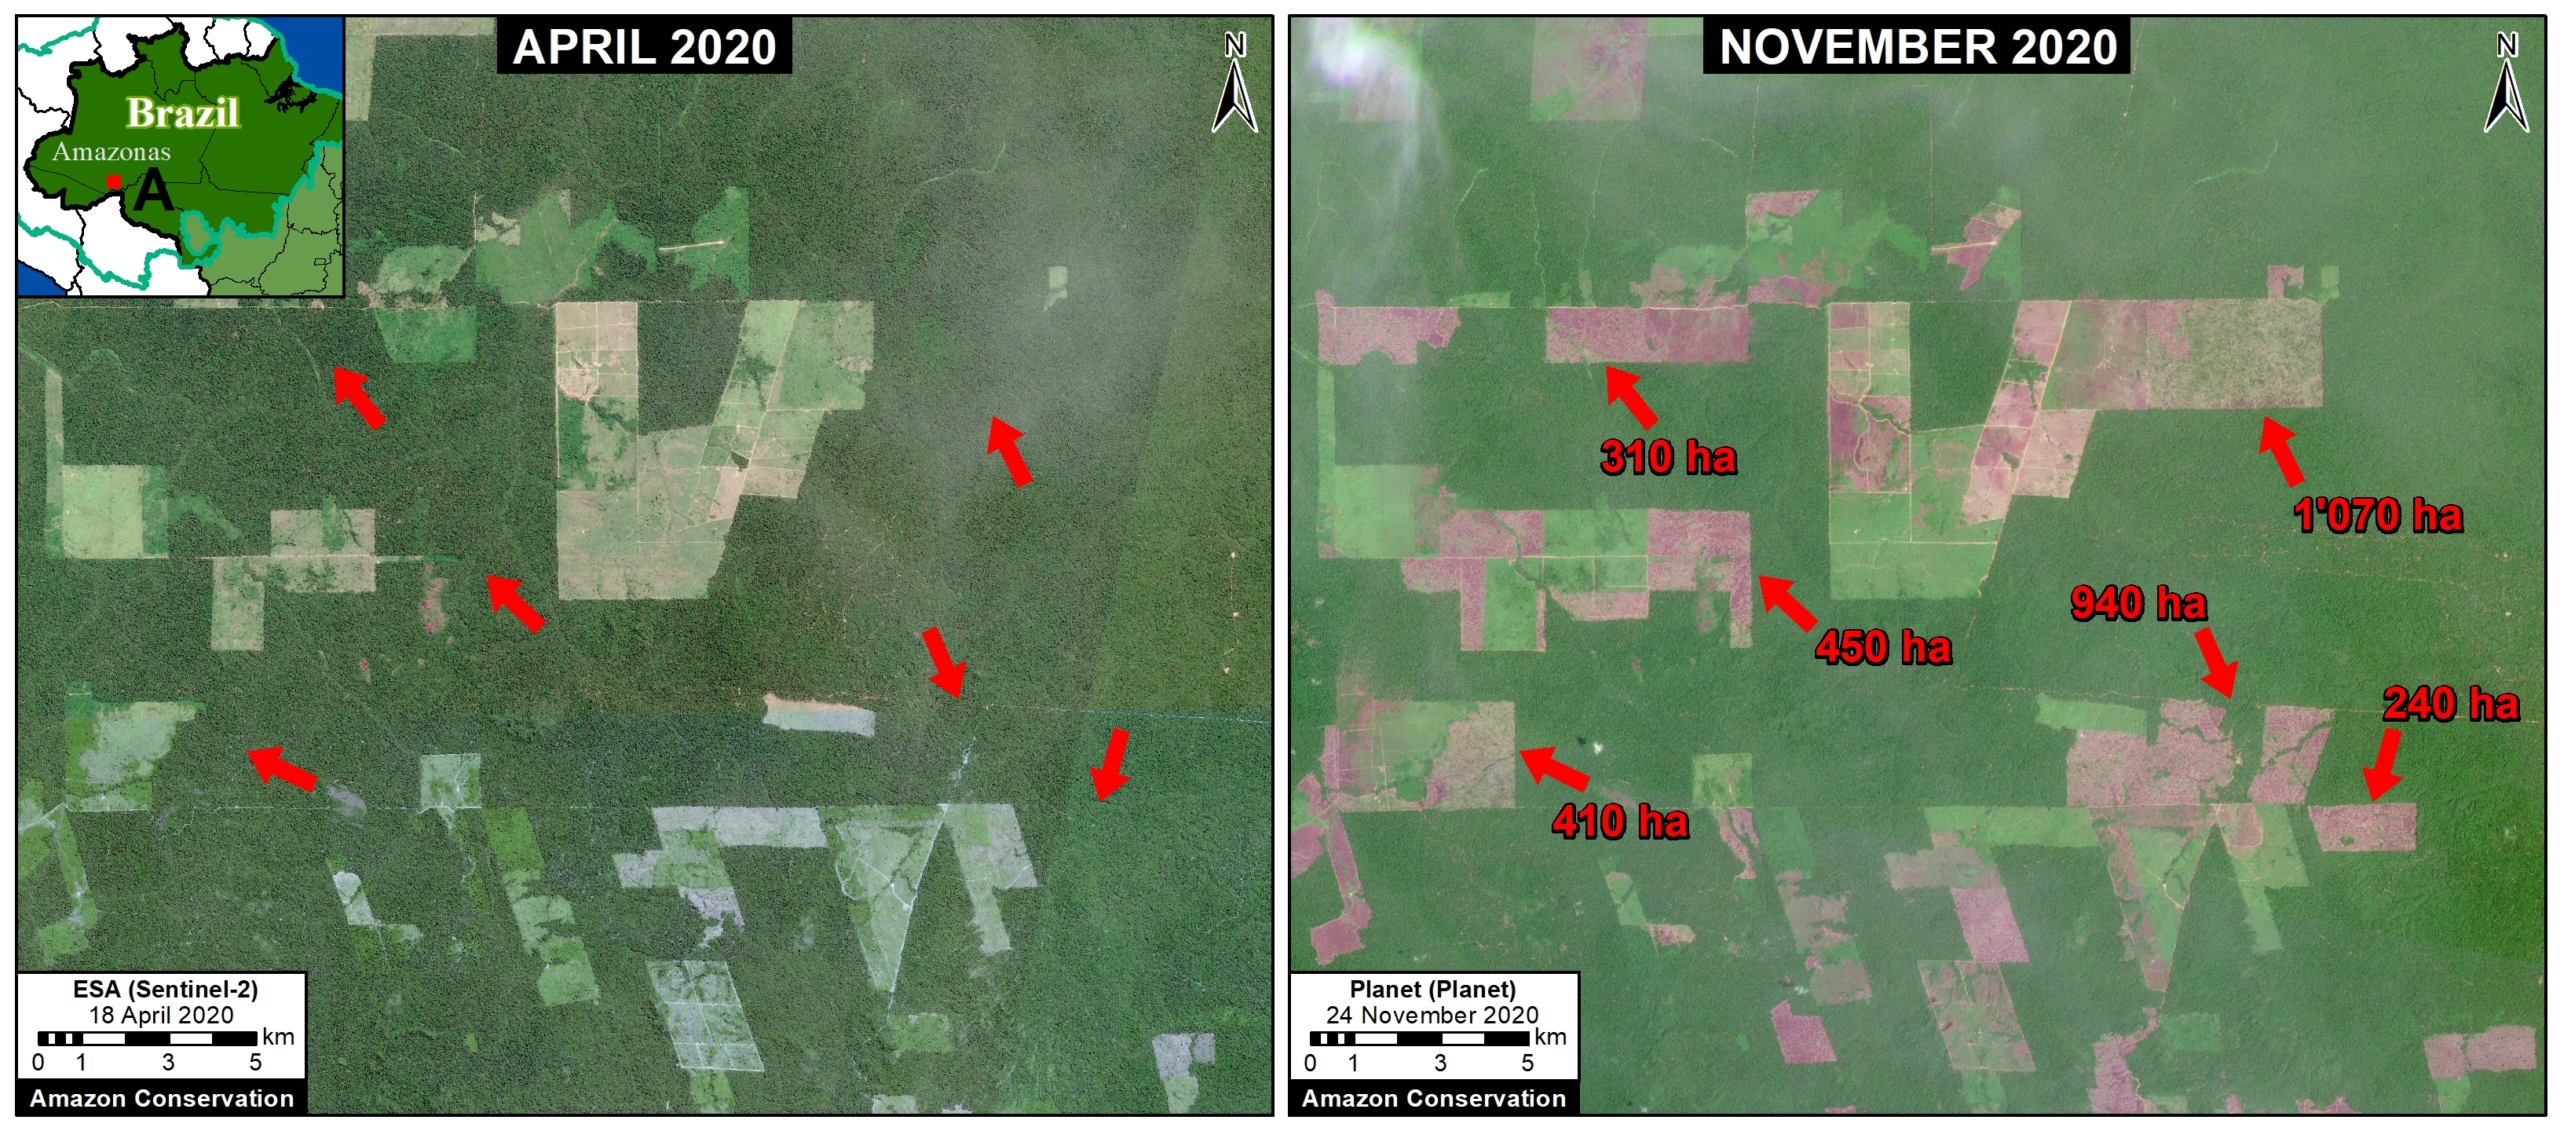
Zoom A. Deforestation in the Brazilian Amazon (Amazonas state) of 3,400 hectares between April (left panel) and November (right panel) 2020. Data: ESA, Planet.
Zoom B. Deforestation in Brazilian Amazon (Amazonas state) of 2,540 hectares between January (left panel) and November (right panel) 2020. Data: Planet.
Zoom C. Deforestation in Brazilian Amazon (Para state) of 15,250 hectares between January (left panel) and October (right panel) 2020. Data: Planet.

Forest Fires in the Brazilian Amazon

In September, there was a shift to actual forest fires in the Brazilian Amazon (see MAAP #129). Zoom D and E show examples of these major forest fires, which burned over 50,000 hectares in the states of Pará and Mato Grosso. Note both fires impacted indigenous territories (Kayapo and Xingu, respectively).
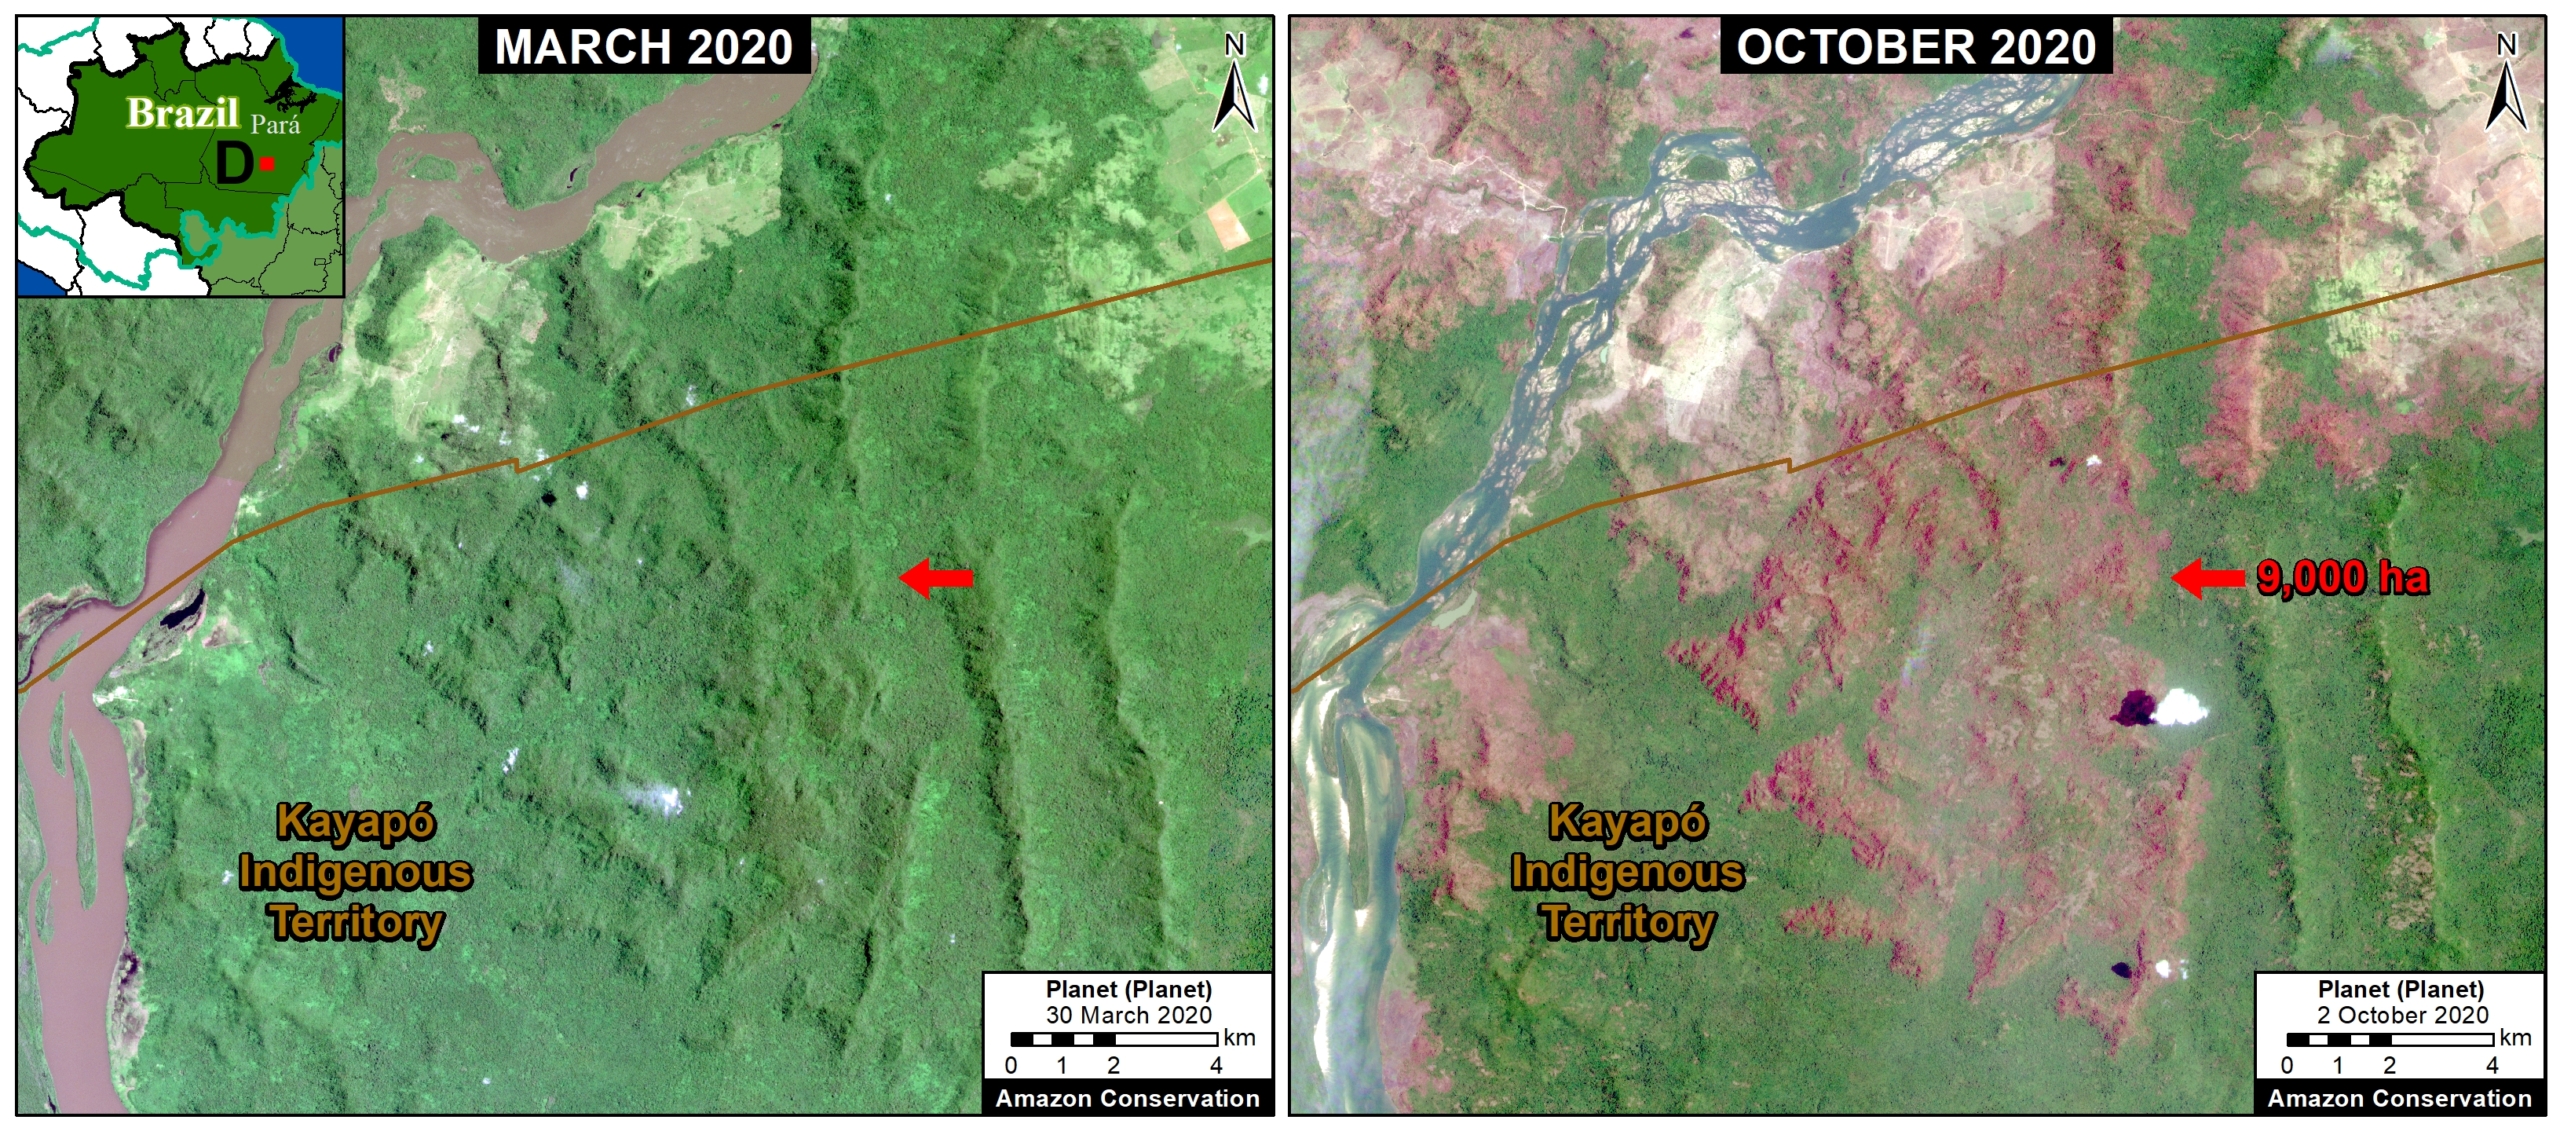
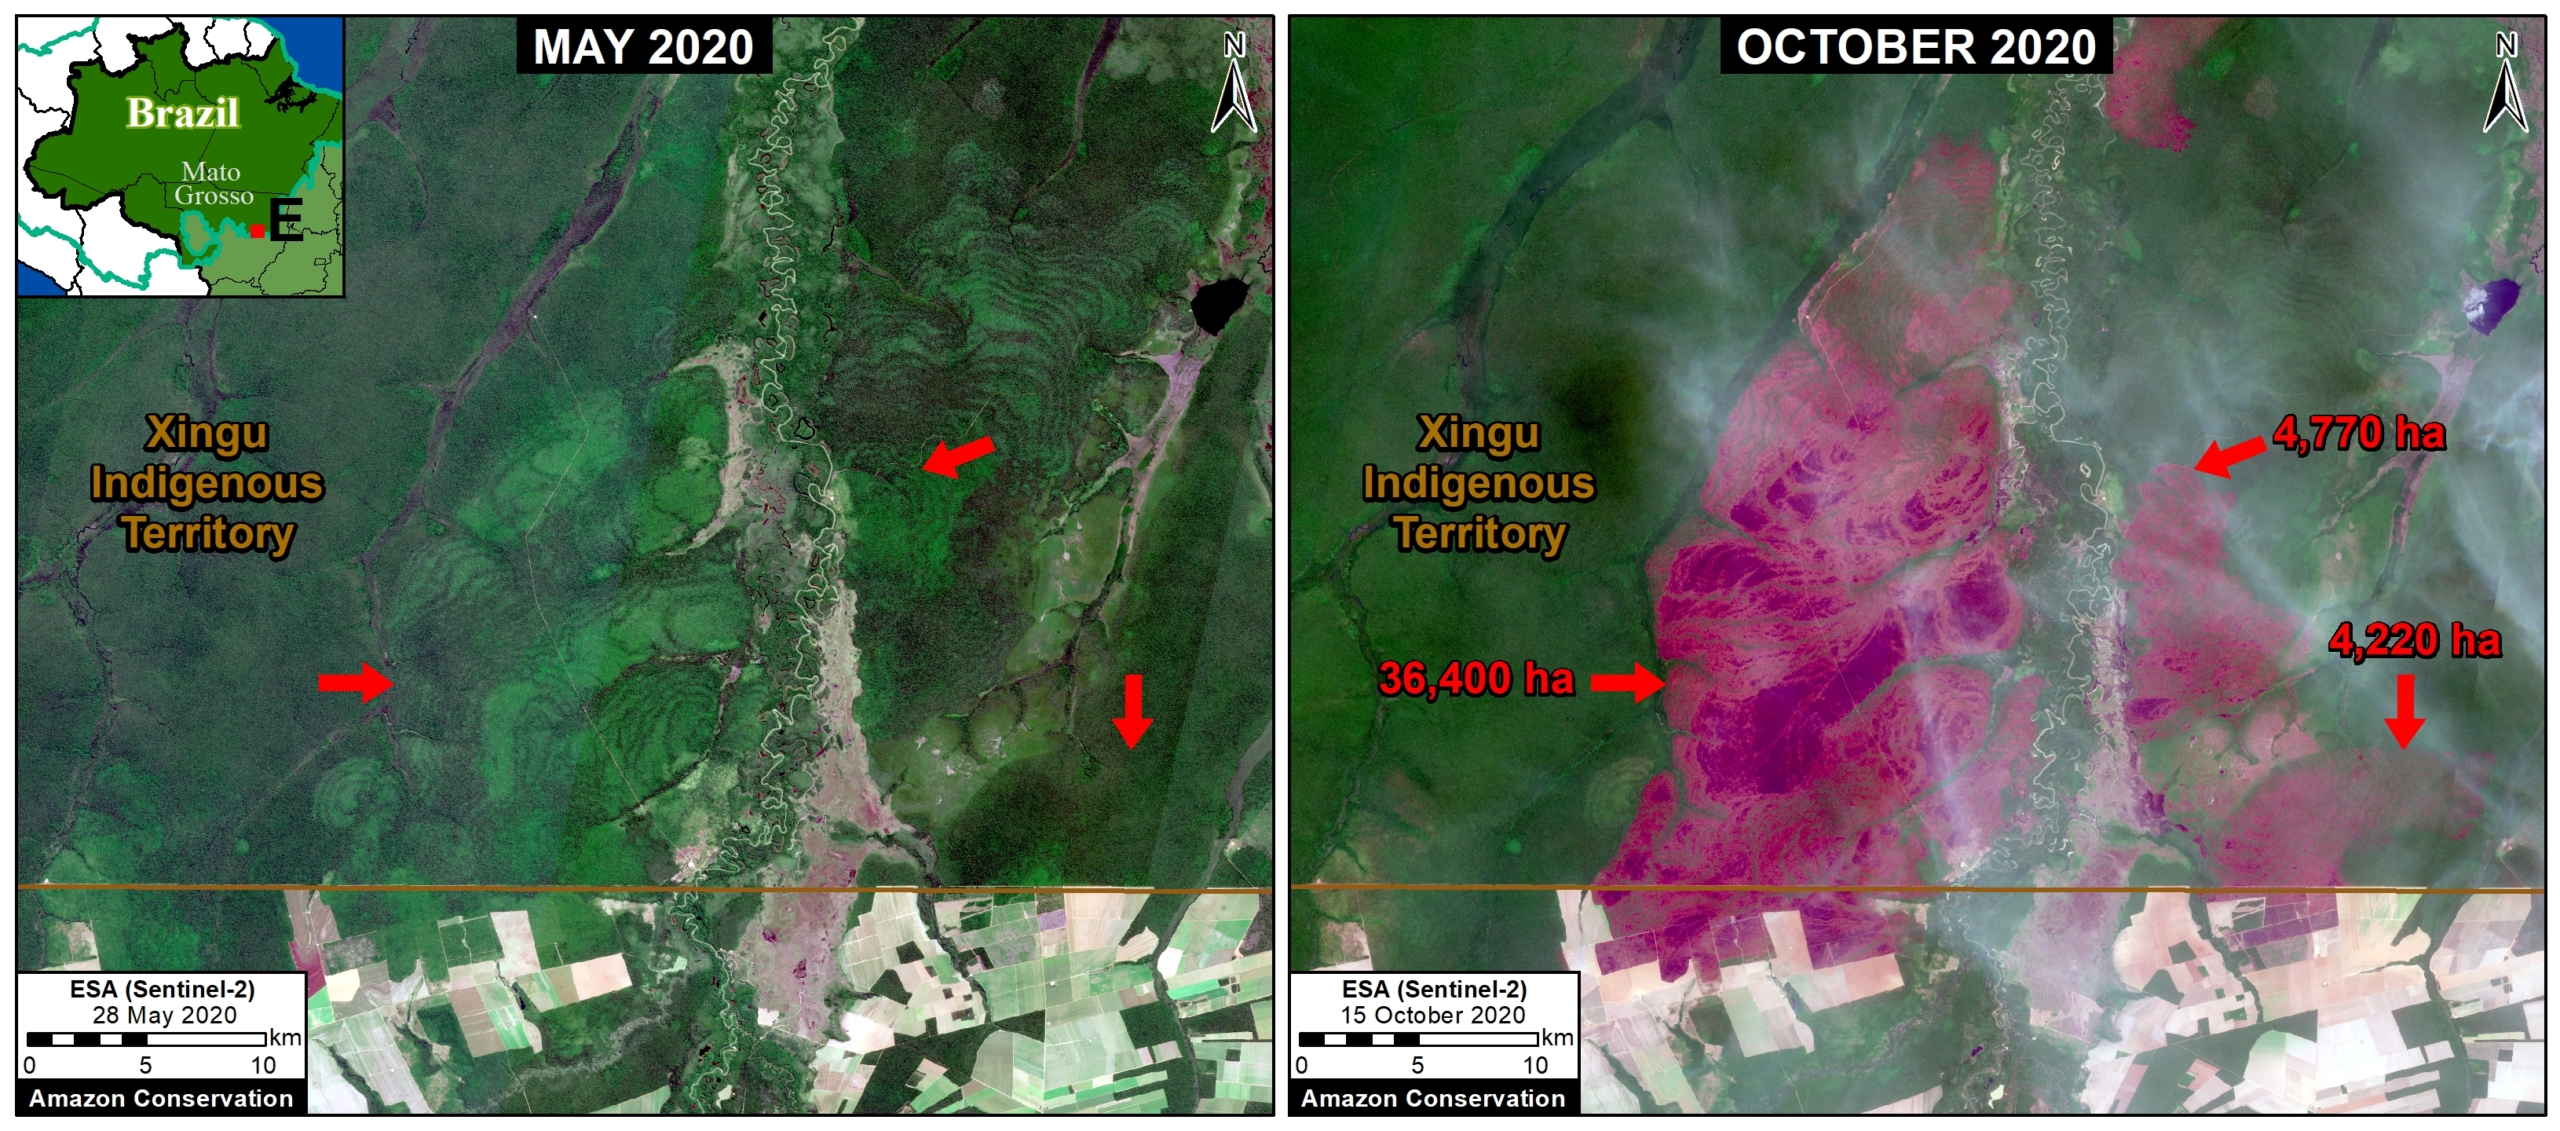
Zoom D. Forest fire in Brazilian Amazon (Para state) that burned 9,000 hectares between March (left panel) and October (right panel) 2020. Data: Planet.
Zoom E. Forest fire in Brazilian Amazon (Mato Grosso state) that burned over 44,000 hectares between May (left panel) and October (right panel) 2020. Data: Planet.

Forest Fires in the Bolivian Amazon

The Bolivian Amazon also experienced another intense fire season in 2020. Zoom F shows the burning of a massive area (over 260,000 hectares) in the Chiquitano dry forests (Santa Cruz department).
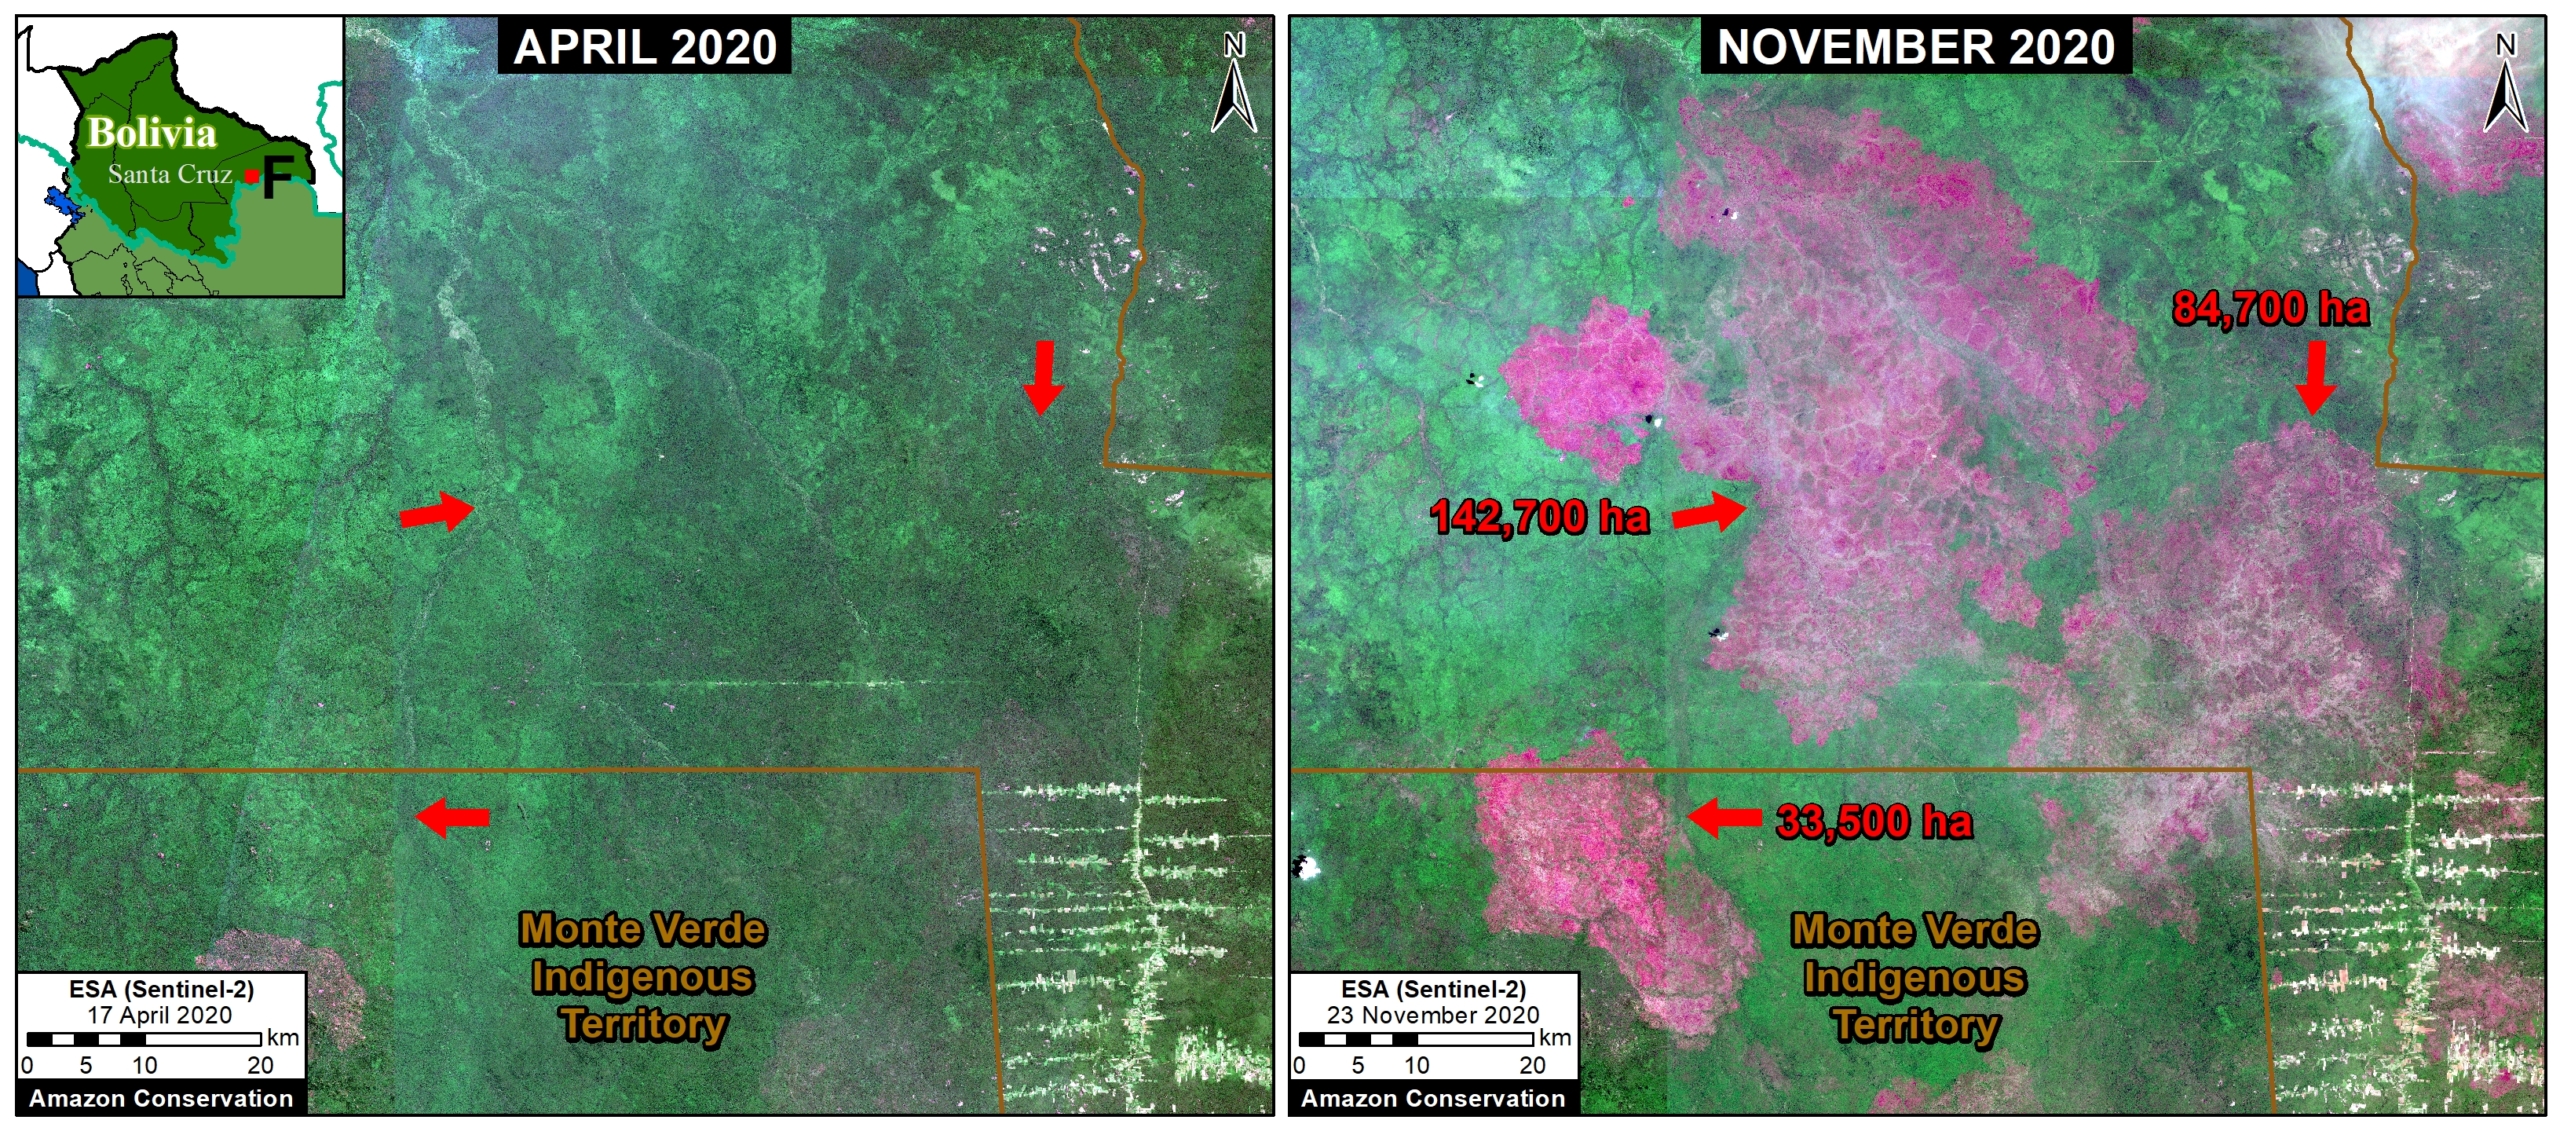
Zoom F. Forest fire in Bolivian Amazon (Santa Cruz) that burned over 260,000 hectares between April (left panel) and November (right panel) 2020. Data: ESA.

Arc of Deforestation in the Colombian Amazon

As described in previous reports (see MAAP #120), there is an “arc of deforestation” concentrated in the northwest Colombian Amazon. This arc impacts numerous protected areas (including national parks) and Indigenous Reserves. For example, Zoom G shows the recent deforestation of over 500 hectares in Chiribiquete National Park. Similar deforestation in that sector of the park appears to be conversion to cattle pasture.
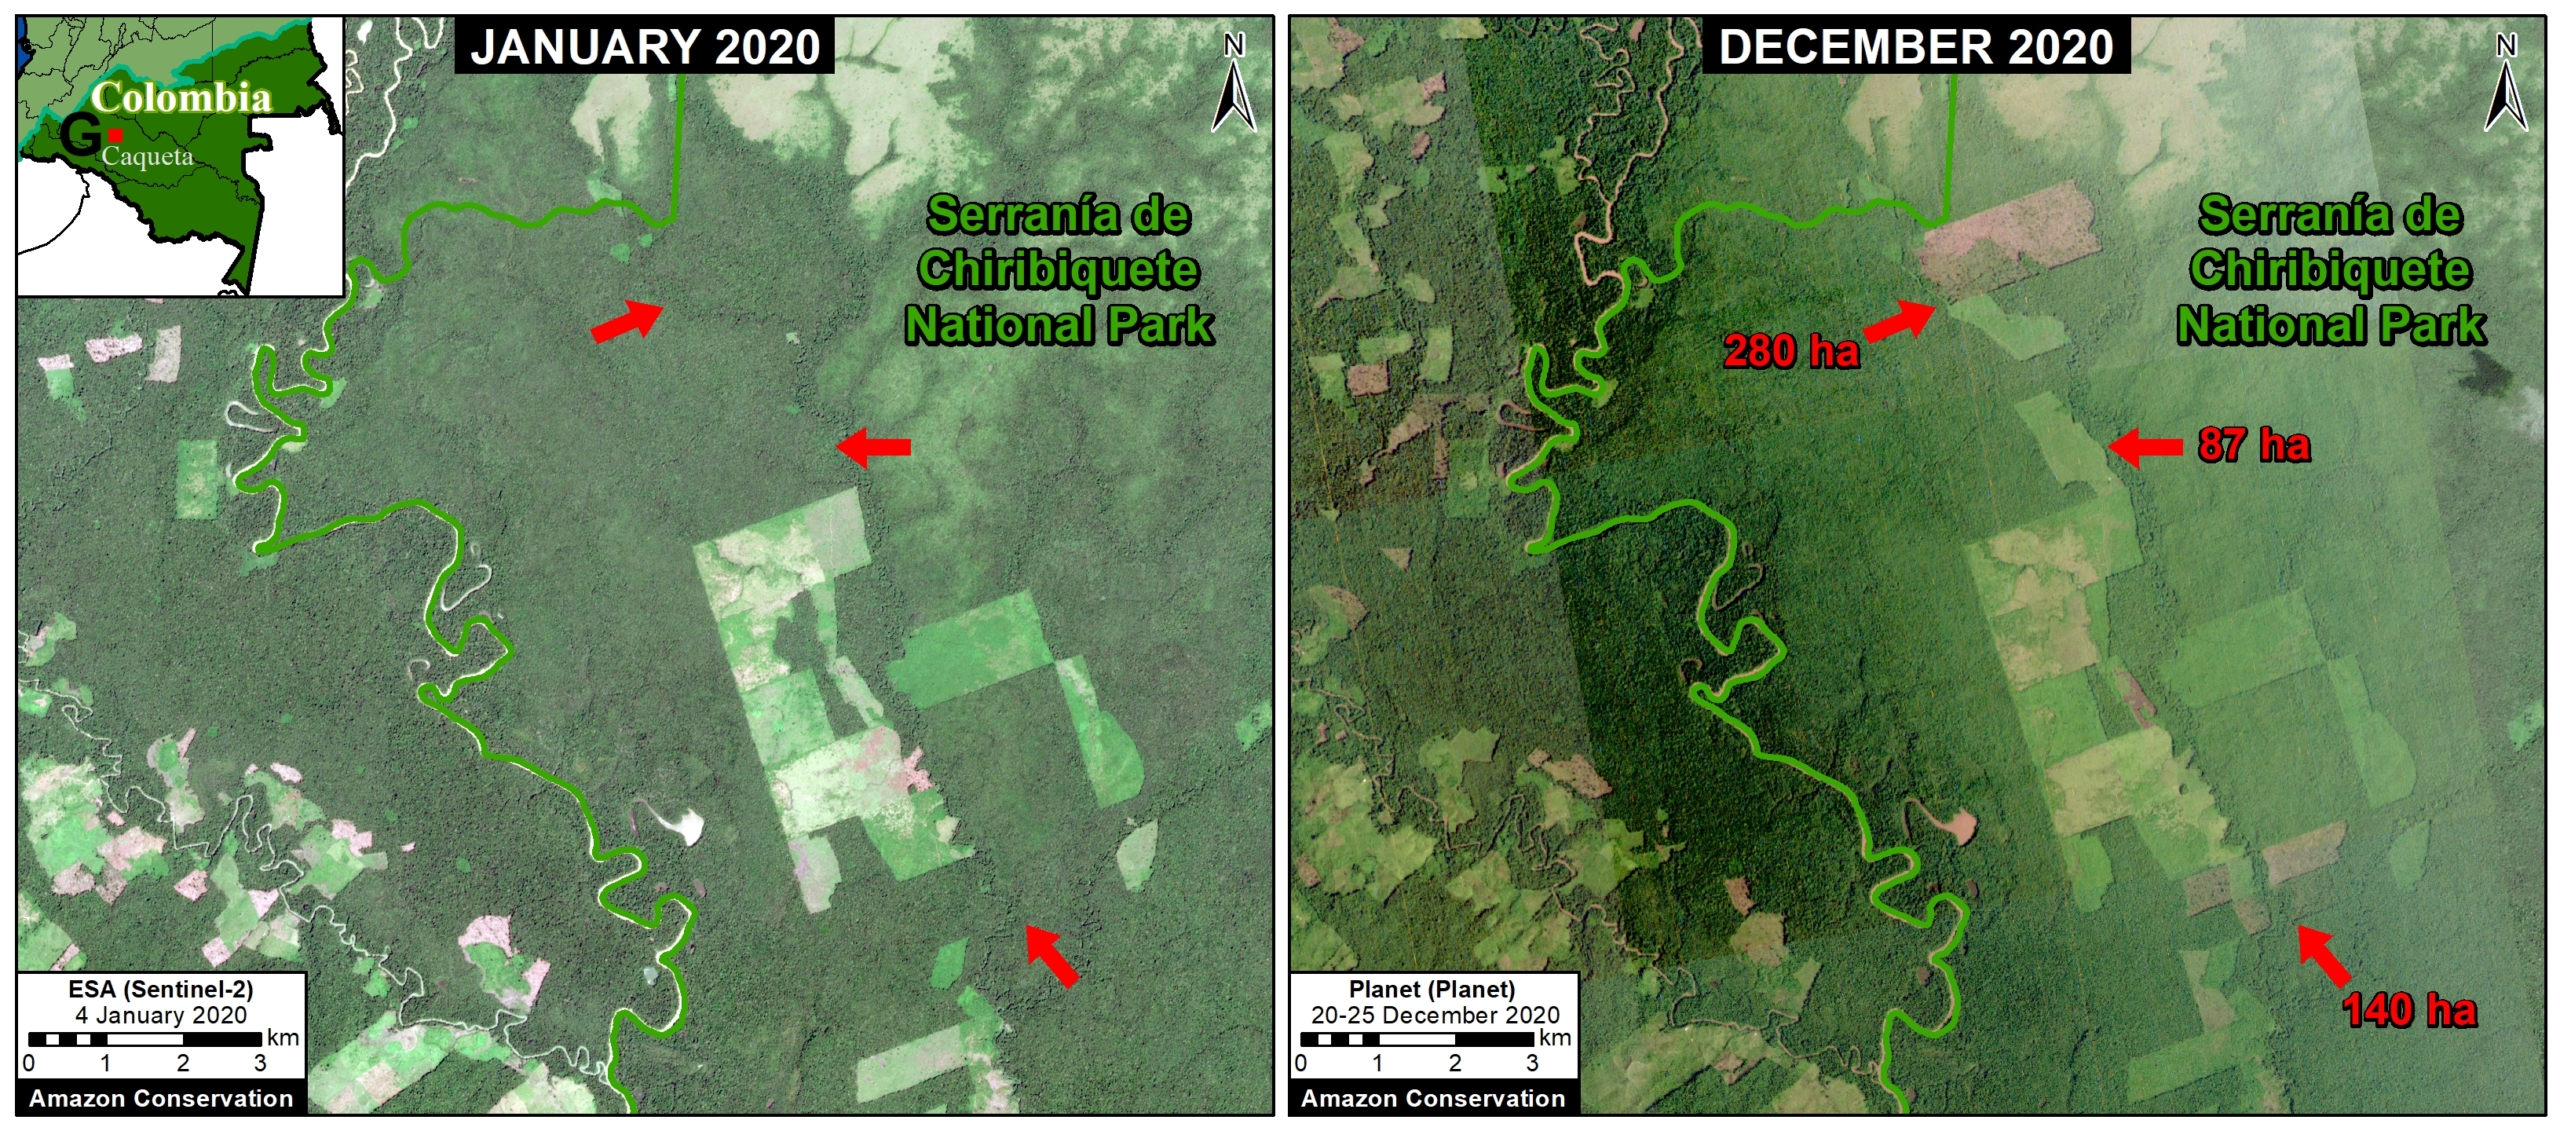
Zoom G. Deforestation in Colombian Amazon of over 500 hectares in Chiribiqete National Park between January (left panel) and December (right panel) 2020. Data: ESA, Planet.

Deforestation in the central Peruvian Amazon

Finally, Zoom H shows expanding deforestation (over 110 hectares), and logging road construction (3.6 km), in an indigenous territory south of Sierra del Divisor National Park in the central Peruvian Amazon (Ucayali region). The deforestation appears to be associated with an expanding small-scale agriculture or cattle pasture frontier.
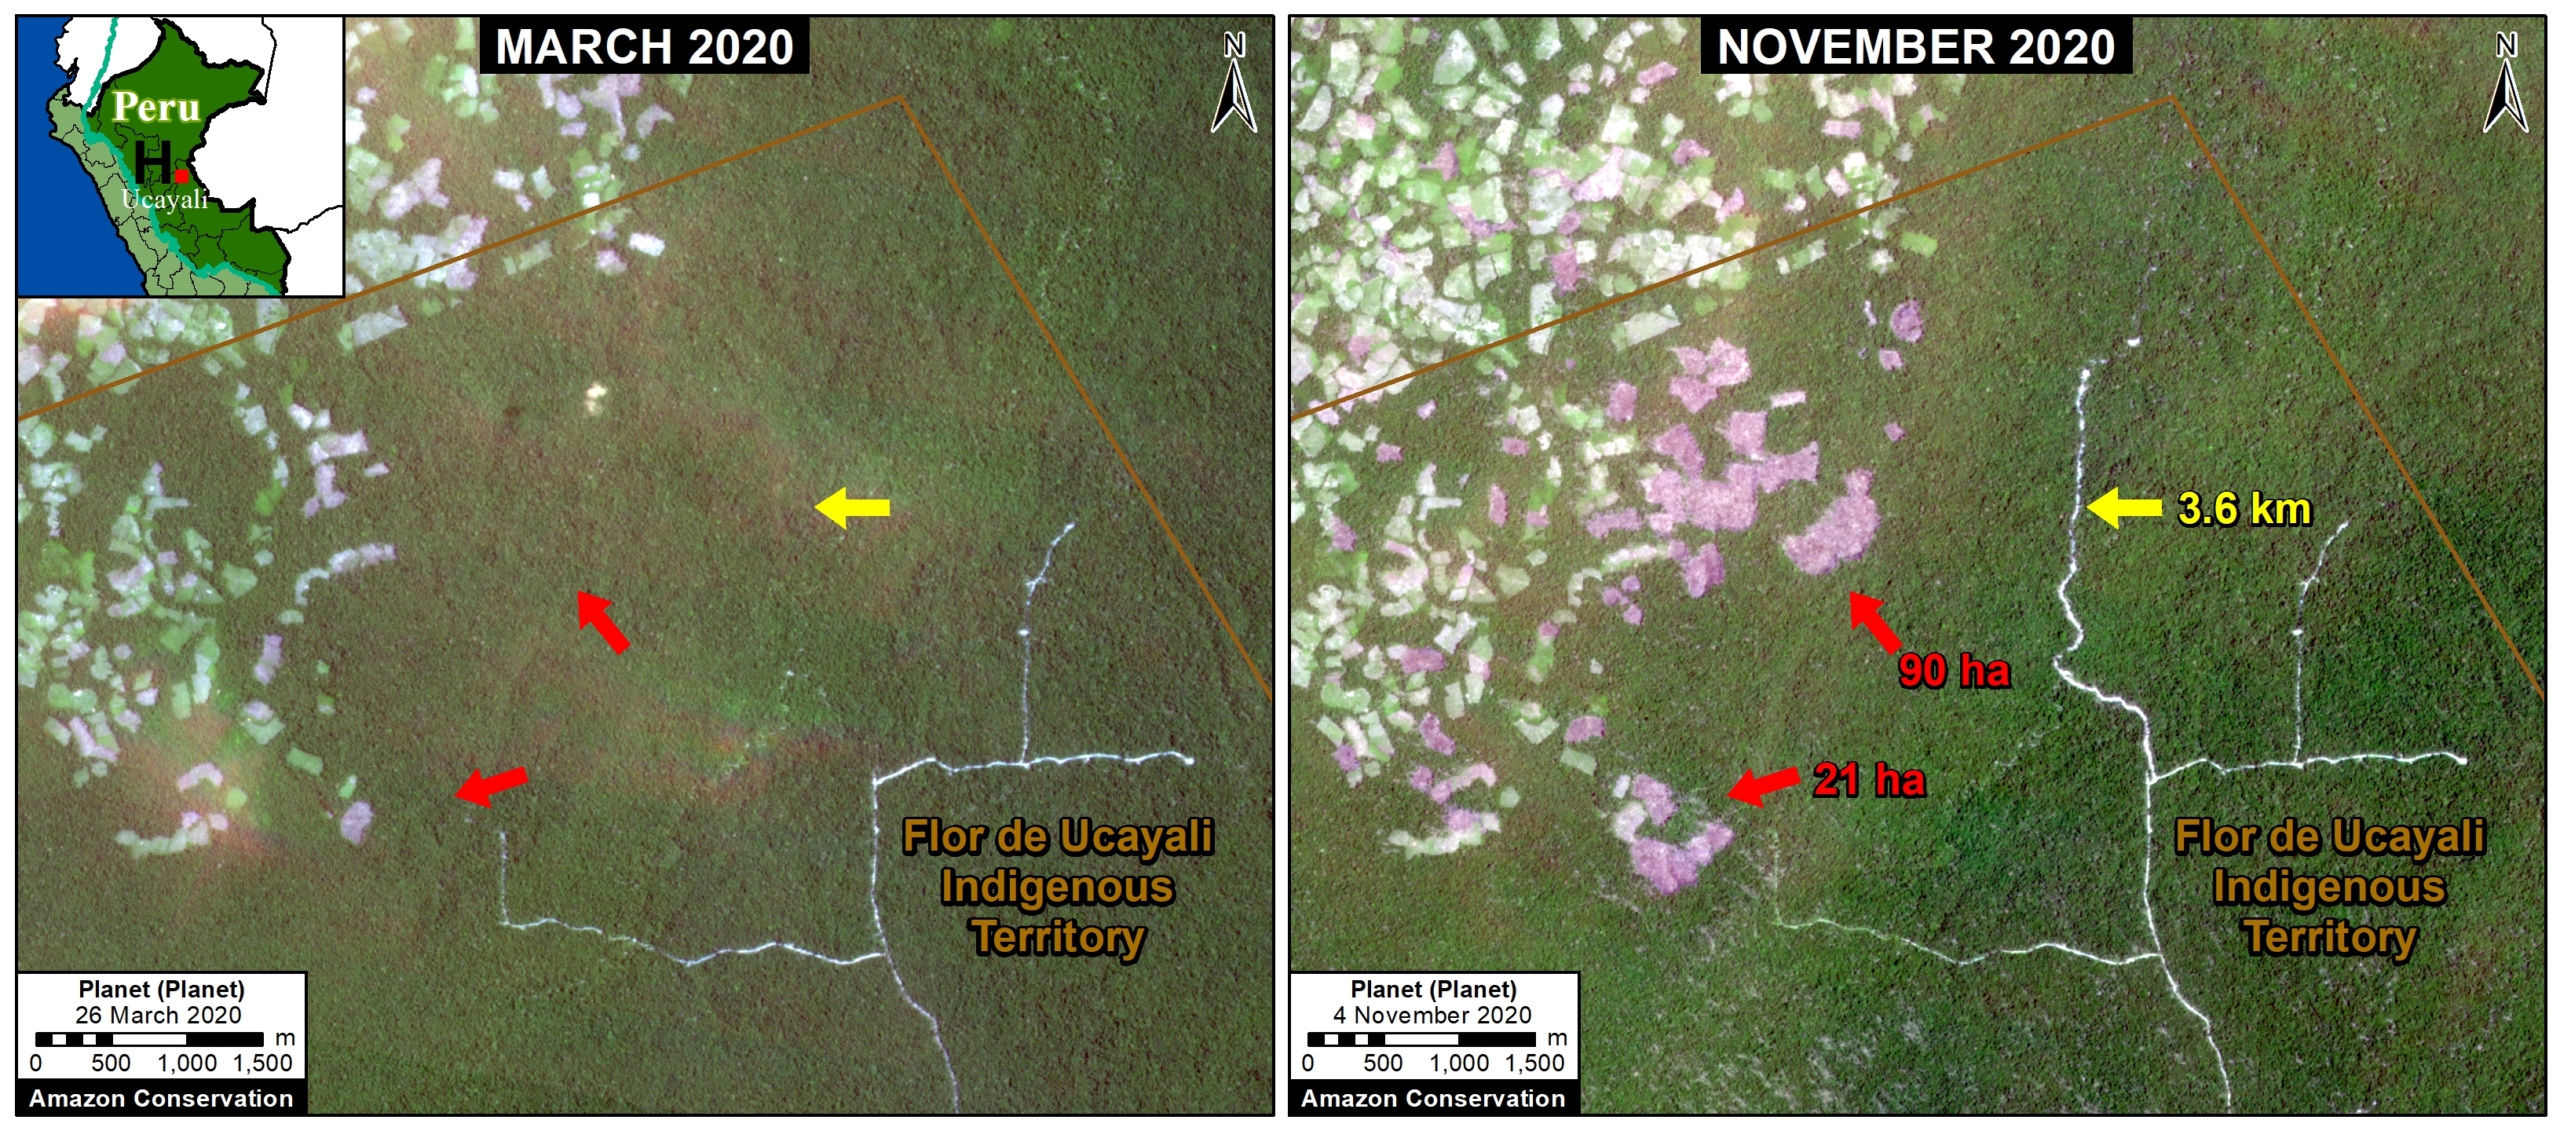
Zoom H. Deforestation and logging road construction in Peruvian Amazon (Ucayali region) between March (left panel) and November (right panel) 2020. Data: Planet.

*Notes and Methodology

The analysis was based on early warning forest loss alerts known as GLAD alerts (30-meter resolution) produced by the University of Maryland and also presented by Global Forest Watch. It is critical to highlight that this data represents a preliminary estimate and more definitive data will come later in the year. For example, our estimate does include some forest loss caused by natural forces. Note that this data detects and classifies burned areas as forest loss. Our estimate includes both confirmed (1,355,671 million hectares) and unconfirmed (751,533 ha) alerts.

Our geographic range is the biogeographic boundary of the Amazon as defined by RAISG (see Base Map above). This range includes nine countries.

We applied a filter to calculate only primary forest loss. For our estimate of primary forest loss, we intersected the forest cover loss data with the additional dataset “primary humid tropical forests” as of 2001 (Turubanova et al 2018). For more details on this part of the methodology, see the Technical Blog from Global Forest Watch (Goldman and Weisse 2019).

To identify the deforestation hotspots, we conducted a kernel density estimate. This type of analysis calculates the magnitude per unit area of a particular phenomenon, in this case forest cover loss. We conducted this analysis using the Kernel Density tool from Spatial Analyst Tool Box of ArcGIS. We used the following parameters:

Search Radius: 15000 layer units (meters)
Kernel Density Function: Quartic kernel function
Cell Size in the map: 200 x 200 meters (4 hectares)
Everything else was left to the default setting.

For the Base Map, we used the following concentration percentages: Medium: 7-10%; High: 11-20%; Very High: >20%.

Acknowledgements

We thank E. Ortiz (AAF), M.E. Gutierrez (ACCA), and S. Novoa for their helpful comments on this report.

This work was supported by NORAD (Norwegian Agency for Development Cooperation) and ICFC (International Conservation Fund of Canada).

Citation

Finer M, Mamani N (2020) Amazon Deforestation Hotspots 2020. MAAP: 132.
MAAP #131: Power of Free High-resolution Satellite Imagery from Norway Agreement

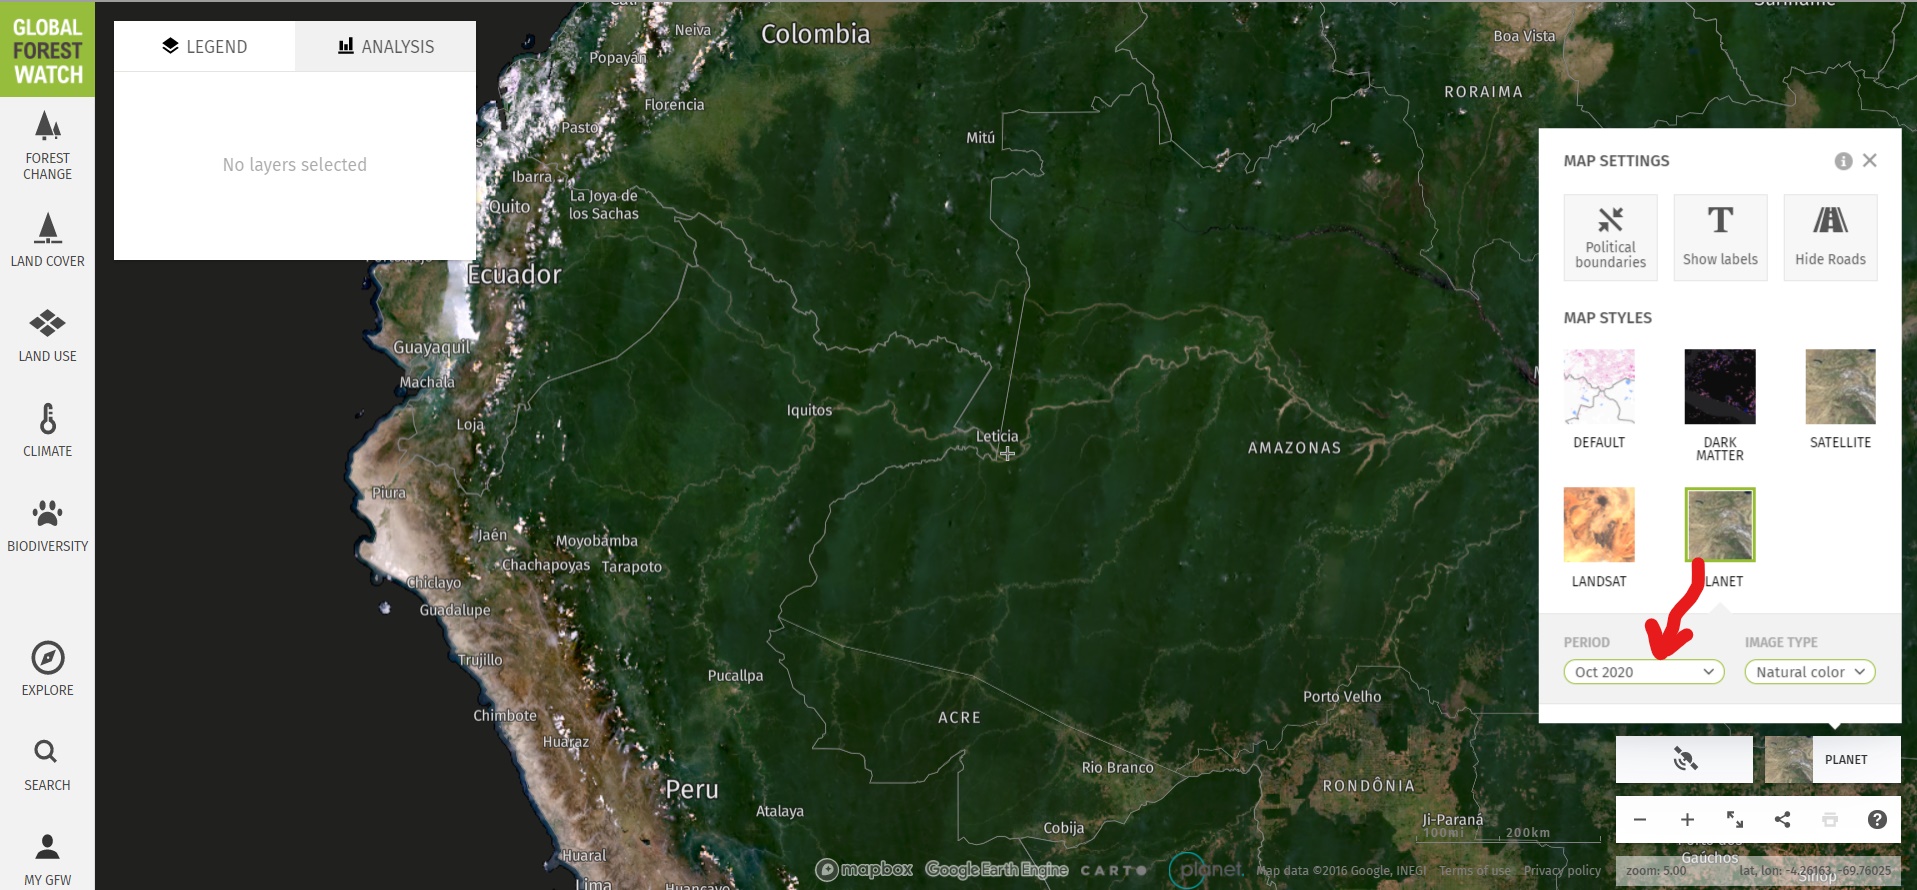
Image 1. Monthly Planet basemap for October 2020 across the Amazon, as seen on Global Forest Watch.

This report demonstrates the powerful application of freely available, high-resolution satellite imagery recently made possible thanks to an agreement between the Government of Norway and several satellite companies.*

This unprecedented agreement will bring commercial satellite technology, previously out of reach to many, to all working in tropical forest conservation around the world.

Here we show how MAAP (an initiative of Amazon Conservation) will use this information to enhance our real-time monitoring program and quickly share timely findings to partners in the field.

Specifically, we highlight the importance of the monthly basemaps (4.7-meter Planet imagery) available under the Norway agreement.* For example, Image 1 shows the stunning, nearly cloud-free October 2020 basemap across the Amazon.

l
Moreover, we show the power of this imagery visualized on Global Forest Watch, where it can be combined with early warning forest loss alerts.
p
Below, we highlight three examples where we combined this data to quickly detect and confirm deforestation in the Colombian, Ecuadorian, and Peruvian Amazon, respectively.

Colombian Amazon

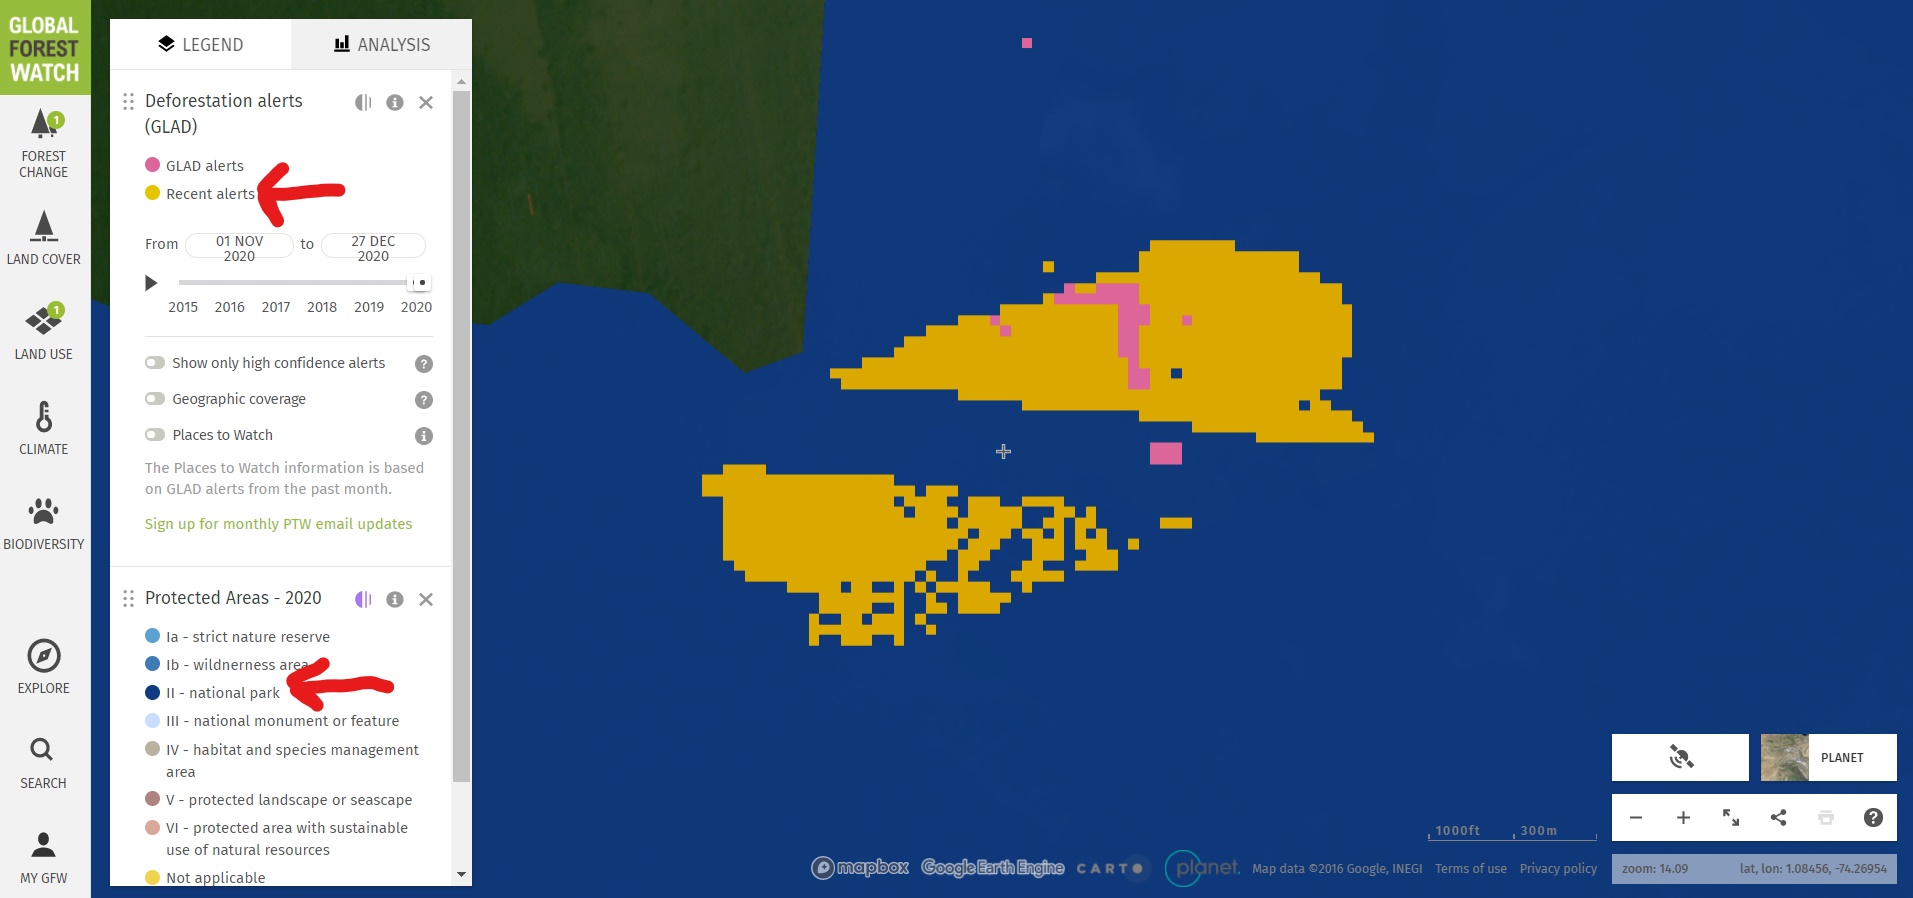
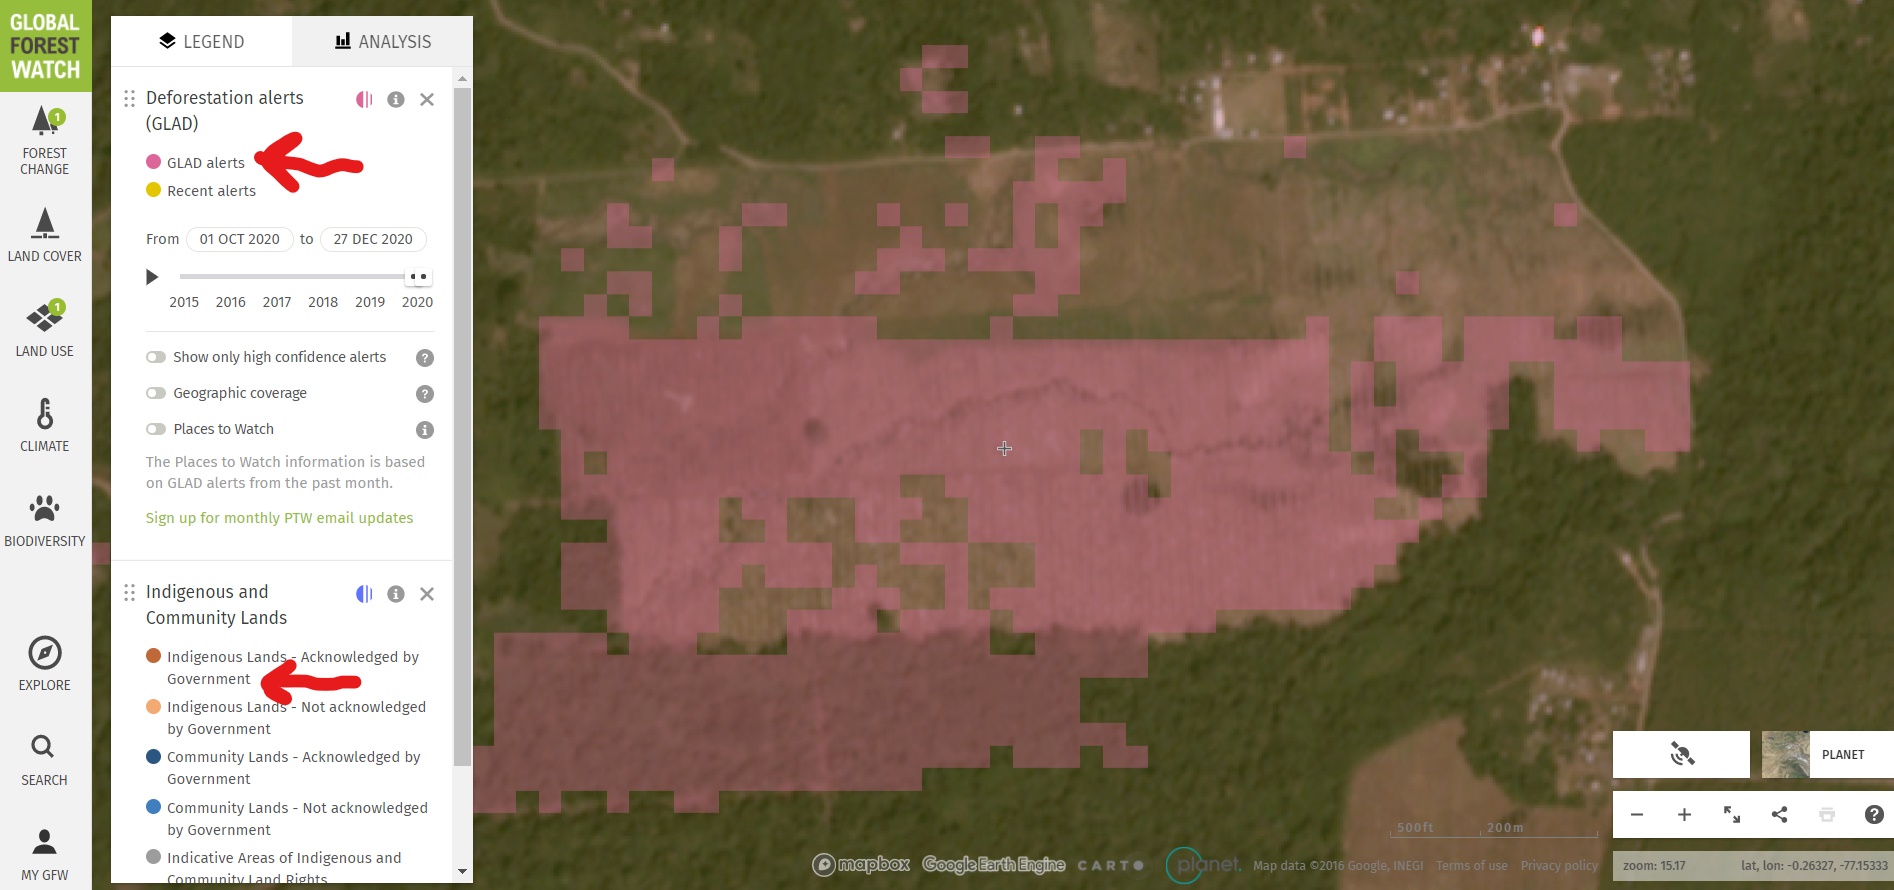
First, we detected recent forest loss alerts (known as GLAD alerts), in the northwestern sector of Chiribiquete National Park. Image 2 is a screen shot of our monitoring search in Global Forest Watch (link here).

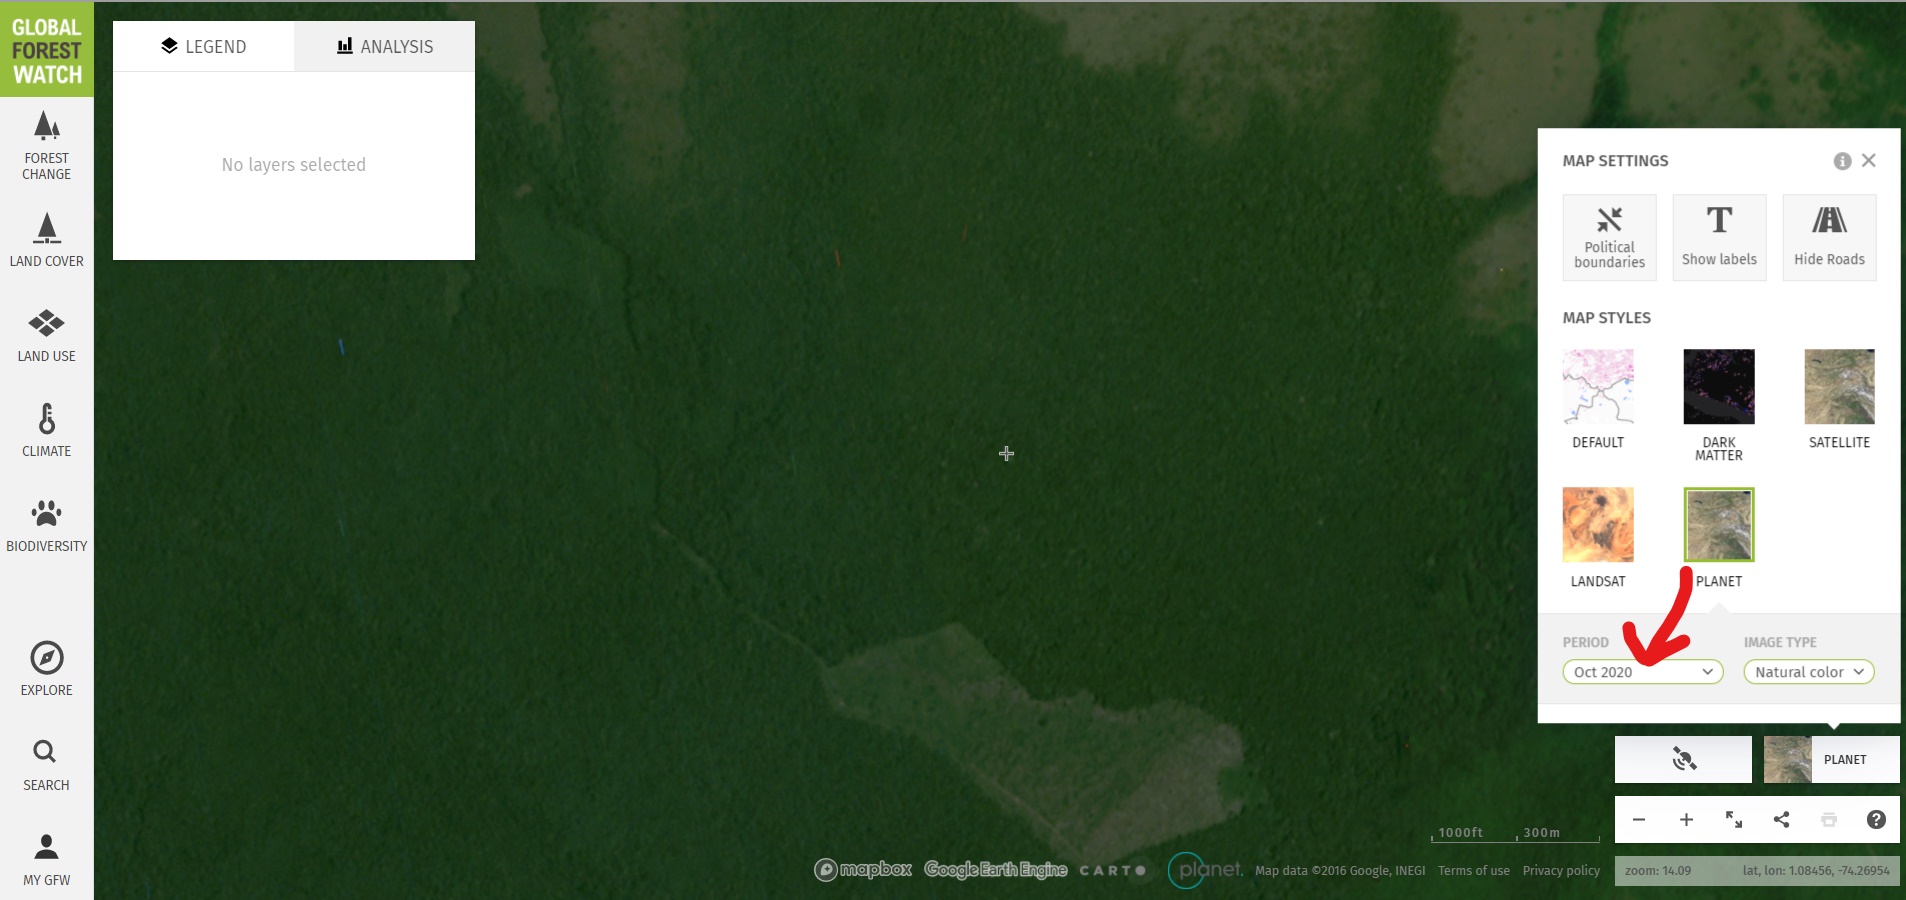
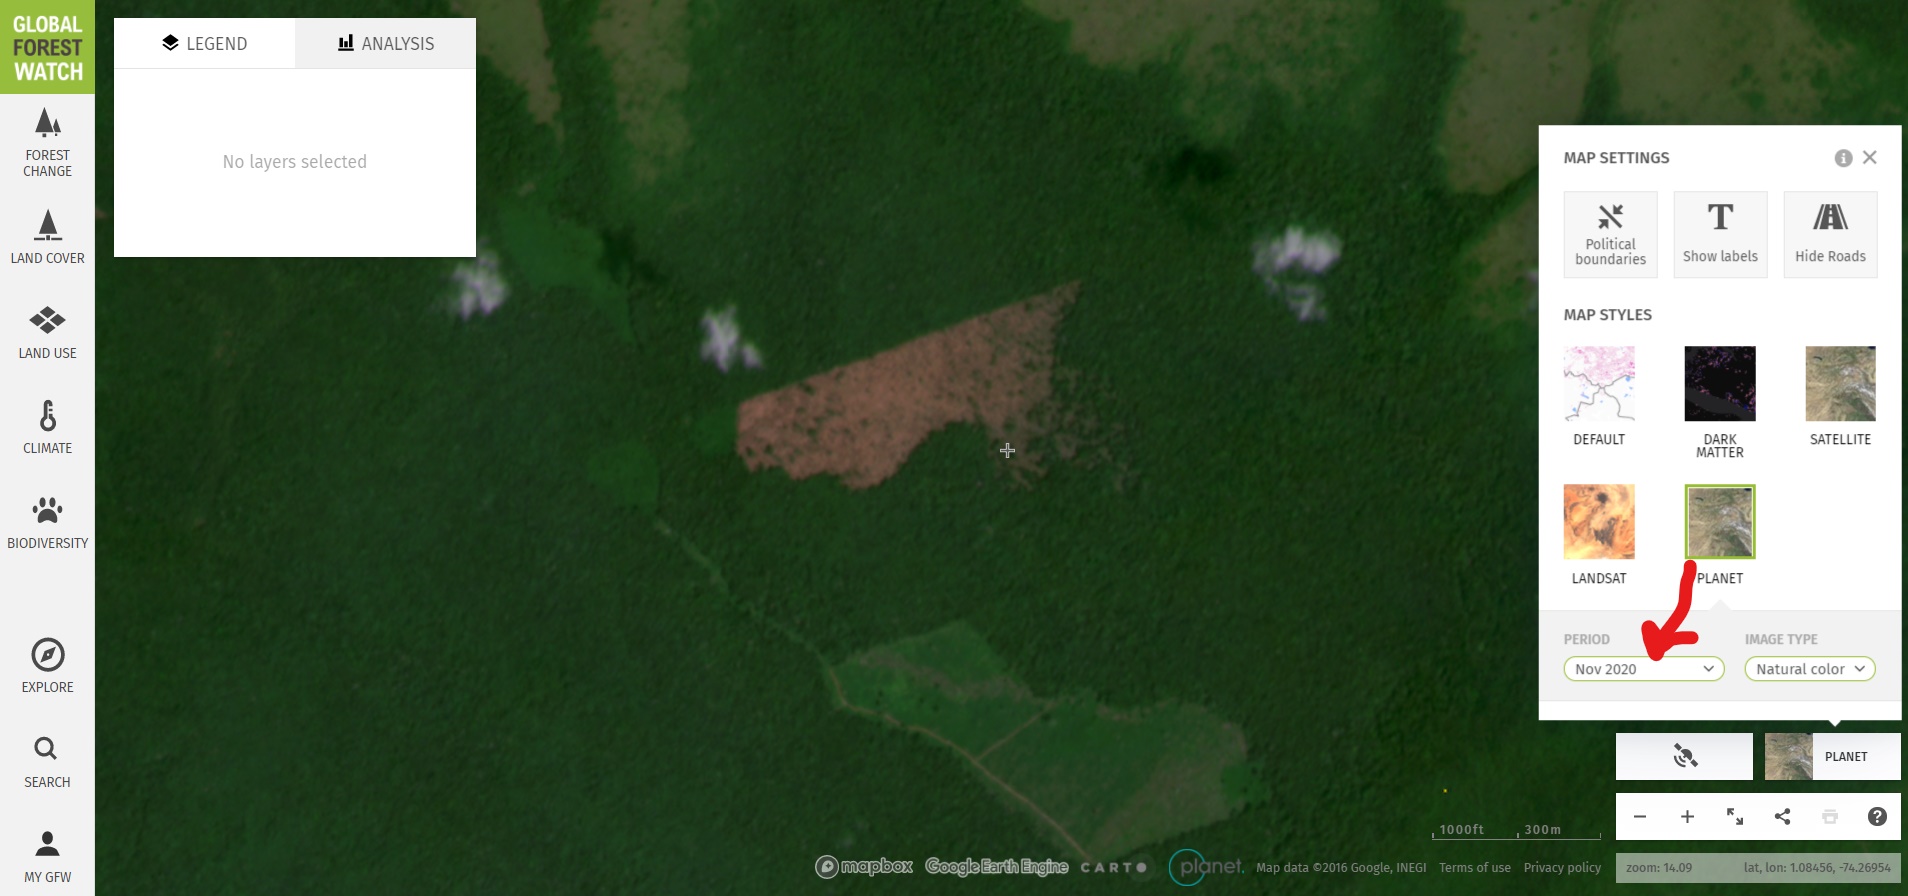
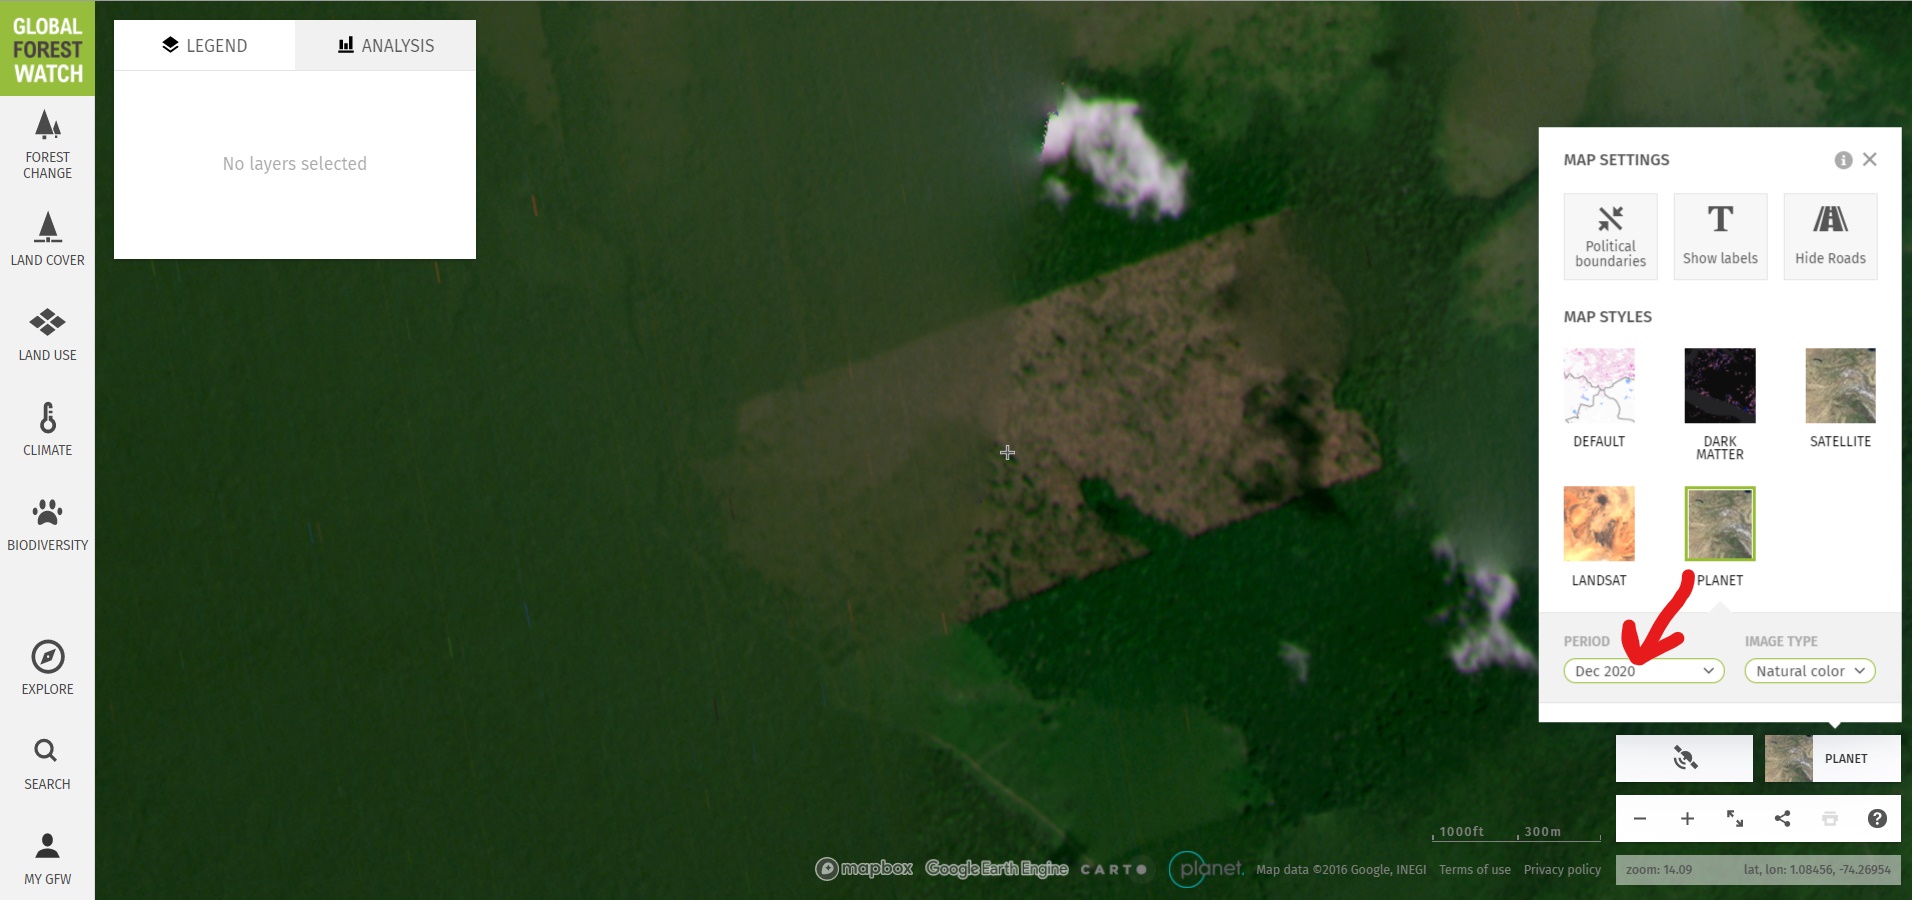
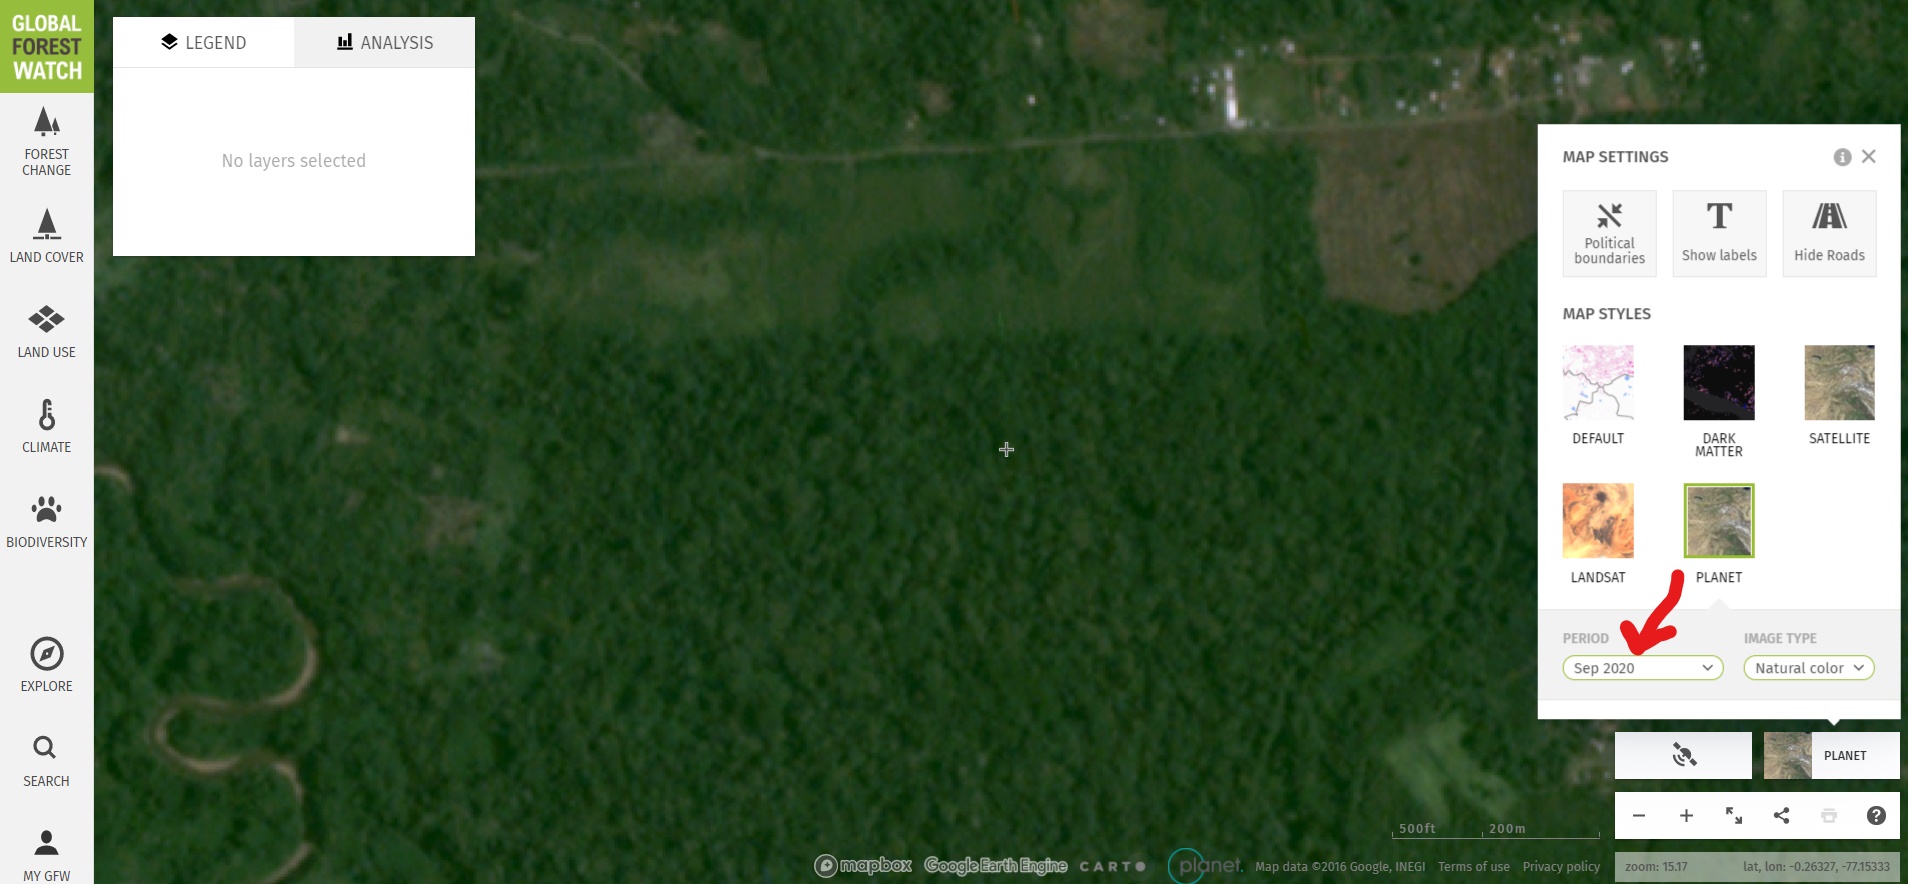
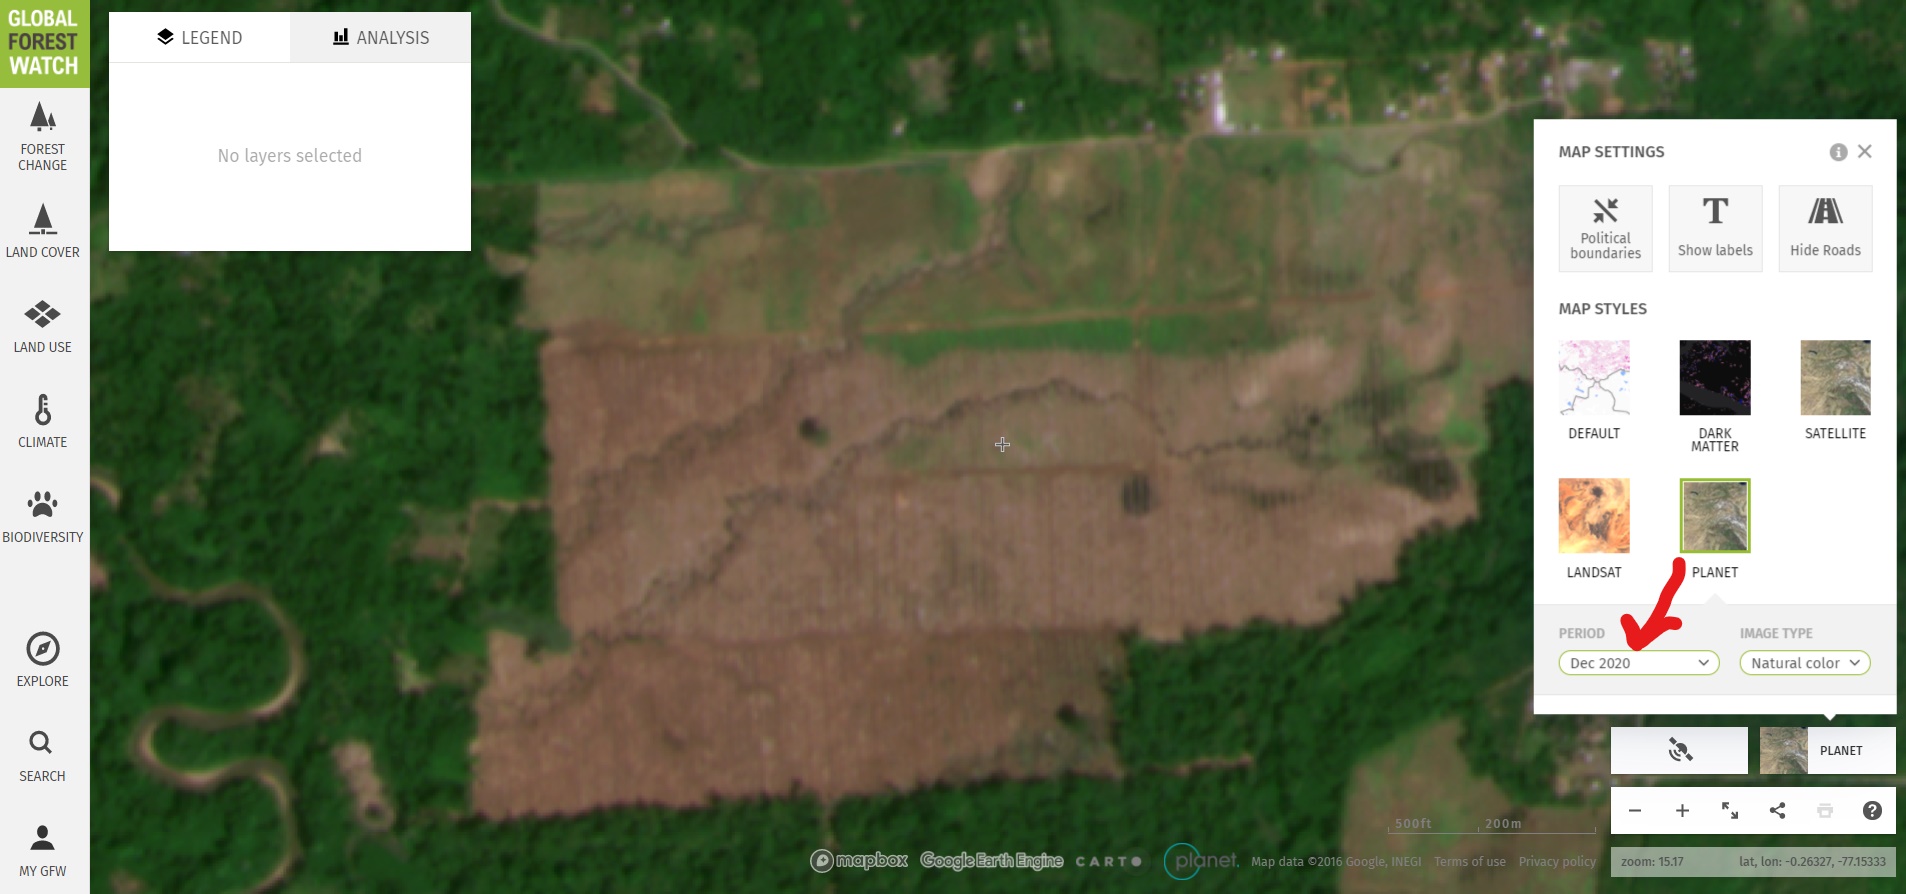
Second, we investigated the alerts with the freely available monthly Planet basemaps. Images 3-5 show the basemaps from October to December 2020. These images confirm that the area was covered in intact (likely primary) Amazon rainforest in October, and then experienced a major deforestation event (225 hectares) in November and December. Similar deforestation in the area appears to be conversion to cattle pasture. Note the crosshairs (+) represent the same point in all four images.

Image 2. Forest loss alerts in Chiribiquete National Park
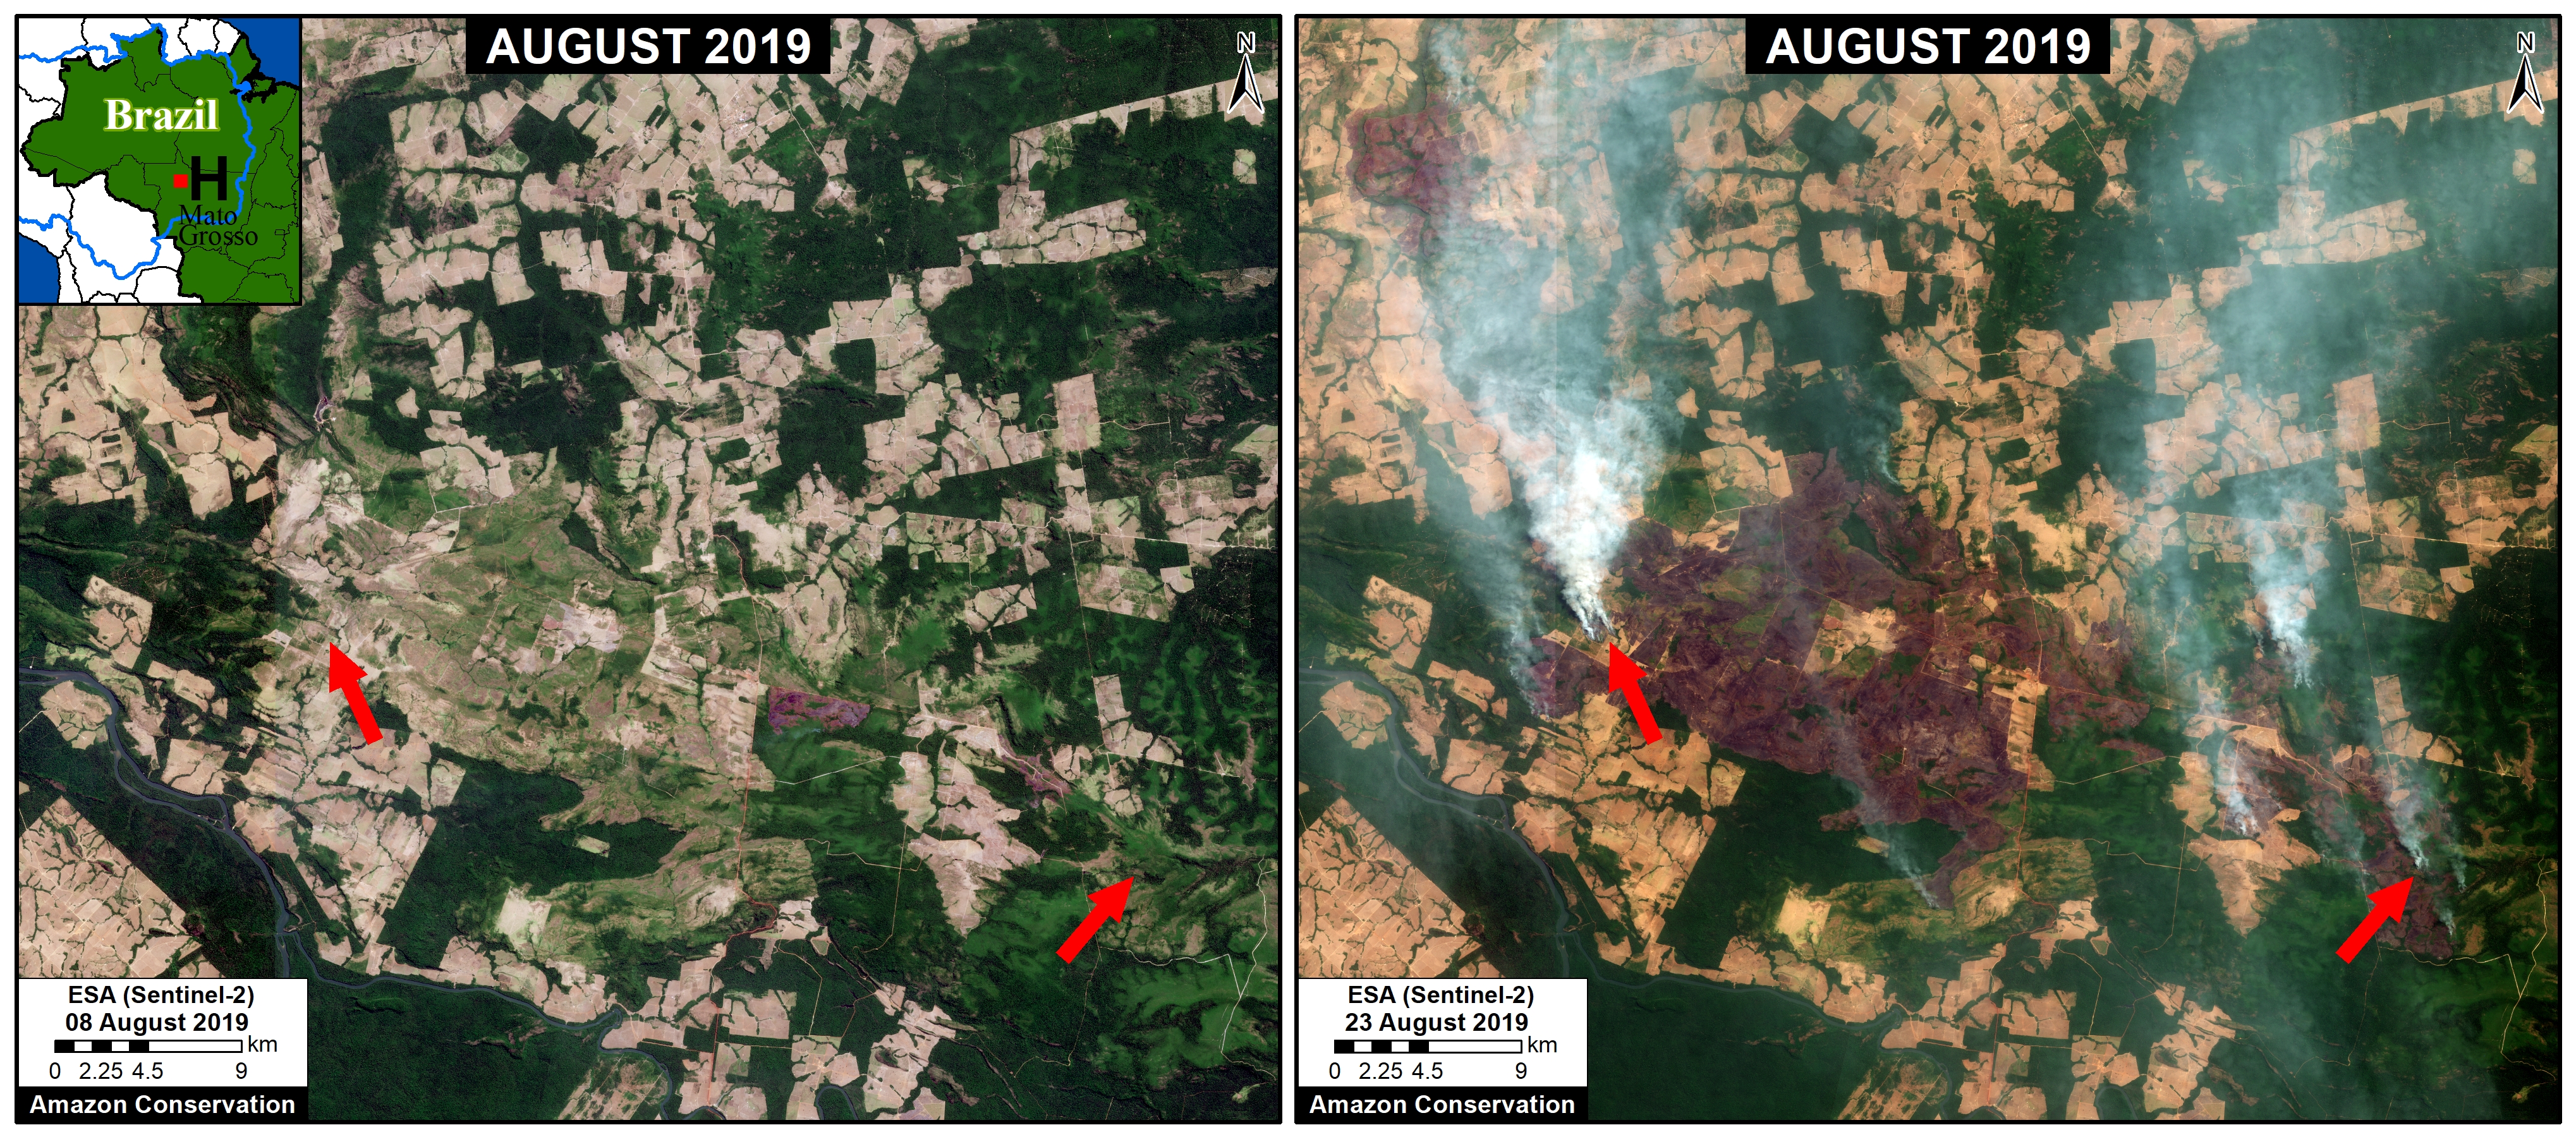
Image 3. Monthly Planet basemap for October 2020 in Chiribiquete National Park.
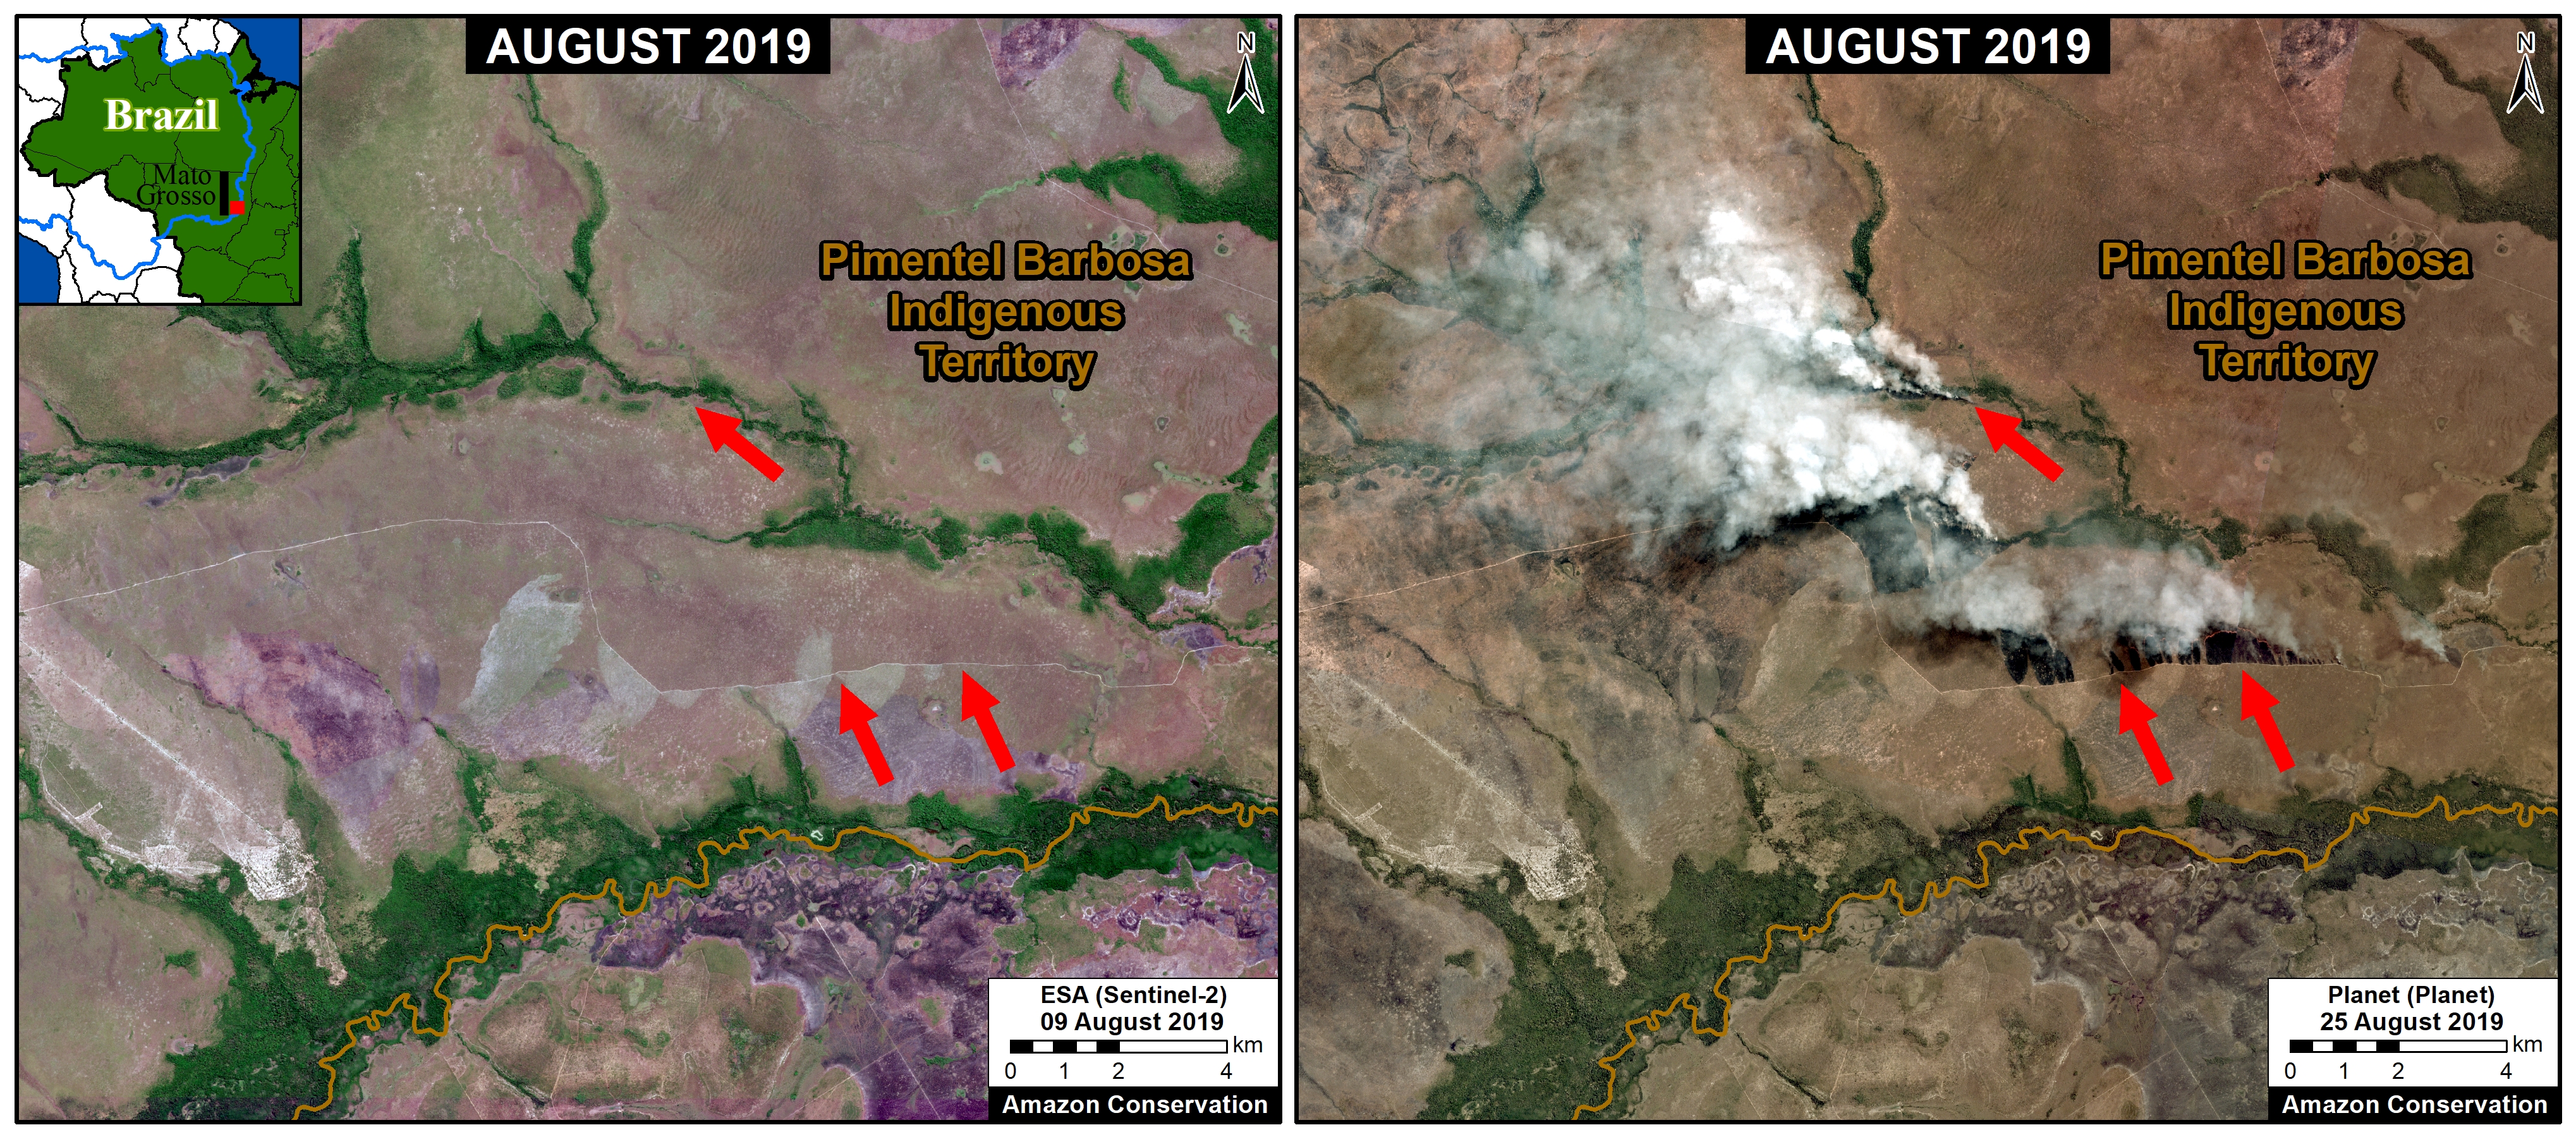
Image 4. Monthly Planet basemap for November 2020 in Chiribiquete National Park.
Image 5. Monthly Planet basemap for December 2020 in Chiribiquete National Park.

Peruvian Amazon

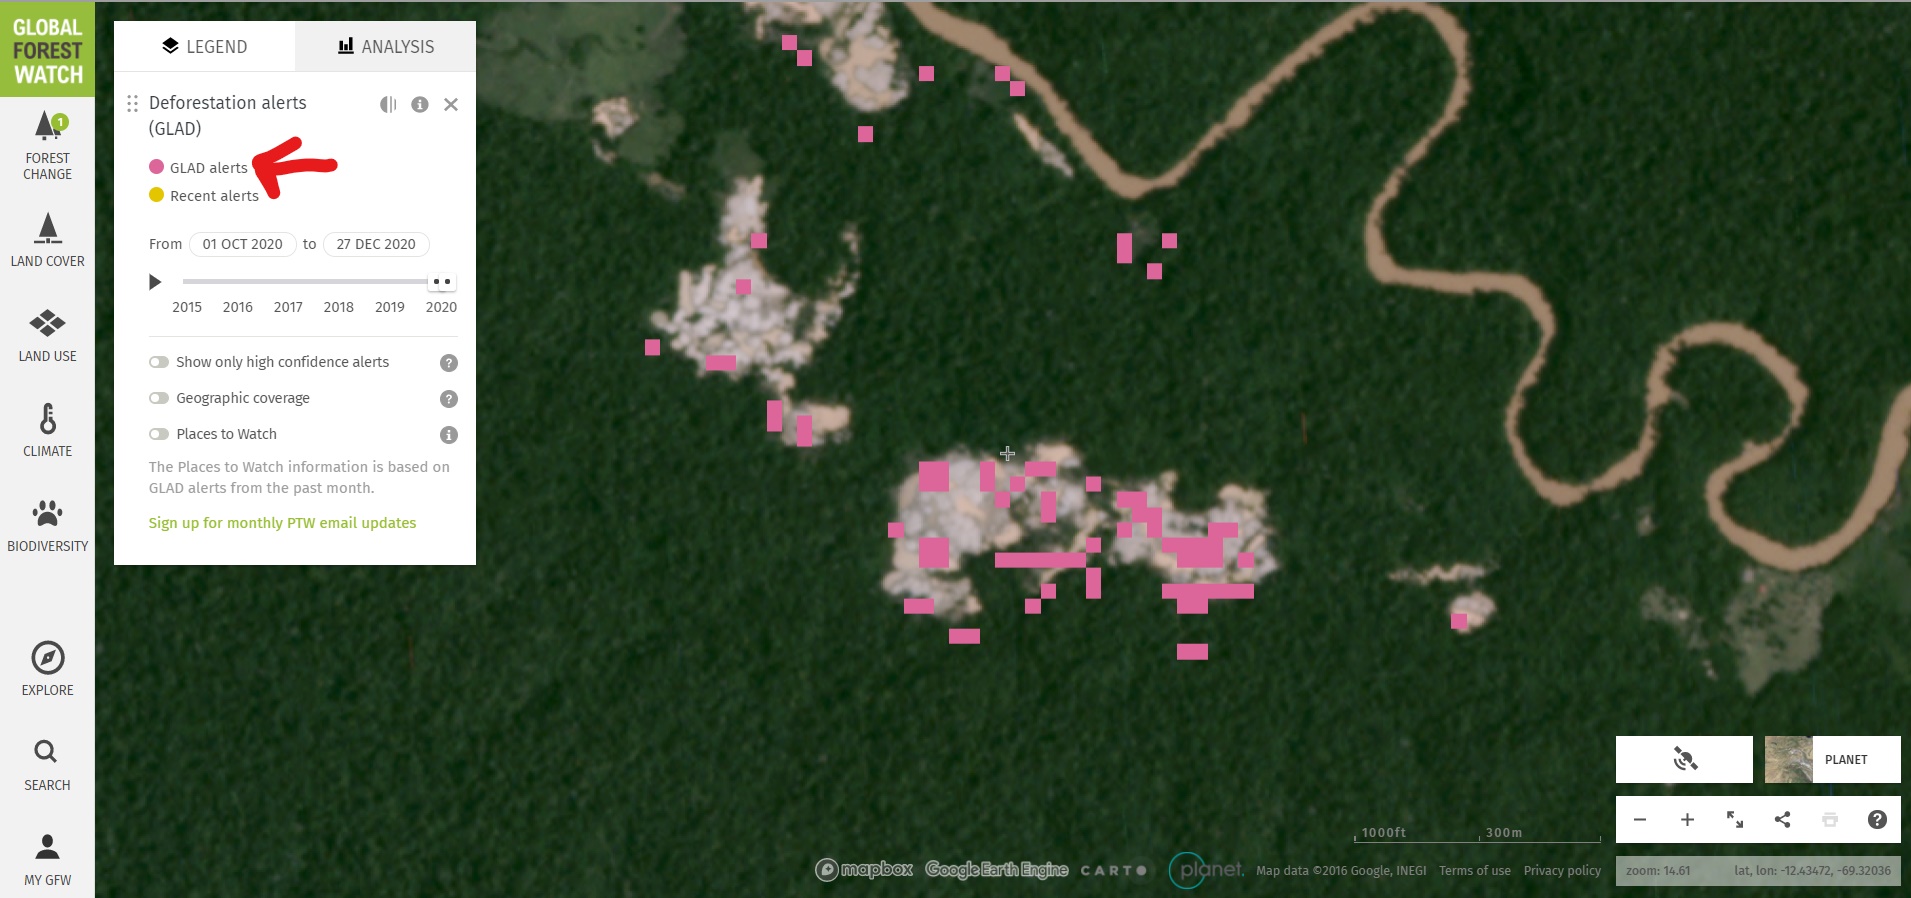
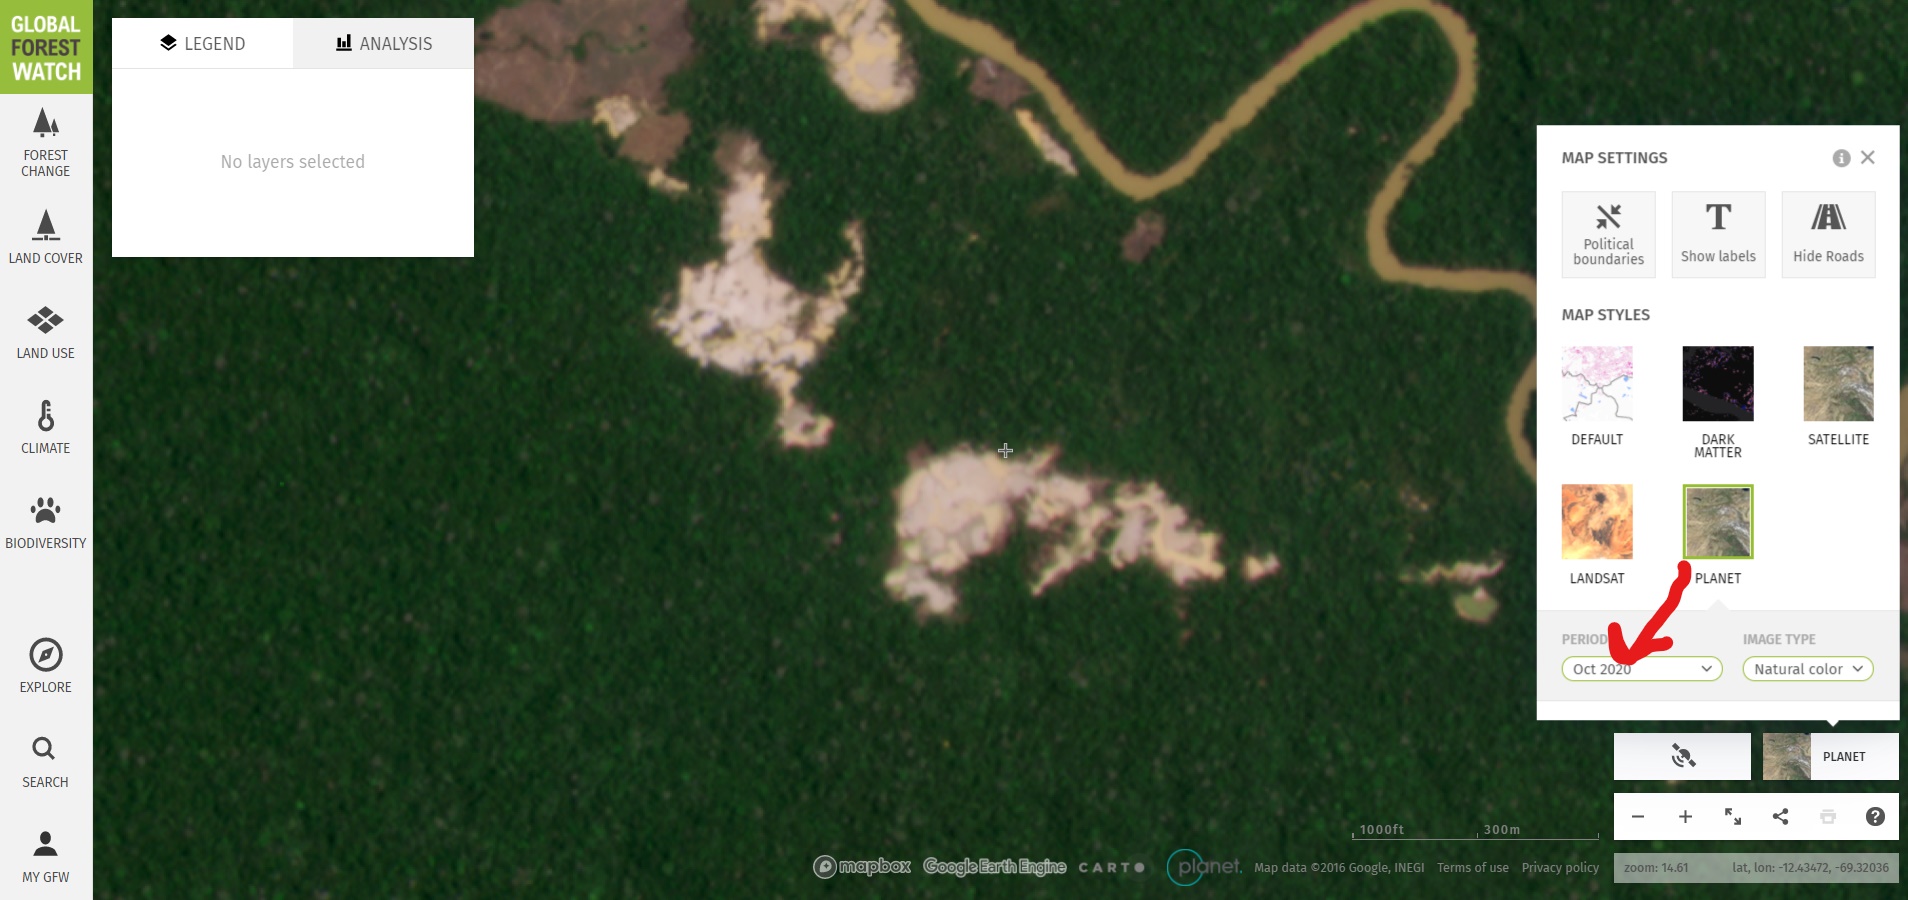
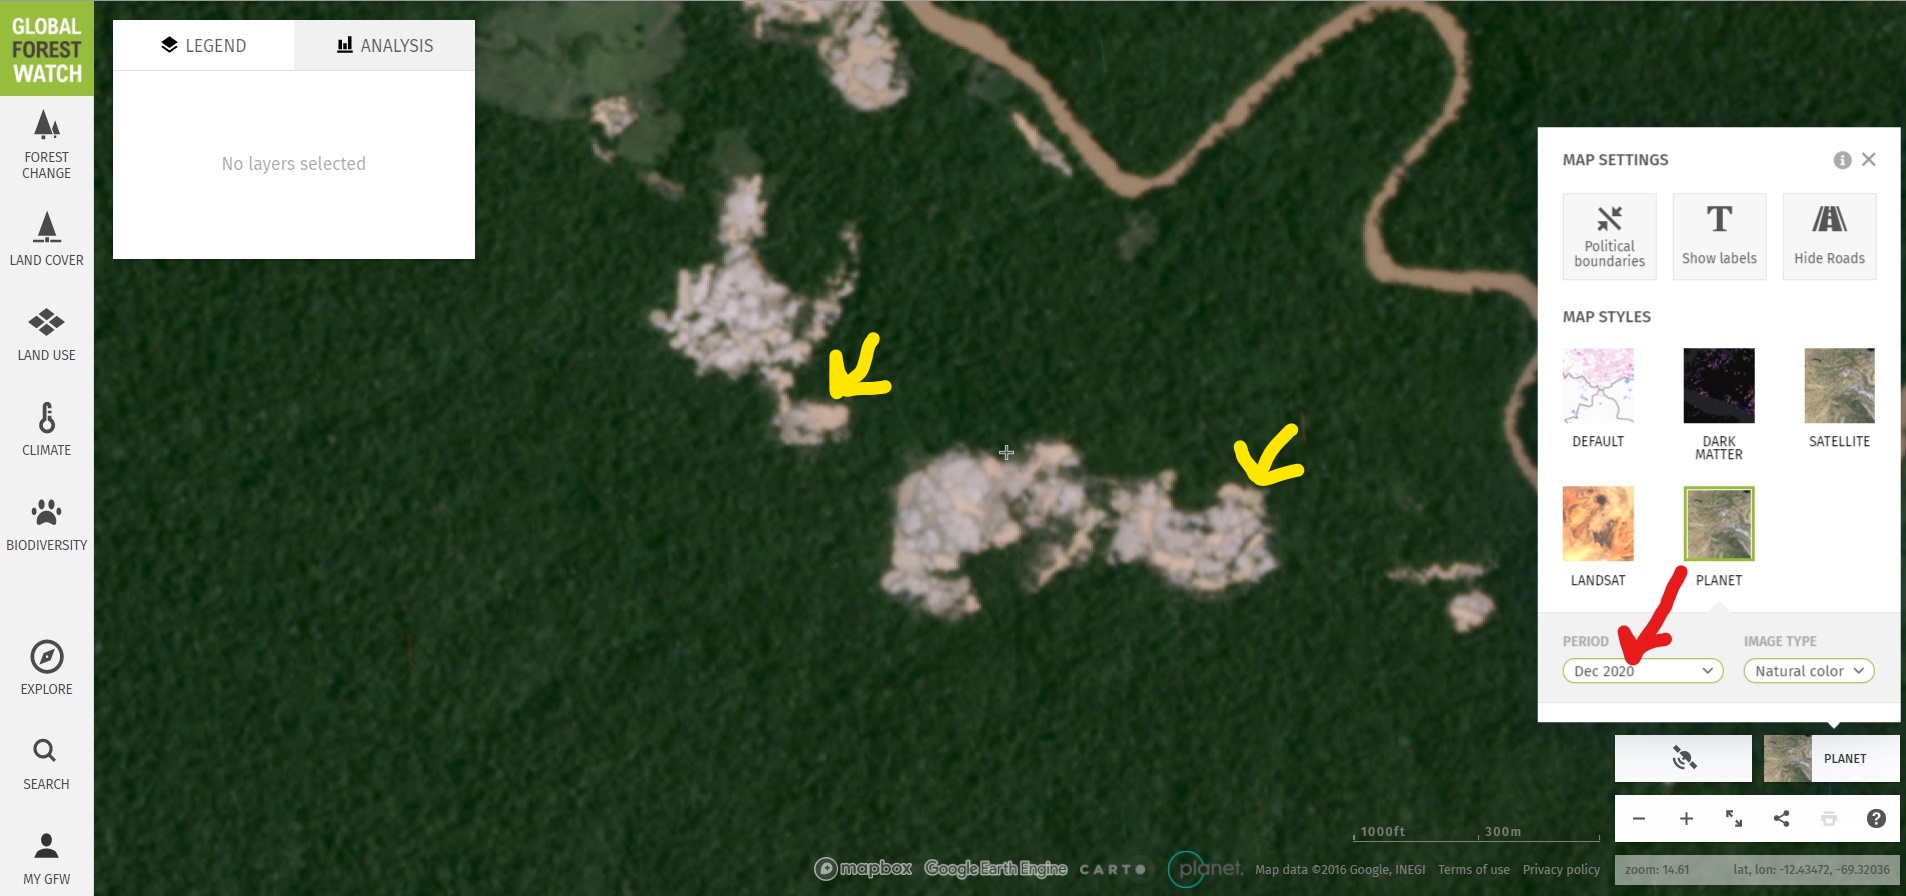
Similarly, we detected recent forest loss alerts in an illegal gold mining area in the southern Peruvian Amazon known as Pariamanu (Image 6). Images 7 & 8 show the monthly basemaps confirming the expansion of illegal mining deforestation between October and December (see yellow arrows). Global Forest Watch link here.

Image 6. Forest loss alerts in illegal gold mining zone (Pariamanu).
Image 7. Monthly Planet basemap for October 2020 in Pariamanu.
Image 8. Monthly Planet basemap for October 2020 in Pariamanu.

Ecuadorian Amazon

Finally, we detected recent forest loss alerts of 100 hectares in an indigenous territory (Kichwa) surrounding an oil palm plantation in the Ecuadorian Amazon (Image 9). Images 10 & 11 show the monthly basemaps confirming large-scale deforestation between September and December, likely for the expansion of the plantation. Note the crosshairs (+) represents the same point in all three images. Global Forest Watch link here.
Image 9. Forest loss alerts in the Ecuadorian Amazon.
Image 10. Monthly Planet basemap for September 2020 in Ecuadorian Amazon.
Image 11. Monthly Planet basemap for December 2020 in Ecuadorian Amazon.

Summary

In summary, we show a major advance for free and real-time deforestation monitoring thanks to an agreement between the Government of Norway and satellite companies.* A key aspect of this agreement is making publically available (such as on Global Forest Watch) monthly basemaps created by the innovative satellite company Planet. Thus, users can now freely visualize recent forest loss alerts and then investigate them with high-resolution monthly basemaps on On Global Forest Watch. MAAP illustrated this process with three examples in the Colombian, Peruvian, Ecuadorian Amazon, respectively.

*Notes 

In September 2020, Norway’s Ministry of Climate and Environment entered into a contract with Kongsberg Satellite Services (KSAT) and its partners Planet and Airbus, to provide universal access to high-resolution satellite monitoring of the tropics in order to support efforts to stop the destruction of the world’s rainforests. This effort is led by Norway’s International Climate and Forest Initiative (NICFI). The basemaps are mosaics of the best cloud-free pixels each month. In addition to viewing the monthly basemaps on Global Forest Watch, users can sign up with Planet directly at this link: https://www.planet.com/nicfi/

Acknowledgements

We thank M. Cohen (ACA), M. Weisse (WRI/GFW), E. Ortiz (AAF) and G. Palacios for their helpful comments on this report.

This work was supported by NORAD (Norwegian Agency for Development Cooperation).

Citation

Finer M, Mamani N (2020) Power of Freely Available, High-resolution Satellite Imagery from Norway Agreement. MAAP: 131.

MAAP #122: Amazon Deforestation 2019

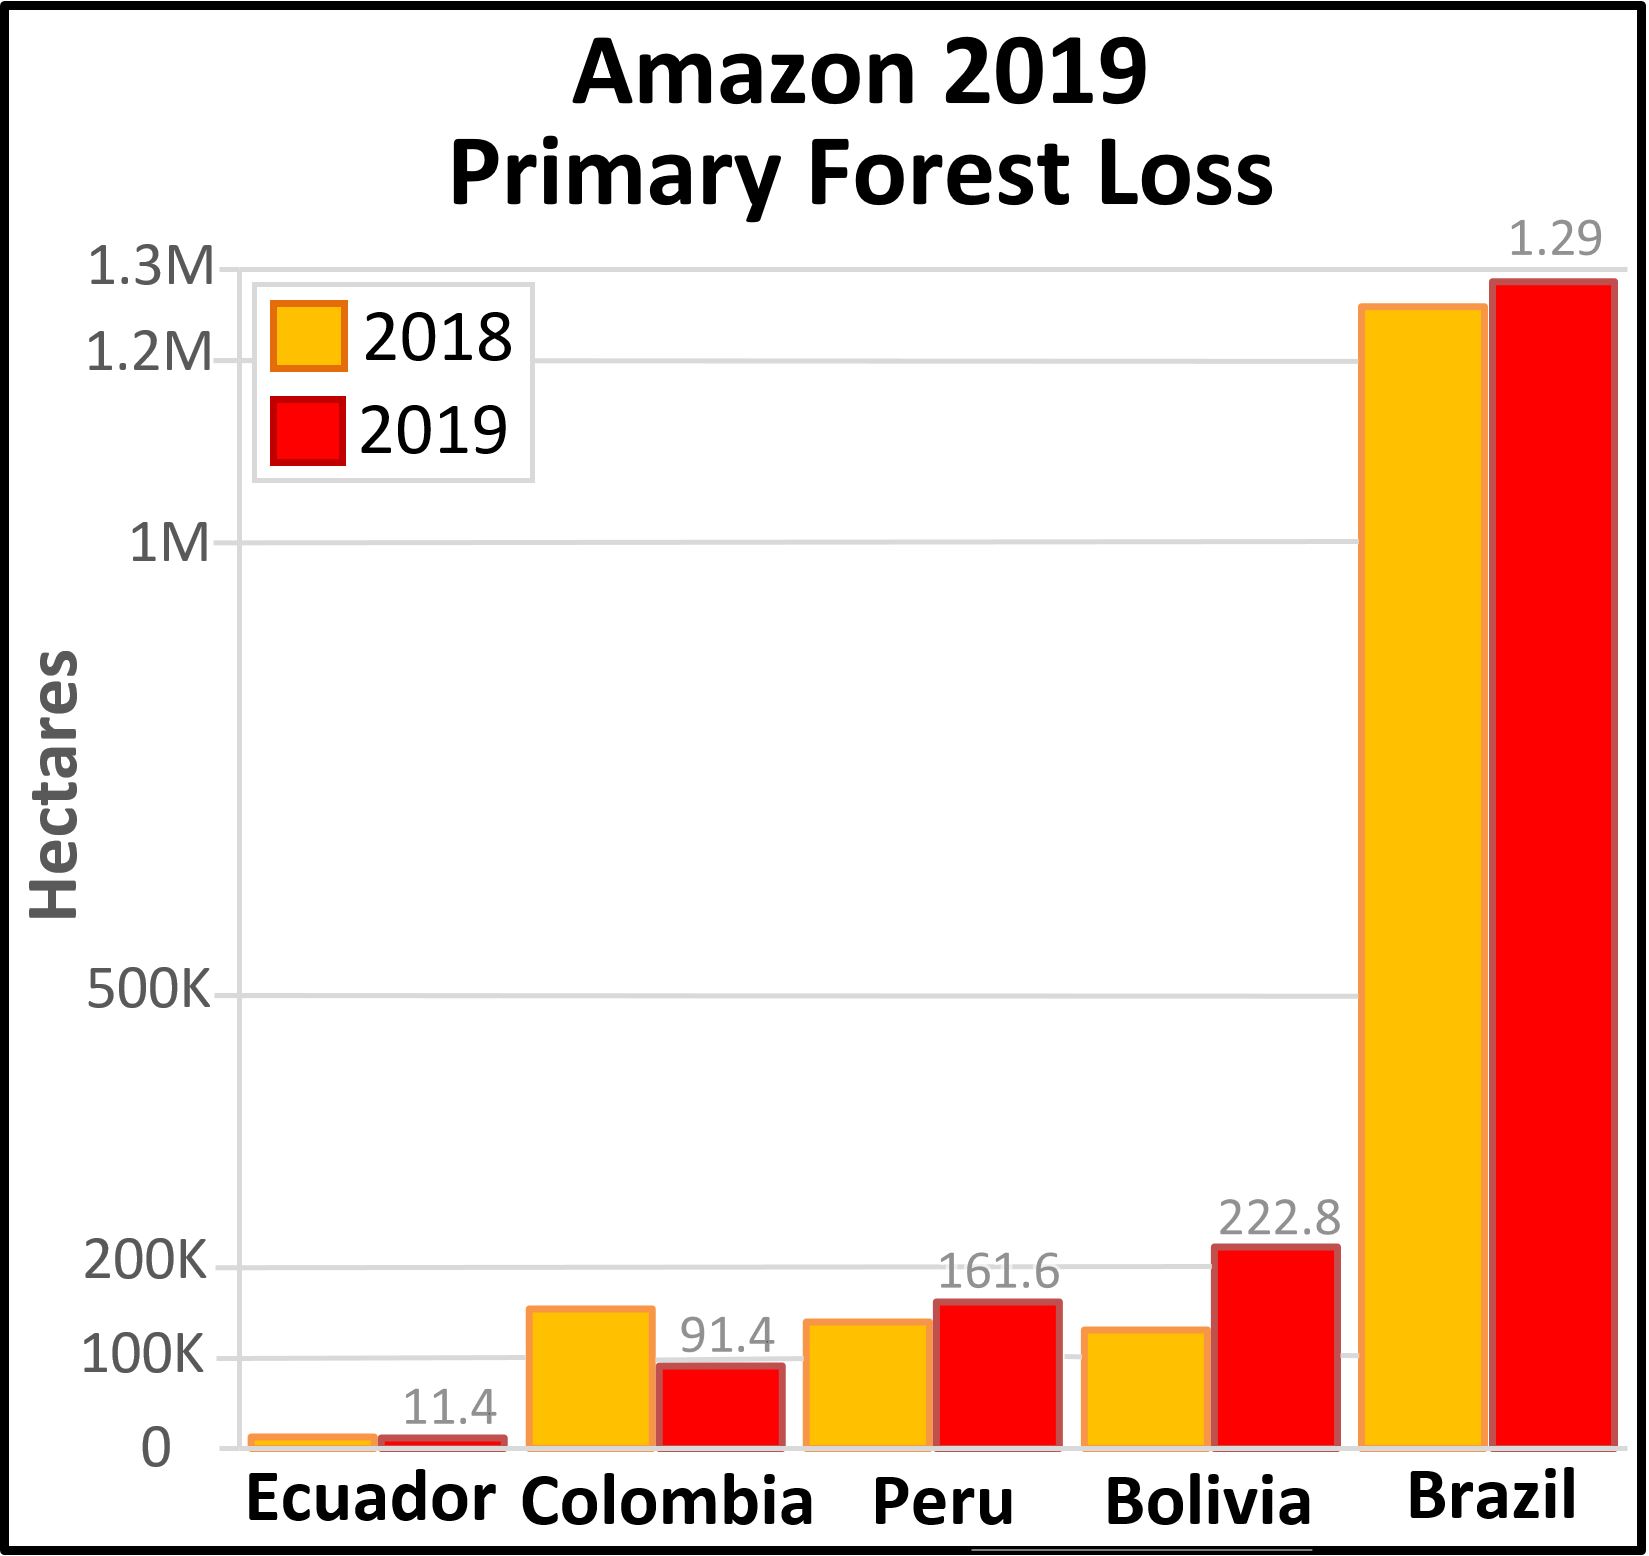
Table 1. Primary forest loss for 2019 (red) compared to 2018 (orange). Data: Hansen/UMD/Google/USGS/NASA, MAAP.

Newly released data for 2019 reveals the loss of over 1.7 million hectares (4.3 million acres) of primary Amazon forest in our 5 country study area (Bolivia, Brazil, Colombia, Ecuador, and Peru).* That is twice the size of Yellowstone National Park.

Table 1 shows 2019 deforestation (red) in relation to 2018 (orange).

Primary forest loss in the Brazilian Amazon (1.29 million hectares) was over 3.5 times higher than the other four countries combined, with a slight increase in 2019 relative to 2018. Many of these areas were cleared in the first half of the year and then burned in August, generating international attention.

Primary forest loss rose sharply in the Bolivian Amazon (222,834 hectares), largely due to uncontrolled fires escaping into the dry forests of the southern Amazon.

Primary forest loss rose slightly in the Peruvian Amazon (161,625 hectares) despite a relatively successful crackdown on illegal gold mining, pointing to small-scale agriculture (and cattle) as the main driver.

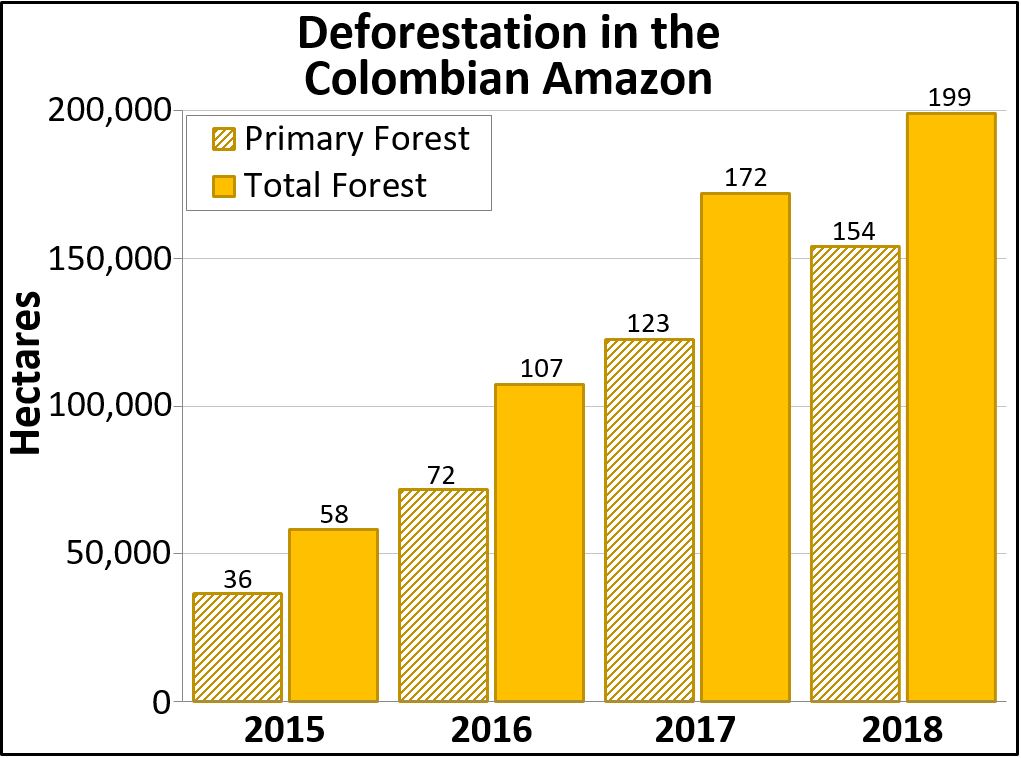
On the positive side, primary forest loss decreased in the Colombian Amazon (91,400 hectares) following a major spike following the 2016 peace accords (between the government and FARC). It is worth noting, however, that we have now documented the loss of 444,000 hectares (over a million acres) of primary forest in the Colombian Amazon in the past four years since the peace agreement (see Annex).

*Two important points about the data. First, we use annual forest loss from the University of Maryland to have a consistent source across all five countries. Second, we applied a filter to only include loss of primary forest (see Methodology).

2019 Deforestation Hotspots Map

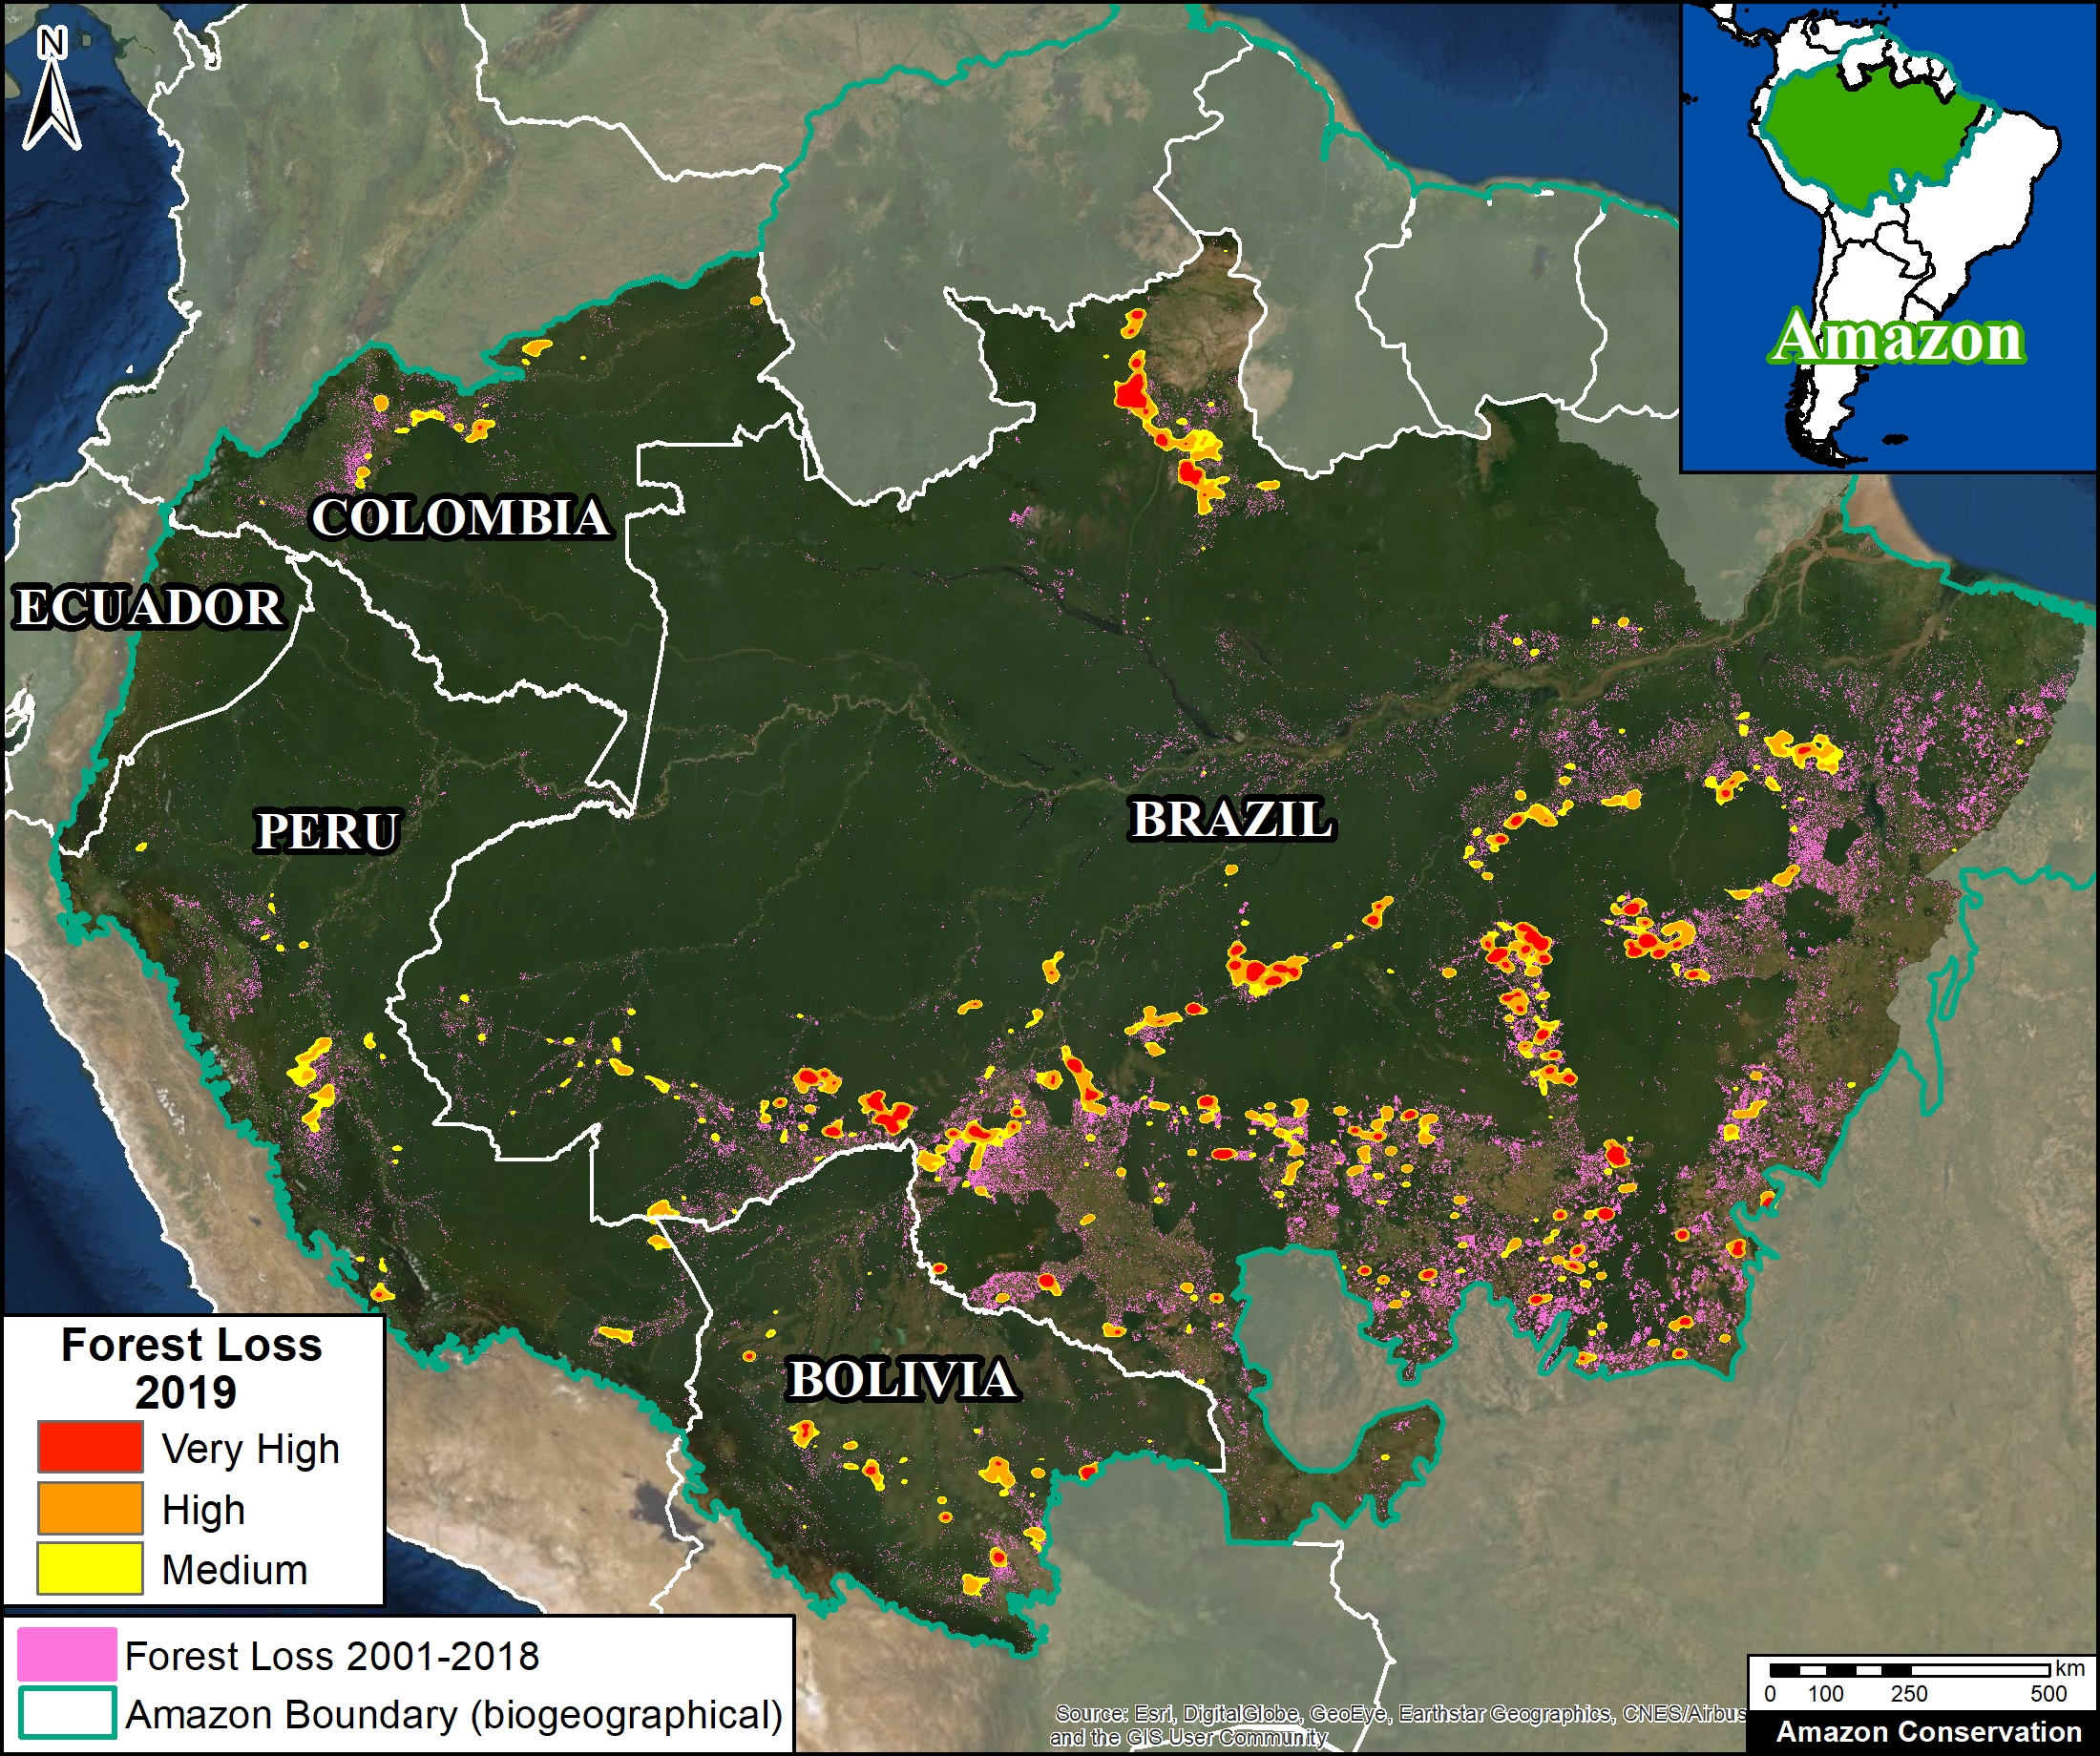
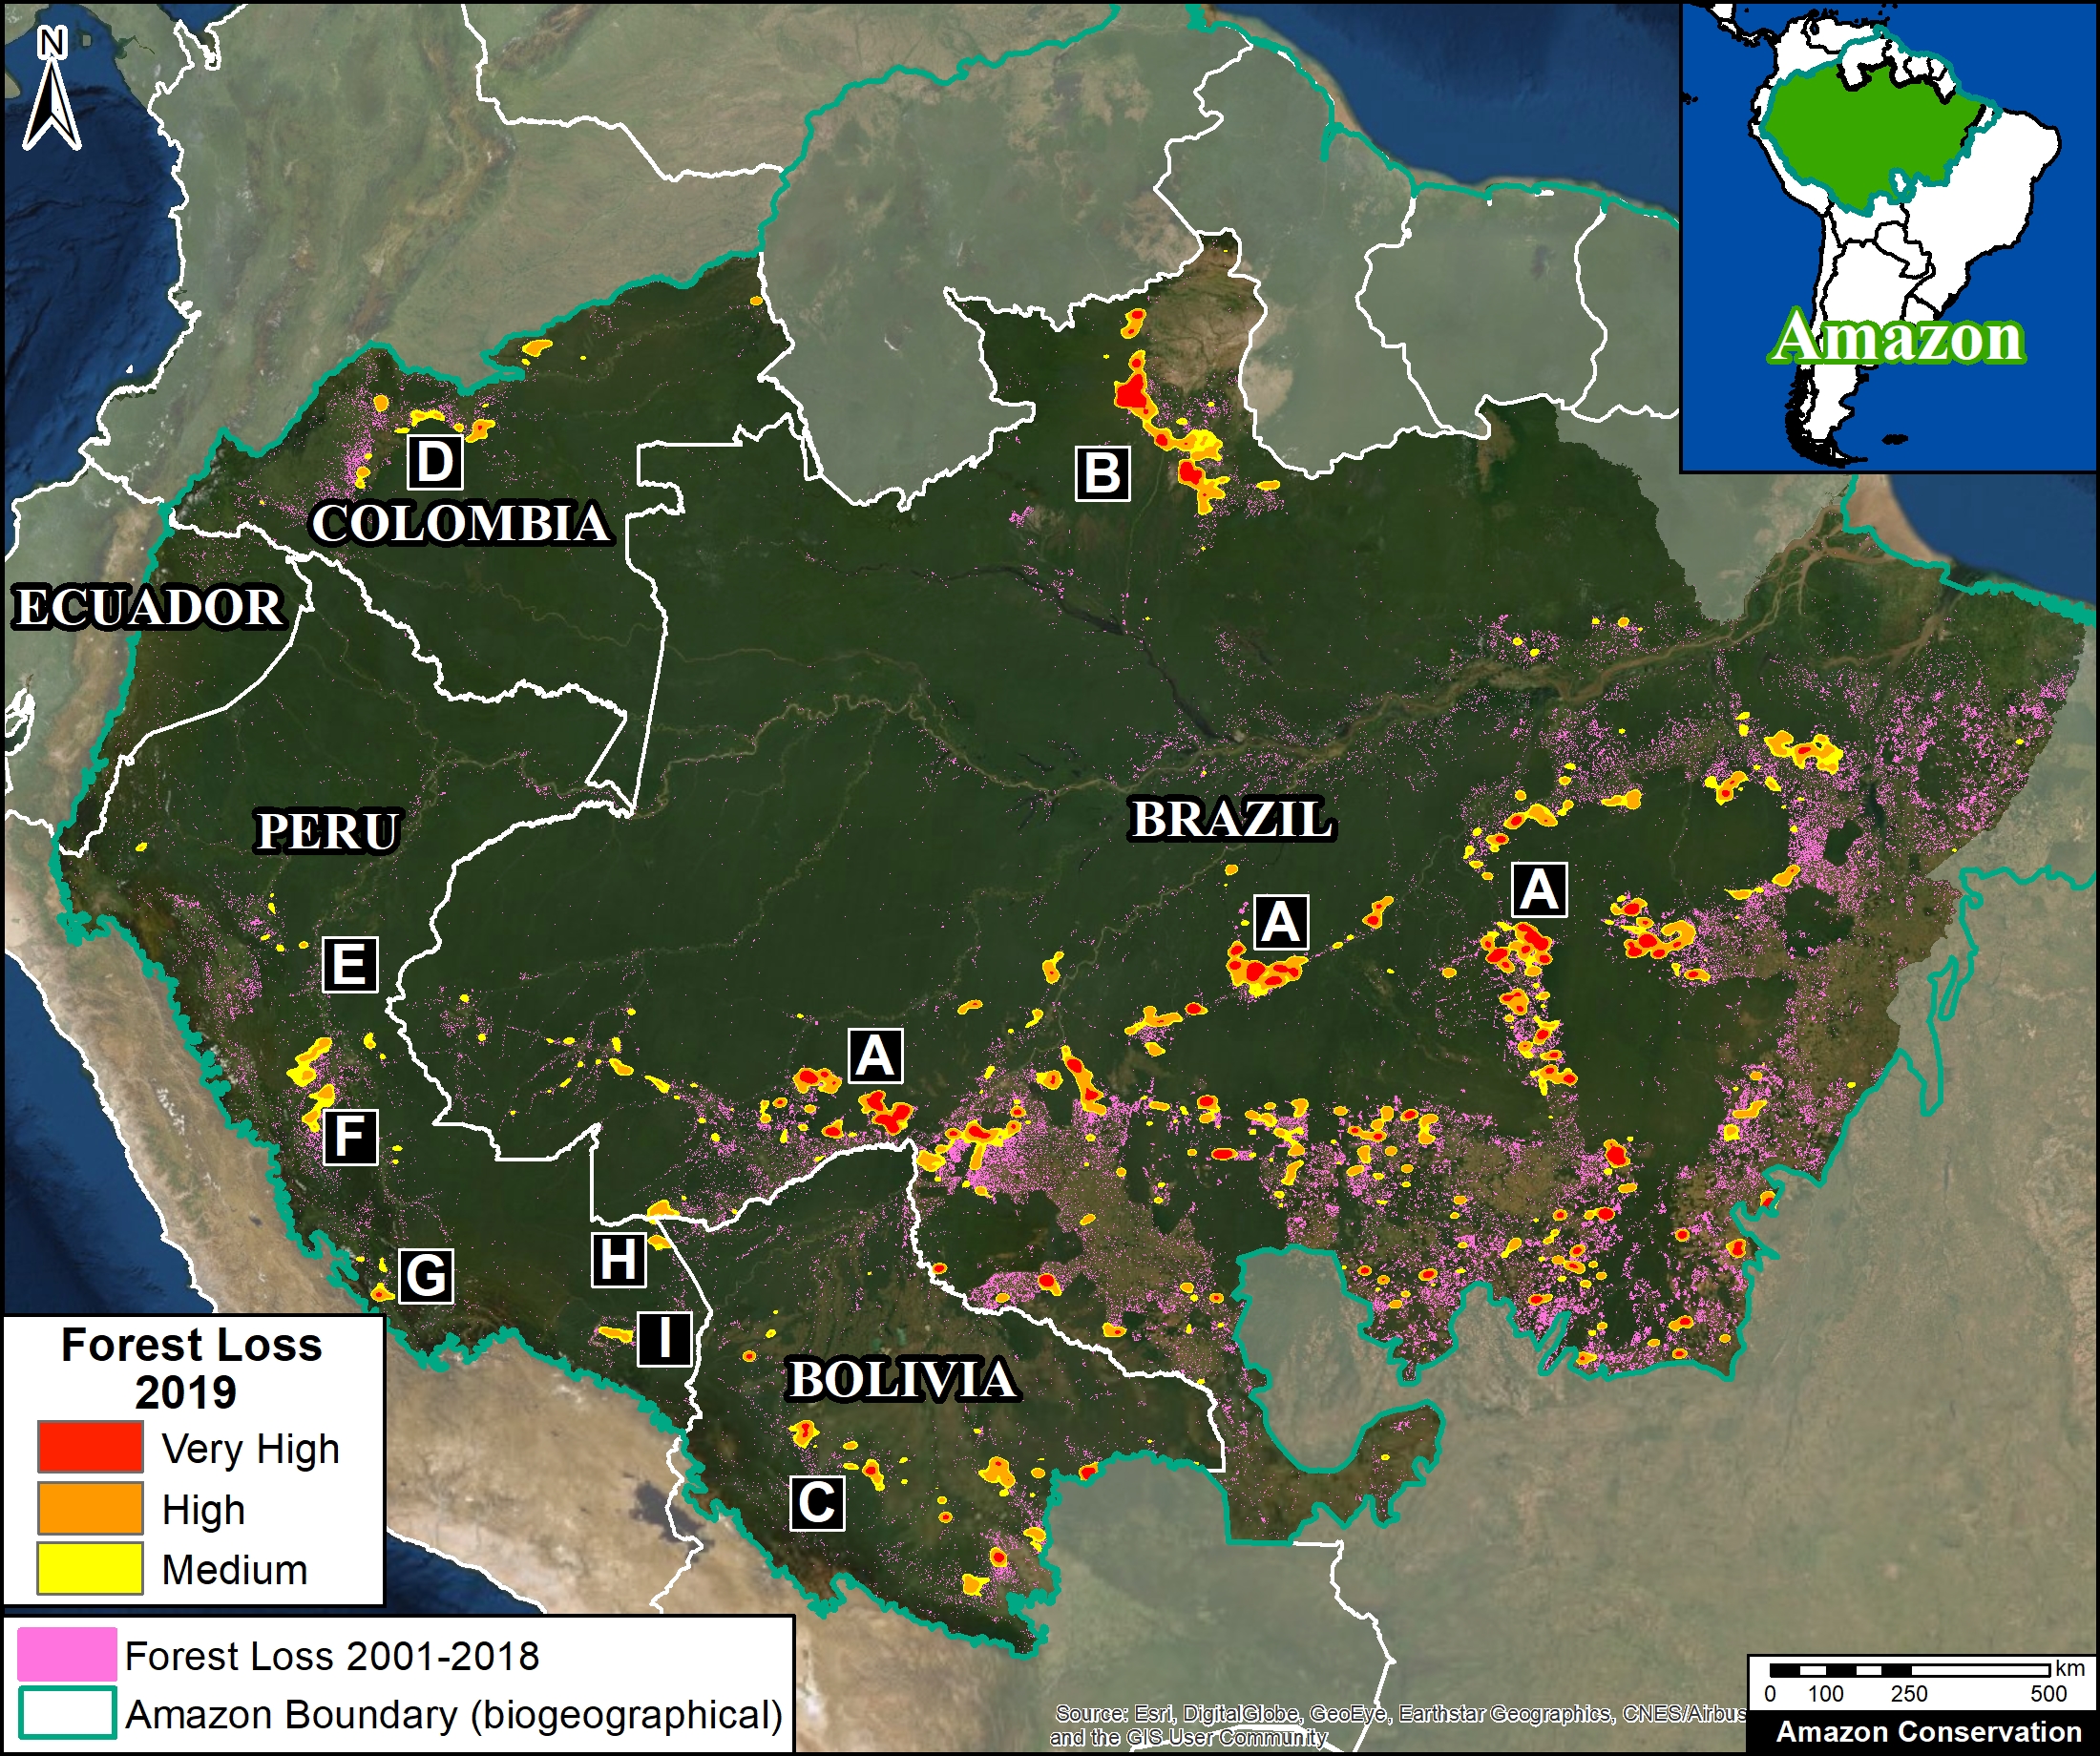
The Base Map below shows the major 2019 deforestation hotspots across the Amazon.

2019 deforestation hotspots across the Amazon. Data: Hansen/UMD/Google/USGS/NASA, MAAP.

Many of the major deforestation hotspots were in Brazil. Early in the year, in March, there were uncontrolled fires up north in the state of Roraima. Further south, along the Trans-Amazonian Highway, much of the deforestation occurred in the first half of the year, followed by the high profile fires starting in late July. Note that many of these fires were burning recently deforested areas, and were not uncontrolled forest fires (MAAP #113).

The Brazilian Amazon also experienced escalating gold mining deforestation in indigenous territories (MAAP #116).

Bolivia also had an intense 2019 fire season. Unlike Brazil, many were uncontrolled fires, particularly in the Beni grasslands and Chiquitano dry forests of the southern Bolivian Amazon (MAAP #108).

In Peru, although illegal gold mining deforestation decreased (MAAP #121), small-scale agriculture (including cattle) continues to be a major driver in the central Amazon (MAAP #112) and an emerging driver in the south.

In Colombia, there is an “arc of deforestation” in the northwestern Amazon. This arc includes four protected areas (Tinigua, Chiribiquete and Macarena National Parks, and Nukak National Reserve) and two Indigenous Reserves (Resguardos Indígenas Nukak-Maku and Llanos del Yari-Yaguara II) experiencing substantial deforestation (MAAP #120). One of the main deforestation drivers in the region is conversion to pasture for land grabbing or cattle ranching.

Annex – Colombia peace accord trend

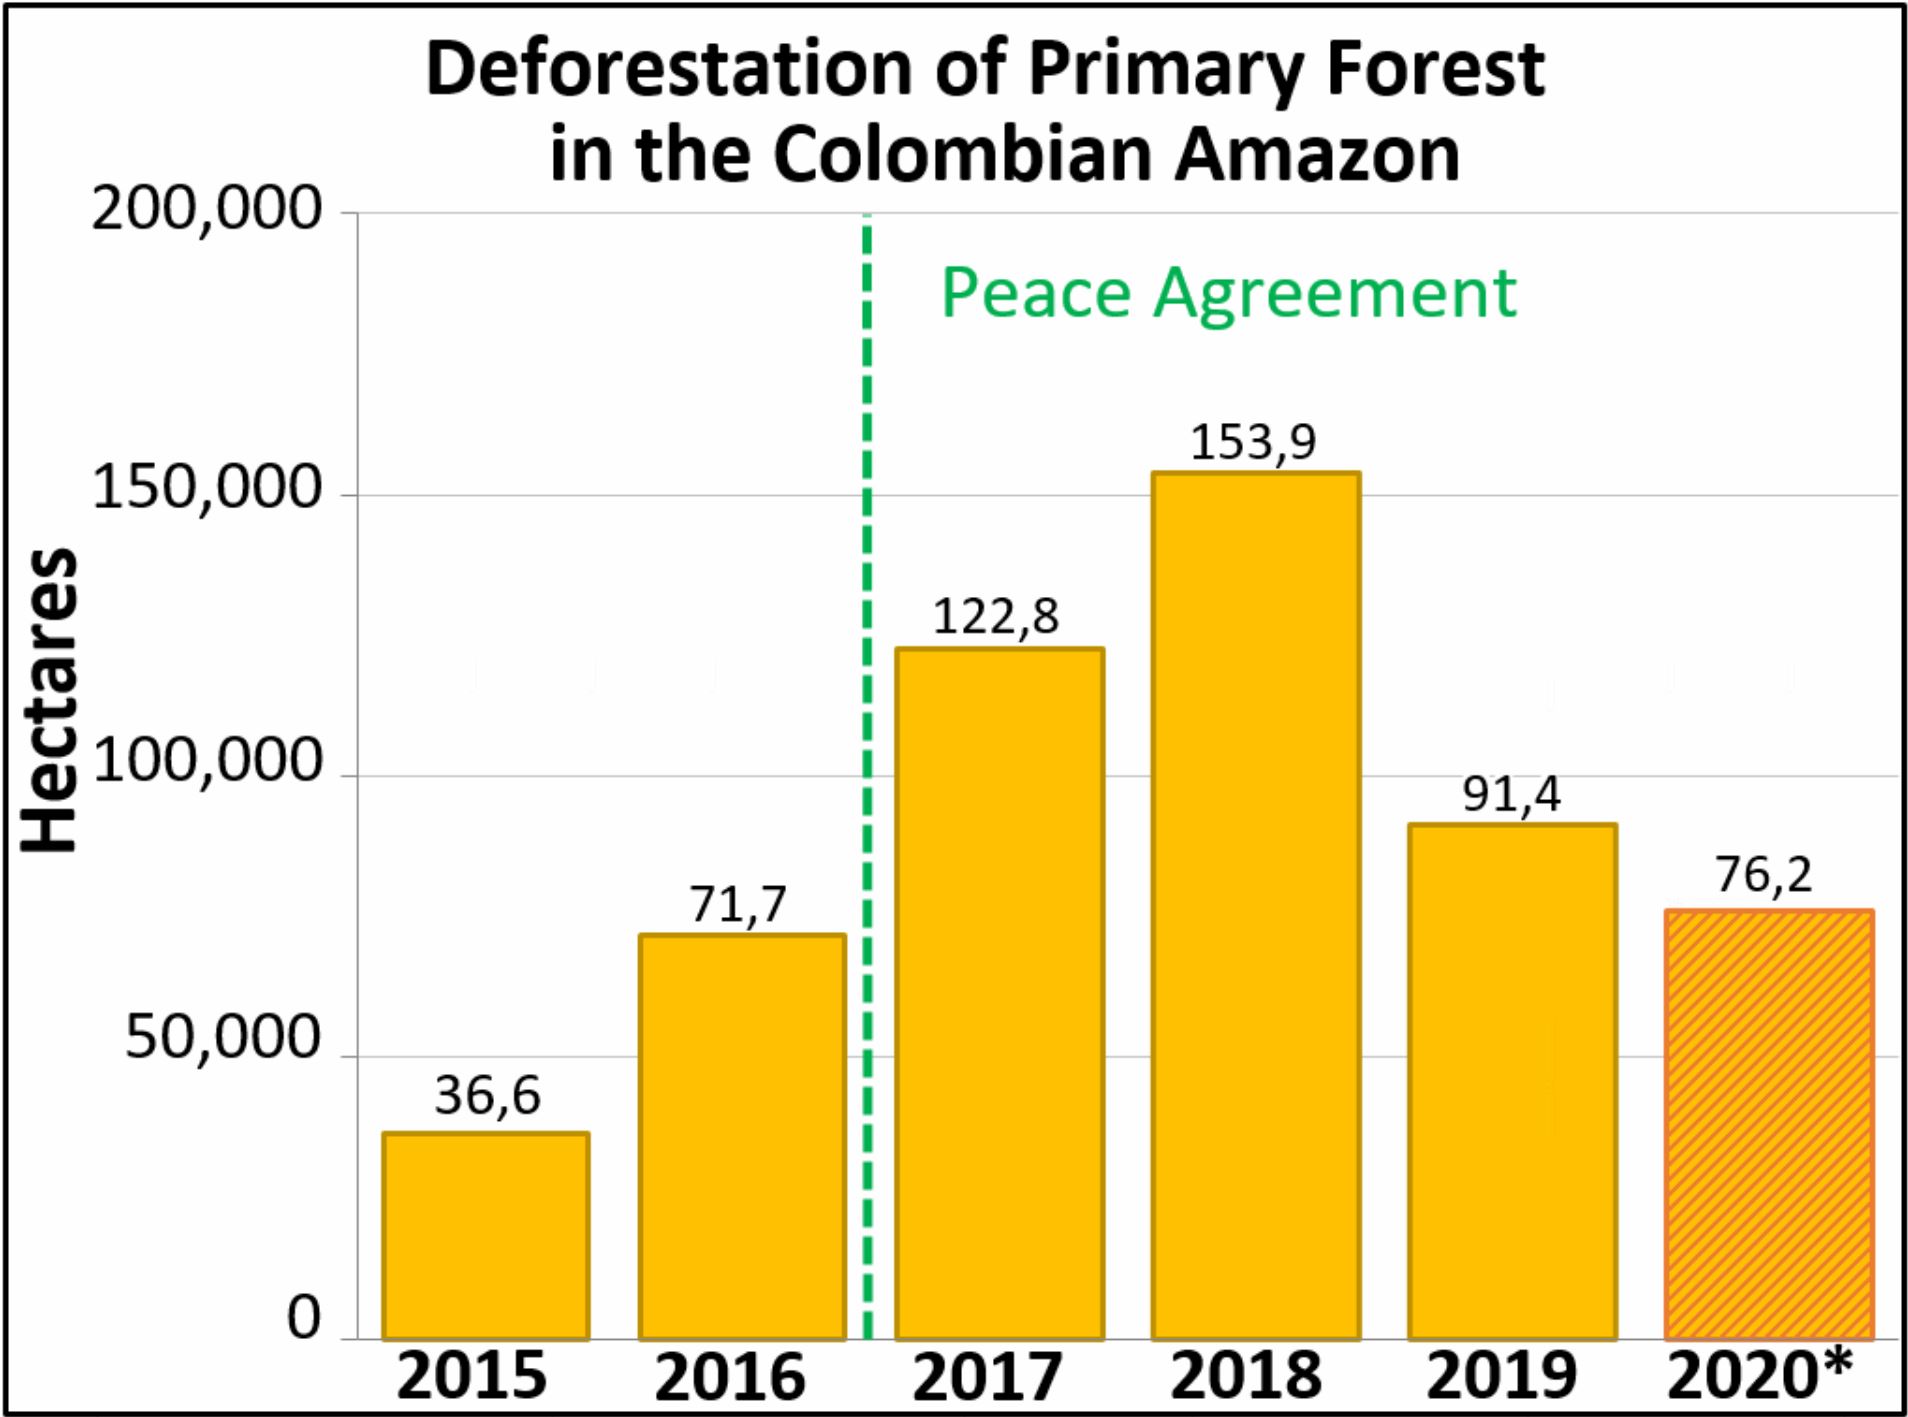
Annex 1. Deforestation of primary forest in the Colombian Amazon, 2015-20. Data: Hansen/UMD/Google/USGS/NASA, UMD/GLAD. *Until May 2020

Methodology

The baseline forest loss data presented in this report were generated by the Global Land Analysis and Discovery (GLAD) laboratory at the University of Maryland (Hansen et al 2013) and presented by Global Forest Watch. Our study area is strictly what is highlighted in the Base Map.

For our estimate of primary forest loss, we used the annual “forest cover loss” data with density >30% of the “tree cover” from the year 2001. Then we intersected the forest cover loss data with the additional dataset “primary humid tropical forests” as of 2001 (Turubanova et al 2018). For more details on this part of the methodology, see the Technical Blog from Global Forest Watch (Goldman and Weisse 2019).

For boundaries, we used the biogeographical limit (as defined by RAISG) for all countries except Bolivia, where we used the Amazon watershed limit (see Base Map).

All data were processed under the geographical coordinate system WGS 1984. To calculate the areas in metric units, the projection was: Peru and Ecuador UTM 18 South, Bolivia UTM 20 South, Colombia MAGNA-Bogotá, and Brazil Eckert IV.

Lastly, to identify the deforestation hotspots, we conducted a kernel density estimate. This type of analysis calculates the magnitude per unit area of a particular phenomenon, in this case forest cover loss. We conducted this analysis using the Kernel Density tool from Spatial Analyst Tool Box of ArcGIS. We used the following parameters:

Search Radius: 15000 layer units (meters)
Kernel Density Function: Quartic kernel function
Cell Size in the map: 200 x 200 meters (4 hectares)
Everything else was left to the default setting.

For the Base Map, we used the following concentration percentages: Medium: 7%-10%; High: 11%-20%; Very High: >20%.

References

Goldman L, Weisse M (2019) Explicación de la Actualización de Datos de 2018 de Global Forest Watch. https://blog.globalforestwatch.org/data-and-research/blog-tecnico-explicacion-de-la-actualizacion-de-datos-de-2018-de-global-forest-watch

Hansen, M. C., P. V. Potapov, R. Moore, M. Hancher, S. A. Turubanova, A. Tyukavina, D. Thau, S. V. Stehman, S. J. Goetz, T. R. Loveland, A. Kommareddy, A. Egorov, L. Chini, C. O. Justice, and J. R. G. Townshend. 2013. “High-Resolution Global Maps of 21st-Century Forest Cover Change.” Science 342 (15 November): 850–53. Data available on-line from: http://earthenginepartners.appspot.com/science-2013-global-forest.

Turubanova S., Potapov P., Tyukavina, A., and Hansen M. (2018) Ongoing primary forest loss in Brazil, Democratic Republic of the Congo, and Indonesia. Environmental Research Letters  https://doi.org/10.1088/1748-9326/aacd1c 

Acknowledgements

We thank G. Palacios for helpful comments to earlier versions of this report.

This work was supported by the following major funders: Norwegian Agency for Development Cooperation (NORAD), Gordon and Betty Moore Foundation, International Conservation Fund of Canada (ICFC), Metabolic Studio, Erol Foundation, MacArthur Foundation, and Global Forest Watch Small Grants Fund (WRI).

Citation

Finer M, Mamani N (2020) 2019 Amazon Deforestation. MAAP: 122.

MAAP #120: Deforestation in the Colombian Amazon – 2020

Table 1. Deforestation of primary forest in the Colombian Amazon, 2015-20. Data: Hansen/UMD/Google/USGS/NASA, UMD/GLAD. *Until May 2020

Here we present a first look at 2020 deforestation of primary forest in the Colombian Amazon, in relation to the new published annual data for 2019.*

This new data confirms that deforestation decreased in 2019 (91,400 hectares) after a peak in 2018 (153,900 hectares).

Table 1 shows the recent trend: a major deforestation spike following the 2016 peace agreement (between the Colombian government and the FARC) with a peak in 2018, followed by a major decrease in 2019.

In our first look at 2020, we estimate the deforestation of 76,200 hectares (188,295 acres) of primary forest through June.

Note that we have documented the deforestation of 444,000 hectares (over a million acres) of primary forest in the Colombian Amazon in the past four years since the peace agreement.

*Global Forest Watch recently released the annual forest loss data for 2019.

Deforestation Hotspots – 2020

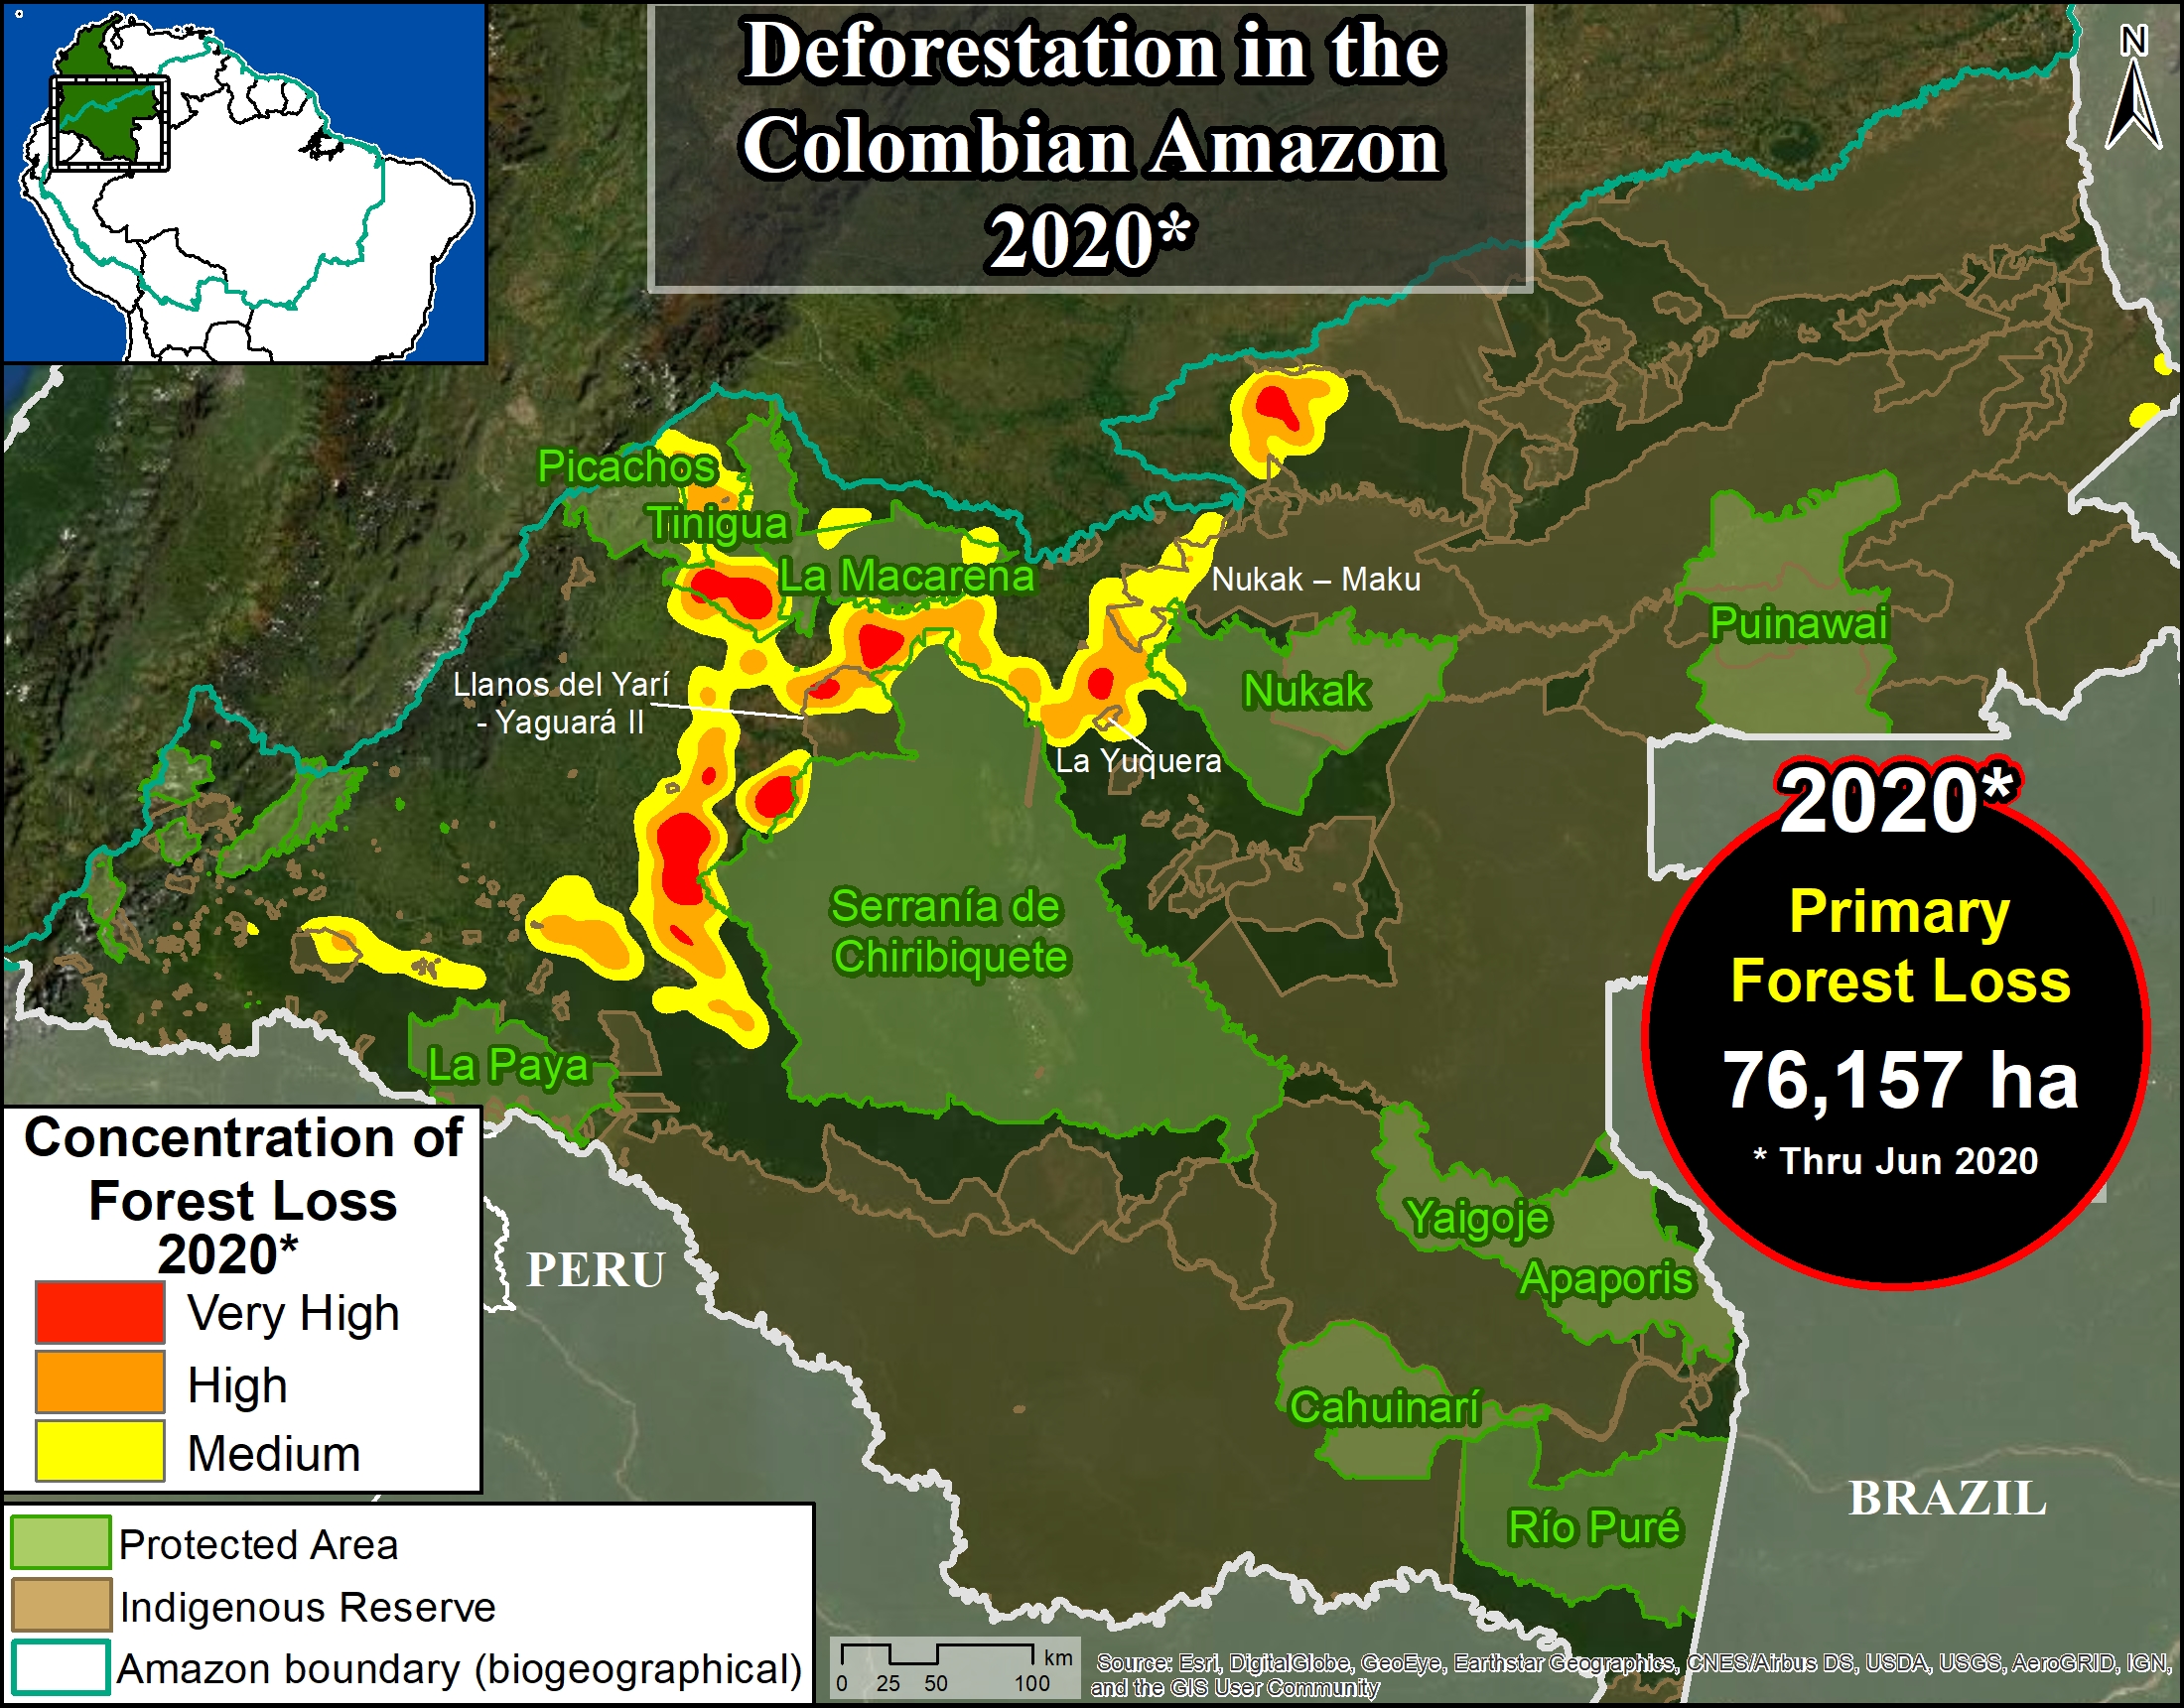
Base Map. 2020 Deforestation hotspots in the Colombian Amazon. Data: UMD/GLAD.

The Base Map shows the 2020 deforestation hotspots.*

As in previous years, they are concentrated in an “arc of deforestation” in the northwest Colombian Amazon.

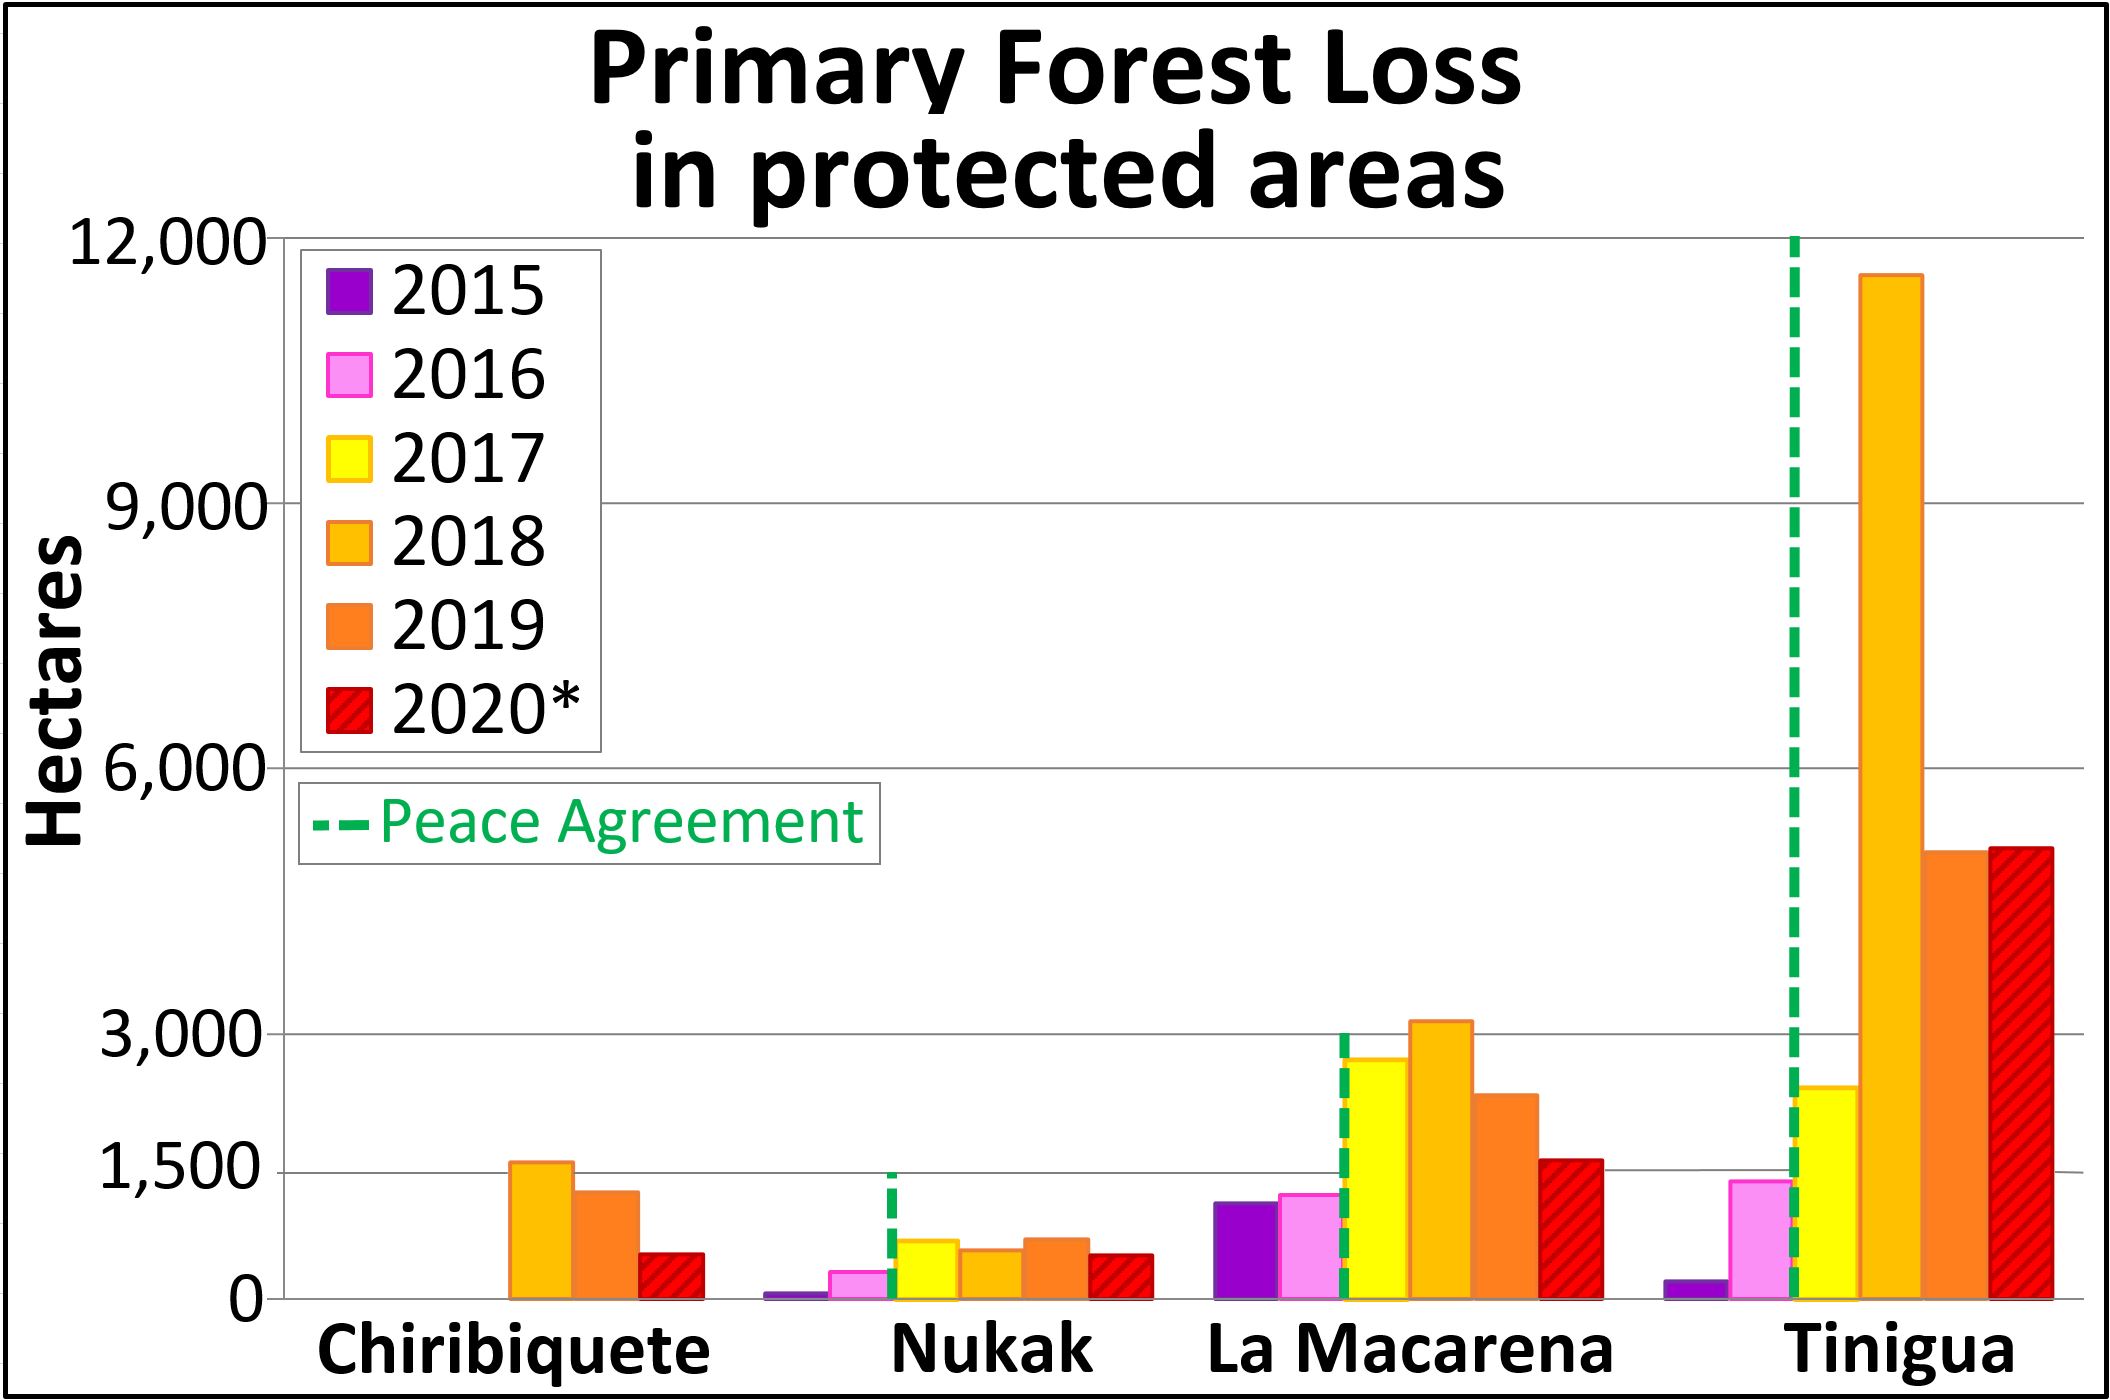
This arc includes four protected areas (Tinigua, Chiribiquete and Macarena National Parks, and Nukak National Reserve) that lost 0ver 7,700 hectares (19,000 acres) of primary forest in 2020 (see Table 2).

Tinigua National Park is the most impacted protected area with the deforestation of 5,100 hectares (12,600 acres). Note the rare occurrence of a major deforestation hotspot in the middle of a national park.

Chiribiquete National Park lost 510 hectares (1,260 acres) in the recently expanded sections of the park.

The arc of deforestation also includes two Indigenous Reserves (Resguardos Indígenas Nukak-Maku and Llanos del Yari-Yaguara II) that lost 4,000 hectares (9,885 acres) so far in 2020.

*To see detailed map of the 2019-20 primary forest deforestation in the Colombian Amazon, click here.

Deforestation in Protected Areas and Indigenous Lands – 2020

Below, we show 2020 examples within the arc of deforestation in the northwest Colombian Amazon.

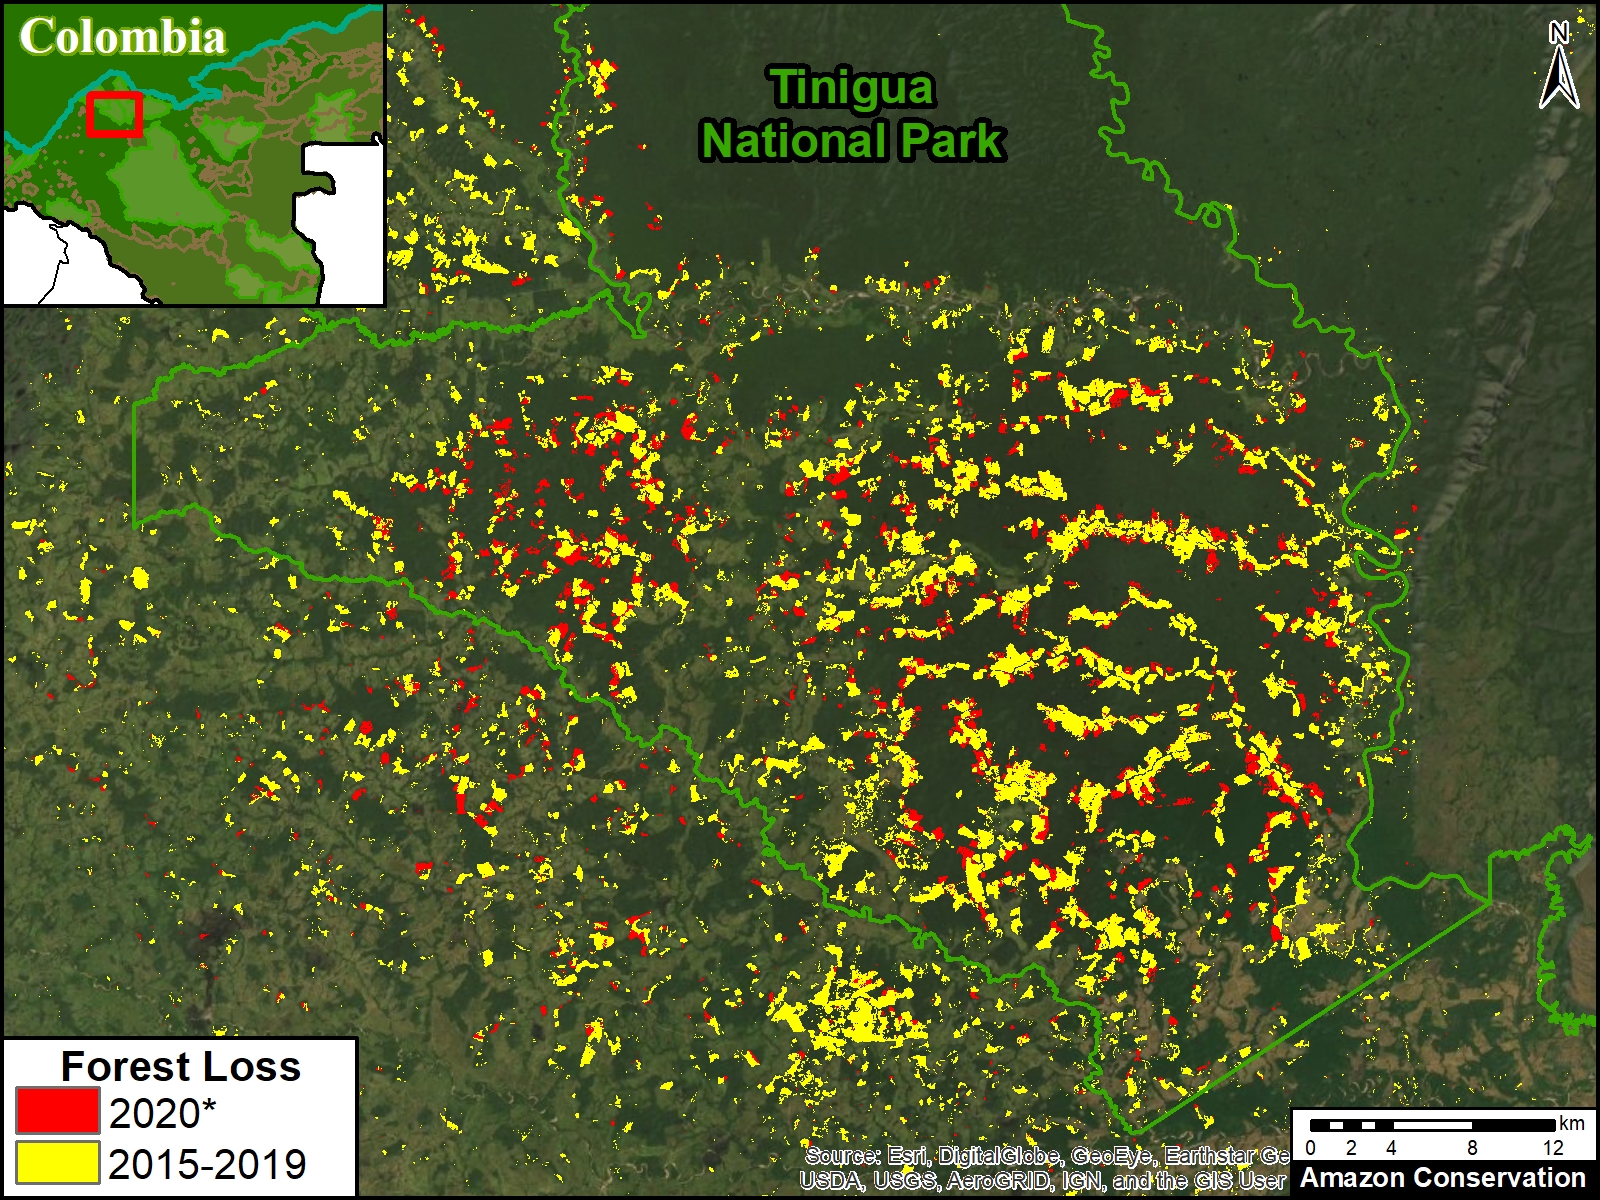
Image 1 illustrates the extensive deforestation within Tinigua National Park over the last five years continuing in 2020.

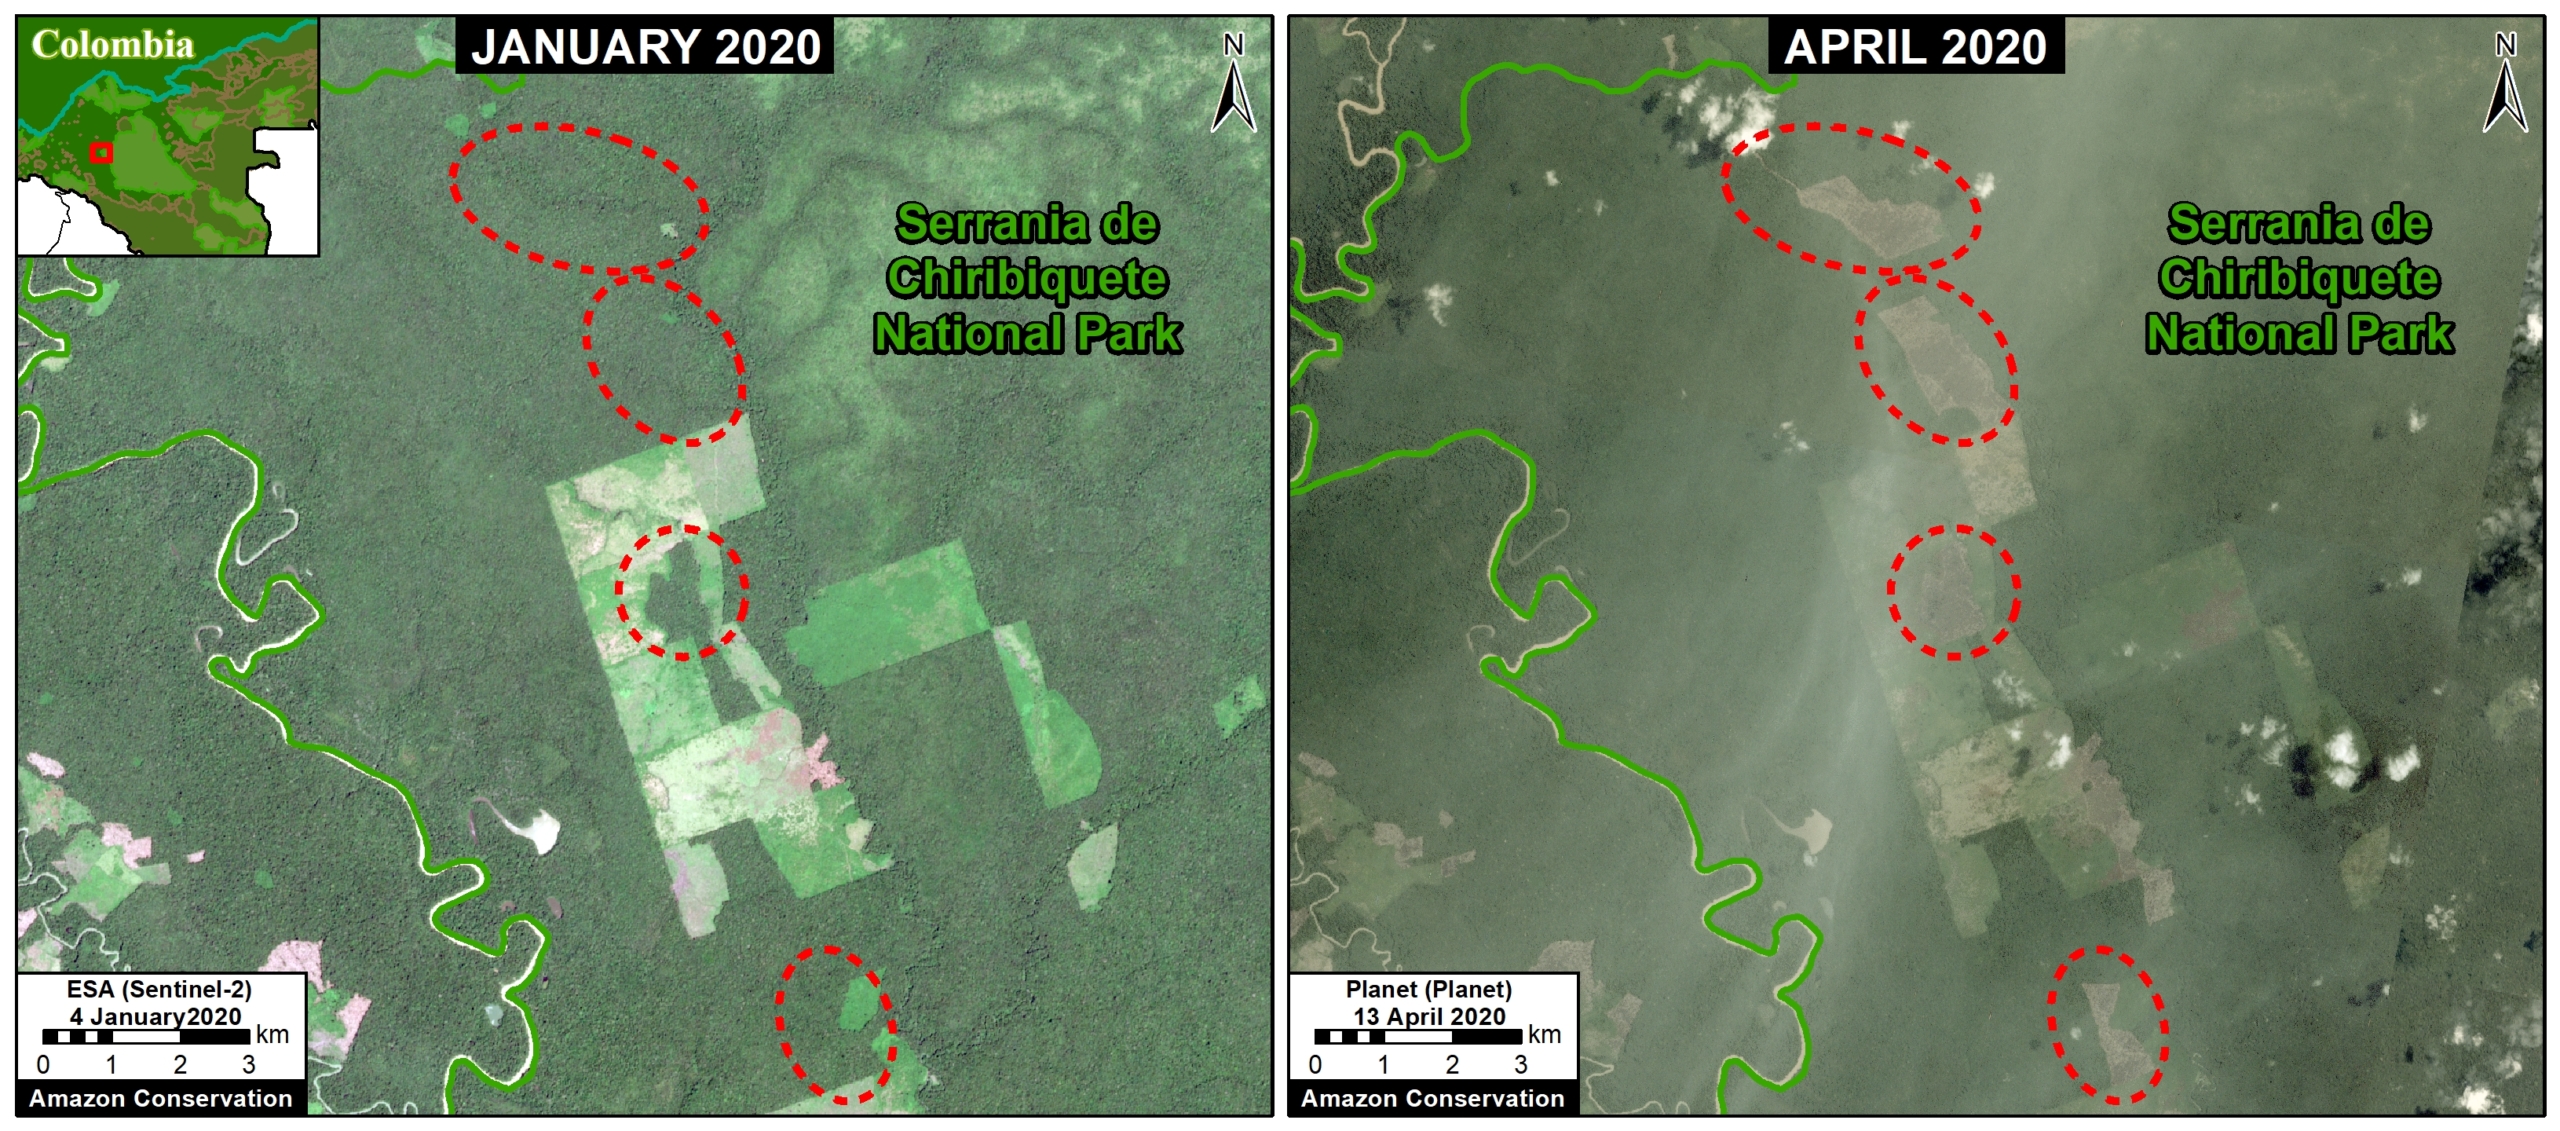
Image 2 shows an example of deforestation within Chiribiquete National Park (western sector) between January (left panel) and April (right panel) of 2020.

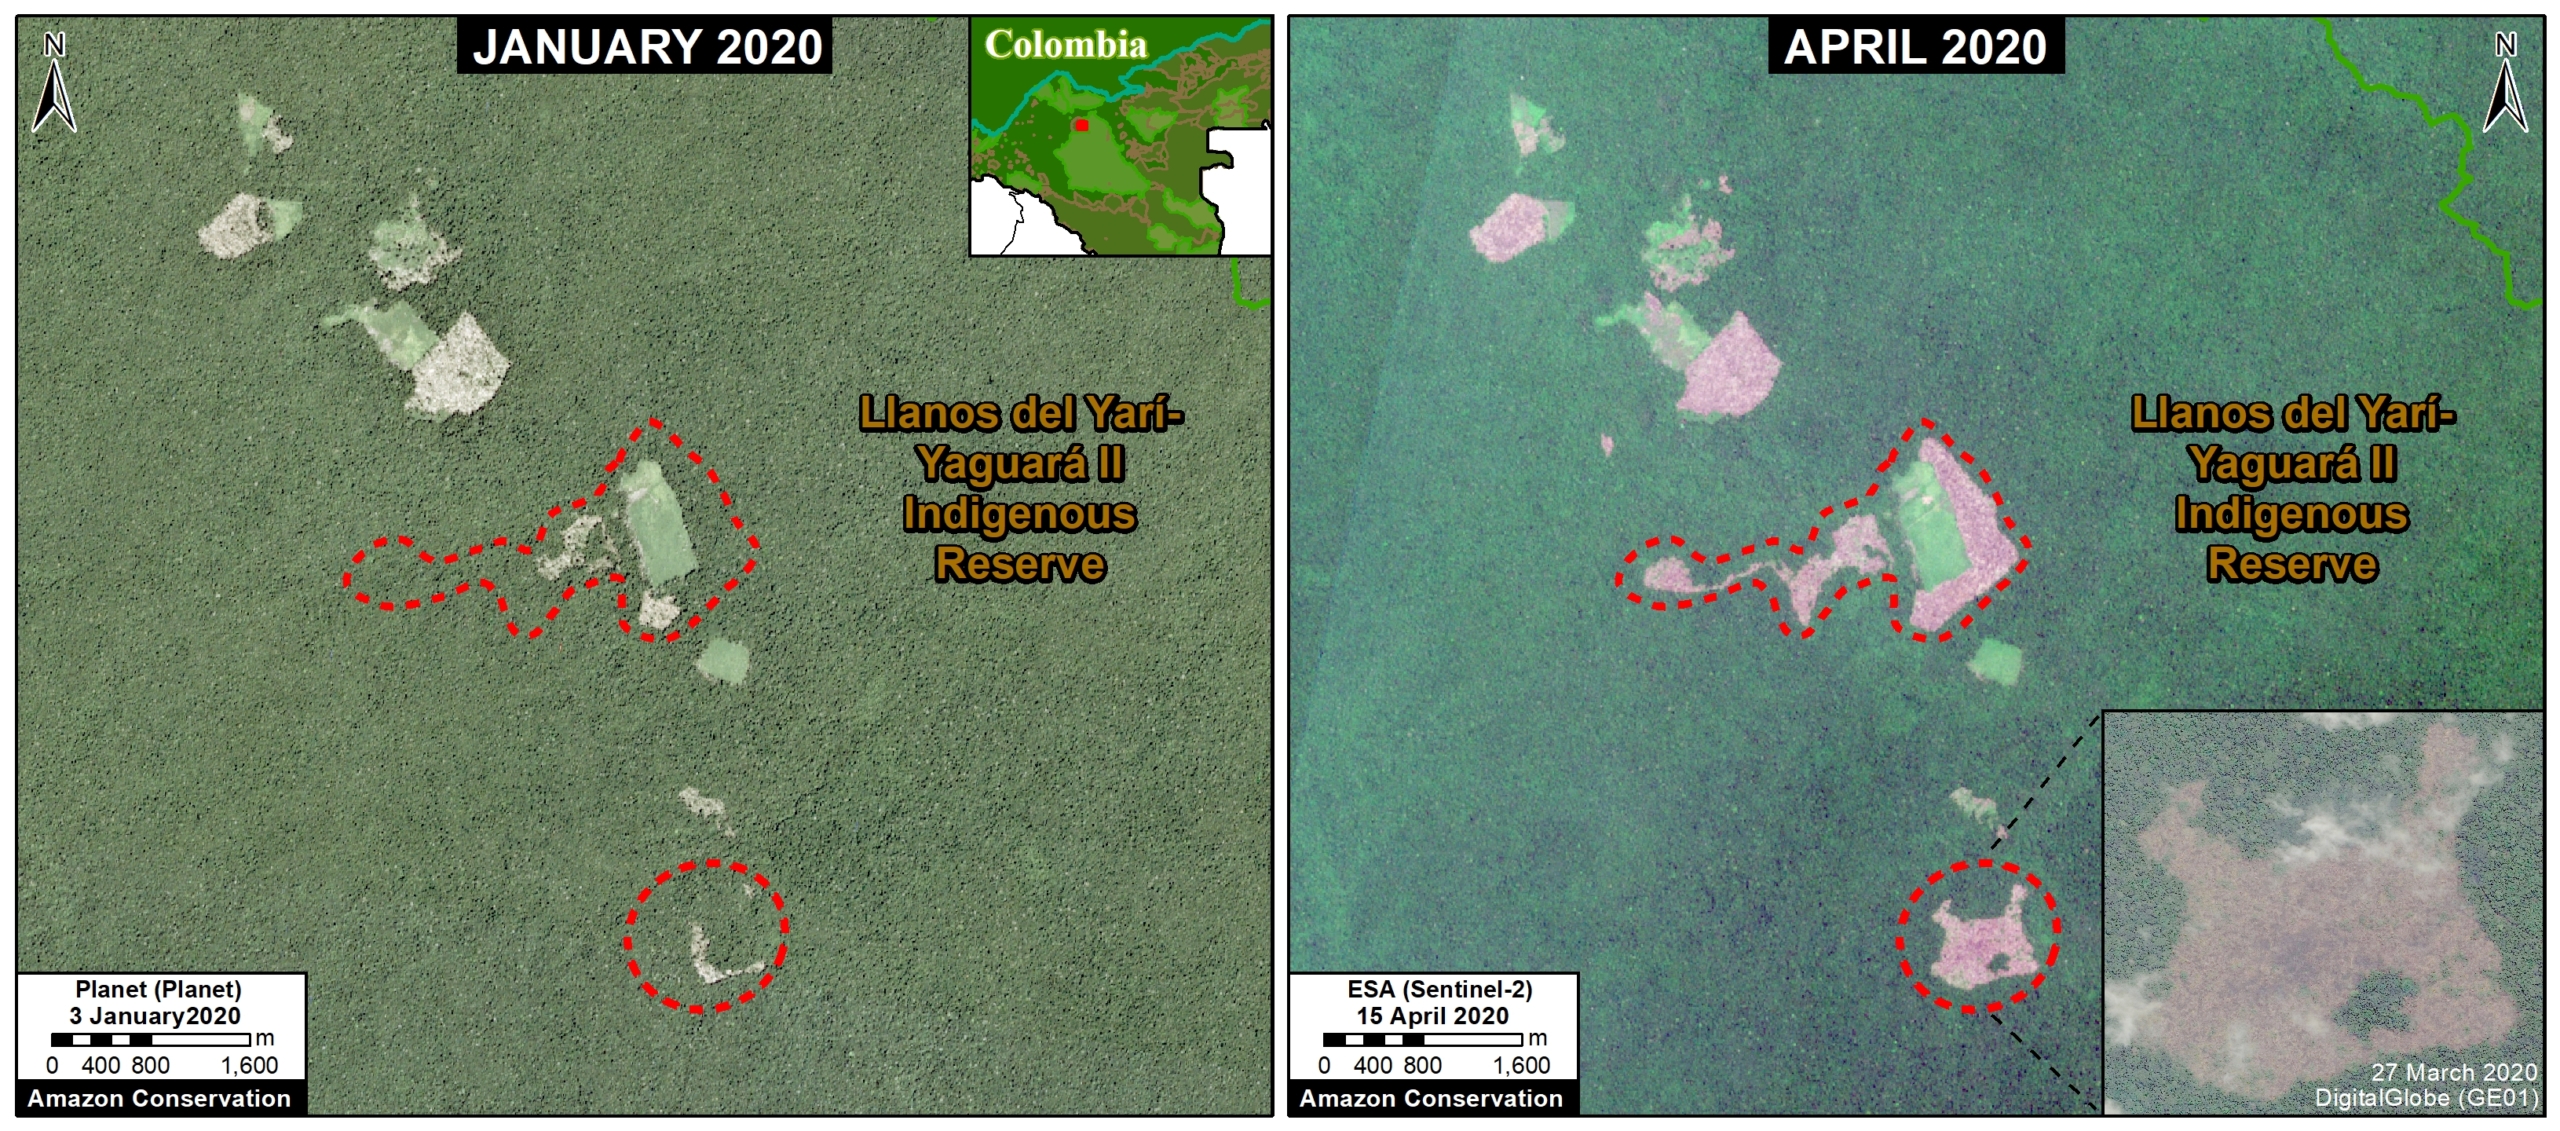
Image 3 shows an example of deforestation within the Llanos del Yari-Yaguara II Indigenous Reserve between January (left panel) and April (right panel) of 2020.

Image 1. Extensive deforestation within Tinigua National Park over the last five years, continuing in 2020. Data: Hansen/UMD/Google/USGS/NASA, UMD/GLAD.
Image 2. Deforestation in Chirbiquete National Park (western sector) between January (left panel) and April (right panel) of 2020. Data: ESA, Planet, MAAP.
Image 3. Deforestation in Llanos del Yari-Yaguara II Indigenous Reserve. Data: ESA, Planet, MAAP.

Deforestation in Protected Areas, 2015-20

Table 2 shows the loss of primary forest in four protected areas located in the arc of deforestation arc in the northwestern Colombian Amazon, between 2015 and 2020.

Table 2. Primary forest loss in four protected areas in the northwestern Colombian Amazon, between 2015 and 2020. Data: Hansen/UMD/Google/USGS/NASA, UMD/GLAD.

Methodology

The data presented in this report were generated by the Global Land Analysis and Discovery (GLAD) laboratory at the University of Maryland (Hansen et al 2013) and presented by Global Forest Watch. For the years 2015-18, we used annual forest loss data. For the years 2019-20, we used early warning alerts (GLAD alerts), and thus represent an estimate. Note that some forest loss detected early in the year may include events from late the preceding year.

Our study area is the Amazon biogeographical limit (not strict Amazon watershed) as highlighted in the Base Map.

Specifically, for our estimate of forest cover loss, we multiplied the annual “forest cover loss” data by the density percentage of the “tree cover” from the year 2001 (values >30%).

For our estimate of primary forest loss, we intersected the forest cover loss data with the additional dataset “primary humid tropical forests” as of 2001 (Turubanova et al 2018). For more details on this part of the methodology, see the Technical Blog from Global Forest Watch (Goldman and Weisse 2019).

All data were processed under the geographical coordinate system WGS 1984. To calculate the areas in metric units the UTM (Universal Transversal Mercator) projection was used: Colombia 18 North.

Lastly, to identify the deforestation hotspots, we conducted a kernel density estimate. This type of analysis calculates the magnitude per unit area of a particular phenomenon, in this case forest cover loss. We conducted this analysis using the Kernel Density tool from Spatial Analyst Tool Box of ArcGIS. We used the following parameters:

Search Radius: 15000 layer units (meters)
Kernel Density Function: Quartic kernel function
Cell Size in the map: 200 x 200 meters (4 hectares)
Everything else was left to the default setting.

For the Base Map, we used the following concentration percentages: Medium: 10%-20%; High: 21%-35%; Very High: >35%.

Acknowledgements

We thank R. Botero (FCDS), E. Ortiz (AAF), and G. Palacios for helpful comments to earlier versions of this report.

This work was supported by the following major funders: Norwegian Agency for Development Cooperation (NORAD), Gordon and Betty Moore Foundation, International Conservation Fund of Canada (ICFC), Metabolic Studio, Erol Foundation, MacArthur Foundation, and Global Forest Watch Small Grants Fund (WRI).

Citation

Finer M, Mamani N (2020) Deforestation in the Colombian Amazon – 2020. MAAP #120.

MAAP Synthesis: 2019 Amazon Deforestation Trends and Hotspots

Base Map. Amazon Deforestation, 2001-2019. Data: UMD/GLAD, Hansen/UMD/Google/USGS/NASA, MAAP. 

MAAP, an initiative of Amazon Conservation, specializes in satellite-based, real-time deforestation monitoring of the Amazon. Our geographic focus covers five countries: Bolivia, Brazil, Colombia, Ecuador, and Peru (see Base Map).

We found that, since 2001, this vast area lost 65.8 million acres (26.6 million hectares) of primary forest, an area equivalent to the size of the United Kingdom (or the U.S. state of Colorado).

In 2019, we published 18 high-impact reports on the most urgent cases of deforestation. 2019 highlights include:

  • Fires in the Brazilian Amazon actually burned freshly deforested areas (MAAP #113);
  • Effective illegal gold mining crackdown in the Peruvian Amazon as a result of the government’s Operation Mercury (MAAP #104);
  • Illegal invasion of protected areas in the Colombian Amazon (MAAP #106);
  • Construction of oil-drilling platforms in the mega-diverse Yasuni National Park of the Ecuadorian Amazon (MAAP #114).

Here, in our annual Synthesis Report, we go beyond these emblematic cases and look at the bigger picture for 2019, describing the most important deforestation trends and hotspots across the Amazon.

*Note: to download a PDF, click the “Print” button below the title.

Synthesis Key Findings

Trends: We present a GIF comparing deforestation trends for each country since 2001. The preliminary 2019 estimates have several important headlines:
  • Possible major deforestation decrease in the Colombian Amazon following a dramatic increase over the previous three years;
  • Likely major deforestation increase in the Bolivian Amazon due to forest fires;
  • Downward deforestation trend continues in the Peruvian Amazon, but still historically high;
  • Deforestation of 2.4 million acres in the Brazilian Amazon, but the trend depends on the data source.
Hotspots: We present a Base Map highlighting the major deforestation hotspots in 2019. Results emphasize the deforestation and fires in the Brazilian Amazon, along with several key areas in Colombia, Peru, and Bolivia.
.

Deforestation Trends 2001-2019

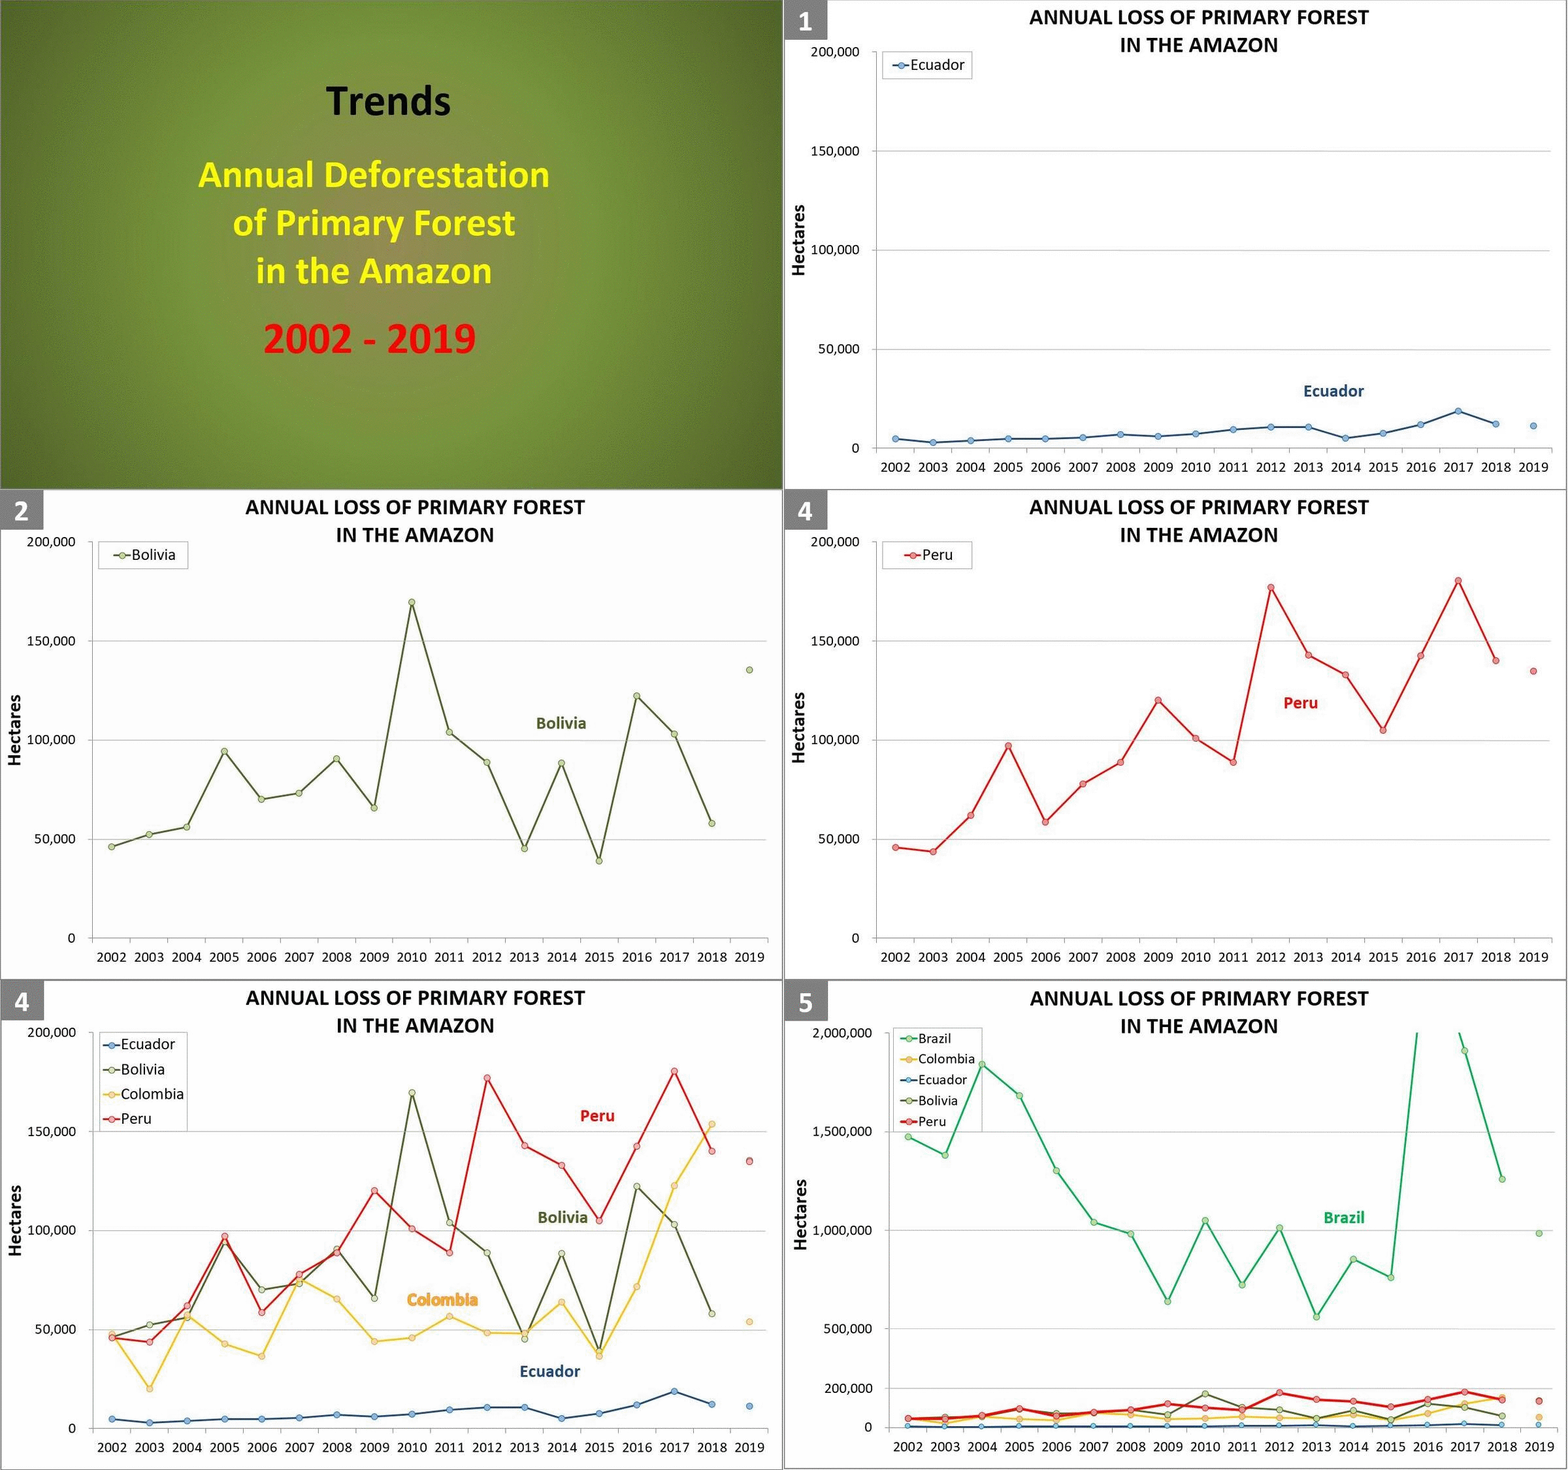
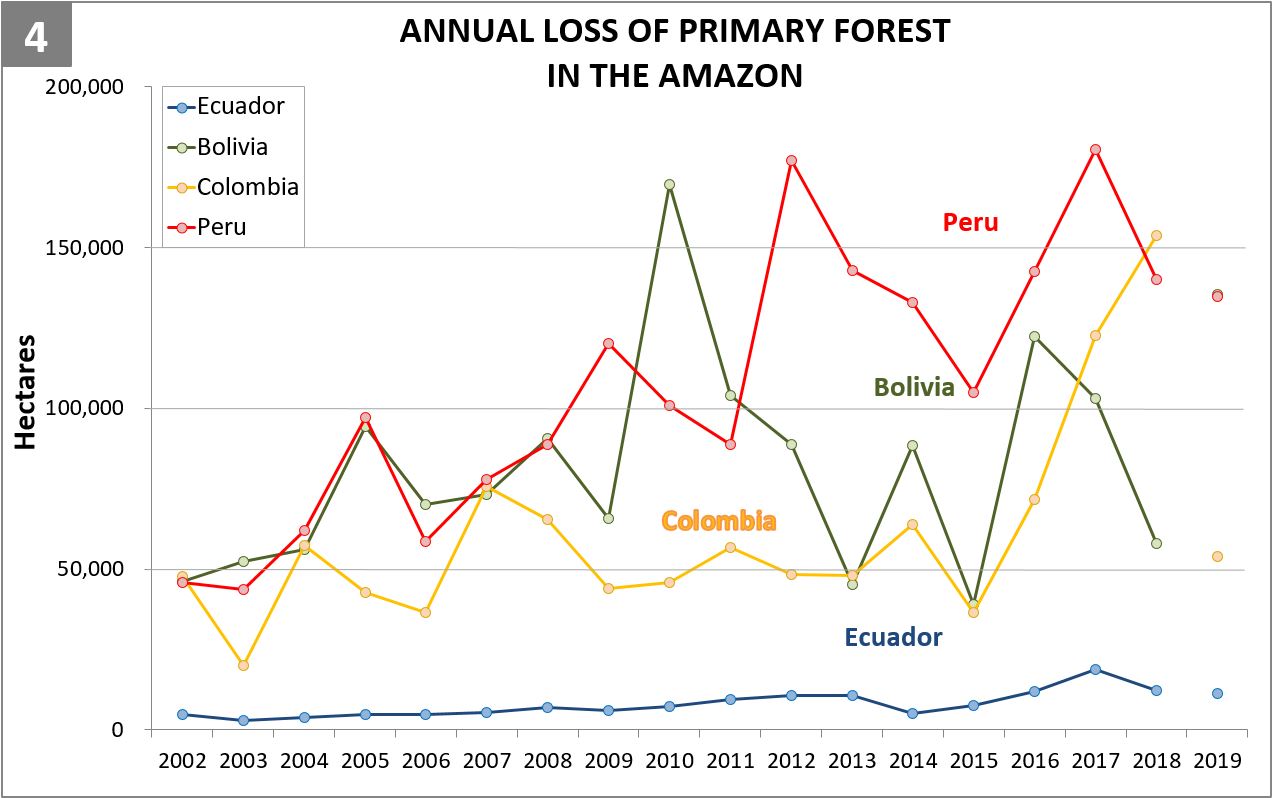
The following GIF shows deforestation trends for each country between 2001 and 2019 (see descriptive notes below). Click here for static versions of each graph.

Three important points about the data: First, as a baseline, we use annual forest loss from the University of Maryland to have a consistent source across all five countries (thus it may differ from official national data). Second, we applied a filter to only include loss of primary forest (see Methodology). Third, the 2019 data represents a preliminary estimate based on early warning alerts.

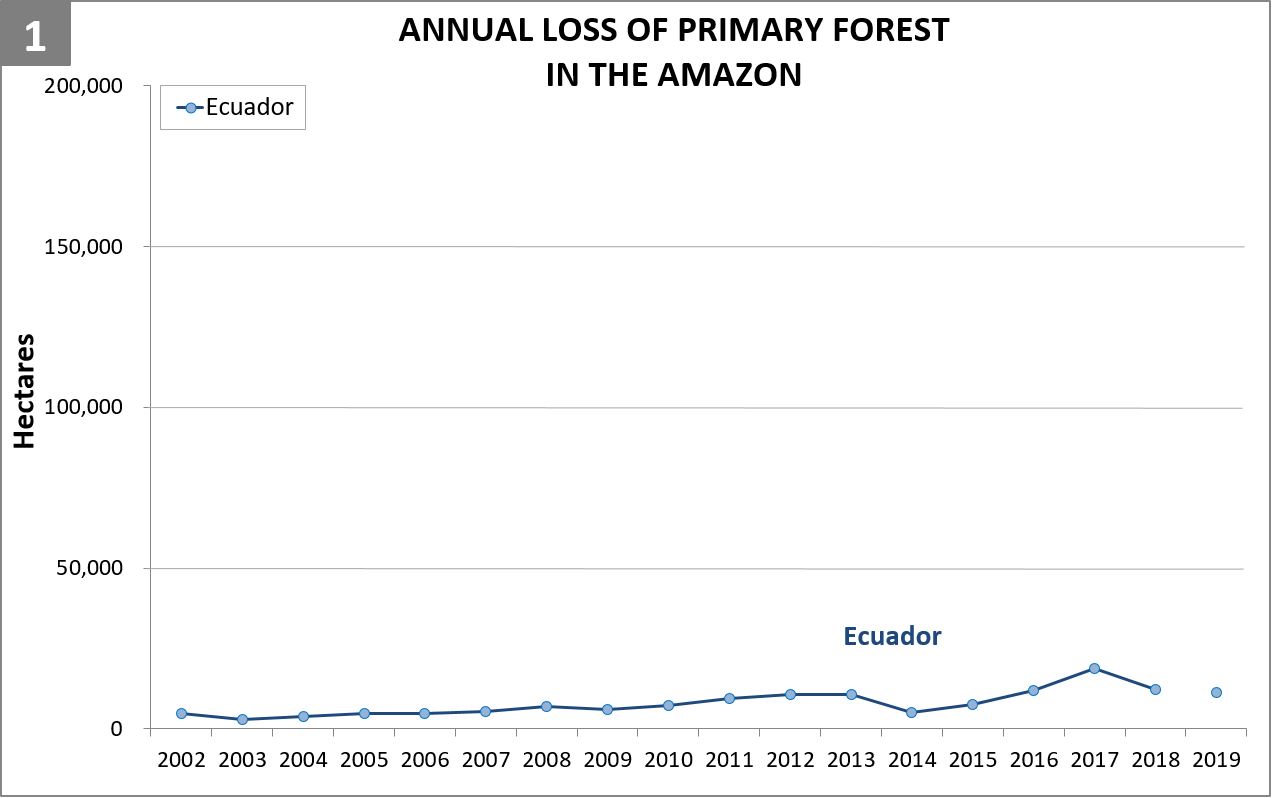
  1. Deforestation in the Ecuadorian Amazon is relatively low, reaching a maximum of 18,800 hectares (46,500 acres) in 2017. The estimate for 2019 is 11,400 hectares (28,000 acres).
    .
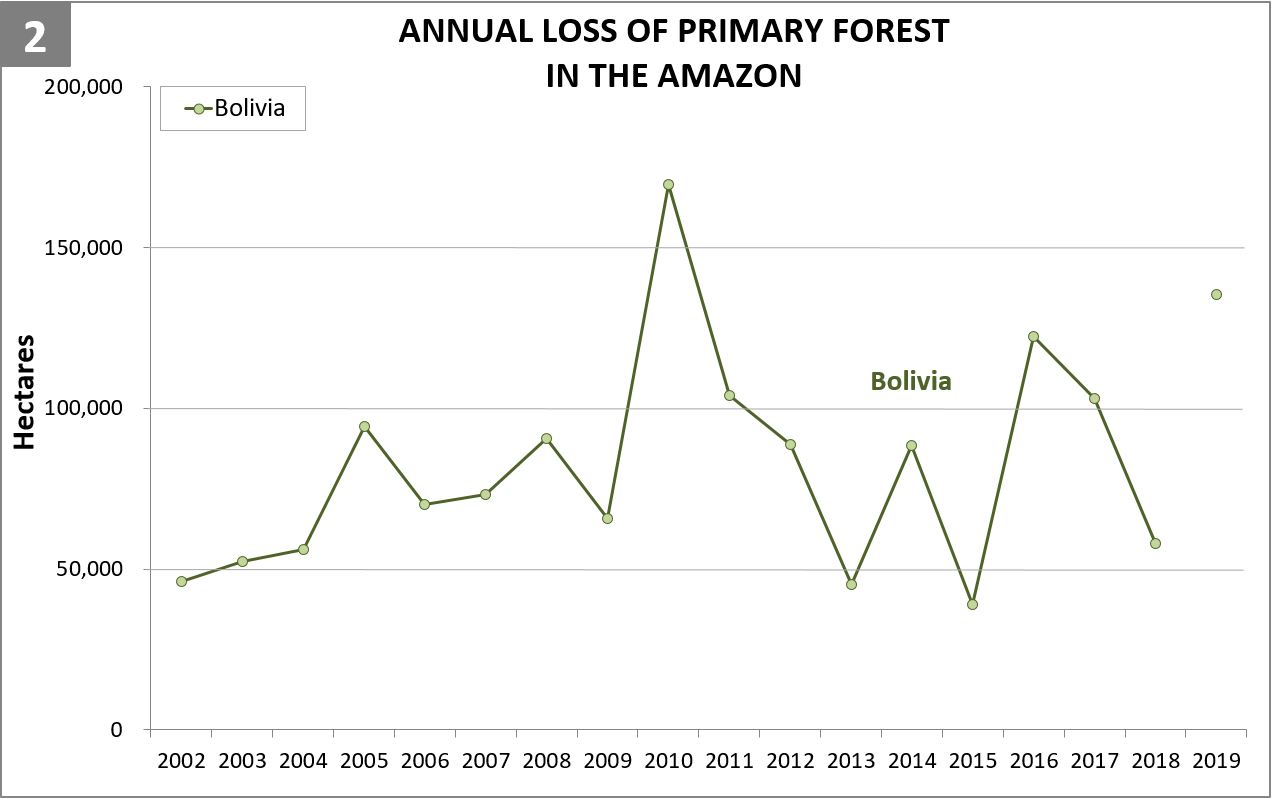
  2. In the Bolivian Amazon, deforestation decreased in 2018 to 58,000 hectares (143,000 acres) after a peak in 2016 of 122,000 hectares (302,000 acres). However, with the recent widespread forest fires, deforestation increased again in 2019, to 135,400 hectares (334,465 acres).
    .
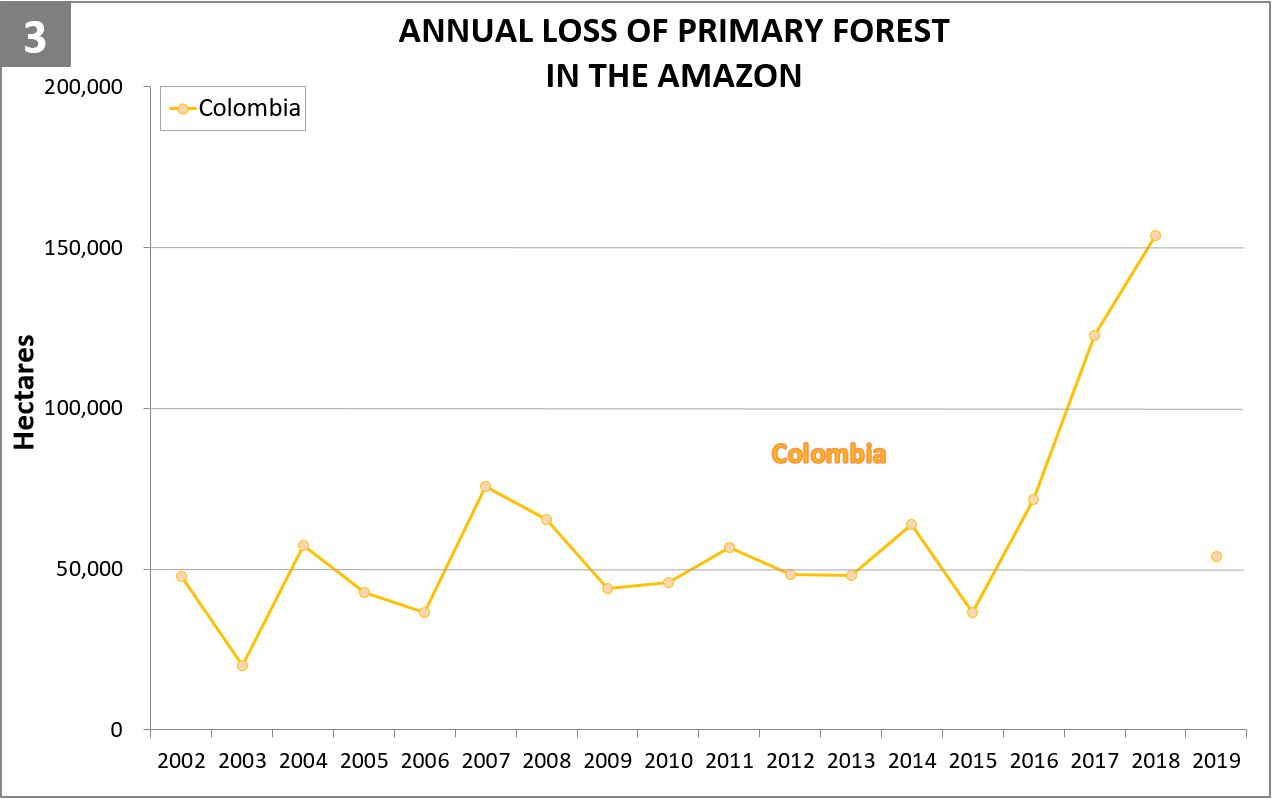
  3. The Colombian Amazon experienced a deforestation boom starting in 2016 (coinciding with the FARC peace accords), reaching an historical high of 153,800 hectares (380,000 acres) in 2018. However, the deforestation estimate for 2019 is back to pre-boom levels at 53,800 hectares (133,000 acres).
    .
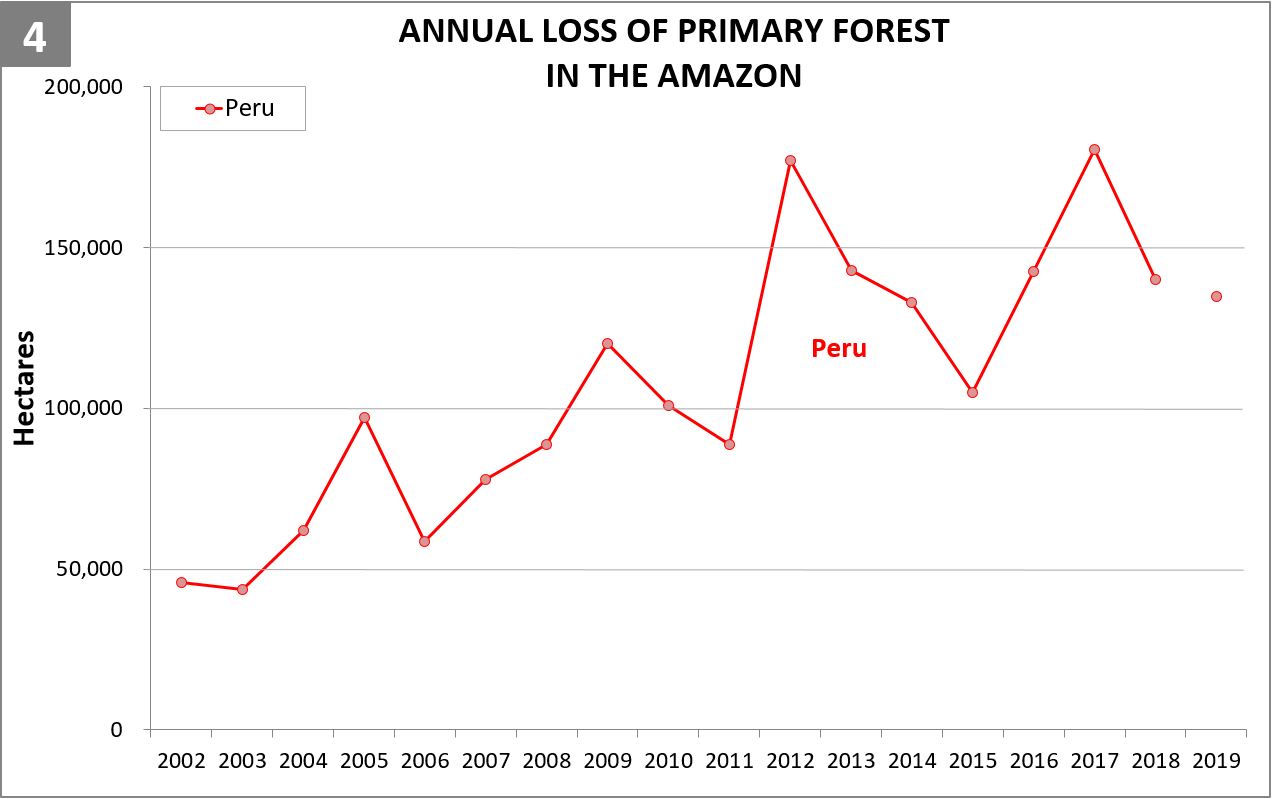
  4. Deforestation in the Peruvian Amazon declined in 2018 (compared to 2017) to 140,000 hectares (346,325 acres), but remained relatively high compared to historical data. The official deforestation data from the Peruvian government for 2018 is slightly higher at 154,700 hectares (382,272 acres), but also represents an important reduction compared to 2017. The deforestation estimate for 2019 indicates the continued downward trend to 134,600 hectares (332,670 acres).
    .
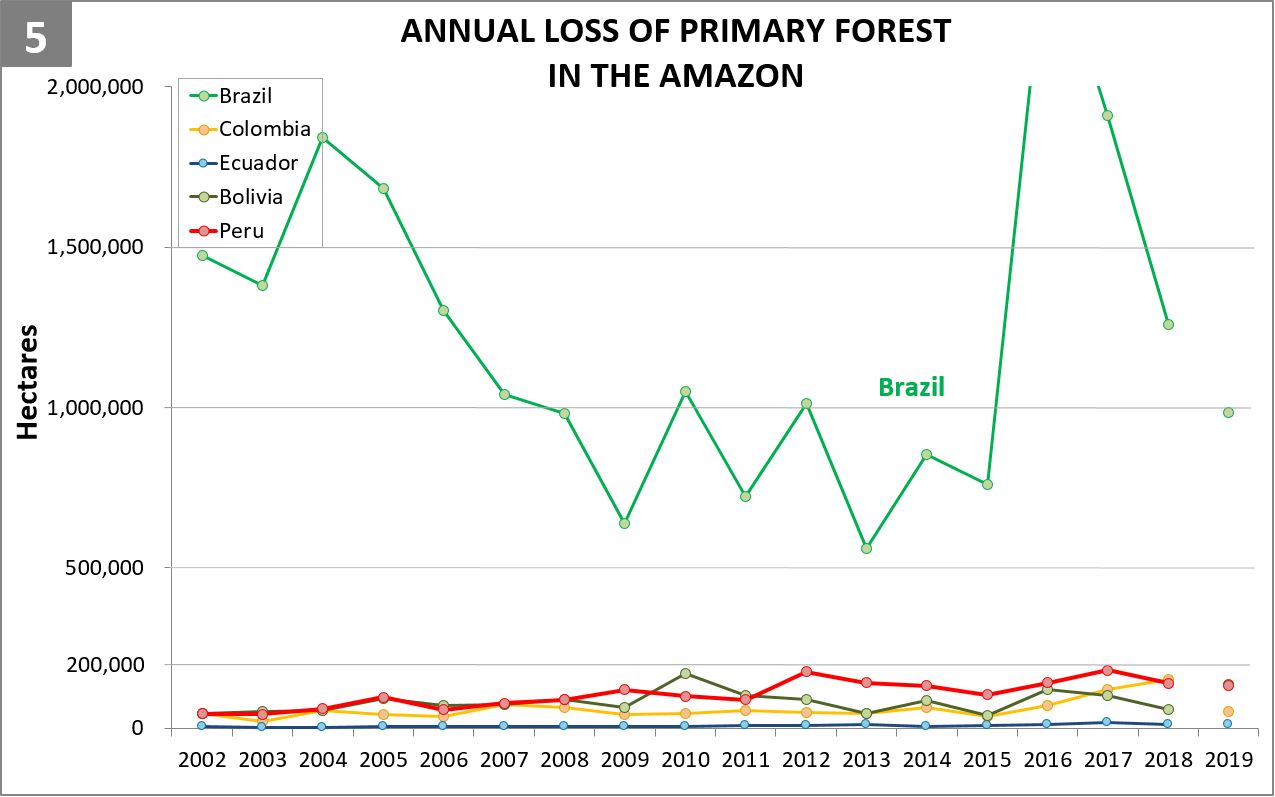
  5. Deforestation in the Brazilian Amazon is on another level compared to the other four countries. The 2019 deforestation estimate of 985,000 hectares (2.4 million acres) is consistent with the official data of the Brazilian government. The trend, however, is quite different; we show a decrease in deforestation compared to the previous three years, but the official data indicates an increase. To better understand the differences between data sources (including spatial resolution, inclusion of burned areas, and timeframe), consult this blog by Global Forest Watch.

Deforestation Hotspots 2019

Base Map. Deforestation Hotspots 2019. Data: MAAP, UMD/GLAD, Hansen/UMD/Google/USGS/NASA. Click to see image in high resolution.

The Base Map shows the most intense deforestation hotspots during 2019.

Many of the major deforestation hotspots were in Brazil. The letters A indicate areas deforested between March and July, and then burned starting in August, covering over 735,000 acres in the states of Rondônia, Amazonas, Mato Grosso, Acre, and Pará (MAAP #113). They also indicate areas where fire escaped into the surrounding primary forest, impacting an additional 395,000 acres. There is a concentration of these hotspots along the Trans-Amazonian Highway. The letter B indicates uncontrolled forest fires earlier in the year (March) in the state of Roraima (MAAP #109).

Bolivia also had an intense 2019 fire season. Letter C indicates the area where fires in Amazonian savanna ecosystems escaped to the surrounding forests.

In Colombia, the letter D indicates an area of high deforestation surrounding and within four protected areas: Tinigua, Chiribiquete, and Macarena National Parks, and the Nukak National Reserve (MAAP #106).

In Peru, there are several key areas to highlight. Letter E indicates a new Mennonite colony that has caused the deforestation of 2,500 acres in 2019, near the town of Tierra Blanca in the Loreto region (MAAP #112). Letter F indicates an area of high concentration of small-scale deforestation in the central Amazon (Ucayali and Huánuco regions), with cattle ranching as one of the main causes (MAAP #37). Letter G indicates an area of high concentration of deforestation along the Ene River (Junín and Ayacucho regions). In the south (Madre de Dios region), letter H indicates expanding agricultural activity around the town of Iberia (MAAP #98) and letter I indicates deforestation caused by a combination of gold mining and agricultural activity.

Methodology

As noted above, there are three important considerations about the data in our analysis: First, as a baseline, we use annual forest loss from the University of Maryland to have a consistent source across all five countries. Thus, the values may differ from official national data. Second, we applied a filter to only include loss of primary forest in order to better approximate the official methodology and data. Third, the 2019 data represents a preliminary estimate based on early warning alerts.

The baseline forest loss data presented in this report were generated by the Global Land Analysis and Discovery (GLAD) laboratory at the University of Maryland (Hansen et al 2013) and presented by Global Forest Watch. Our study area is strictly what is highlighted in the Base Map.

Specifically, for our estimate of forest cover loss, we multiplied the annual “forest cover loss” data by the density percentage of the “tree cover” from the year 2001 (values >30%).

For our estimate of primary forest loss, we intersected the forest cover loss data with the additional dataset “primary humid tropical forests” as of 2001 (Turubanova et al 2018). For more details on this part of the methodology, see the Technical Blog from Global Forest Watch (Goldman and Weisse 2019).

All data were processed under the geographical coordinate system WGS 1984. To calculate the areas in metric units the UTM (Universal Transversal Mercator) projection was used: Peru and Ecuador 18 South, Colombia 18 North, Western Brazil 19 South and Bolivia 20 South.

Lastly, to identify the deforestation hotspots, we conducted a kernel density estimate. This type of analysis calculates the magnitude per unit area of a particular phenomenon, in this case forest cover loss. We conducted this analysis using the Kernel Density tool from Spatial Analyst Tool Box of ArcGIS. We used the following parameters:

Search Radius: 15000 layer units (meters)
Kernel Density Function: Quartic kernel function
Cell Size in the map: 200 x 200 meters (4 hectares)
Everything else was left to the default setting.

For the Base Map, we used the following concentration percentages: Medium: 10%-20%; High: 21%-35%; Very High: >35%.

References

Goldman L, Weisse M (2019) Explicación de la Actualización de Datos de 2018 de Global Forest Watch. https://blog.globalforestwatch.org/data-and-research/blog-tecnico-explicacion-de-la-actualizacion-de-datos-de-2018-de-global-forest-watch

Hansen, M. C., P. V. Potapov, R. Moore, M. Hancher, S. A. Turubanova, A. Tyukavina, D. Thau, S. V. Stehman, S. J. Goetz, T. R. Loveland, A. Kommareddy, A. Egorov, L. Chini, C. O. Justice, and J. R. G. Townshend. 2013. “High-Resolution Global Maps of 21st-Century Forest Cover Change.” Science 342 (15 November): 850–53. Data available on-line from: http://earthenginepartners.appspot.com/science-2013-global-forest.

Planet Team (2017). Planet Application Program Interface: In Space for Life on Earth. San Francisco, CA. https://api.planet.com

Turubanova S., Potapov P., Tyukavina, A., and Hansen M. (2018) Ongoing primary forest loss in Brazil, Democratic Republic of the Congo, and Indonesia. Environmental Research Letters  https://doi.org/10.1088/1748-9326/aacd1c 

Acknowledgements

Agradecemos a S. Novoa (ACCA), R. Botero (FCDS), A. Condor (ACCA) y G. Palacios por sus útiles comentarios a este reporte.

Acknowledgements

We thank S. Novoa (ACCA), R. Botero (FCDS), A. Condor (ACCA), A. Folhadella (Amazon Conservation), M. Cohen, and G. Palacios for helpful comments to earlier versions of this report.

This work was supported by the following major funders: NASA/USAID (SERVIR), Norwegian Agency for Development Cooperation (NORAD), Gordon and Betty Moore Foundation, International Conservation Fund of Canada (ICFC), Metabolic Studio, Erol Foundation, MacArthur Foundation, and Global Forest Watch Small Grants Fund (WRI).

Citation

Finer M, Mamani N (2020) MAAP Synthesis: 2019 Amazon Deforestation Trends and Hotspots. MAAP Synthesis #4.

MAAP #108: Understanding the Amazon Fires with Satellites, part 2

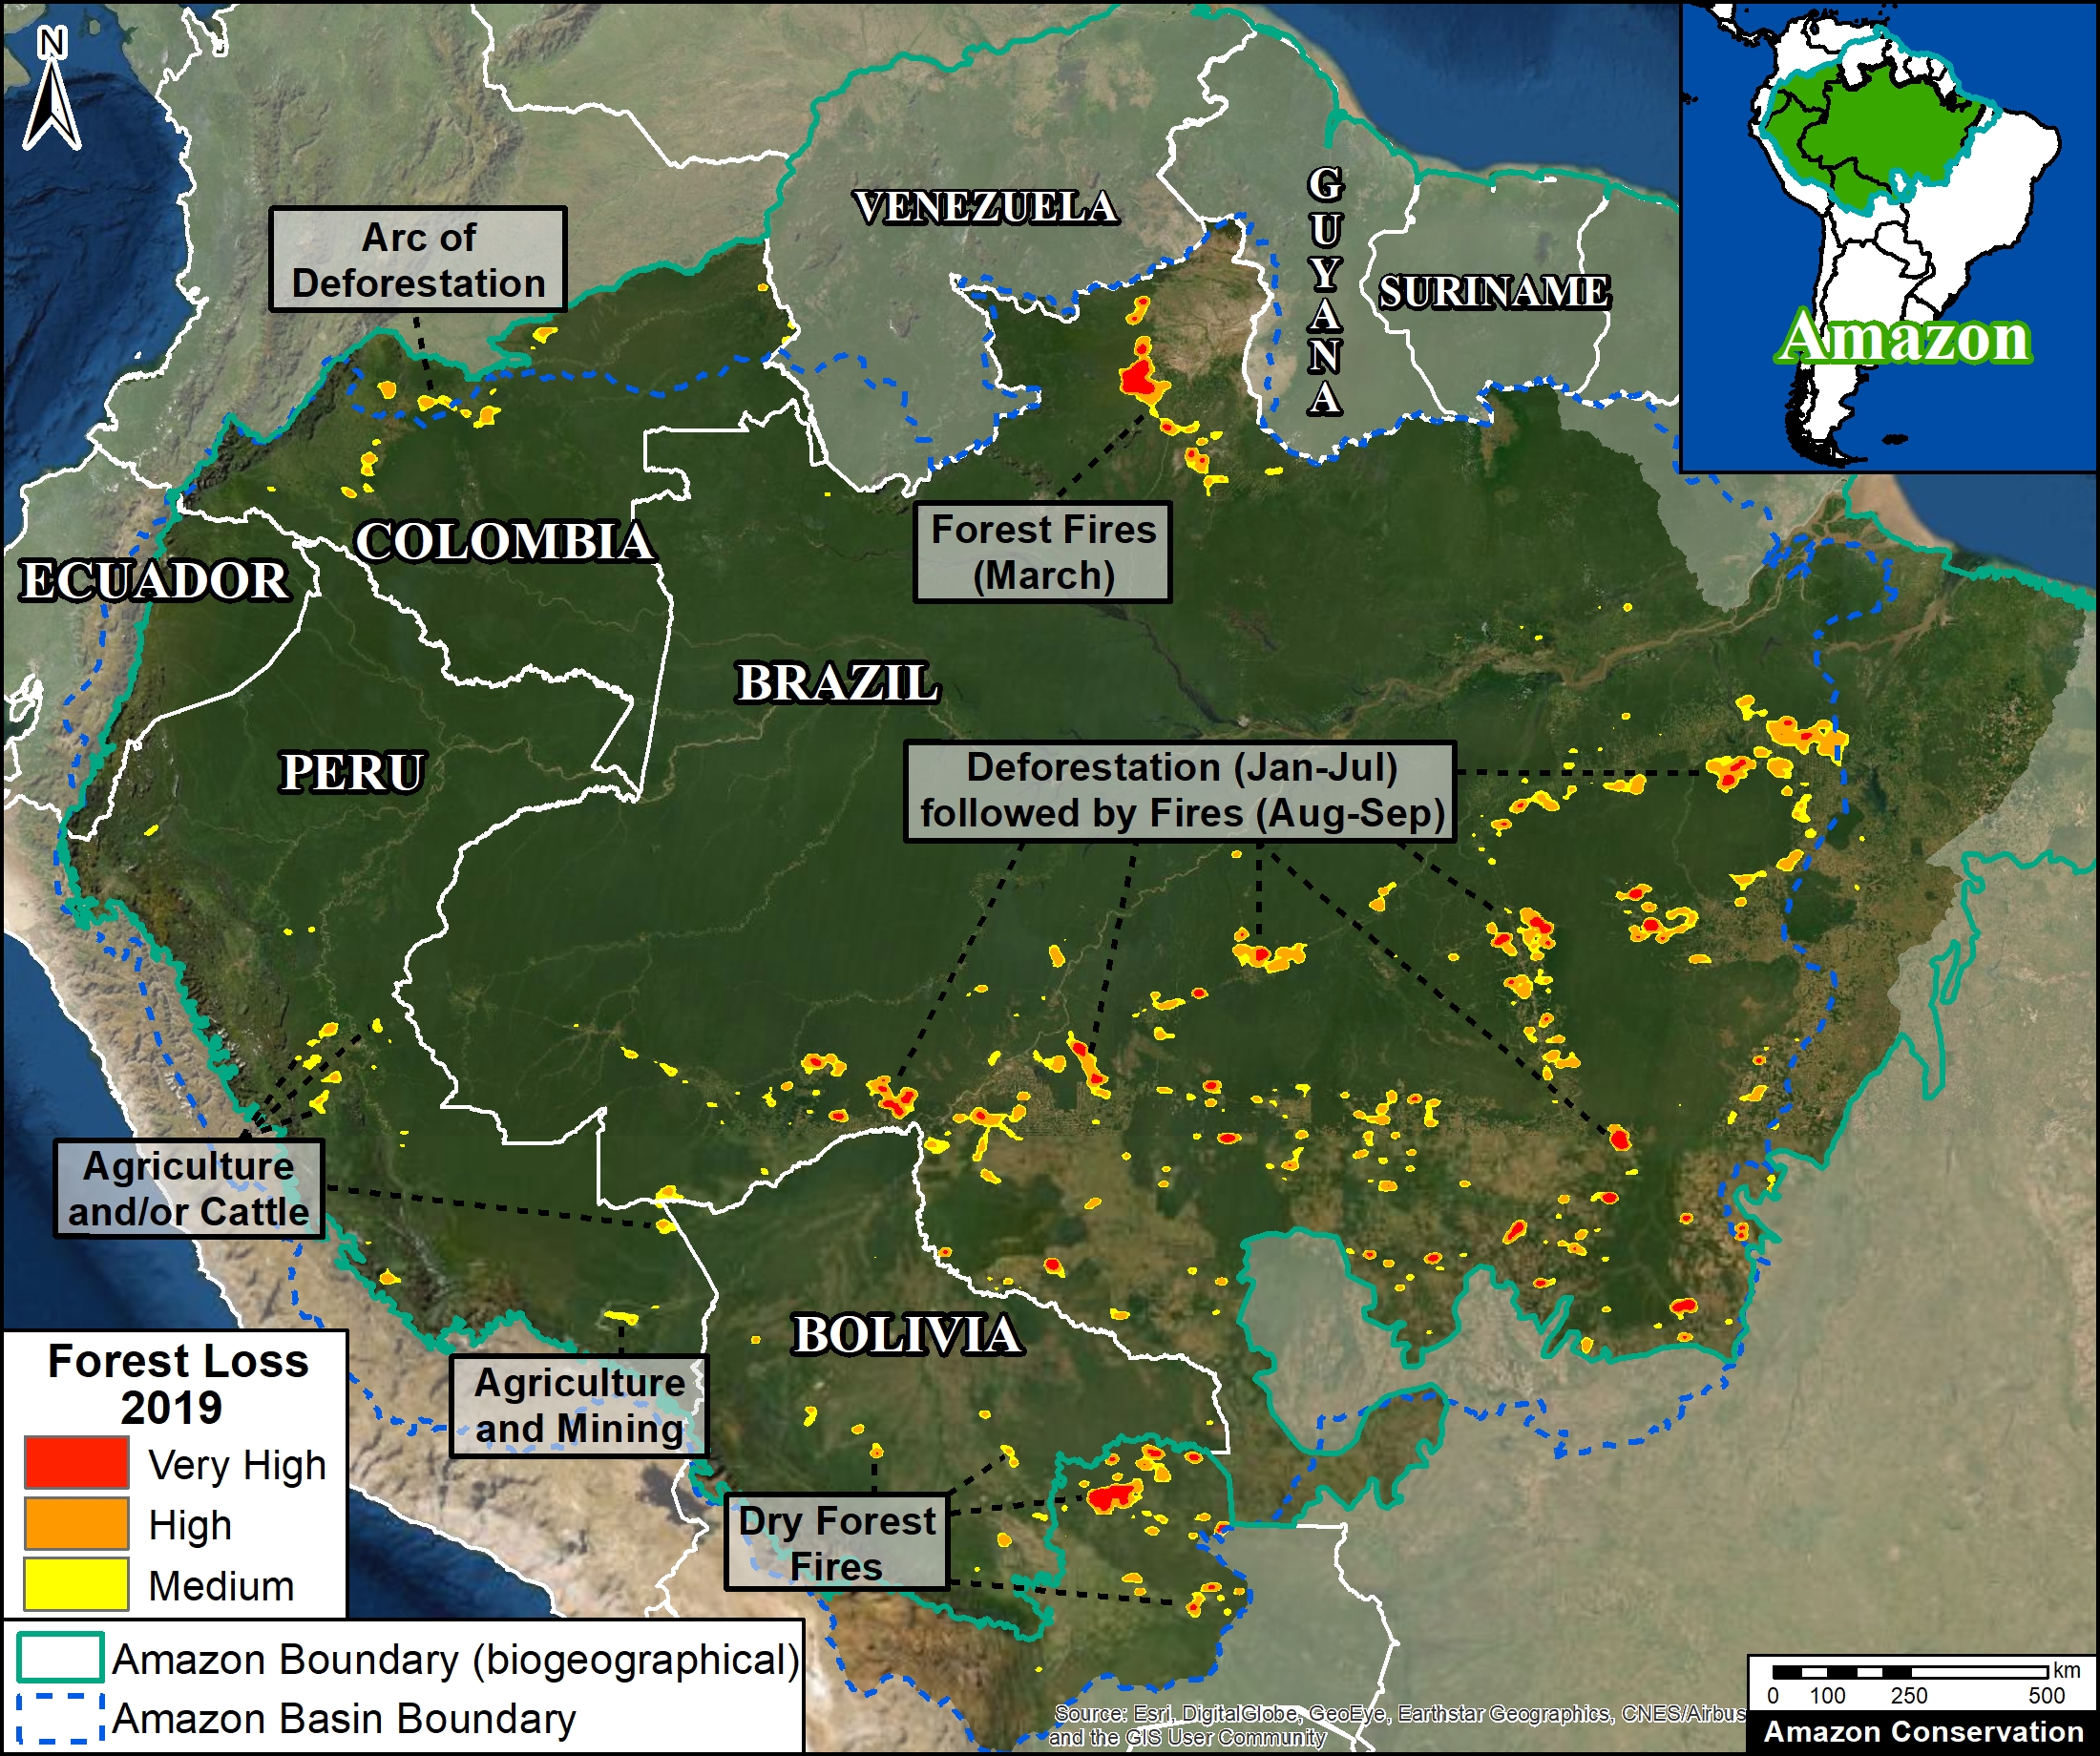
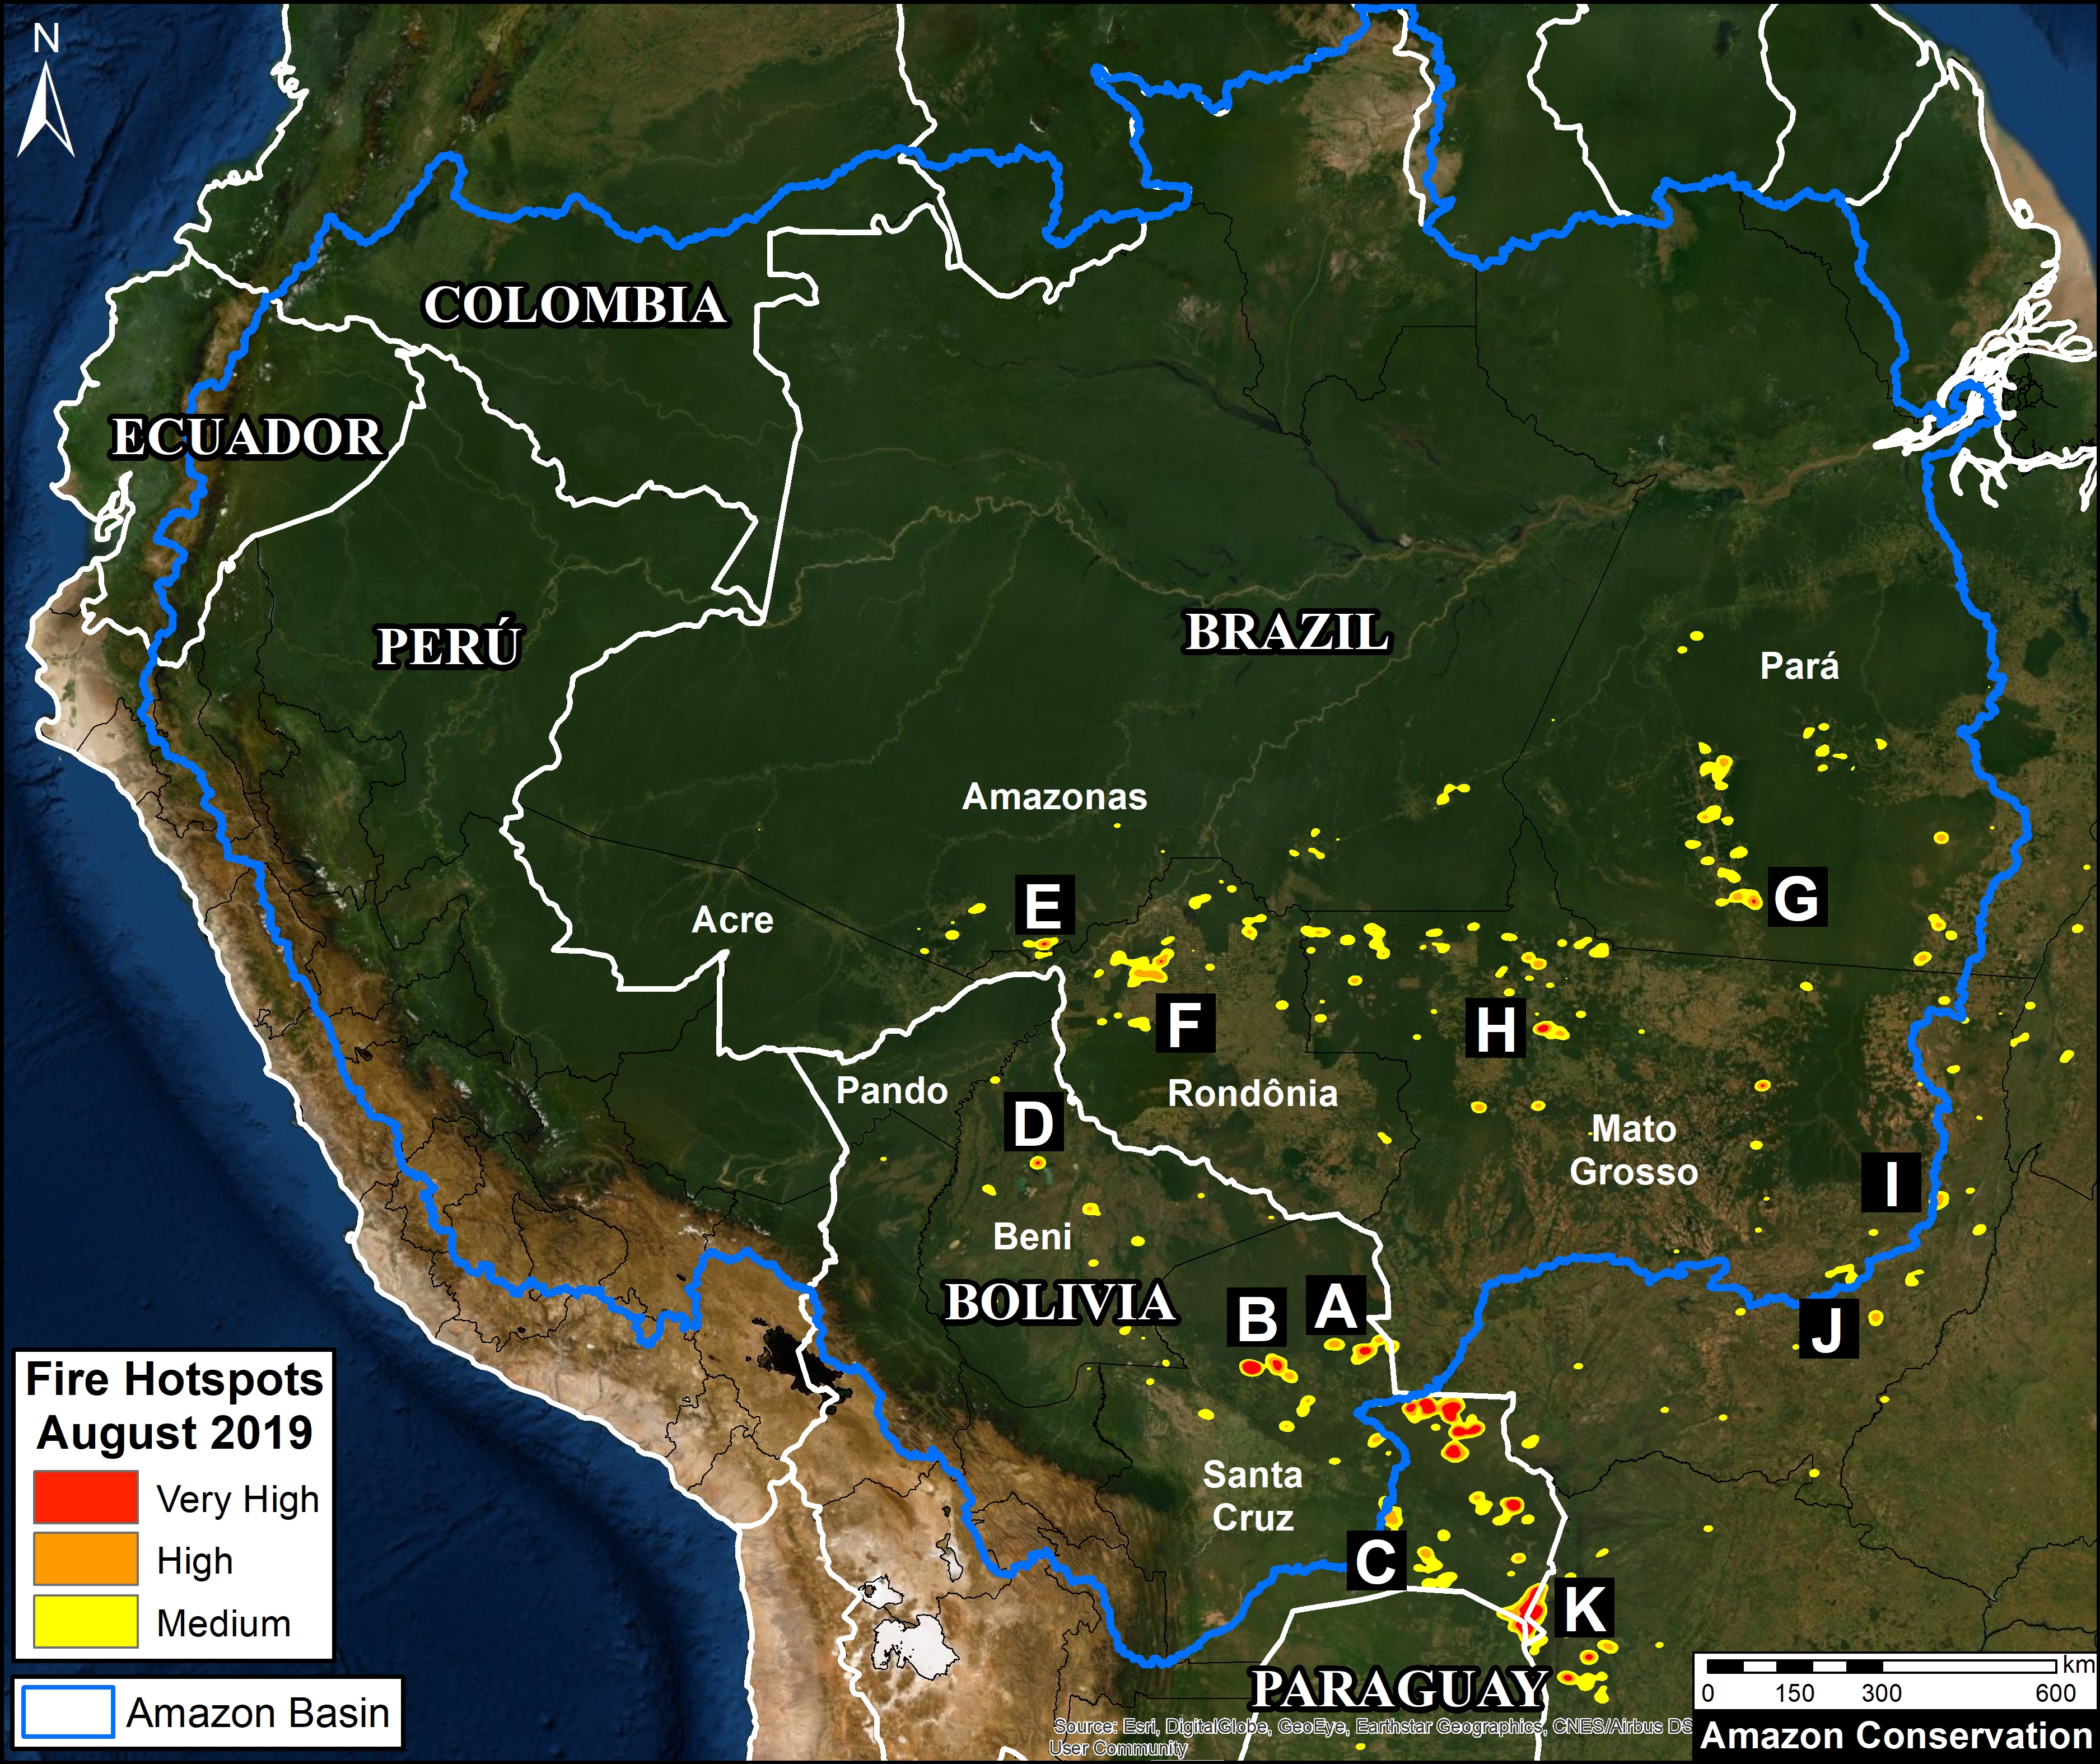
Base Map. Updated Amazon fire hotspots map, August 20-26, 2019. Red, Orange, and Yellow indicate the highest concentrations of fire, as detected by NASA satellites that detect fires at 375 meter resolution. Data. VIIRS/NASA, MAAP.

Here we present an updated analysis on the Amazon fires, as part of our ongoing coverage and building off what we reported in MAAP #107.

First, we show an updated Base Map of the “fire hotspots” across the Amazon, based on very recent fire alerts (August 20-26). Hotspots (shown in red, orange, and yellow) indicate the highest concentrations of fire as detected by NASA satellites.

Our key findings include:

– The major fires do NOT appear to be in the northern and central Brazilian Amazon characterized by tall moist forest (Rondônia, Acre, Amazonas, Pará states),* but in the drier southern Amazon of Brazil and Bolivia characterized by dry forest and shrubland (Mato Grosso and Santa Cruz).

– The most intense fires are actually to the south of the Amazon, along the border of Bolivia and Paraguay, in areas characterized by drier ecosystems.

– Most of the fires in the Brazilian Amazon appear to be associated with agricultural lands. Fires at the agriculture-forest boundary may be expanding plantations or escaping into forest, including indigenous territories and protected areas.

– The large number of agriculture-related fires in Brazil highlights a critical point: much of the eastern Amazon has been transformed into a massive agricultural landscape over the past several decades. The fires are a lagging indicator of massive previous deforestation.

– We continue to warn against using satellite-based fire detection data alone as a measure of impact to Amazonian forests. Many of the detected fires are in agricultural areas that were once forest, but don’t currently represent forest fires.

In conclusion, the classic image of wildfires scorching everything in their path are currently more accurate for the unique and biodiverse dry forests of the southern Amazon then the moist forests to the north. However, the numerous fires at the agriculture-moist forest boundary are both a threat and stark reminder of how much forest has been, and continues to be, lost by deforestation.

Next, we show a series of 11 satellite images that show what the fires look like in major hotspots and how they are impacting Amazonian forests. The location of each image corresponds to the letters (A-K) on the Base Map.

*If anyone has detailed information to the contrary, please send spatial coordinates to maap@amazonconservation.org

Zooms A, B: Chiquitano Dry Forest (Bolivia)

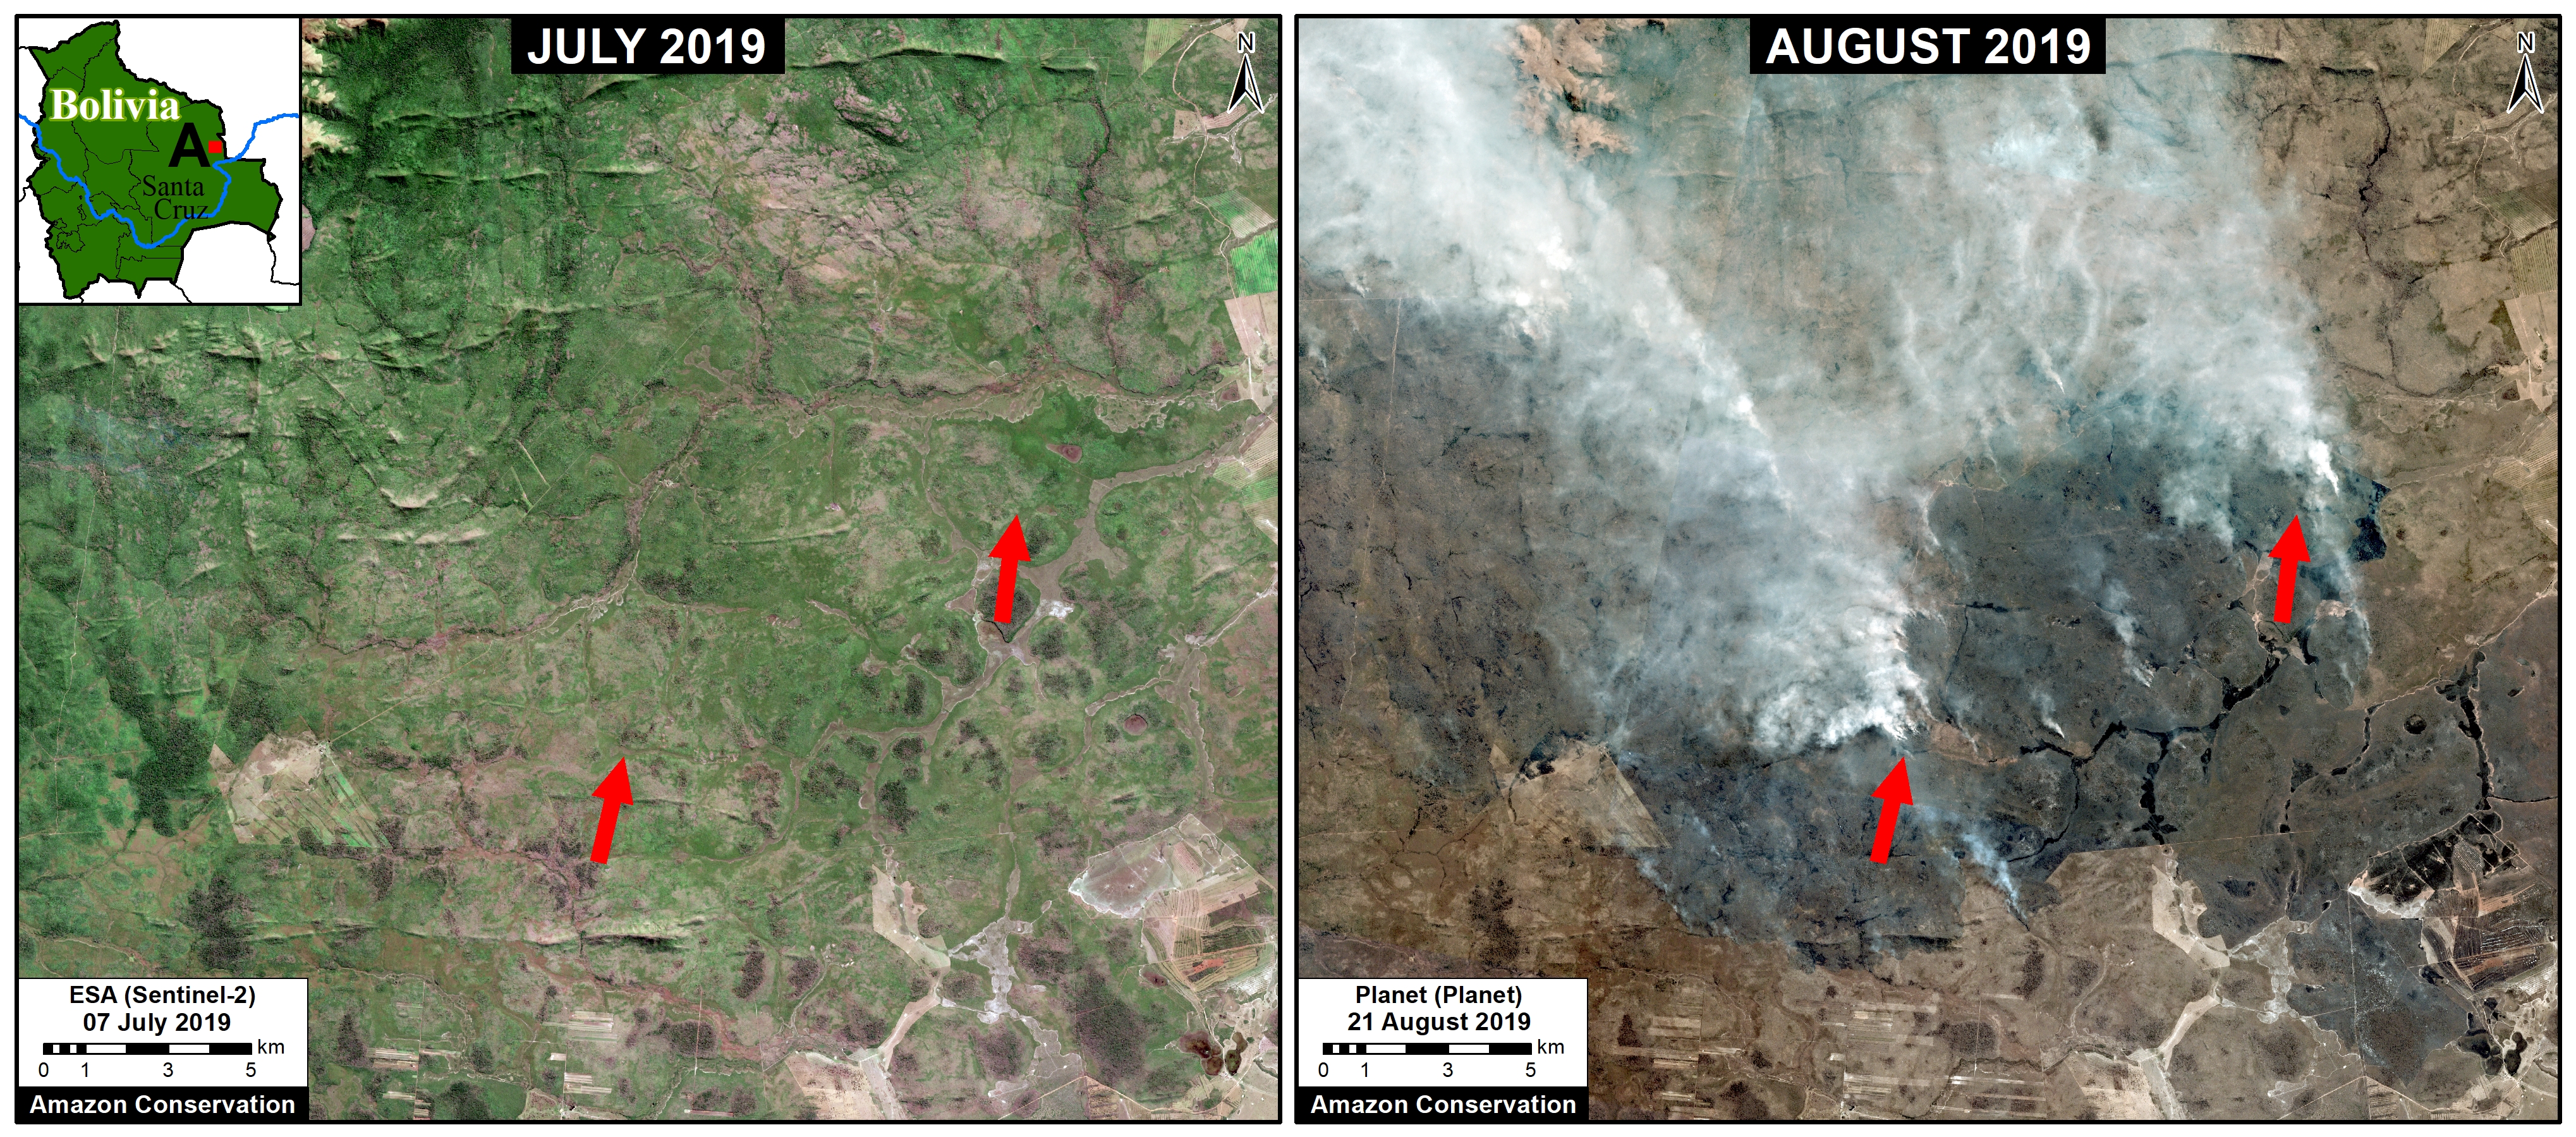
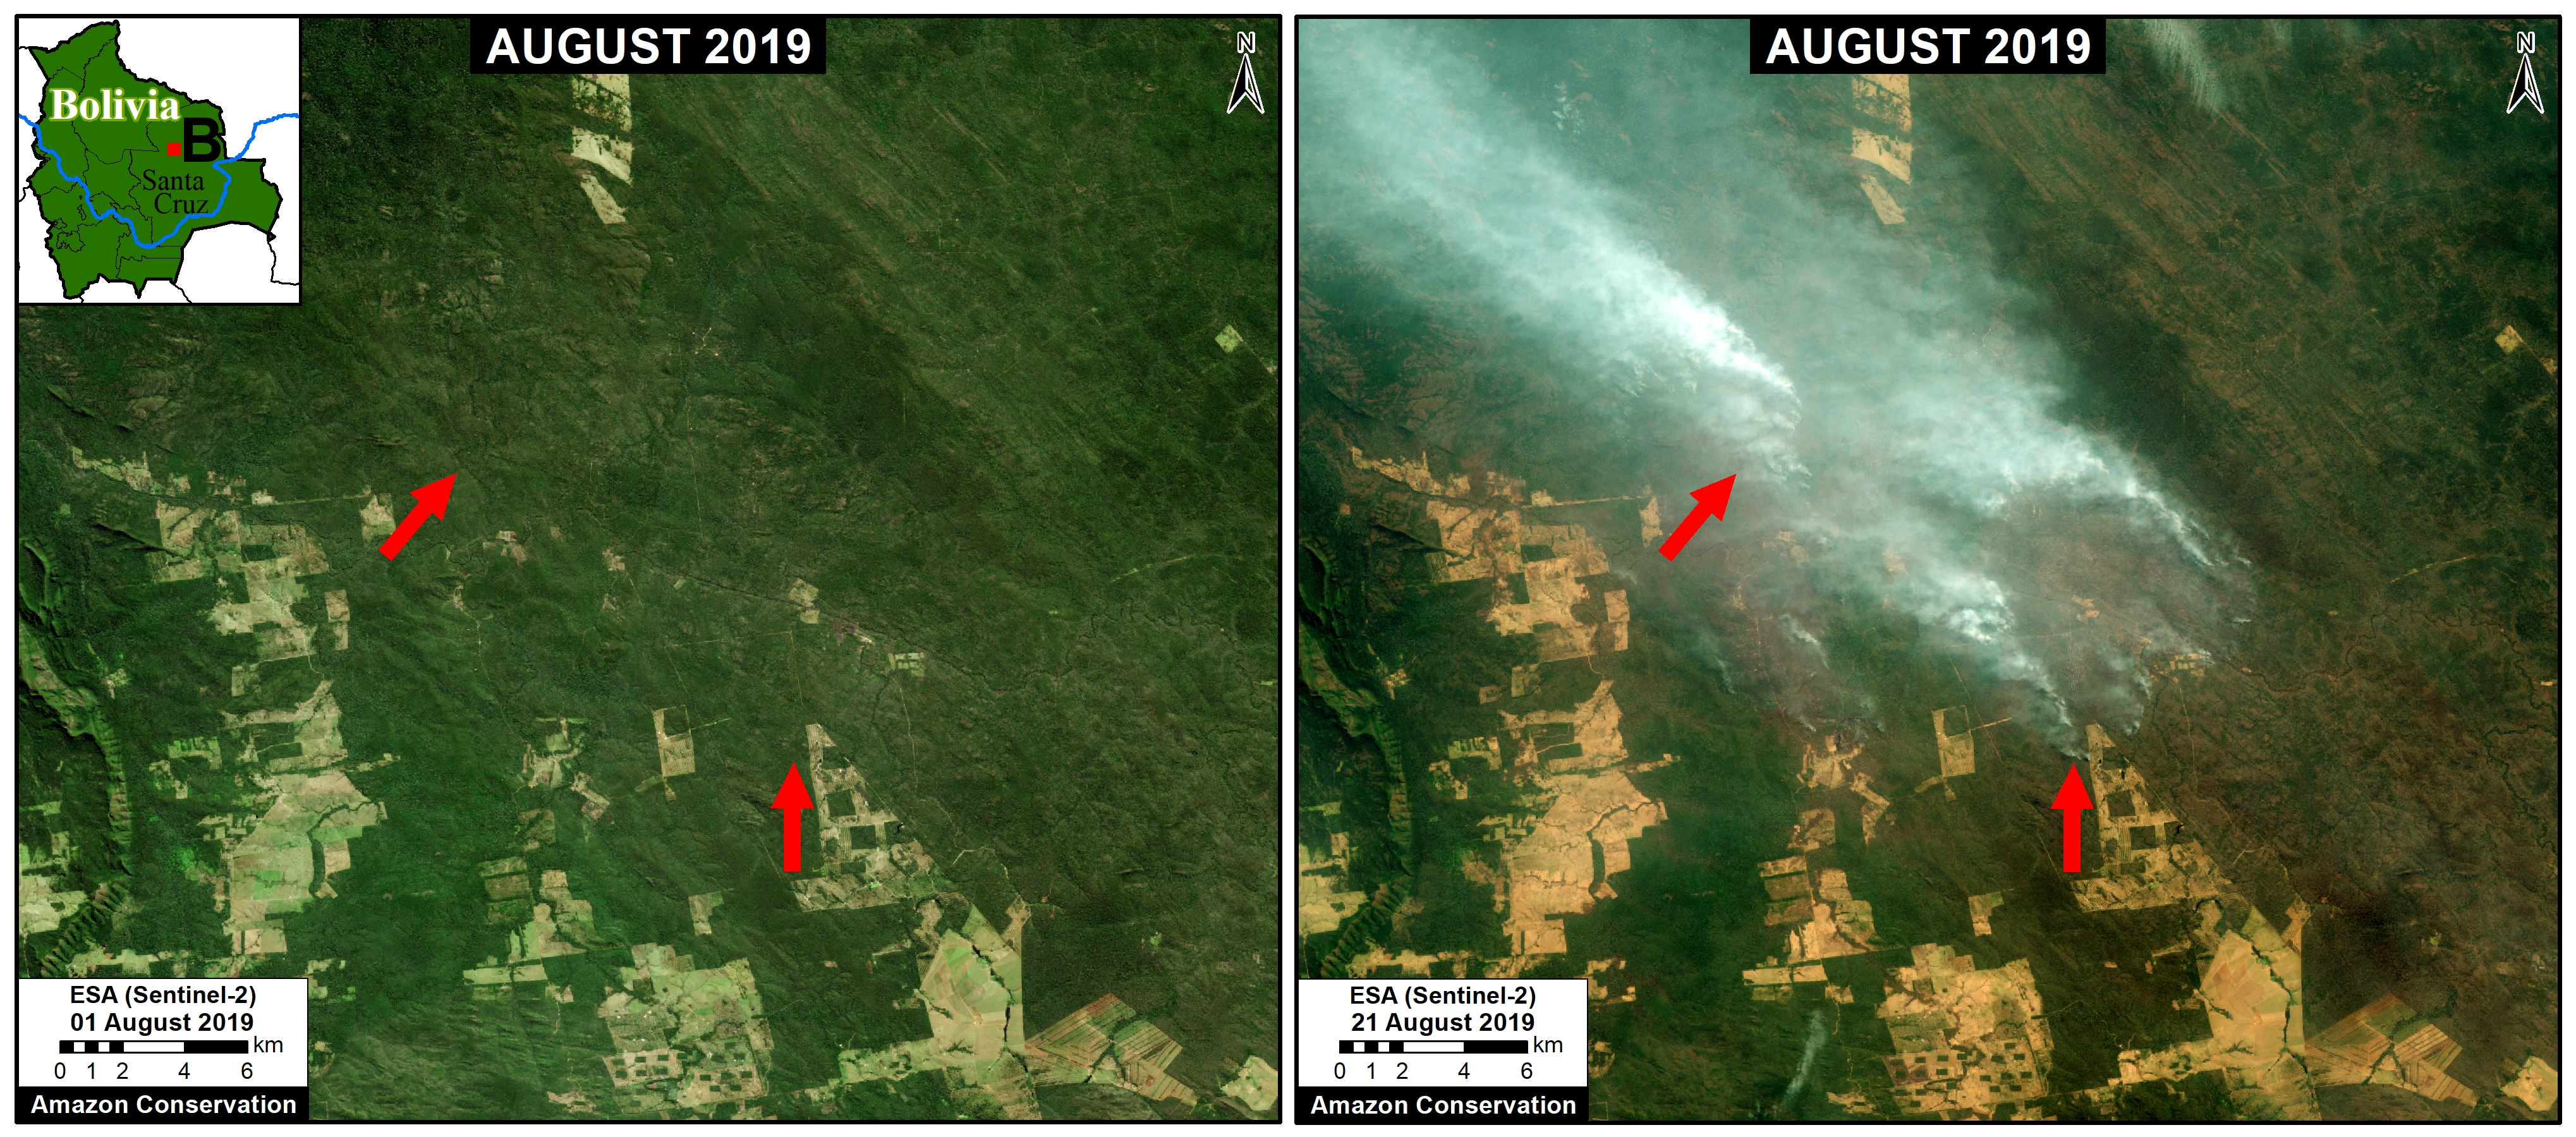
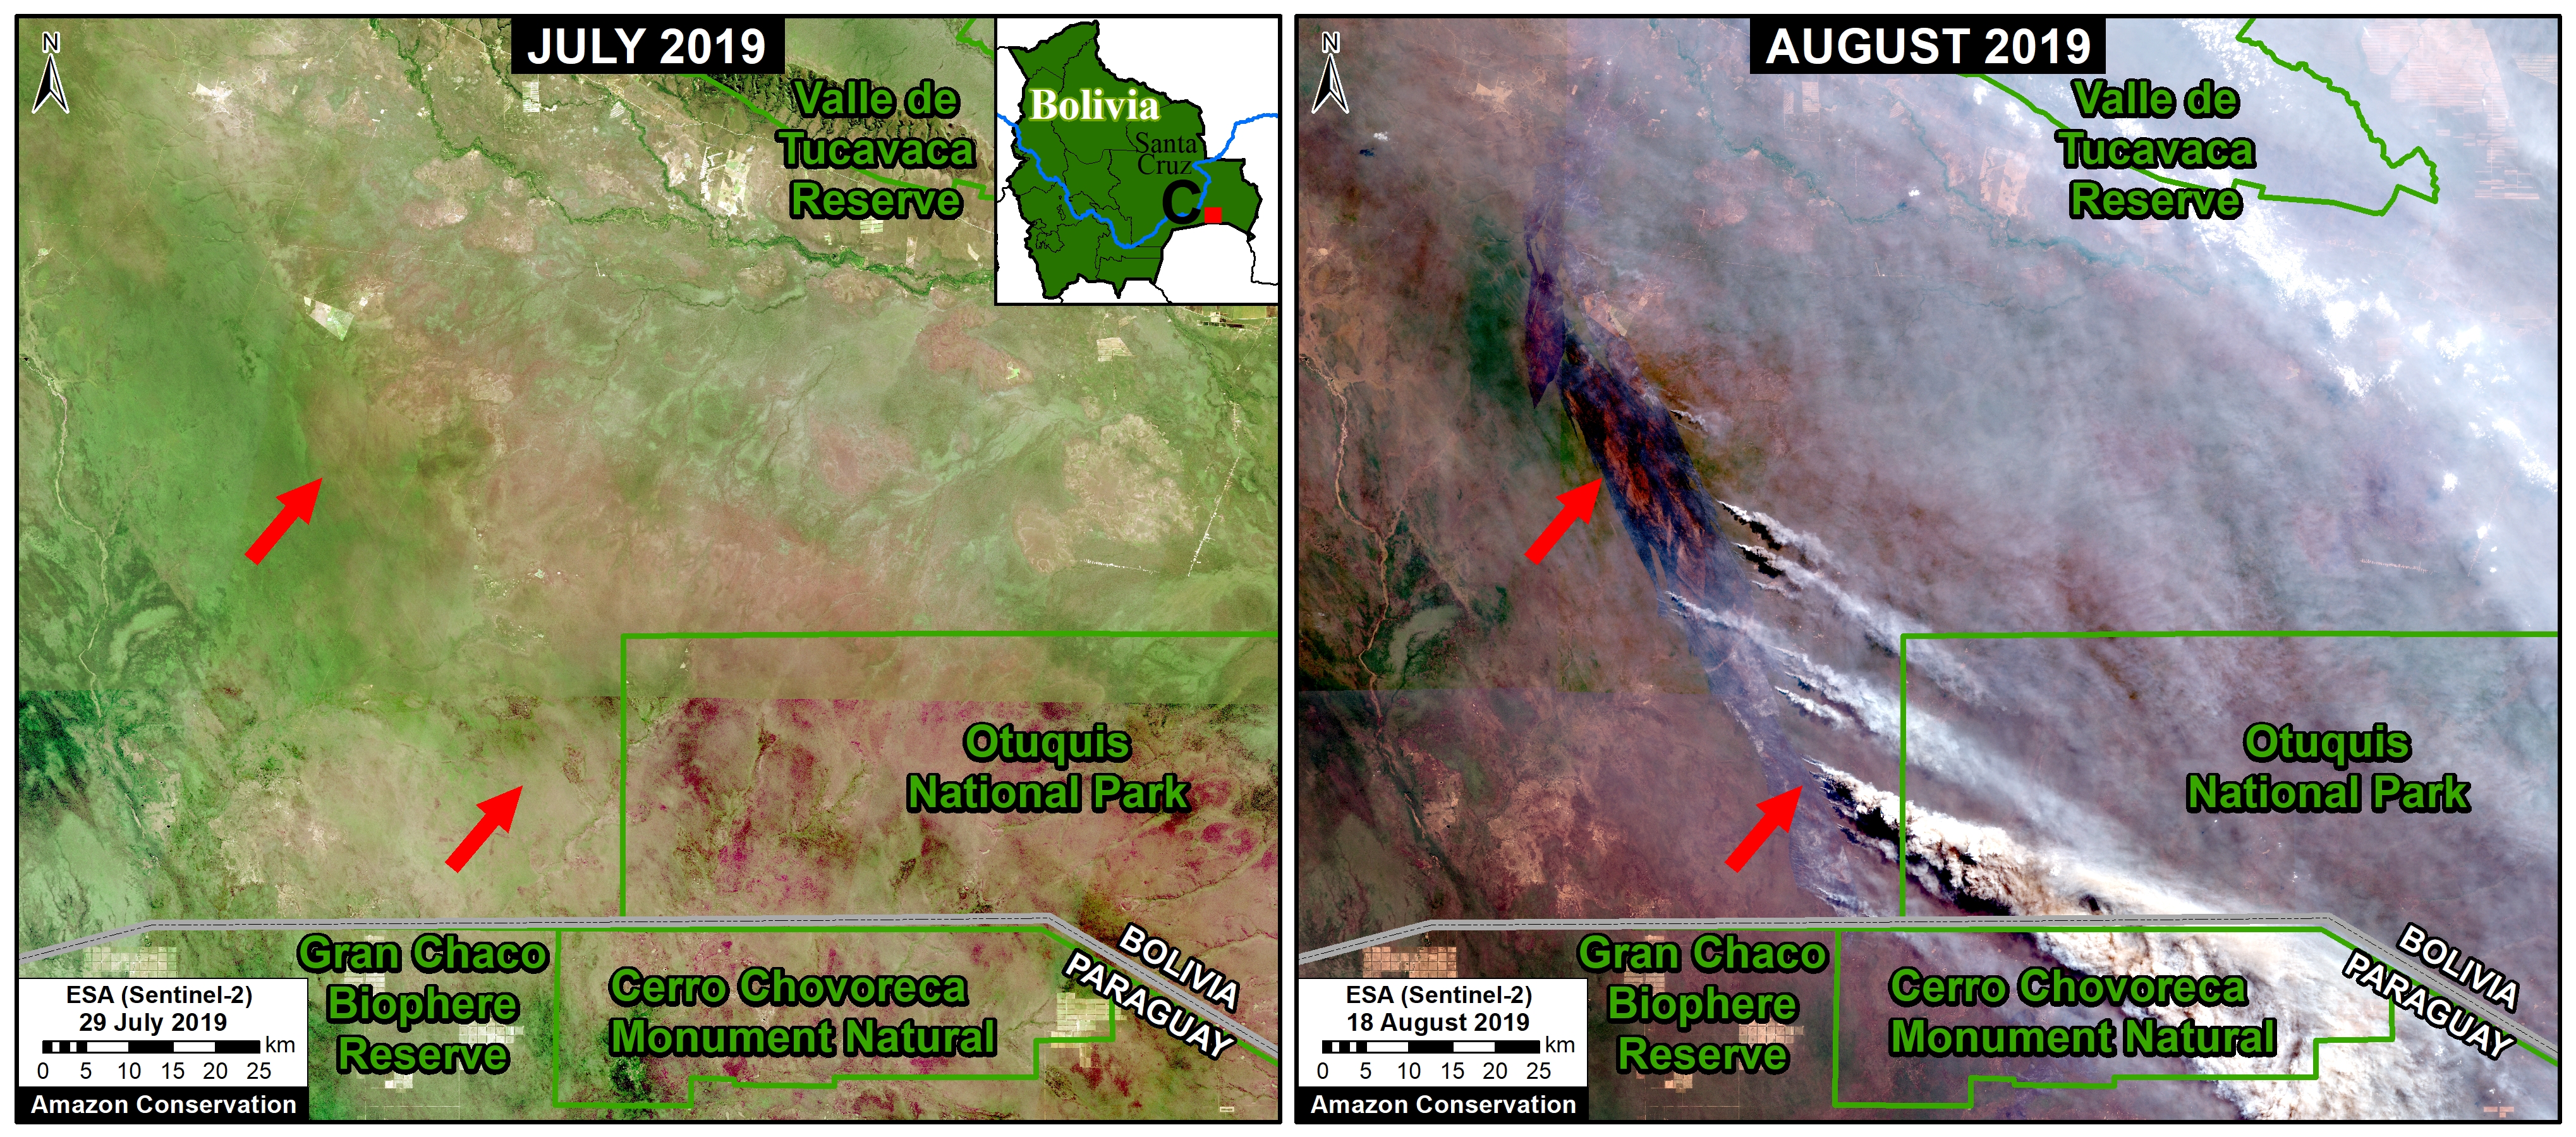
Some of the most intense fires are concentrated in the dry Chiquitano of southern Bolivia. The Chiquitano is part of the largest tropical dry forest in the world and is a unique, high biodiversity, and poorly explored Amazonian ecosystem. Zooms A-C illustrate fires in the Chiquitano between August 18-21 of this year, likely burning a mixture of dry forest, scrubland, and grassland.

Zoom A. Recent fires in the dry Chiquitano of southern Bolivia. Data: Planet.
Zoom B. Recent fires in the dry Chiquitano of southern Bolivia. Data: Planet.

Zoom D: Beni Grasslands (Bolivia)

Zoom D shows recent fires and burned areas in Bolivia’s Beni grasslands.

Zoom D. Recent fires and burned areas in Bolivia’s Beni grasslands. Data: ESA.

Zooms E,F,G,H: Brazilian Amazon (Amazonas, Rondônia, Pará, Mato Grosso)

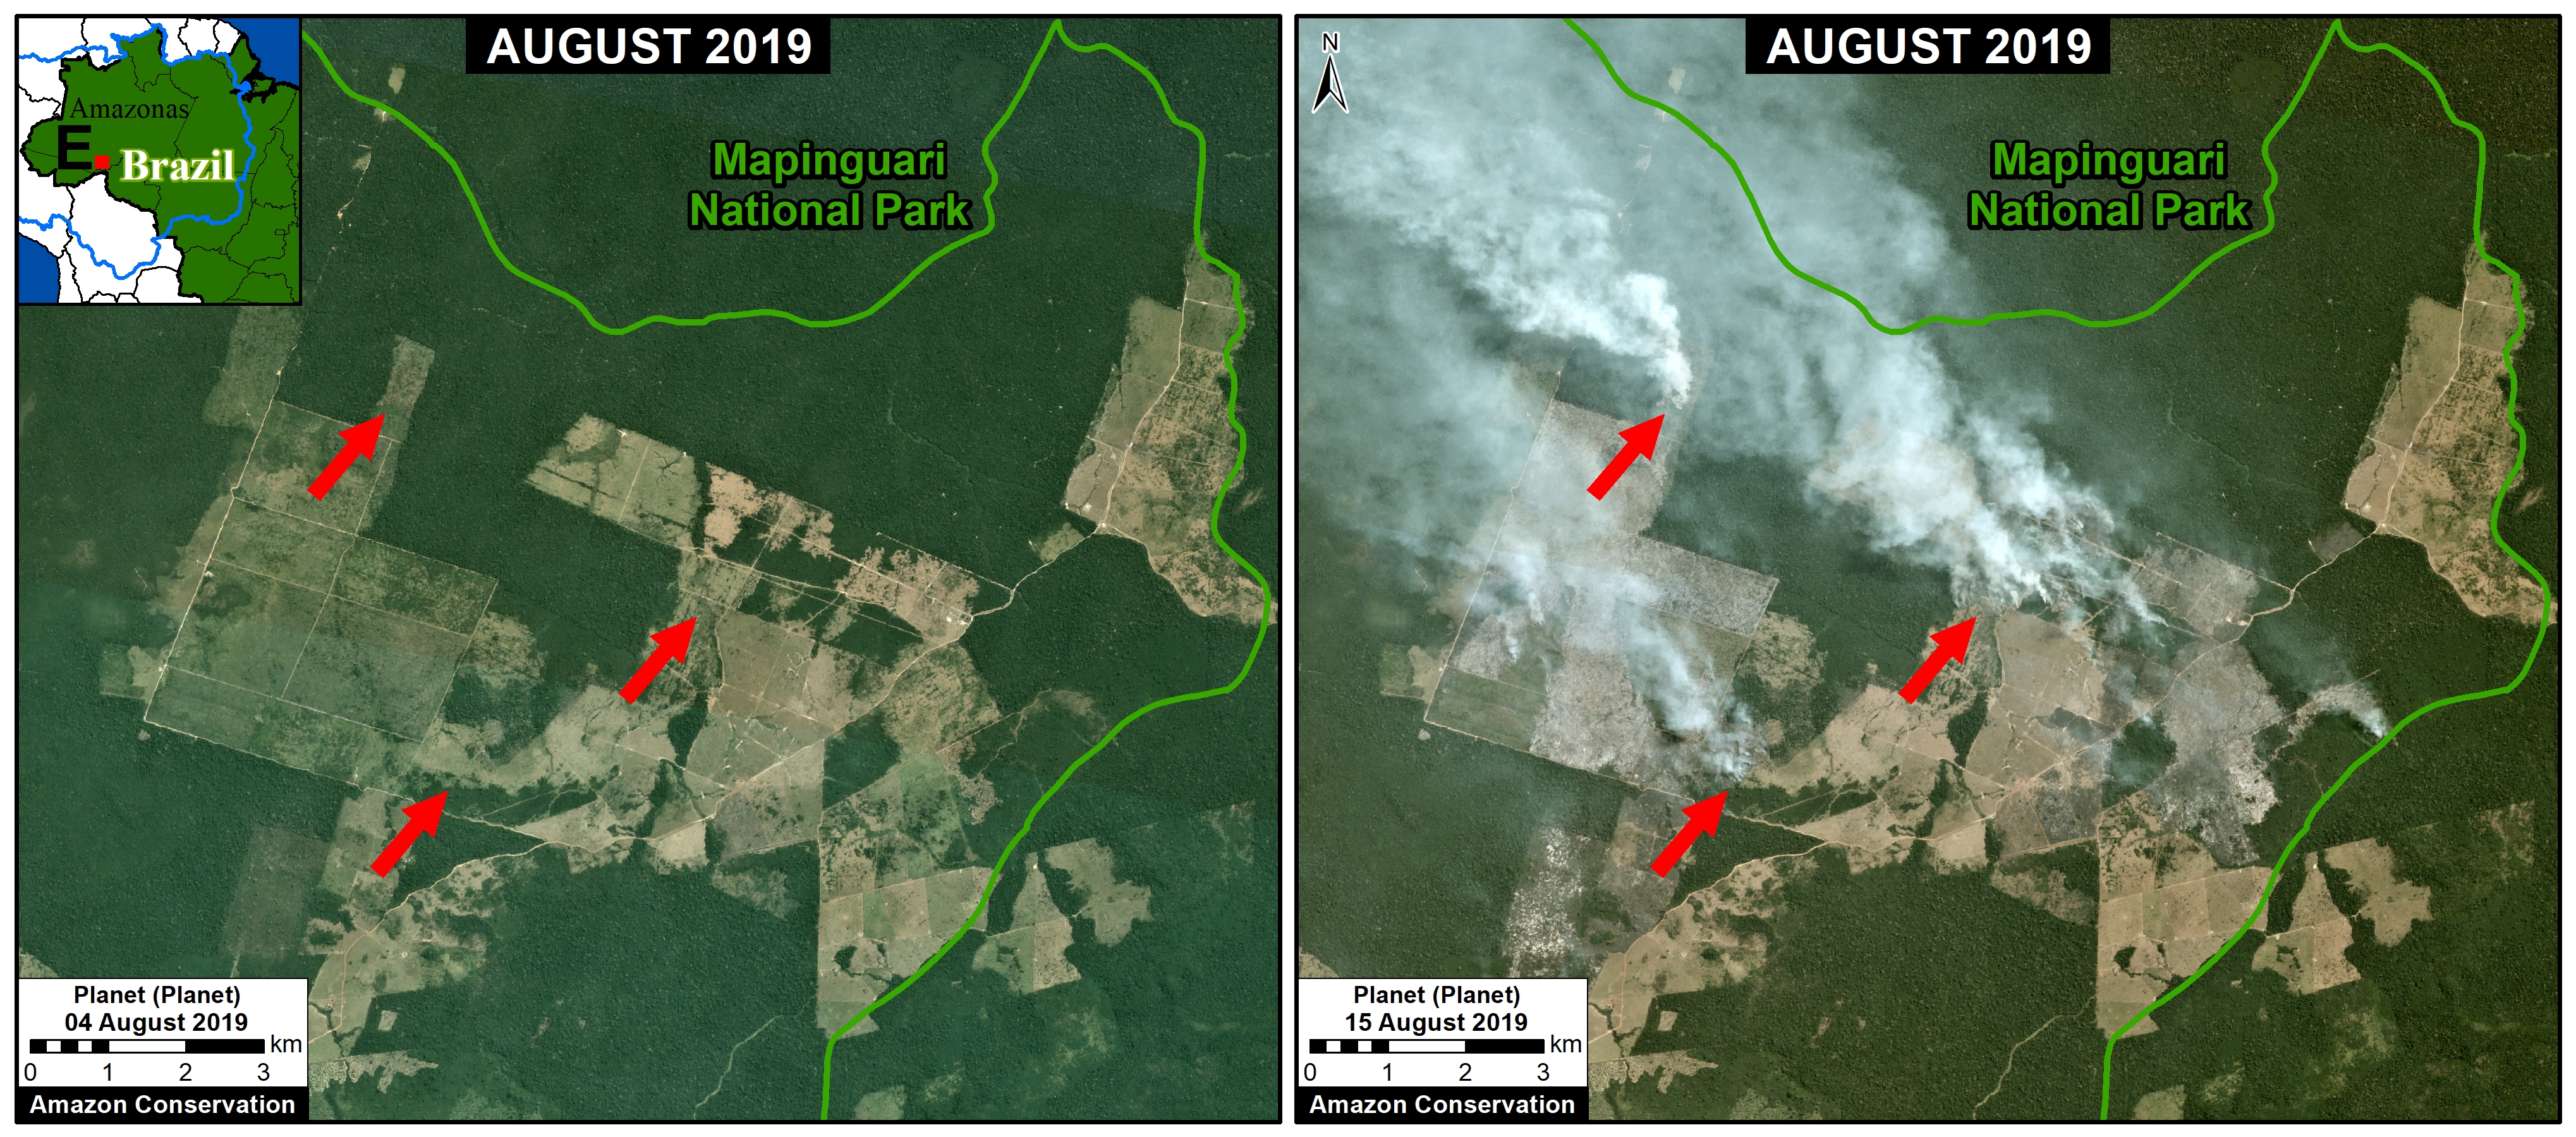
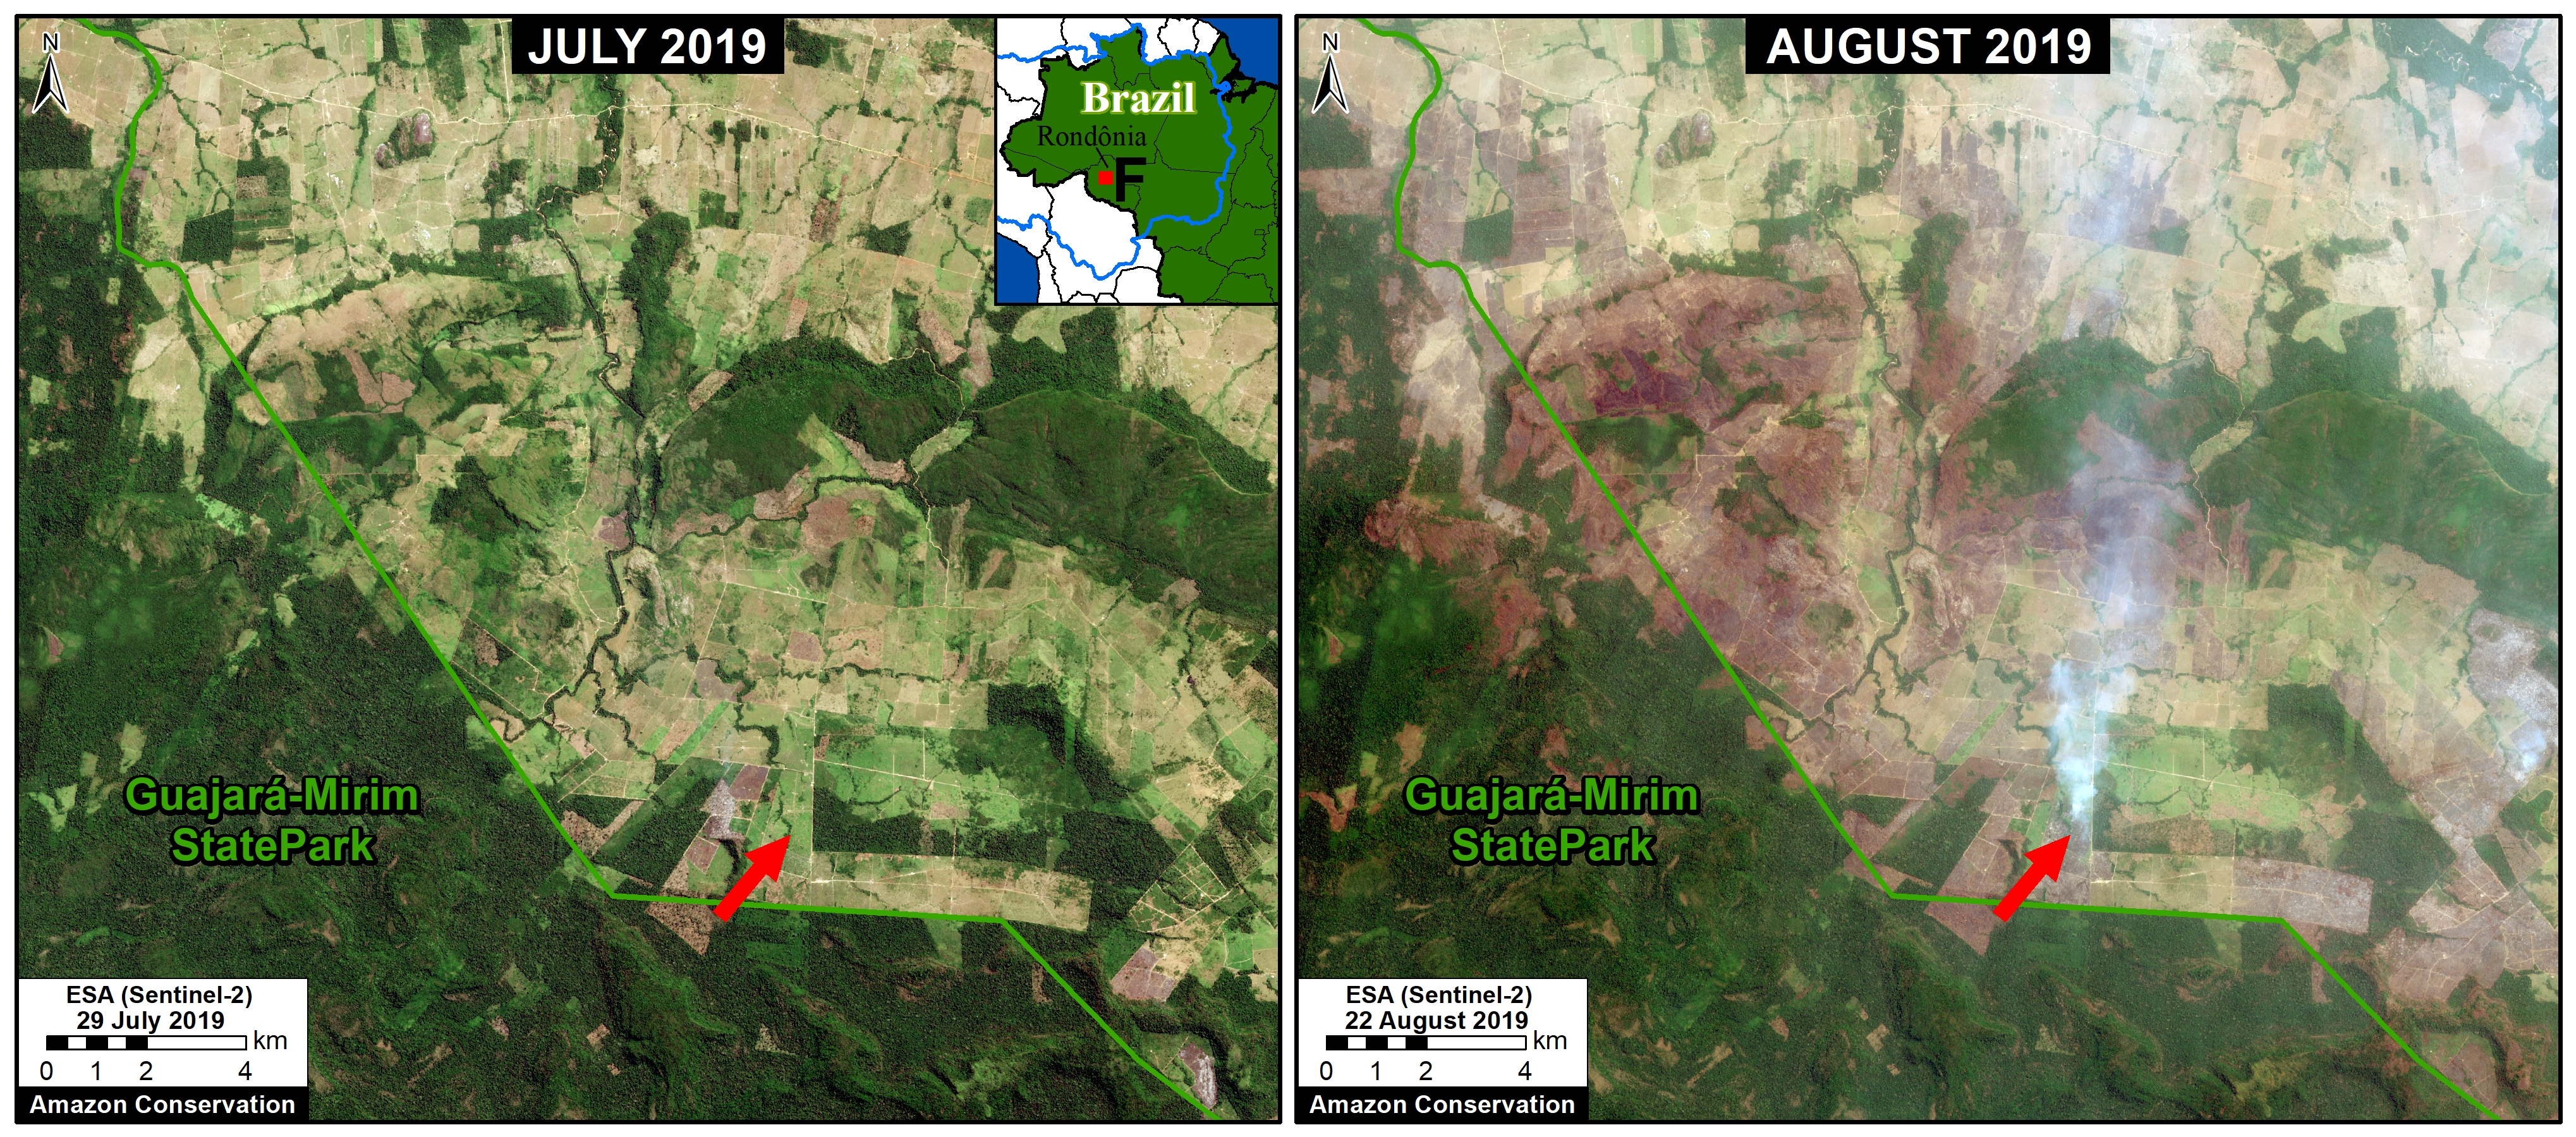
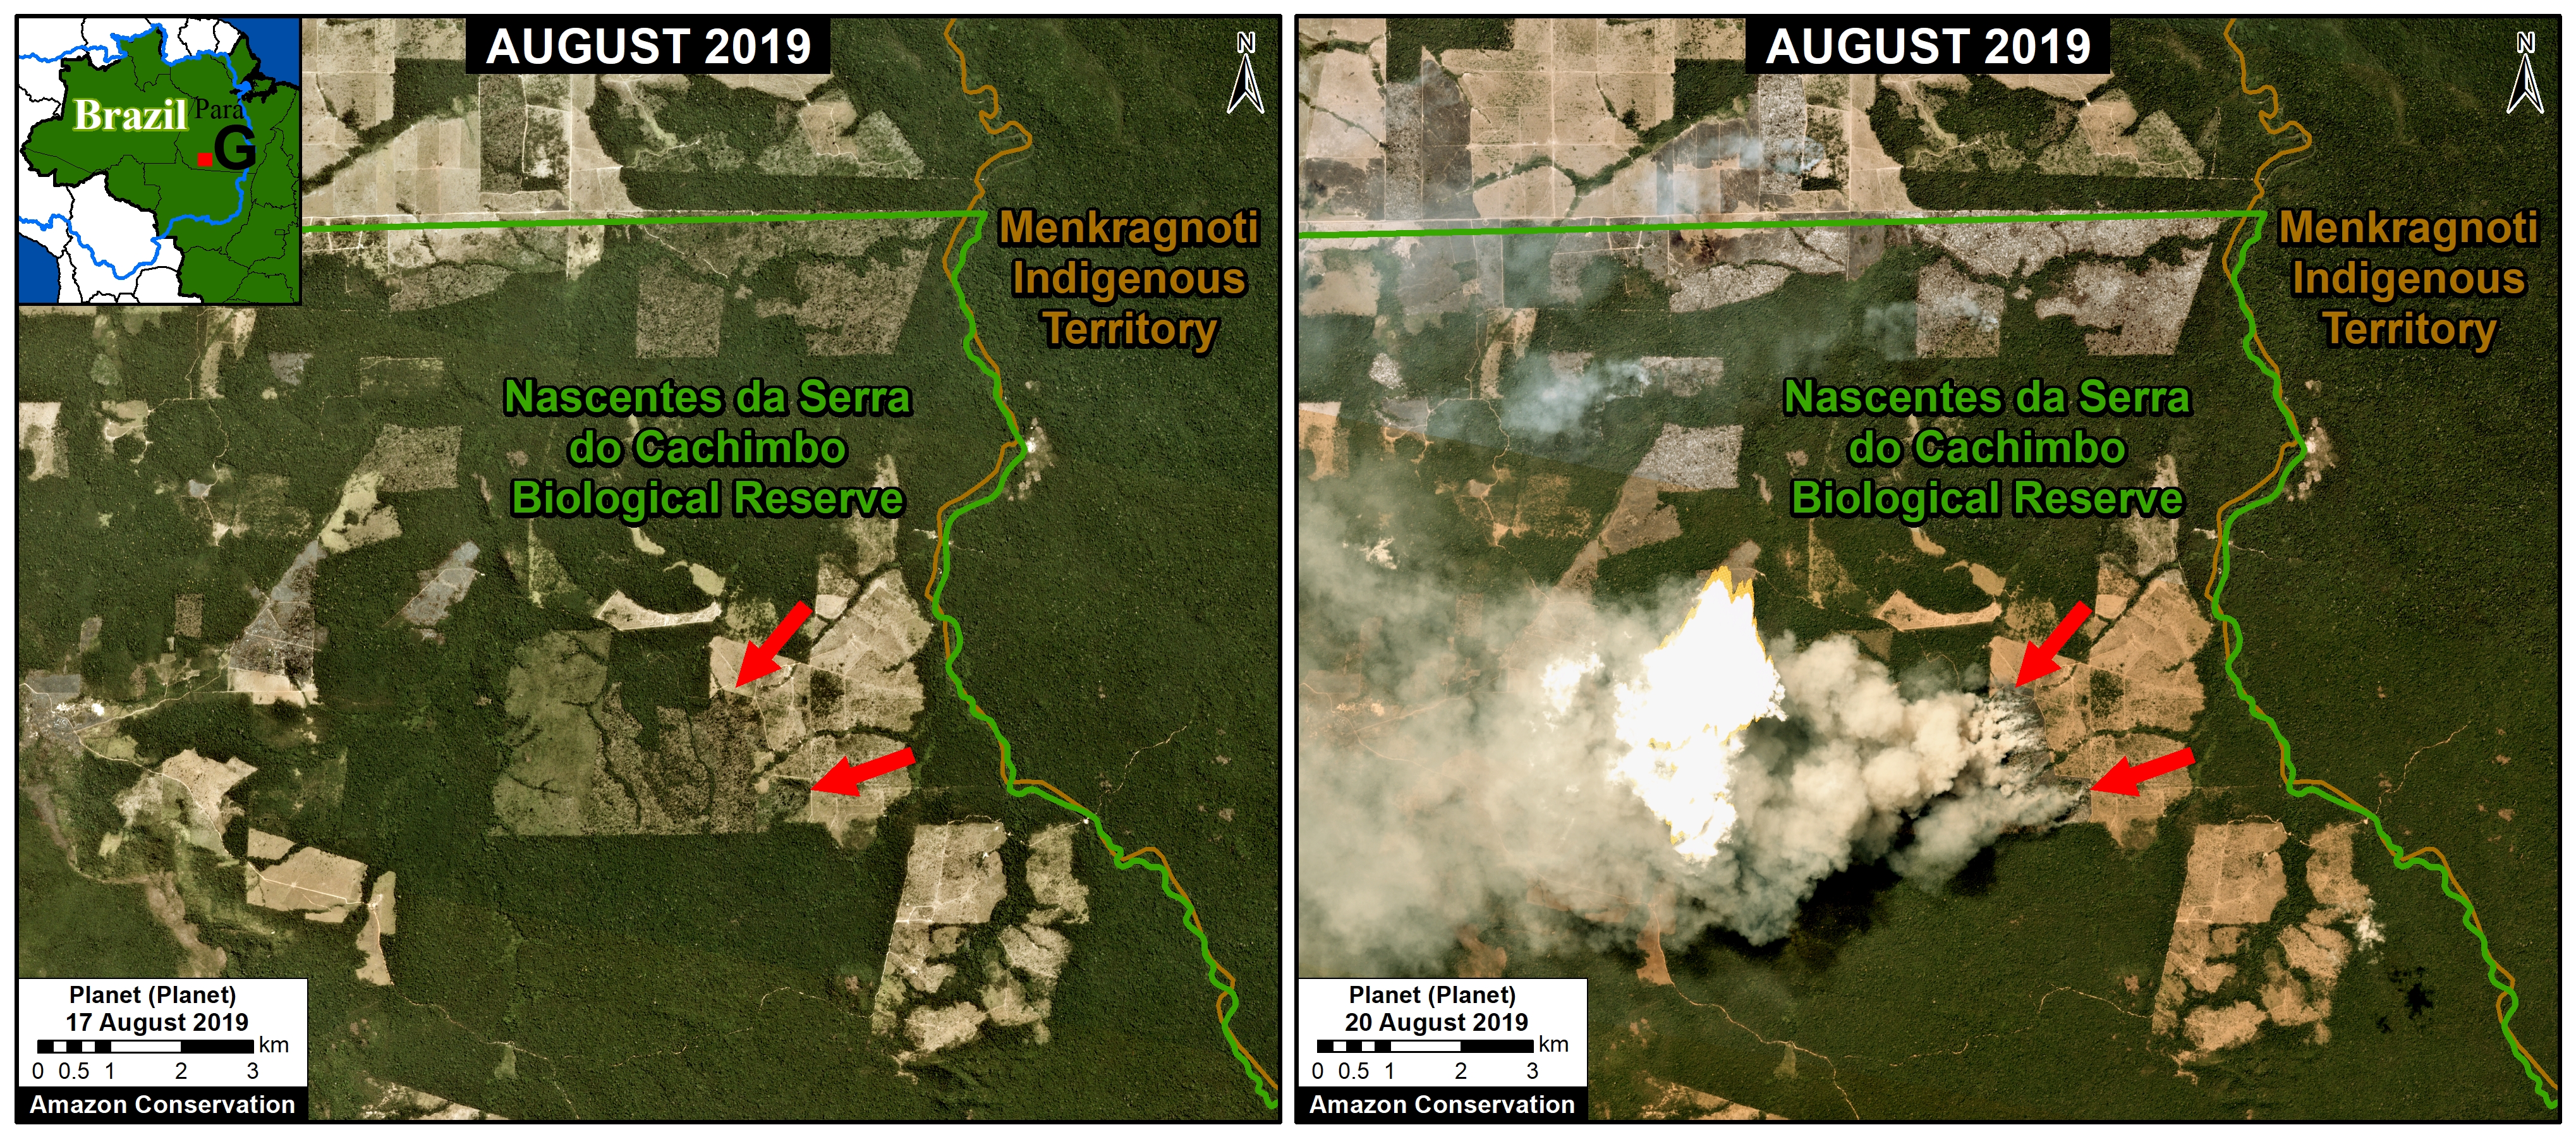
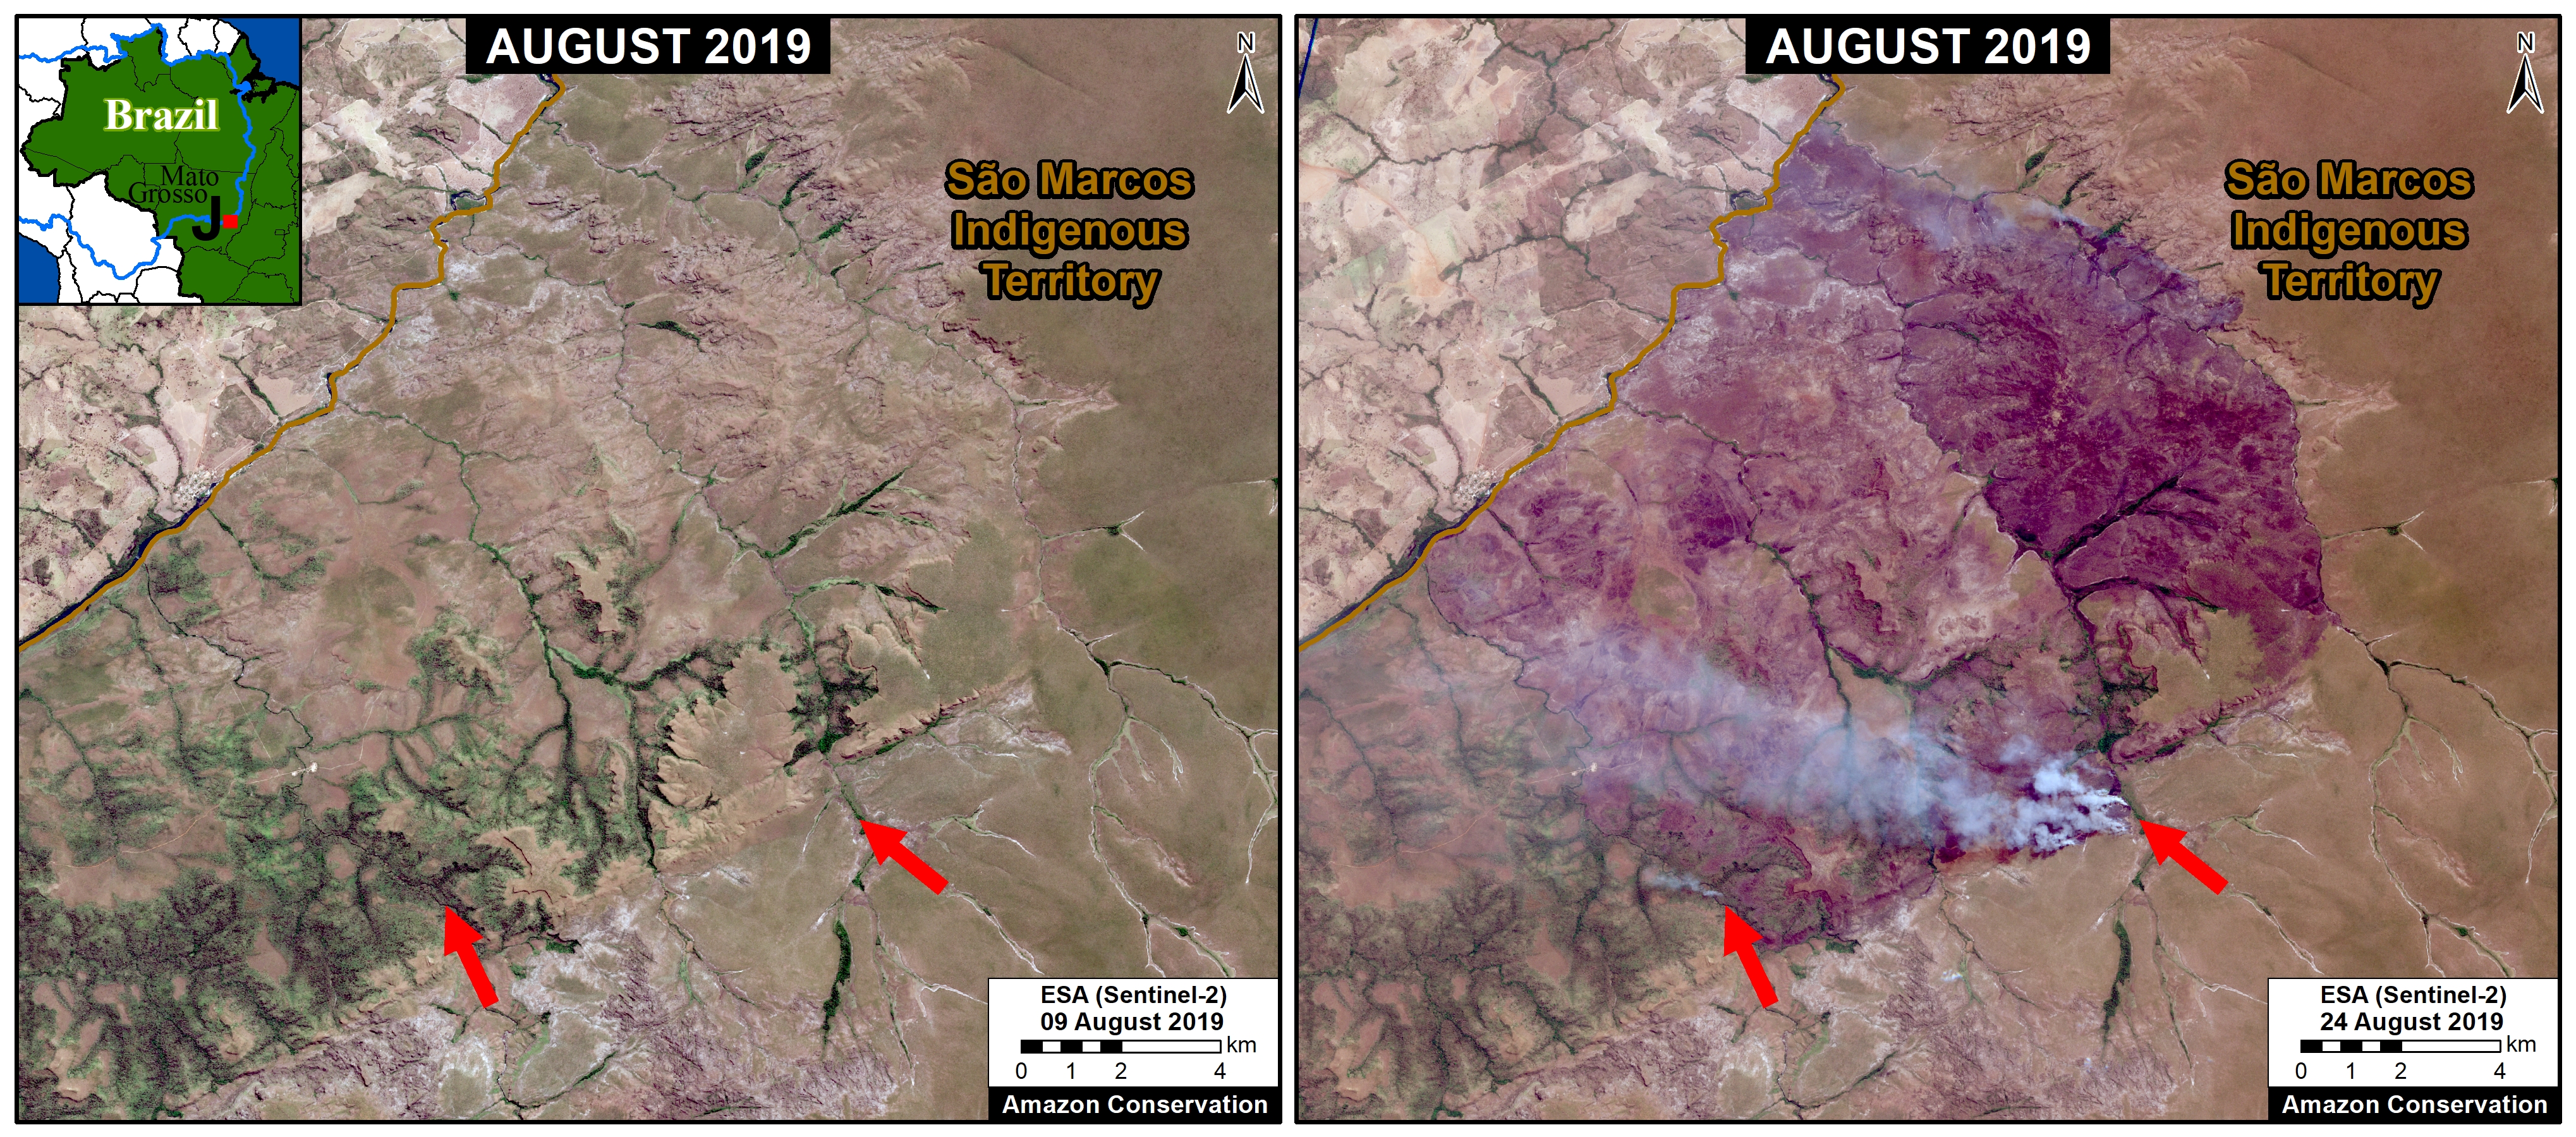
Zoom E-H take us to moist forest forests of the Brazilian Amazon, where much of the media and social media attention has been focused. All fires we have seen in this area are in agricultural fields or at the agriculture-forest boundary. Note Zoom E is just outside a national park in Amazonas state; Zoom F shows fires at the agriculture-forest boundary in Rondônia state; Zoom G shows fires at the agriculture-forest boundary within a protected area in Pará state; and Zoom H shows fires at the agriculture-forest boundary in Mato Grosso state.

Zoom E. Fires at the agriculture-forest boundary outside a national park in Amazonas state. Data: Planet.
Zoom F. Fires at the agriculture-forest boundary in Rondônia state. Data: ESA.
Zoom G. Fires at the agriculture-forest boundary within a protected area in Pará state.
Zoom H. Fires at the agriculture-forest boundary in Mato Grosso. Data: ESA.

Zooms I, J: Southern Mato Grosso (Brazil)

Zooms I and J shows fires in grassland/scrubland at the drier southern edge of the Amazon Basin. Note both of these fires are within Indigenous Territories.

Zoom I. Fires within an Indigenous Territory at the drier southern edge of the Amazon Basin. Data: Planet.
Zoom J. Fires within an Indigenous Territory at the drier southern edge of the Amazon Basin. Data: Planet.

Zooms C, K: Bolivia/Brazil/Paraguay Border

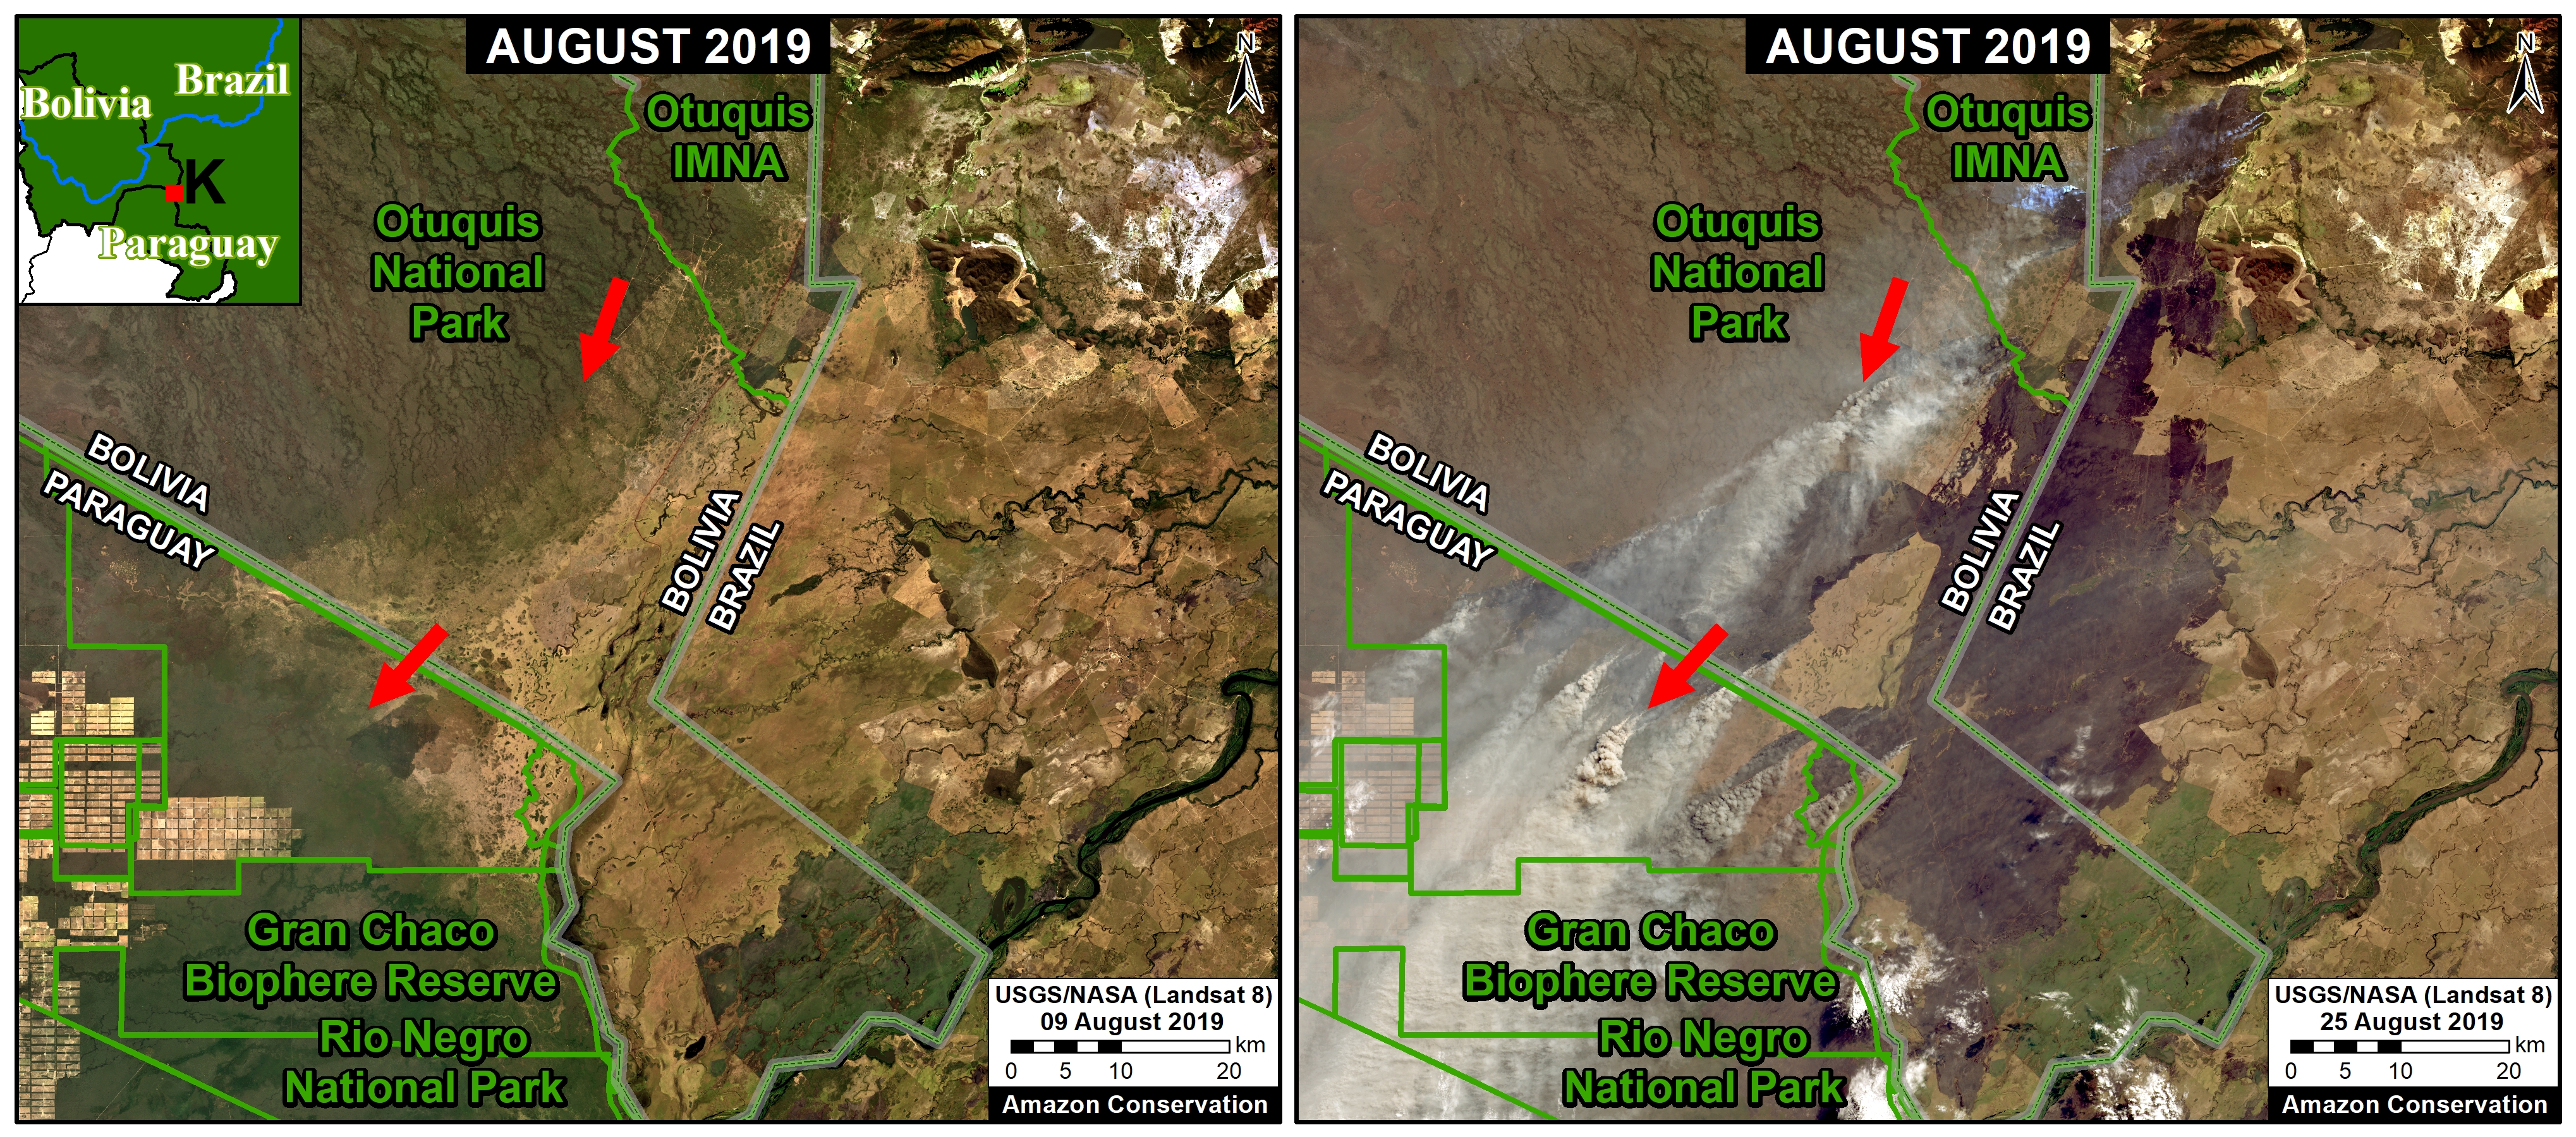
Zooms C and K show large fires burning in the drier ecosytems at the Bolivia-Brazil-Paraguay border. This area is outside the Amazon Basin, but we include it due it’s magnitude.

Zoom C. Recent fires in the dry Chiquitano of southern Bolivia. Data: Planet.
Zoom K. Large fires burning around the Gran Chaco Biosphere Reserve. Data: NASA/USGS.

Acknowledgements

We thank  J. Beavers (ACA), A. Folhadella (ACA), M. Silman (WFU), S. Novoa (ACCA), M. Terán (ACEAA), and D. Larrea (ACEAA) for helpful comments to earlier versions of this report.

This work was supported by the following major funders: MacArthur Foundation, International Conservation Fund of Canada (ICFC), Metabolic Studio, and Global Forest Watch Small Grants Fund (WRI).

Citation

Finer M, Mamani N (2019) Seeing the Amazon Fires with Satellites. MAAP: 108.

MAAP #106: Deforestation impacts 4 protected areas in the Colombian Amazon (2019)

Table 1. Deforestation in the Colombian Amazon. Data: Hansen/UMD/Google/USGS/NASA

We continue our focus on the northwest Colombian Amazon,* one of the most intense deforestation hotspots in the western Amazon (see MAAP# 100).

Here, we analyze deforestation data over the past five years (2015-19) to better understand current trends and patterns.

We found a major increase in deforestation as of 2016. The Colombian Amazon lost nearly 1.2 million acres (478,000 hectares) of forest between 2016 and 2018. Of this, 73% (860,000 acres) was primary forest (see Table 1).

One of the main deforestation drivers in the region is conversion to pasture for land grabbing or cattle ranching.

Next, we provide a real-time update of 2019, based on early warning forest alerts (GLAD alerts) from the University of Maryland/Global Forest Watch), updated through July 25, 2019.

*MAAP in Colombia represents a collaboration between Amazon Conservation and its Colombian partner, the Foundation for Conservation and Sustainable Development (FCDS).”

Base Map. Deforestation hotspots in Colombian Amazon. Data: UMD/GLAD, RUNAP, RAISG

Deforestation 2019

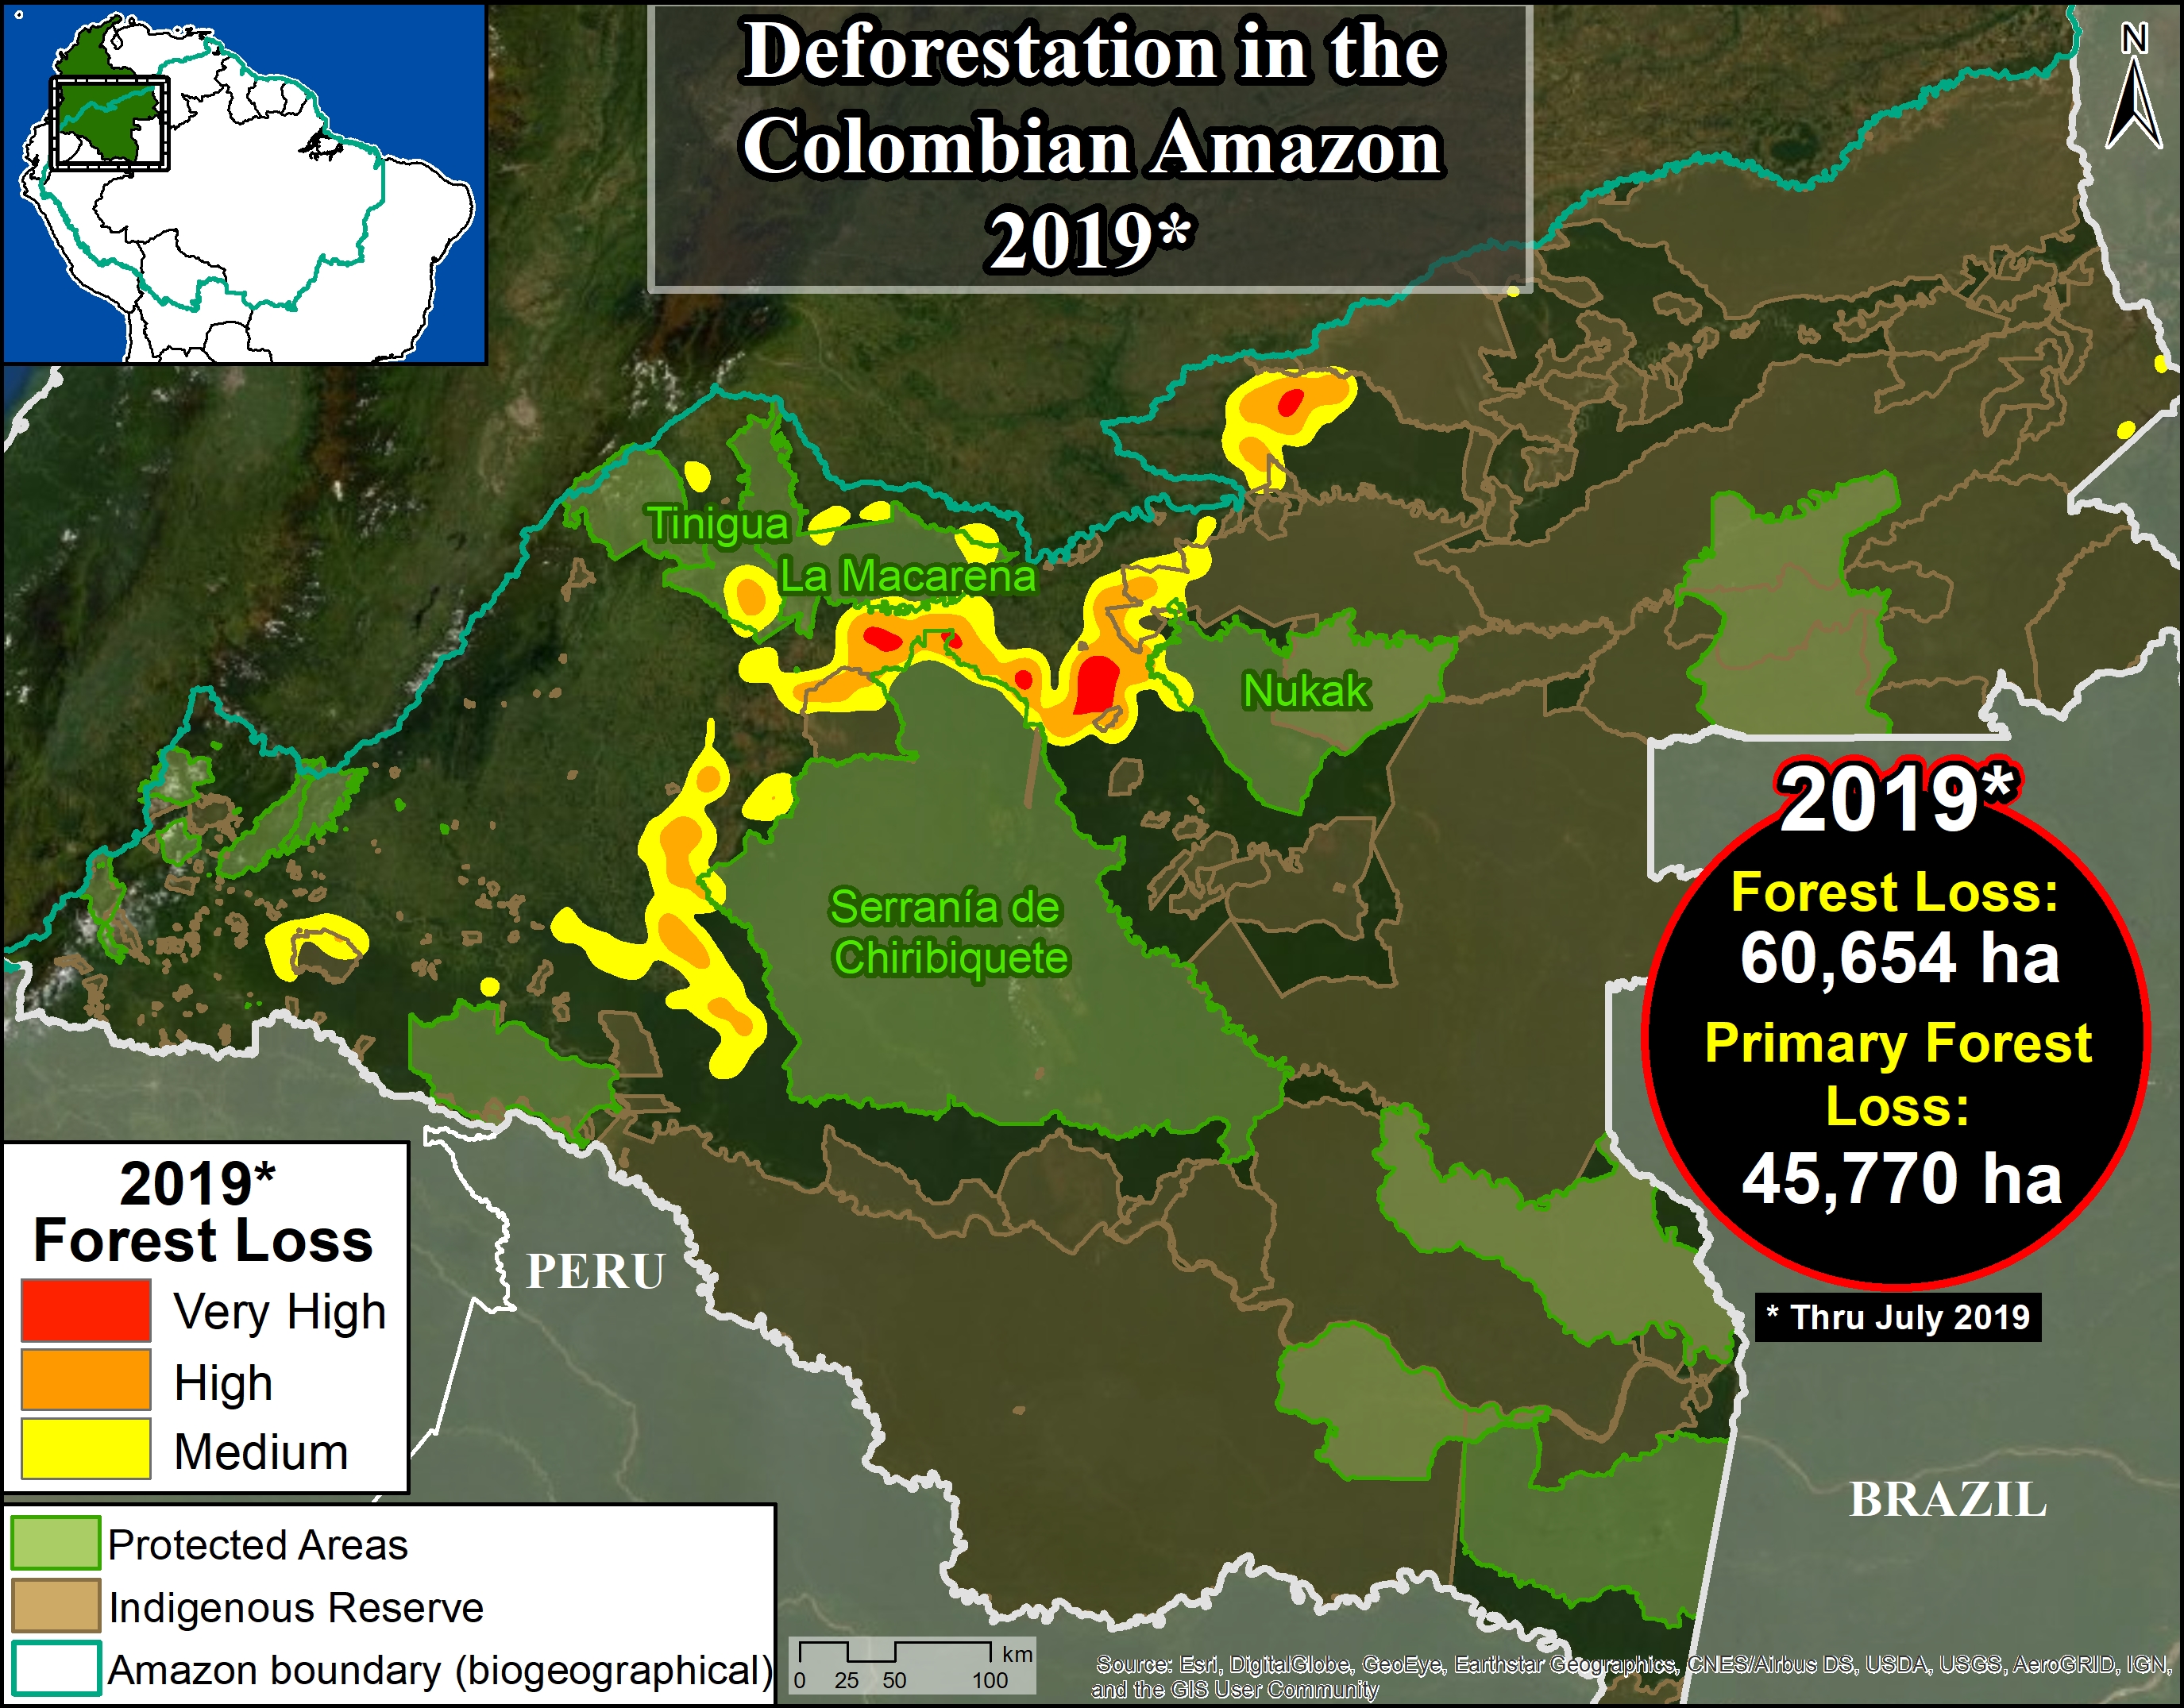
The GLAD alerts estimate the additional loss of 150,000 acres (60,654 hectares) in the first 7 months of 2019 (through end of July). Of  this, 75% (113,000 acres) was primary forest.

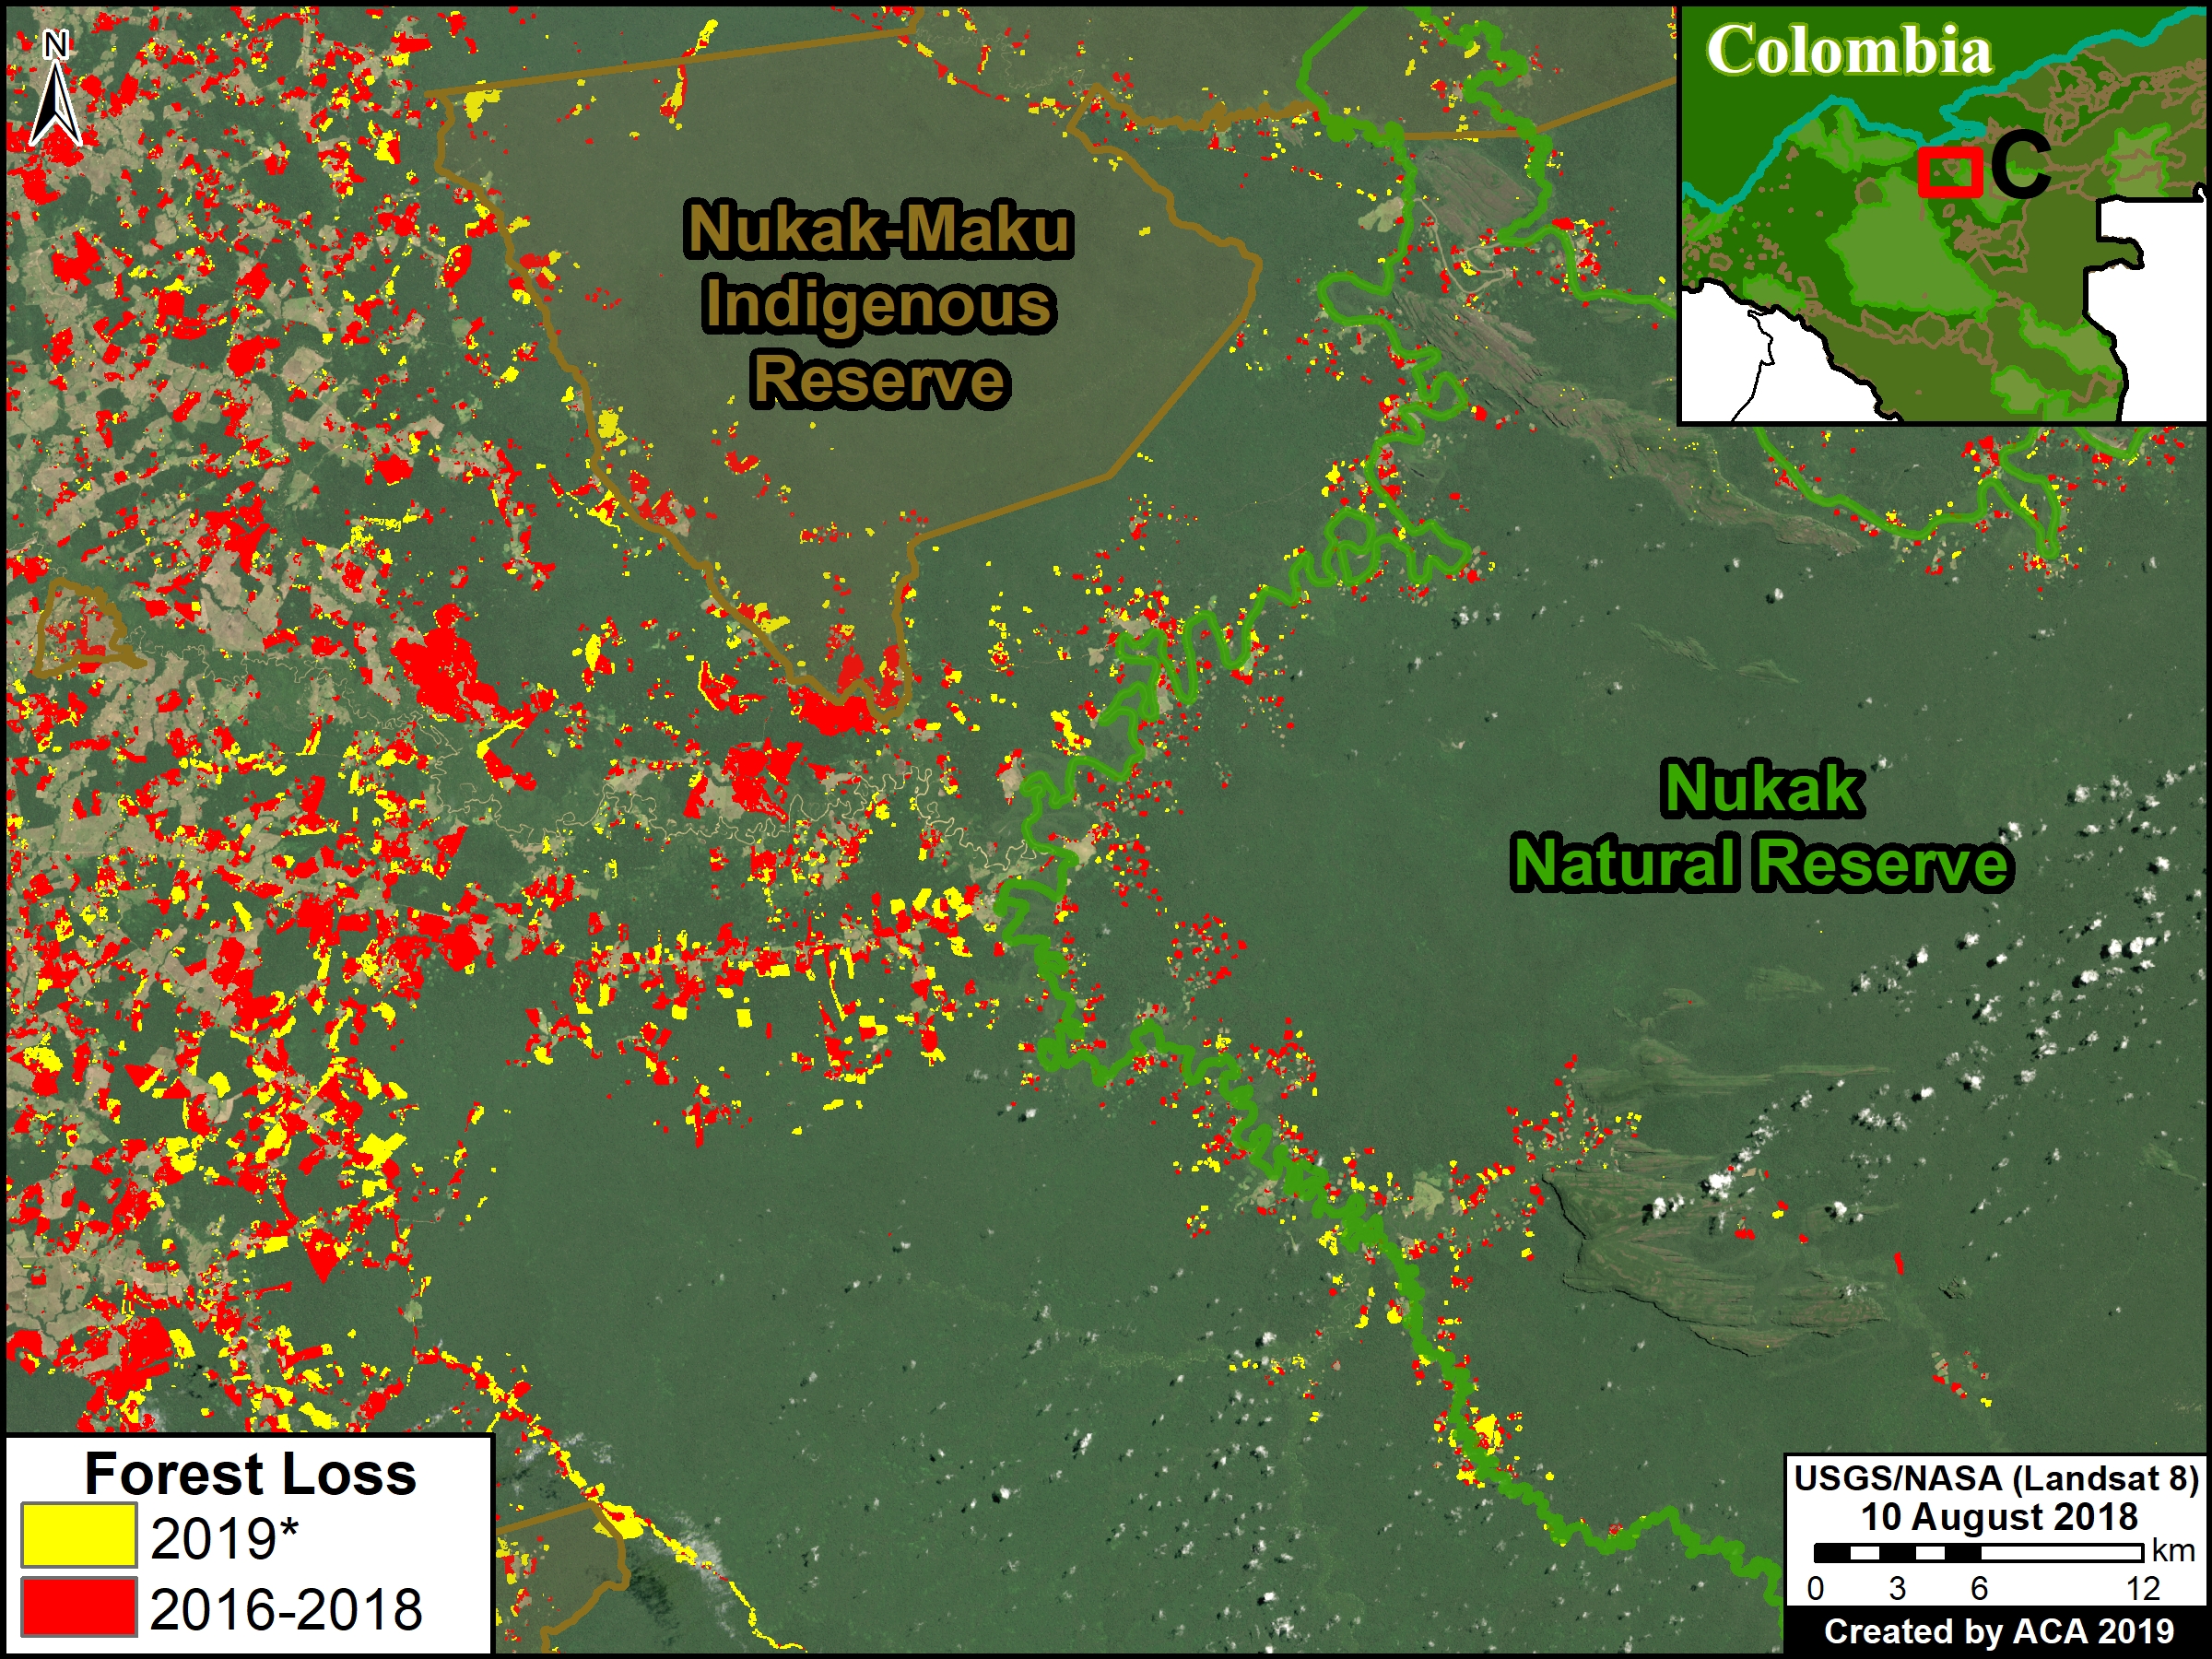
The Base Map shows that 2019 deforestation primarily impacts 4 protected areas* in the northwest Colombian Amazon: Tinigua, Serranía de Chiribiquete, and Sierra de la Macarena National Parks, and Nukak National Reserve.

Next, we detail the recent deforestation in these four protected areas of the Colombian Amazon, including the presentation of a series of satellite-based images.

*There are other protected areas in the Colombian Amazon with recent deforestation (such as Picachos and La Paya National Parks), but here we focus on the four with the highest deforestation thus far during 2019.


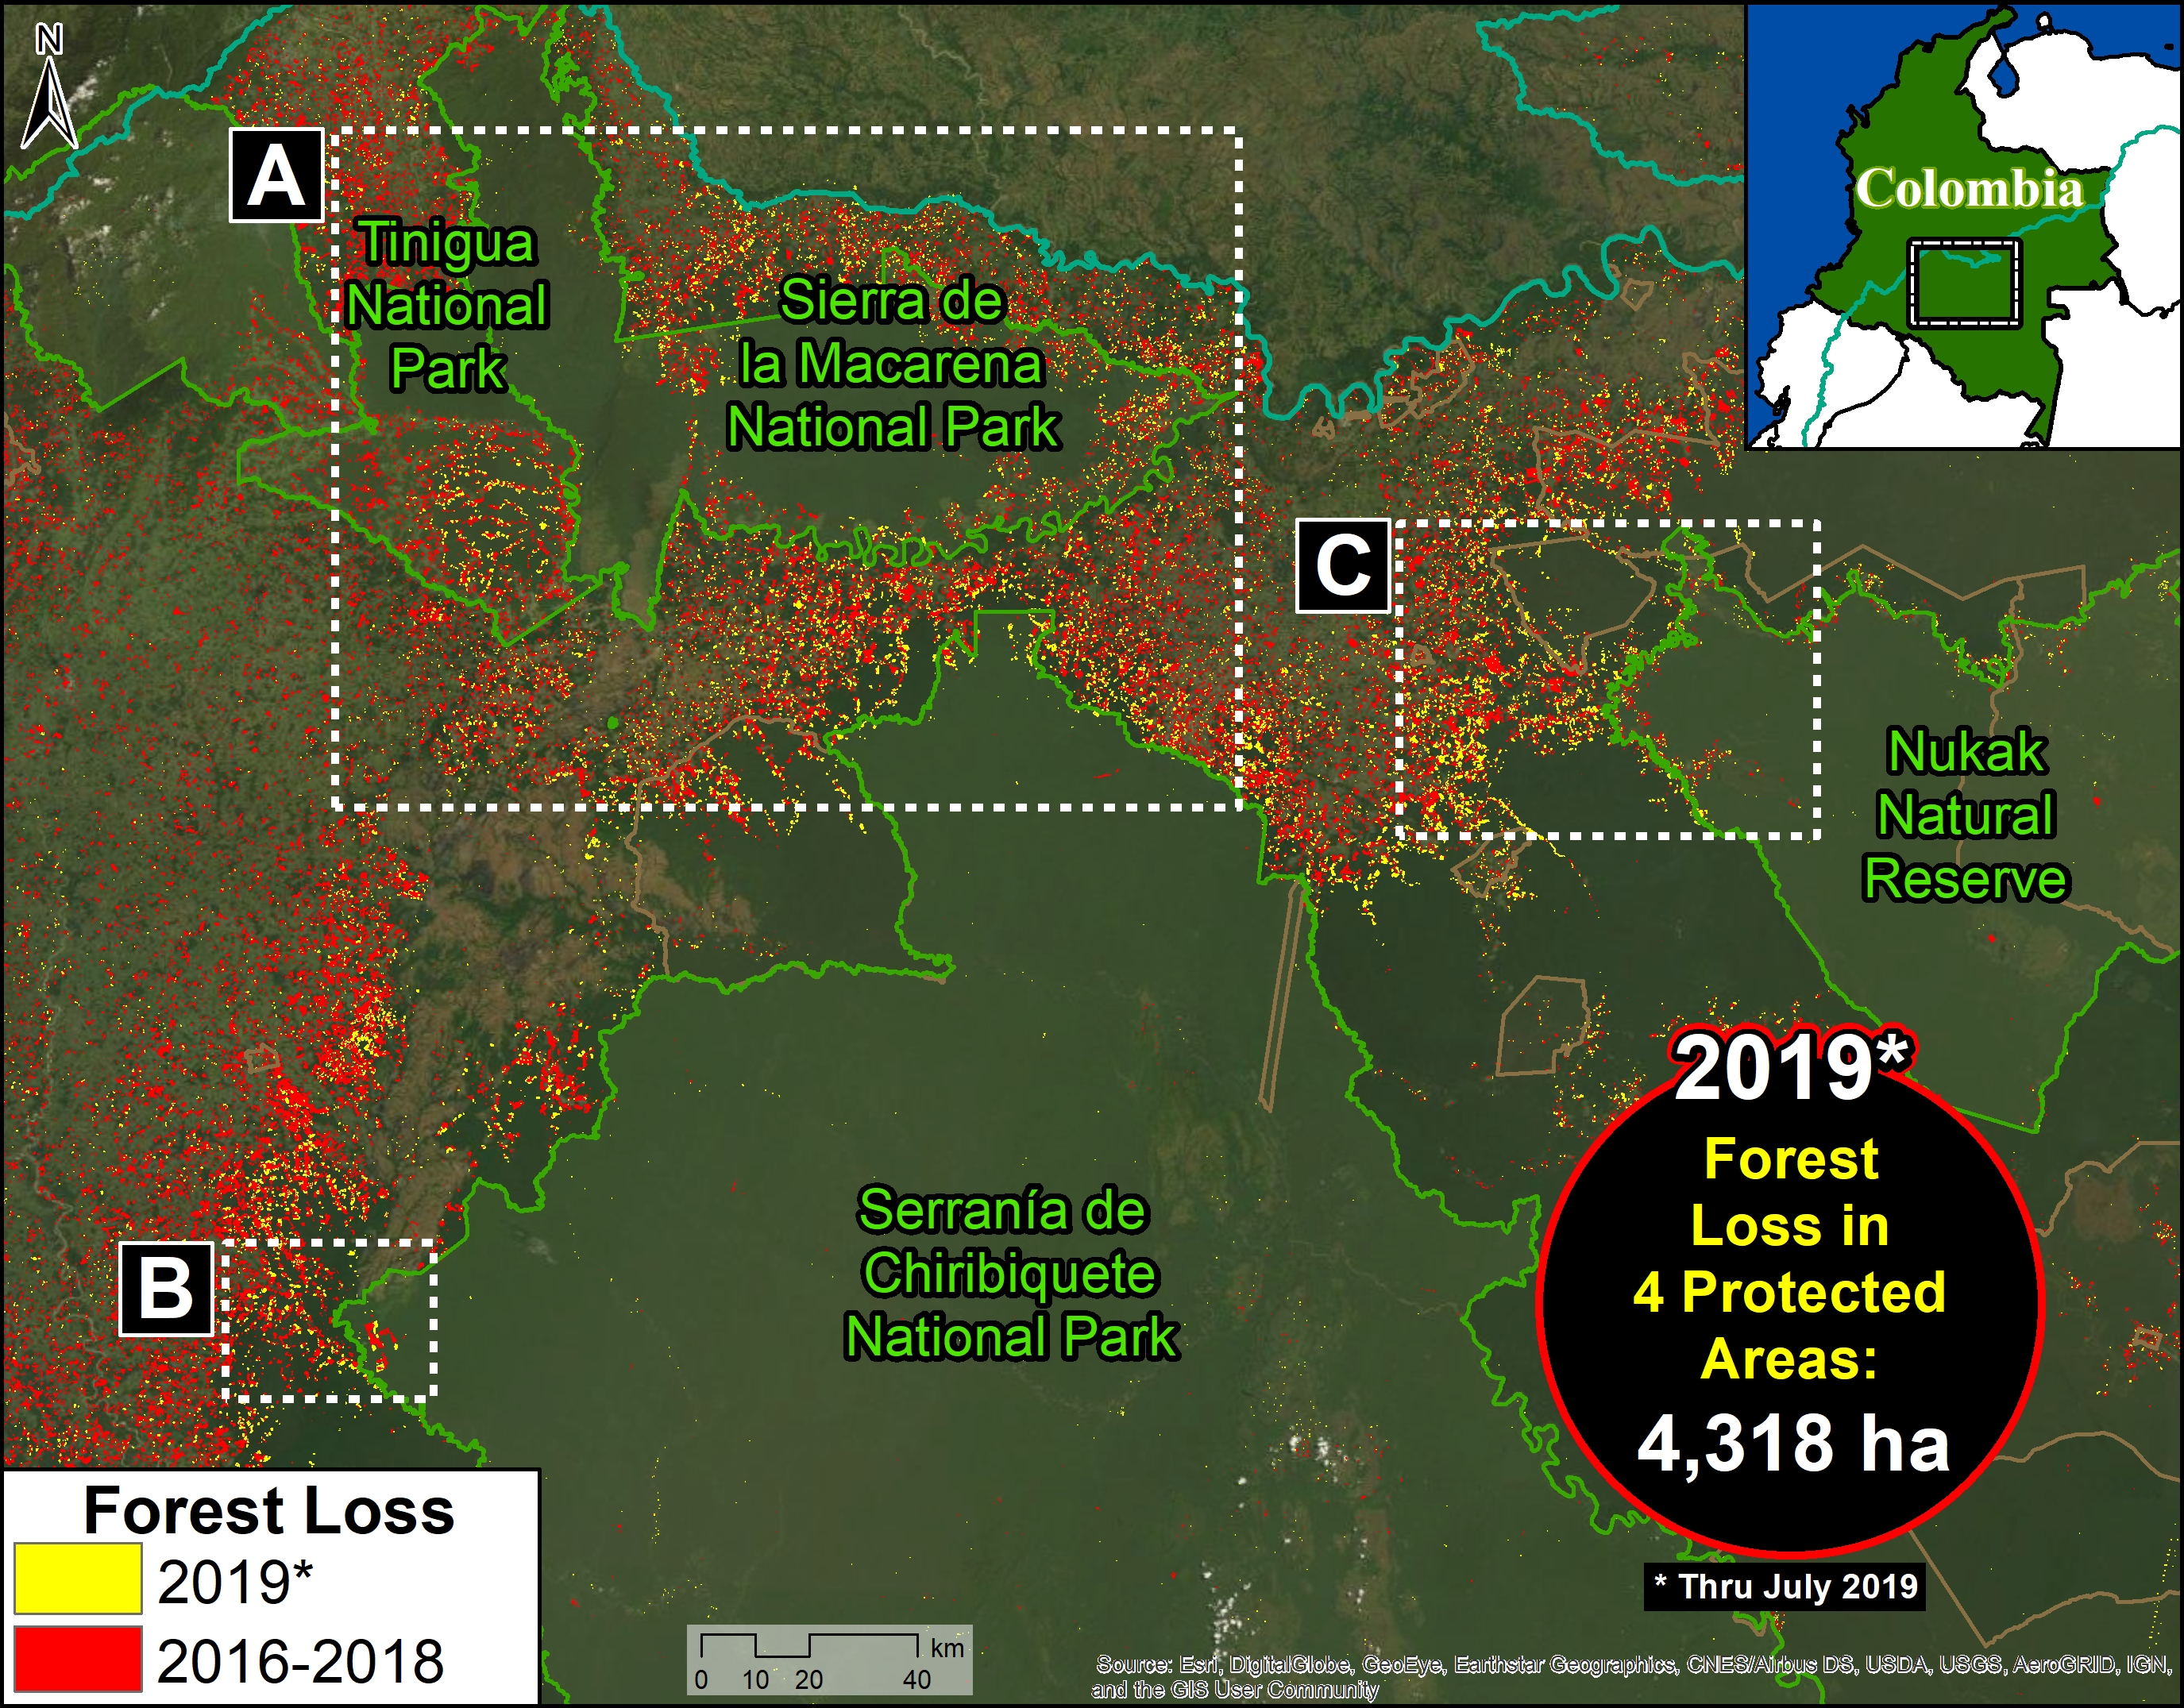
Protected Areas Zoom Map. Deforestation in four protected areas of the Colobian Amazon. Data: UMD/GLAD, Hansen/UMD/Google/USGS/NASA, RUNAP, RAISG

Deforestation in Protected Areas

We conducted a deforestation analys within the 4 protected areas noted above (Chiribiquete, Tinigua, Macarena, and Nukak), generating the following key results:

  • From 2016-18, deforestation claimed over  70,000 acres (29,000 ha) in the four protected areas, 86% of which were primary forests (62,000 acres).
    .
  • Thus far in 2019 (through July 25), deforestation claimed an additional 10,600 acres (4,300 ha), 87% of which were primary forests (9,200 acres).
    .
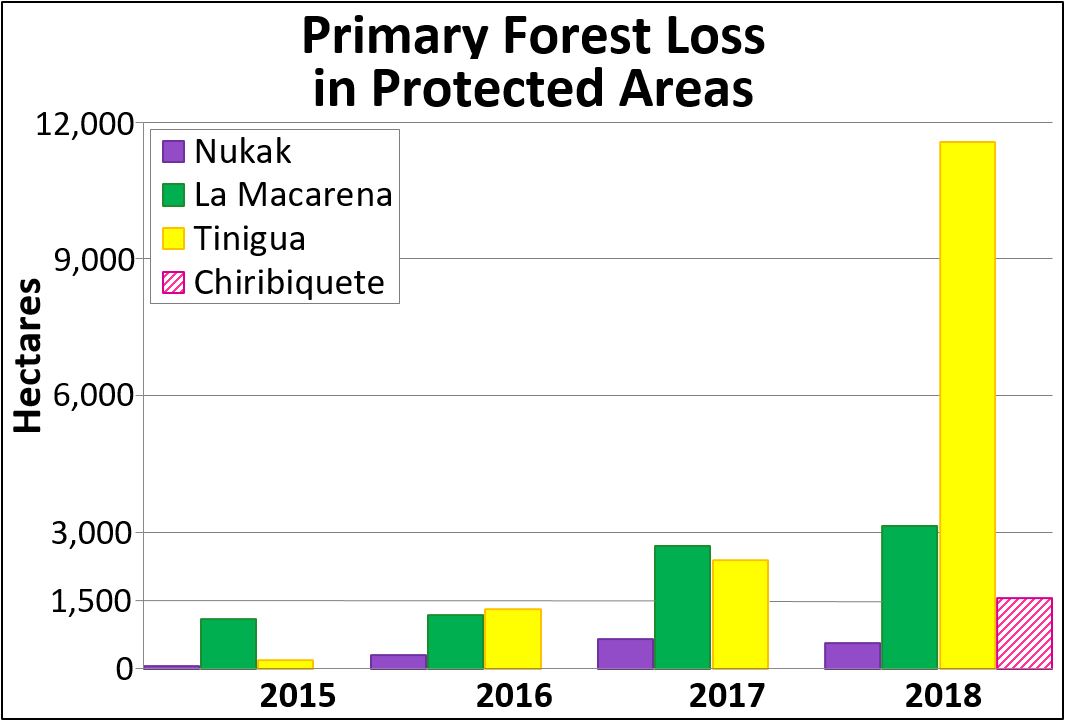
  • Tinigua National Park has been the most impacted protected area, as deforestation claimed 39,500 acres (16,000 ha) from 2017-19 (96% of which were primary forests). Note the major deforestation spike in 2018.
    .
  • Deforestation has claimed 6,400 acres (2,600 ha) in Chiribiquete National Park since its expansion in July 2018 (96% of which were primary forests).

Zoom A: Deforestation in Tinigua, Chiribiquete, and Macarena National Parks

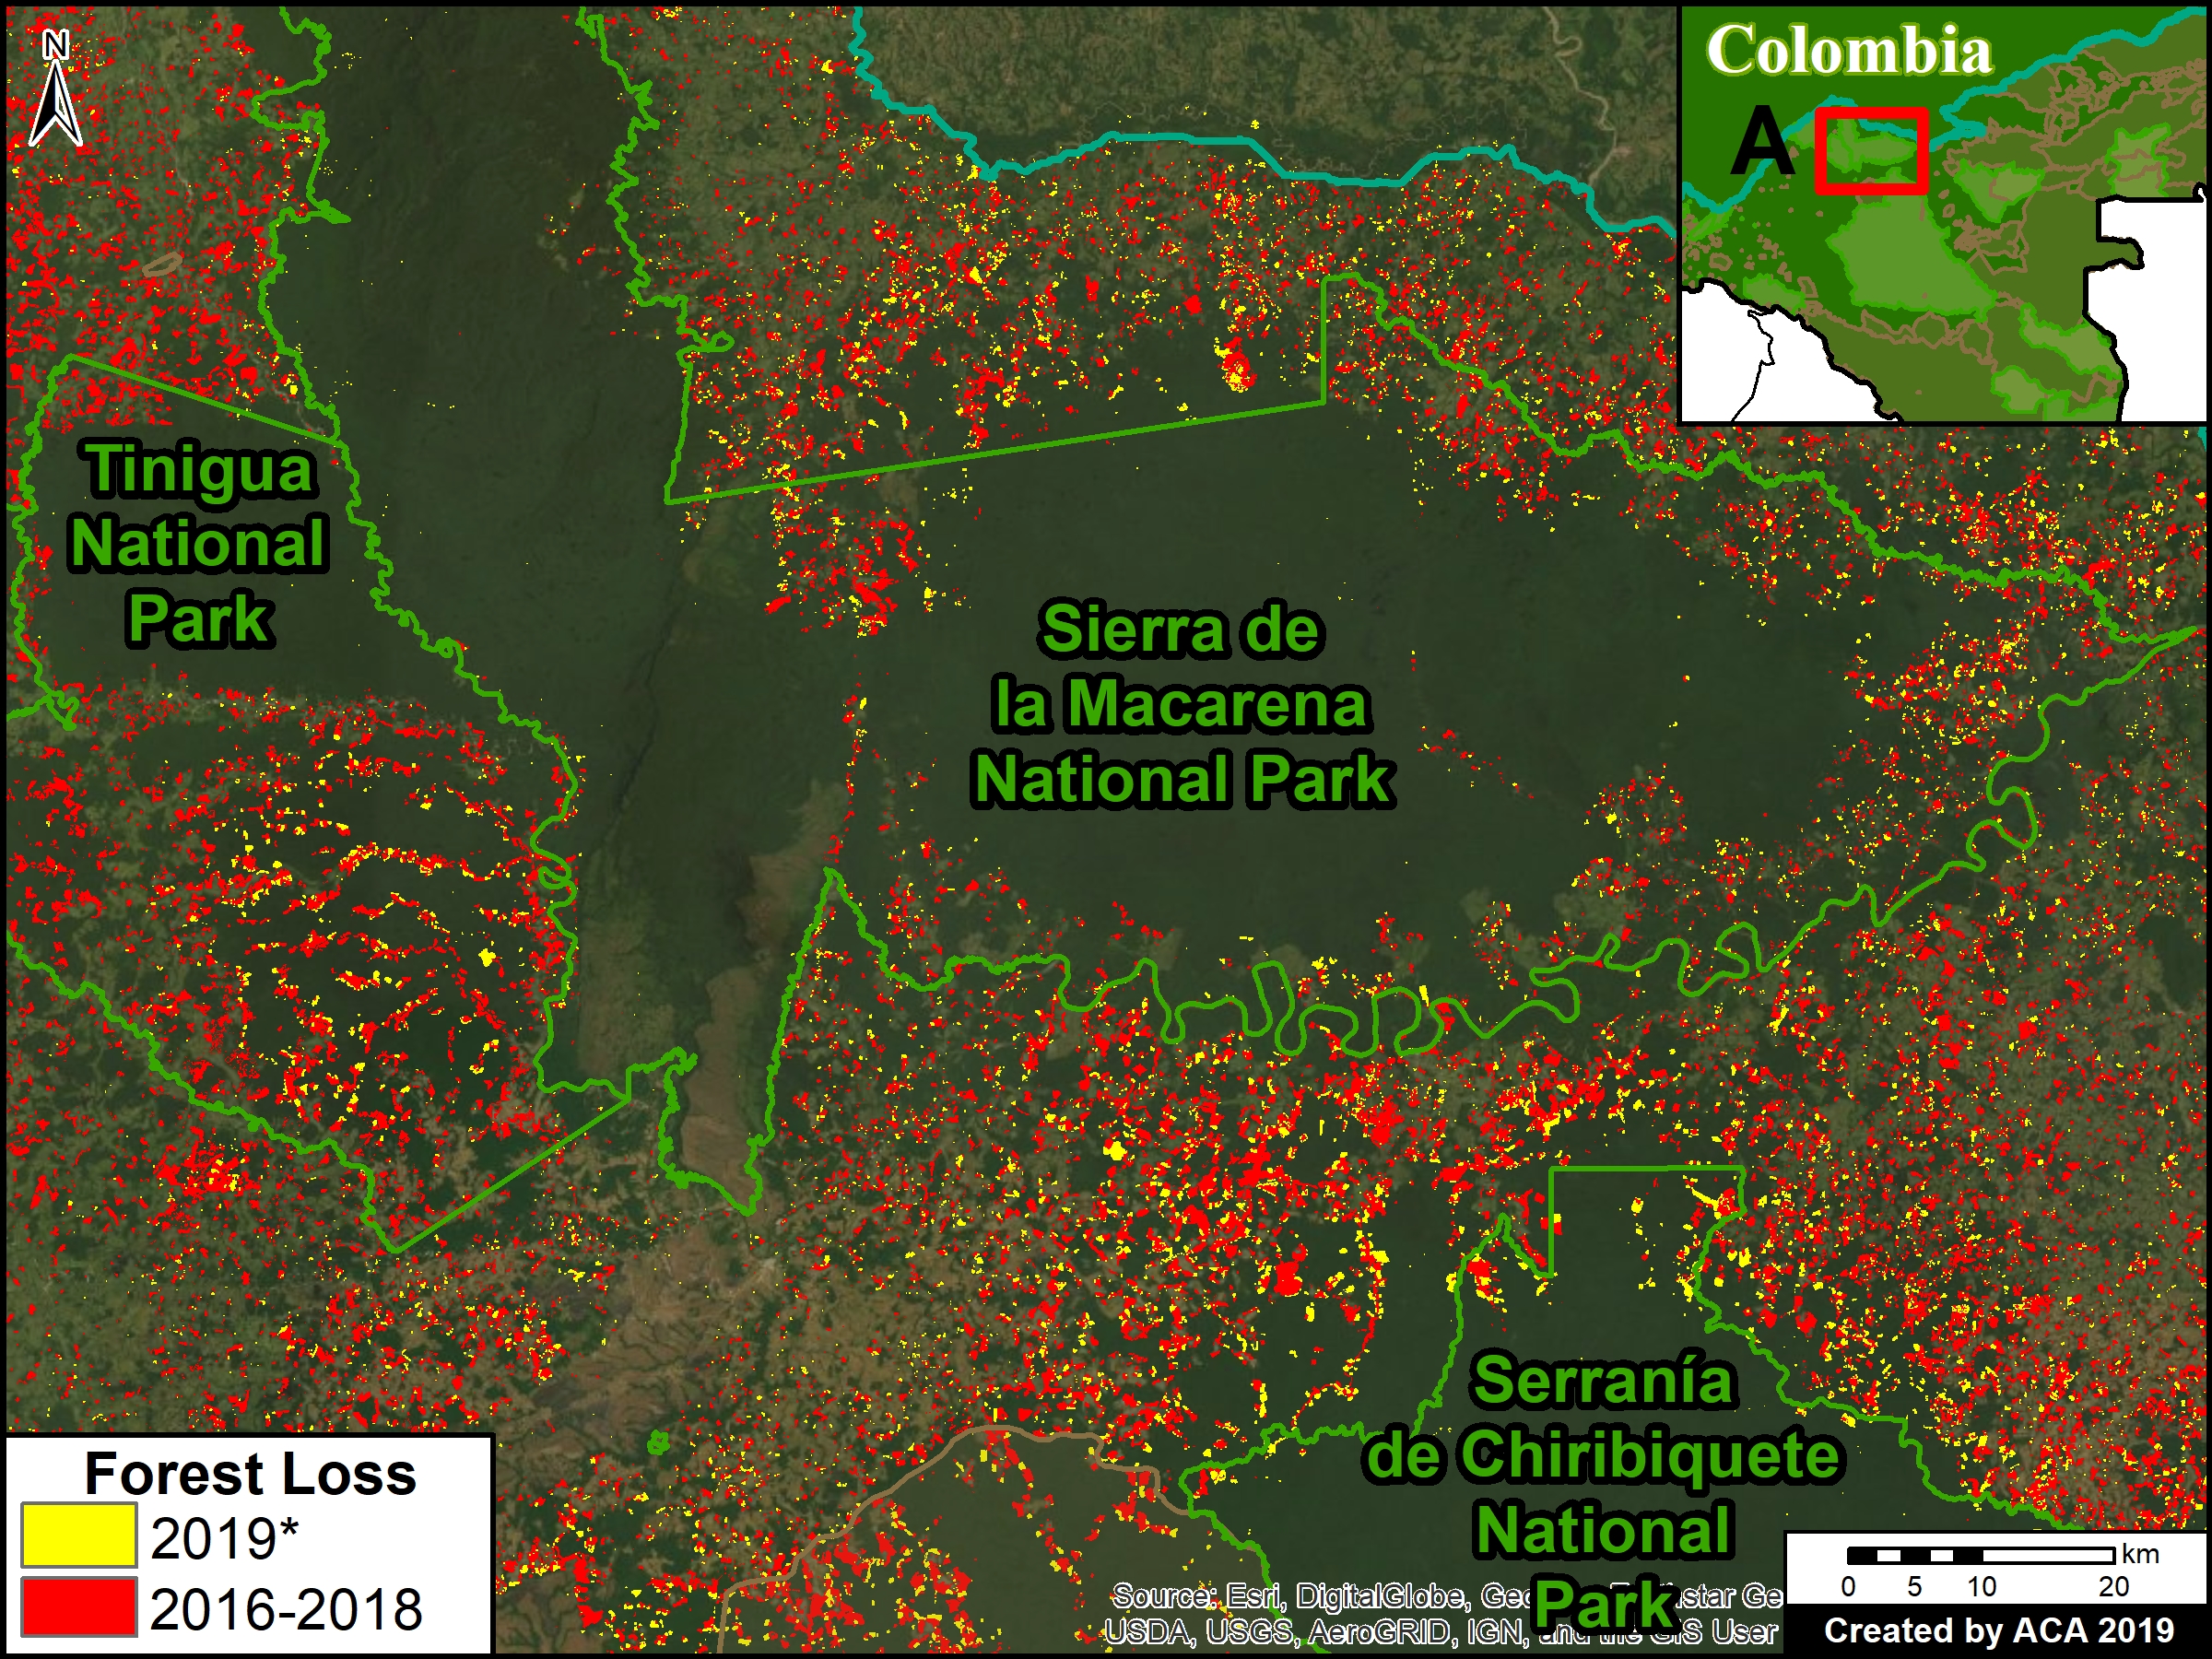
See location of Zooms A-C in Protected Areas Zoom Map above. Data updated through July 25, 2019.

Zoom A. Deforestation in Tinigua, Serranía de Chiribiquete, and Sierra de la Macarena National Parks, *through July 25, 2019. Data: UMD/GLAD, Hansen/UMD/Google/USGS/NASA, RUNAP, RAISG

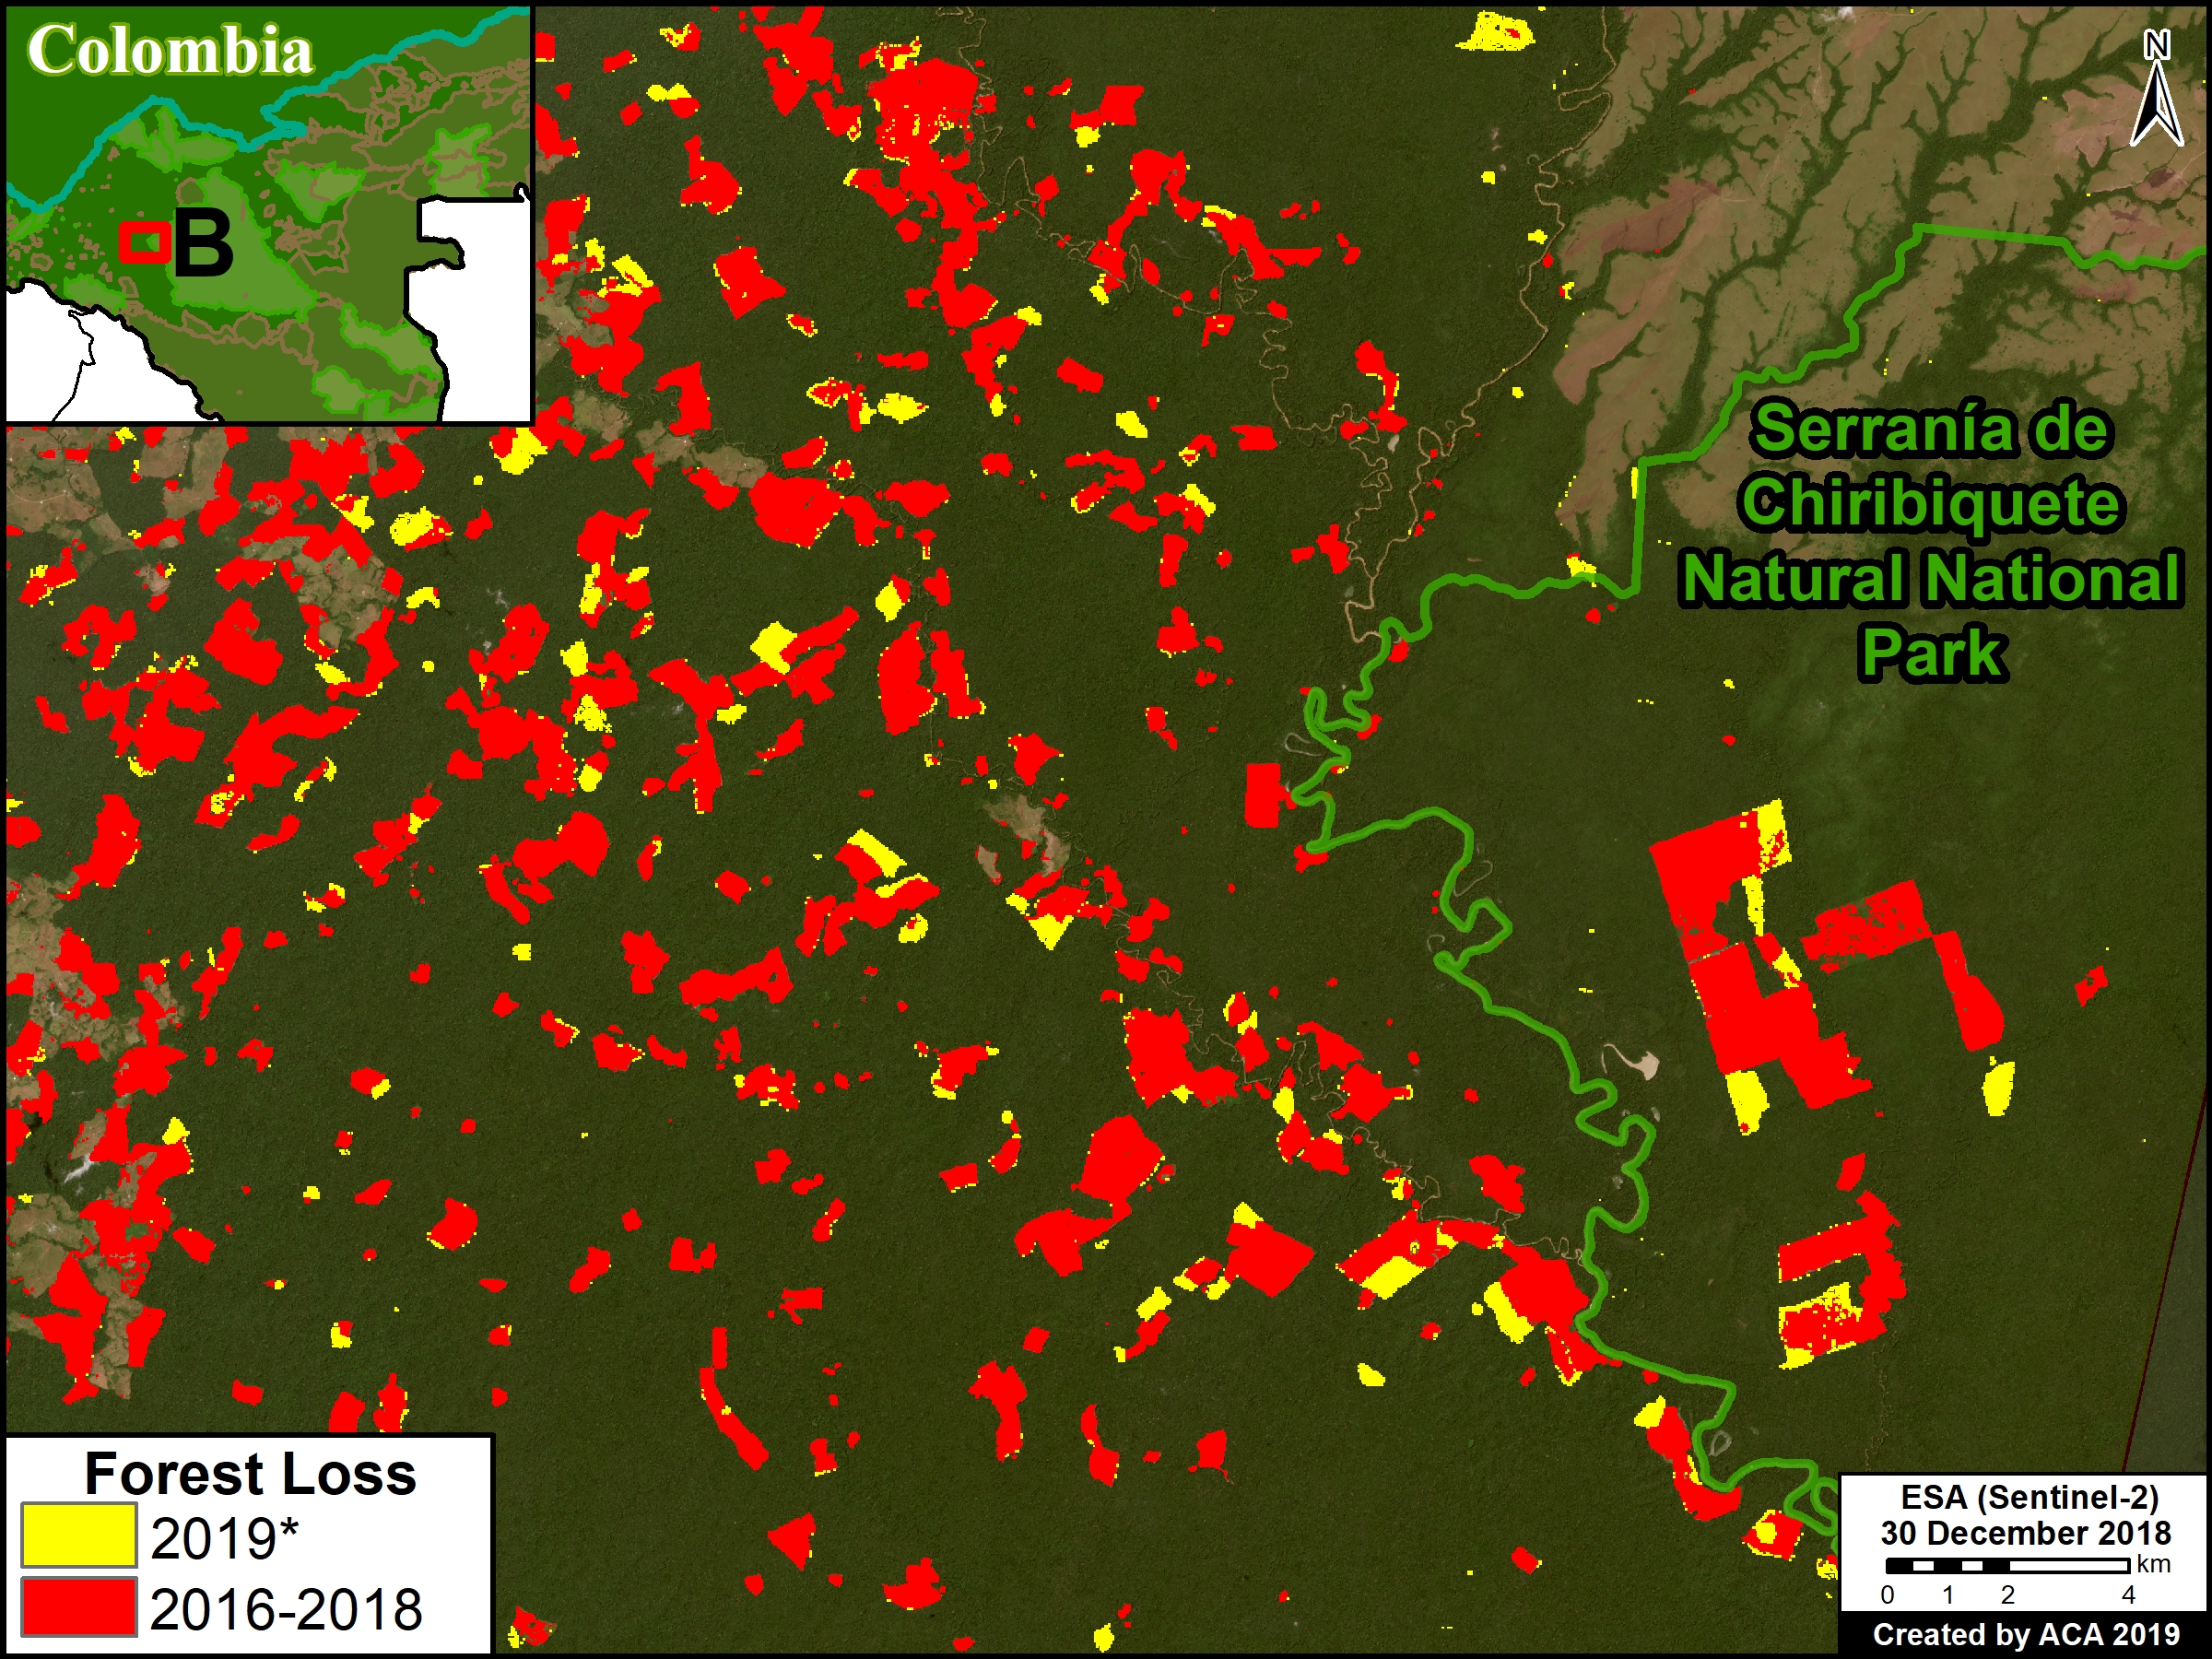
Zoom B. Deforestation in Chiribiquete National Park (western sector)

Zoom B. Deforestation Serranía de Chiribiquete National Park (western sector), *through July 25, 2019. Data: UMD/GLAD, Hansen/UMD/Google/USGS/NASA, RUNAP, RAISG

Zoom C. Deforestation in Nukak National Reserve

Zoom C. Deforestation in Nukak National Reserve *through July 25, 2019. Data: UMD/GLAD, Hansen/UMD/Google/USGS/NASA, RUNAP, RAISG

Annex 1: Table
Deforestation of Primary Forest in four protected areas (2015-18)

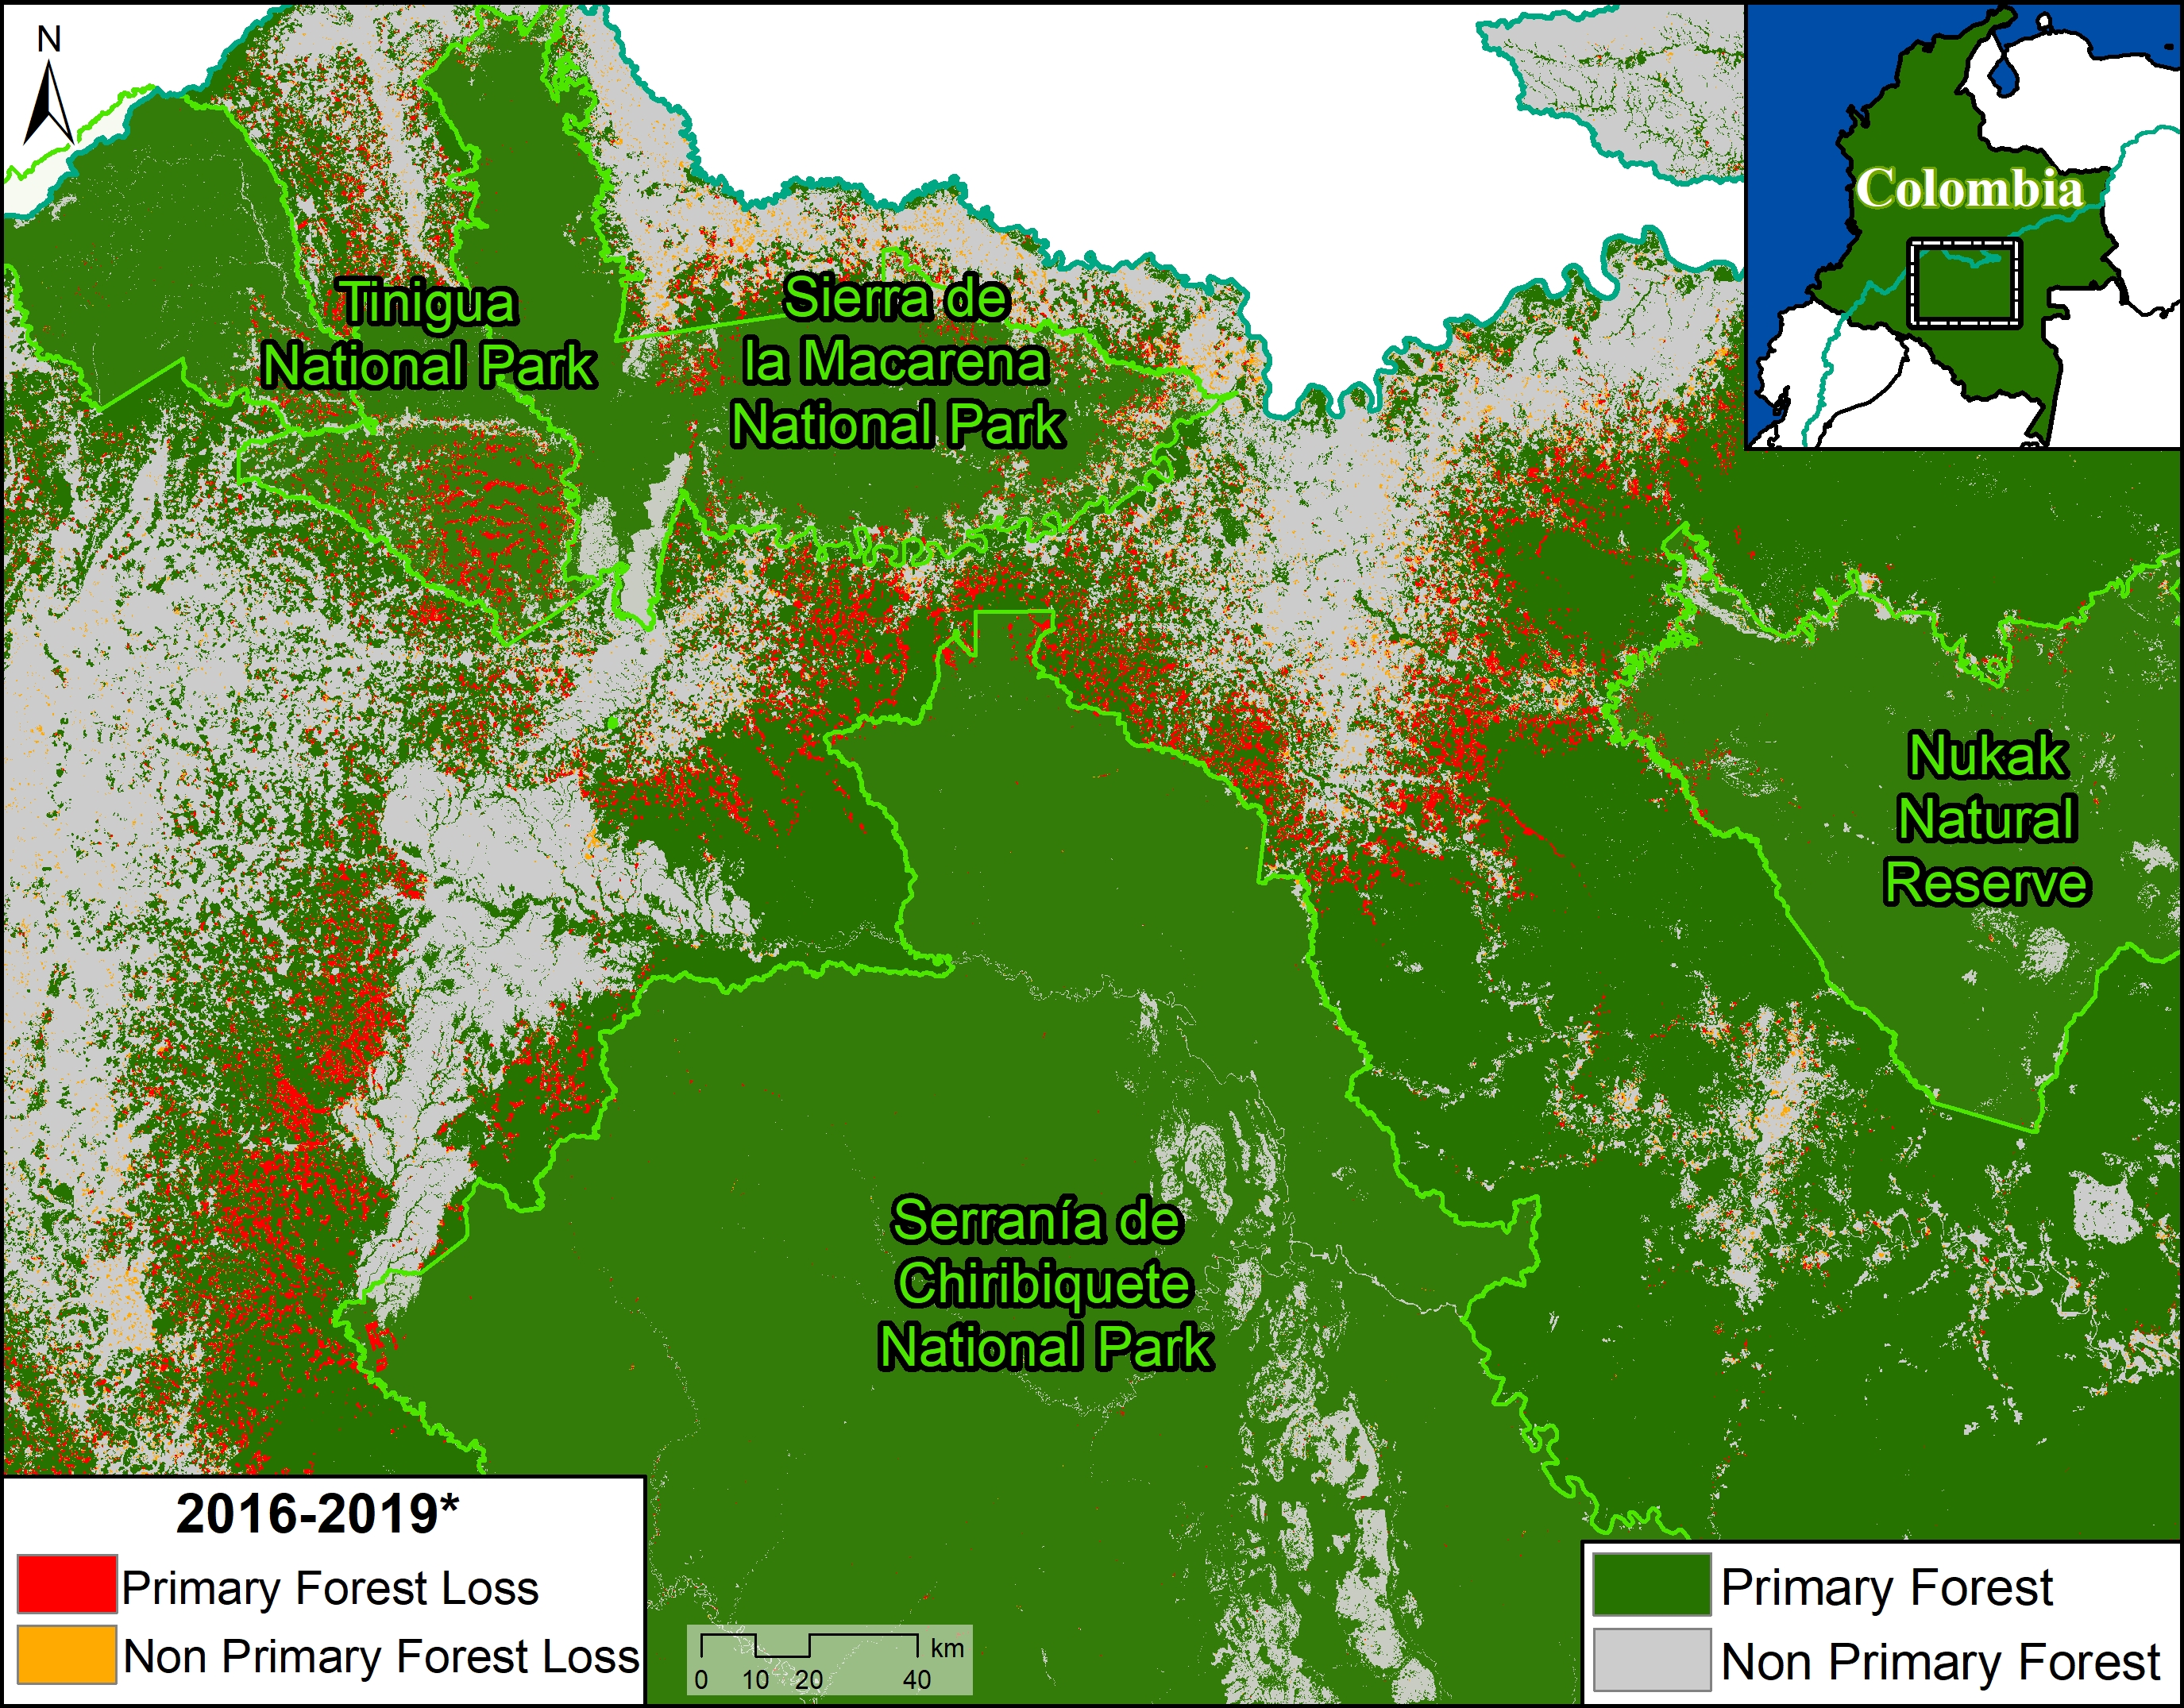
Annex 2: Map
Deforestation of Primary Forest in four protected areas (2016-19)

Annex 2. Data: Turubanova 2018, UMD/GLAD, Hansen/UMD/Google/USGS/NASA, RUNAP, RAISG

Methodology

We primarily used data generated by the GLAD laboratory of the University of Maryland, available on Global Forest Watch. This data is based on moderate resolution Landsat imagery (30 m). For 2017-18, we analyzed annual data (Hansen et al 2013), and for 2019 we analyzed GLAD alerts (Hansen et al 2016).

For our deforestation estimates, we multiplied the annual “forest cover loss” data by the density percentage of the “tree cover” from the year 2000 (values >30%). Including this percentage allows us to look at the precise area of each pixel, thus improving the preciseness of the results.

We define primary forest as “mature natural humid tropical forest cover that has not been completely cleared and regrown in recent history,” following the definition from Turubanova et al 2018. For our primary forest deforestation estimates, we intersected the forest cover loss data with the additional dataset “primary humid tropical forests” as of 2001 (Turubanova et al 2018). For more details on this part of the methodology, see the Technical Blog from Global Forest Watch (Goldman and Weisse 2019).

All data were processed under the geographical coordinate system WGS 1984. To calculate the areas in metric units the UTM (Universal Transversal Mercator) projection was used: Colombia 18 North.

To identify the deforestation hotspots in the Base Map, we conducted a kernel density estimate. This type of analysis calculates the magnitude per unit area of a particular phenomenon, in this case forest cover loss. We conducted this analysis using the Kernel Density tool from Spatial Analyst Tool Box of ArcGIS. We used the following parameters:

Search Radius: 15000 layer units (meters)
Kernel Density Function: Quartic kernel function
Cell Size in the map: 200 x 200 meters (4 hectares)
Everything else was left to the default setting.

For the Base Map, we used the following concentration percentages: Medium: 10%-25%; High: 26%-50%; Very High: >50%.

References

Hansen, M. C., P. V. Potapov, R. Moore, M. Hancher, S. A. Turubanova, A. Tyukavina, D. Thau, S. V. Stehman, S. J. Goetz, T. R. Loveland, A. Kommareddy, A. Egorov, L. Chini, C. O. Justice, and J. R. G. Townshend. 2013. “High-Resolution Global Maps of 21st-Century Forest Cover Change.” Science 342 (15 November): 850–53.

Hansen, M.C., A. Krylov, A. Tyukavina, P.V. Potapov, S. Turubanova, B. Zutta, S. Ifo, B. Margono, F. Stolle, and R. Moore. 2016. Humid tropical forest disturbance alerts using Landsat data. Environmental Research Letters, 11 (3).

Hansen, M.C., A. Krylov, A. Tyukavina, P.V. Potapov, S. Turubanova, B. Zutta, S. Ifo, B. Margono, F. Stolle, and R. Moore. 2016. Humid tropical forest disturbance alerts using Landsat data. Environmental Research Letters, 11 (3).

Turubanova S., Potapov P., Tyukavina, A., and Hansen M. (2018) Ongoing primary forest loss in Brazil, Democratic Republic of the Congo, and Indonesia. Environmental Research Letters.

Acknowledgements

We thank R. Botero (FCDS), A. Rojas (FCDS) y G. Palacios for helpful comments to earlier versions of this report.

This work was supported by the following major funders: MacArthur Foundation, International Conservation Fund of Canada (ICFC), Metabolic Studio, and Global Forest Watch Small Grants Fund (WRI).

Citation

Finer M, Mamani N (2019) Deforestation impacts 4 protected areas in the Colombian Amazon (2019). MAAP: 106.

MAAP #101: Deforestation Continues in Colombian Amazon (2019)

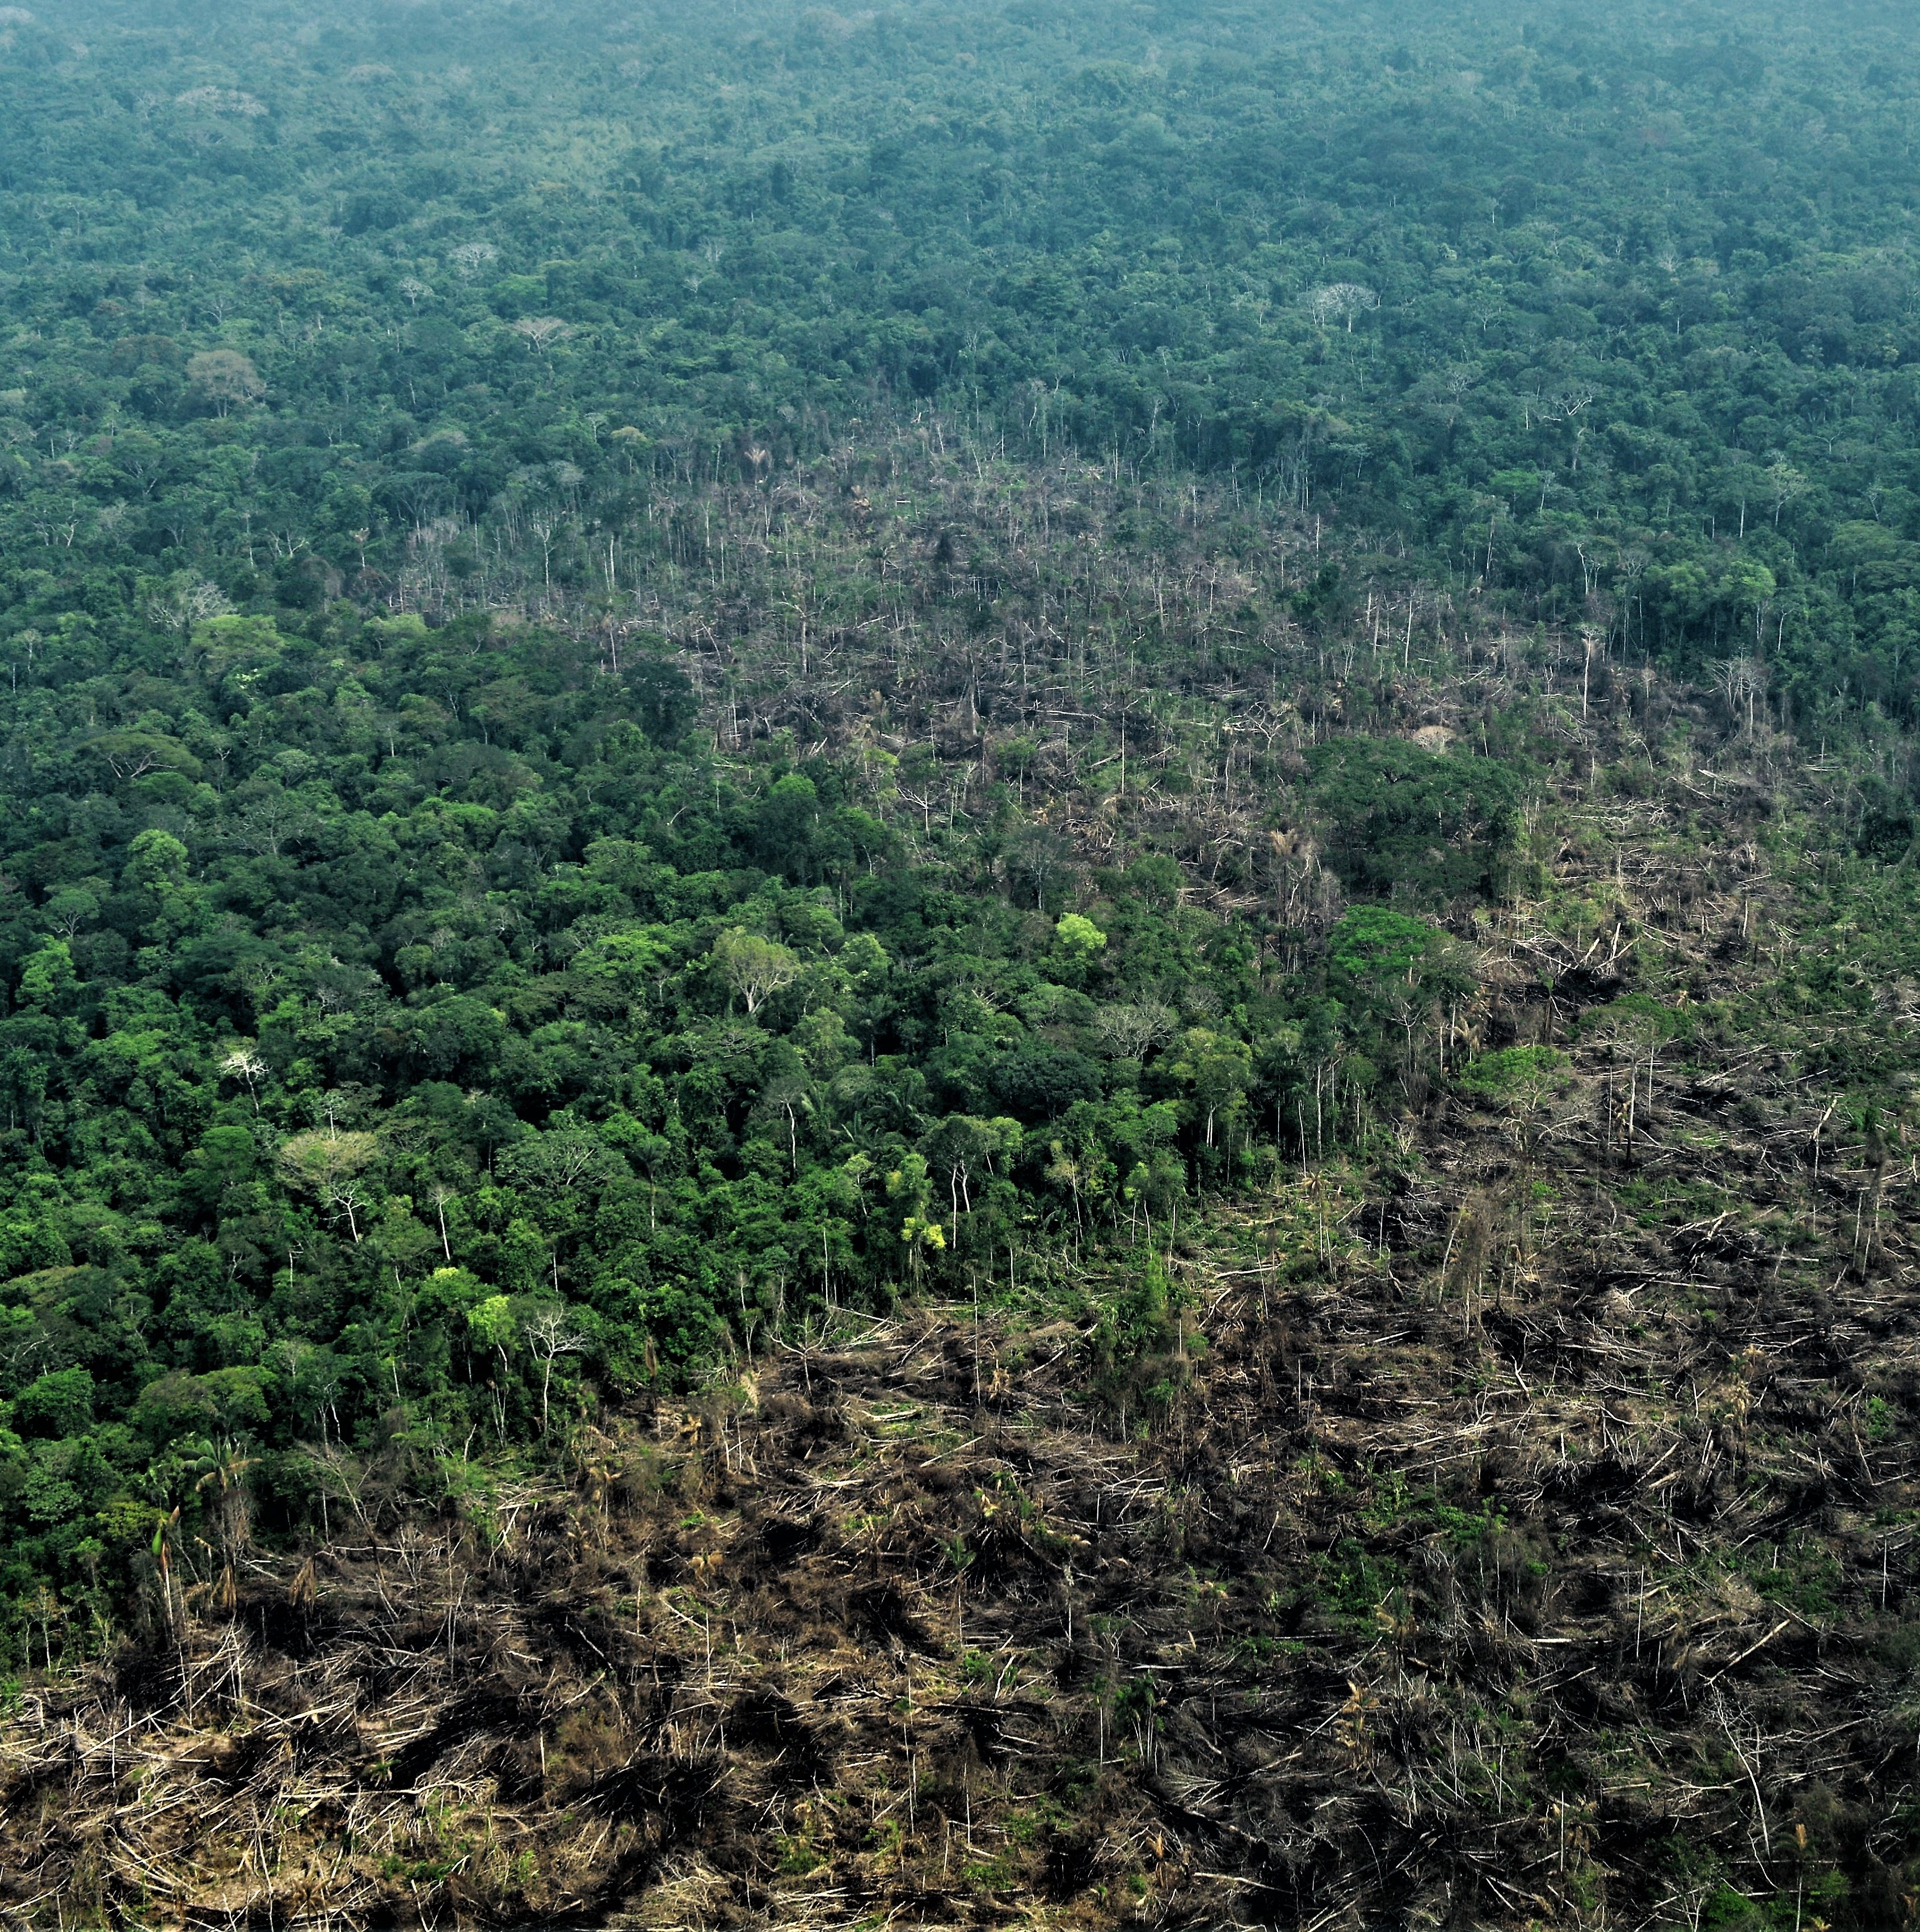
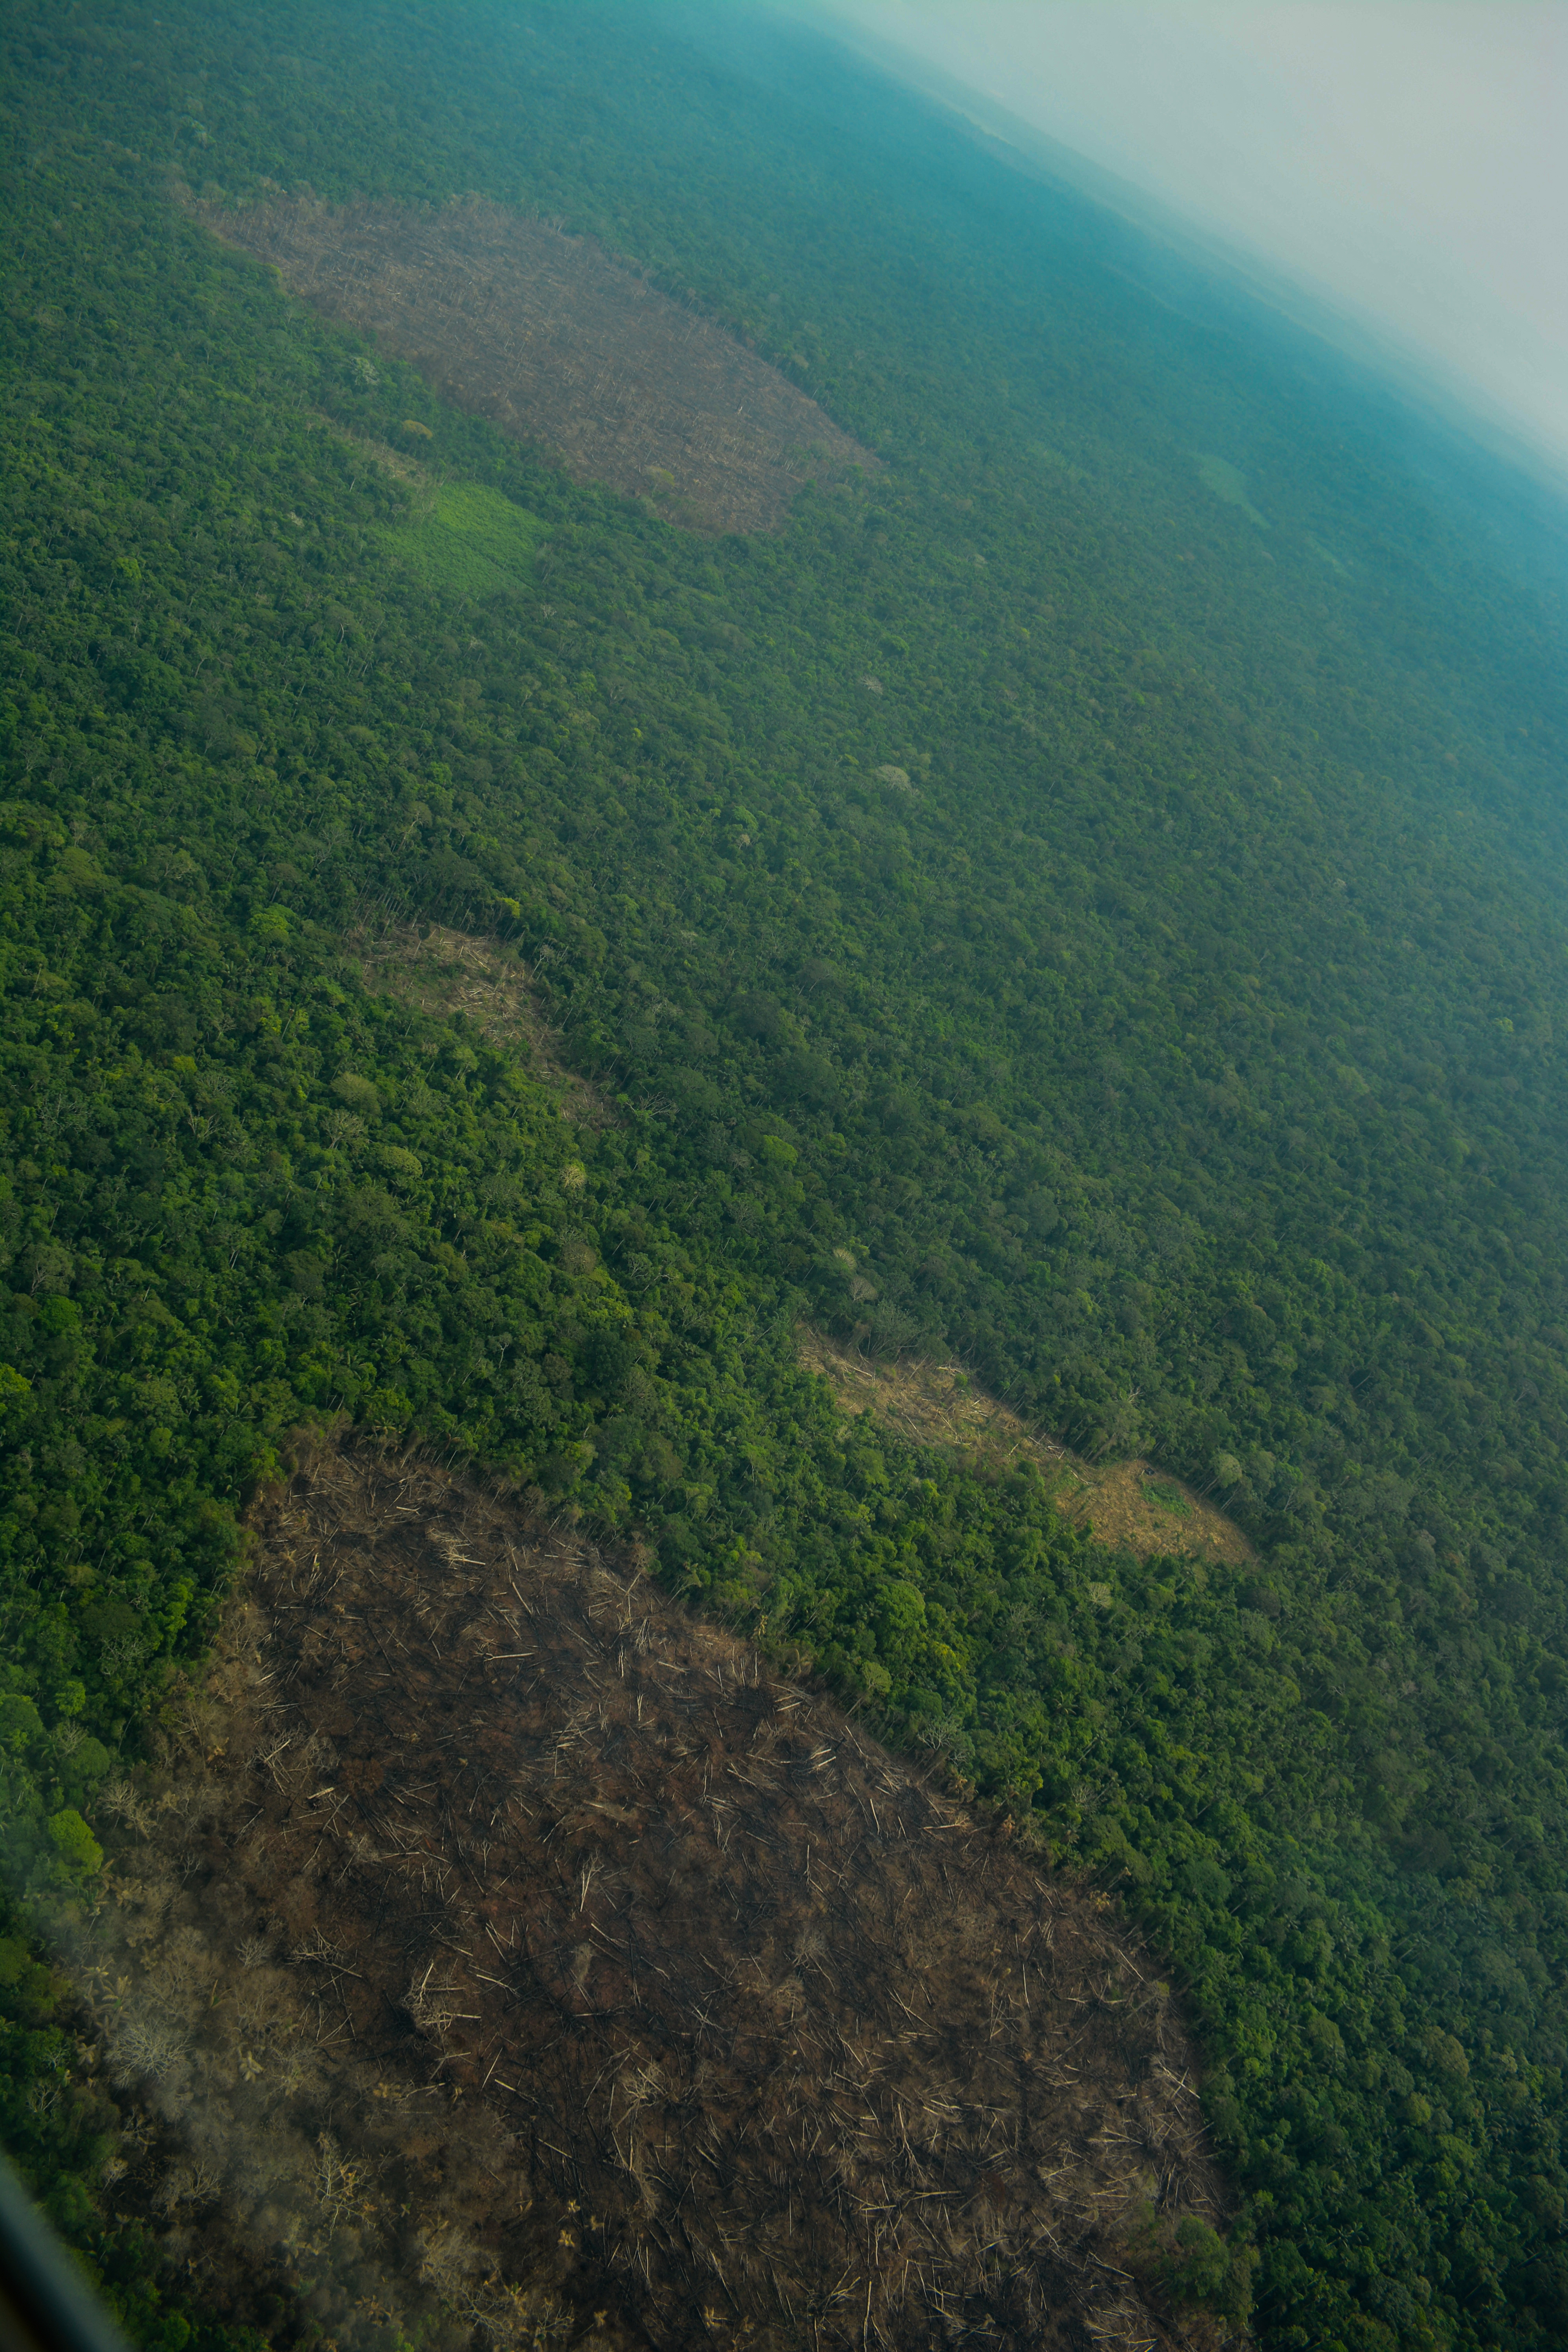
Overflight photo of recent deforestation in Chiribiquete National Park. Credit: FCDS/RFN/AAF.

A major deforestation surge continues in the northwest Colombian Amazon (MAAP #97).

In 2018, it resulted in the loss of 199,000 hectares (491,700 acres)*, making it the most concentrated deforestation hotspot in the entire western Amazon (MAAP #100).

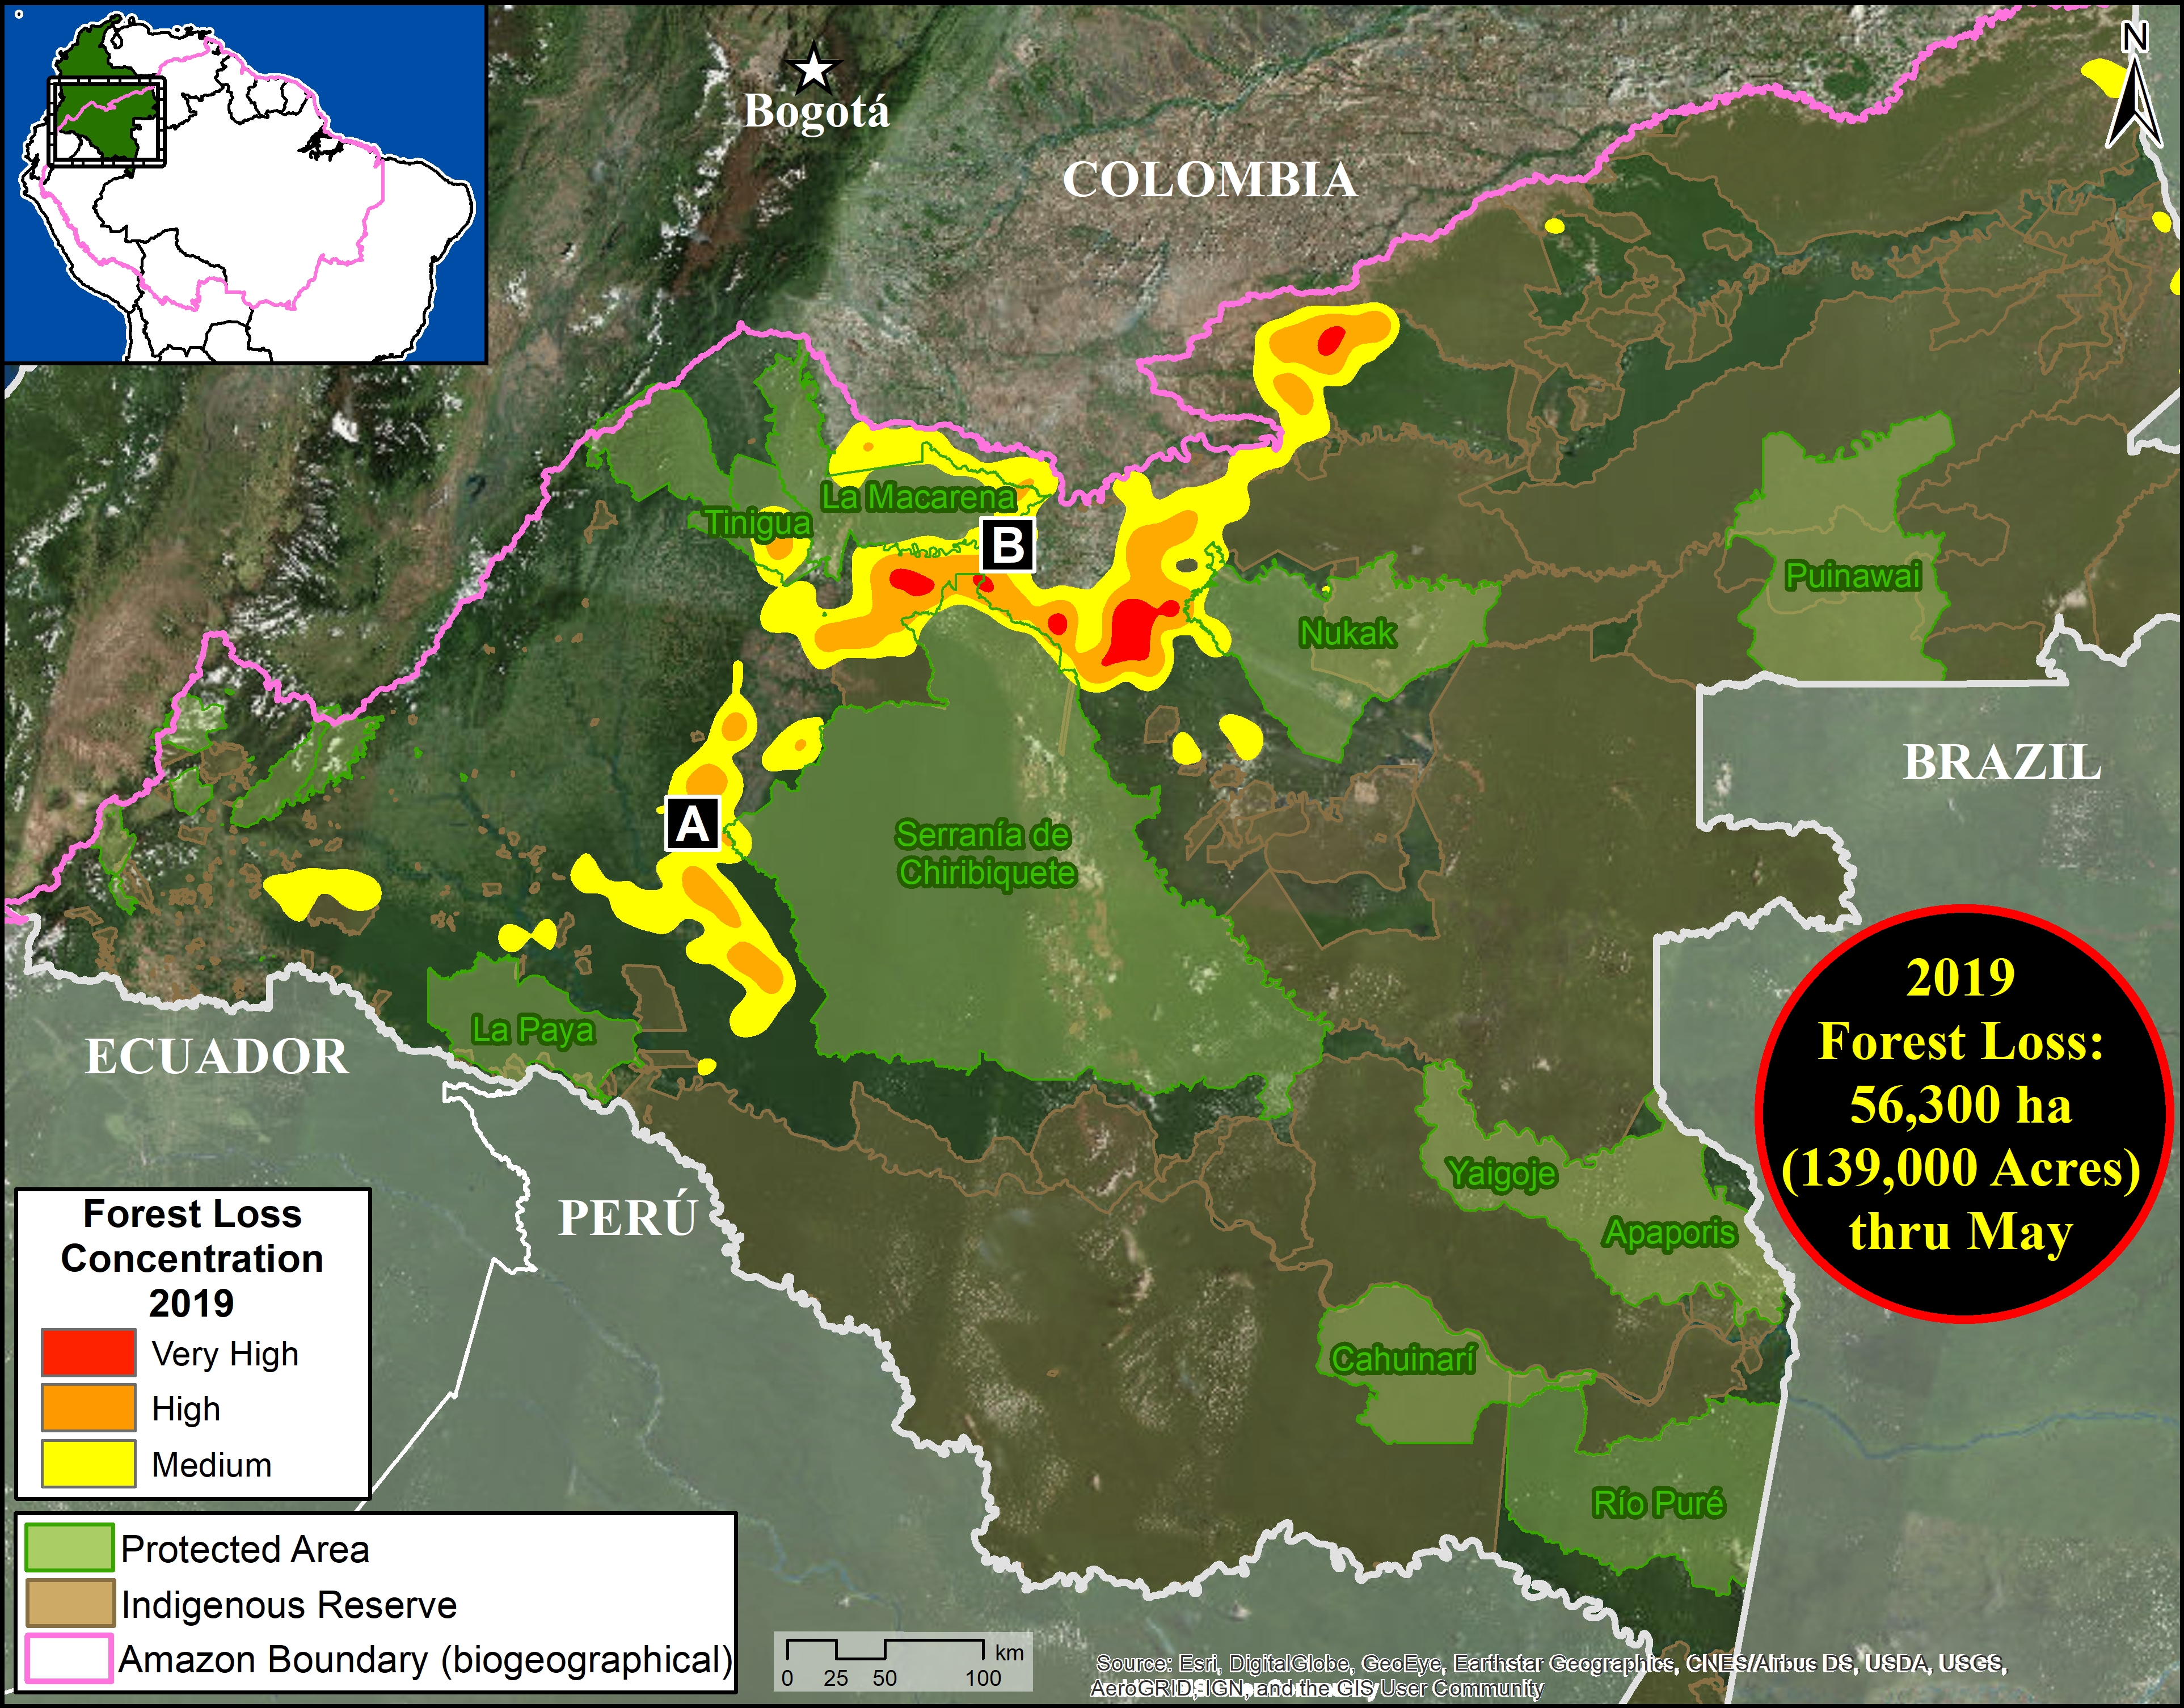
Here, we provide a real-time update for 2019 based on early warning GLAD alerts.** The alerts indicate the loss of 56,300 hectares (139,100 acres) in the first five months of 2019 (January to May) in the Colombian Amazon.

The Base Map (see below) shows the deforestation hotspots are again concentrated in the northwest Colombian Amazon.

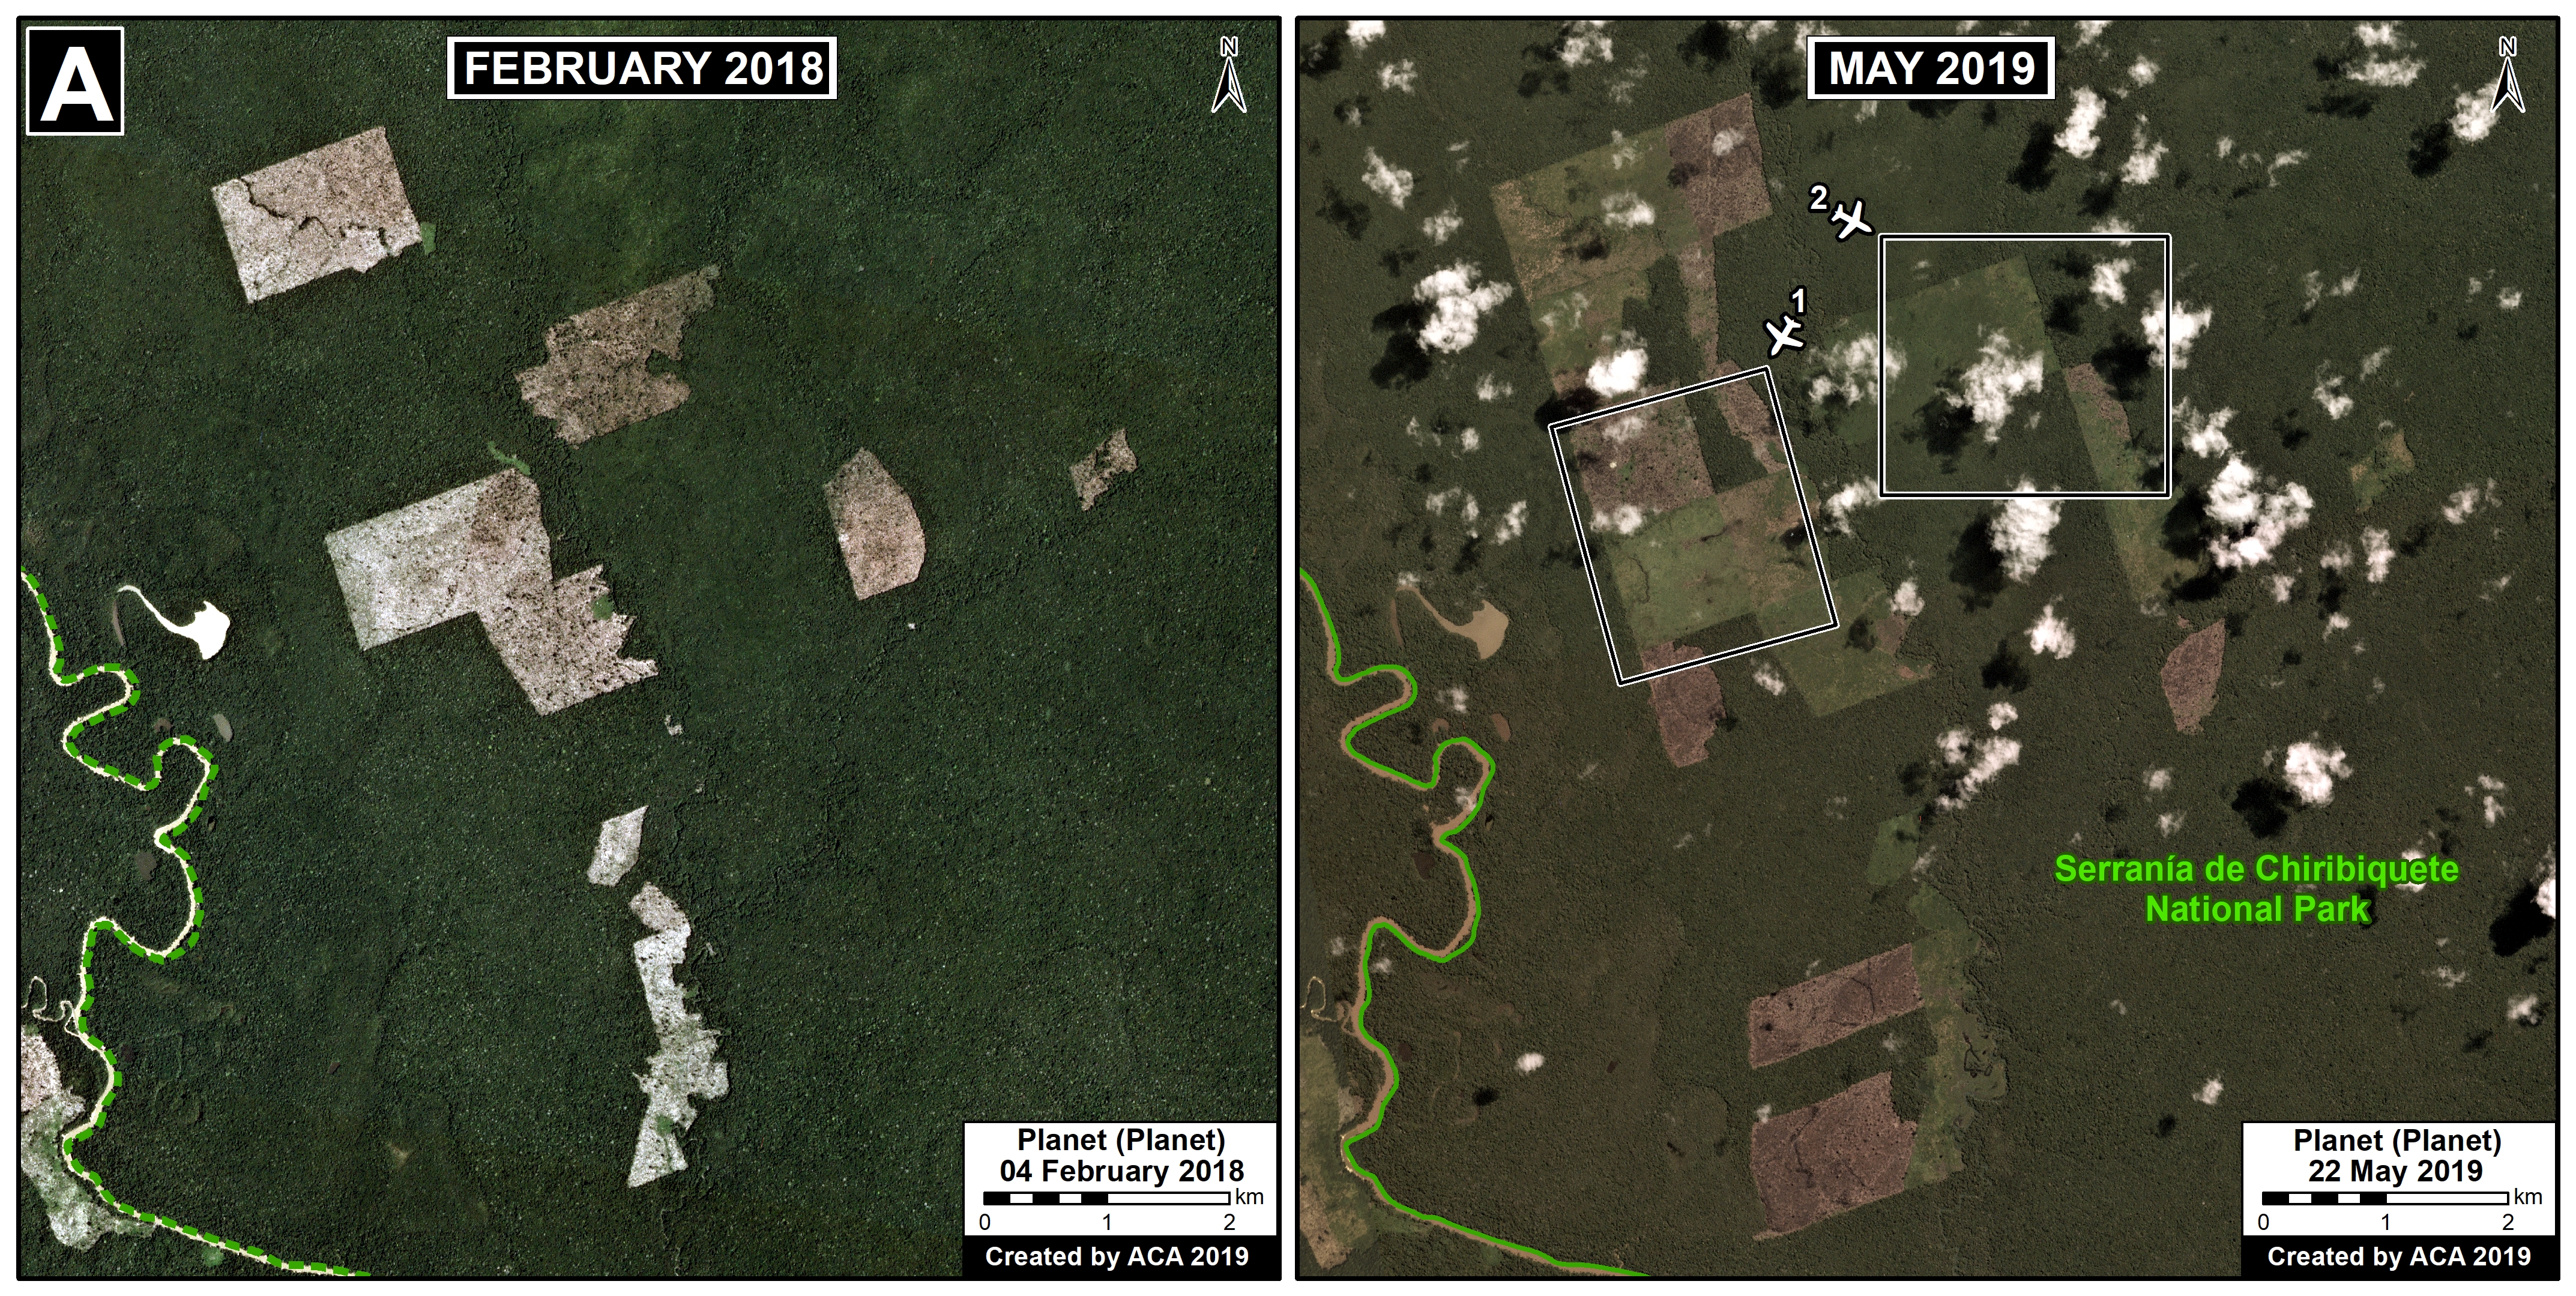
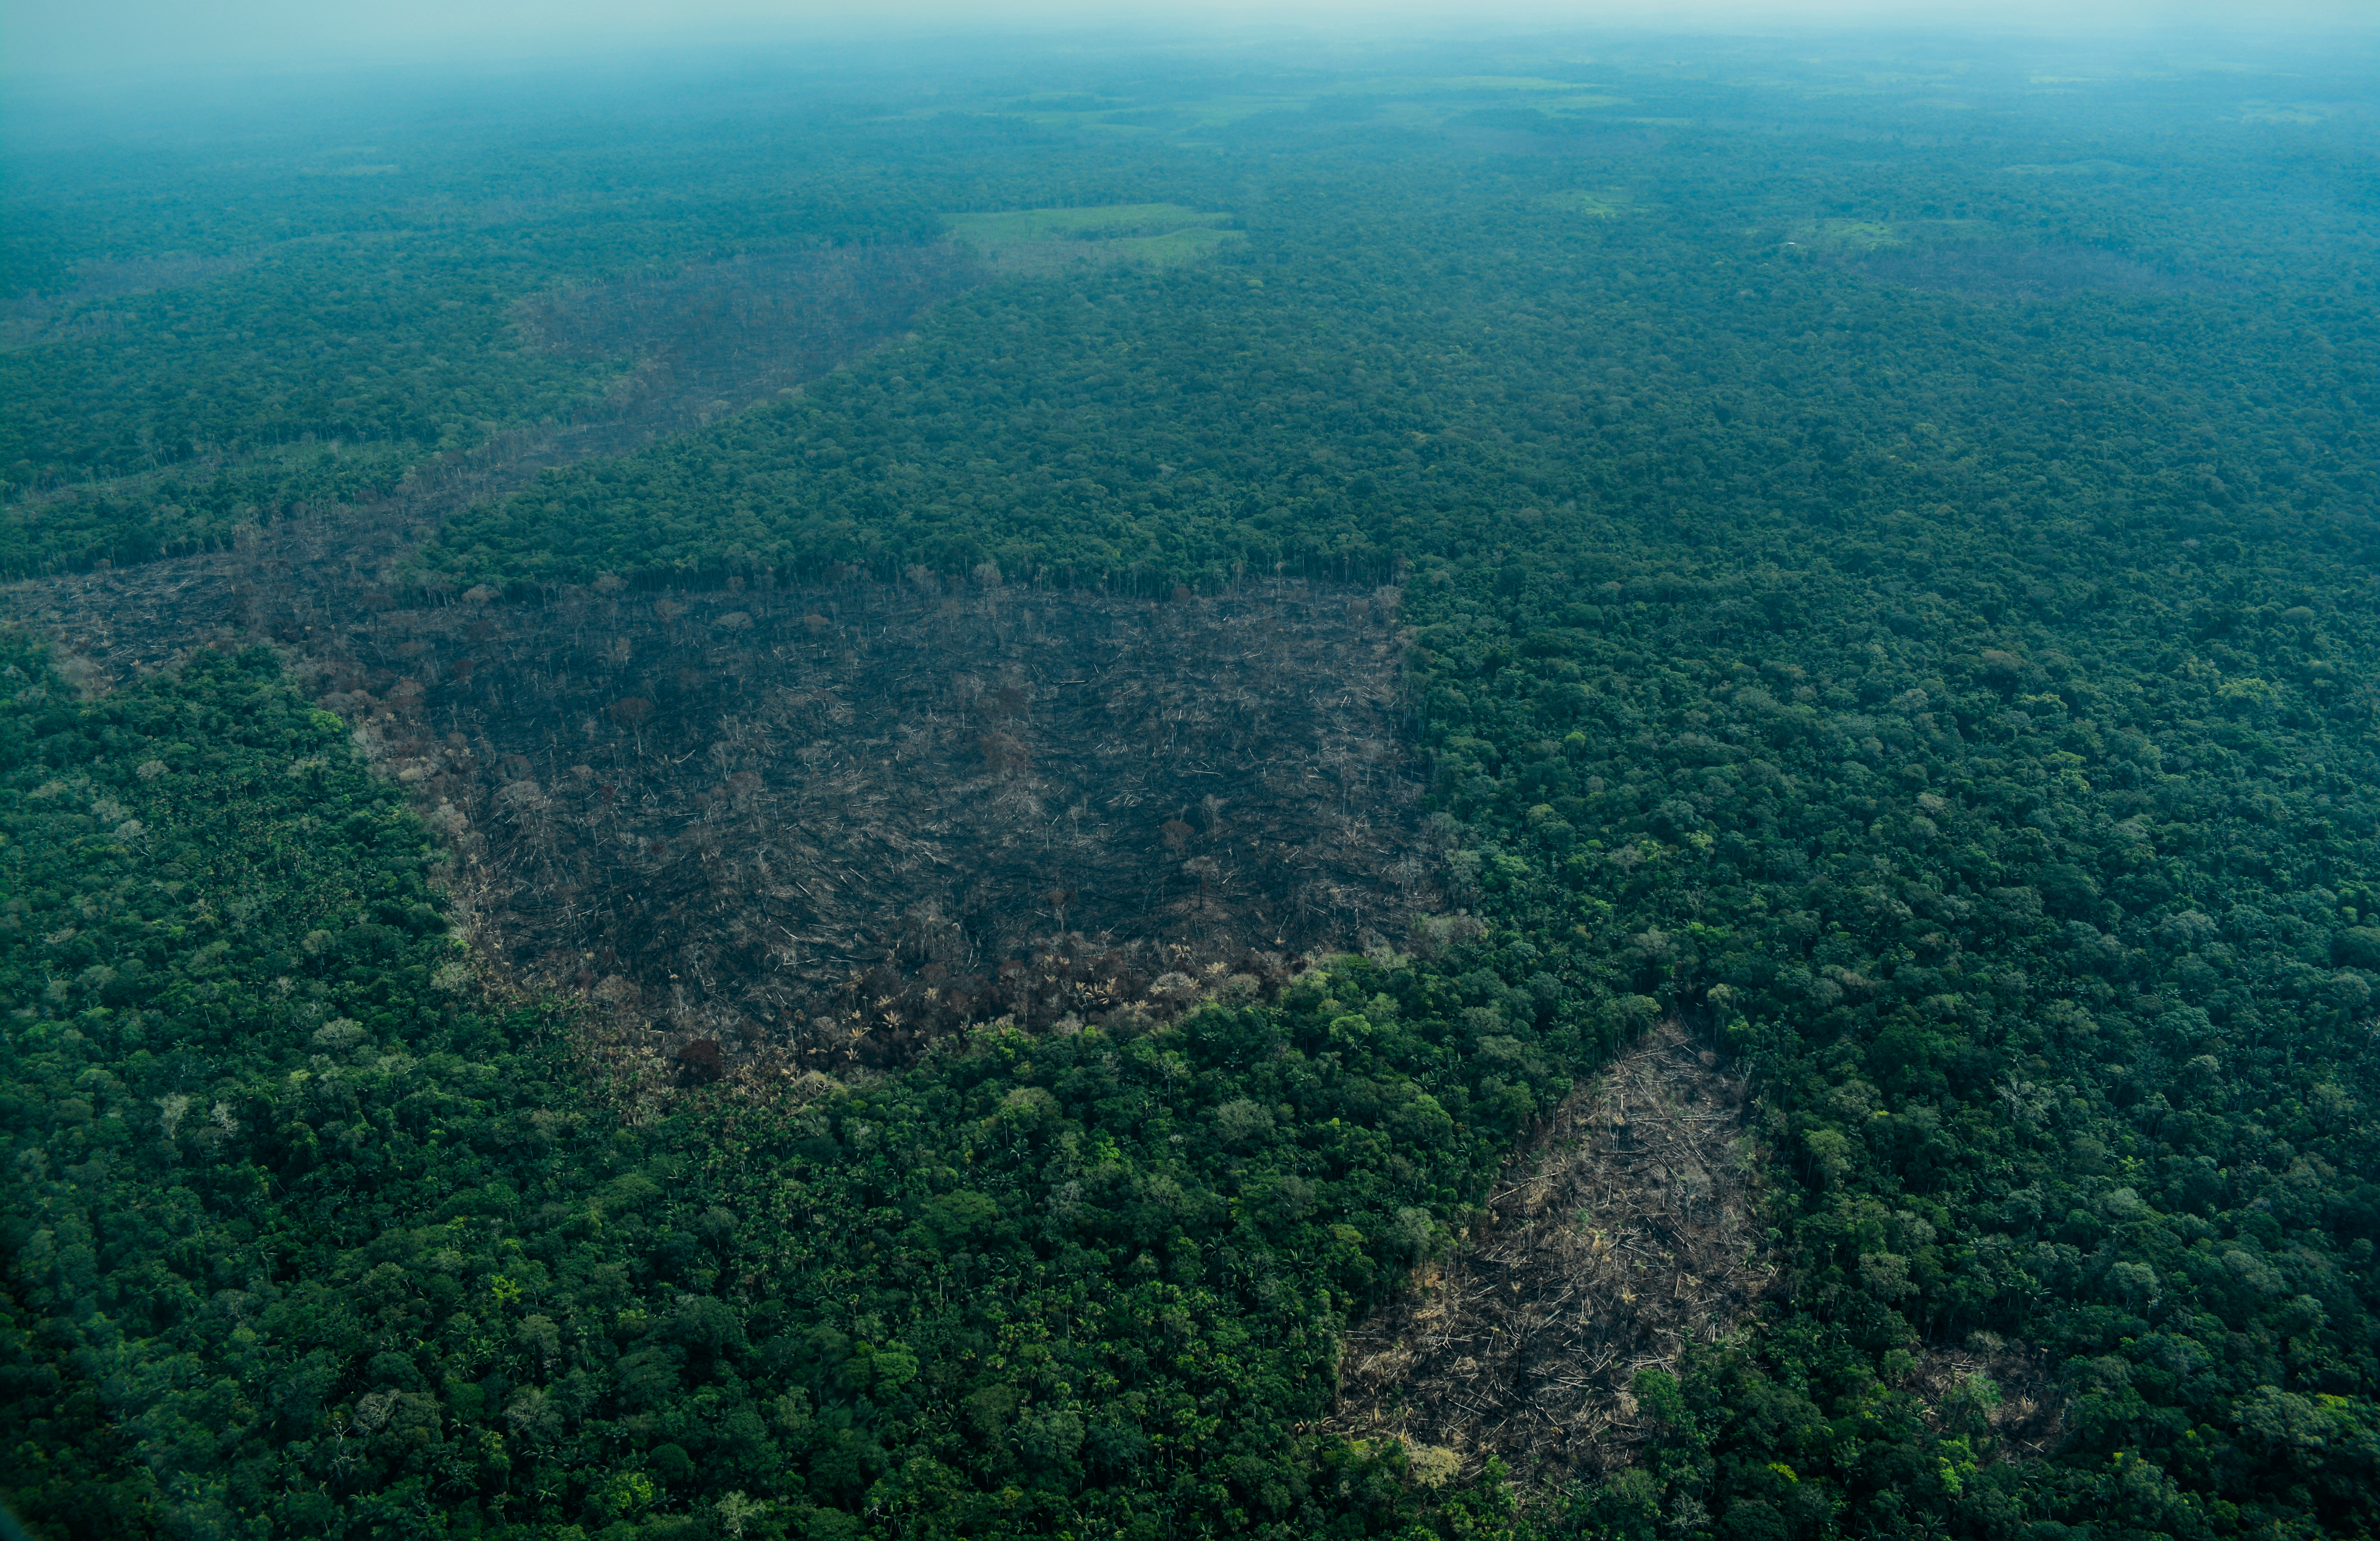
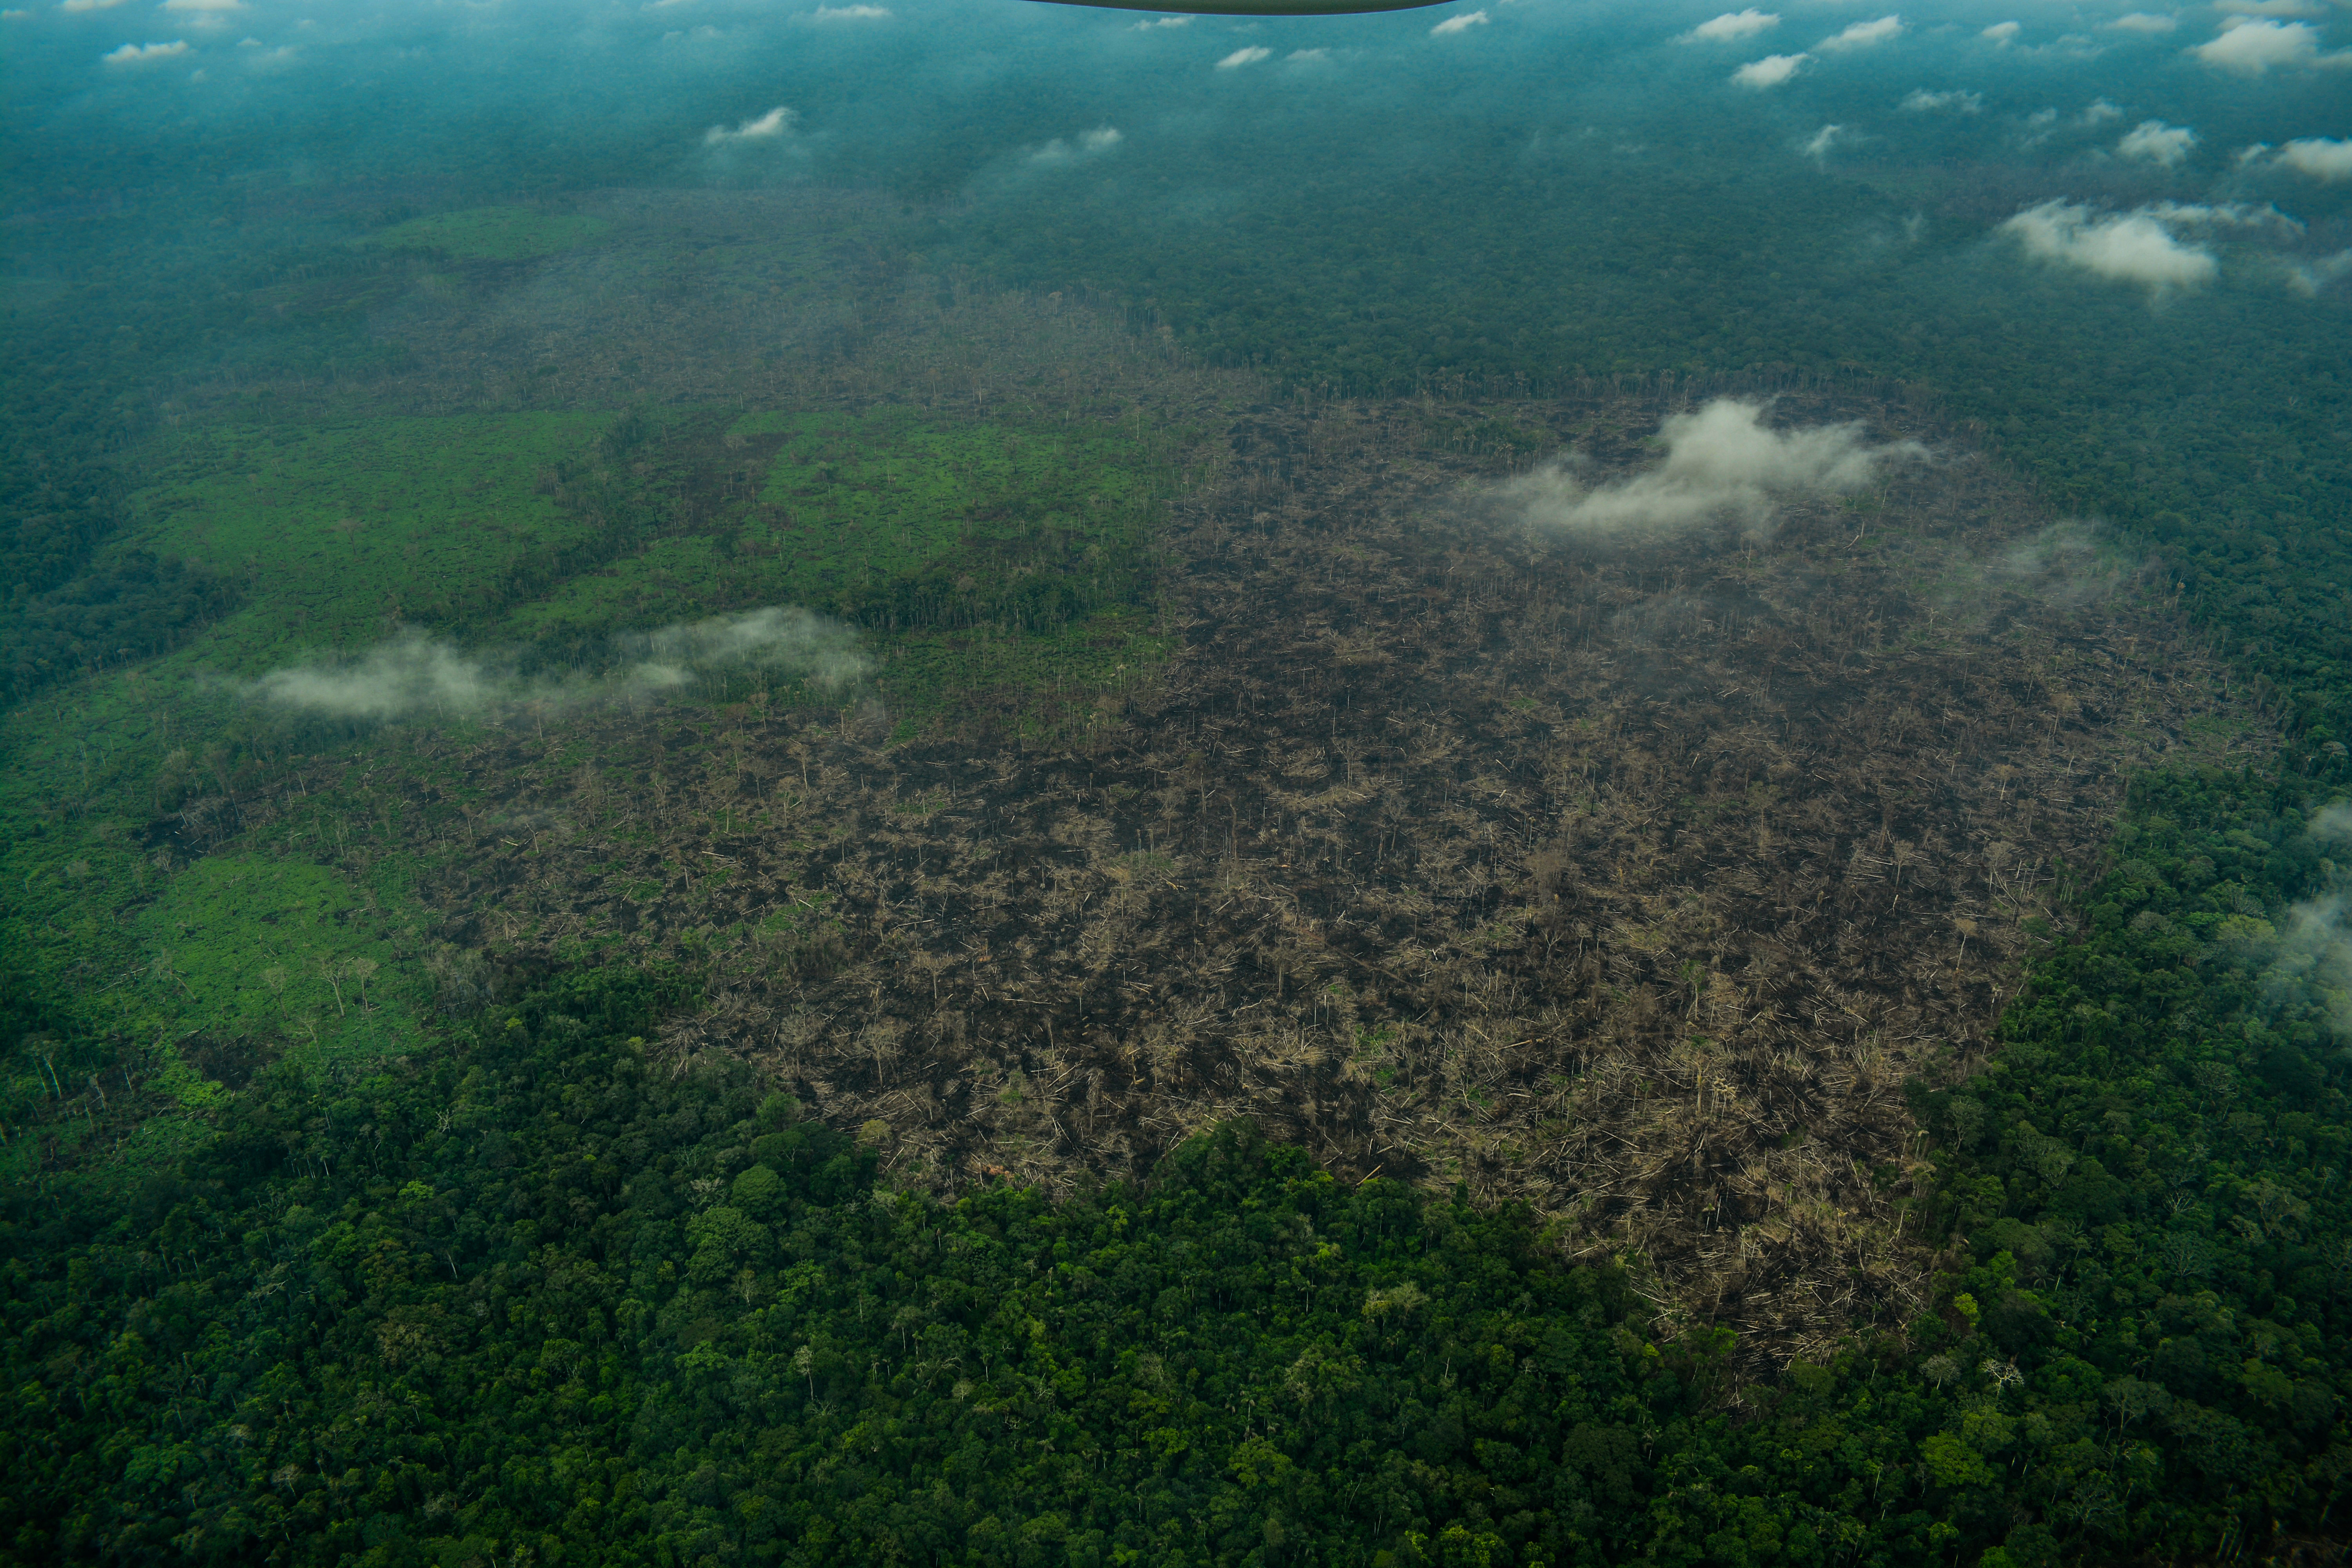
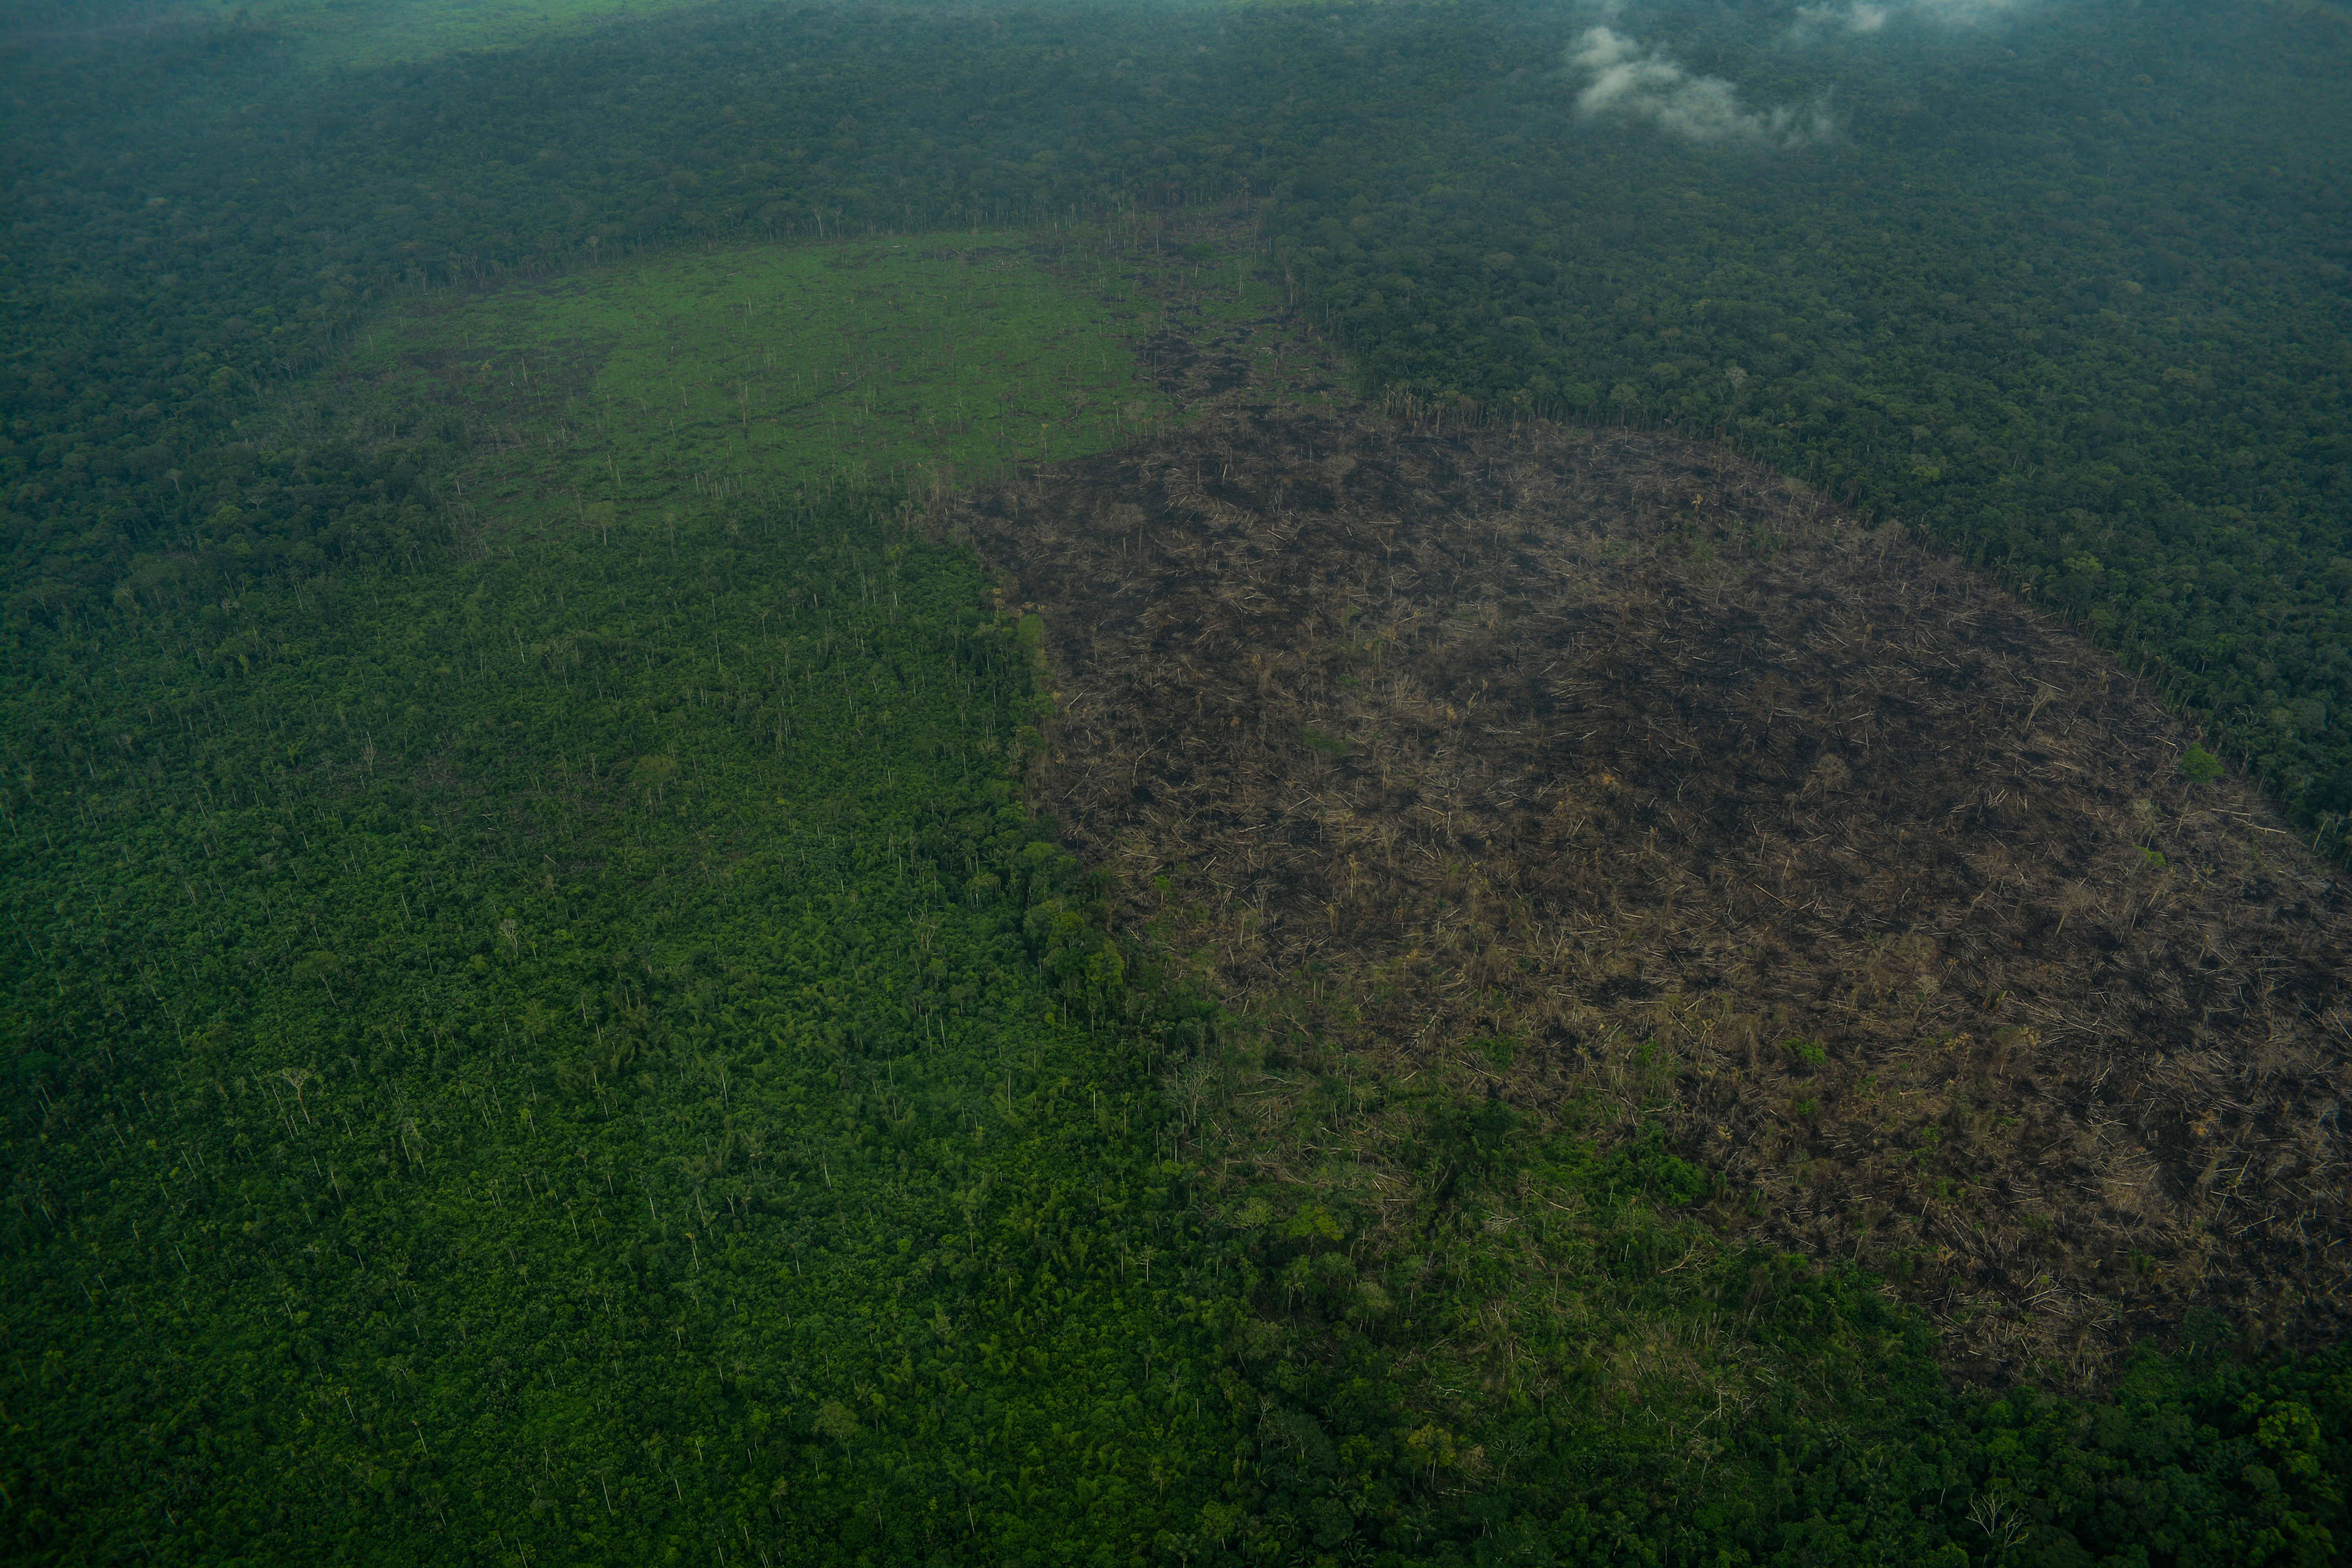
We focus on Chiribiquete National Park, showing satellite imagery and overflight photos for two sections of the park experiencing recent deforestation.***

We estimate the deforestation of 2,200 hectares (5,400 acres) inside the Park since its expansion in July 2018.

As described below, one of the main deforestation drivers in the region is conversion to pasture for land grabbing or cattle ranching.


Base Map. 2019 deforestation hotspots in the Colombian Amazon. Data: UMD/GLAD, RUNAP, RAISG.

Zoom 1: Western Chiribiquete (Llanos de Yari)

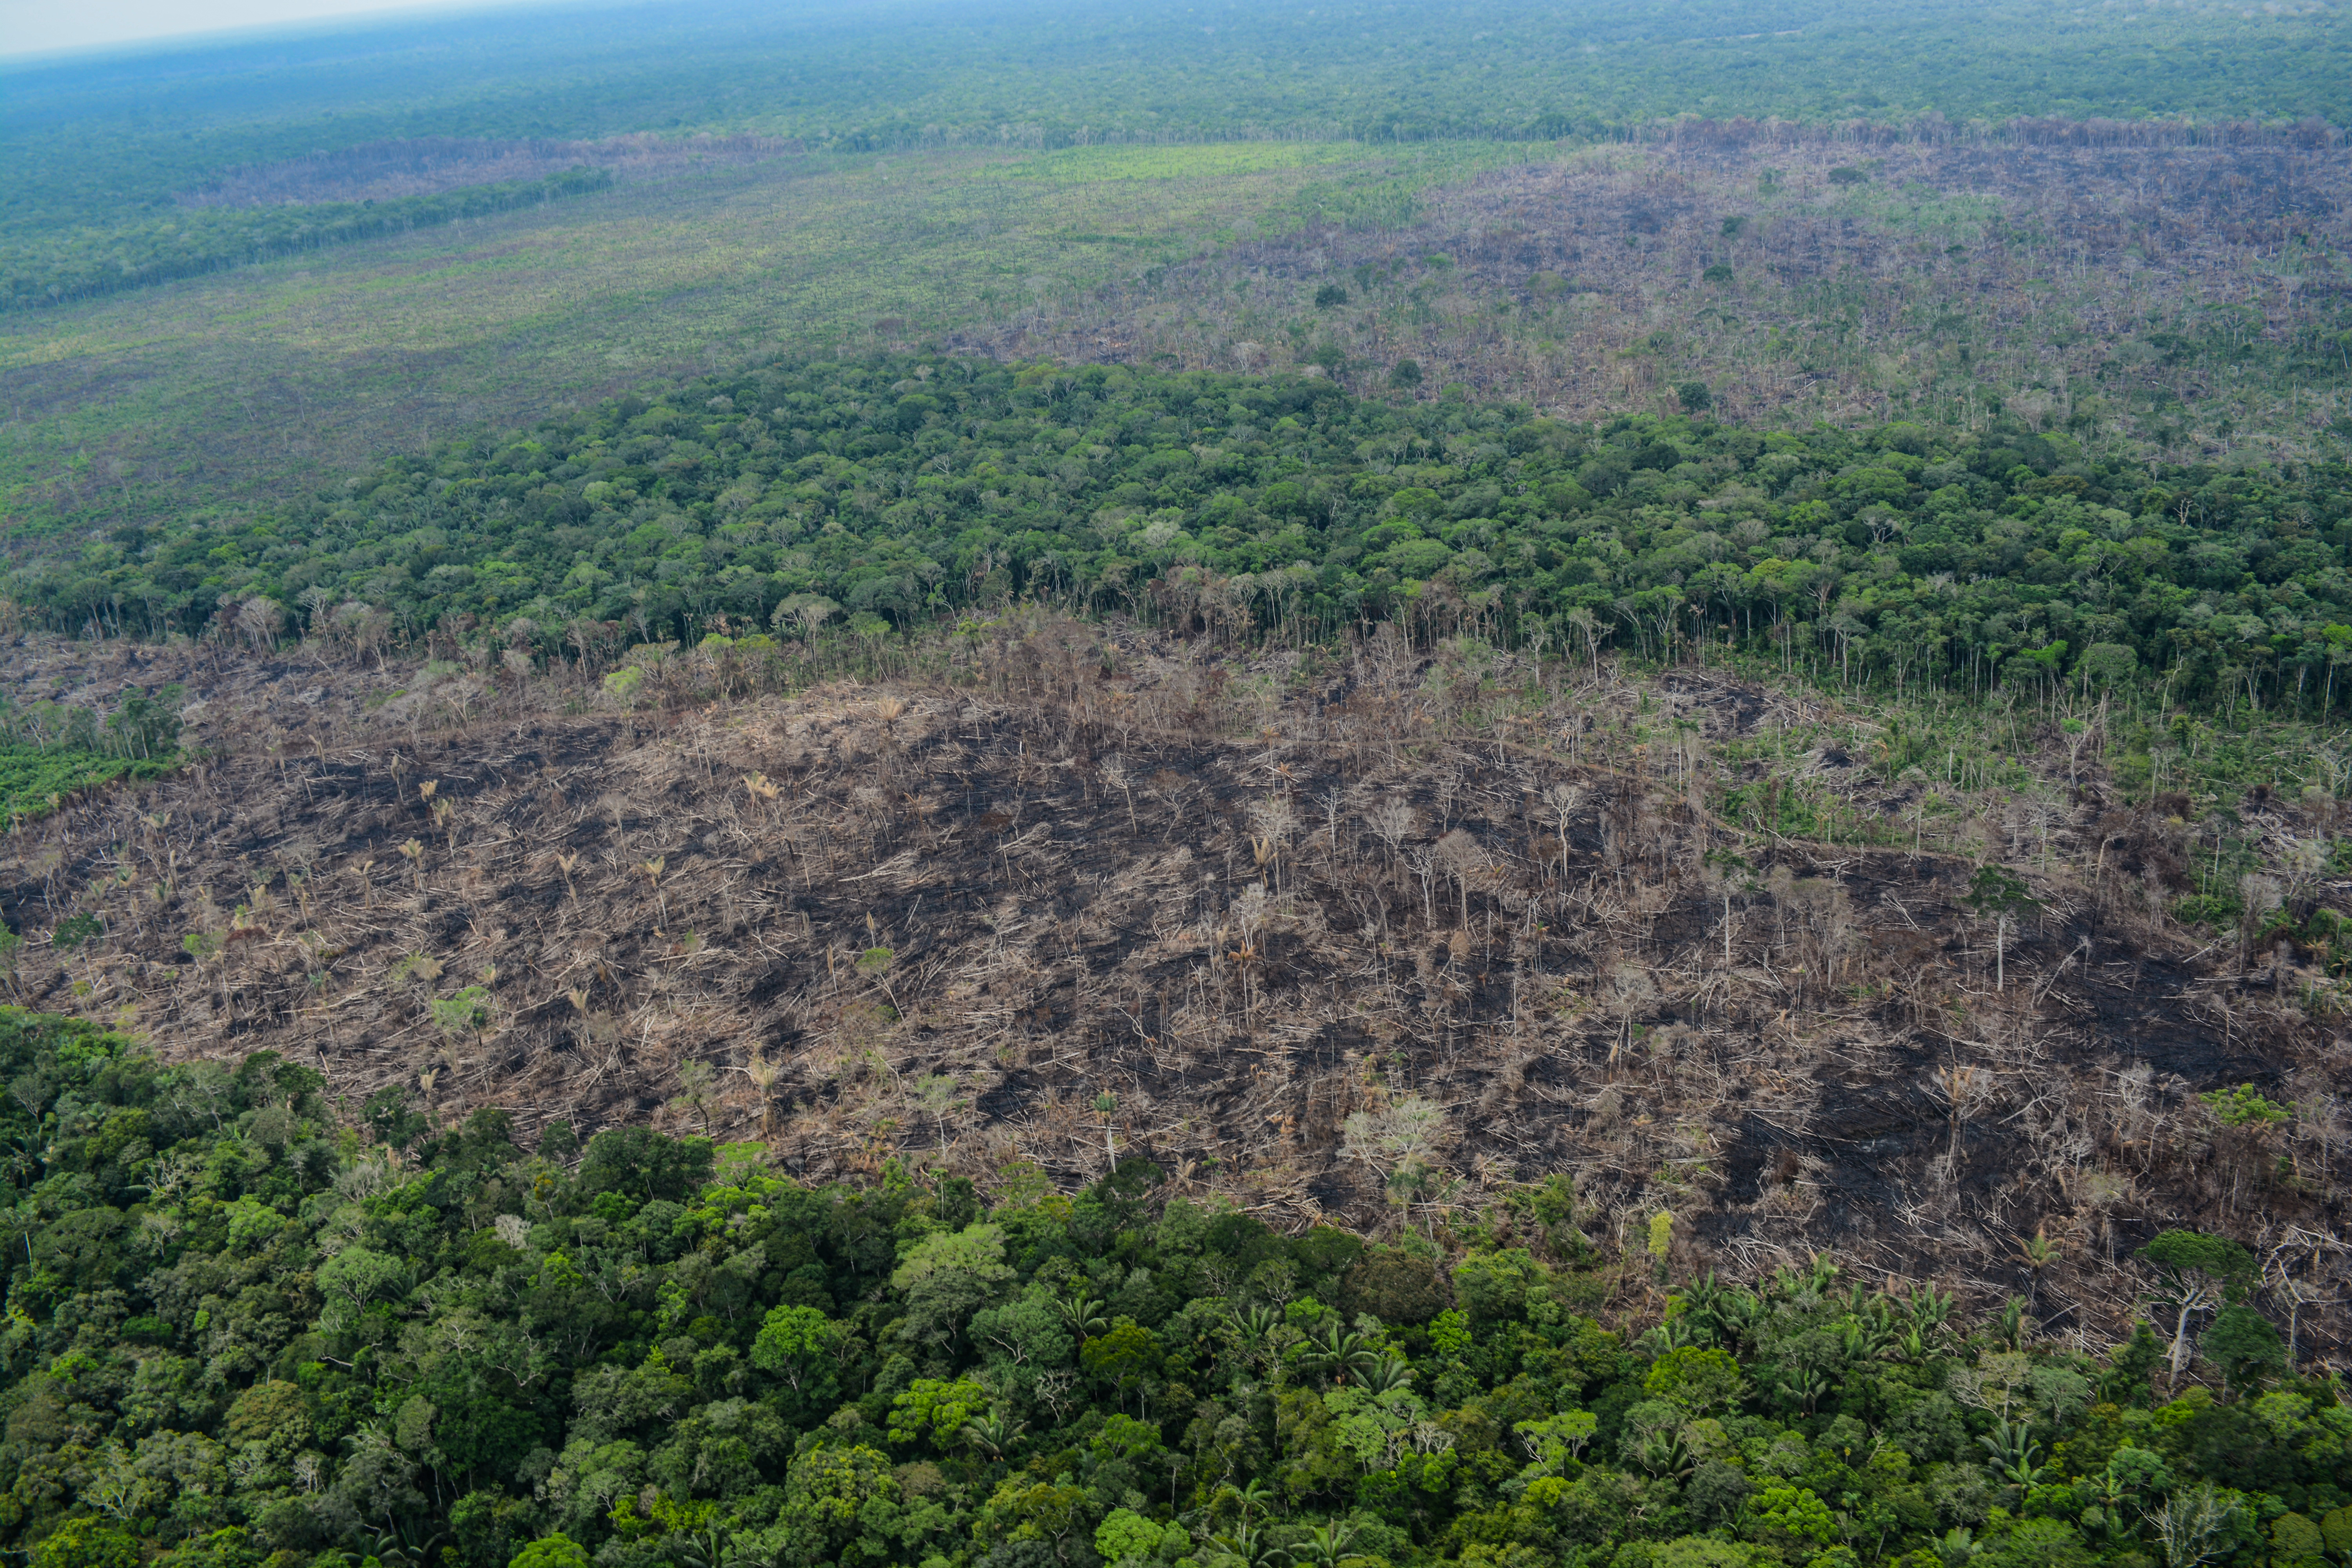
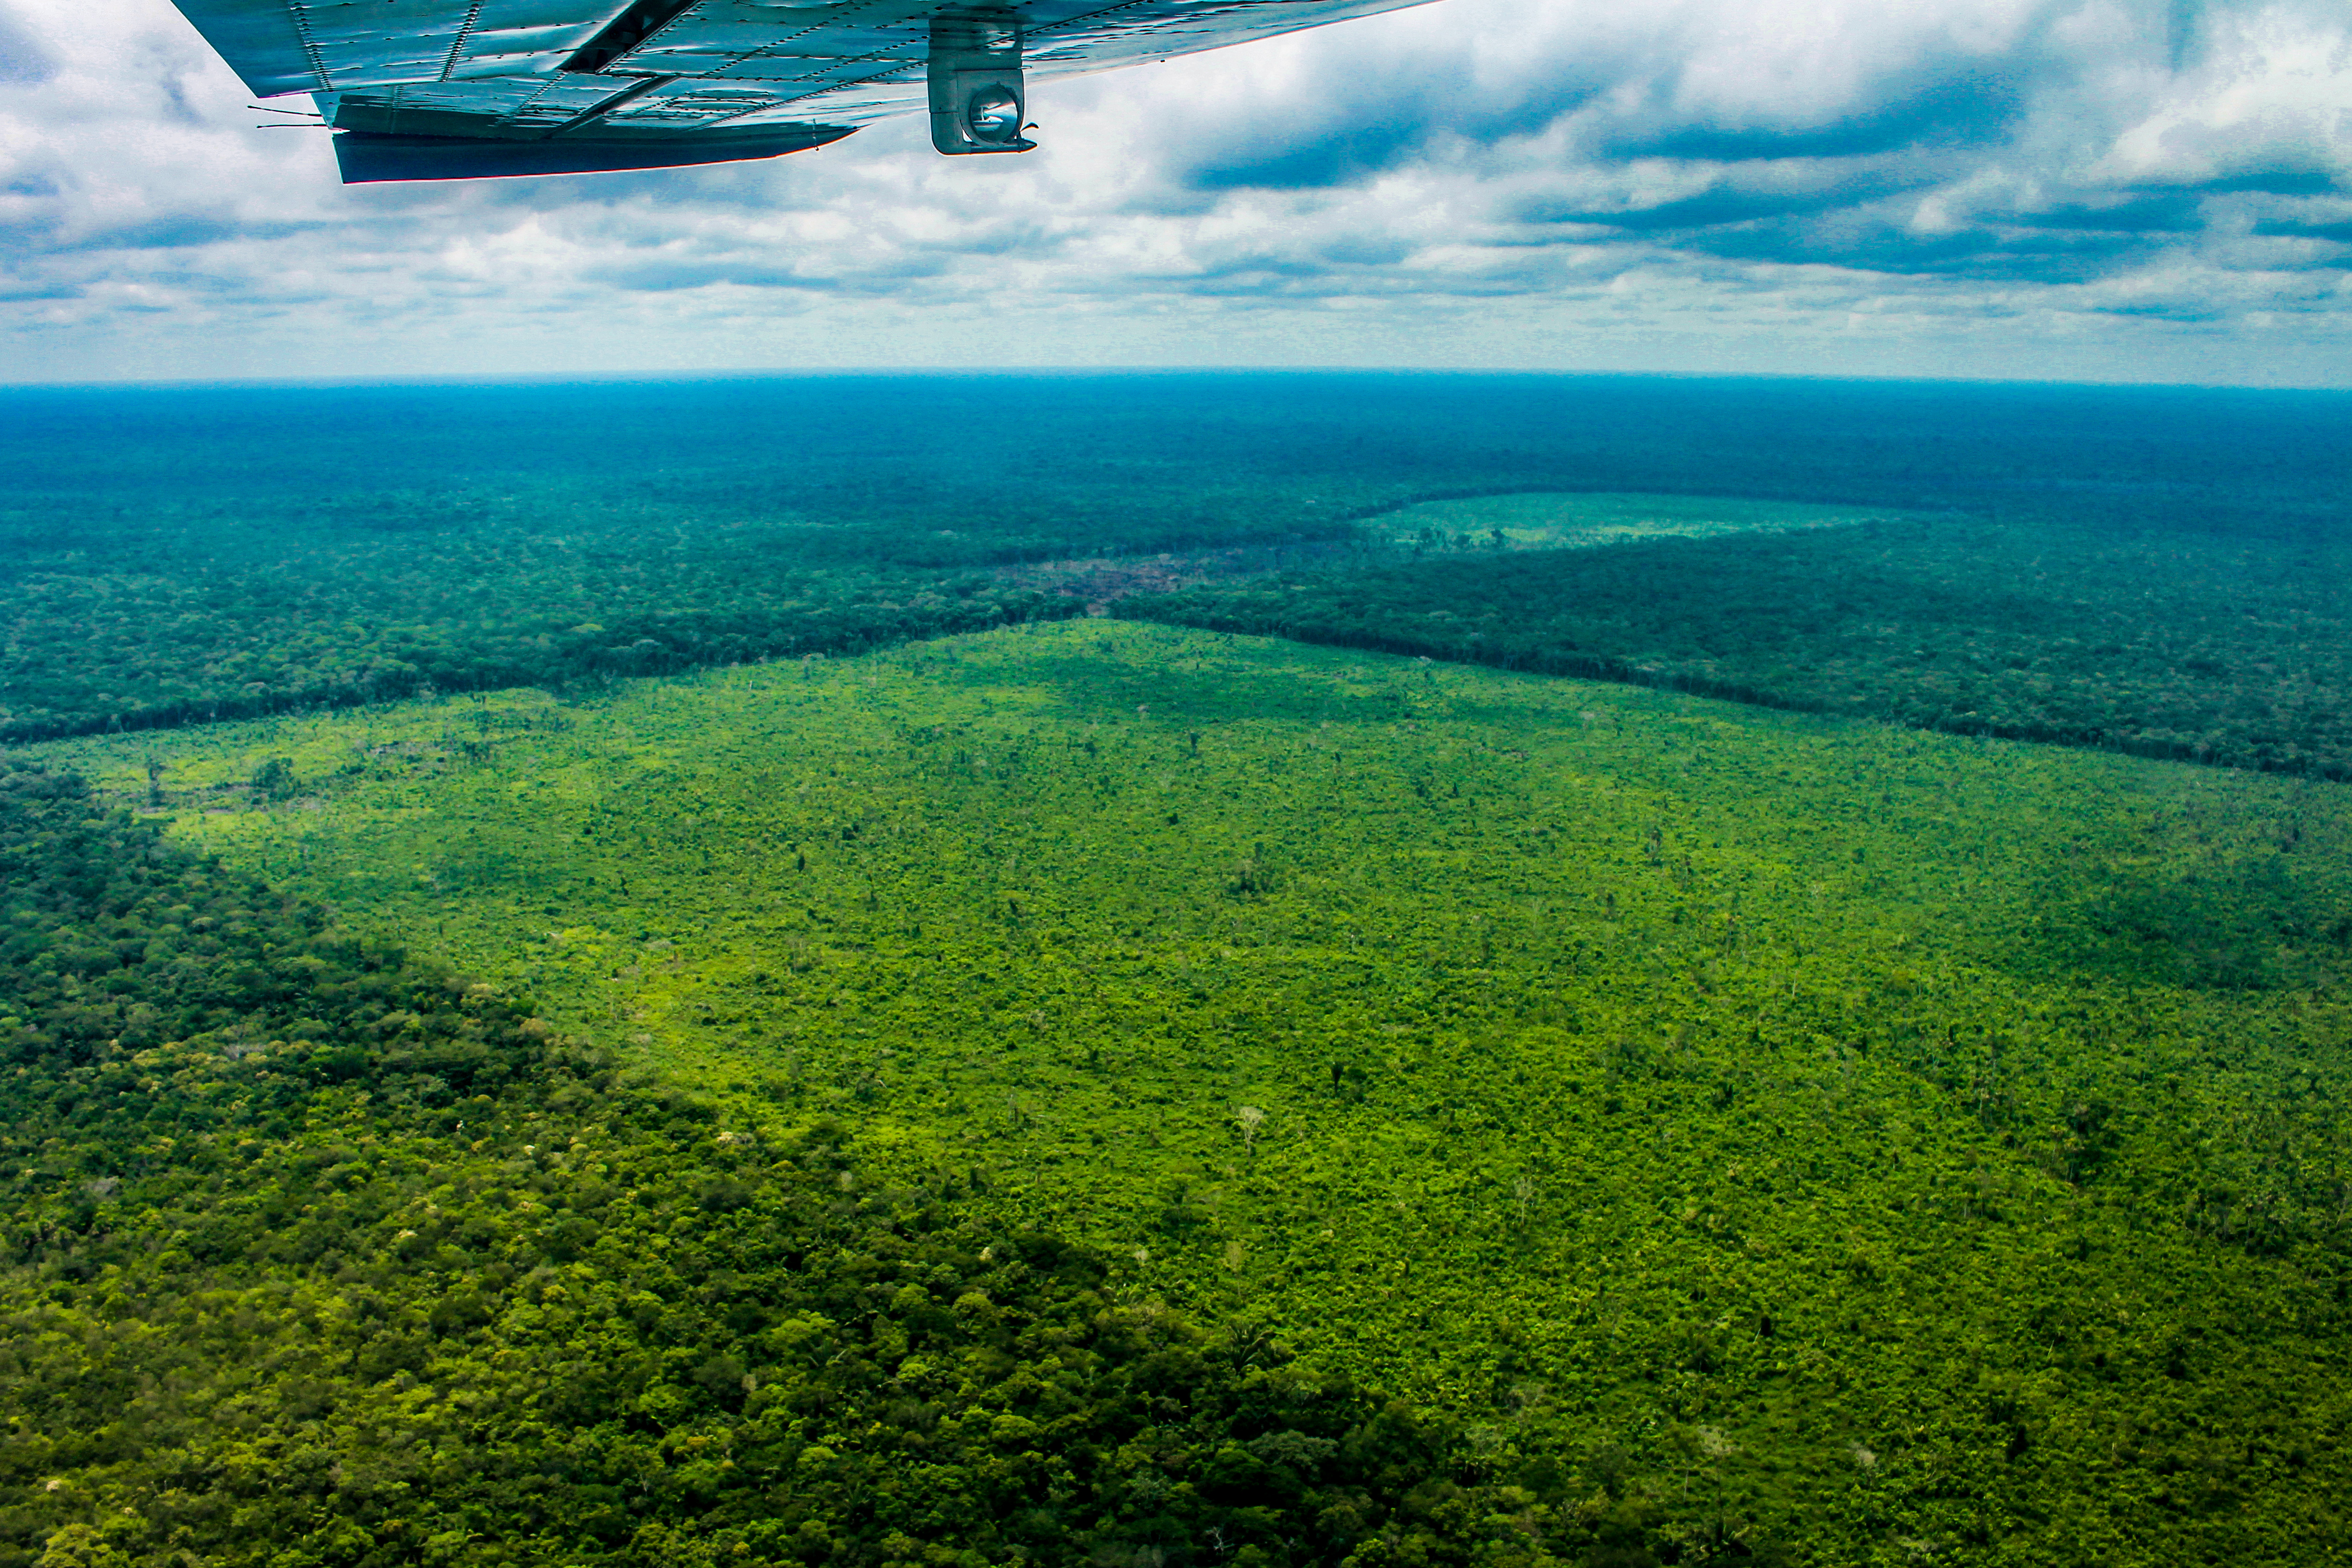
Zoom 1 shows the deforestation in the recently expanded western section of Chiribiquete National Park between February 2018 (left panel) and May 2019 (right panel). The white inset boxes indicate the areas of the overflight photos shown below.

We estimate the deforestation of 555 hectares (1,300 acres) in this section of the park since July 2018, the date of the expansion of Chiribiquete National Park in this area.

Zoom 1. Western Chiribiquete National Park (Llanos de Yari). Data: Planet.
Inset A1. Overflight photo over Chiribiquete National Park, courtesy of FCDS/RFN/AAF.
Inset A2. Overflight photo over Chiribiquete National Park, courtesy of FCDS/RFN/AAF.

A recent report by the Colombian government agency charged with monitoring deforestation (IDEAM 2019) characterizes the situation as follows:

“In this area, the process of colonization is accelerated, causing a growing demand for resources and new lands, which is encouraged by the reconfiguration of organized armed groups and the absence of state control at the local level. The main conversion of the forest is to pasture, destined for cattle ranching or land grabbing. This transformation is advanced by the area’s tertiary road network, which allows access to new areas of forest and burning as a method of rapid removal of coverage. This area is also used for illicit crops.”

Zoom 2: Northern Chiribiquete

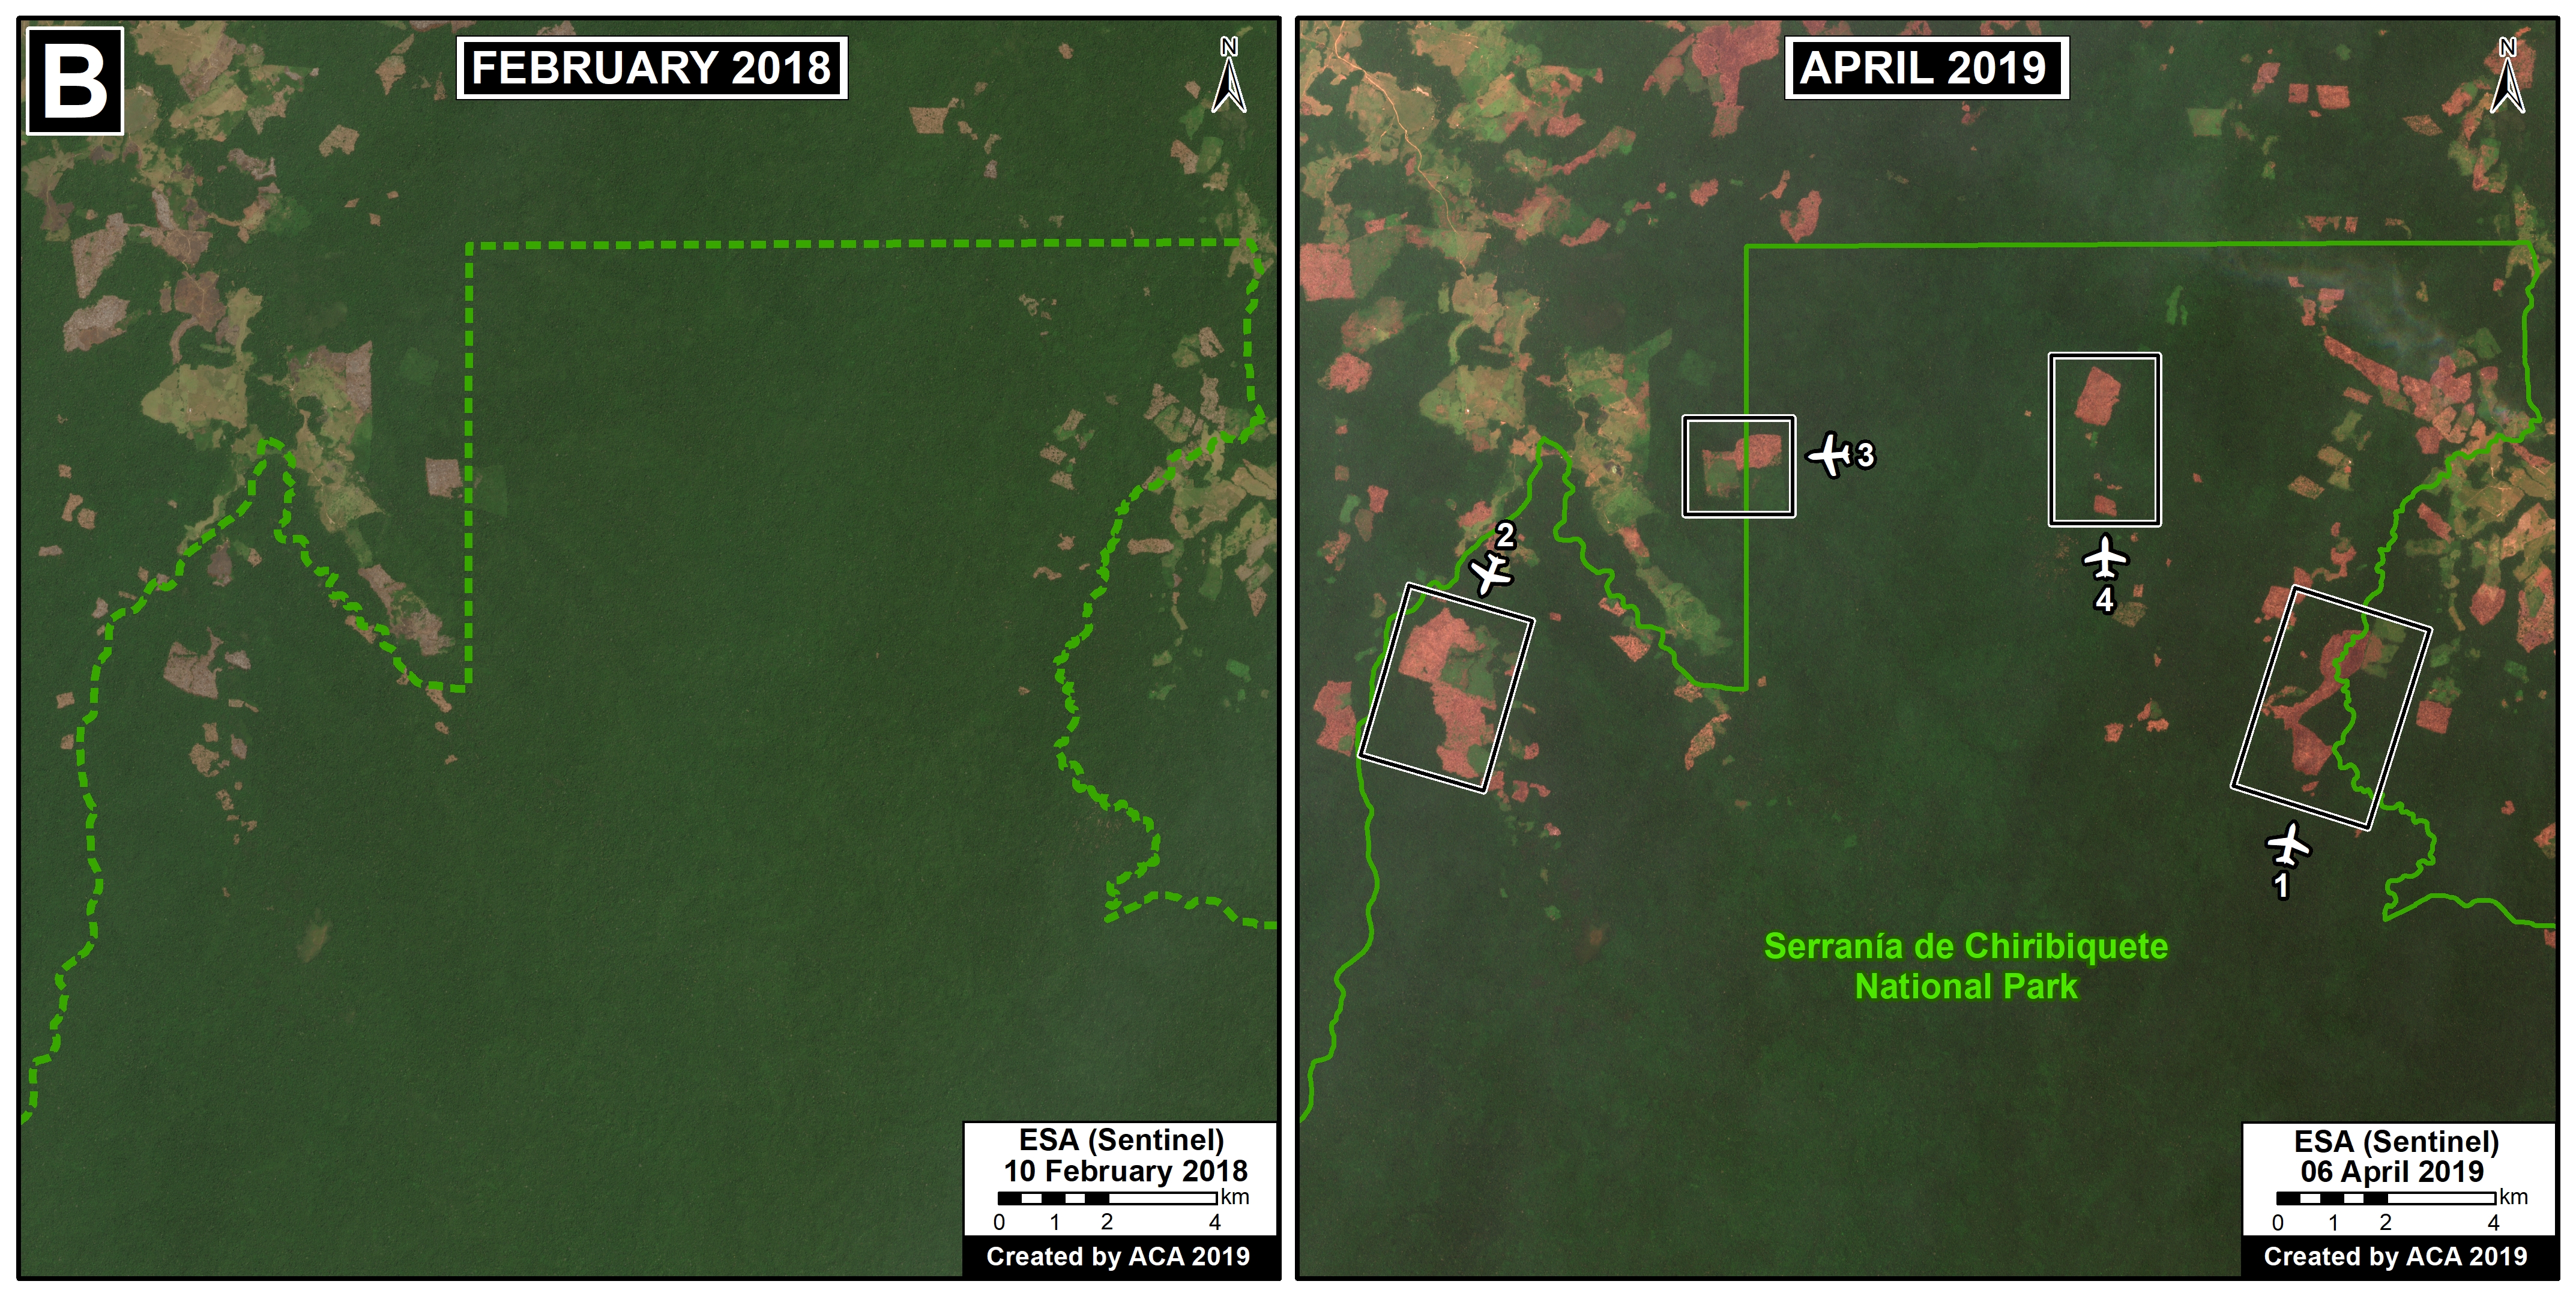
Zoom 2 shows the deforestation in the recently expanded northern section of Chiribiquete National Park between February 2018 (left panel) and April 2019 (right panel). The white inset boxes indicate the areas of the overflight photos shown below.

We estimate the deforestation of 1,650 hectares (4,100 acres) in this section of the park since 2018, the date of the expansion of Chiribiquete National Park in this area.

Zoom 2. Northern Chiribiquete National Park. Data: ESA.
Inset B1. Overflight photo over Chiribiquete National Park, courtesy of FCDS/RFN/AAF.
Inset B2. Overflight photo over Chiribiquete National Park, courtesy of FCDS/RFN/AAF.
Inset B3. Overflight photo over Chiribiquete National Park, courtesy of FCDS/RFN/AAF.
Inset B4. Overflight photo over Chiribiquete National Park, courtesy of FCDS/RFN/AAF.


A recent report by the Colombian government agency charged with monitoring deforestation (IDEAM 2019) characterizes the situation as follows:

“As is common in the Amazon region, the main activity driving the transformation of forests in this area is the establishment of pastures, with the purpose of land grabbing or cattle ranching. This transformation is generally financed by external actors, whose primary motivation is speculation and income generation. The armed actors present in the area promote the development of illicit agricultural activities, as well as the expansion of informal road infrastructure, which affects forests by facilitating access.”

Notes

*Including 154,000 hectares (380,5000 acres) of primary forests. The surge started in 2016.

**GLAD alerts, produced by the University of Maryland and presented by Global Forest Watch, are based on Landsat imagery. To generate the deforestation hotspots map, we conducted a kernel density analysis on GLAD alert data from January 1 to May 31, 2019.

***Overflight was March 22, 2019, carried out by Fundación Conservación y Desarrollo, with funding from Rain Forest Norway and Andean Amazon Fund.

References

IDAEM-SMBYC (2019) BOLETÍN DE DETECCIÓN TEMPRANA DE DEFORESTACIÓN #17. Link: http://documentacion.ideam.gov.co/openbiblio/bvirtual/023856/17_BoletinAT-D.pdf

Planet Team (2017). Planet Application Program Interface: In Space for Life on Earth. San Francisco, CA. https://api.planet.com

Acknowledgments

We thank A. Rojas (FCDS) and R. Botero (FCDS) for helpful comments to this report.

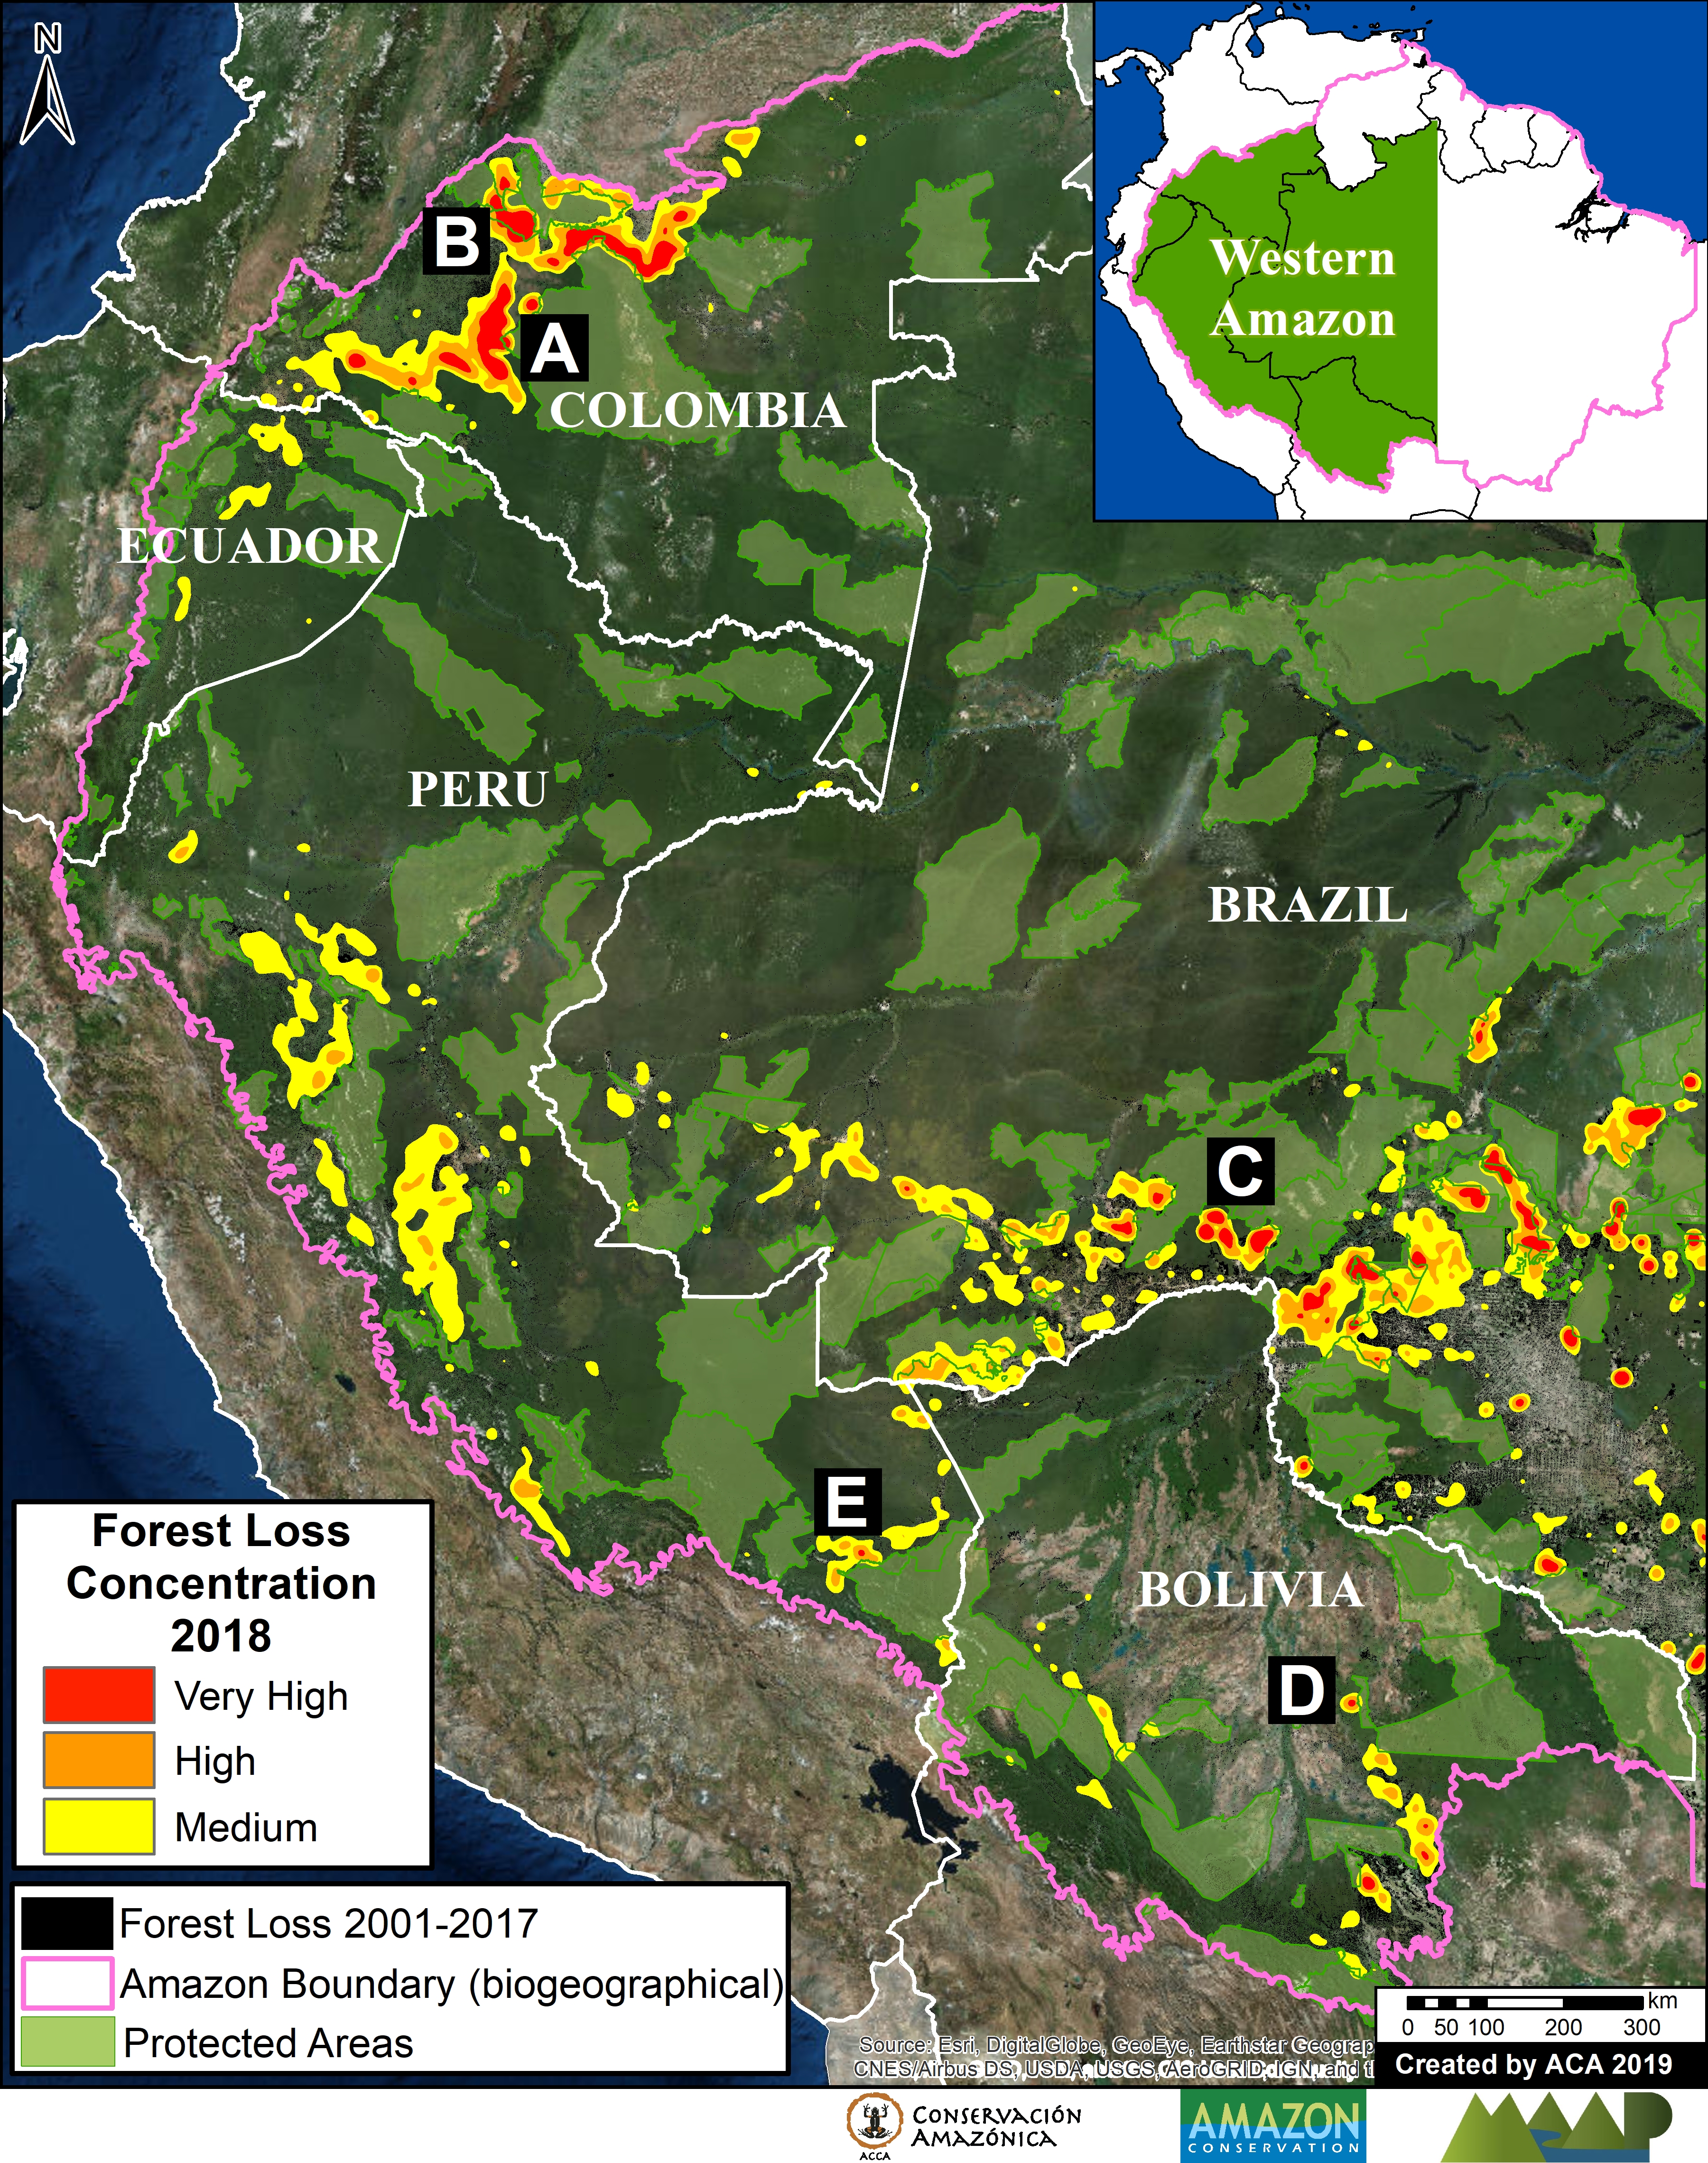
MAAP #100: Western Amazon – Deforestation Hotspots 2018 (a regional perspective)

Base Map. Deforestation Hotspots in the western Amazon. Data: Hansen/UMD/Google/USGS/NASA, GFW, SERNANP, SNAP, SINAP, SERNAP, RAISG

For the 100th MAAP report, we present our first large-scale western Amazon analysis: Colombia, Peru, Ecuador, Bolivia, and western Brazil (see Base Map).

We use the new 2018 data for forest cover loss, generated by the  University of Maryland (Hansen et al 2013) and presented by Global Forest Watch.

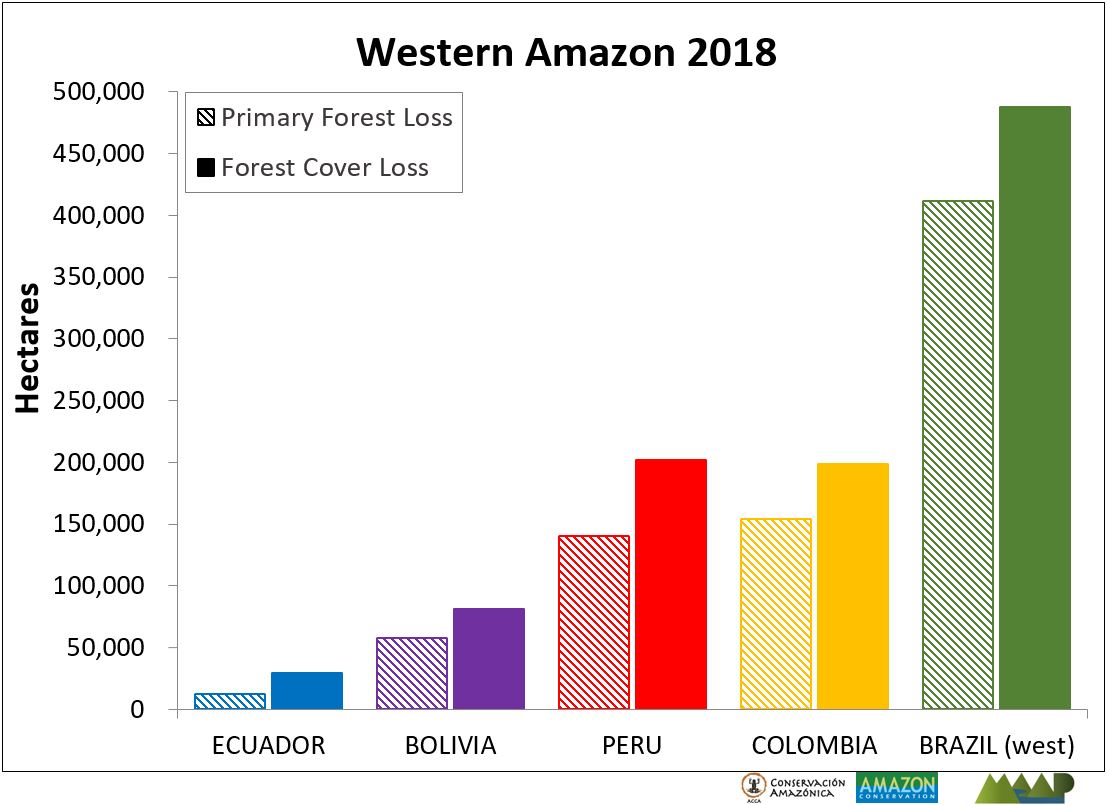
These data indicate 2.5 million acres of forest cover loss in the western Amazon in 2018.*

We conducted an additional analysis that indicates, of this total, 1.9 million acres were primary forest.*

To identify deforestation hotspots consistently across this vast landscape, we conducted a kernel density analysis (see Methodology).

The Base Map shows the hotspots in yellow, orange and red, indicating areas with medium, high, and very high forest loss concentrations, respectively.

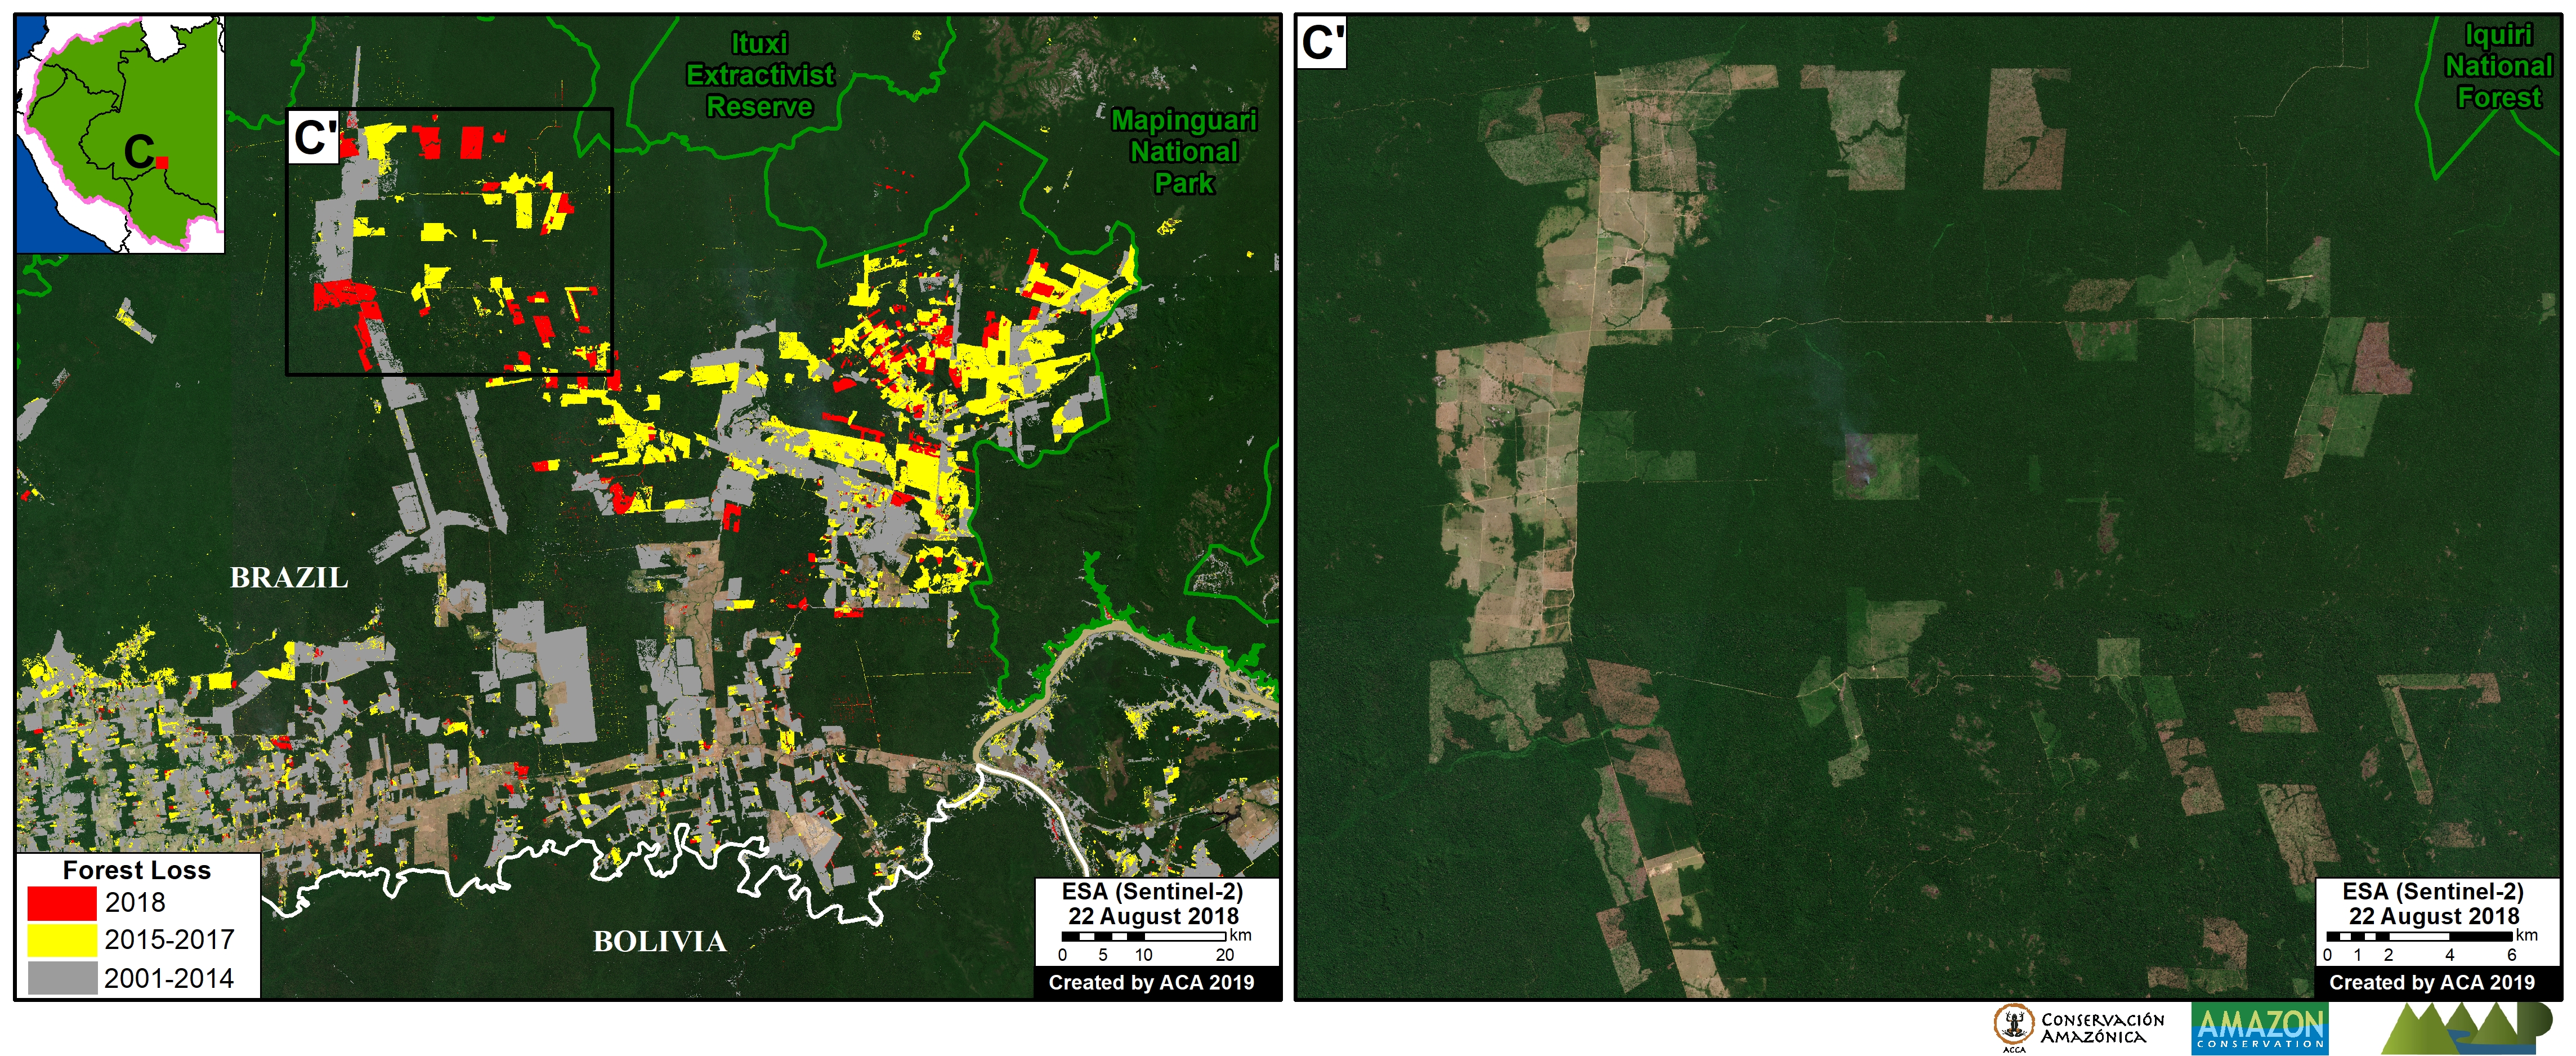
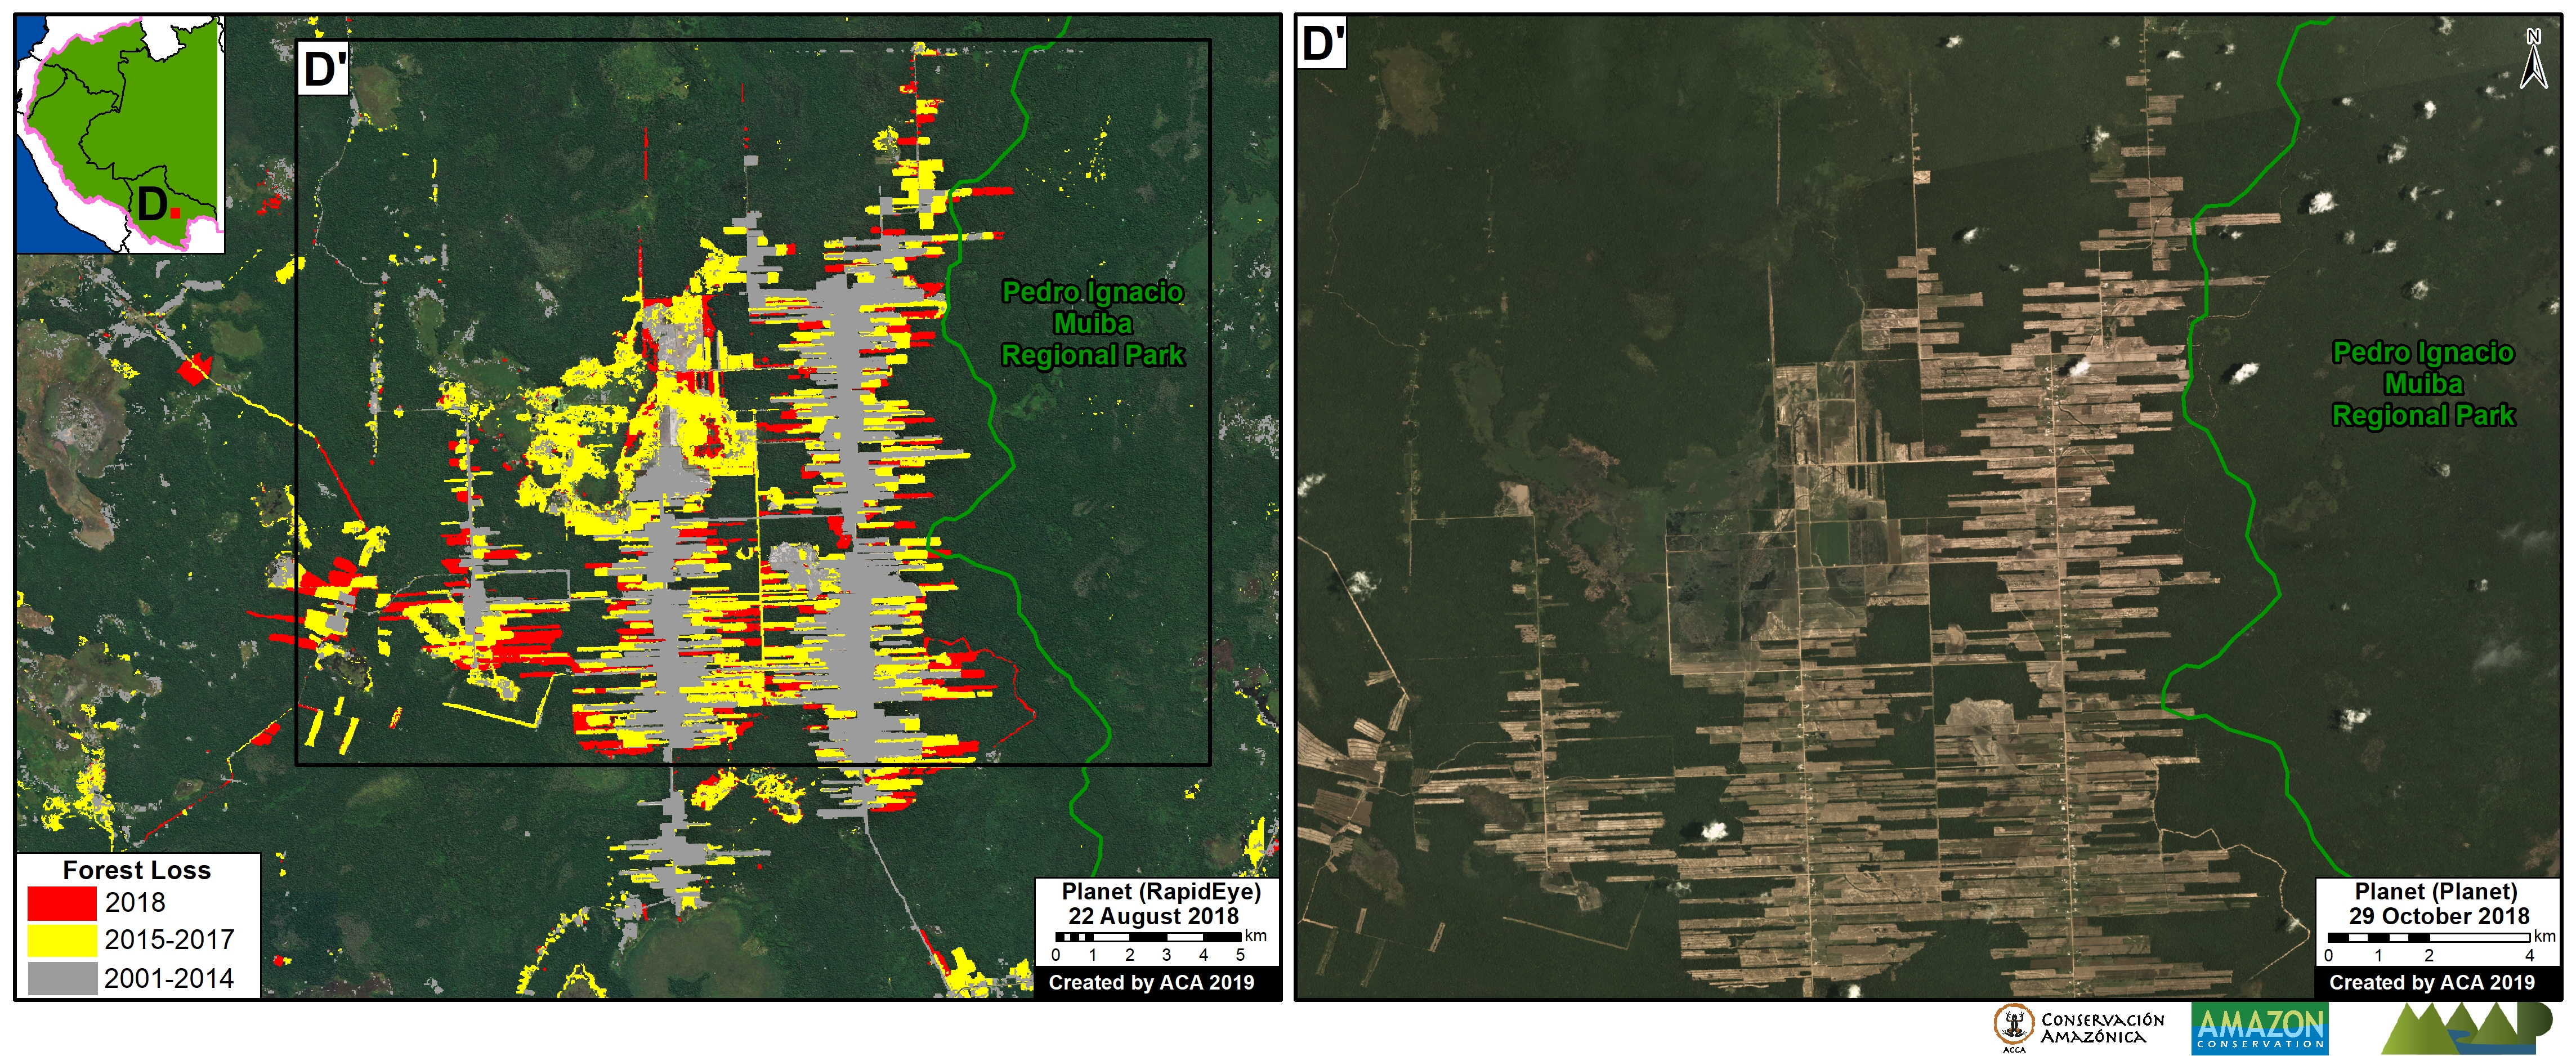
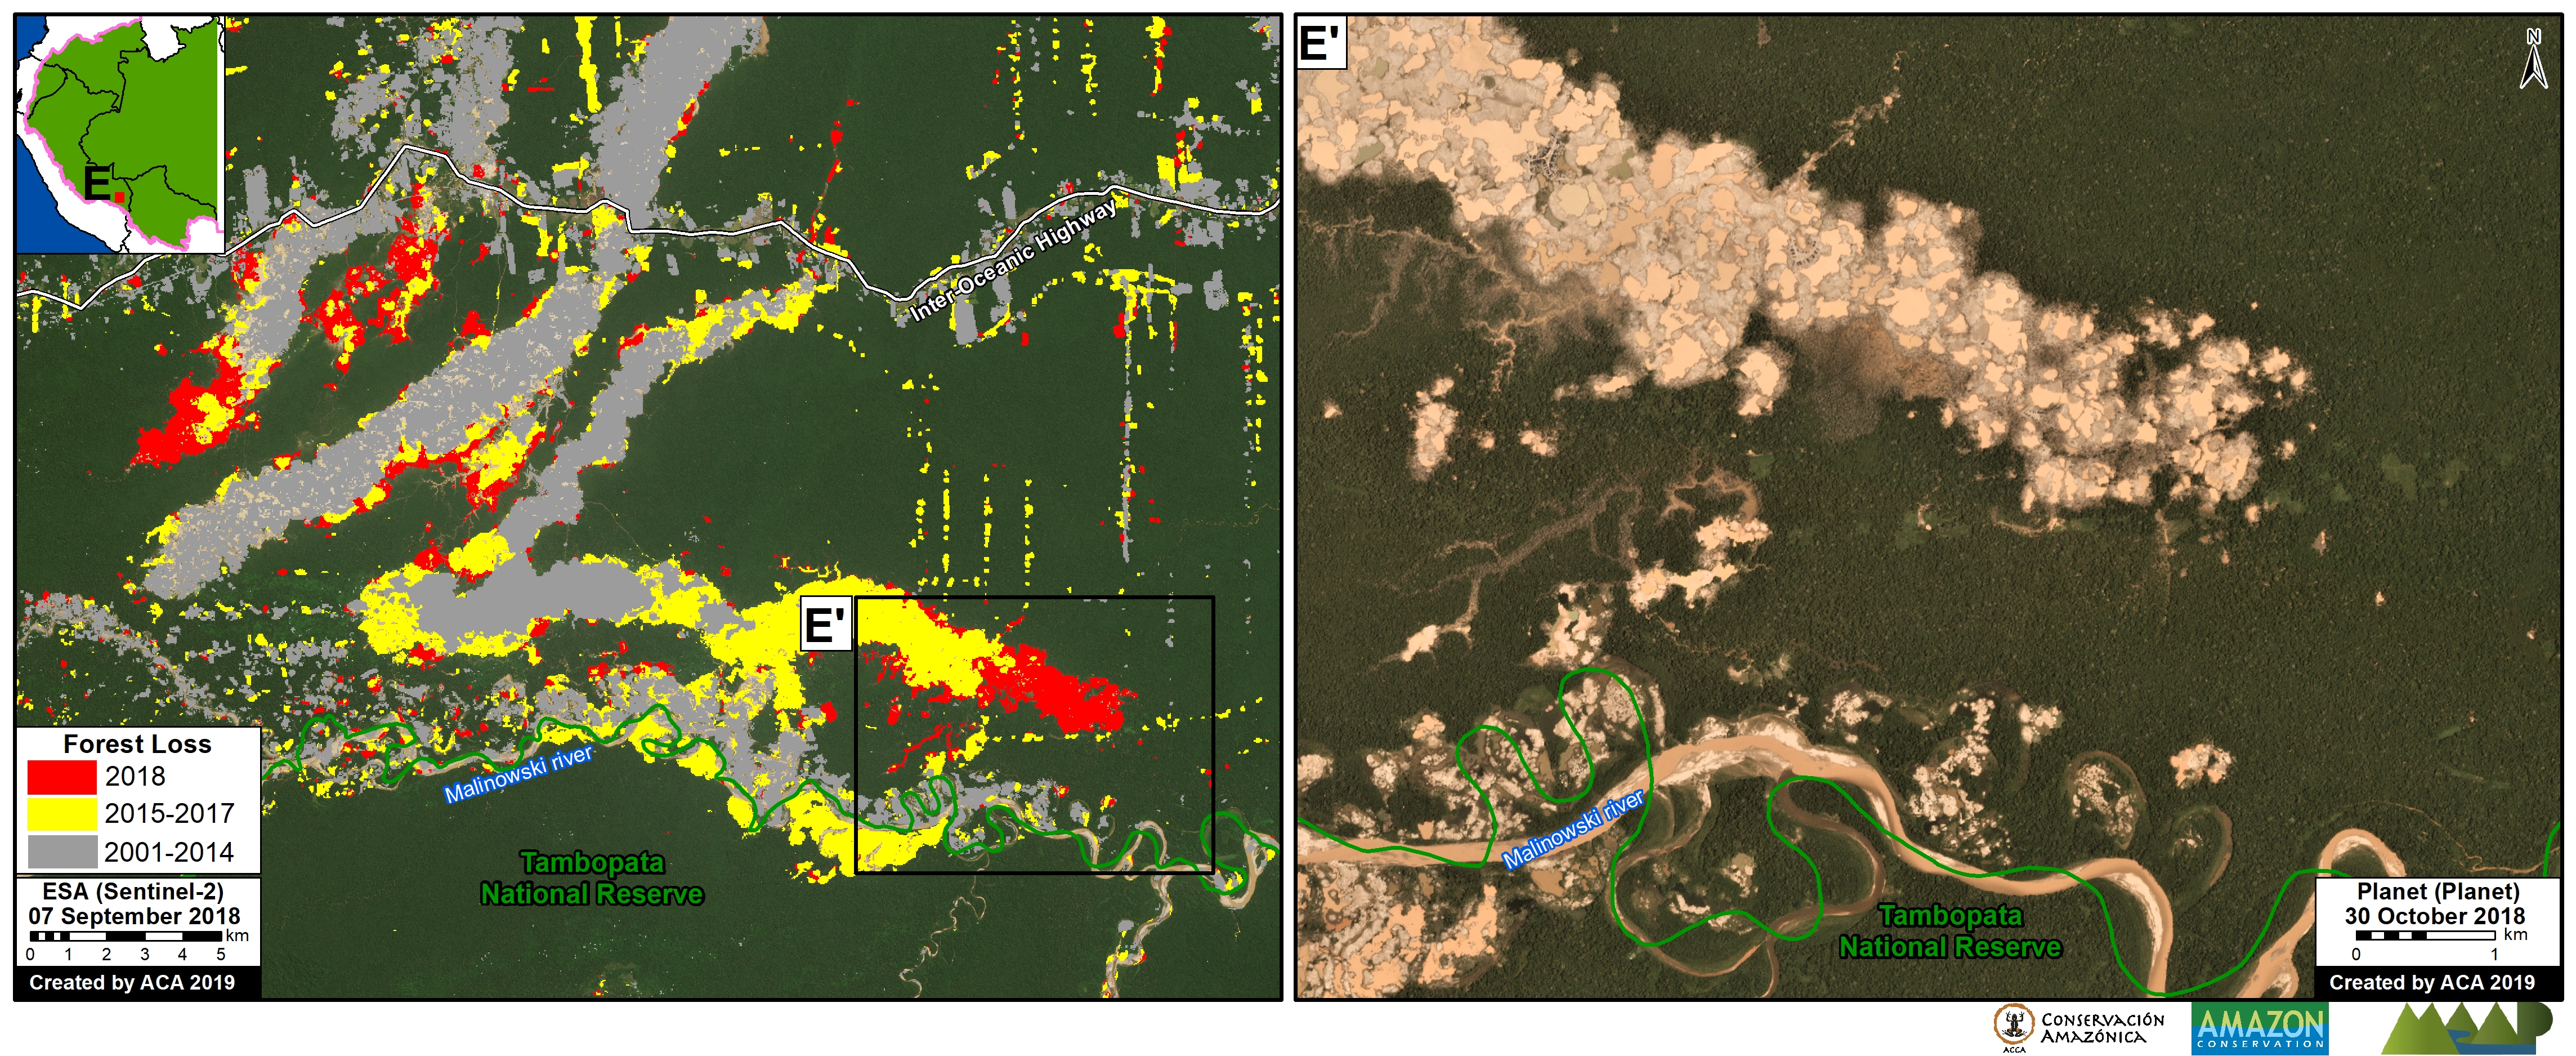
Next, we focus on five zones of interest (Zooms A-E) in Colombia, Brazil, Bolivia, and Peru. For all images, please click to enlarge.

*Forest Cover Loss: 5 acres per minute. Almost half (49%) occurred in Brazil, followed by Peru (20%), Colombia (20%), Bolivia (8%), and Ecuador (3%). see Annex.

**Primary Forest Loss: 3.5 acres per minute. Over half (53%) occurred in Brazil, followed by Peru (20%), Colombia (18%), Bolivia (7%), and Ecuador (2%). see Annex.

Colombia

The largest concentration of 2018 forest loss is in the northeast Colombian Amazon (494,000 acres). Out of this total, 11% (56,800 acres) occurred in national parks. National experts indicate that land grabbing has emerged as a leading direct driver of deforestation (Arenas 2018). See MAAP #97 for more information.

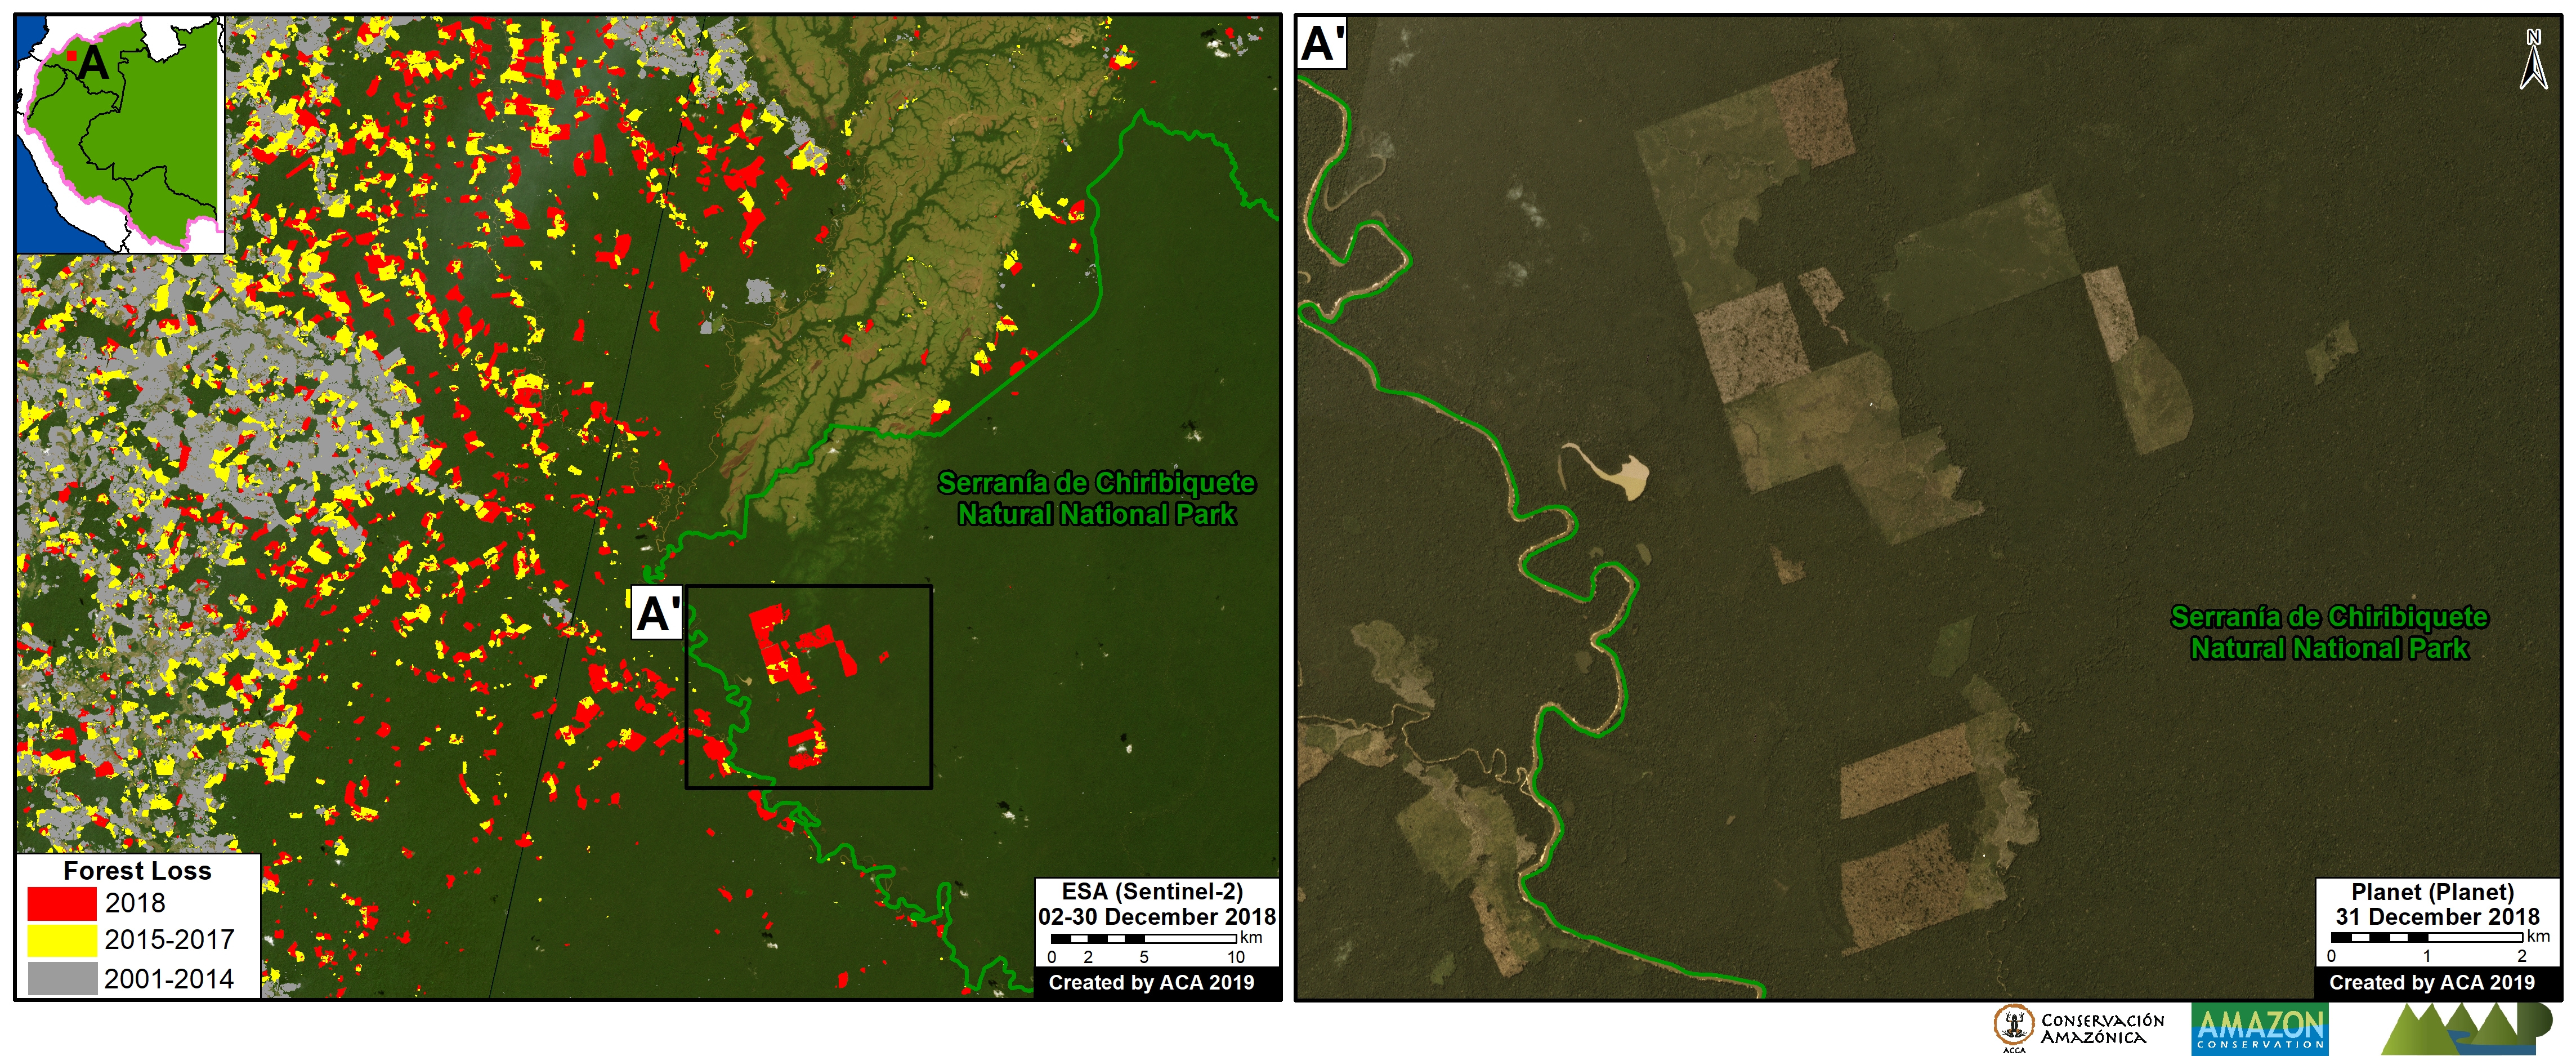
Zoom A shows the forest loss expanding towards western Chiribiquete National Park, including distinct deforestation in this protected area during 2018.

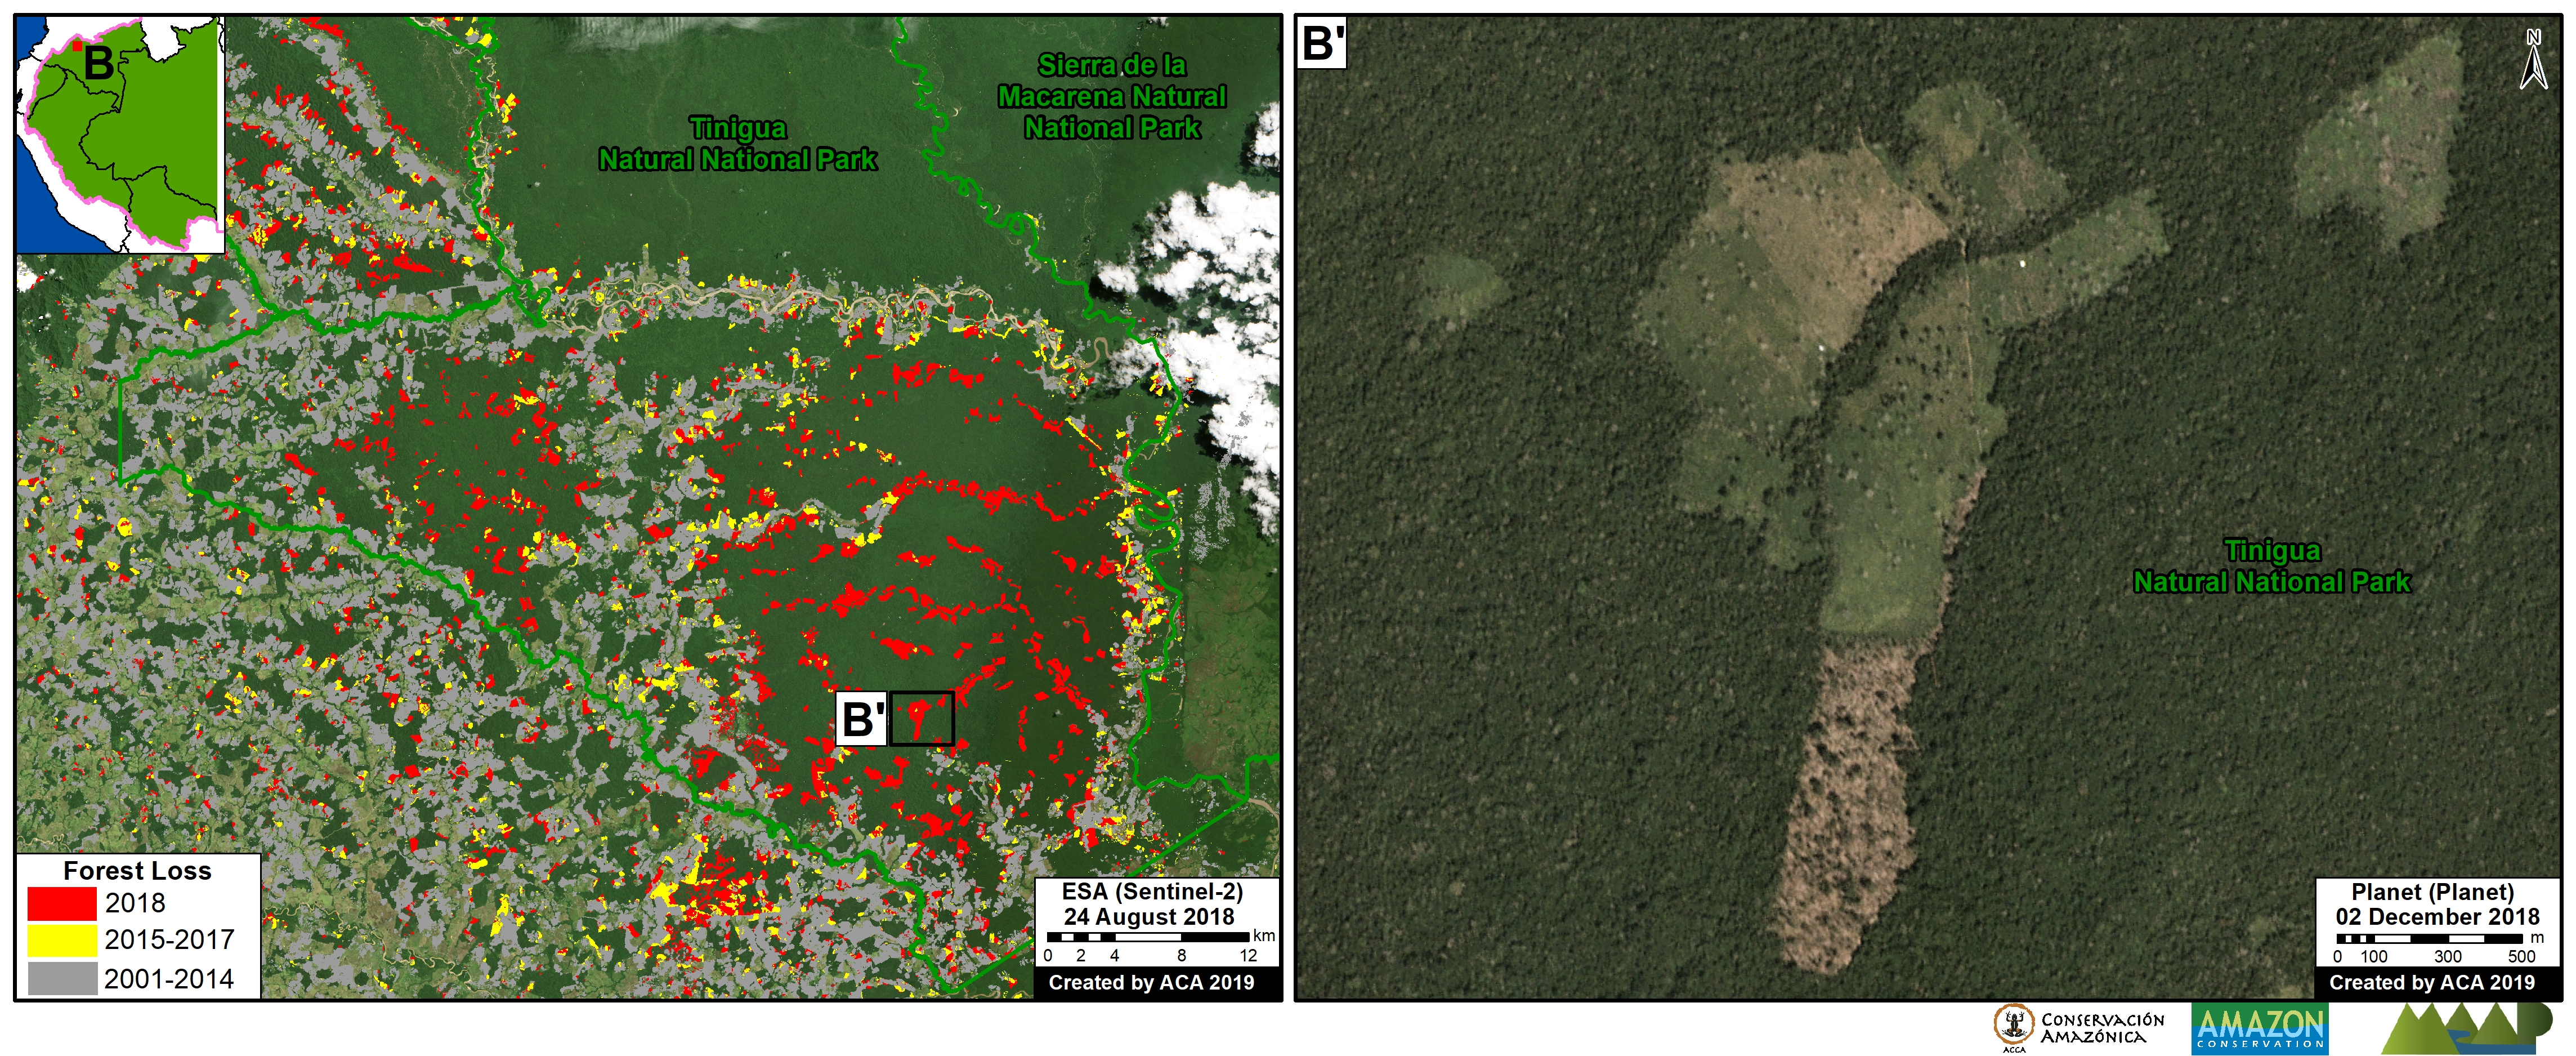
Zoom B shows the extensive 2018 deforestation (30,000 acres) within Tinigua National Park. A recent news report indicates that cattle ranching is one of the factors related to this deforestation.

Zoom A. Colombia-Chiribiquete. Data: Hansen/UMD/Google/USGS/NASA, SINAP, Planet, ESA
Zoom B. Colombia – Tinigua. Data: Hansen/UMD/Google/USGS/NASA, SINAP, Planet, ESA

Brazil (border with Bolivia)

Another important result is the contrast between northern Bolivia (Pando department) and adjacent side Brazil (states of Acre, Amazonas, and Rondônia). Zoom C shows several deforestation hotspots on the Brazilian side, while the Bolivian side is much more intact.

Zoom C. Brazil, Bolivia border. Data: Hansen/UMD/Google/USGS/NASA, ESA, RAISG

Bolivia

In Bolivia, the major forest loss hotspots are further south. Zoom D shows the recent deforestation (5,000 acres in 2018) due to agricultural activity associated with one of the first major Mennonite settlements in Beni department (Kopp 2015). The other Mennonite settlements are located further south.

Zoom D. Bolivia, Black River Mennonite settlement. Data: Hansen/UMD/Google/USGS/NASA, SERNAP, Planet

Peru

The Hansen data indicates over 200,000 acres of forest loss during 2018 in the Peruvian Amazon. One of the most important deforestation drivers, especially in southern Peru, is gold mining. We estimate 23,000 acres of gold mining deforestation during 2018 in the southern Peruvian Amazon (see MAAP #96).

Zoom E shows the most emblematic case of gold mining deforestation: the area known as La Pampa.

It is important to emphasize, however, that in February 2019 the Peruvian government launched “Operation Mercury 2019” (Operación Mercurio 2019), a multi-sectoral and comprehensive mega-operation aimed at eradicating illegal mining and associated crime in La Pampa, as well as promote development in the region.

Zoom D. Peru – La Pampa. Data: Hansen/UMD/Google/USGS/NASA, SERNAP, Planet

Annex

Annex. Forest cover and primary forest loss in the western Amazon.  Data: Hansen/UMD/Google/USGS/NASA, Global Forest Watch.

Methods

The 2018 forest loss data presented in this report were generated by the Global Land Analysis and Discovery (GLAD) laboratory at the University of Maryland (Hansen et al 2013) and presented by Global Forest Watch. Our study area is strictly what is presented in the Base Map: the areas within the Amazonian biogeographic boundary of the western Amazon.

Specifically, for our estimate of forest cover loss, we multiplied the annual “forest cover loss” data by the density percentage of the “tree cover” from the year 2000 (values >30%).

For our estimate of primary forest loss, we intersected the forest cover loss data with the additional dataset “primary humid tropical forests” as of 2001 (Turubanova et al 2018). For more details on this part of the methodology, see the Technical Blog from Global Forest Watch (Goldman and Weisse 2019).

All data were processed under the geographical coordinate system WGS 1984. To calculate the areas in metric units the UTM (Universal Transversal Mercator) projection was used: Peru and Ecuador 18 South, Colombia 18 North, Western Brazil 19 South and Bolivia 20 South.

Lastly, to identify the deforestation hotspots, we conducted a kernel density estimate. This type of analysis calculates the magnitude per unit area of a particular phenomenon, in this case forest cover loss. We conducted this analysis using the Kernel Density tool from Spatial Analyst Tool Box of ArcGIS. We used the following parameters:

Search Radius: 15000 layer units (meters)
Kernel Density Function: Quartic kernel function
Cell Size in the map: 200 x 200 meters (4 hectares)
Everything else was left to the default setting.

For the Base Map, we used the following concentration percentages: Medium: 10%-20%; High: 21%-35%; Very High: >35%.

References

Arenas M (2018) Acaparamiento de tierras: la herencia que recibe el nuevo gobierno de Colombia. Mongabay, 2 AGOSTO 2018. https://es.mongabay.com/2018/08/acaparamiento-de-tierras-colombia-estrategias-gobierno/

Goldman L, Weisse M (2019) Technical Blog: Global Forest Watch’s 2018 Data Update Explained. https://blog.globalforestwatch.org/data-and-research/blog-tecnico-explicacion-de-la-actualizacion-de-datos-de-2018-de-global-forest-watch

Hansen, M. C., P. V. Potapov, R. Moore, M. Hancher, S. A. Turubanova, A. Tyukavina, D. Thau, S. V. Stehman, S. J. Goetz, T. R. Loveland, A. Kommareddy, A. Egorov, L. Chini, C. O. Justice, and J. R. G. Townshend. 2013. “High-Resolution Global Maps of 21st-Century Forest Cover Change.” Science 342 (15 November): 850–53. Data available on-line from: http://earthenginepartners.appspot.com/science-2013-global-forest.

Kopp Ad (2015) Las colonias menonitas en Bolivia. Tierra. http://www.ftierra.org/index.php/publicacion/libro/147-las-colonias-menonitas-en-bolivia

Planet Team (2017). Planet Application Program Interface: In Space for Life on Earth. San Francisco, CA. https://api.planet.com

Turubanova S., Potapov P., Tyukavina, A., and Hansen M. (2018) Ongoing primary forest loss in Brazil, Democratic Republic of the Congo, and Indonesia. Environmental Research Letters  https://doi.org/10.1088/1748-9326/aacd1c 

Acknowledgements

We thank M. Terán (ACEAA), M. Weisse (GFW/WRI), A. Thieme (UMD), R. Catpo (ACCA) and A. Cóndor (ACCA) for helpful comments to this report.

Citation

Finer M, Mamani N (2019) Western Amazon – Deforestation Hotspots 2018 (a regional perspective). MAAP: 100.