Image #8: New Deforestation Detected Within Sierra del Divisor (Peru) in June

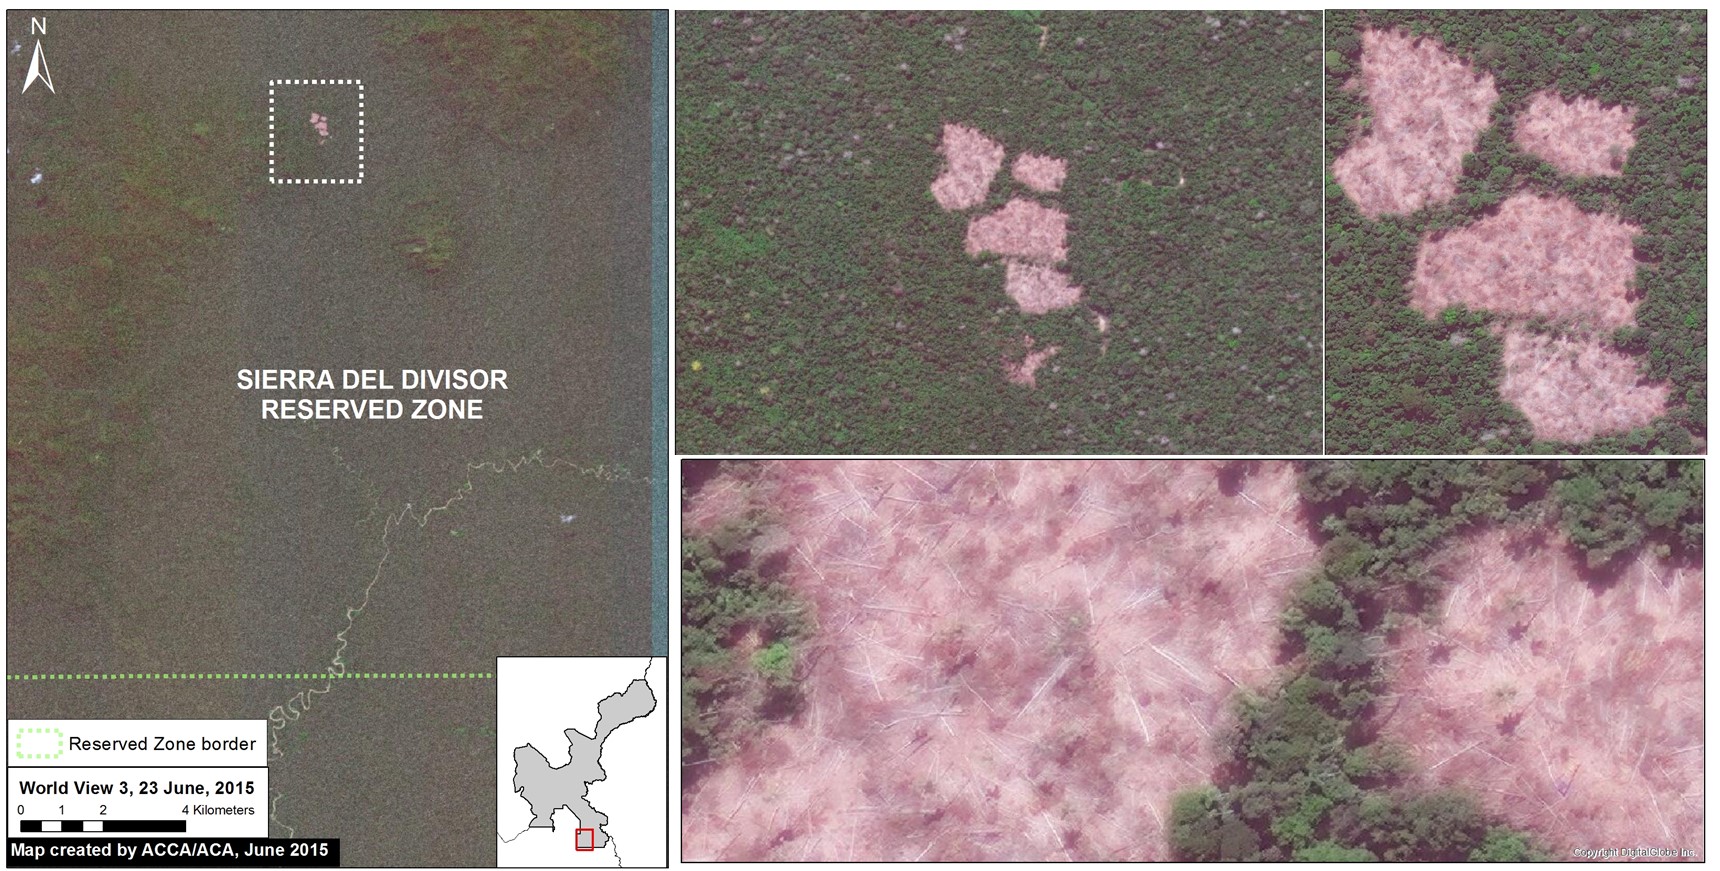
Recall that in Image of the Week #7 we documented the increasing threats (illegal coca, logging, and mining) to the Sierra del Divisor Reserved Zone. We just obtained brand new, high-resolution imagery showing new deforestation deep within this protected area during the month of June. Here, Image of the Week #8, presents new maps of this recent deforestation. According to several consulted experts, the cause of this deforestation is illegal coca cultivation or a new illegal logging camp.
Sierra_divisor_MAAP_8d_v3p
Image 8a: Very high resolution (38 cm) image from June 23 showing new deforestation within the Sierra del Divisor Reserved Zone. Data: WorldView-3 from Digital Globe (NextView).

New Deforestation Detected

Image 8a shows the new deforestation detected within the southeast section of the Sierra del Divisor Reserved Zone. As of June 23, 2015 (the date of the image), the total new deforestation was 13 hectares. This deforestion is located between the La Cúpula and Shesha hills.

In Image of the Week #7 we showed that there is a series of illegal logging camps nearby, but this new deforestation is located much deeper in the reserve. According to several consulted experts, the cause of the new deforestation is illegal coca cultivation or a new illegal logging camp.

Updated Baseline Map
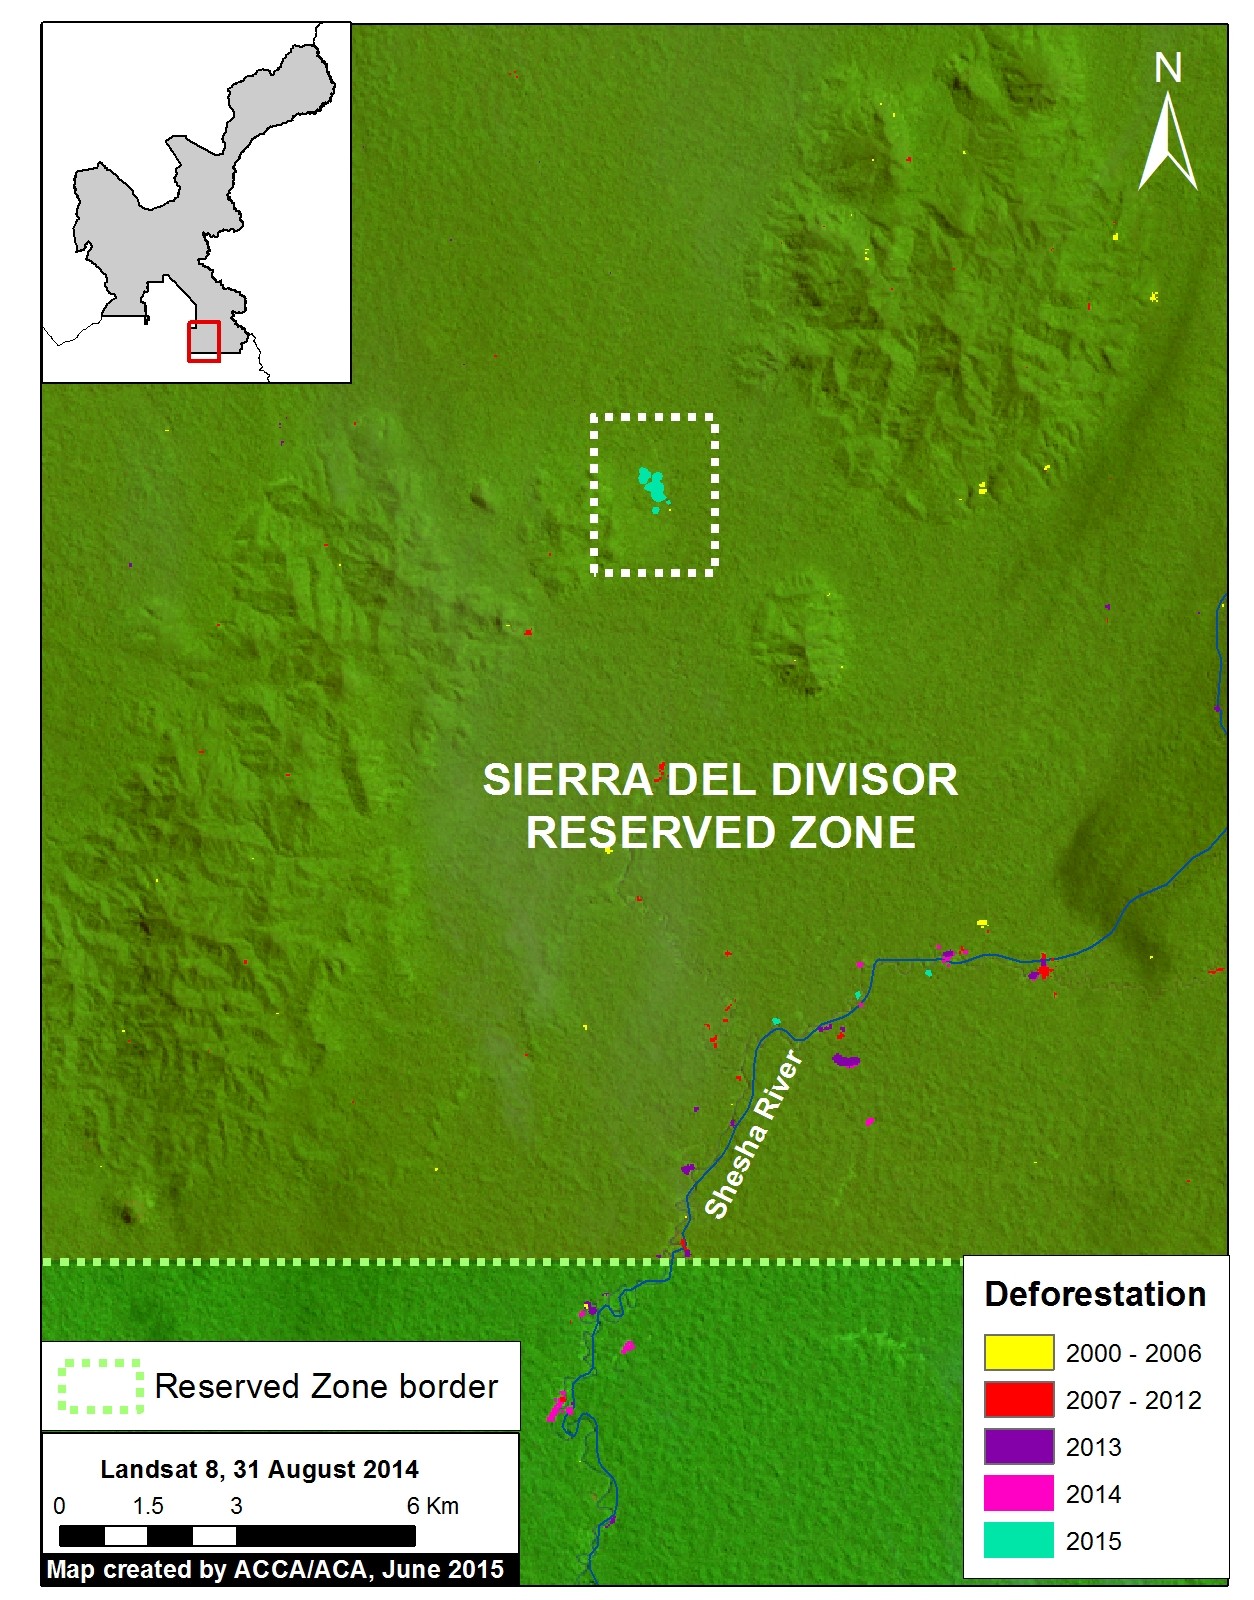
Sierra_divisor_MAAP_8b_Zoom3_v4
Image 8b. Updated baseline map of the southeast section of the Sierra del Divisor Reserved Zone. Data: MINAM, SERNANP, USGS, IBC, Hansen/UMD/Google/USGS/NASA.


Image 8b is an updated map of the deforestation within the southeast section of the Sierra del Divisor Reserved Zone. Note that the new 2015 deforestation is found much deeper within the reserve than previous detected forest loss.


Confirming Recent Deforestation
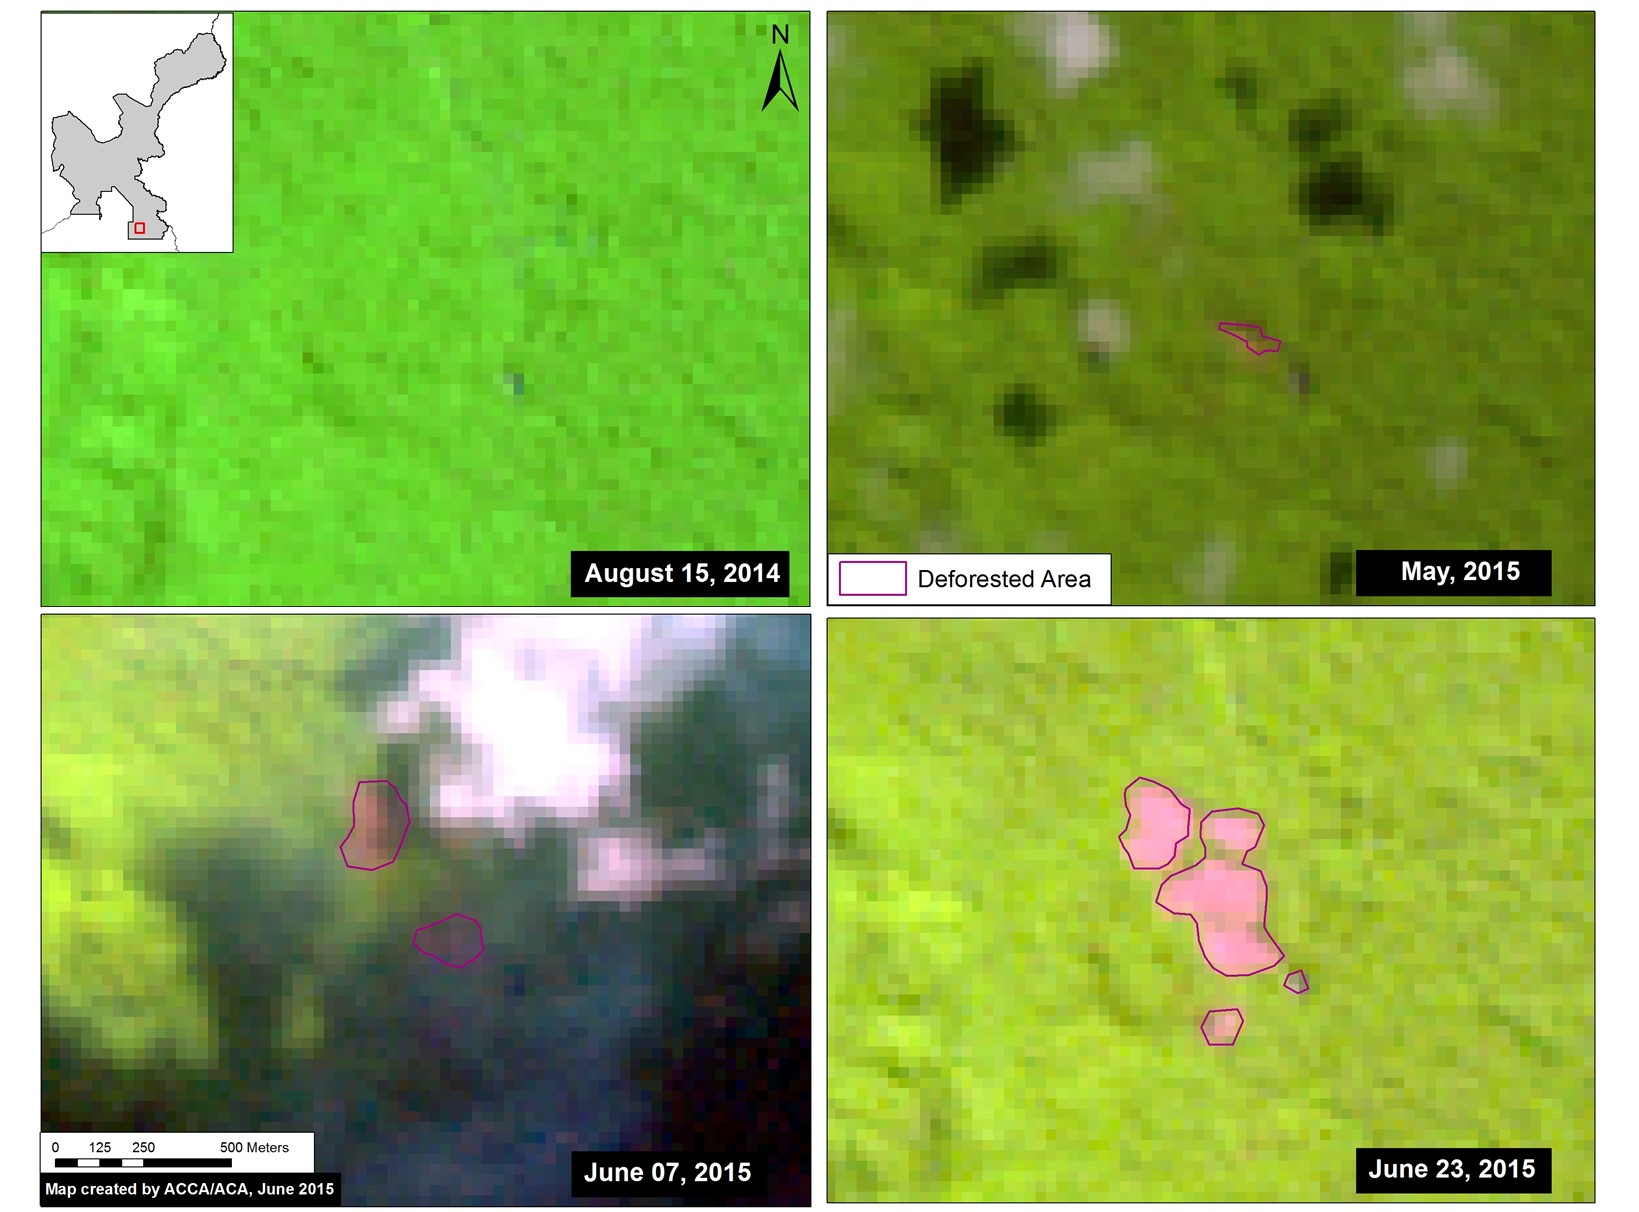
Sierra_divisor_MAAP_8c_v1p
Image 8c. Landsat time-series (2014-2015) of the recent deforestation. Data: USGS.

To better understand how the recent deforestation unfolded, we created a satellite (Landsat) image time-series. Note that in Image 8c all four panels show the exact same area over time. In August 2014, our focal area was completely forested. The first evidence of deforestation is seen in May 2015. In June 2015, the deforestation grows quickly.


Deforestation Within the Isconahua Territorial Reserve
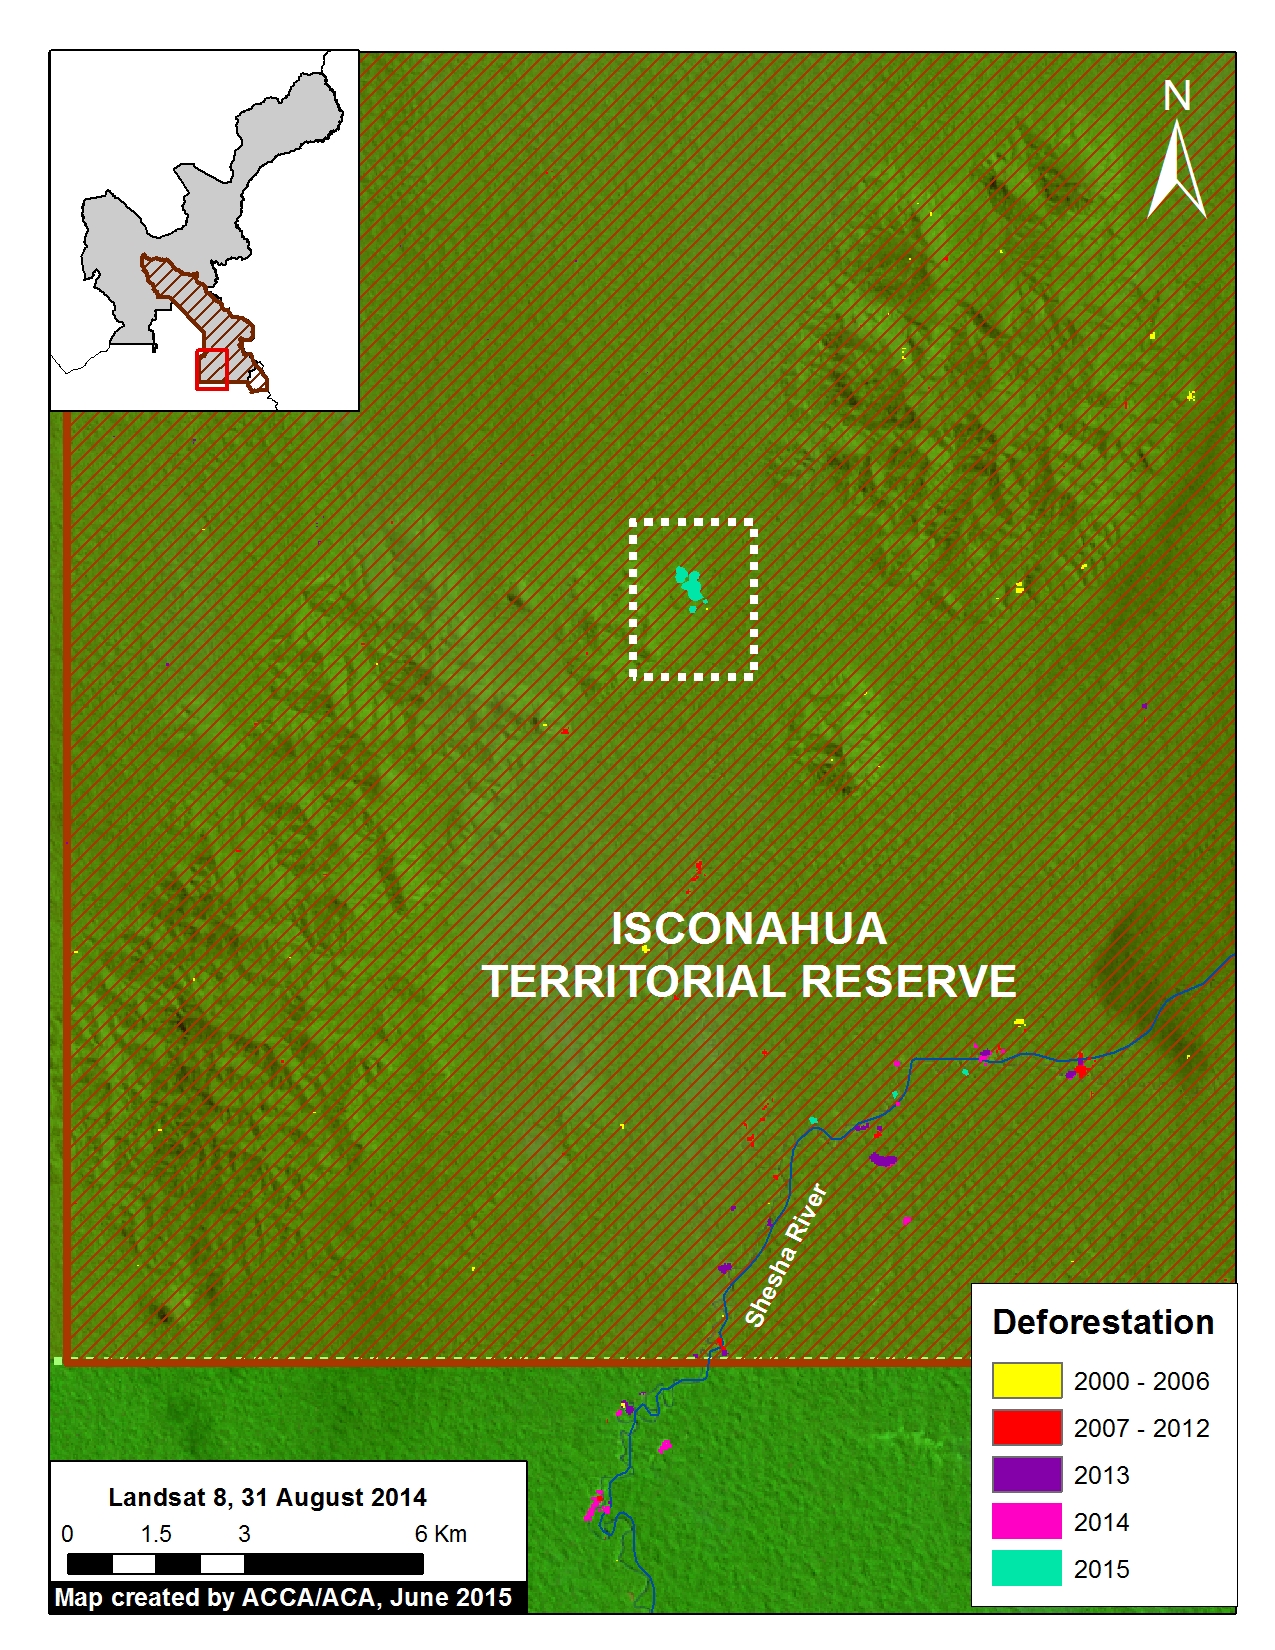
Sierra_divisor_MAAP_8e_v2
Image 8d. Deforestation within the Territorial Reserve Isconahua. Data: MINAM, SERNANP, USGS, IBC, Hansen/UMD/Google/USGS/NASA.


Image 8d shows the new deforestation is also located with the Isconahua Territorial Reserve.

This is an official land designation in favor of indigenous peoples in isolation, to protect their rights, habitat, and the conditions that ensure their existence and integrity as a people.


SERNANP Response

In response to this article, SERNANP (the Peruvian protected areas agency) issued this statement:

“The Sierra del Divisor Reserved Zone is a transitional area under the Peruvian National Service of Natural Protected Areas (SERNANP).

Over the past few years, Sierra del Divisor has made significant efforts in its fight against ilegal logging and other activities that threaten it. However, it is worth noting that Image of the Week #8: New Deforestation Detected Within Sierra del Divisor (Peru) in June corresponds with an area of overlap with the Isconahua Territorial Reserve, a sector in which the Ministry of Culture works in coordination with SERNANP.

As part of our actions, SERNANP has planned a flyover in the zone to verify information regarding the new deforestation alert in the Sierra del Divisor, and will continue with special park guard patrolling that began last week, despite the local climate conditions.”

+++

“La Zona Reservada Sierra del Divisor es un espacio de carácter transitorio a cargo del Servicio Nacional de Áreas Naturales Protegidas por el Estado (SERNANP).

En los últimos años la ZRSD ha realizado grandes esfuerzos en su lucha contra la tala ilegal y otras actividades que la amenazan. Sin embargo, hay que precisar que la Imagen de la Semana #8: Nueva Deforestación al Interior de la ZRSD corresponde al ámbito de traslape (superposición) con la Reserva Territorial Isconahua, donde también interviene el Ministerio de Cultura, la cual el SERNANP trabaja de manera conjunta con dicho sector.

En el marco de nuestras acciones, el SERNANP viene programando un sobrevuelo en la zona para verificar la información sobre la nueva alerta de deforestación en la ZRSD, y continuar con el patrullaje especial del personal guardaparque que viene realizando desde la semana pasada, pese a las condiciones climáticas del lugar”.

Cita

Finer M, Novoa S, Peña N (2015) Nueva Deforestación al Interior de la Zona Reservada Sierra del Divisor. MAAP: Imagen #8. Link: https://www.maapprogram.org/2015/06/imagen-8-sierradivisor
Mining News Watch #16

Mining News Watch #16 covers the time period March 17- June 10, 2015

Top Stories

  • The Peruvian government announced in May that new complementary regulations for the formalization process will be released in August.

  • To date, only 16 permits have been issued for formalized mining, affecting just 631 of the 58,835 miners that started the process in Puno.

  • According to a pair of technical reports by the Amazon Conservation Association (ACA) and Conservaciόn Amazόnica (ACCA), 2,500 hectares has been deforested in the Tambopata National Reserve buffer zone due to illegal mining in the past two years.

  • The Ministry of the Environment (MINAM) reported that 40.5 tons of mercury enter the rivers of Madre de Dios annually.

  • The Foreign Relations Committee of the Peruvian Congress approved the Minamata Convention, and sent it to the full Peruvian Congress for final approval.

Recent Government Action

  • During a press conference in May, the Minister of Energy and Mines (MEM), Rosa María Ortiz, said that current regulations are not solving the illegal mining problem, and that in two months new complementary rules will be published to strengthen the formalization process. She stated that one focus of the new regulations will be to “achieve formalization for those that have not been able to do so.”[1]
  • The Regional President of Madre de Dios, Luis Otsuka, met with the Minister of the Interior, José Luis Pérez Guadalupe, in April to discuss possible actions to combat crime in Madre de Dios. The government is attempting to reduce illegal activity in Madre de Dios by increasing police patrols in critical zones and increasing containment of fuel used for illegal mining.[2] Guadalupe stated that the eradication of illegal mining is a priority for the national government. Along with the General Director of Police, Guadalupe visited the region to analyze the checkpoints and infrastructure designed to combat illegal mining in the area.[3]
  • The Peruvian government has invested over $63.5 million to be used for remediation projects in various areas damaged by illegal mining. Some of this money will focus on Madre de Dios, including the buffer zone of the Tambopata National Reserve.[4]

Formalization Process

  • The Office of the Ombudsman (La Defensoría del Pueblo) revealed that the Peruvian government has thus far only issued 16 permits for formalized mining, affecting about 631 miners, contrasting with the 58,835 informal miners that started the formalization process in Puno. The difficult and expensive “saneamiento” (restructuring) process, which involves the legal ordering of informal mines, coupled with the lack of human and financial resources, are some of the cited reasons for the slow formalization process.[5]
  • A new response to the low completion rates is the use of mediators to create a space of dialogue for the miners.[6]
  • During a recent visit by Madre de Dios Regional President Luis Otsuka with Peruvian President Ollanta Humala in March, Otsuka criticized the President for the illegal mining situation in the country. Otsuka stated that he “will continue to sell [his] gold on the black market” and that “in the past three years not one miner was formalized [in Madre de Dios], only six deaths. Things will not change if the laws are not modified.” Otsuka also expressed his frustration that current regulations seem to target small miners who only want to progress in the formalization process.[7]
  • Environmental specialist Juan Víctor Ortega Vargas found that in Puno, the only department in Peru with any formalized mining companies, the high cost of performing the Corrective Environmental Management Instrument (IGAC) is the main limitation for illegal miners attempting to complete the process. The IGAC is the fifth (out of six) step of the formalization process and is basically a streamlined Environmental Impact Assessment designed to prevent and control environmental impacts. However, performing the IGAC costs each company approximately $10,000.[8,9]

Deforestation

  • A pair of technical reports published by the ACA and ACCA revealed that a total of 2,500 hectares have been deforested due to gold mining in the Tambopata National Reserve buffer zone over the past two years.[10, 11, 12]

Mercury Regulation

  • The Vice Minister of MINAM, Mariano Castro, released a statement in March saying that as a result of illegal mining, a total of 40.5 tons of mercury enters the rivers of Madre de Dios each year. This quantity comprises 5.6% of global mercury emissions, which reached 721 tons in 2010. Castro also announced that MINAM will be working with the U.S. embassy and the Blacksmith Institute to reach an agreement on financing further studies about reductions in mercury emission.[13] The U.S. State Department gave the Blacksmith Institute one million dollars to conduct mercury emission reduction research in Madre de Dios.[14]
  • In May, the Foreign Relations Committee of the Peruvian Congress approved the Minamata Convention, a global treaty that seeks to avoid further damage to human health and the environment from mercury. This is a strong sign that Congress will ratify the convention.[15] The Office of the Ombudsman submitted a formal request to Congress on June 4th asking them to formally approve Minamata.[16]

  • A regional workshop on reducing mercury use took place in Lima at the end of March. The workshop was intended to encourage more countries to ratify the Minamata Convention. Government officials specializing in the fight against illegal mining from Peru, Colombia, Brazil, and Ecuador participated in the workshop, sharing experiences and successful practices.[17]
  • In March, Luis Fernández, a tropical ecologist from Stanford, interviewed with El Comercio in order to raise support for the Minamata Convention. He discussed the results from his 2013 research on mercury pollution in the Amazon, and warned that 250,000 Peruvians are currently exposed to mercury contamination.[18]
  • Police agents seized more than 15 kg of mercury that was being transported illegally near a mining zone in the Inambari district of Madre de Dios.[19]

Other

  • The Third Civil Chamber of the Superior Court of Lima sided with the Agency for Environmental Assessment and Enforcement (OEFA), saying that OEFA regulations are constitutional and do not infringe on any rights to miners and mining companies. This ruling gives OEFA power to combat illegal mining and to determine responsibility for environmental damage.[20]
  • Currently, around 100 kg of illegal gold travel across the border from Peru to Bolivia every week, where the gold can then be sold to U.S. and European markets.[21] Peru and Bolivia met in May to discuss tactics for protecting their shared border from criminal activity related to illegal mining, particularly the smuggling of fuel across the border. Peru promised to share its experience with Bolivia, which initiated its mining laws only a year ago.[22]
  • The Peruvian Society for Environmental Law (SPDA) and the International Union for Conservation of Nature (IUCN) launched a blog called “Las rutas del oro” (Routes of Gold) that will provide information on various aspects of illegal mining in different Amazonian countries.[23]
  • According to the Peruvian Financial Intelligence Unit (UIF), between January and December 2014, illegal mining generated $2,765 million, surpassing illegal drug trafficking, which generated $78 million.[24] The Office for National Electoral Processes reports that money from both mining and drug trafficking is making its way into the electoral campaigns of political organizations.[25]
  • The indigenous community of Tres Islas, located in Madre de Dios, demanded that the government fulfill a sentence forbidding outsiders to be within their designated indigenous land. The goal is to protect indigenous land from illegal gold mining. The claim is directed to the Constitutional Court, which unanimously declared in 2012 that the tribes have the right to control their lands.[26]

Notes: The ACA Mining News Watch focuses mostly on issues pertaining to the Peruvian Amazon and may not cover issues related to non-Amazonian parts of the country. We would like to credit ProNaturaleza’s “Observatorio Amazonia” as our primary resource for articles related to illegal mining in Peru.


ACA contact for Comments/Questions:  Matt Finer (mfiner@amazonconservation.org)

Citation:

DeRycke E, Finer M (2015). Peru Mining News Watch Report #16. Amazon Conservation Association. https://www.maapprogram.org/2015/06/mining-news-watch-16/

Image #7: Sierra del Divisor – Growing Threats Highlight Importance of Creating National Park

As the Peruvian Government decides whether the Sierra del Divisor Reserved Zone should become a National Park, here in Image of the Week #7 we offer this new analysis of the current deforestation patterns of the area. A Reserved Zone classification, which was applied to Sierra del Divisor in 2006, is a temporary measure to protect an area of biological importance until the government is able to determine a final designation. National Park status represents the strongest possible final designation and would lead to strengthened legal protections to confront the growing array of threats we document below (namely, illegal coca, logging, mining activities).


Sierra_divisor_MAAP_7a_v7_zoomareas
Image of the Week 7a. Deforestation patterns within and around the proposed Sierra del Divisor National Park. Key data sources: MINAM, SERNANP, USGS, IBC, MINAGRI, Hansen/UMD/Google/USGS/NASA.

Key Findings:

We have detected several deforestation fronts within and around the current Sierra del Divisor Reserved Zone. These findings demonstrate the need for the stronger legal protections that would come with National Park status.


Most notably, we detected within and around the current  Reserved Zone (and proposed National Park):

– Deforestation for illegal coca cultivation within the southwestern section (Zoom #1).

– New logging roads near both the southern and northwestern sections (Zooms #1 and #2).

– Deforestation associated with illegal logging camps within the southeastern section (Zoom #3). This illegal logging is within the Isconahua Territorial Reserve, an official land classification designed to protect the territory of indigenous peoples in isolation.

– Gold mining near the southern section (Zoom #3).

Background: From Reserved Zone to National Park

Sierra_divisor_MAAP_7o_v4p
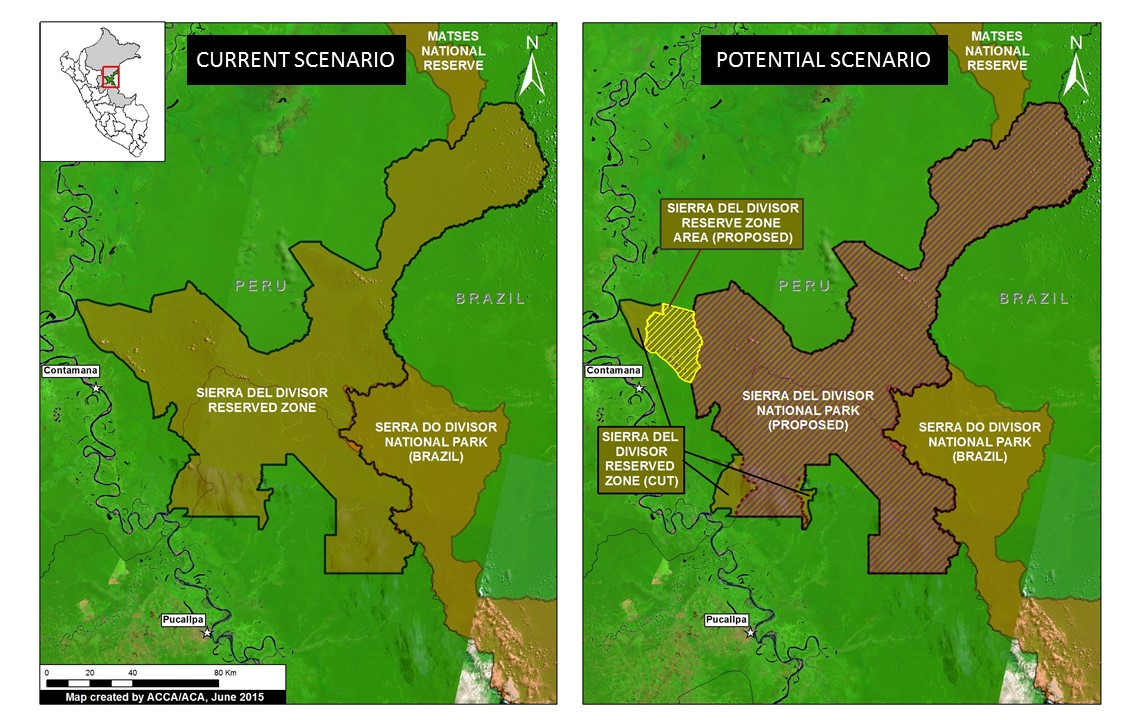
Image 7b. The current (left panel) and potential (right panel) scenario for the Sierra del Divisor region

Image 7b illustrates the current (left panel) and potential (right panel) scenario for the Sierra del Divisor region.

The vast majority of the Reserved Zone would become a National Park under the current proposal pending before the Peruvian government. The proposed Sierra del Divisor National Park covers a vast area (1,354,485 hectares) in the far eastern Peruvian Amazon (departments of Loreto and Ucayali), adjacent to the Brazilian border.

Note that several sections on the western side of the Reserved Zone would not be included, however. Part of the excluded area, in the northwest, will remain as a Reserved Zone and may be part of a future proposal for a Regional Conservation Area known.


Coca and Logging Roads in Southwestern Section (Zoom #1)

Sierra_divisor_MAAP_7b_Zoom1_v5_p
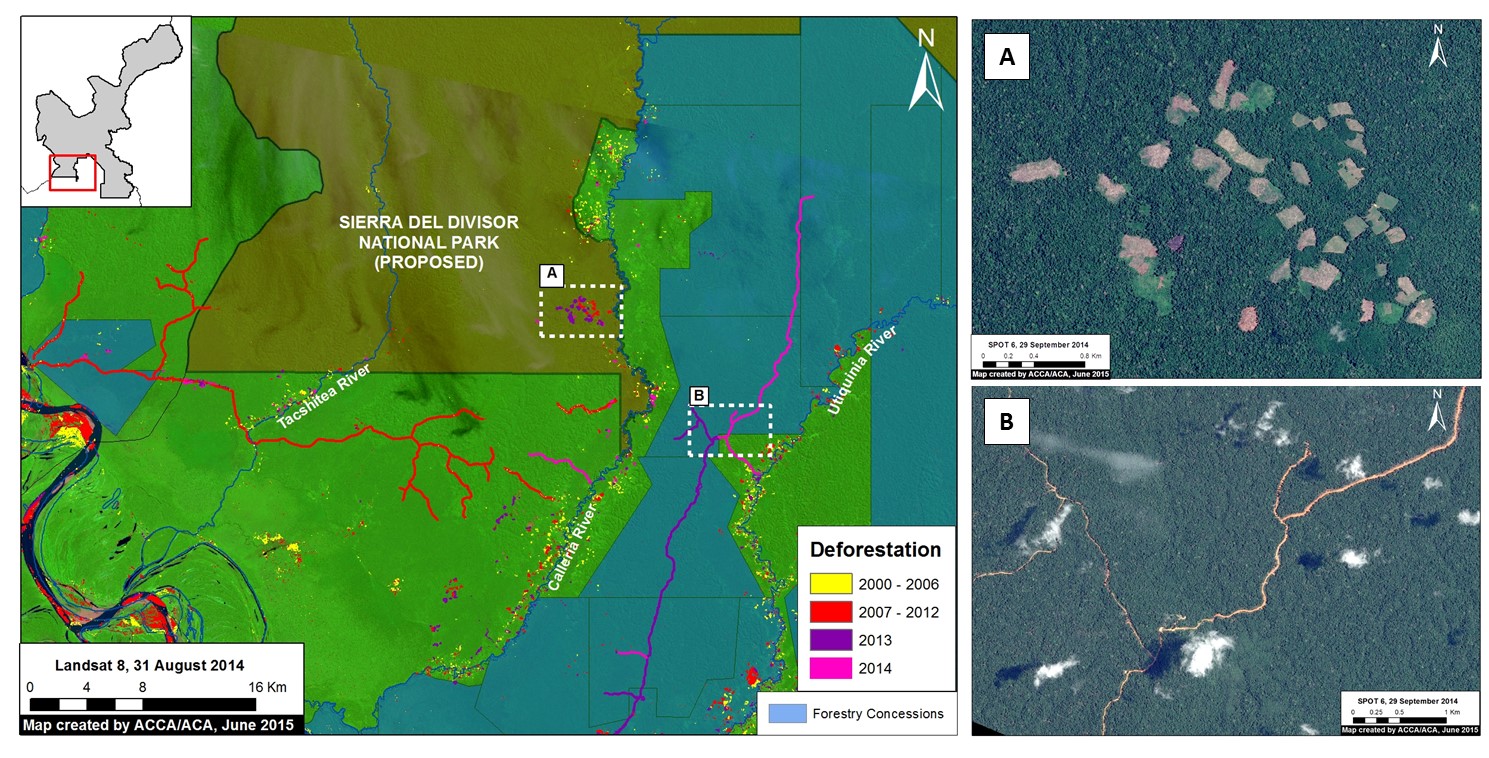
Image 7c. Zoom #1: Enhanced view of the southwestern section of the proposed national park. Panels A and B are high resolution satellite images of the areas indicated on the main map on the left. Key data sources: MINAM, SERNANP, ACCA, Hansen/UMD/Google/USGS/NASA, USGS, SPOT 6.

Image 7c provides an enhanced view of the southwestern section of the proposed National Park. It highlights an expanding deforestation cluster — 130 hectares between 2013 and 2014 — on the upper Calleria River (see “A” on the map). Our analysis indicates that illegal coca cultivation is the cause of this deforestation. Panel A shows a high resolution satellite image of this deforestation.

Also note that a new road is being constructed near the southwestern park boundary (see “B” on the map). We presume it to be a logging road because it passes through a forestry concession. Most notably, there was significant new construction in both 2013 and 2014, indicating that the road is in active use. In addition, high resolution imagery (see panel B) shows road width of about 30 meters, indicating that it may be designed for larger vehicles and heavy machinery.

Logging Road Approaching Northwestern Section (Zoom #2)

Sierra_divisor_MAAP_7c_Zoom2_v4
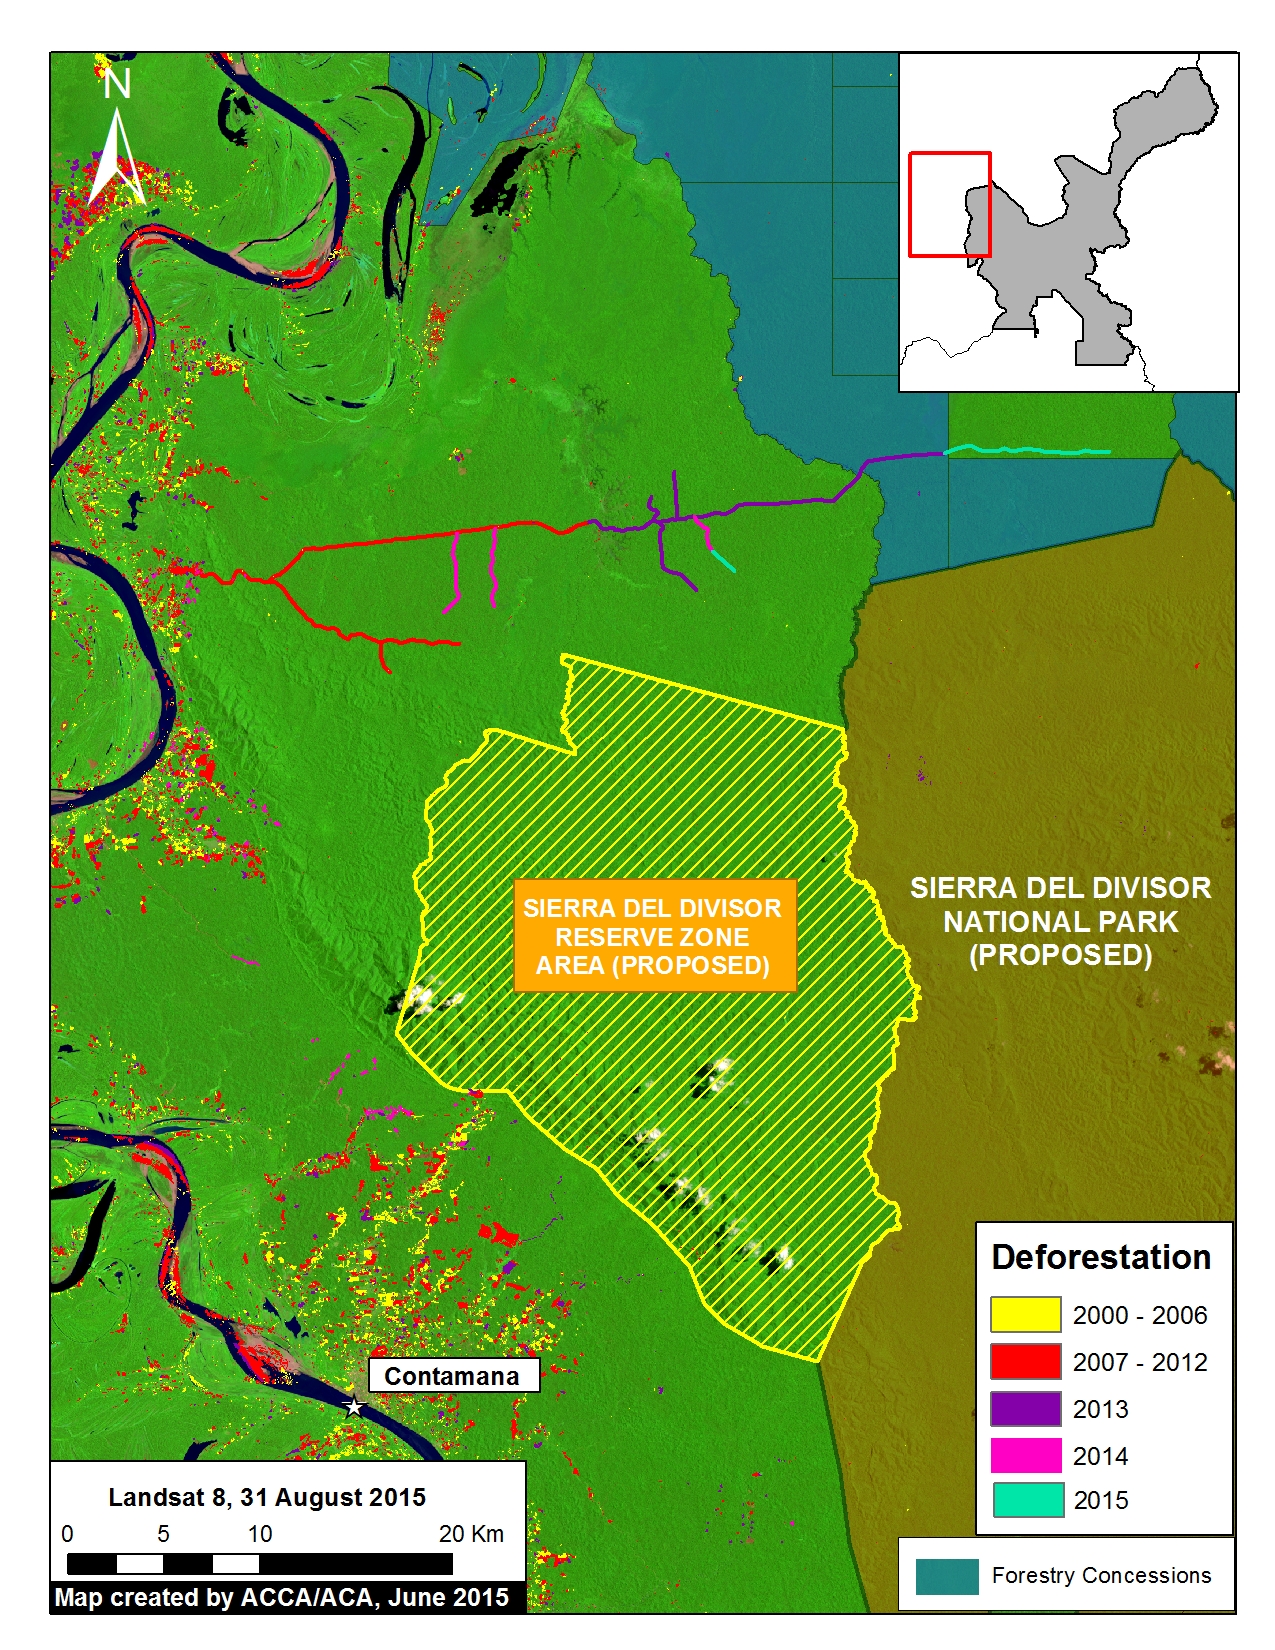
Image 7d. Zoom #2: Enhanced view of the northwestern section of the proposed national park. Key data sources: USGS, SERNANP, GOREL.

Image 7d provides an enhanced view of the northwestern section of the proposed National Park, showing the construction of another new logging road. We presume that it is a logging road because it is passing through forestry concessions with no other obvious destination. Most notably, there was new construction in 2013, 2014, and 2015 indicating that is an active logging road.

Also note the expanding deforestation, especially in 2014, outside of the town of Contamana, indicating the importance of creating a Regional Conservation Area in this area adjacent to the proposed National Park.


Illegal Logging and Gold Mining in Southeastern Section (Zoom #3)

Sierra_divisor_MAAP_7d_Zoom3_v7_p
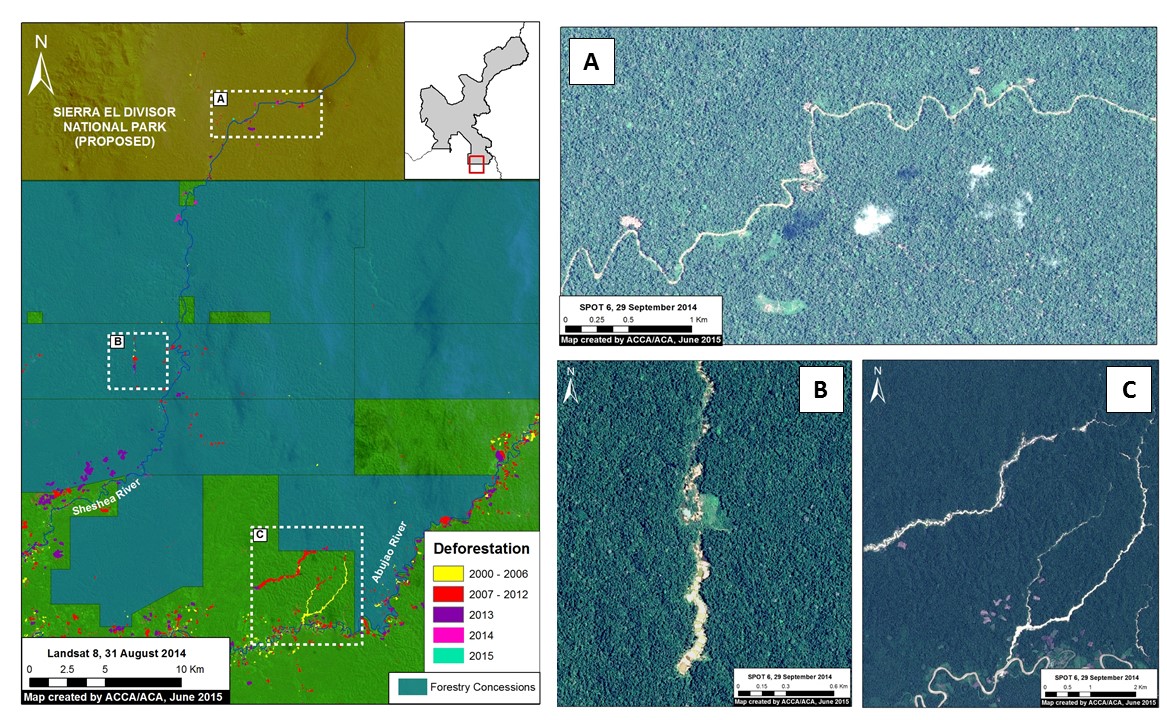
Image 7e. Zoom #3: Enhanced view of the southeastern section of the proposed national park. Panels A, B, and C are high resolution satellite images of the areas indicated on the main map on the left. Key data sources: MINAM, SERNANP, ACCA, Hansen/UMD/Google/USGS/NASA, USGS, and SPOT 6.

Image 7e provides an enhanced view of the southeastern section of the Proposed National park. It highlights that both illegal logging (see “A” on the map) and gold mining (see “B” and “C” on the map) are present.

It is important to emphasize that this southeast section is part of the Isconahua Territorial Reserve administered by the Ministry of Culture. This is an official land designation in favor of indigenous peoples in isolation, to protect their rights, habitat, and the conditions that ensure their existence and integrity as a people.

Regarding the illegal logging, our analysis indicates the deforestation within the proposed National Park along the upper Shesha River is caused by a series of logging camps. Panel A shows a high resolution satellite image of this deforestation. This illegal logging is within the Isconahua Territorial Reserve.

Regarding the gold mining, there are two principal zones causing deforestation, one along the Shesha River and the other along the Abujao River. Panels B and C show high resolution images of these two mining areas. The headwaters of both river systems are born in the proposed park.

SERNANP Response

In response to this article, SERNANP (the Peruvian protected areas agency) issued this statement:

La Zona Reservada Sierra del Divisor es un espacio de carácter transitorio a cargo del Servicio Nacional de Áreas Naturales Protegidas por el Estado (SERNANP).  La zona aledaña a esta área acoge a 14 Comunidades Nativas, las cuales aprovechan los servicios ecosistémicos en beneficio de más de 500 familias.

En los últimos años la ZRSD ha logrado mejores resultados en su lucha contra la tala ilegal enfrentando esta amenaza sobre todo en espacios de ámbito de las reservas territoriales, y continúa alerta por la deforestación asociada al cultivo ilícito de coca que se reporta en esta parte del país.

En ese marco, se ha reportado desde el 2011 a los sectores correspondientes para su incorporación dentro del Plan Anual de Reducción del Espacio Cocalero de tal forma que se haga frente a esta amenaza de manera estratégica.

Data Description:

Background map is a mosaic of four Landsat 8 images (30 m resolution) from August and September 2014. Any variation of green indicates forest cover. Note there is some scattered cloud cover. Data is from USGS.

Protected areas are darker green. Data for the proposed Sierra del Divisor National Park comes from its technical document (expediente técnico).

Black indicates areas that were deforested as of 2000 according to data from the Peruvian Environment Ministry (MINAM 2009). Yellow (2000-2006), red (2007-2012), and purple (2013) indicate areas that were deforested from 2000 to 2013 according to data published by Hansen et al. 2013 (Science 342: 850–53; Data download).

Pink and teal indicate areas that were deforested between 2014 and early 2015 based on our analysis of Landsat imagery using CLASlite forest monitoring software.

Citation

Finer M, Novoa S (2015) Sierra del Divisor: Growing Threats Highlight Importance of Creating National Park. MAAP Image #7. Link: https://www.maapprogram.org/2015/06/image-7-sierra-del-divisor/

Image #6: Expanding Gold Mining Deforestation Enters Amarakaeri Communal Reserve (Madre de Dios, Peru)

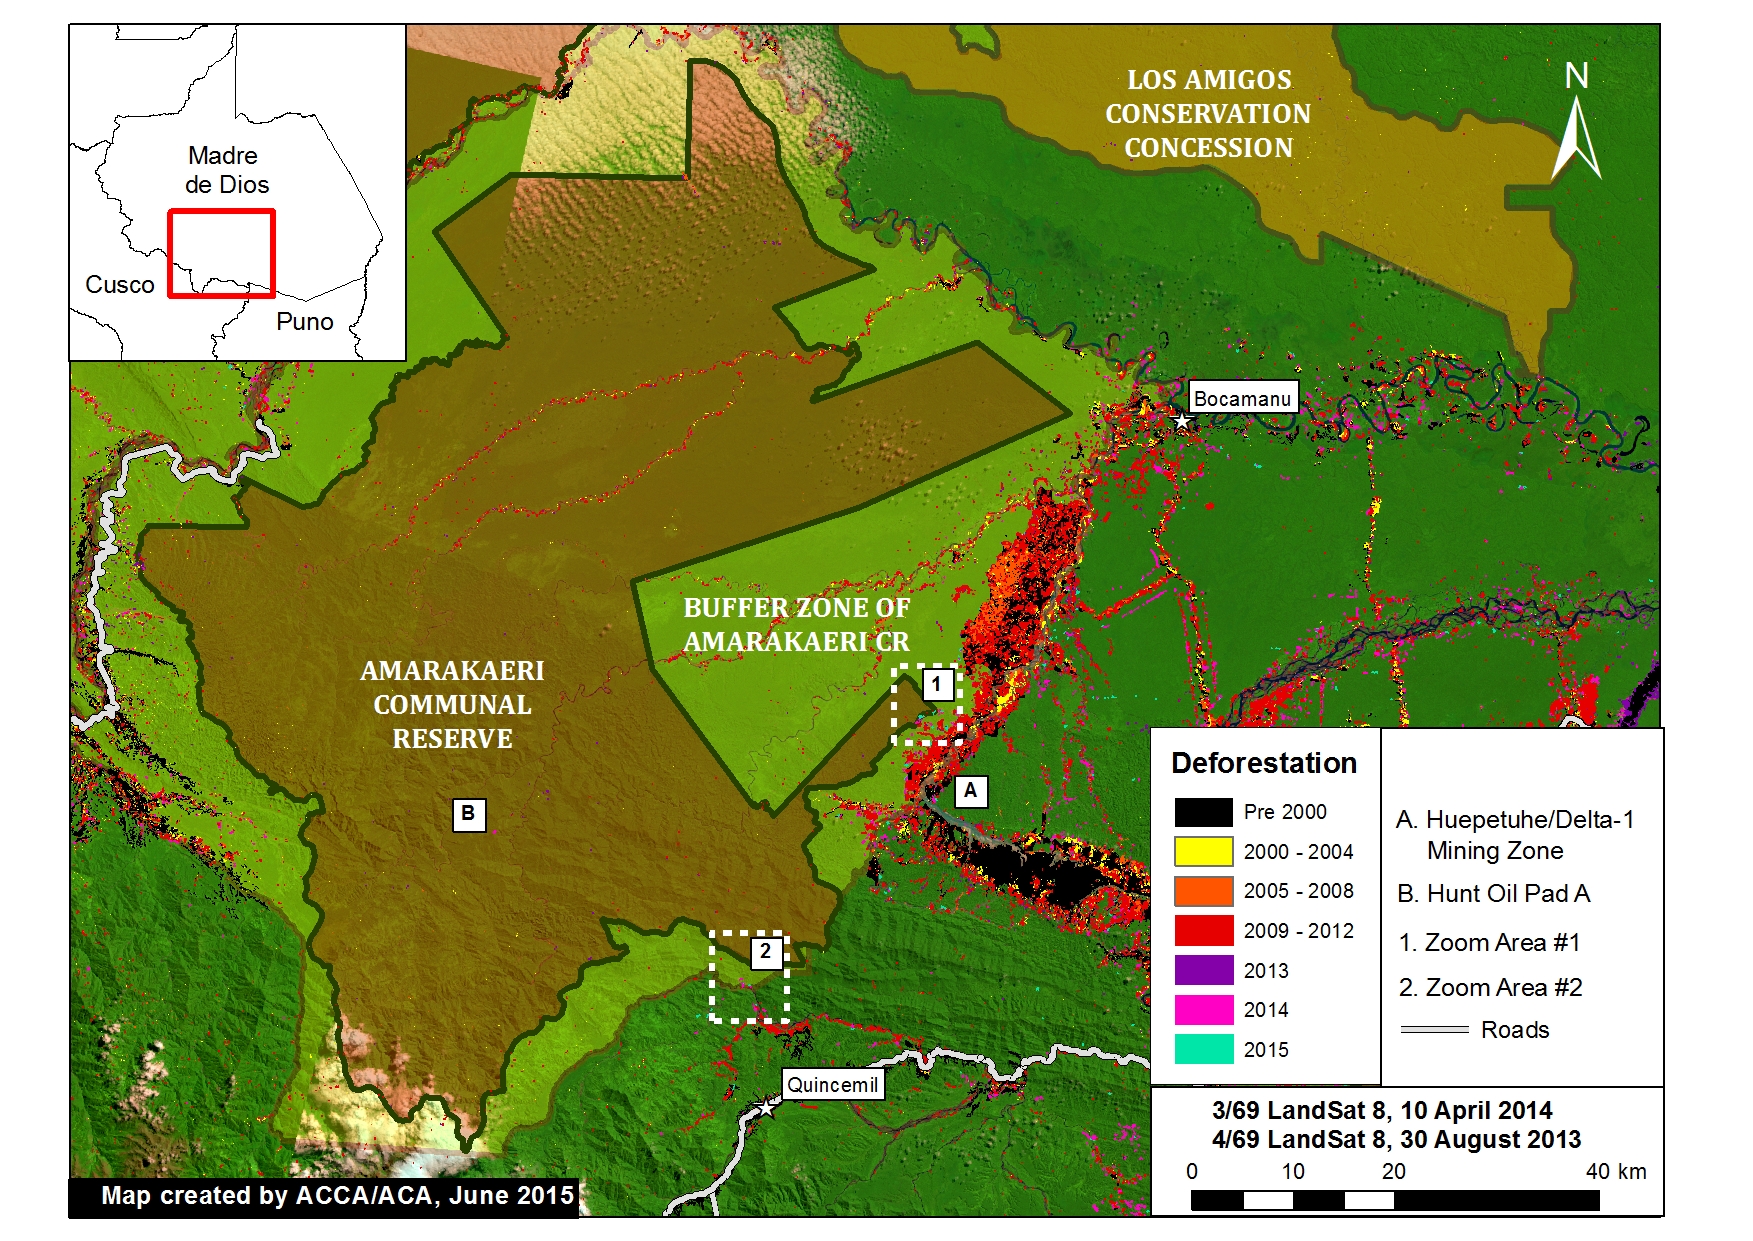
Recall that in Image of the Week #1 and Image of the Week #5 we documented how gold mining deforestation continues to expand within the Department of Madre de Dios, Peru (in the areas known as La Pampa and Upper Malinowski, respectively). Here, Image of the Week #6 documents how expanding deforestation from the mining zone known as Huepetuhe/Delta-1 is now entering the Amarakaeri Communal Reserve, an important Peruvian protected area that is co-managed by indigenous communities and Peru’s National Protected Areas Service (known as SERNANP).

Our analysis shows that gold mining deforestation, expanding from Huepetuhe/Delta-1, entered the southeast corner of the reserve in 2013 and expanded in 2014 and 2015. We also show that gold mining deforestation is spreading within the reserve’s south-eastern buffer zone.

2015_MDD_Amarakaeri_MAAP_6a_v8
Image of the Week 6a. Deforestation detected within and around the Amarakaeri Communal Reserve and its buffer zone. Zoom Area #1 indicates focal area in Images 6b and 6c, while Zoom Area #2 indicates focal area in Image 6d. Key data sources: MINAM, SERNANP, ACCA, USGS, IBC, Hansen/UMD/Google/USGS/NASA.

Key Findings:

According to our CLASlite analysis, deforestation entered the southeast corner of the Amarakaeri Communal Reserve in 2013 and expanded in 2014 and 2015 (see Zoom #1 below). Additional analysis revealed that the driver of this deforestation was gold mining due to the pattern and appearance of the forest loss.

We also detected increasing gold mining deforestation within the reserve’s south-eastern buffer zone between 2014 and 2015 (see Zoom #2 below). See below for more details.

We also detected a small amount of deforestation in 2014 from Hunt Oil’s drilling of Pad A within the reserve (see “B” in Image 6a). Note that overall deforestation from this gas exploration project has been very low because the company did not build an access road.

Gold Mining Deforestation Enters the Reserve (Zoom Area #1)

2015_MDD_Amarakaeri_MAAP_6b_v7 (1)
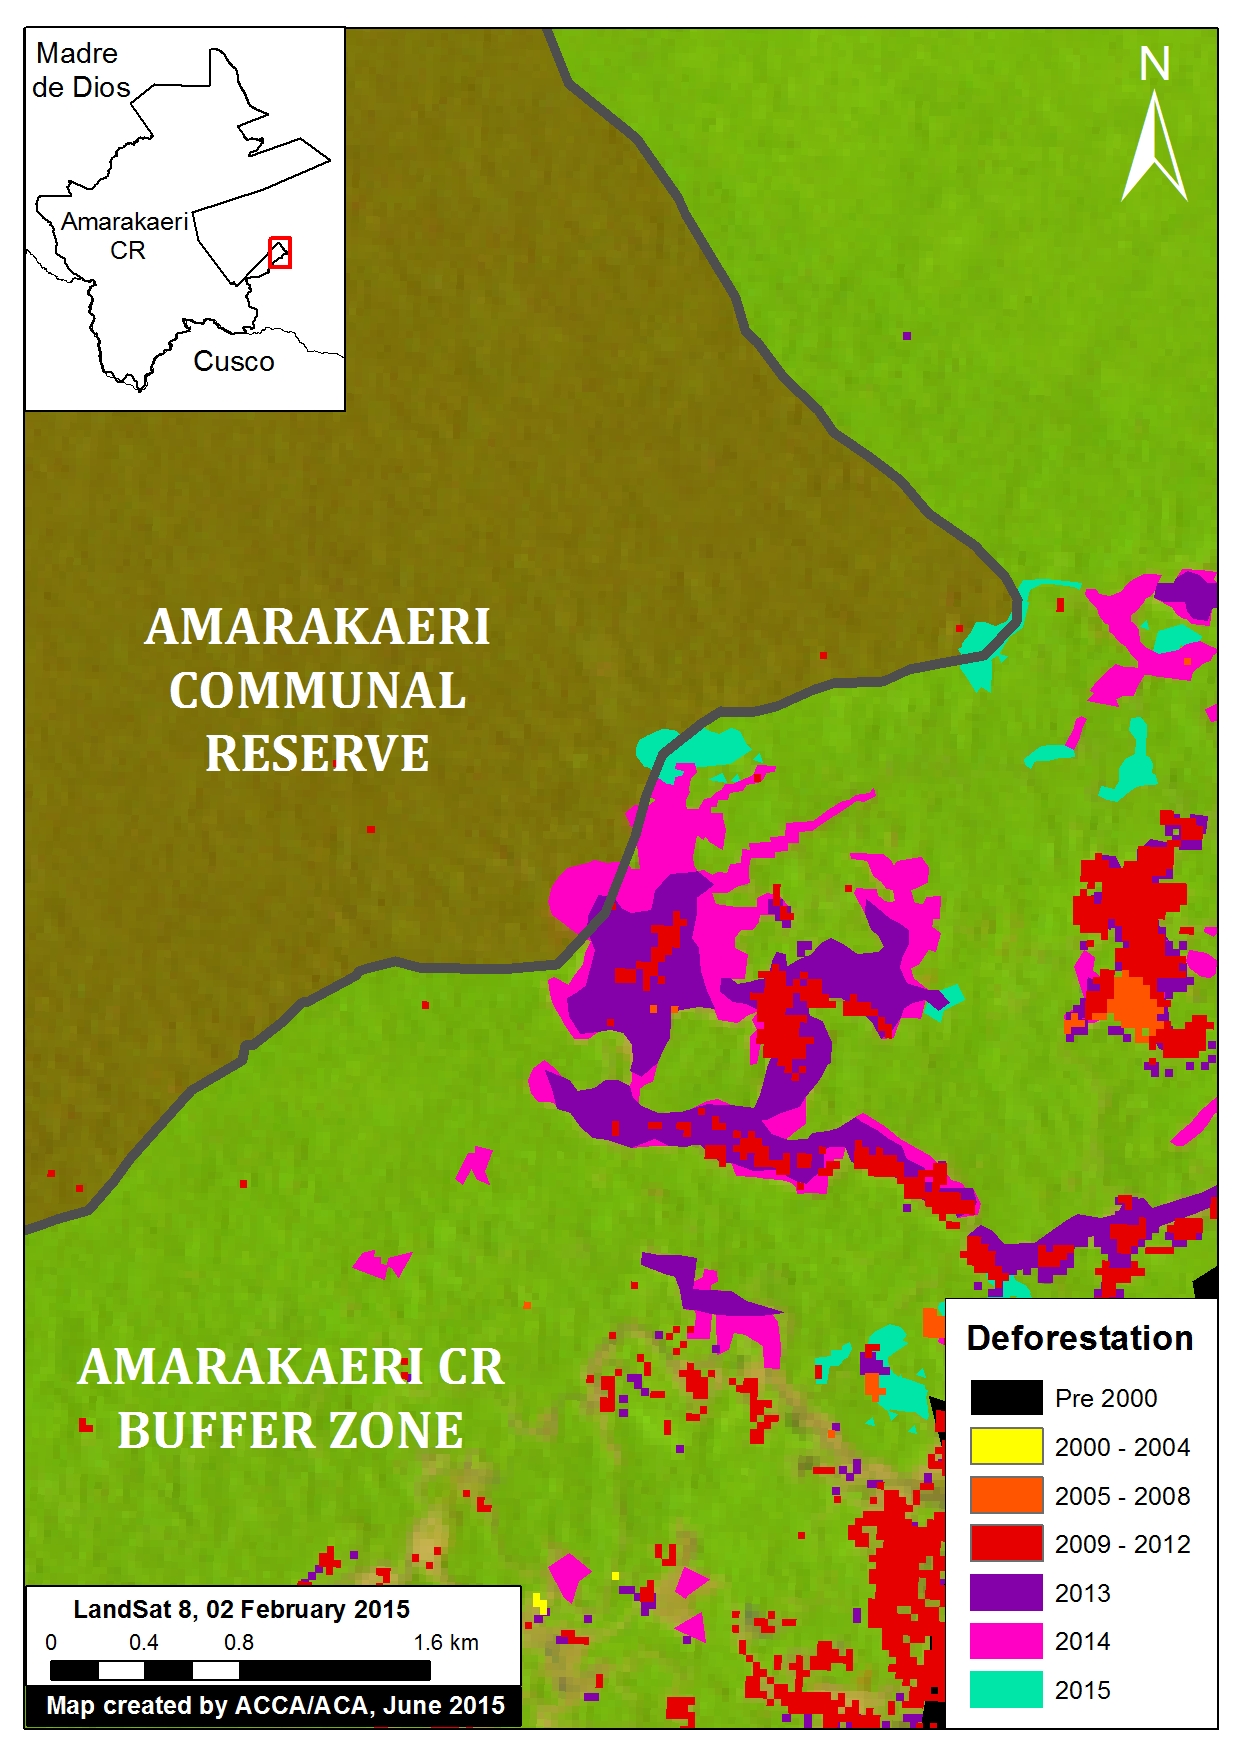
Image 6b. Zoom Area #1 provides an enhanced view of the deforestation within the southeast section of Amarakaeri Communal Reserve and its surrounding buffer zone. Key data sources: MINAM, SERNANP, ACCA, Hansen/UMD/Google/USGS/NASA, USGS.


Image 6b is a zoom view of the deforestation within the southeast section of Amarakaeri Communal Reserve and its surrounding buffer zone (see Zoom Area #1 in Image 6a for context).

Here, one can more clearly see how the gold mining deforestation entered the southeast corner of the reserve in 2013 and expanded in 2014 and 2015.

Total gold mining deforestation within this section of the Reserve is currently 11 hectares. Although this is currently only 1% of the Reserve’s total area, it represents a growing trend that may worsen.

Note that all of the rest of the deforestation in the image is within the reserve’s surrounding buffer zone.


Satellite Image Time-series of Deforestation Entering the Reserve (Zoom Area #1)

2015_MDD_Amarakaeri_MAAP_6c_v4
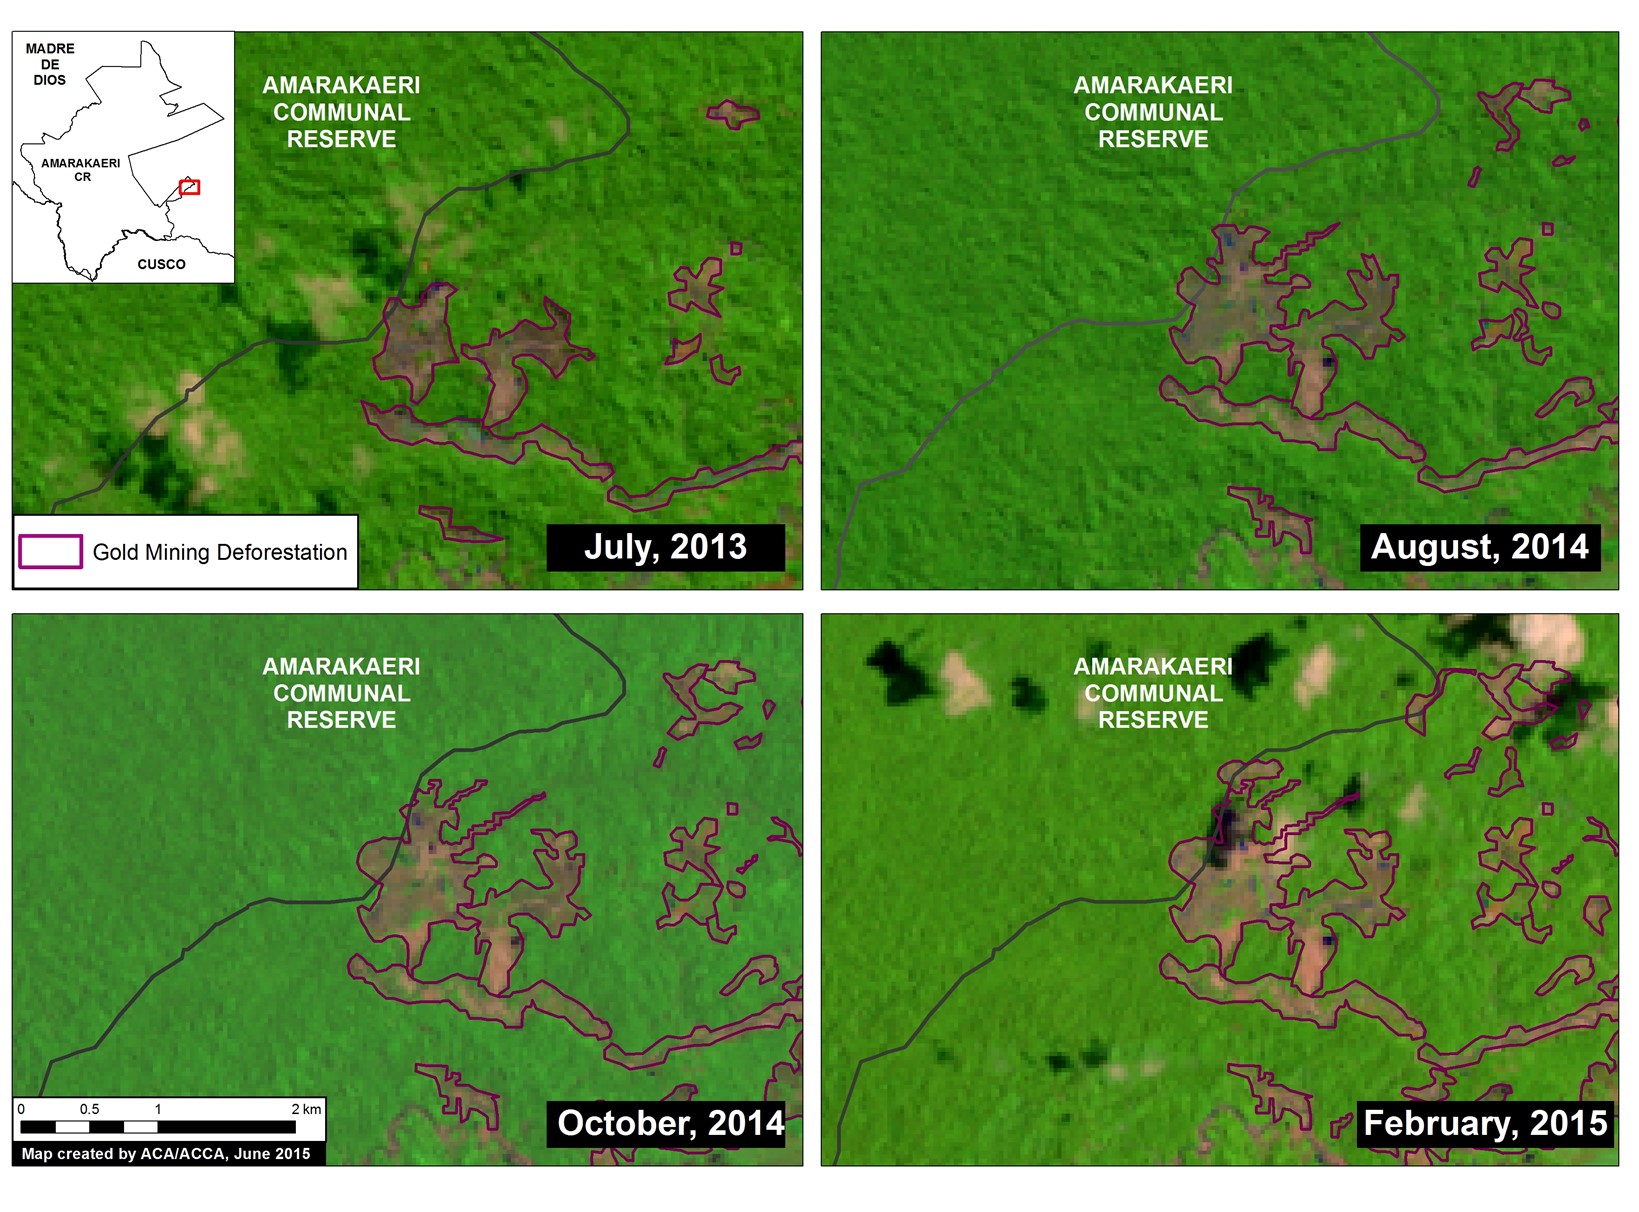
Image 6c. Satellite (Landsat 8) image time-series (2013 – 2015) of deforestation within the southeast section of the Amarakaeri Communal Reserve. Note that all four panels show the same location over time. Key data sources: USGS, SERNANP.

To better understand the deforestation dynamics over time within the southeast corner of the Amarakaeri Communal Reserve, we created a satellite (Landsat 8) image time-series. As seen in Image 6c, gold mining deforestation within the reserve is first seen in July 2013, and then slowly expands on several fronts until February 2015, the last good Landsat image for the area. Note that all four panels show the same location. Also note that all area in each panel outside the reserve is within its official buffer zone.

Gold Mining Deforestation Encroaching Upon Another Part of the Reserve (Zoom Area #2)

2015_MDD_Amarakaeri_MAAP_6e_v8
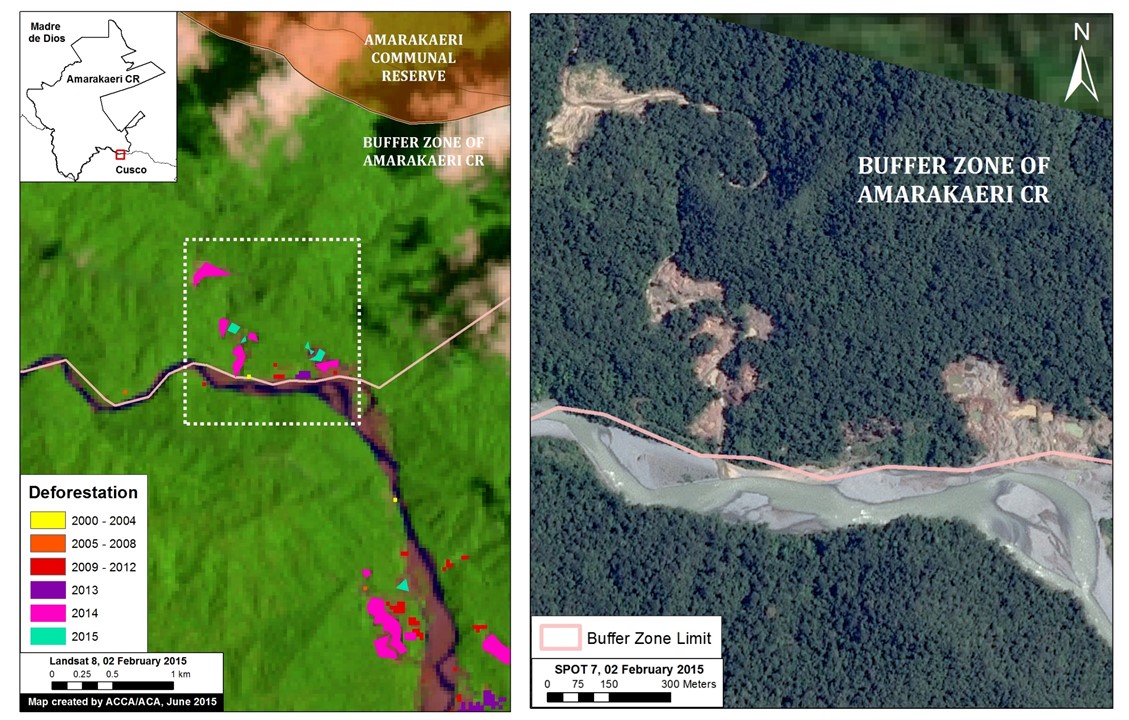
Image 6d. Zoom view of the deforestation within the south-eastern buffer zone of the Amarakaeri Communal Reserve. Left panel shows deforestation results data and right panel shows high resolution SPOT 7 imagery for the area in white dashed lines. Key data sources: MINAM, SERNANP, ACCA, Hansen/UMD/Google/USGS/NASA, USGS, and SPOT 7 from Airbus.

Image 6d shows how gold mining deforestation is encroaching on another part of the south-eastern section of the reserve (see Zoom Area #2 in Image 6a for context). As seen in the left panel, the deforestation within the buffer zone began expanding most notably in 2014 and 2015.

To confirm the driver of the deforestation, we acquired high resolution satellite imagery (SPOT 7 with 1.5 m resolution). As seen in the right panel of Image 6d, the pattern of the recent deforestation is characteristic of gold mining, and not other possible drivers such as agriculture.

Data Description:

Background map is a mosaic of two Landsat 8 images (30 m resolution) from April 10, 2014 and August 30, 2013. Any variation of green indicates forest cover. Note there is some scattered cloud cover. Data is from USGS.

Protected areas data is from SERNANP. Dark green indicates an established Peruvian national protected area or conservation concession and yellow-green indicates an official protected area buffer zone.

Black indicates areas that were deforested as of 2000 according to data from the Peruvian Environment Ministry (MINAM 2009). Yellow, orange, and red indicate areas that were deforested from 2000 to 2012 (each color covers a four year period) (Hansen MC et al. 2013 Science 342: 850–53; Data download).

Purple, pink, and teal indicate areas that were deforested between January 2013 and February 2015 based on our analysis of Landsat imagery using CLASlite forest monitoring software.

Citation

Finer M, Novoa S (2015) Gold Mining Deforestation Enters Amarakaeri Communal Reserve (Madre de Dios, Peru). MAAP: Image #6. Link: https://www.maapprogram.org/2015/08/image-of-the-week-6-gold-mining-deforestation-enters-amarakaeri-communal-reserve/


Image #5: Gold Mining Deforestation Intensifies along Upper Malinowski (Madre de Dios, Peru)

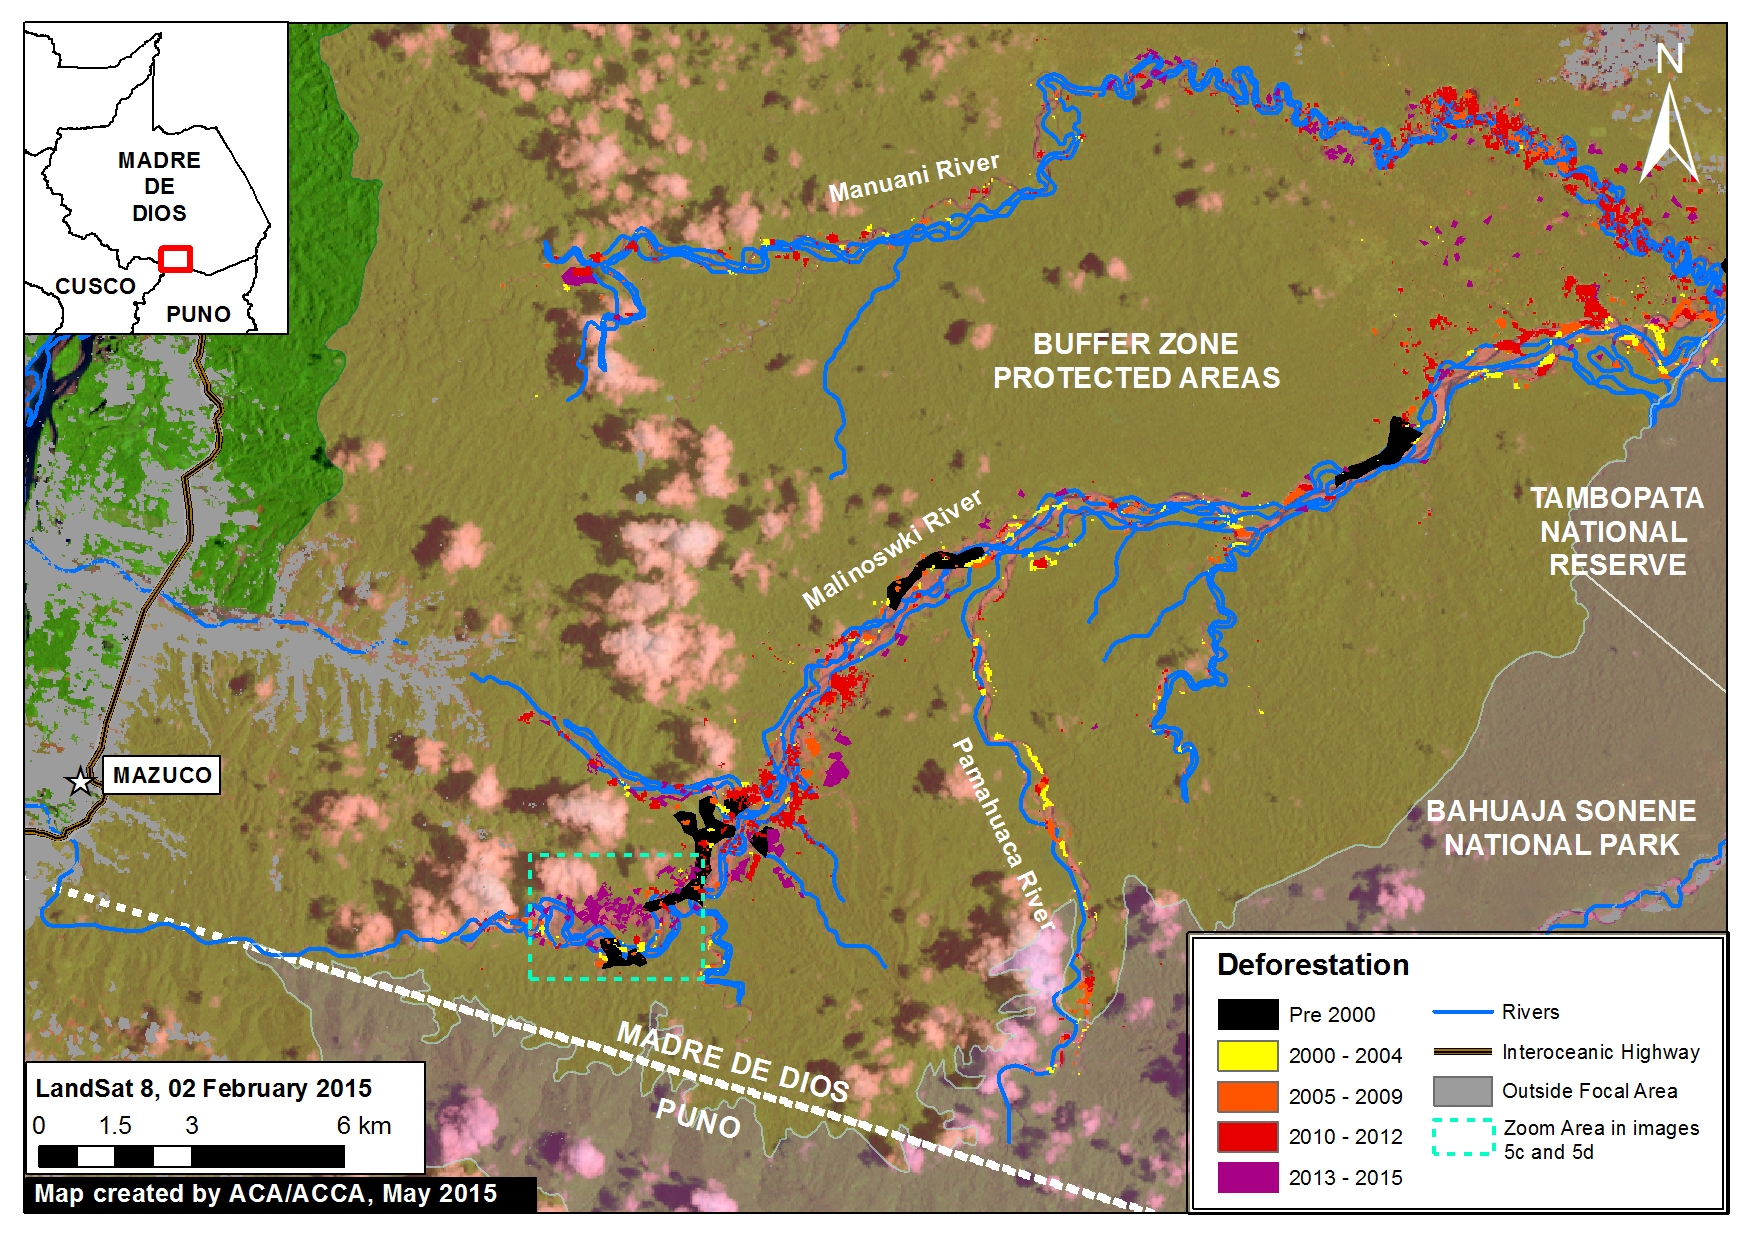
Recall that in Image of the Week #1 we documented how gold mining deforestation continues to expand within the Department of Madre de Dios (Peru) in an area known as La Pampa  (1,700 hectares of new deforestation between 2013 and 2015). Here, Image of the Week #5 examines the area immediately to the west of La Pampa along the Upper Malinowski River, where we document over 850 hectares of additional gold mining deforestation between 2013 and 2015. Like La Pampa, most mining along the Upper Malinowski is illegal because it is outside the permissible mining zone and within the official buffer zone of a protected area.

2015_MDD_Malinowski_MAAP_5a_v7
Image of the Week 5a. Expanding deforestation from illegal gold mining along the Upper Malinowski River. Key data sources: MINAM, SERNANP, ACCA, USGS, IBC, Hansen/UMD/Google/USGS/NASA.

Key Results

According to our CLASlite analysis, 864 hectares were deforested between 2013 and 2015 along the Upper Malinowski and nearby tributaries within the buffer zones of the Bahuaja Sonene and Tambopata protected areas.

Image of the Week Description

Background map is a Landsat 8 image (30 m resolution) from February 2, 2015. Any variation of green indicates forest cover. Note there is some scattered cloud cover. Data is from USGS.

Protected areas data is from SERNANP. Dark green indicates established national protected areas and yellow-green indicates their buffer zones.

Black indicates areas that were deforested as of 2000 according to data from the Peruvian Environment Ministry (MINAM 2009). Yellow, orange, and red indicate areas that were deforested from 2000 to 2012 (each color covers a four year period) (Hansen MC et al. 2013 Science 342: 850–53Data download).

Purple indicates areas that were deforested between January 2013 and February 2015 based on our analysis of Landsat imagery using CLASlite forest monitoring software.

Madre de Dios Mining Zone

2015_MDD_Malinowski_MAAP_5b_v4
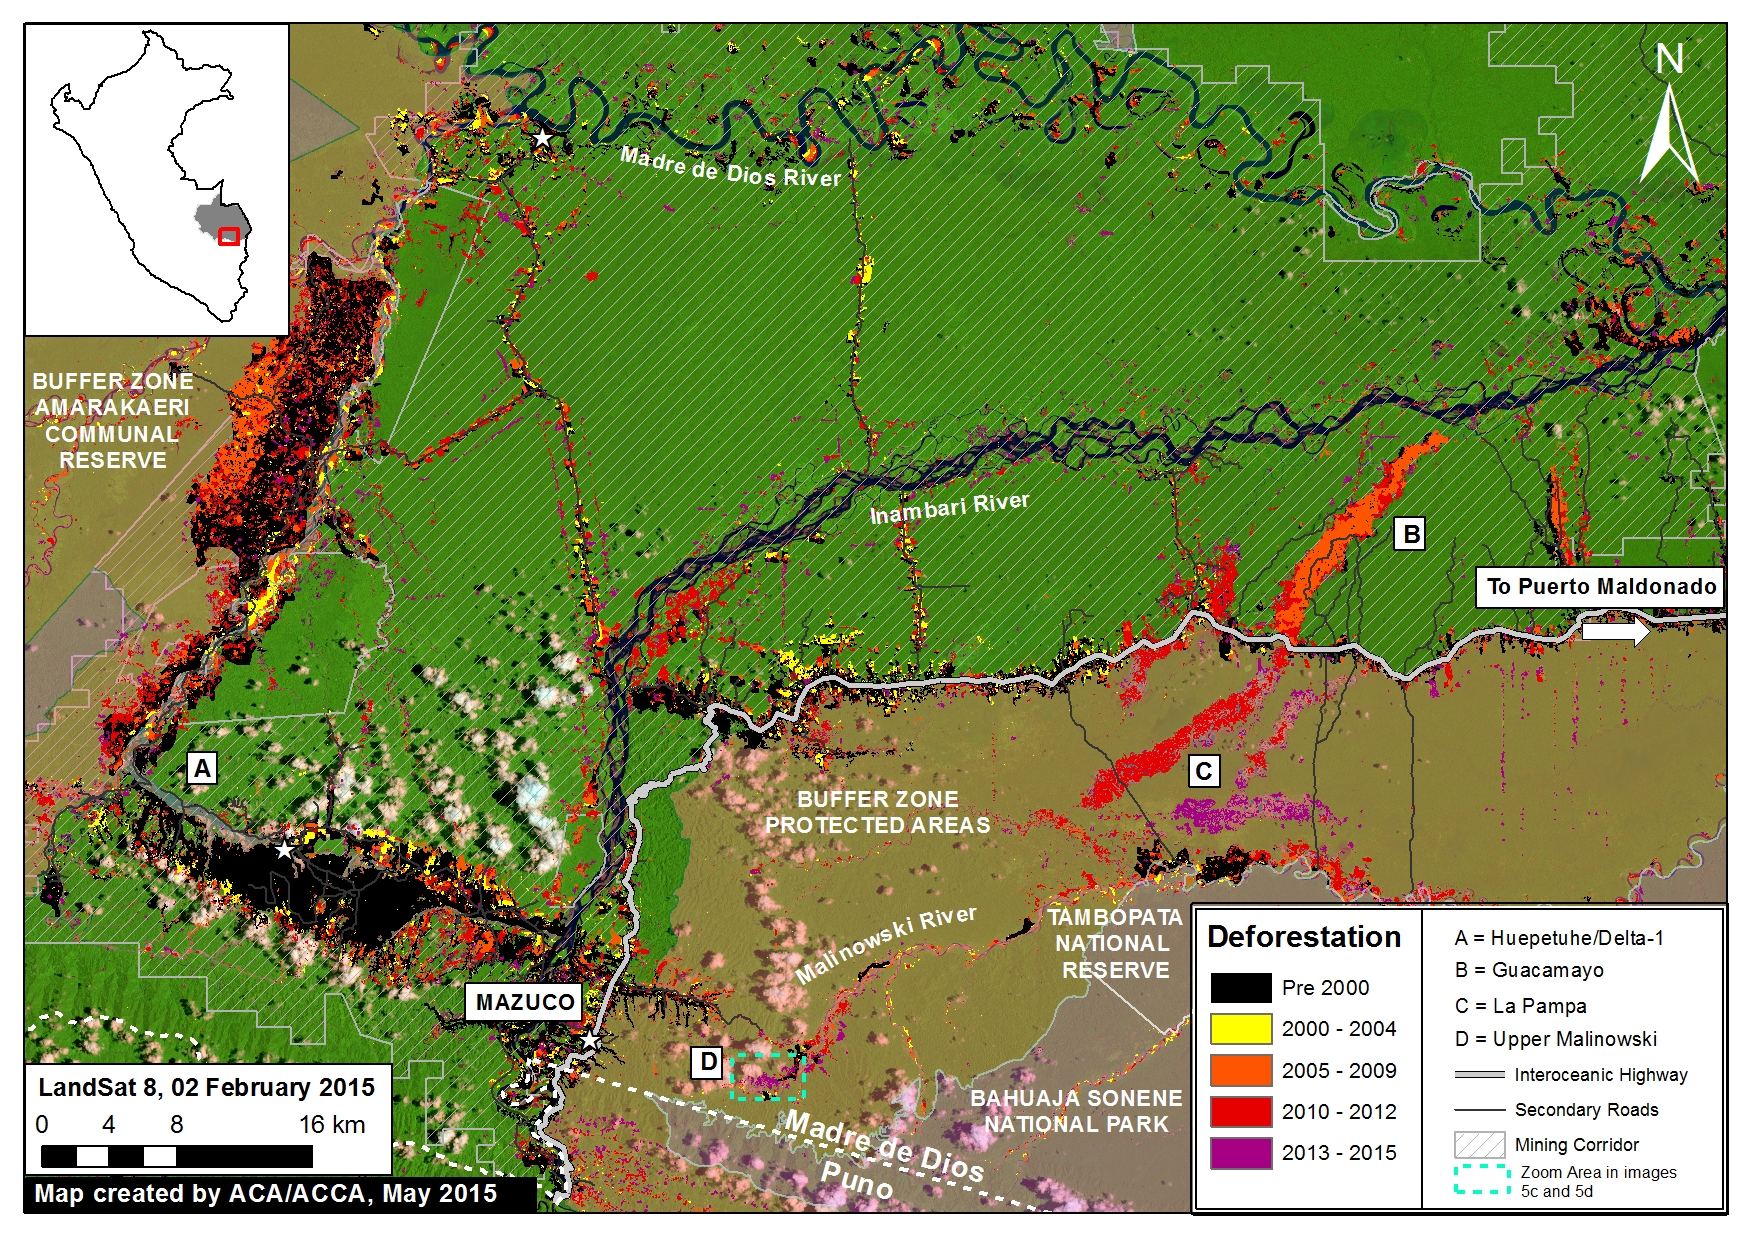
Image 5b. Madre de Dios mining zone, highlighting location of La Pampa and Upper Malinowski. Note that we did not include other land uses such as forestry concessions. Key data sources: MINAM, SERNANP, ACCA, Hansen/UMD/Google/USGS/NASA, USGS.

Image 5b provides greater context of the Madre de Dios mining zone, highlighting La Pampa at “C” (Image of the Week #1) and the Upper Malinowski at “D”.

The Permissible Mining Zone was established in 2010 and indicates the zone that the Peruvian Government has delimited as potentially legal for small-scale and artisanal mining activities, but only if miners succesfully complete a multi-step formalization process for each project. One of the key steps of this process is to resolve any land use conflicts due to overlapping land claims (for example if a section of the mining corridor overlaps with a forestry concession). Data is from ACCA.

Importantly, note that most gold mining in both La Pampa and the Upper Malinowski is illegal since it is located outside the permissible mining zone and within the buffer zone of two protected areas (Bahuaja Sonene National Park and Tambopata National Reserve).

Also note that on the lower Malinowski, deforestation is concentrated on the buffer zone side and largely absent on the protected area side. This striking pattern indicates that official protection status is much more of an effective deforestation deterrent than the looser buffer zone status.

High-resolution Zoom

2015_MDD_Malinowski_MAAP_5c_v4
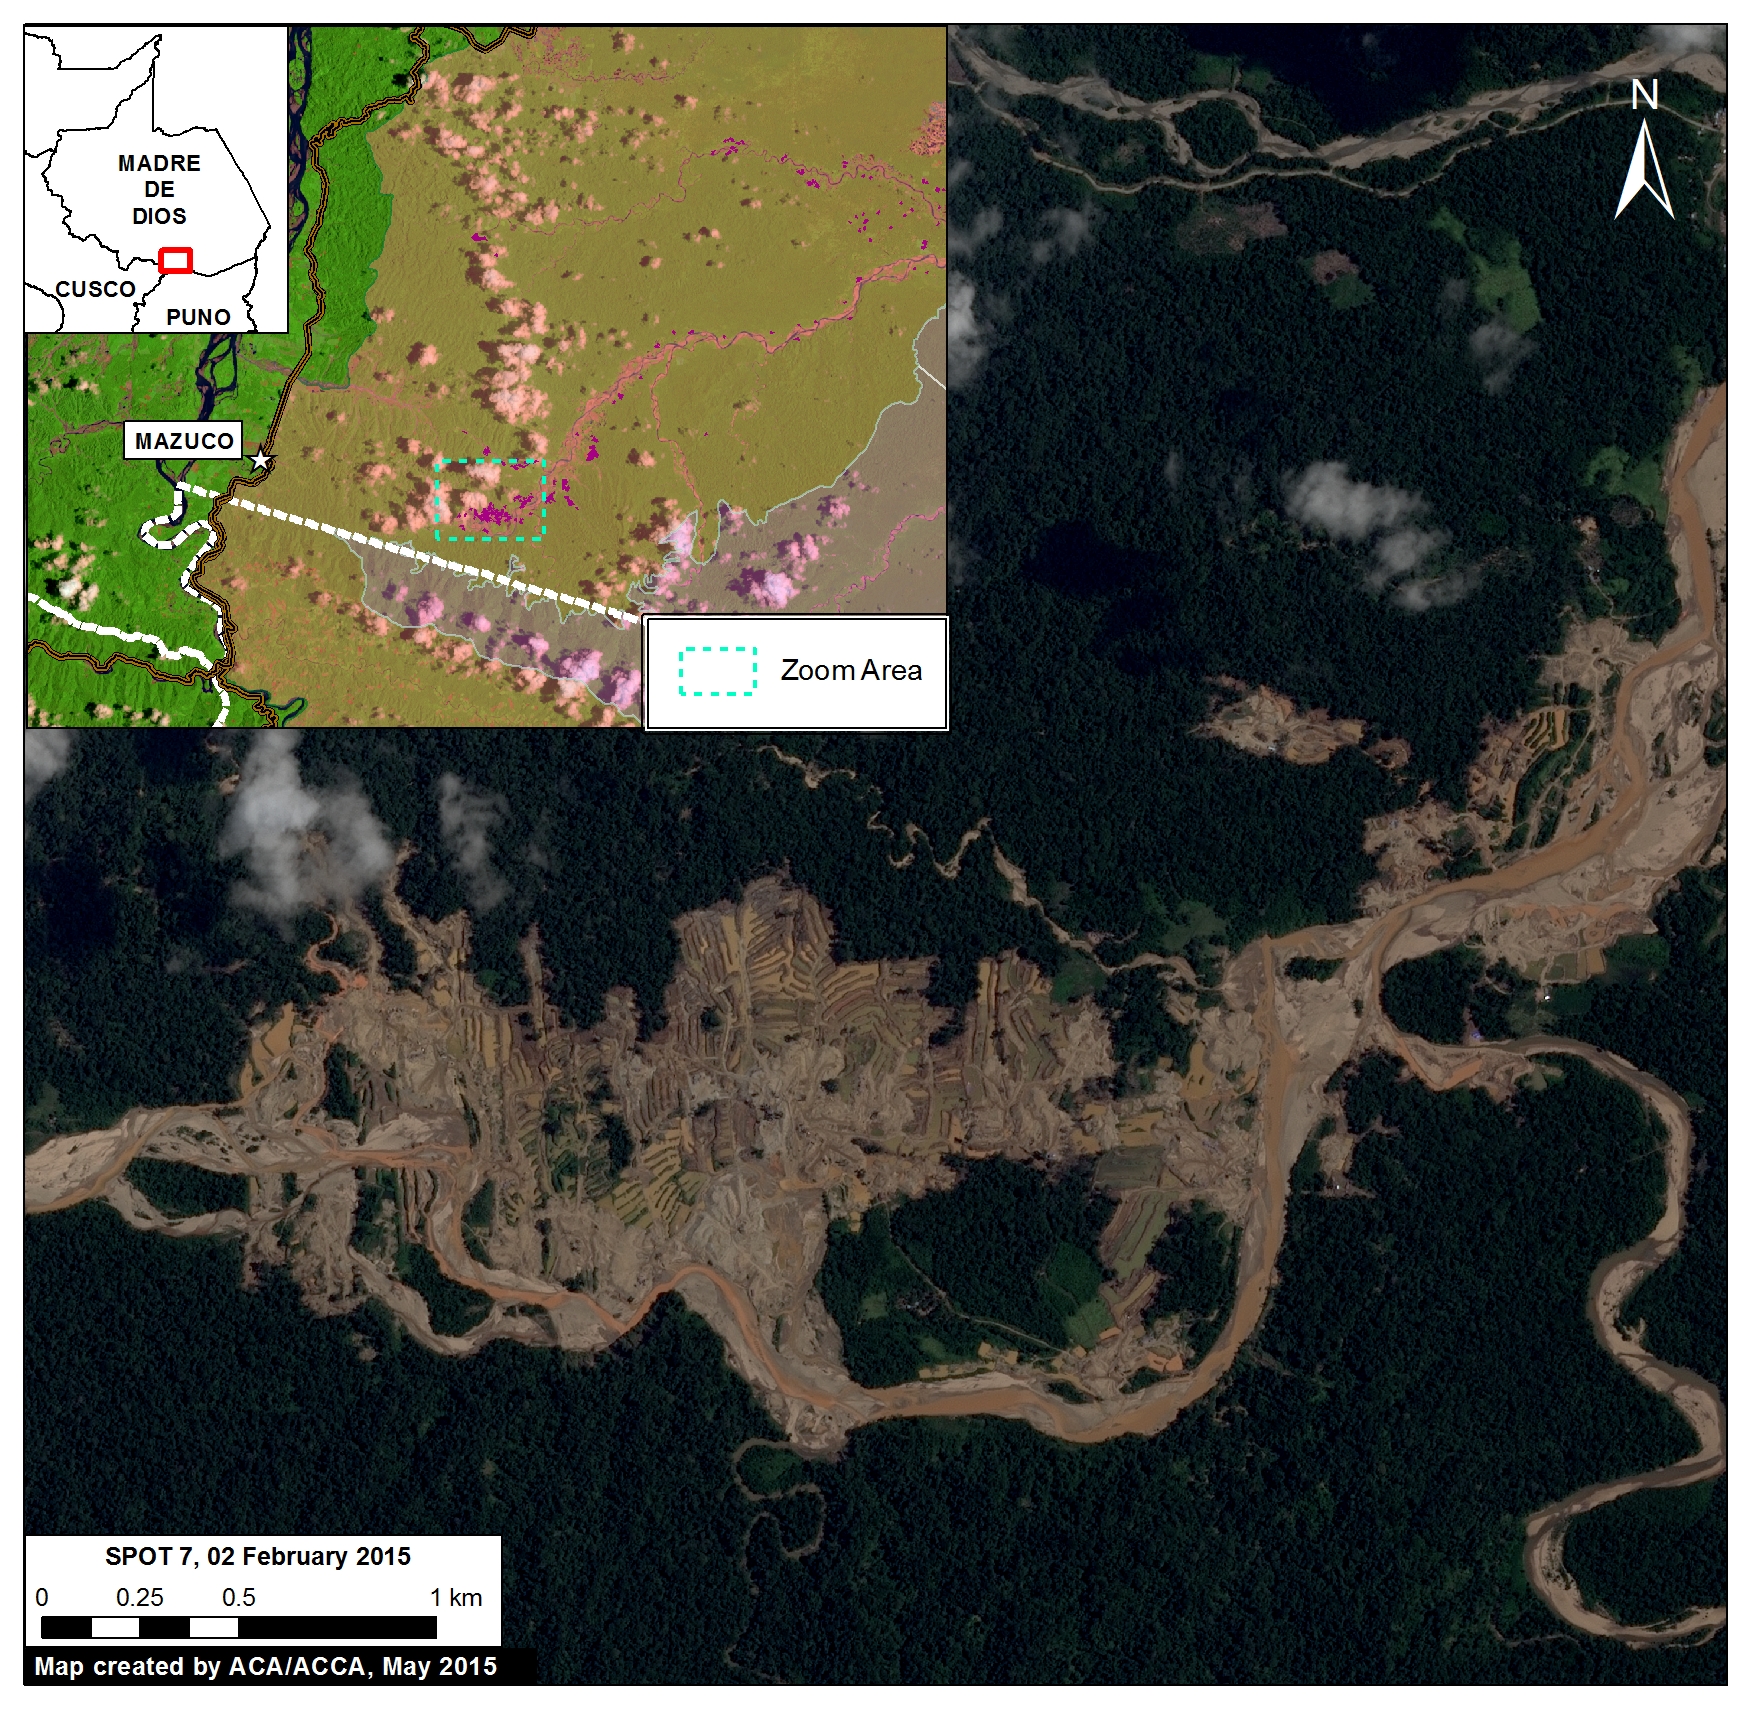
Image 5c. High resolution satellite image of deforestation along the Upper Malinowski River. Key data sources: SPOT 7, CLASlite.

To better understand the driver of the deforestation along the Upper Malinowski, we acquired high resolution satellite imagery (SPOT 7 with 1.5 m resolution). As seen in Image 5c, the pattern of the recent deforestation is characteristic of gold mining, and not other possible drivers such as agriculture. Note that the purple outlines indicate areas that were deforested between January 2013 and February 2015 based on our CLASlite analysis (this image shows 492 of the total 864 hectares of recent deforestation).

Satellite Image Time-series

2015_MDD_Malinowski_MAAP_5d_v3
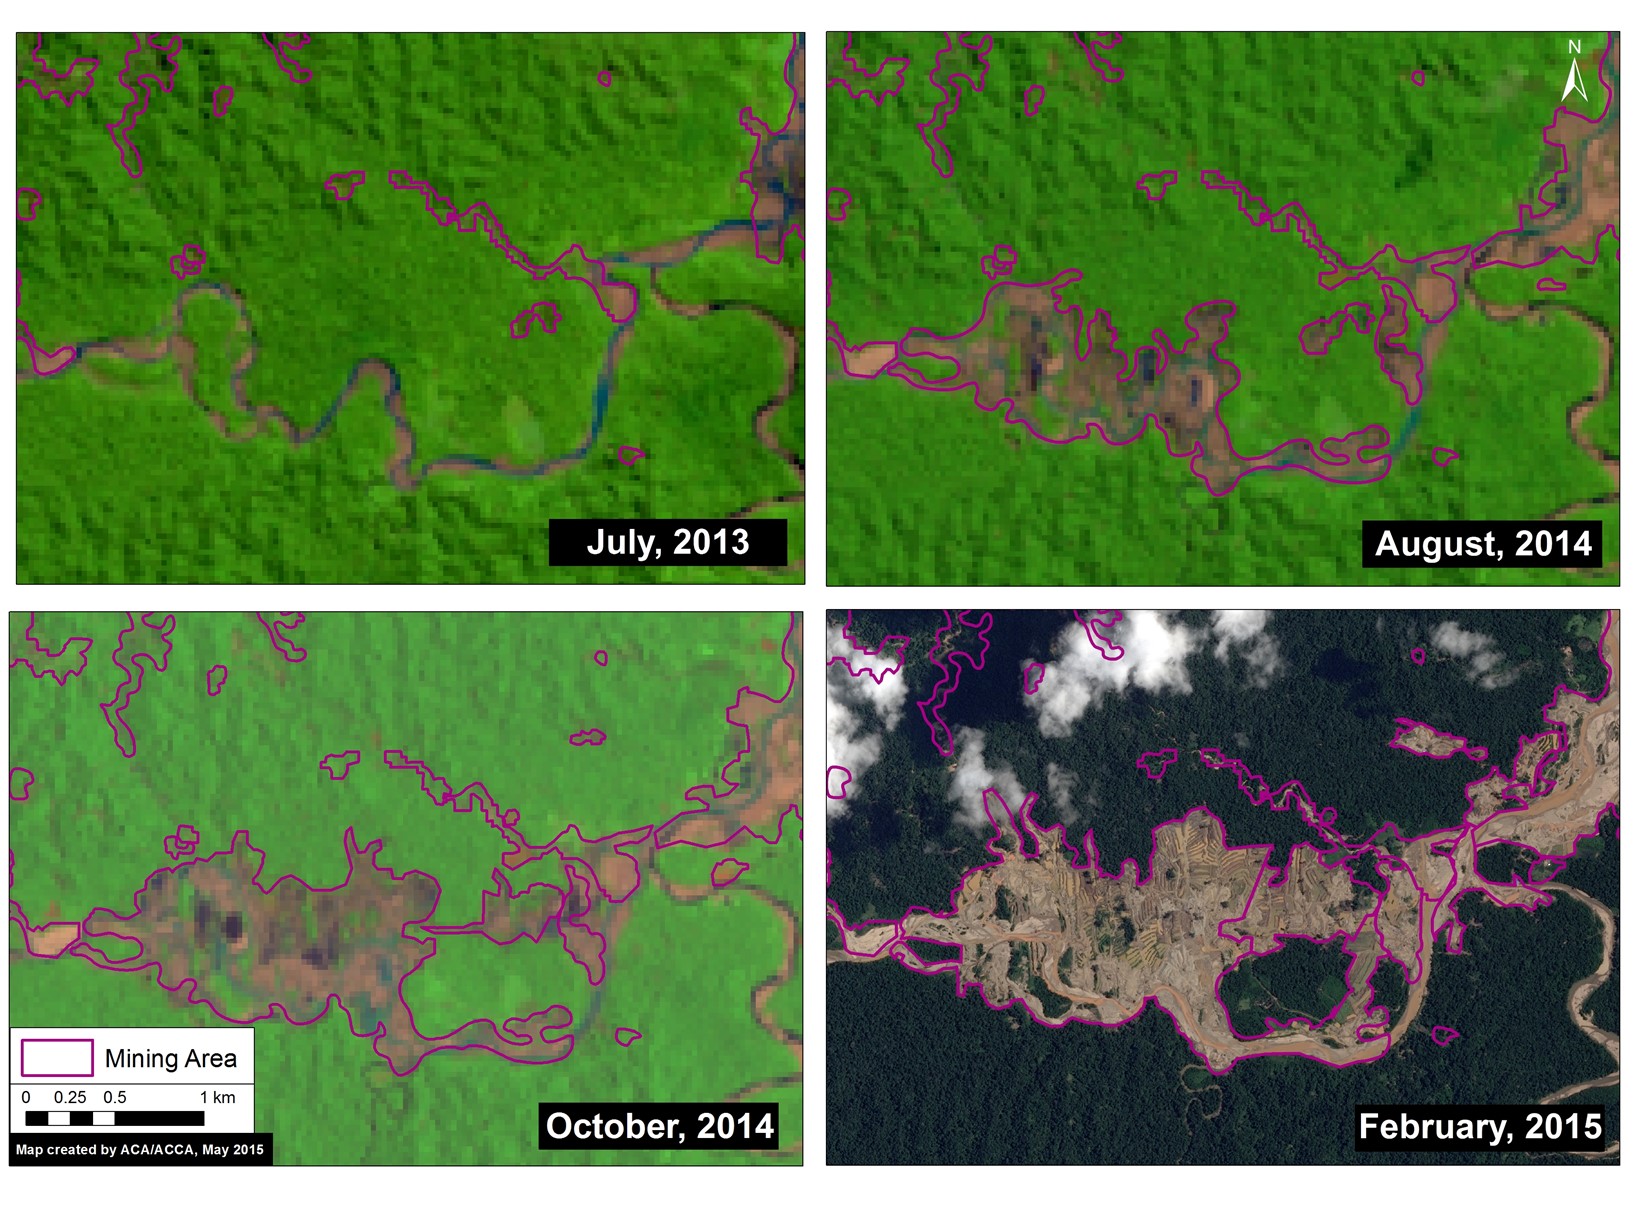
Image 5d. Satellite image time-series (2013 – 2015) of deforestation along the Upper Malinowski. Note that all four panels in Image 5d show the same location. Key data sources: USGS, SPOT 7.

To better understand the deforestation dynamics over time along the Upper Malinowski, we created a satellite image (Landsat and SPOT 7) time-series. As seen in Image 5d, there was a rapid increase in mining deforestation in the less than two years between July 2013 and February 2015. Note that all four panels in Image 5d show the same location, but appear different because of the deforestation.

Citation

Finer M, Novoa S (2015) Gold Mining Deforestation Intensifies along Upper Malinowski (Madre de Dios, Peru). MAAP: Image #5. Link: https://www.maapprogram.org/2015/05/image-5-gold-mining-deforestation-intensifies-along-upper-malinowski-madre-de-dios-peru/

Image #4: Large-Scale Oil Palm Causes Deforestation of Primary Forest in the Peruvian Amazon (Part 1: Nueva Requena)

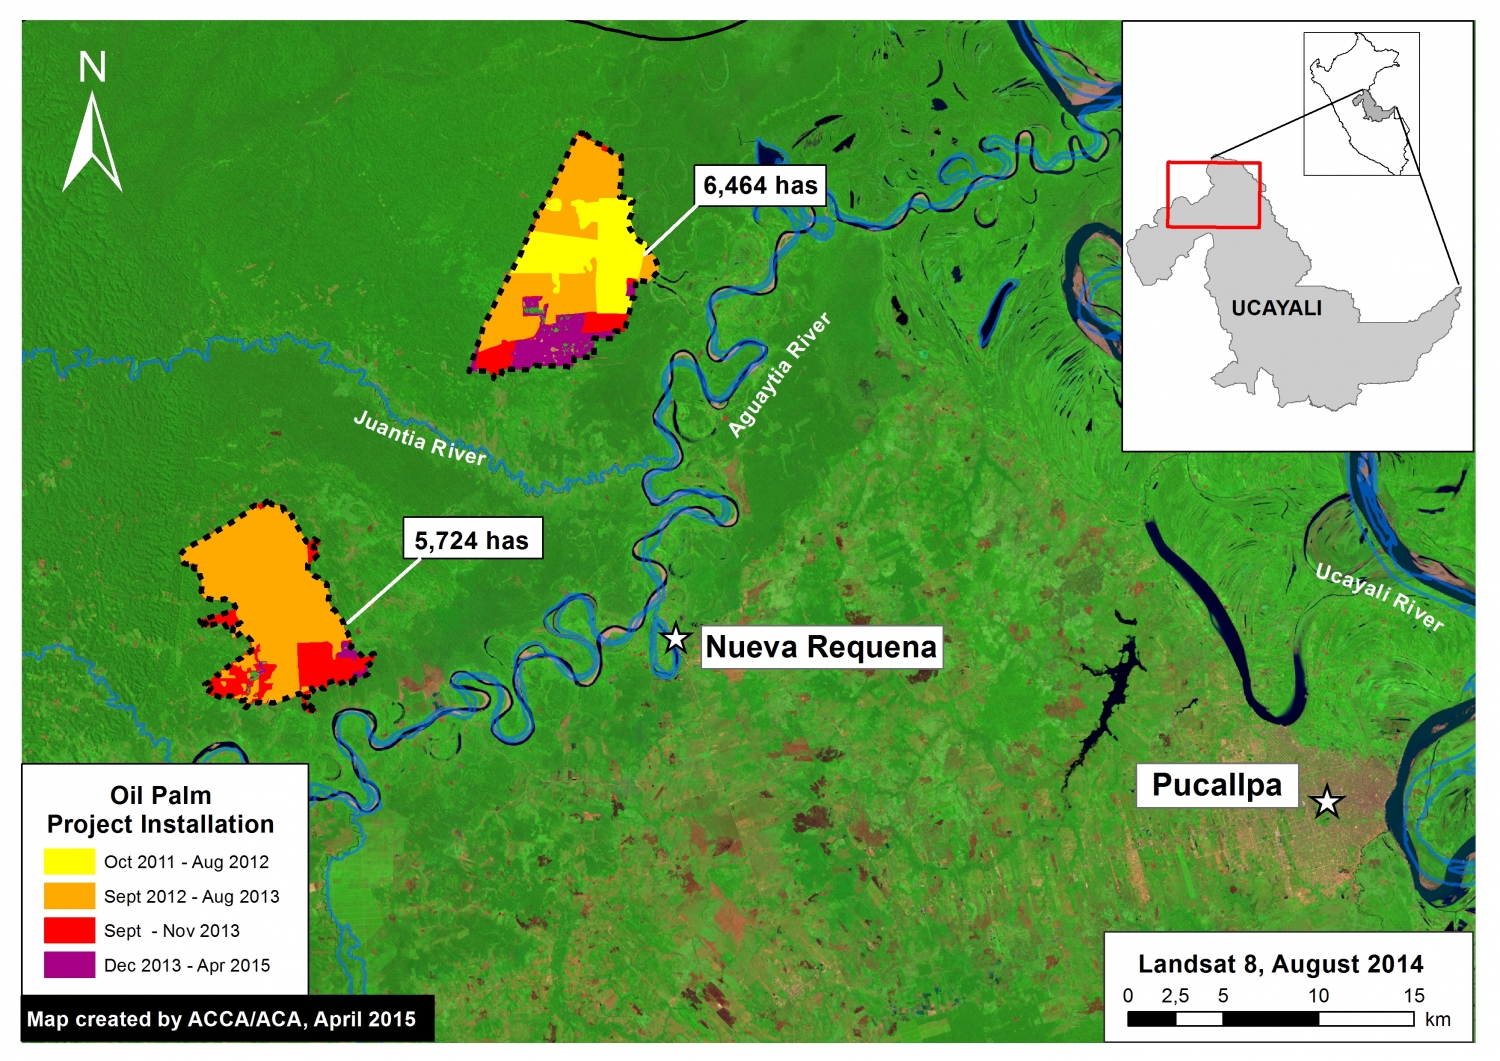
Image of the Week #4 shows the expansion of two large-scale oil palm projects near the town of Nueva Requena in the central Peruvian Amazon (Department of Ucayali). These projects began in late 2011 and, as of April 2015, now cover nearly 12,200 hectares (ha). Our analysis reveals that, of this total area, 9,400 ha came at the expense of primary forest and 2,350 ha from secondary forest.

NR_MAAP_4d_v5
Image of the Week 4a. Two large-scale oil palm projects near Nueva Requena in the central Peruvian Amazon (Department of Ucayali) began in late 2011 and now cover nearly 12,200 ha. Key data sources: USGS.

Map Description

Background map is a Landsat 8 satellite image (30 meter resolution) from August 2014. Dark green indicates forest cover. Light green indicates younger or secondary vegetation. Blue indicates water bodies. Data is from USGS.

The dashed black lines indicate the outline of the two large-scale oil palm projects, one of which is known to be “Plantaciones de Ucayali”, as of April 2015.

The colors indicate how the deforestation and plantation installation unfolded over time for the two projects according to our analysis of Landsat imagery.

Between October 2011 and August 2012, large scale-clearing and installation (indicated in yellow) started in the northern project.

Between September 2012 and August 2013, large-scale clearing and installation (indicated in orange) continued in the northern project and began in the southern project.

Between September and November 2013, clearing and installation (indicated in red) continued in the southern portion of both projects.

Most recently, between December 2013 and April 2015, clearing and installation (indicated in purple) continued in the southern portion of the northern project.

As of April 2015, the two projects cover an area of 12,188 ha.

Landsat Time-series 2010 – 2015

NR_MAAP_4g_v2
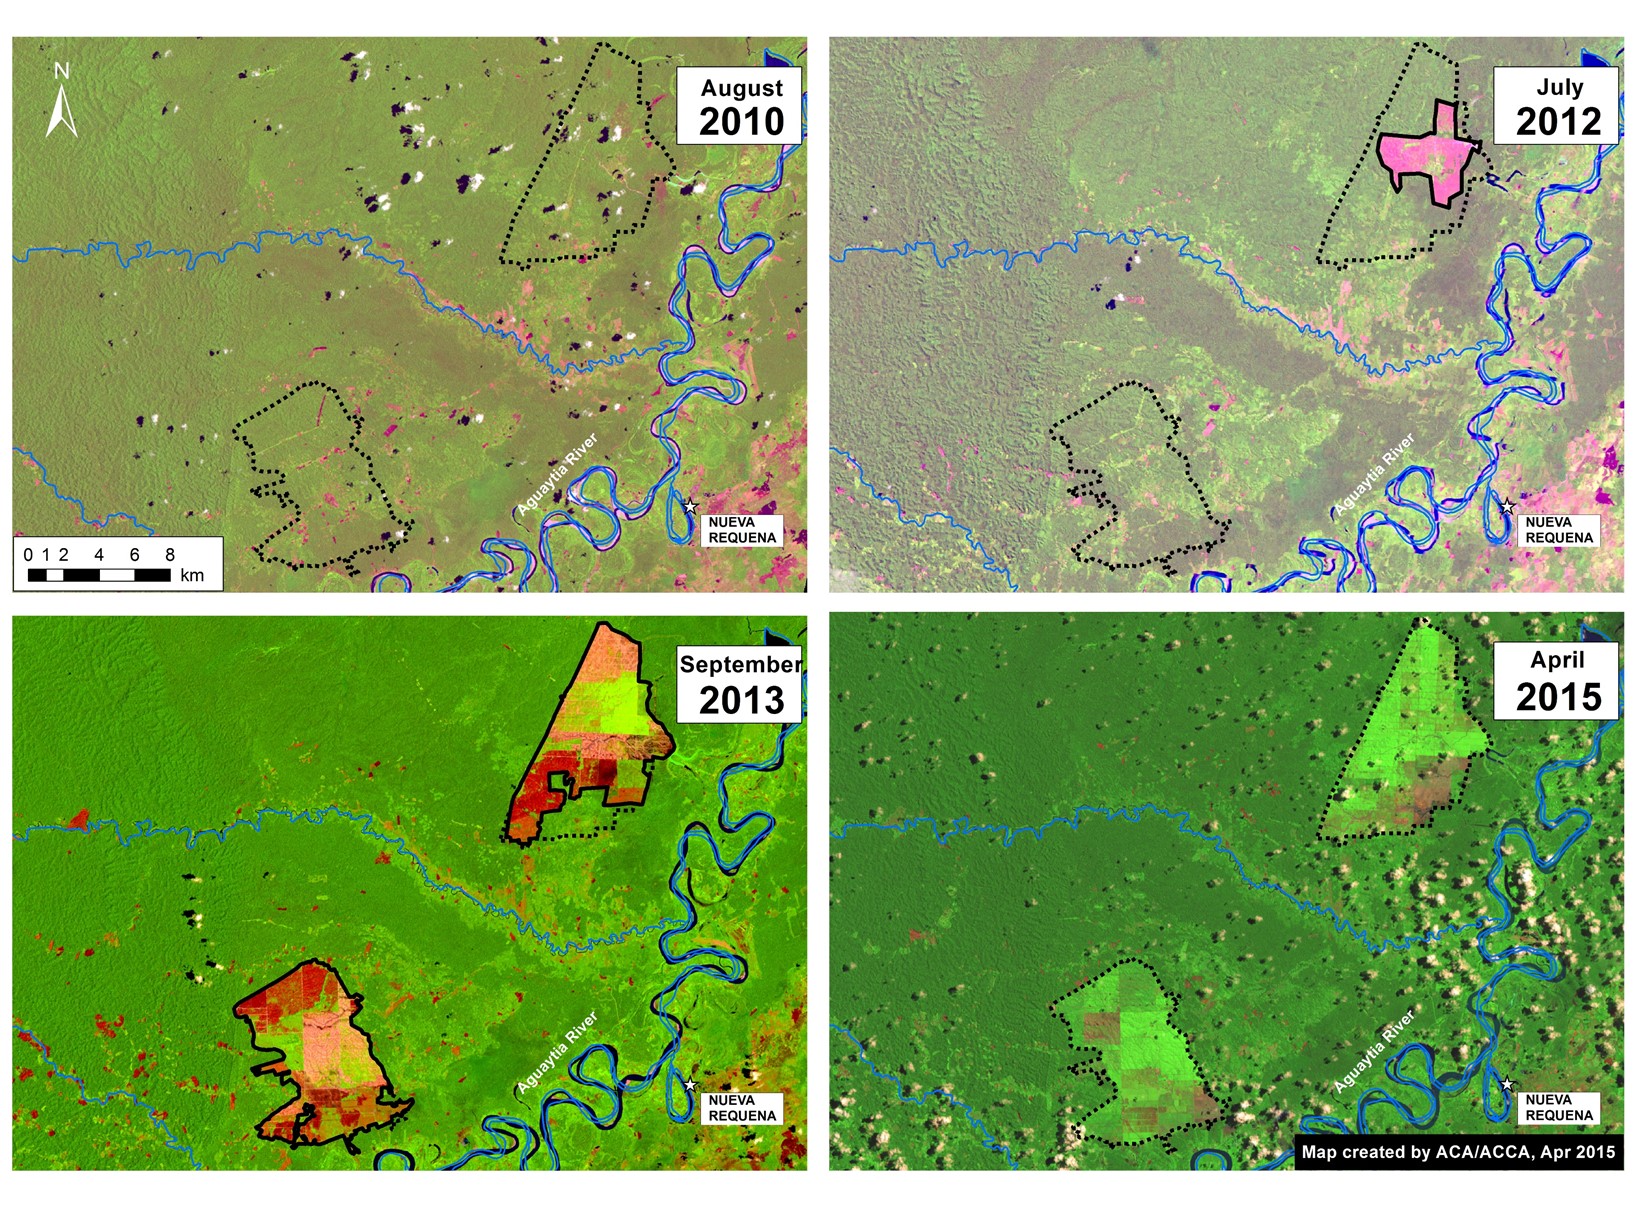
Image 4b. Landsat time-series (2010 – 2015) for both large-scale oil palm projects near Nueva Requena. Key data sources: USGS.

Image 4b is a series of Landsat images showing the change over time for both oil palm projects. In these images, dark green indicates forest cover, light green indicates secondary vegetation and oil palm plantations, pink indicates exposed ground (and is therefore a key indicator of recent deforestation), and the scattered white and black spots indicate clouds and their shade.

The first image, Landsat 5 from August 2010, shows the eventual project area (indicated by dashed black lines) immediately prior to the start of the project in 2011.

The second image, Landsat 7 from July 2012, shows the start of large-scale clearing in the northern portion of the project area.

The third image, Landsat 8 from September 2013, shows the clearing quickly expanded in both projects. It also shows the start of the oil palm plantation planting in the northern project (indicated by bright green).

The fourth image, Landsat 8 from April 2015, is the latest cloud-free image for the project area. It shows the continued expansion of the northern project and the extensive oil palm plantation plantings in both projects.

Landsat Time-series 1990 – 2015

NR_MAAP_4e_v5
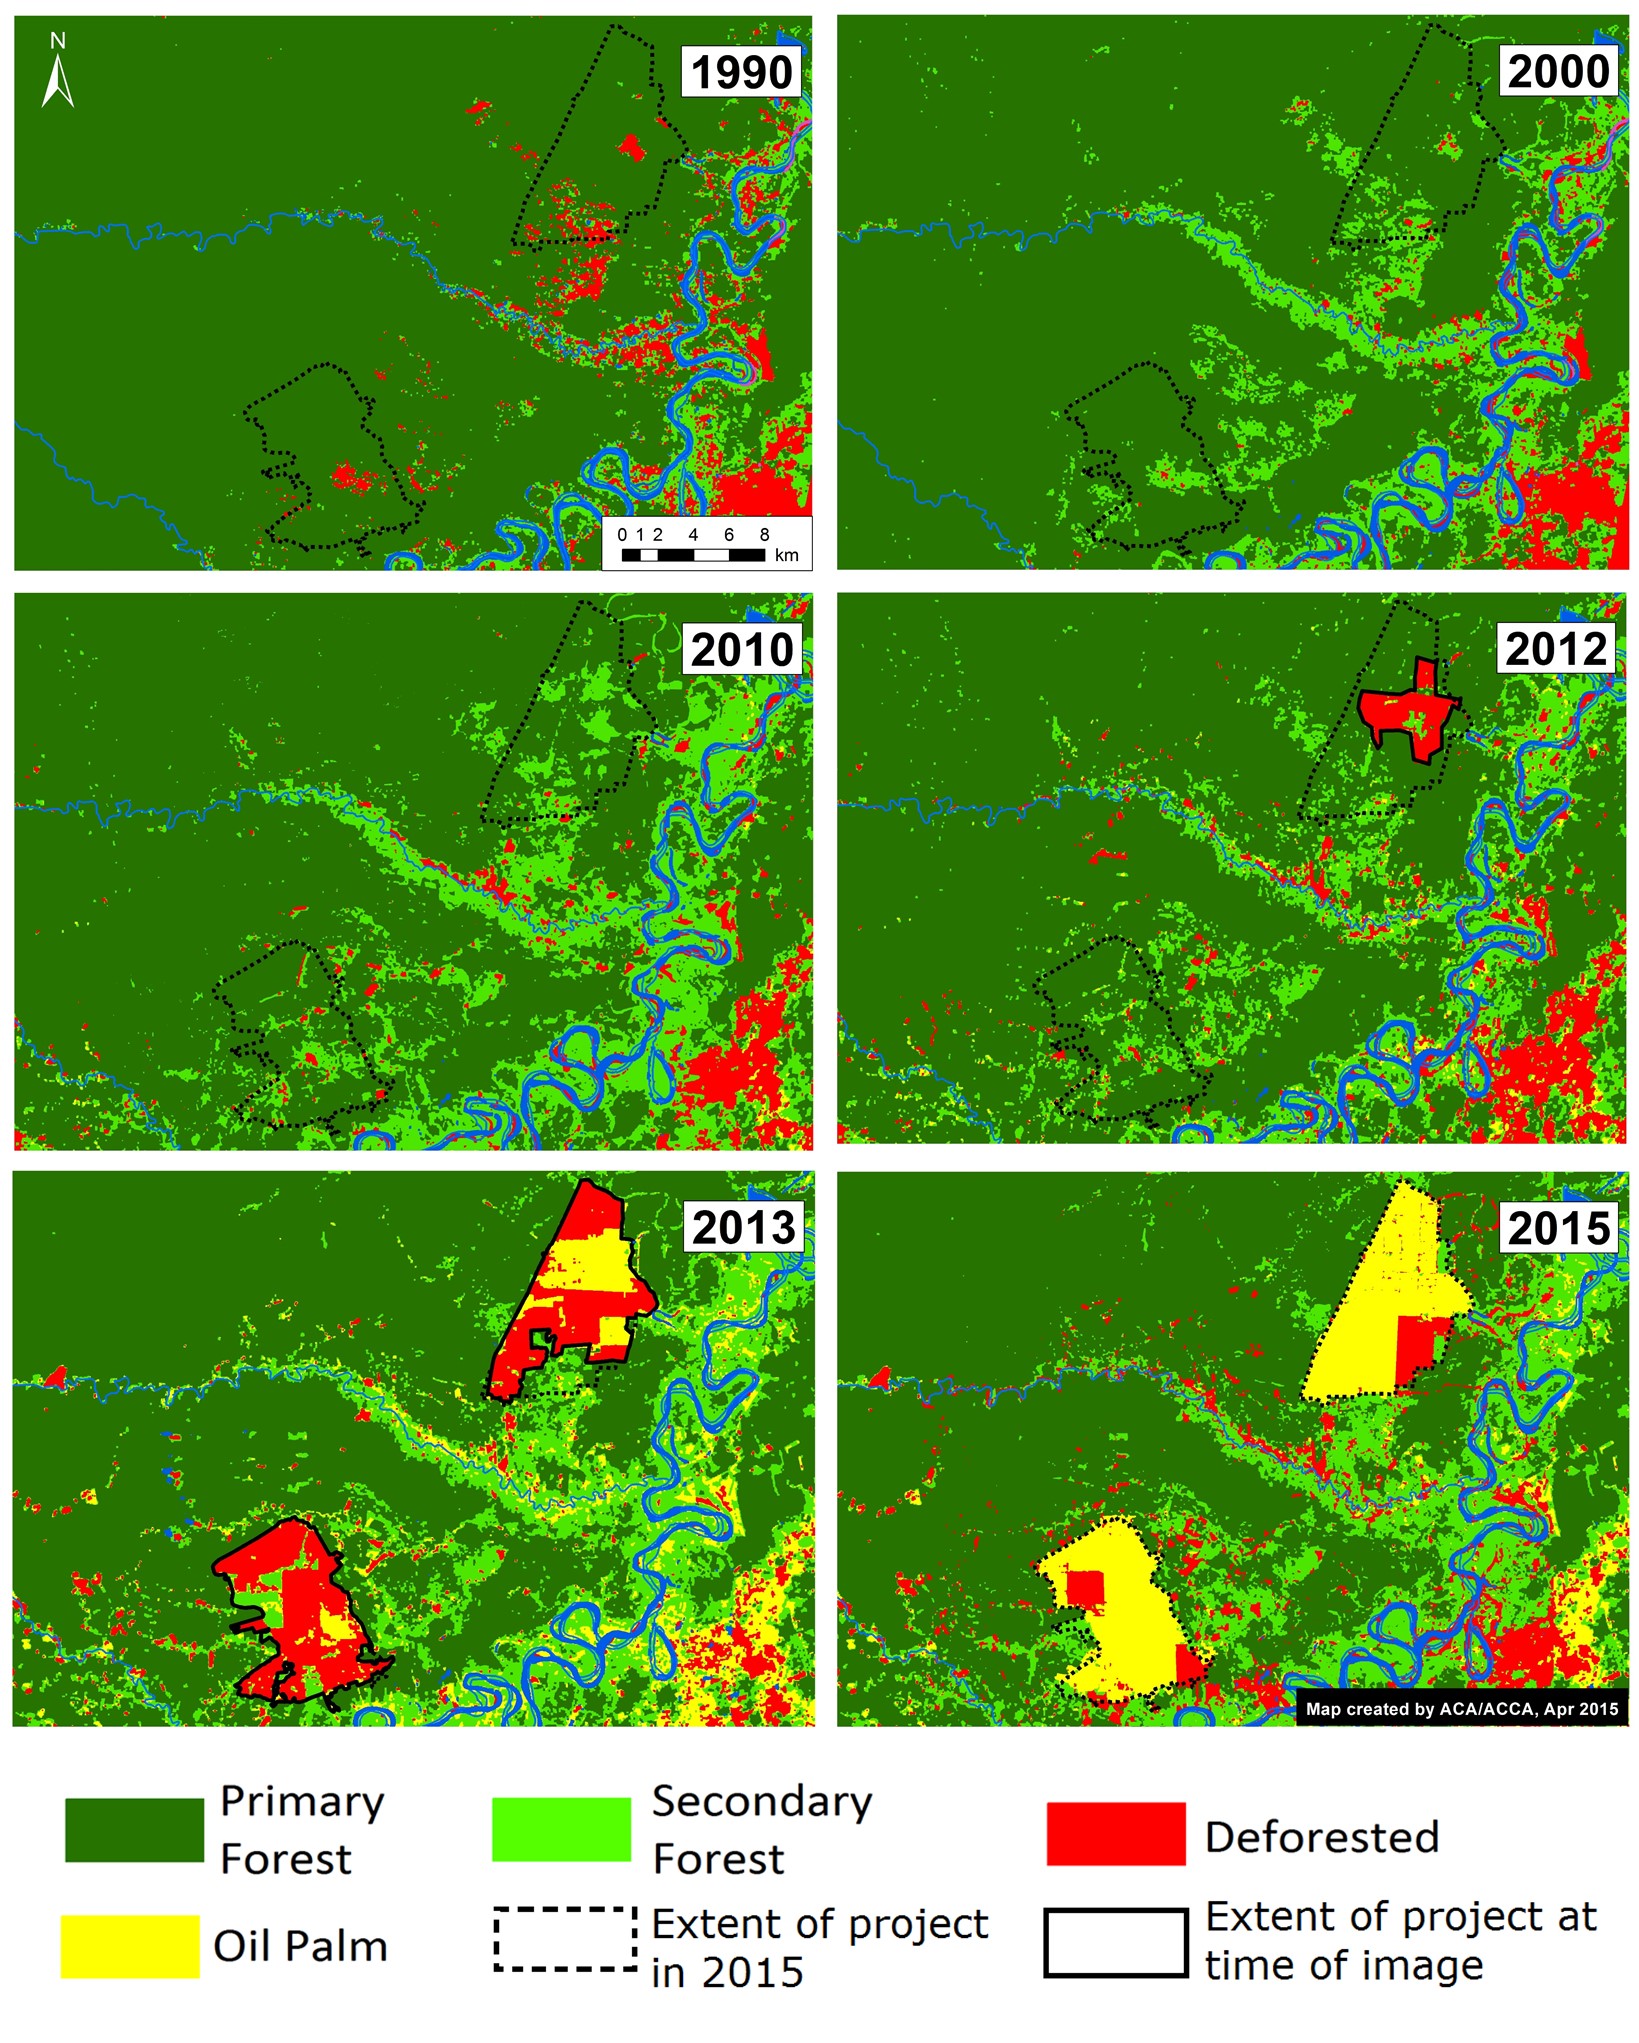
Image 4c. Landsat time-series (1990 – 2015) for both large-scale oil palm projects near Nueva Requena. Key data sources: USGS.

We conducted another Landsat time-series analysis, but going back further in time (to 1990) in order to better understand the state of the forests cleared for the oil palm project. For each image, we determined whether an area was primary forest, secondary forest, deforested, or oil palm. Image 4c illustrates the results of this analysis.

It is important to note that in 2010, just prior to the large scale clearing, the two project areas were mostly a mix of primary and secondary forest.


Deforestation of Primary Forest

NR_MAAP_4f_v4
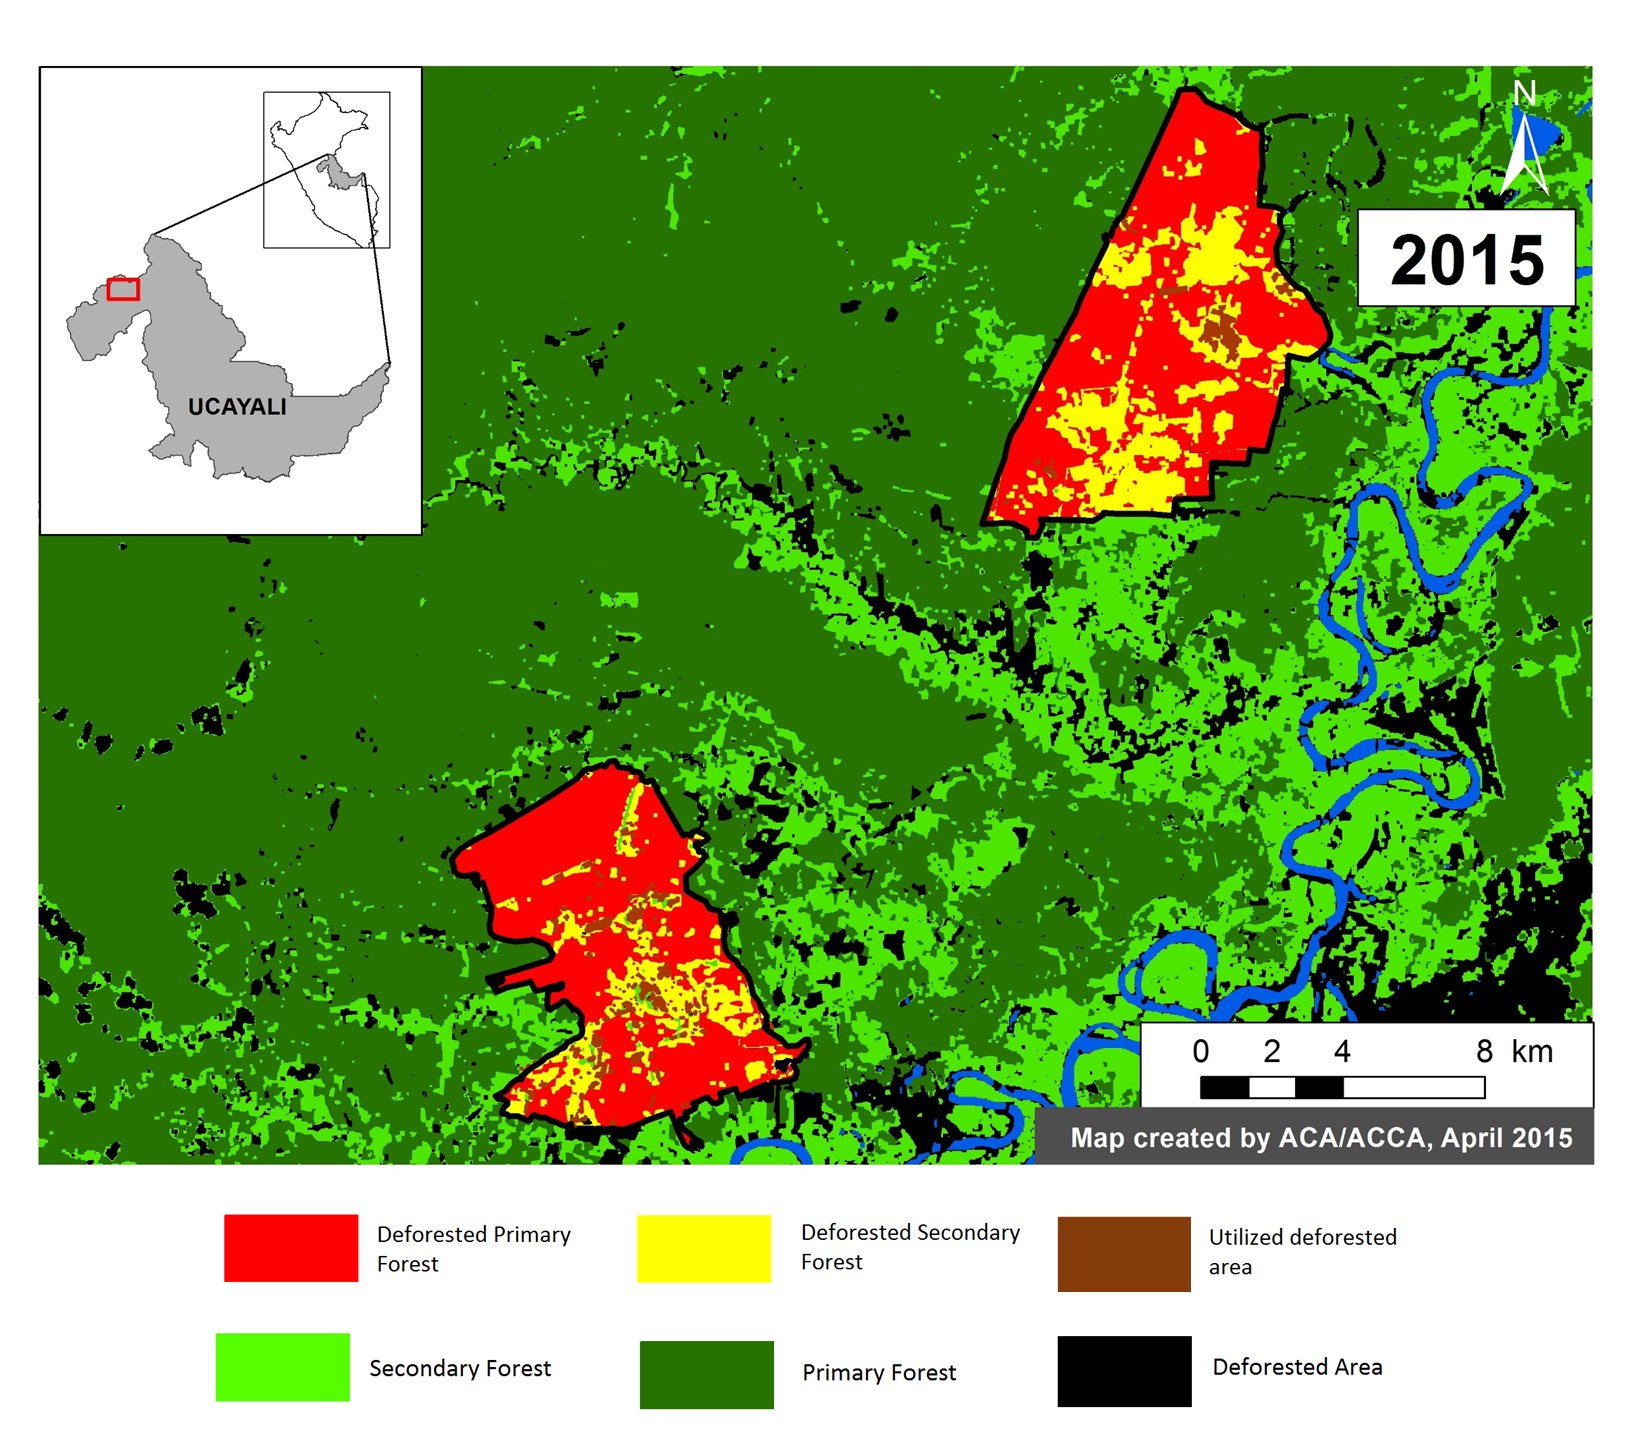
Image 4d. Classification of land use prior to oil palm activities. Key data sources: USGS.

Finally, we used the results from the Landsat time-series analysis to conduct a classification of land use prior to oil palm activities.

We determined that, of the 12,188 ha of the two oil palm projects, 9,404 ha (77%) was primary forest immediately prior to project installation. That is the equivalent to nearly 7,000 soccer fields. An additional 2,350 ha (19 %) was secondary forest. Only 434 ha (4 %) was already deforested at the start of the project.

We defined primary forest as an area that from the earliest available Landsat, in this case 1990, was characterized by dense closed canopy forest cover.


This work builds off of the following publication: Environmental Investigation Agency. Deforestation by Definition. 2015. Washington, DC. http://eia-global.org/news-media/deforestation-by-definition

Citation

Finer M, Novoa S (2015) Large-Scale Oil Palm Causes Deforestation of Primary Forest in the Peruvian Amazon (Part 1: Nueva Requena). MAAP: Image #4. Link: https://www.maapprogram.org/2015/04/image-4-oil-palm-projects-cause-deforestation-of-primary-forest-in-the-peruvian-amazon-part-1-nueva-requena/

Image #3: Detection of New (Logging?) Roads in the Peruvian Amazon

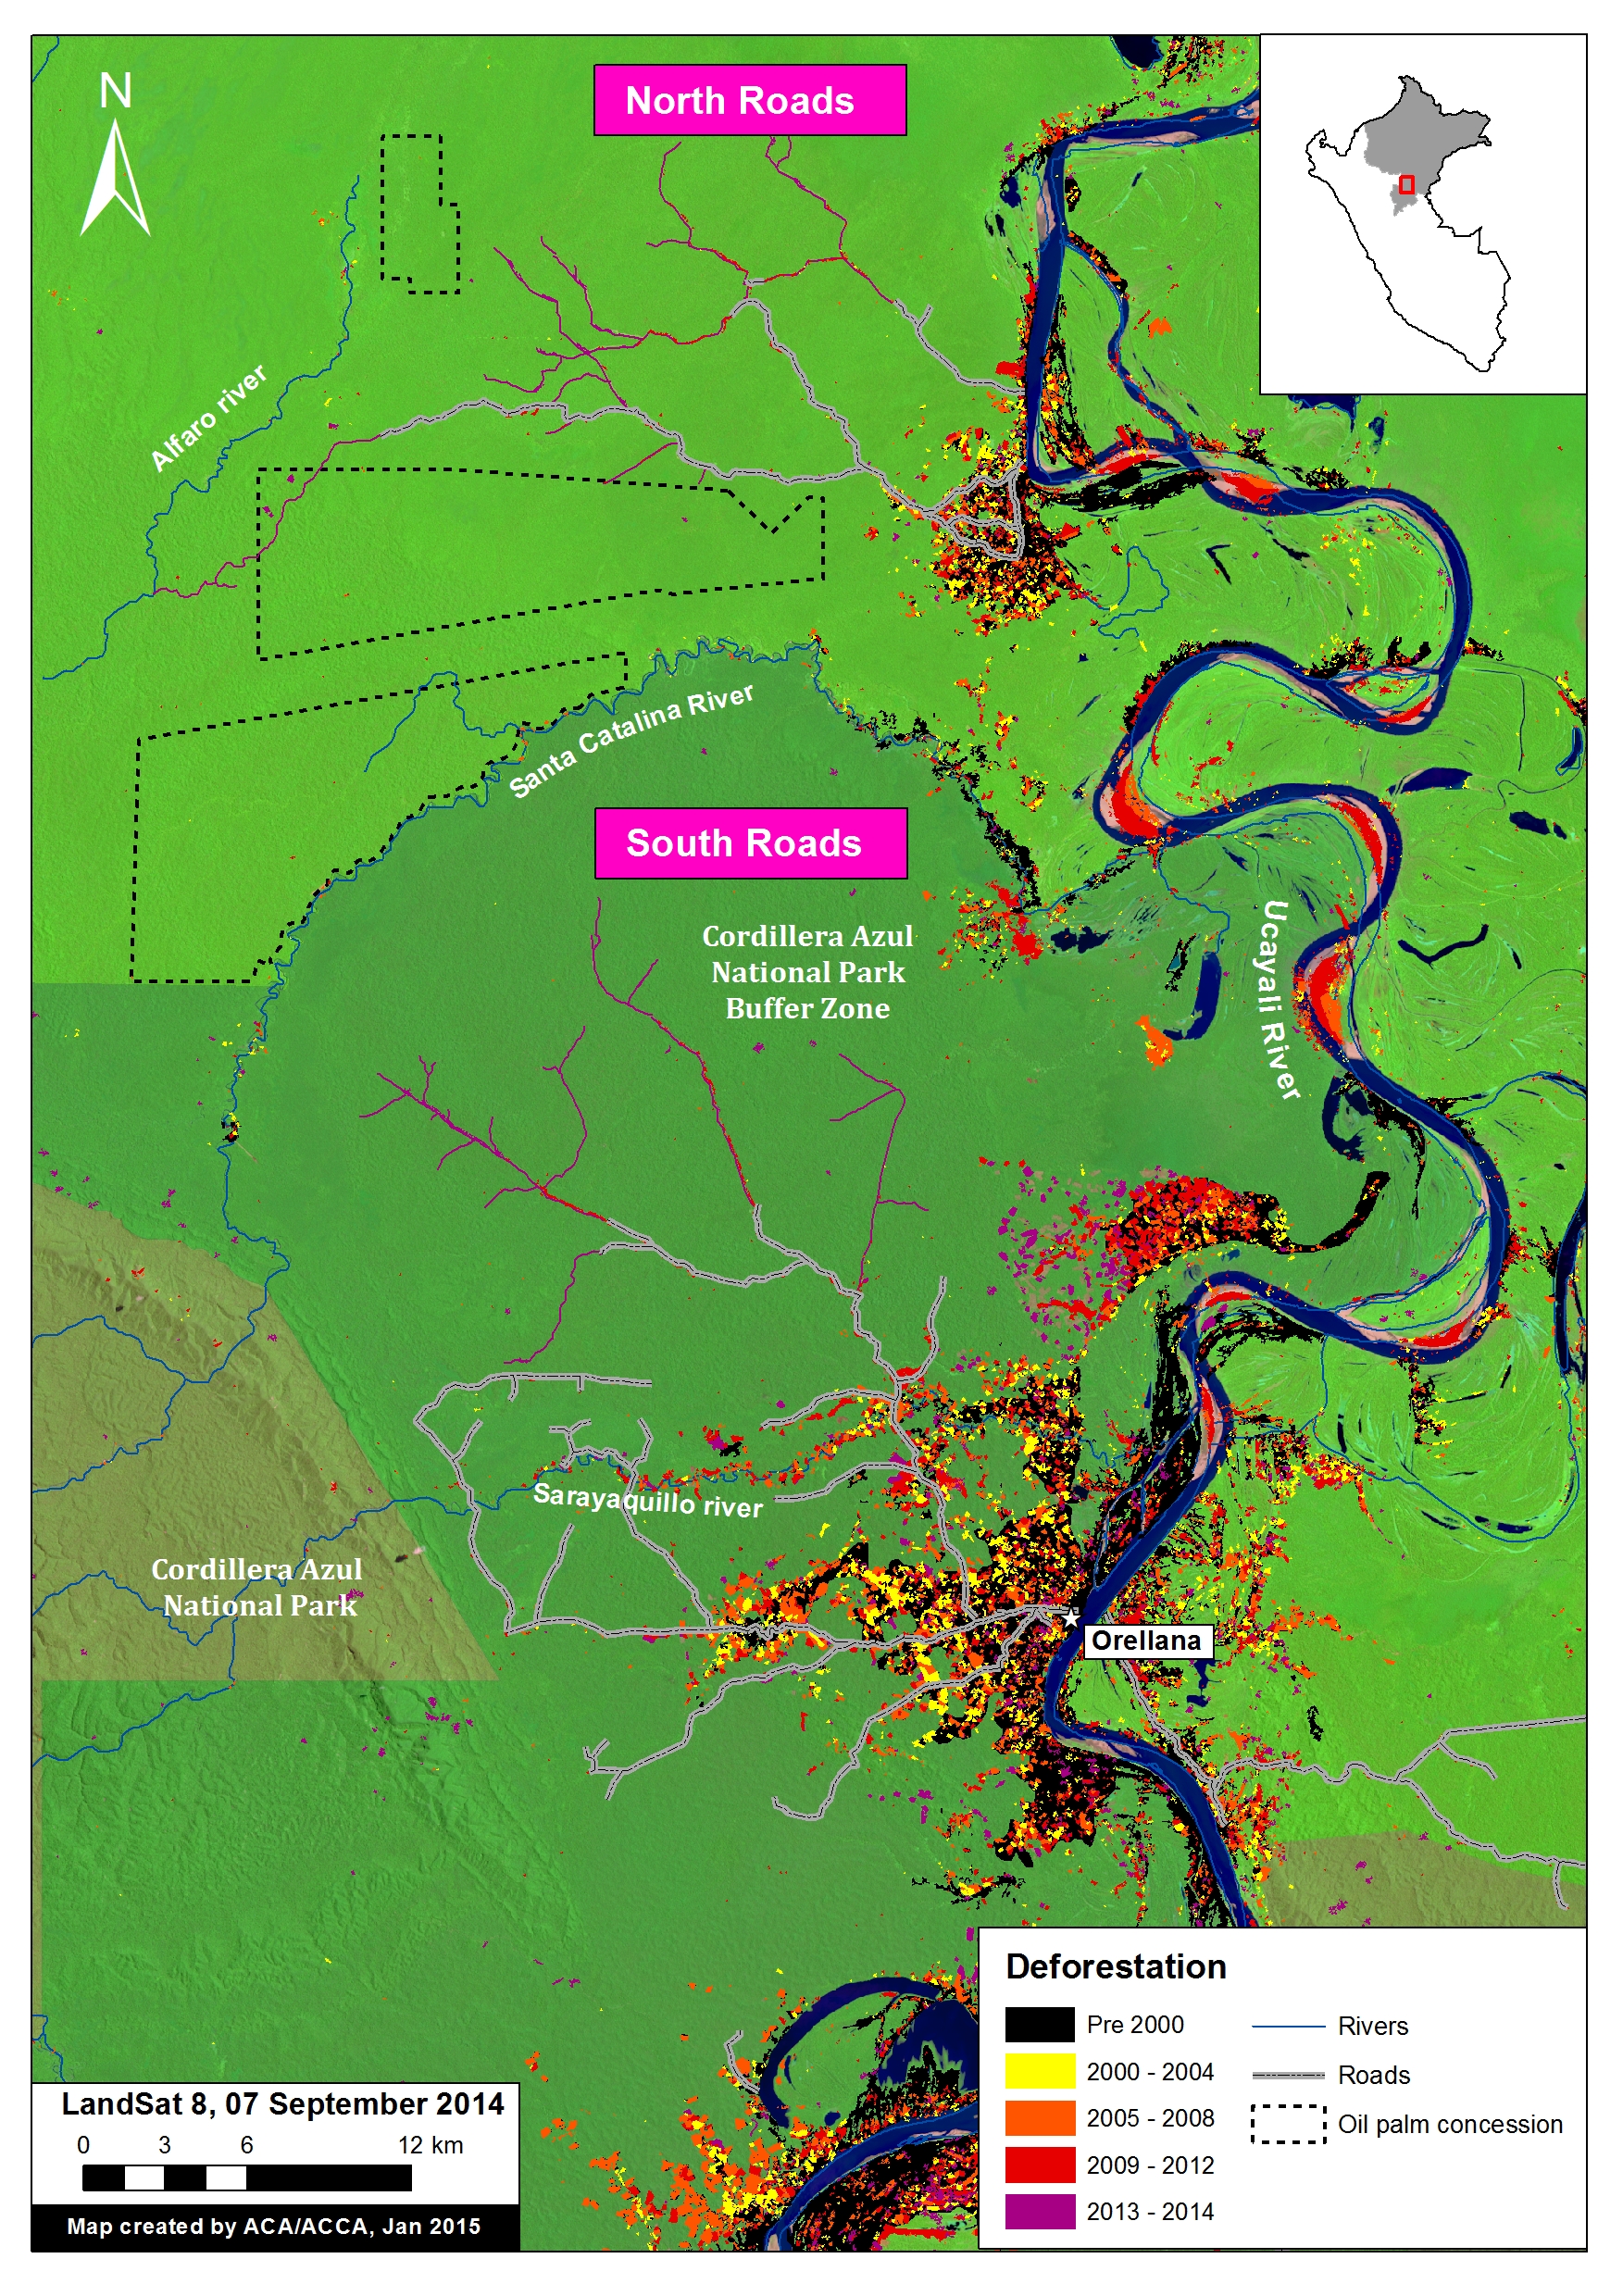
Image of the Week #3 shows the rapid proliferation of two new road networks in the northern Peruvian Amazon (Department of Loreto). Most notably, it highlights the construction of nearly 150 km of new roads, possibly illegal logging roads, through mostly primary forest between 2013 and 2014. One of the roads is within the buffer zone of the Cordillera Azul National Park.

TierraBlanca_MAAP_3a_v4
Image of the Week 3. Detection of new road construction in the northern Peruvian Amazon (Department of Loreto) Key data sources: MINAM, Hansen/UMD/Google/USGS/NASA, USGS, SERNANP, Grupo Palmas, GOREL.

Map Description

Background map is a Landsat 8 image (30 m resolution) from September 7, 2014. Green indicates forest cover. Our analysis has demonstrated that much of this forest cover is primary forestData is from USGS.

Black indicates areas that were deforested as of 2000 according to data from the Peruvian Environment Ministry. Yellow, orange, and red indicate areas that were deforested from 2000 to 2012 (each color covers a four year period) (Hansen MC et al. 2013 Science 342: 850–53; Data download).

Purple indicates areas that were deforested between 2013 and 2014 based on our analysis of Landsat imagery using CLASlite forest monitoring software. Note the two new road networks, labeled North and South, respectively, to the west of the Ucayali River.

Black dashed lines indicate planned oil palm plantations. We obtained this data from Environmental Impact Studies and the Regional Government of Loreto (GOREL).

Protected areas data is from SERNANP. Note the different shades of green to differentiate the protected area and its respective buffer zone.

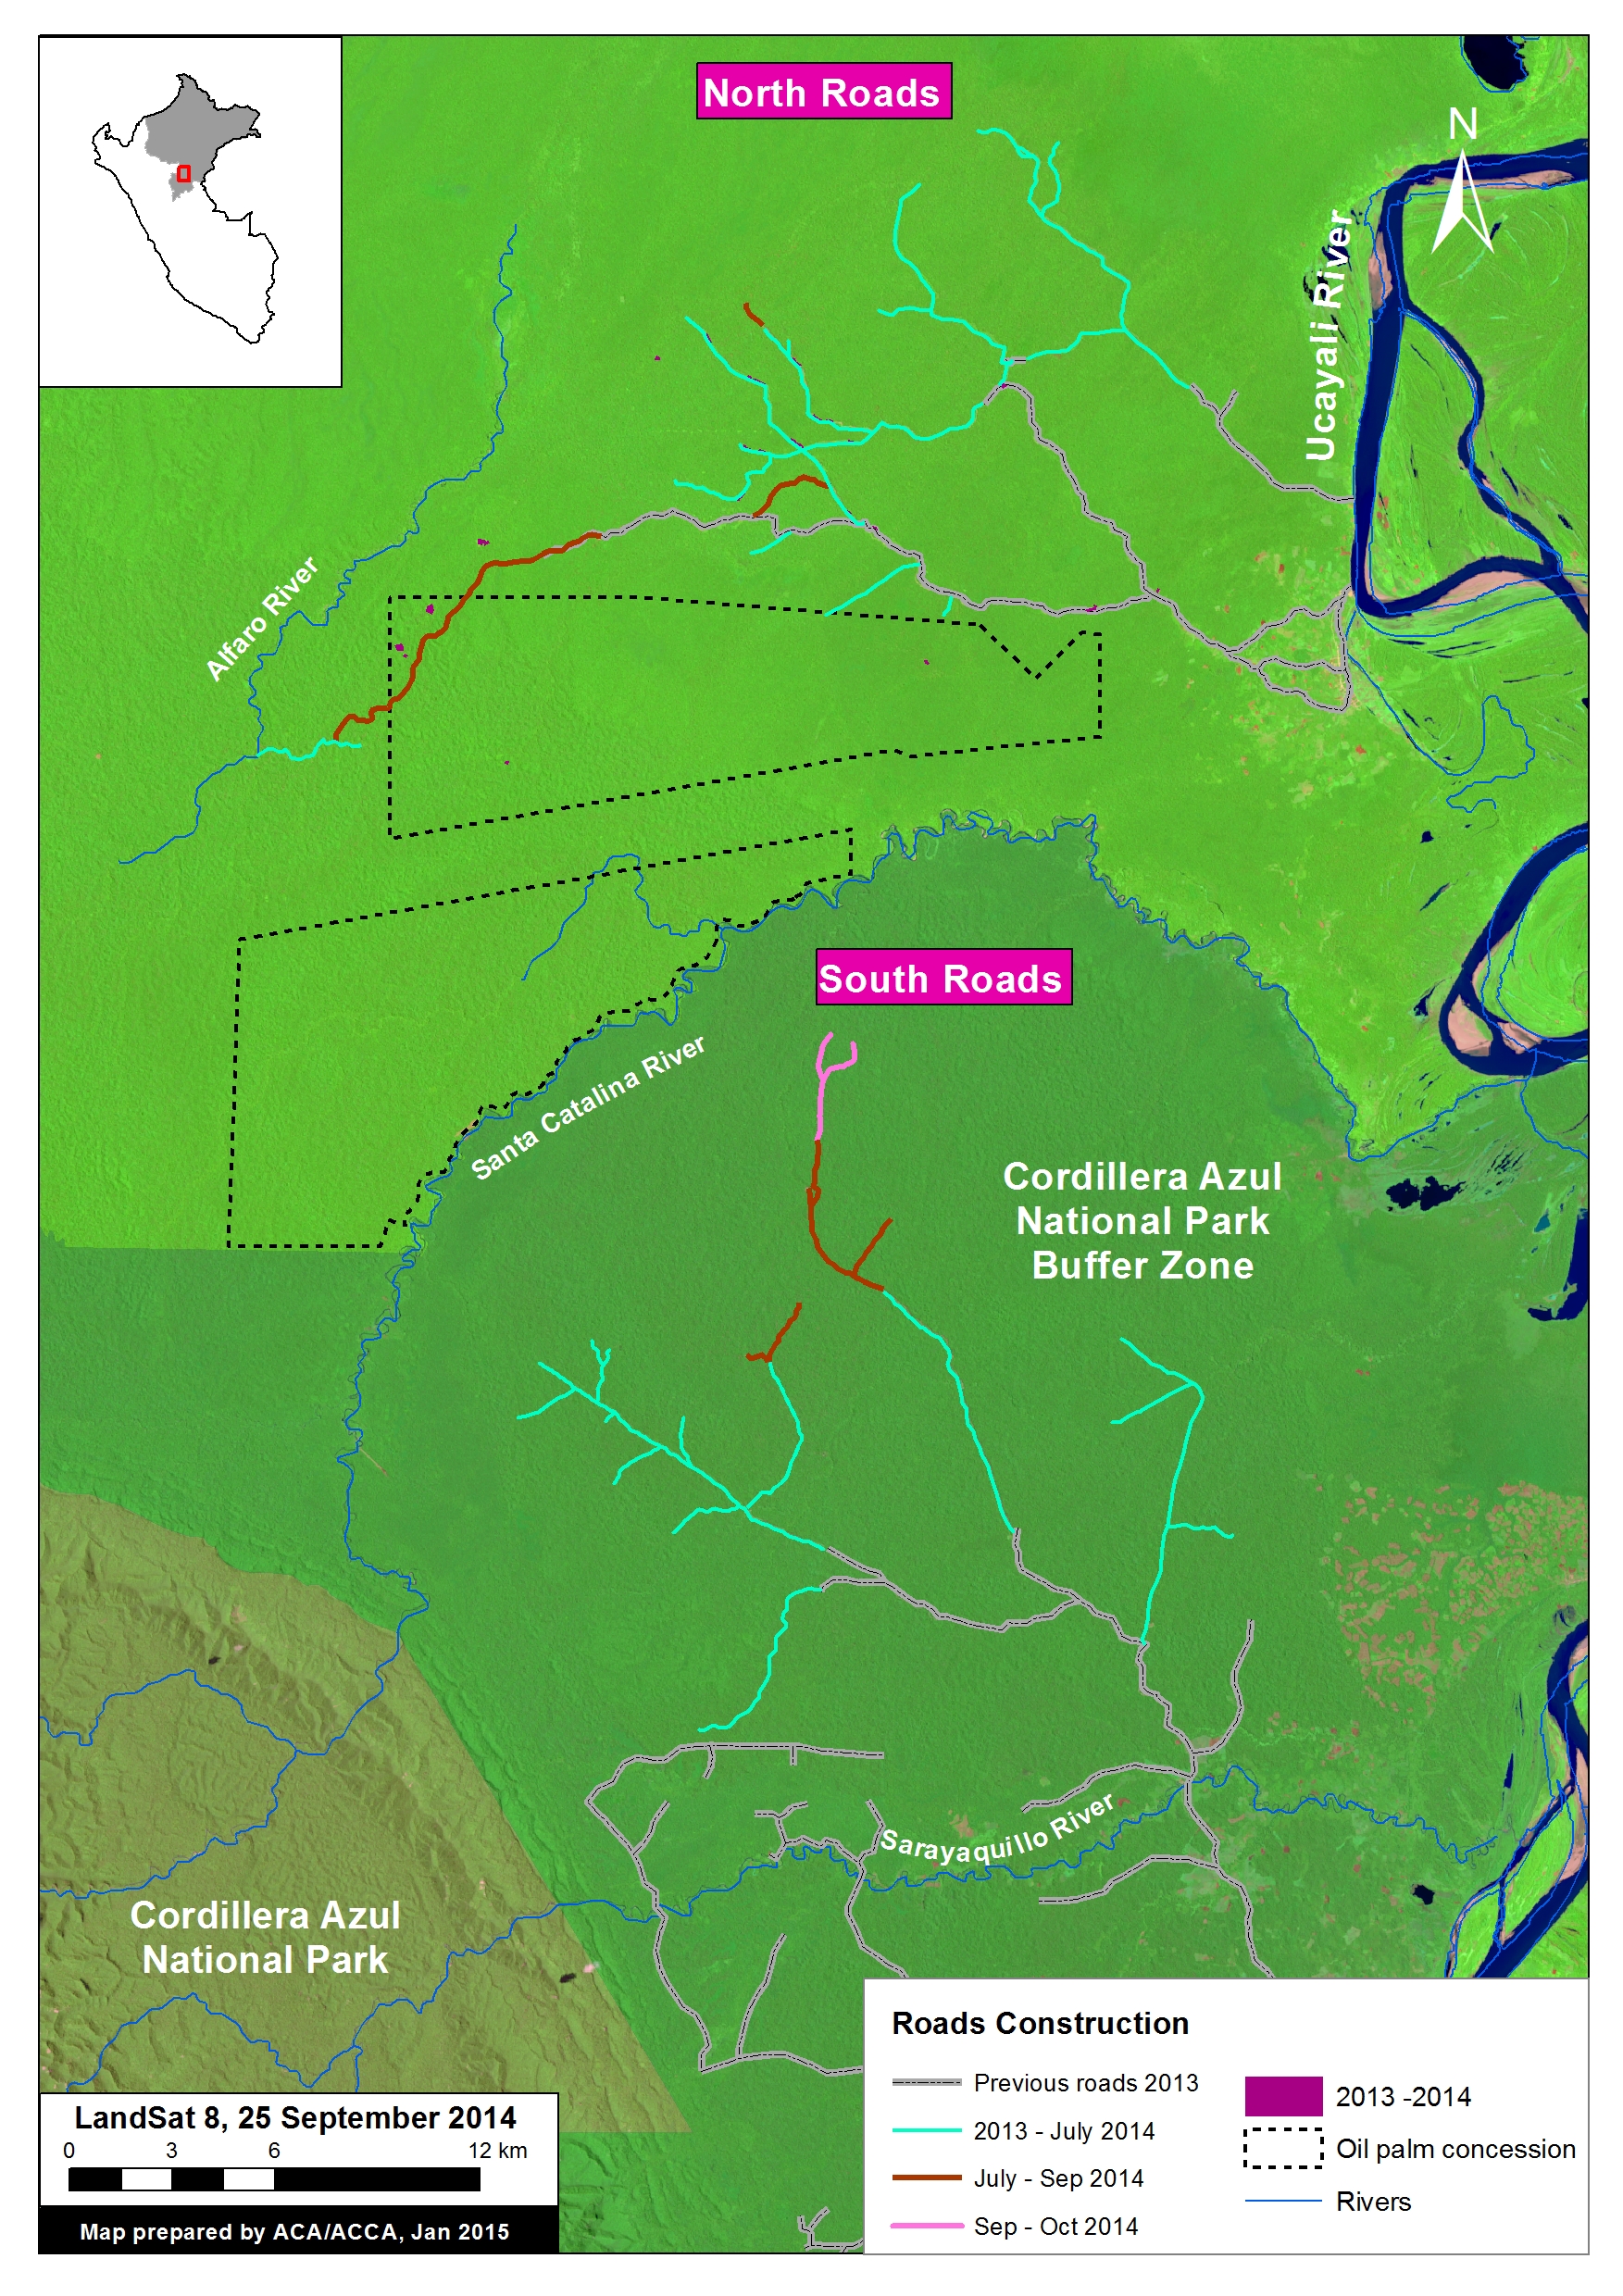
TierraBlanca_MAAP_3b_v3
Image 3b. Road construction time-series. Key data sources: USGS, SERNANP, Grupo Palmas.

Construction of New Roads

We color coded the segments of road by construction period: Grey indicates  road segments constructed between 2009 and 2012. Teal indicates road  segments constructed between January 2013 and July 2014 (117.3 km). Dark-orange   indicates road segments constructed between July and September 2014 (25.9  km). Pink indicates road segments constructed between September and October  2014 (4.8 km).

In sum, 148 km of new roads was constructed in this area between January 2013 and  October 2014 (76.24 km in south and 77.38 km in the north).

The southern network is characteristic of a logging road in that it does not have a clear destination and instead just keeps extending and branching deeper into closed-canopy forest.

The northern network is more puzzling in that it crosses a proposed palm oil concession (Grupo Romero’s Tierra Blanca project) and terminates at the Alfaro River. Also note several areas of recent deforestation near the road in the northwest corner of the oil palm concession.


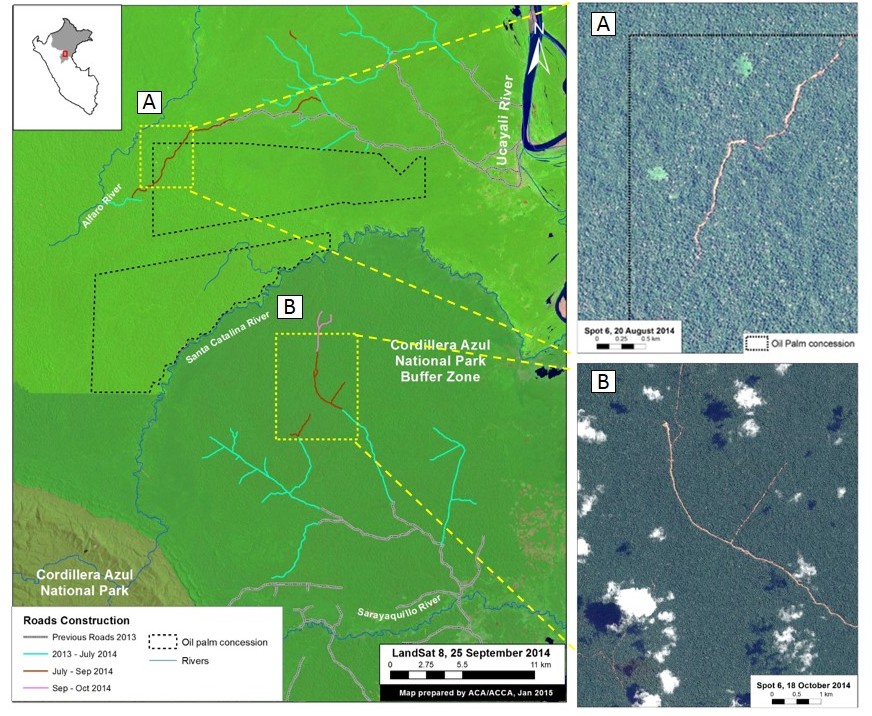
TierraBlanca_MAAP_3c_v3
Image 3c. High resolution SPOT 6 images (1.5 m resolution) of portions of the northern and southern road networks. Key data sources: USGS, SPOT 6.

High-resolution zooms

Panel A is a high resolution SPOT 6 image (1.5 m resolution) from August 2014 of a portion of the northern road network.

Panel B is a high resolution SPOT 6 image (1.5 m resolution) from October 2014 of a portion of the southern road network.


Citation

Finer M, Novoa S (2015) Detection of New (Logging?) Roads in the Peruvian Amazon. MAAP: Image #3. Link: https://www.maapprogram.org/2015/04/detection-of-new-road-construction-in-southern-loreto-peru/

Mining News Watch #15

Report #15 // January 28, 2015 – March 17, 2015

Top Stories

  • Antonio Fernández Jeri has been appointed as the new High Commissioner of Mining Formalization and the Interdiction of Illegal Mining.

  • The Amazon Conservation Association issued a new map showing that gold mining-driven deforestation grew by 226.5 hectares between October 2014 and February 2015 in the buffer zone of the Tambopata National Reserve.

  • A new report found that miners from Ecuador are using a series of underground tunnels to smuggle illegal gold from the Amazonas department of Peru.

Deforestation

  • A new analysis conducted by the Amazon Conservation Association (ACA) found that, despite government efforts to crack down on illegal gold mining, mining-driven deforestation in the buffer zone of the Tambopata National Reserve in Madre de Dios grew by 226.5 hectares between October 2014 and February 2015.[1] This deforestation is the equivalent of 310 soccer fields in just four months.

Formalization Process

  • The Presidency of the Council of Ministers (PCM) appointed Antonio Fernández Jeri as the new High Commissioner of Mining Formalization and the Interdiction of Illegal Mining. Fernández is the third person to hold this title, following Augusto Soto Castagnola and Daniel Urresti. He is now responsible for coordinating and overseeing the implementation of the national strategy to combat illegal mining.[2]
  • More than 2,000 informal miners met in Arequipa to demand a more efficient formalization strategy, under the leadership of economist Hernando de Soto of the Institute for Liberty and Democracy (ILD), a think-tank that focuses on helping developing countries modernize their economies. The new “true formalization” process will supposedly be more supportive of miners enrolled in the process and will include a plan to protect and remediate the environment. In contrast to the present formalization process, the plan will also contain different procedures for miners depending on region (coast, mountains, or rainforest). The proposal is set to be completed in 45 days and then sent to the Executive for approval.[3,4]
  • The regional president of Madre de Dios, Luis Otsuka, met with Peruvian President Ollanta Humala to address the issue of mining formalization. Prior to the meeting, the general manager of the regional government of Madre de Dios declared the process a “failure” in need of “integral revision.”[5] Otsuka reported that the first meeting with Humala yielded positive results in that the two leaders definitively agreed that the formalization process must be amended in order for “real” formalization to occur.[6] More concrete changes will likely develop out of further meetings, during which Otsuka hinted that the two will discuss amending Supreme Decree 016-2014, a controversial law regulating fuel supply, which Otsuka says negatively affects the region’s economy.[7]
  • To date, only eight mining companies have successfully completed the formalization process in Peru, all in the department of Puno. Around 70,000 miners initially registered for formalization.[8] Still, no informal miners have been formalized in Madre de Dios.
  • The Public Defender (Defensoría del Pueblo) analyzed the efficacy of the government’s strategies to eliminate illegal mining, including formalization and remediation of the environment. It found that the most significant difficulties were minimal budget dedicated to formalization, lack of qualified leaders and personnel, inadequate planning, and insufficient supervision.[9]

Illegal Gold Smuggling

  • A report aired on Peruvian news program Panorama showing that illegal miners from Ecuador are extracting gold from Peruvian territory in the Amazonas department through a series of 150 underground tunnels which are up to two kilometers long. The tunnels are used both to extract gold and to transport it illegally, and are used by both Peruvian and Ecuadorian miners.[10] The government plans to intervene in the area through raids on illegal mining operations and inspections of key checkpoints in the area.[11,12]
  • The President of the Central Reserve Bank of Peru denounced Bolivia for exporting US$1 billion more in gold in 2014 than the country has the capacity to produce. Analysts suspect that the gold was sourced illegally from Peru and then smuggled over the border due to inadequate customs control.[13]

Mercury Regulation

  • A new peer-reviewed study by the Royal Society of Chemistry found that mercury pollution from illegal mining sites moves rapidly downstream and can impact communities as least 560 kilometers (350 miles) away. According to the study, communities along the Madre de Dios River and its tributaries are at risk and should avoid regular consumption of carnivorous fish.[14,15]
  • The Alliance for Responsible Mining (ARM) has developed a new “fairmined” mining standard in an effort to promote sustainable mining. Currently, the AURELSA mine in Madre de Dios is one of the only companies in Peru to achieve the fairmined standard. To get the fairmined certification, a mining company must reduce their mercury emissions by 60 to 90 percent, ensure that chemical waste is disposed of safely, and guarantee worker’s rights. Buyers of fairmined gold pay a premium of ten percent which is then reinvested in the company and the interests of the local community.[16]

Other

  • Inspectors from the National Customs and Tax Administration (Sunat) seized 2,507 gallons of diesel fuel that was being transported along the Inambari River in Madre de Dios without the required documentation, destined for illegal mining operations.[17] A second seizure occurred a few weeks later, coordinated by the regional police and Sunat, during which 1,800 gallons of fuel were confiscated along the Madre de Dios River.[18] Sunat says it has increased its operational actions along the rivers and tributaries in the region.
  • The Magistrate Control Office (OCMA) found that the chief judge and president of the Court of Madre de Dios, John Russel Hurtado Centeno, was running an illegal mining camp called “Guadalupe” while simultaneously serving in the court system. He has been suspended indefinitely from his position while investigations continue.[19]
  • The Peruvian government found that gold production in the country fell by 6.7% in 2014 relative to 2013, yet Peru is still the sixth largest gold producer globally. The decrease is likely due to lower production in the largest mine in the country, Yanacocha.[20] Additionally, it is estimated that gold production in Madre de Dios will fall by 20% in 2015, largely due to the government’s offensive on illegal mining in the region.[21]

Notes: The ACA Mining News Watch focuses mostly on issues pertaining to the Peruvian Amazon and may not cover issues related to non-Amazonian parts of the country. We would like to credit ProNaturaleza’s “Observatorio Amazonia” as our primary resource for articles related to illegal mining in Peru.

Featured image credit: Gobierno Regional de Madre de Dios GOREMAD

Download the complete report in PDF

MAAP #2: Large-scale Forest Clearing for Cacao in Tamshiyacu, Peru

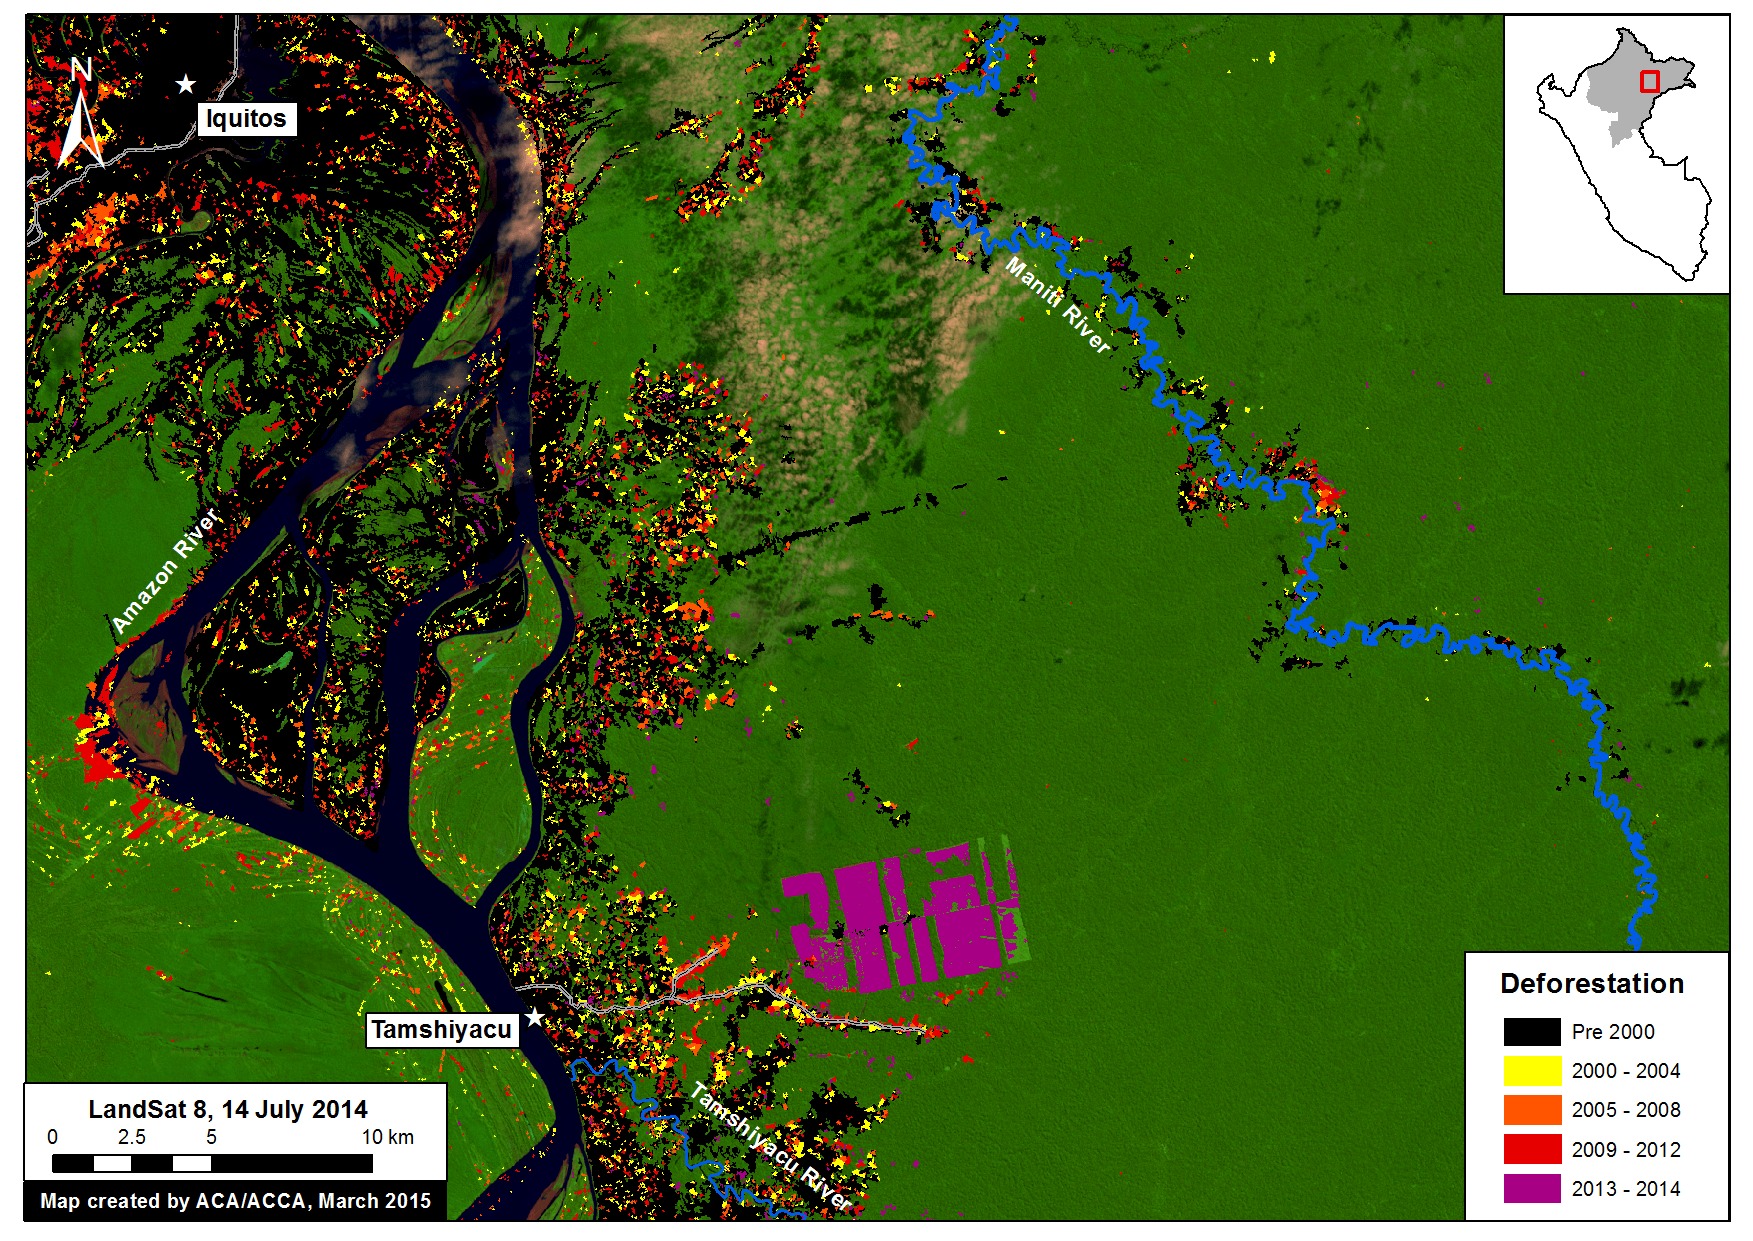
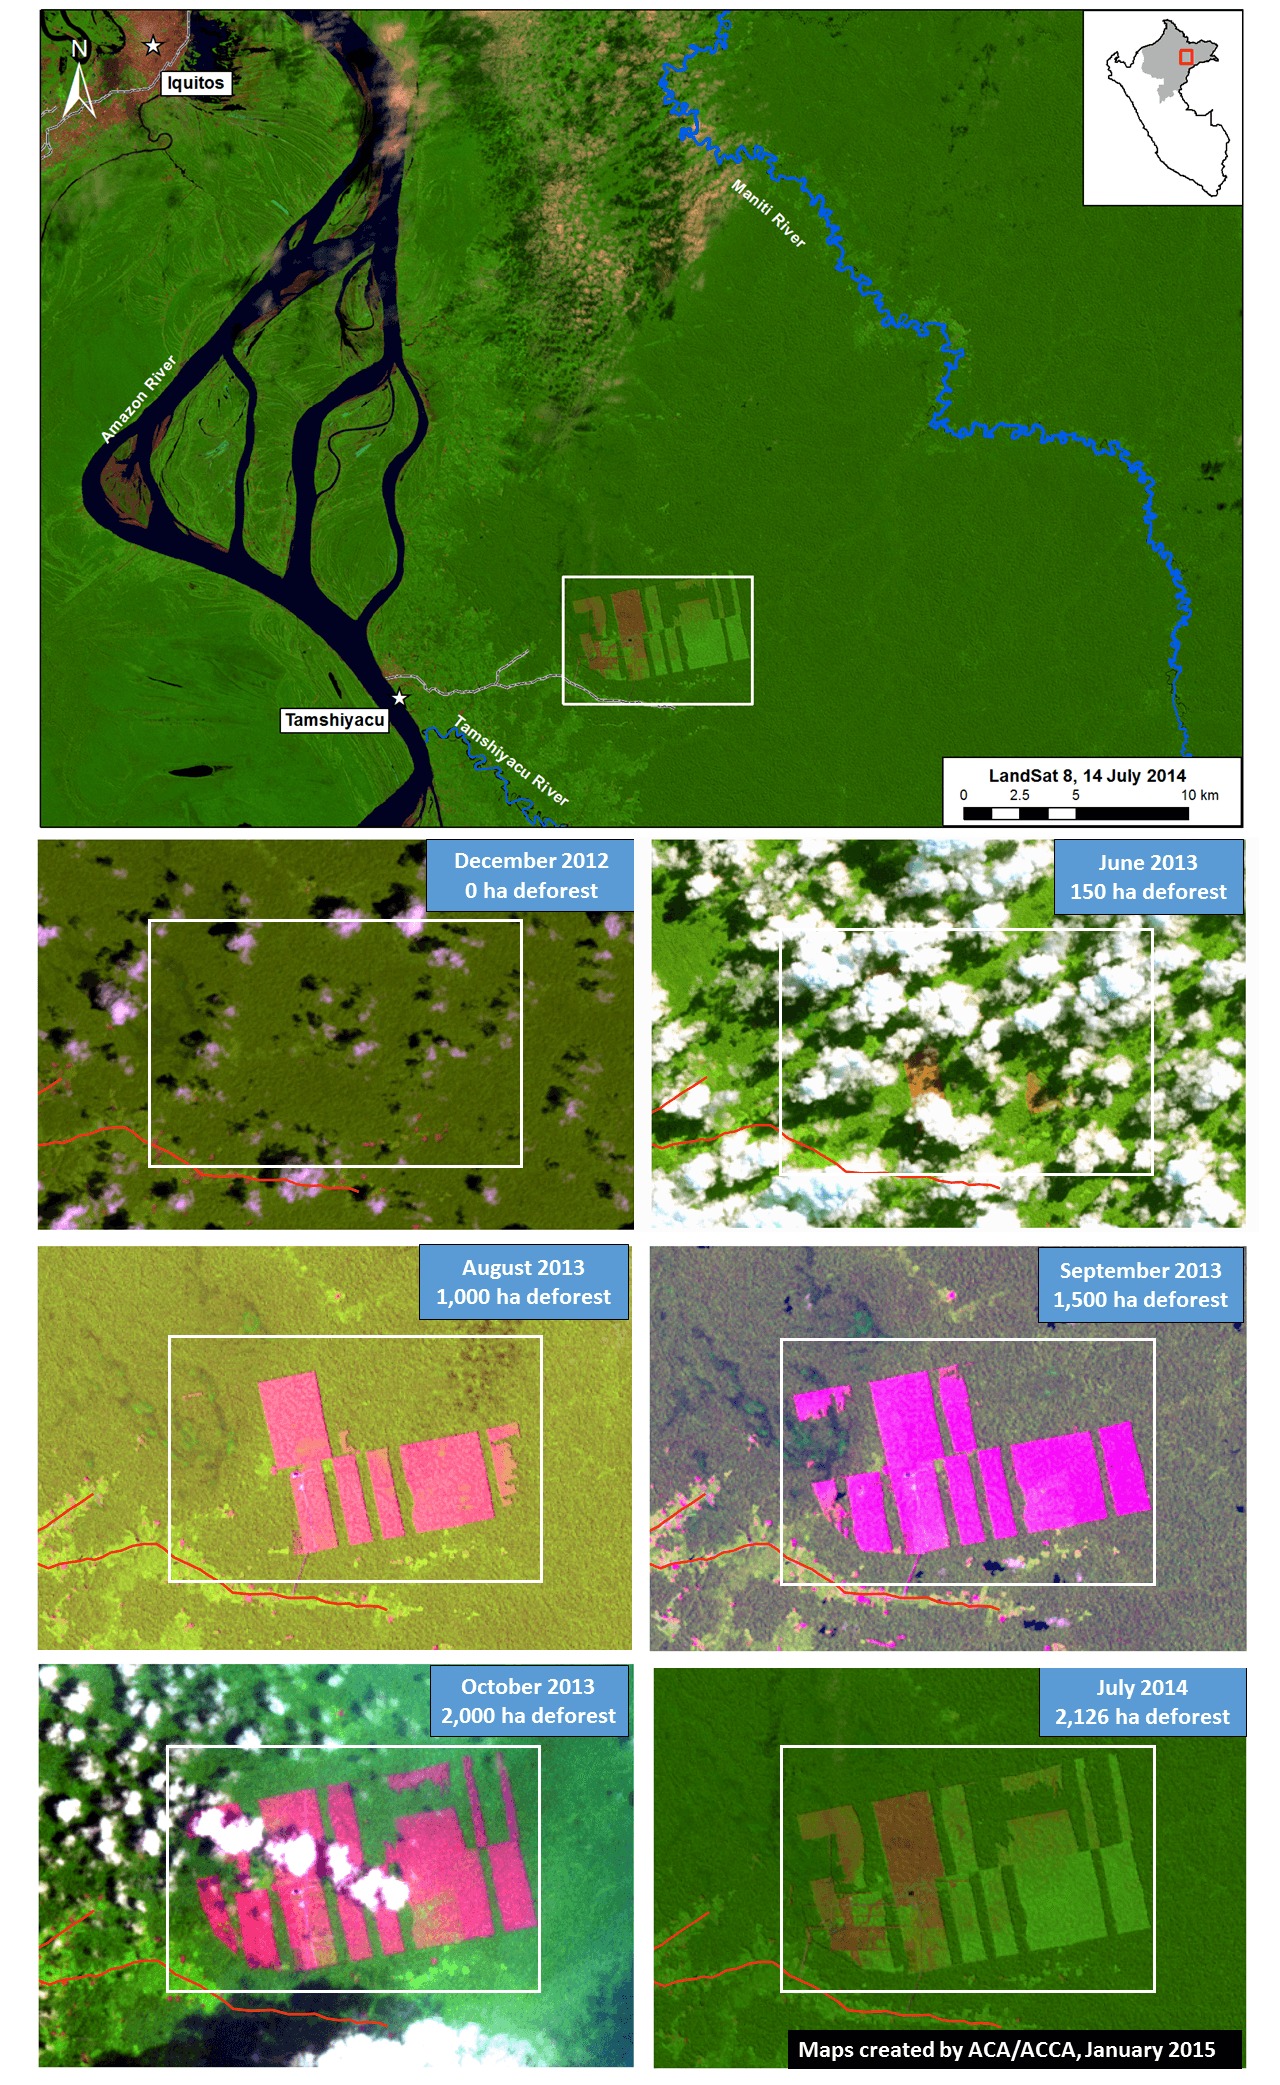
Image of the Week #2 shows the recent and rapid forest clearing for a new cacao project outside of the town of Tamshiyacu in the northern Peruvian Amazon (Department of Loreto). Specifically, we found that over 2,100 hectares (ha) were cleared between May 2013 and August 2014 in an area known as Fundo Tamshiyacu.

Tamshiyacu_MAAP_Mapa_3a_v6
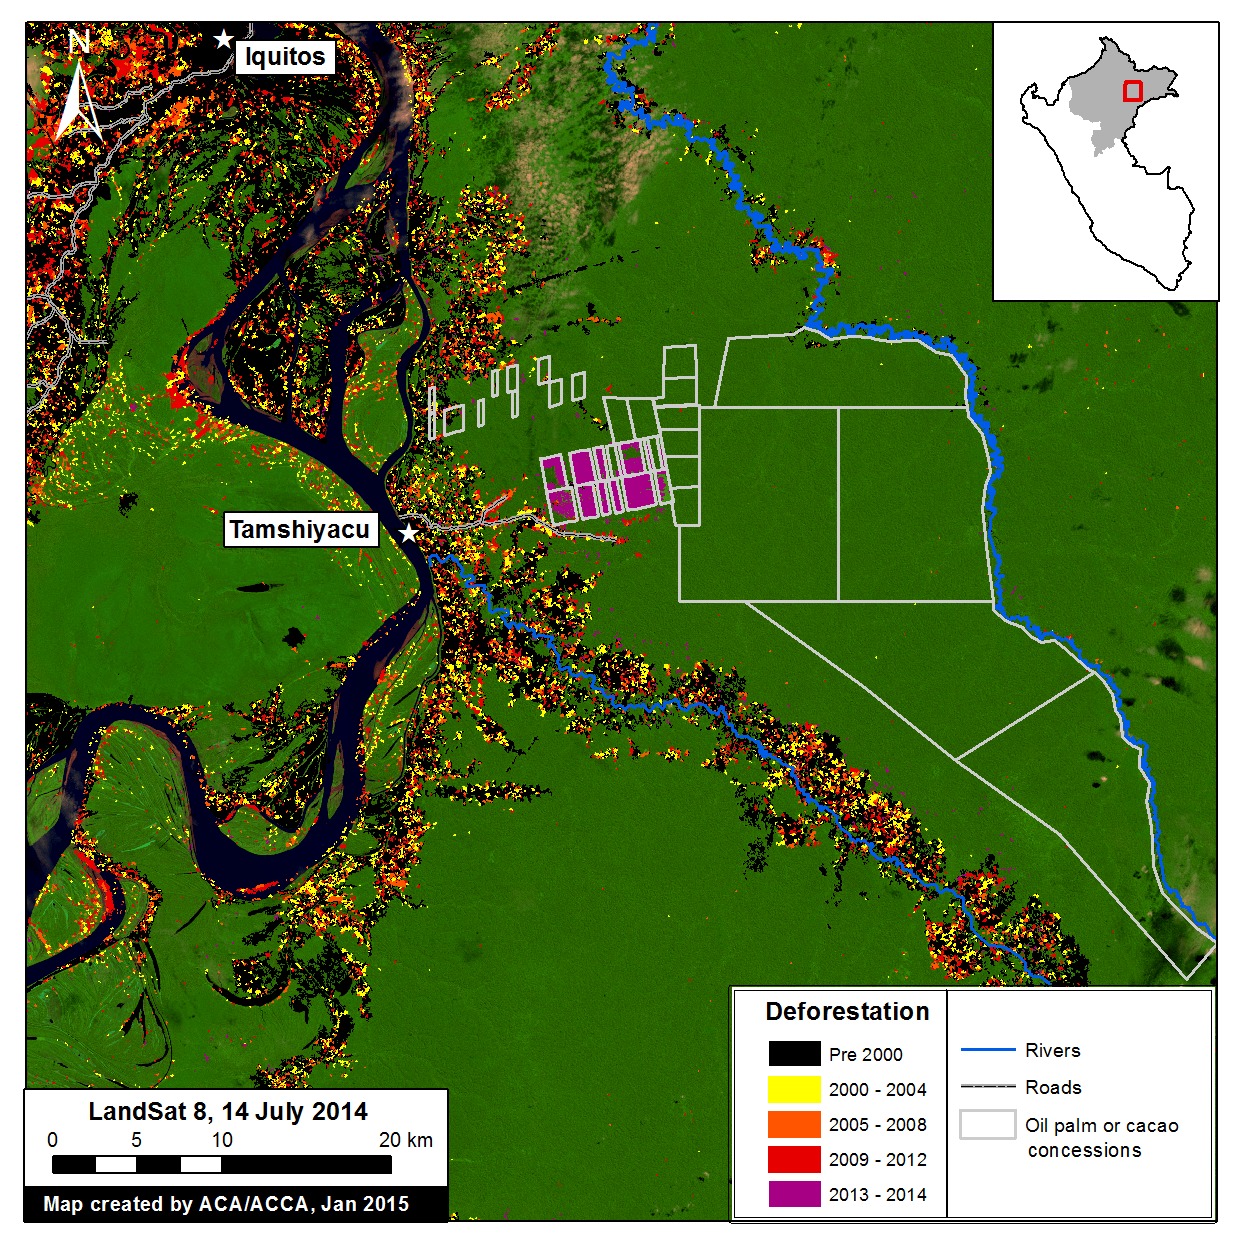
Image of the Week 2a. Rapid clearing for large-scale agriculture in Tamshiyacu (Loreto, Peru). Key data sources: MINAM, Hansen/UMD/Google/USGS/NASA, USGS.

Map Description 

Background map is a Landsat 8 image (30 m resolution) from July 14, 2014. Green indicates forest cover. Note there is some cloud cover. Data is from USGS.

Black indicates areas that were cleared as of 2000 according to data from the Peruvian Environment Ministry (MINAM 2009). Yellow, orange, and red indicate areas that were cleared from 2000 to 2012 (each color covers a four year period) (Hansen MC et al. 2013 Science 342: 850–53; Data download).

Purple indicates areas that were cleared in 2013 and 2014 based on our analysis of Landsat imagery using CLASlite forest monitoring softwareUsing CLASlite, we found that 2,126 ha were cleared between May 2013 and August 2014 in the cacao project area known as Fundo Tamshiyacu. That is the equivalent to 2,900 soccer fields.

See this article published on mongabay.com for more information on the company that carried out the forest clearing (United Cacao, through its subsidiary in Peru, Cacao del Peru Norte). See this article, also published on mongabay, for more information on the legality of the forest clearing.

Landsat Time-series

Tamshiyacu_MAAP_Mapa_3b_v4
Image 2b. Results of Landsat time series analysis, December 2012 – August 2014. Key sources: USGS.

Image 2b is a series of Landsat images (30 meter resolution) of the recently cleared area that illustrates how the forest clearing unfolded.

In December 2012, the area was predominantly covered by closed-canopy forest.

In June 2013, although the image is cloudy, we detected the first signs of major forest clearing (about 150 ha).

In August 2013, a cloud-free image clearly revealed that forest clearing jumped to 1,000 ha.

Subsequent images in September and October 2013 revealed that forest clearing continued to 1,500 ha and 2,000 ha, respectively.

During the peak clearing between June and September 2013, the clearing rate was approximately 100 ha per week.

The forest clearing halted between November 2013 and June 2014, but in July 2014 we detected some new clearing. This additional clearing in 2014 raised the total cleared area to 2,126 ha.


Cutting Primary Forest 

Tamshiyacu_MAAP_Mapa_3c_v2
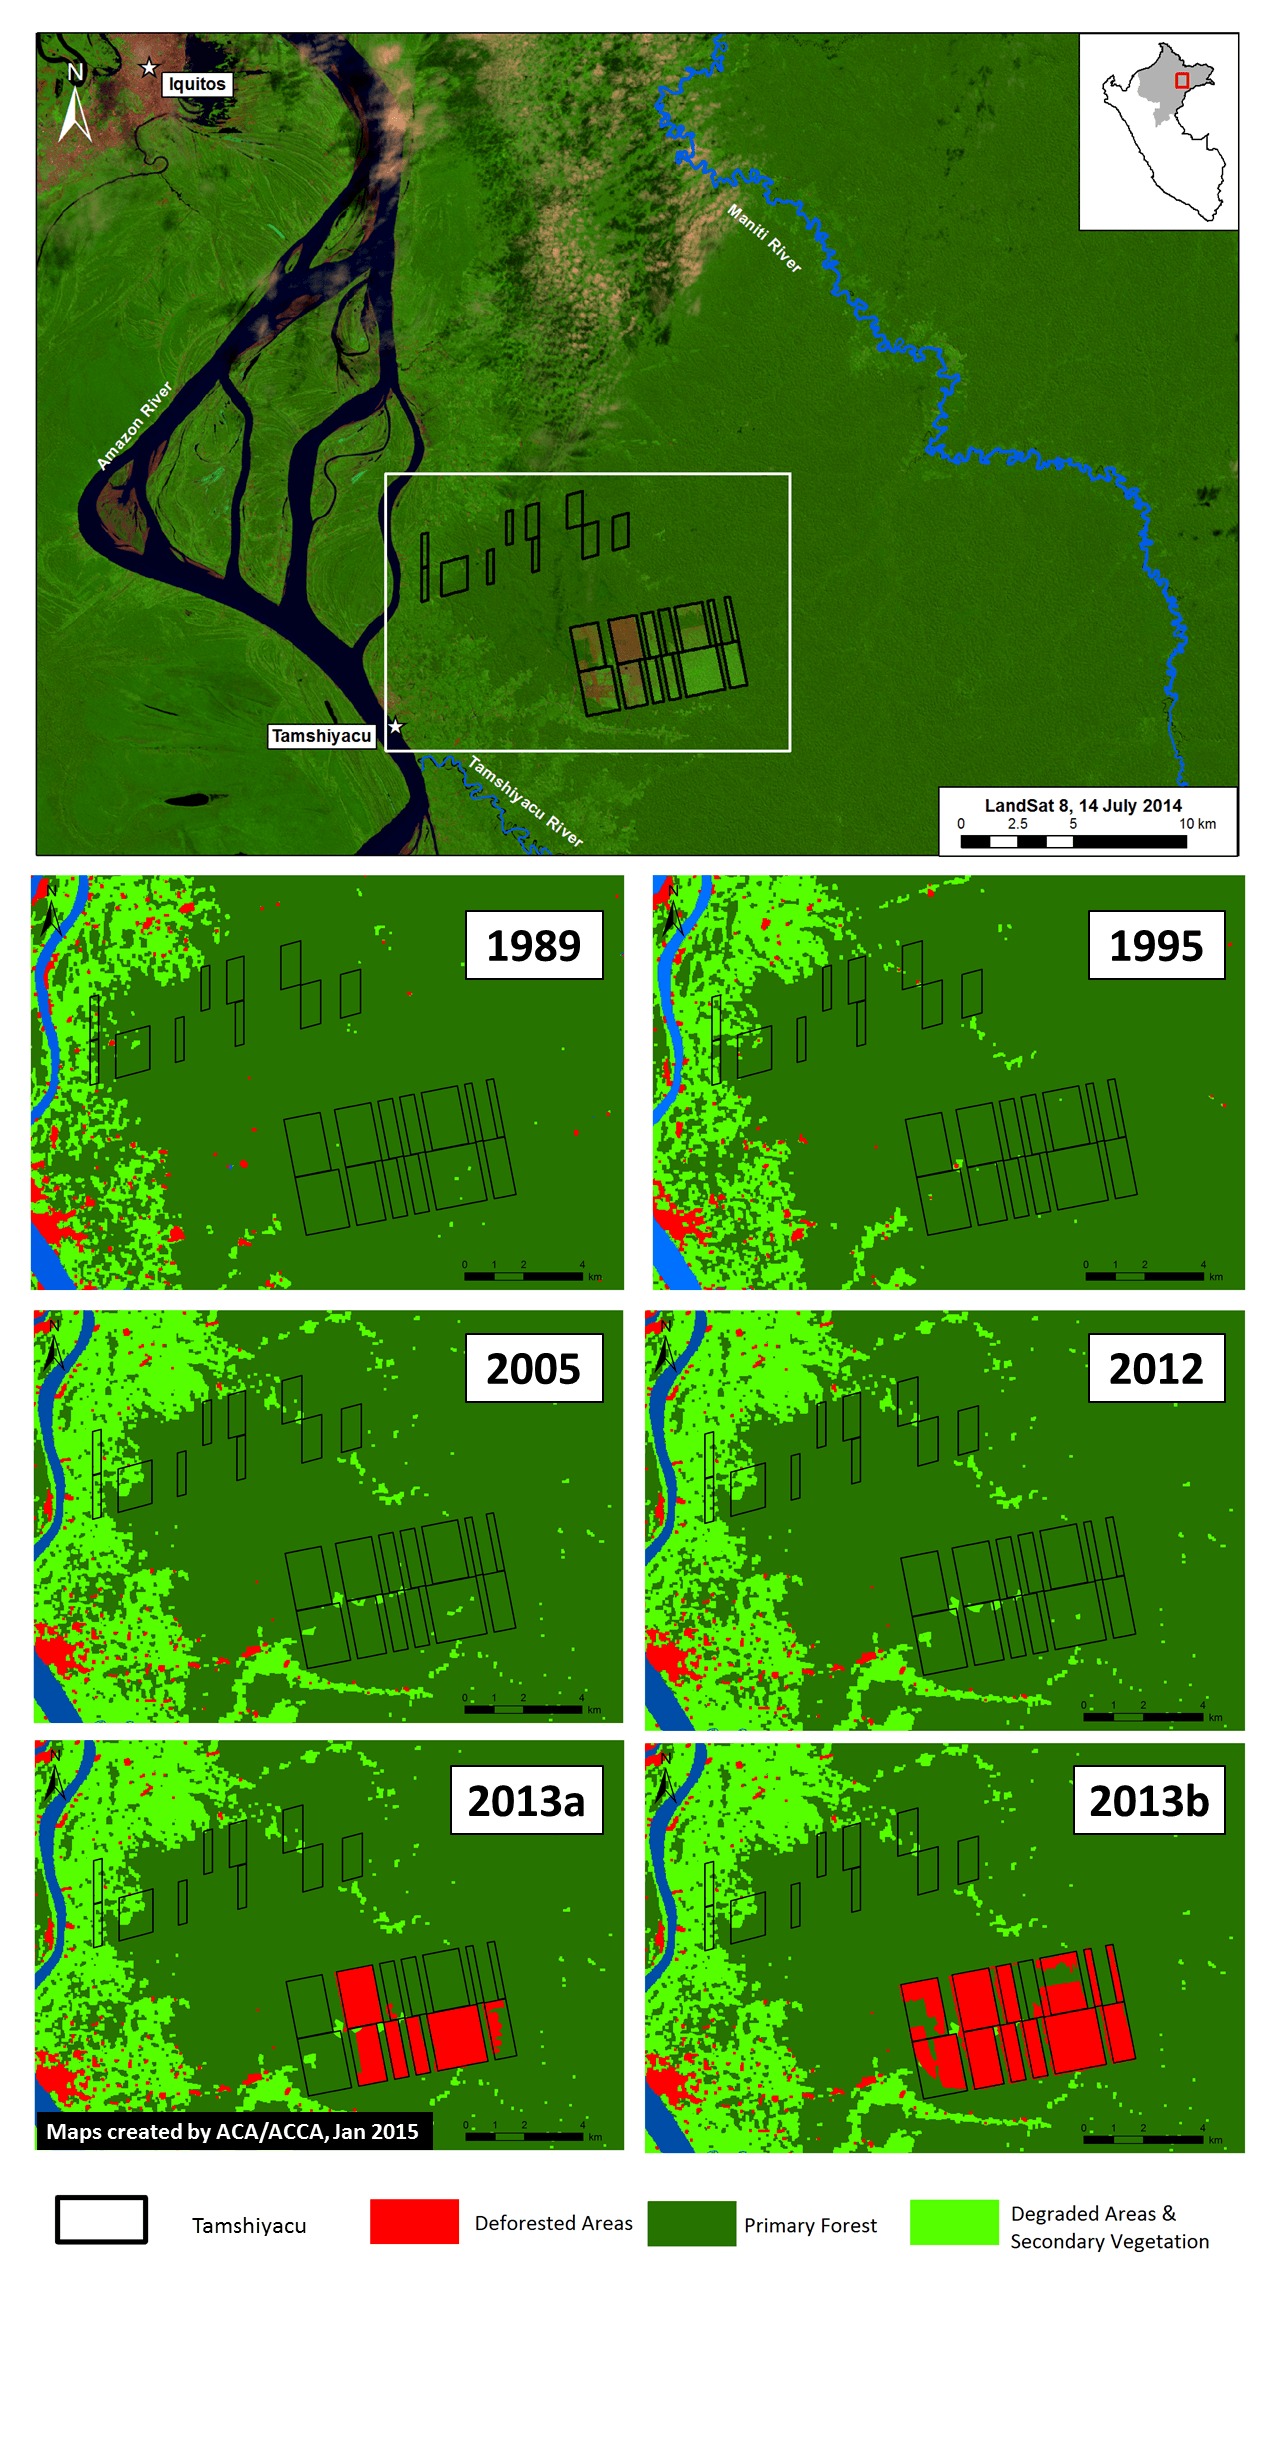
Image 2c. Tamshiyacu Landsat time series, 1989 – 2013. See text for definition of primary forest. Key sources: USGS.

Image 2c shows the results of our analysis of another series of Landsat images of the recently cleared area that go further back in time, until 1985. We conducted this analysis to determine whether the clearing described above came at the expense of primary forest.

We defined primary forest as an area that from the earliest available Landsat (in this case an image from 1985) was characterized by dense closed canopy coverage and having a similar spectral signature (NDVI) as areas in remote areas of the Amazon known to be undisturbed.

Using this methodology, we found that nearly 98% of the recently cleared area in Tamshiyacu was primary forest at the start clearing around May 2013.


Much More Forest Clearing to Come?

Tamshiyacu_MAAP_Mapa_3d_v1
Image 2d. Rapid clearing for large-scale agriculture in Tamshiyacu (Loreto, Peru). Key sources: MINAM, Hansen/UMD/Google/USGS/NASA, GOREL, USGS.

Image 2d includes spatial information on proposed cacao and oil palm projects in the Tamshiyacu area (indicated by grey lines). This data was obtained from the Regional Government of Loreto (GOREL). The total area for proposed cacao and oil palm projects around Tamshiyacu is greater than 50,000 ha.


Tamshiyacu_MAAP_Mapa_3e_v1
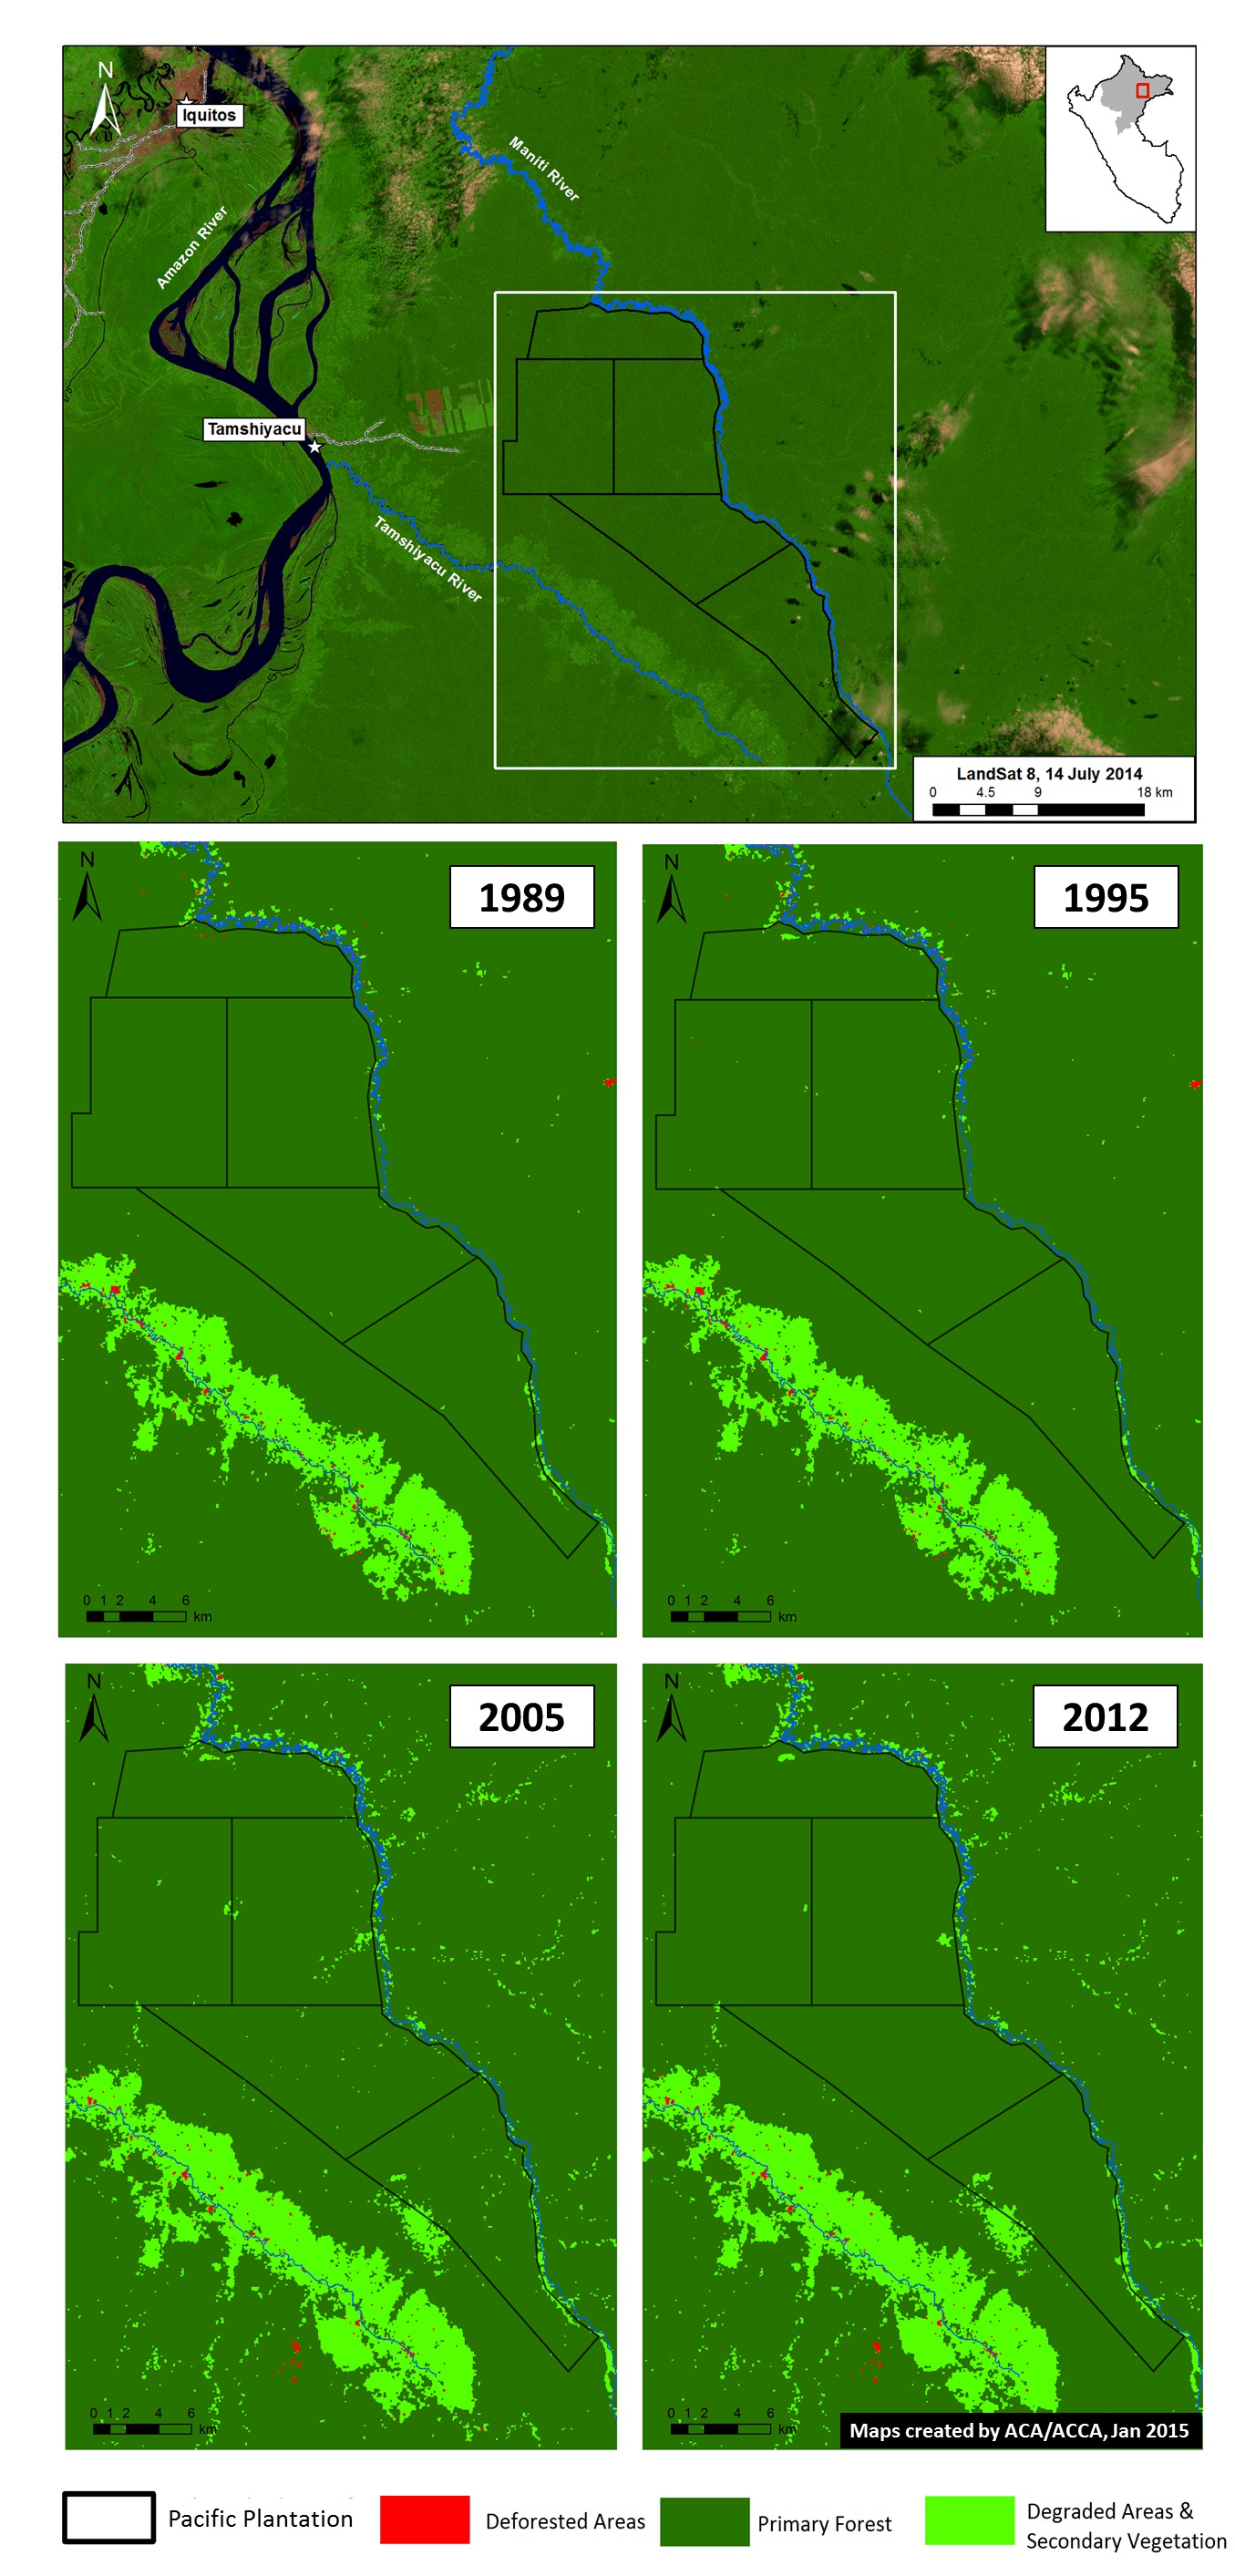
Image 2e. Landsat time series (1989 – 2012) for Pacific Plantation. See text for definition of primary forest. Key sources: USGS, GOREL.

We conducted a Landsat time-series analysis for the proposed oil palm projects noted above. We refer to these proposed projects as Pacific Plantation because this is how they are labelled in the information obtained from GOREL. As seen in Image 2e, our analysis indicates that 99.3% of the Pacific Plantation project area, or 44,685 ha, is primary forest.


Citation

Finer M, Novoa S (2015) Large-scale Forest Clearing for Cacao and Oil Palm in Tamshiyacu, Peru. MAAP: Image #2. Link: https://www.maapprogram.org/2015/03/image-3-rapid-clearing-for-large-scale-agriculture-in-tamshiyacu-_/


Image #1: Gold Mining Deforestation Continues to Expand in La Pampa (Madre de Dios, Peru)

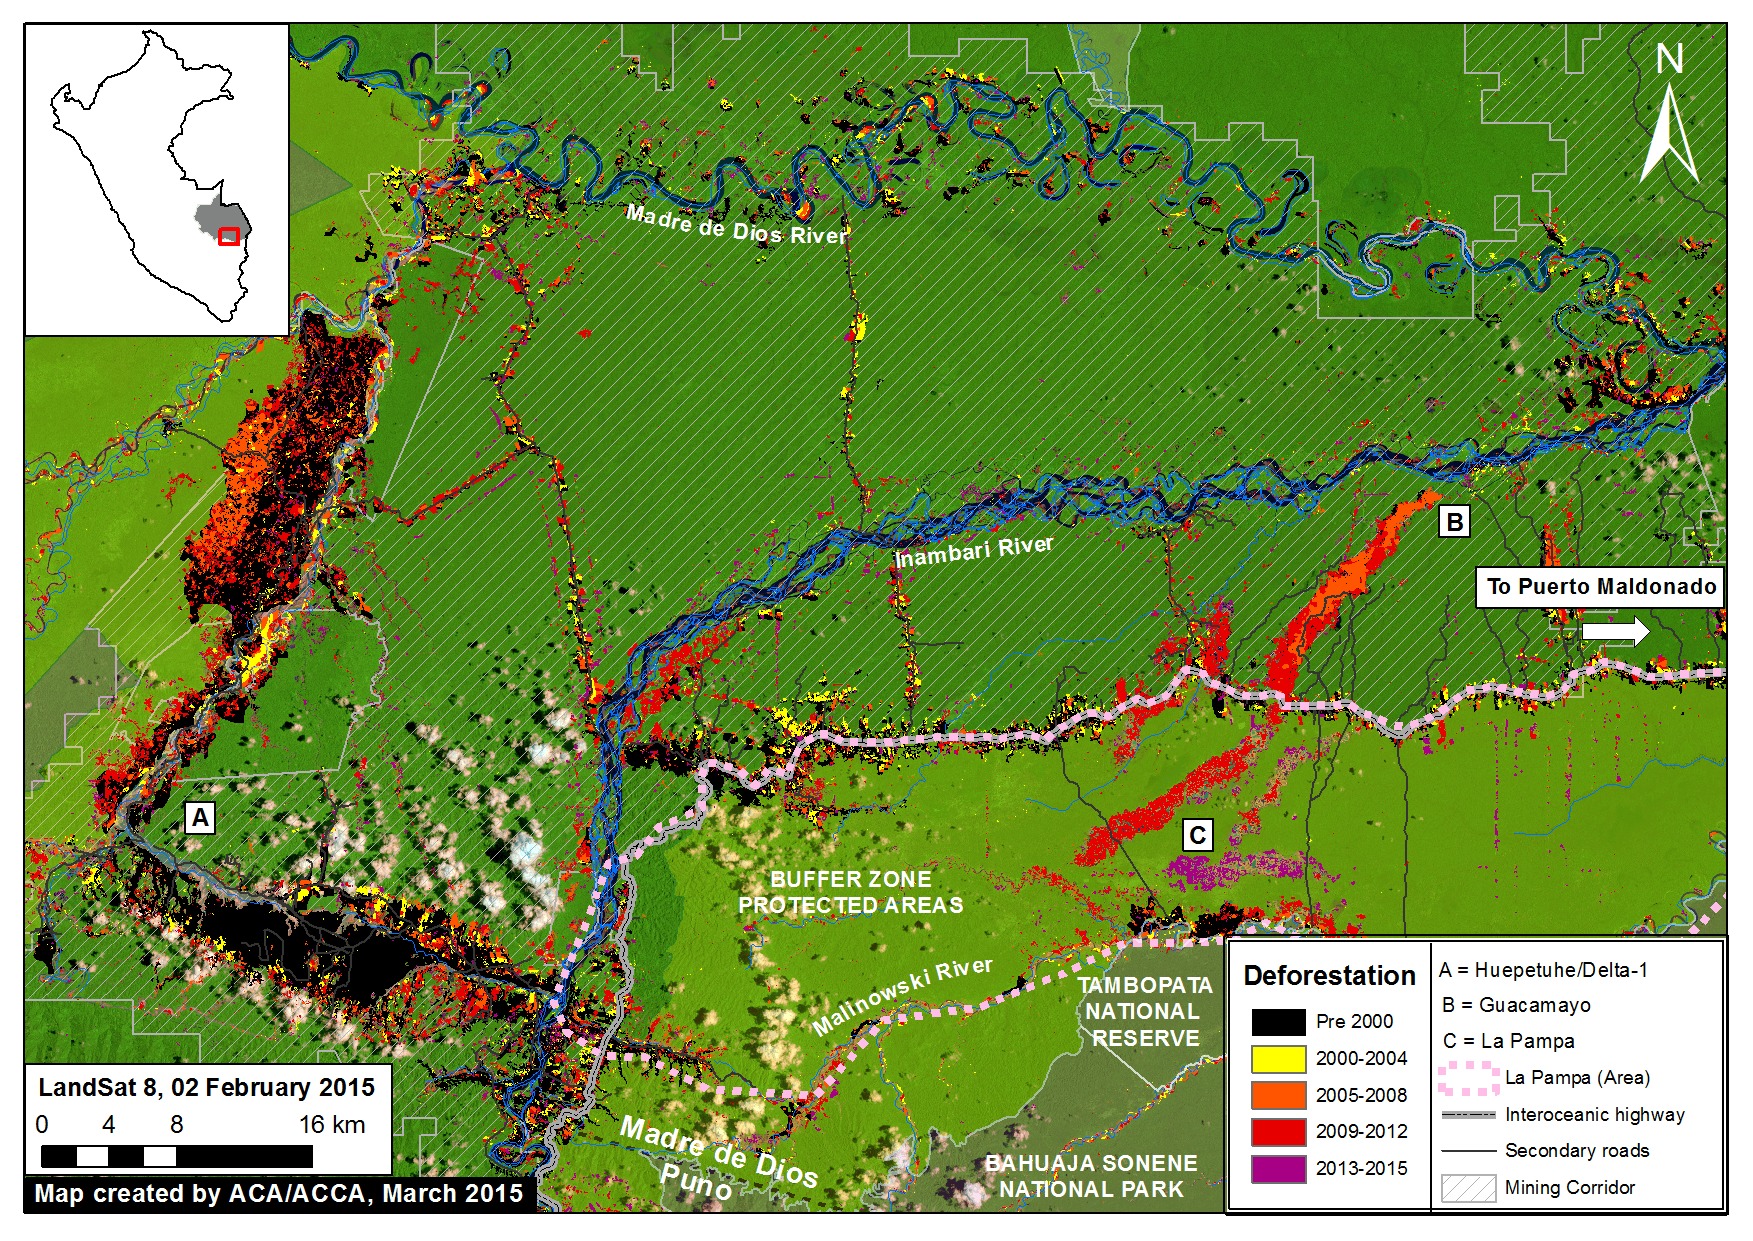
Image of the Week #1 highlights that gold mining deforestation continues to expand in the southern Peruvian Amazon (Department of Madre de Dios). Most notably, the image illustrates that much of the most recent (2013 – 2015) deforestation occured a) in an area known as La Pampa, b) outside of the legal mining corridor, and c) within the buffer zone of the Tambopata National Reserve.

2015_MDD_MAAP_a1_v6_rose1
Image of the Week 1a. Deforestation in the mining corridor of Madre de Dios in the southern Peruvian Amazon from 2000 – 2015. Key data sources: MINAM, SERNANP, ACCA, Hansen/UMD/Google/USGS/NASA, USGS

Map Description: 

Background map is a Landsat 8 image (30 m resolution) from February 2, 2015. Green indicates forest cover. Note there is some cloud cover. Data is from USGS.

Black indicates areas that were deforested as of 2000 according to data from the Peruvian Environment Ministry (MINAM 2009). Yellow, orange, and red indicate areas that were deforested from 2000 to 2012 (each color covers a four year period) (Hansen MC et al. 2013 Science 342: 850–53; Data download).

Purple indicates areas that were deforested between January 2013 and February 2015 based on our analysis of Landsat imagery using CLASlite forest monitoring software.

Data for secondary roads is from Conservación Amazónica-ACCA.

The mining corridor indicates the zone that the Peruvian Government has delimited as potentially legal for mining activities, but only if miners succesfully complete a multi-step formalization process for each project. Data is from ACCA.

Protected areas data is from SERNANP. Dark green indicates established protected areas and light green indicates their buffer zones.

The majority of the forest loss shown on the map is associated with gold mining activity, although some is also associated with the recently paved Interoceanic Highway and its growing secondary roads network.

According to a recent study published in PNAS by Greg Asner et al., the gold mining deforestation in this region increased from 10,000 ha in 2000 to 50,000 hectares (ha) in 2012. This deforestation was concentrated in two primary areas: Huepetuhe/Delta-1 and Guacamayo (A and B on the map, respectively).

More recently, the deforestation has largely shifted to La Pampa (C on the map). This shift is particularly important because La Pampa is within the buffer zone of the Tambopata National Reserve and outside of the designated mining corridor. Using CLASlite, we detected 1,711 ha of deforestation in La Pampa between 2013 and 2015.

Zoom View of La Pampa

2015_MDD_MAAP_b1_v2_zoom
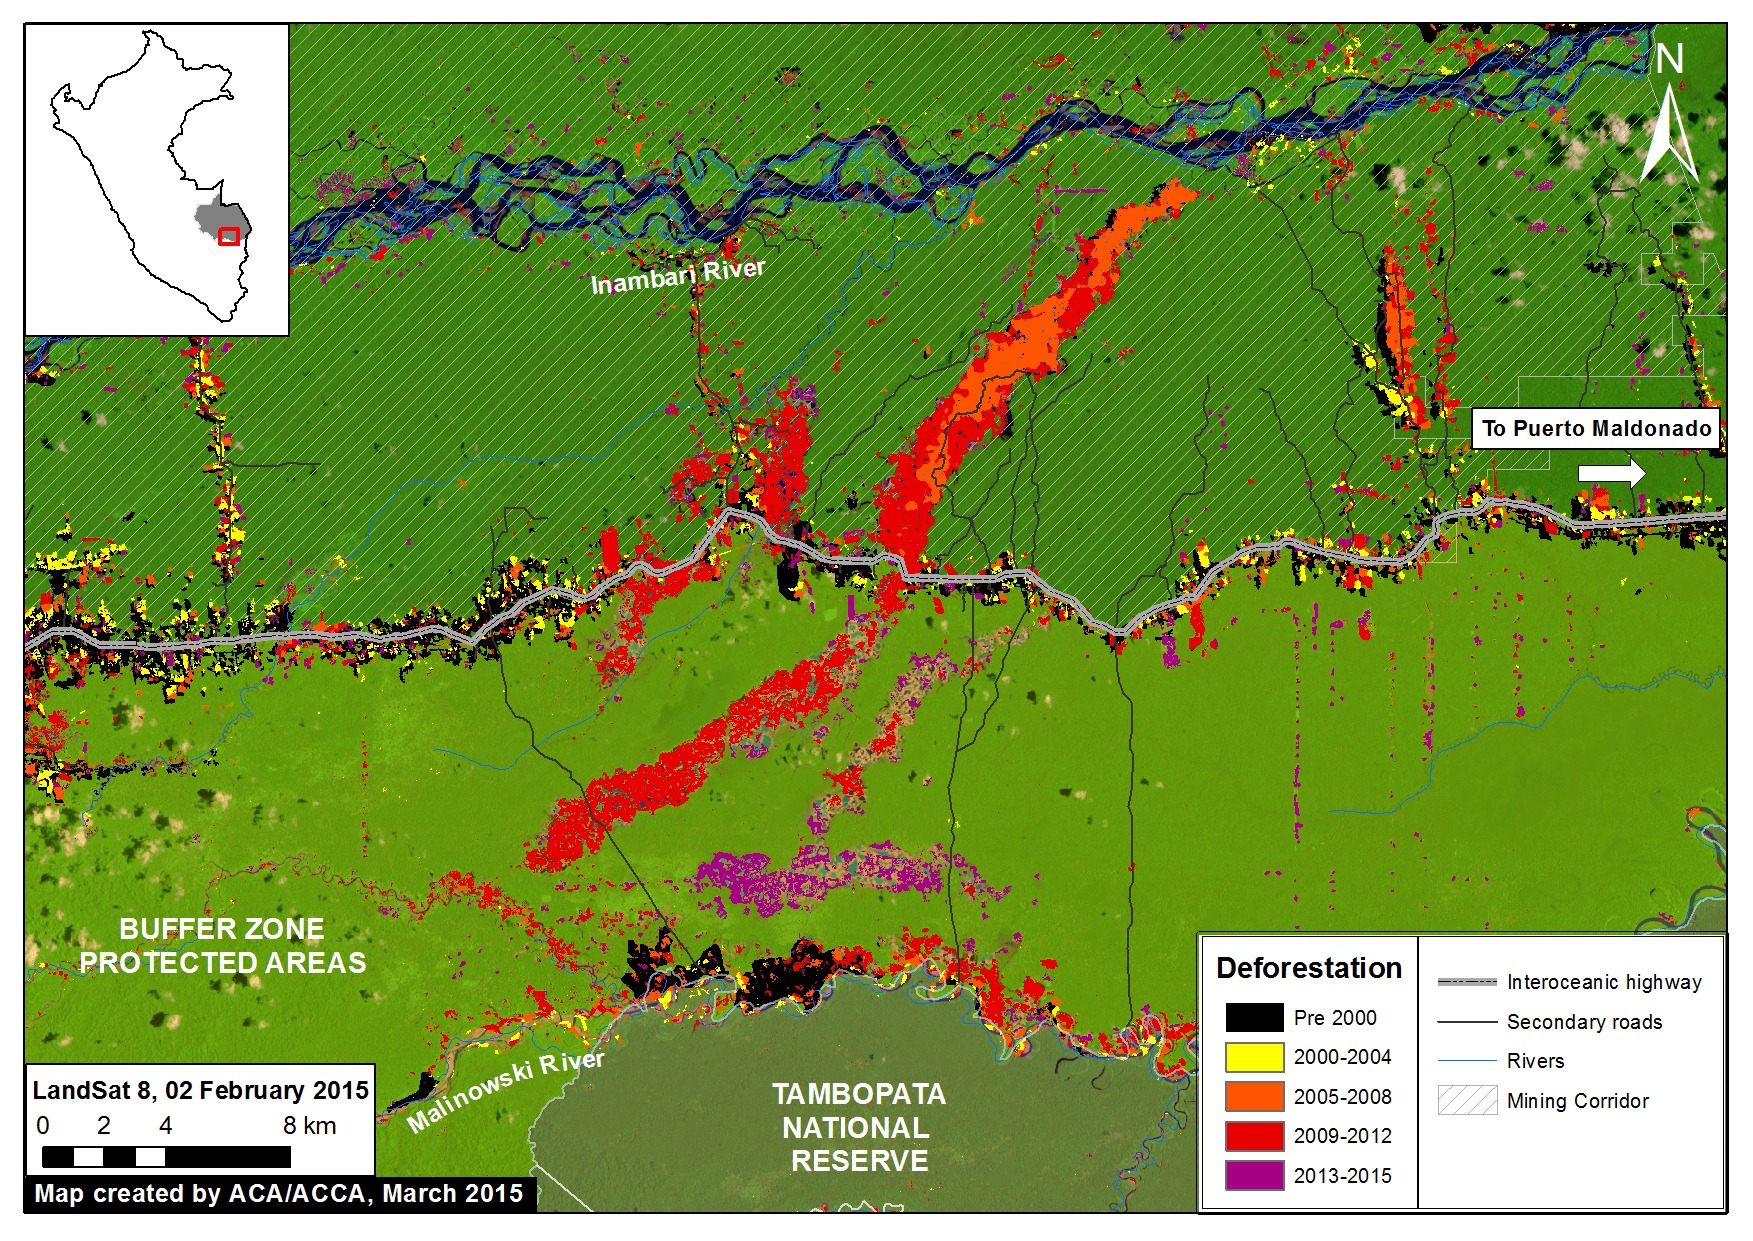
Image 1b. Zoom view of La Pampa mining zone within the buffer zone of the Tambopata National Reserve. Key data sources: MINAM, SERNANP, Hansen/UMD/Google/USGS/NASA, ACCA, USGS

Image 2b is a zoom view of the La Pampa area provided to better illustrate the most recent deforestation within the Tambopata National Reserve buffer zone. As noted above, using CLASlite we detected 1,711 ha of deforestation within the La Pampa area between 2013 and 2015. That is the equivalent to more than 2,300 soccer fields.

Note that much of the most recent deforestation is within 6 km of the Tambopata National Reserve.

Near Real-time Monitoring

2015_MDD_MAAP_c1_v3
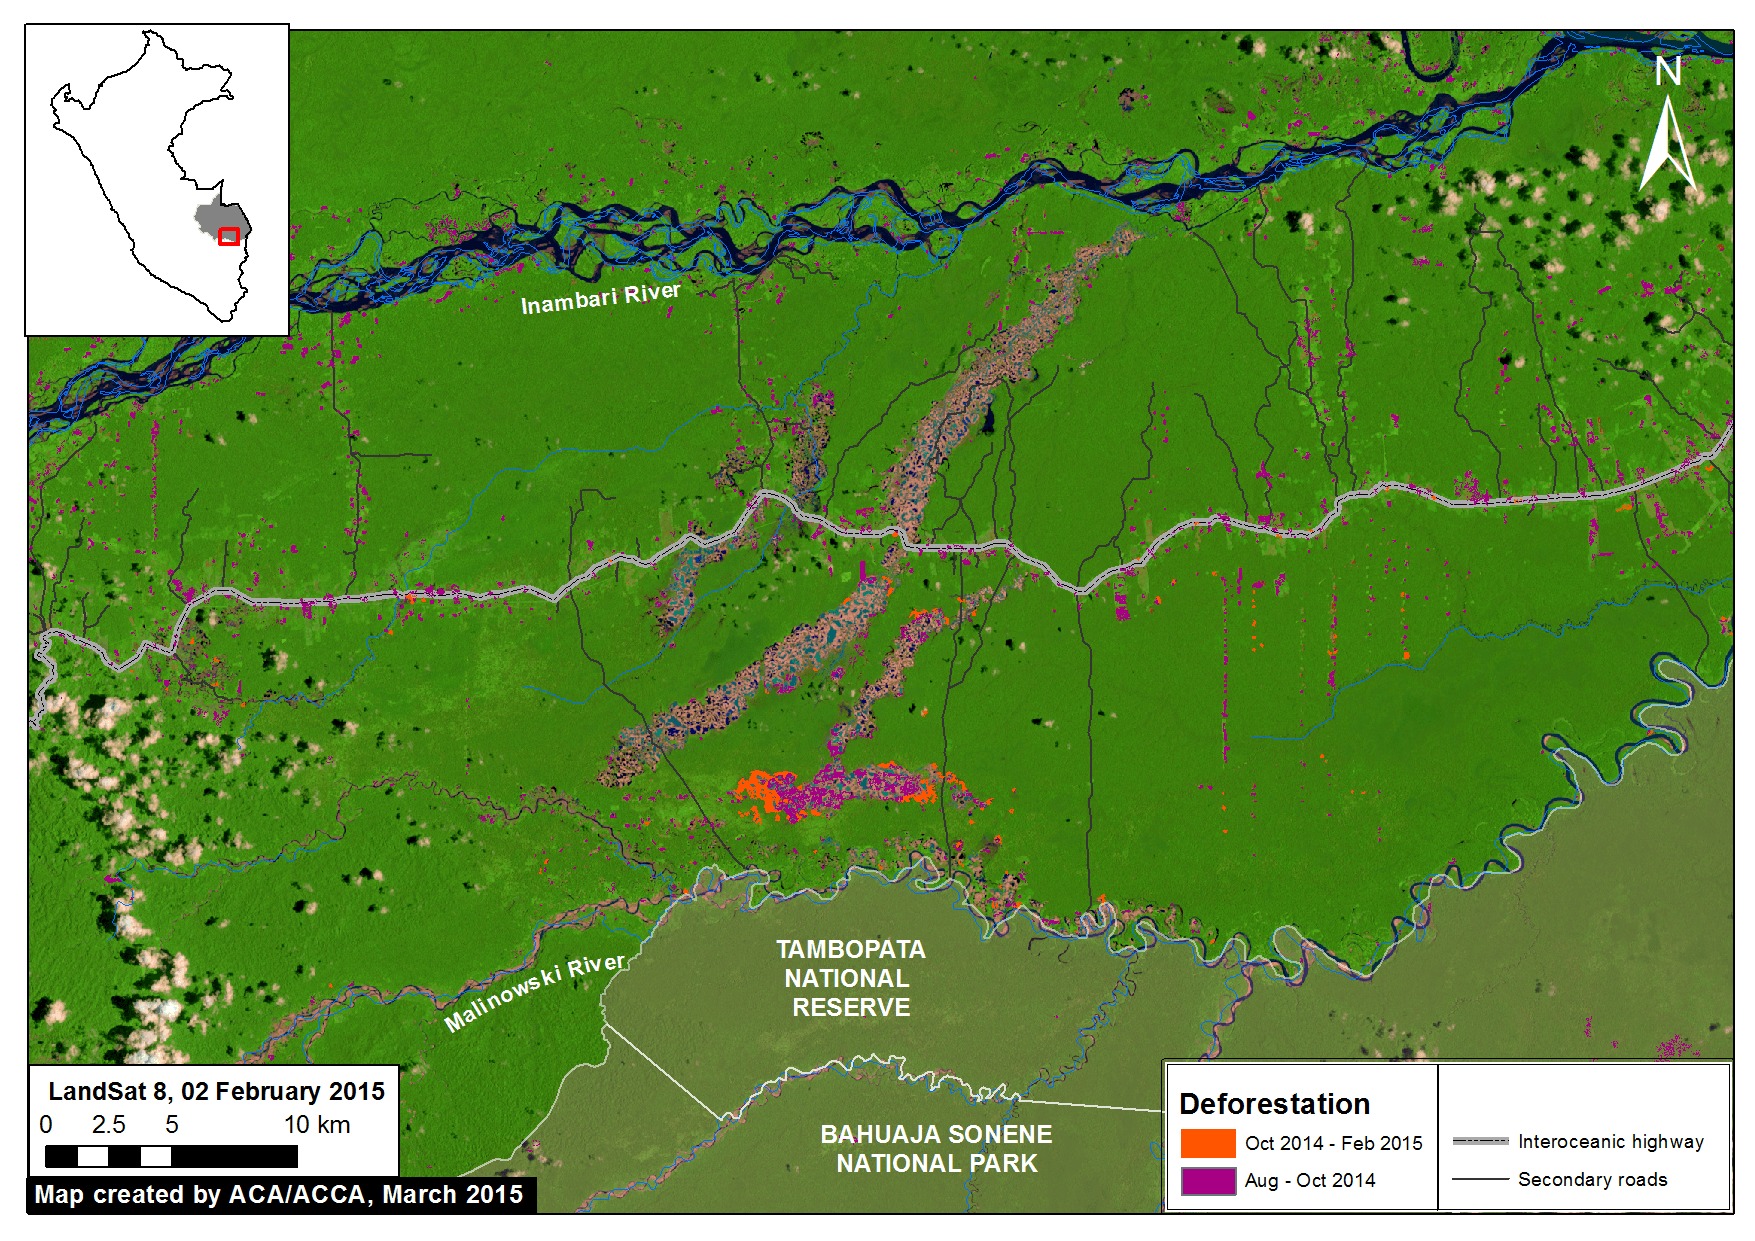
Image 1c. Near real-time deforestation monitoring in La Pampa. Key data sources: SERNANP, USGS, ACCA

Thanks to a series of relatively cloud-free Landsat images, we were able to conduct near real-time analysis with CLASlite during 2014 and 2015.

For example, we found that between mid-October 2014 and early February 2015 (about four months) there was deforestation of 226.5 ha in La Pampa within the buffer zone of the Tambopata National Reserve. That is the equivalent to 310 soccer fields, a rate of over 2.5 fields a day.

Prior to that time period, we found that between mid-August  and mid-October 2014 (abount nine weeks), there was deforestation of 431 ha in La Pampa.

Citation

Finer M, Novoa S (2015) Gold Mining Deforestation Continues to Expand in La Pampa (Madre de Dios, Peru). MAAP: Image #1. Link: https://www.maapprogram.org/2015/03/gold-mining-deforestation-expand-peruvian-amazon/