MAAP, an initiative of the organization Amazon Conservation, uses cutting-edge satellite technology to monitor deforestation in near real-time in the megadiverse Andean Amazon (Peru, Colombia, Ecuador, and Bolivia).
The monitoring is based on 5 satellite systems: Landsat (NASA/USGS), Sentinel (European Space Agency), PeruSAT-1, and the companies Planet and DigitalGlobe. For more information about our innovative methodology, see this recent paper in Science Magazine.
Launched in 2015, MAAP has published nearly 100 high-impact reports on the major Amazonian deforestation issues of the day.
Here, we present our third annual synthesis report with the objective to concisely describe the bigger picture: Deforestation trends, patterns, hotspots and drivers across the Andean Amazon.
Our principal findings include:
Trends: Deforestation across the Andean Amazon has reached 4.2 million hectares (10.4 million acres) since 2001. Annual deforestation has been increasing in recent years, with a peak in 2017 (426,000 hectares). Peru has had the highest annual deforestation, followed by surging Colombia (in fact, Colombia surpassed Peru in 2017). The vast majority of the deforestation events are small-scale (‹5 hectares).
Hotspots: We present the first regional-scale deforestation hotspots map for the Andean Amazon, allowing for spatial comparisons between Peru, Colombia, and Ecuador. We discuss six of the most important hotspots.
Drivers: We present MAAP Interactive, a dynamic map with detailed information on the major deforestation drivers: gold mining, agriculture (oil palm and cacao), cattle ranching, logging, and dams. Agriculture and ranching cause the most widespread impact across the region, while gold mining is most intense southern Peru.
Climate Change. We estimated the loss of 59 million metric tons of carbon in the Peruvian Amazon during the last five years (2013-17) due to forest loss. In contrast, we also show that protected areas and indigenous lands have safeguarded 3.17 billion metric tons of carbon.
I. Deforestation Trends
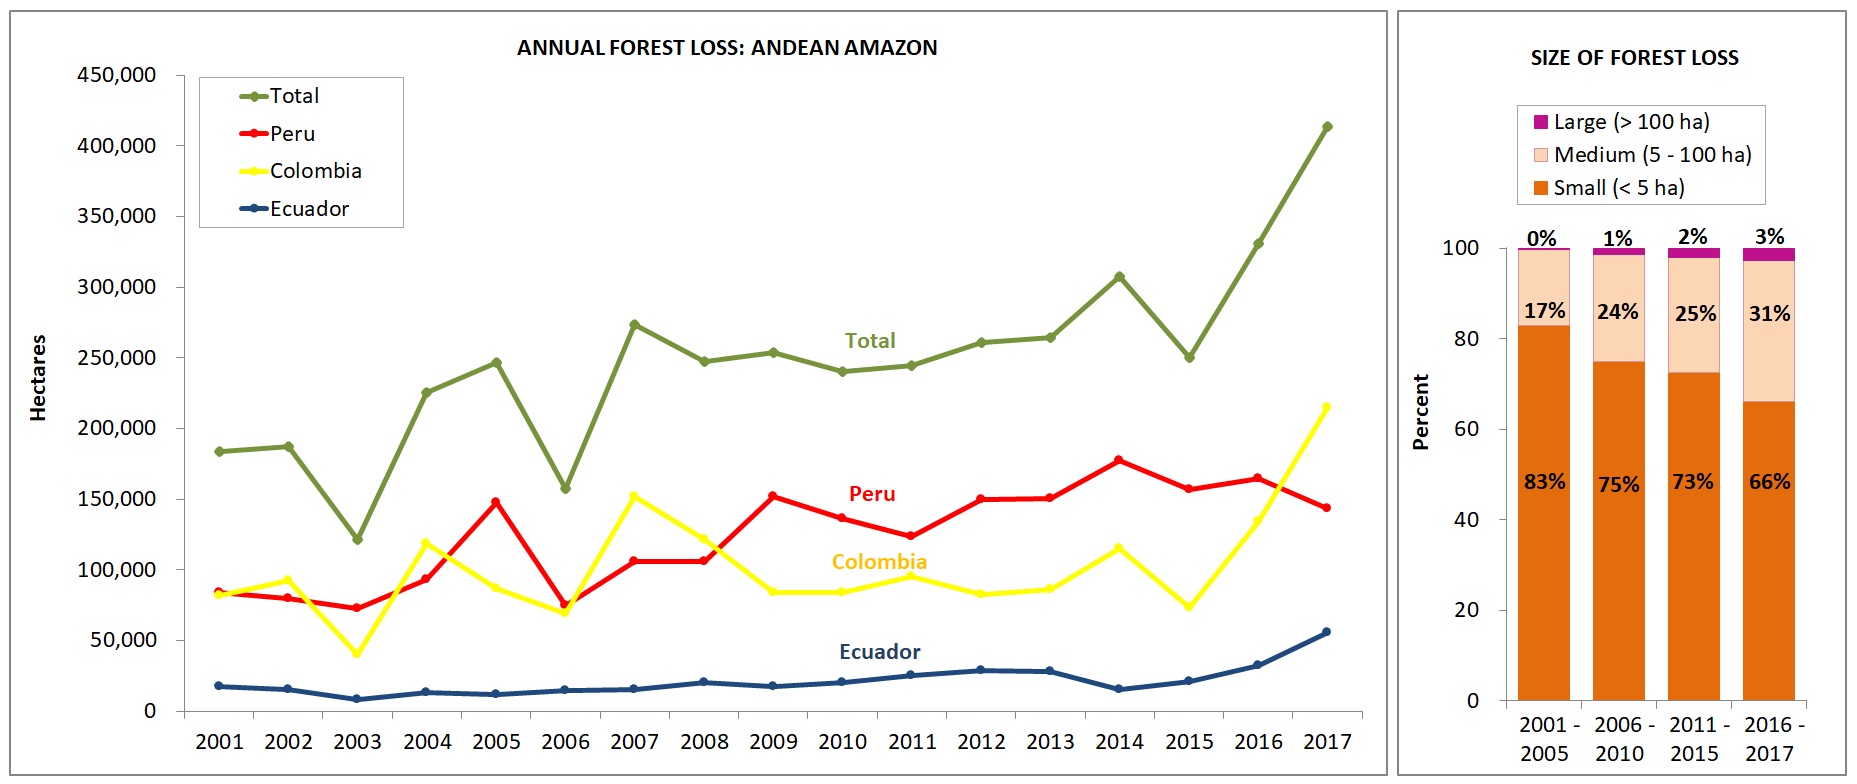
Image 1 shows forest loss trends in the Andean Amazon between 2001 and 2017.* The left graph shows data by country, while the right graph shows data by forest loss event size.
Trends by Country
Over the past 17 years (2001-2017), deforestation has surpassed 4.2 million hectares (10.4 million acres) in the Andean Amazon (see green line). Of this total, 50% is Peru (2.1 million hectares/5.2 million acres), 41% Colombia (1.7 million hectares/4.27 million acres), and 9% Ecuador (887,000 acres/359,000 hectares). This analysis did not include Bolivia.
Since 2007, there has been an increasing deforestation trend, peaking during the past two years (2016-17). In fact, 2017 has the highest annual forest loss on record with 426,000 hectares (over one million acres), more than double the total forest loss in 2006.
Peru had the highest average annual Amazonian deforestation between 2009 and 2016. The past four years have the highest annual deforestation totals on record in the country, with peaks in 2014 (177,566 hectares/439,000 acres) and 2016 (164,662 hectares/406,888 acres). According to new data from the Peruvian Environment Ministry, there was an important decline in 2017 (155,914 hectares/385,272 acres), but it is still the fourth highest annual total on record.
There has been a surge of deforestation in Colombia during the past two years. Note that in 2017, Colombia surpassed Peru with a record high of 214,700 hectares (530,400 acres) deforested.
Deforestation is also increasing in Ecuador, with highs of 32,000 hectares (79,000 acres) in 2016 and 55,500 hectares (137,000) acres in 2017.
For context, Brazil has had an average deforestation loss rate of 639,403 hectares (1.58 million acres) over the past several years.
* Data: Colombia & Ecuador: Hansen/UMD/Google/USGS/NASA; Peru: MINAM/PNCB, UMD/GLAD. While this information includes natural forest loss events, it serves as our best estimate of deforestation resulting from anthropogenic causes. It is estimated that the non-anthropic loss comprises approximately 3.5% of the total loss. Note that the analysis does not include Bolivia.
Trends by Size
The pattern related to the size of deforestation events in the Andean Amazon remained relatively consistent over the last 17 years. Most noteworthy: the vast majority (74%) of the deforestation events are small-scale (‹5 hectares). Only 2% of deforestation events are large-scale (>100 hectares). The remaining 24% are medium-scale (5-100 hectares).
These results are important for conservation efforts. Addressing this complex situation – in which most of the deforestation events are small-scale – requires significantly more attention and resources. In addition, while large-scale deforestation (usually associated with agro-industrial practices) is not that common, it nonetheless represents a serious latent threat, due to the fact that only a small number of agro-industrial projects (for example, oil palm) are able to rapidly destroy thousands of acres of primary forest.
II. Deforestation Hotspots
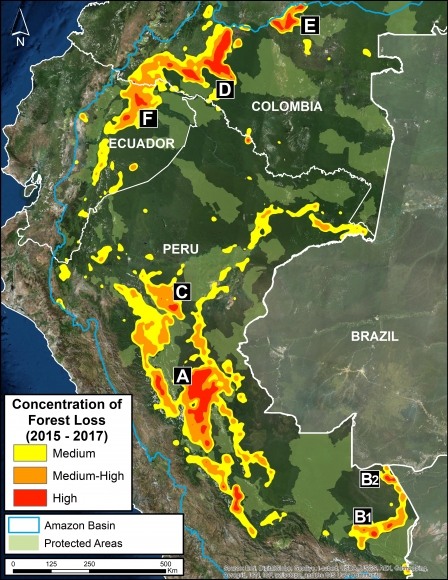
We present the first regional-scale deforestation hotspots map across the Andean Amazon (Colombia, Ecuador, Peru). Image 2 shows the results for the past three, 2015 – 2017.
The most critical zones (“high” deforestation density) are indicated in red. They include:
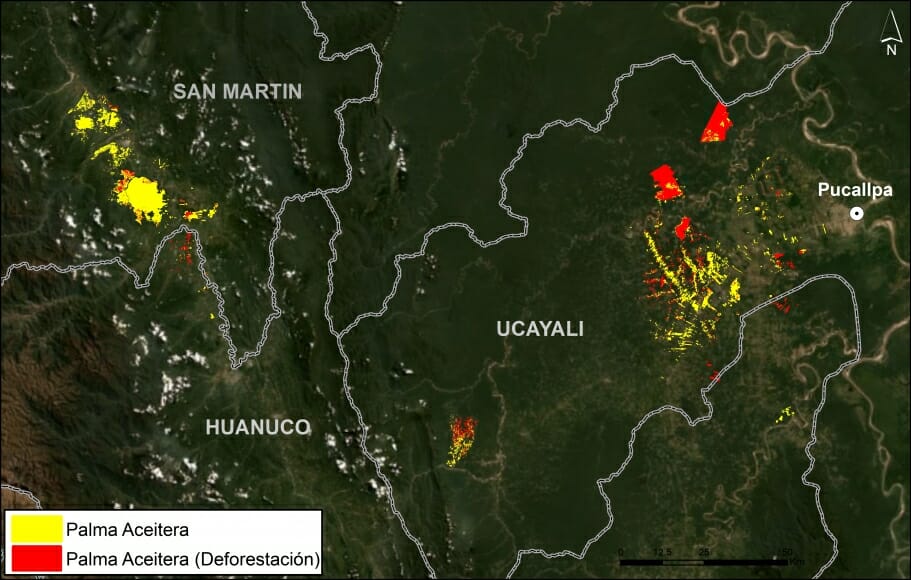
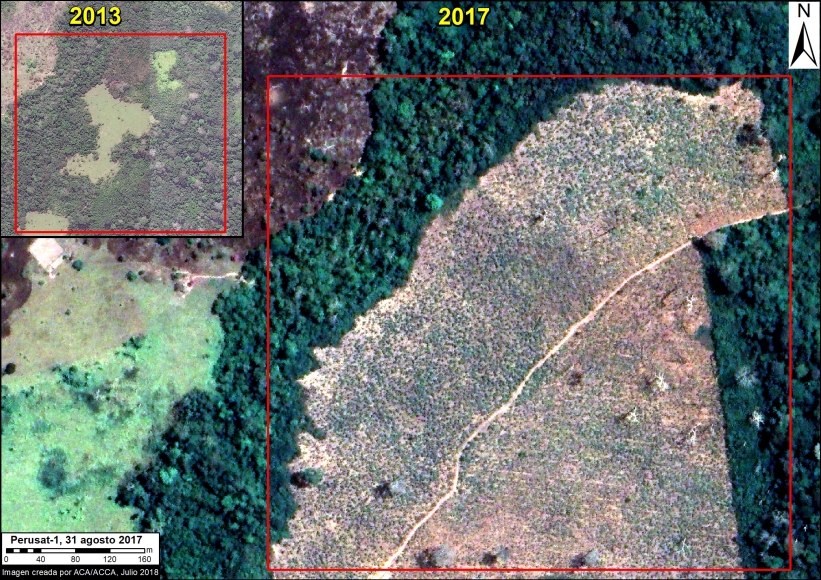
A. Central Peruvian Amazon: Over the last 10 years, this zone, located in the Ucayali and Huánuco regions, has consistently had one of the largest concentrations of deforestation in Peru (Inset A). Its principal drivers include oil palm and cattle grazing.
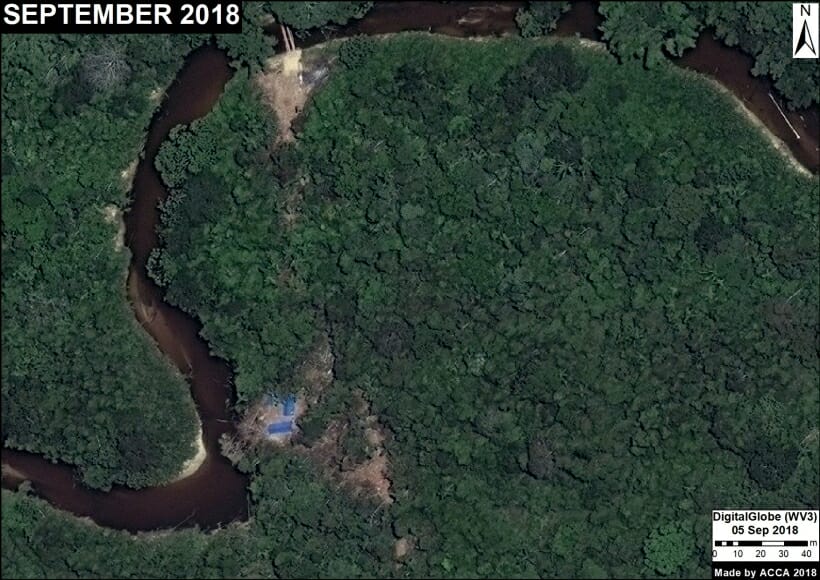
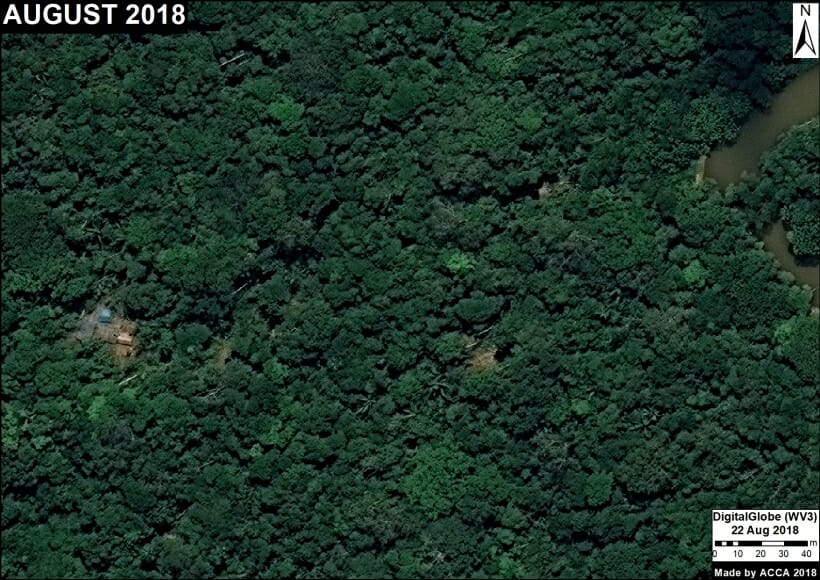
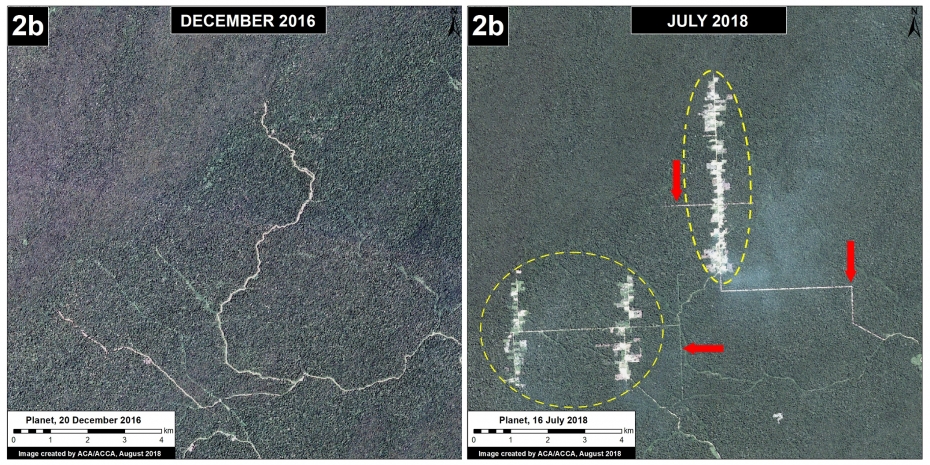
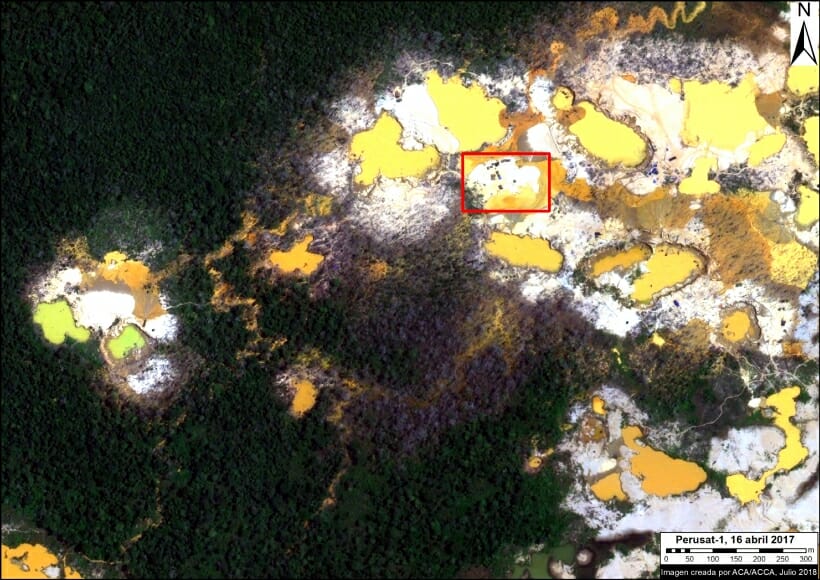
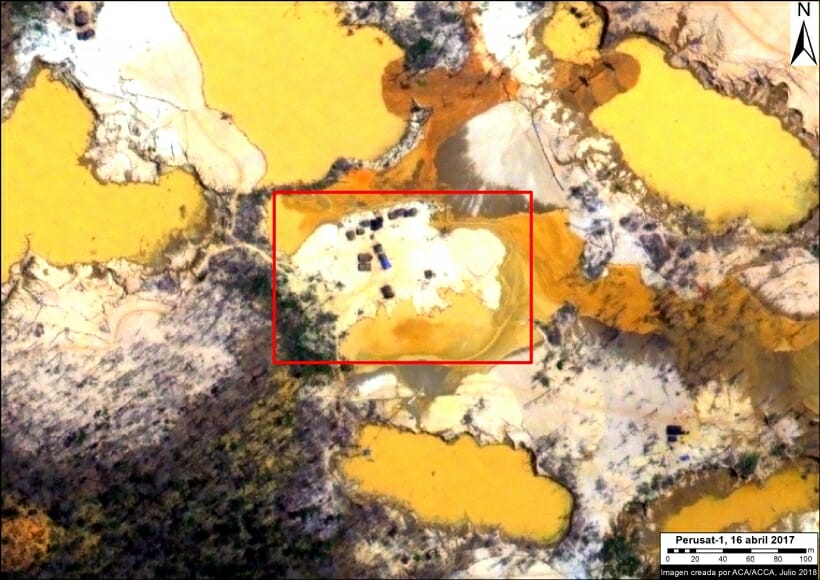
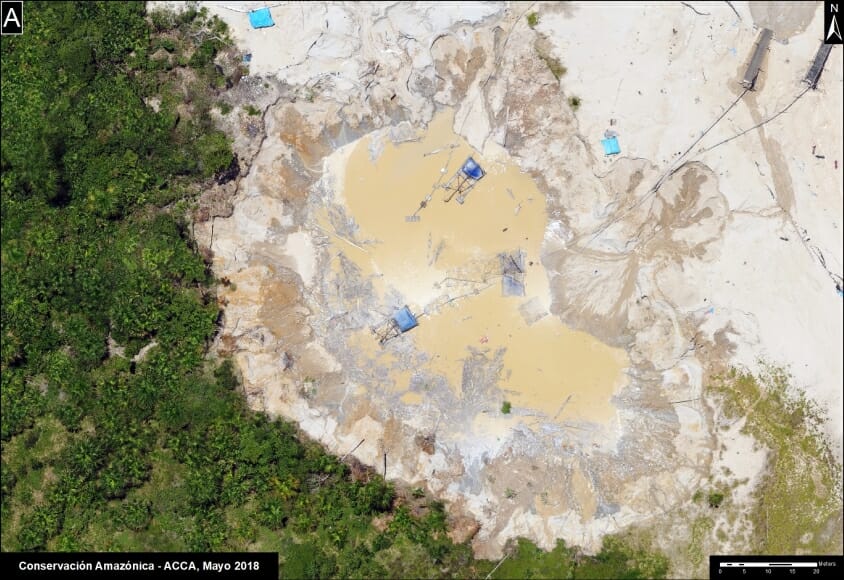
B. Southern Peruvian Amazon: This zone, located in the Madre de Dios region, is impacted by gold mining (Inset B1), and increasingly by small- and medium-scale agriculture along the Interoceanic Highway (Inset B2).
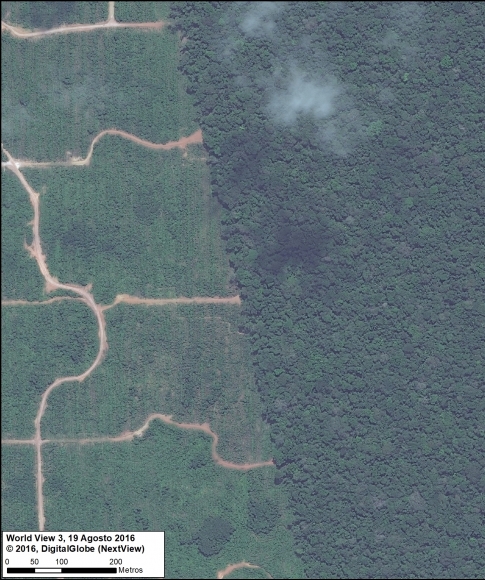
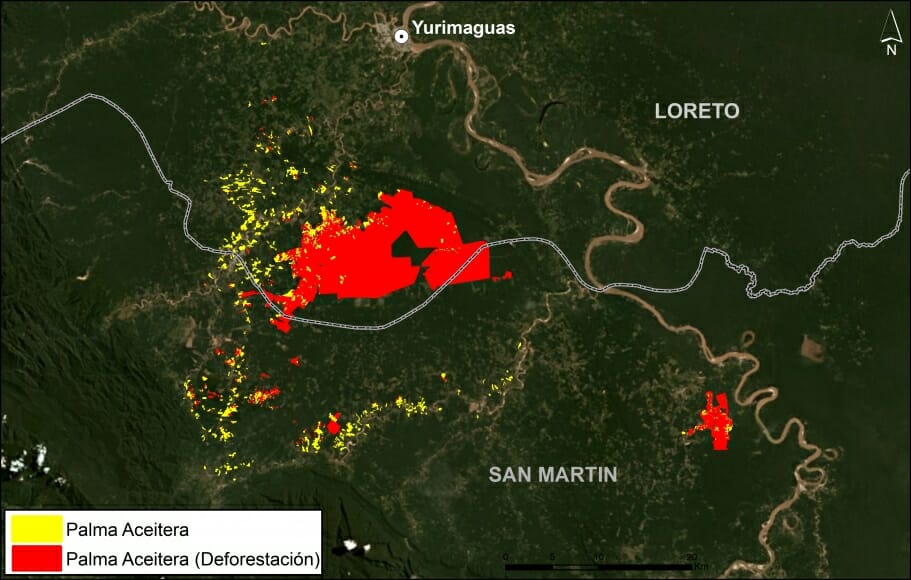
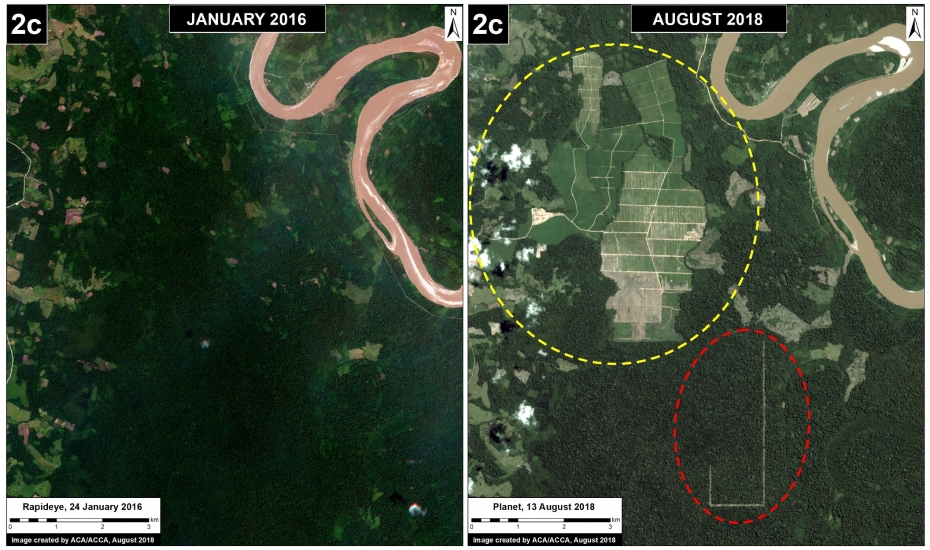
C. Central Peruvian Amazon: A new oil palm plantation located in the San Martín region has been identified as a recent large-scale deforestation event in this zone (Inset C).
D. Southwestern Colombian Amazon: Cattle grazing is the principal deforestation driver documented in this zone, located in the departments of Caquetá and Putumayo (Inset D).
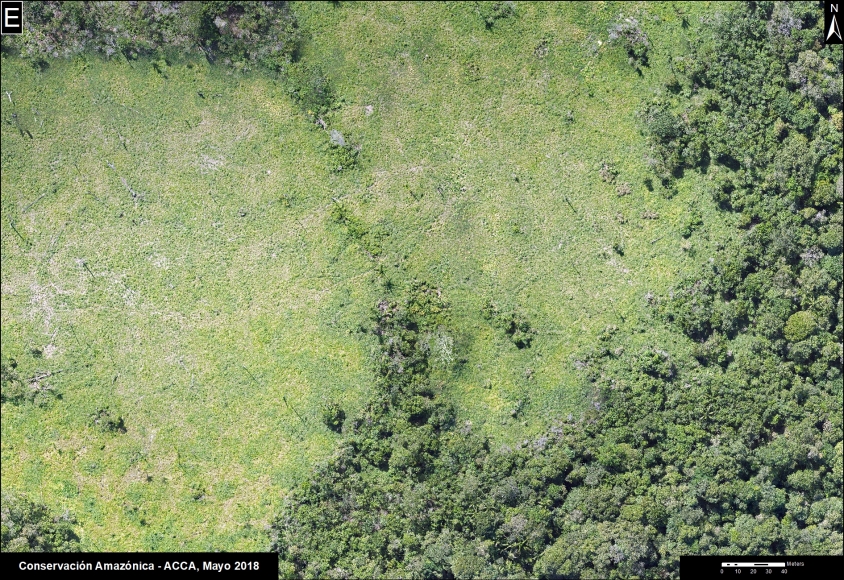
E. Northern Colombian Amazon: There is expanding deforestation along a new road in this zone, located in the department of Guaviare (Inset E).
F. Northern Ecuadoran Amazon: This zone is located in the Orellana province, where small- and medium-scale agriculture, including oil palm, is the principal driver of deforestation (Inset F).
III. Drivers of Deforestation
One of the main objectives of MAAP is to improve the availability of precise and up-to-date information regarding the current drivers (causes) of deforestation in the Andean Amazon. Indeed, one of our most important advances has been the use of high-resolution imagery to identify current deforestation drivers.
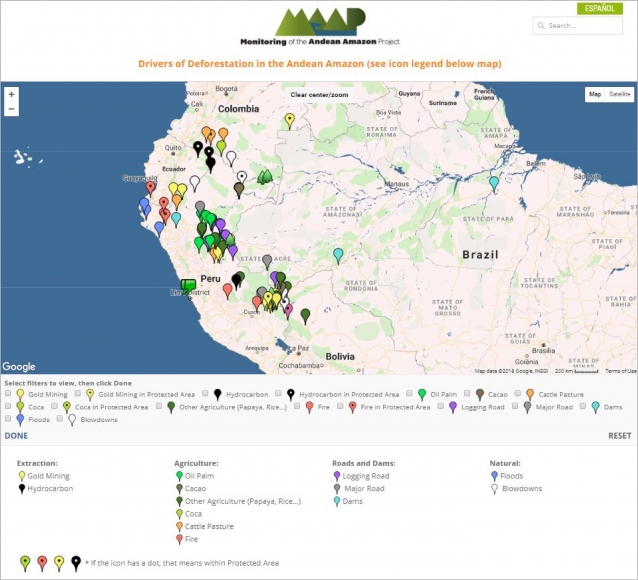
In order to improve the analysis and understanding of the identified drivers, we have created an Interactive Map that displays the spatial location of each driver associated with every MAAP report. An important characteristic of this map is the ability to filter the data by driver, by selecting the boxes of interest.
Image 3 shows a screenshot of the Interactive Map. Note that it contains detailed information on these principal drivers: gold mining, oil palm, cacao, small-scale agriculture, cattle pasture, logging roads, and dams. It also includes natural causes such as floods, forest fires, and blowdowns. In addition, it highlights deforestation events in protected areas.
Below, we discuss the principal drivers of deforestation and degradation in greater detail.
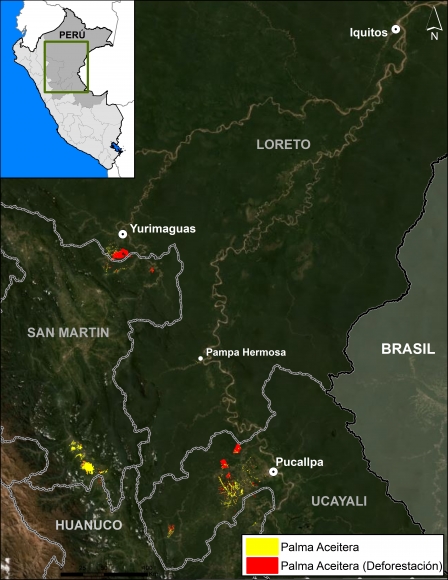
Agriculture – oil palm, cacao, and other crops
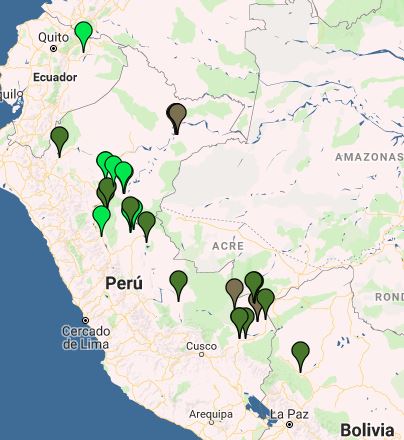
Image 4 shows the results of the interactive map when applying the agriculture-related filters.
Legend:
Oil palm (bright green)
Cacao (brown)
Other crops (dark green)
Agricultural activity is one of the principal causes of deforestation in the Andean Amazon.
The majority of agriculture-related deforestation is caused by small- and medium-scale plantations (‹50 hectares).
Deforestation for large-scale, agro-industrial plantations is much less common, but represents a critical latent threat.
Large-scale Agriculture
We have documented five major deforestation events produced by large-scale plantations since 2007: four of these occurred in Peru (three of which are related to oil palm and one to cacao) and one in Bolivia (resulting from sugar cane plantations).
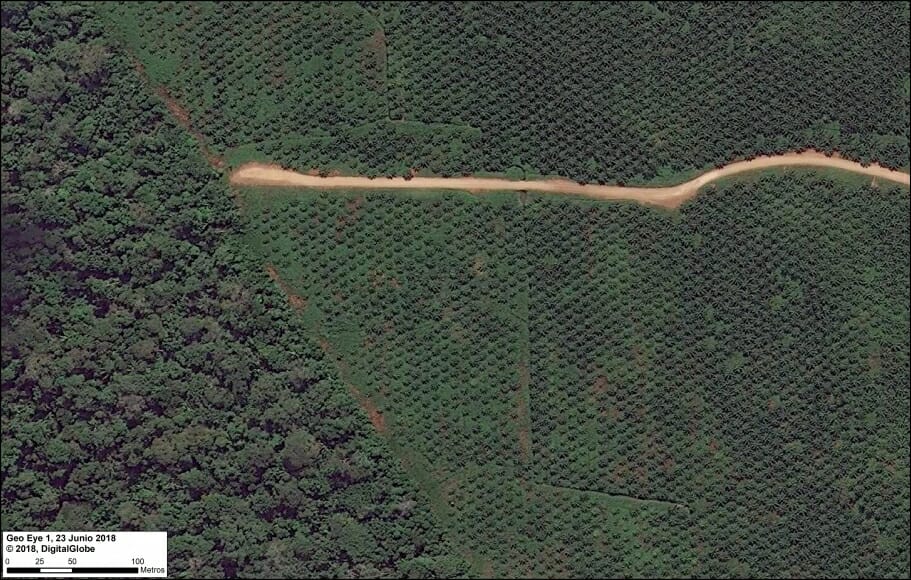
First, between 2007 and 2011, two large-scale oil palm plantations caused the deforestation of 7,000 hectares on the border between Loreto and San Martín (MAAP #16). Subsequent plantations in the surrounding area caused the additional deforestation of 9,800 hectares.
It is importnat to note that the Peruvian company Grupo Palmas is now working towards a zero deforestation value chain and has a new sustainability policy (see Case C of MAAP #64).
Next, between 2012 and 2015, two other large-scale oil palm plantations deforested 12,000 hectares in Ucayali (MAAP #4, MAAP #41).
Between 2013 and 2015, the company United Cacao deforested 2,380 hectares for cacao plantations in Loreto (MAAP #9, MAAP #13, MAAP #27, MAAP #35).
Deforestation from large-scale agriculture decreased in Peru between 2016 and 2017, but there was one notable event: an oil palm plantation of 740 hectares in San Martín (MAAP #78).
Another notable case of deforestation related to large-scale agriculture has been occurring in Bolivia, where a new sugarcane plantation has caused the deforestation of more than 2,500 hectares in the department of La Paz.
Additionally, we found three new zones in Peru characterized by the deforestation pattern produced by the construction of organized access roads which have the potential of becoming large-scale agriculture areas (MAAP #69).
Small and Medium-scale Agriculture
Deforestation caused by small- and medium-scale agriculture is much more widespread, but it is often difficult to identify the driver from satellite imagery.
We have identified some specific cases of oil palm in Huánuco, Ucayali, Loreto, and San Martín (MAAP #48, MAAP #26, MAAP #16).
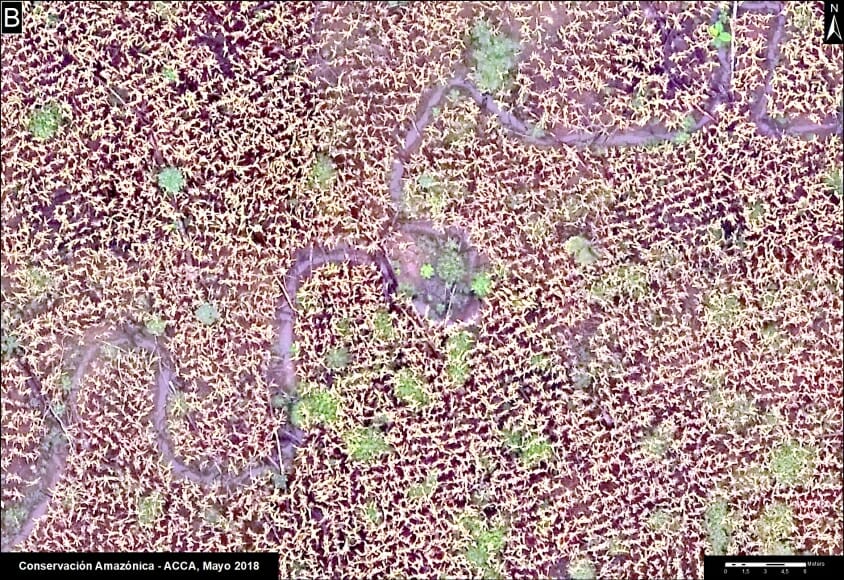
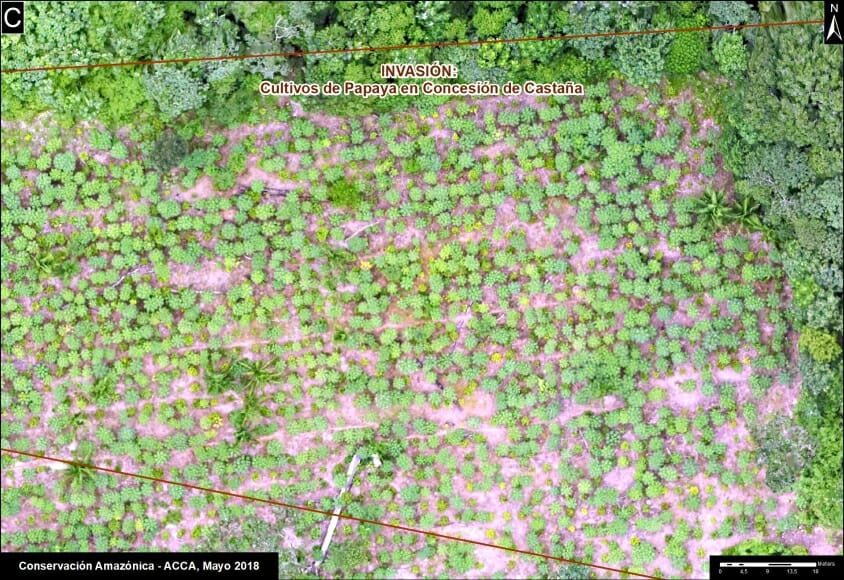
Cacao and papaya are emerging drivers in Madre de Dios. We have documented cacao deforestation along the Las Piedras River (MAAP #23, MAAP #40) and papaya along the Interoceanic Highway (MAAP #42).
Corn and rice cultivation appear to be turning the area around the town of Iberia into a deforestation hotspot (MAAP #28). In other cases, we have documented deforestation resulting from small- and medium-scale agriculture, though it has not been possible to identify the type of crop (MAAP #75, MAAP #78).
Additionally, small-scale agriculture is possibly a determining factor in the forest fires that degrade the Amazon during the dry season (MAAP #45, MAAP #47).
The cultivation of illicit coca is a cause of deforestation in some areas of Peru and Colombia. For example, in southern Peru, the cultivation of coca is generating deforestation within the Bahuaja Sonene National Park and its surrounding areas.
Cattle Ranching
By analyzing high-resolution satellite imagery, we have developed a methodology for identifying areas deforestated by cattle ranching.*
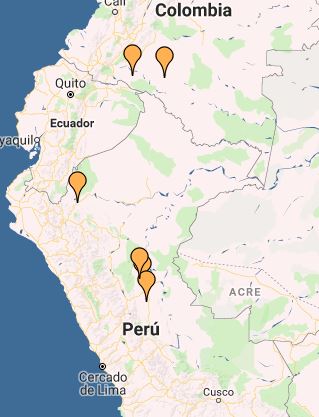
Image 5 shows the results of the Interactive Map when applying the “Cattle pasture” filter, indicating the documented examples in Peru and Colombia.
Legend:
Cattle ranching (orange)
Cattle ranching is the principal driver of deforestation in the central Peruvian Amazon (MAAP #26, MAAP #37, MAAP #45, MAAP #78). We also identified recent deforestation from cattle ranching in northeastern Peru (MAAP #78).
In the Colombian Amazon, cattle ranching is one the primary direct drivers in the country’s most intense deforestation hotspots (MAAP #63, MAAP #77).
* Immediately following a major deforestation event, the landscape of felled trees is similar for both agriculture and cattle pasture. However, by studying an archive of images and going back in time to analyze older deforestation cases, it is possible to distinguish between the drivers. For example, after one or two years, agriculture and cattle pasture appear very different in the images. Ther former tends to have organized rows of new plantings, while the latter is mostly grassland.
Gold Mining
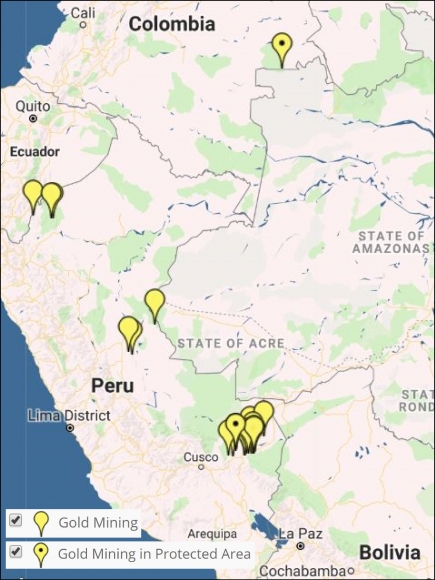
Image 6 shows the results of the Interactive Map when applying the “Gold mining” filter.
Legend:
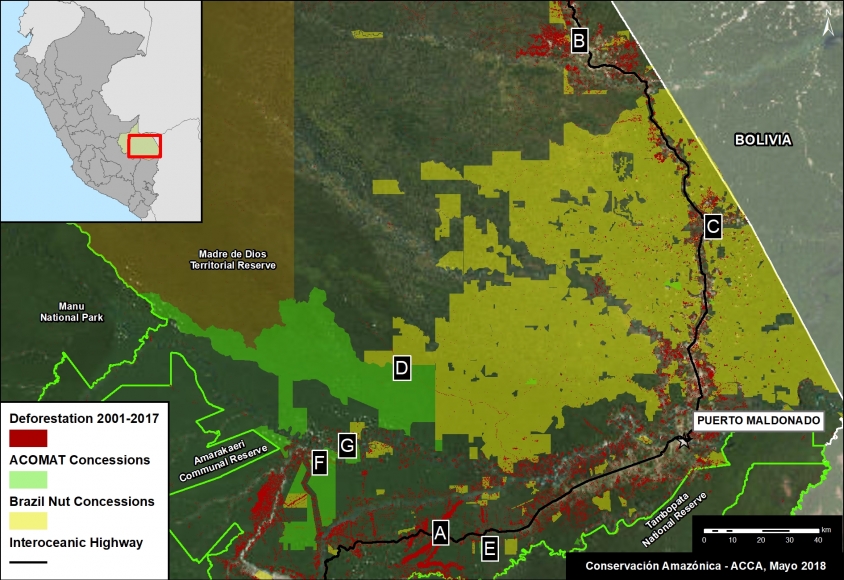
Gold Mining (yellow)
*With dot indicates within protected area
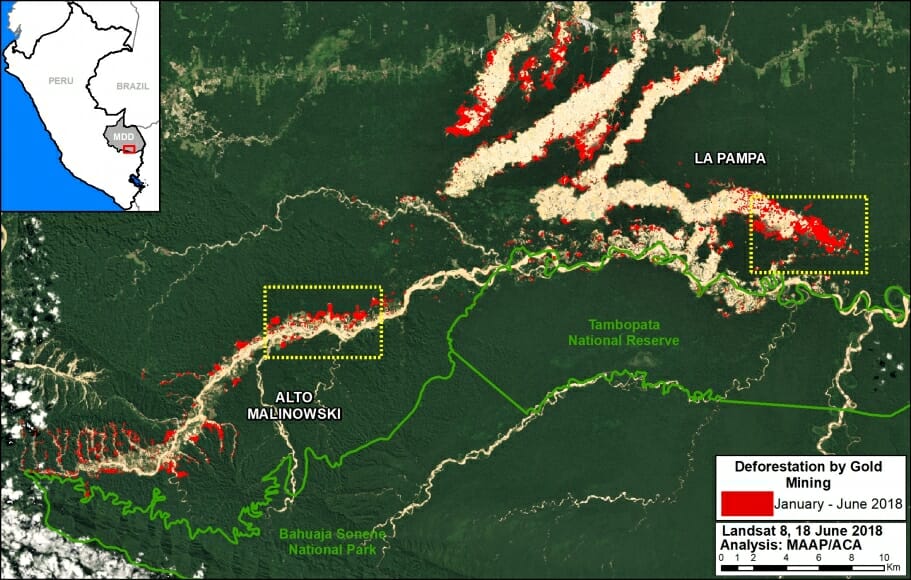
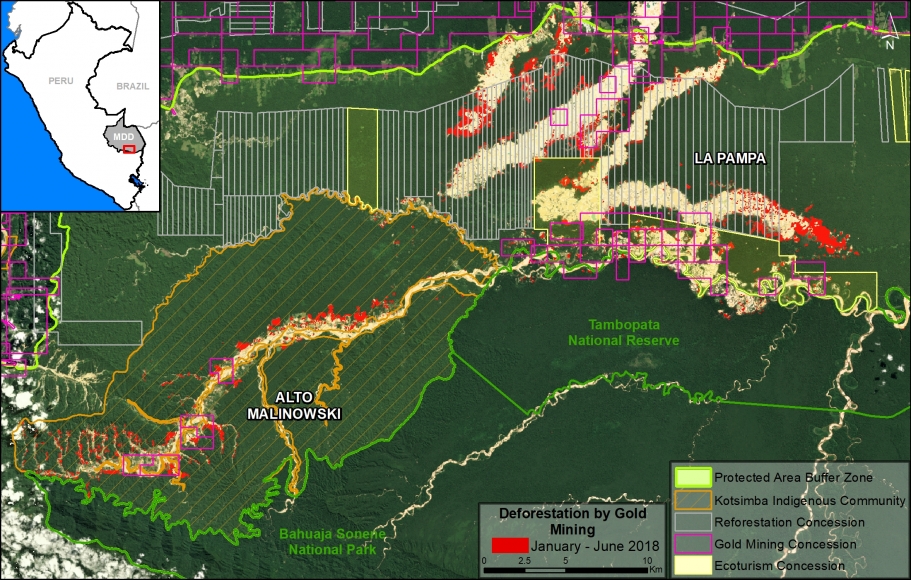
The area that has been most impacted by gold mining is clearly the southern Peruvian Amazon, where we estimate the total deforestation of more than 63,800 hectares. Of this, at least 7,000 hectares have been lost since 2013. The two most critical zones are La Pampa and Alto Malinowski in Madre de Dios (MAAP #87, MAAP #75, MAAP #79). Another critical area exists in Cusco in the buffer zone of the Amarakaeri Communal Reserve, where mining deforestation is now less than one kilometer from the boundary of the protected area (MAAP #71).
It is important to highlight two important cases in which the Peruvian government has taken effective actions to halt illegal mining within protected areas (MAAP #64). In September 2015, illegal miners invaded Tambopata National Reserve and deforested 550 hectares over the course of a two-year period. At the end of 2016, the government intensified its interventions and the invasion was halted in 2017. In regards to Amarakaeri Communal Reserve, in June 2015 we revealed the mining invasion deforestation of 11 hectares. Over the course of the following weeks, SERNANP and ECA Amarakaeri implemented measures and rapidly halted the illegal activity.
Other small gold-mining fronts are emerging in the northern and central Peruvian Amazon (MAAP #45, MAAP #49).
In addition, we have also documented deforestation linked to illegal gold-mining activities in the Puinawai National Park in the Colombian Amazon.
Logging
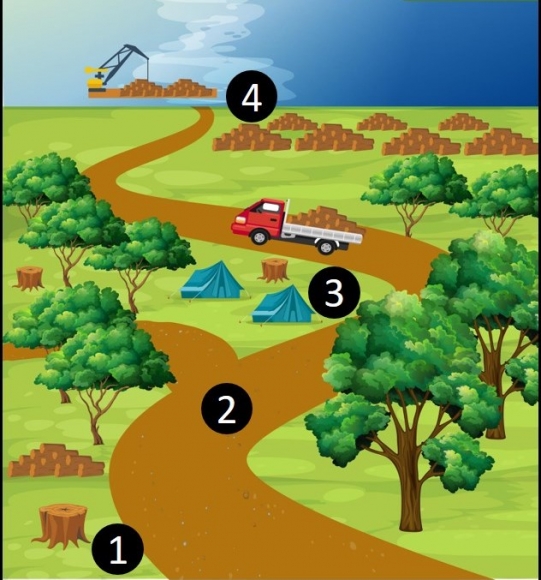
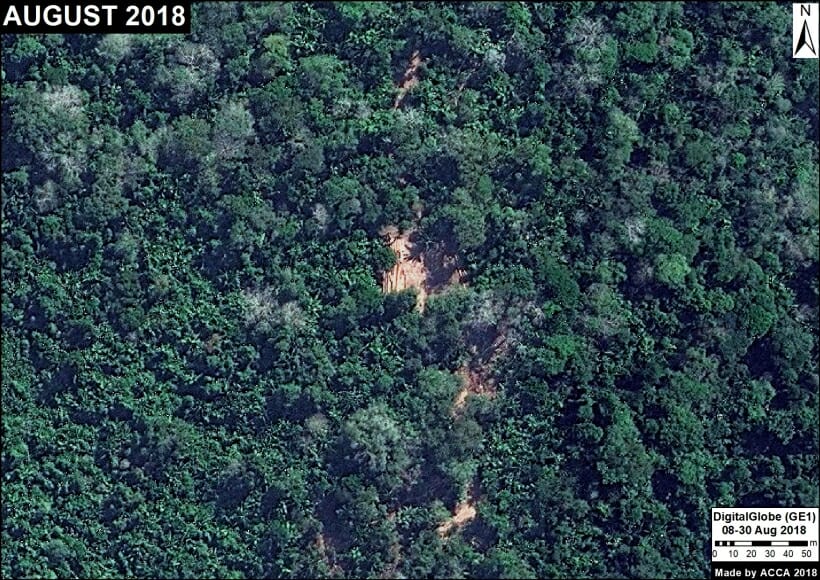
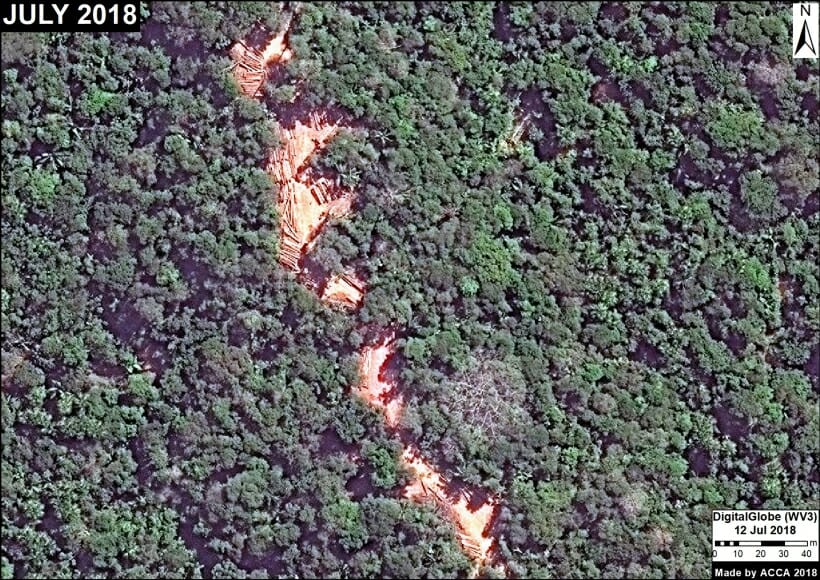
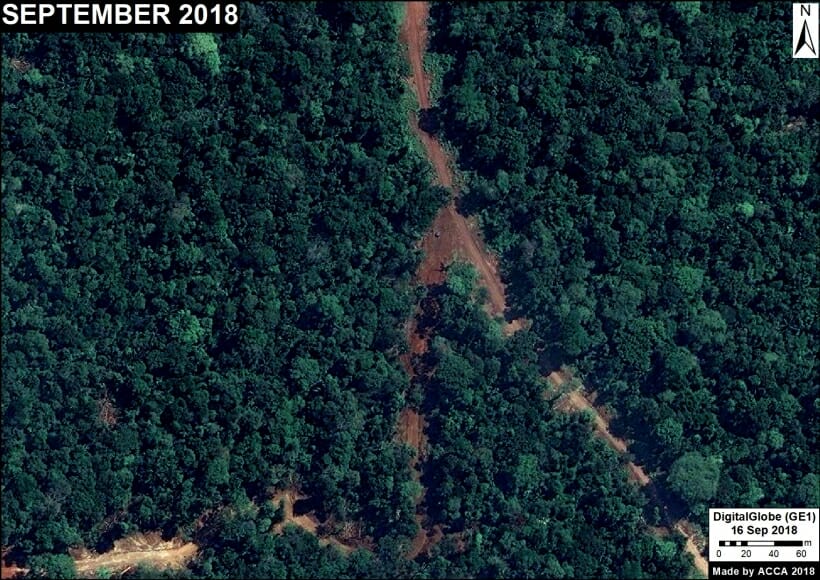
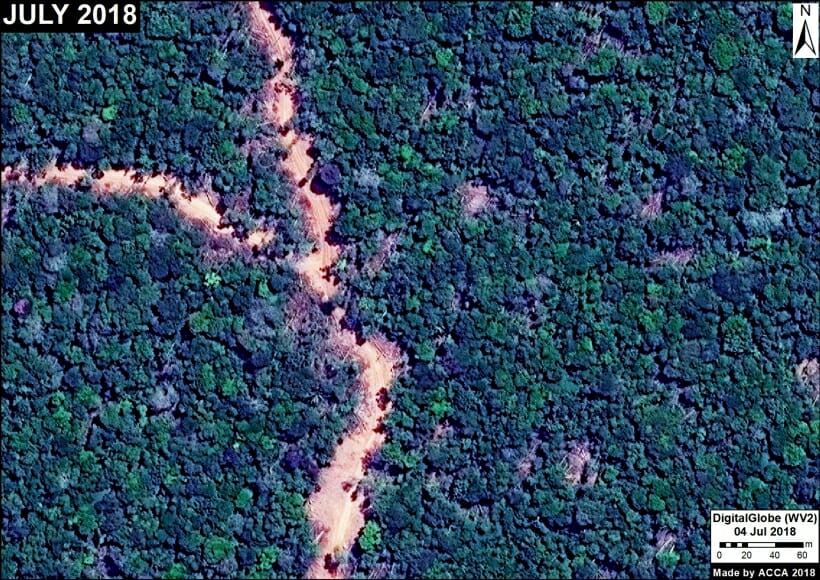
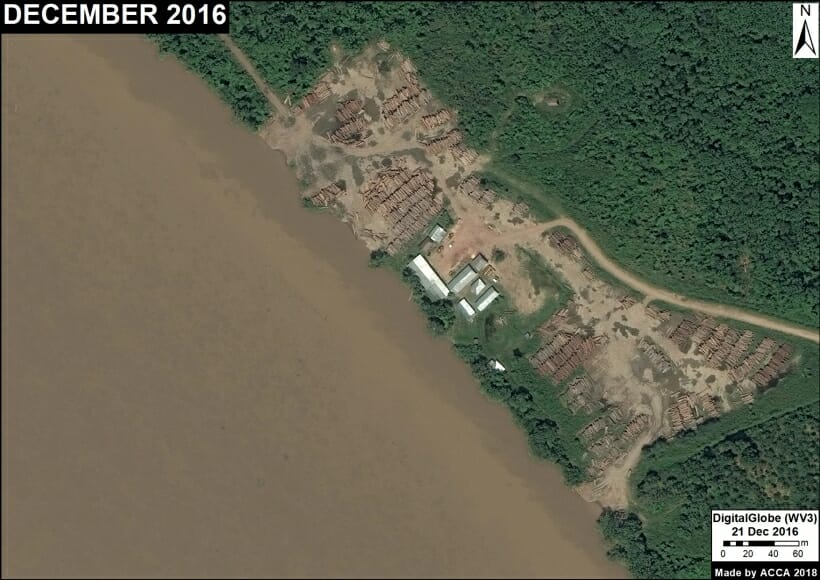
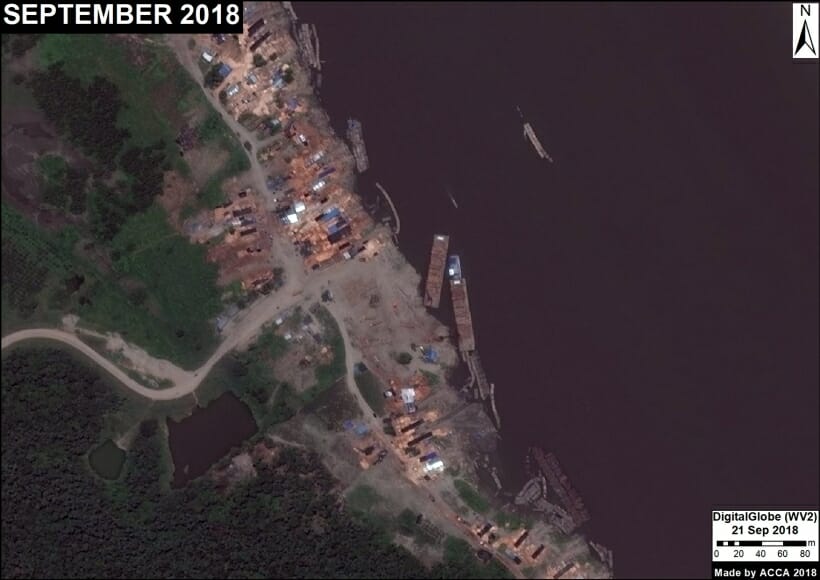
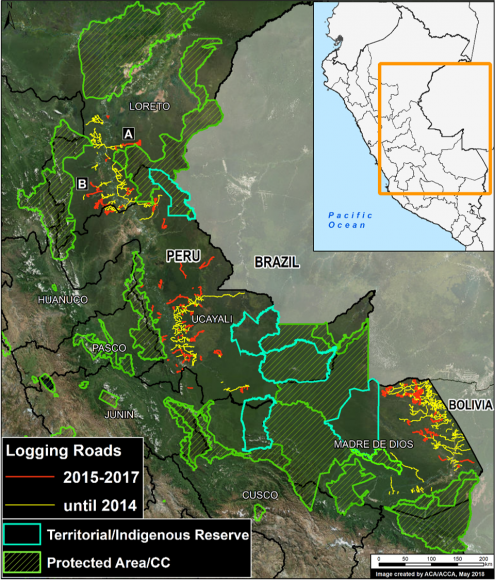
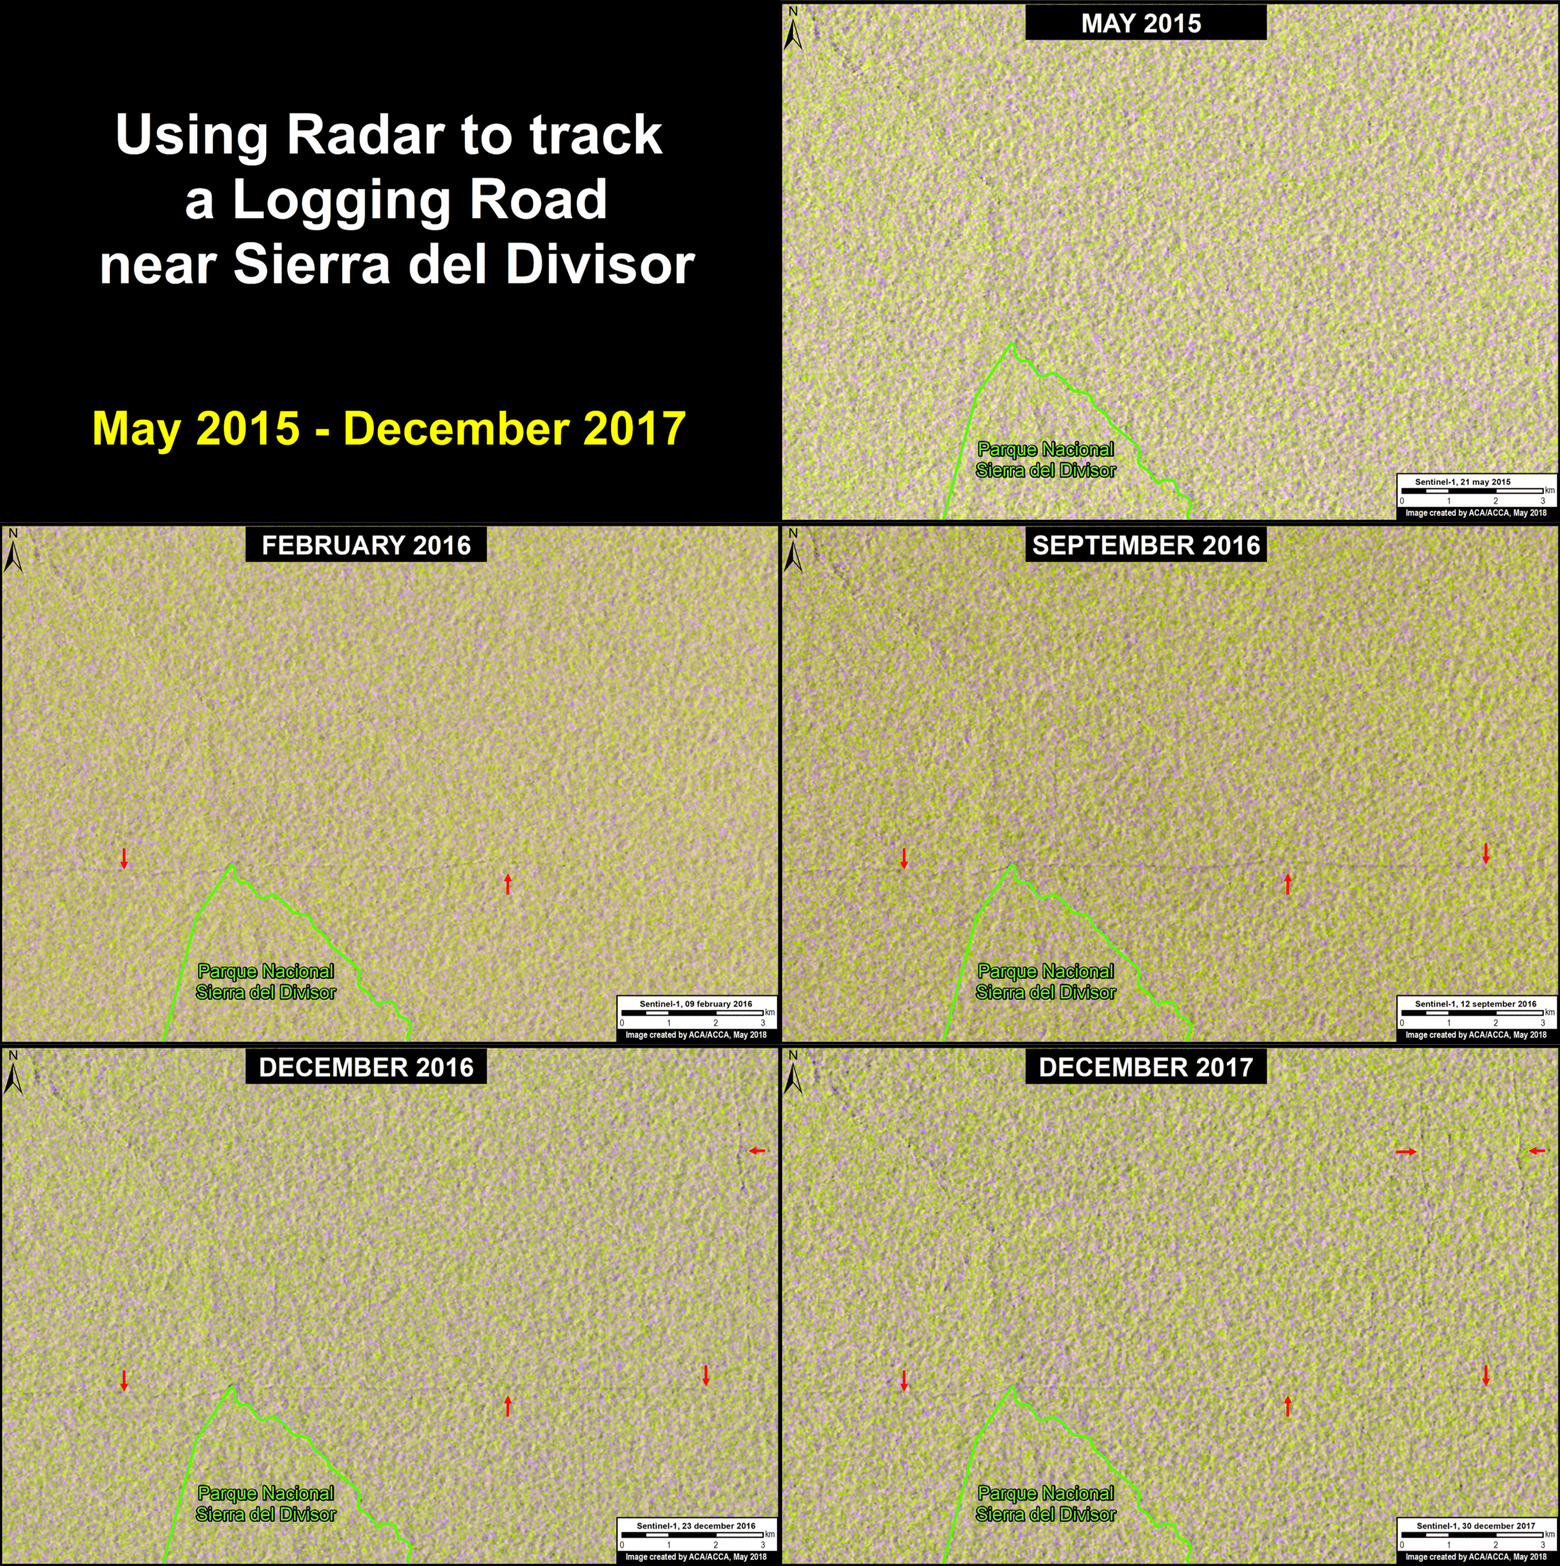
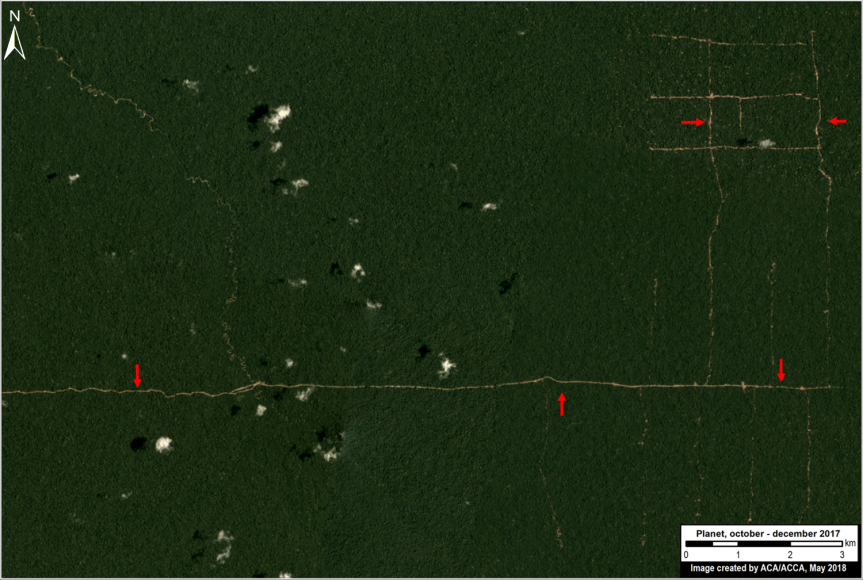
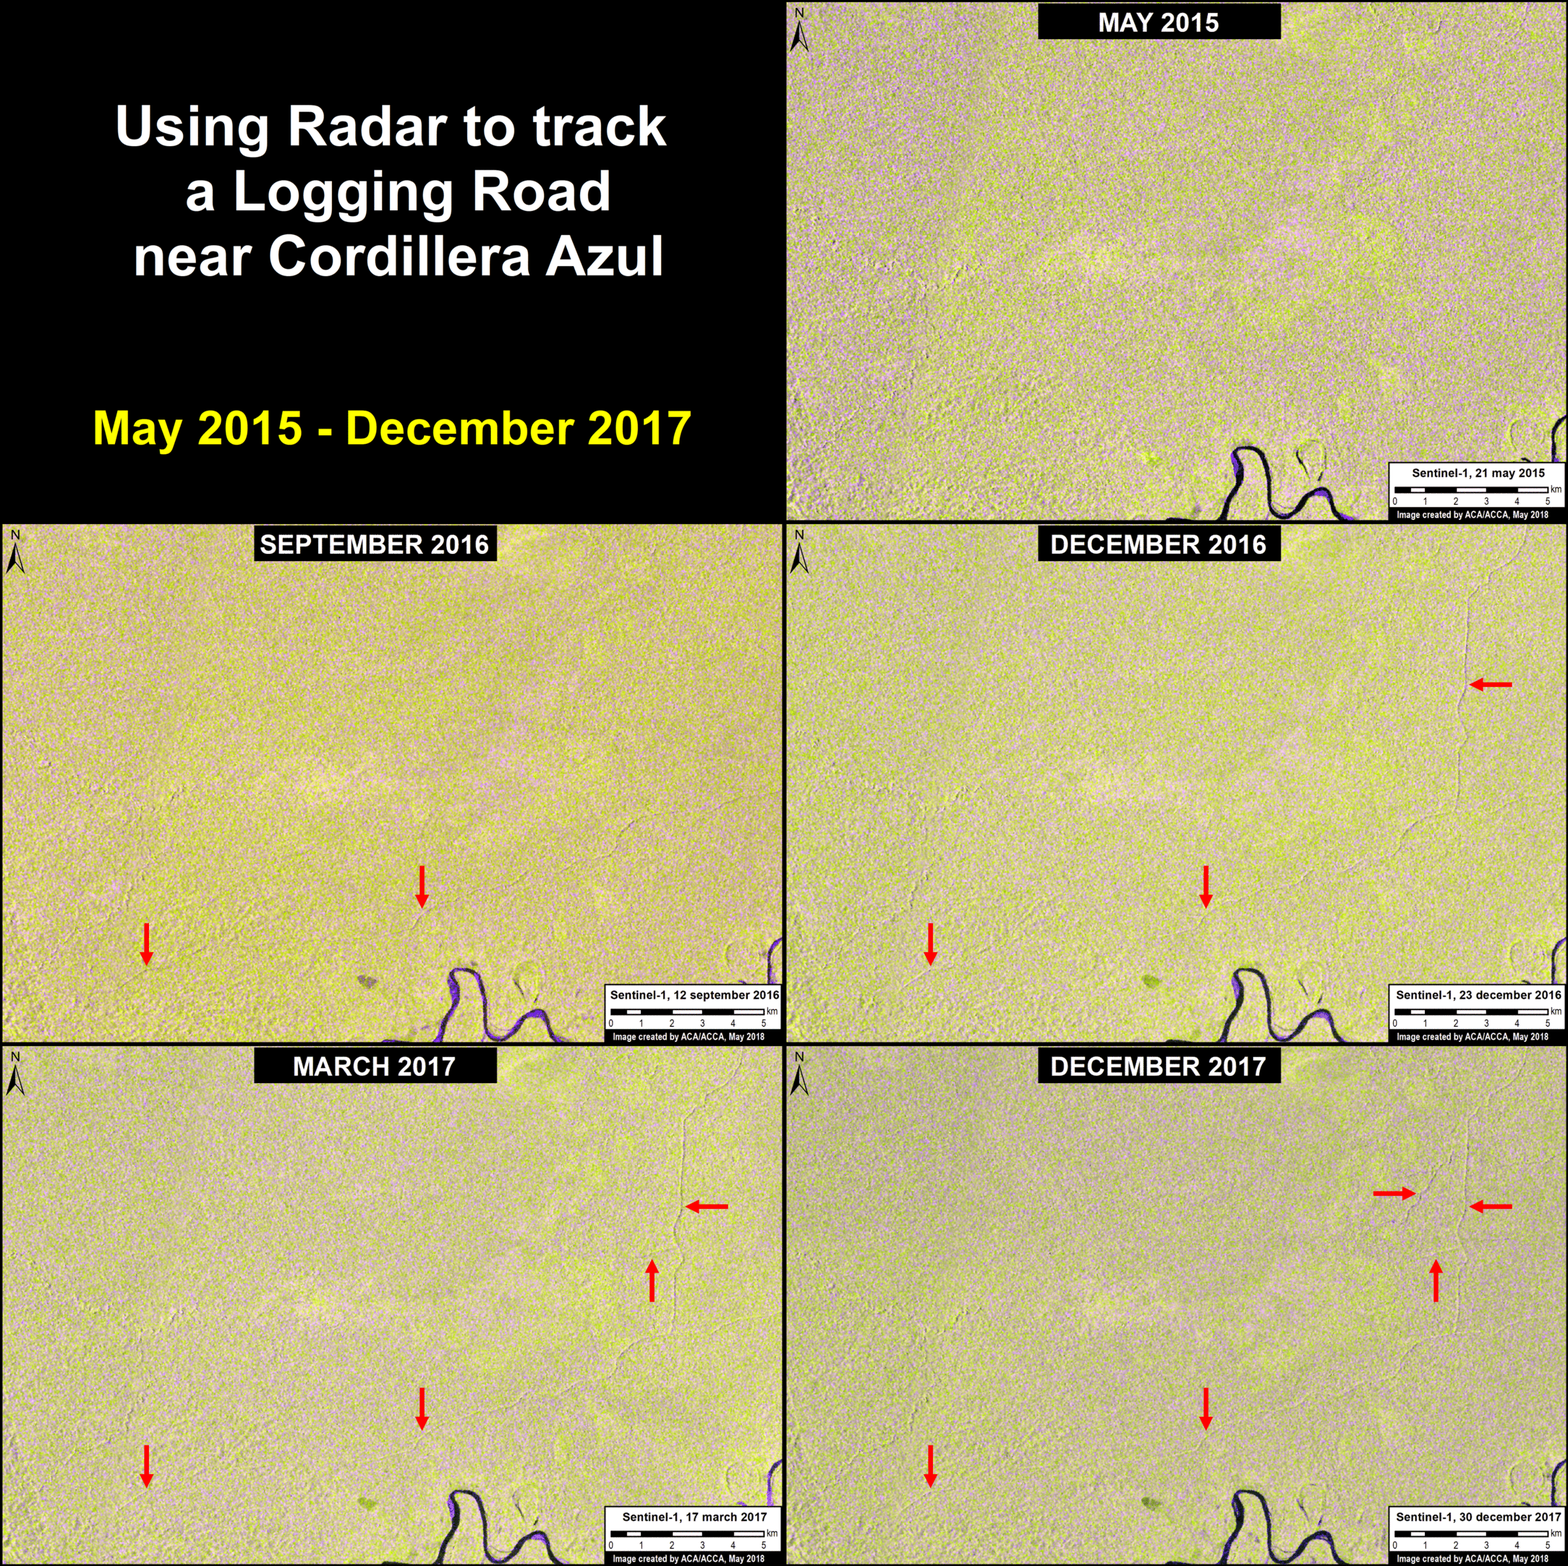
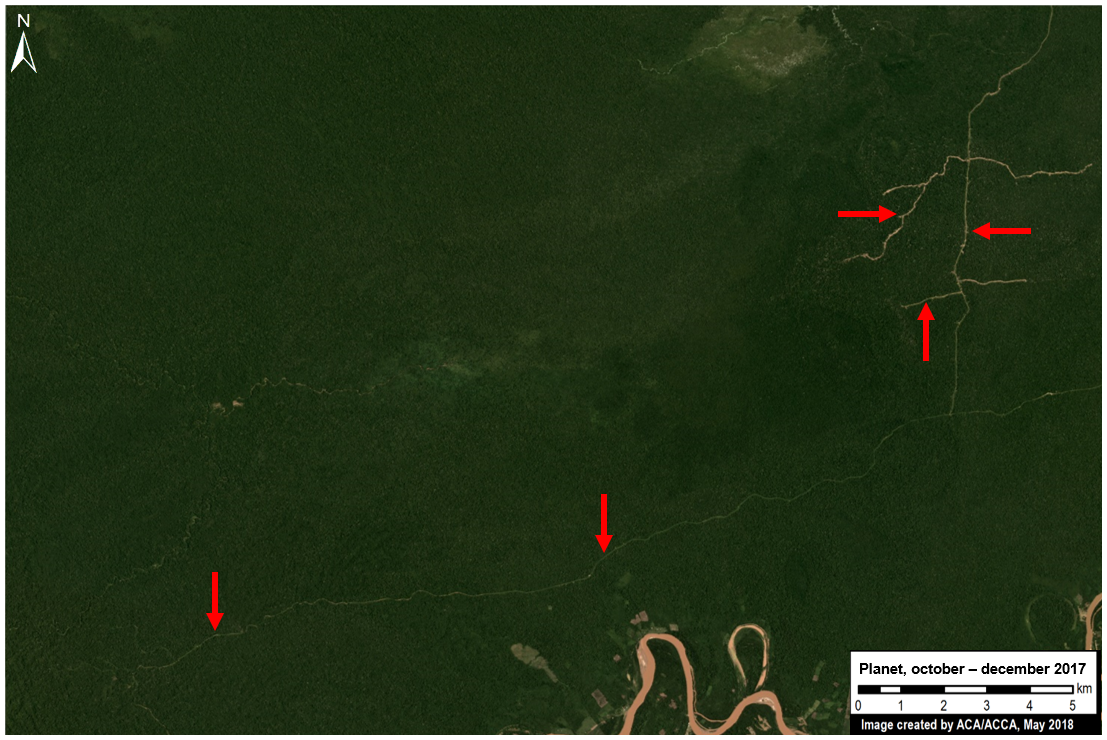
In MAAP #85 we proposed a new tool to address illegal logging in the Peruvian Amazon: utilize satellite imagery to monitor construction of logging roads in near real-time.
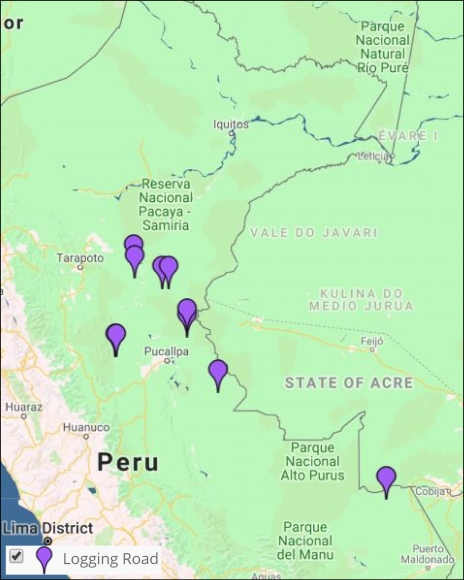
Image 7 shows the results of the Interactive Map when applying the “Logging roads” filter.
Legend:
Logging Road (purple)
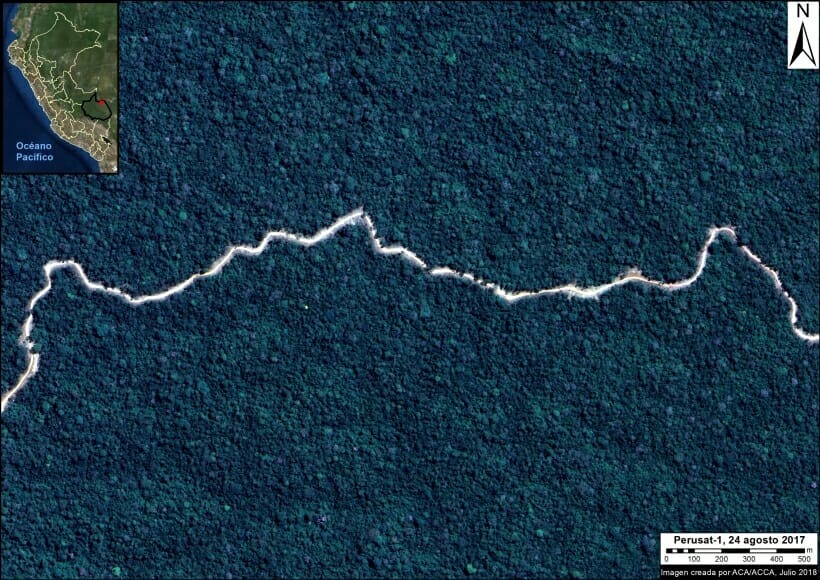
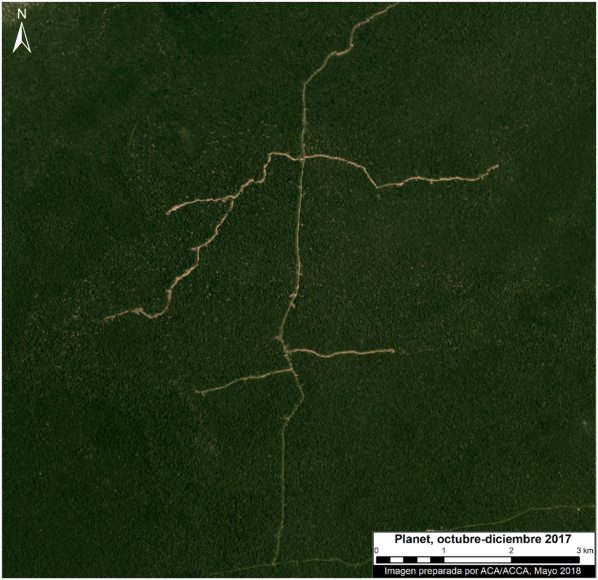
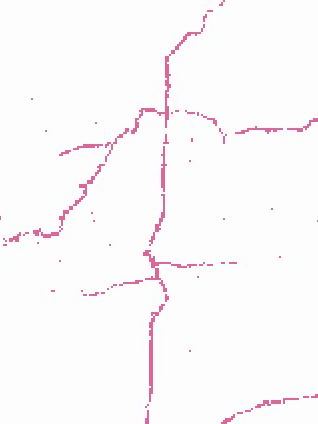
We estimate that 2,200 kilometers of forest roads have been constructed in the Peruvian Amazon during the last three years (2015-2017). The roads are concentrated in southern Loreto, Ucayali, and northwestern Madre de Dios.
Roads
It has been well-documented that roads are one of the most important drivers of deforestation in the Amazon, particularly due to the fact that they facilitate human access and activities related to agriculture, cattle ranching, mining, and logging.
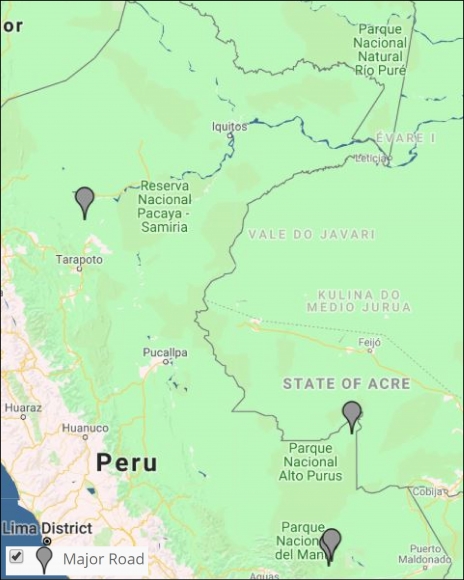
Image 8 shows the results of the Interactive Map when applying the “Roads” filter.
Legend:
Road (gray)
We have analyzed two controversial proposed roads in Madre de Dios, Peru.
The Nuevo Edén – Boca Manu – Boca Colorado road would traverse the buffer zone of two protected areas: Amarakaeri Communal Reserve and Manu National Park (MAAP #29).
The other, the Puerto Esperanza-Iñapari road, would traverse the Purús National Park and threaten the territory of the indigenous peoples in voluntary isolation who live in this remote area (MAAP #76).
Hydroelectric dams
Image 9 shows the results of the Interactive Map when applying the “Dams” filter.
Legend:
Hydroelectric Dam (light blue)
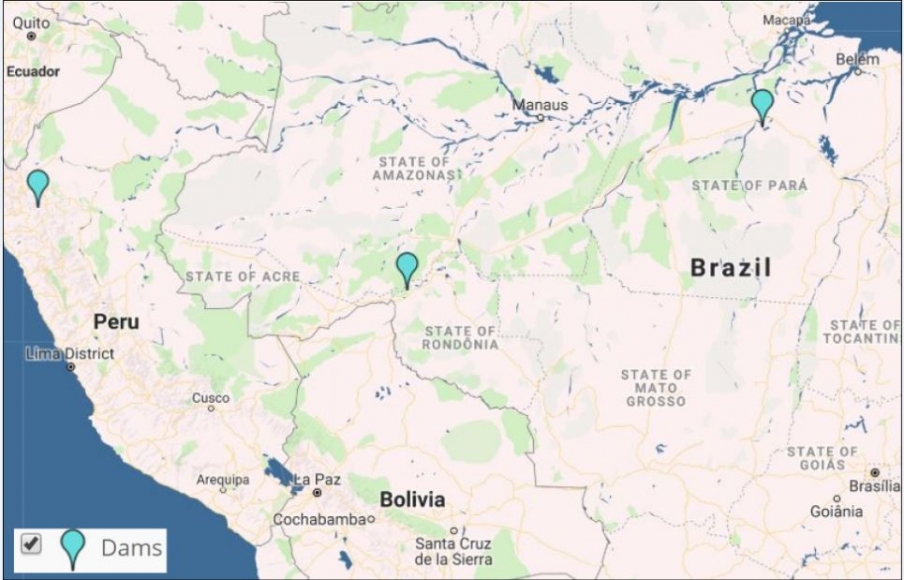 To date, we have analyzed three hydroelectric dams located in Brazil. We have documented the loss of 36,100 hectares of forest associated with flooding produced by two dams (San Antonio and Jirau) on the Madeira River near the border with Bolivia (MAAP #34). We also analyzed the controversial Belo Monte hydroelectrical complex located on the Xingú River, adn estimate that 19,880 hectares of land have been flooded. According to the imagery, this land is a combination of forested areas and agricultural areas (MAAP #66).
Additionally, we show a very high-resolution image of the exact location of the proposed Chadín-2 hydroelectric dam on the Marañón River in Peru (MAAP #80).
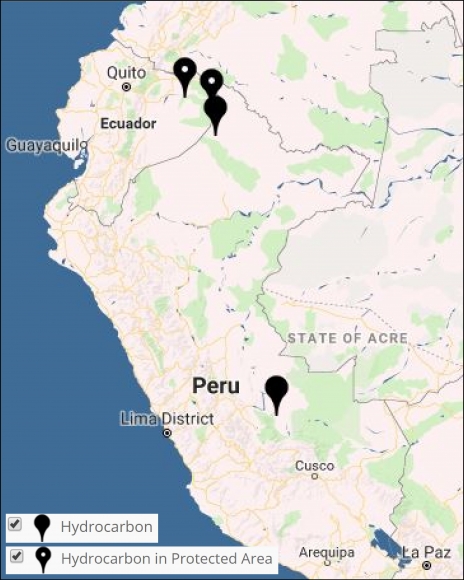
Hydrocarbon (oil and gas)
Image 10 shows the results of the Interactive Map when applying the “Hydrocarbon“ filter.
Legend:
Hydrocarbon (black)
Our first report on this sector focused on Yasuní National Park in the Ecuadorian Amazon. We documented the direct and indirect deforestation amounts of 417 hectares (MAAP #82).
We also show the location of recent deforestation in two hydrocarbon block in Peru: Block 67 in the north and Blocks 57 in the south.
Climate Change
Tropical forests, especially the Amazon, sequester huge amounts of carbon, one of the main greenhouse gases driving climate change.
In MAAP #81, we estimated the loss of 59 million metric tons of carbon in the Peruian Amazon during the last five years (2013-17) due to forest loss, especially deforestation from mining and agricultural activities. This finding reveals that forest loss represents nearly half (47%) of Peru’s annual carbon emissions, including from burning fossil fuels.
In contrast, in MAAP #83 we show that protected areas and indigenous lands have safeguarded 3.17 billion metric tons of carbon, as of 2017. That is the equivalent to 2.5 years of carbon emissions from the United States.
The breakdown of results are:
1.85 billion tons safeguarded in the Peruvian national protected areas system;
1.15 billion tons safeguarded in titled native community lands; and
309.7 million tons safeguarded in Territorial Reserves for indigenous peoples in voluntary isolation.
Citation
Finer M, Mamani N (2018) Deforestation in the Andean Amazon (Trends, Hotspots, Drivers). MAAP Synthesis #3.
