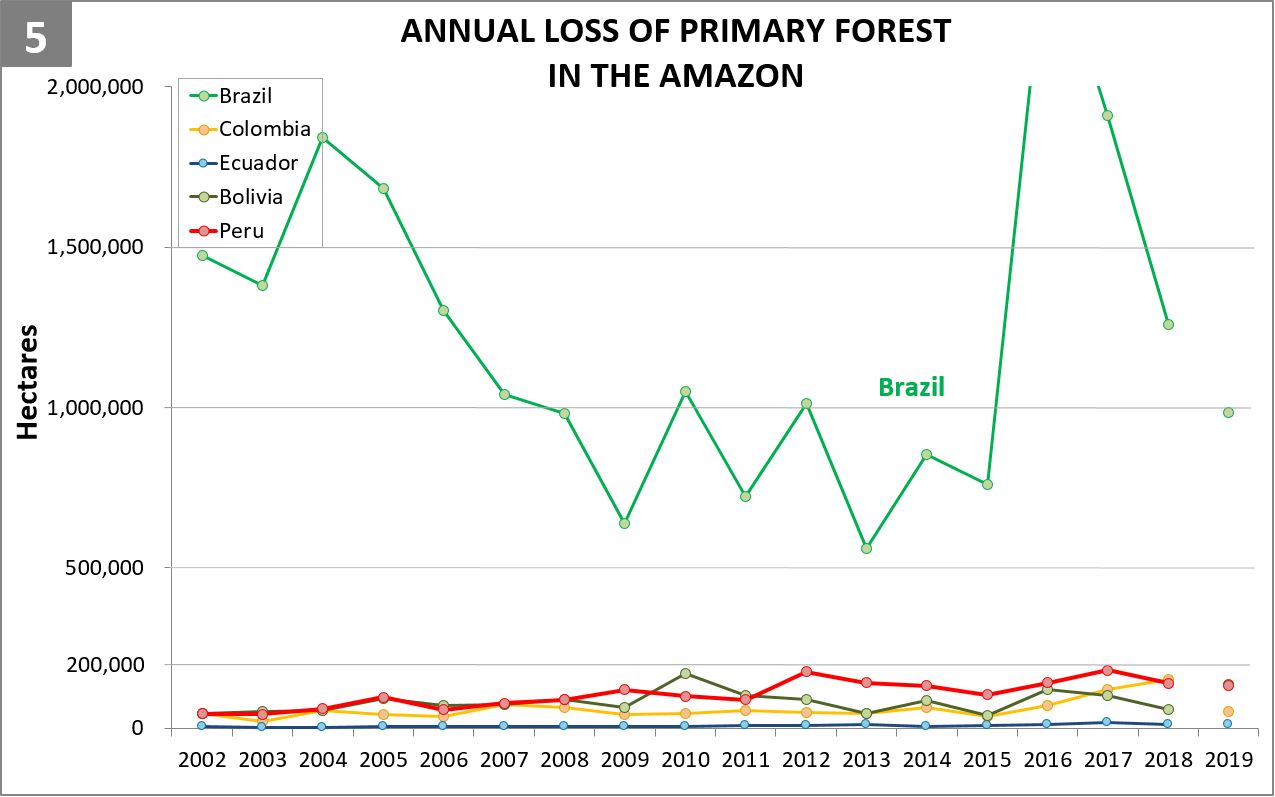
Newly released data for 2019 reveals the loss of over 1.7 million hectares (4.3 million acres) of primary Amazon forest in our 5 country study area (Bolivia, Brazil, Colombia, Ecuador, and Peru).* That is twice the size of Yellowstone National Park.
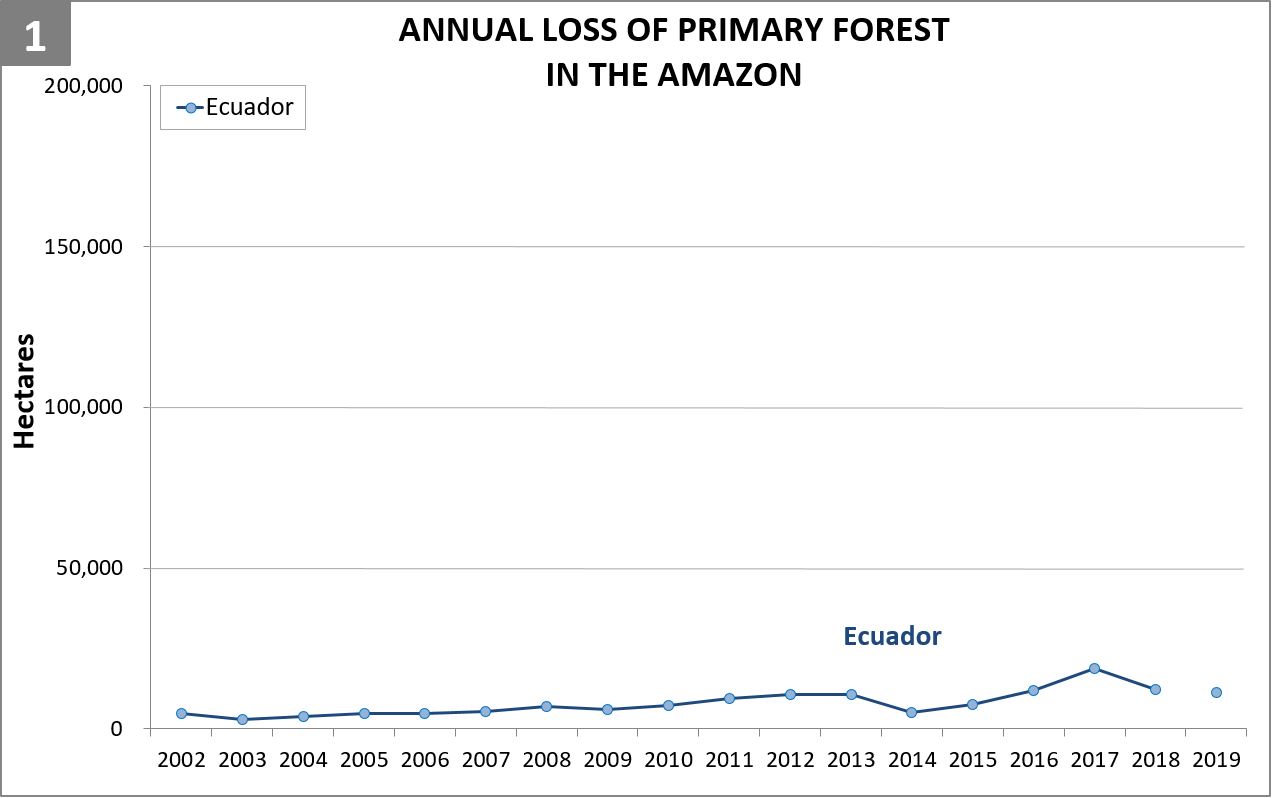
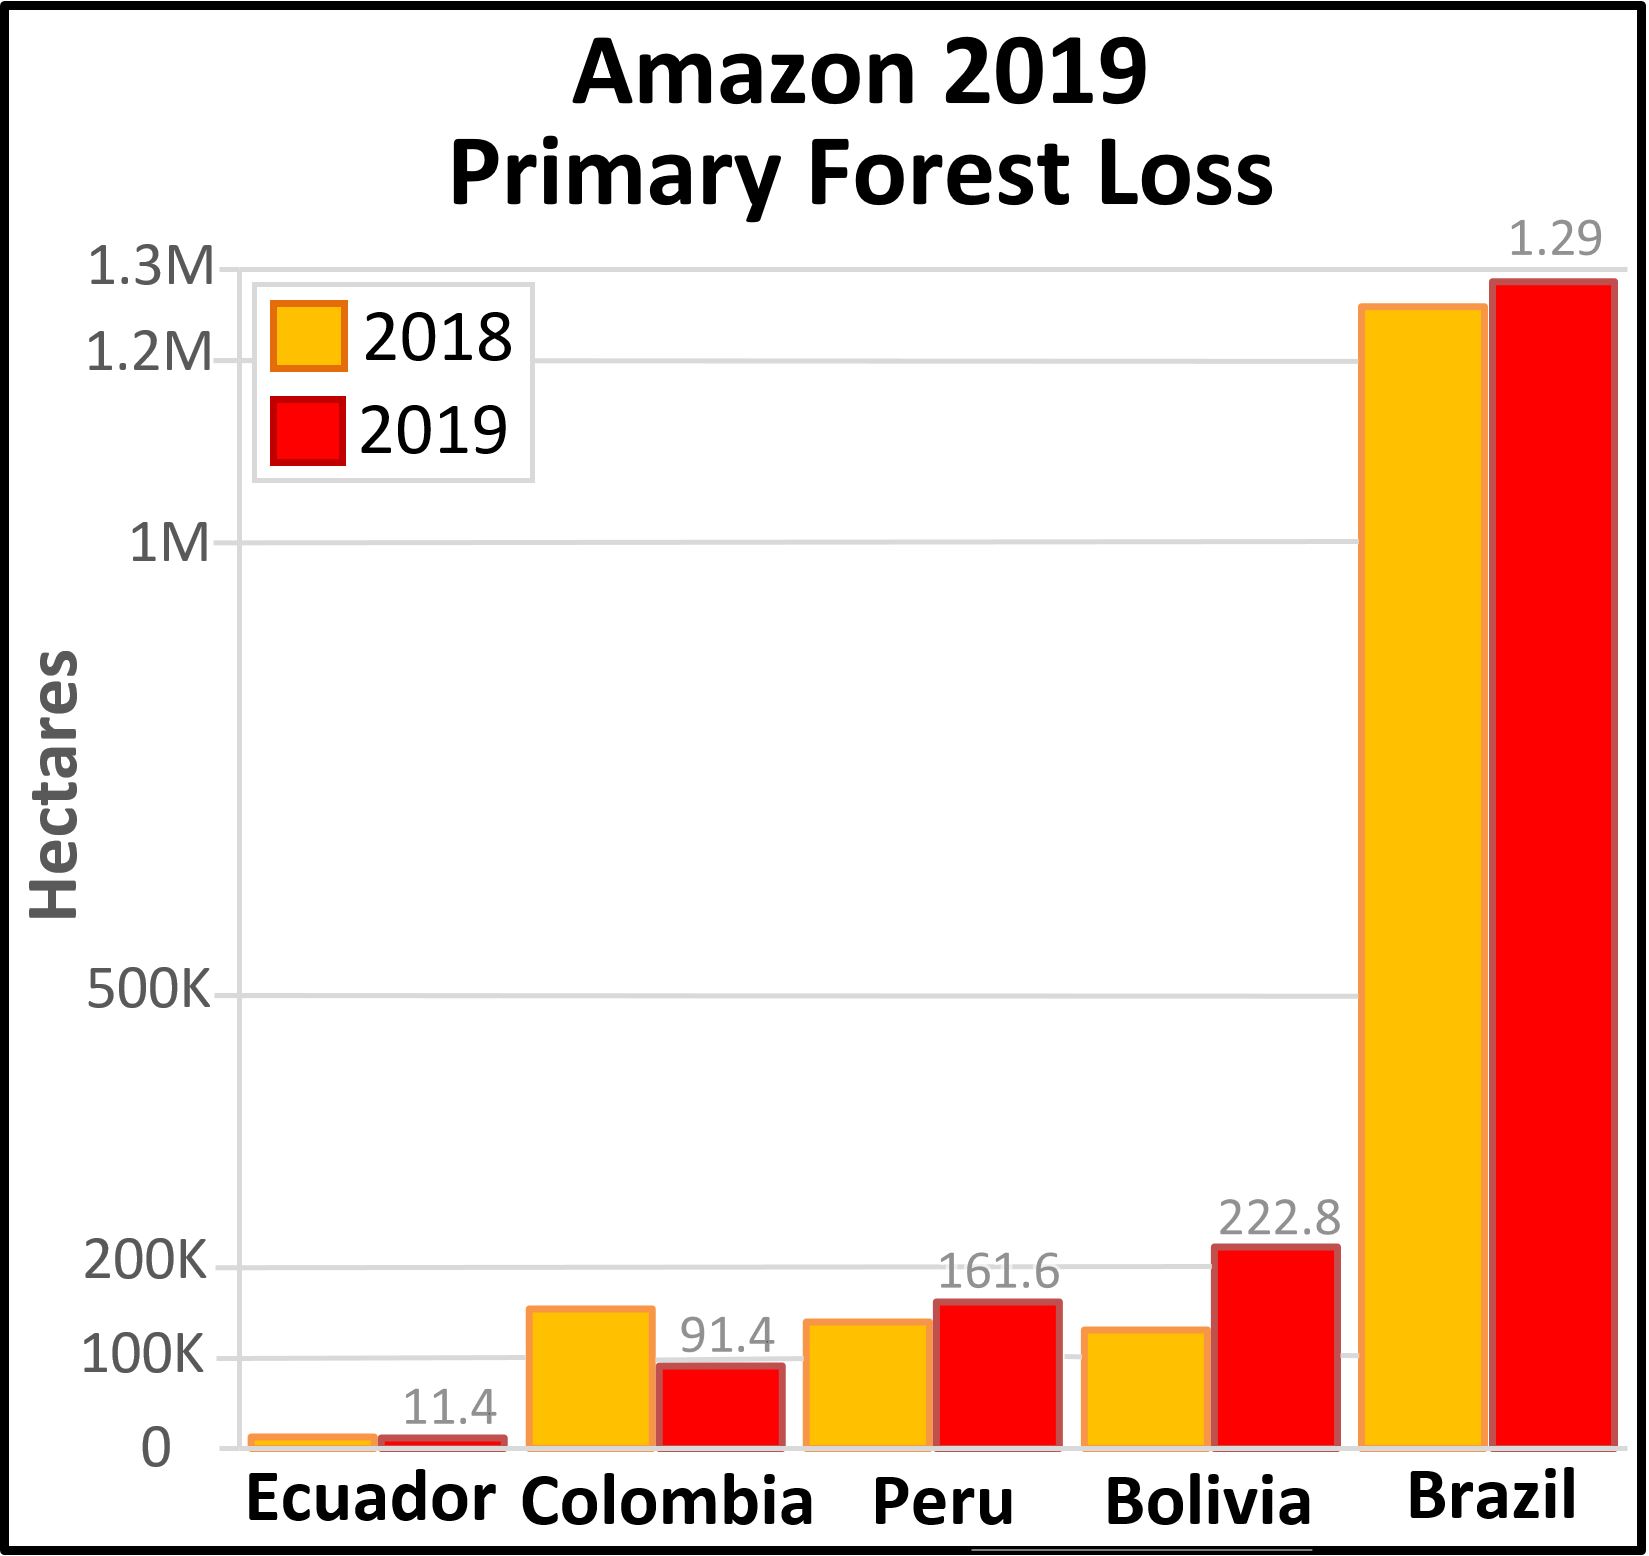
Table 1 shows 2019 deforestation (red) in relation to 2018 (orange).
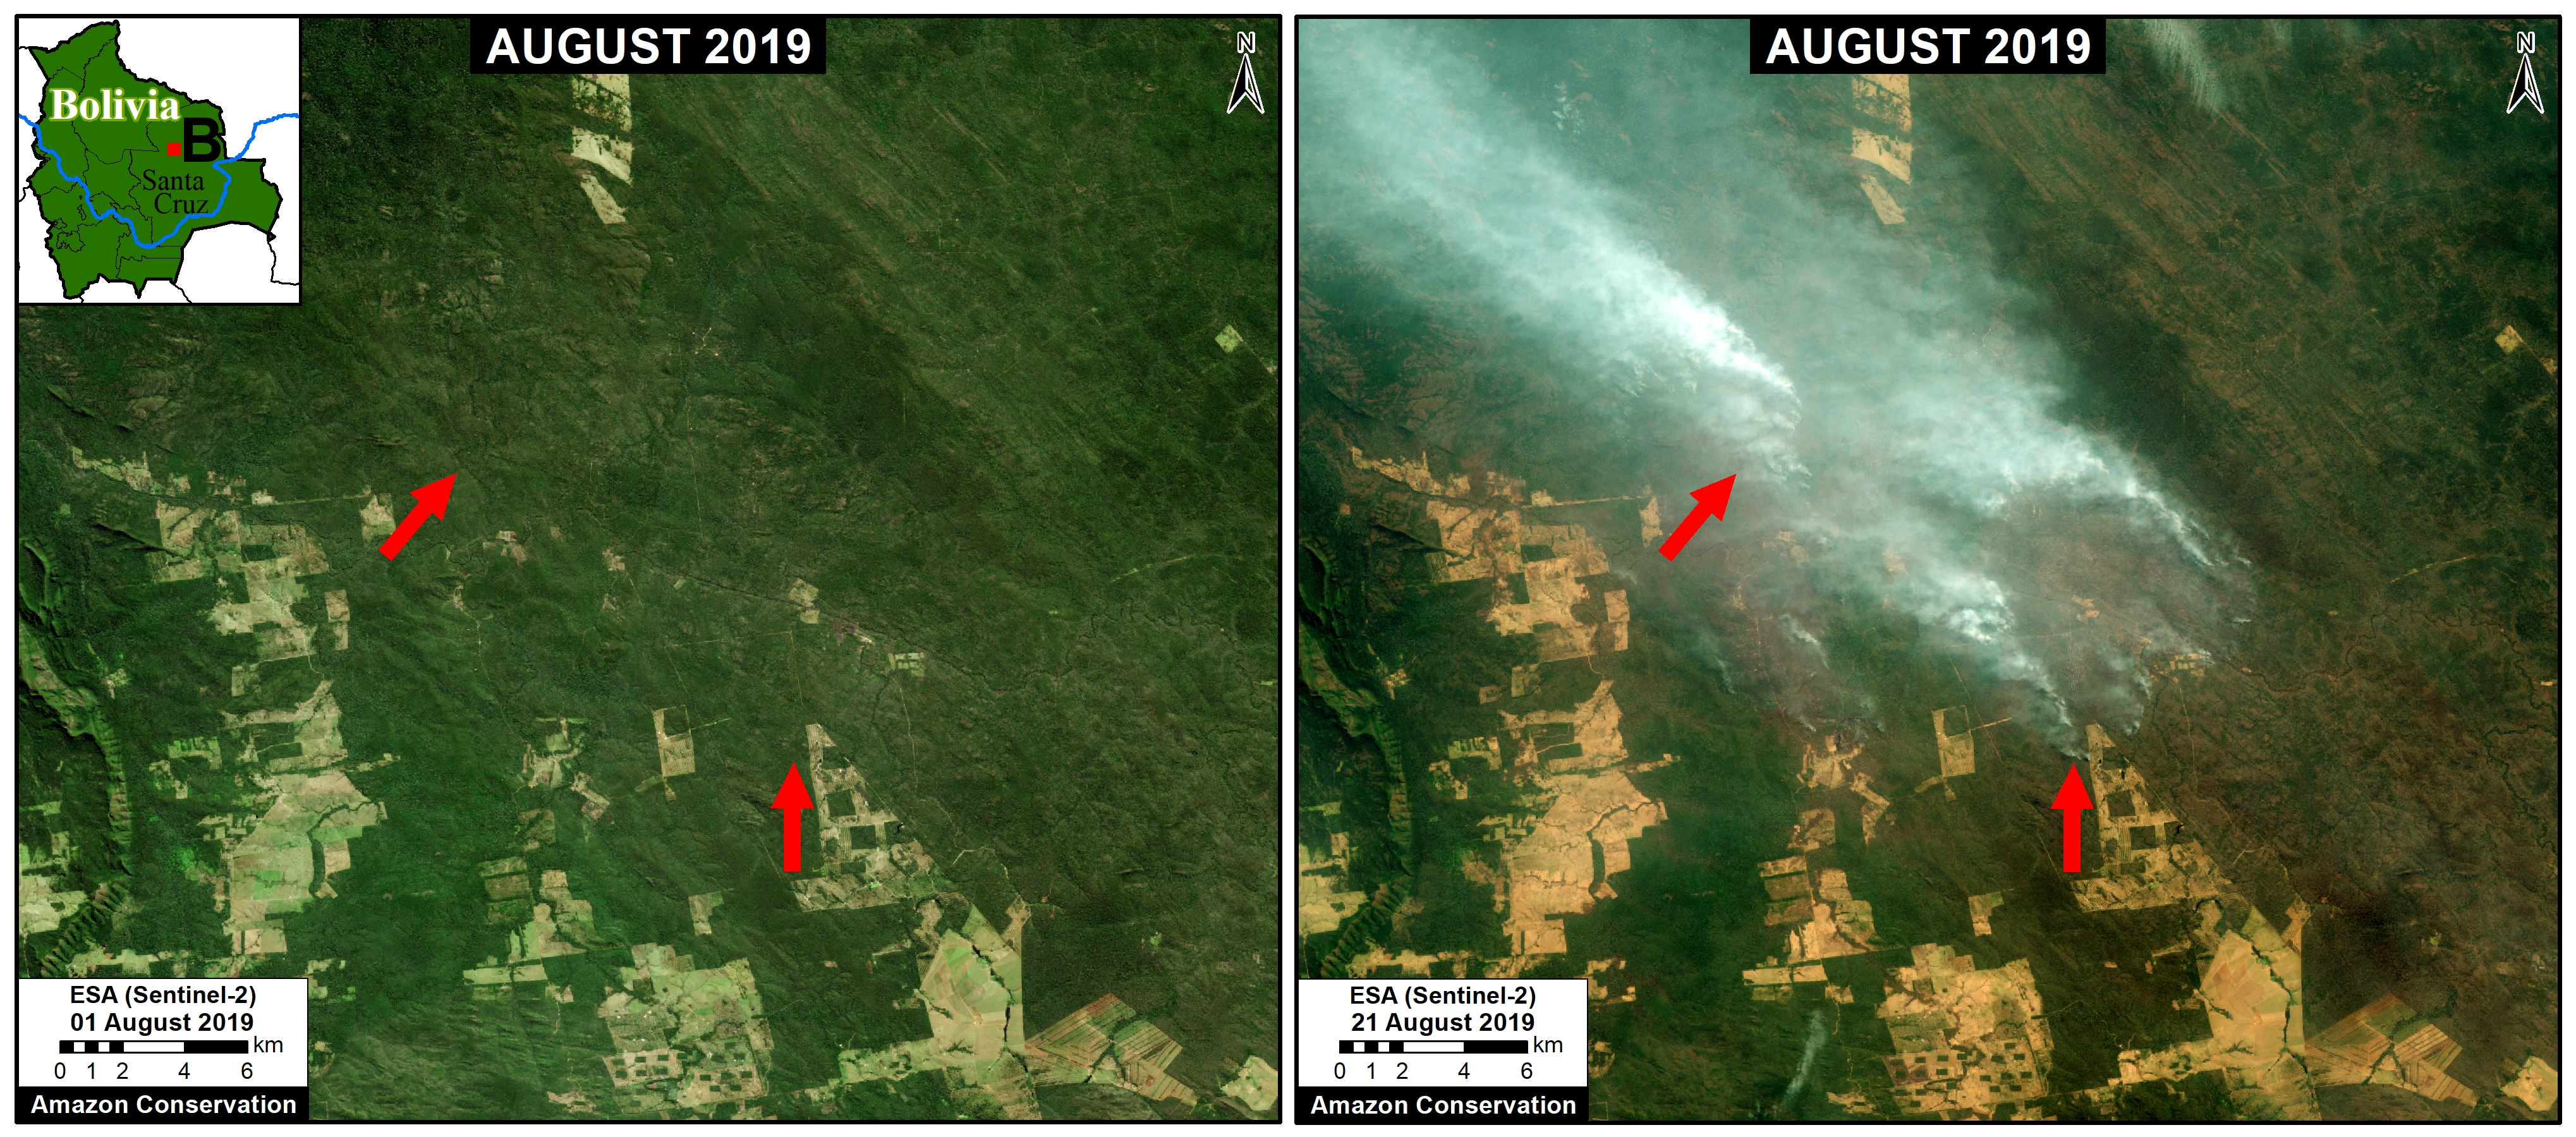
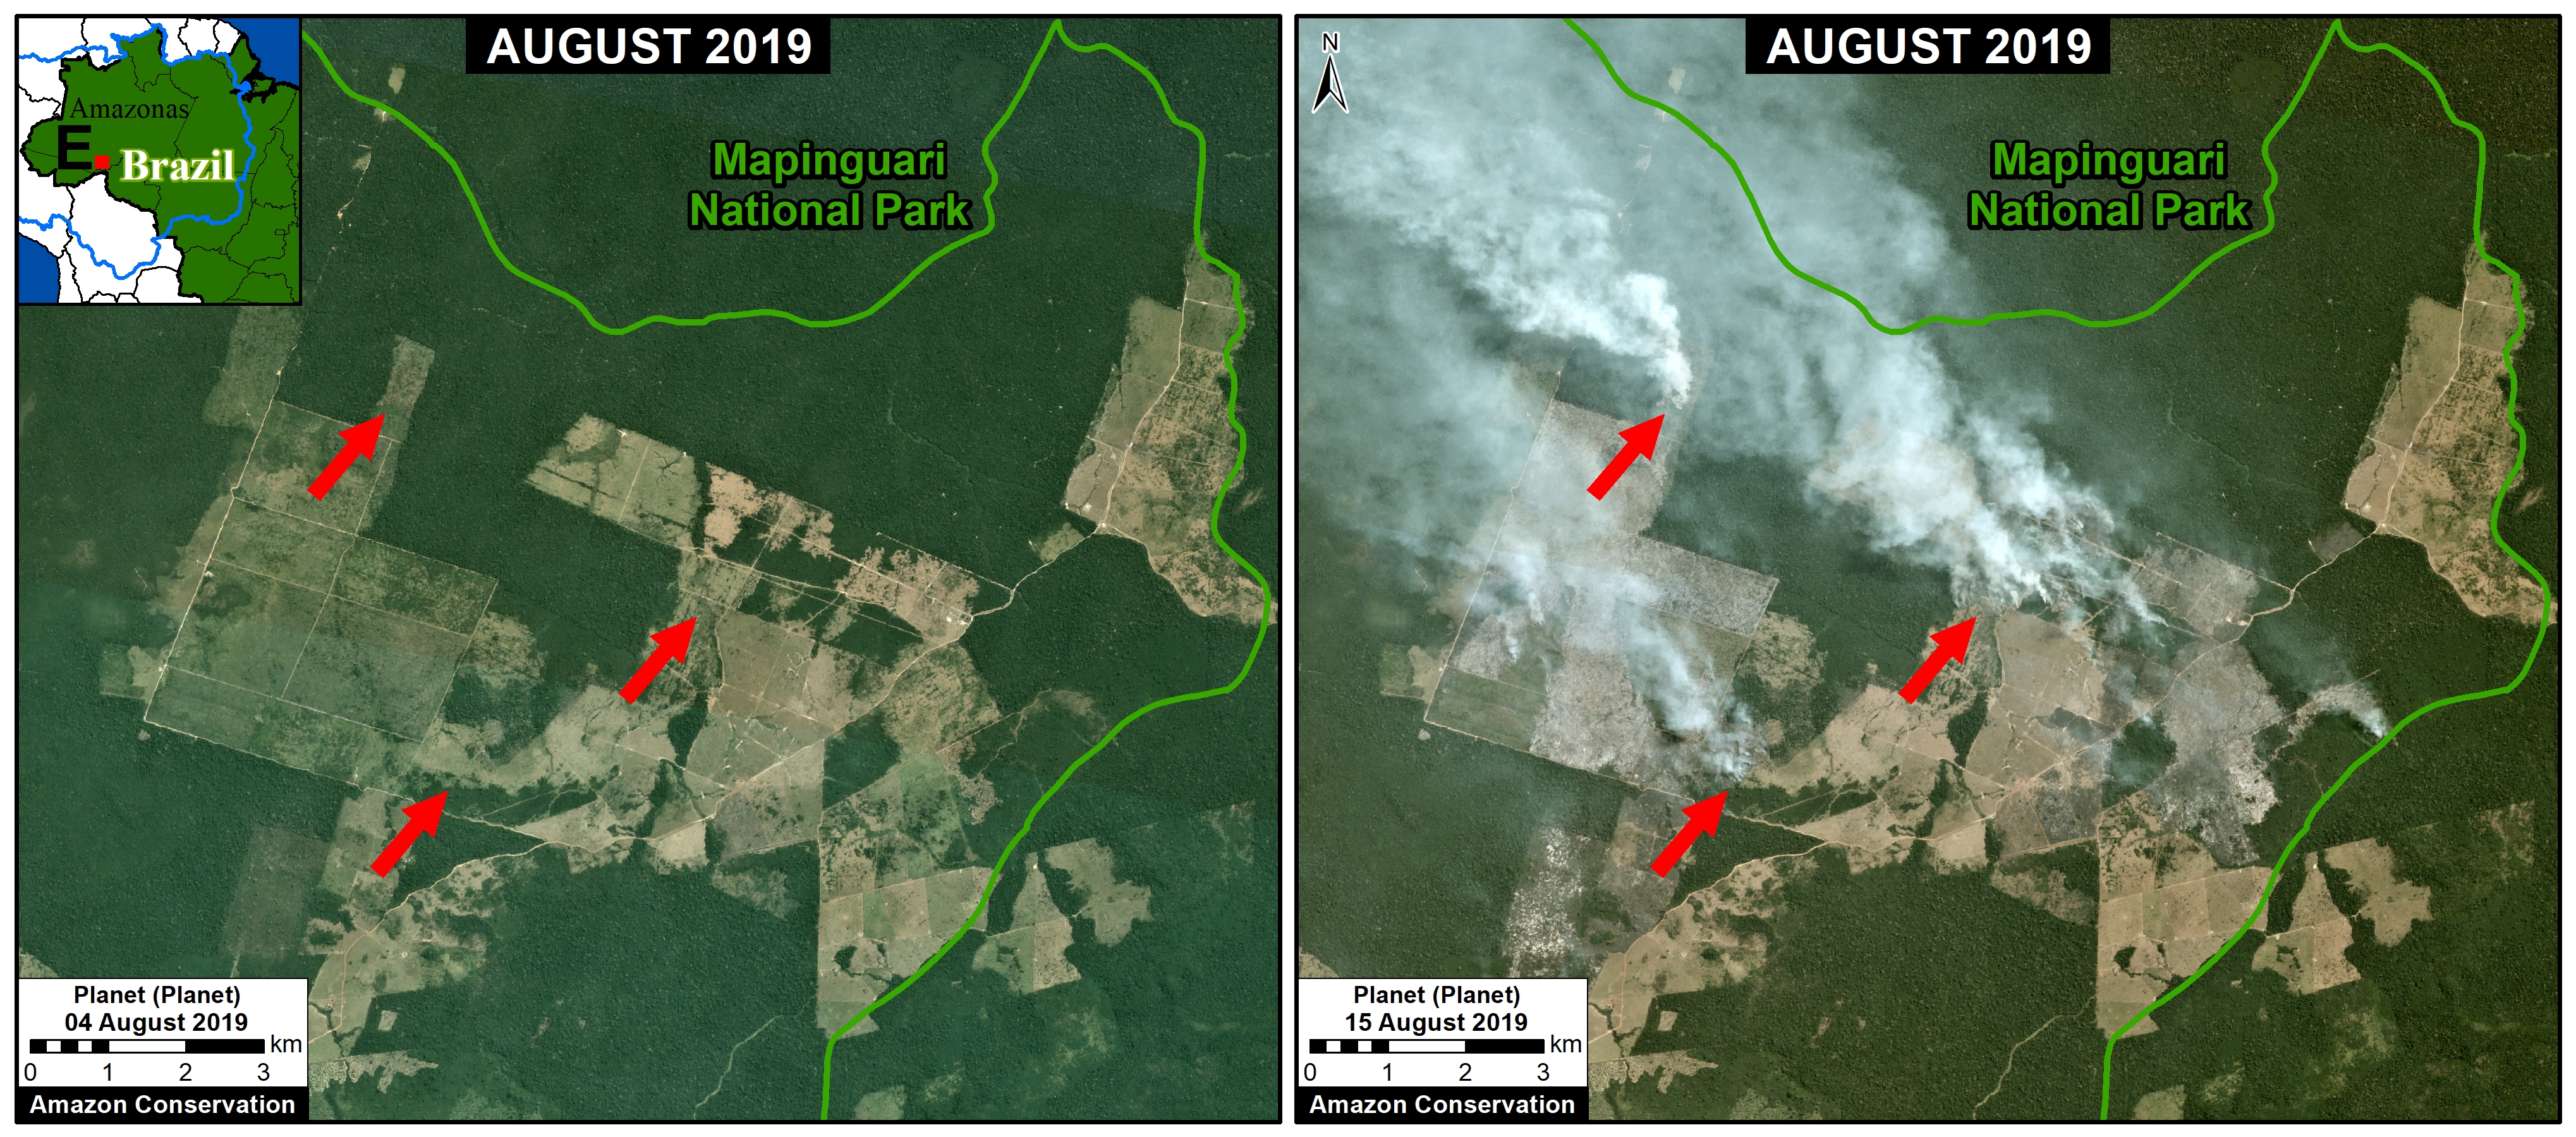
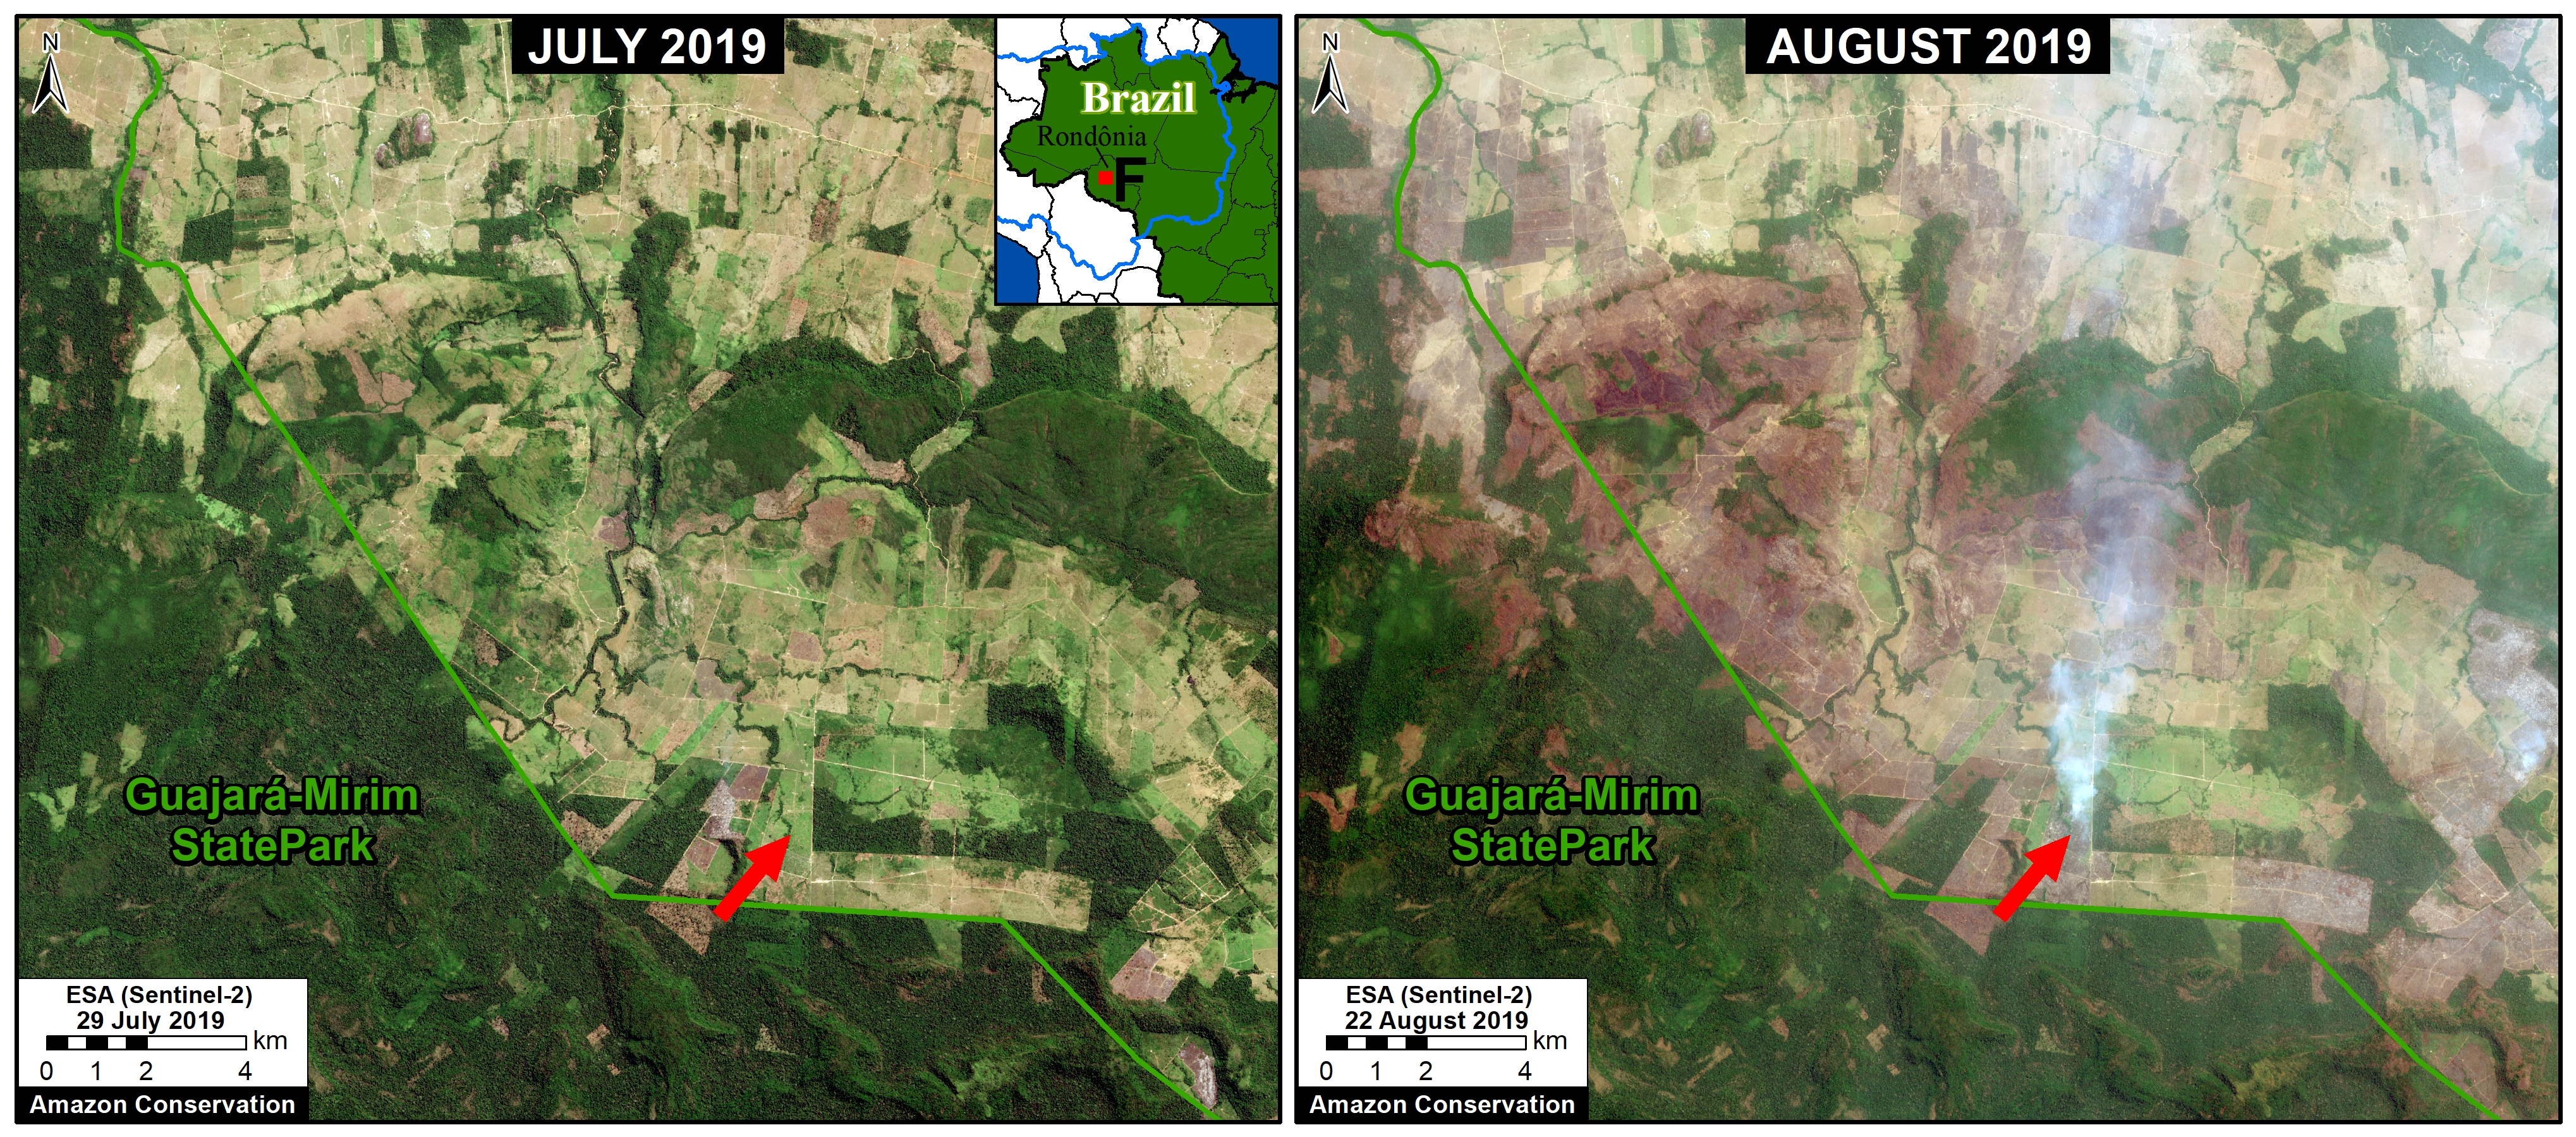
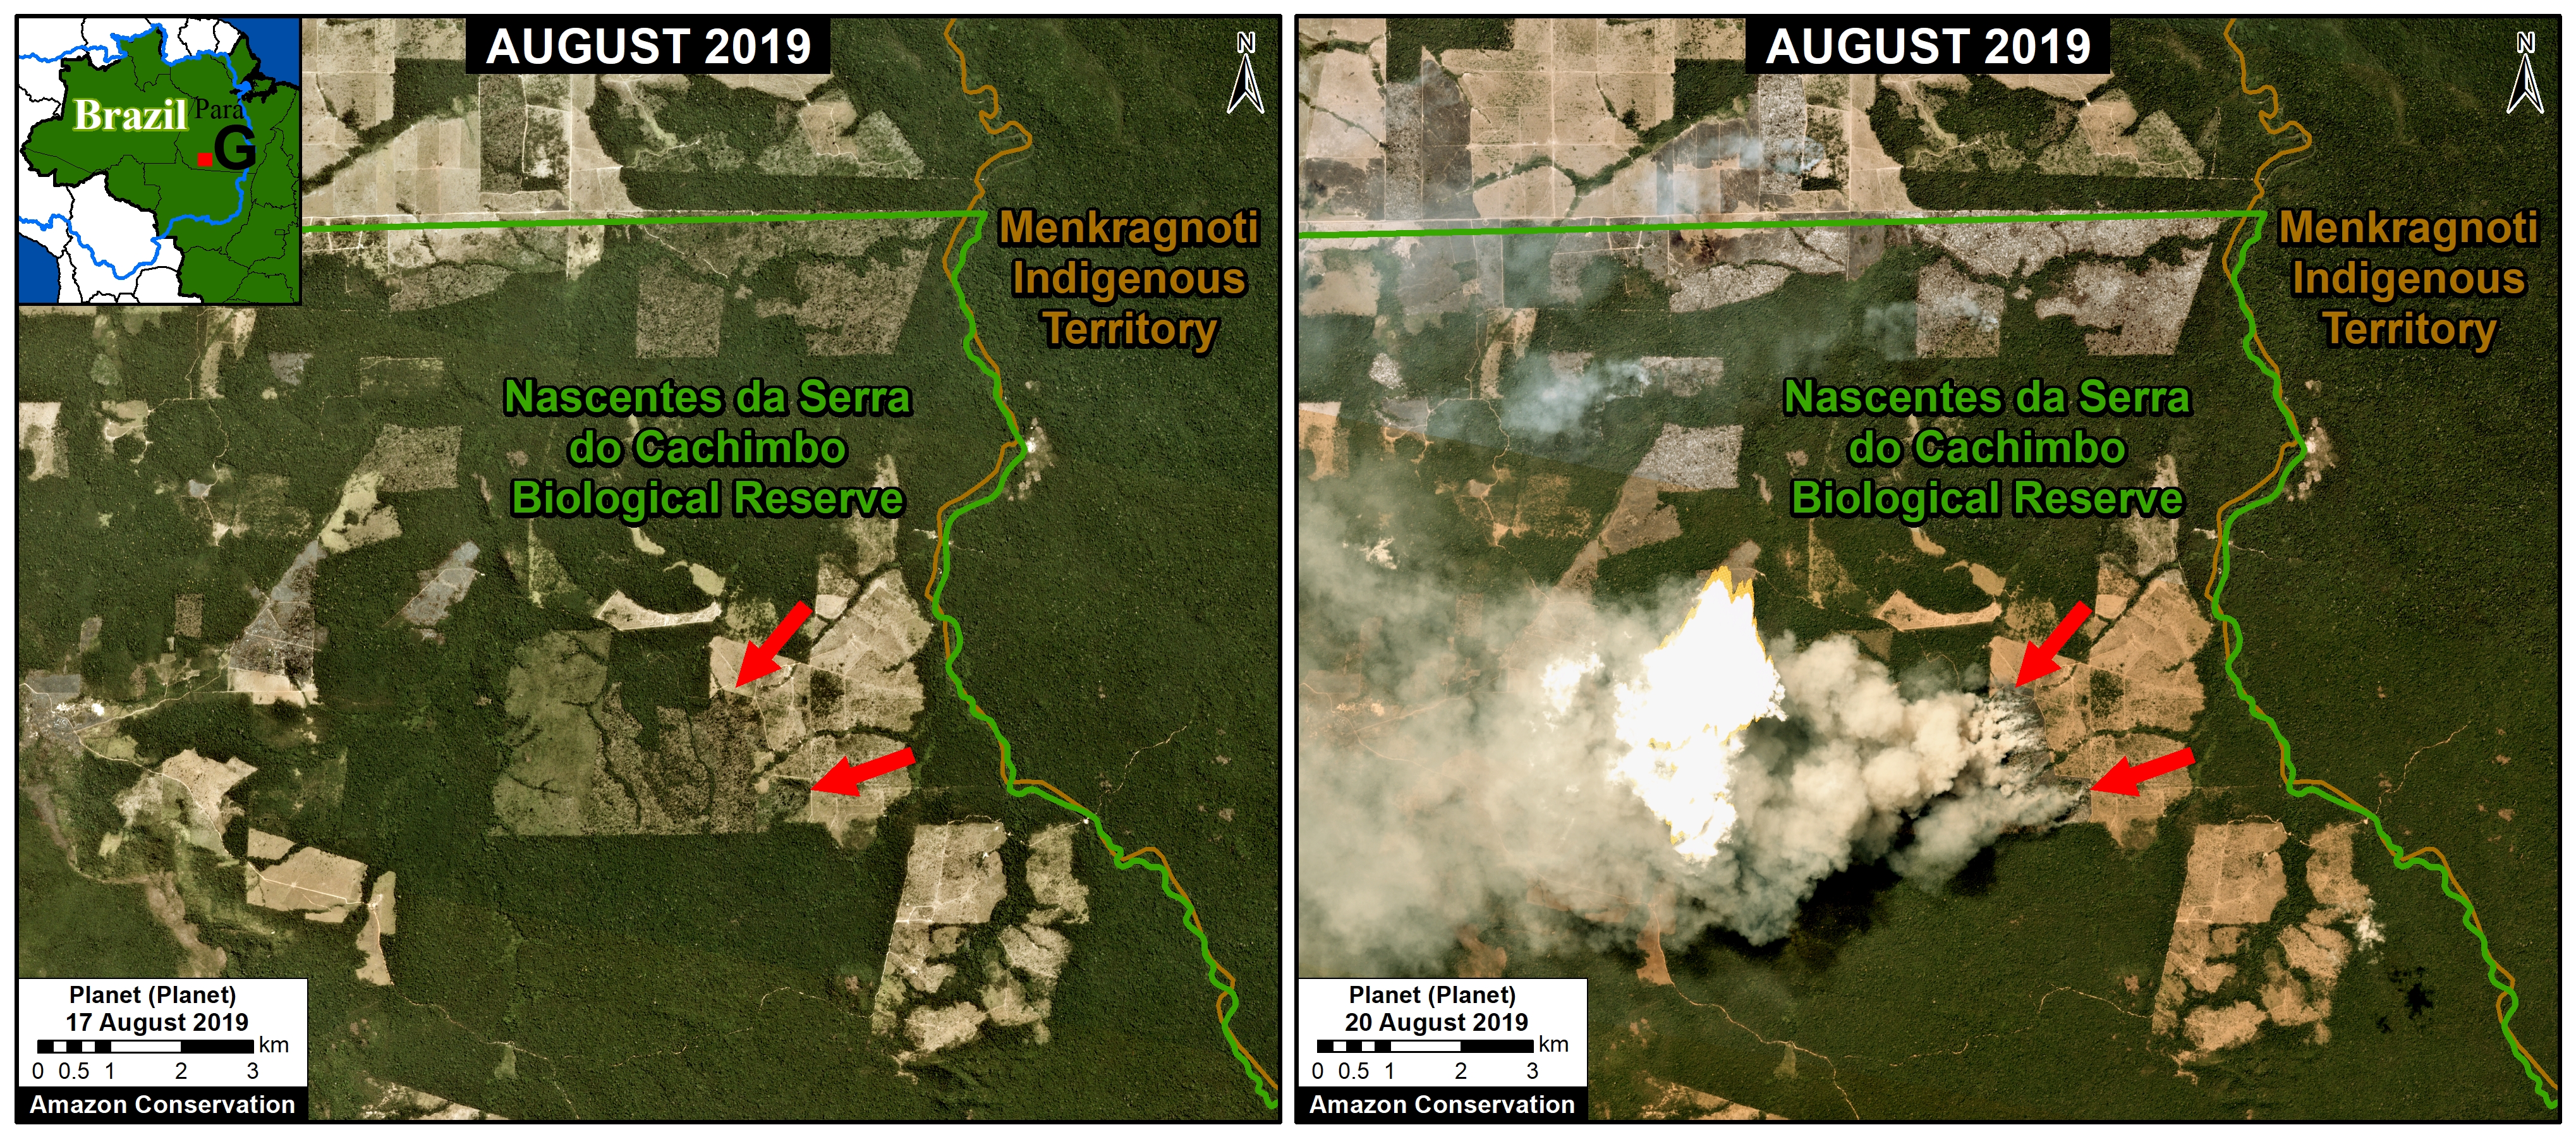
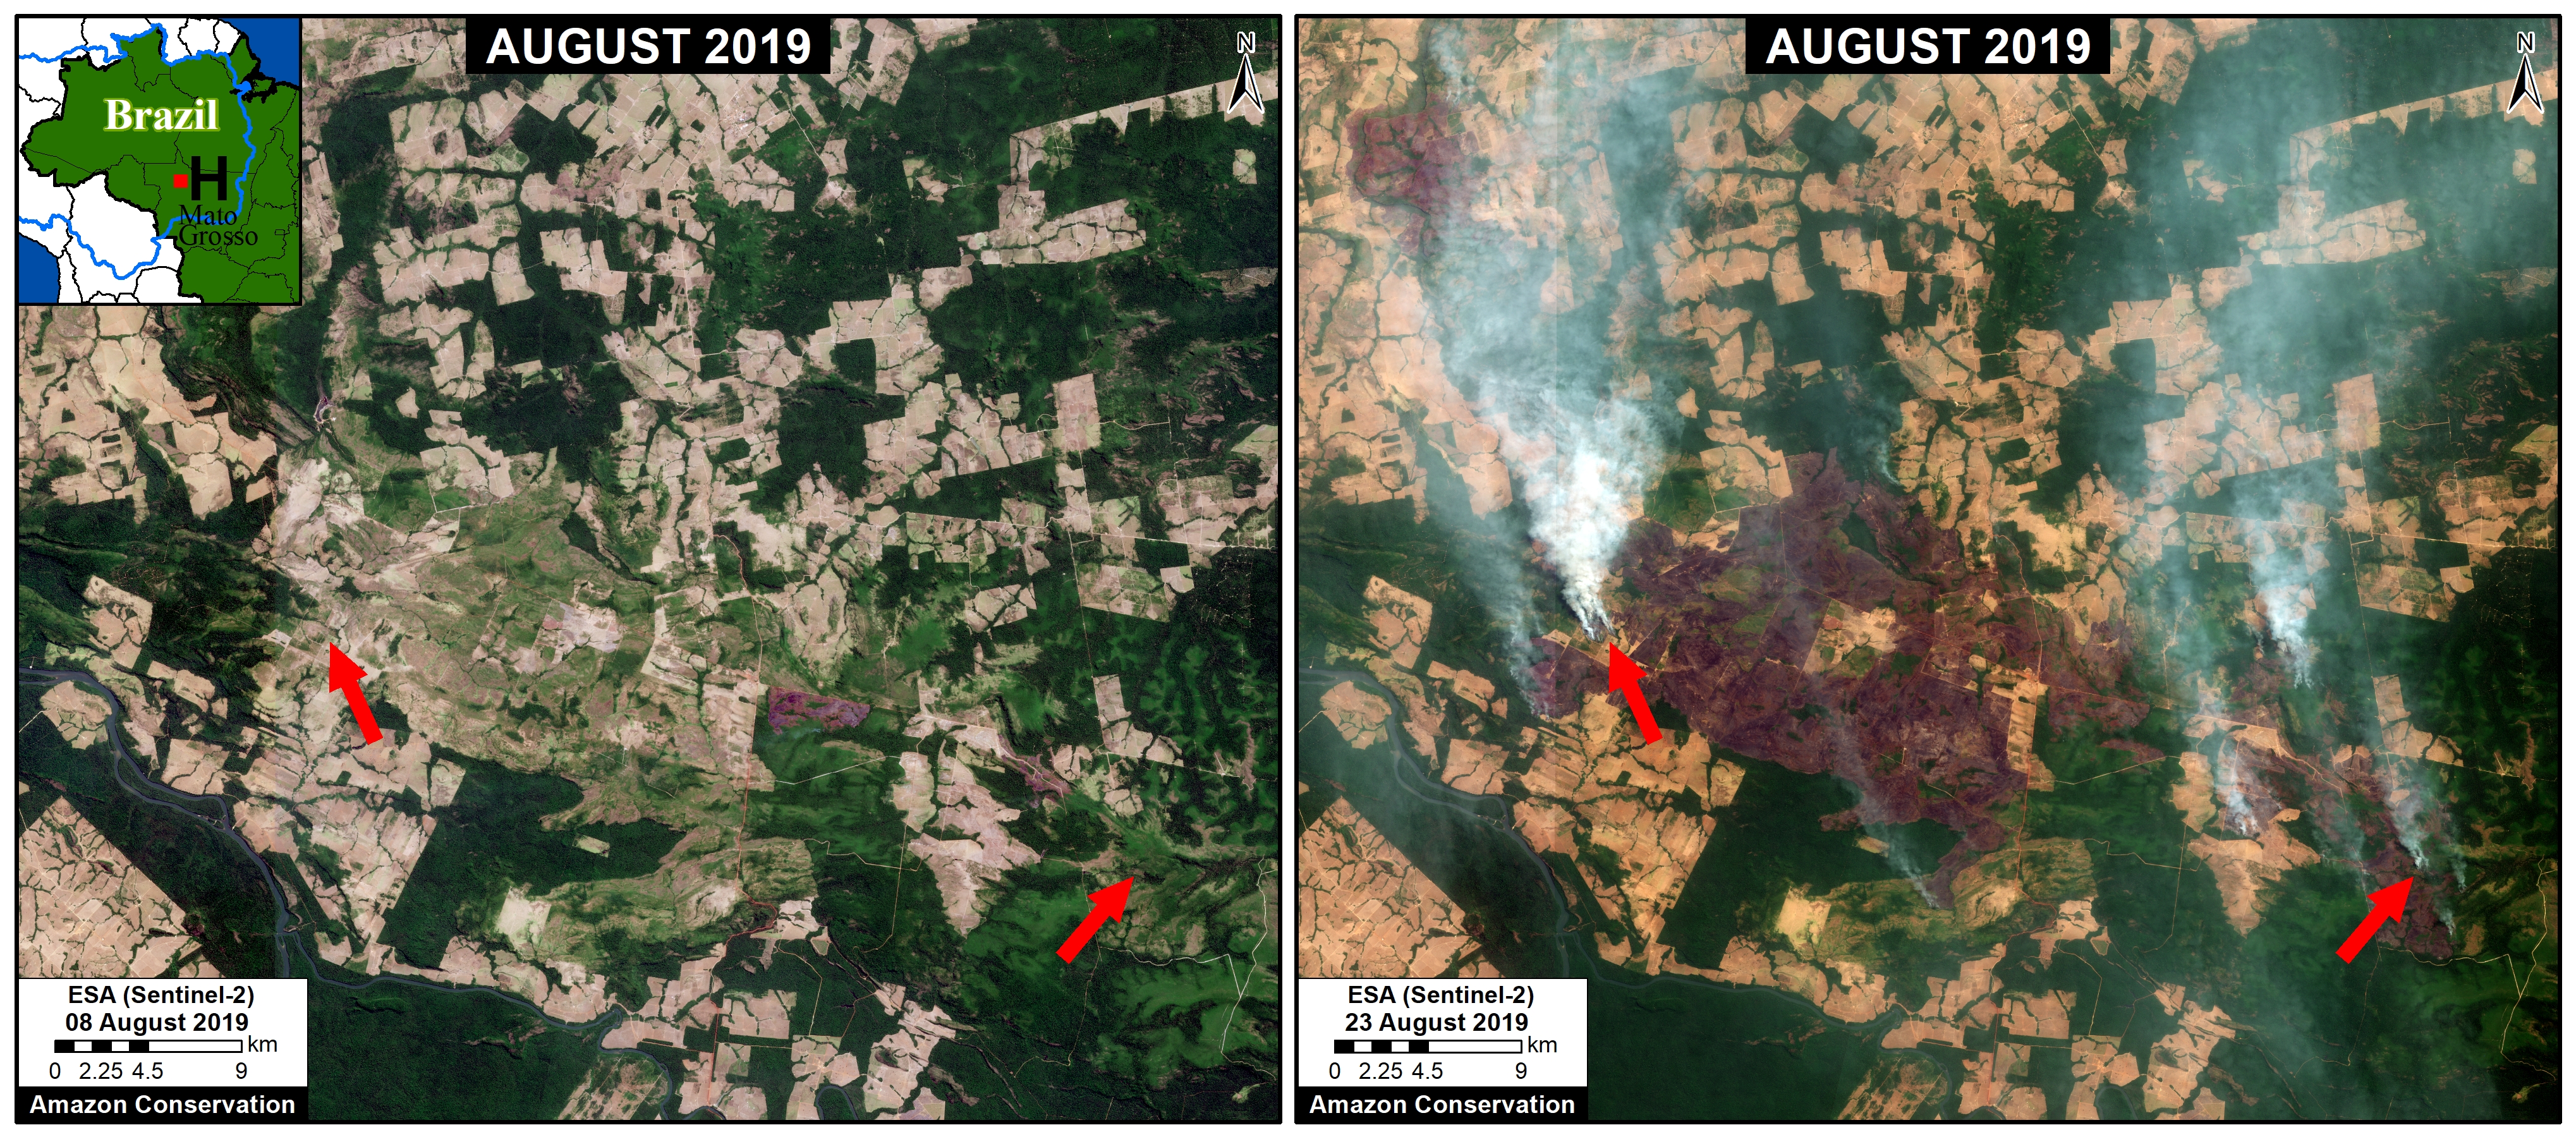
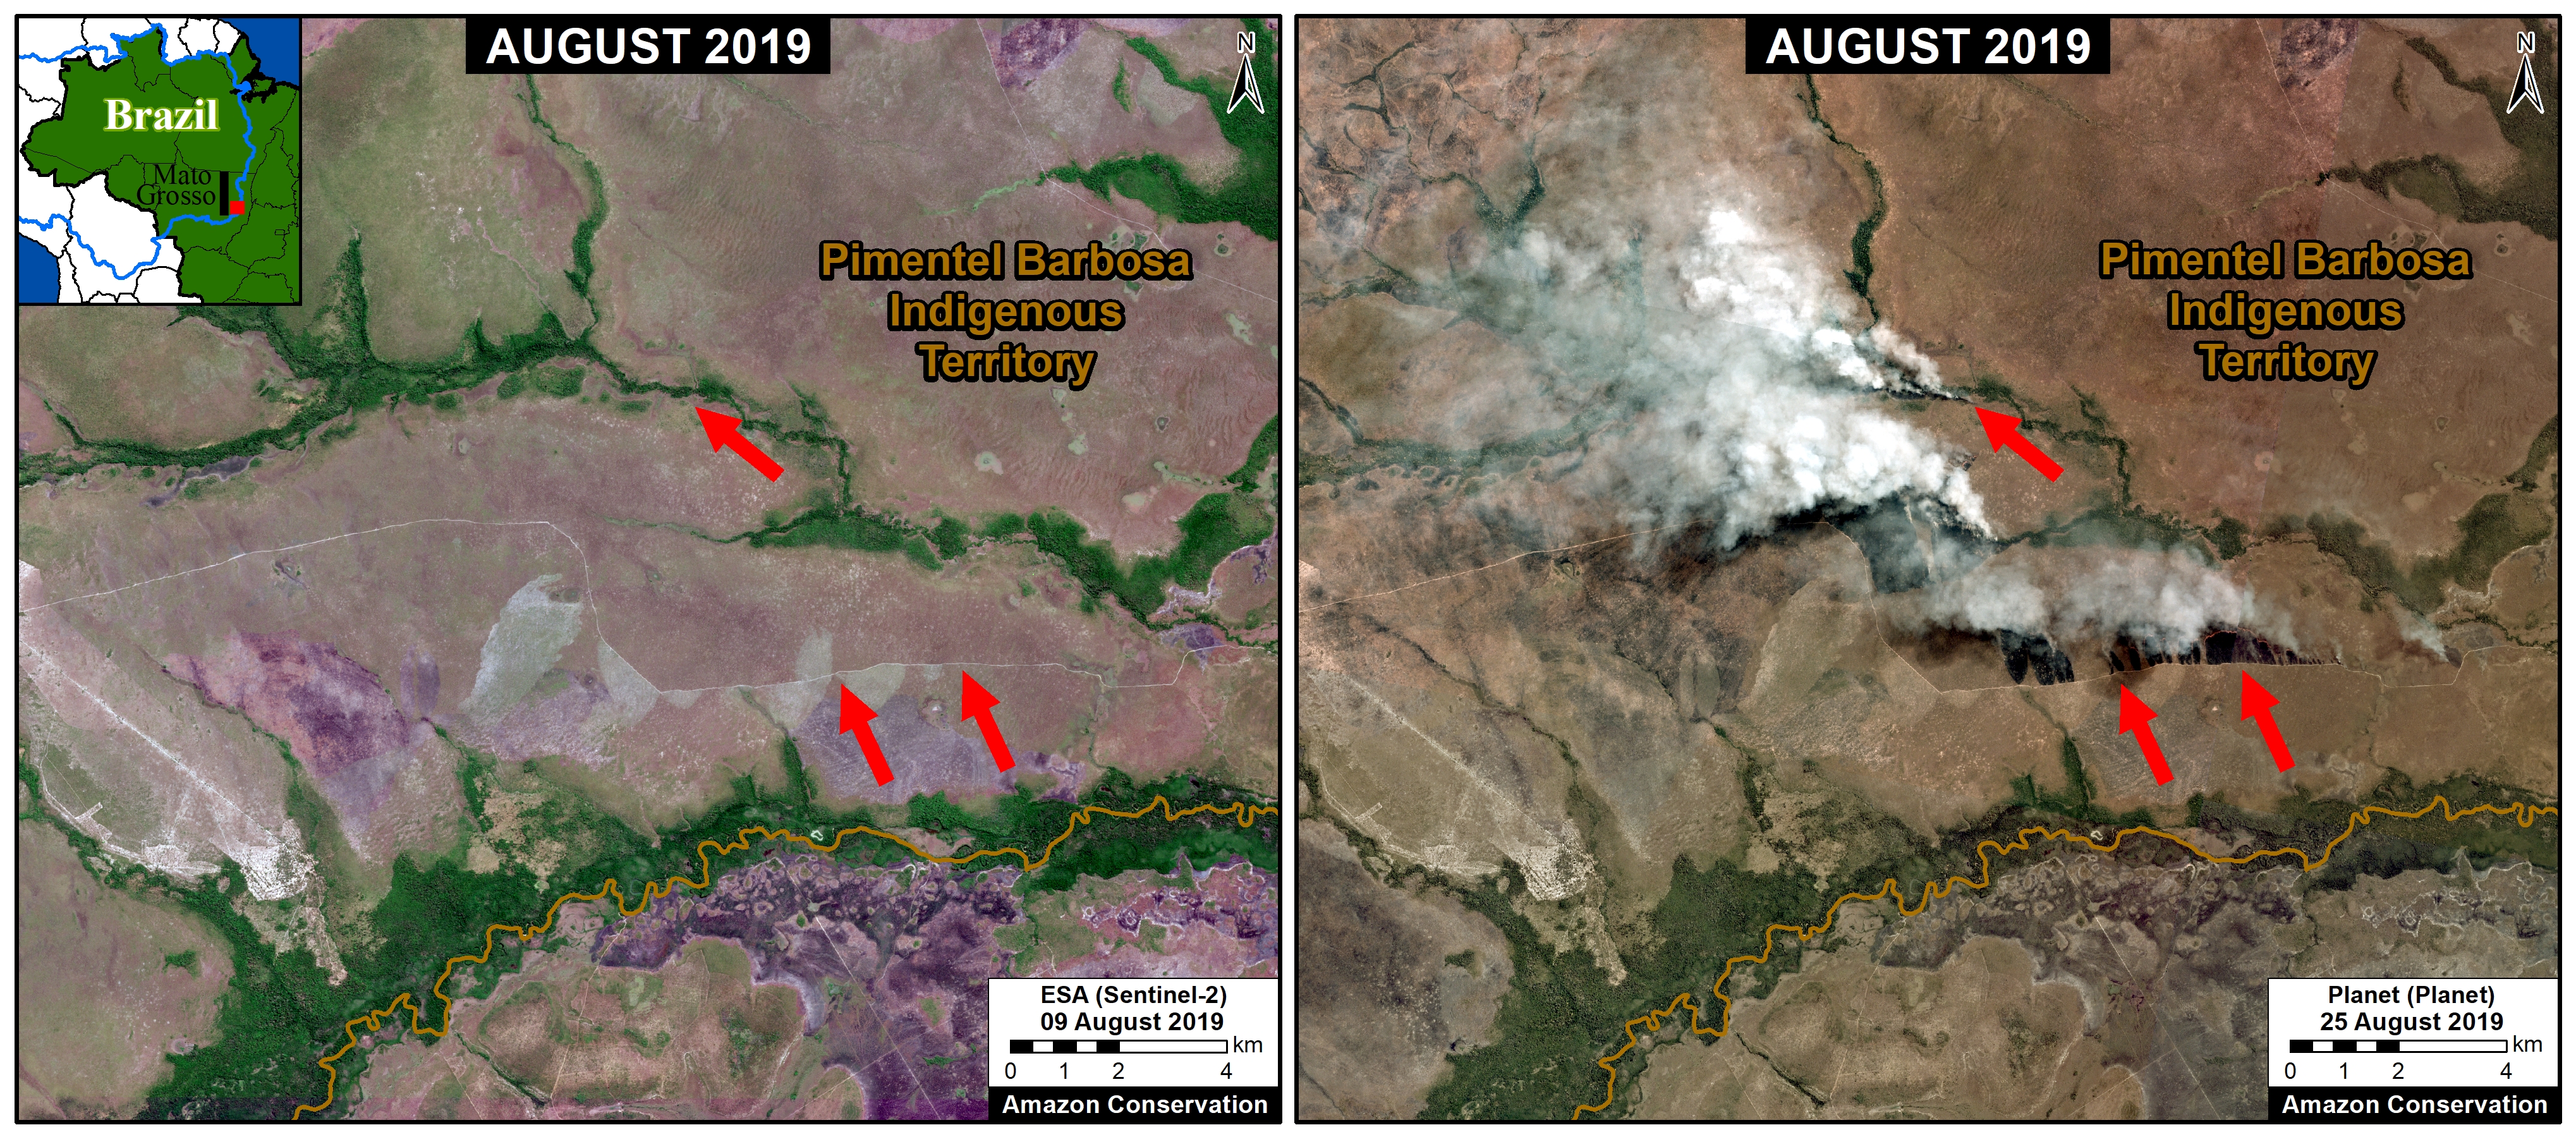
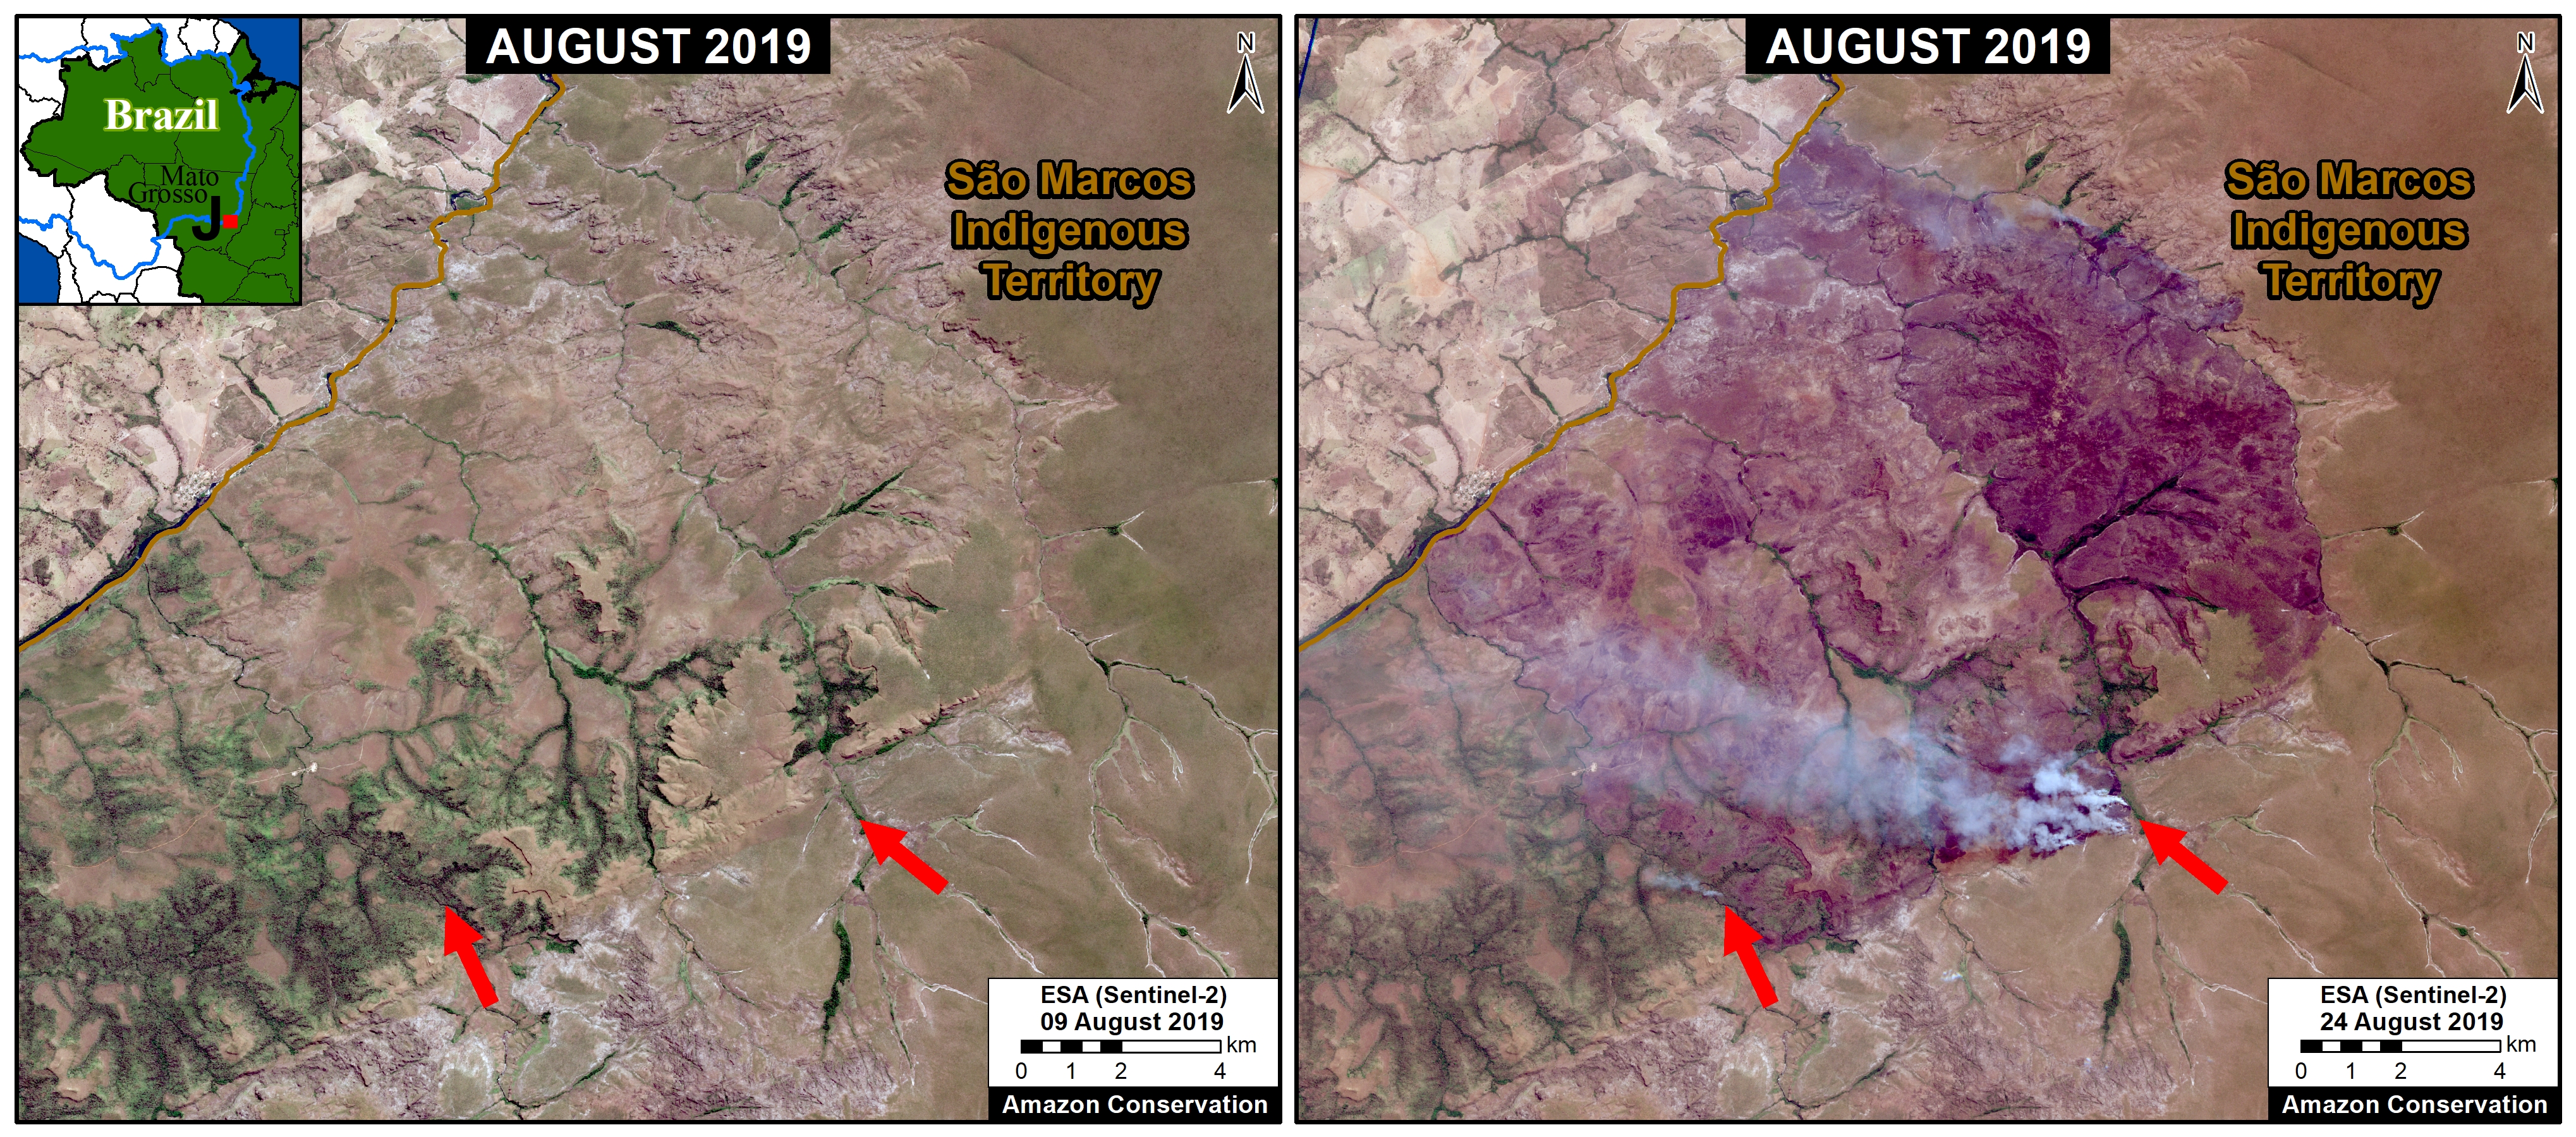
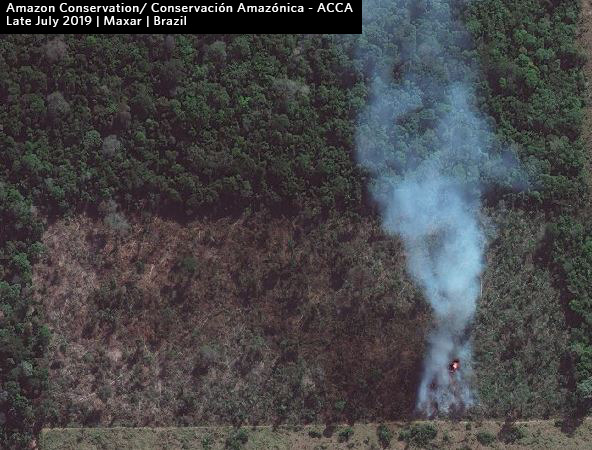
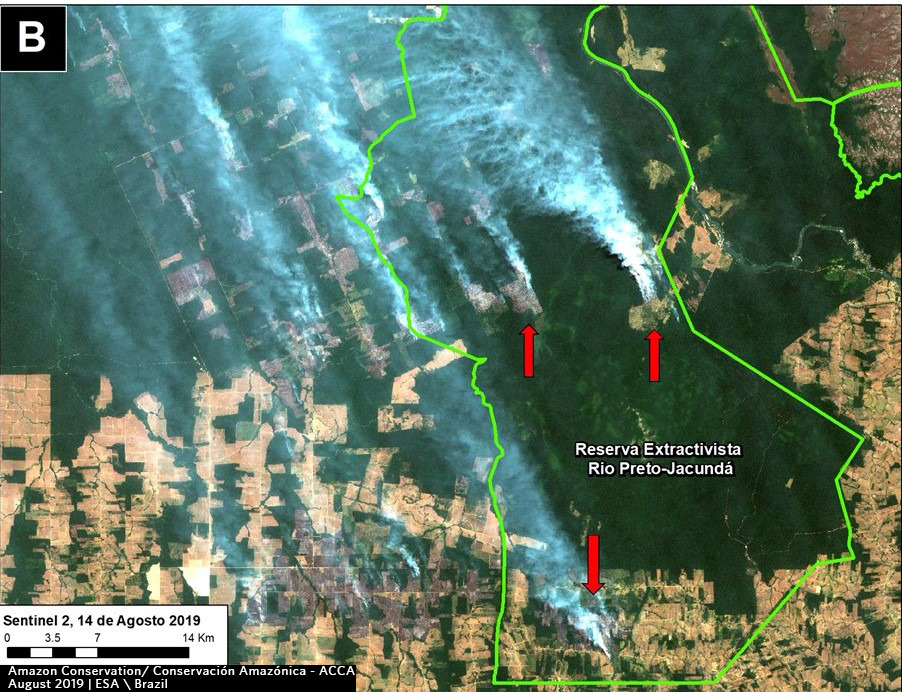
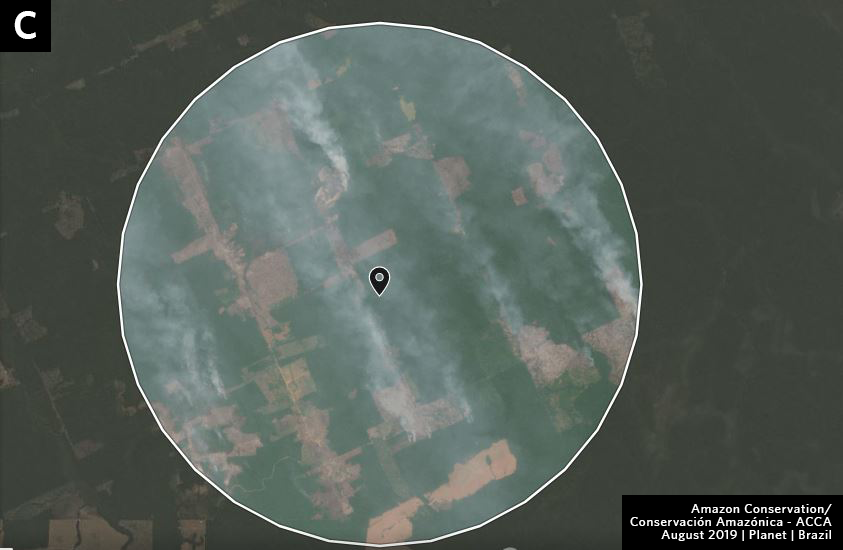
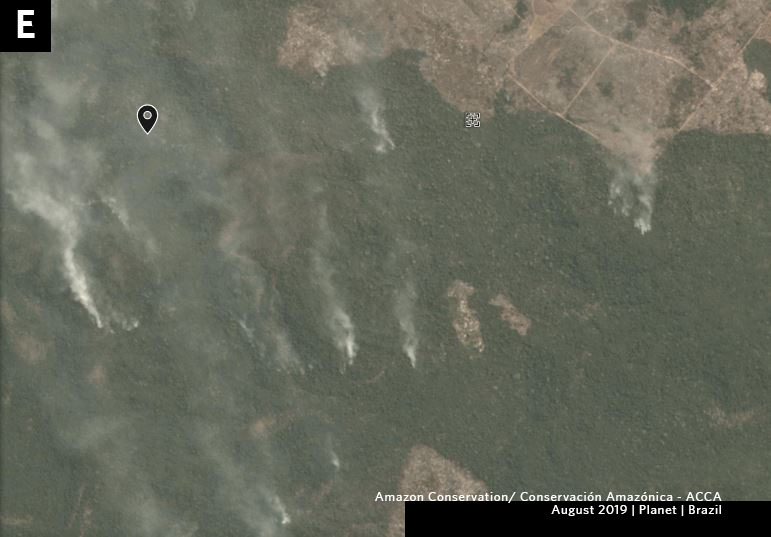
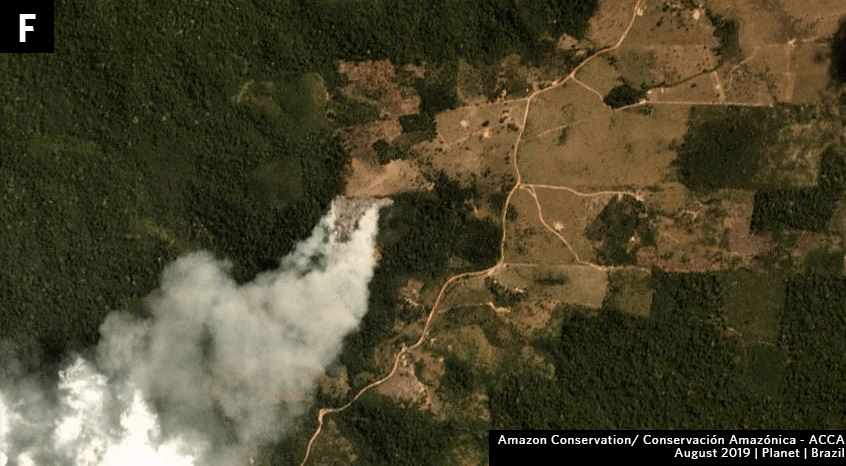
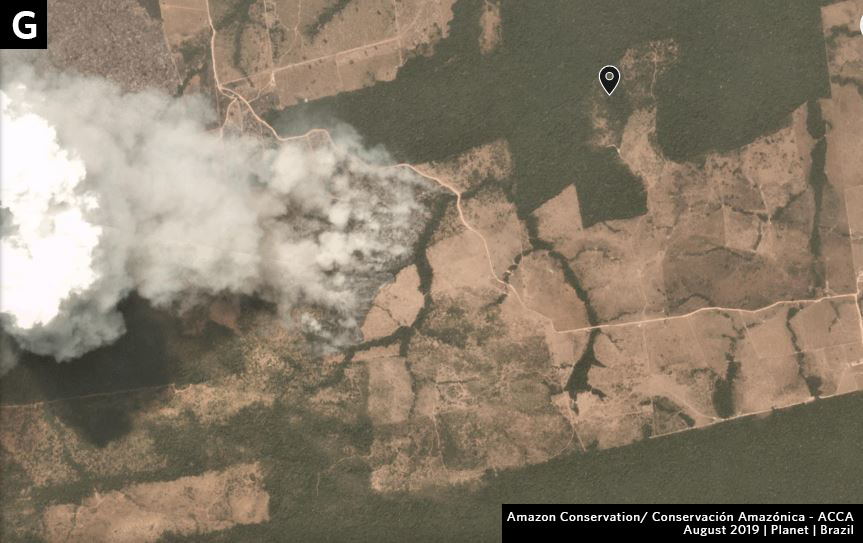
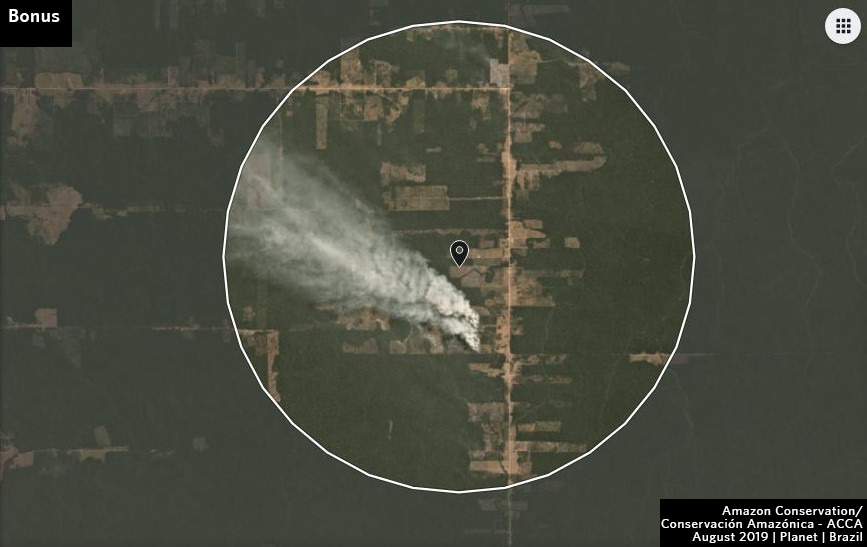
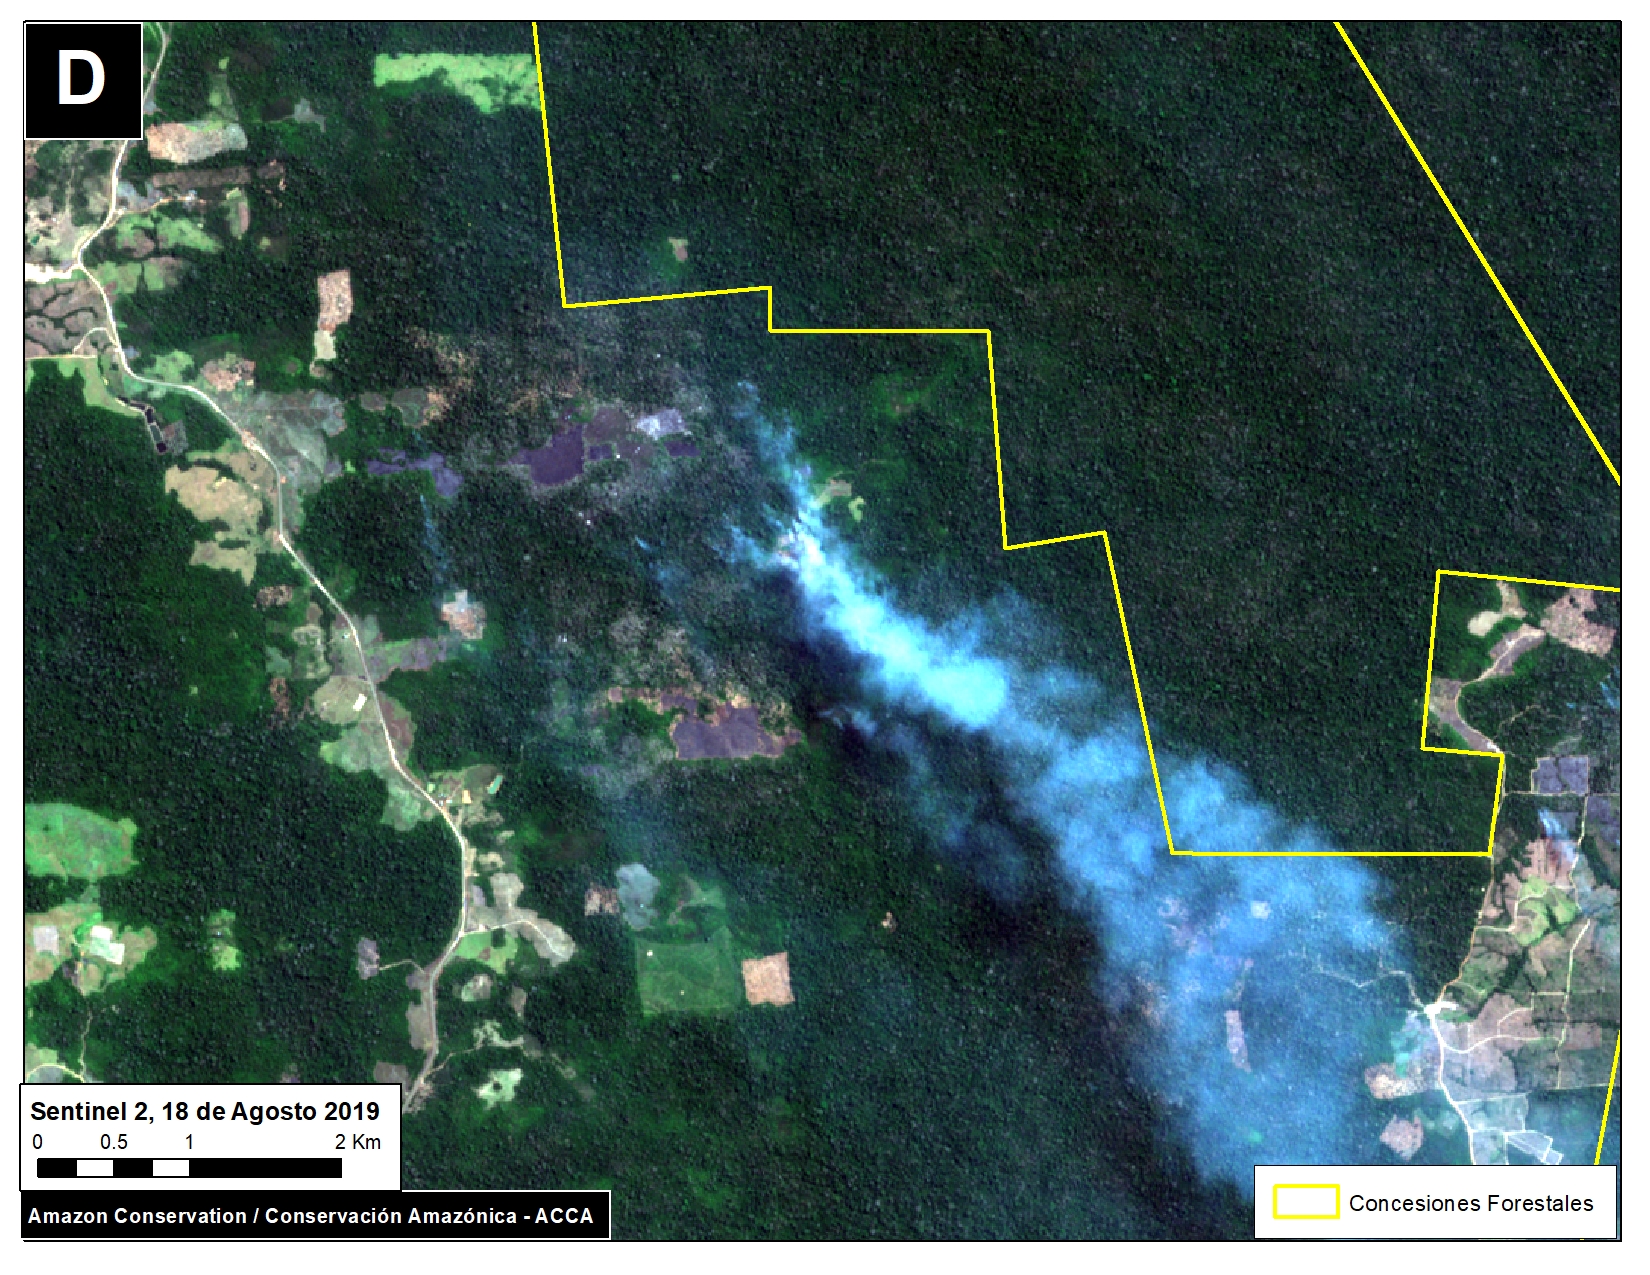
Primary forest loss in the Brazilian Amazon (1.29 million hectares) was over 3.5 times higher than the other four countries combined, with a slight increase in 2019 relative to 2018. Many of these areas were cleared in the first half of the year and then burned in August, generating international attention.
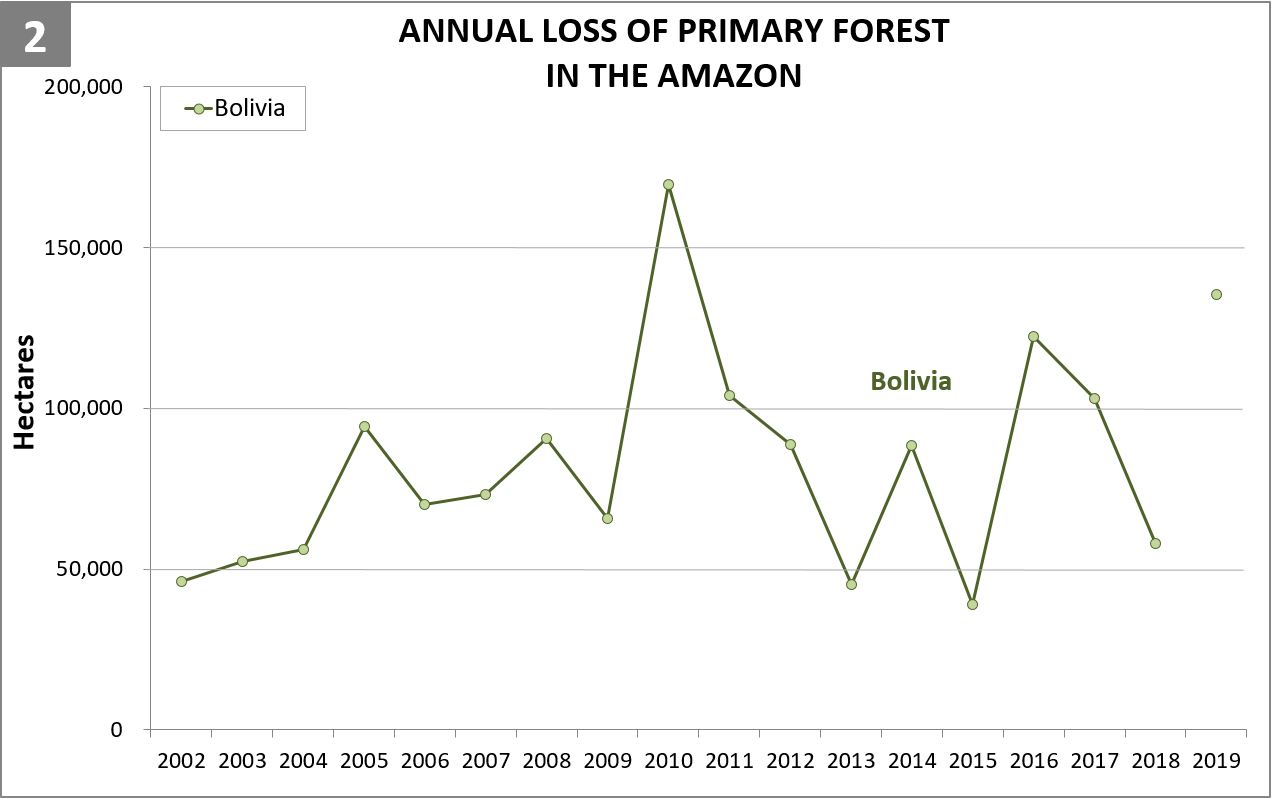
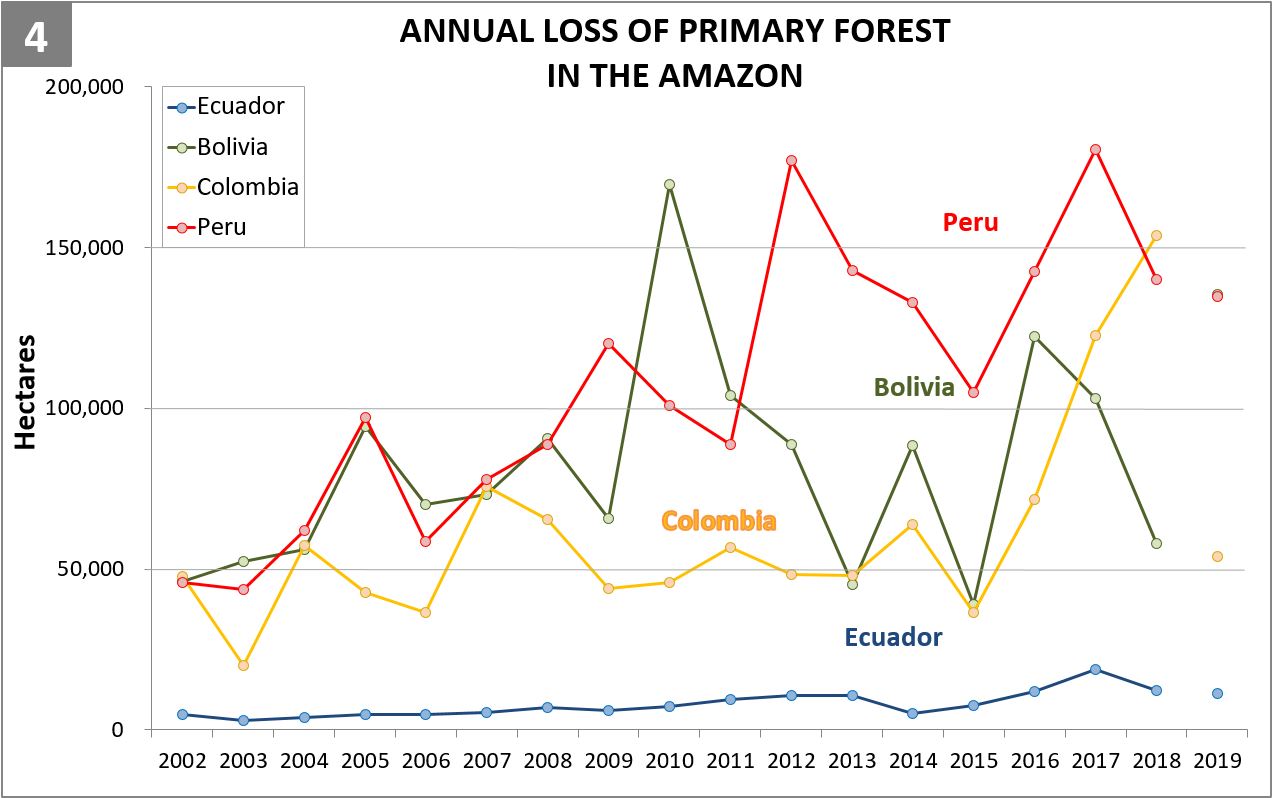
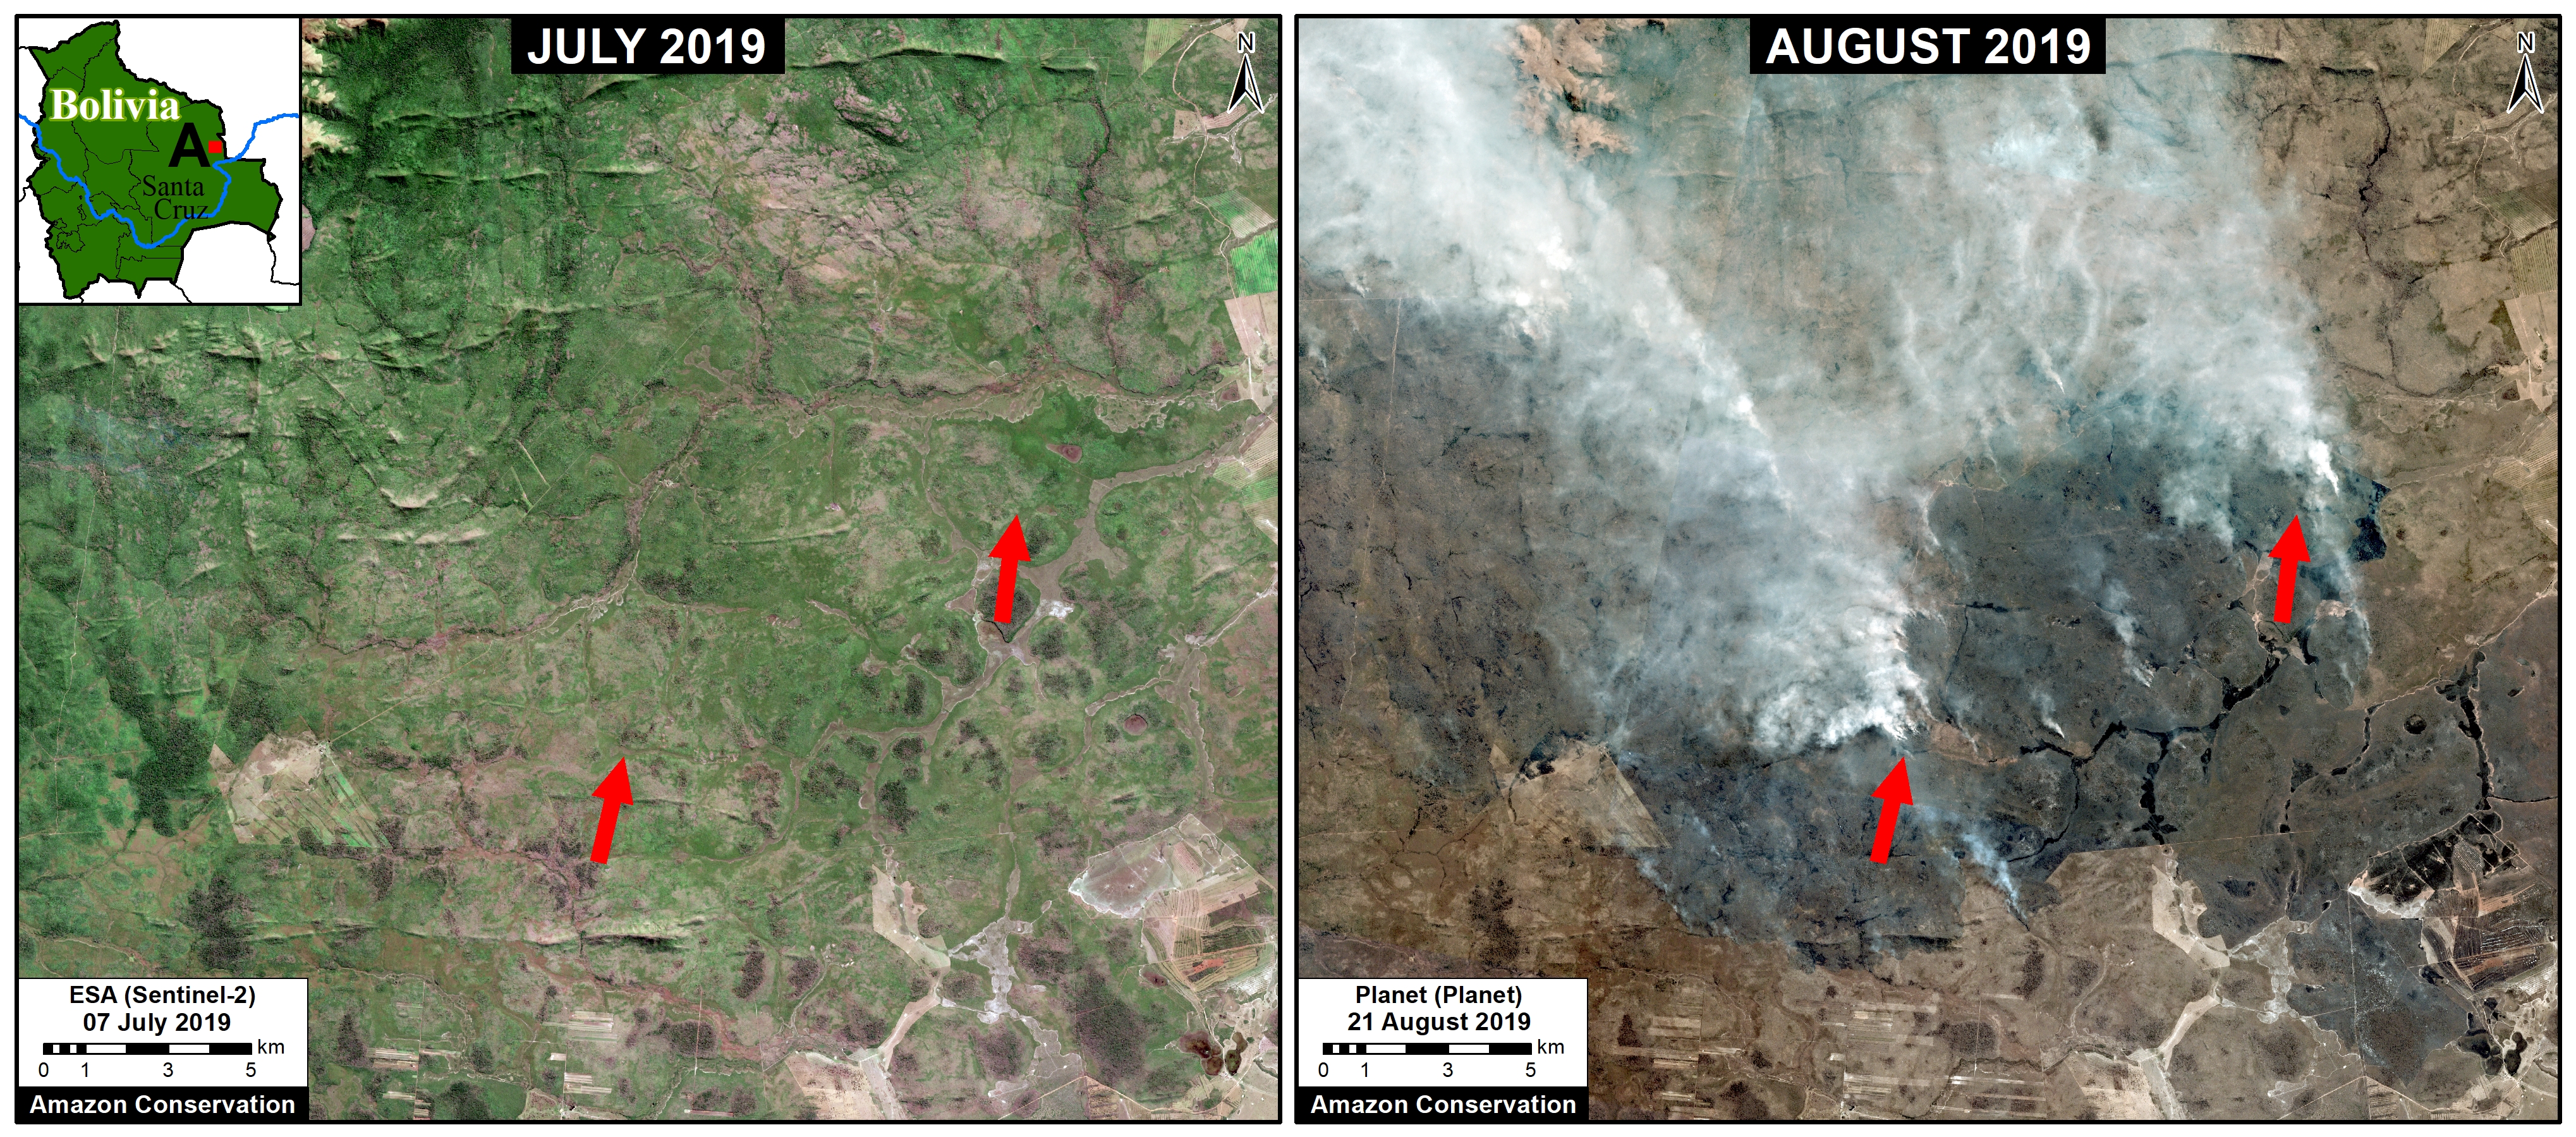
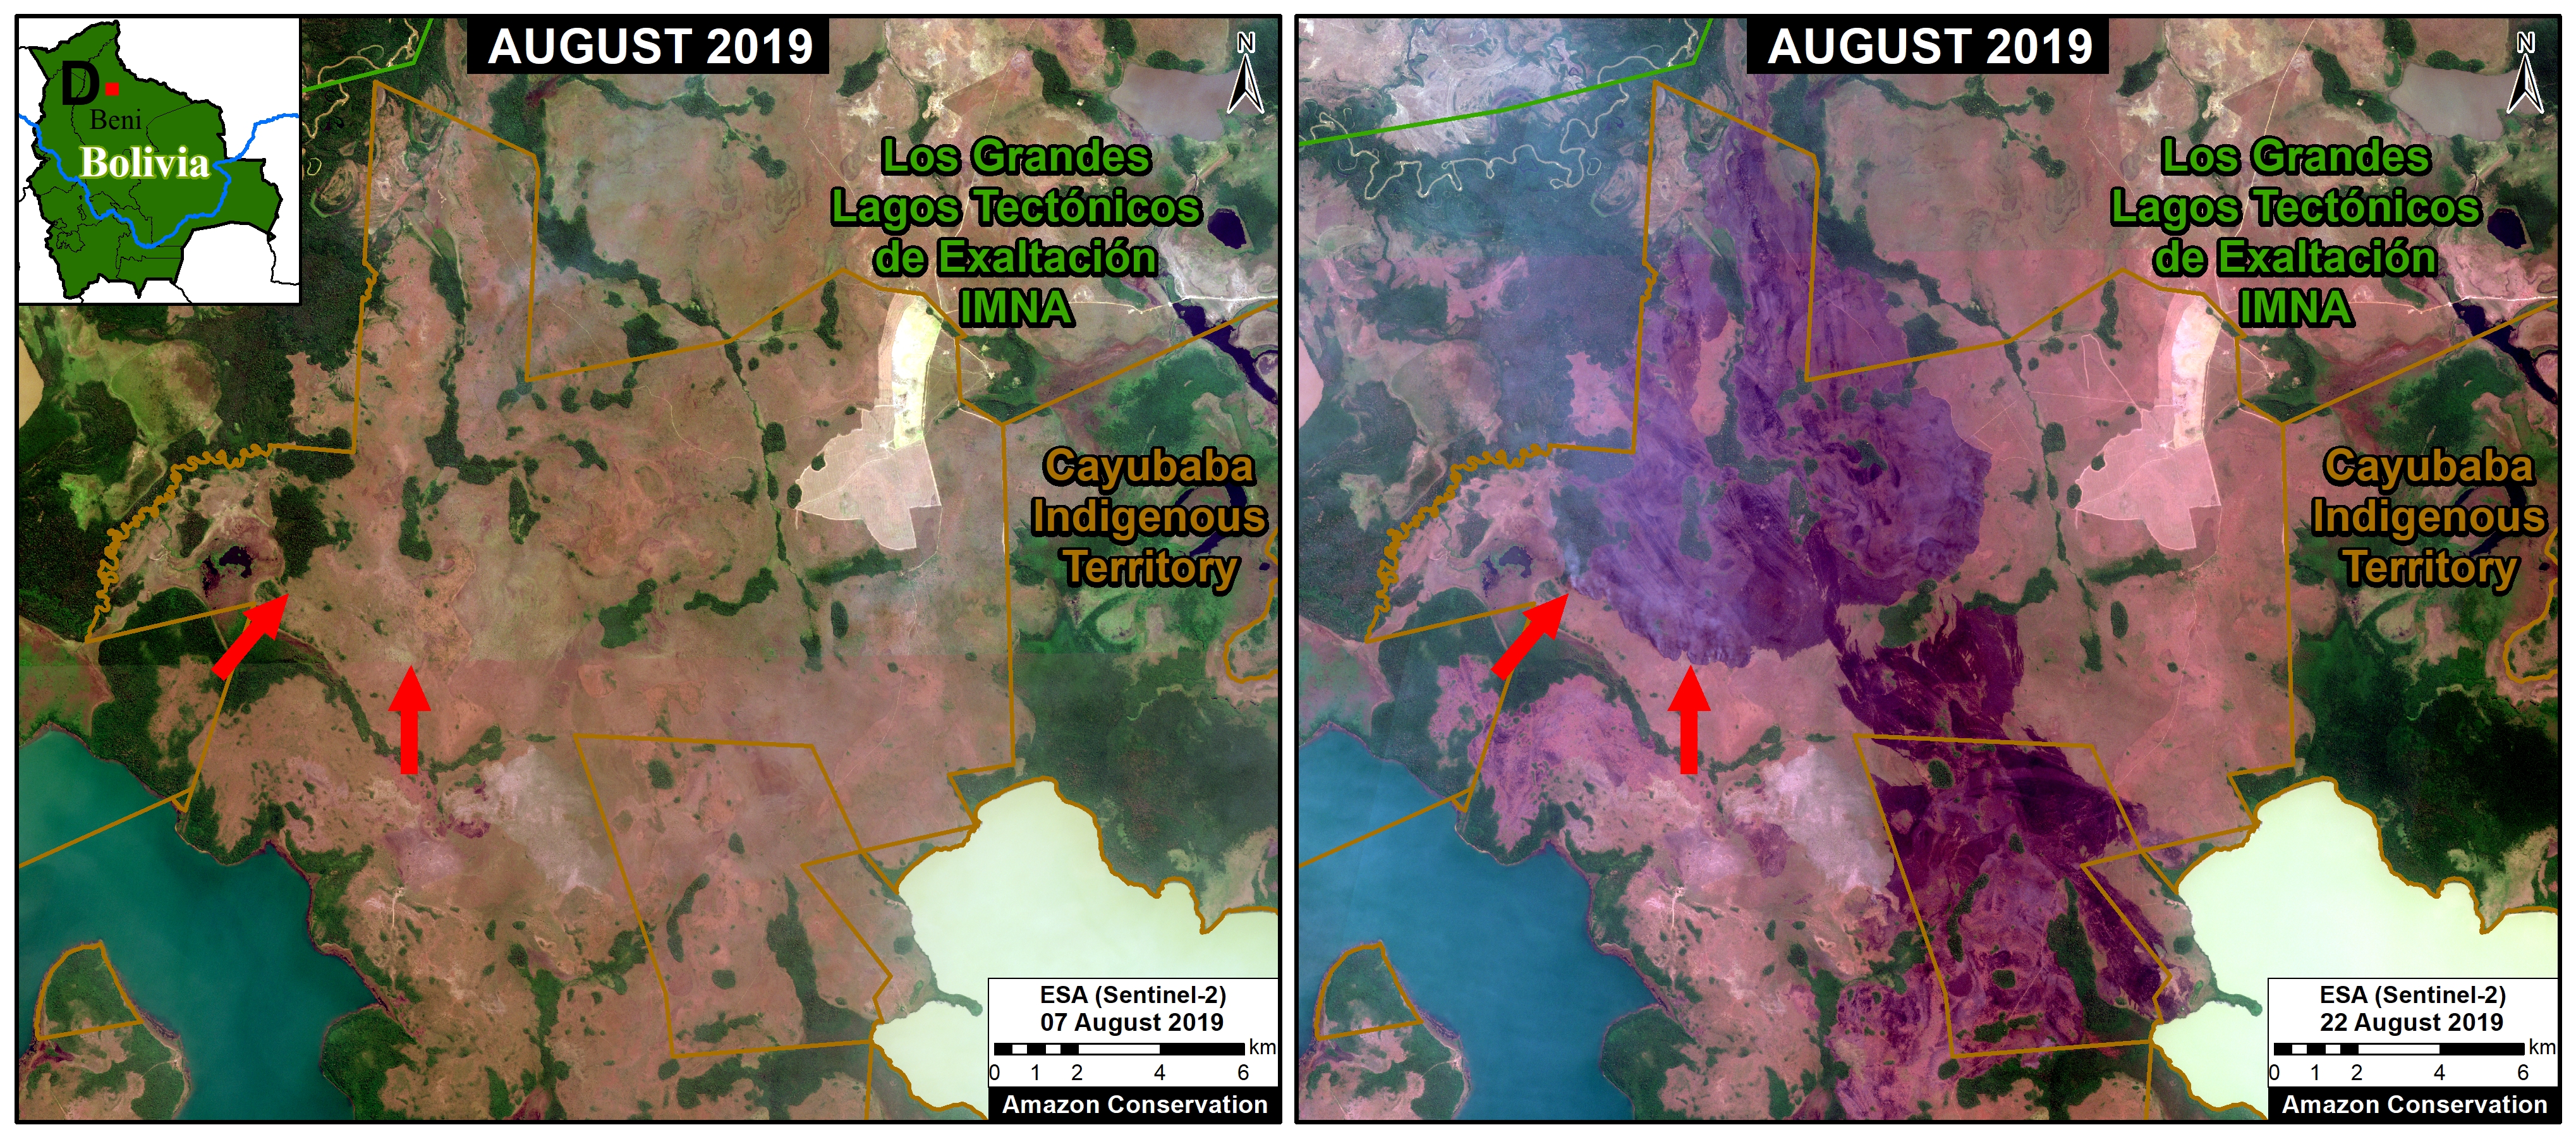
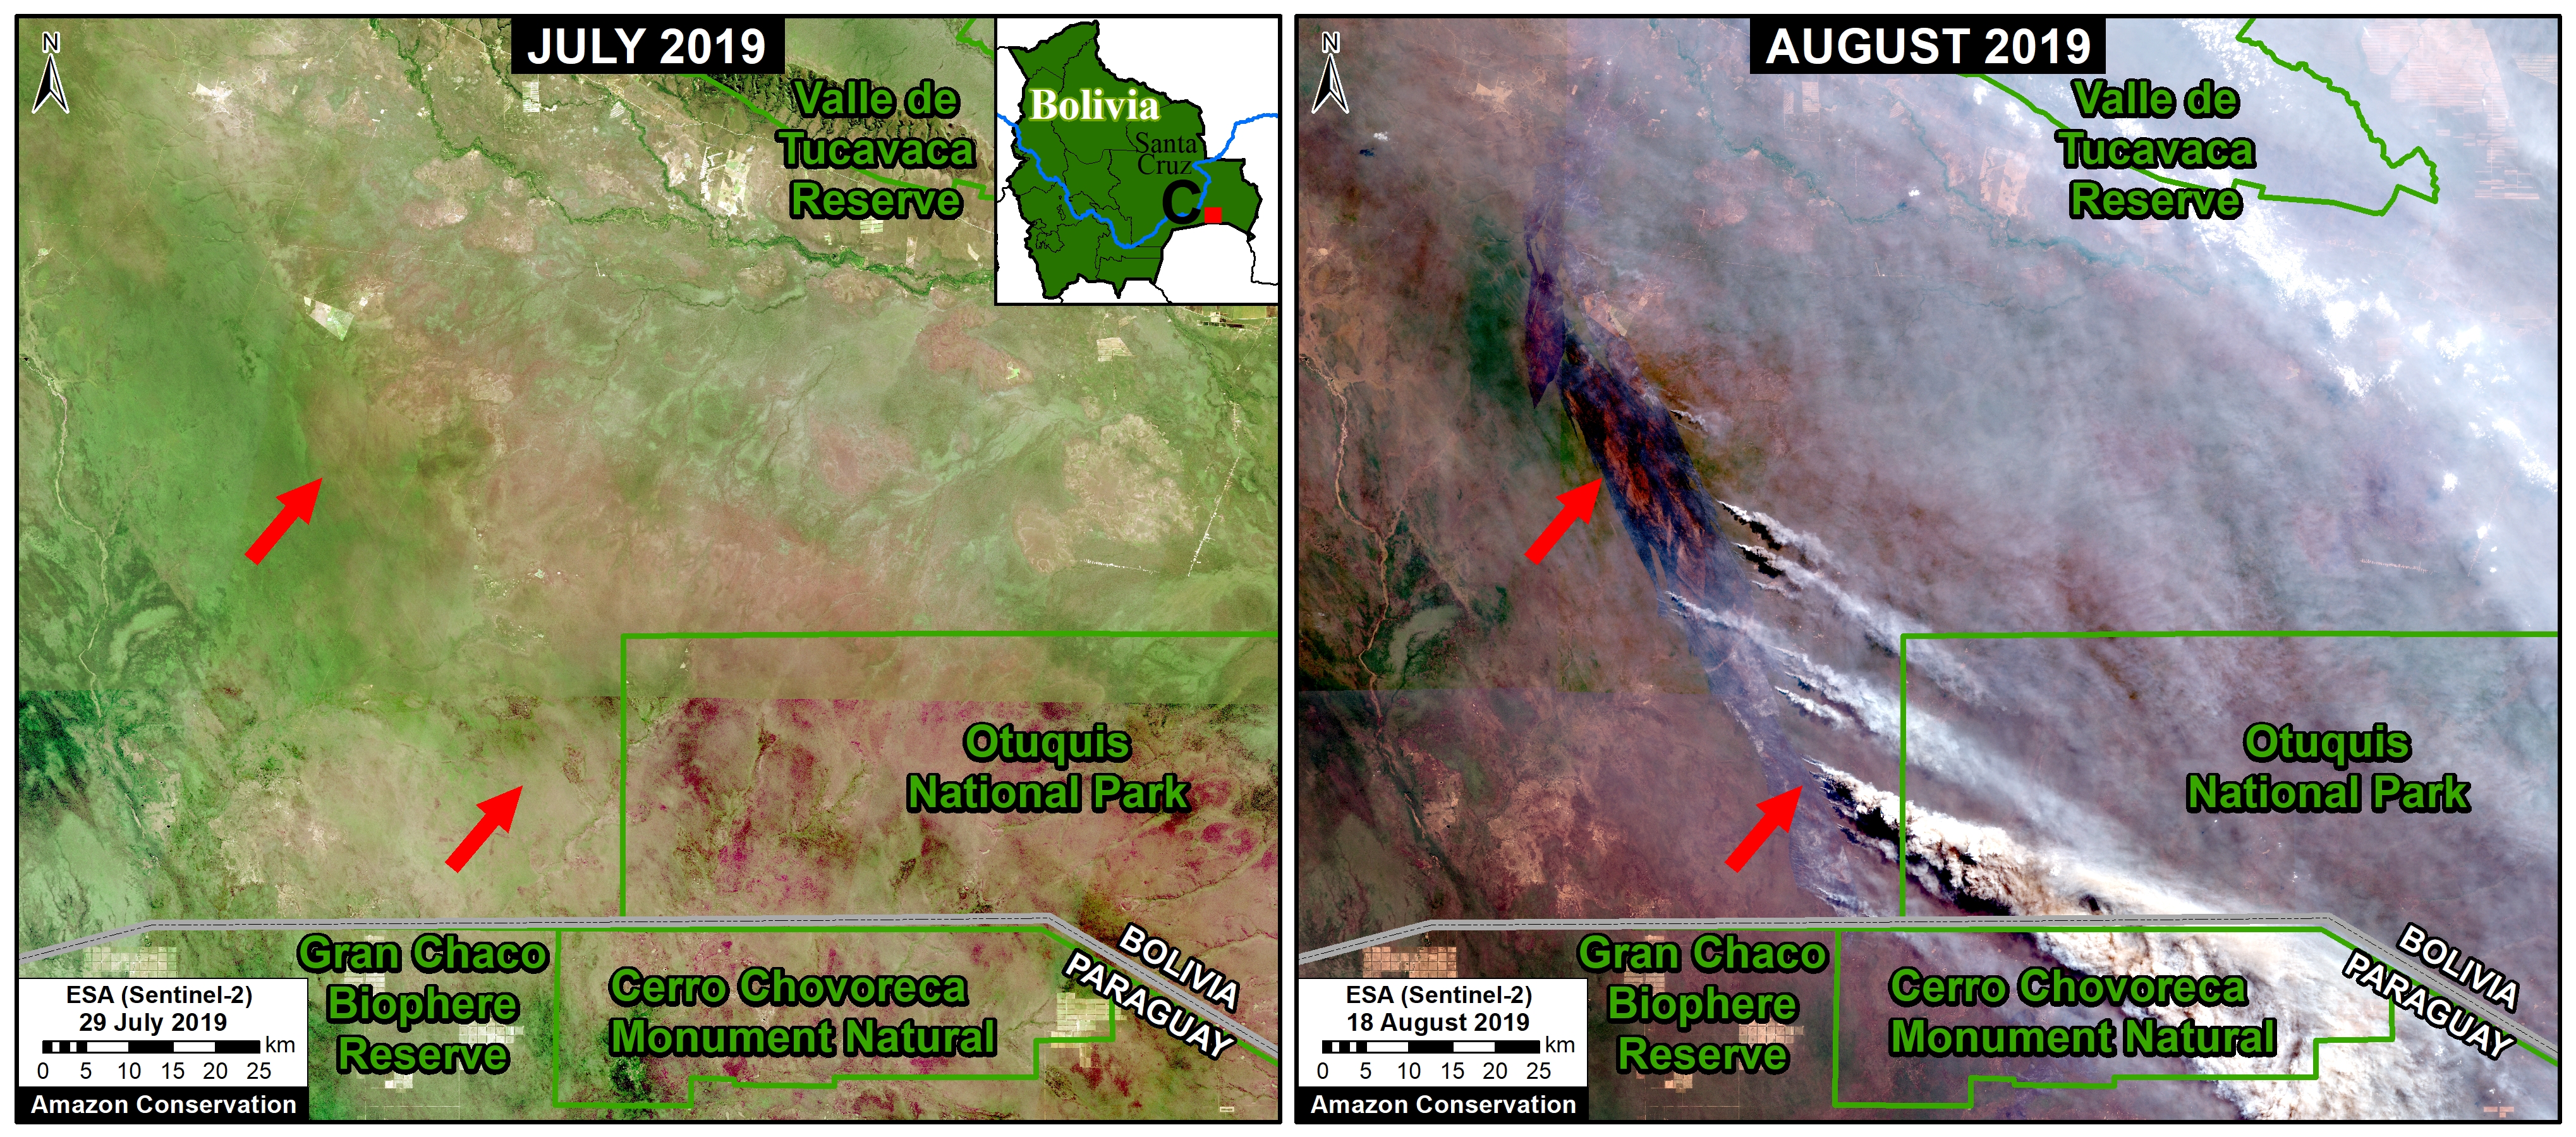
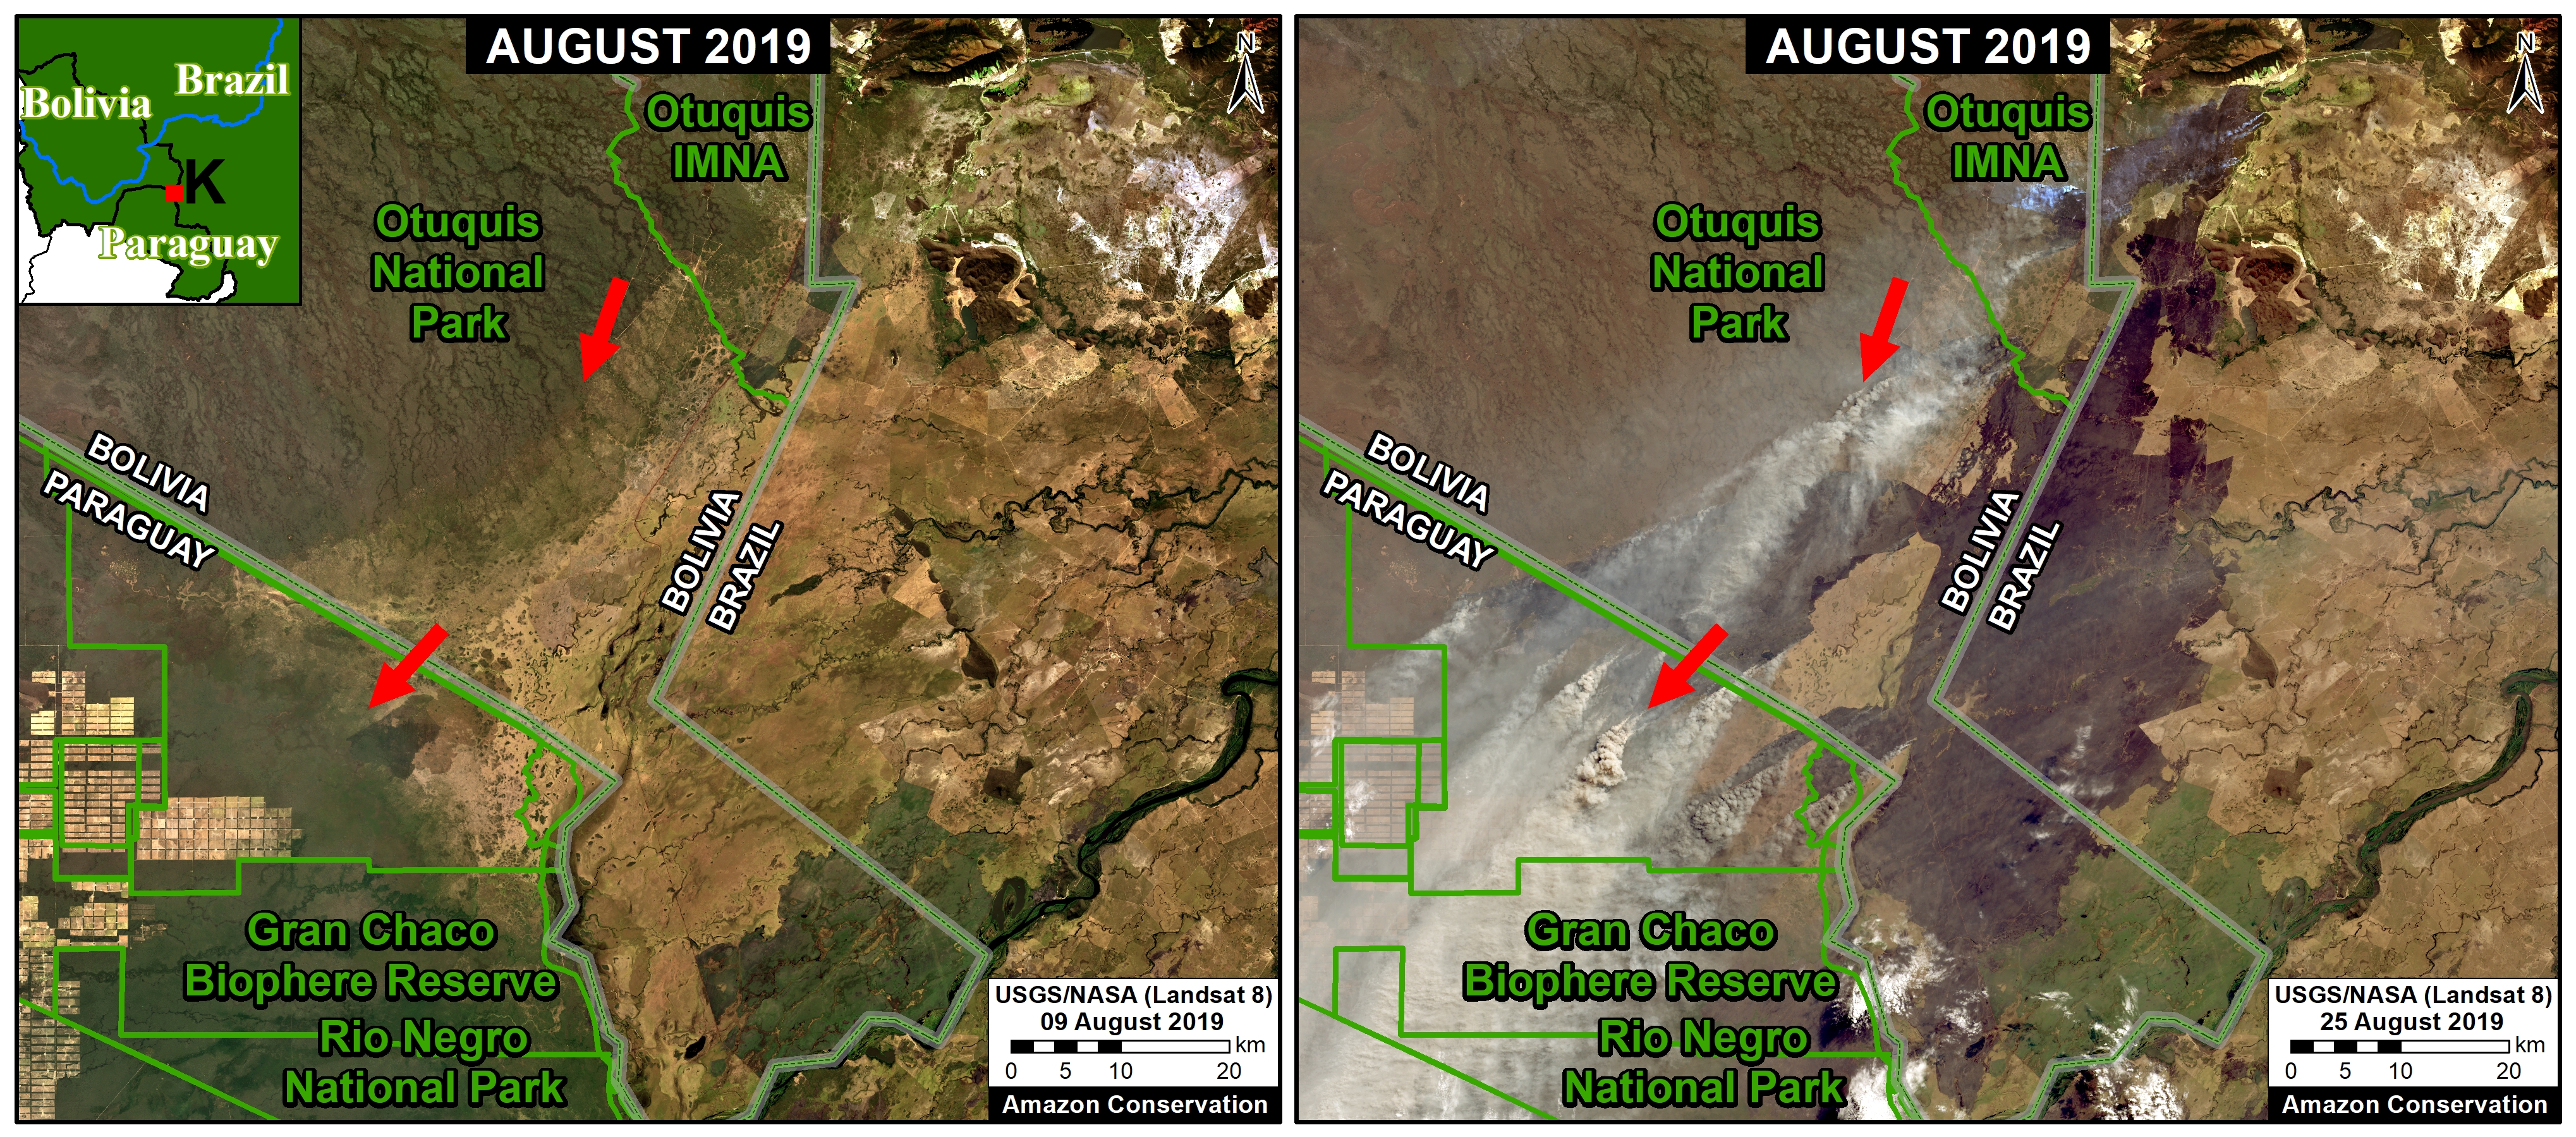
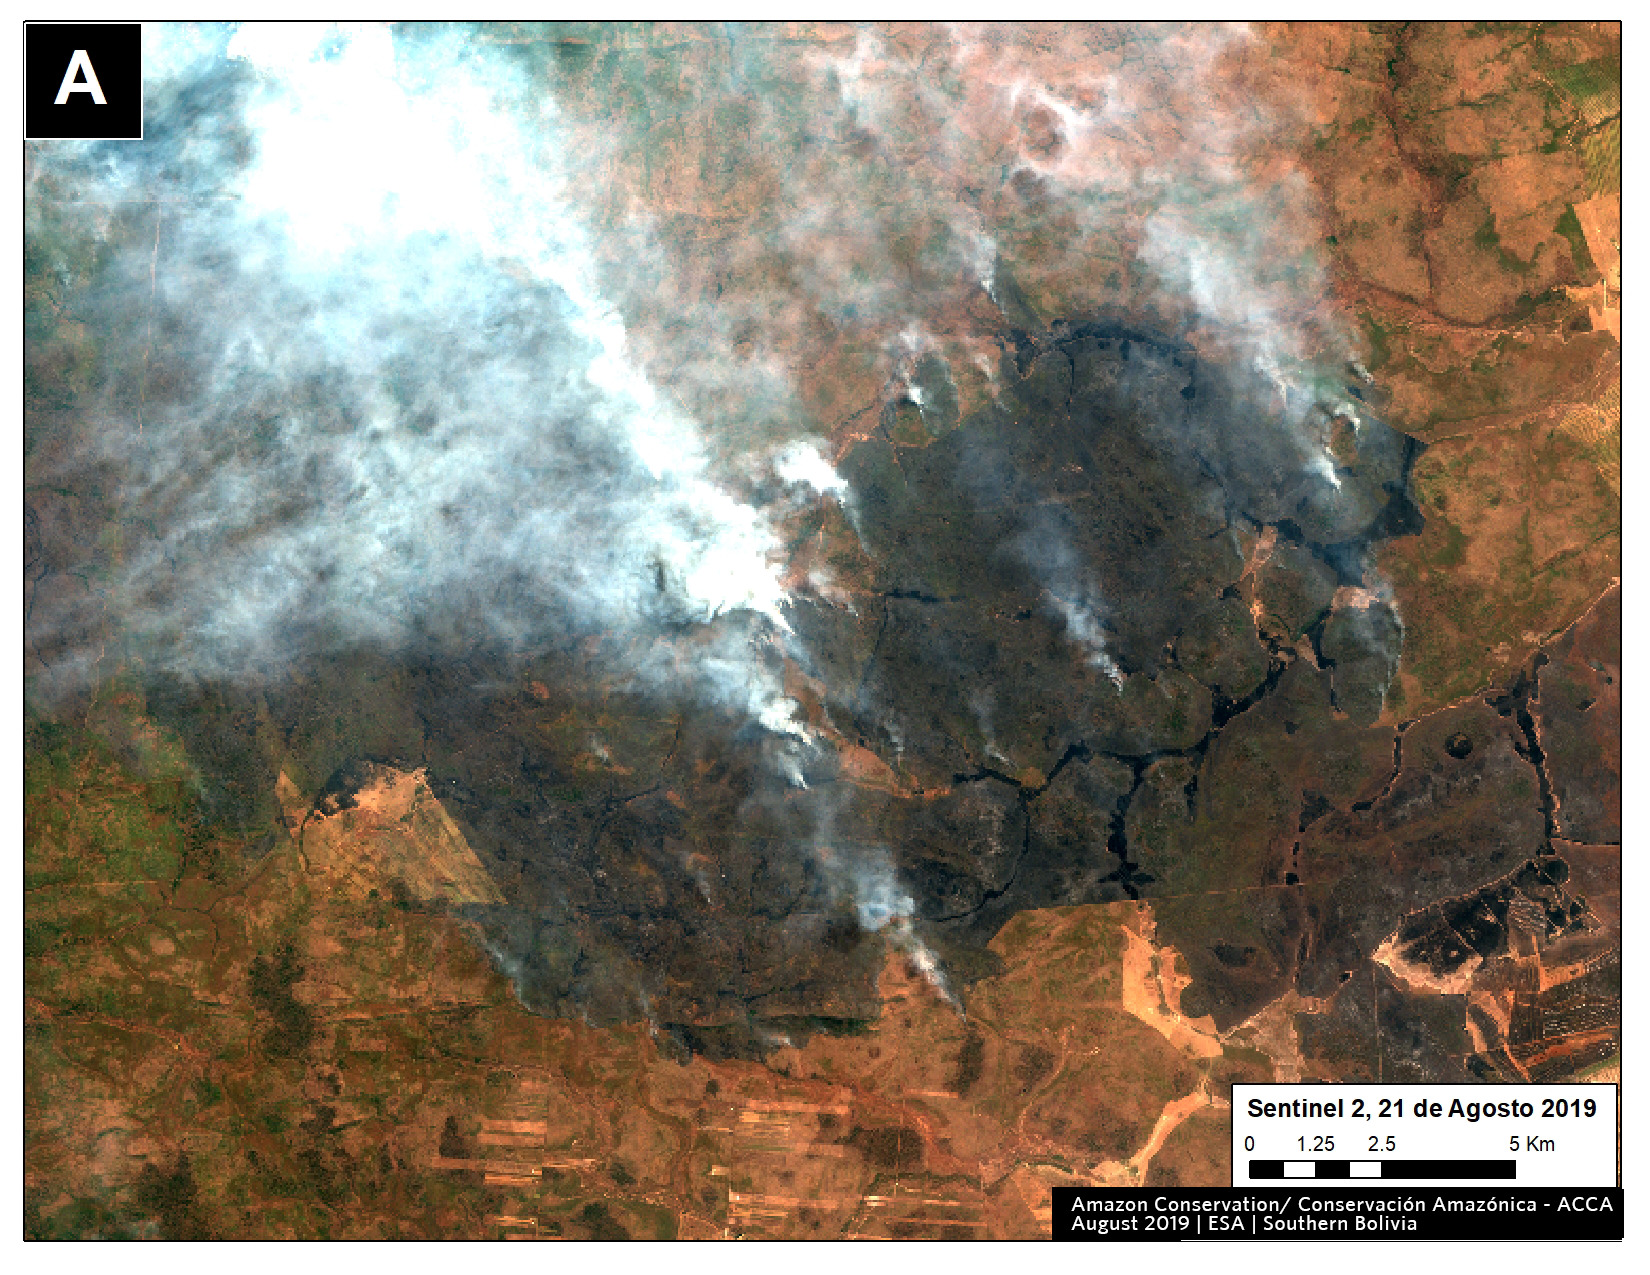
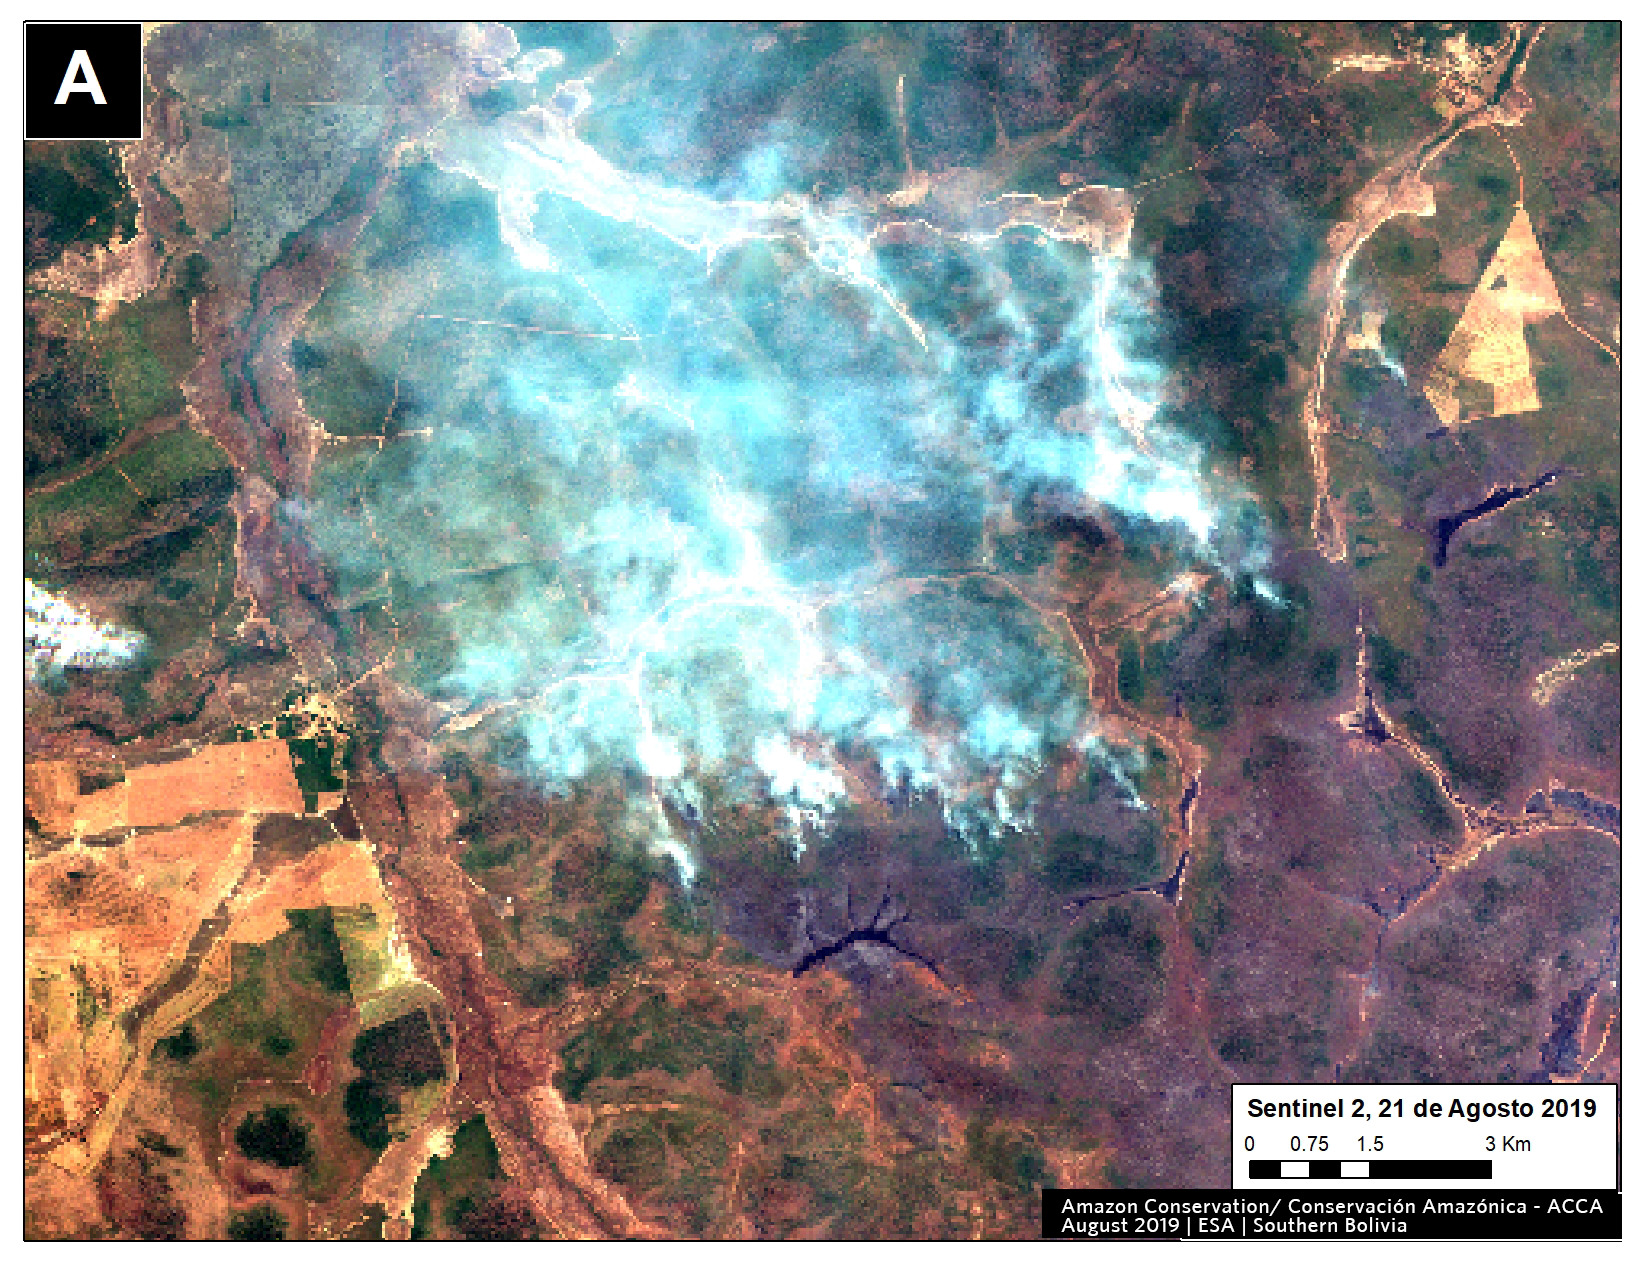
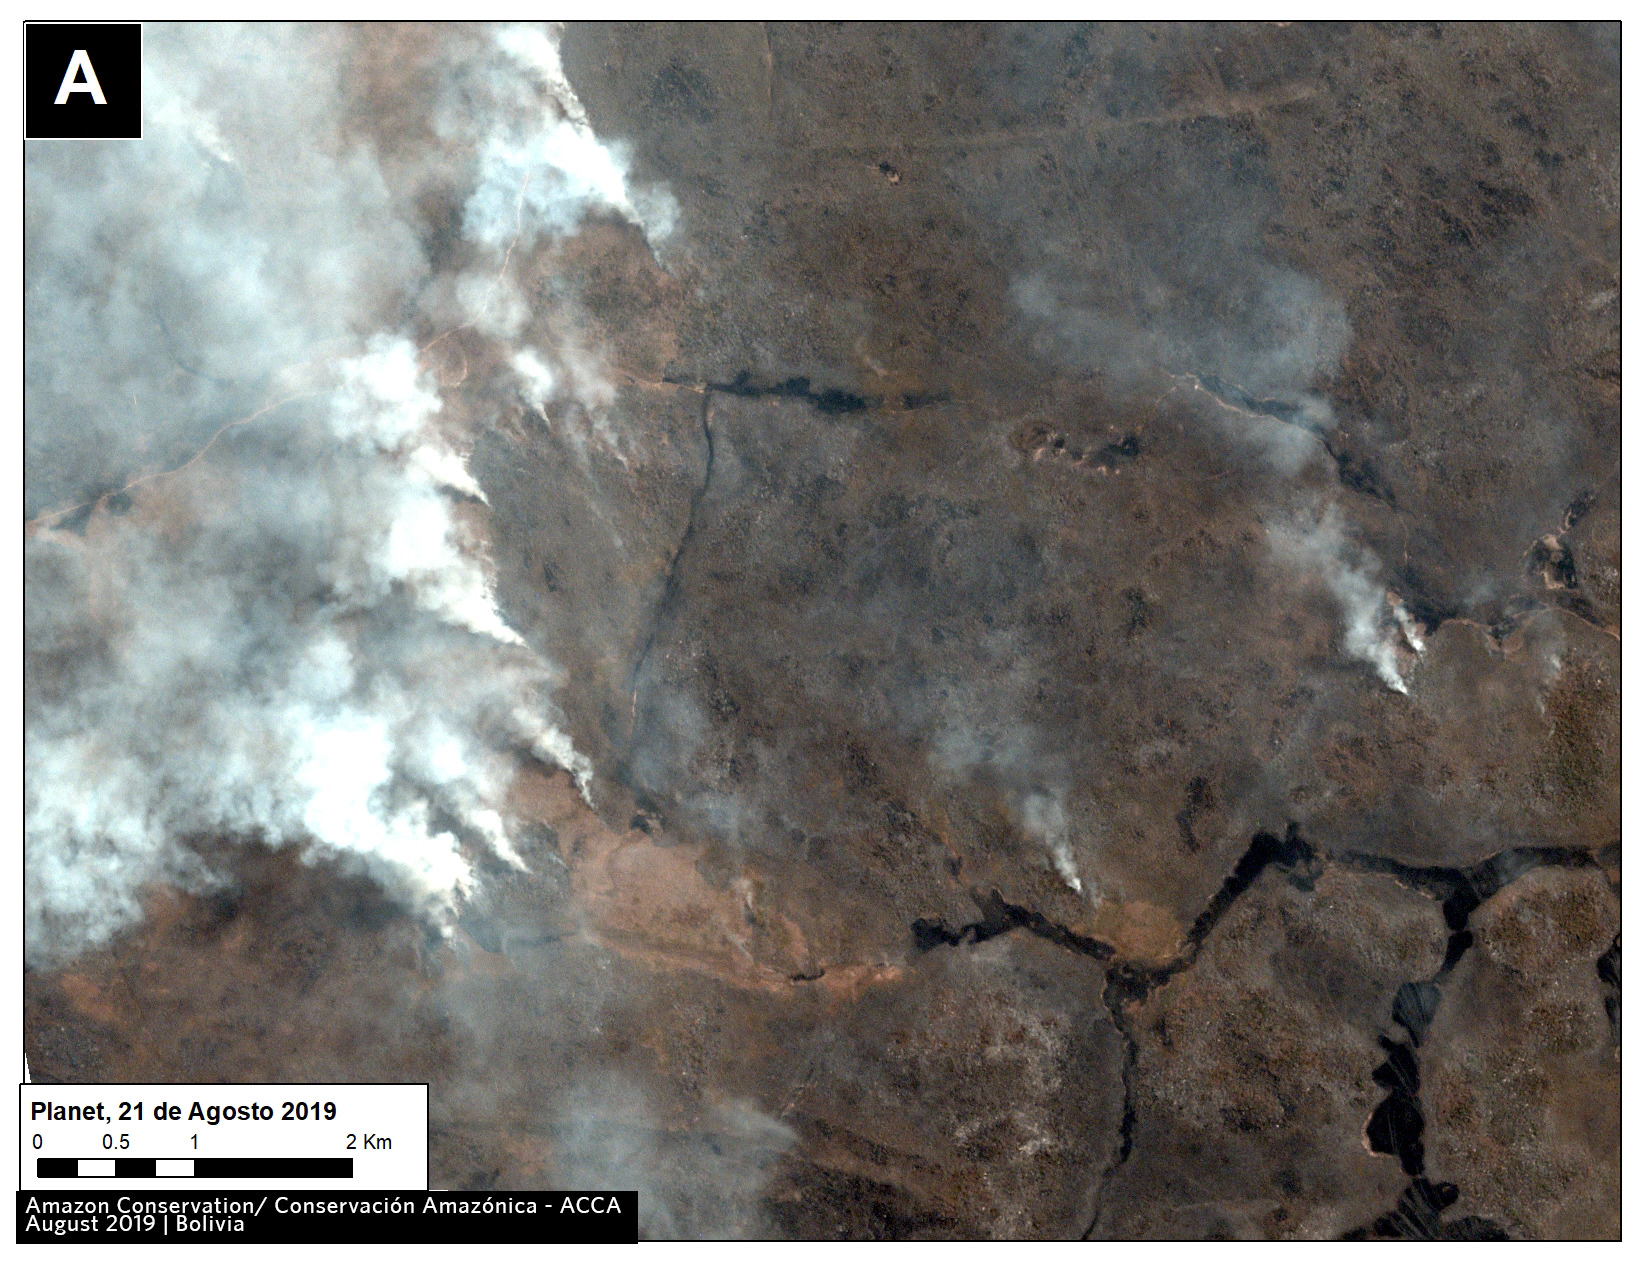
Primary forest loss rose sharply in the Bolivian Amazon (222,834 hectares), largely due to uncontrolled fires escaping into the dry forests of the southern Amazon.
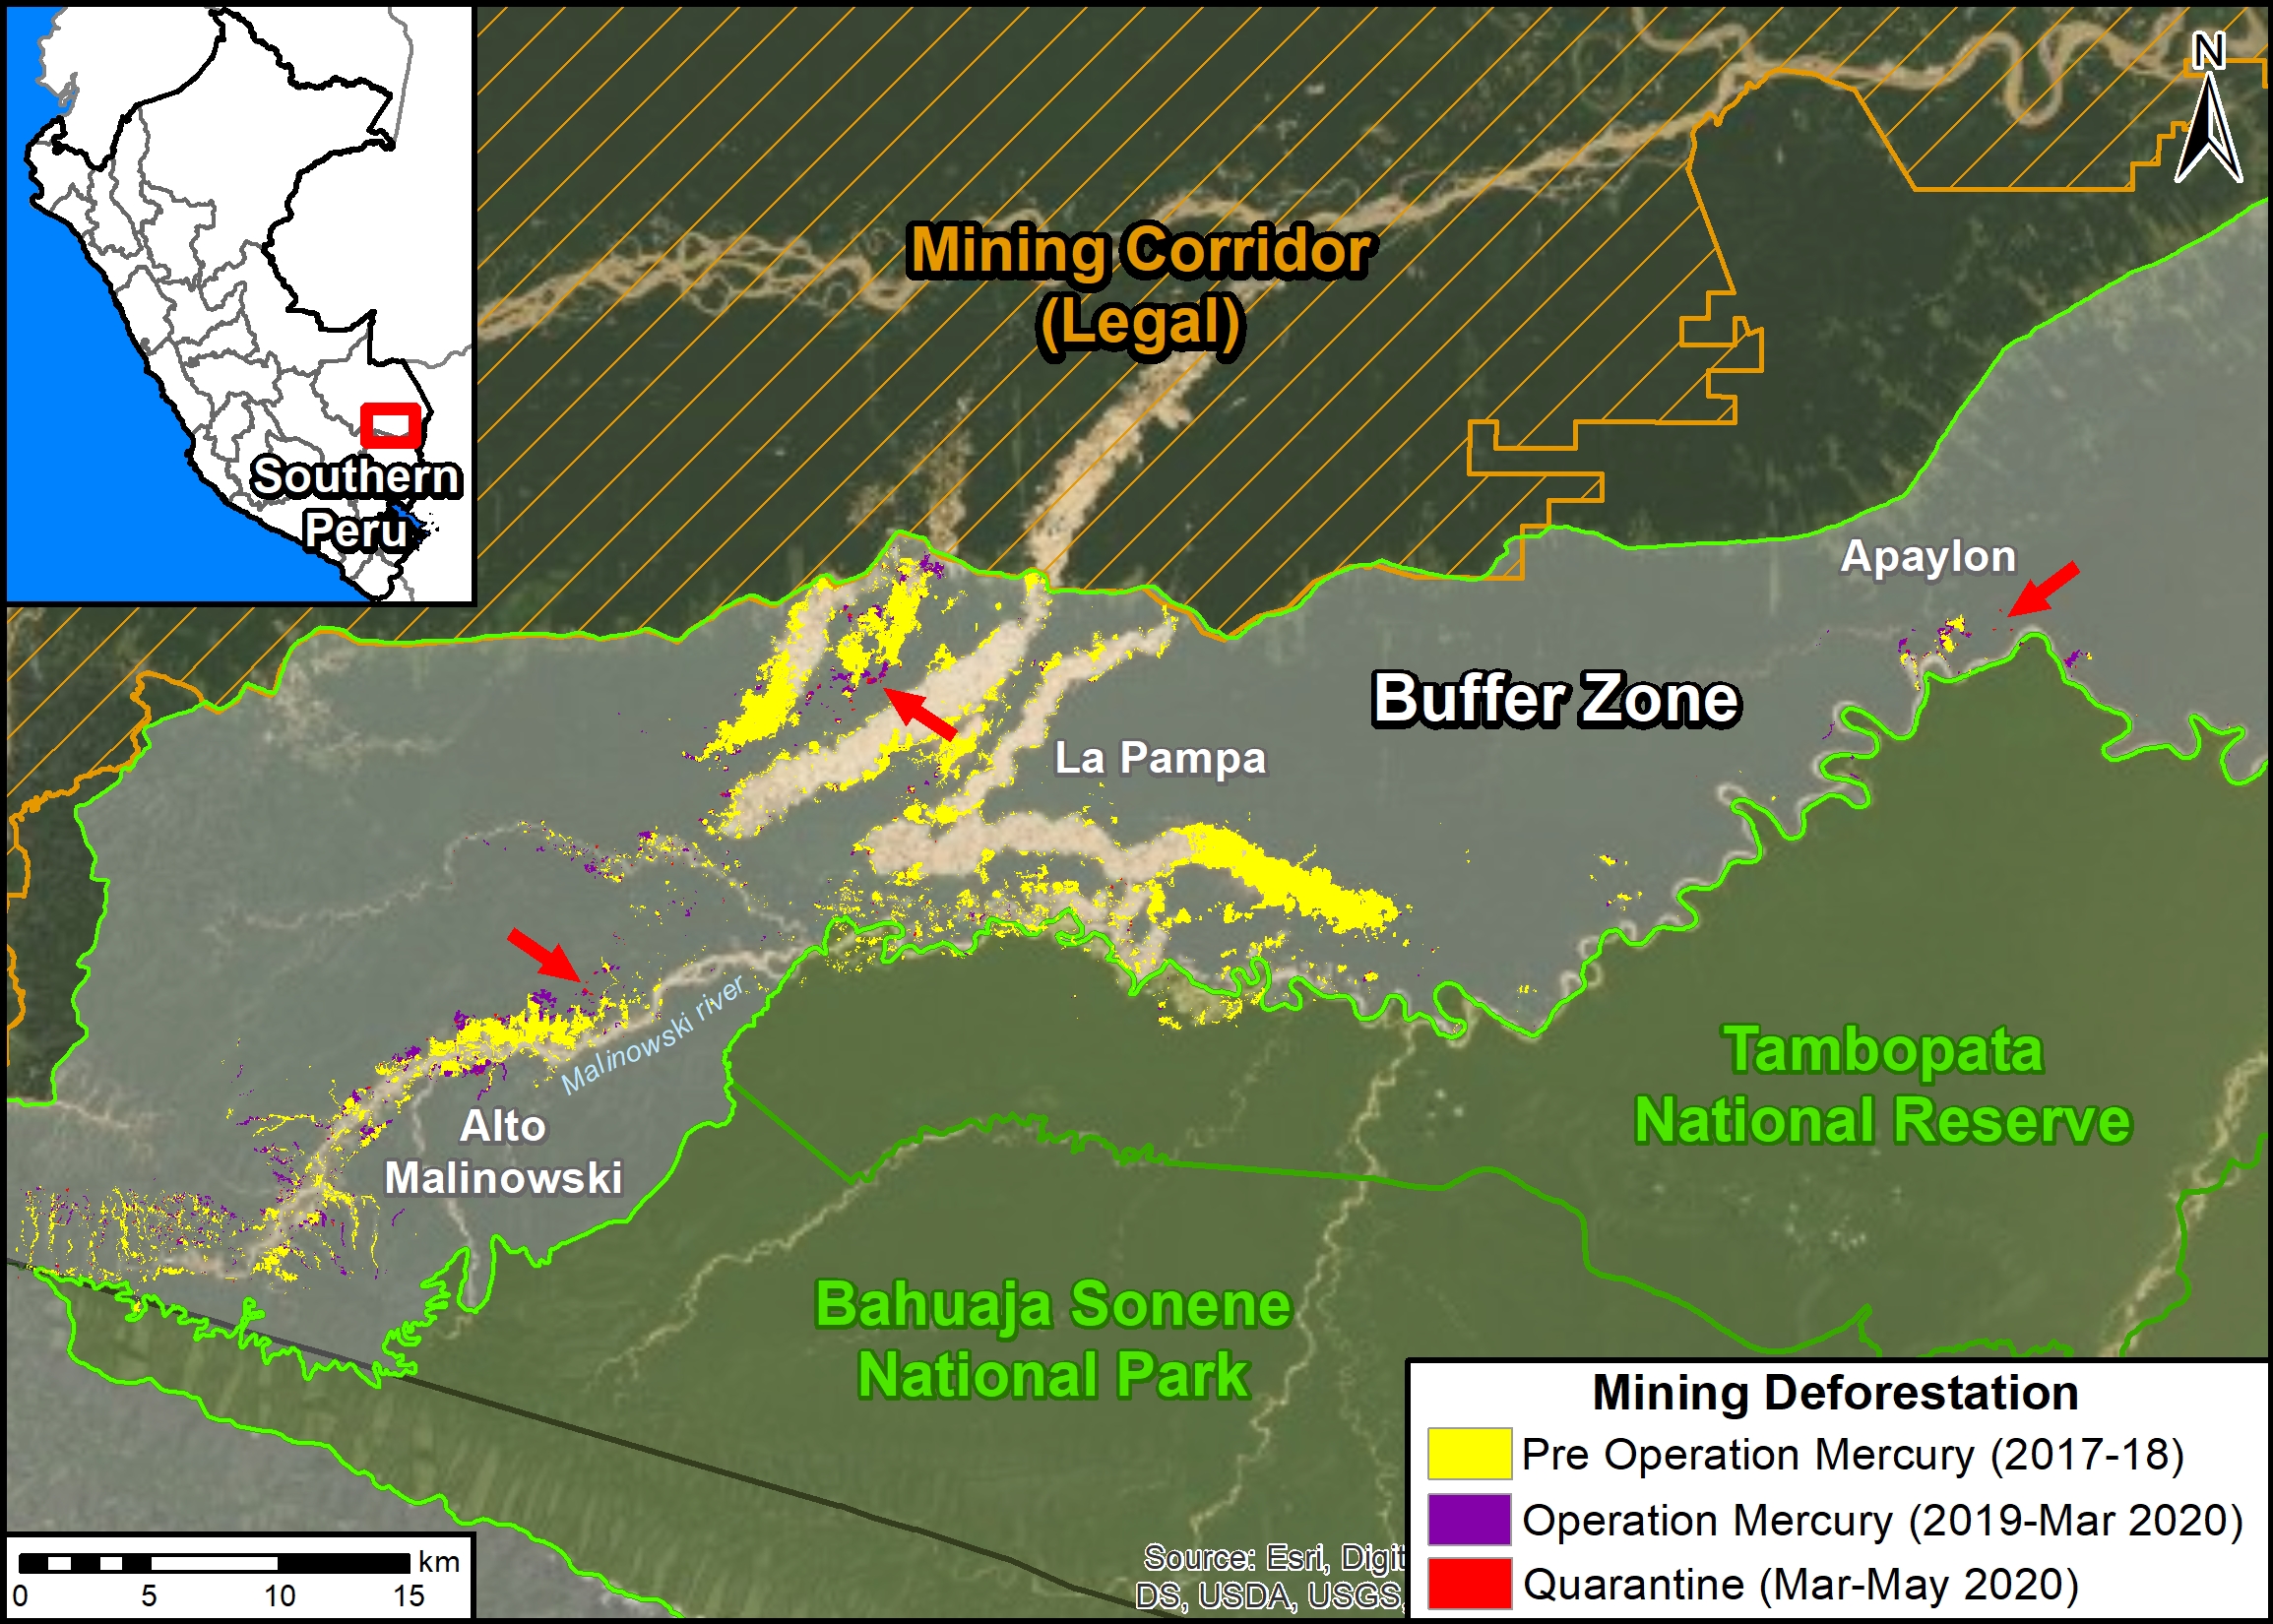
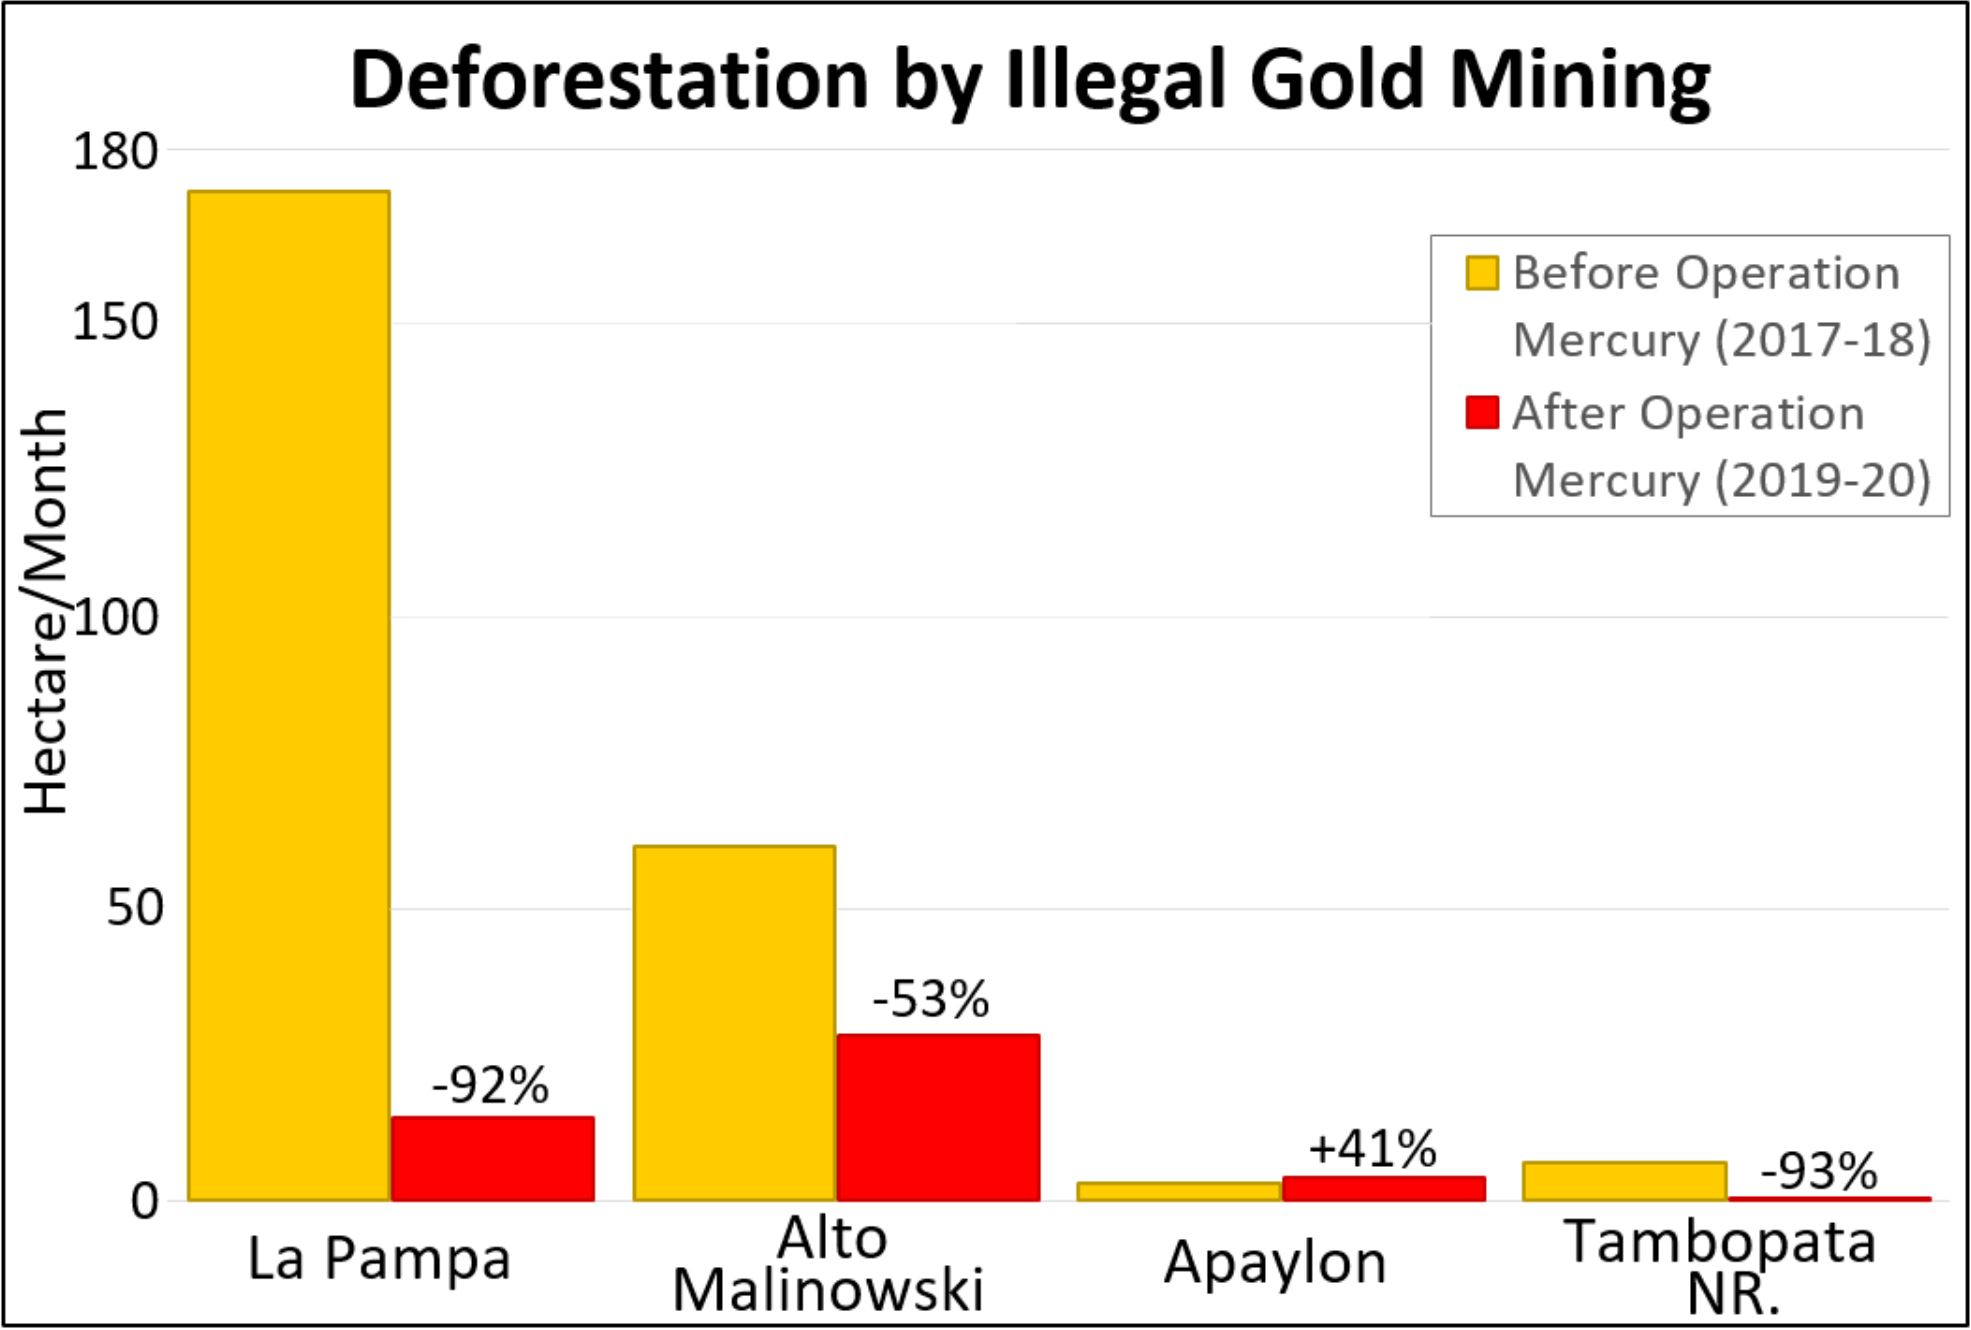
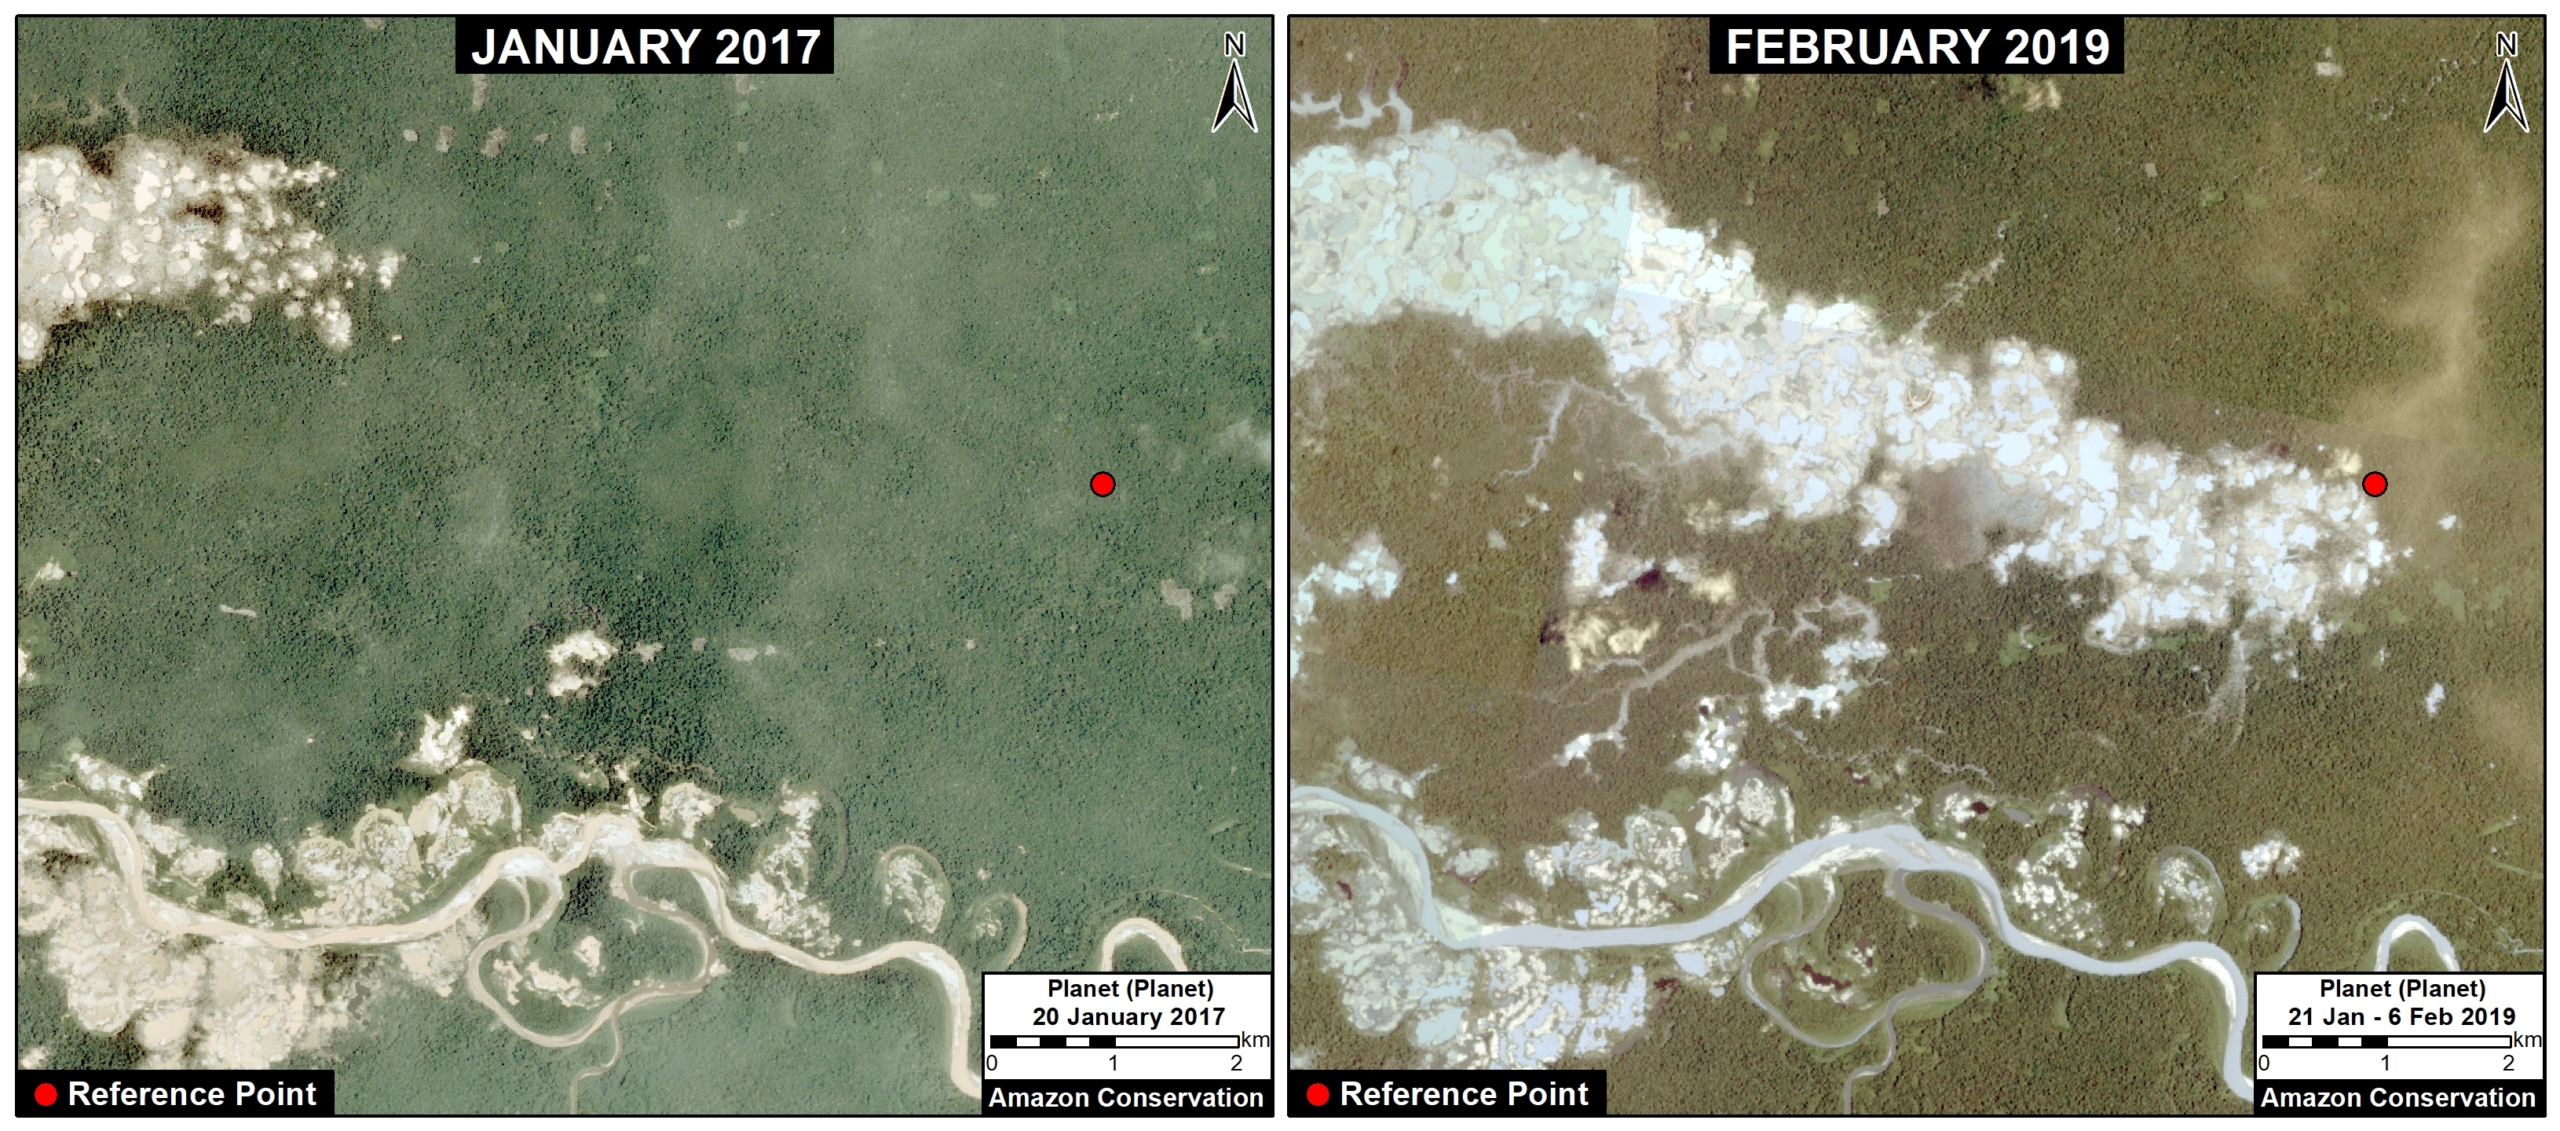
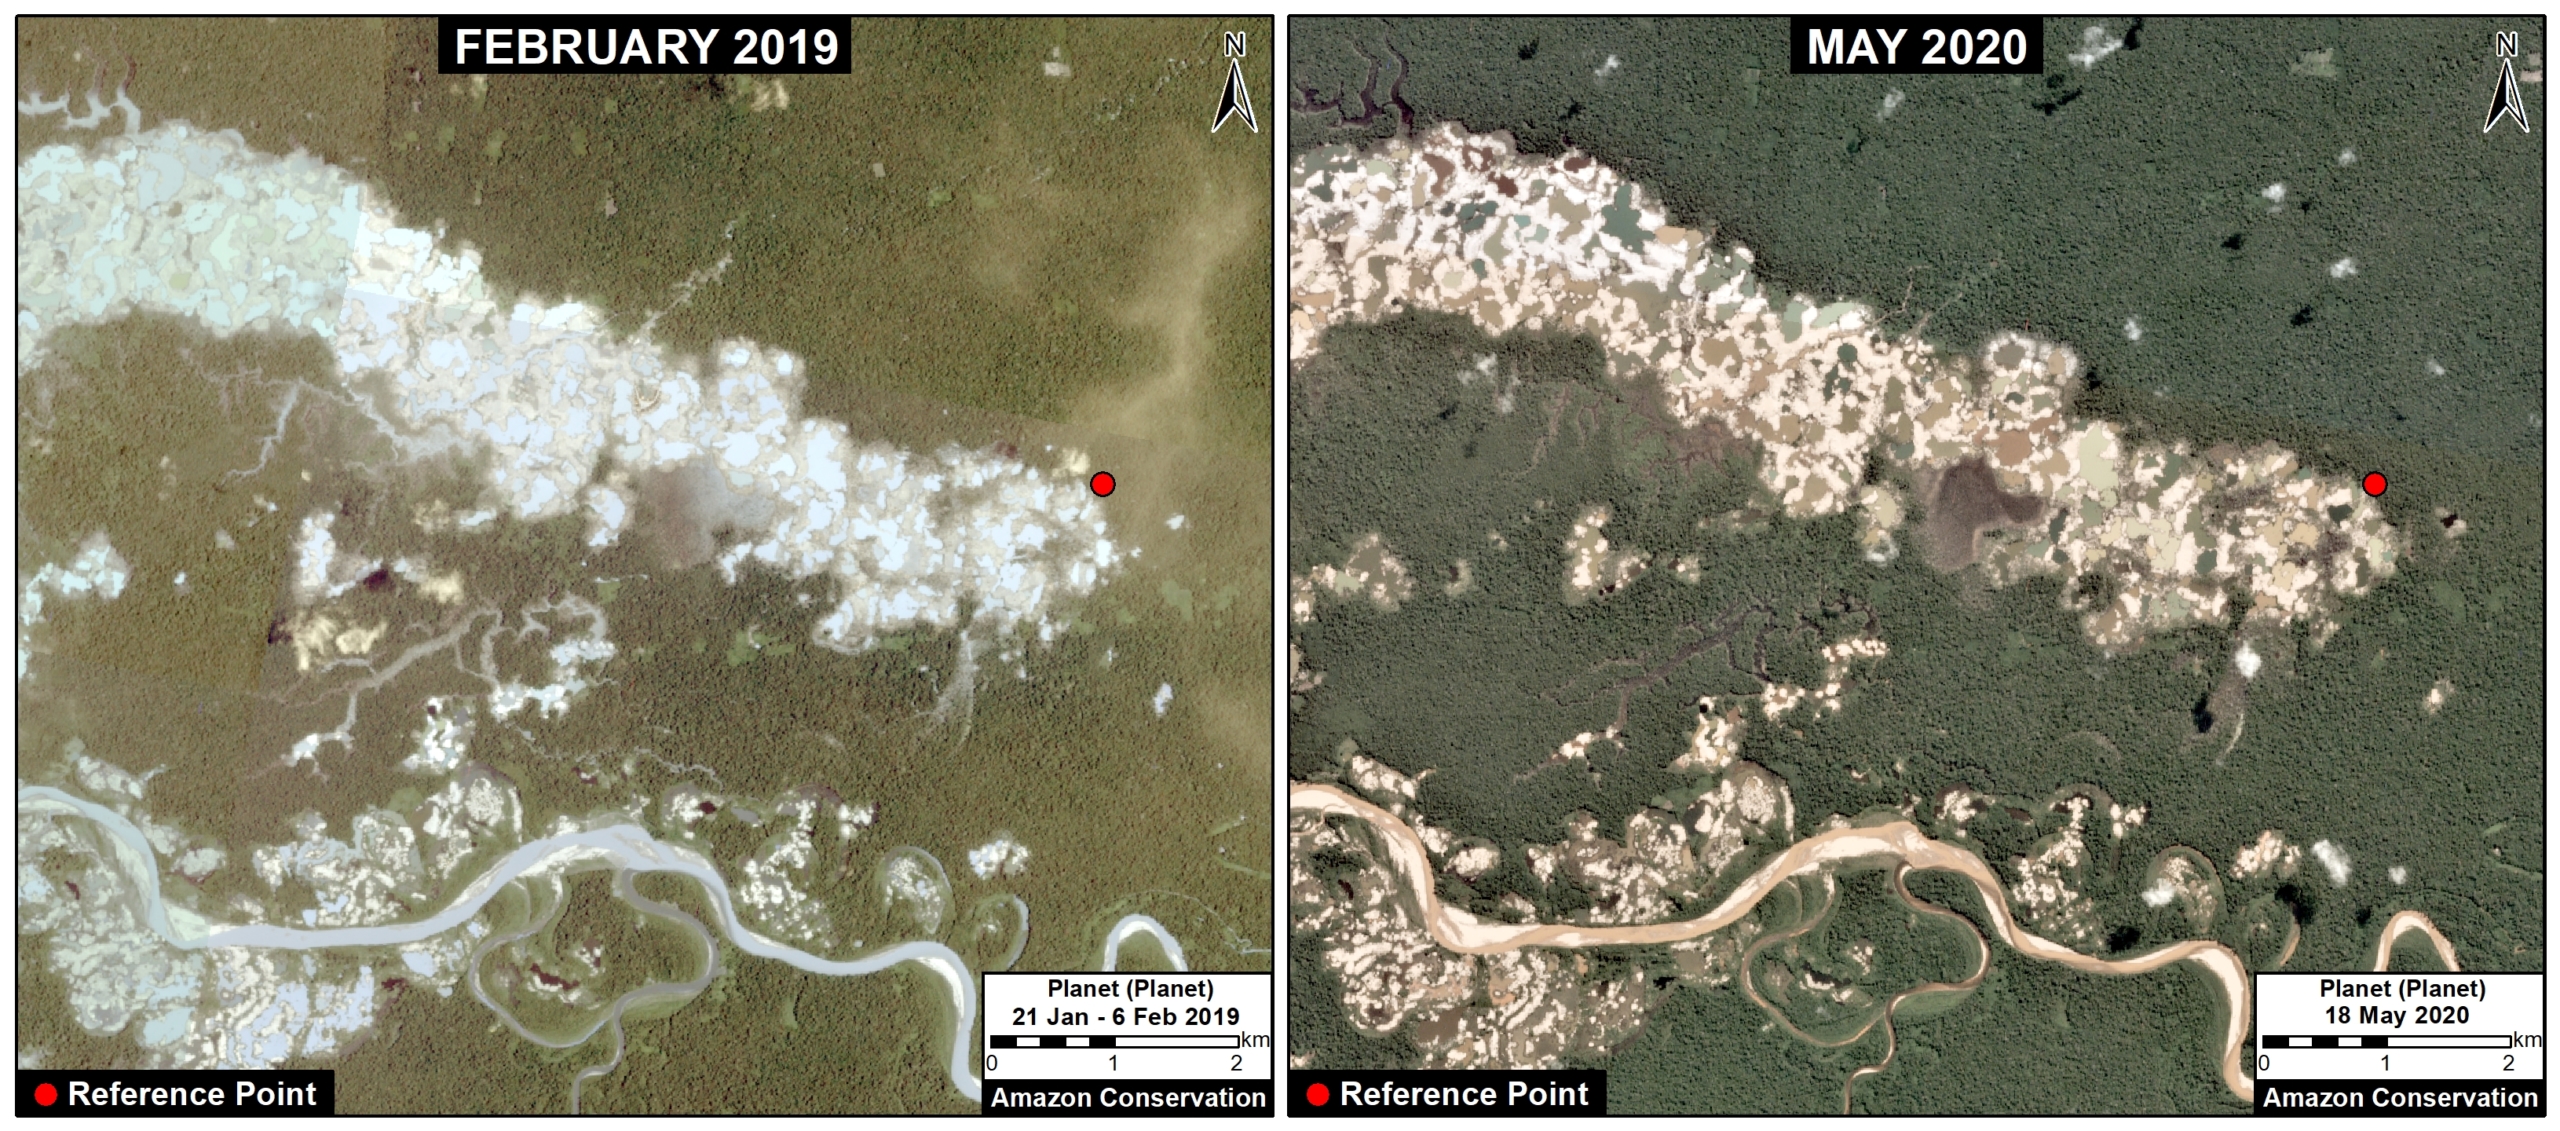
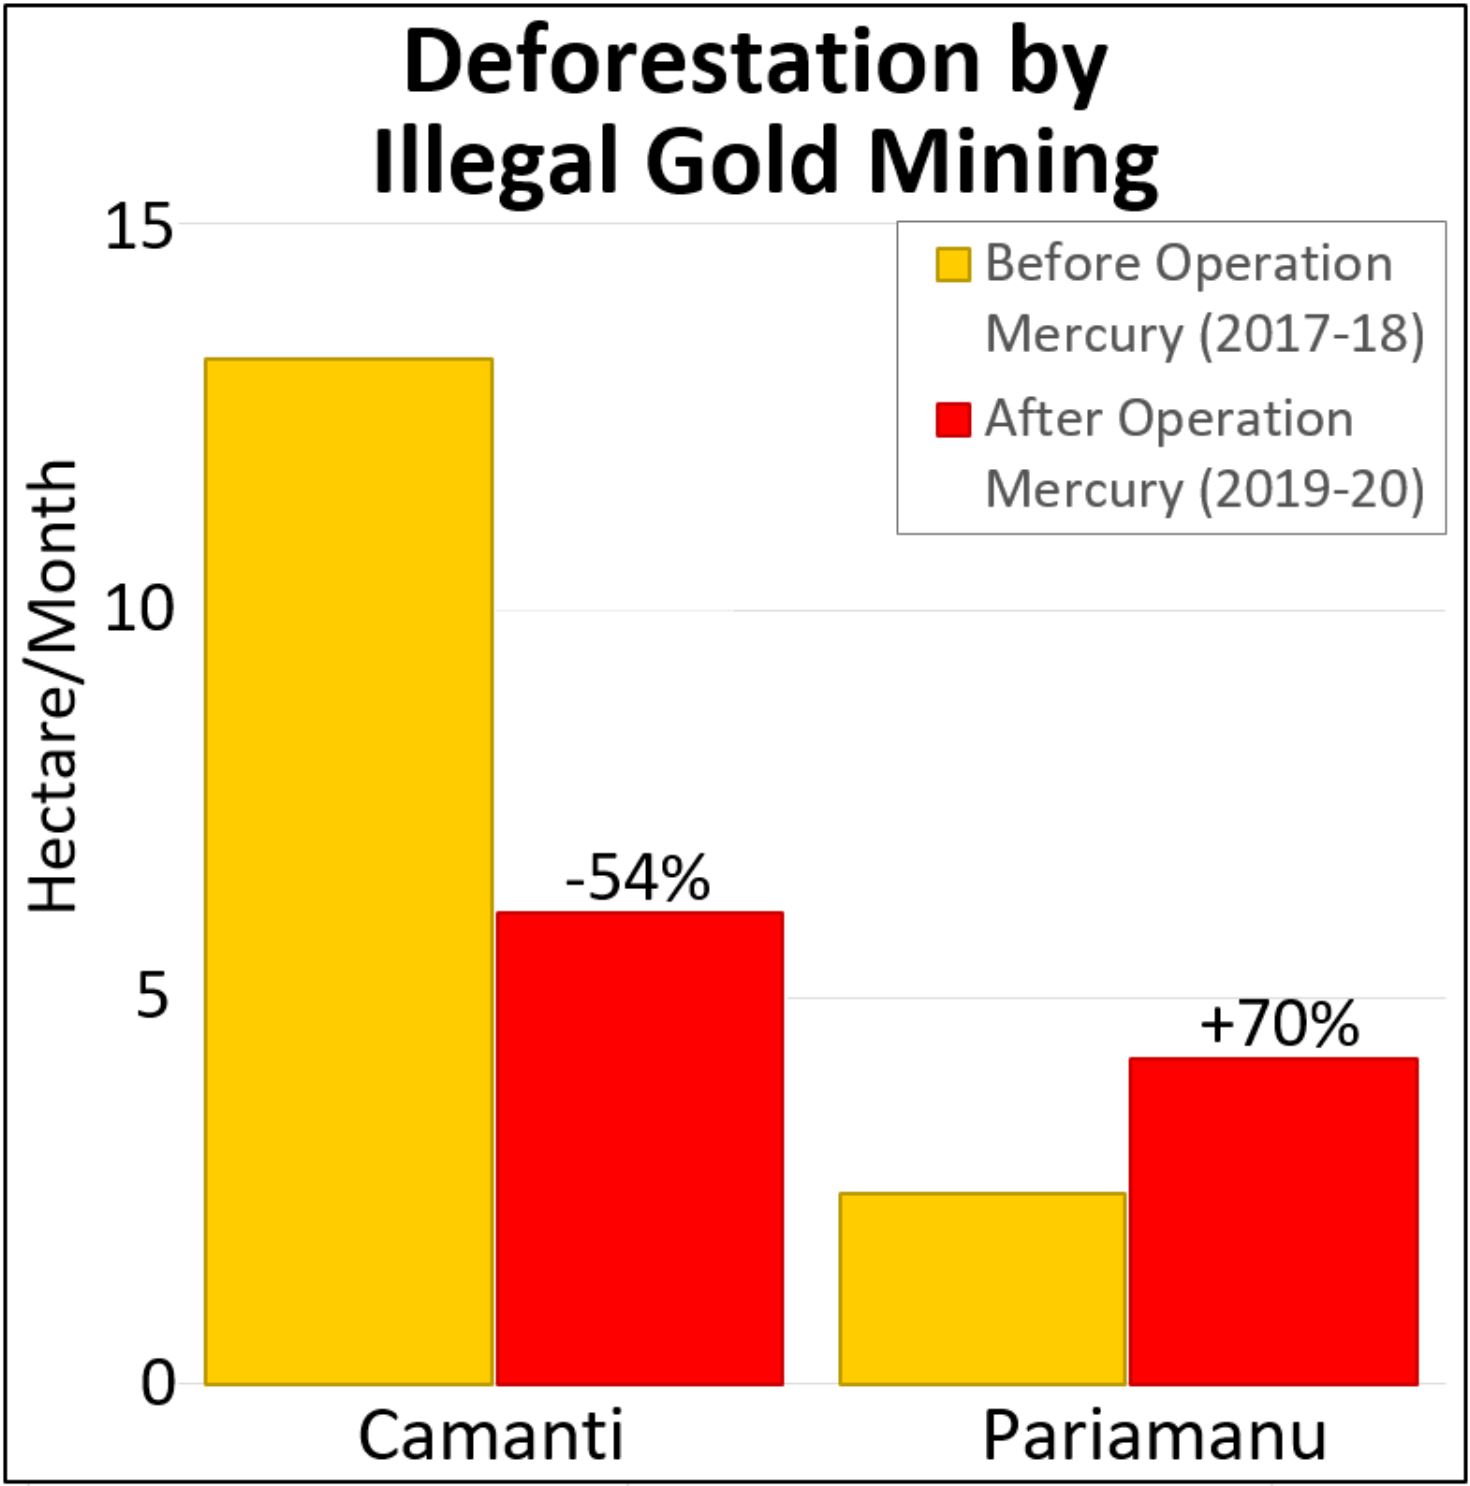
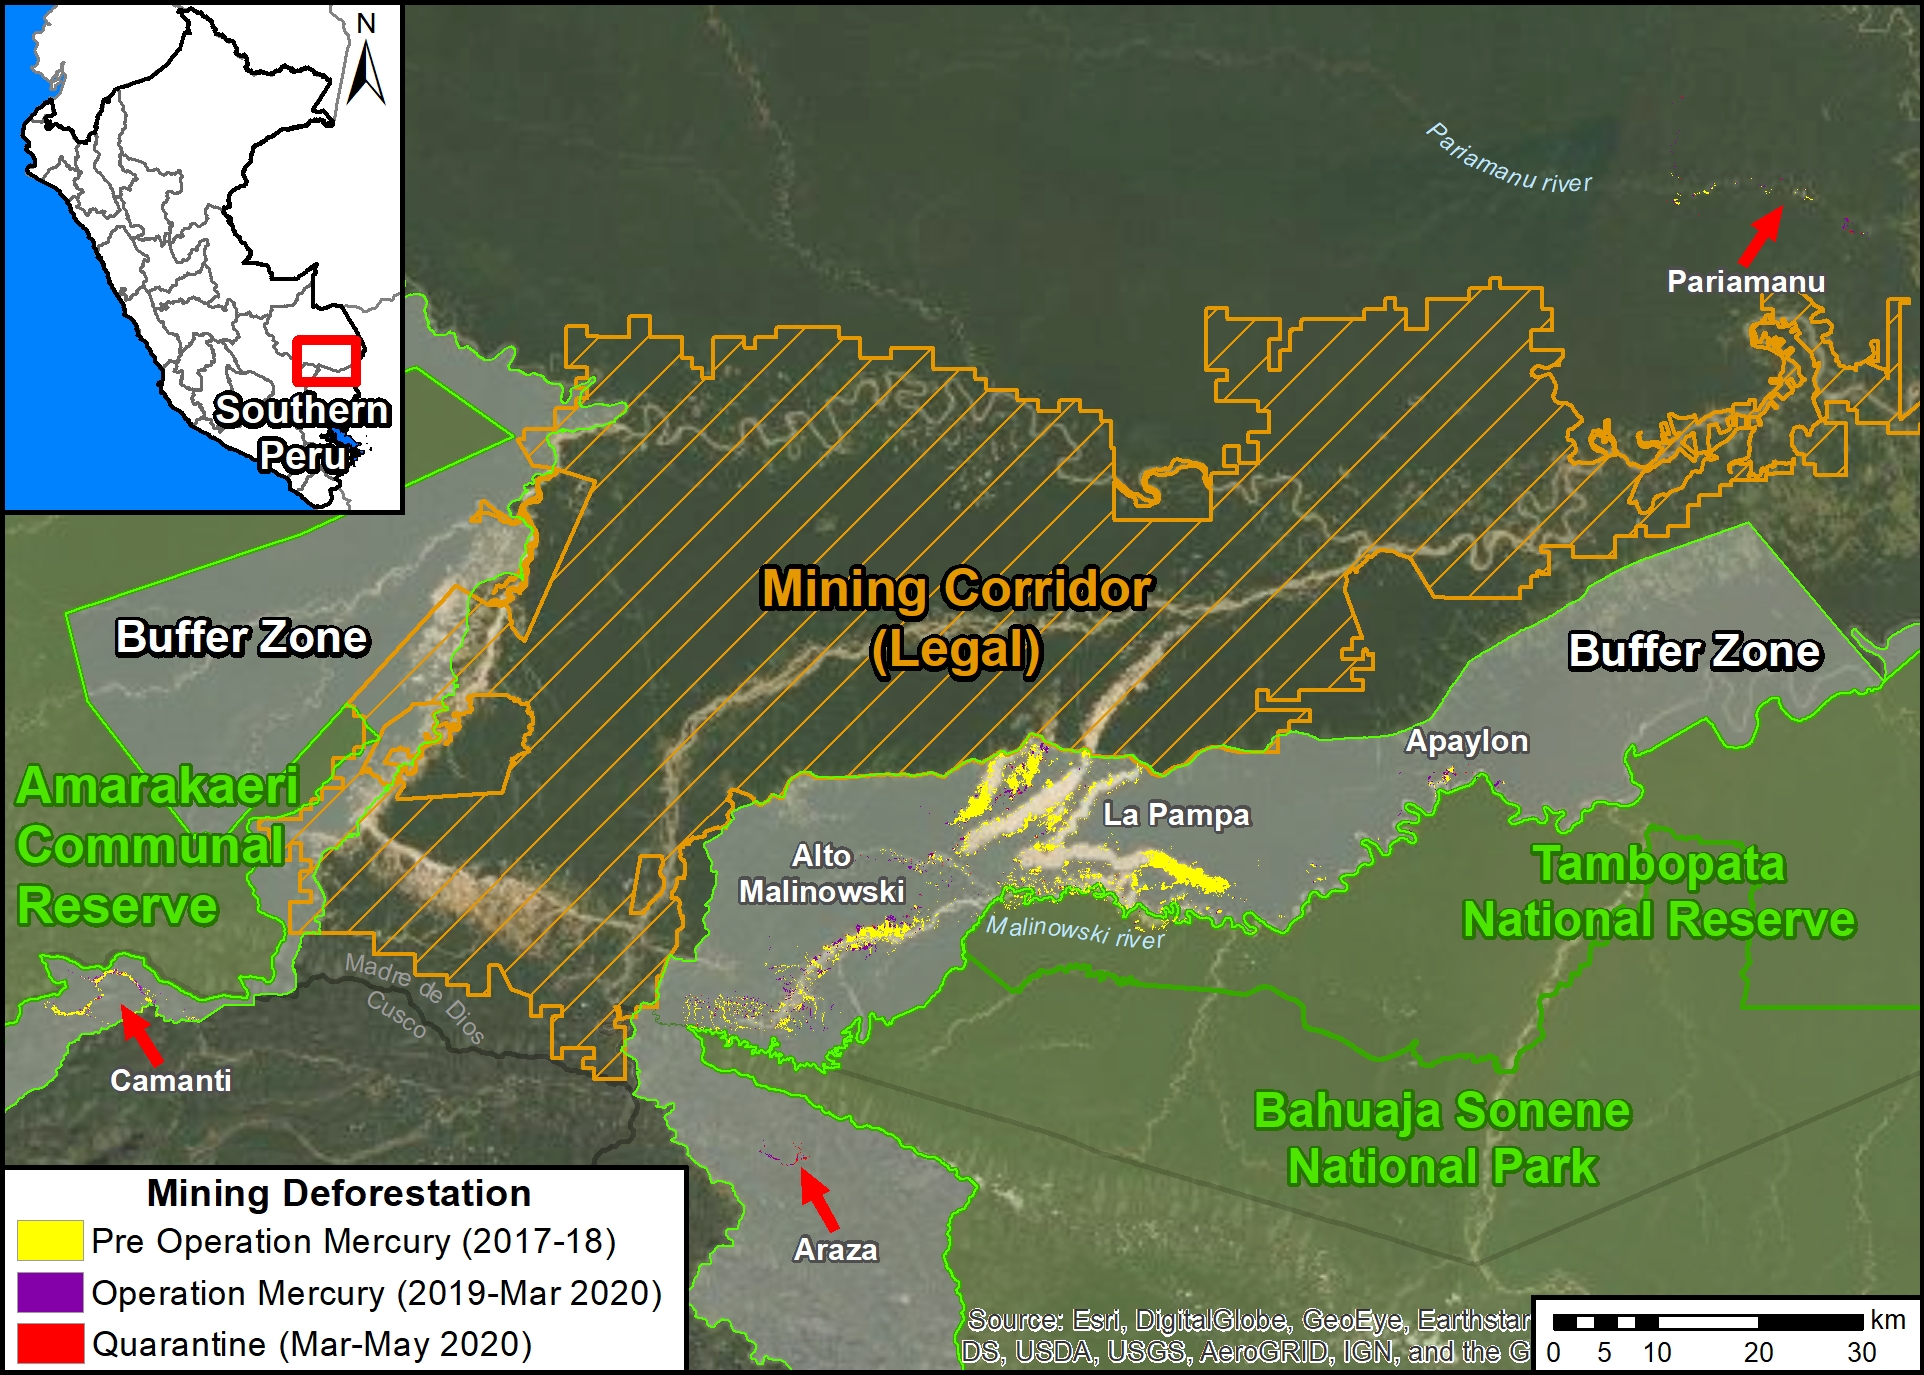
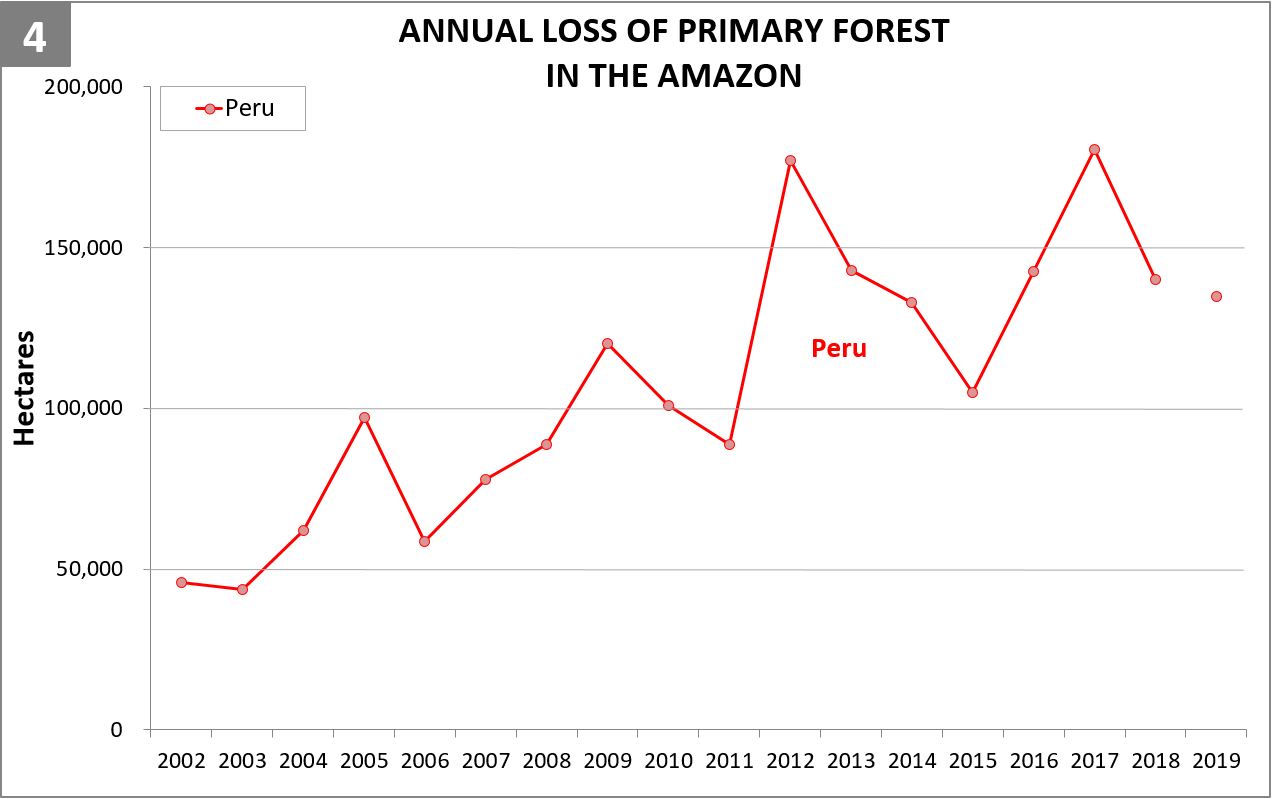
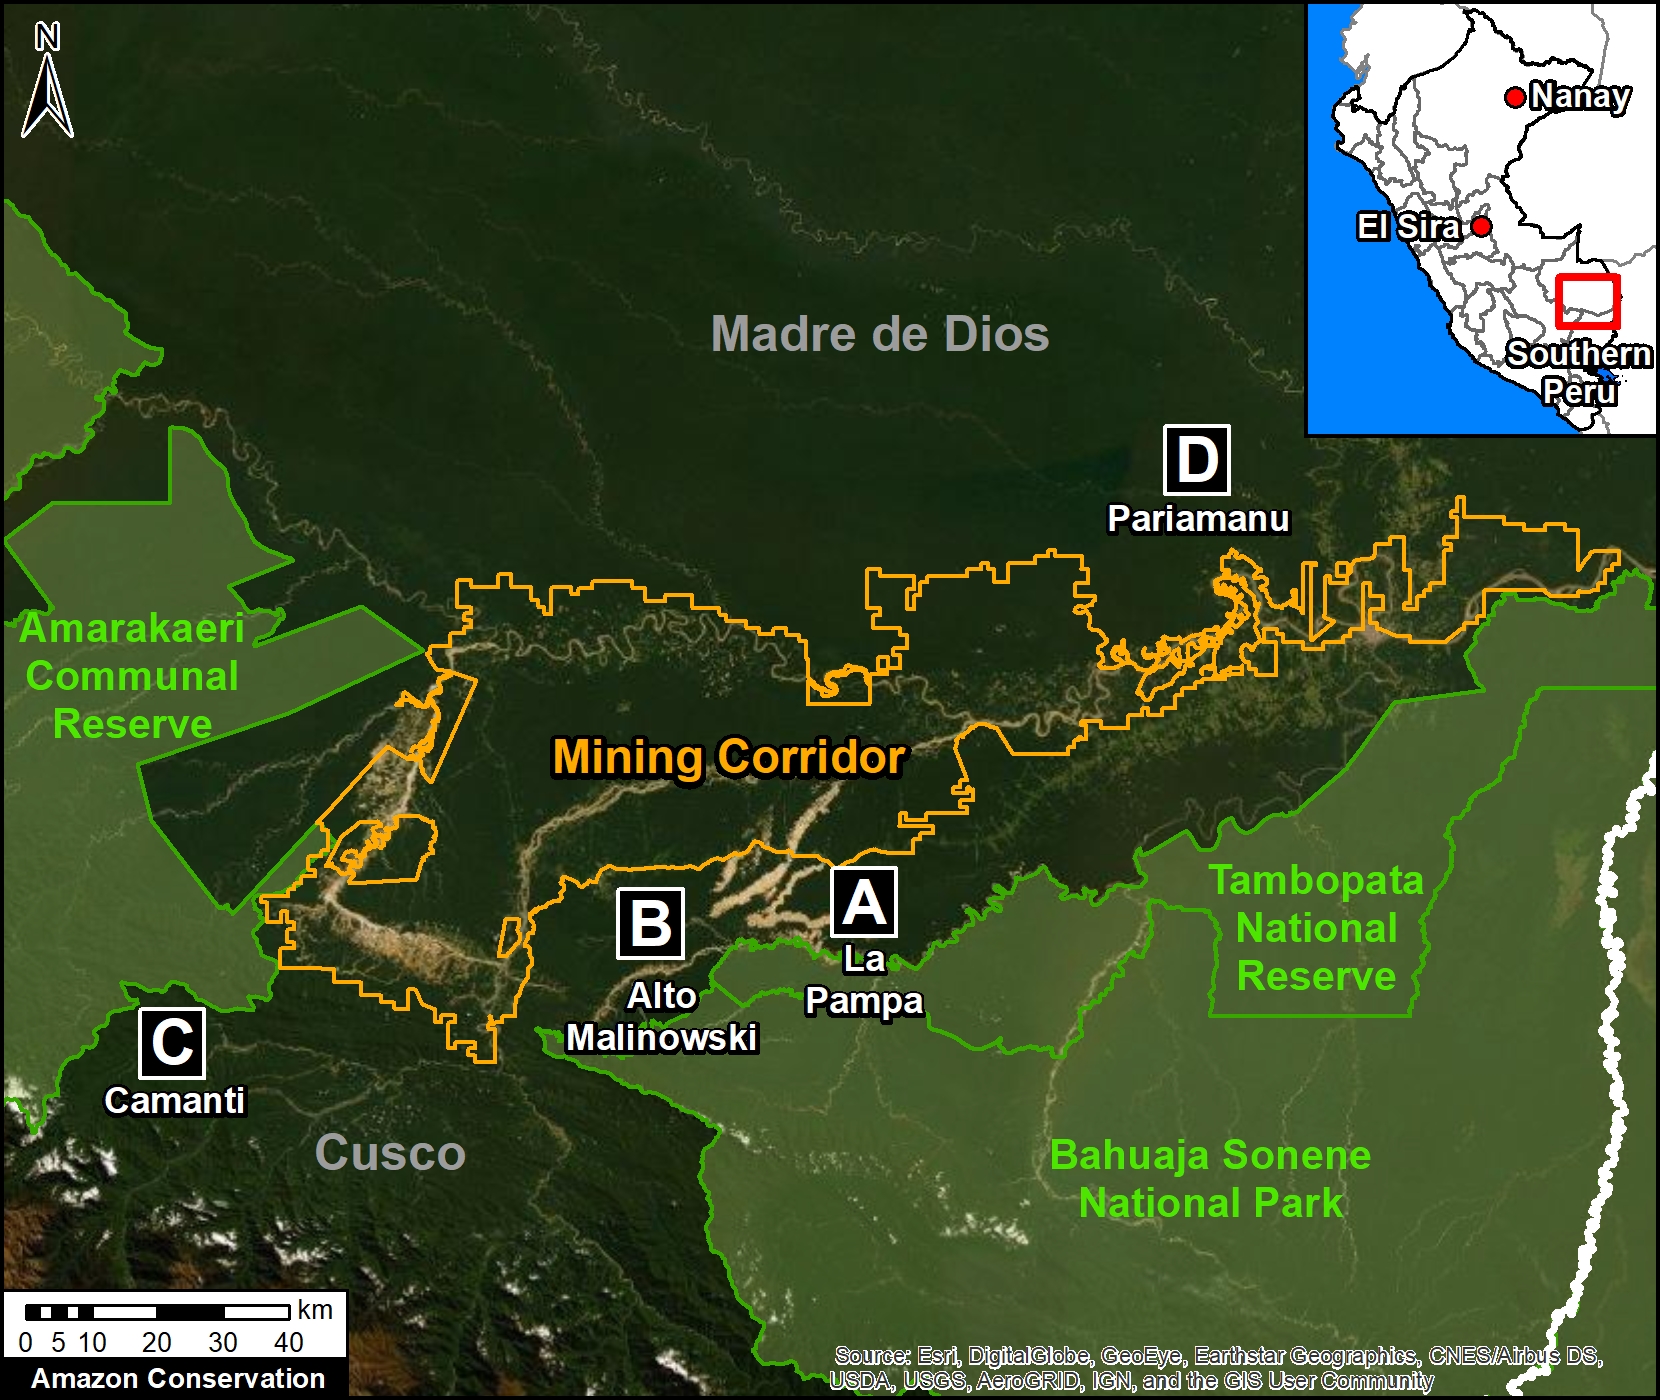
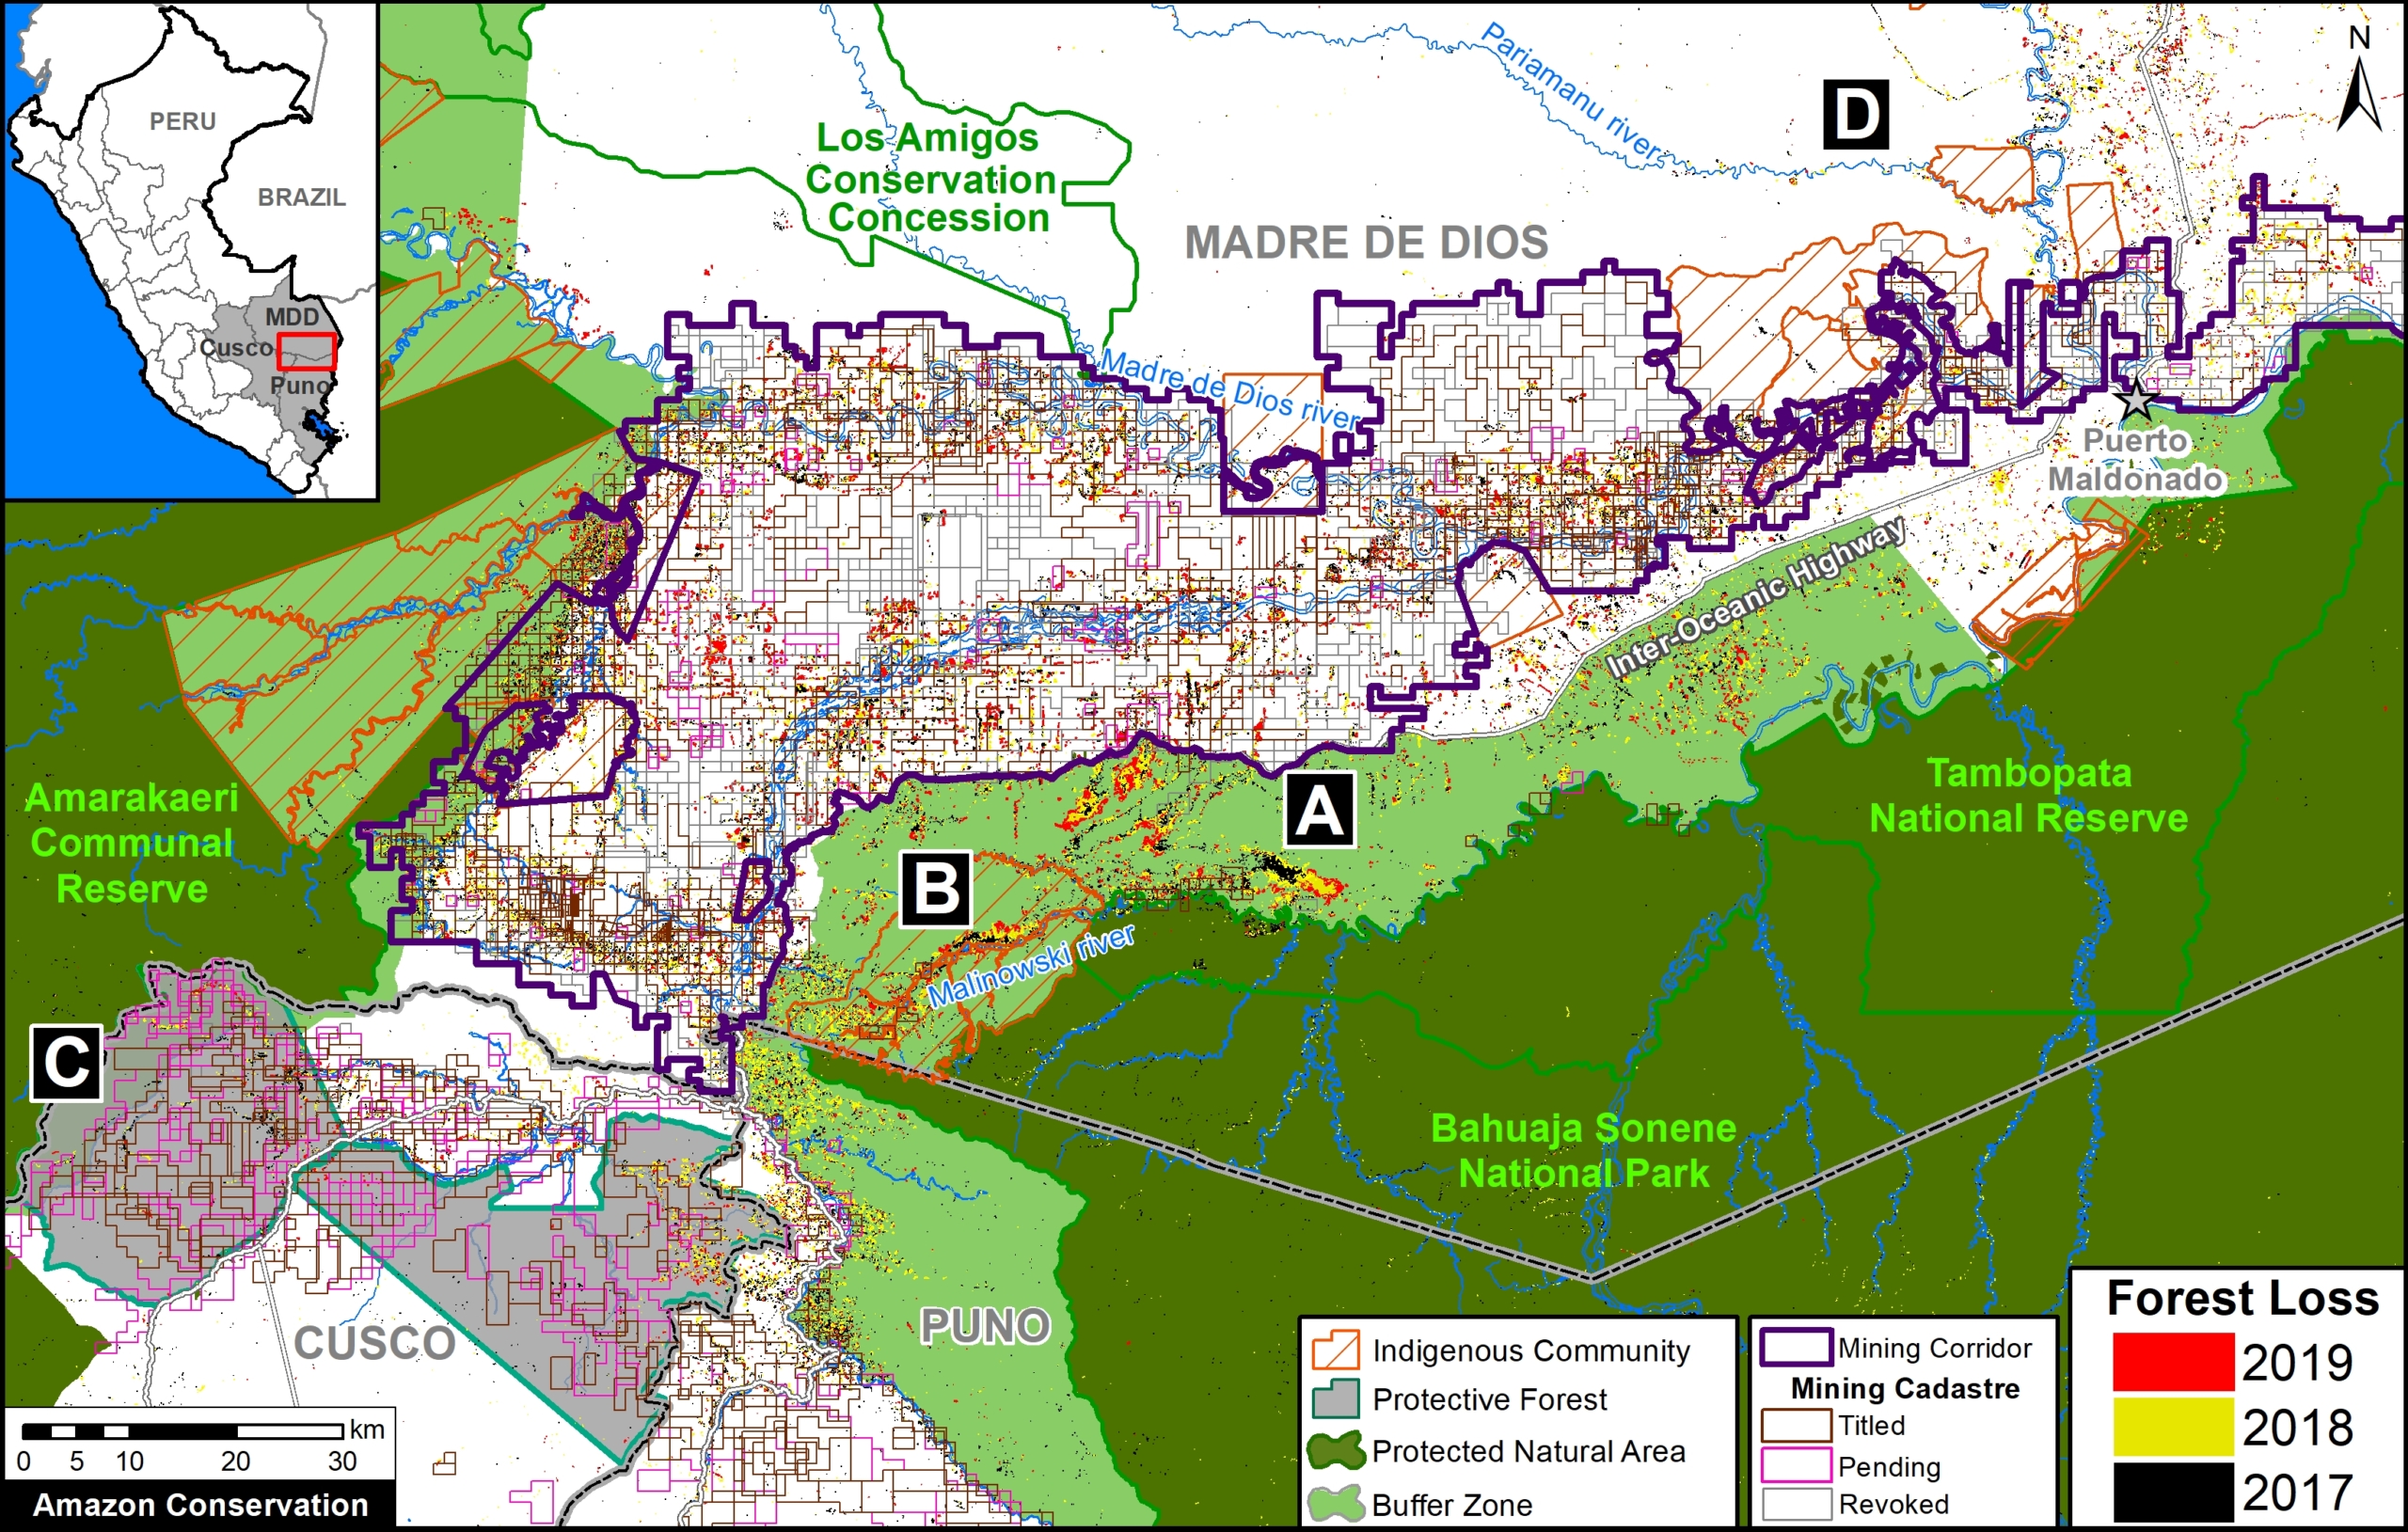
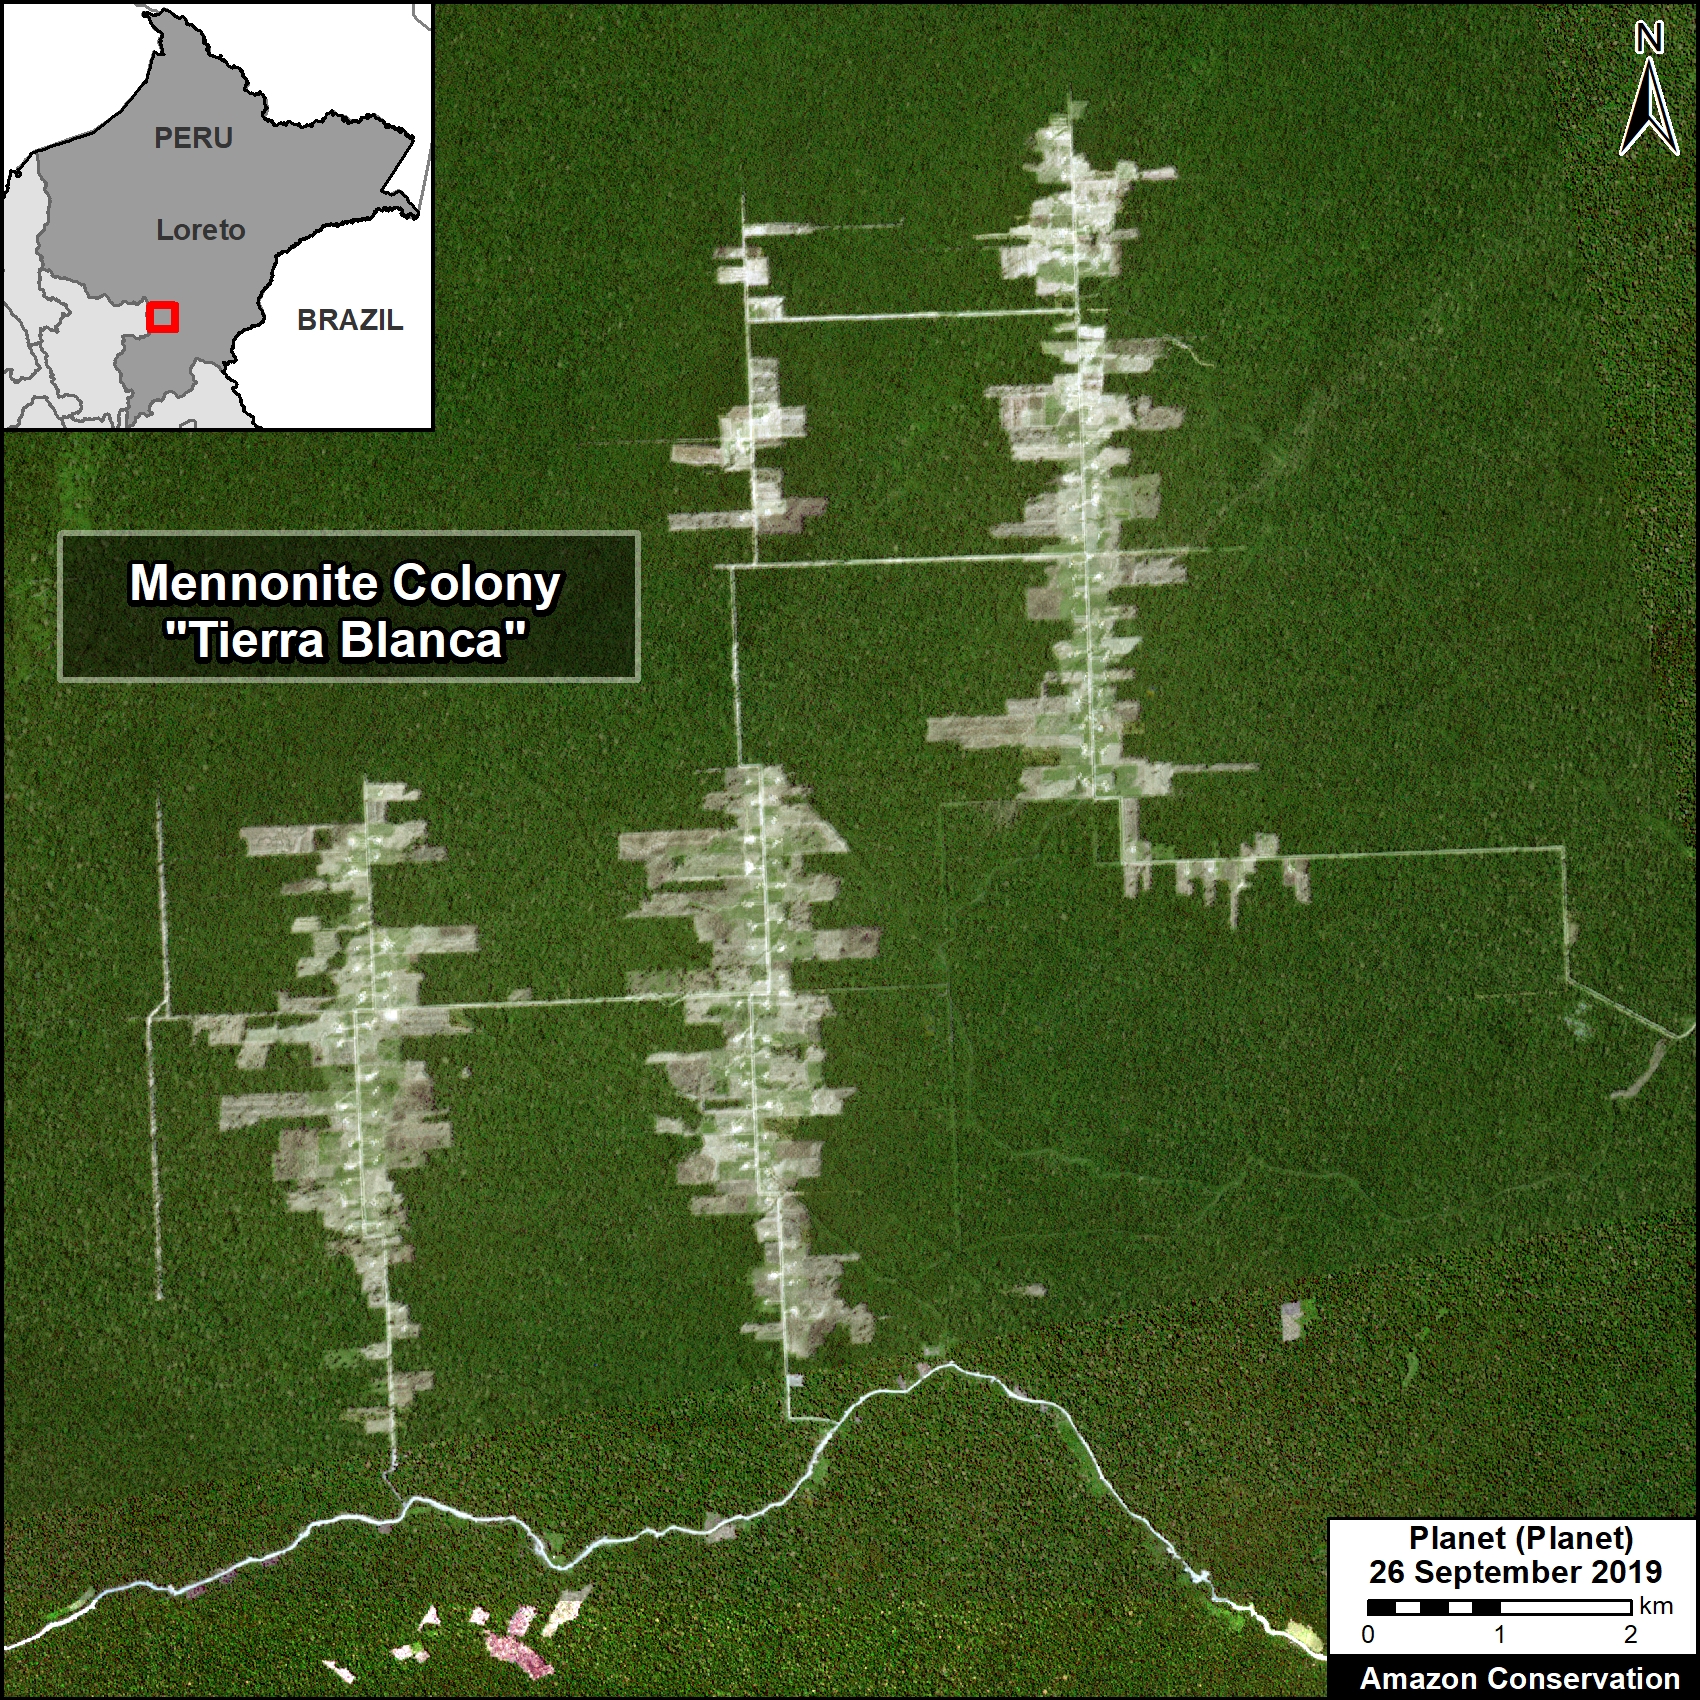
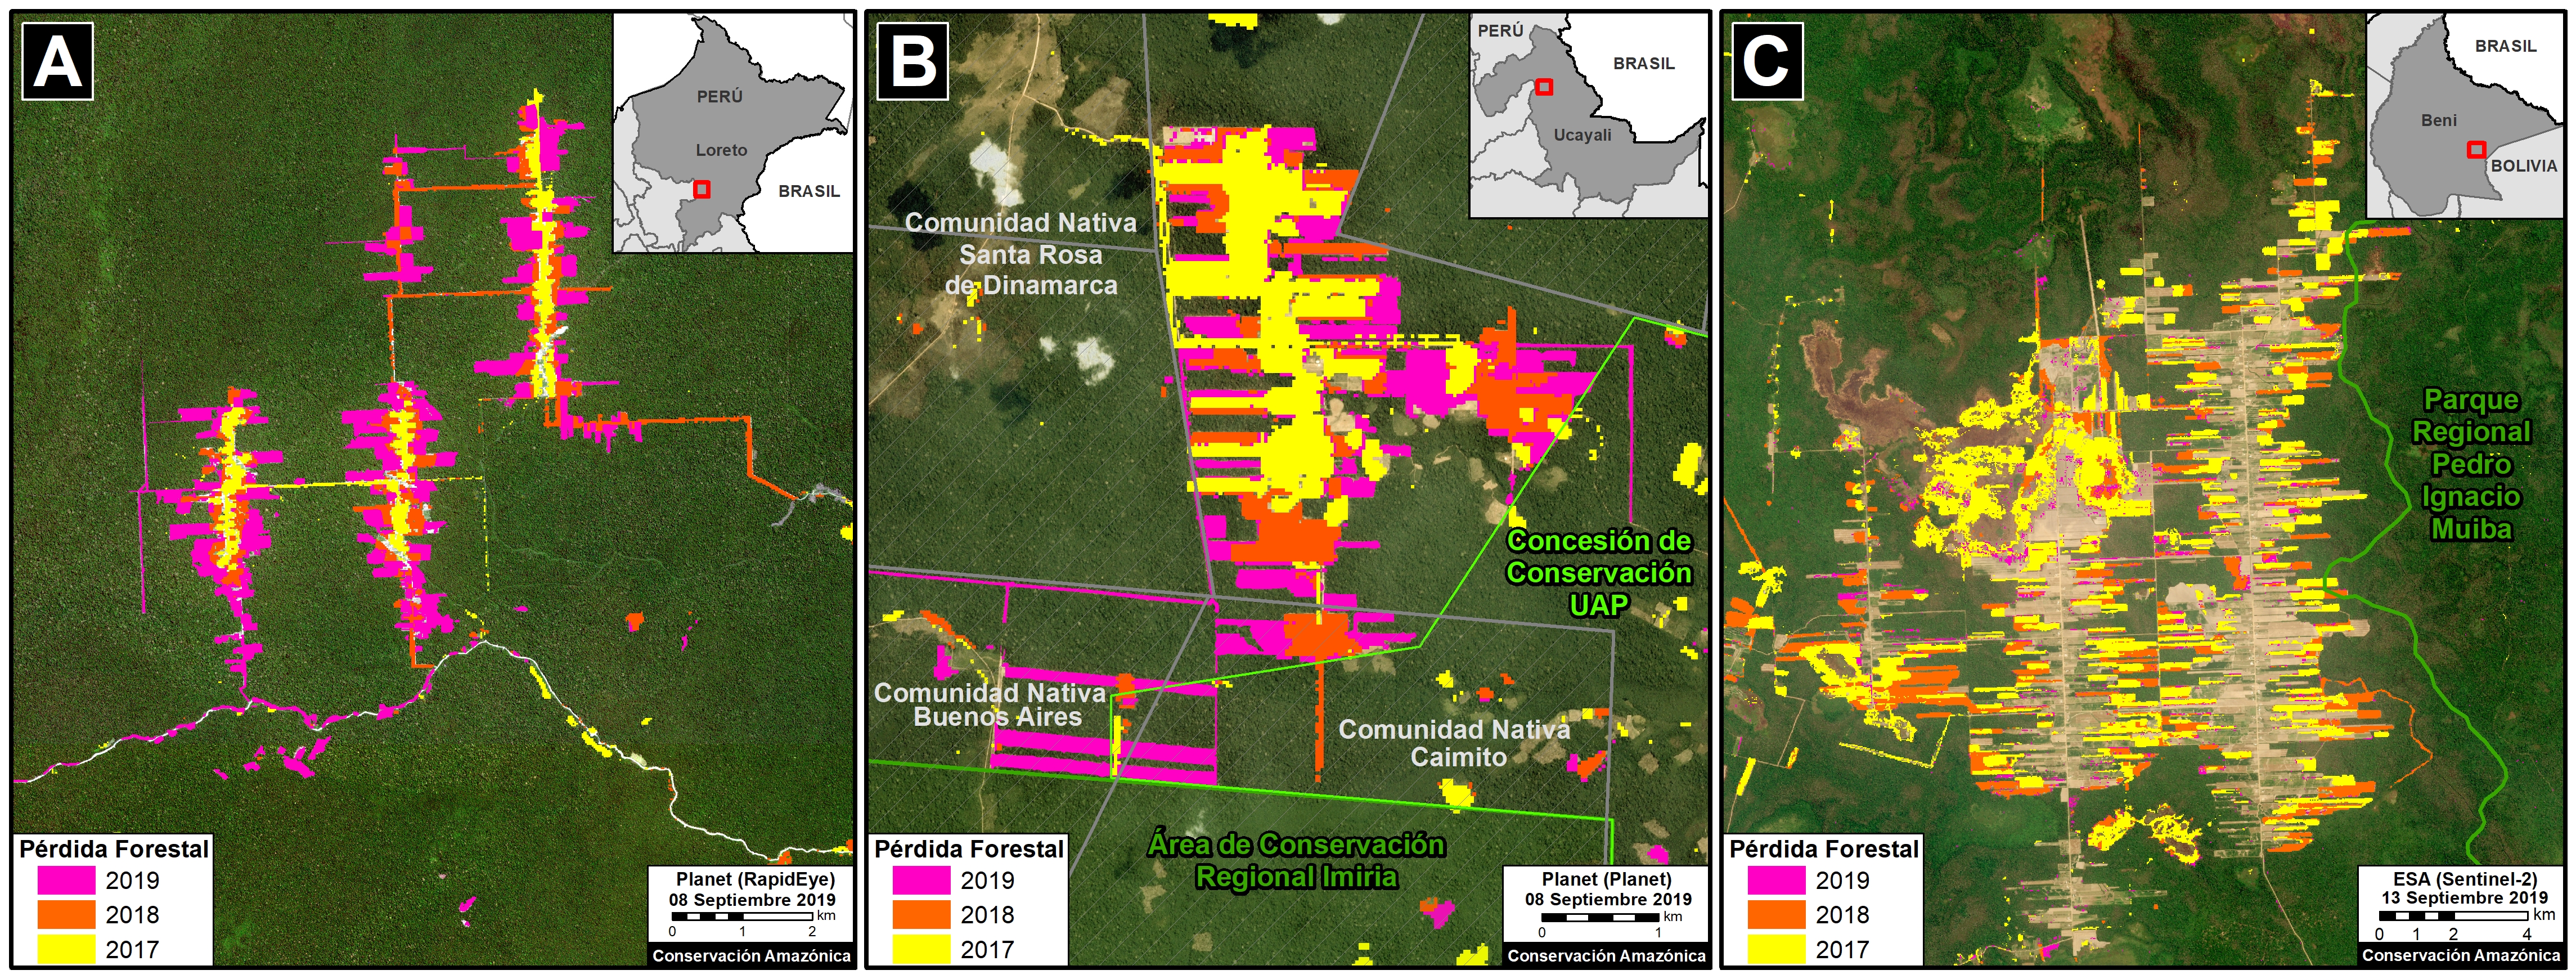
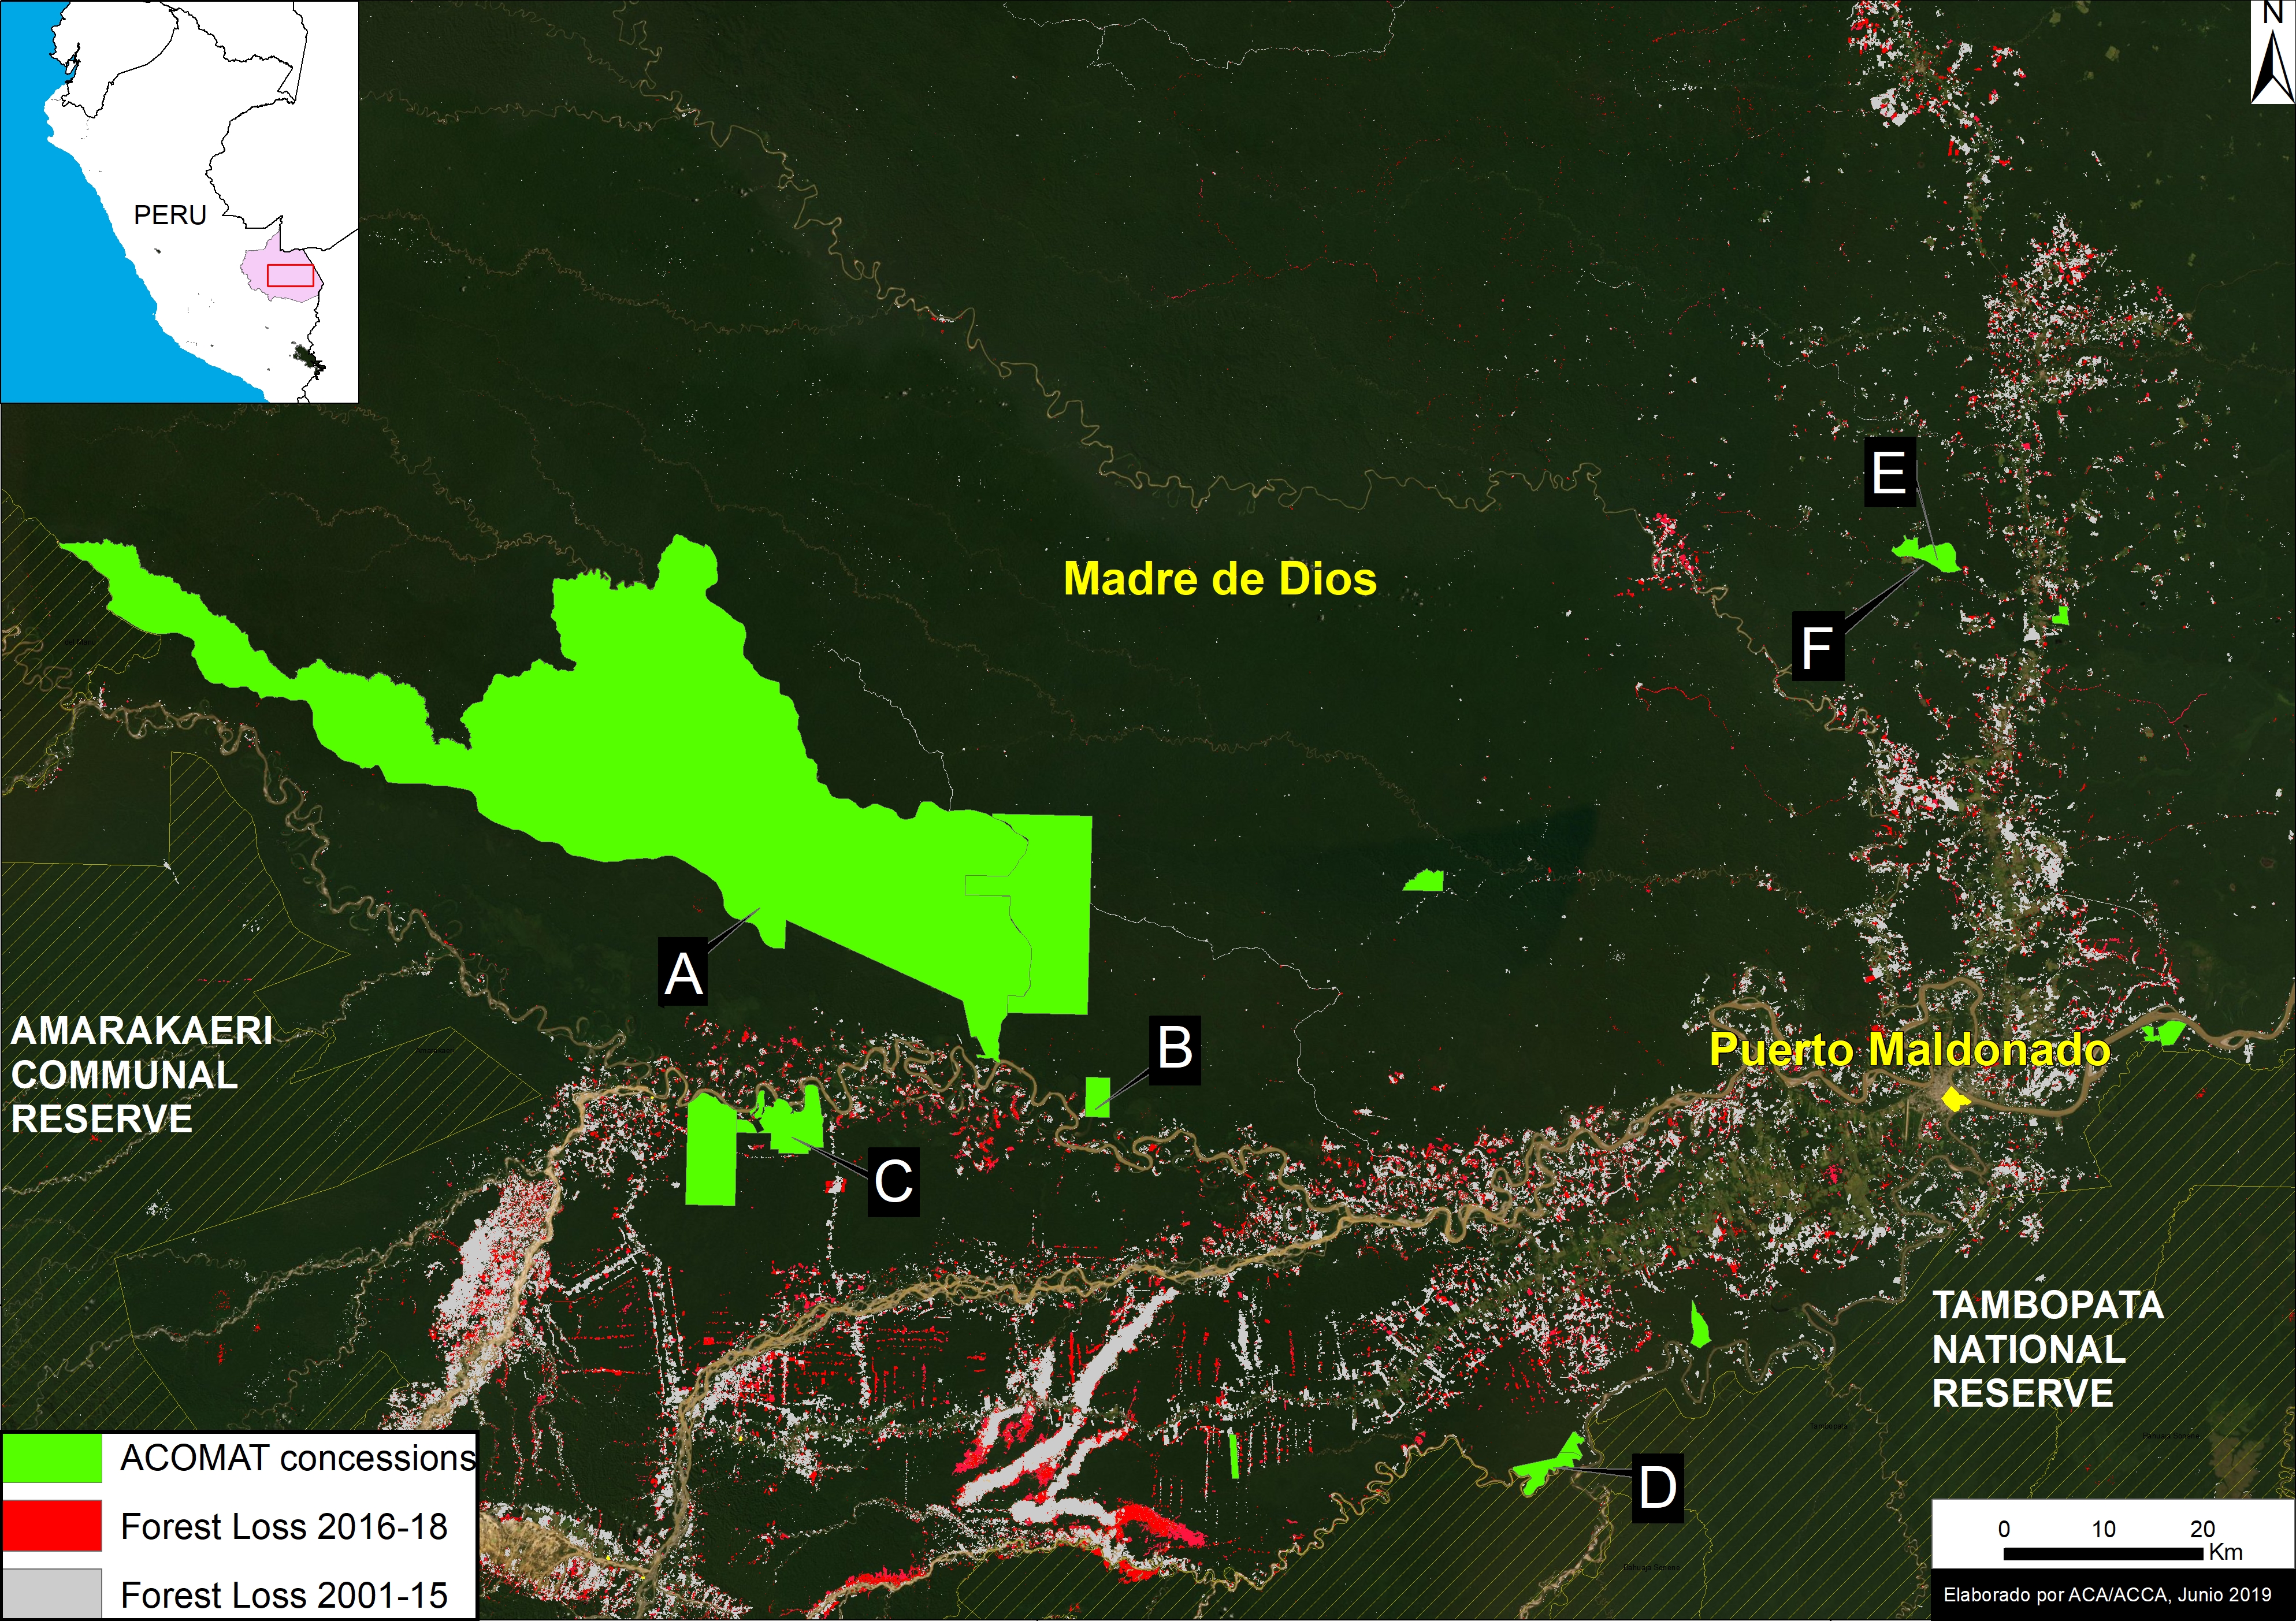
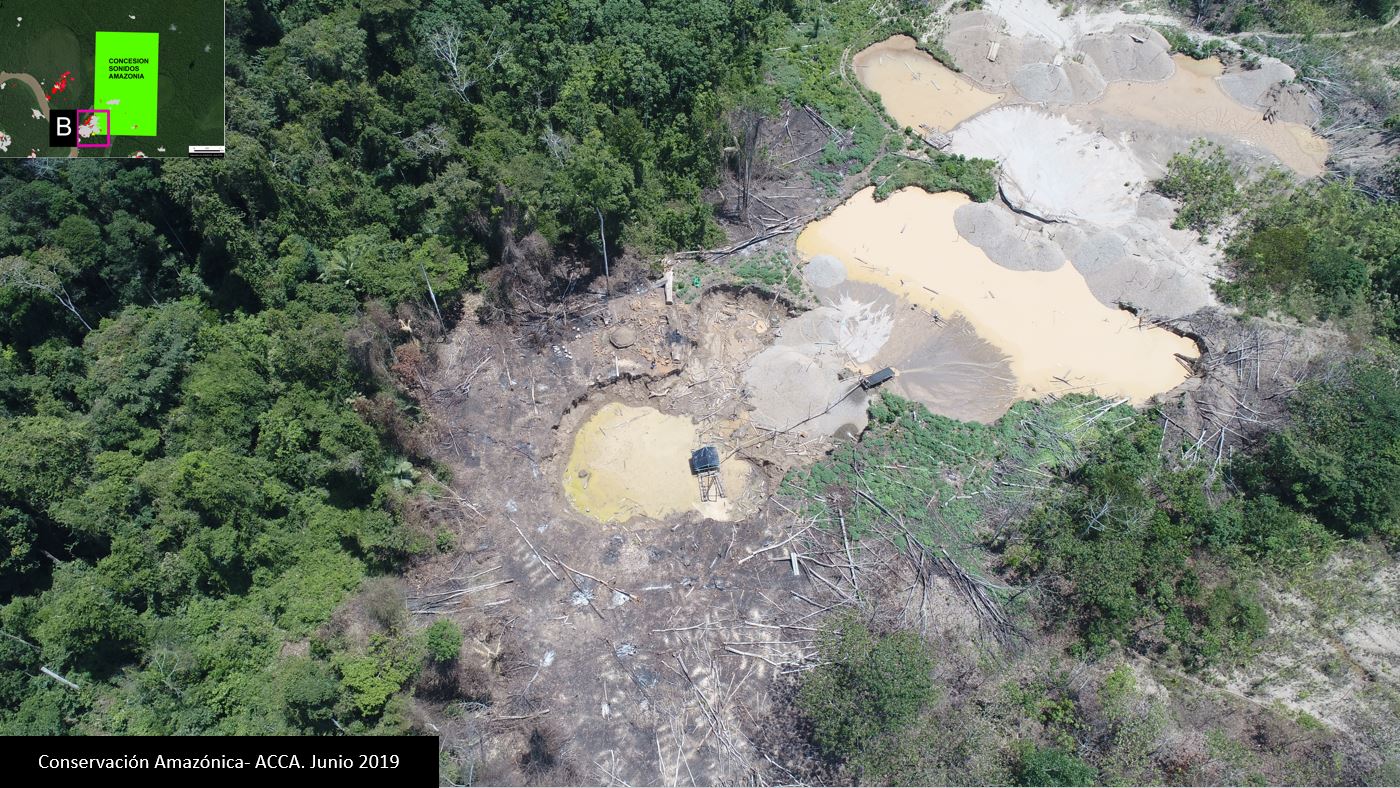
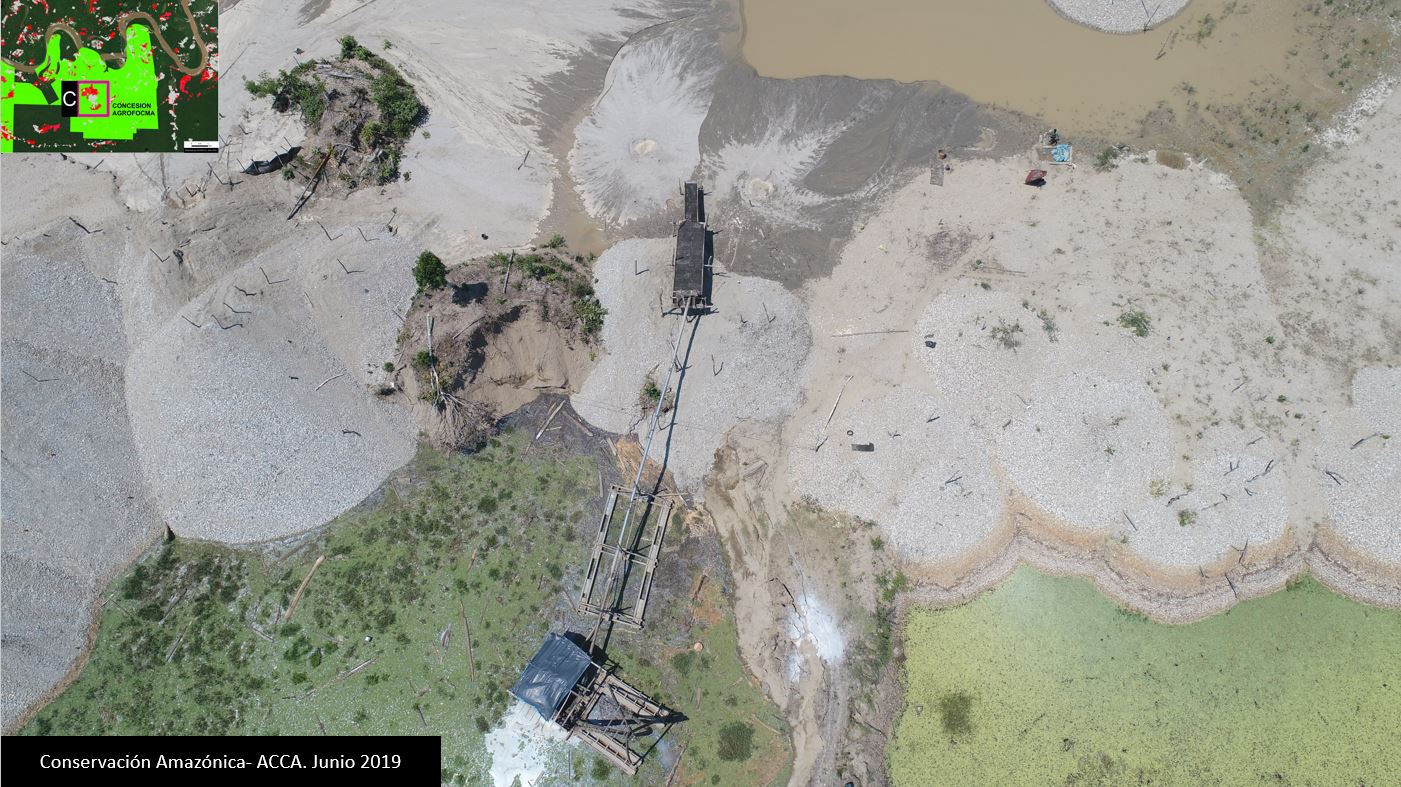
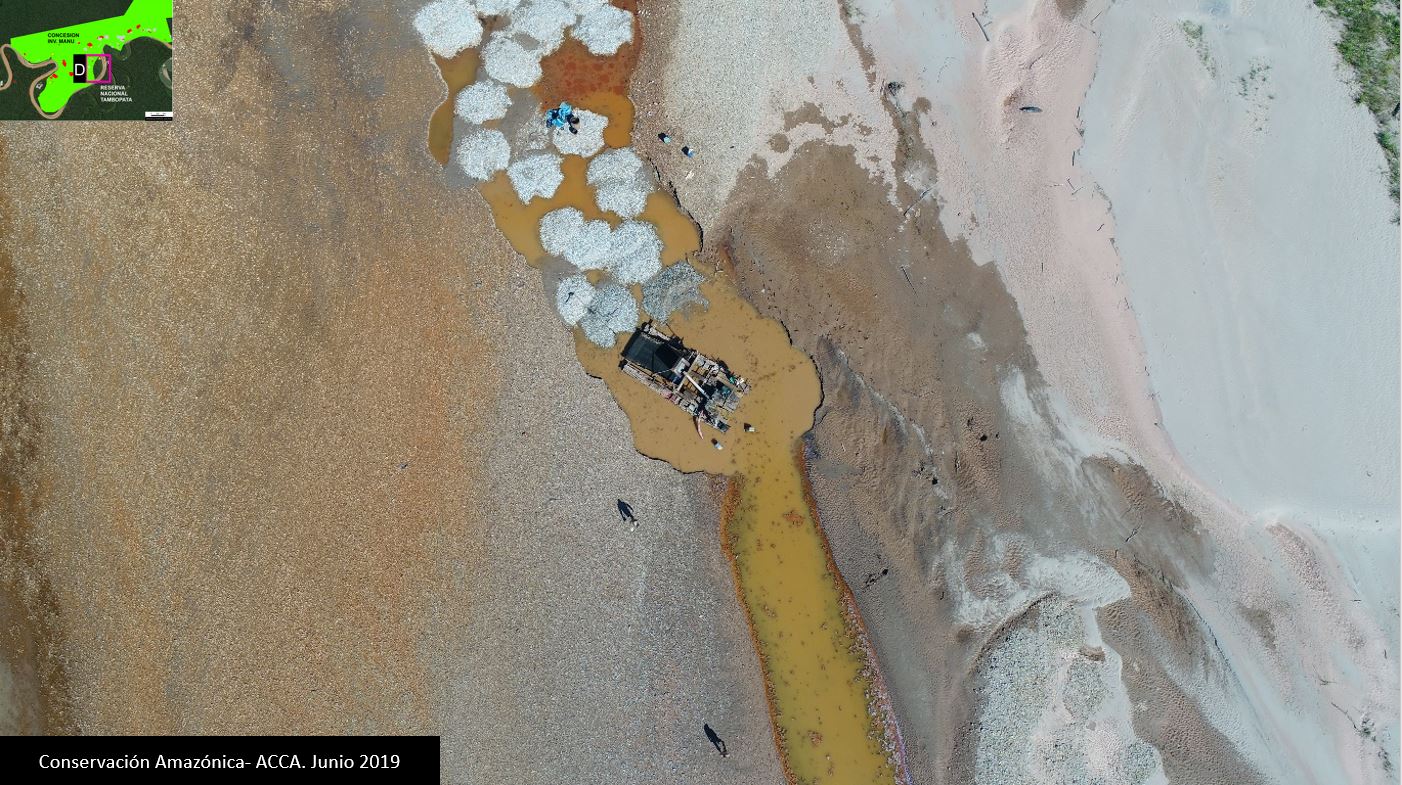
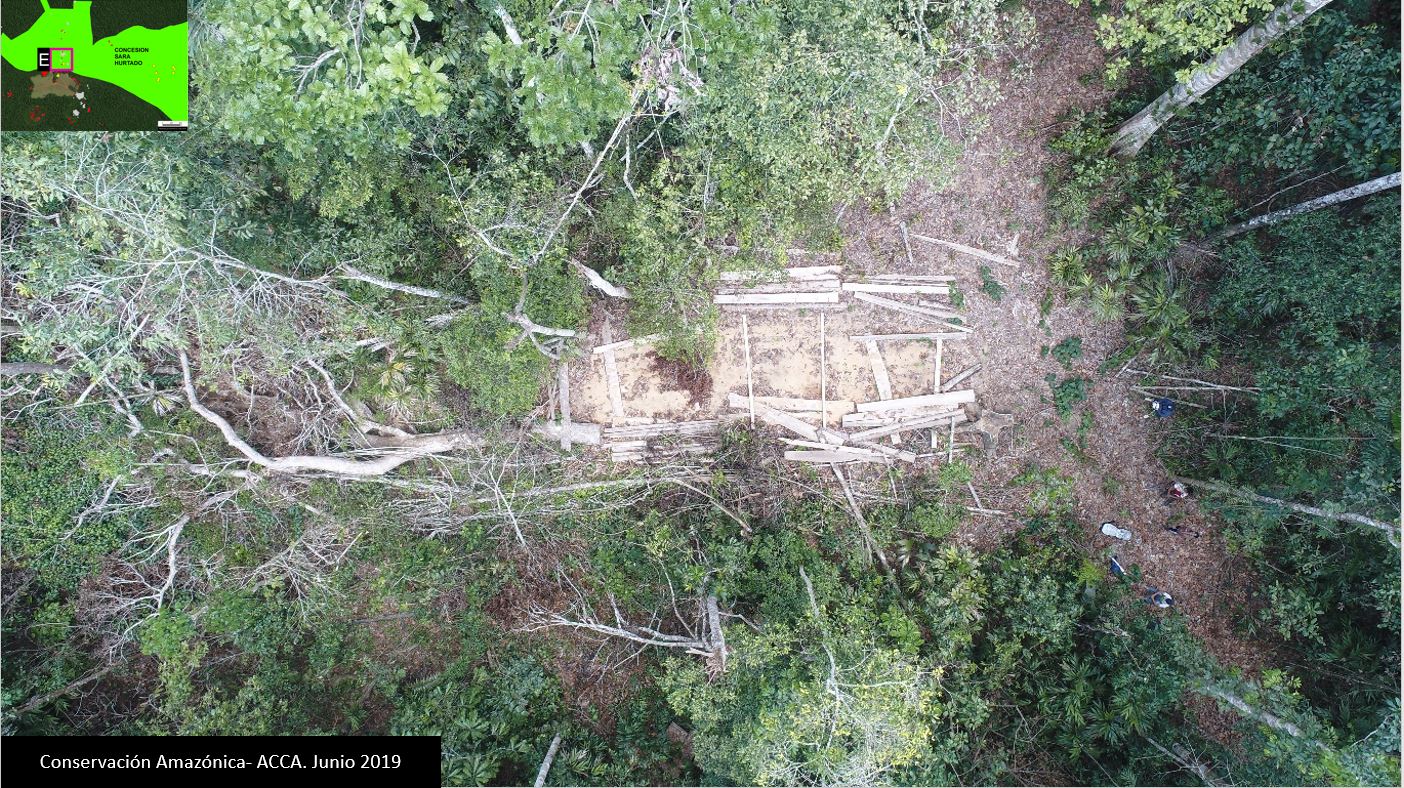
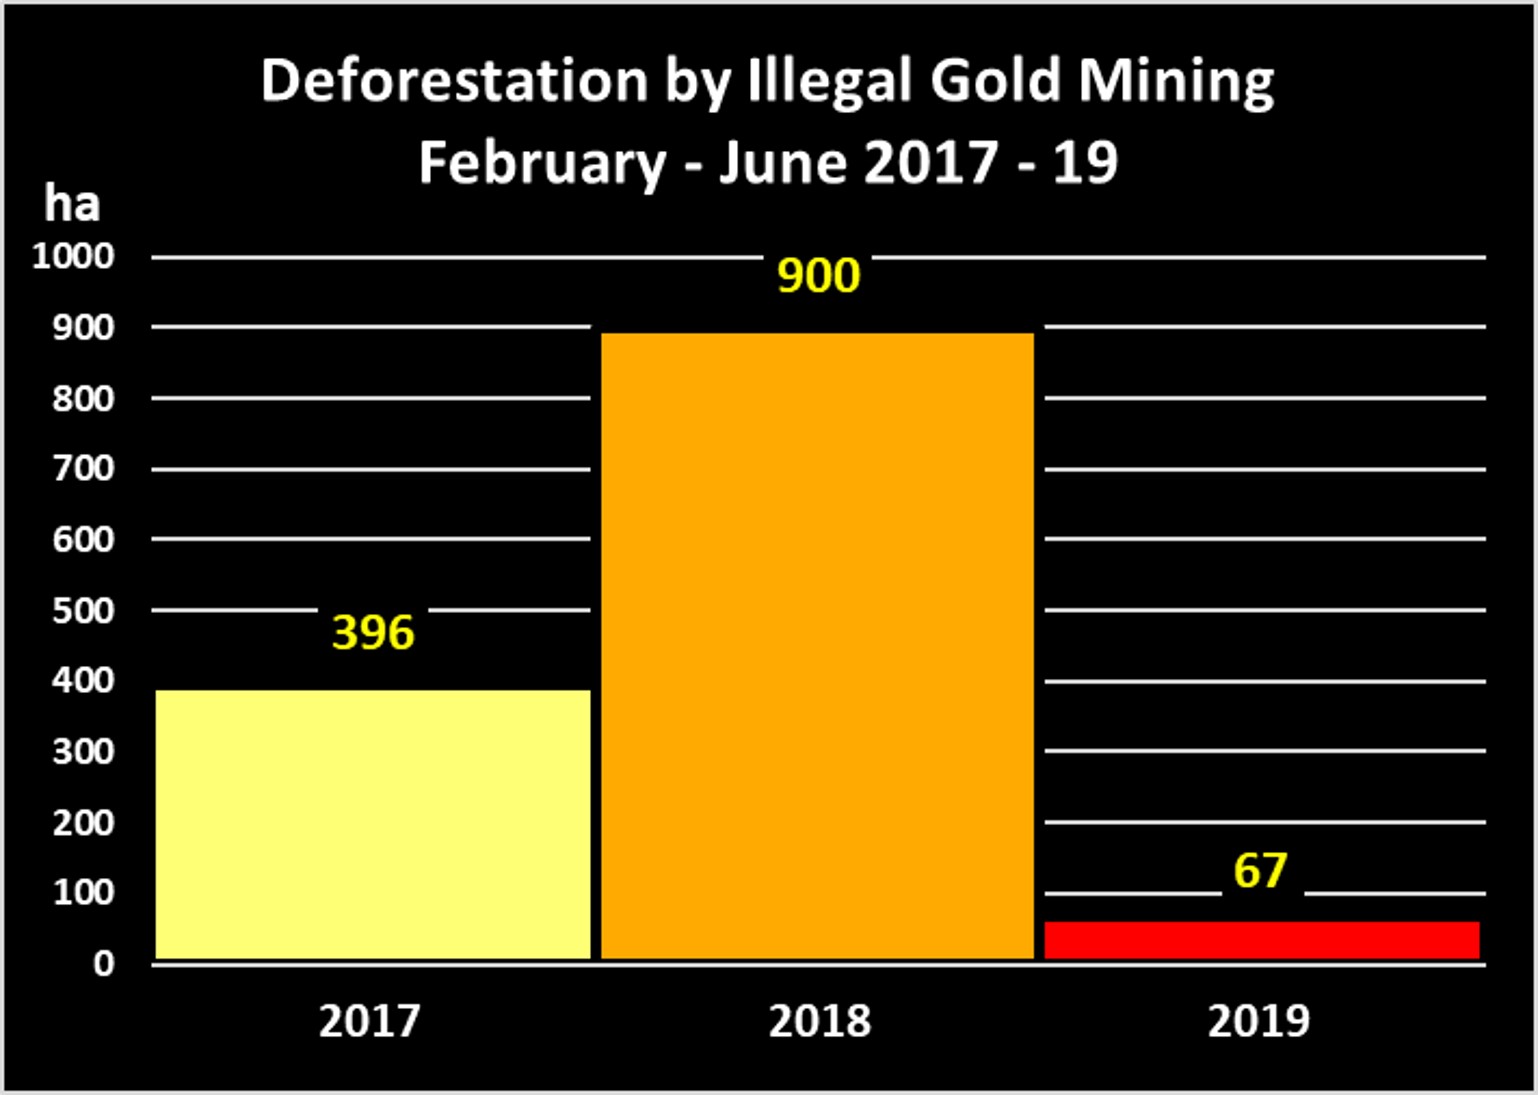
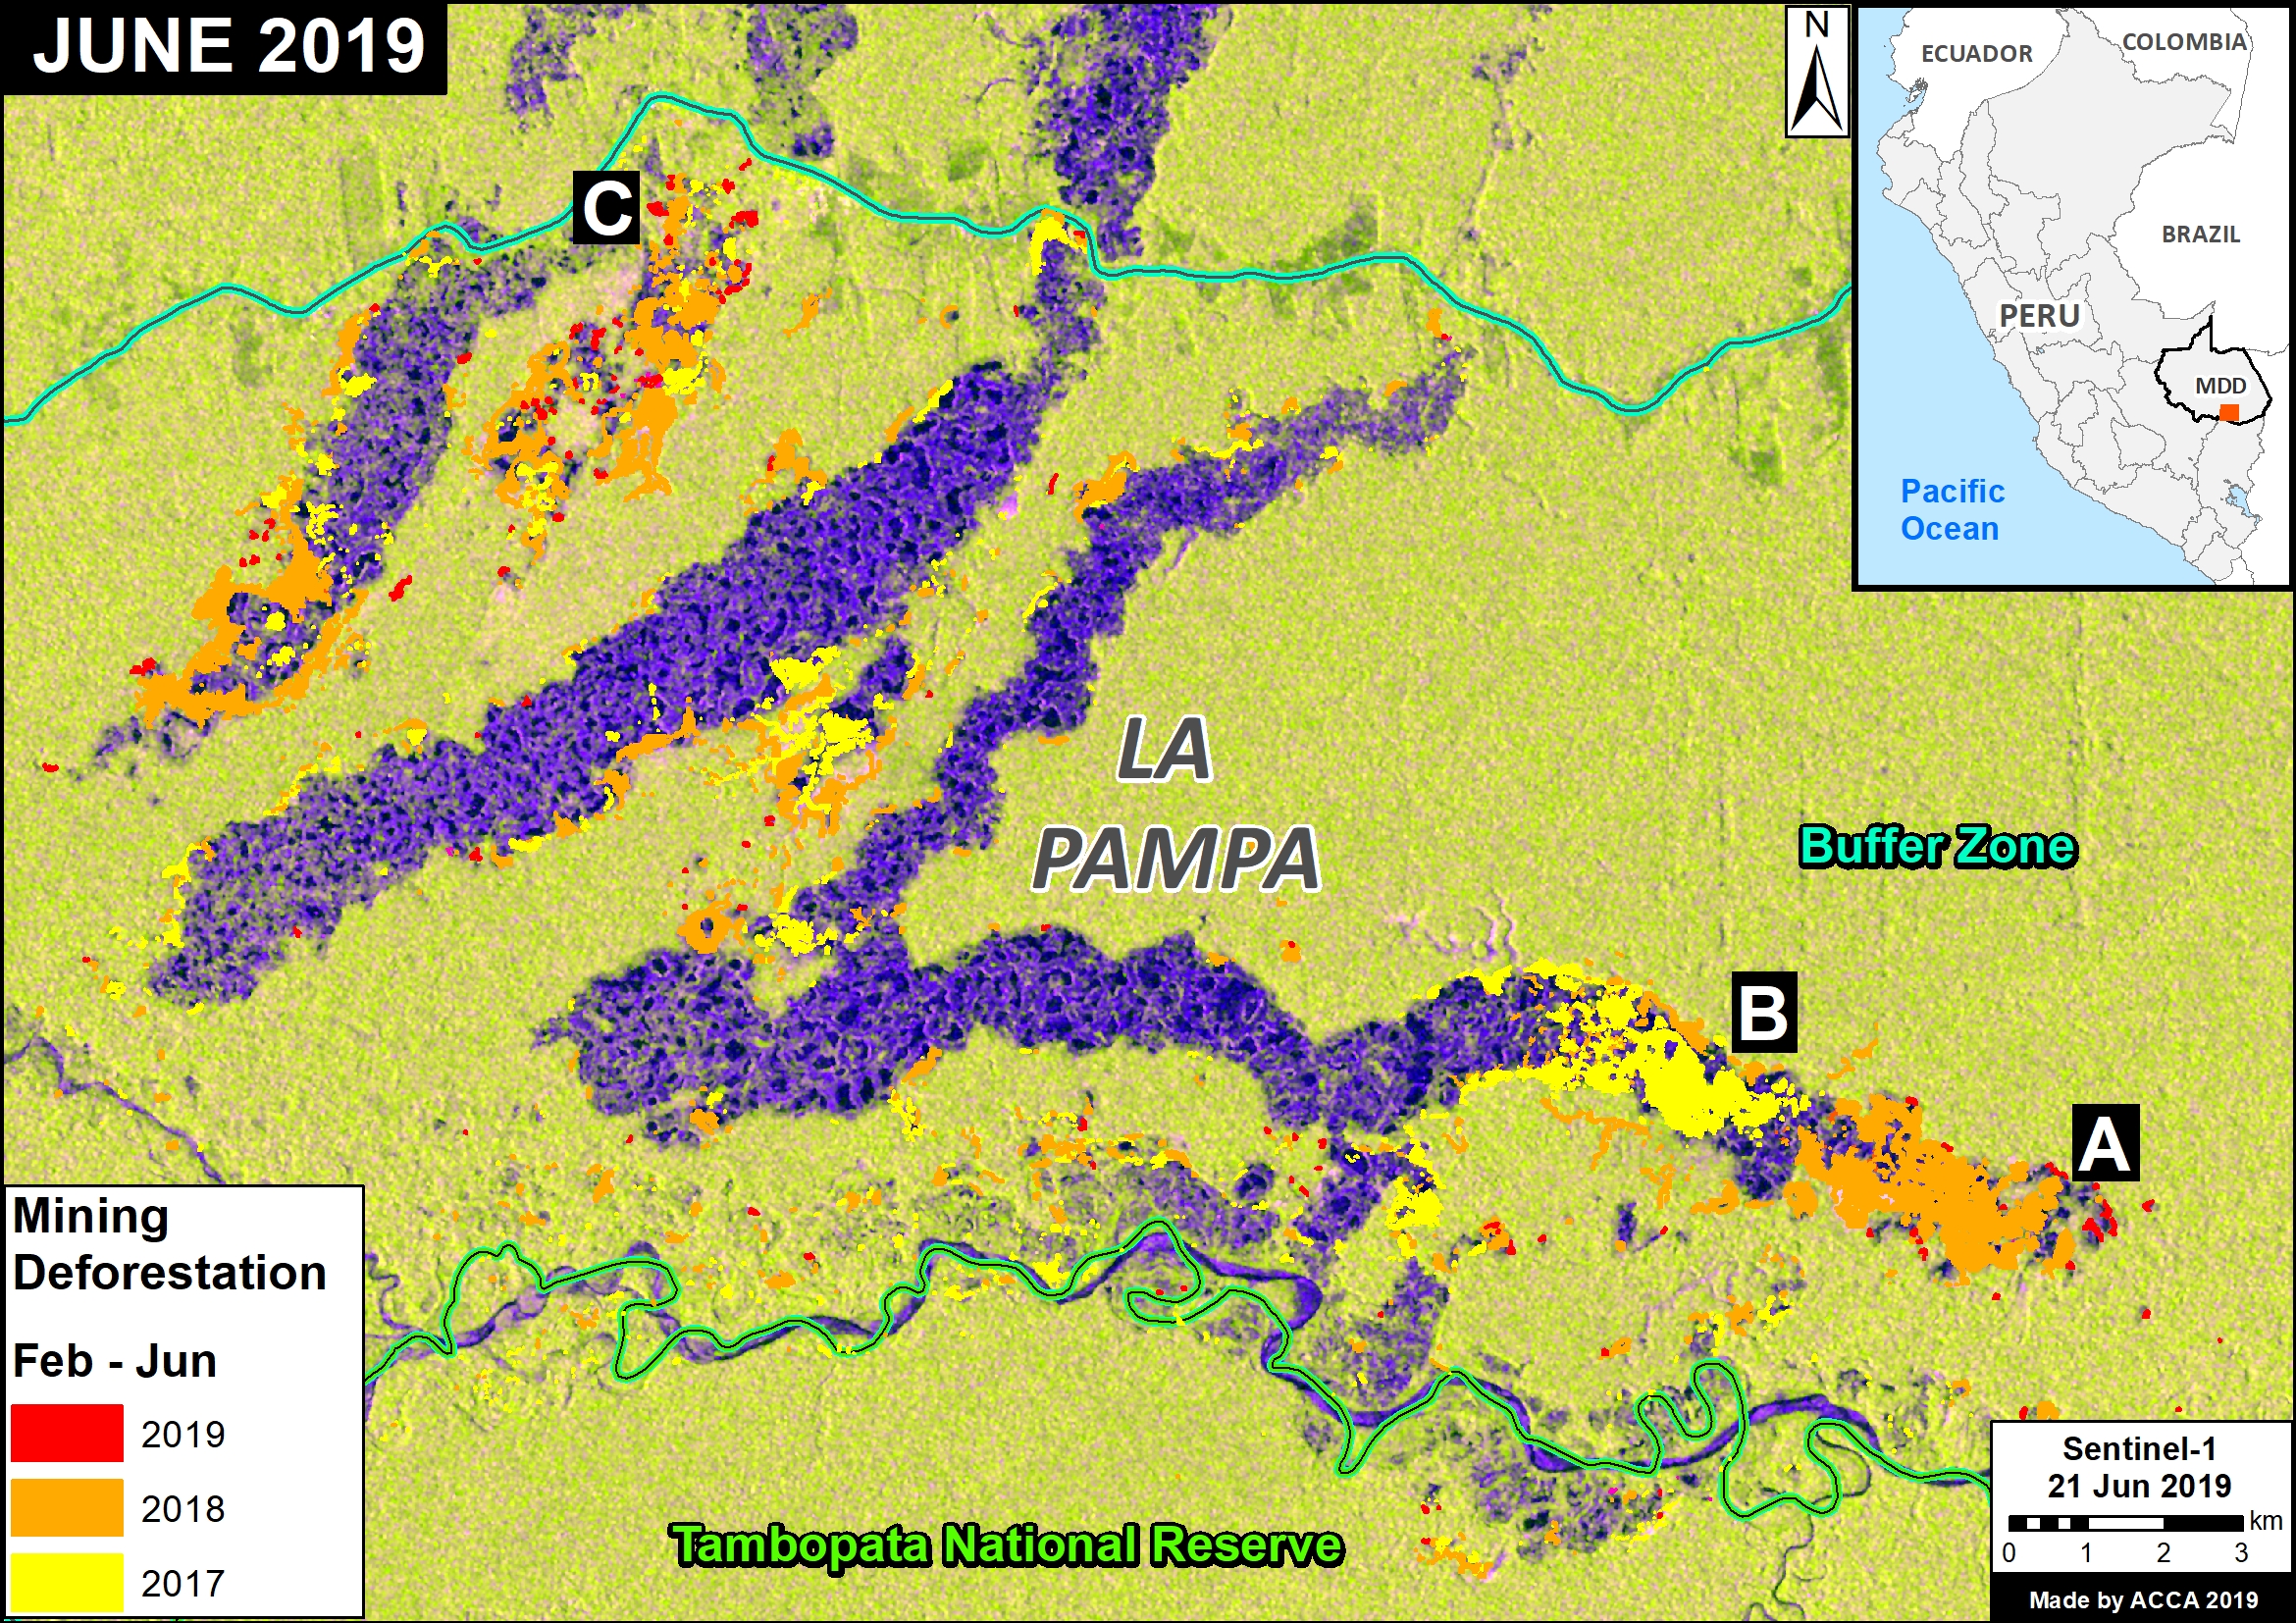
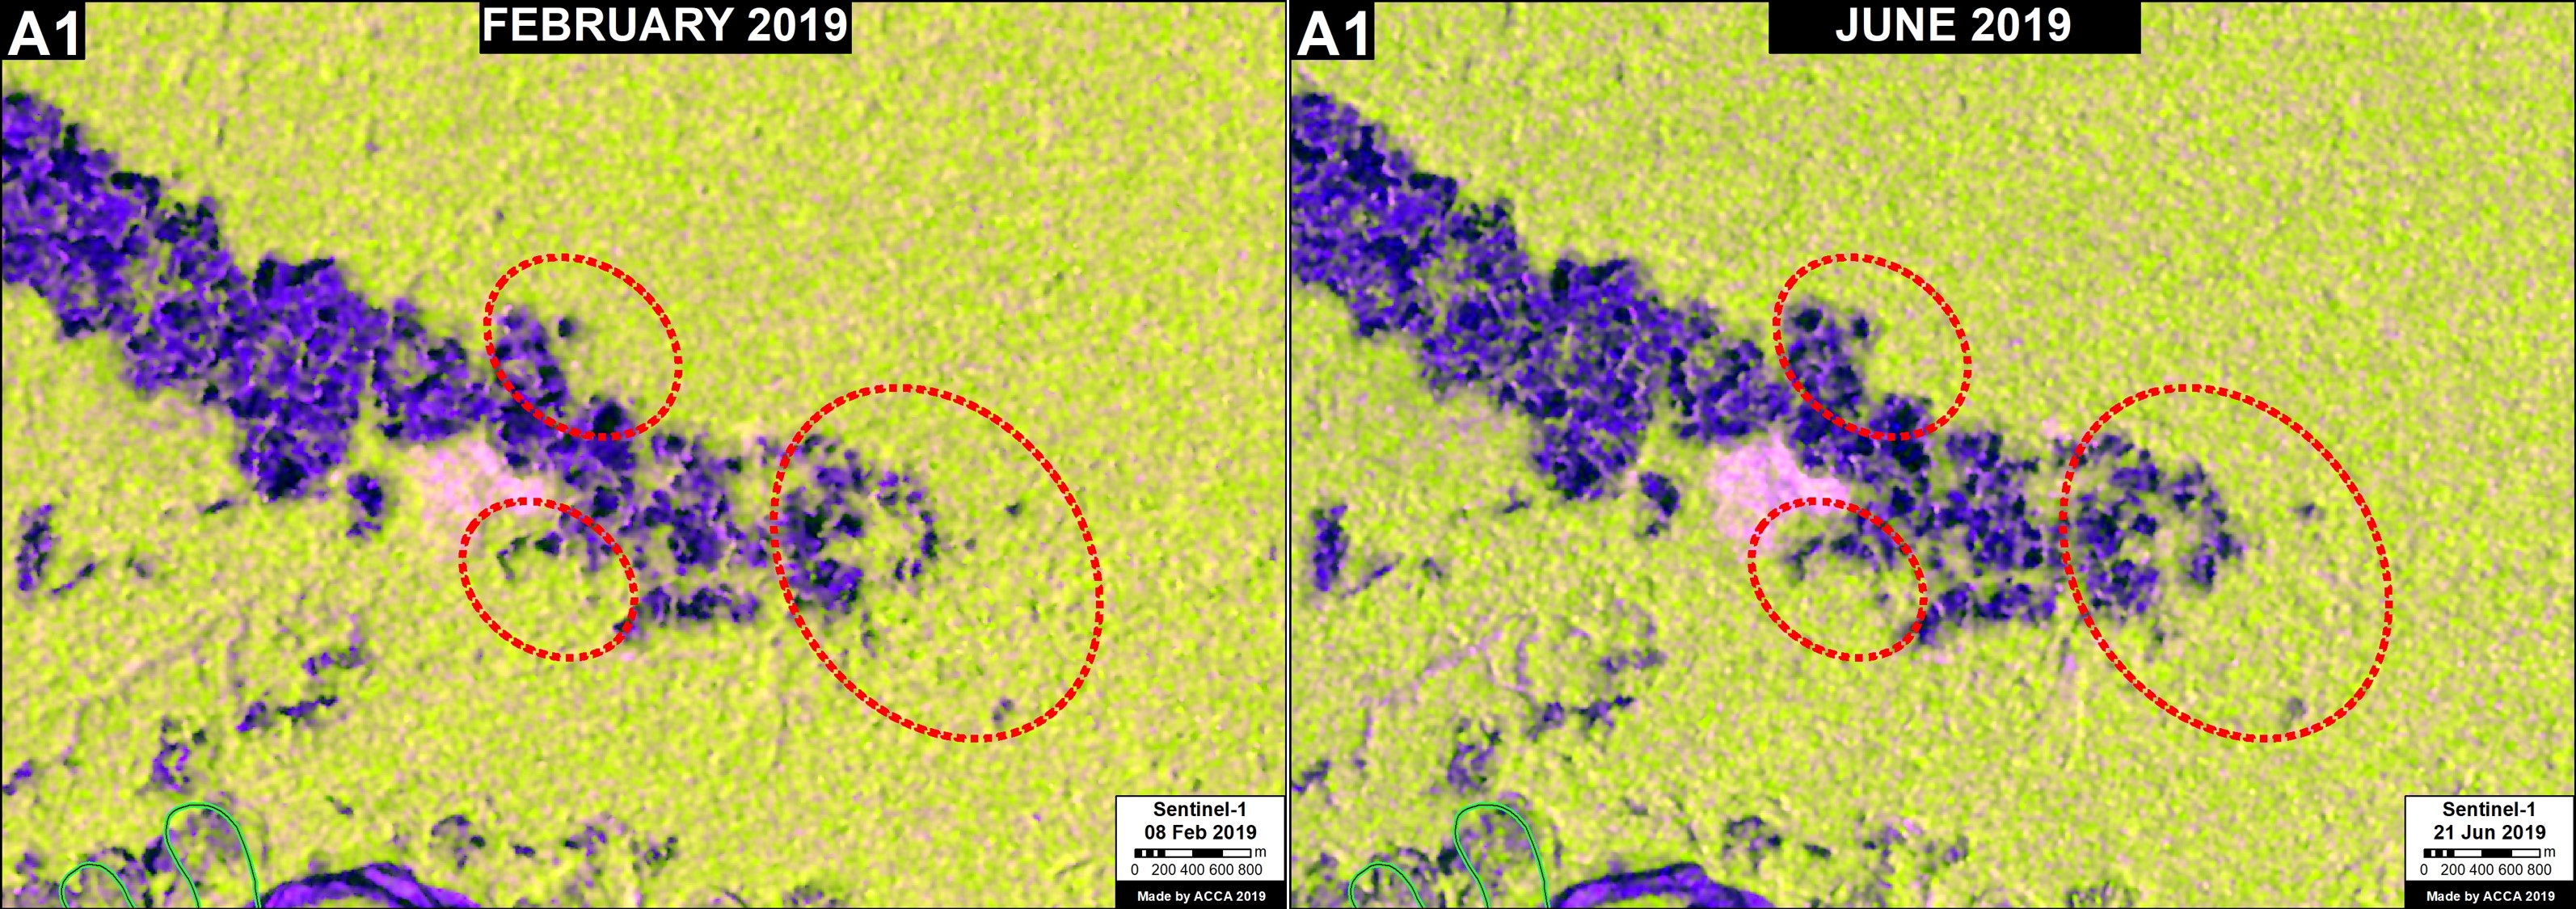
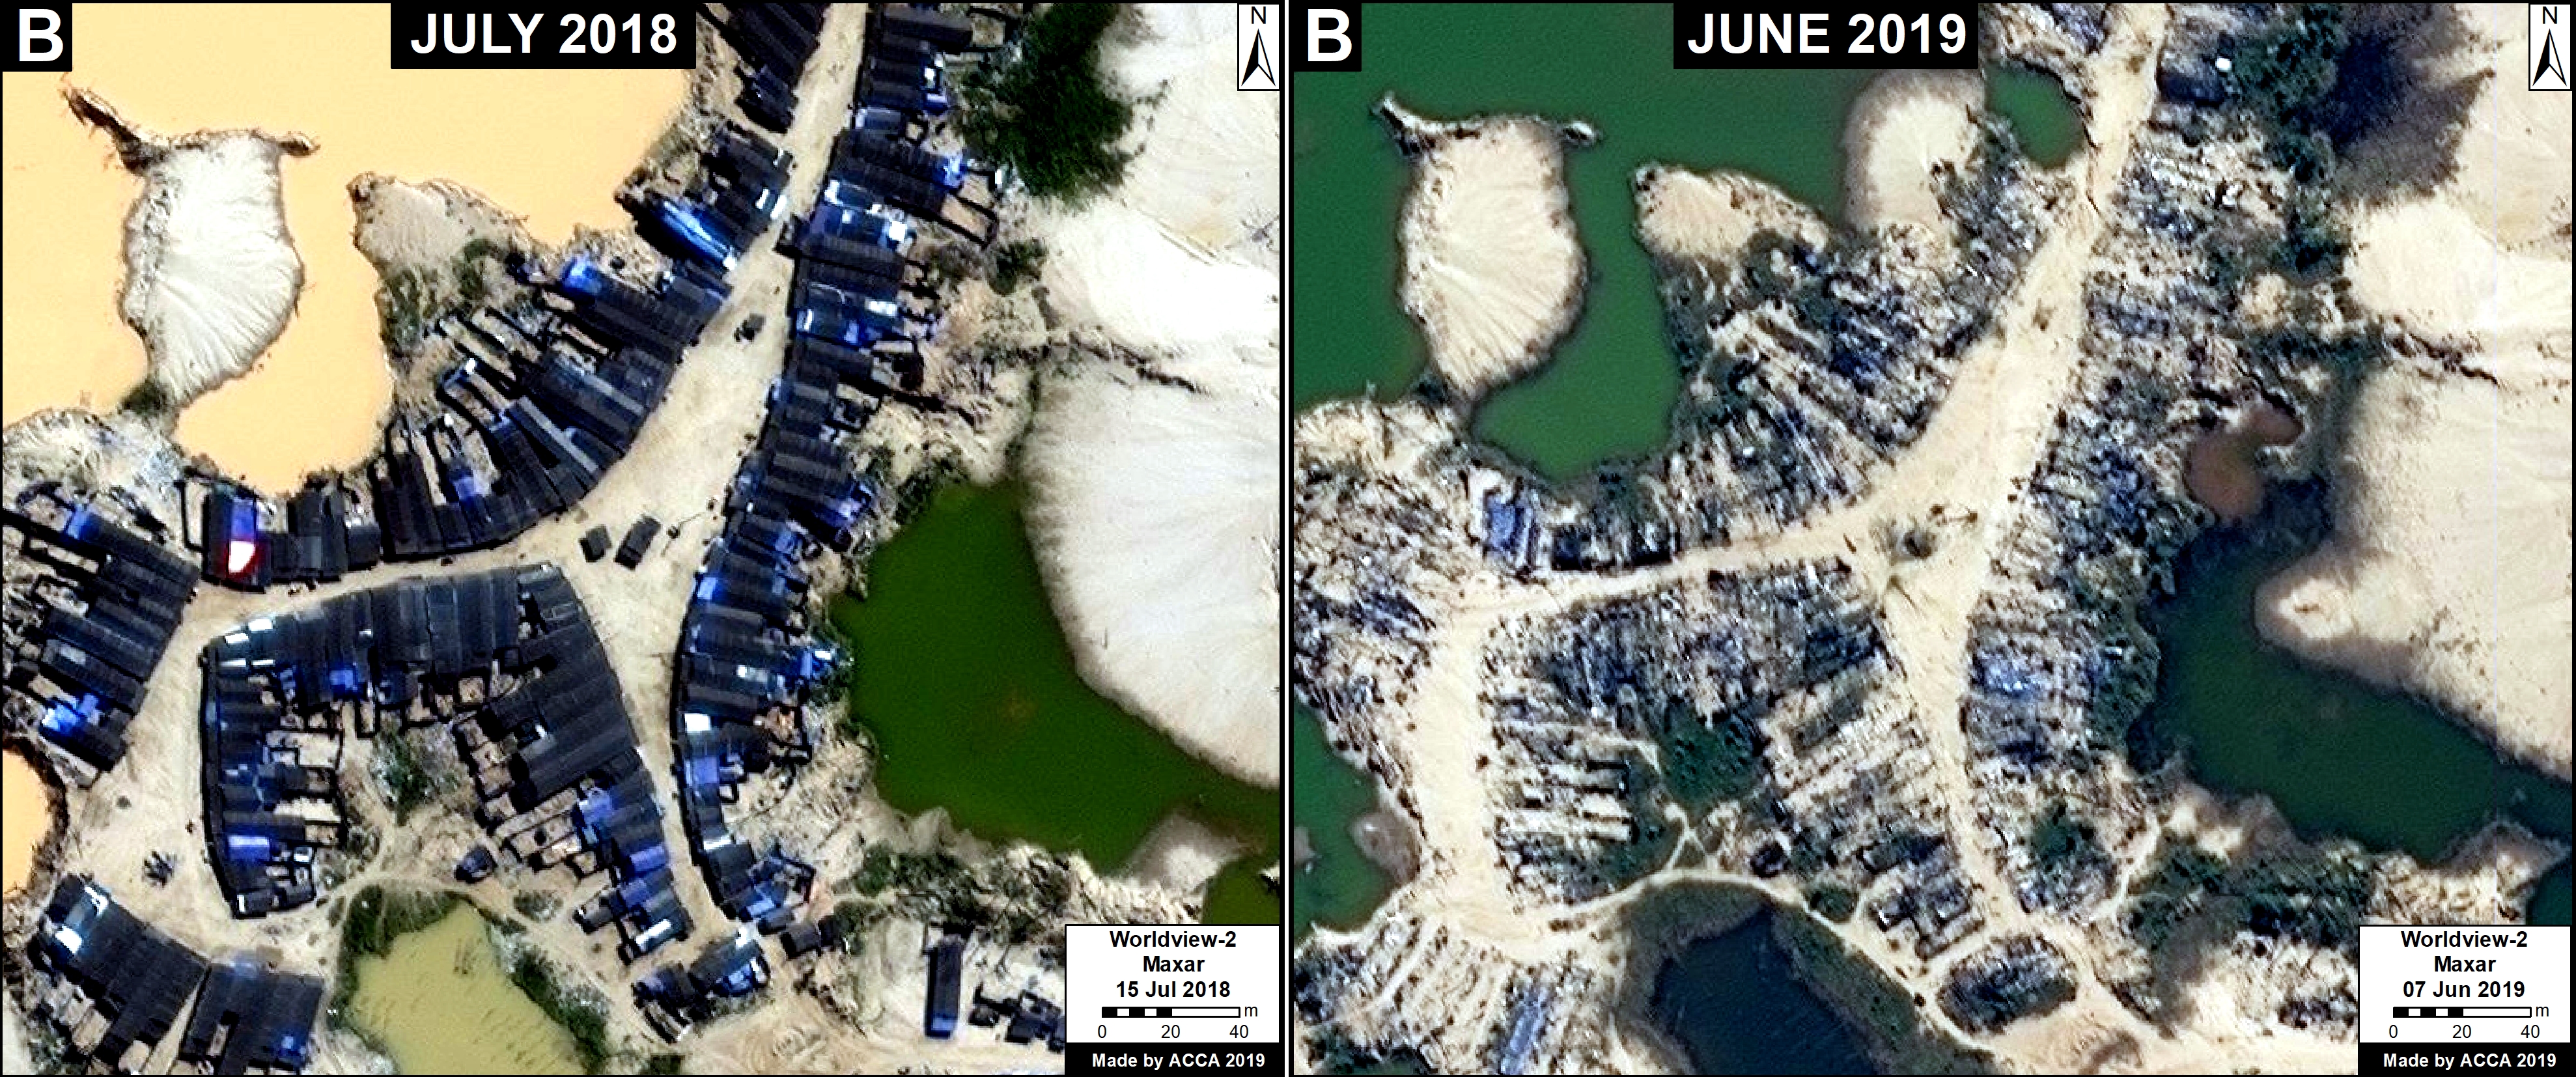
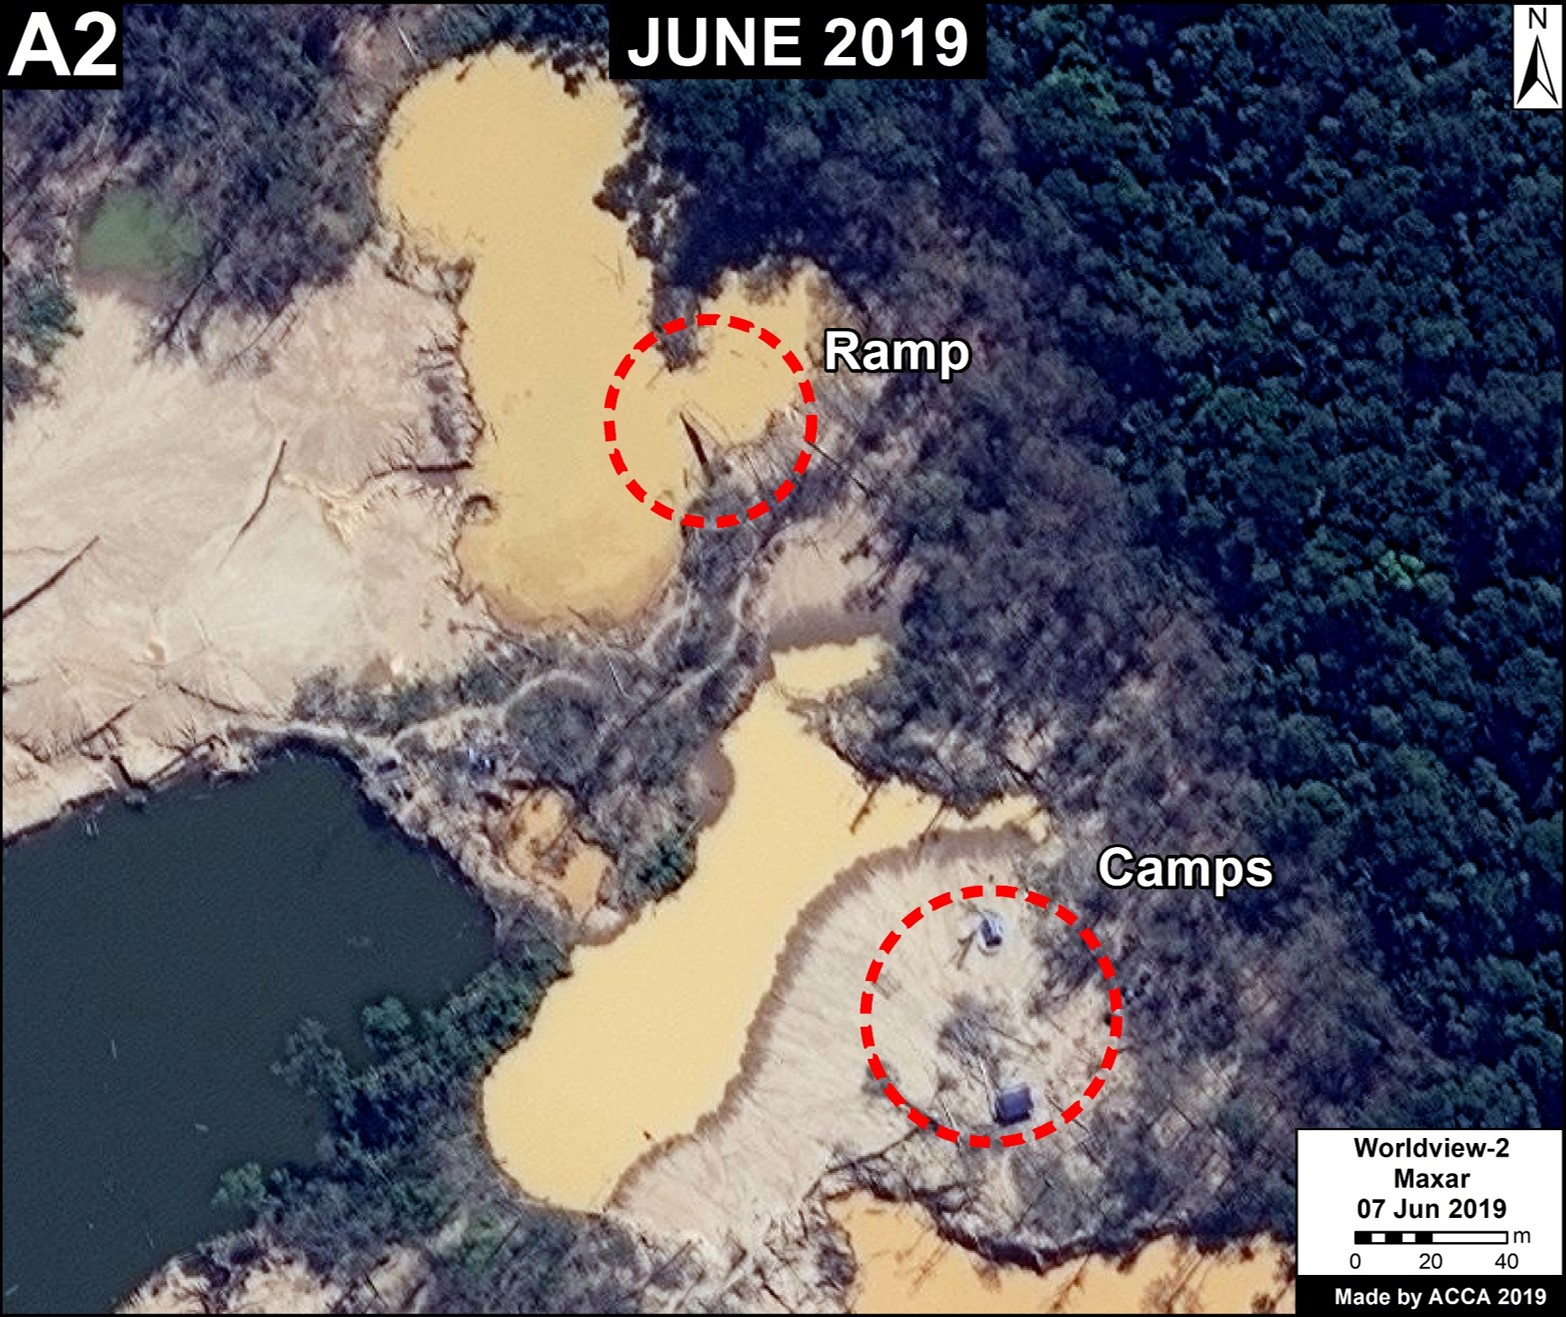
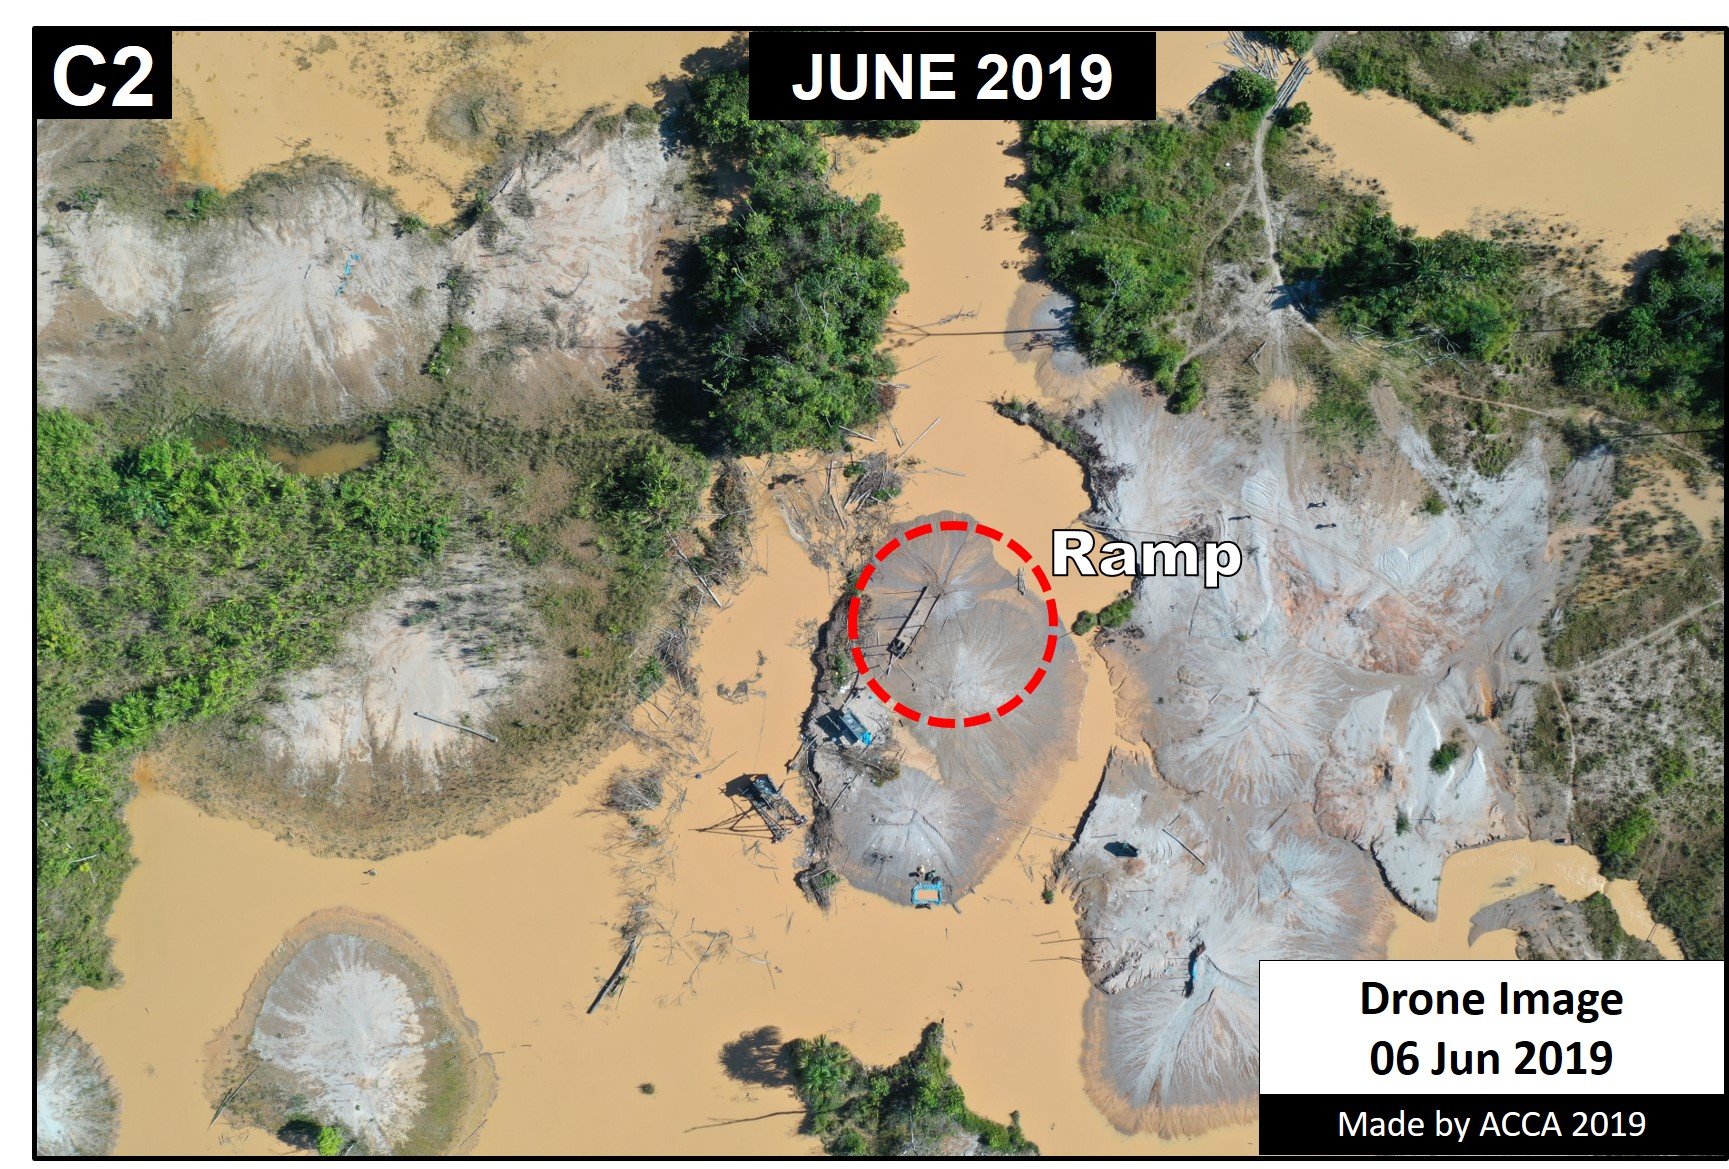
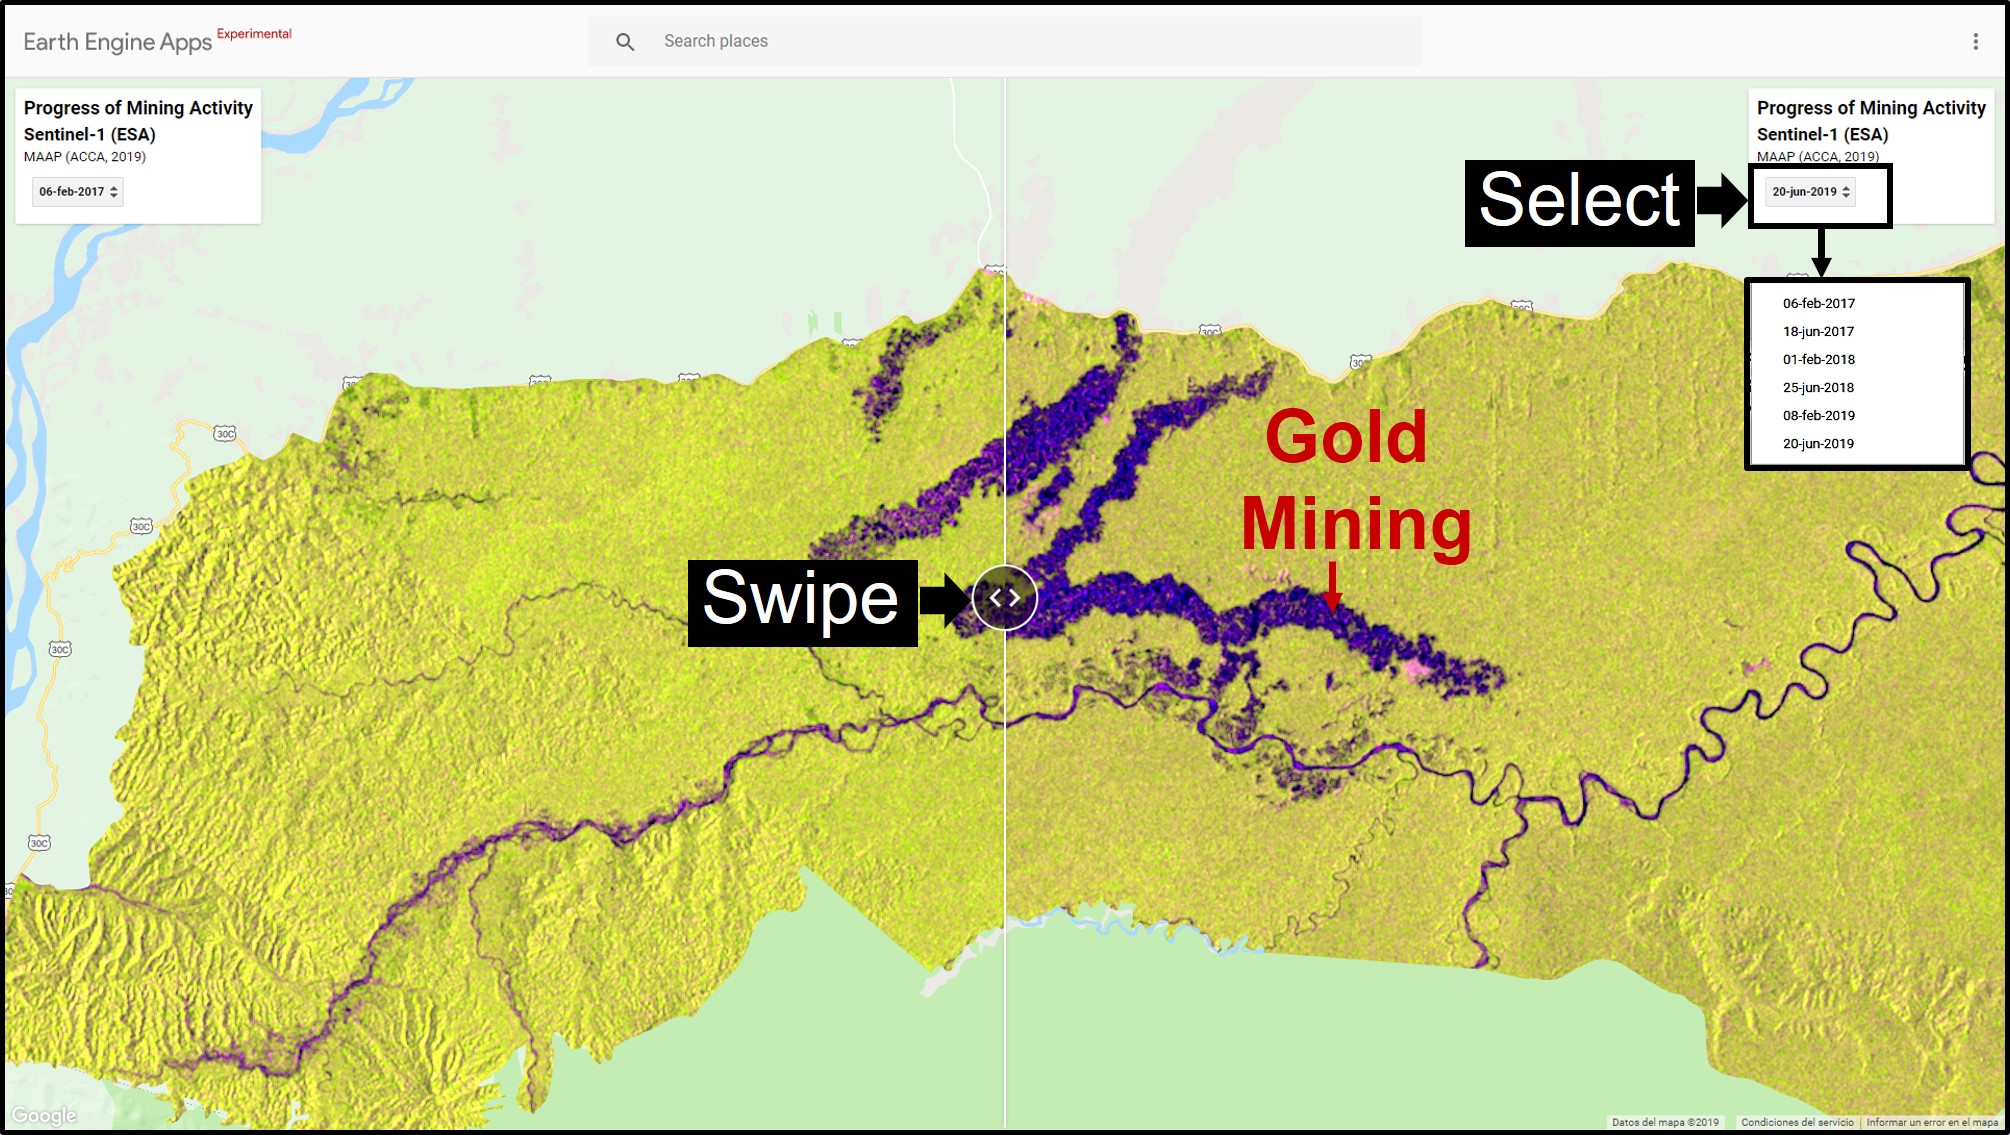
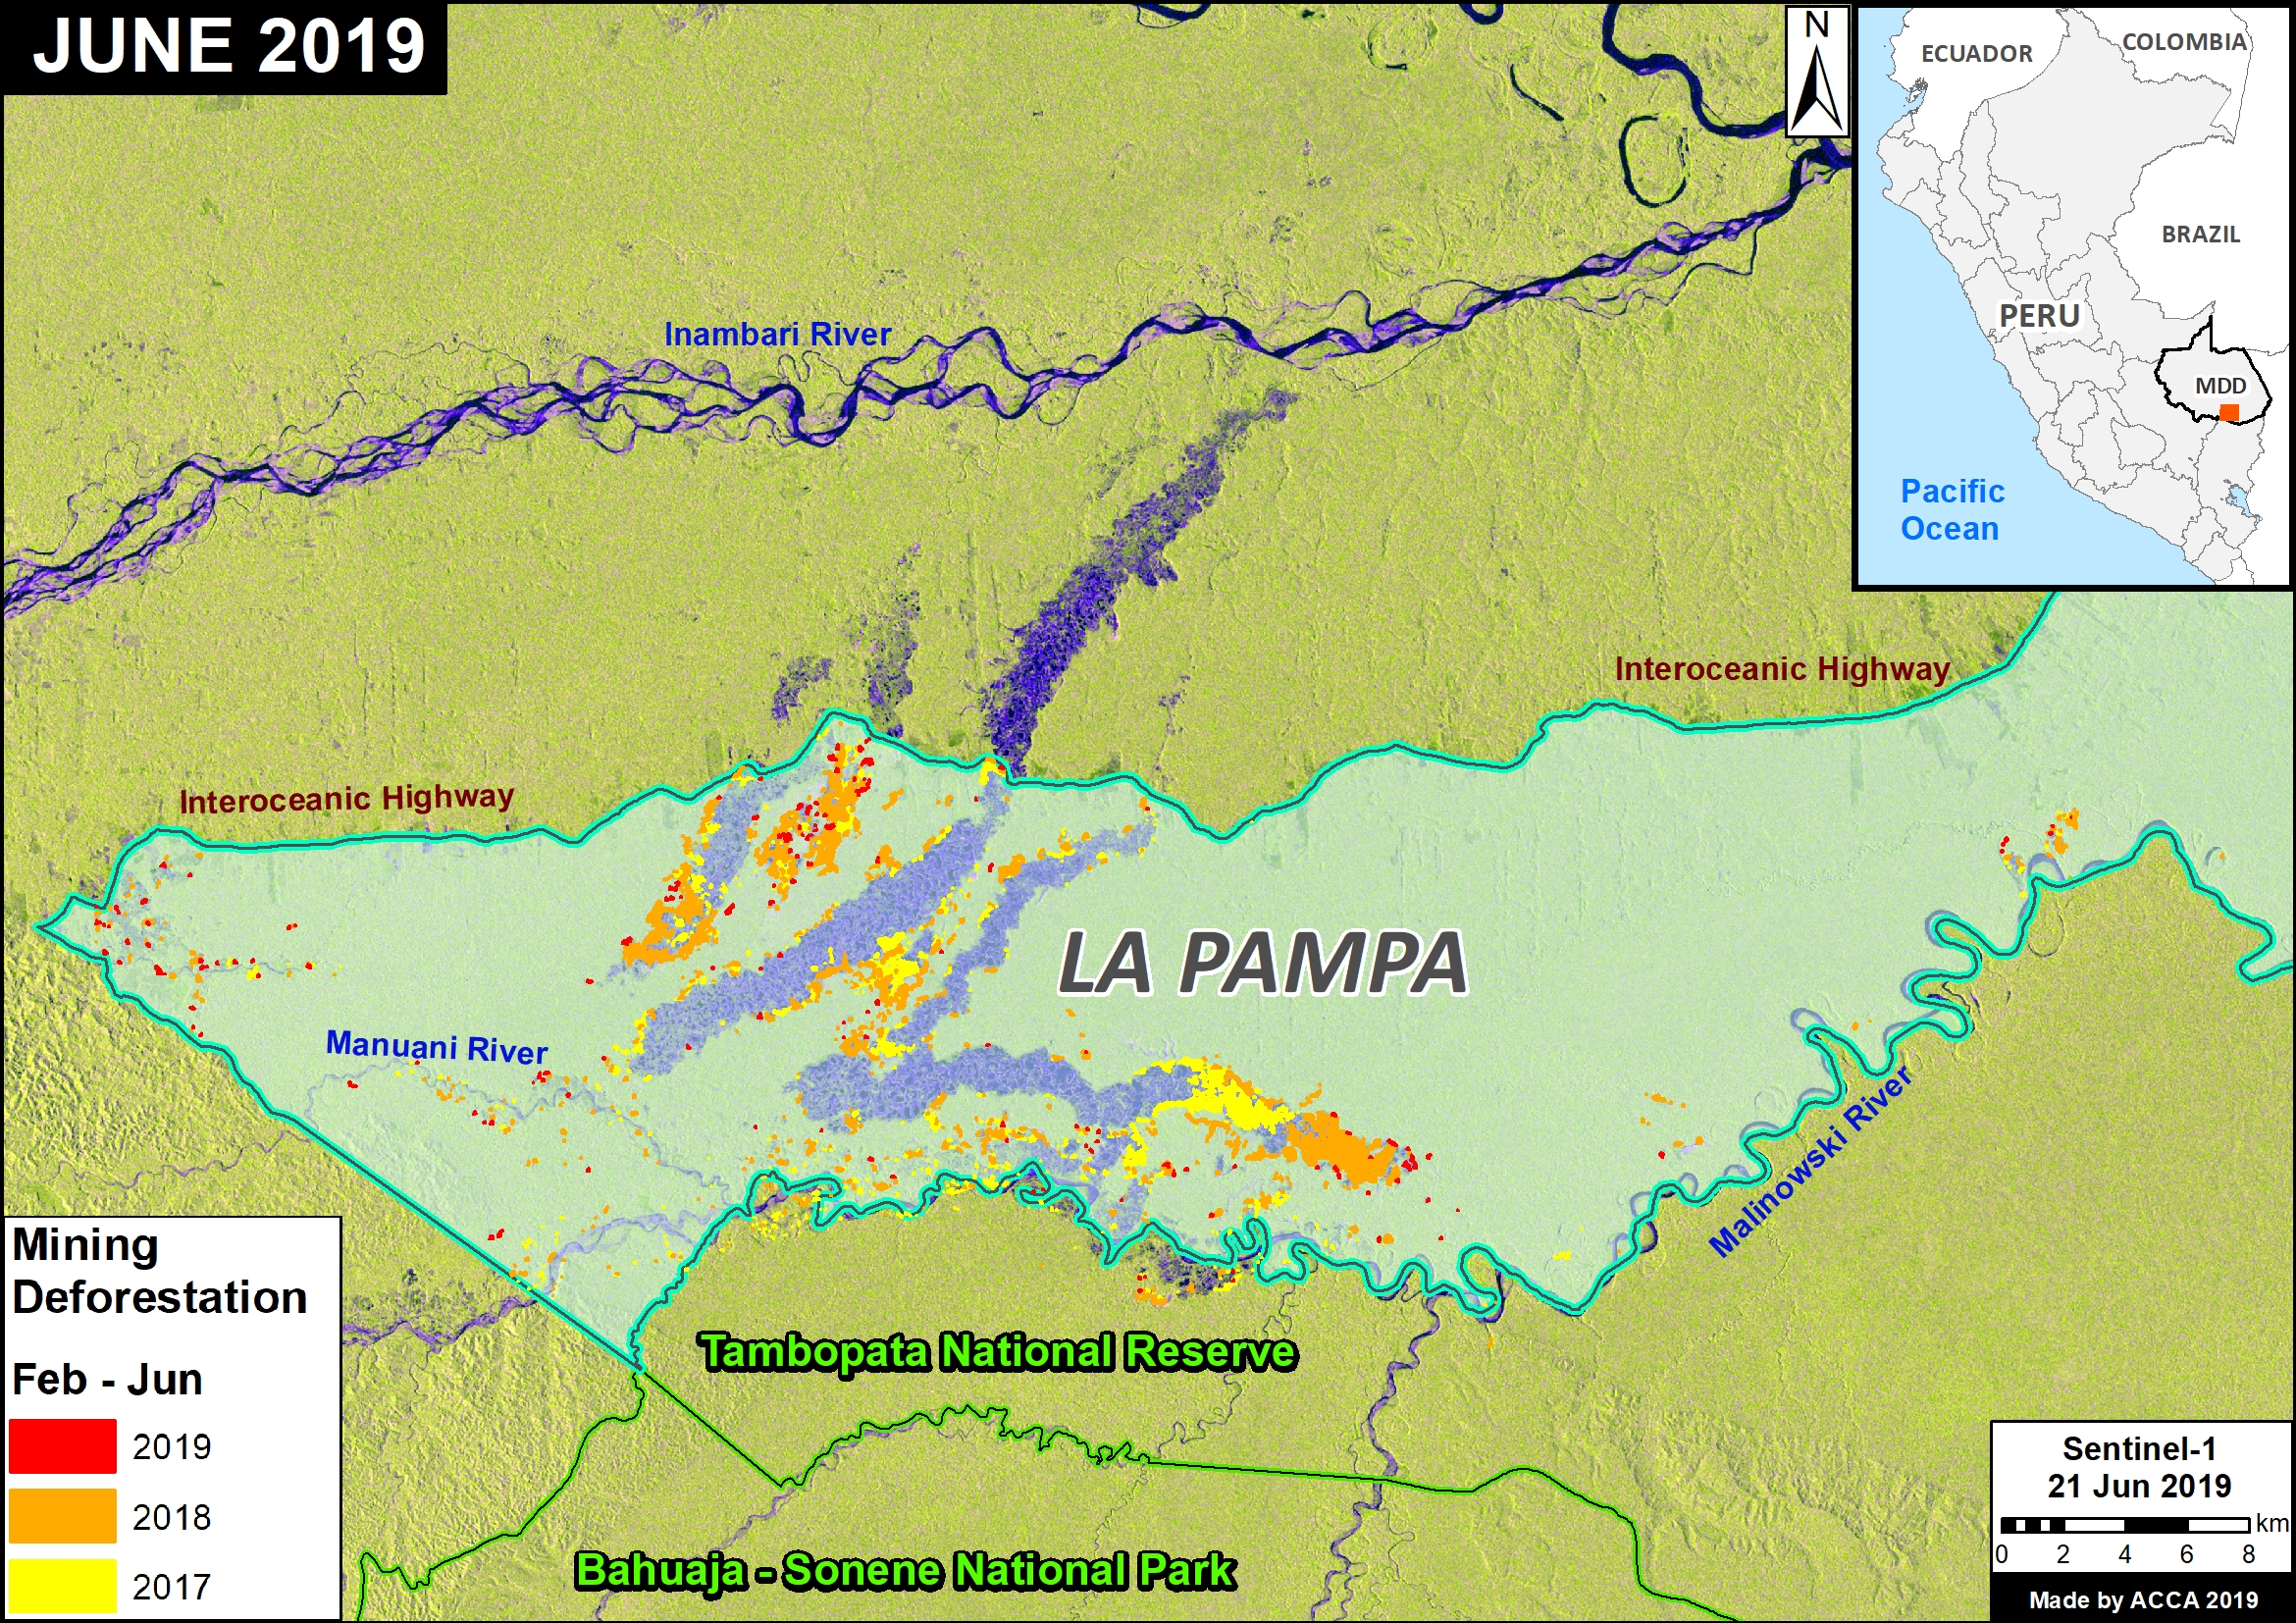
Primary forest loss rose slightly in the Peruvian Amazon (161,625 hectares) despite a relatively successful crackdown on illegal gold mining, pointing to small-scale agriculture (and cattle) as the main driver.
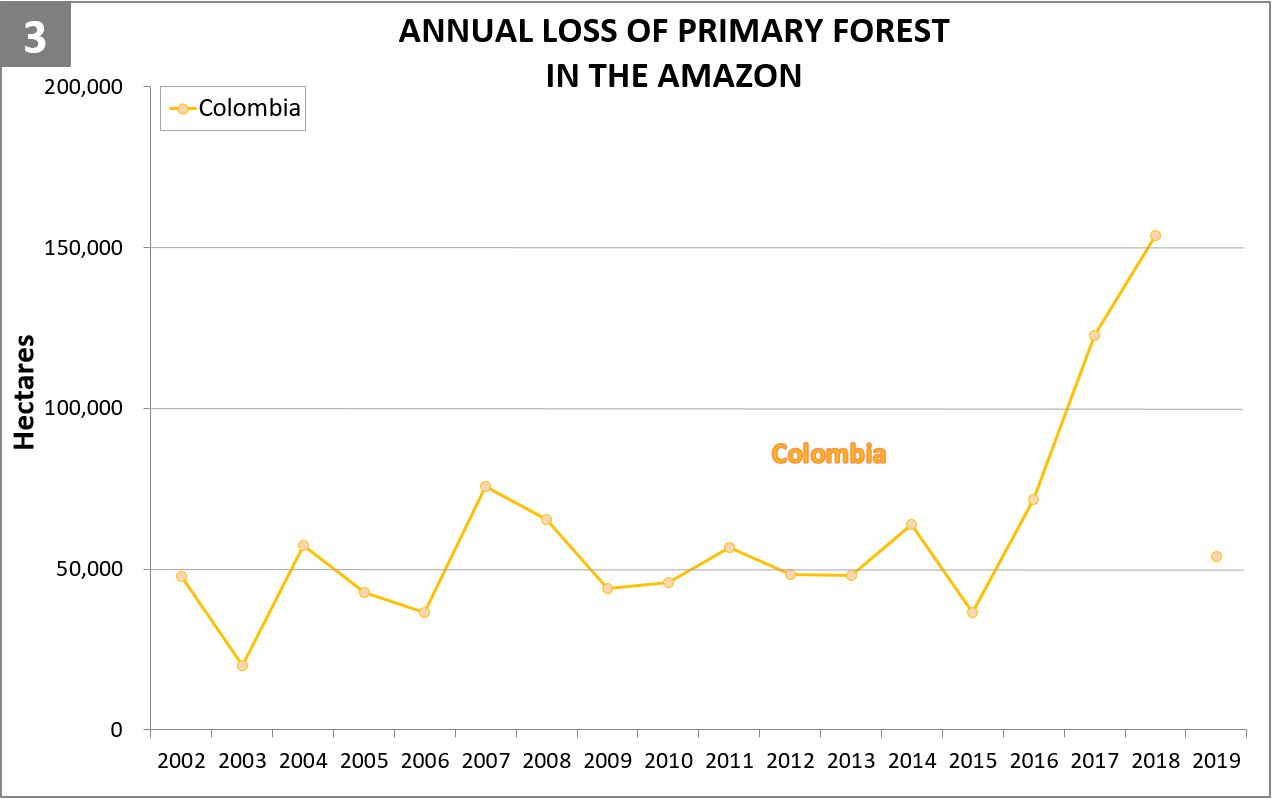
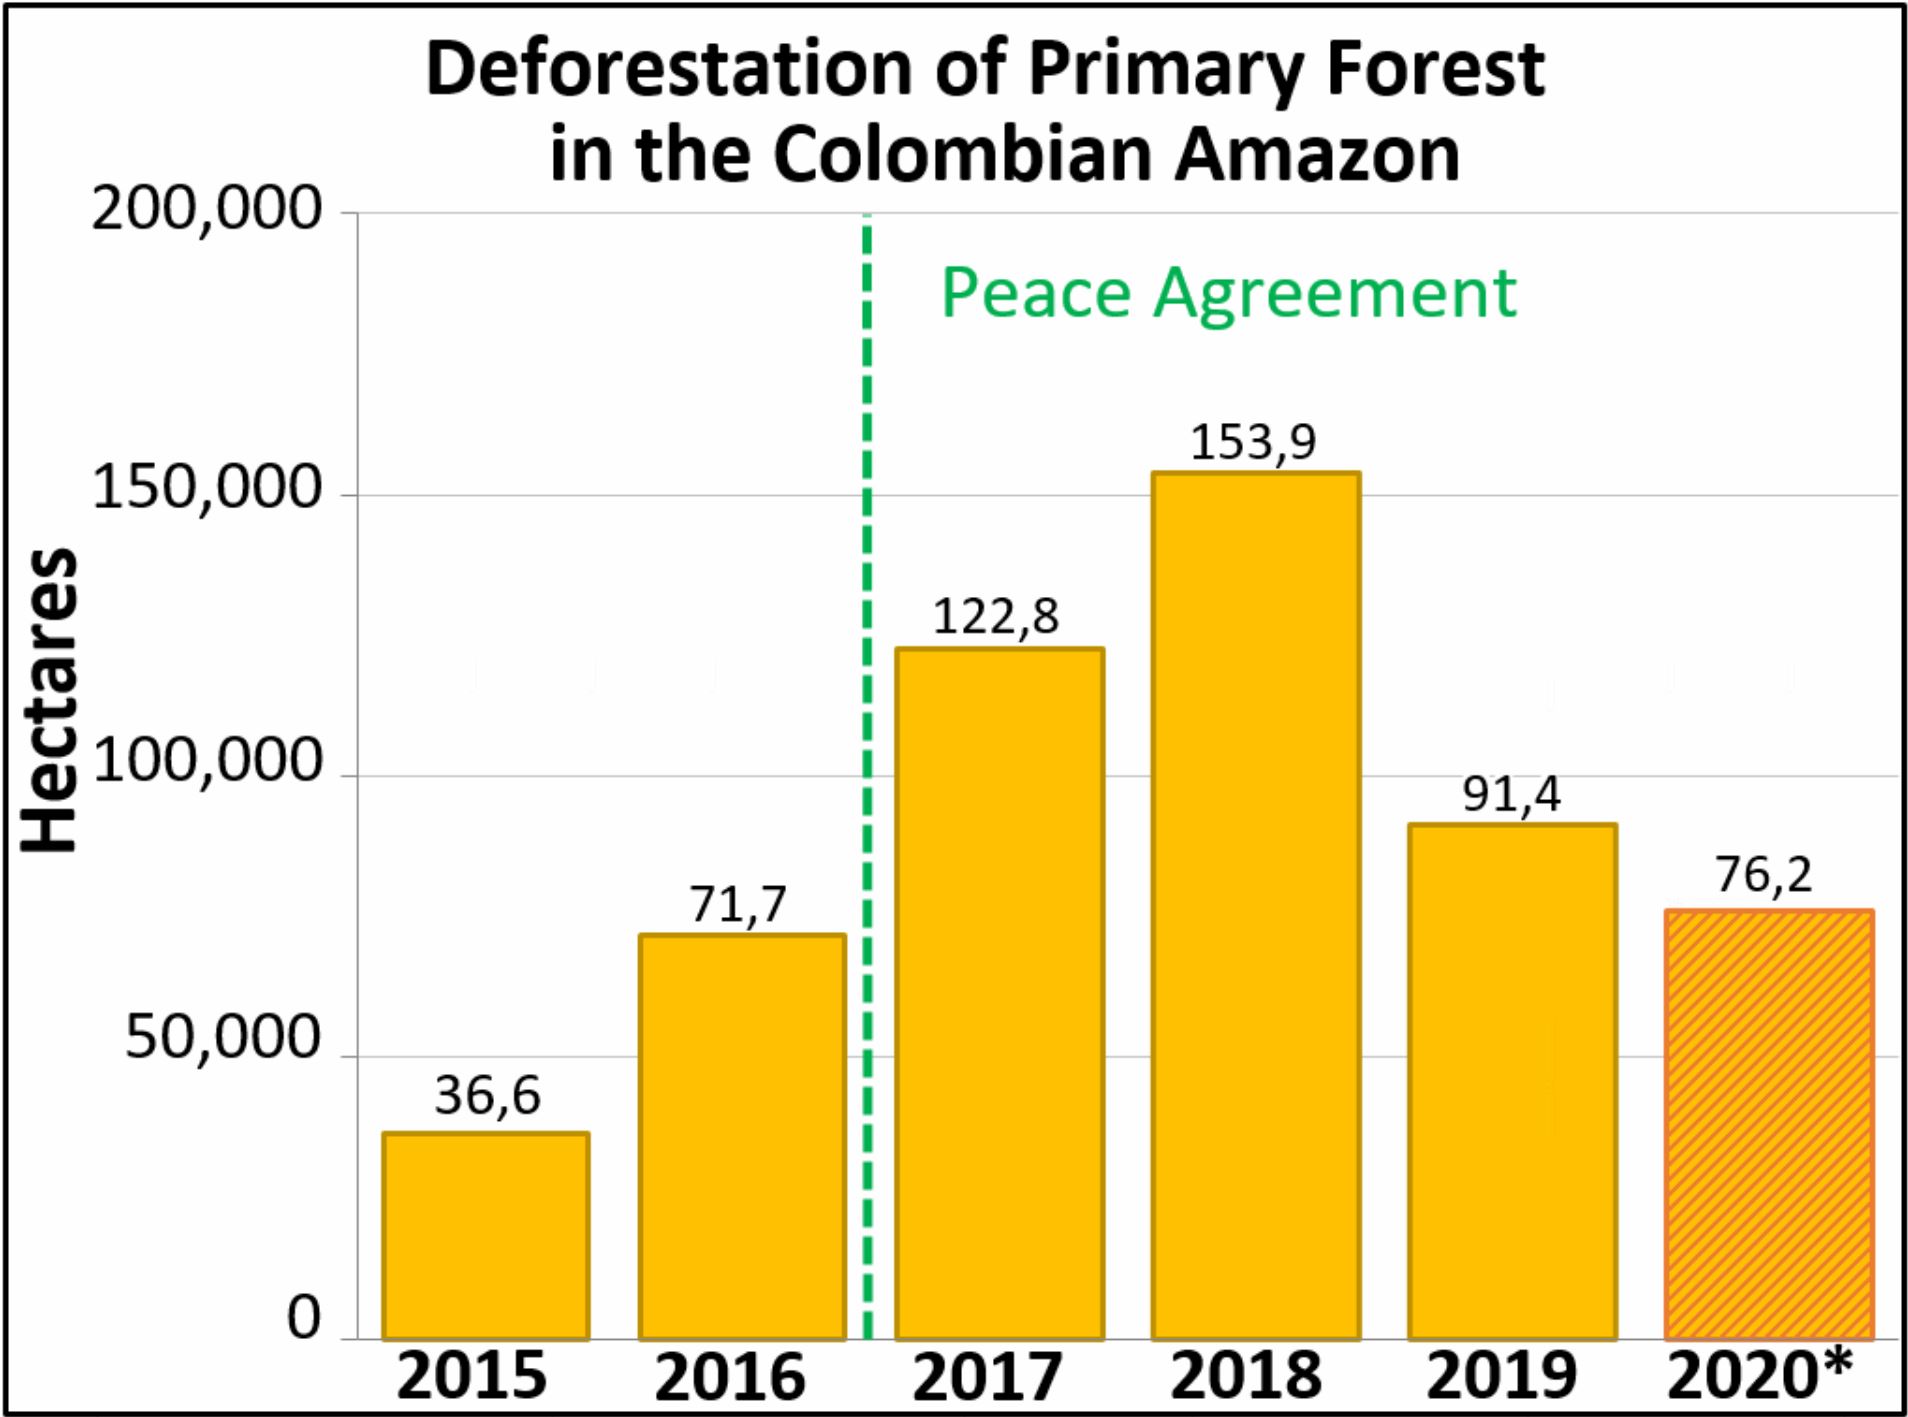
On the positive side, primary forest loss decreased in the Colombian Amazon (91,400 hectares) following a major spike following the 2016 peace accords (between the government and FARC). It is worth noting, however, that we have now documented the loss of 444,000 hectares (over a million acres) of primary forest in the Colombian Amazon in the past four years since the peace agreement (see Annex).
*Two important points about the data. First, we use annual forest loss from the University of Maryland to have a consistent source across all five countries. Second, we applied a filter to only include loss of primary forest (see Methodology).
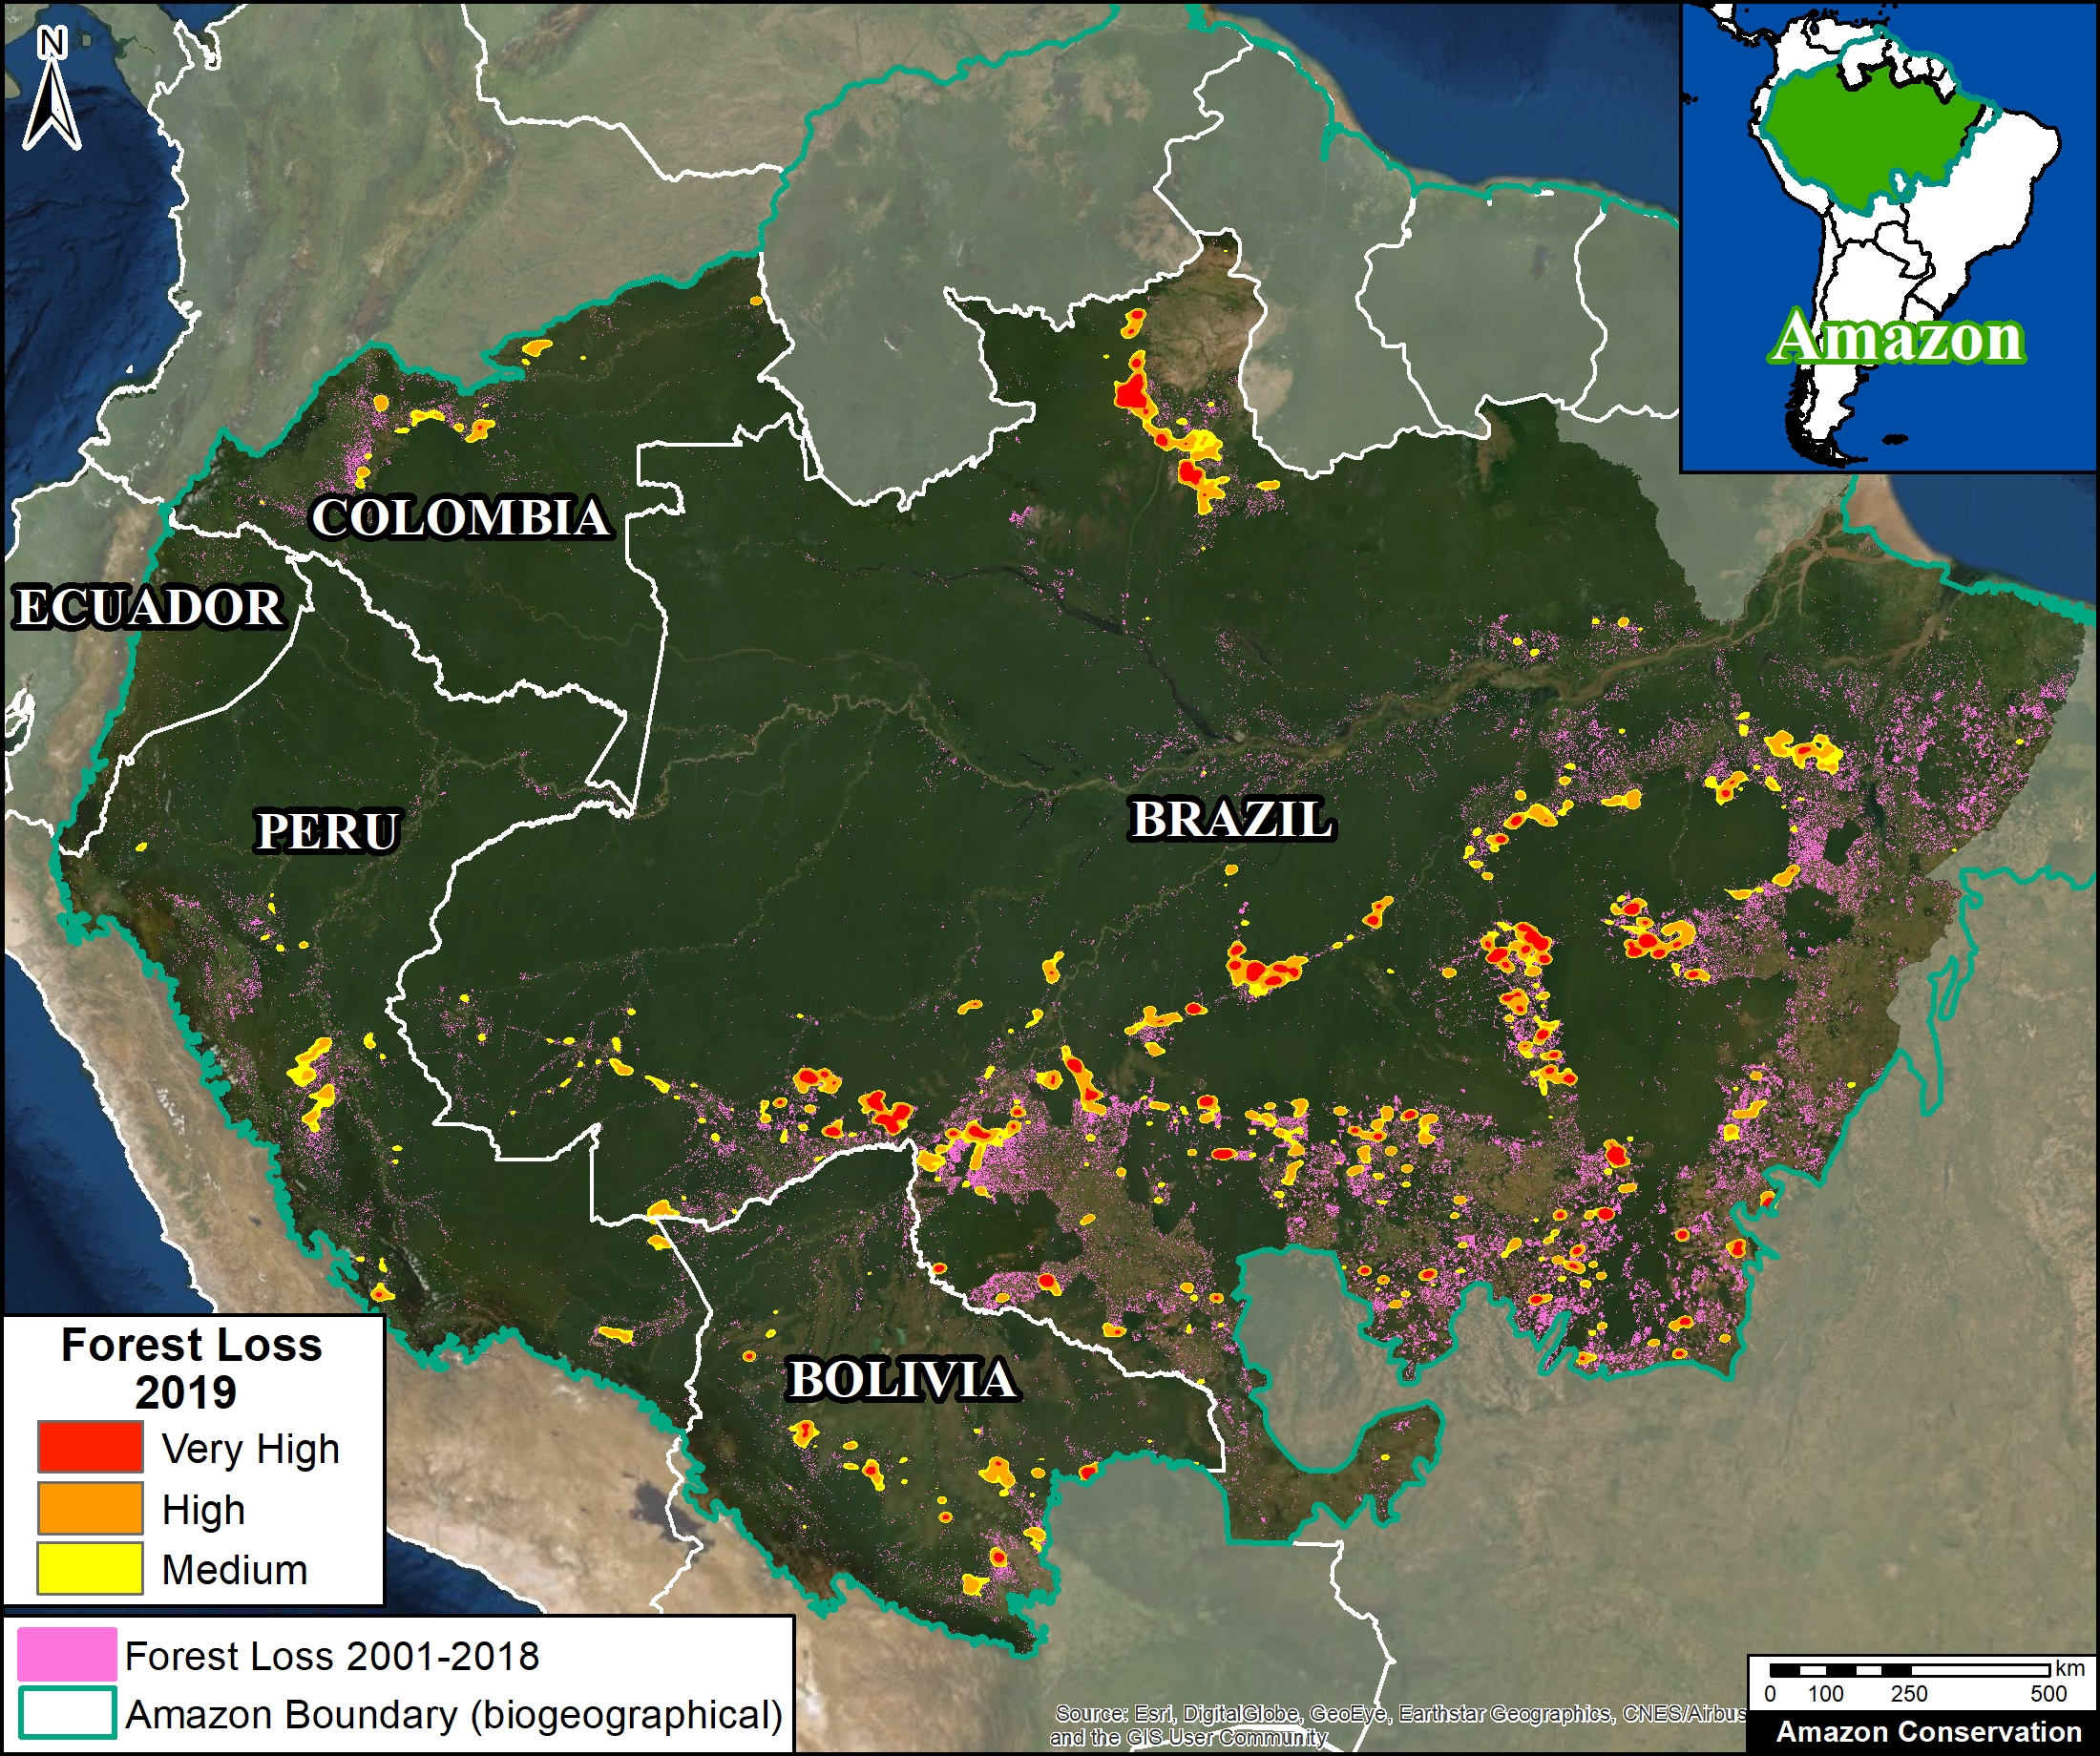
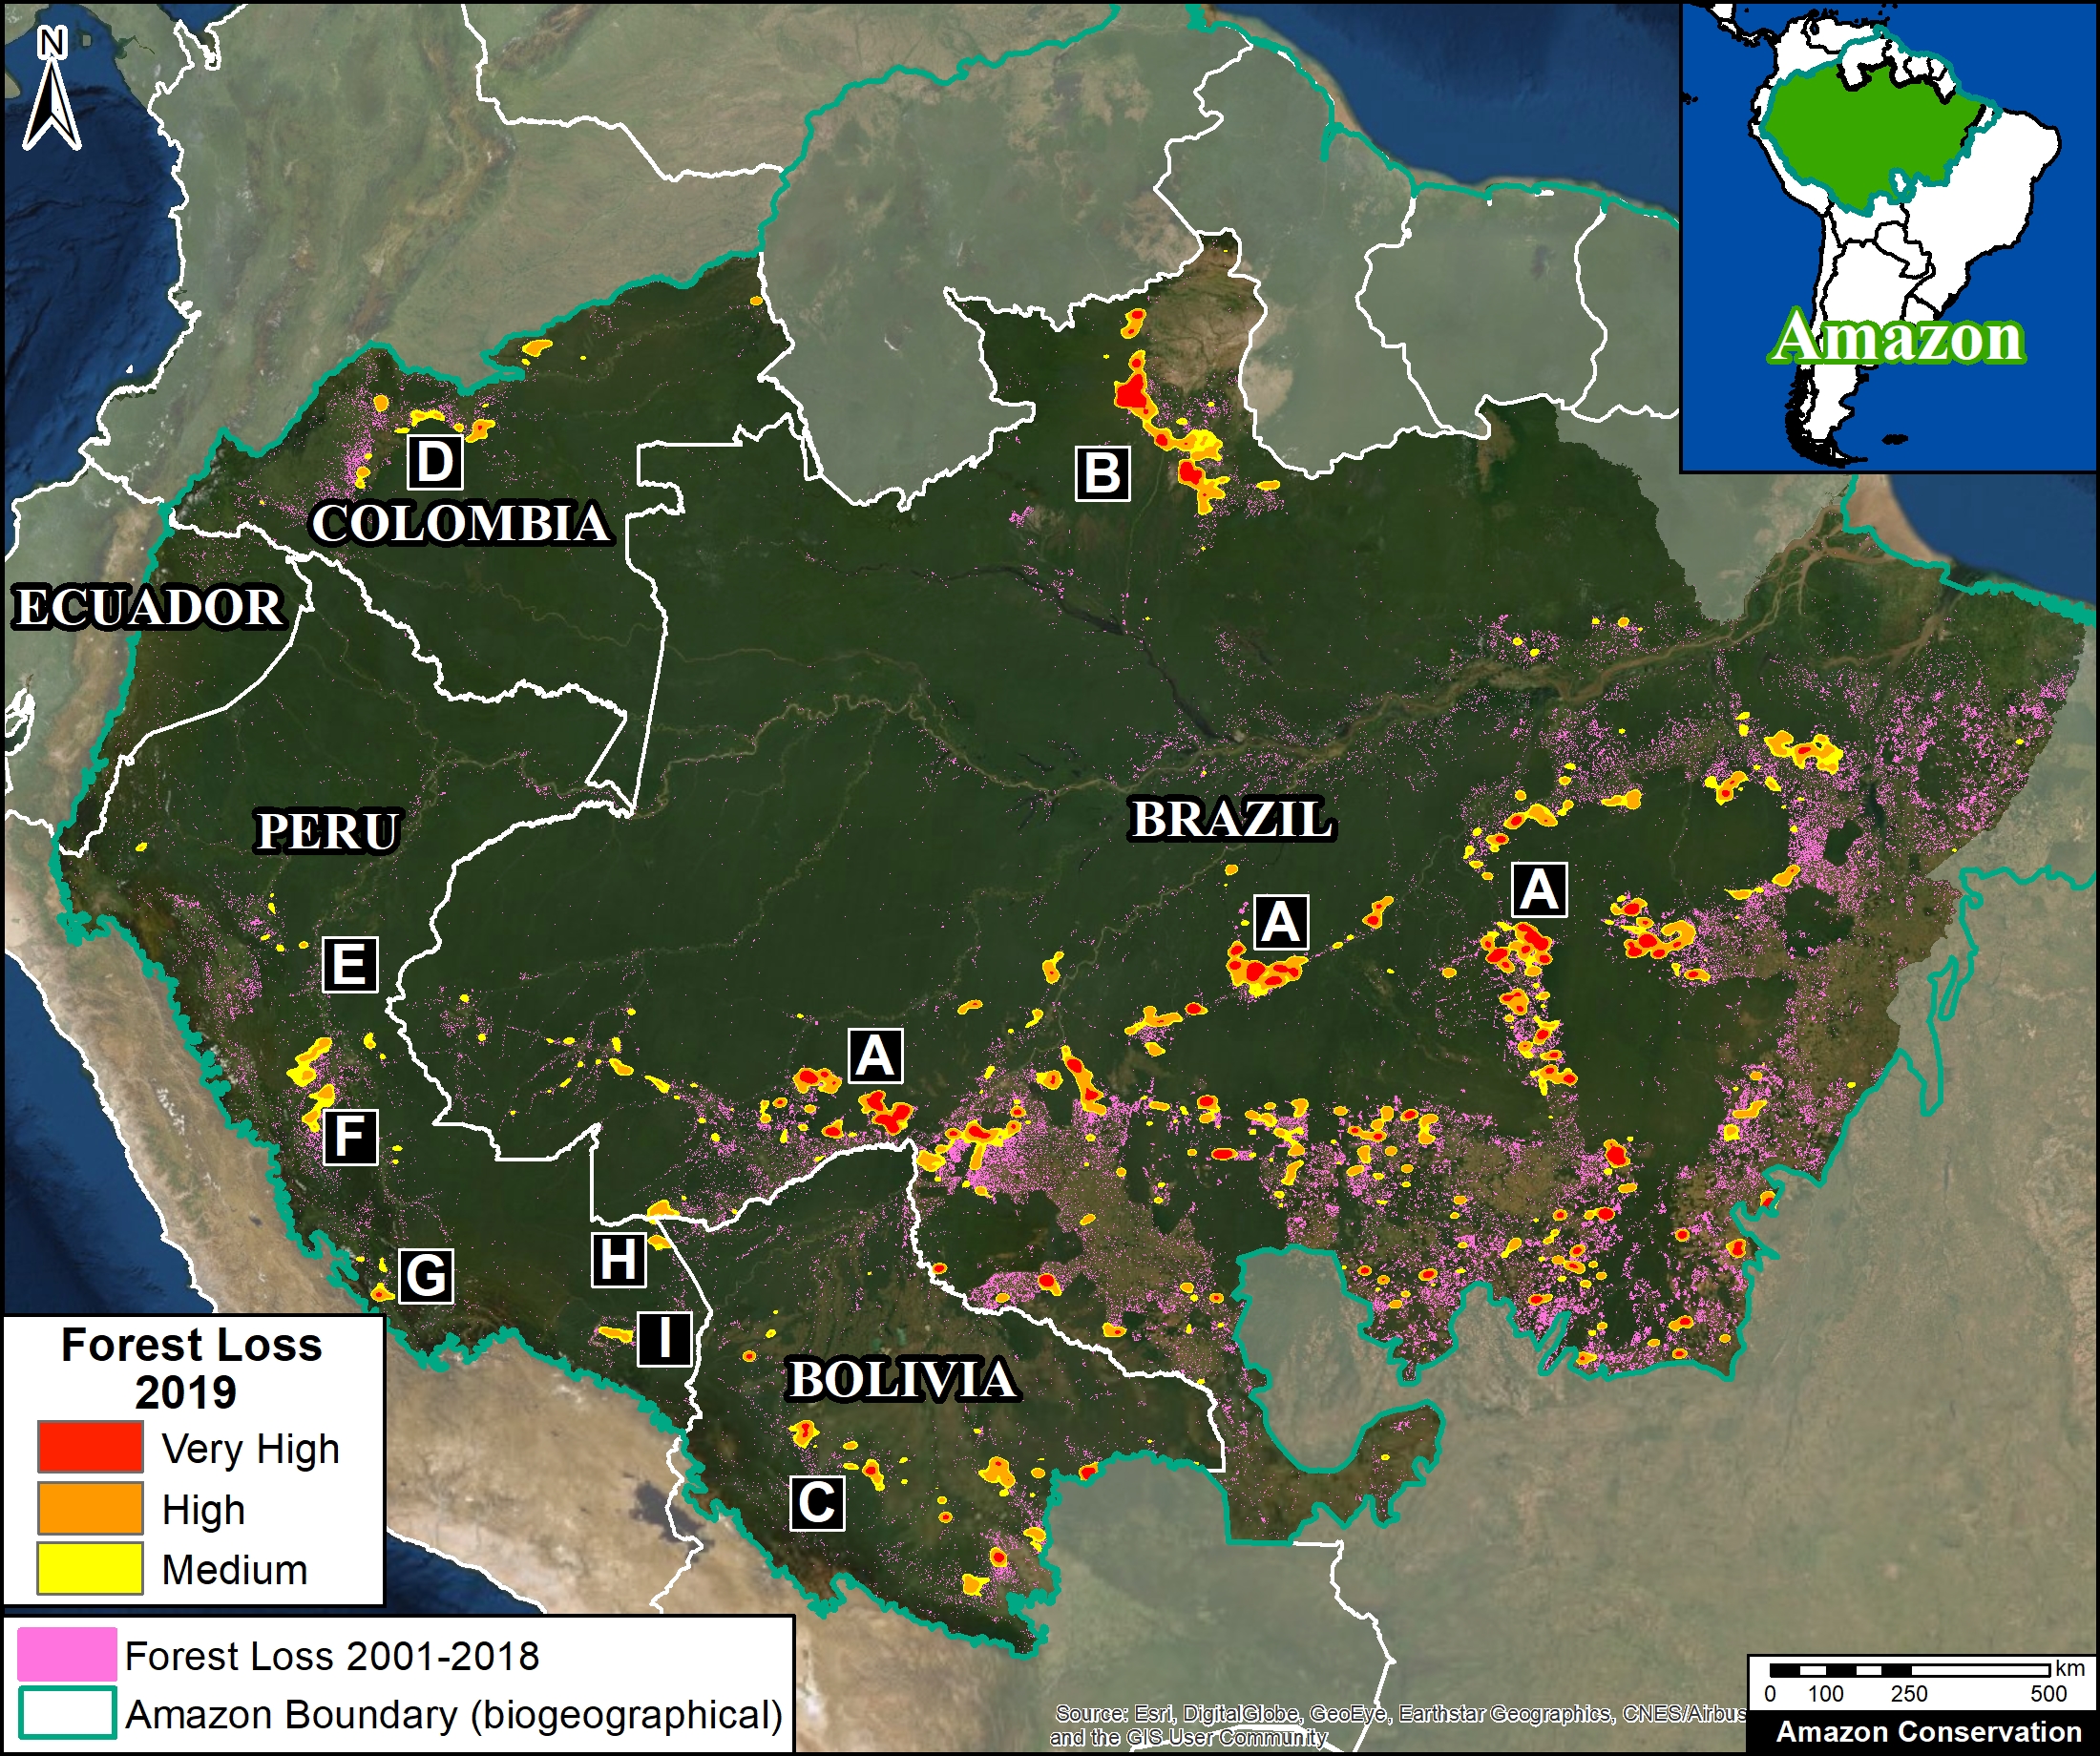
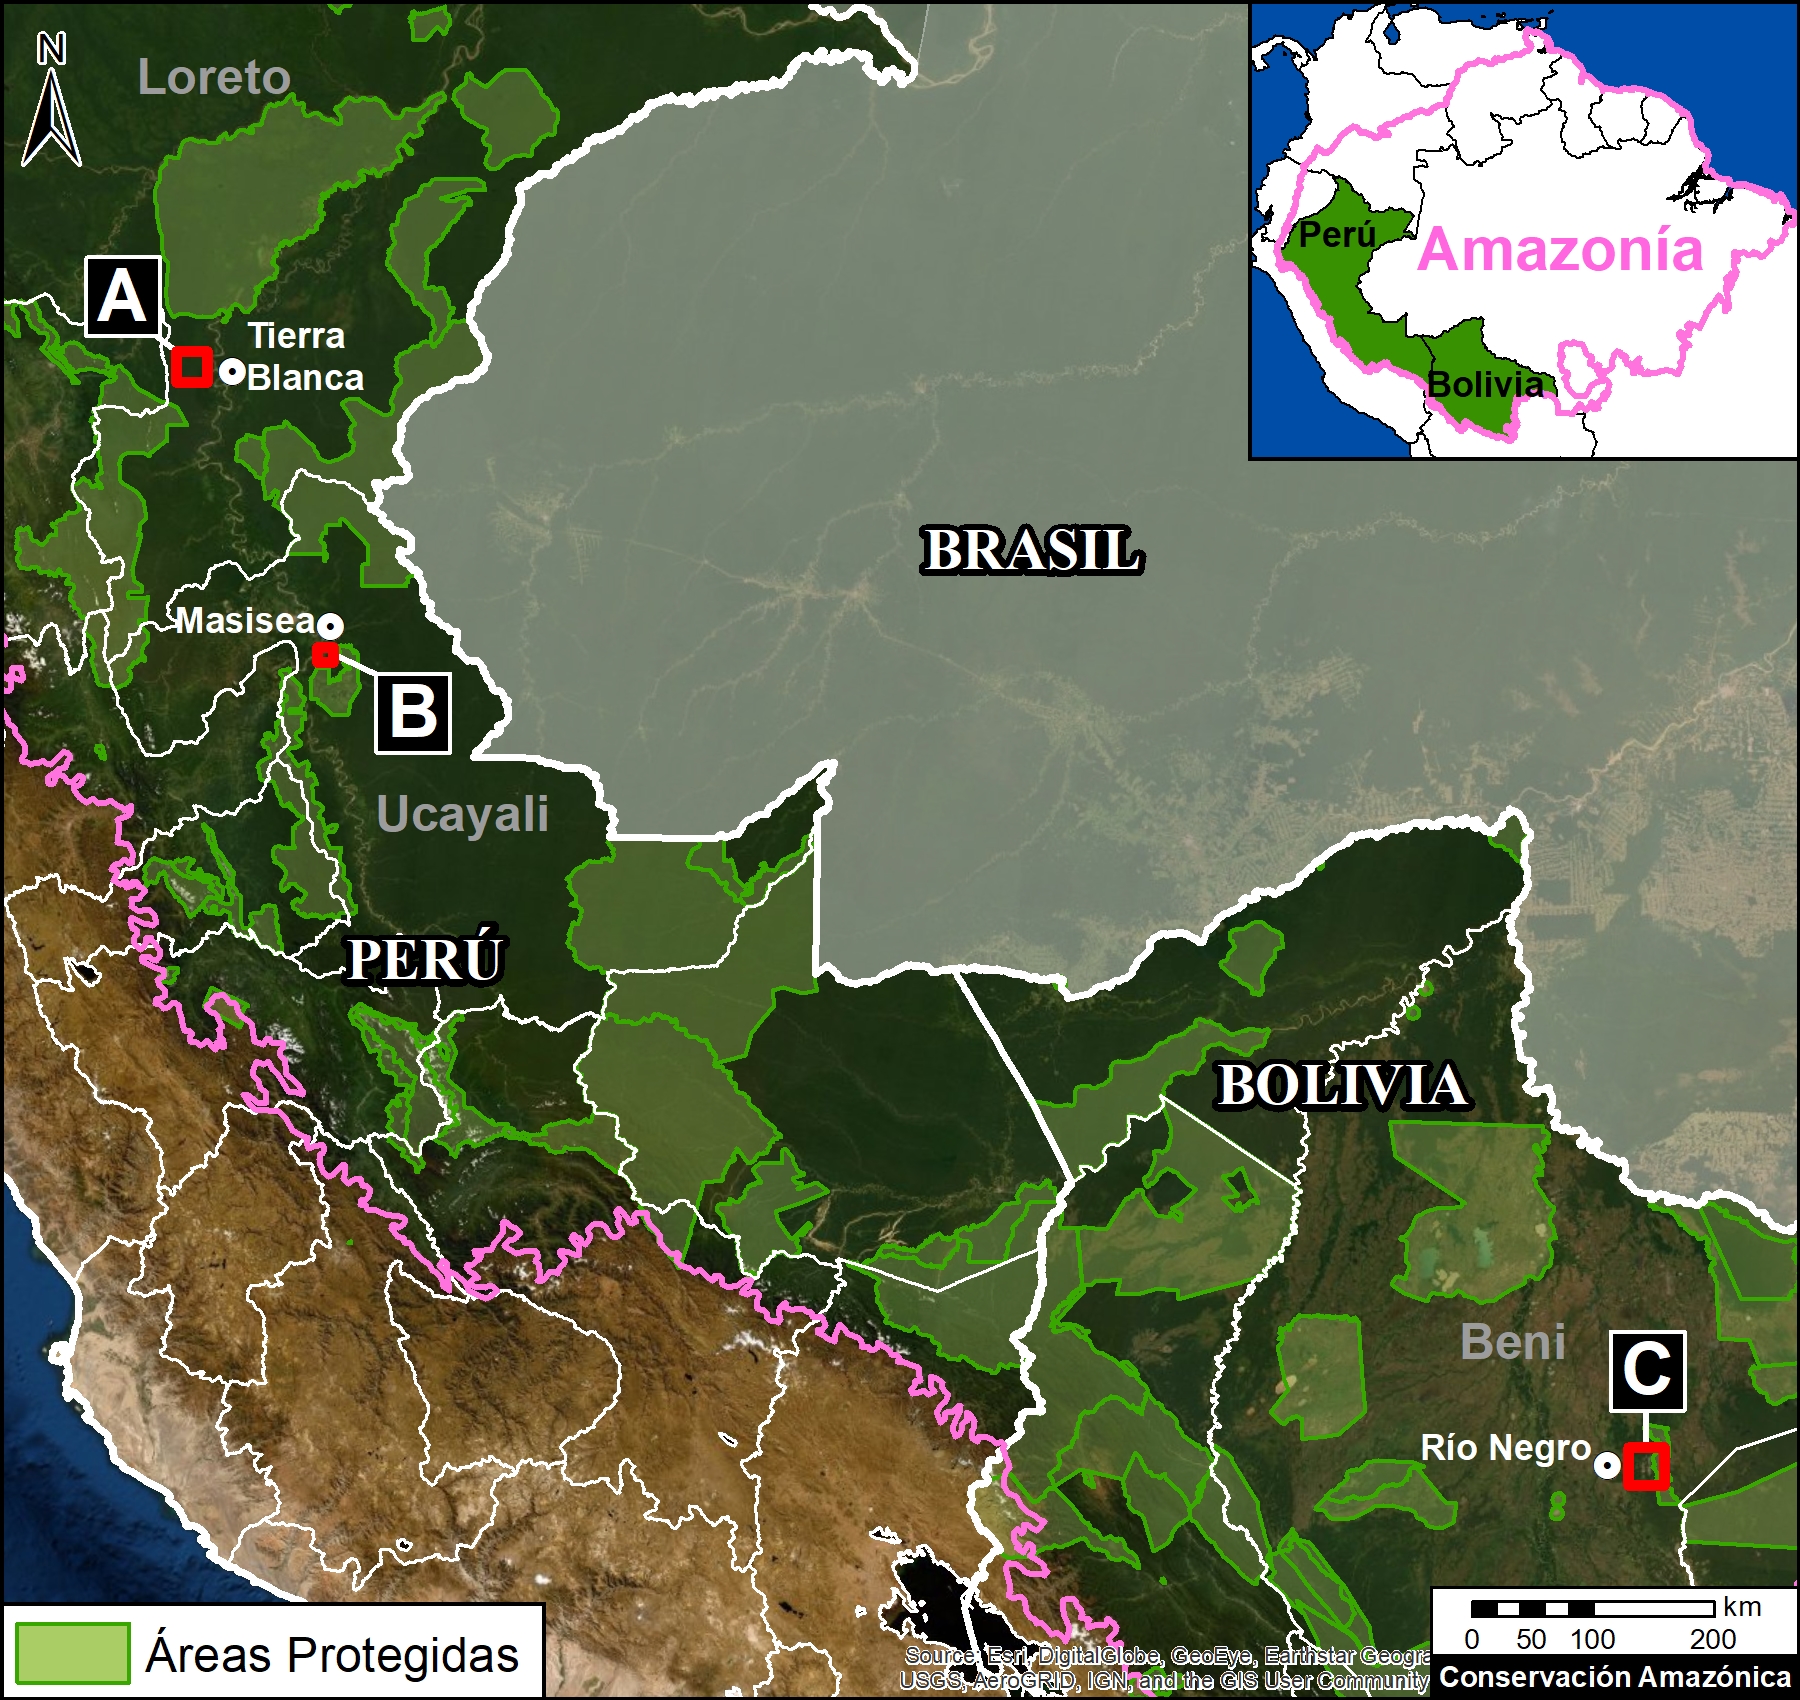
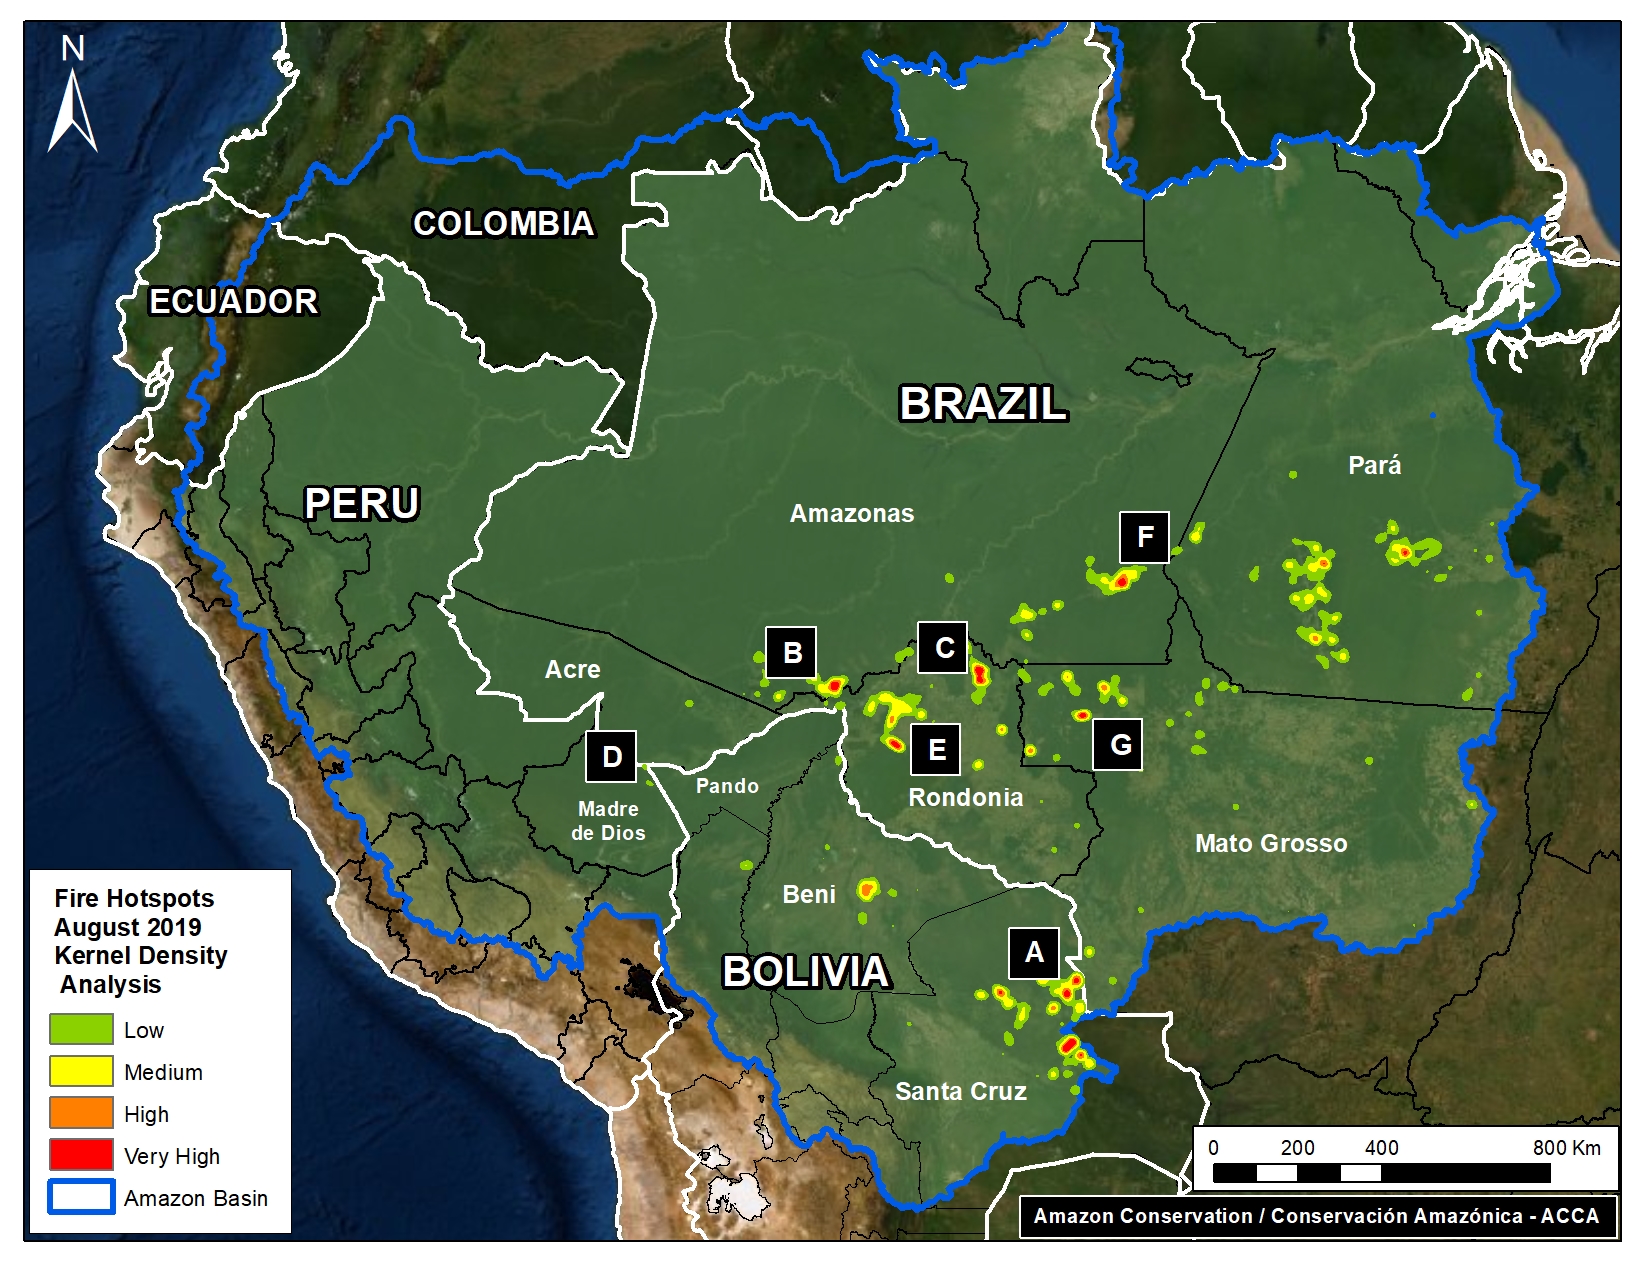
2019 Deforestation Hotspots Map
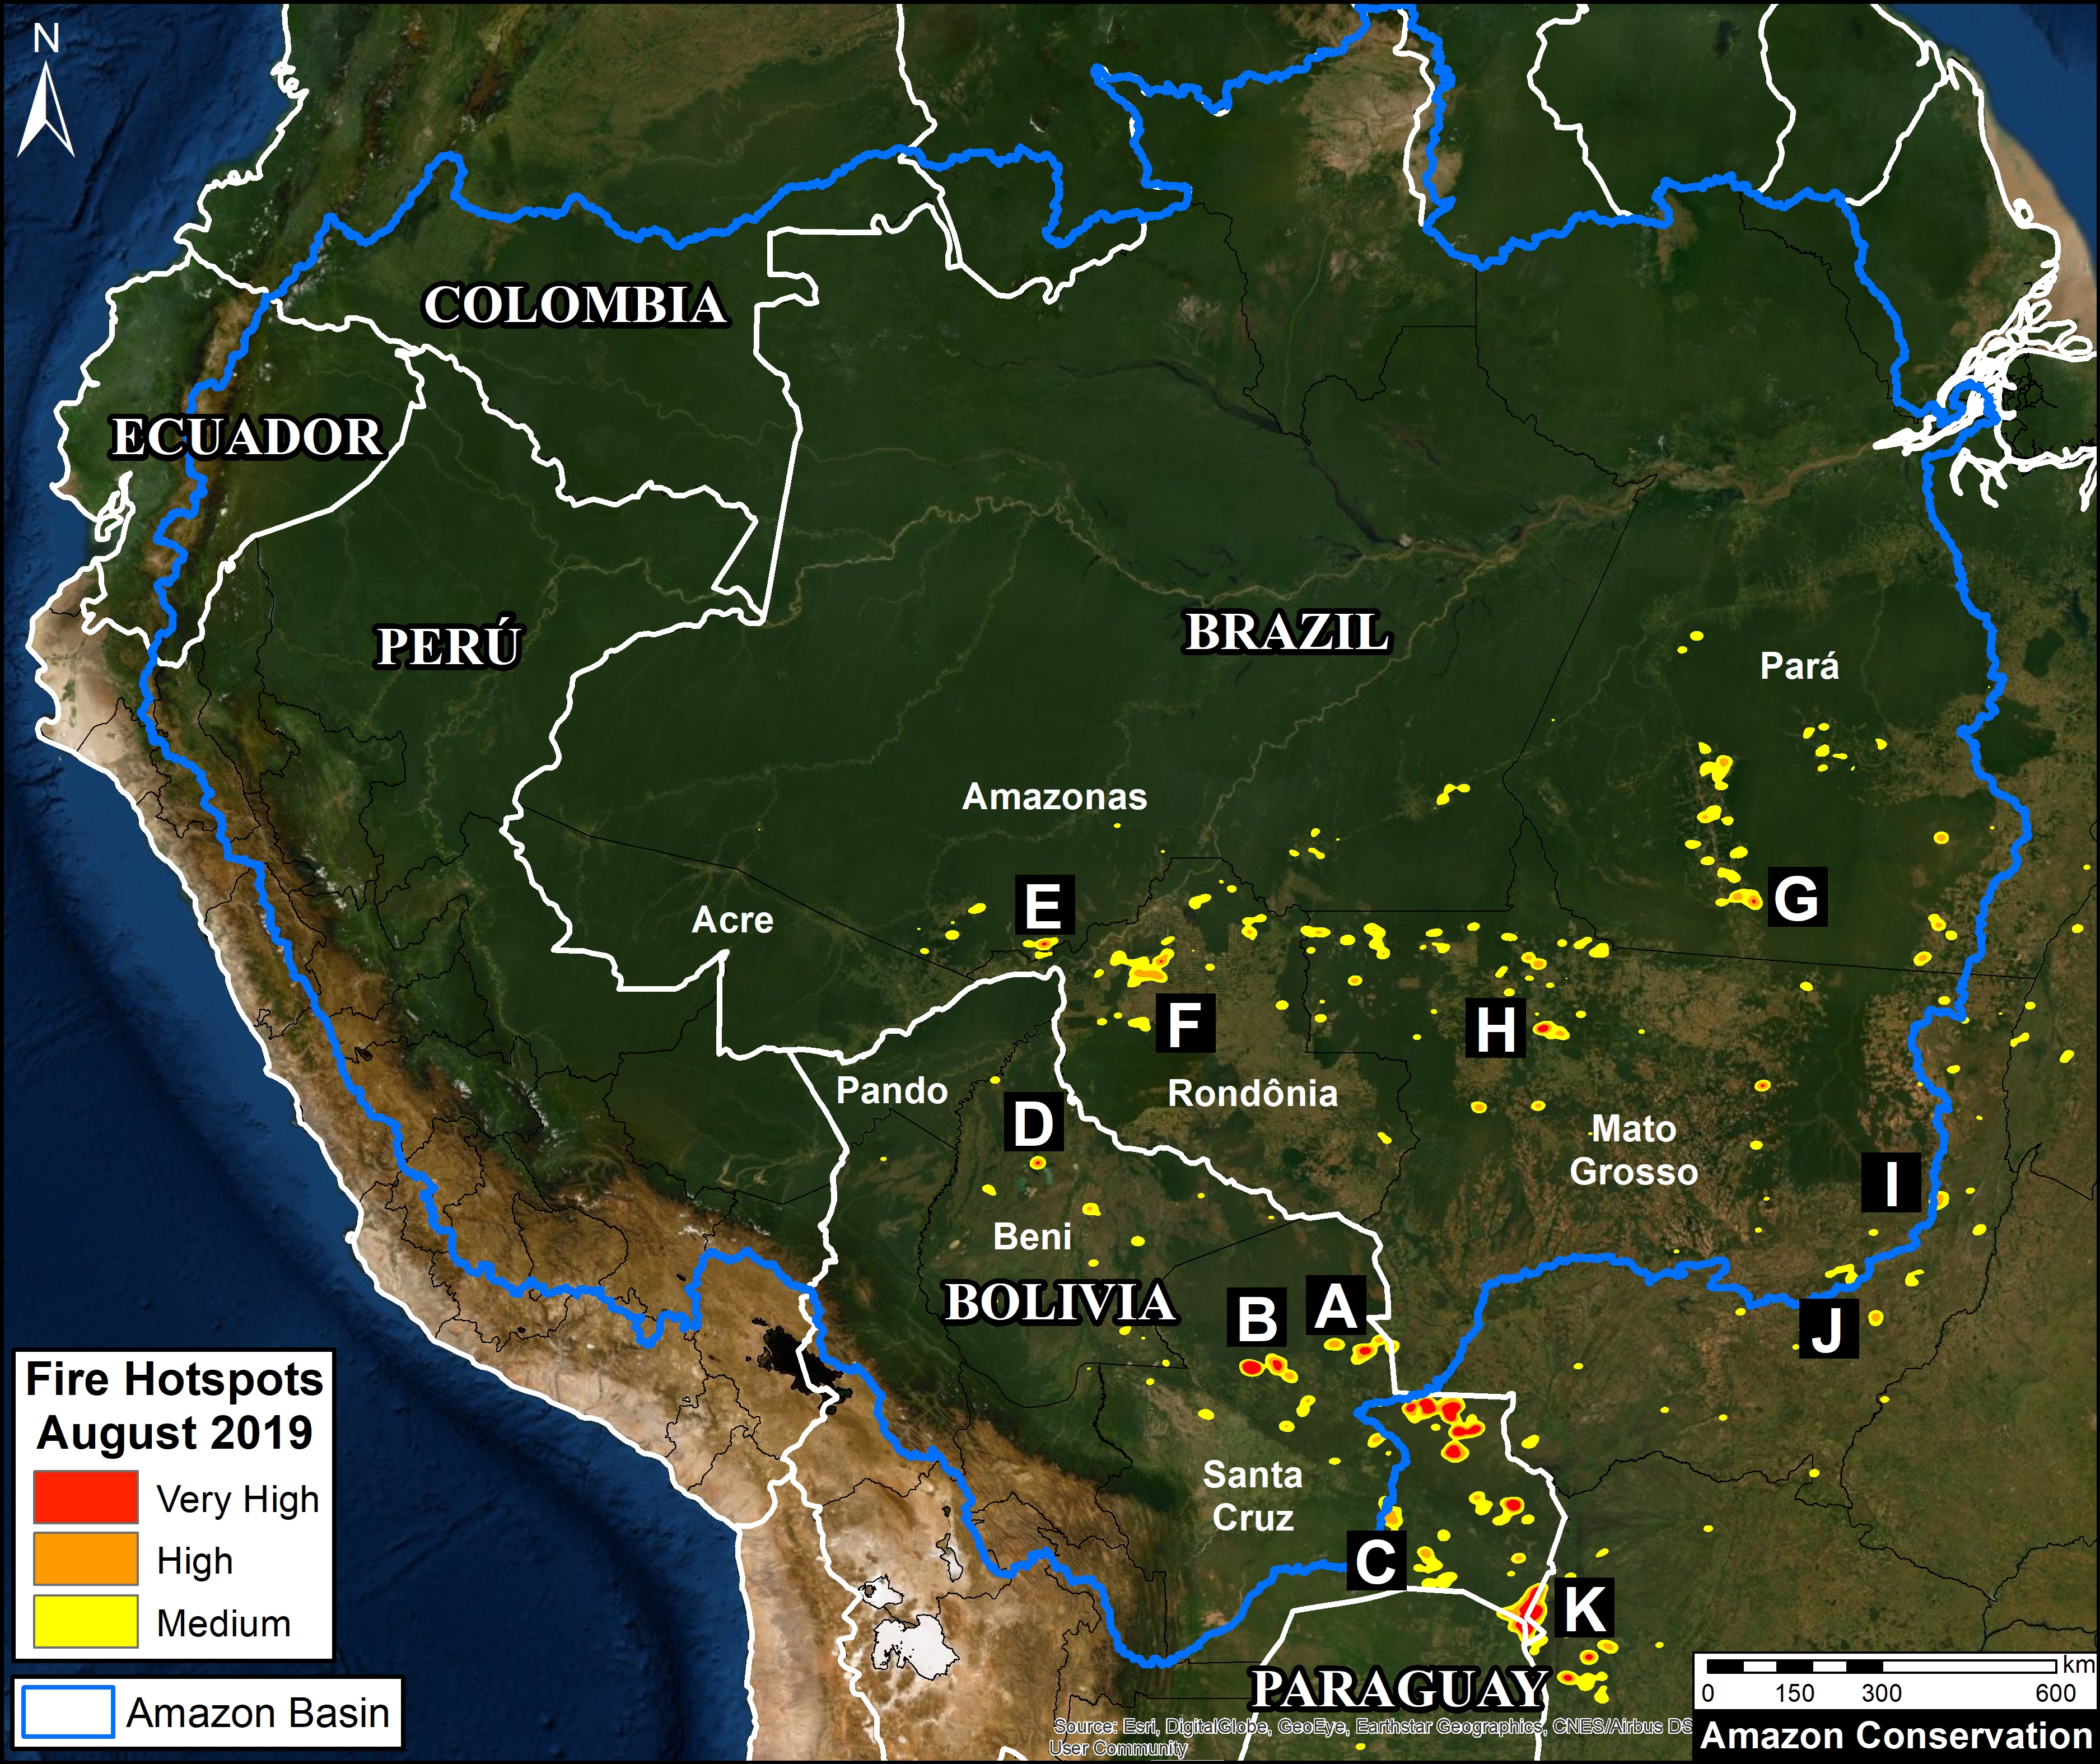
The Base Map below shows the major 2019 deforestation hotspots across the Amazon.
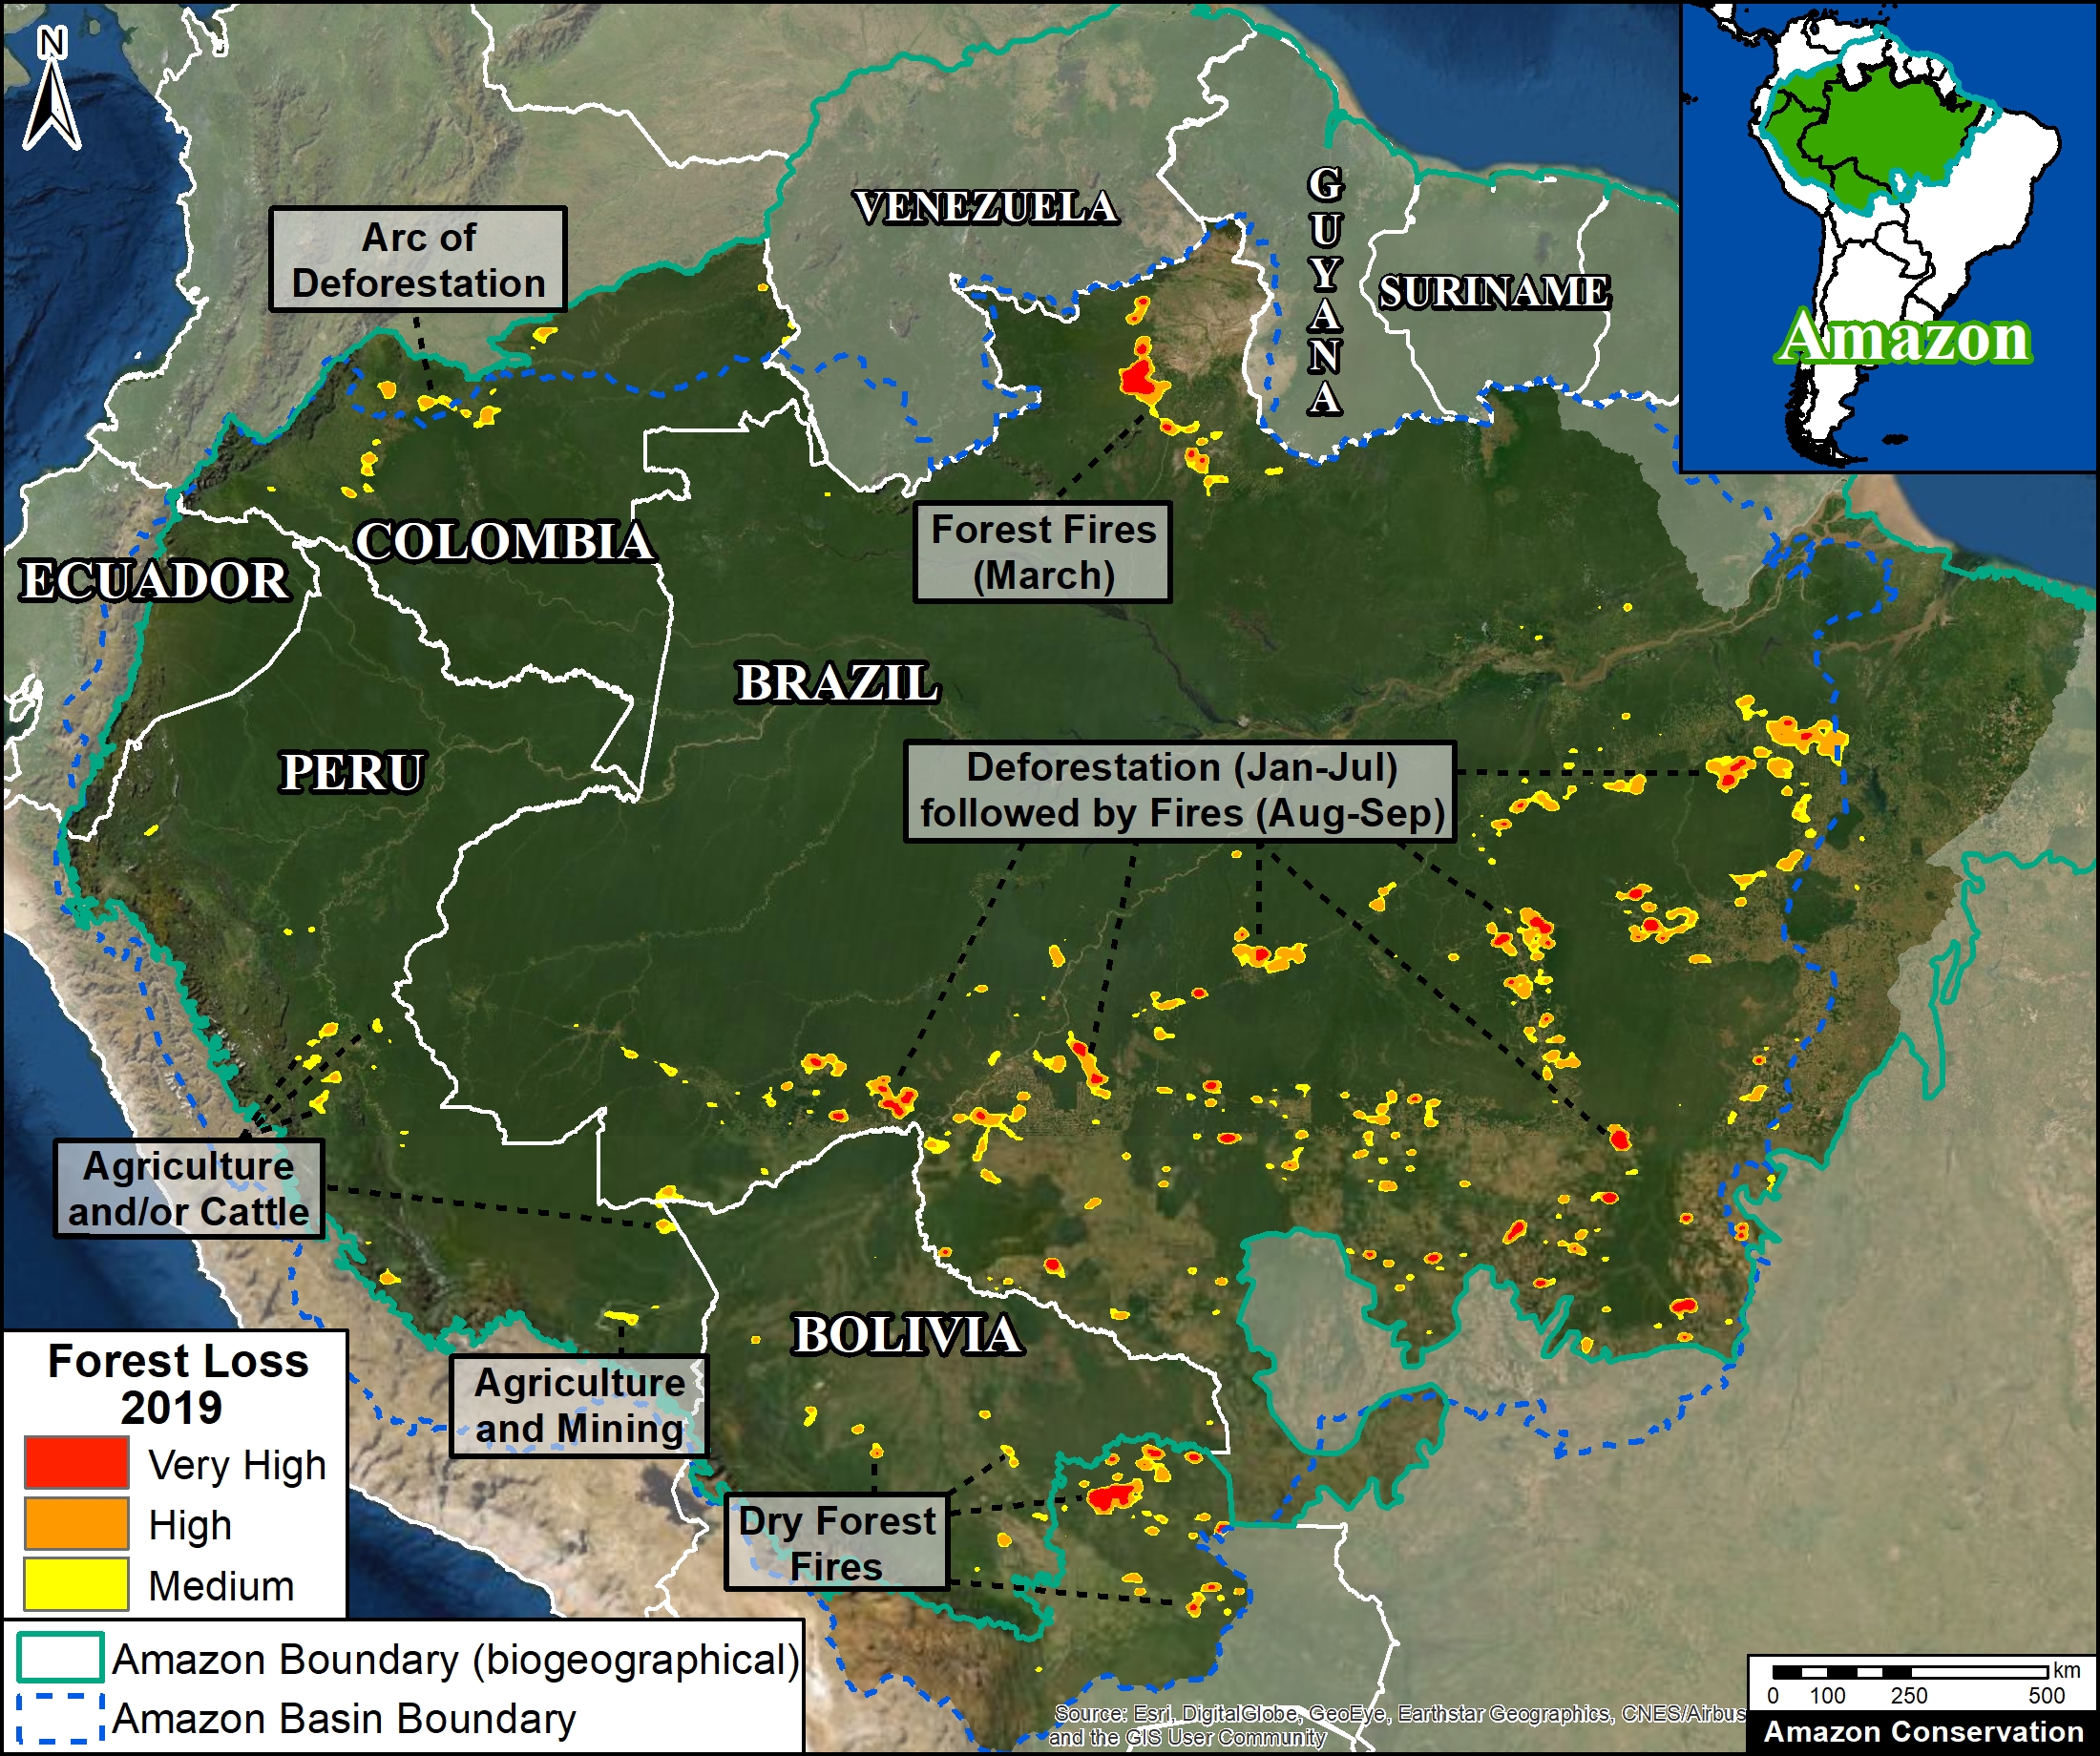
Many of the major deforestation hotspots were in Brazil. Early in the year, in March, there were uncontrolled fires up north in the state of Roraima. Further south, along the Trans-Amazonian Highway, much of the deforestation occurred in the first half of the year, followed by the high profile fires starting in late July. Note that many of these fires were burning recently deforested areas, and were not uncontrolled forest fires (MAAP #113).
The Brazilian Amazon also experienced escalating gold mining deforestation in indigenous territories (MAAP #116).
Bolivia also had an intense 2019 fire season. Unlike Brazil, many were uncontrolled fires, particularly in the Beni grasslands and Chiquitano dry forests of the southern Bolivian Amazon (MAAP #108).
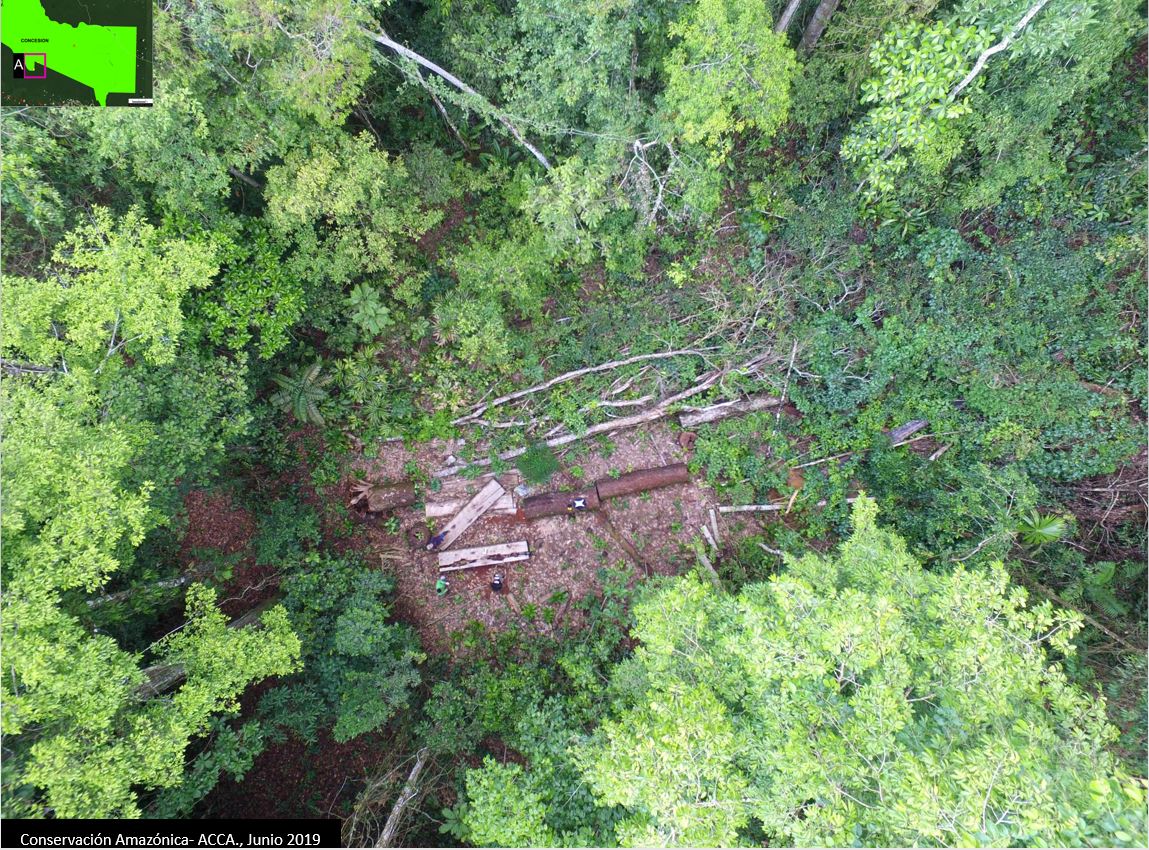
In Peru, although illegal gold mining deforestation decreased (MAAP #121), small-scale agriculture (including cattle) continues to be a major driver in the central Amazon (MAAP #112) and an emerging driver in the south.
In Colombia, there is an “arc of deforestation” in the northwestern Amazon. This arc includes four protected areas (Tinigua, Chiribiquete and Macarena National Parks, and Nukak National Reserve) and two Indigenous Reserves (Resguardos Indígenas Nukak-Maku and Llanos del Yari-Yaguara II) experiencing substantial deforestation (MAAP #120). One of the main deforestation drivers in the region is conversion to pasture for land grabbing or cattle ranching.
Annex – Colombia peace accord trend
Methodology
The baseline forest loss data presented in this report were generated by the Global Land Analysis and Discovery (GLAD) laboratory at the University of Maryland (Hansen et al 2013) and presented by Global Forest Watch. Our study area is strictly what is highlighted in the Base Map.
For our estimate of primary forest loss, we used the annual “forest cover loss” data with density >30% of the “tree cover” from the year 2001. Then we intersected the forest cover loss data with the additional dataset “primary humid tropical forests” as of 2001 (Turubanova et al 2018). For more details on this part of the methodology, see the Technical Blog from Global Forest Watch (Goldman and Weisse 2019).
For boundaries, we used the biogeographical limit (as defined by RAISG) for all countries except Bolivia, where we used the Amazon watershed limit (see Base Map).
All data were processed under the geographical coordinate system WGS 1984. To calculate the areas in metric units, the projection was: Peru and Ecuador UTM 18 South, Bolivia UTM 20 South, Colombia MAGNA-Bogotá, and Brazil Eckert IV.
Lastly, to identify the deforestation hotspots, we conducted a kernel density estimate. This type of analysis calculates the magnitude per unit area of a particular phenomenon, in this case forest cover loss. We conducted this analysis using the Kernel Density tool from Spatial Analyst Tool Box of ArcGIS. We used the following parameters:
Search Radius: 15000 layer units (meters)
Kernel Density Function: Quartic kernel function
Cell Size in the map: 200 x 200 meters (4 hectares)
Everything else was left to the default setting.
For the Base Map, we used the following concentration percentages: Medium: 7%-10%; High: 11%-20%; Very High: >20%.
References
Goldman L, Weisse M (2019) Explicación de la Actualización de Datos de 2018 de Global Forest Watch. https://blog.globalforestwatch.org/data-and-research/blog-tecnico-explicacion-de-la-actualizacion-de-datos-de-2018-de-global-forest-watch
Hansen, M. C., P. V. Potapov, R. Moore, M. Hancher, S. A. Turubanova, A. Tyukavina, D. Thau, S. V. Stehman, S. J. Goetz, T. R. Loveland, A. Kommareddy, A. Egorov, L. Chini, C. O. Justice, and J. R. G. Townshend. 2013. “High-Resolution Global Maps of 21st-Century Forest Cover Change.” Science 342 (15 November): 850–53. Data available on-line from: http://earthenginepartners.appspot.com/science-2013-global-forest.
Turubanova S., Potapov P., Tyukavina, A., and Hansen M. (2018) Ongoing primary forest loss in Brazil, Democratic Republic of the Congo, and Indonesia. Environmental Research Letters https://doi.org/10.1088/1748-9326/aacd1c
Acknowledgements
We thank G. Palacios for helpful comments to earlier versions of this report.
This work was supported by the following major funders: Norwegian Agency for Development Cooperation (NORAD), Gordon and Betty Moore Foundation, International Conservation Fund of Canada (ICFC), Metabolic Studio, Erol Foundation, MacArthur Foundation, and Global Forest Watch Small Grants Fund (WRI).
Citation
Finer M, Mamani N (2020) 2019 Amazon Deforestation. MAAP: 122.