MAAP #80: Amazon Beauty, in High-Resolution

Image 80. Base Map. Data: SERNANP, MAAP

MAAP tracks the most urgent deforestation cases in the Andean Amazon, thus it can be a bit depressing. However, it is important to remember why we do it: the Amazon is spectacular.

Here, we present a series of high-resolution satellite images to show the incredible beauty of the Peruvian Amazon, and help remind us all why it is so important to protect.

All the images, obtained from DigitalGlobe, are both recent and very high resolution (less than 0.5 meters). Together, they form an art exhibition, starring the forests, rivers, and mountains of the Peruvian Amazon.

The categories of the images are: “Protected Areas” and “Threatened Areas.”

The Protected Areas include National Parks (Yaguas, Sierra del Divisor, and Manu); National Reserve (Tambopata); Communal Reserve (Amarakaeri); and Regional Conservation Area (Choquequirao).

The Threatened Areas include areas at risk due to gold mining, road construction, hydroelectric dams, and new oil palm and cacao plantations.

Click on each image to enlarge. See the base map for the location of each image (A-M).


Protected Areas

A. Yaguas National Park (Loreto)

As Peru’s newest national park, created in January 2018, Yaguas National Park now protects a large (2,147,345 acres) and nearly intact stretch of the northern Peruvian Amazon. In featured Image A, we show the Yaguas River meandering through the primary forest of the eastern section of the new park.

Image 80_A. Parque Nacional Yaguas. Data: DigitalGlobe (Nextview)

B. Sierra del Divisor National Park (Ucayali)

The second newest national park in Peru is Sierra del Divisor, created in 2015. Sierra del Divisor National Park protects more than three million acres in the remote central Peruvian Amazon, along the border with Brazil. Featured Image B shows an aerial view of the famous cone mountain in the southern part of the park.

Image B. Parque Nacional Sierra del Divisor. Data: DigitalGlobe (Nextview)

C. Tambopata National Reserve (Madre de Dios)

Tambopata National Reserve made headlines in 2015 due to an illegal gold mining invasion that has since been contained (MAAP #61). Fortunately, Tambopata, located in the southern Peruvian Amazon, is best known for its world-renowned biodiversity. Featured Image C shows a meandering tributary of the Tambopata River and the subsequent formation of oxbow lakes.

Image C. Reserva Nacional Tambopata. Data: DigitalGlobe (Nextview)

D. Amarakaeri Communal Reserve (Madre de Dios)

Amarakaeri Communal Reserve is an important protected area in the southern Peruvian Amazon that is jointly managed by indigenous communities (ECA Amarakaeri) and the national protected areas agency (SERNANP). Featured Image D shows a wild river winding through the rugged foothills of the southern portion of the reserve.

Image D. Reserva Comunal Amarakaeri. Data: DigitalGlobe (Nextview), SERNANP

E. Manu National Park (Cusco sector)

Manu is one of the most famous national parks in the world, known for its diversity of habitats in the southern Peruvian Amazon, including lowland rainforest. Featured Image E shows the other extreme, the highlands and the transition beyond treeline to an ecosystem known as puna. Interestingly, this image shown an example of the upper-most headwaters where Amazonian rivers are born.

Image E. Parque Nacional Manu. Data: DigitalGlobe (Nextview), SERNANP

F. Regional Conservation Area Choquequirao (Cusco)

Choquequirao, one of the first examples of a regional conservation area in southern Peru, is located next to Machu Picchu. Featured Image F shows a high-elevation scene in the heart of the reserve, near the mountain peak known as Nevado Sacsarayoc.

Image F. Choquequirao. Data: DigitalGlobe (Nextview)

G. Los Amigos Conservation Concession (Madre de Dios)

It’s not technically a protected area, but a forestry concession in the southern Peruvian Amazon. In fact, Los Amigos is the first private conservation concession in the world. Featured Image G shows the meandering course of a tributary of the Los Amigos river, and the surrounding primary forest, deep in the concession.

Image G. Los Amigos. Data: DigitalGlobe (Nextview)

Threatened Areas

H. Tamshiyacu (Loreto)

The company United Cacao clearcut 5,880 acres of primary forest near the town of Tamshiycacu in the northern Peruvian Amazon between 2013 and 2015 (MAAP #35). Featured Image H shows the abrupt transition between plantation and primary forest at the eastern end of the project area, where plans exist to expand for more large-scale cacao operations.

Image H. United Cacao. Data: DigitalGlobe (Nextview)

I. Manu-Amarakaeri Highway (Madre de Dios)

A controversial road construction project would cross the buffer zones of two important protected areas in the southern Peruvian Amazon, Amarakaeri Communal Reserve and Manu National Park. Initial construction began in 2015 before being halted by the courts, but the project continues to be a long-term threat to the area. Featured Image I shows the leading edge of the road construction, surrounded by primary forest.

Image I. Amarakaeri/Manu road. Data: DigitalGlobe (Nextview)

J. La Pampa (Madre de Dios)

MAAP has documented the rapid expansion of gold mining deforestation in an area known as La Pampa, in the southern Peruvian Amazon (MAAP #75). Alarmingly, over 11,250 acres has been cleared since 2013. Featured Image J shows the most active mining deforestation front penetrating the primary forests to the east. Note the temporary and mobile mining camp city that has been formed near the leading edge of mining deforestation.

Image J. La Pampa. Data: DigitalGlobe (Nextview)

K. Tierra Blanca (Loreto)

The Peruvian company Grupo Romero had plans to clearcut thousands of hectares of primary forest for four large-scale oil palm plantations. There are reports that the company has abandoned the projects, in part due to pressure from civil society. Featured Image K shows the spared primary forest in one of the proposed plantations, Tierra Blanca. Note the recent construction (2014) of a logging road that still endangers the area.

Image K. Tierra Blanca. Data: DigitalGlobe (Nextview)

L. Amarakaeri Communal Reserve (Madre de Dios)

Immediately following a gold mining invasion in 2015, the co-administrators of Amarakaeri Communal Reserve (SERNANP and ECA Amarakaeri) took action against the illegal activities (see MAAP #44). Featured Image L shows the spared primary forest surrounding the abandoned invasion front at the border of the reserve.

Image L. Reserva Comunal Amarakaeri. Data: DigitalGlobe (Nextview), SERNANP

Marañon River (sector Amazonas/Cajamarca)

Featured Image M shows the exact location of a proposed hydroelctric dam, Chadín 2. It is one of the most advanced of the controversial 20 proposed dams along the Marañón River in the western Peruvian Amazon. It would be a large dam with the capacity to produce 600 MW of energy, and will create a flooding reservoir of over 8,000 acres. The project’s environmental impact study was approved in 2014, but construction has not yet started.

Image M. Rio Maranon. Data: DigitalGlobe (Nextview)

Coordinates

A. Yaguas: -2.72314, -70.746635
B. Sierra del Divisor: -7.962626, -73.781751
C. Tambopata: -12.93985, -69.233005
D. Amarakaeri: -13.073707, -70.966423
E. Manu: -12.816693, -71.886345
F. Choquequirao: -13.30926, -72.808164
G. Los Amigos: -12.377288, -70.380948
H. Tamshiyacu: -3.983962, -73.013498
I. Carretera Manu/Amarakaeri: -12.473042, -71.114976
J. La Pampa: -12.997284, -69.94845
K. Tierra Blanca: -6.517934, -75.366485
L. Amarakaeri: -12.88521, -70.626946
M. Chadin 2: -6.423889, -78.223333

Citation

Finer M, Mamani N (2018) Amazon Beauty, in High-Resolution. MAAP: 80.

MAAP SYNTHESIS #2: PATTERNS AND DRIVERS OF DEFORESTATION IN THE PERUVIAN AMAZON

We present our second synthesis report, building off our first report published in September 2015. This synthesis is largely based on the 50 MAAP reports published between April 2015 and November 2016. The objective is to synthesize all the information to date regarding deforestation trends, patterns and drivers in the Peruvian Amazon.

MAAP methodology includes 4 major components: Forest loss detection, Prioritize big data, Identify deforestation drivers, and Publish user-friendly reports. See Methodology section below for more details.

Our major findings include:

  • Trends. During the 15 years between 2001 and 2015, around 4,448,000 acres (1,800,000 hectares) of Peruvian Amazon forest has been cleared, with a steadily increasing trend. 2014 had the highest annual forest loss on record (438,775 acres), followed by a slight decrease  in 2015. The preliminary estimate for 2016 indicates that forest loss remains relatively high. The vast majority (80%) of forest loss events in the Peruvian Amazon are small-scale (<5 hectares), while large-scale events (> 50 hectares) pose a latent threat due to new agro-industrial projects.
  • Hotspots. We have identified at least 8 major deforestation hotspots. The most intense hotspots are located in the central Amazon (Huánuco and Ucayali). Other important hotspots are located in Madre de Dios and San Martin. Two protected areas (Tambopata National Reserve and El Sira Communal Reserve) are threatened by these hotspots.
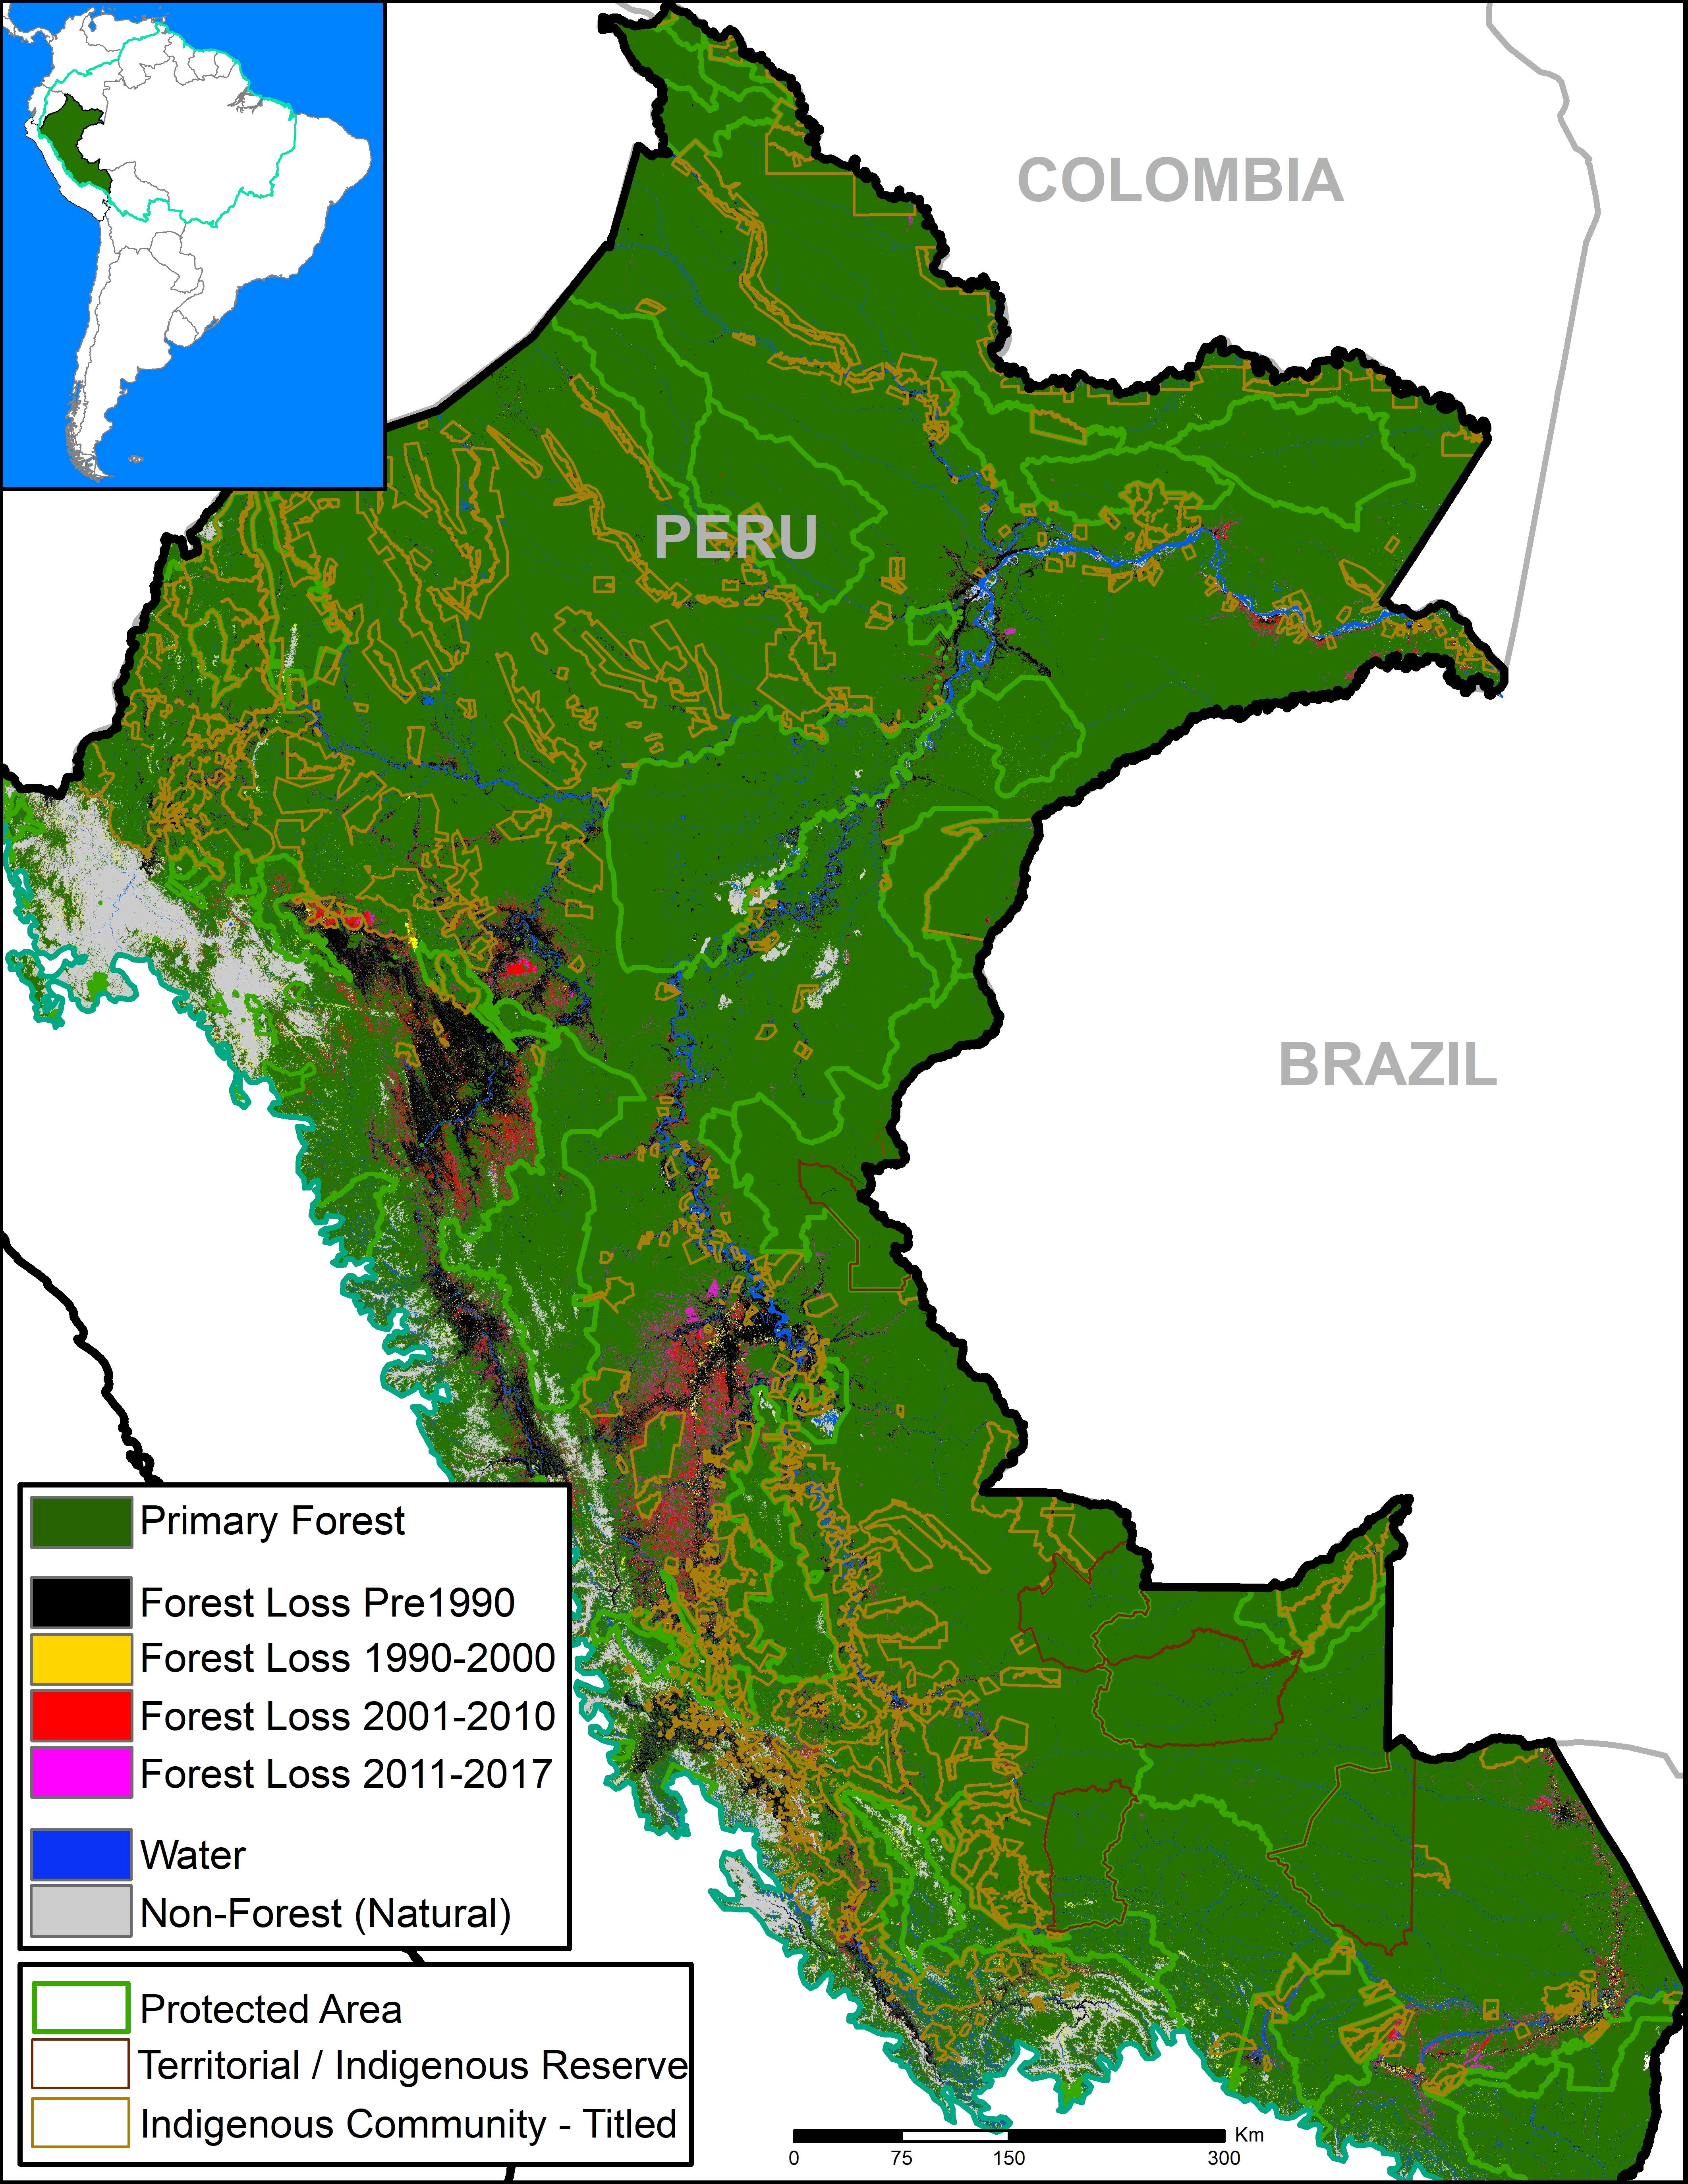
  • Drivers. We present an initial deforestation drivers map for the Peruvian Amazon. Analyzing high-resolution satellite imagery, we have documented six major drivers of deforestation and degradation: small/medium-scale agriculture, large-scale agriculture, cattle pasture, gold mining, illegal coca cultivation, and roads. Small-scale agriculture and cattle pasture are likely the most dominant drivers overall. Gold mining is a major driver in southern Peru. Large-scale agriculture and major new roads are latent threats. Logging roads are likely a major source of forest degradation in central Peru.

Deforestation Trends

Image 1 shows forest loss trends in the Peruvian Amazon from 2001 to 2015, including a breakdown of the size of the forest loss events. This includes the official data from the Peruvian Environment Ministry, except for 2016, which is a preliminary estimate based on GLAD forest loss alerts.

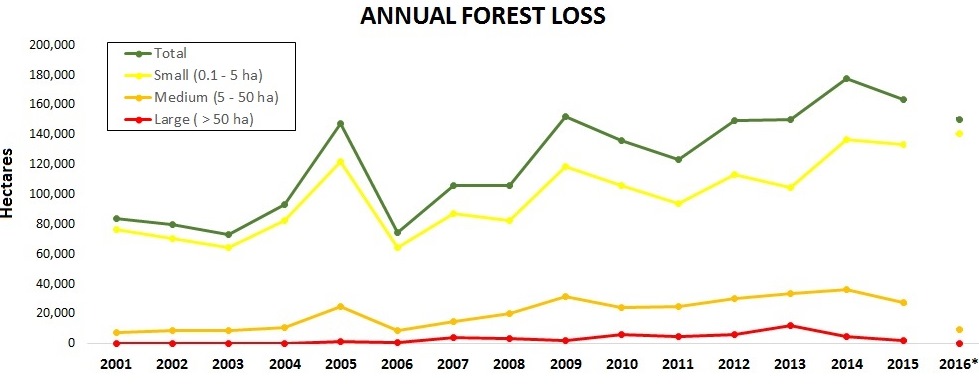
Image 1. Data: PNCB/MINAM, UMD/GLAD. *Estimate based on GLAD alerts.

During the 15 years between 2001 and 2015, around 4,448,000 acres (1,800,000 hectares) of Peruvian Amazon forest has been cleared (see green line). This represents a loss of approximately 2.5% of the existing forest as of 2001.There have been peaks in 2005, 2009, and 2014, with an overall increasing trend. In fact, 2014 had the highest annual forest loss on record (386,626 acres). Forest loss decreased in 2015 (386,732 acres), but is still the second highest recorded. The preliminary estimate for 2016 indicates that forest loss continues to be relatively high.

It is important to note that the data include natural forest loss events (such as storms, landslides, and river meanders), but overall serves as our best proxy for anthropogenic deforestation. The non-anthropogenic forest loss is estimated to be approximately 3.5% of the total.1

The vast majority (81%) of forest loss events in the Peruvian Amazon are small-scale (<5 hectares, equivalent of 12 acres), see the yellow line. Around 16% of the forest loss events are medium-scale (5-50 hectares, equivalent of 12-124 acres), see the orange line. Large-scale (>50 hectares, equivalent of 124 acres) forest loss events, often associated with industrial agriculture, pose a latent threat. Although the average is only 2%, large-scale forest loss rapidly spiked to 8% in 2013 due to activities linked with a pair of new oil palm and cacao plantations. See MAAP #32 for more details on the patterns of sizes of deforestation events.

Deforestation Patterns

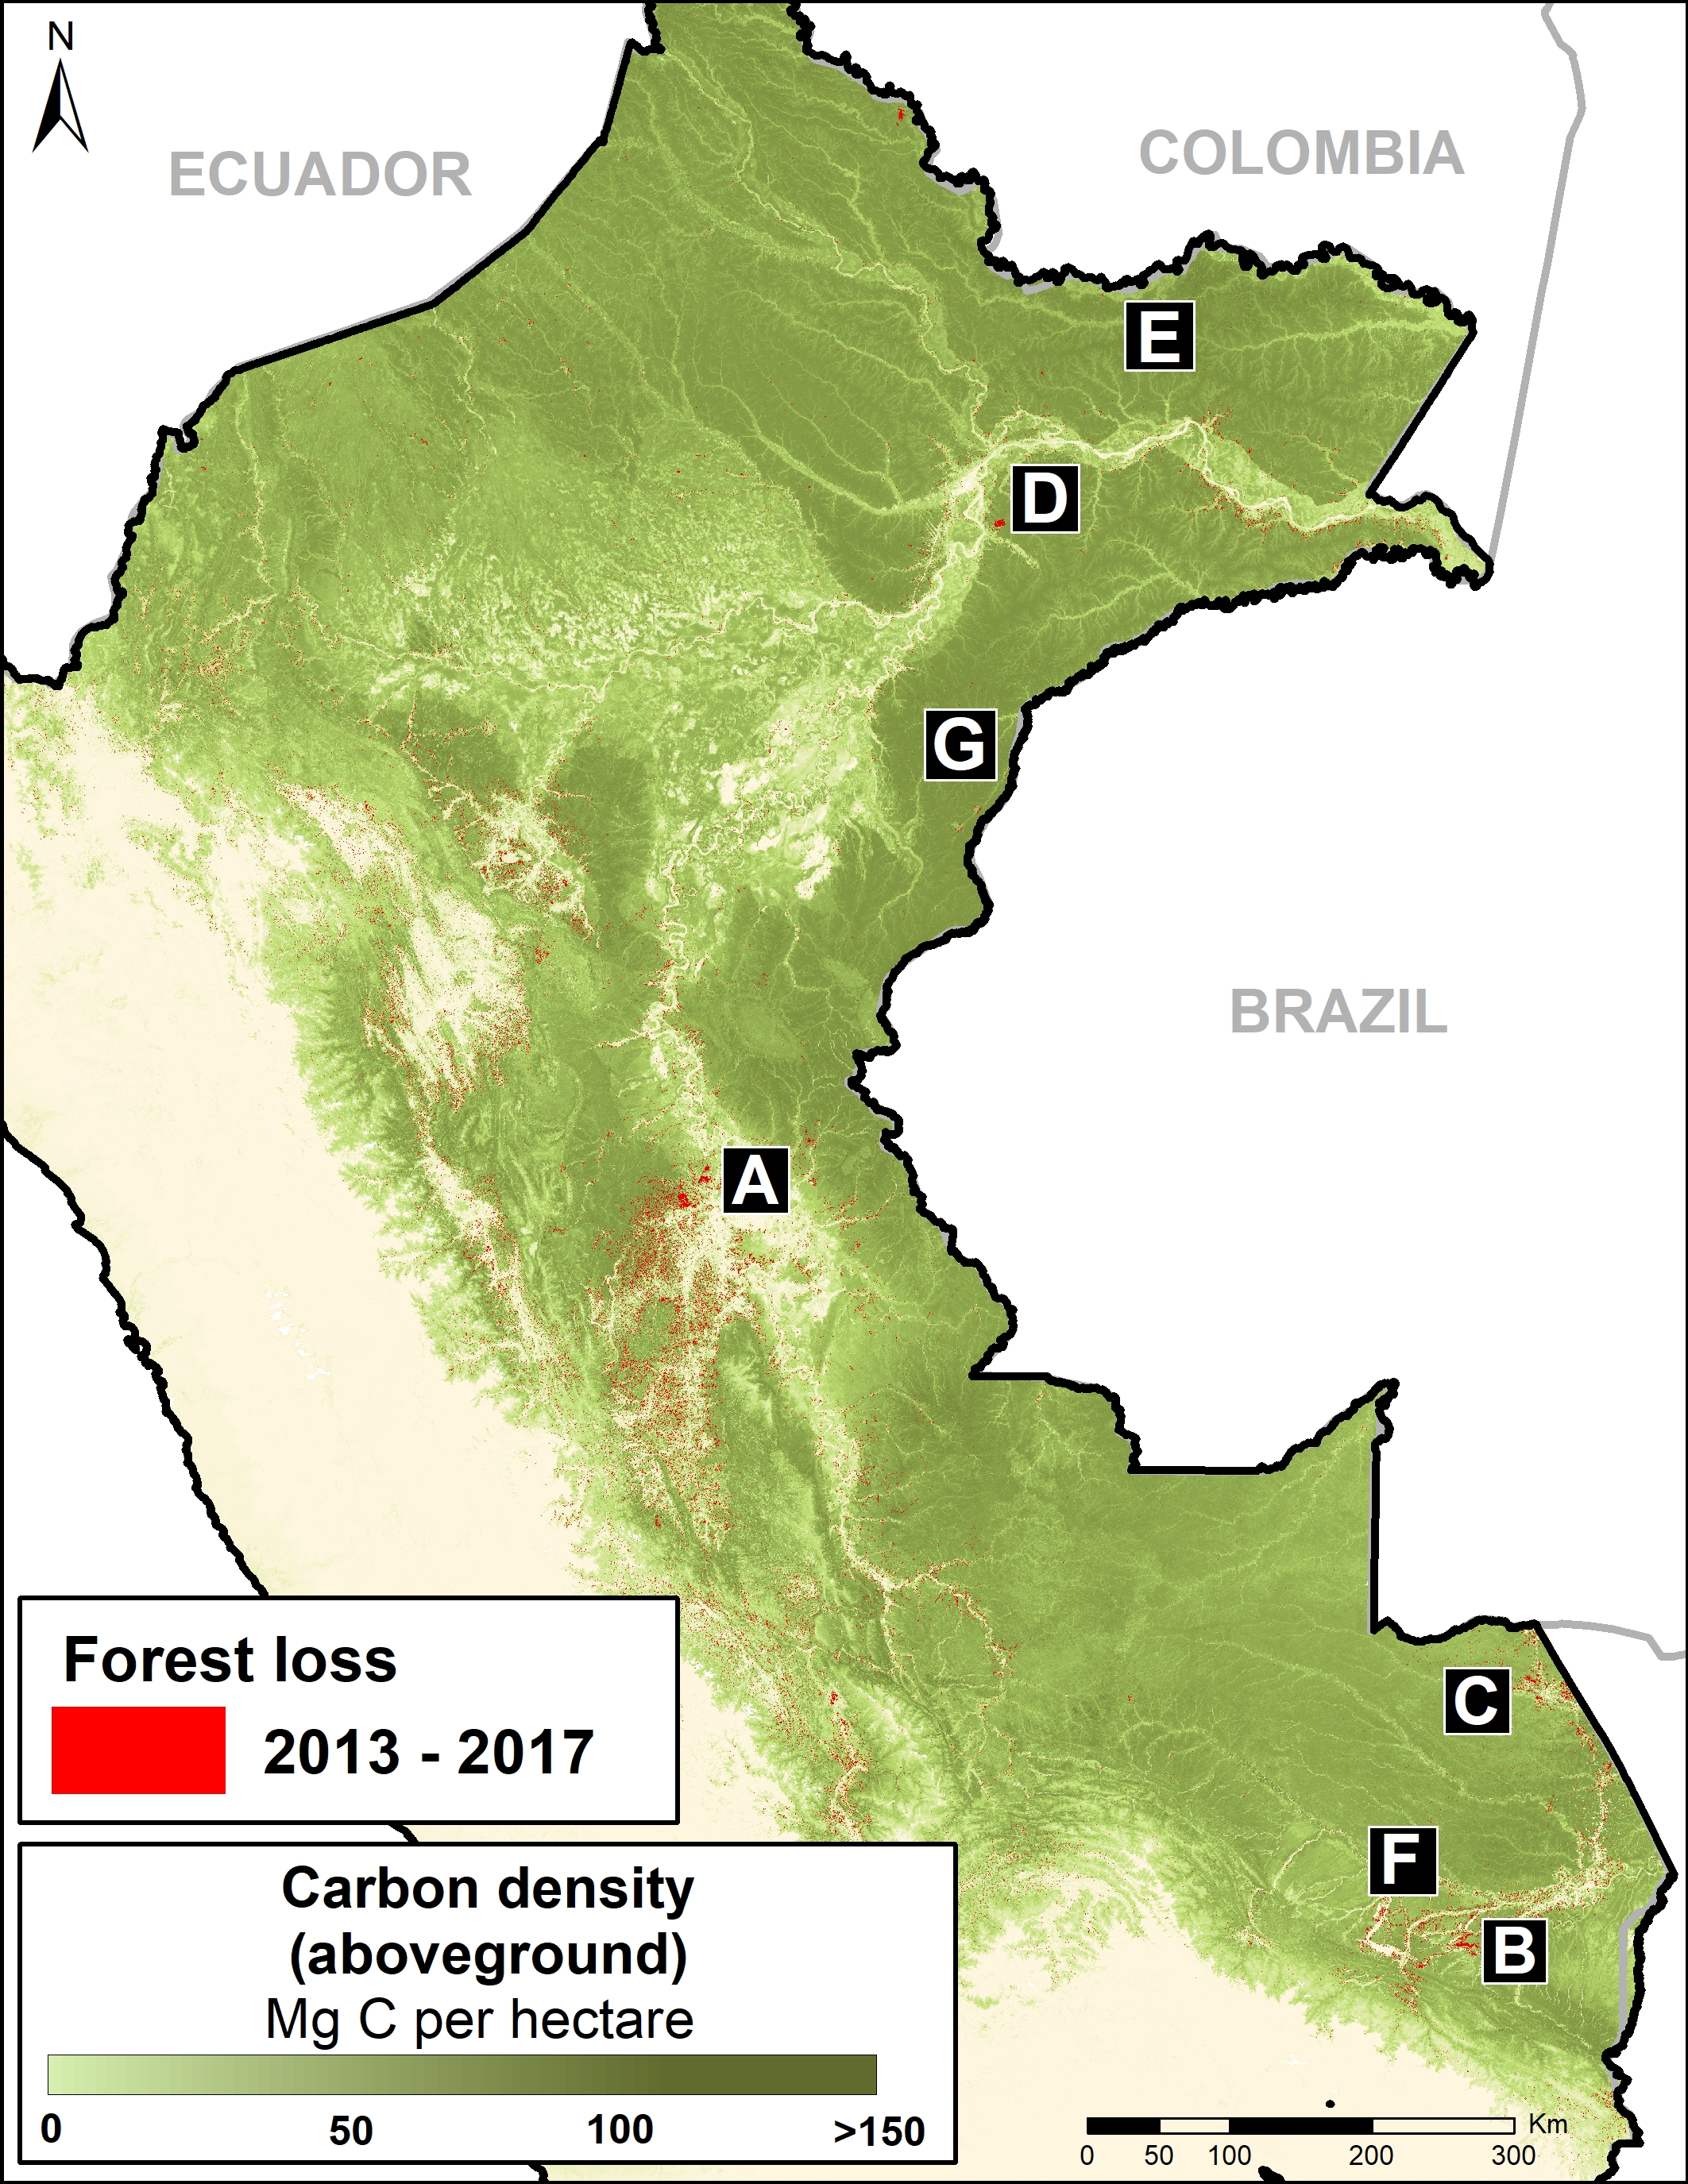
Image 2 shows the major deforestation hotspots in 2012-14 (left panel) relative to 2015-16 (right panel), based on a kernel density analysis.We have identified at least 8 major deforestation hotspots, labeled as Hotspots A-H.

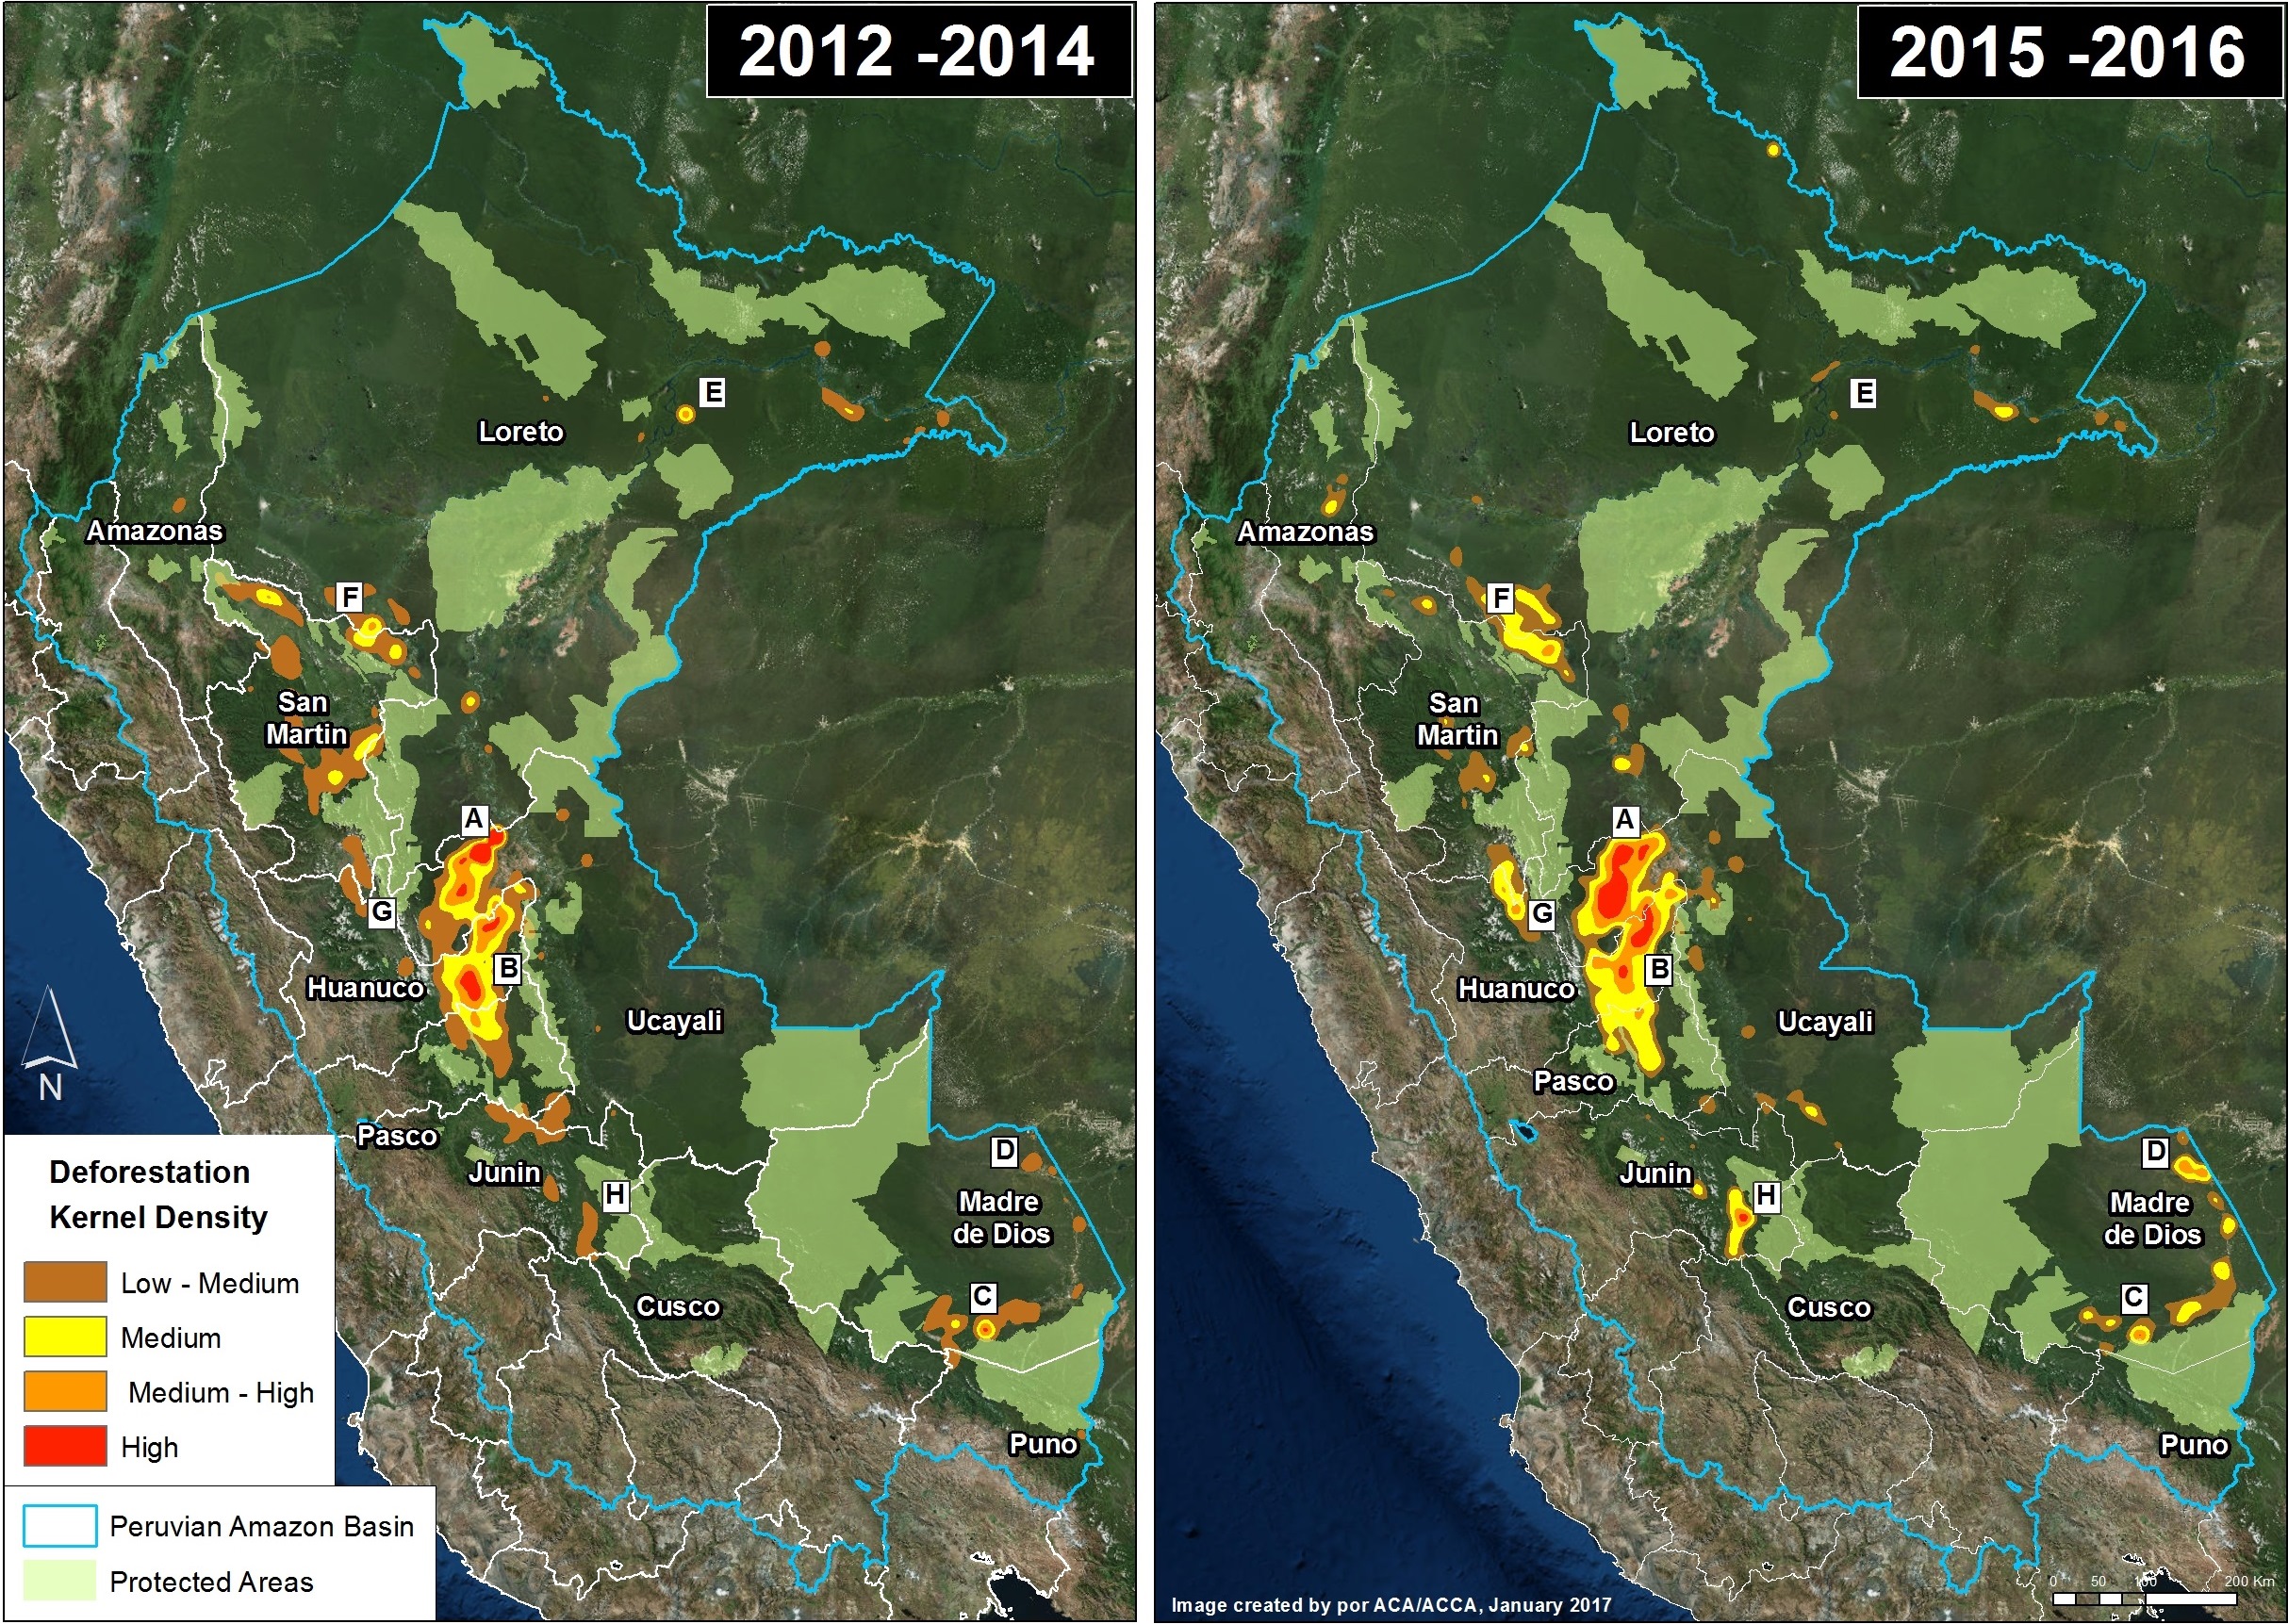
Image 2. Data: PNCB/MINAM, GLAD/UMD. Click to enlarge.

The most intense hotspots, A and B, are located in the central Amazon. Hotspot A, in northwest Ucayali, was dominated by two large-scale oil palm projects in 2012-14, but then shifted a bit to the west in 2015-16, where it was dominated by cattle pasture and small-scale oil palm. Hotspot B, in eastern Huánuco, is dominated by cattle pasture (MAAP #26).

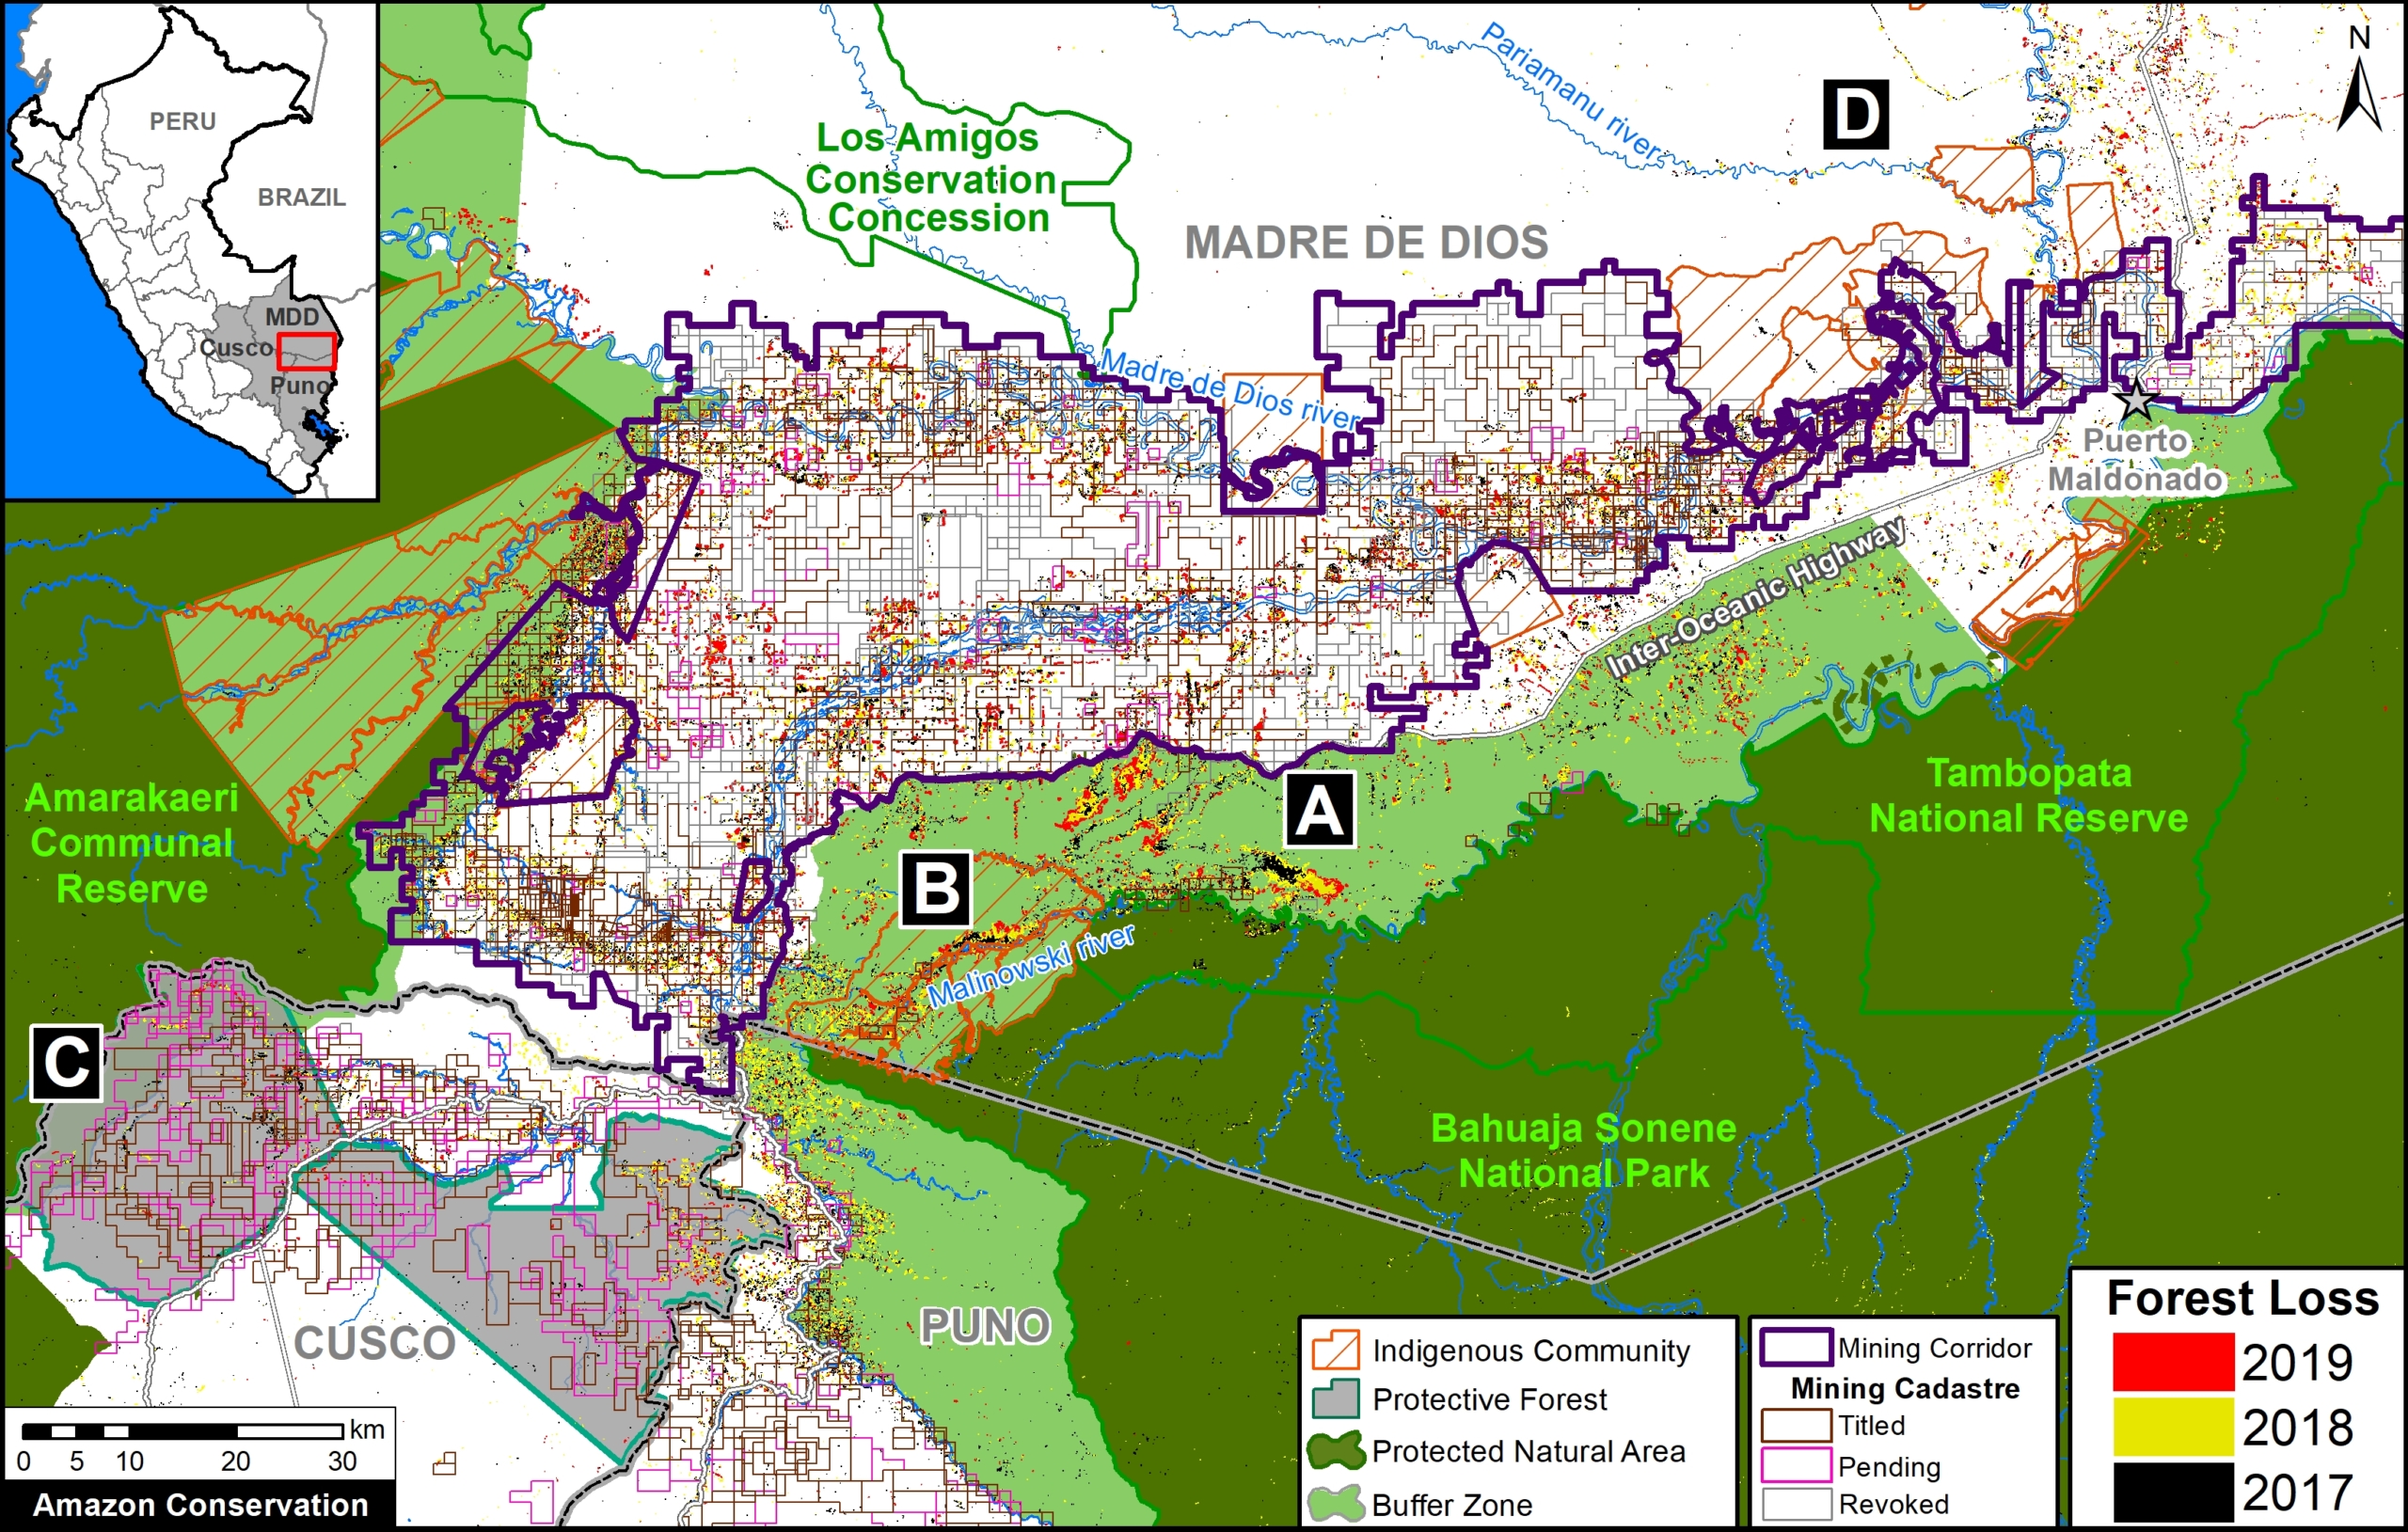
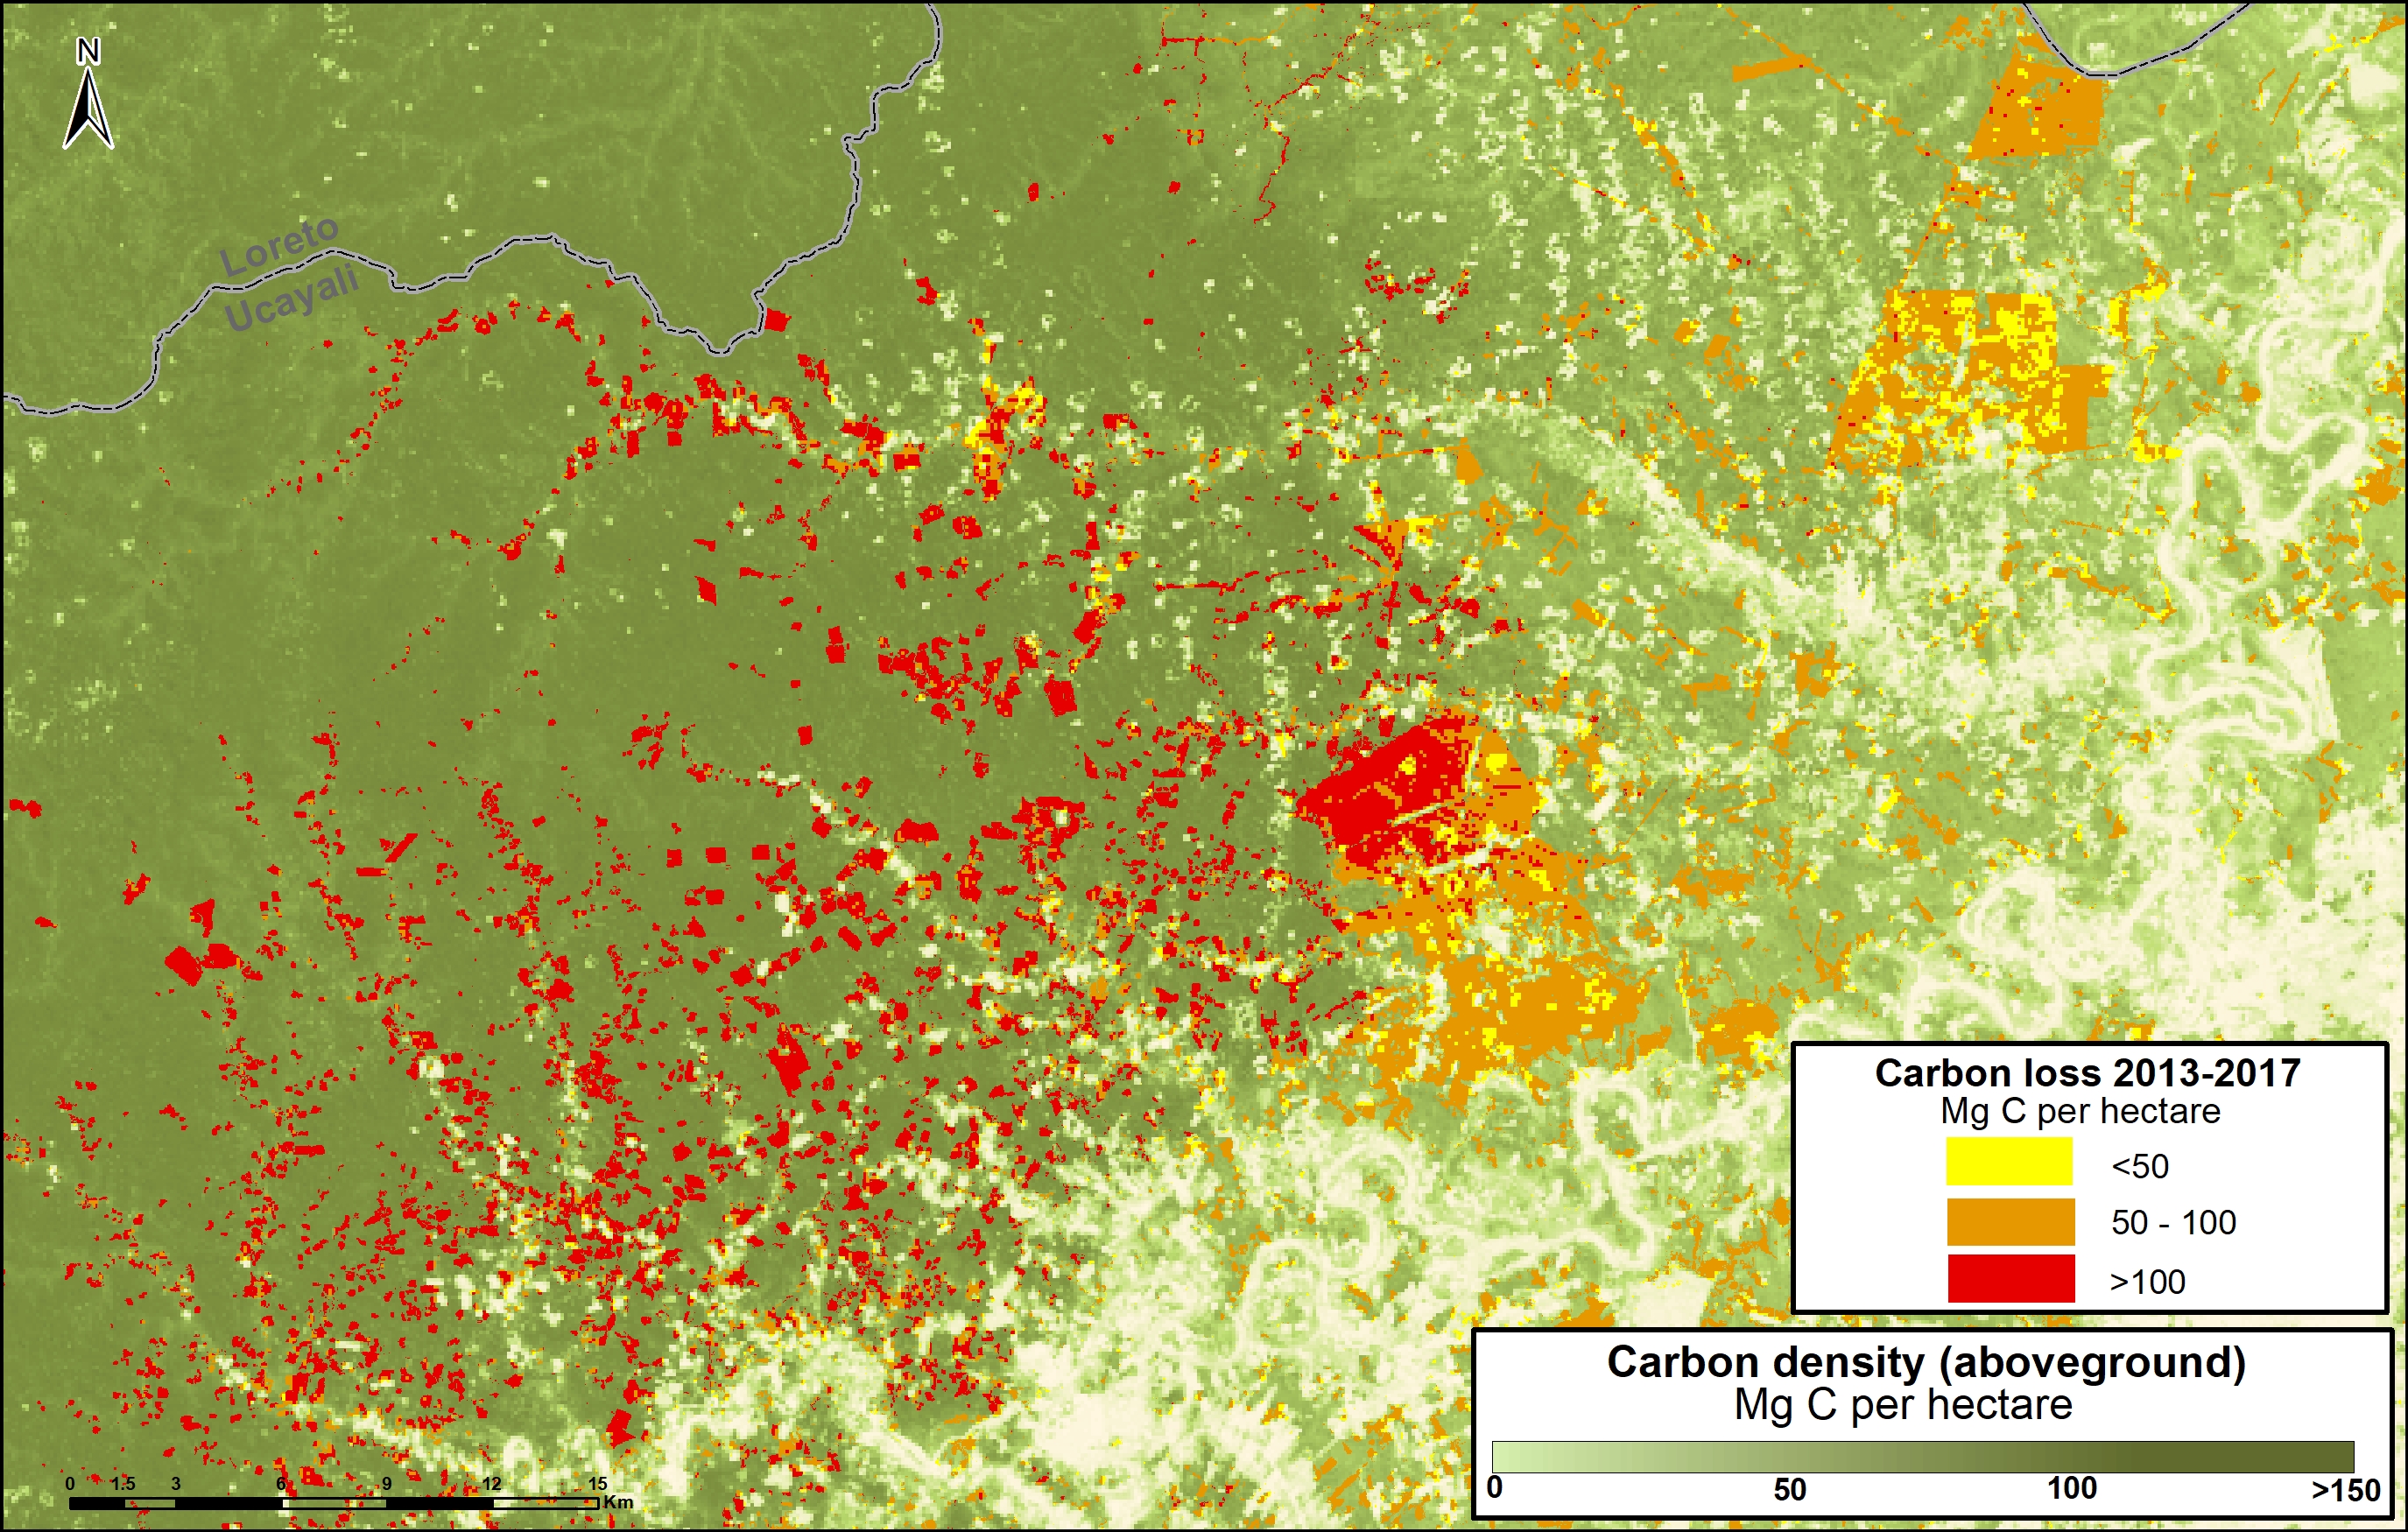
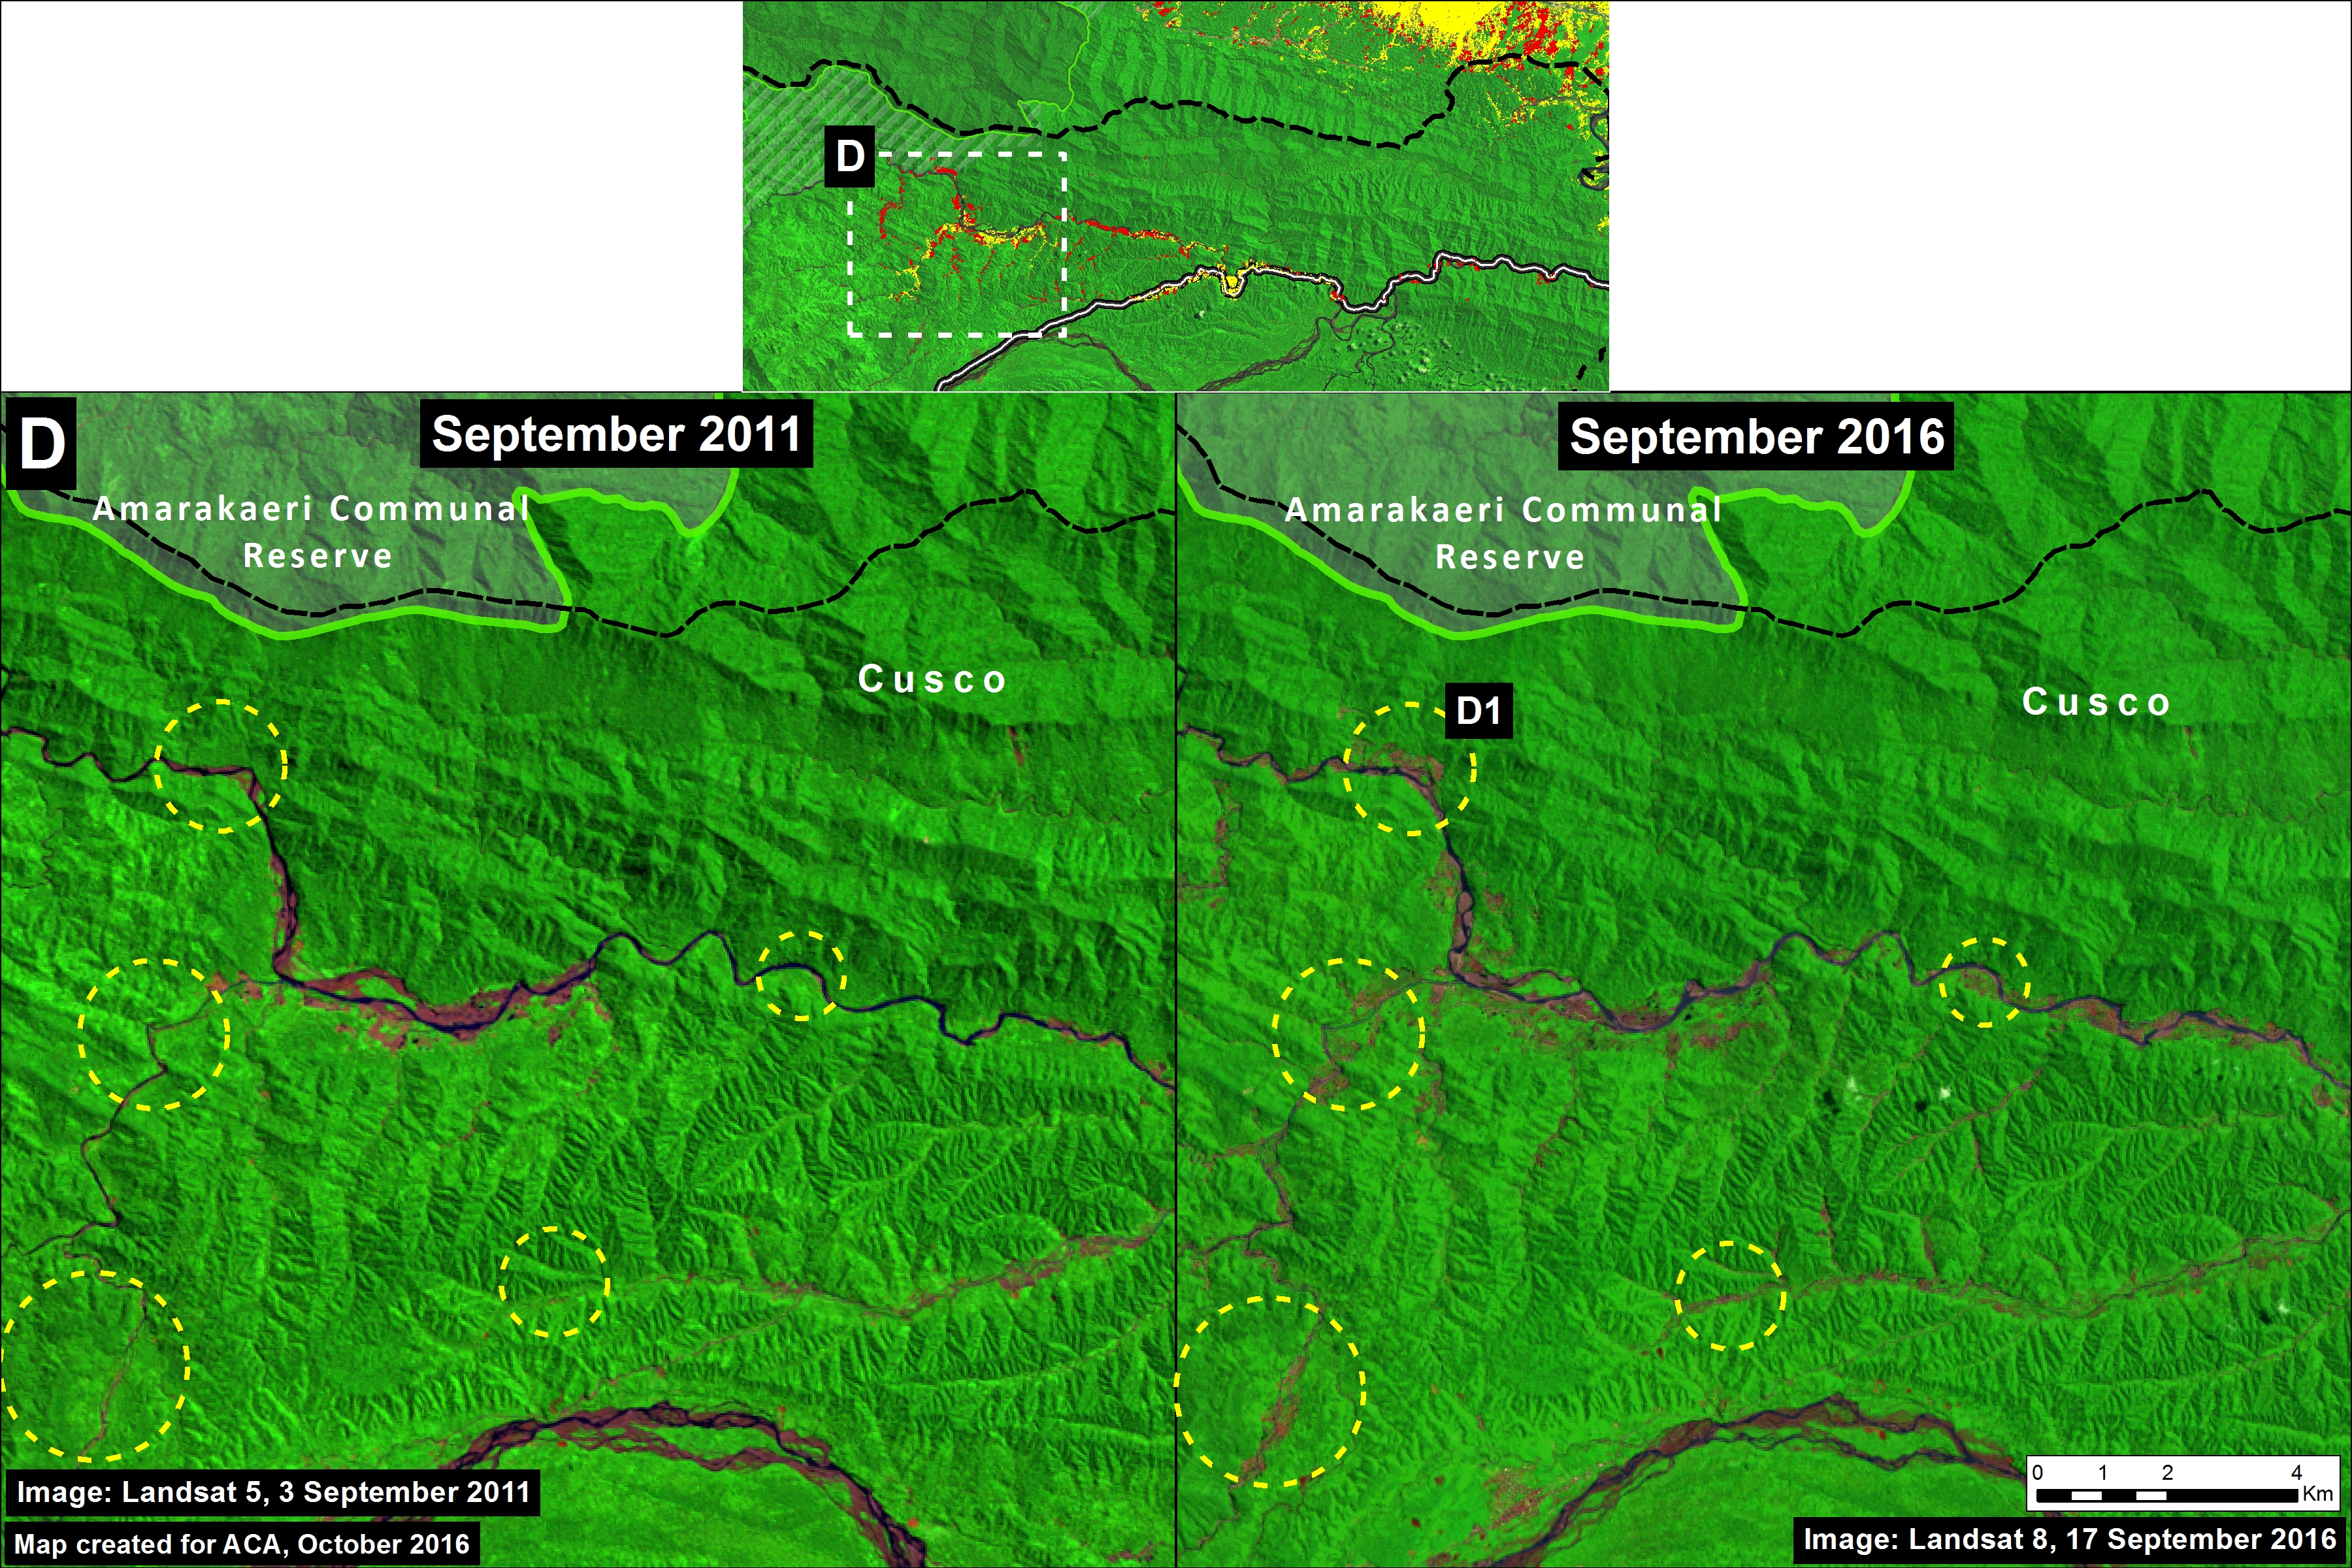
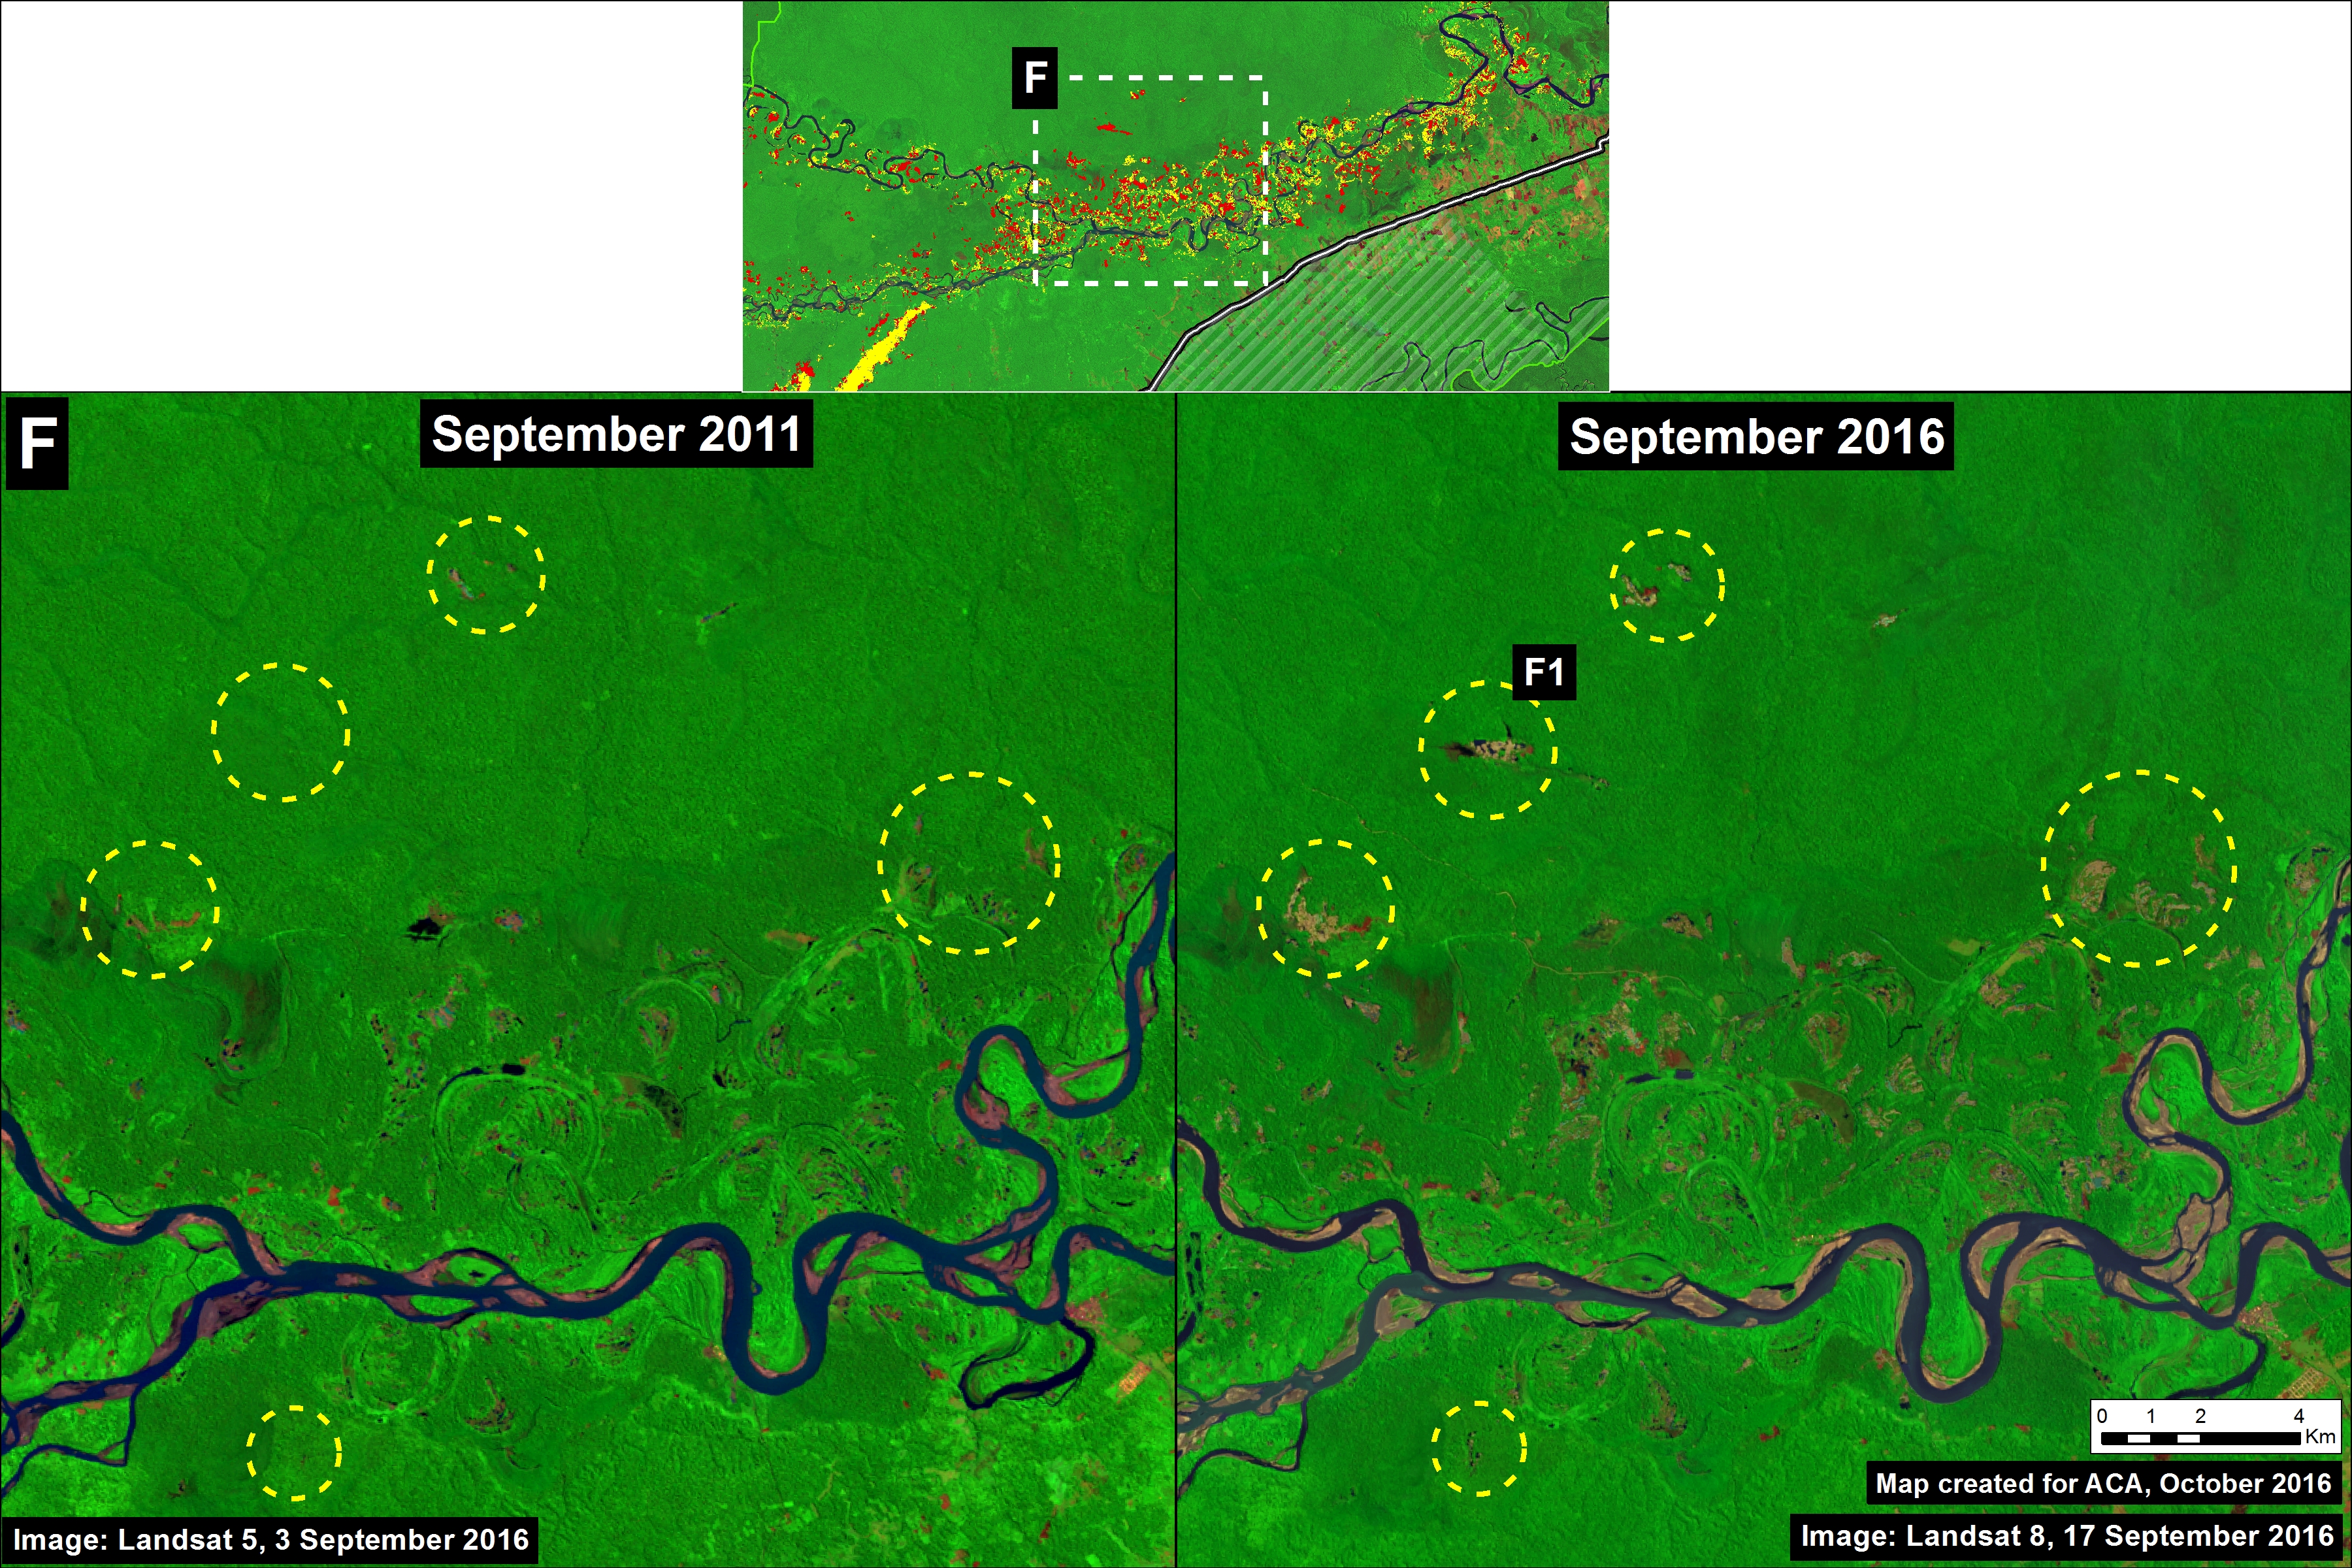
Hotspots C and D are in the Madre de Dios region in the southern Amazon. Hotspot C indicates the primary illegal gold mining front in recent years (MAAP #50). Hotspot D highlights the emerging deforestation zone along the Interoceanic Highway, particularly around the town of Iberia (MAAP #28).

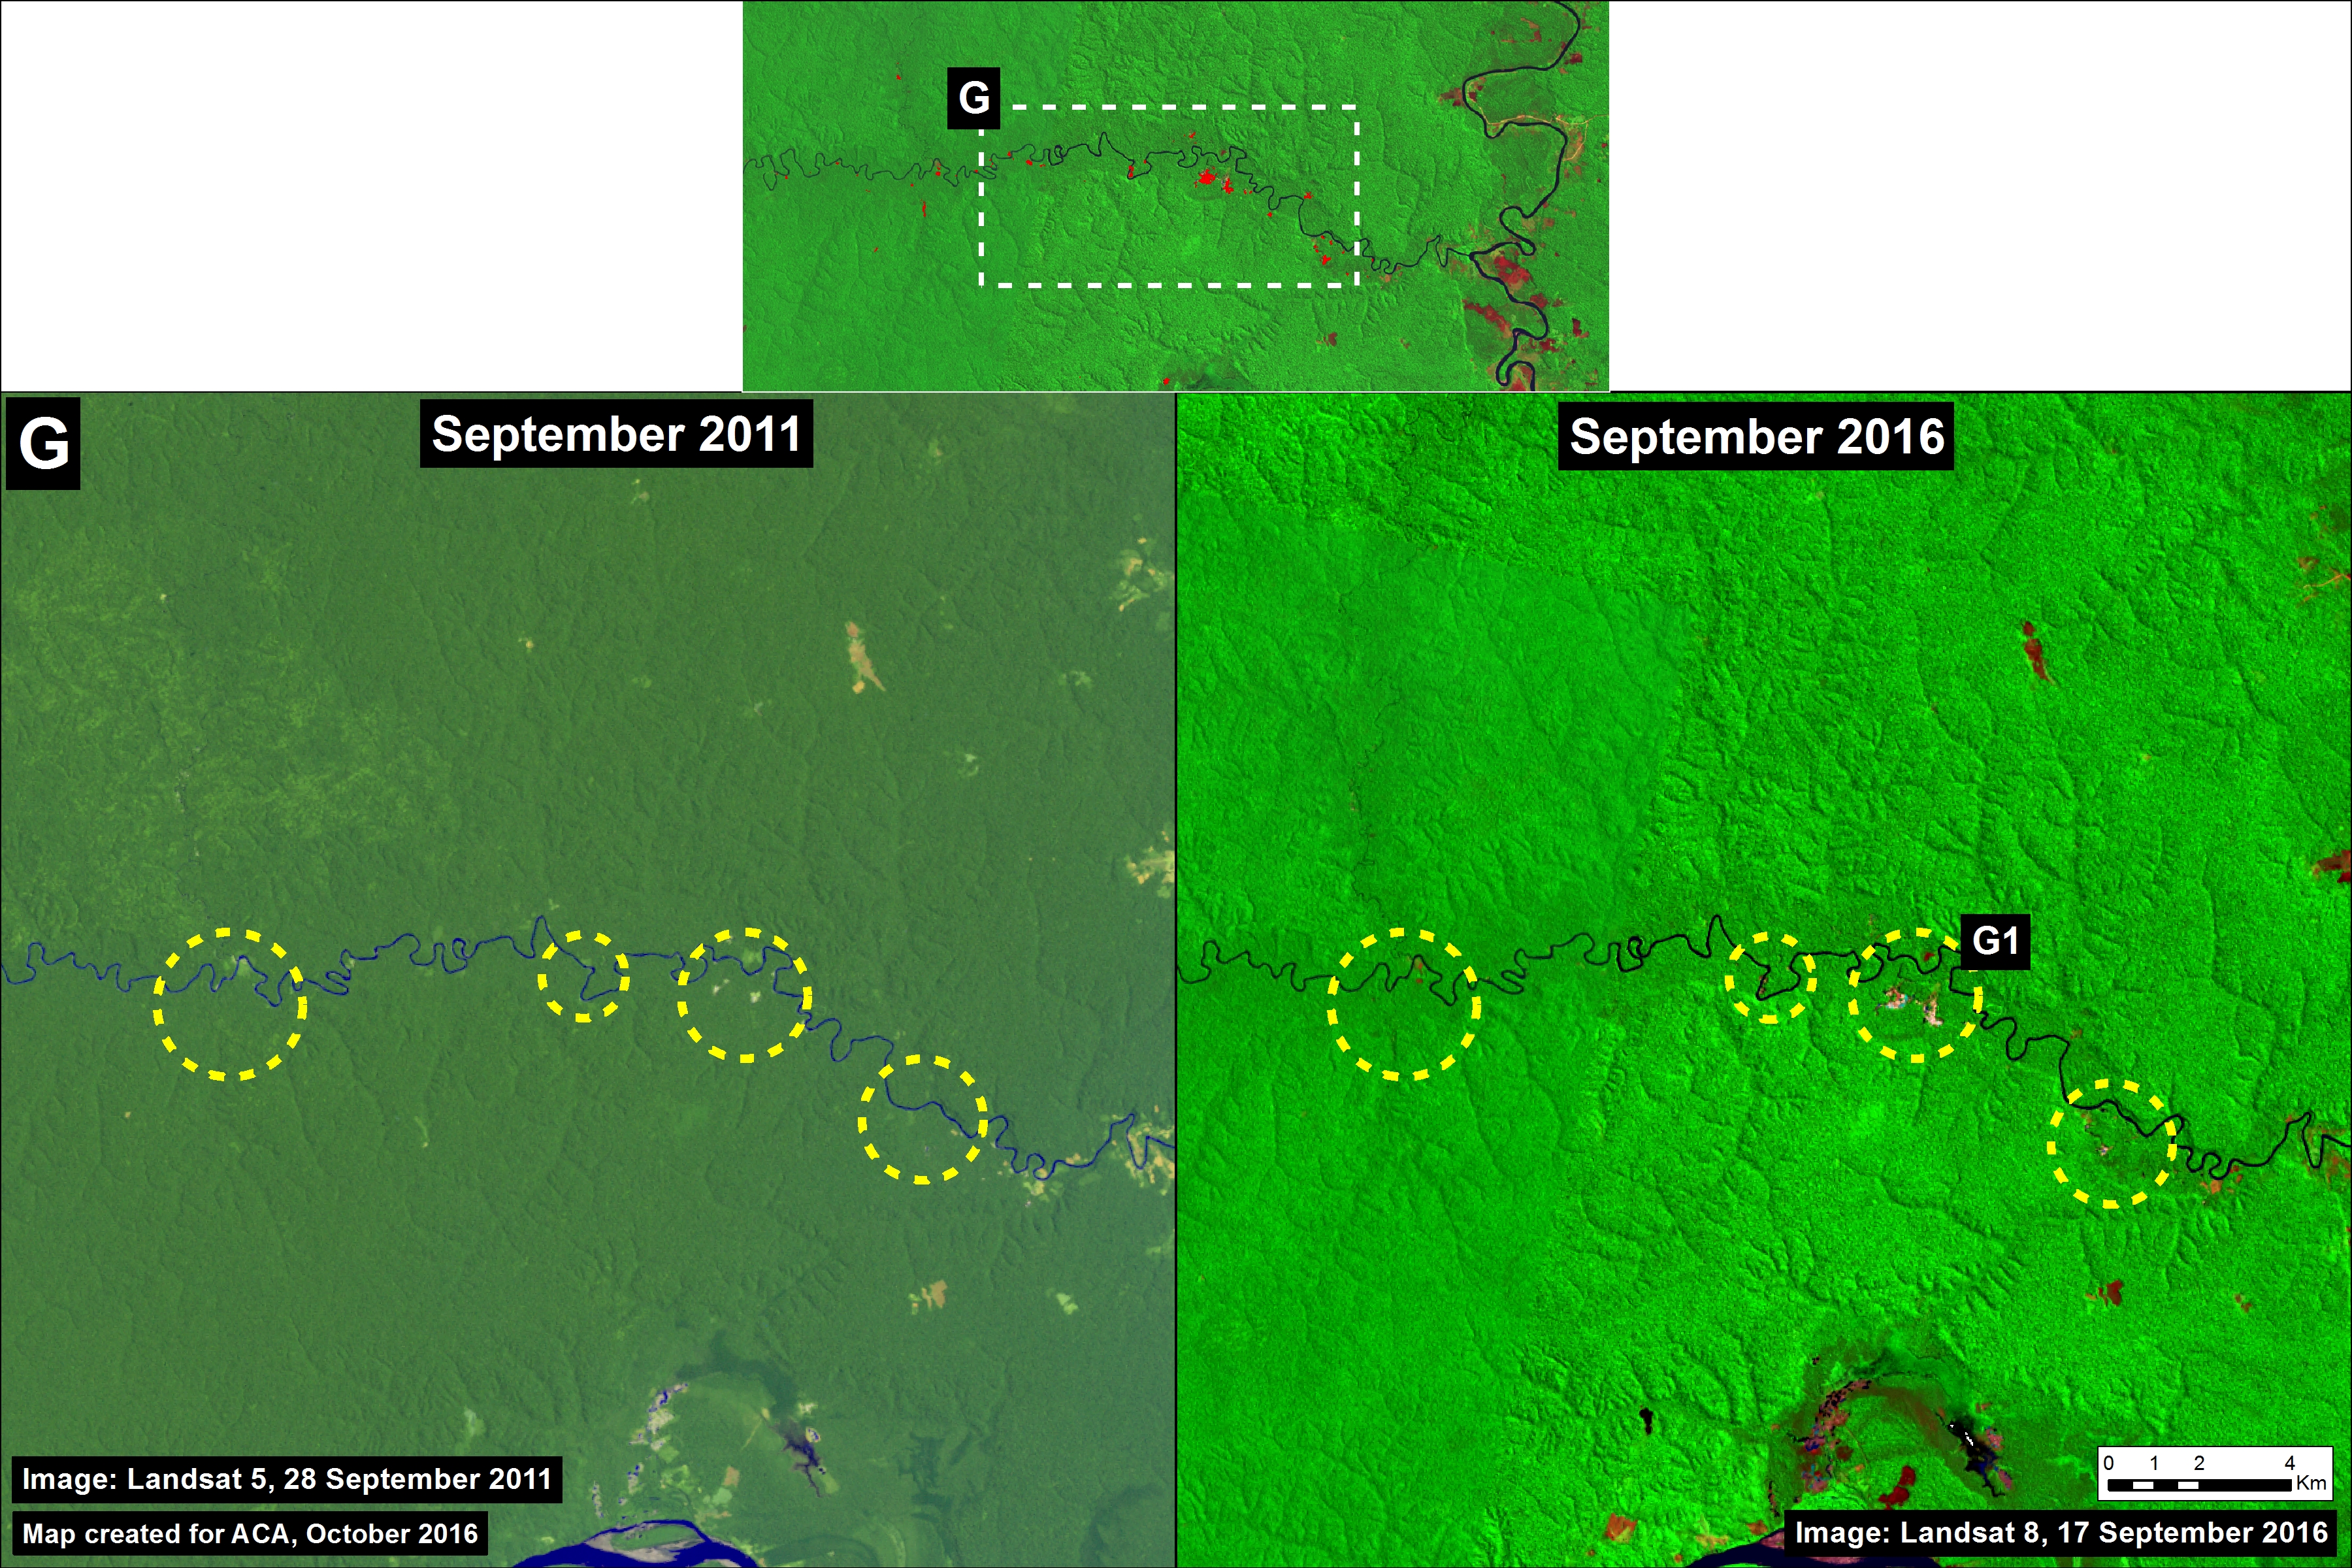
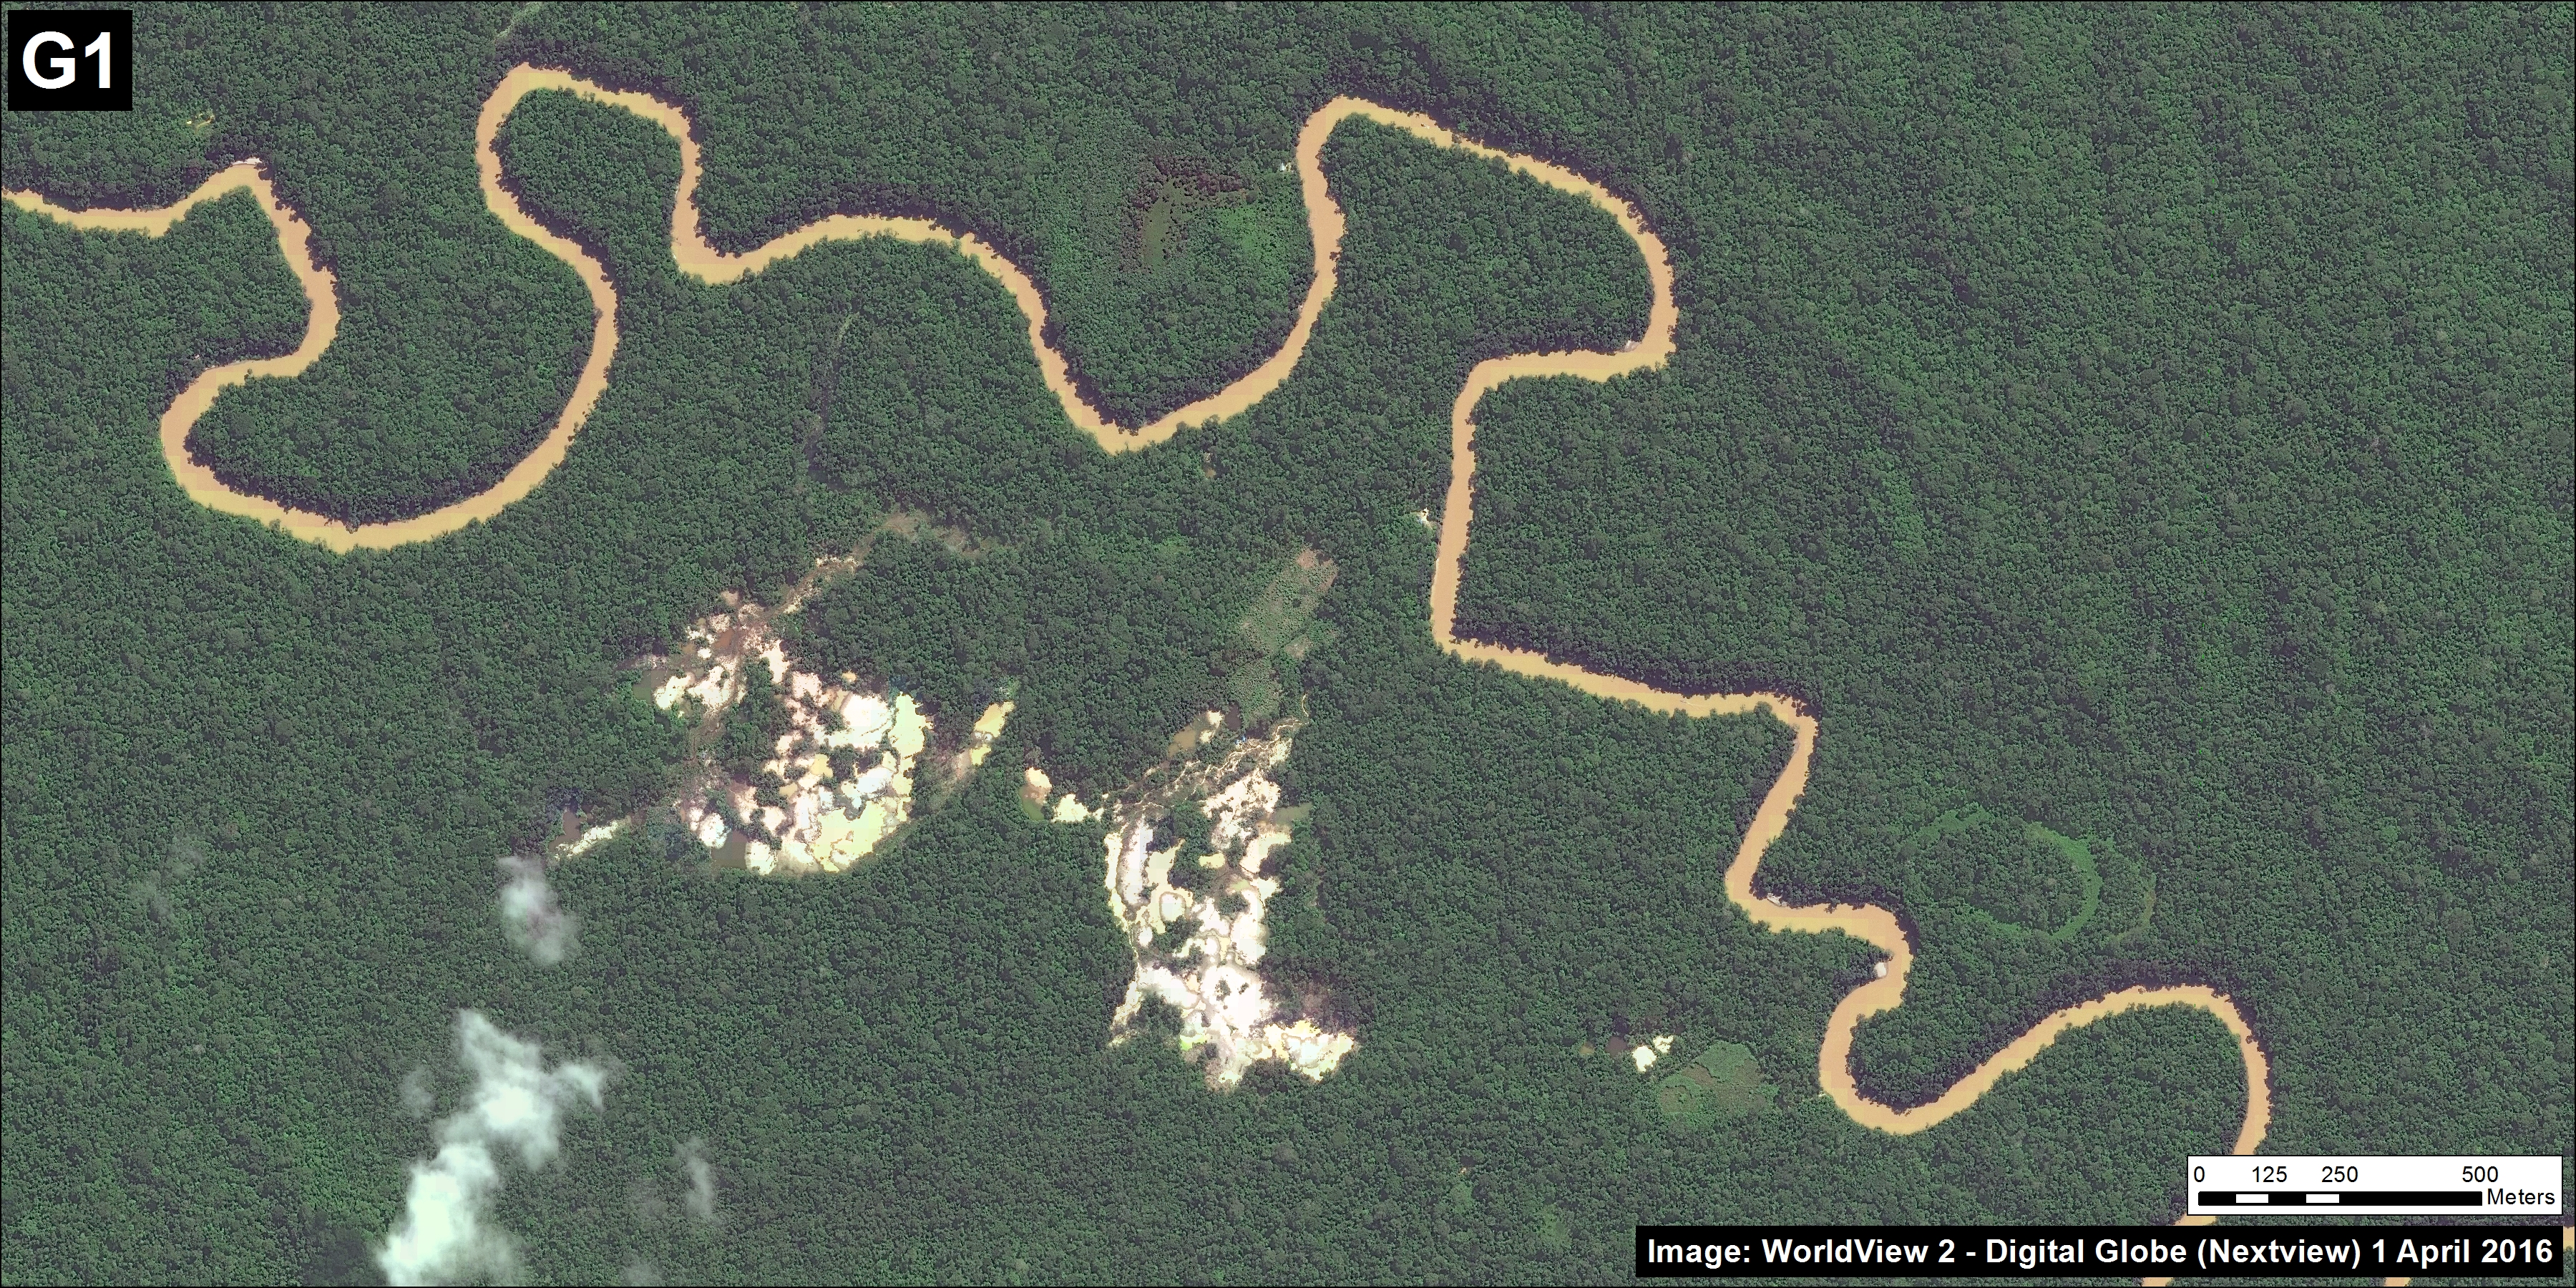
Hotspots E-H are agriculture related. Hotspot E indicates the rapid deforestation for a large-scale cacao plantation in 2013-14, with a sharp decrease in forest loss 2015-16 (MAAP #35). Hotspot F indicates the expanding deforestation around two large-scale oil palm plantation (MAAP #41). Hotspot G indicates the intensifying deforestation for small-scale oil palm plantations (MAAP #48).

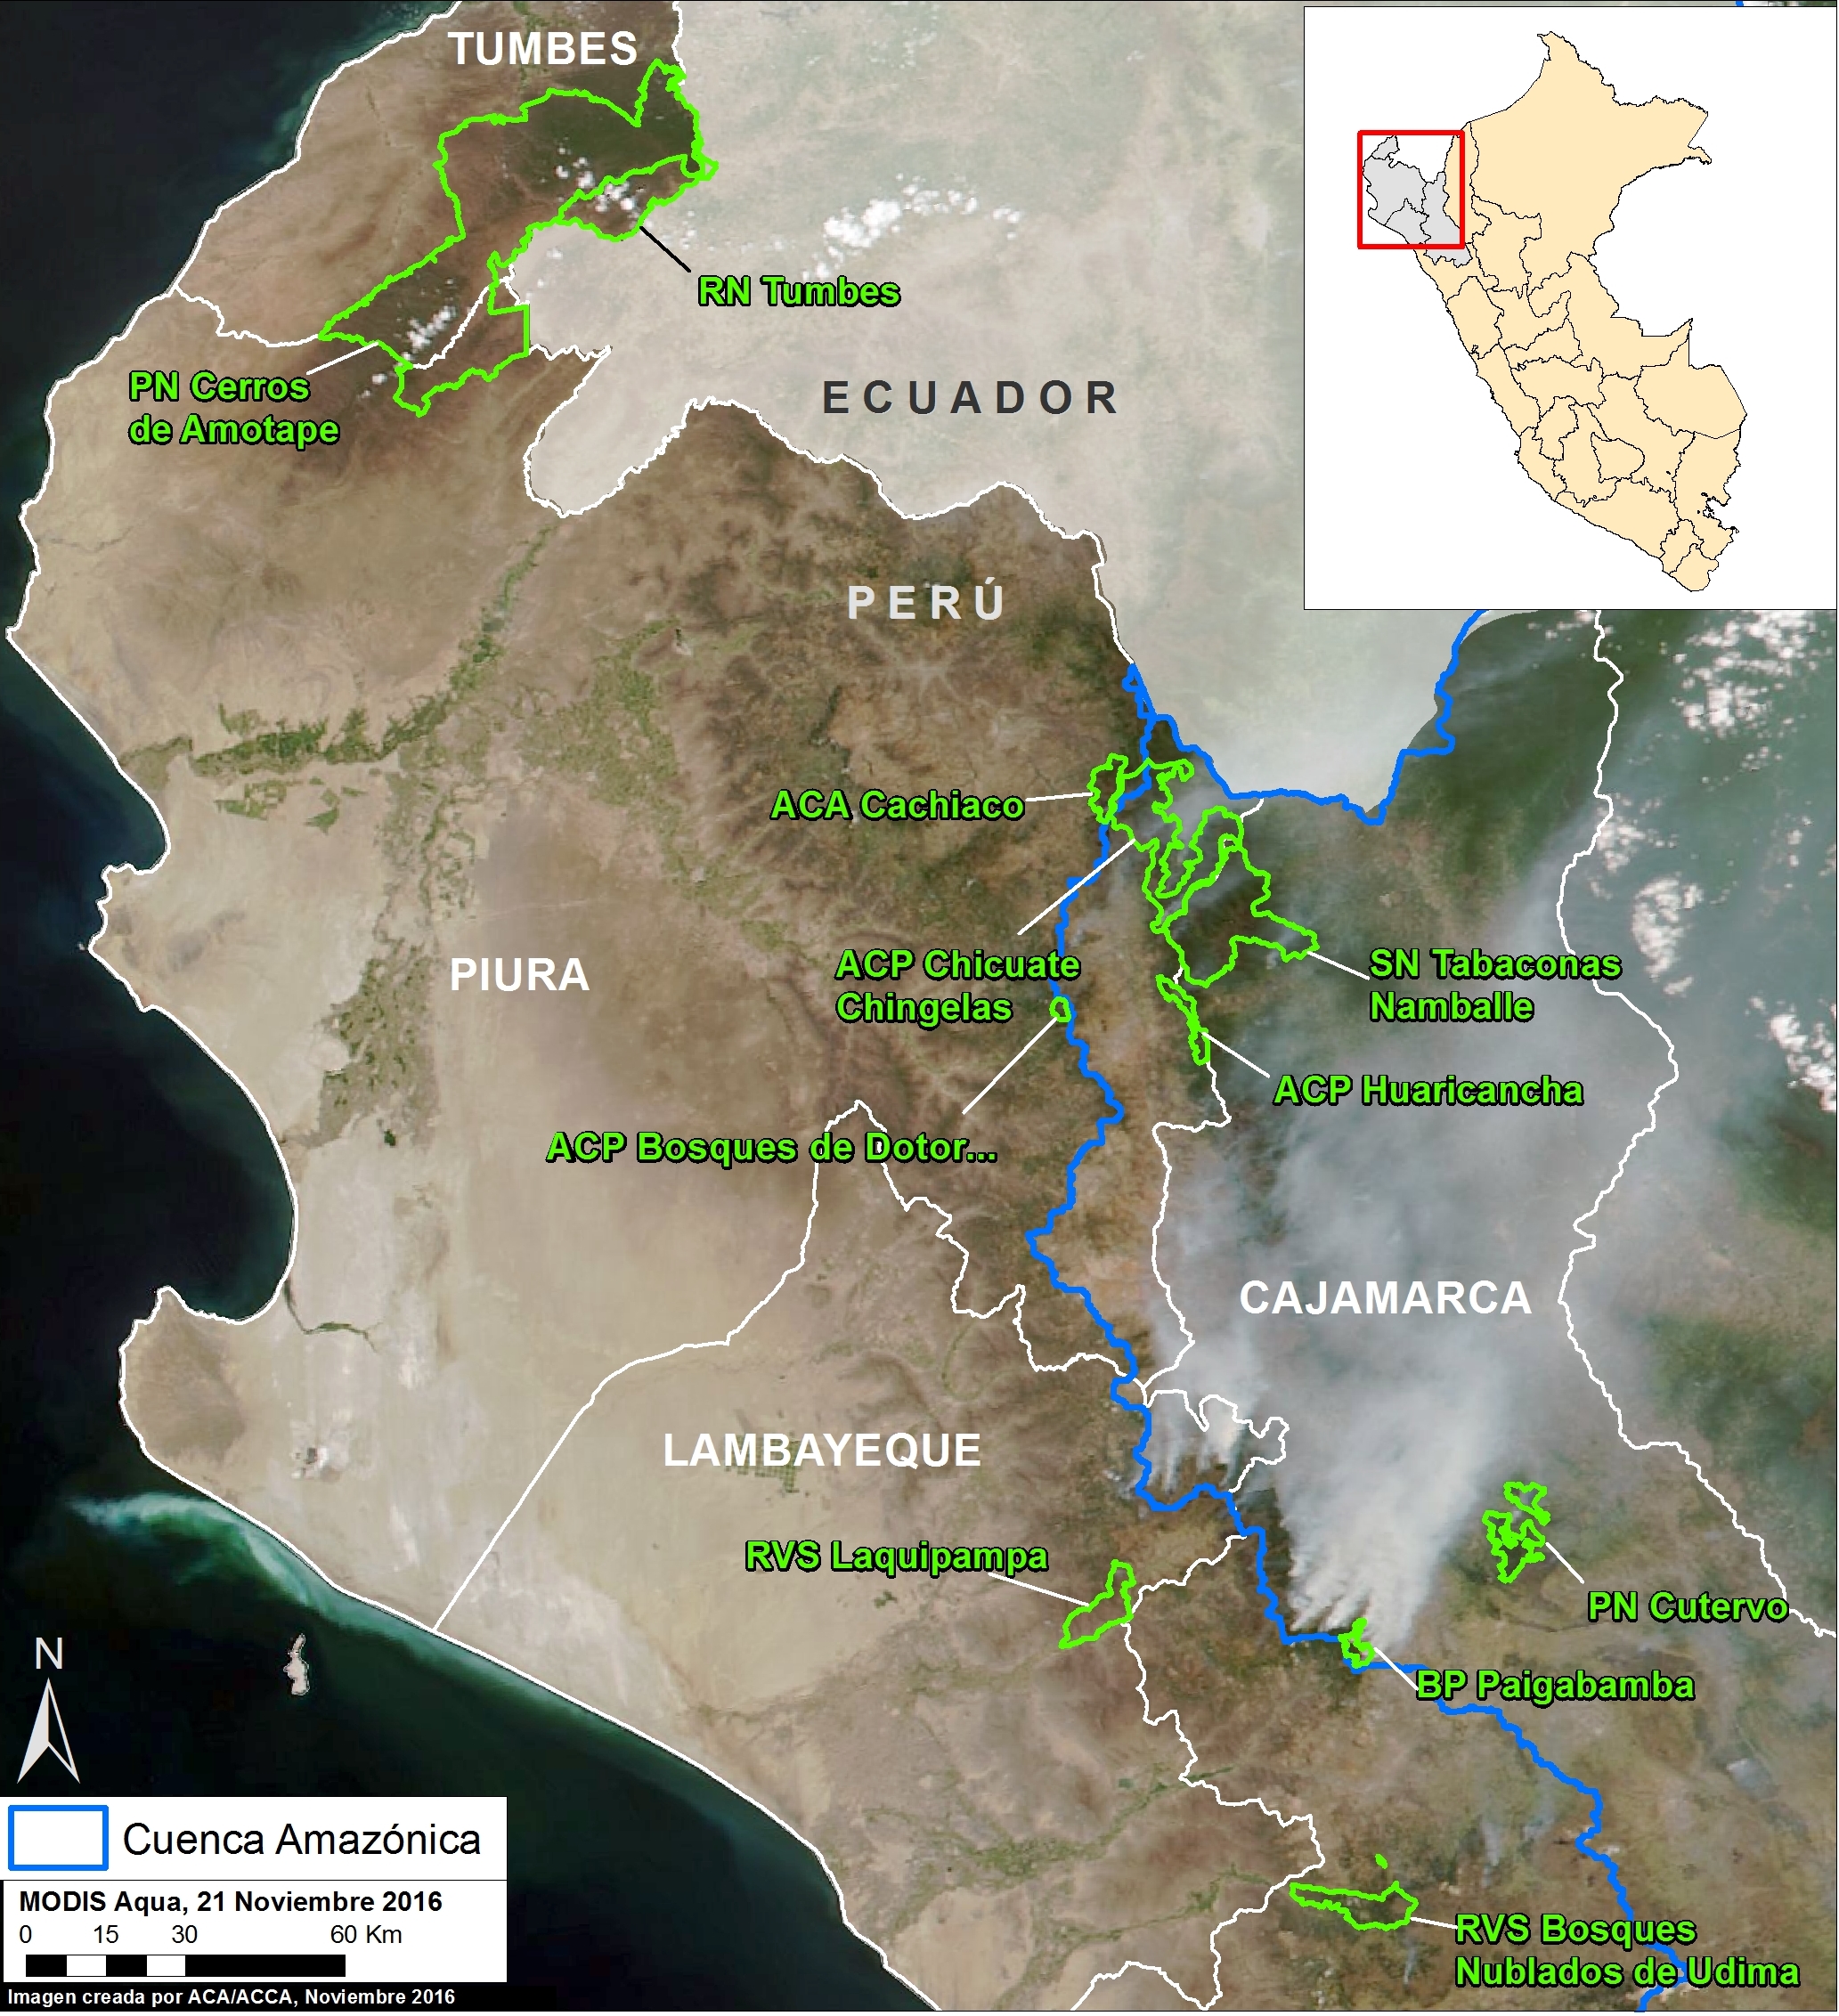
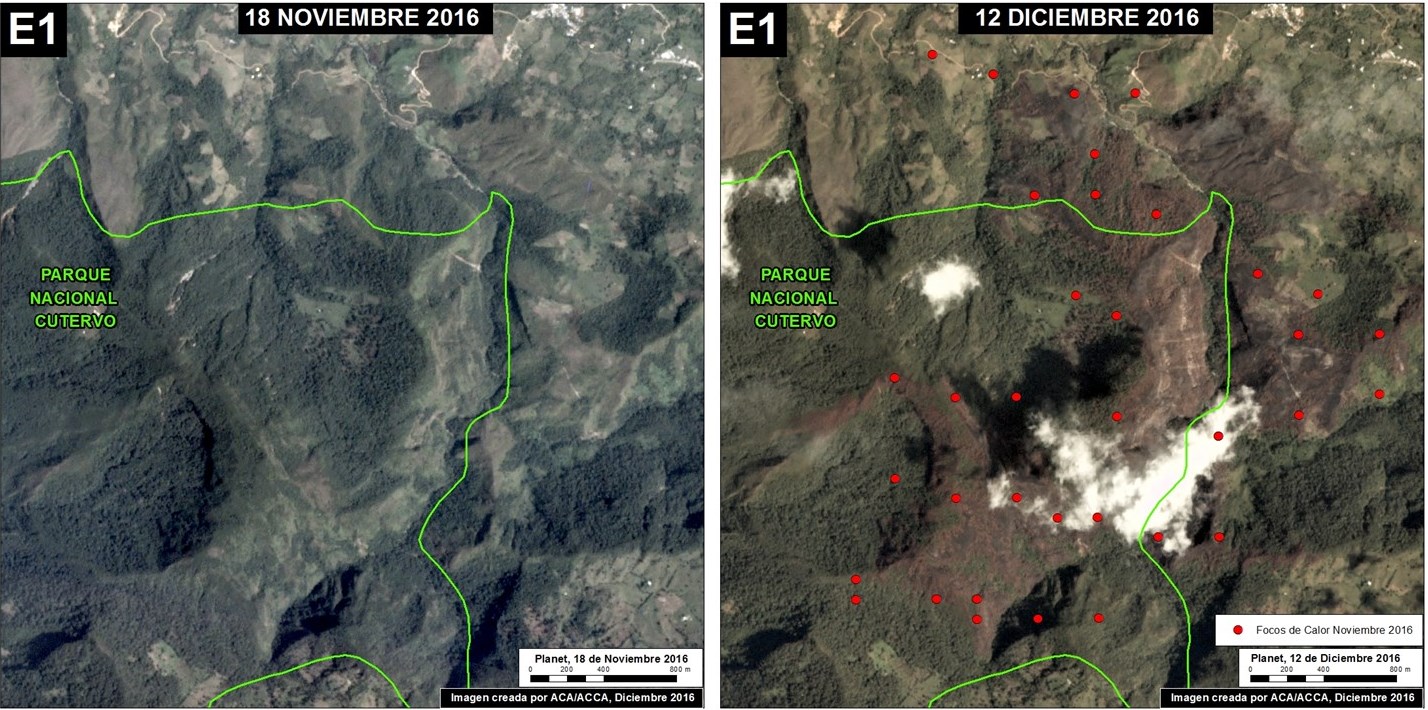
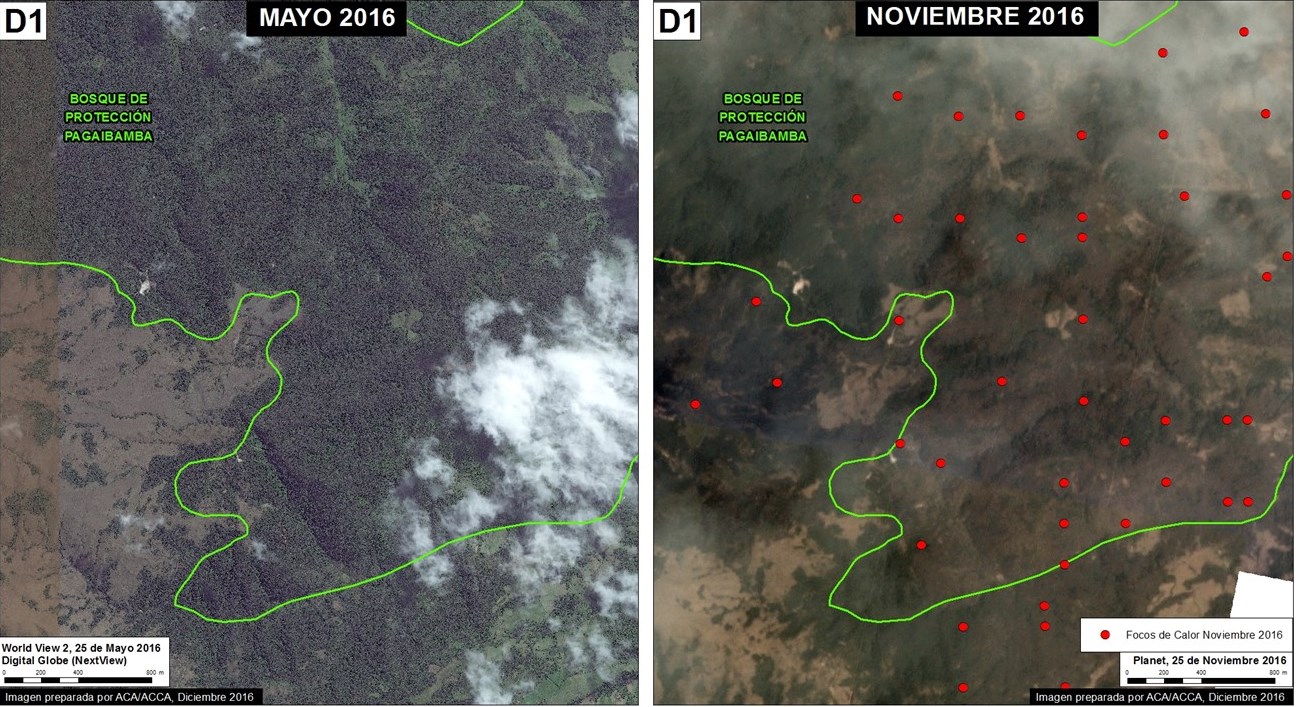
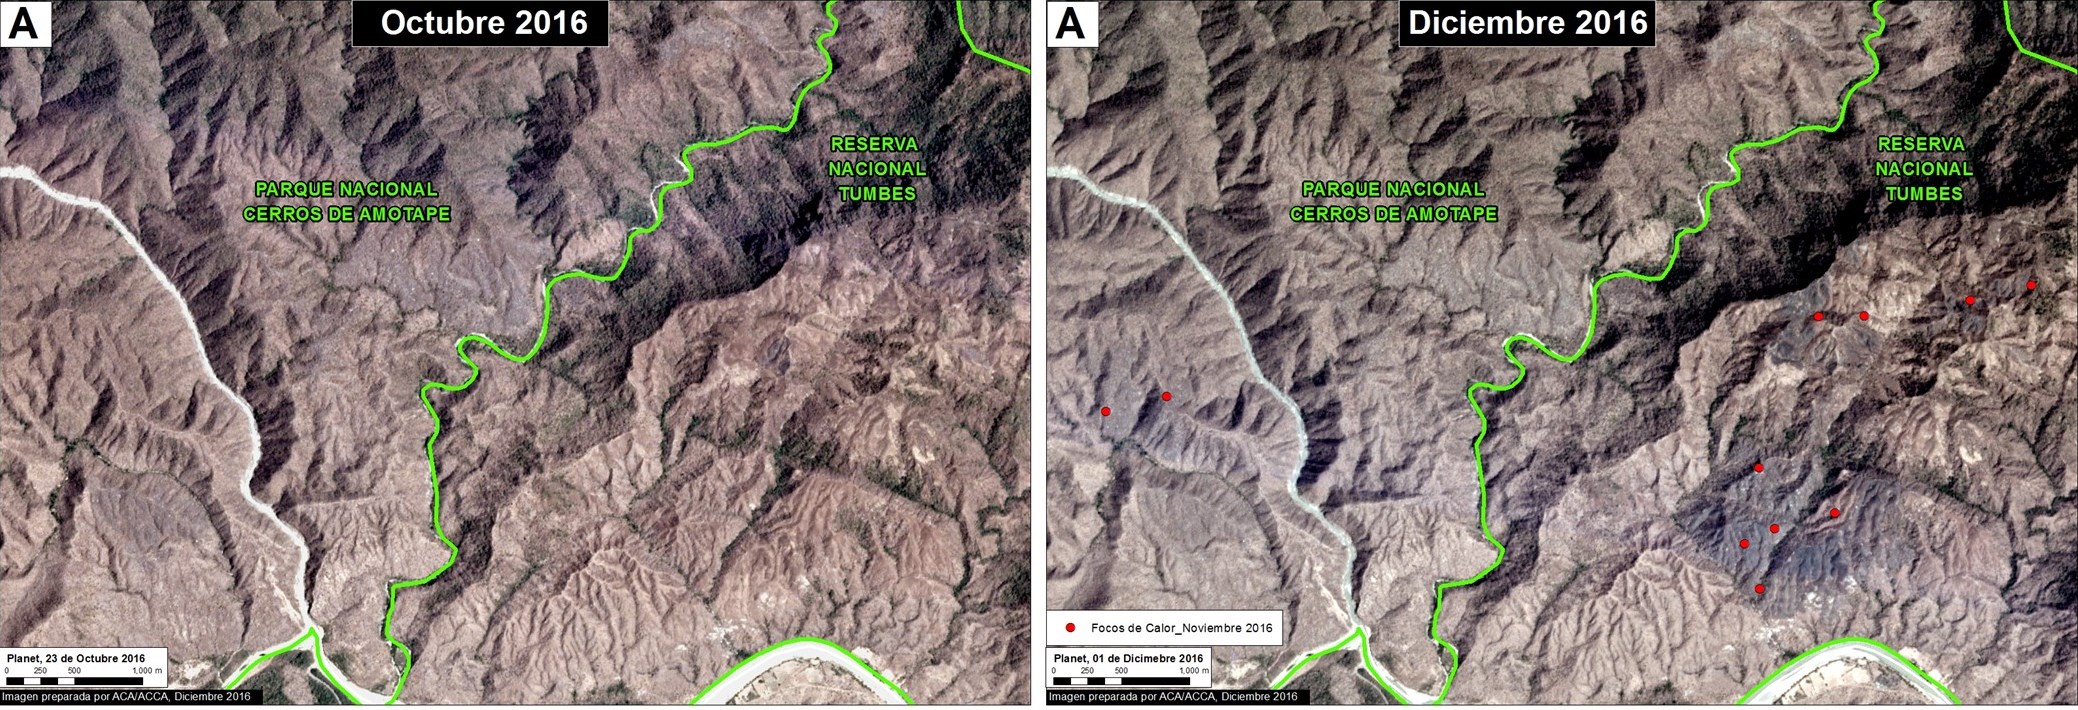
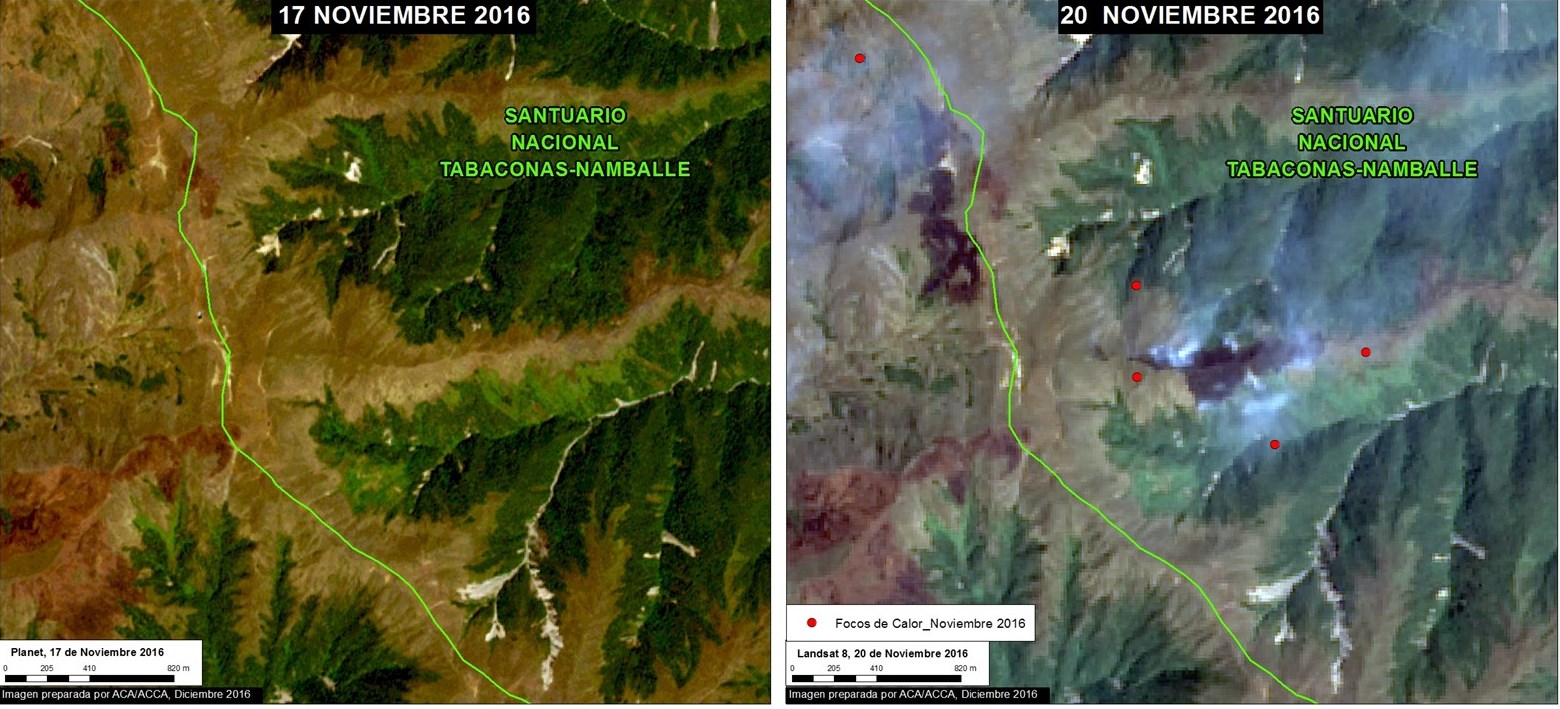
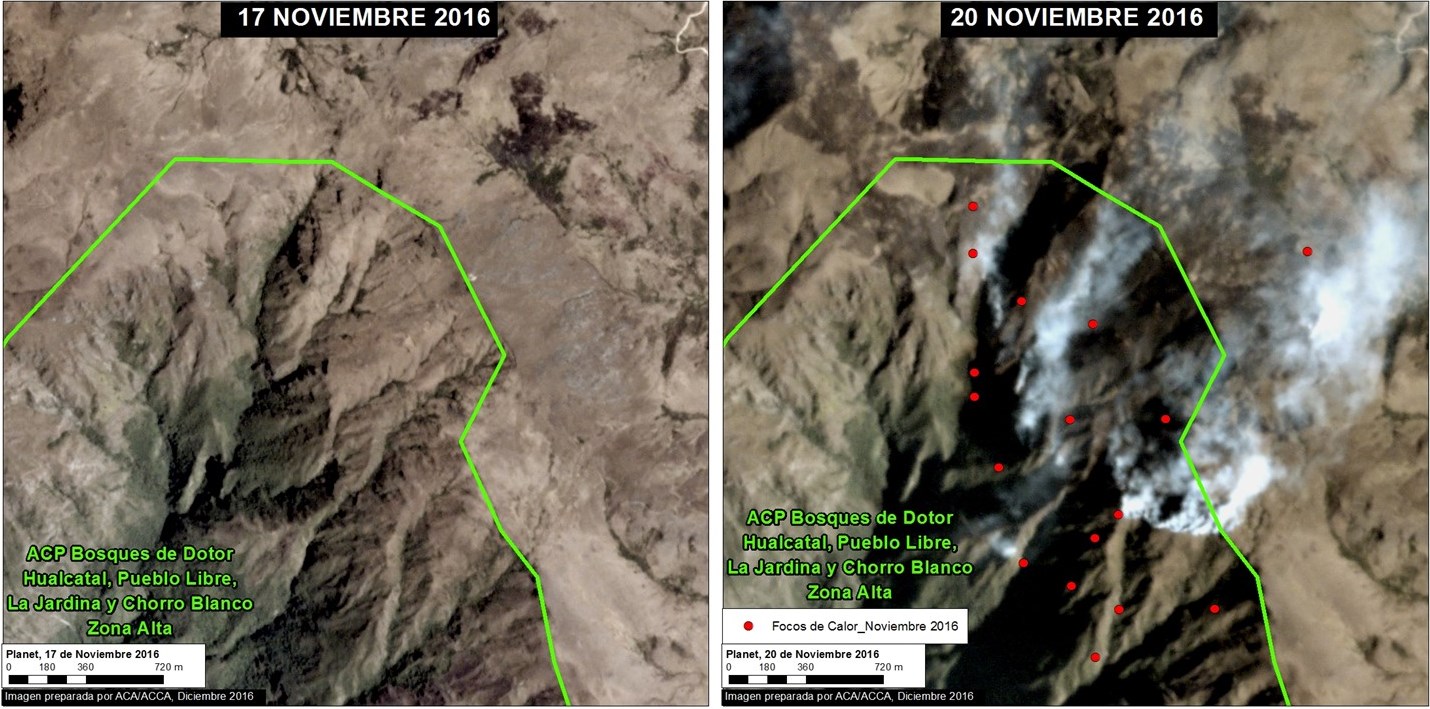
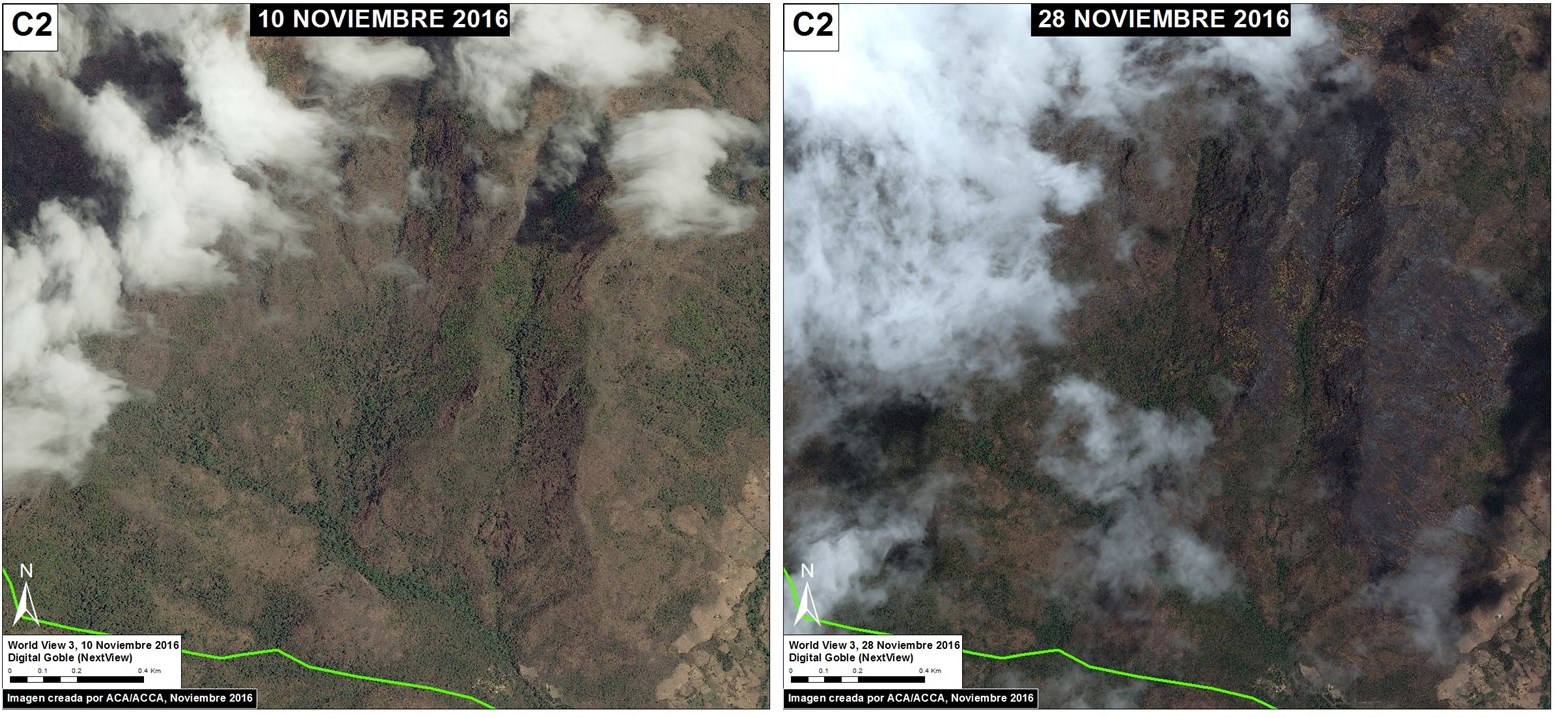
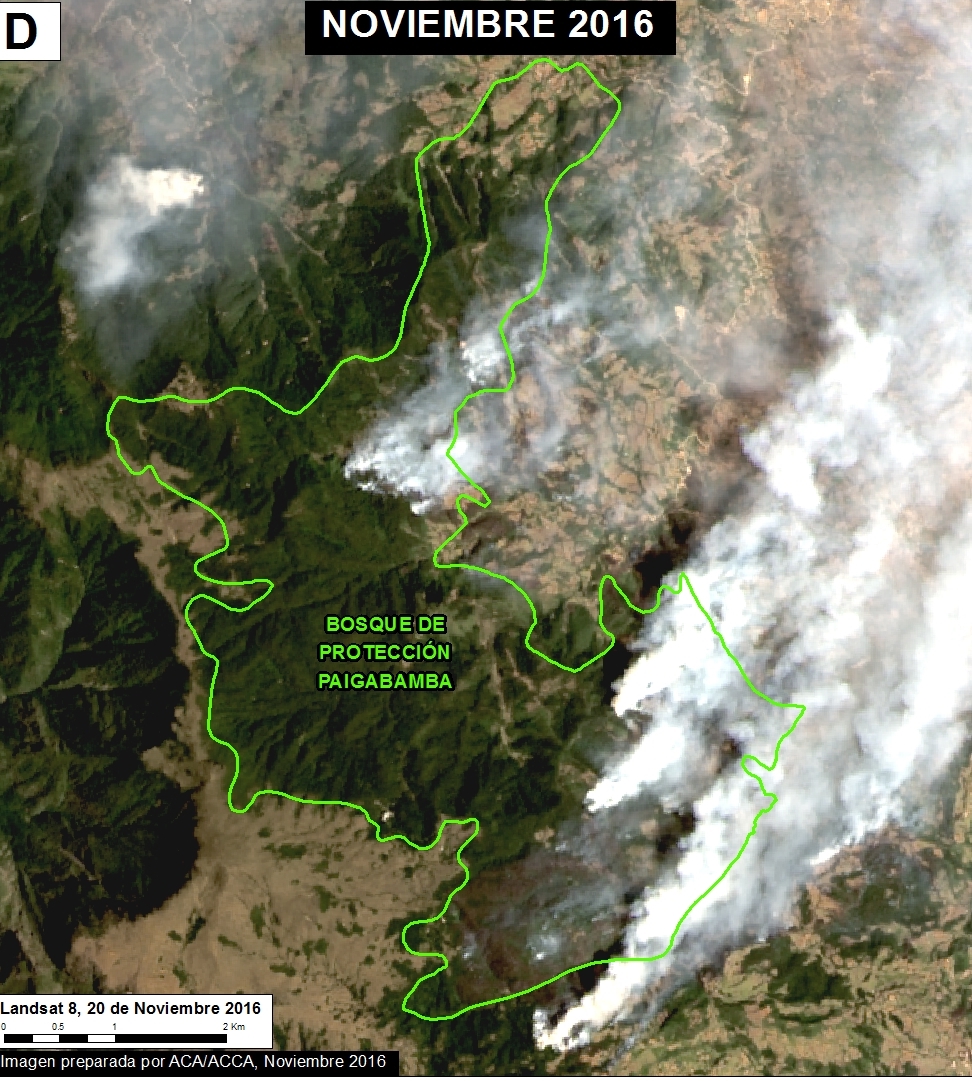
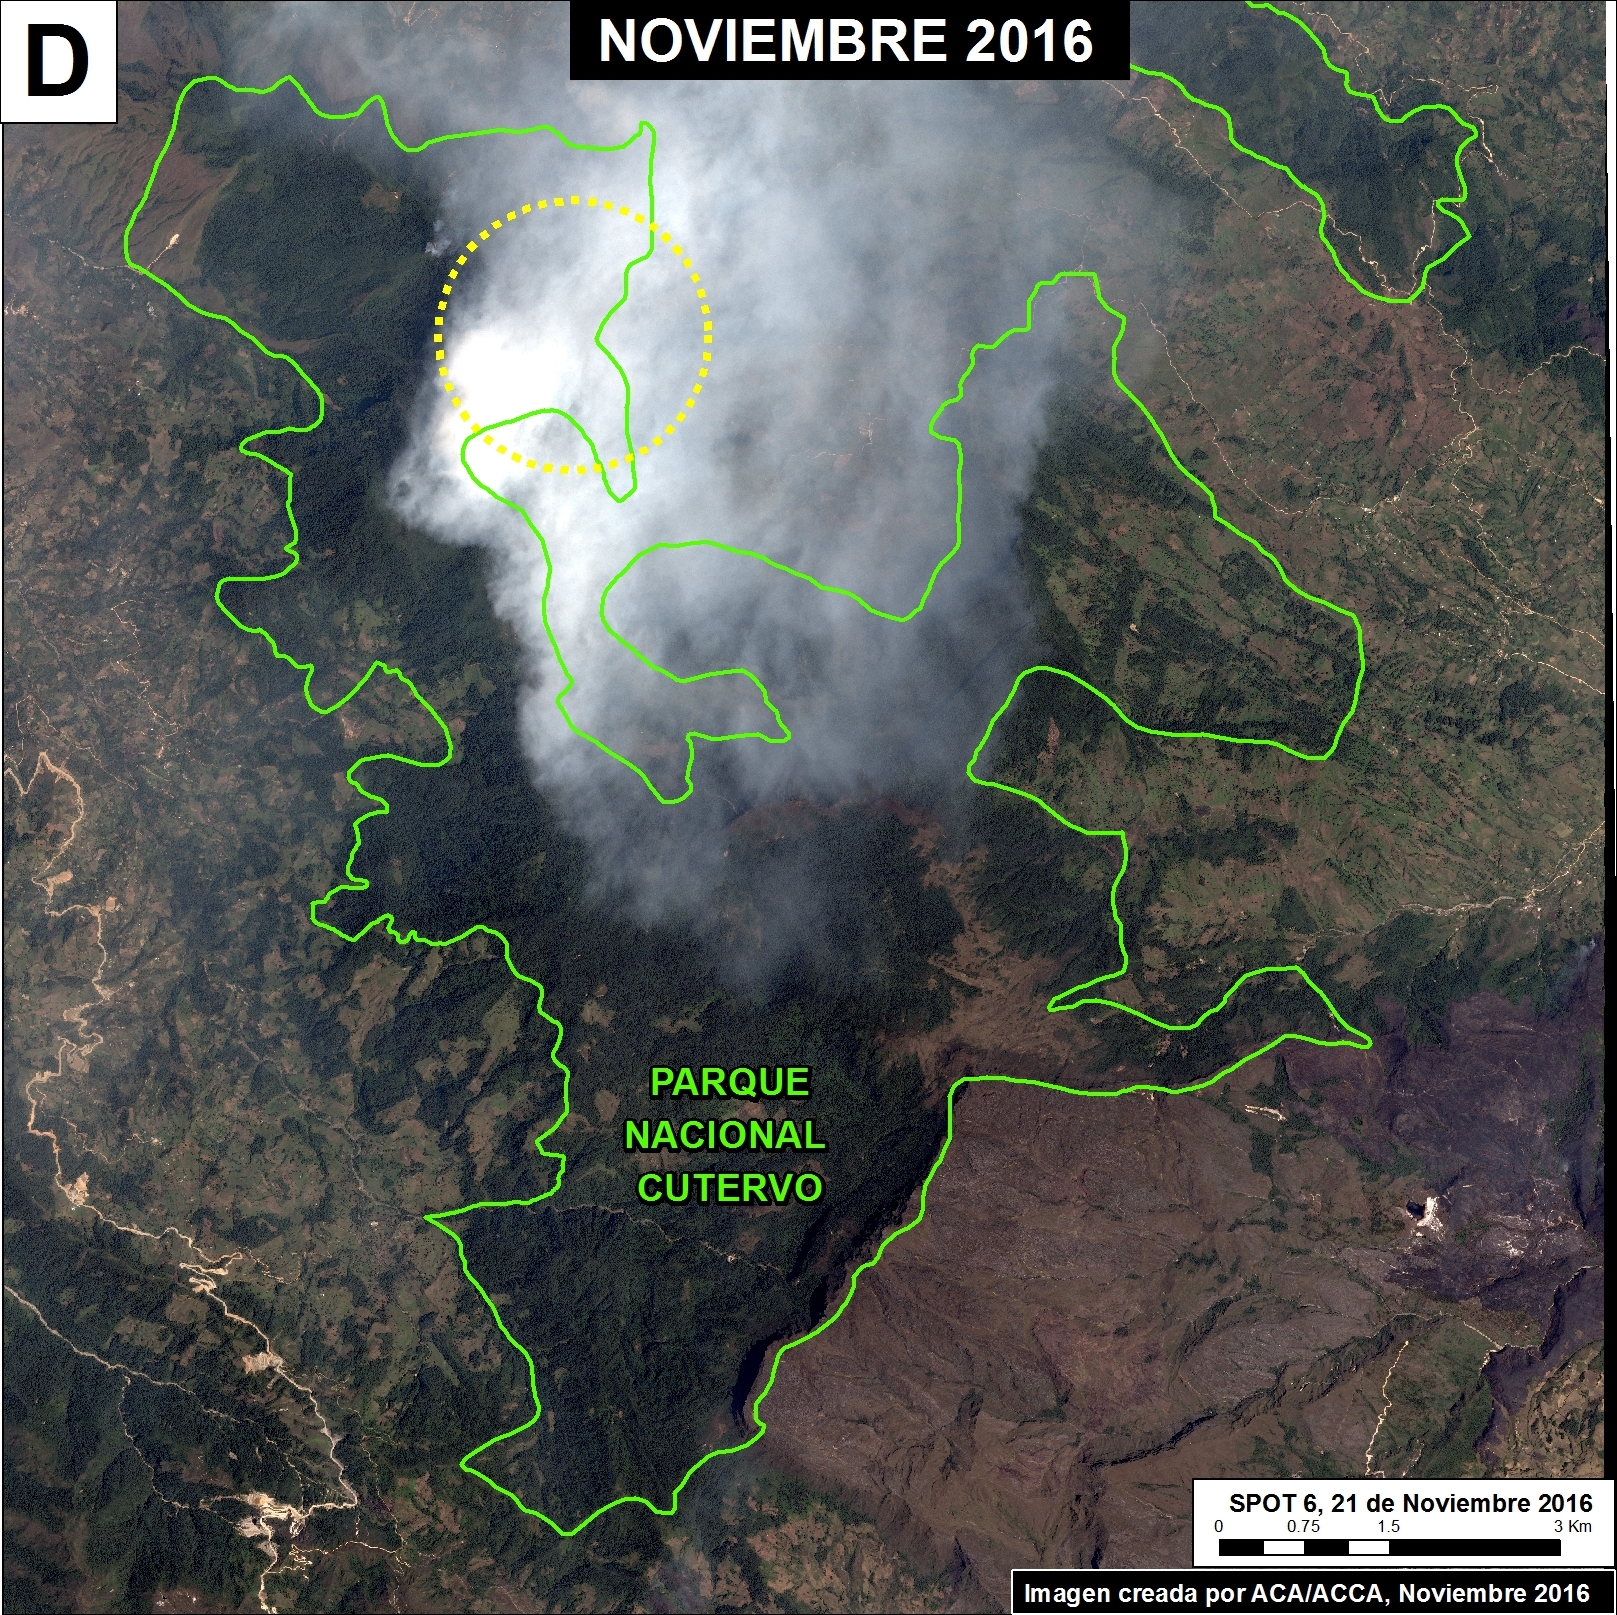
Hotspot H indicates an area impacted by intense wildfires in 2016.

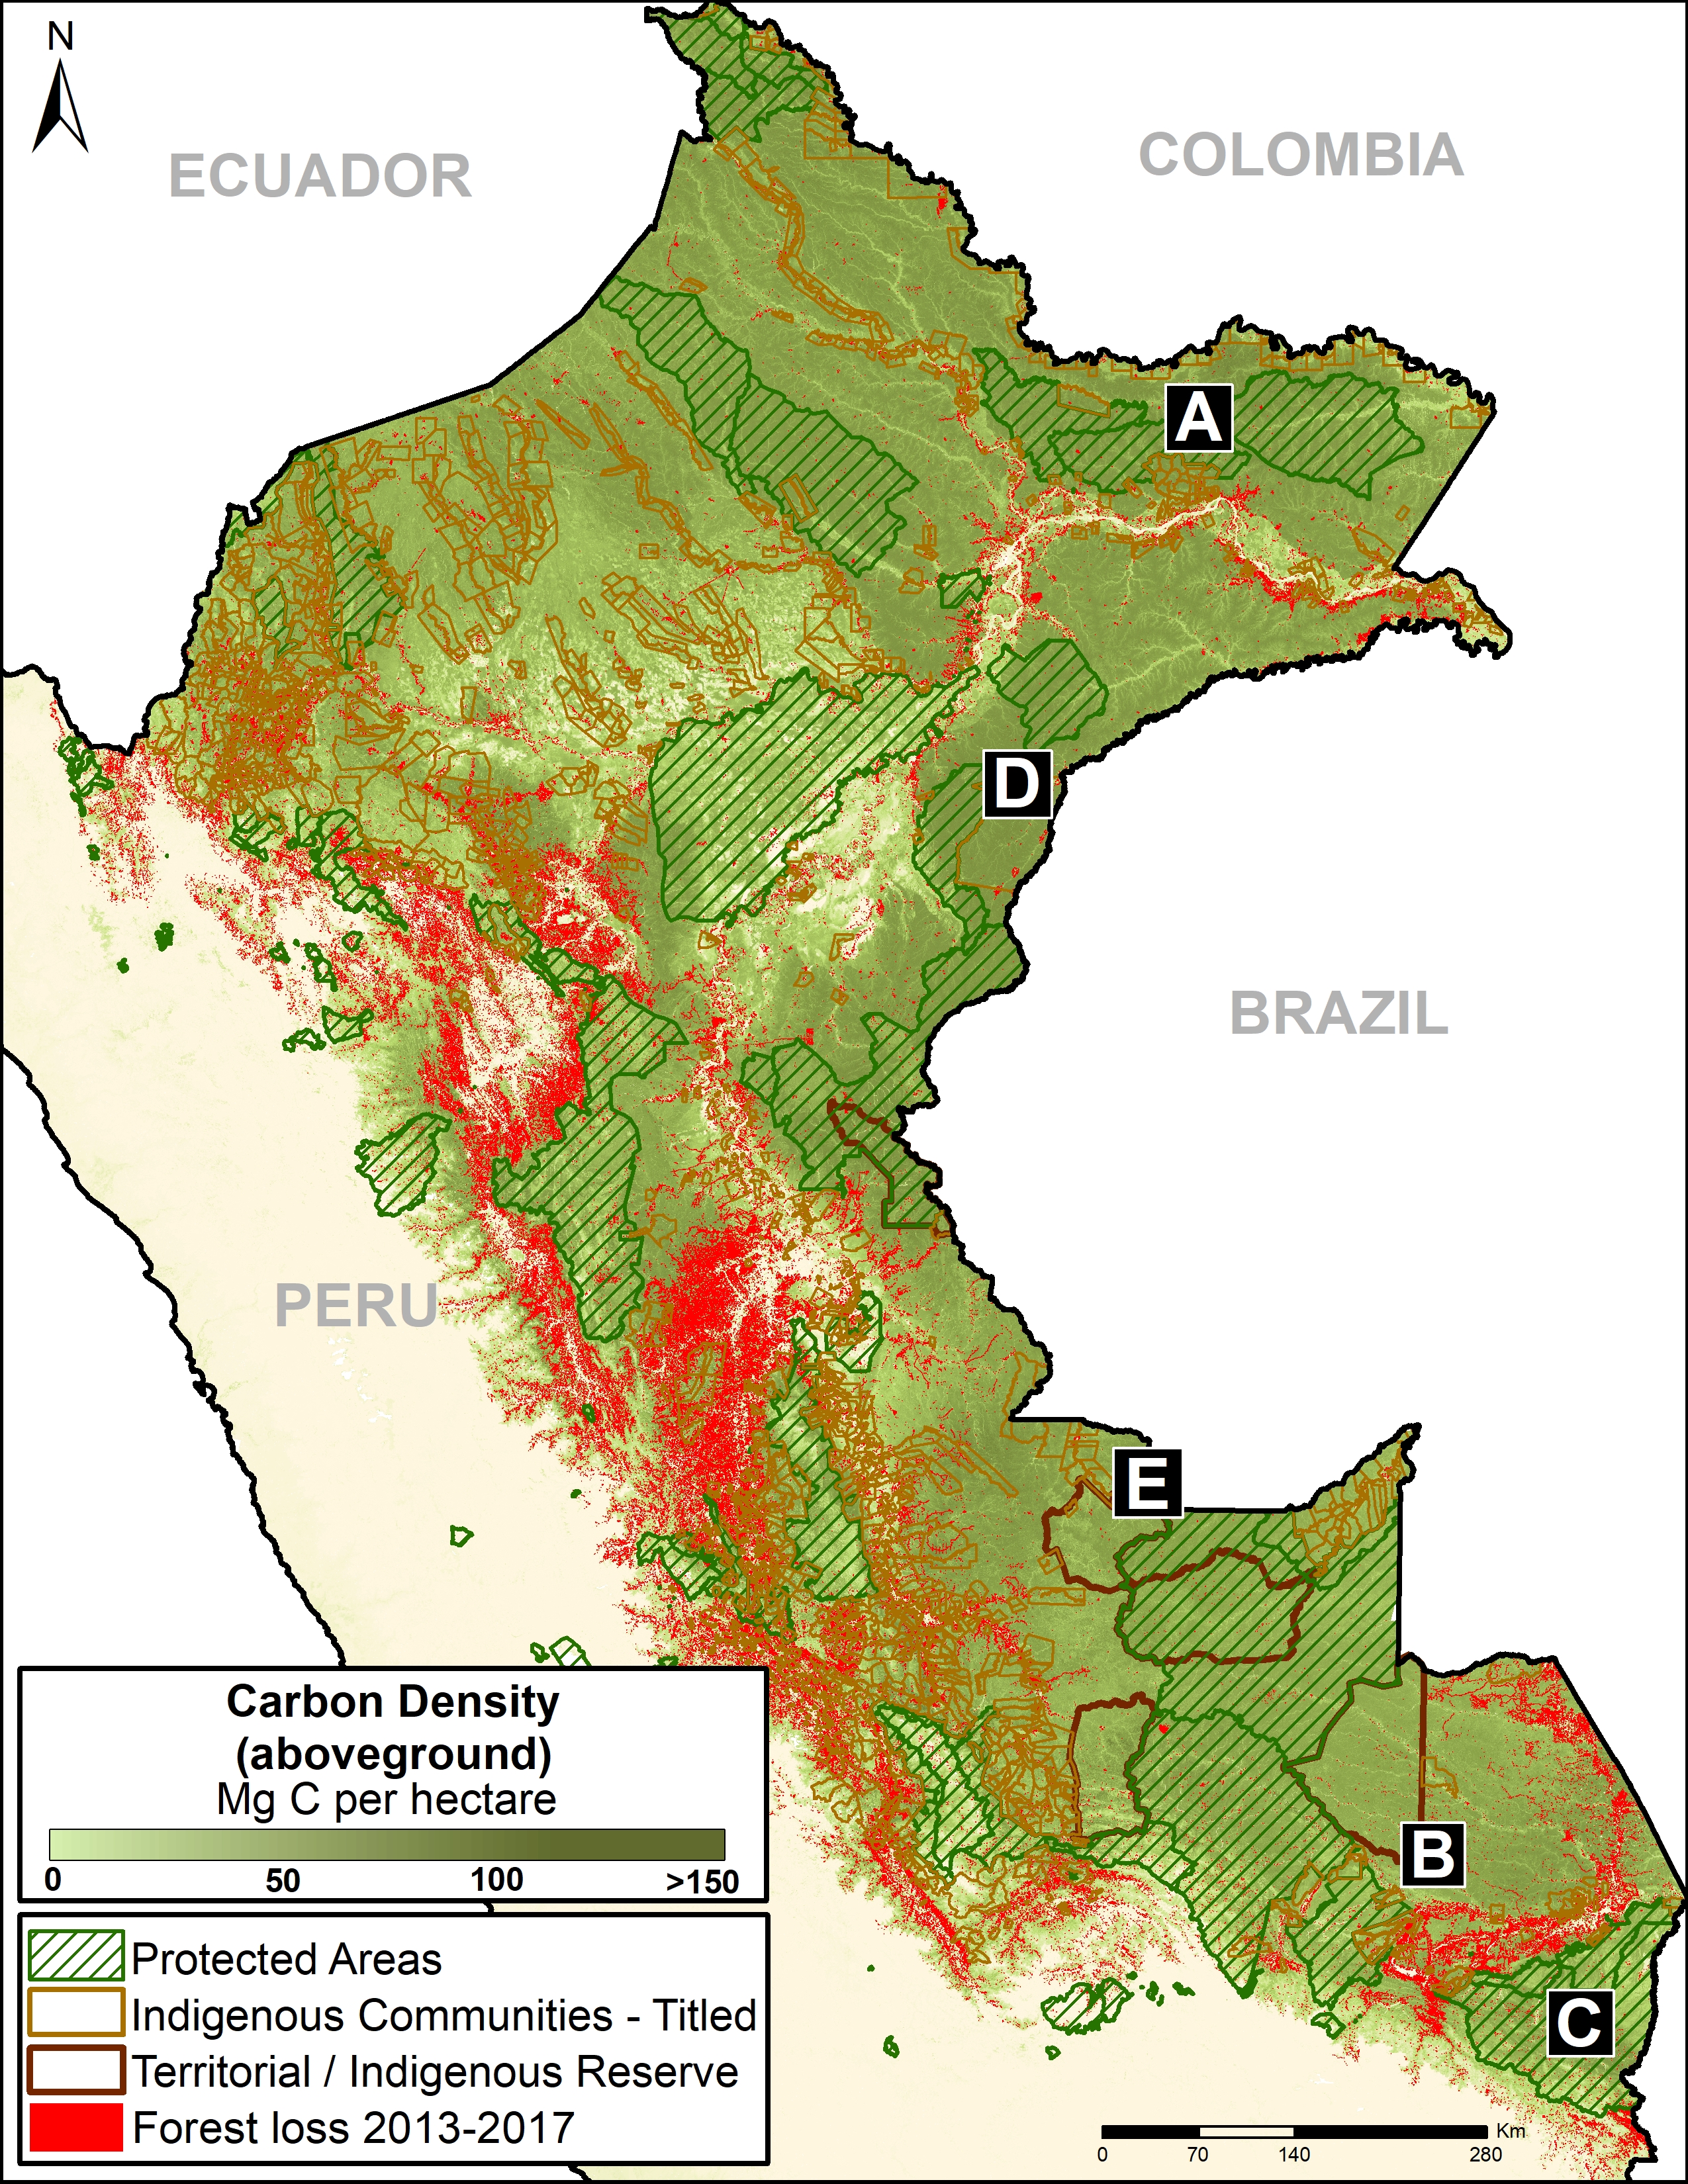
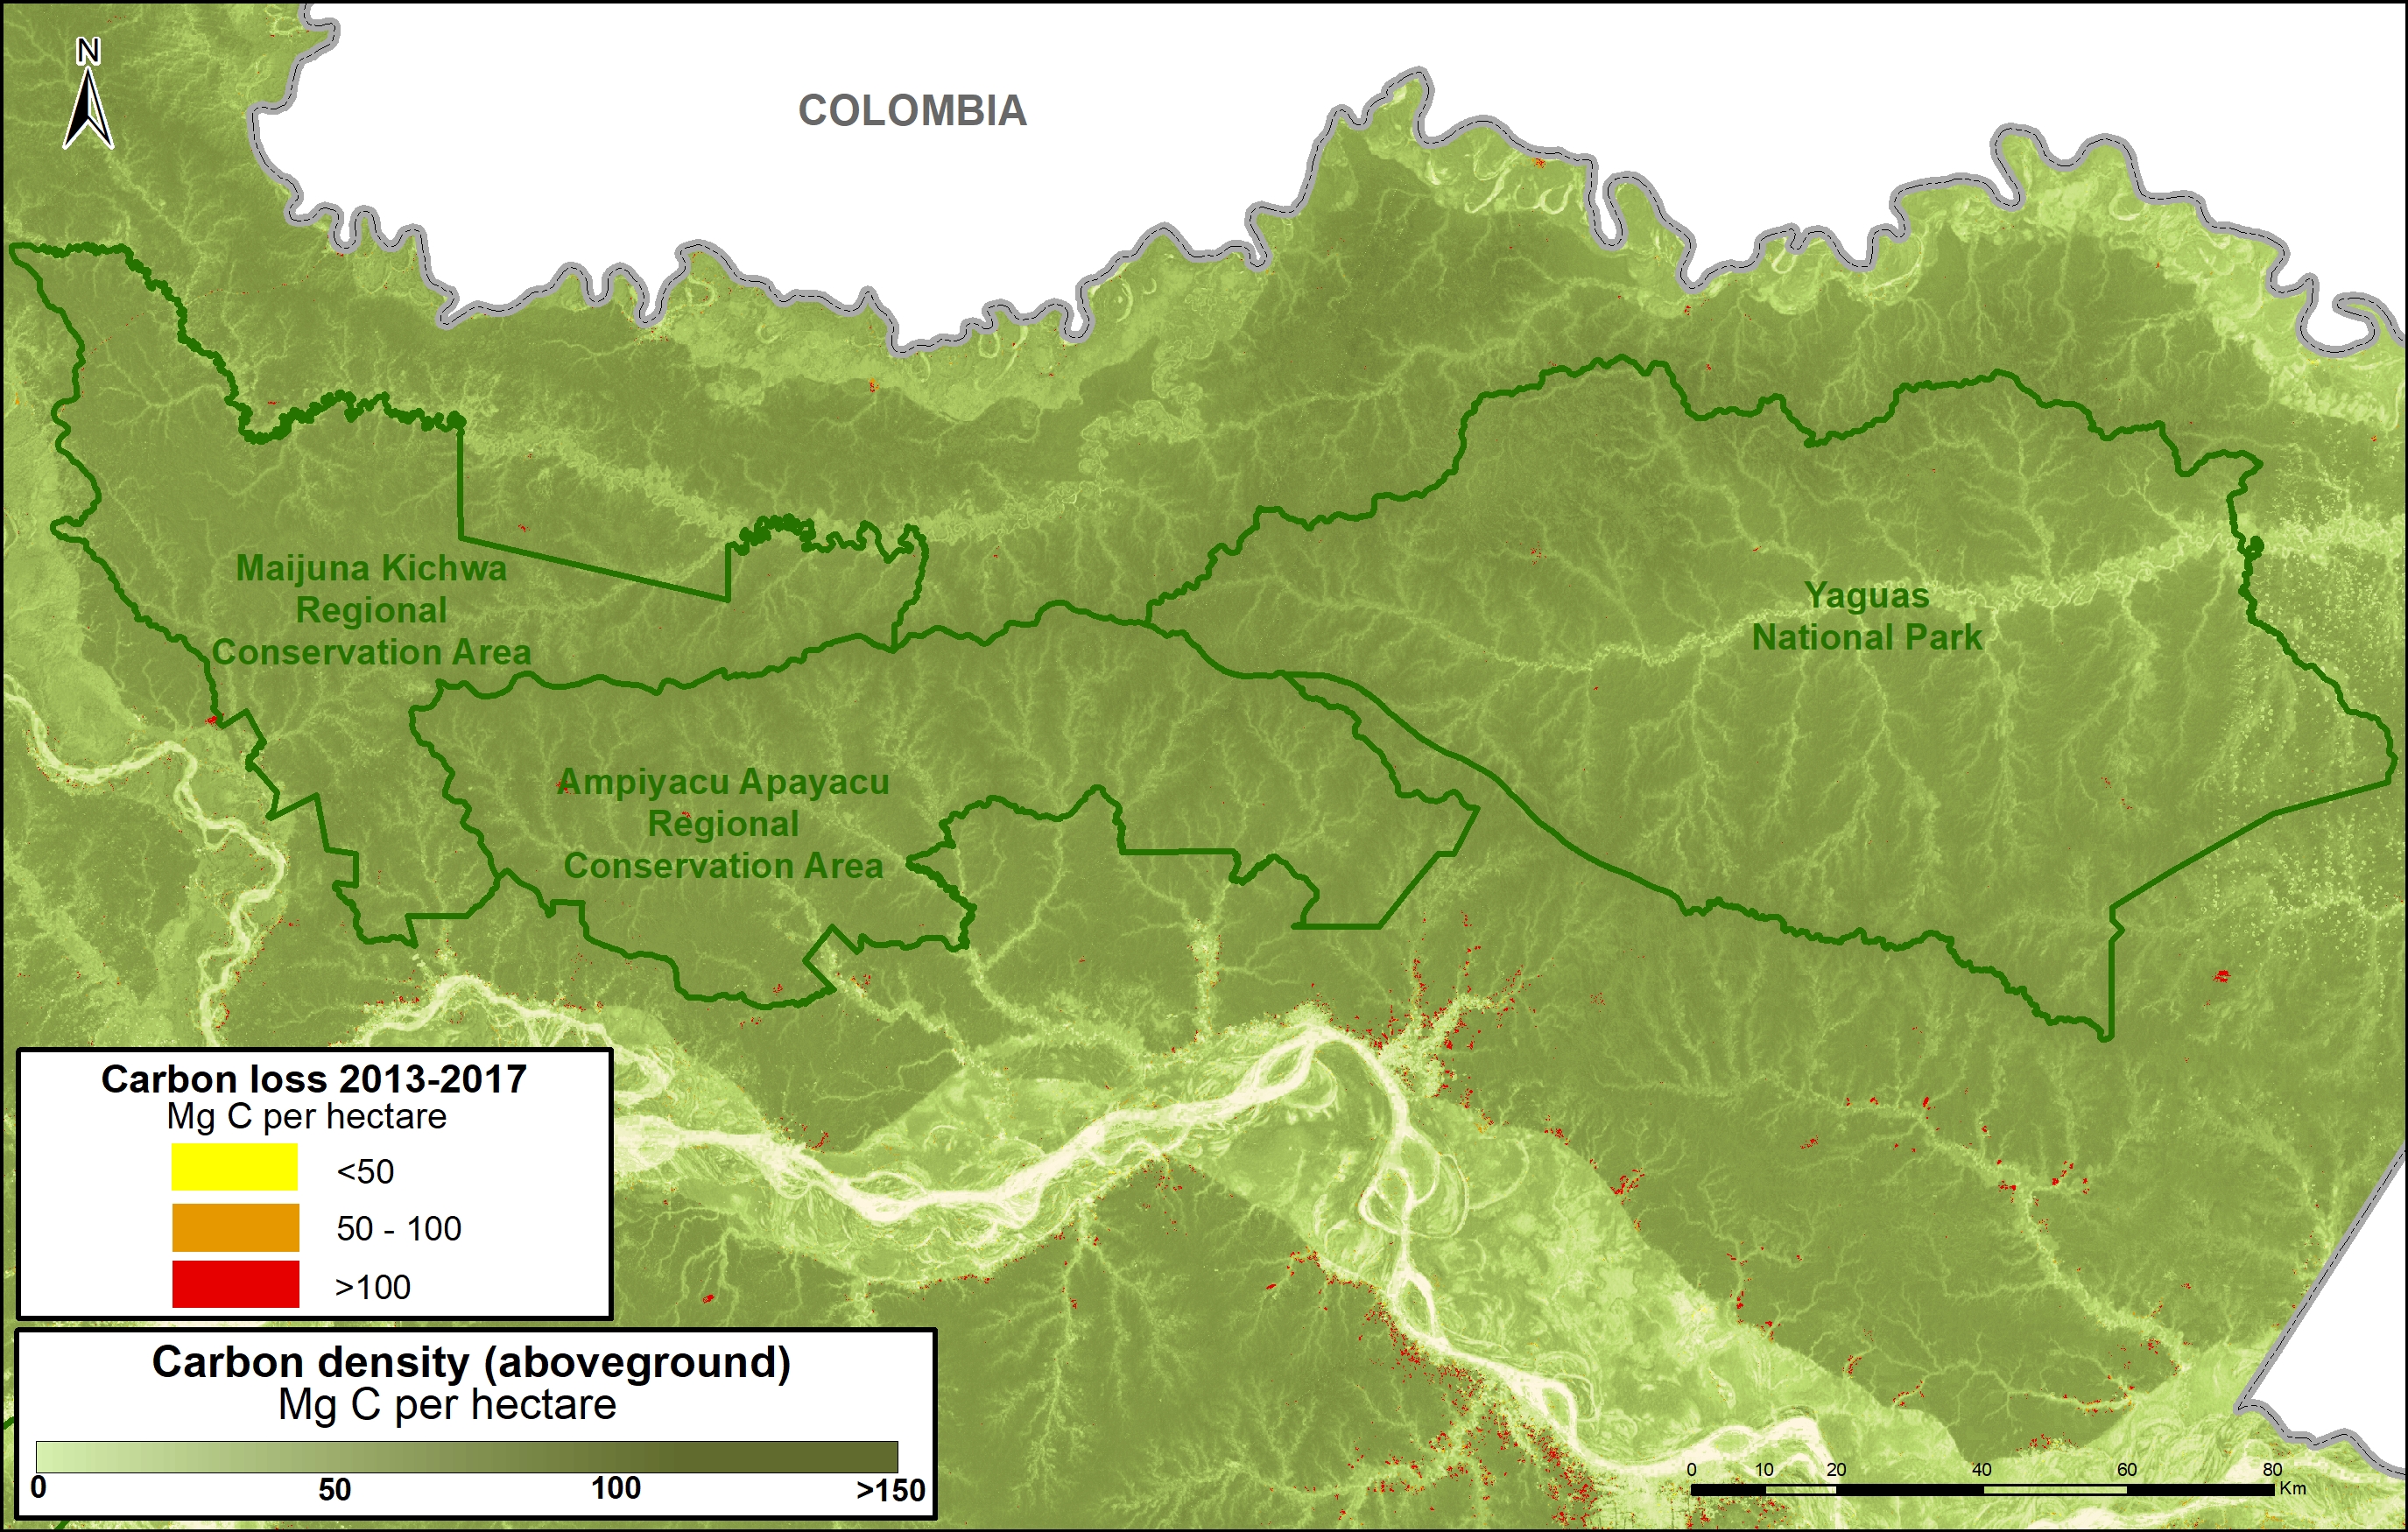
Protected Areas, in general, are effective barriers against deforestation (MAAP #11). However, several protected areas are currently threatened, most notably Tambopata National Reserve (Hotspot C; MAAP #46). and El Sira Communal Reserve (Hotspot B; MAAP #45).

Deforestation Drivers

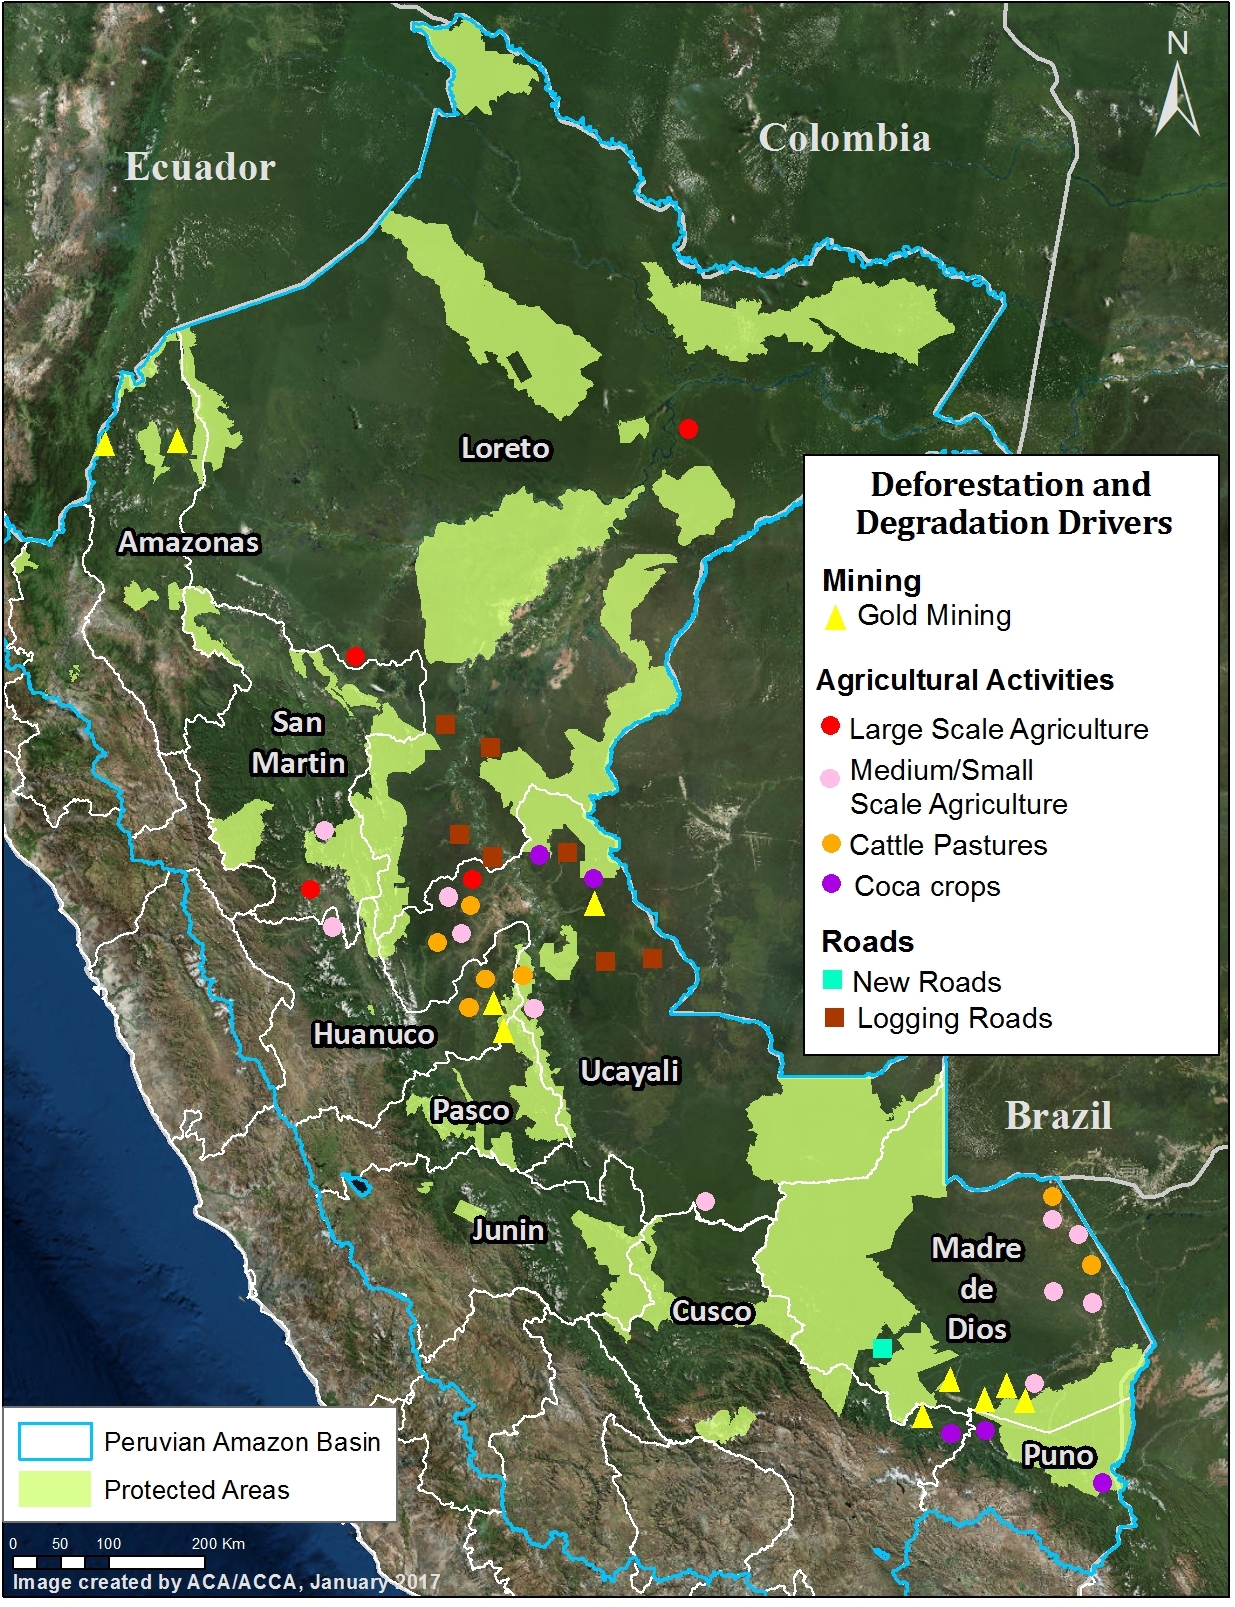
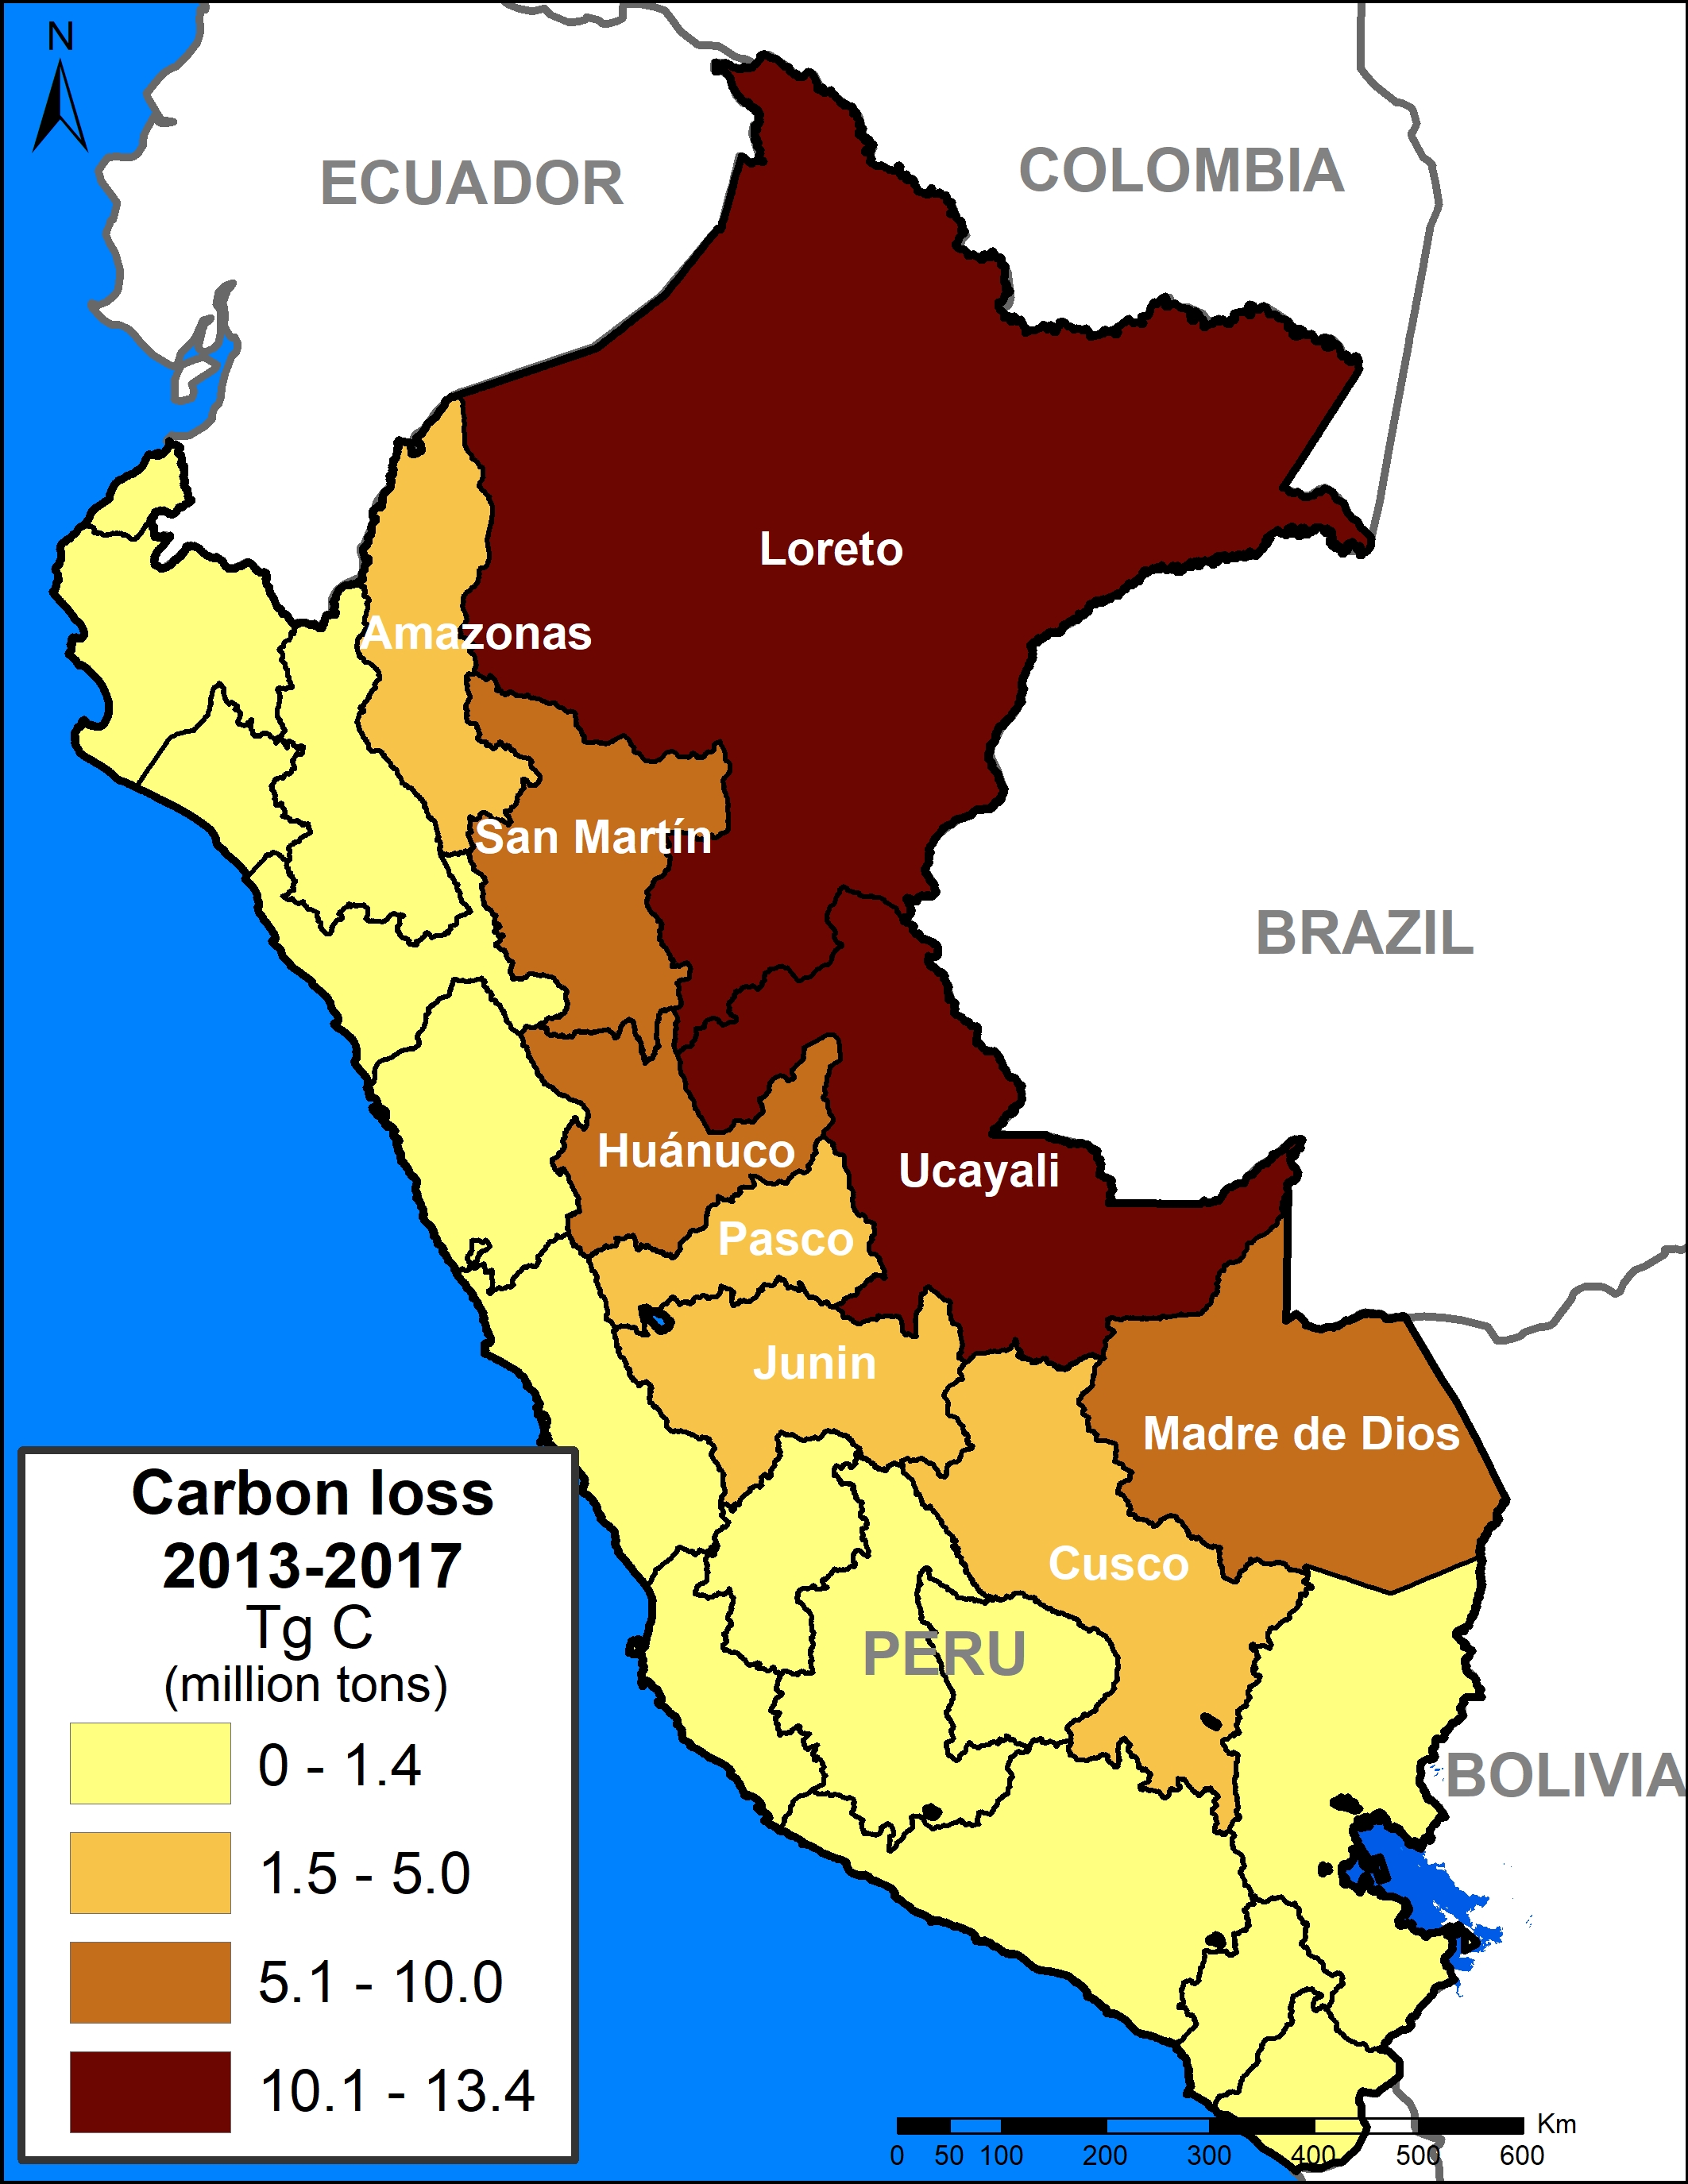
Image 3. Data: MAAP, SERNANP. Click to enlarge.

Surprisingly, there is a striking lack of precise information about the actual drivers of deforestation in the Peruvian Amazon. According to an important paper published in 2016, much of the existing information is vague and outdated, and is based solely on a general analysis of the size of deforestation events.3  

As noted above, one of the major advances of MAAP has been using high-resolution imagery to better identify deforestation drivers.

Image 3 shows the major deforestation drivers identified thus far by our analysis. As far as we know, it represents the first spatially explicit deforestation drivers map for the Peruvian Amazon.

To date, we have documented six major direct drivers of deforestation and degradation in the Peruvian Amazon: small/medium-scale agriculture, large-scale agriculture, cattle pasture, gold mining, illegal coca cultivation, and roads.

At the moment, we do not consider the hydrocarbon (oil and gas) and hydroelectric dam sectors as major drivers in Peru, but this could change in the future if proposed projects move forward.

We describe these major drivers of deforestation and degradation in greater detail below.

Small/Medium-scale Agriculture

The literature emphasizes that small-scale agriculture is the leading cause of deforestation in the Peruvian Amazon.However, there is little actual empirical evidence demonstrating that this is true.3 The raw deforestation data is dominated by small-scale clearings that are most likely for agriculture or cattle pasture. Thus, it is likely that small-scale agriculture is a major driver, but a definitive study utilizing high-resolution imagery and/or extensive field work is still needed to verify the assumption.

In several key case studies, we have shown specific examples of small-scale agriculture being a deforestation driver. For example, using a combination of high-resolution imagery, photos from the field, and local sources, we have determined that:

  • Oil Palm, in the form of small and medium-scale plantations, is one of the main drivers within deforestation Hotspot B (Ucayali; MAAP #26), Hotspot G (northern Huánuco; MAAP #48), and Hotspot F (Loreto-San Martin;MAAP #16). This was also shown for Ucayali in a recent peer-reviewed study.4 See below for information about large-scale oil palm.
  • Cacao is causing rapid deforestation along the Las Piedras River in eastern Madre de Dios (MAAP #23, MAAP #40). See below for information about large-scale cacao.
  • Papaya is an important new driver in Hotspot D, along the Interoceanic Higway in eastern Madre de Dios (MAAP #42).
  • Corn and rice plantations may also be an important driver in Hotspot D in eastern Madre de Dios (MAAP #28).

Large-scale Agriculture

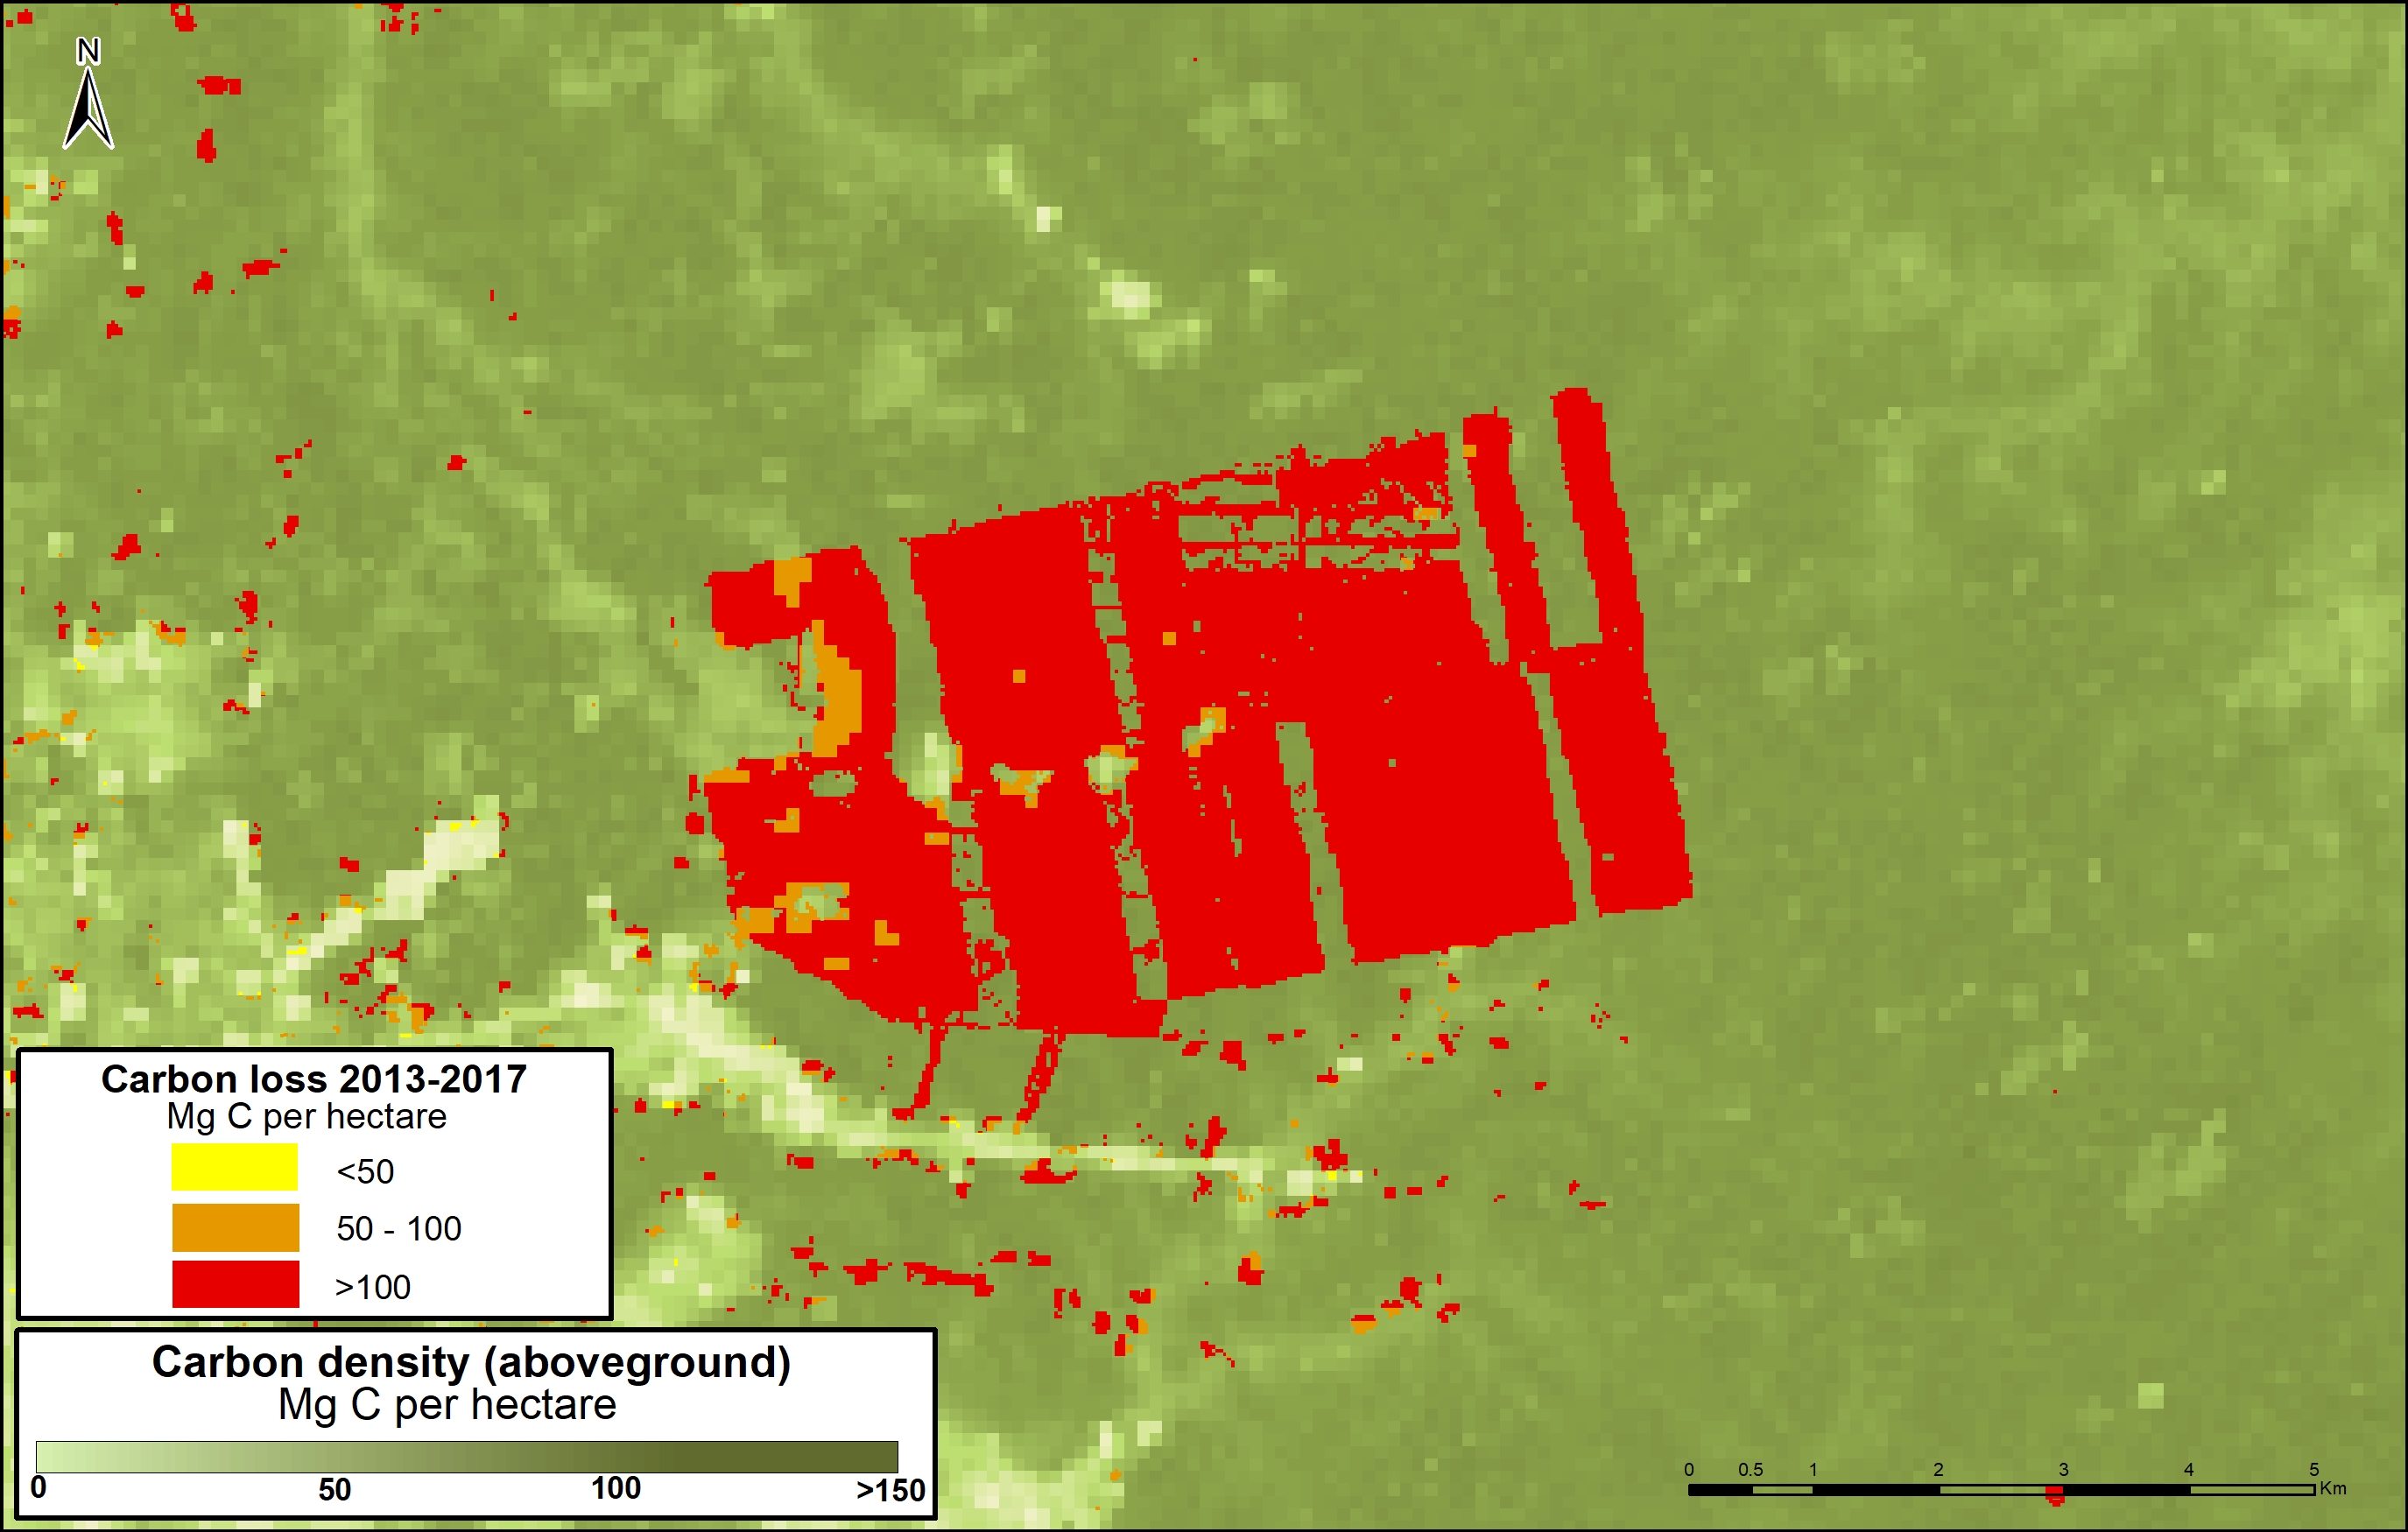
Large-scale, agro-industrial deforestation remains a latent threat in Peru, particularly in the central and northern Amazon regions. This issue was put on high alert in 2013, with two cases of large-scale deforestation for oil palm and cacao plantations, respectively.

In the oil palm case, two companies that are part of the Melka group,5 cleared nearly 29,650 acres in Hotspot A in Ucayali between 2012 and 2015 (MAAP #4, MAAP #41). In the cacao case, another company in the Melka group (United Cacao) cleared 5,880 acres in Hotspot E in Loreto between 2013 and 2015 (MAAP #9, MAAP #13, MAAP #27, MAAP #35). Dennis Melka has explicitly stated that his goal is to bring the agro-industrial production model common in Southeast Asia to the Peruvian Amazon.6

Prior to these cases, large-scale agricultural deforestation occurred between 2007 and 2011, when oil palm companies owned by Grupo Palmas7 cleared nearly 17,300 acres for plantations in Hotspot H along the Loreto-San Martin border (MAAP #16). Importantly, we documented the additional deforestation of 24,215 acres for oil palm plantations surrounding the Grupo Palmas projects (MAAP #16).

In contrast, large-scale agricultural deforestation was minimal in 2015 and 2016. However, as noted above, it remains a latent threat. Both United Cacao and Grupo Palmas have expansion plans that would clear over 49,420 acres of primary forest in Loreto.8

Cattle Pasture

Using an archive of satellite imagery, we documented that deforestation for cattle pasture is a major issue in the central Peruvian Amazon. Immediately following a deforestation event, the scene of hundreds or thousands of recently cut trees often looks the same whether the cause is agriculture or cattle pasture. However, by using an archive of imagery and studying deforestation events from previous years, one can more easily determine the drivers of the forest loss. For example, after a year or two, agriculture and cattle pasture appear very differently in the imagery and thus it is possible to distinguish these two drivers.

Using this technique, we determined that cattle pasture is a major driver in Hotspots A and B, in the central Peruvian Amazon (MAAP #26, MAAP #37).

We also used this technique to determine that much of the deforestation in the northern section of El Sira Communal Reserve is due to cattle pasture (MAAP #45).

Maintenance of cattle pasture, and small-scale agriculture, are likely important factors behind the escaped fires that degrade the Amazon during intense dry seasons (MAAP #45, MAAP #47).
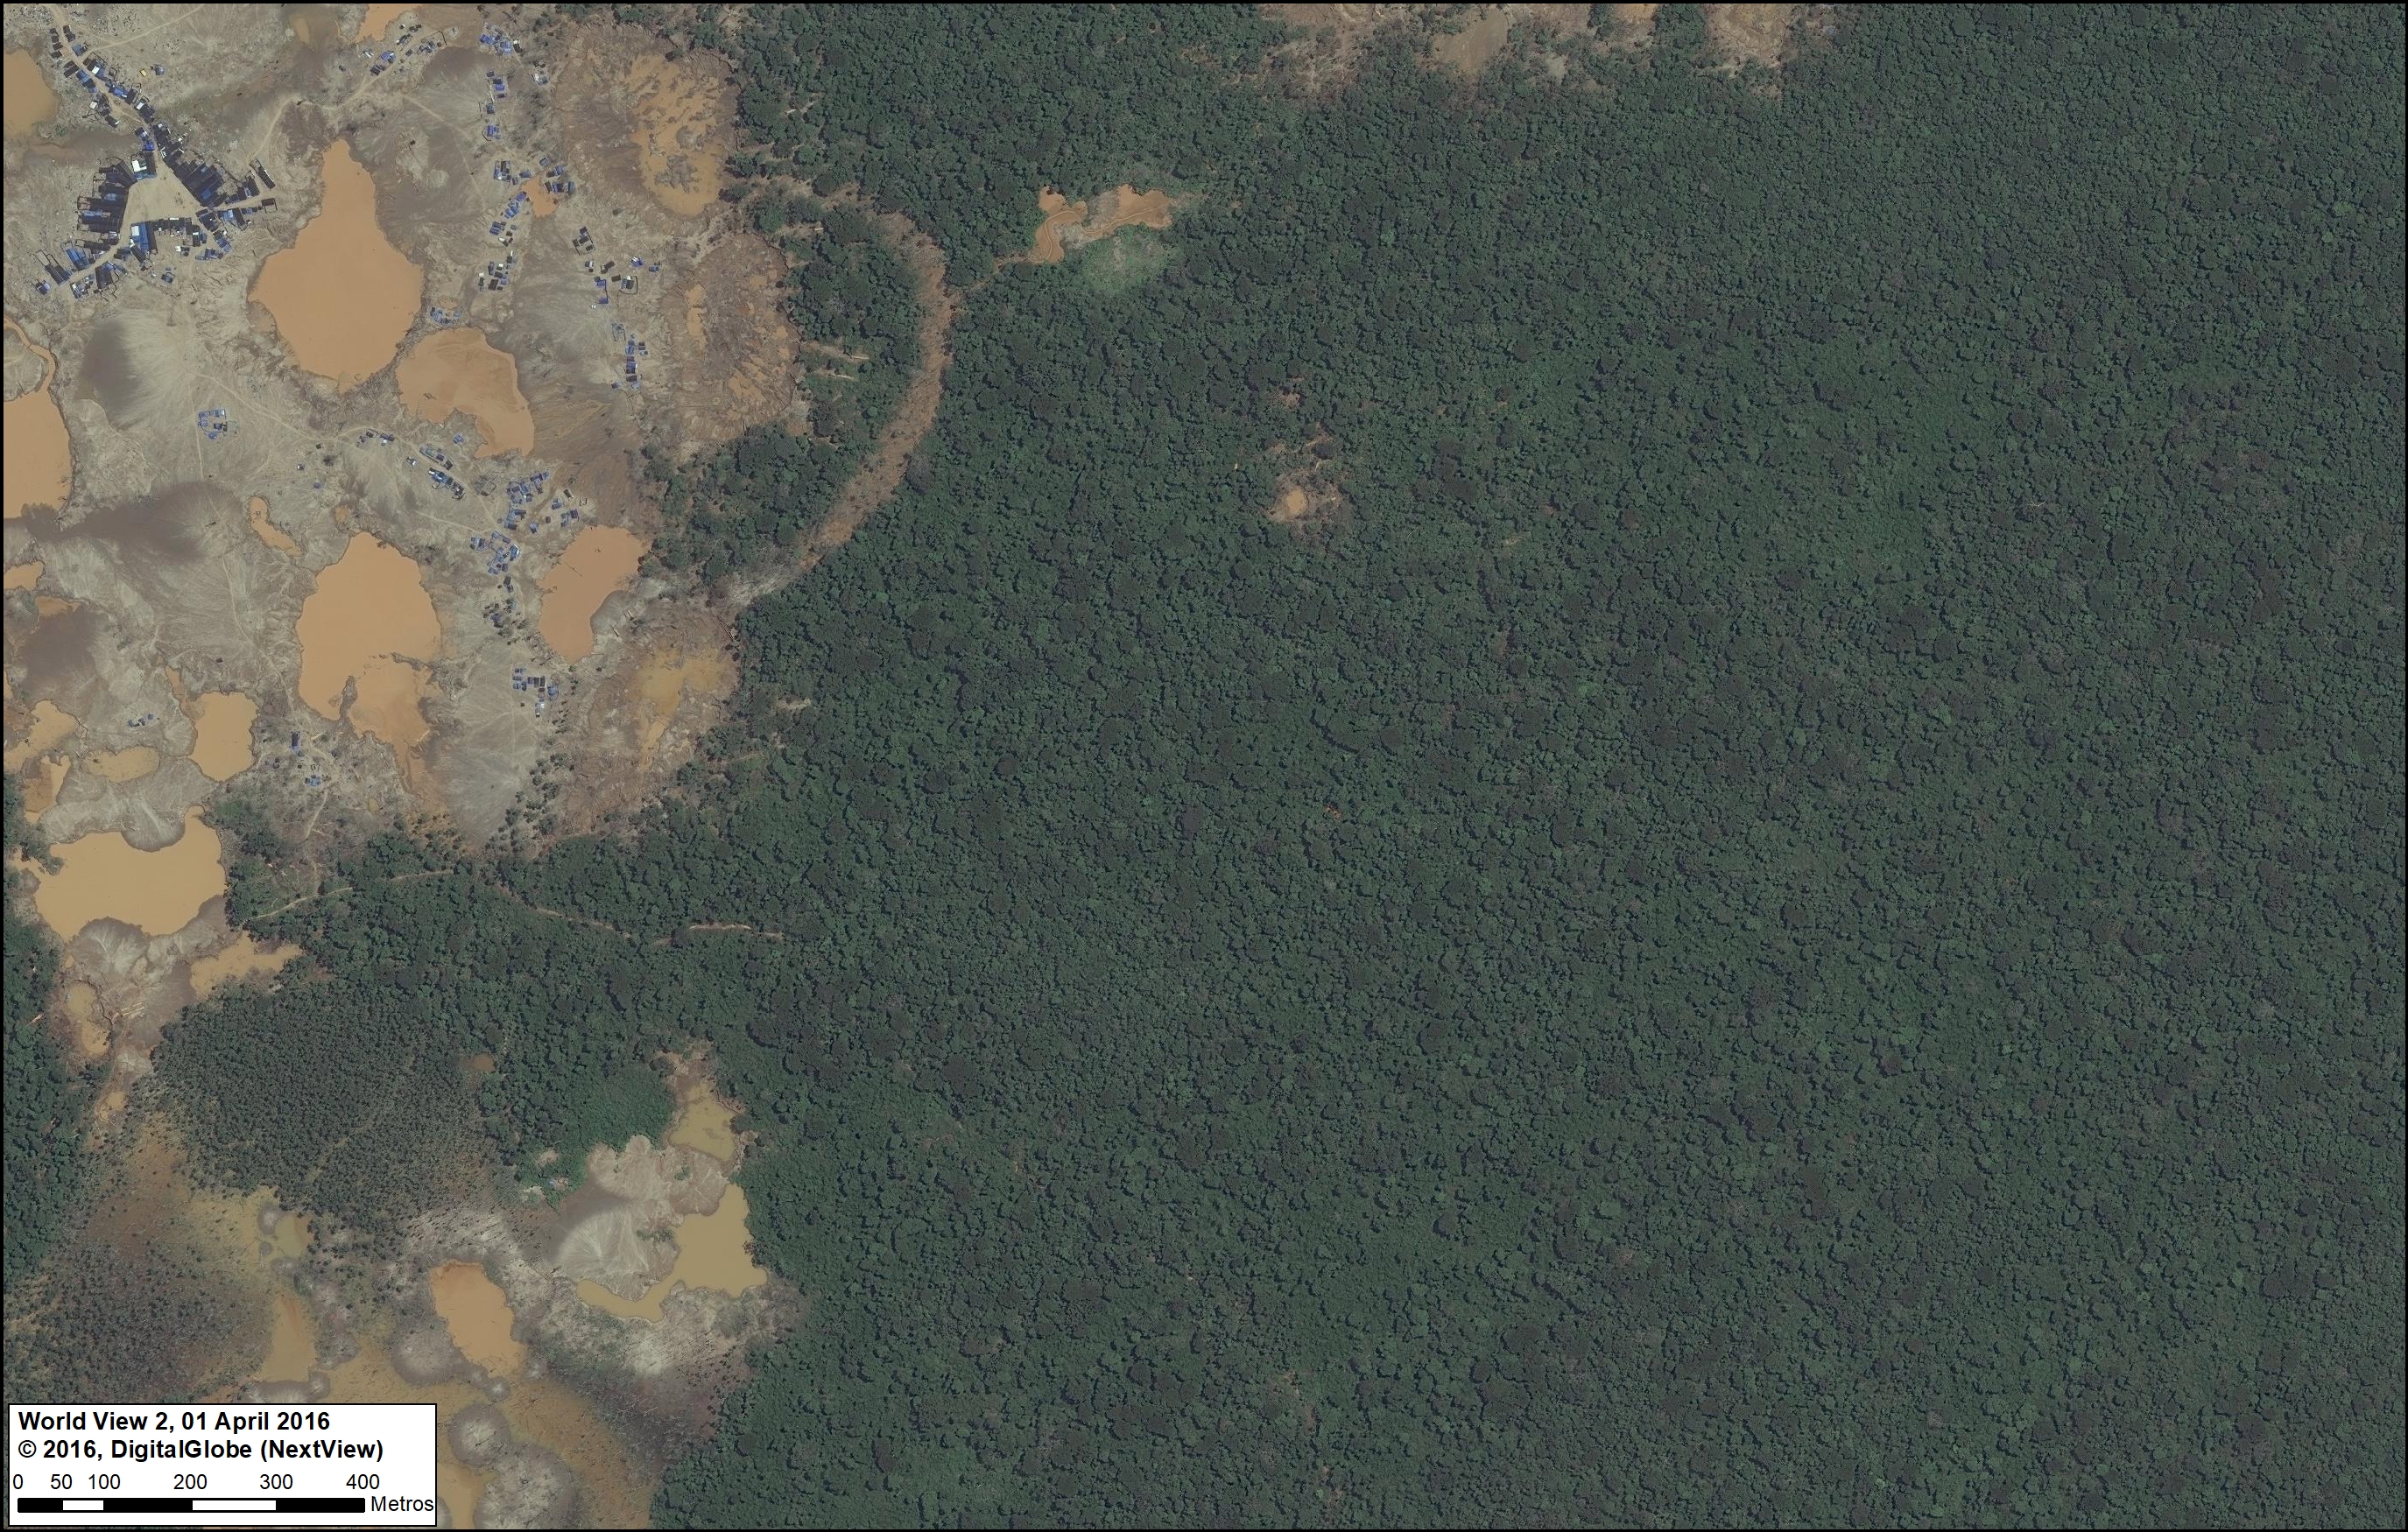
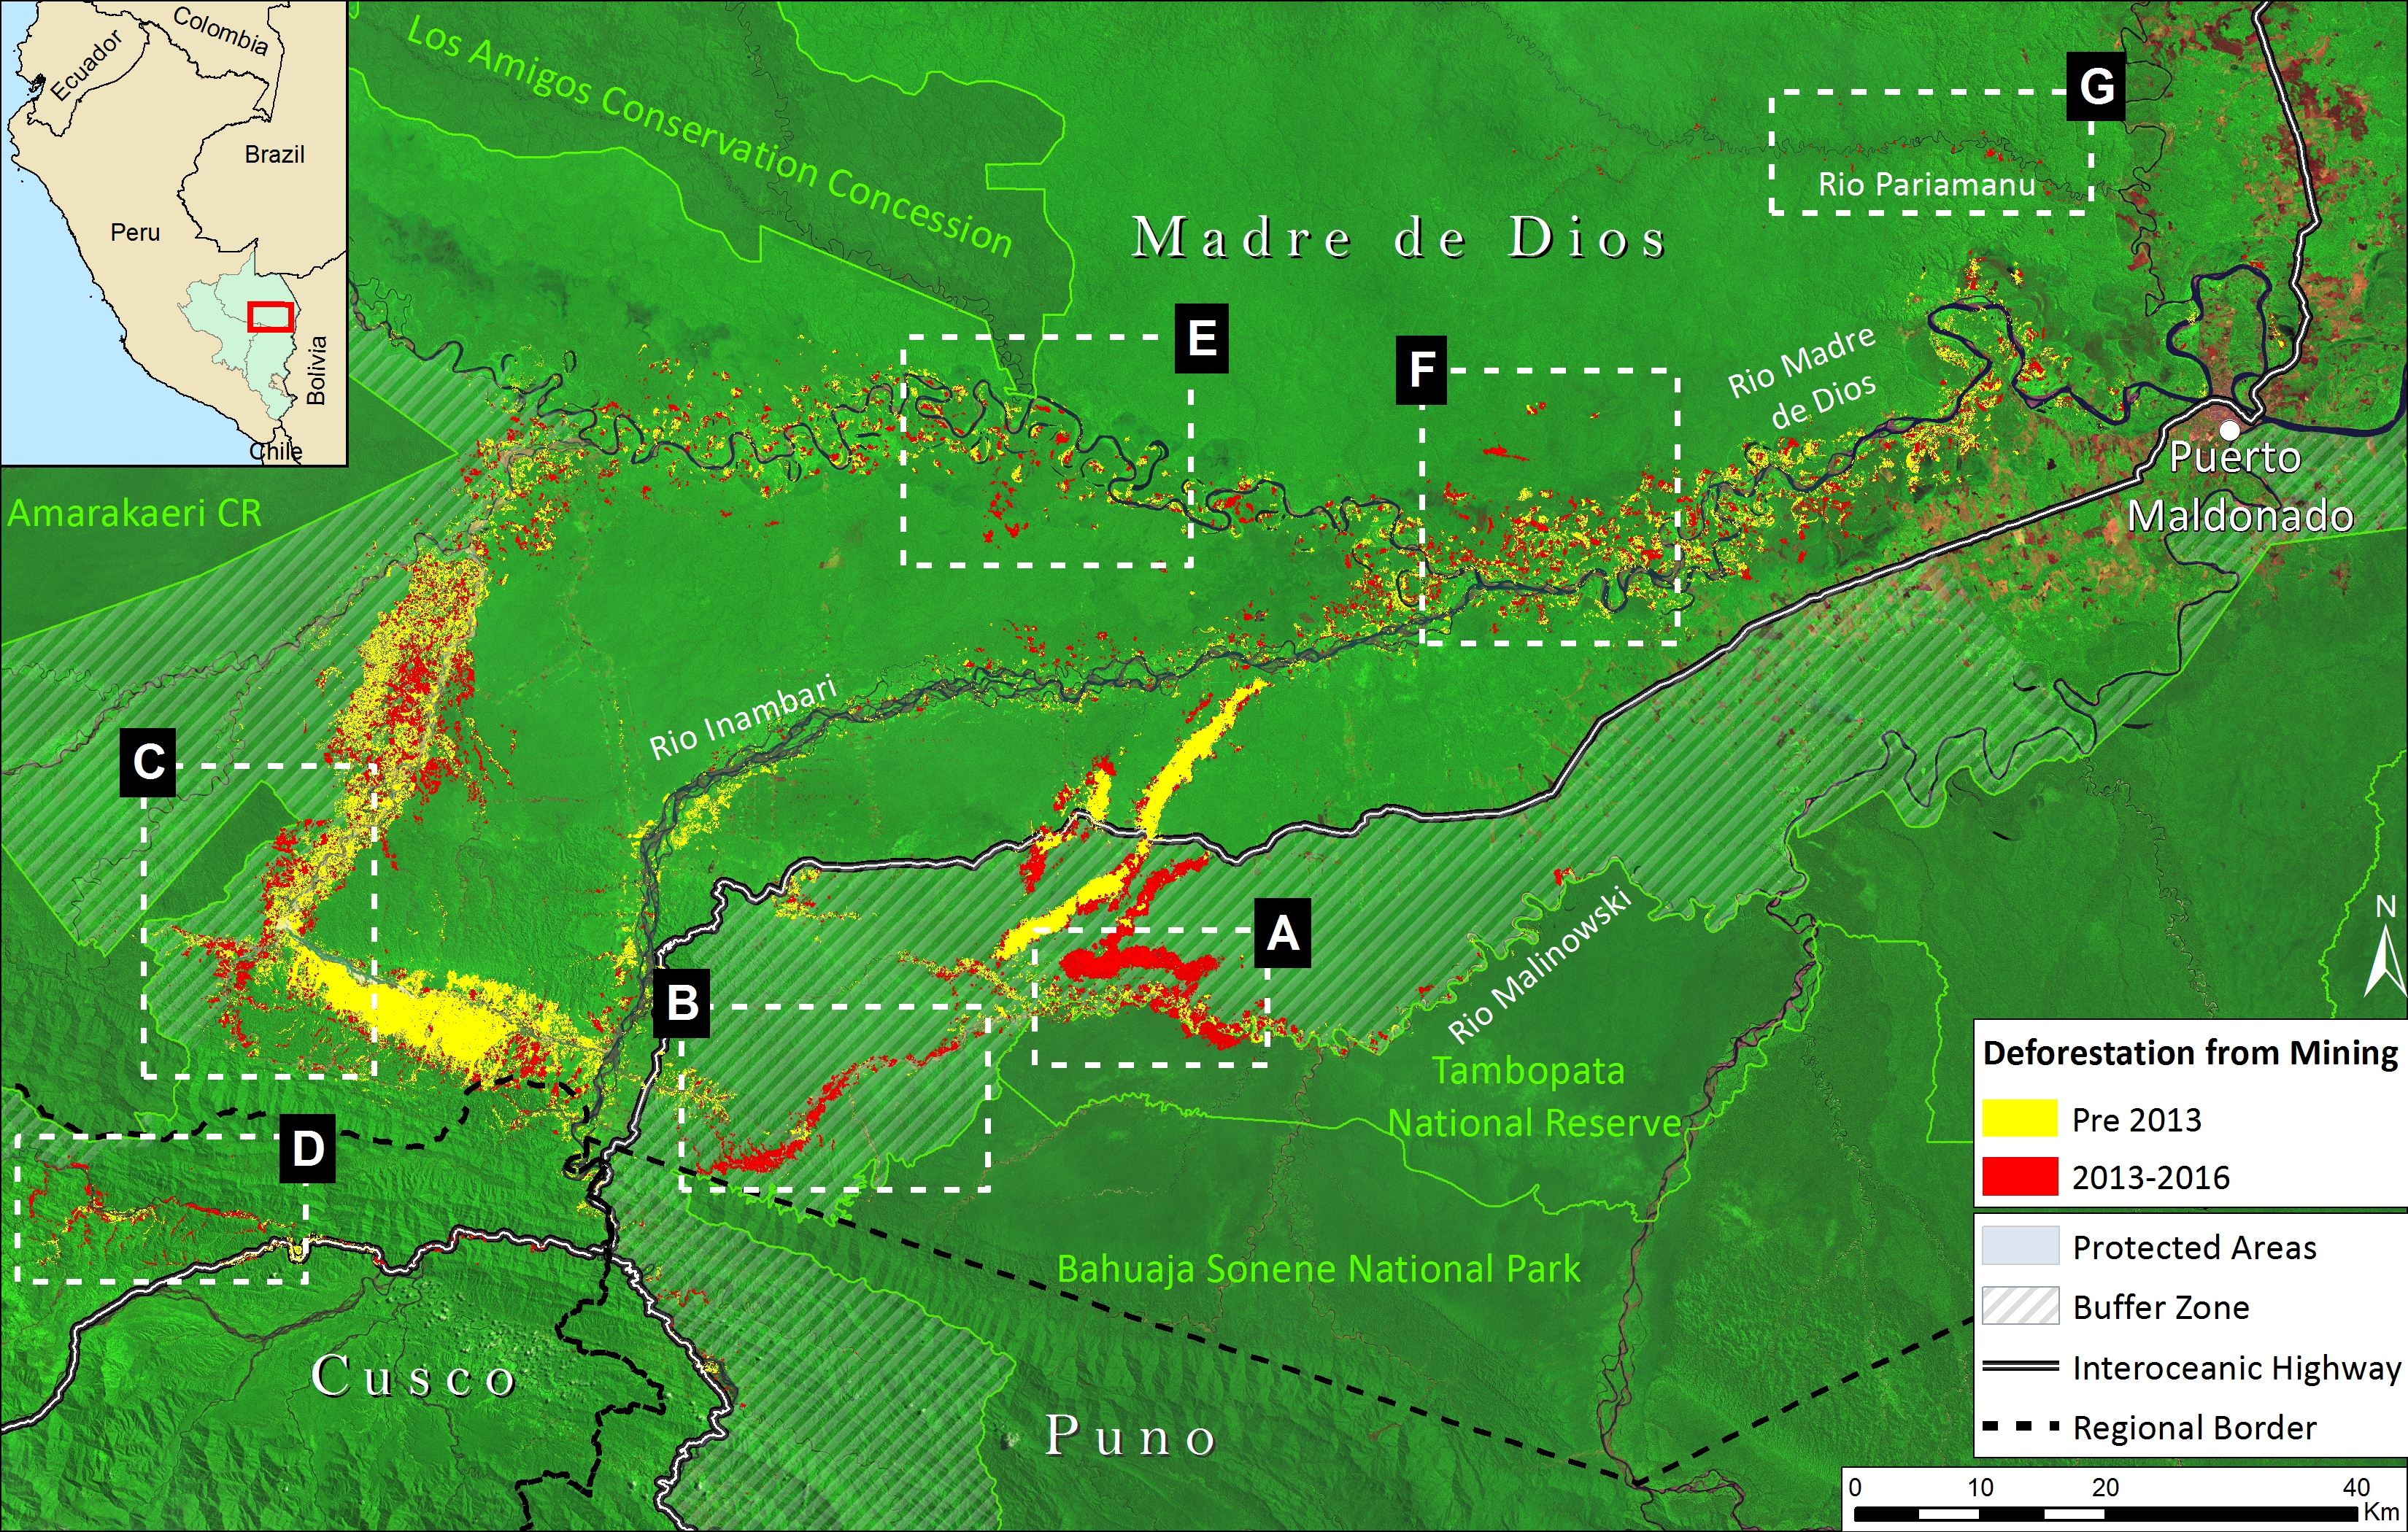
Gold Mining

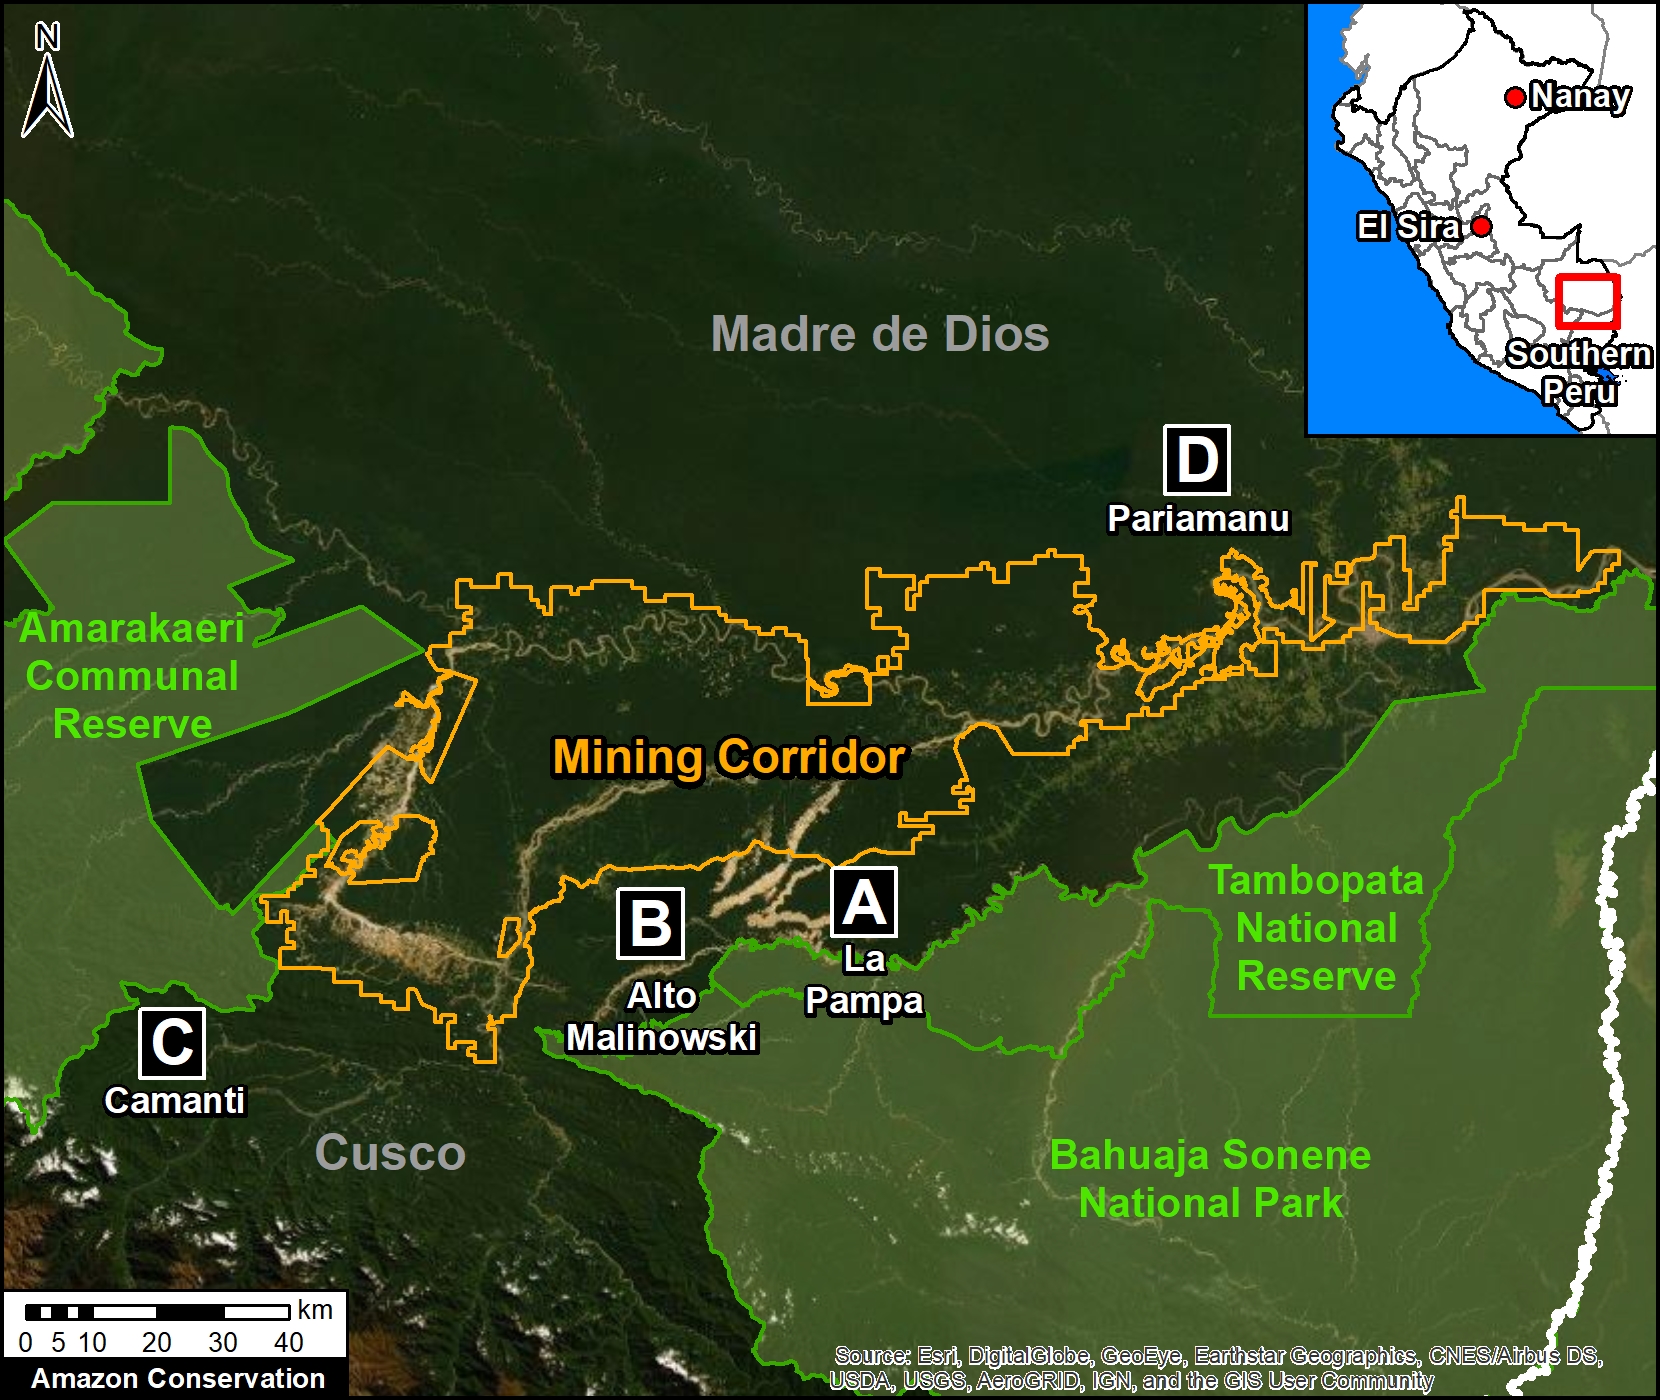
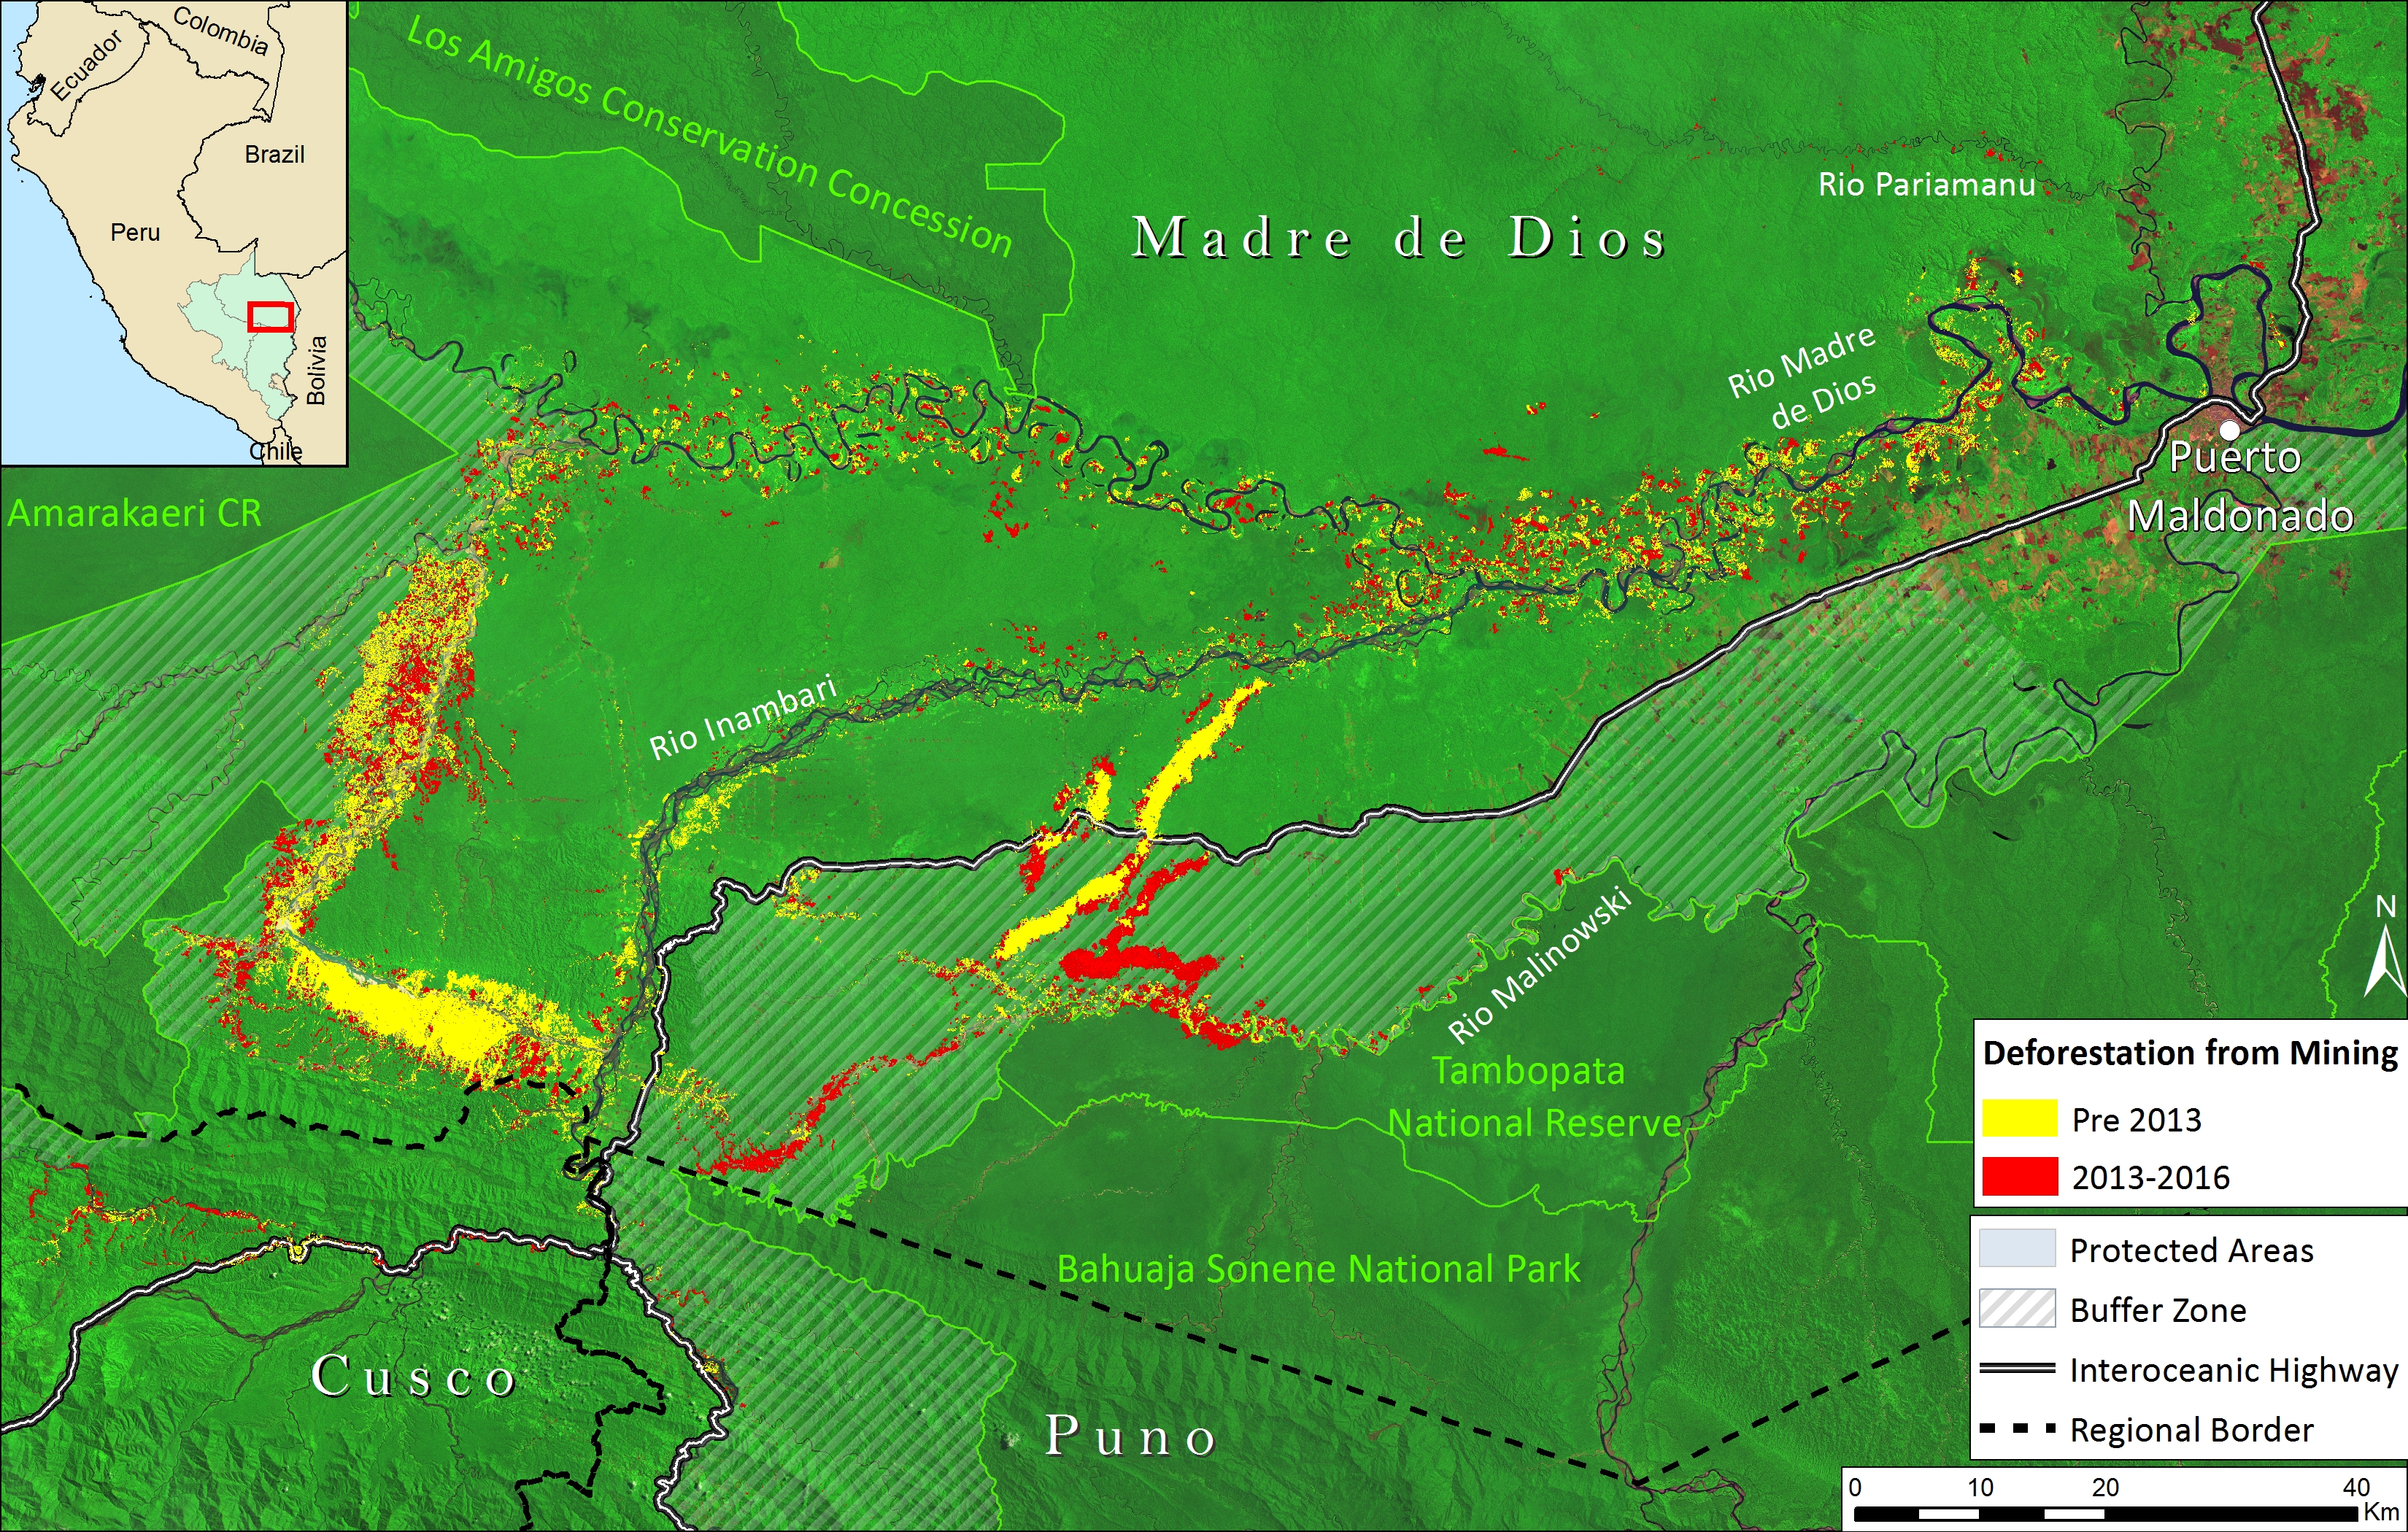
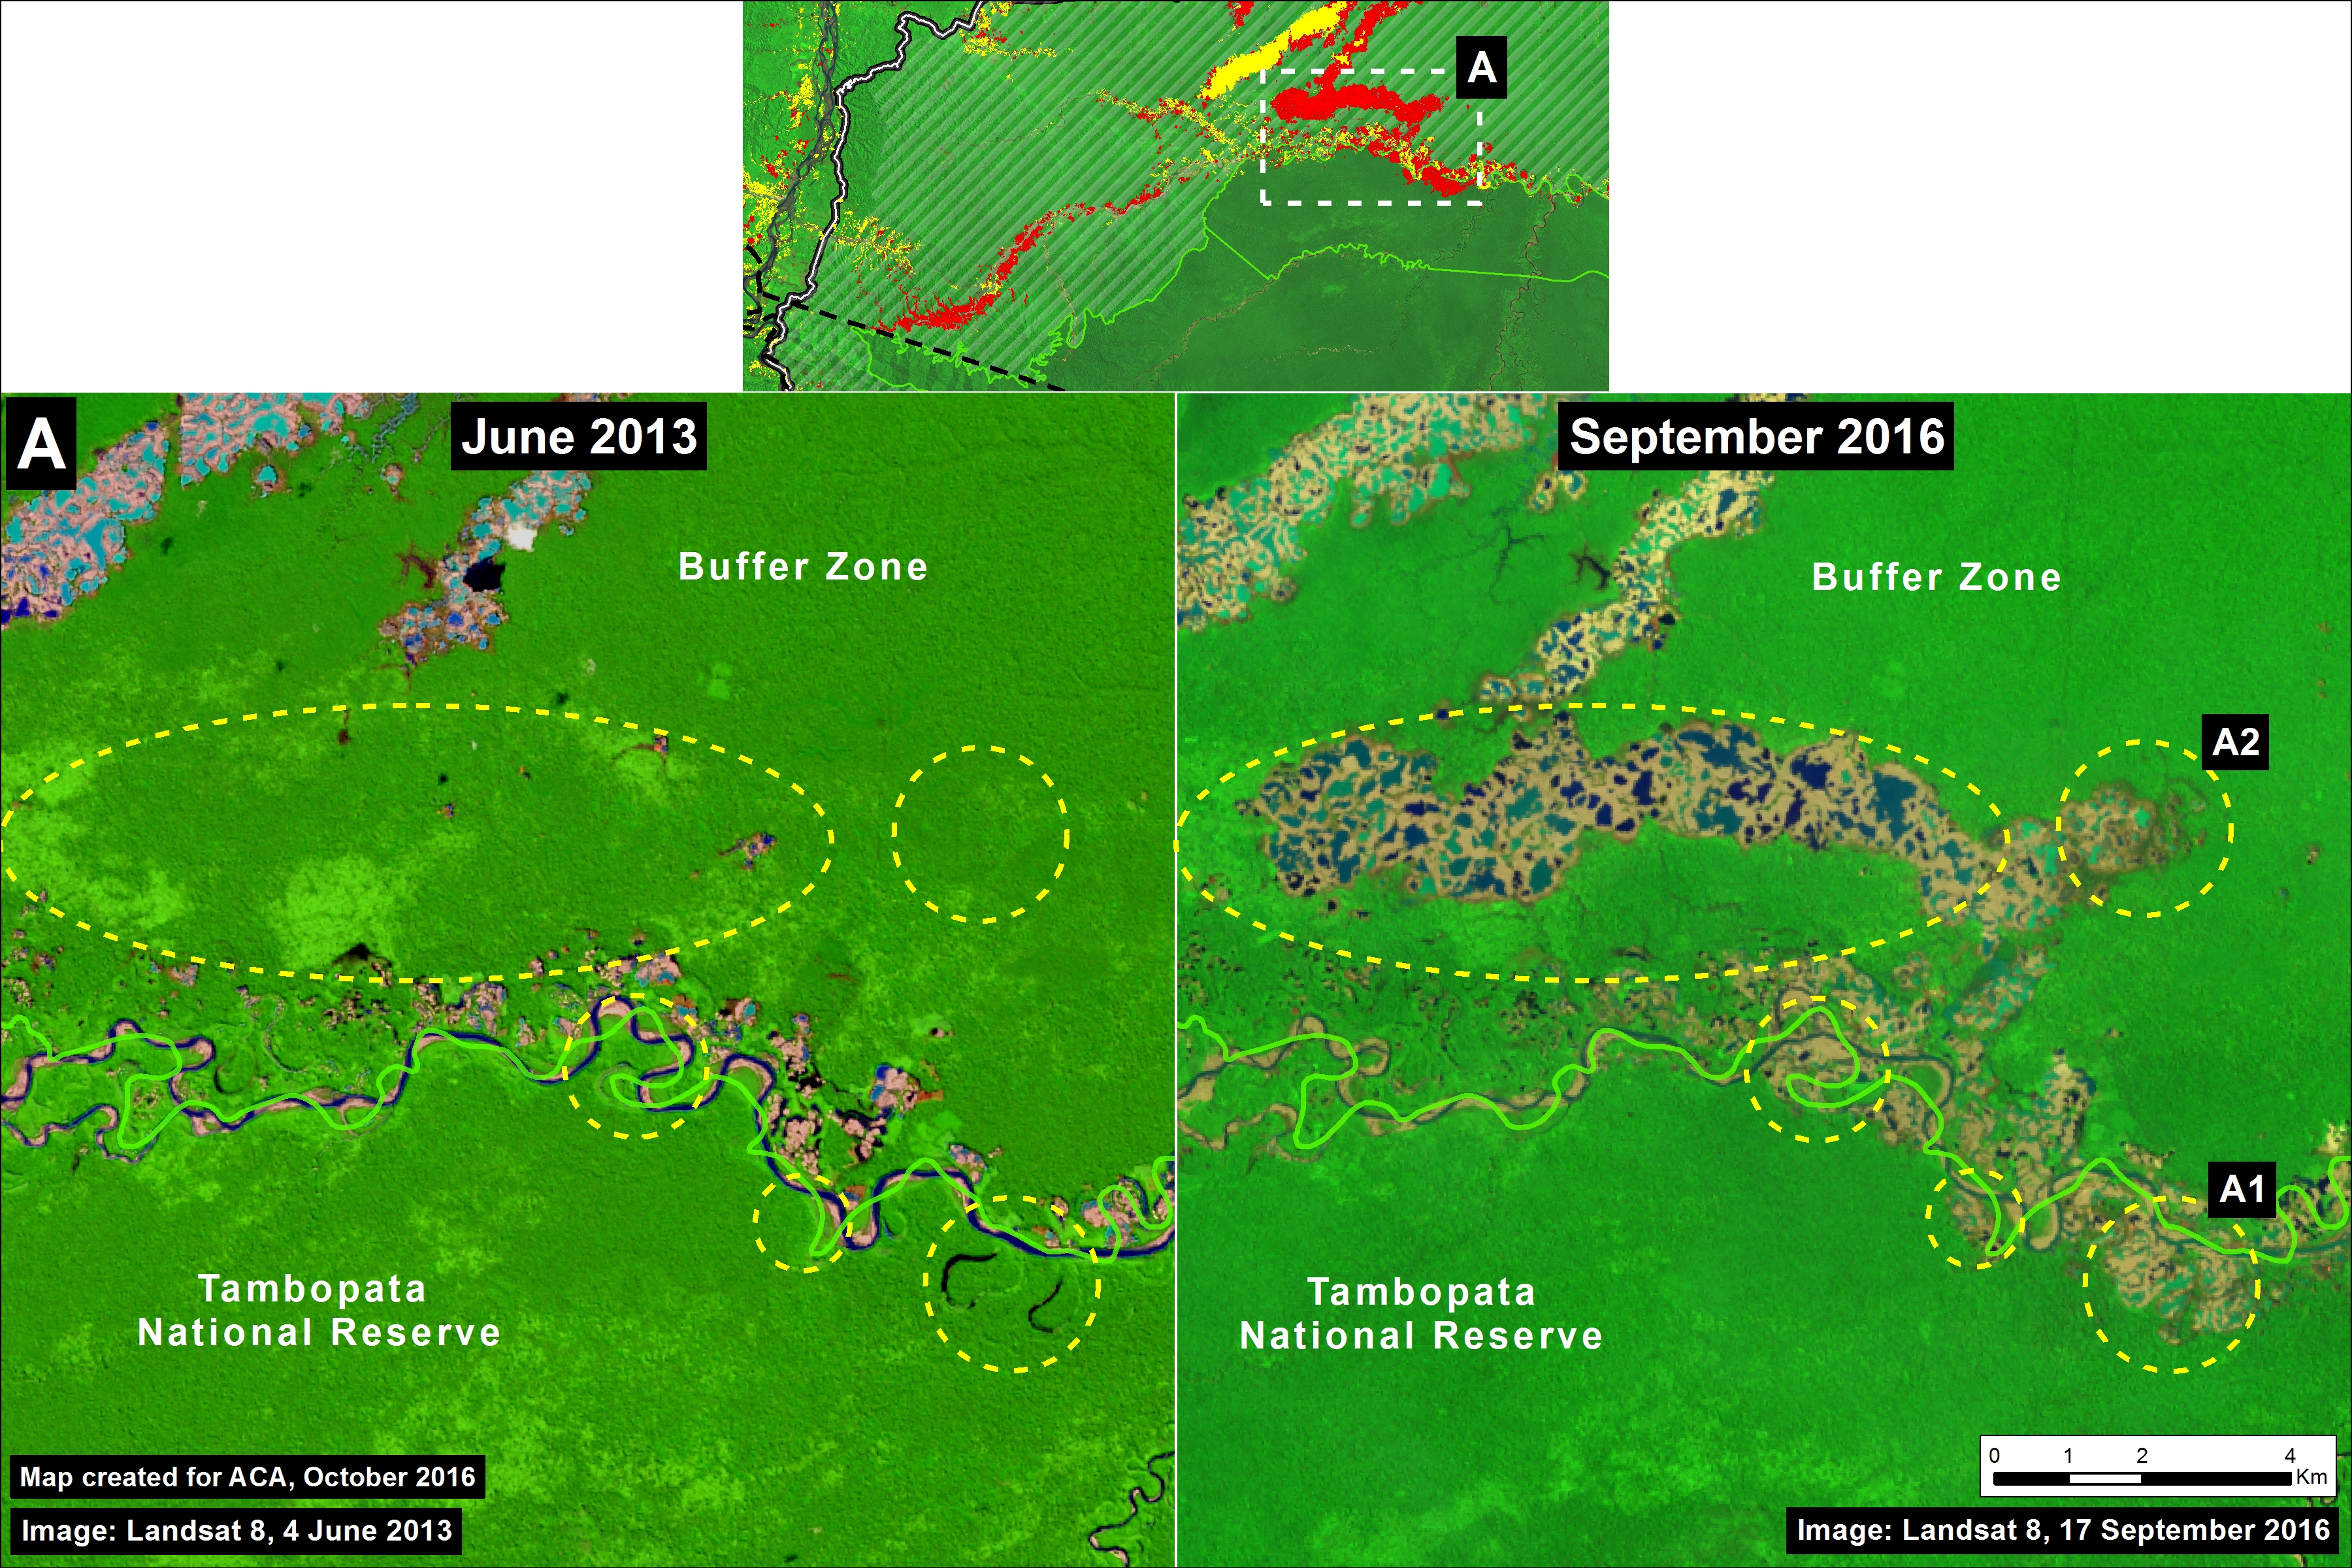
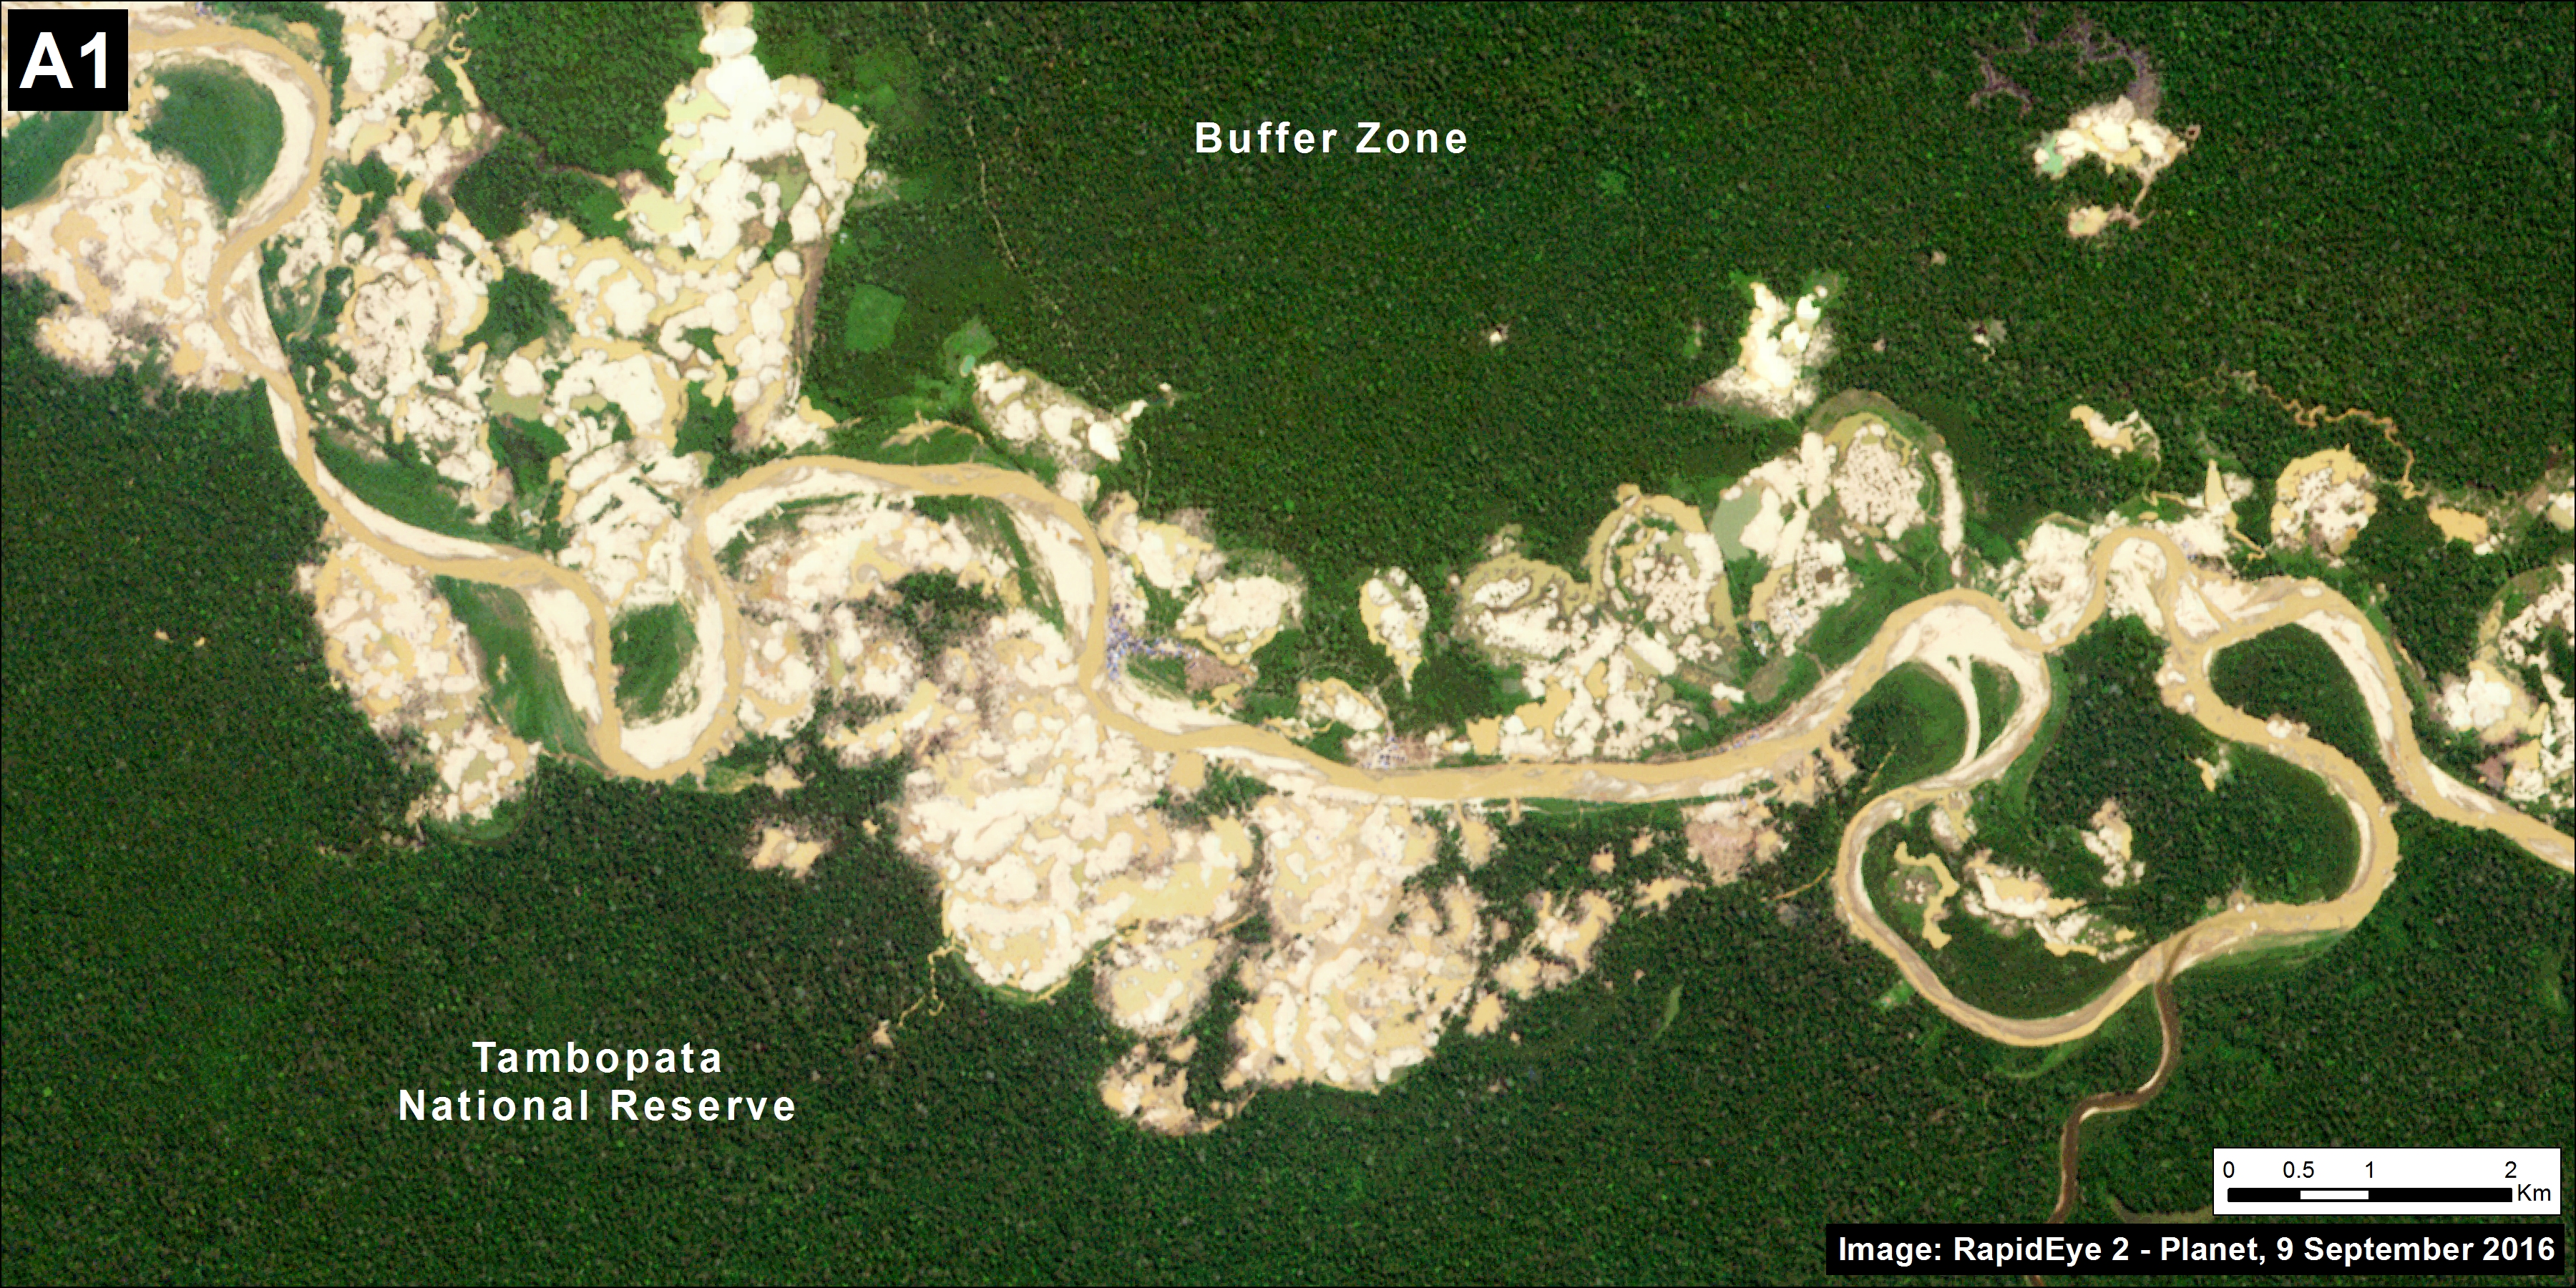
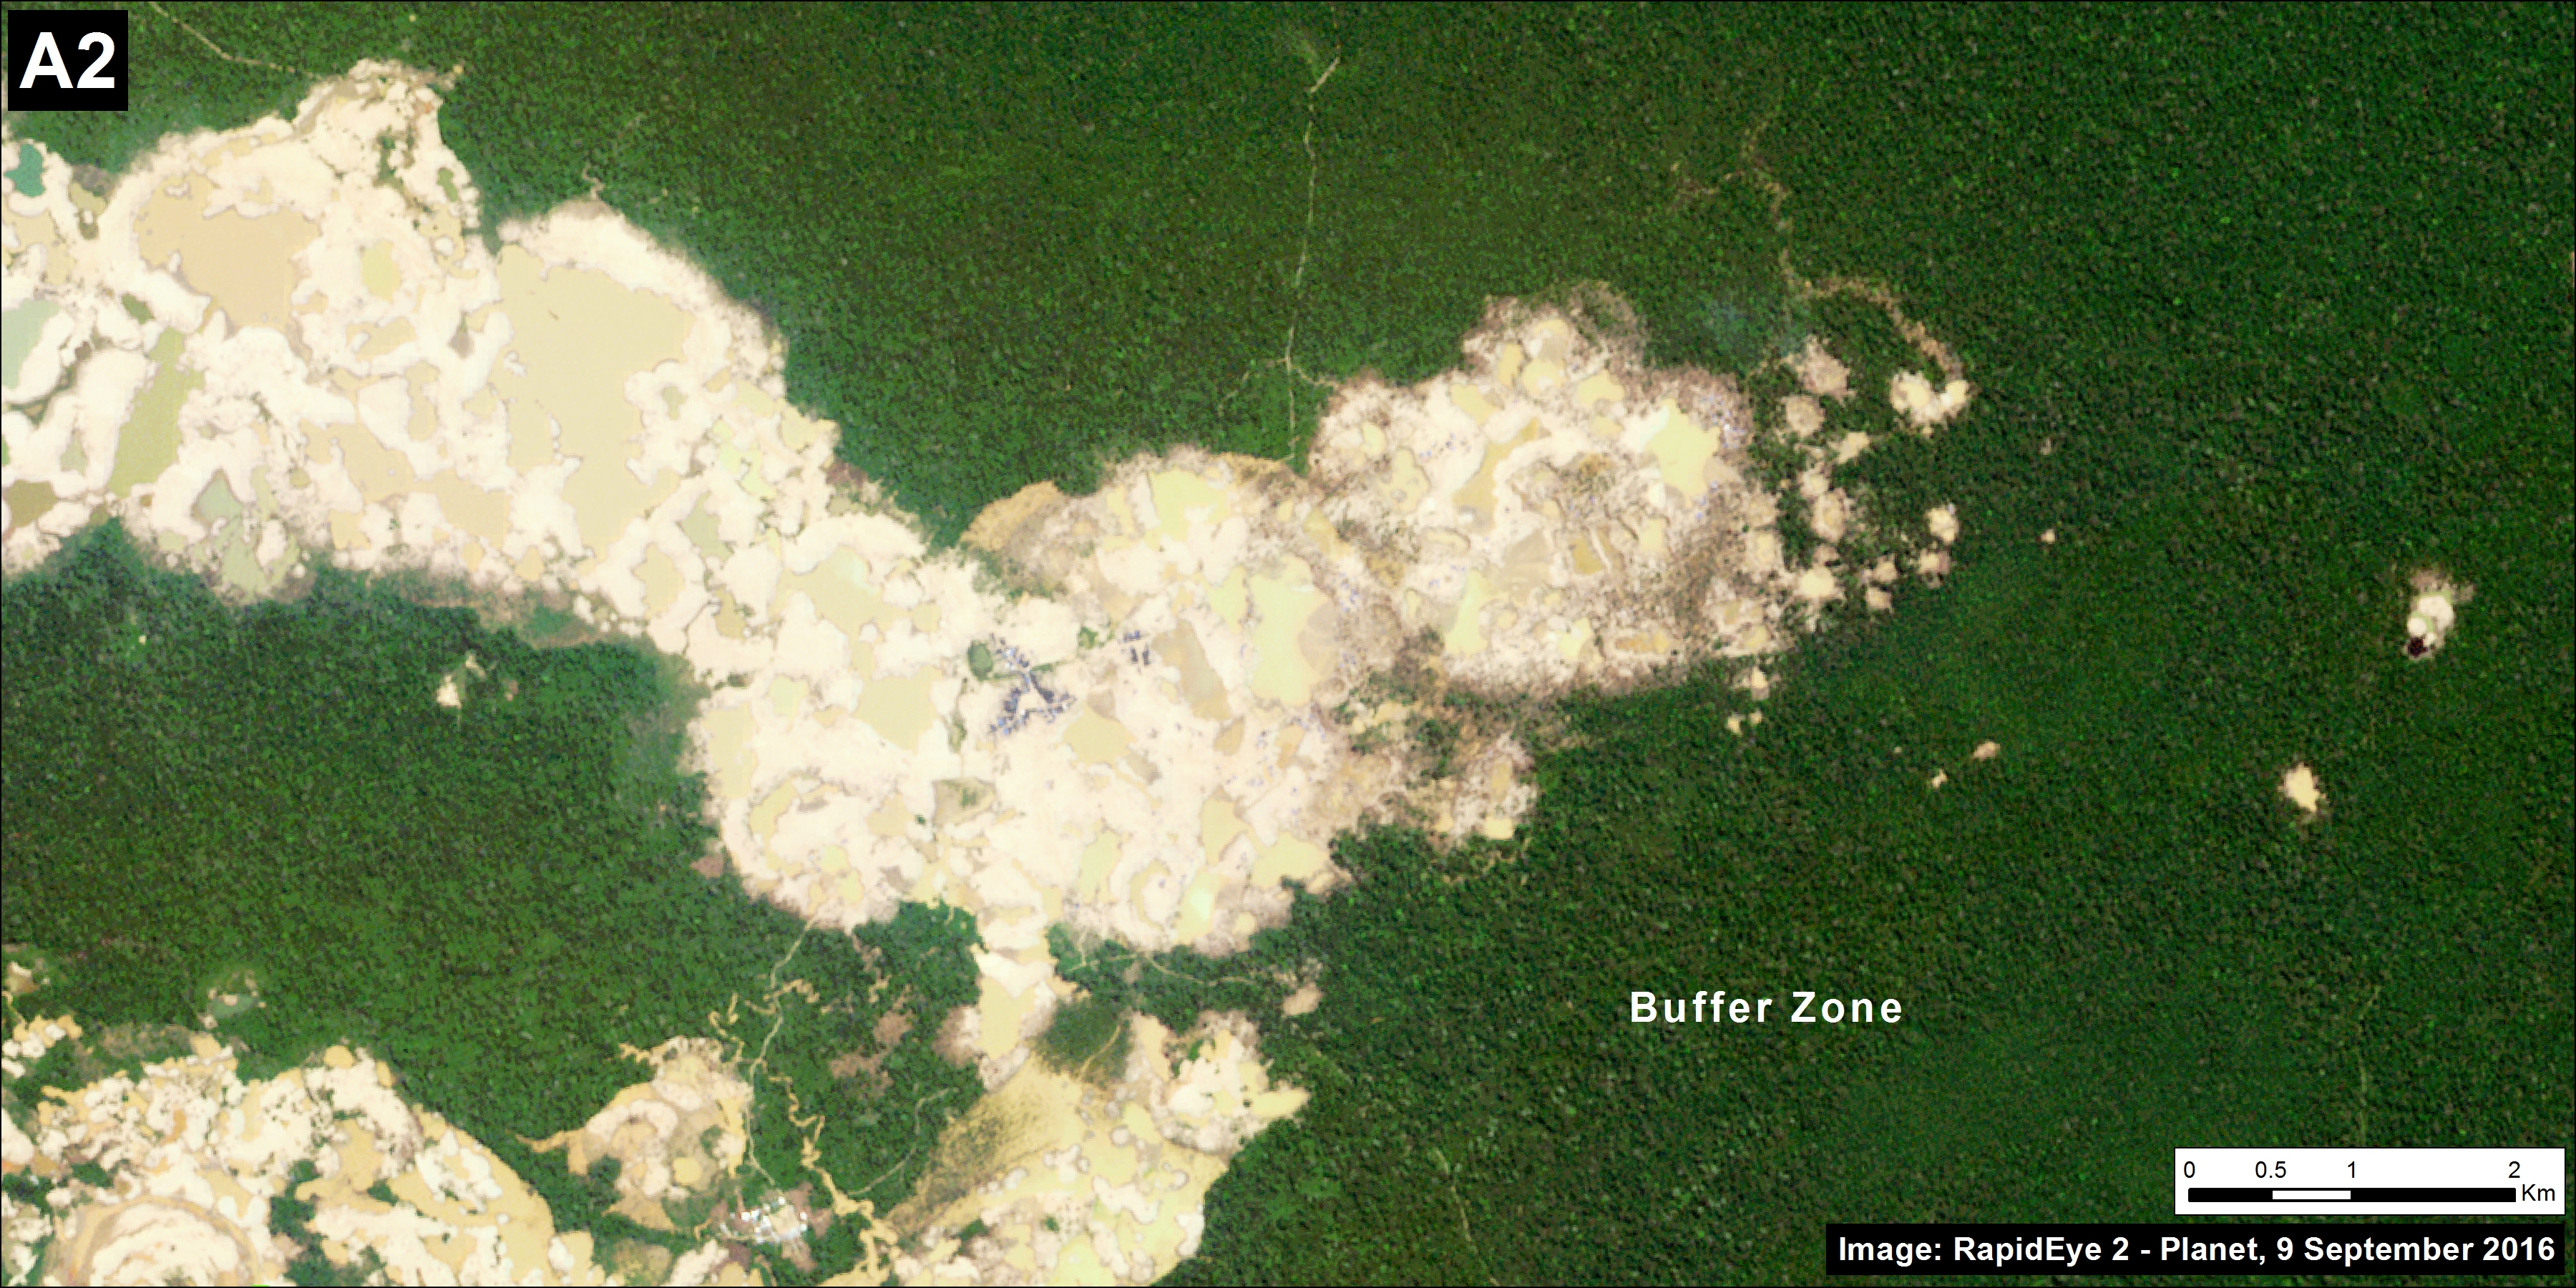
Gold mining is one of the major drivers of deforestation in the southern Peruvian Amazon (Hotspot C). An important study found that gold mining cleared around 123,550 acres up through 2012.9 We built off this work, and by analyzing hundreds of high resolution imageres, found that gold mining caused the loss of an additional 30,890 acres between 2013 and 2016 (MAAP #50). Thus, gold mining is thus far responsible for the total loss of around 154,440 acres in southern Peru. Much of the most recent deforestation is illegal due to its occurrence in protected areas and buffer zones strictly off-limits to mining activities.

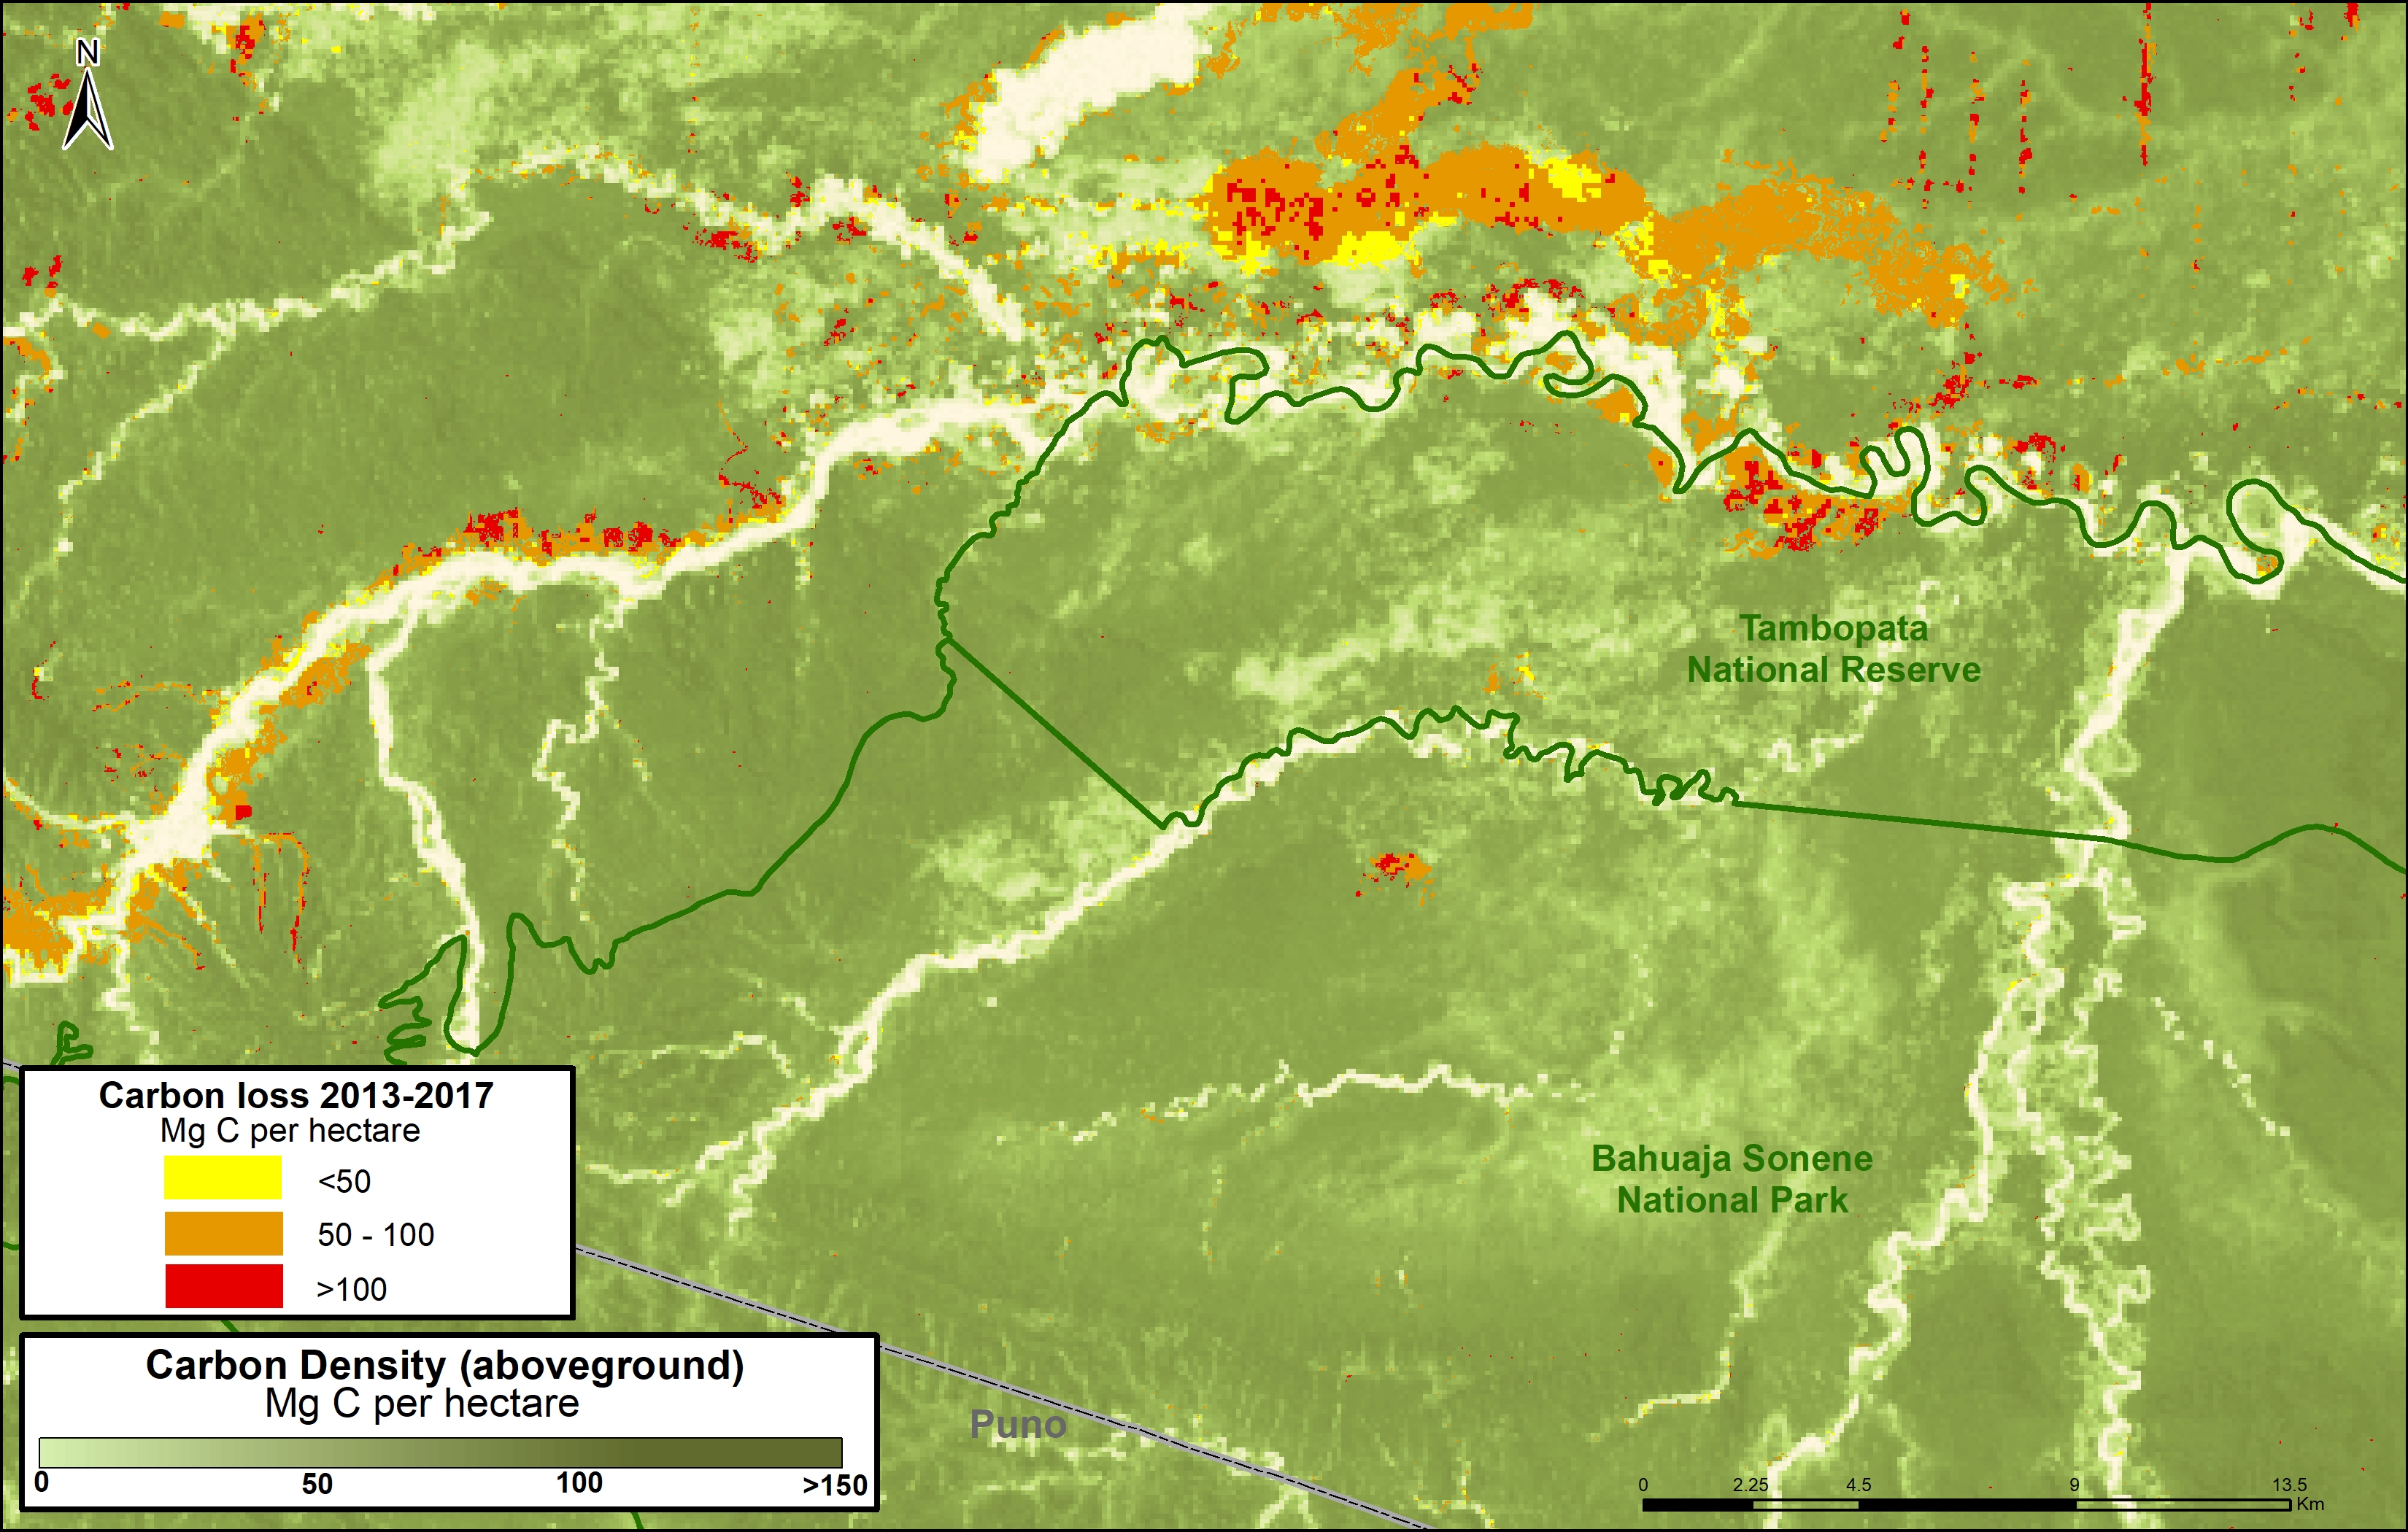
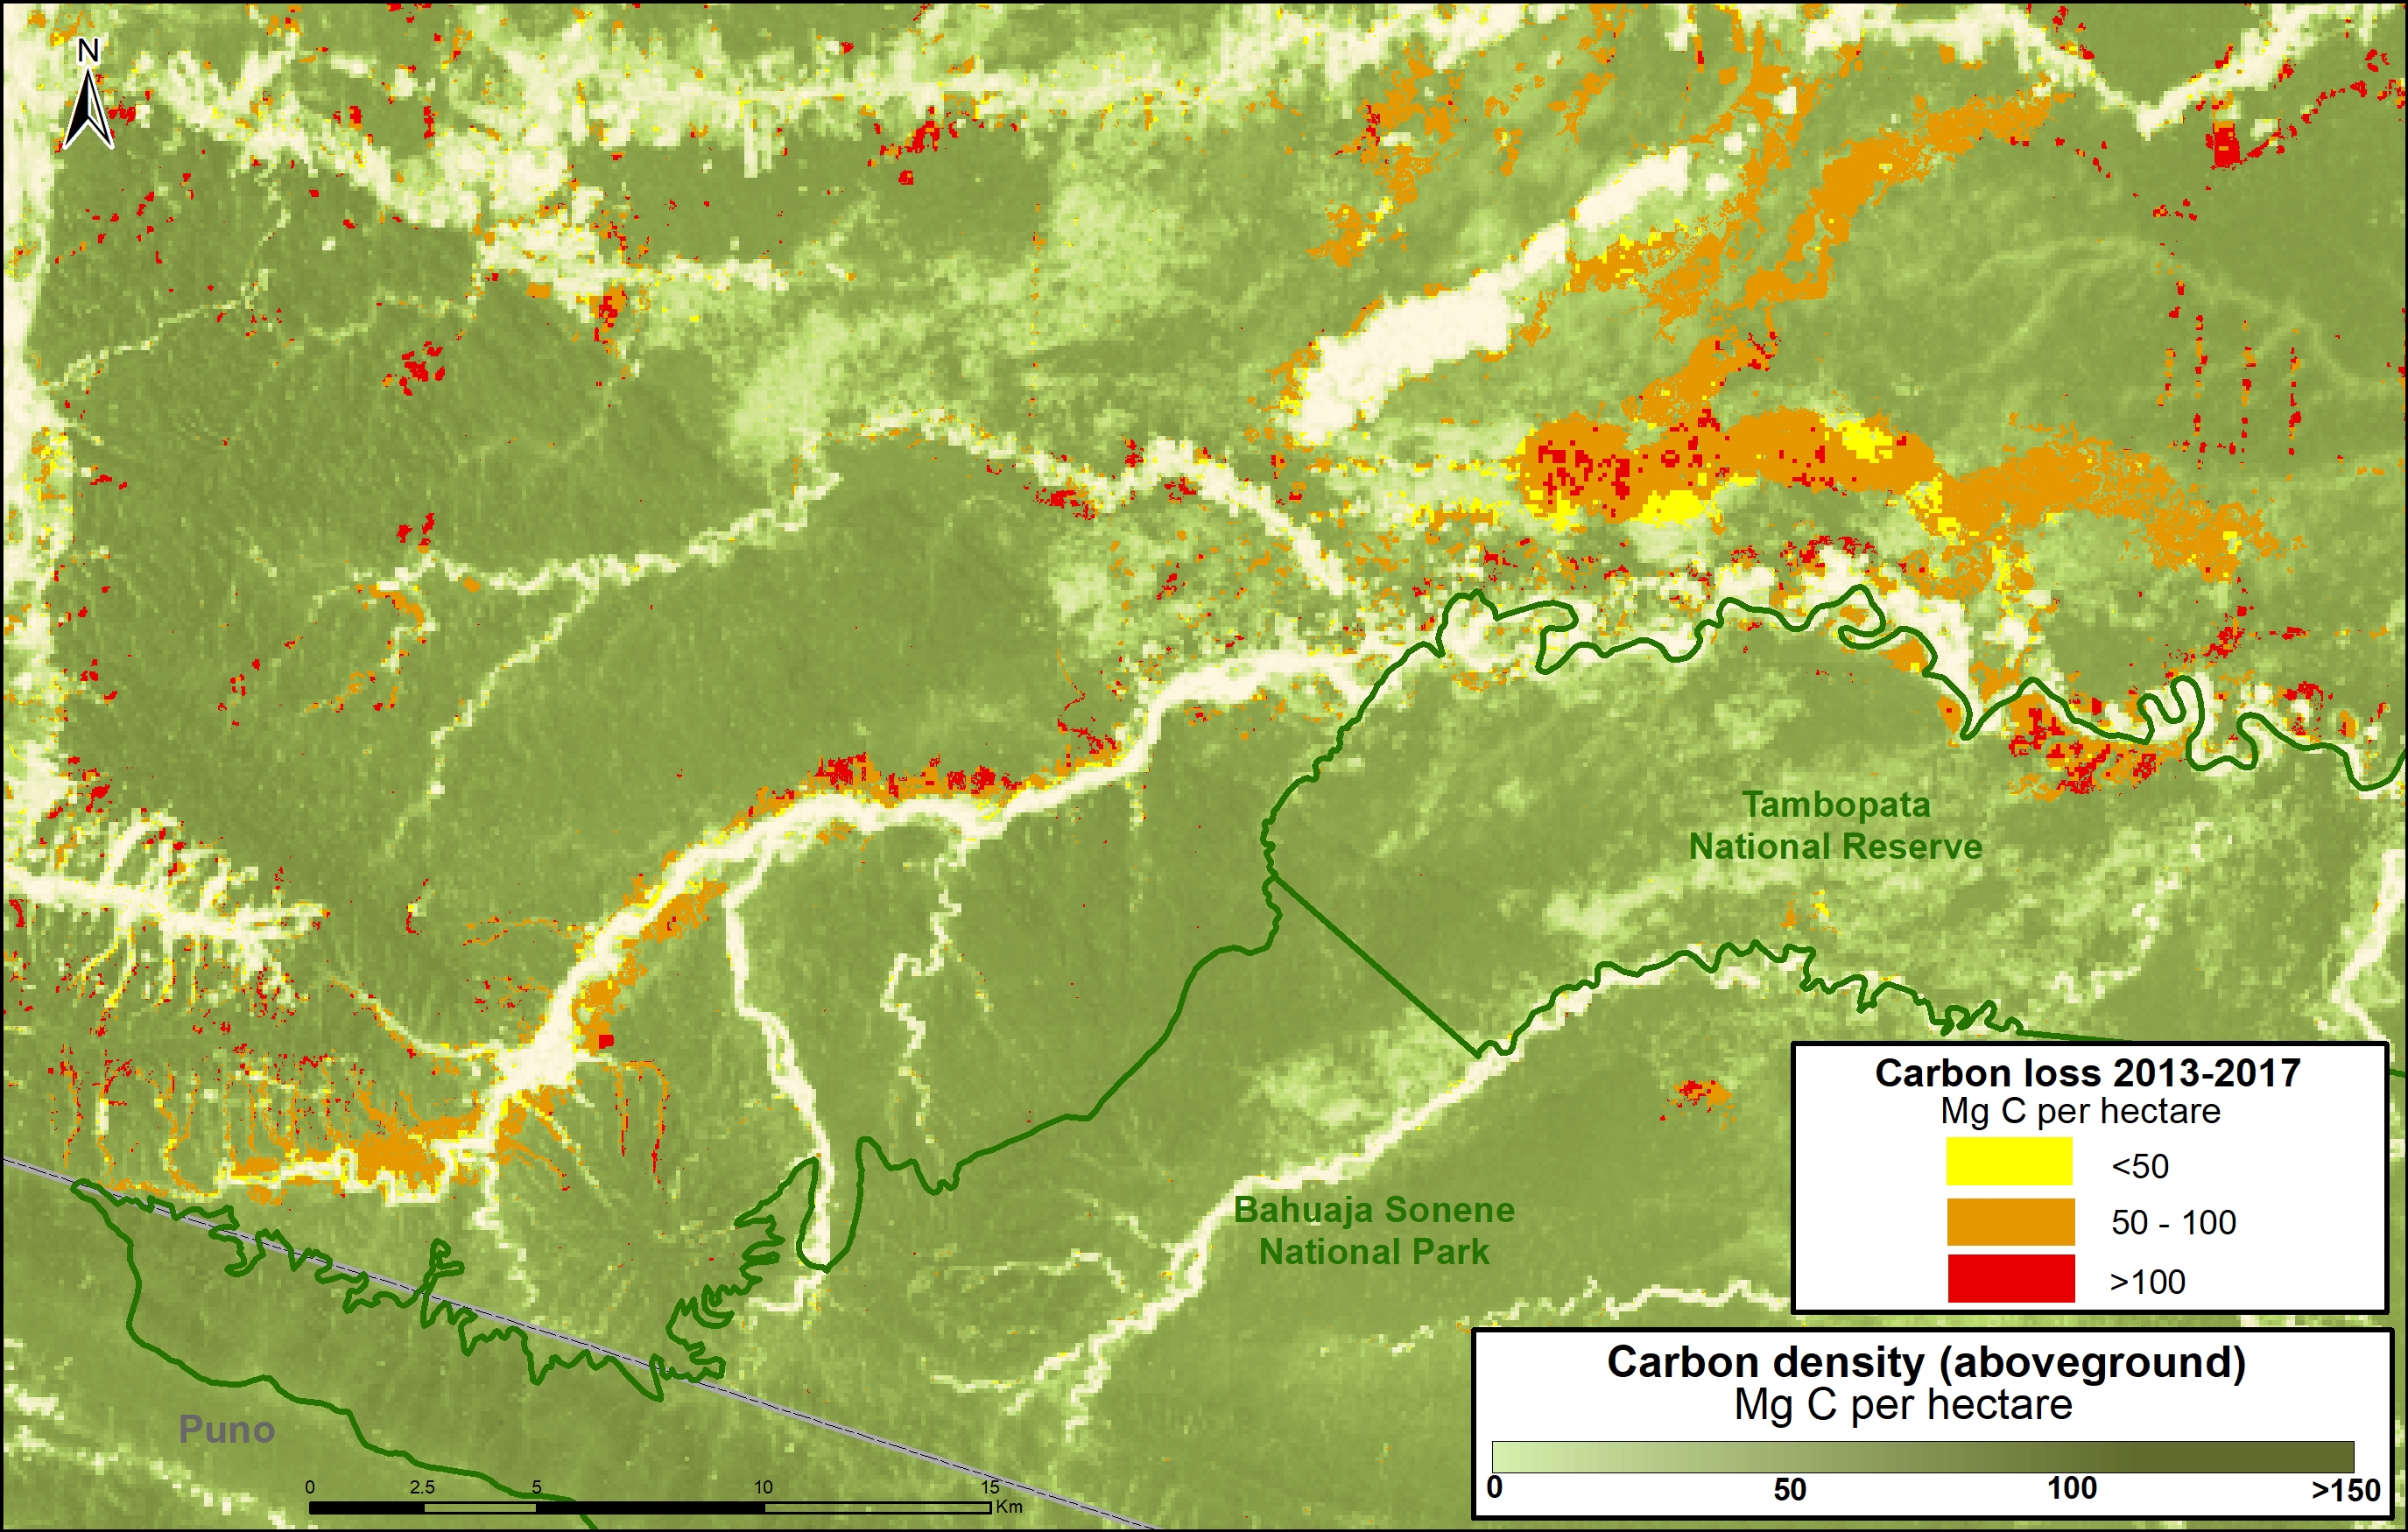
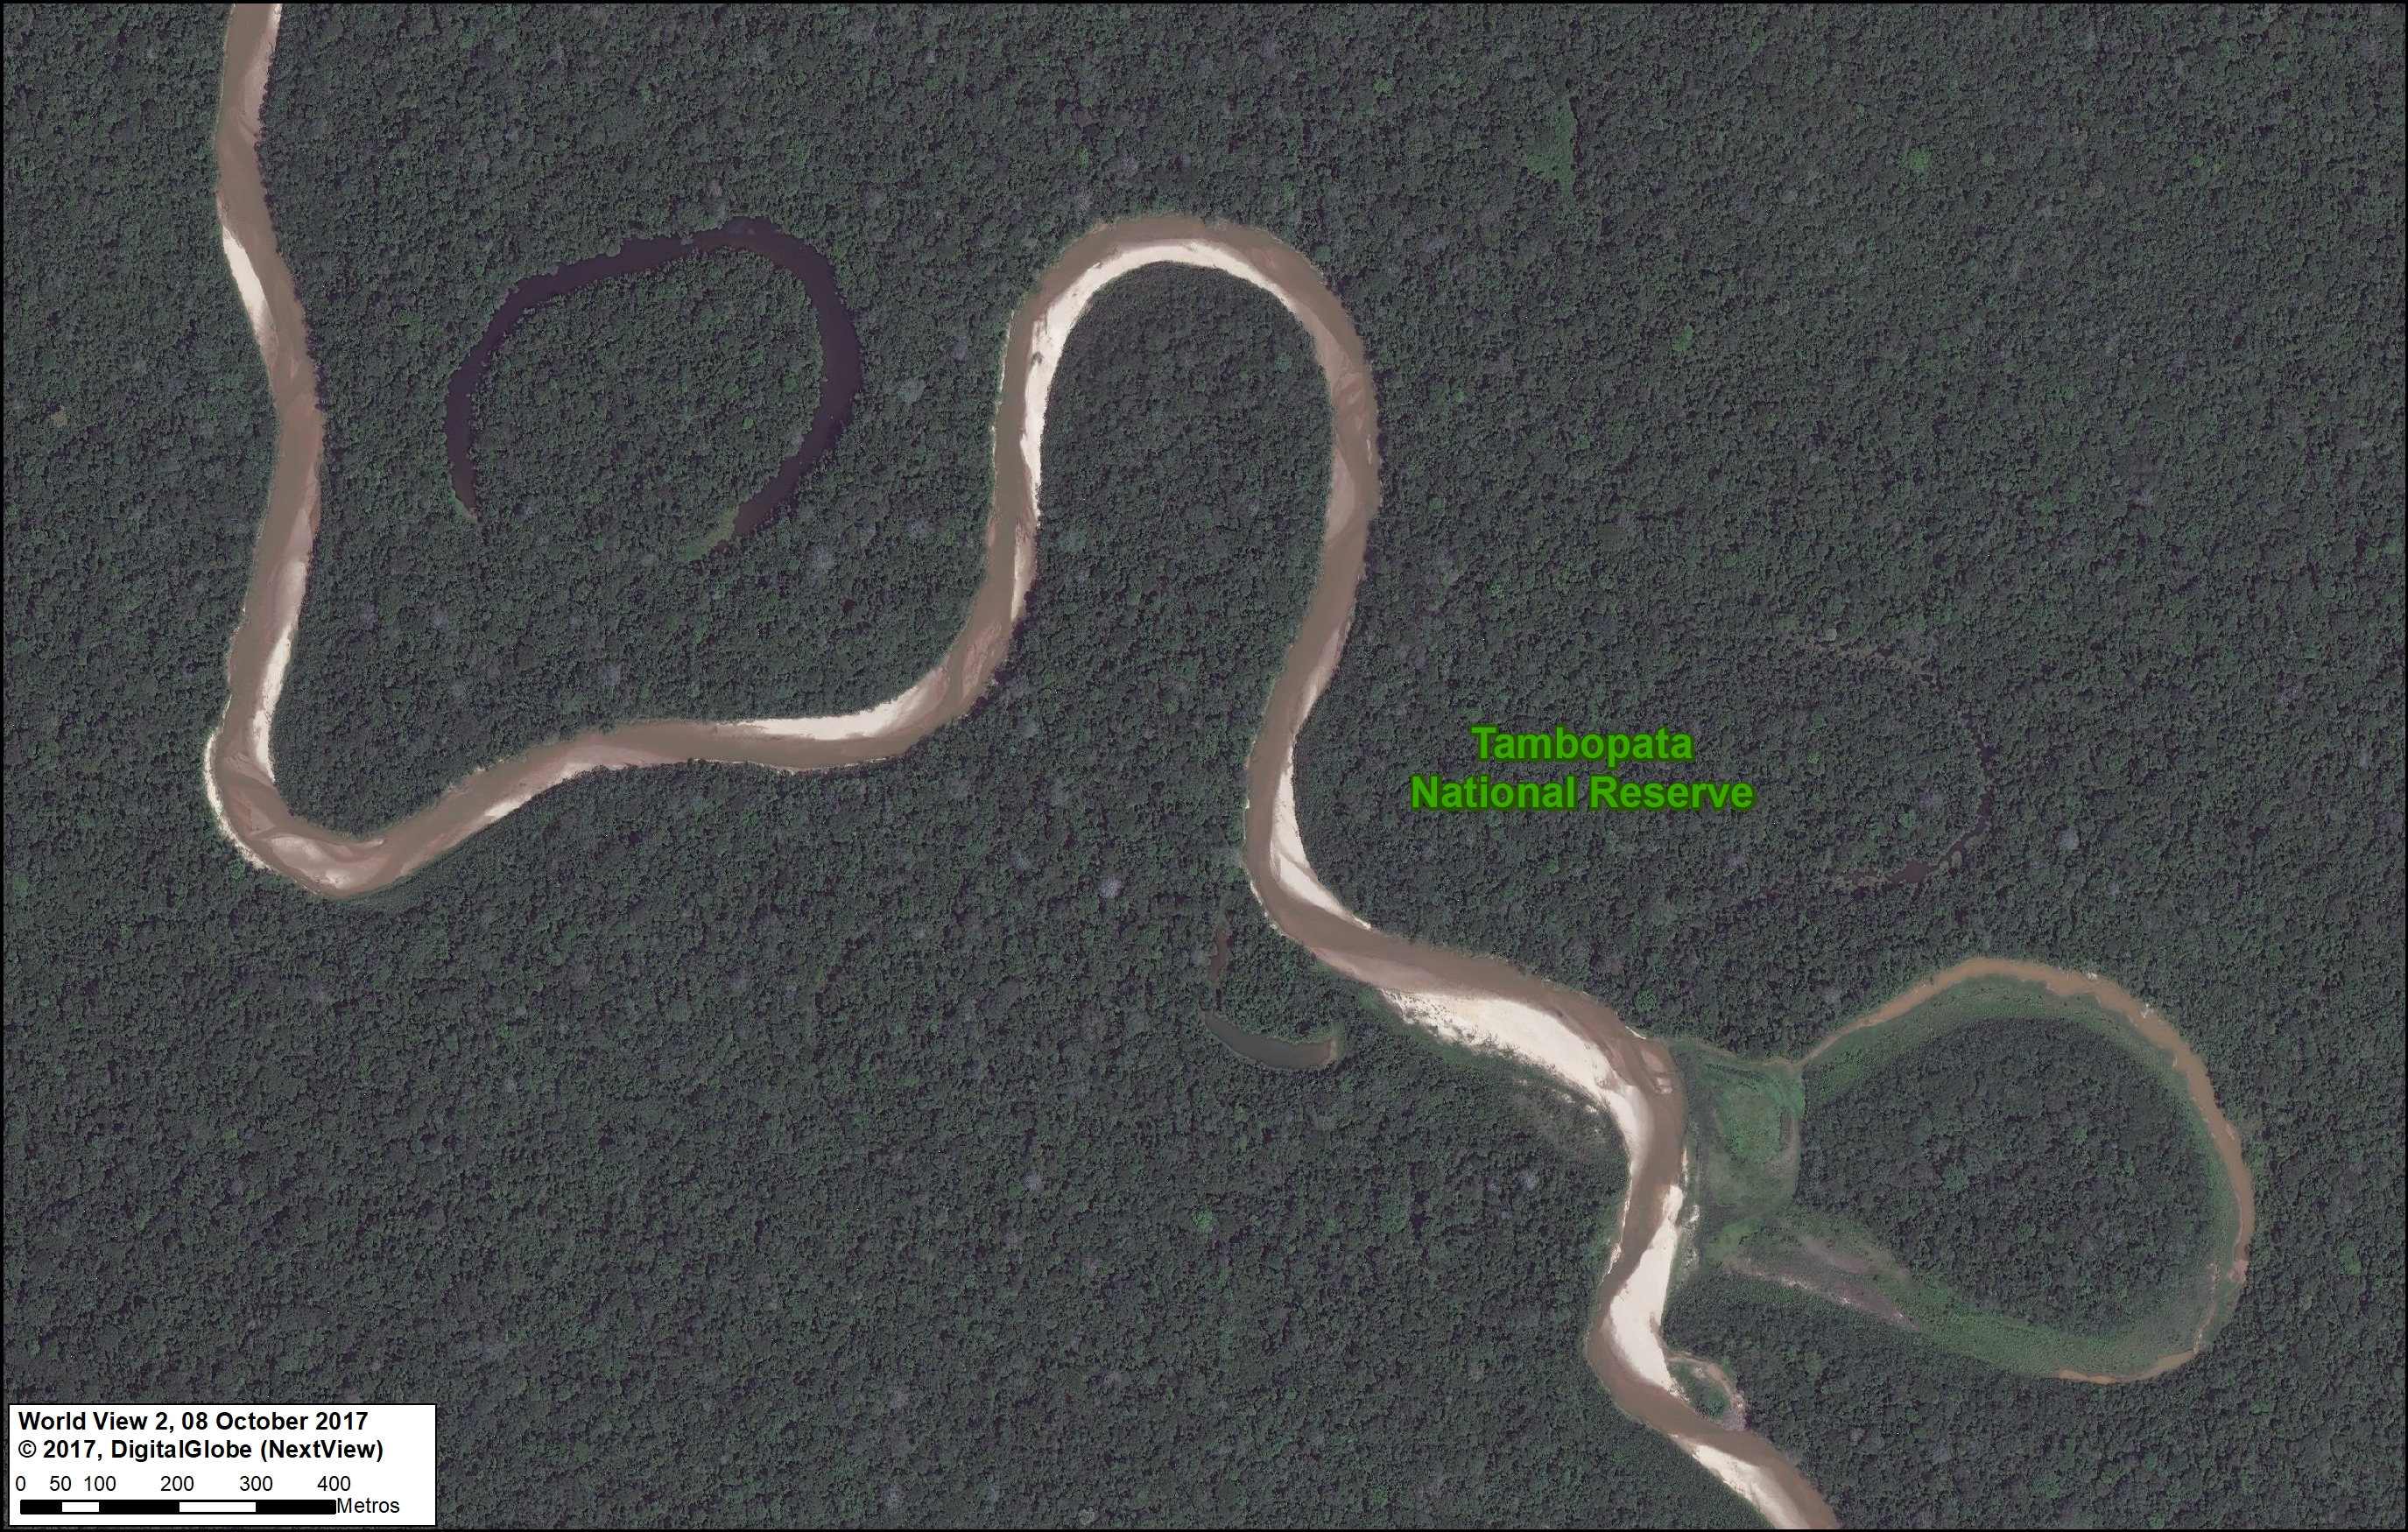
Most notably, we have closely tracked the illegal gold mining invasion of Tambopata National Reserve, an important protected area in the Madre de Dios region with renowned biodiversity and ecotourism. The initial invasion occurred in November 2015 (MAAP #21), and has steadily expanded to over 1,110 acres (MAAP #24, MAAP #30, MAAP #46). As part of this invasion, miners have modified the natural course of the Malinowski River, which forms the natural northern border of the reserve (MAAP #33). In addition, illegal gold mining deforestation continues to expand within the reserve’s buffer zone, particularly in an area known as La Pampa (MAAP #12, MAAP #31).

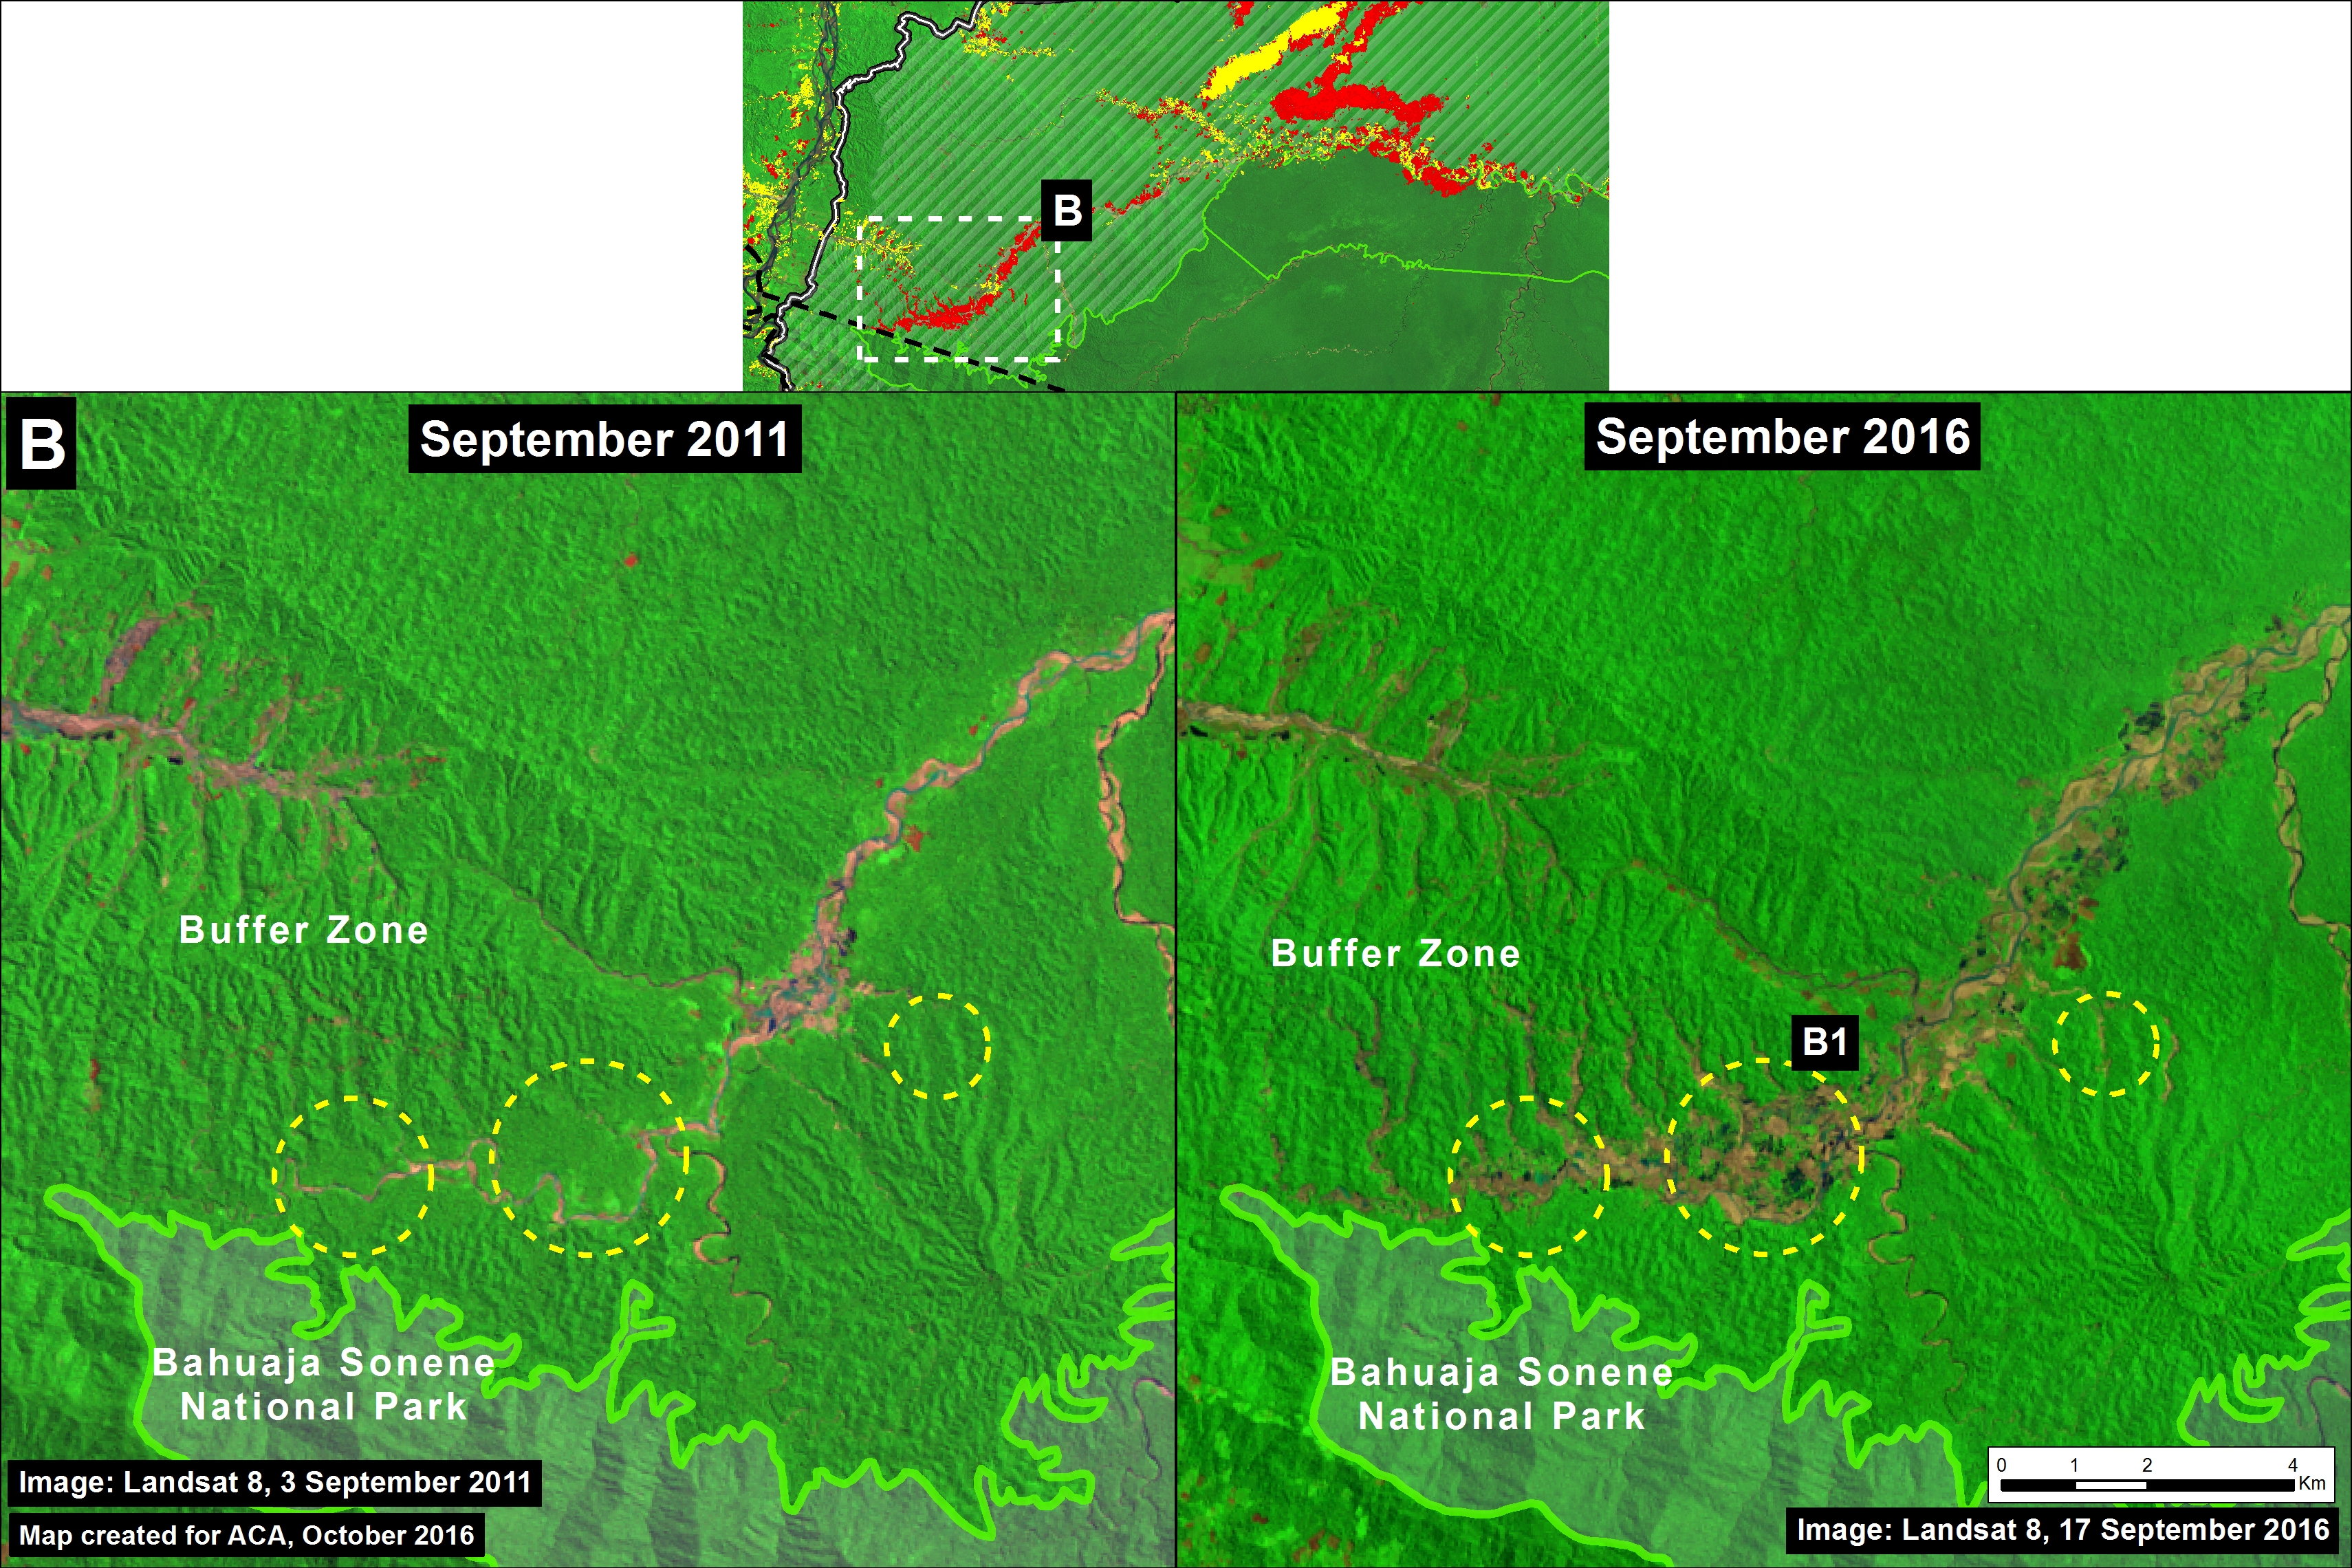
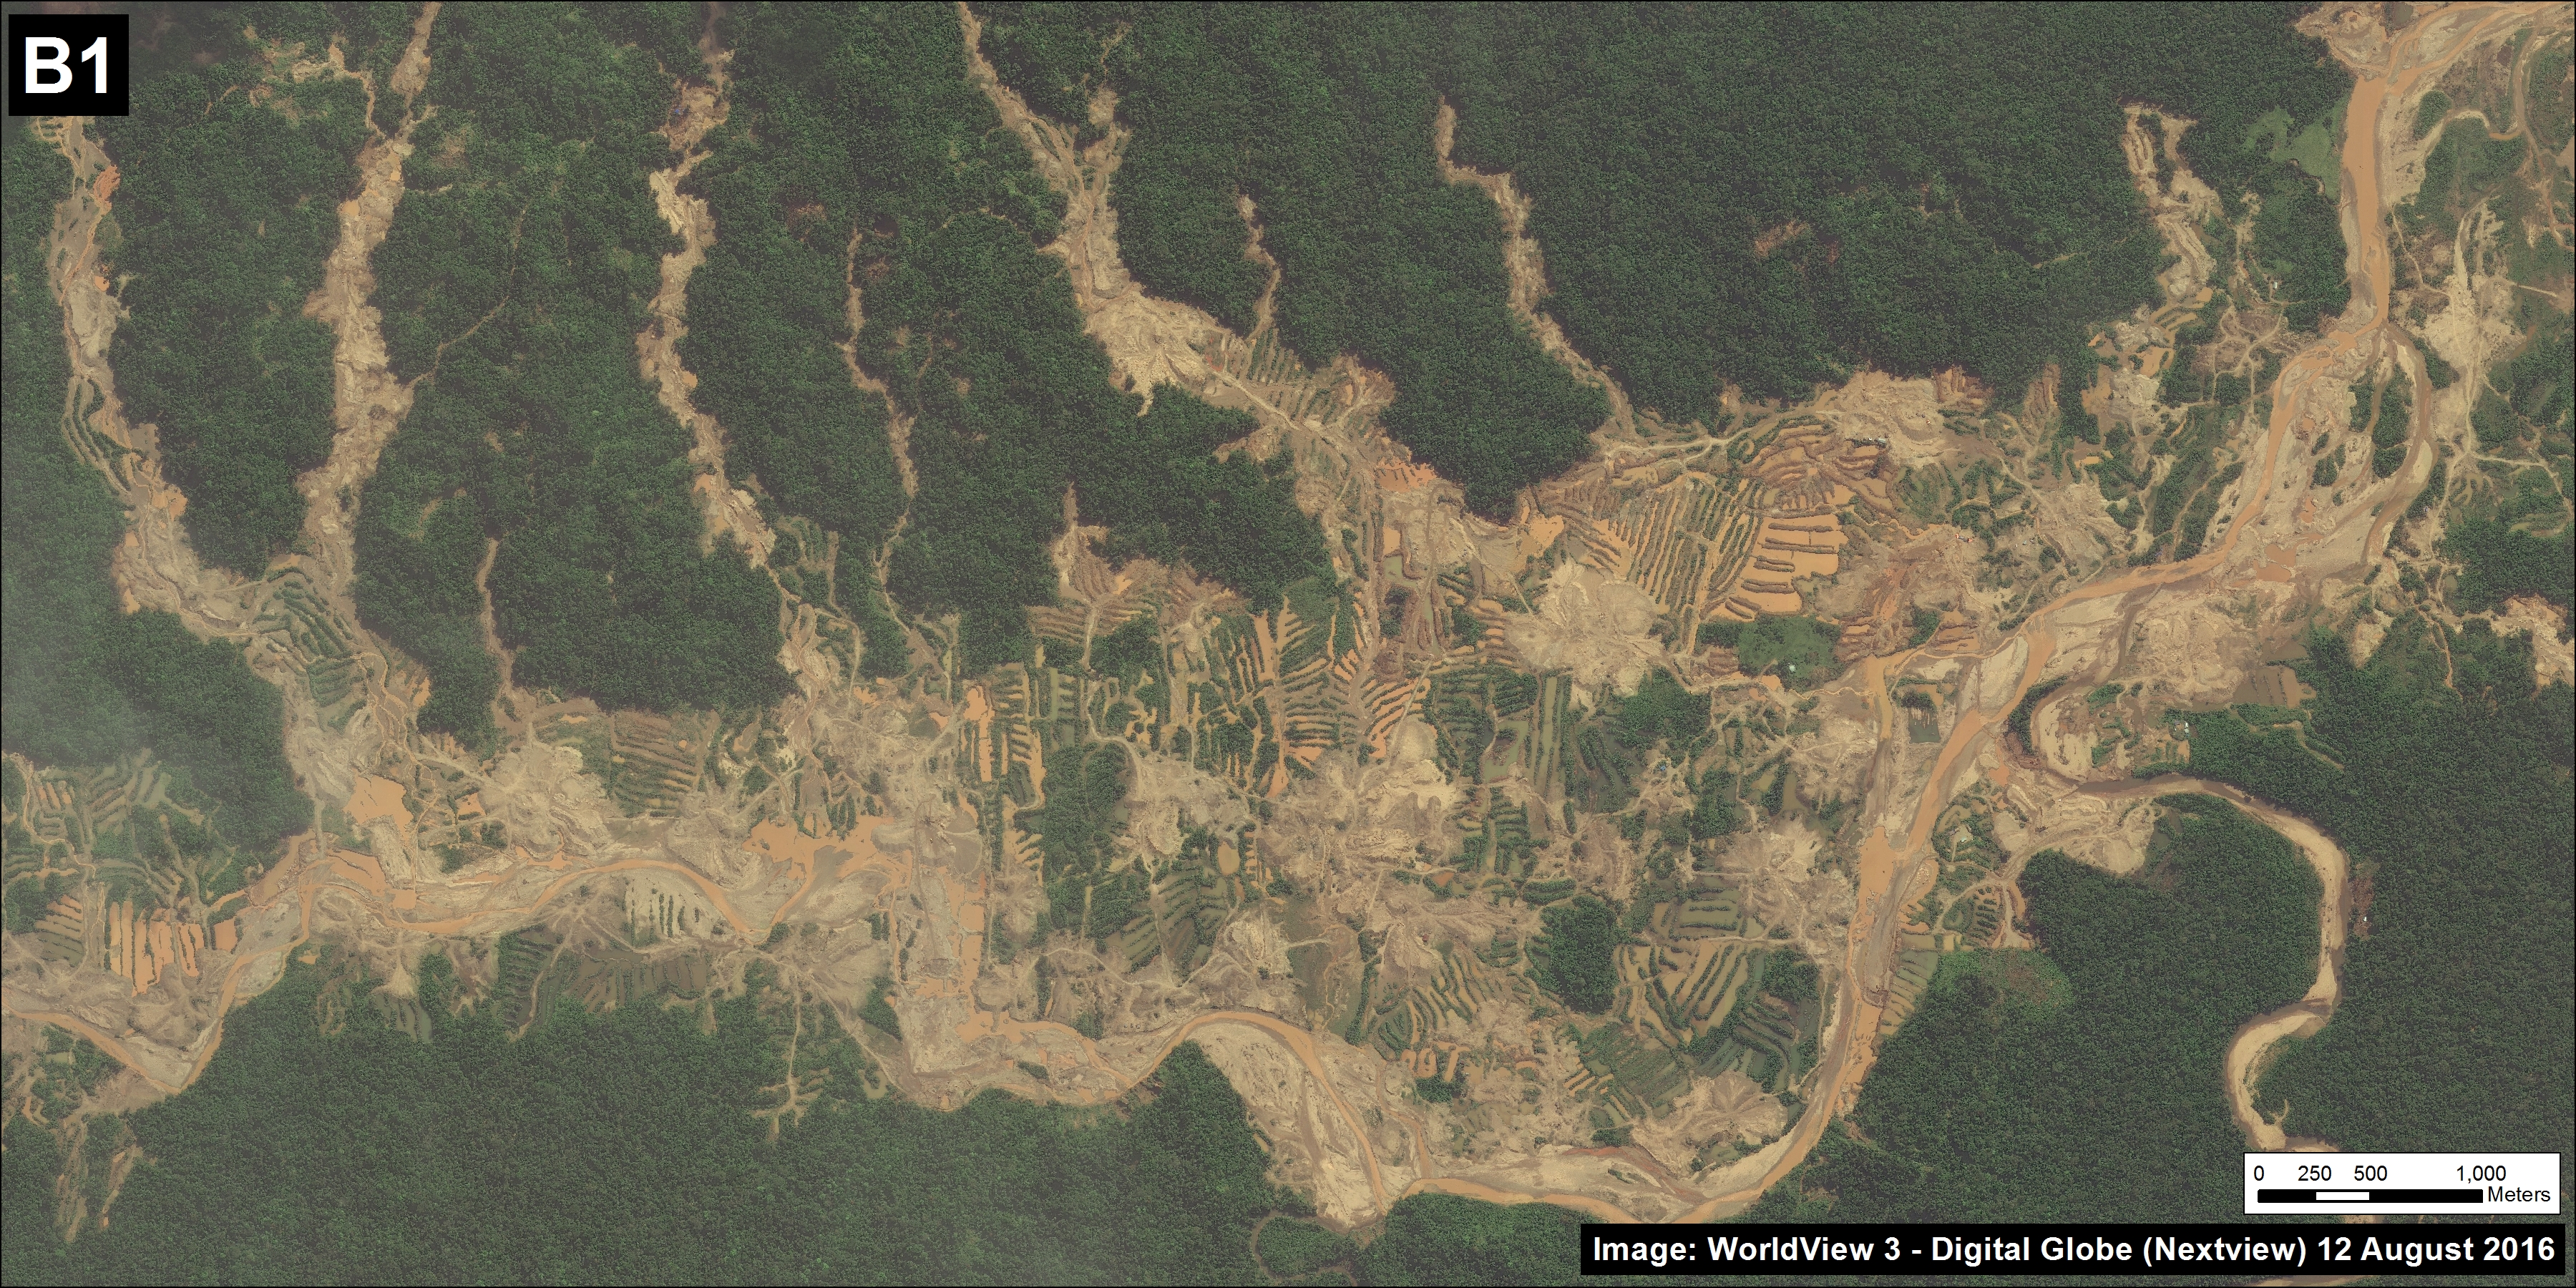
Further upstream, illegal gold mining is also expanding on the upper Malinowski River, within the buffer zone of Bahuaja Sonene National Park (MAAP #19, MAAP #43).

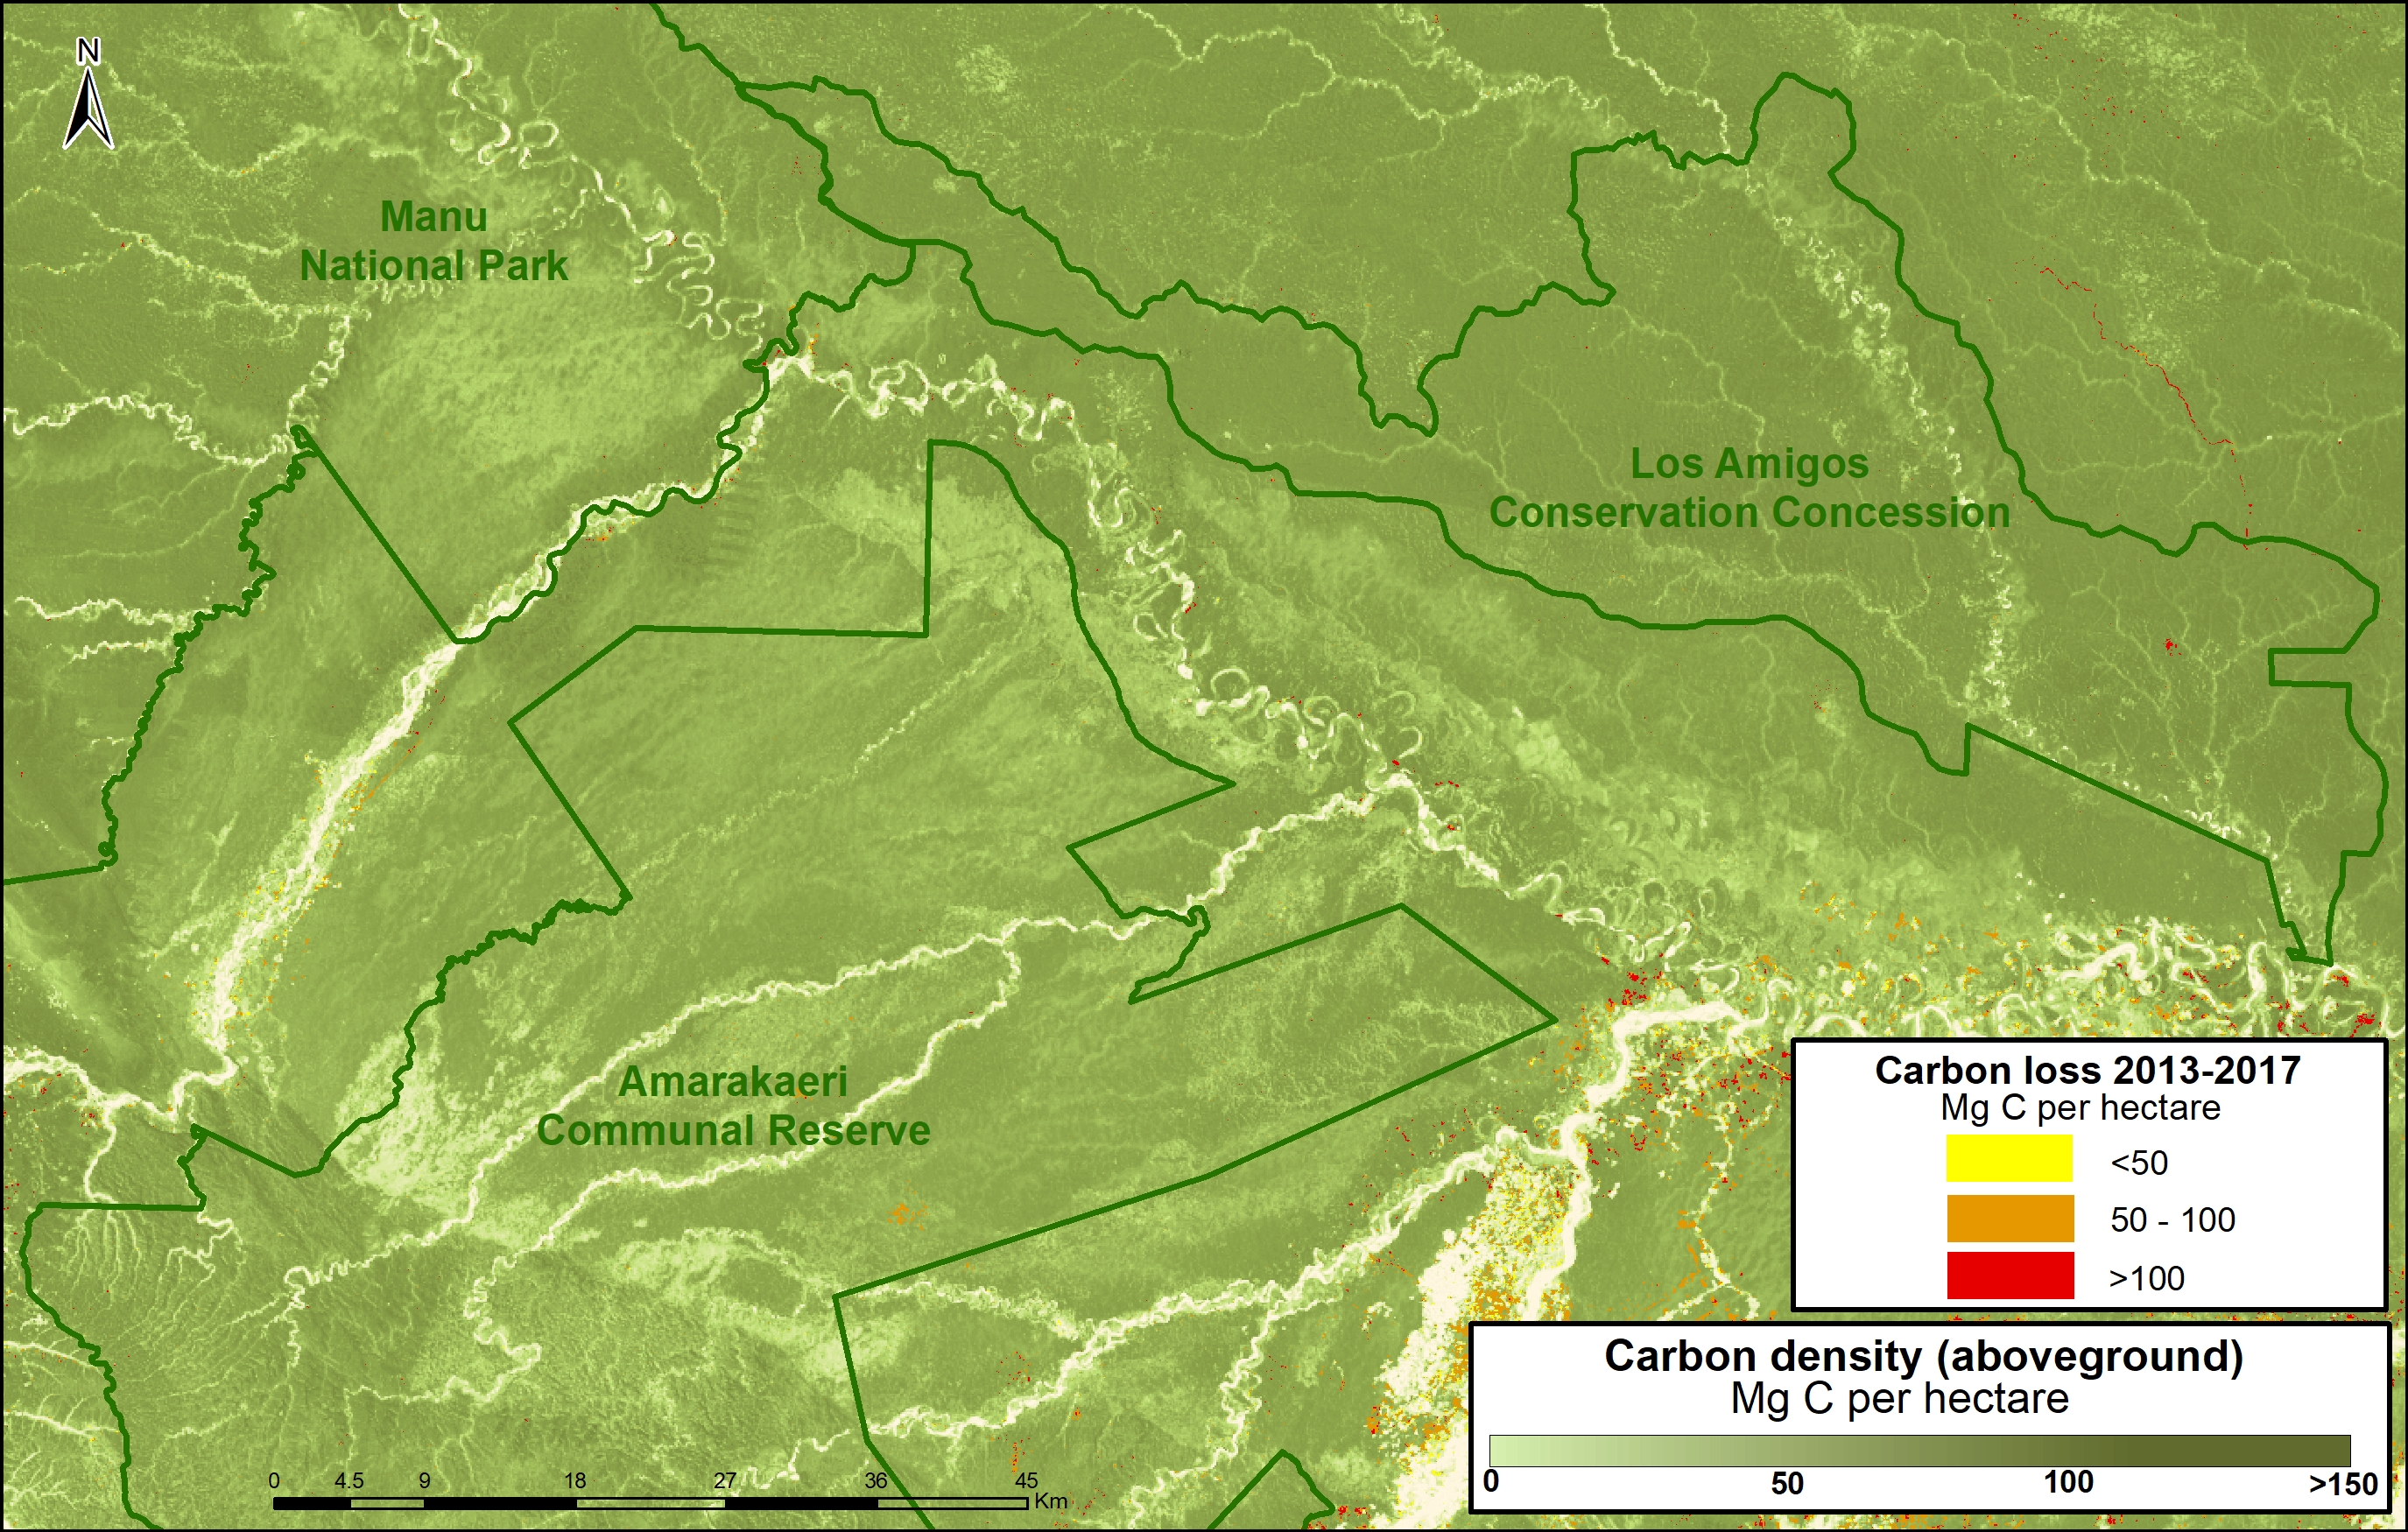
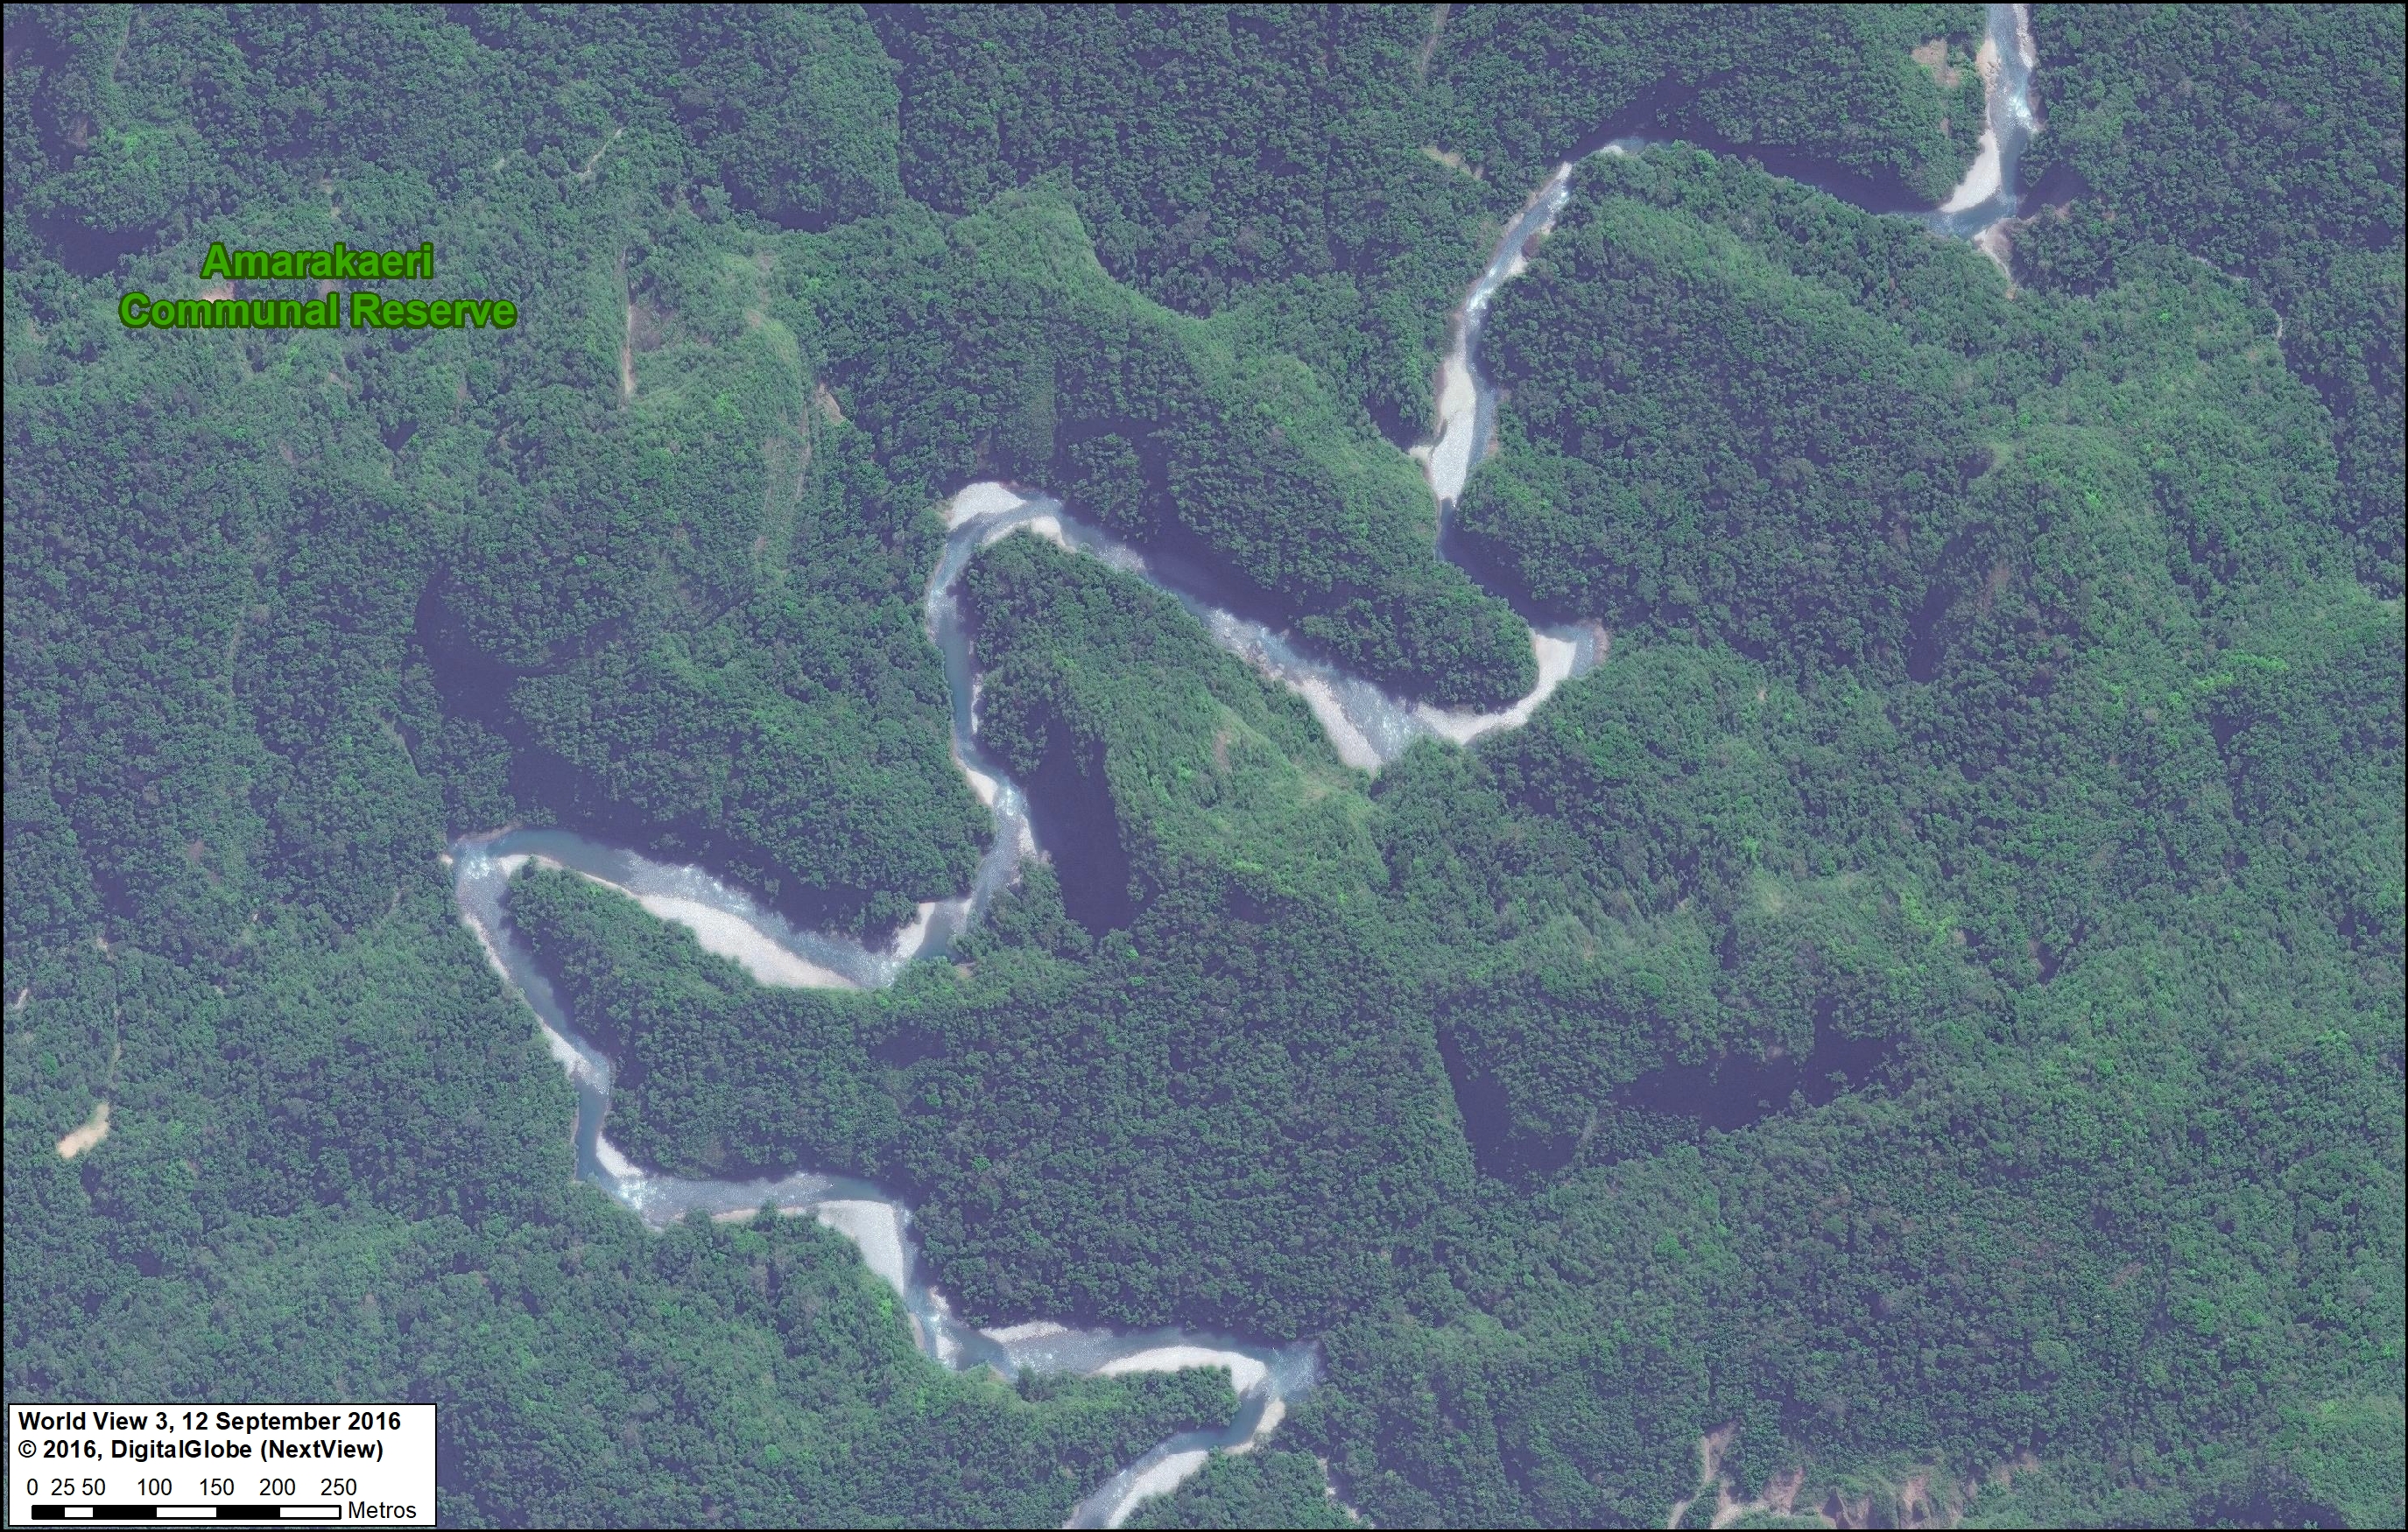
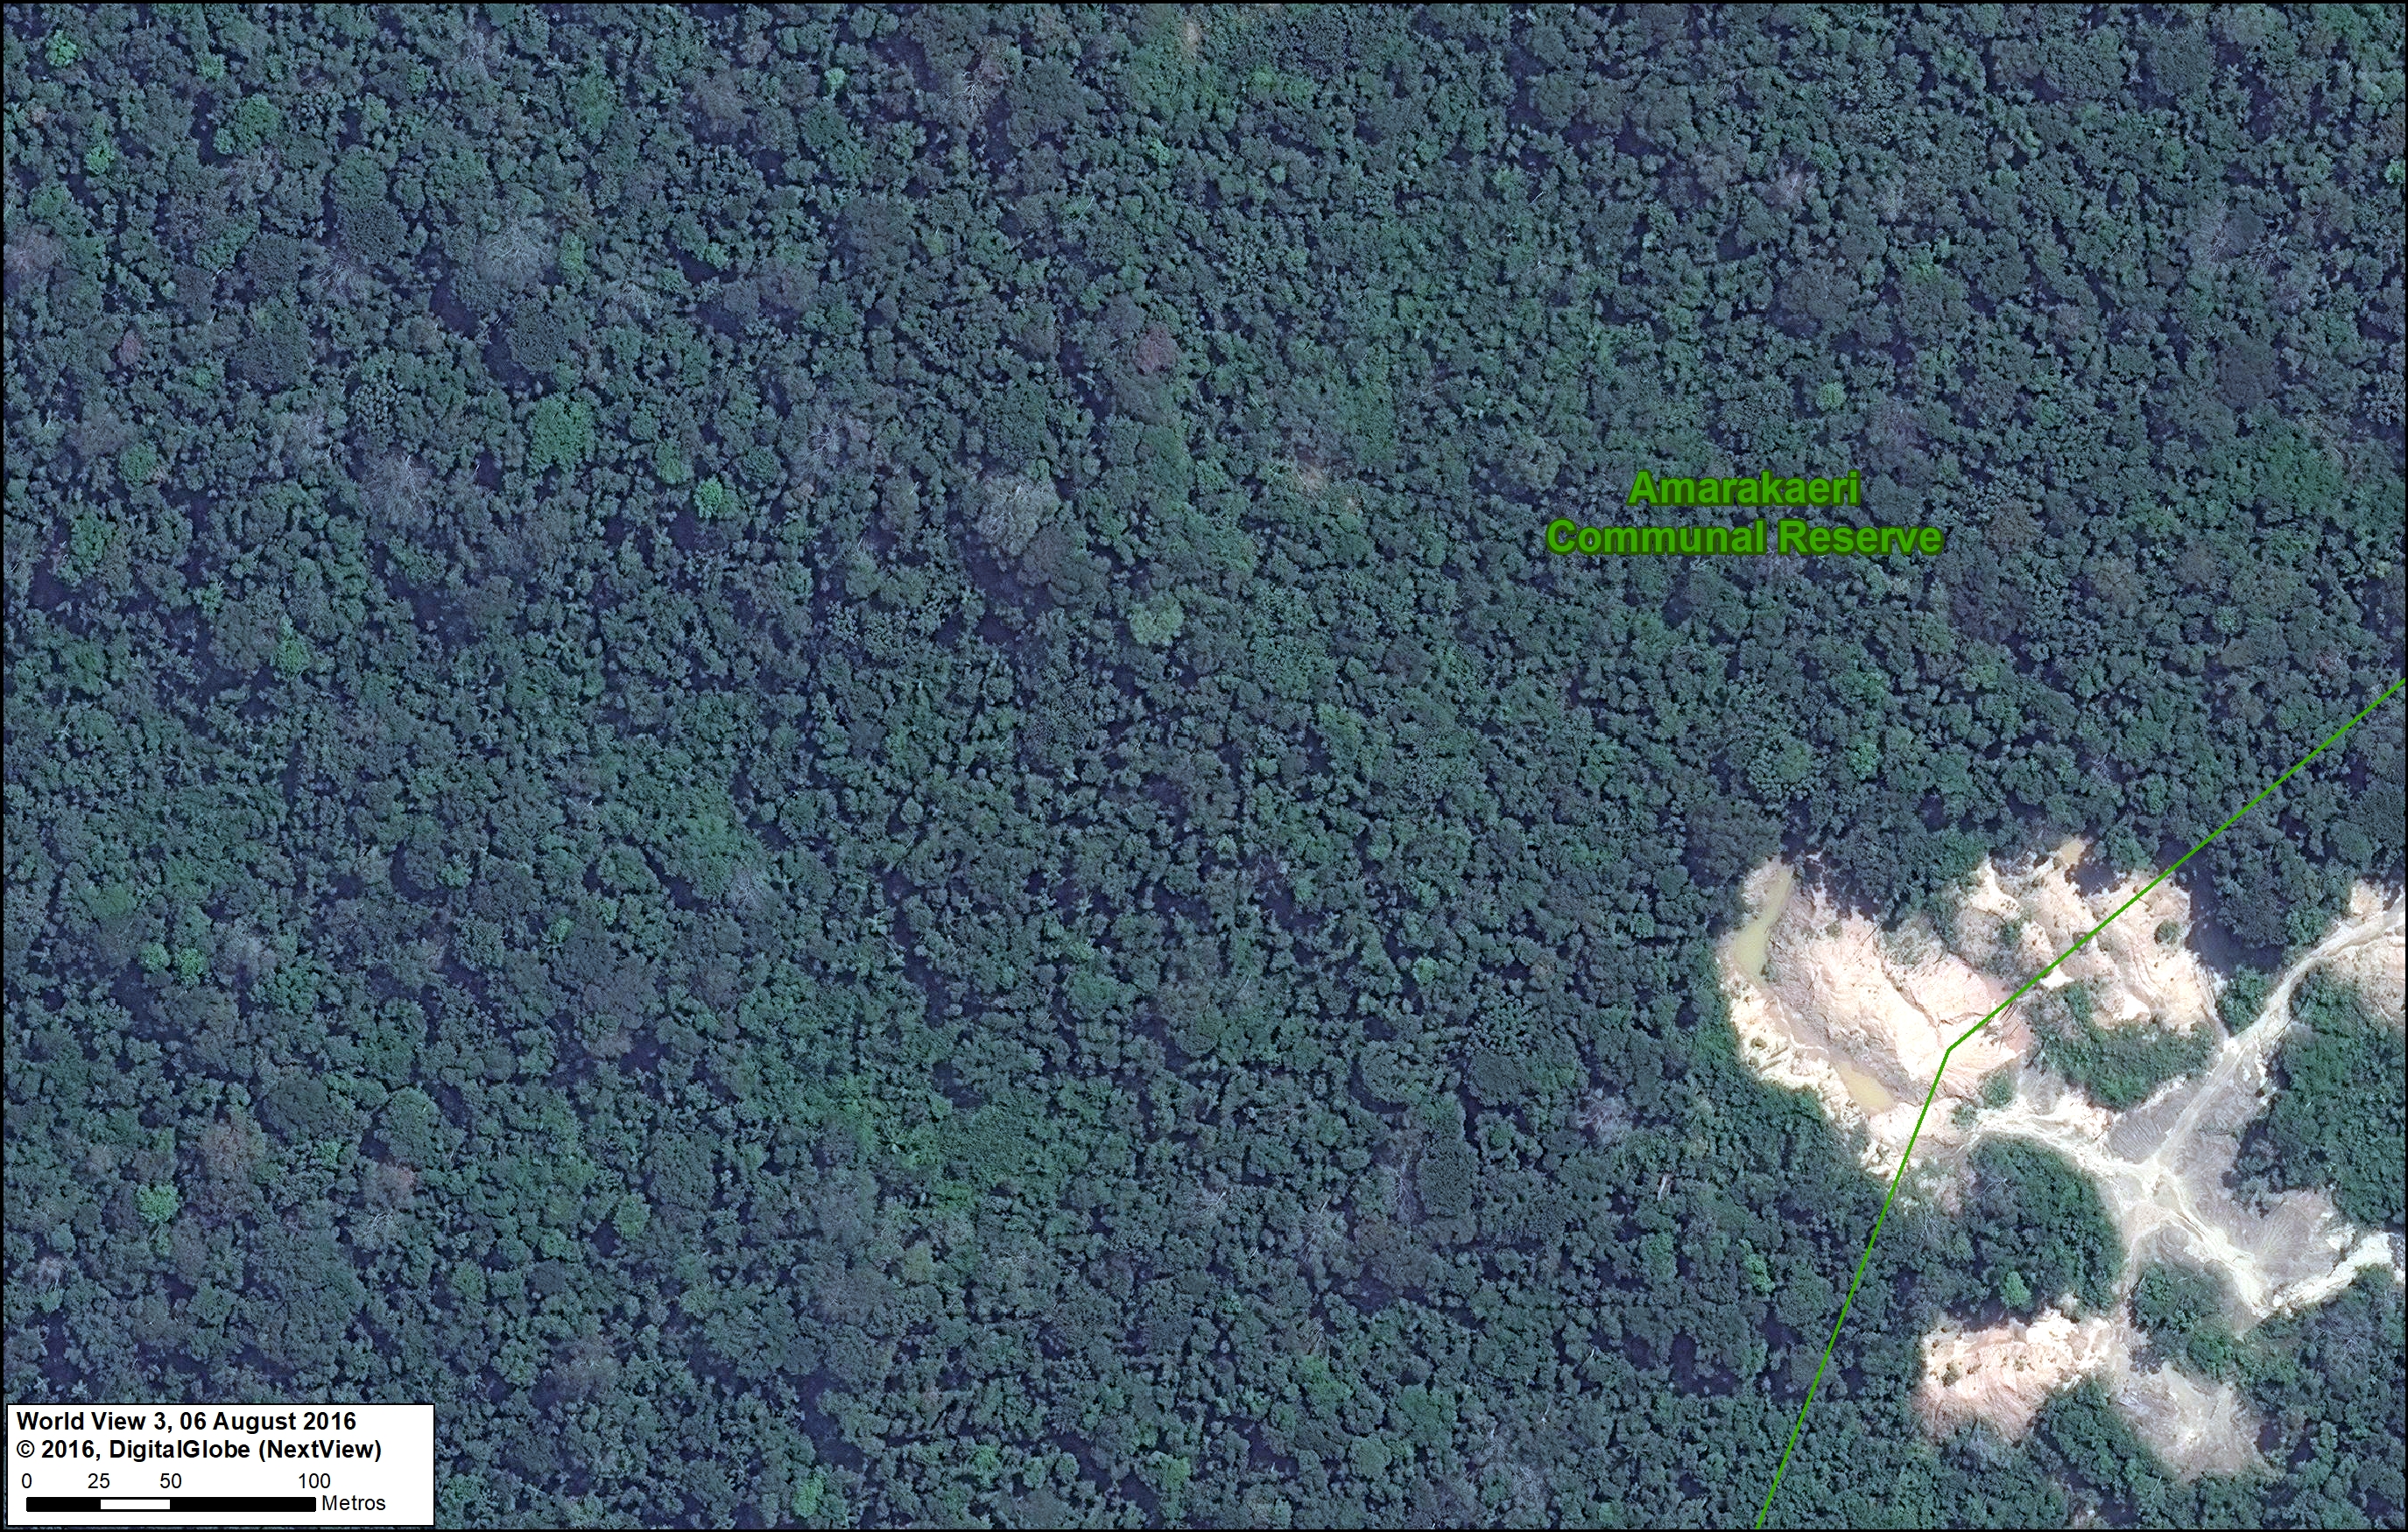
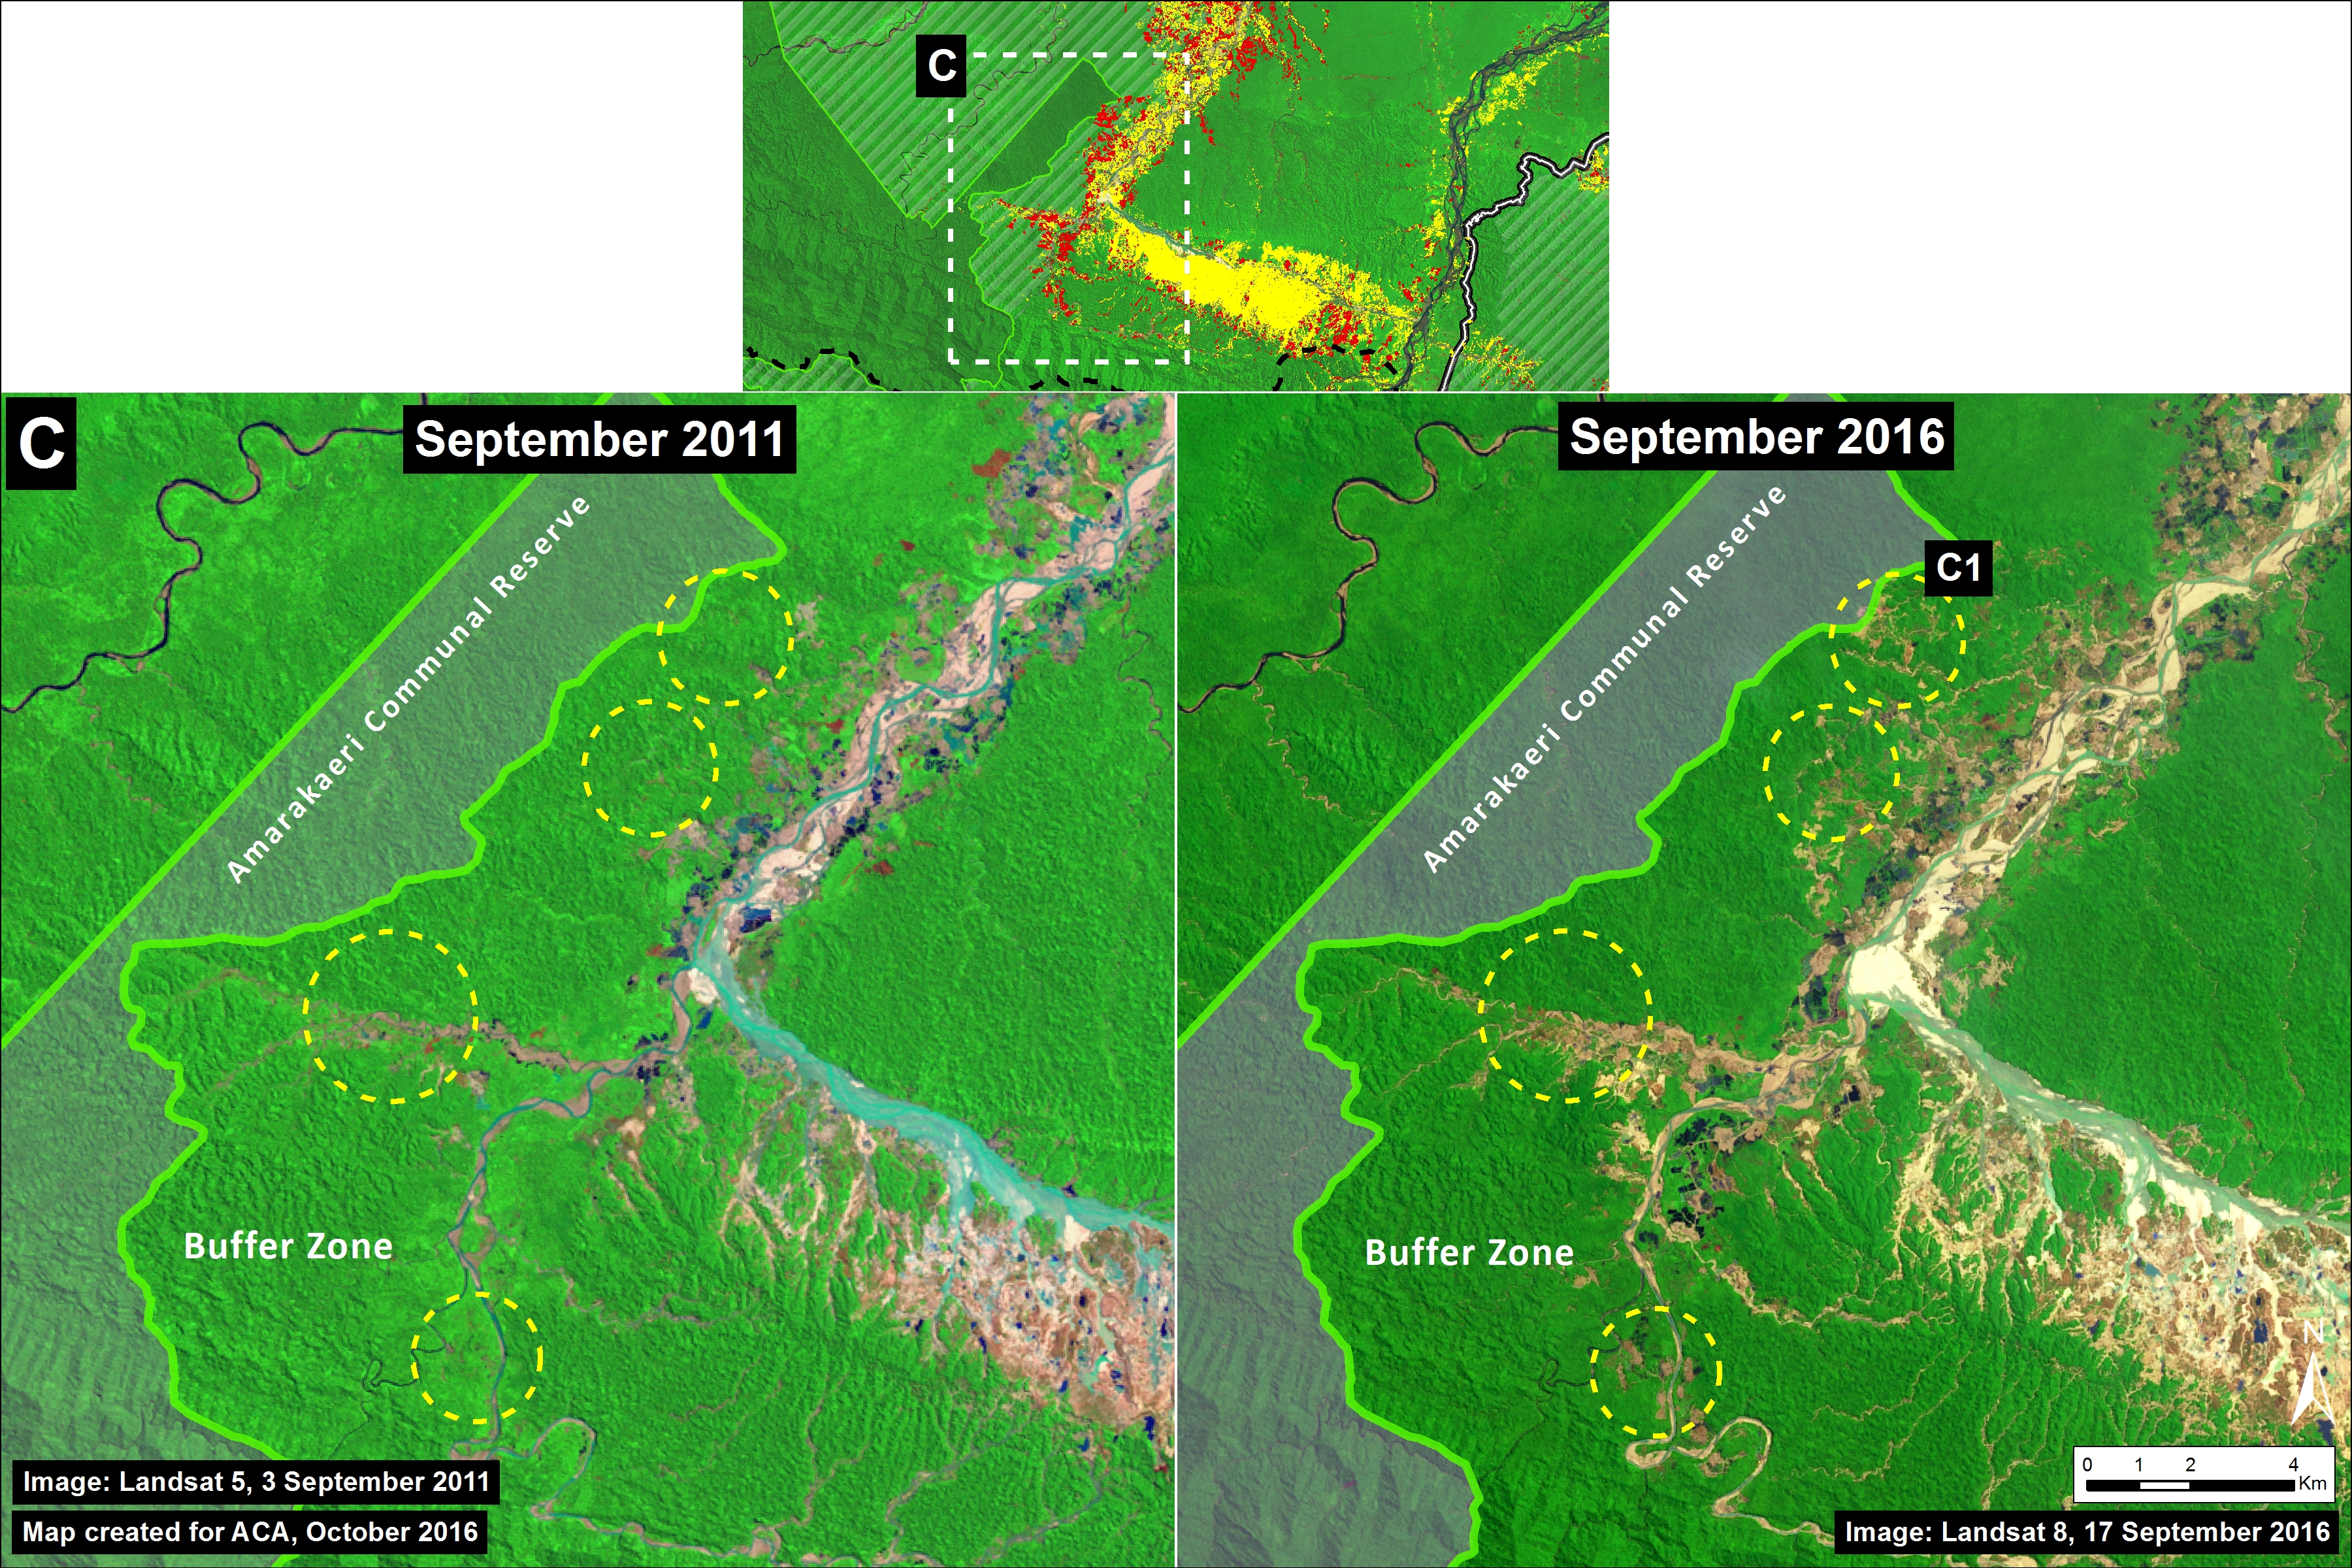
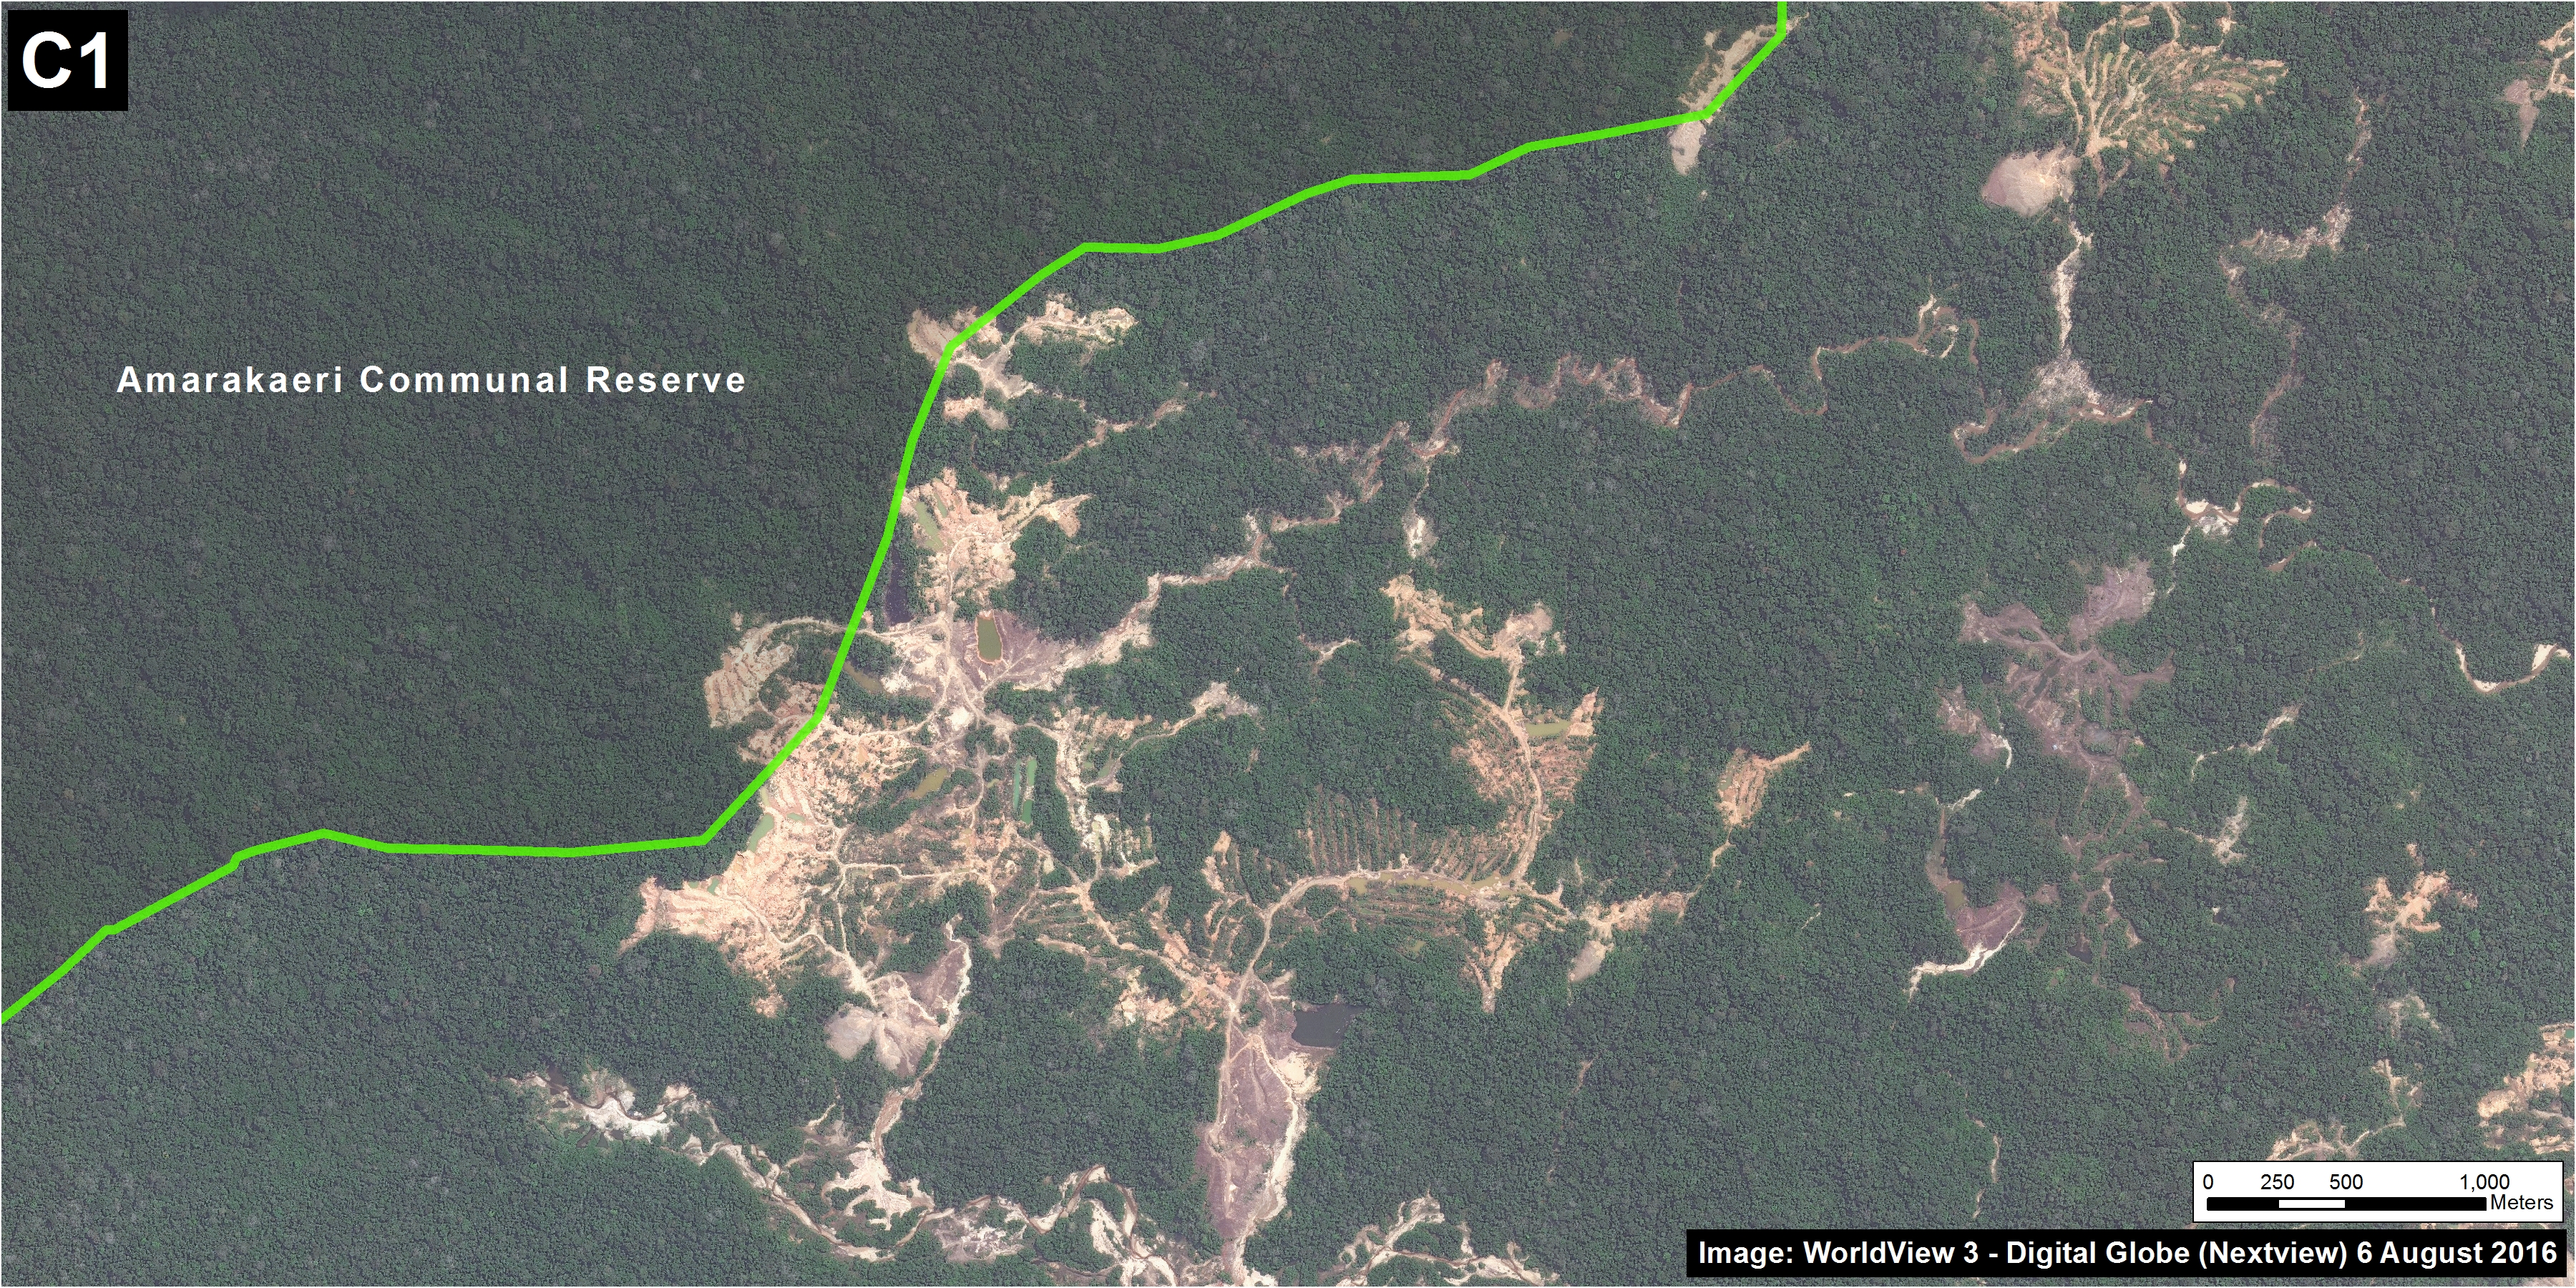
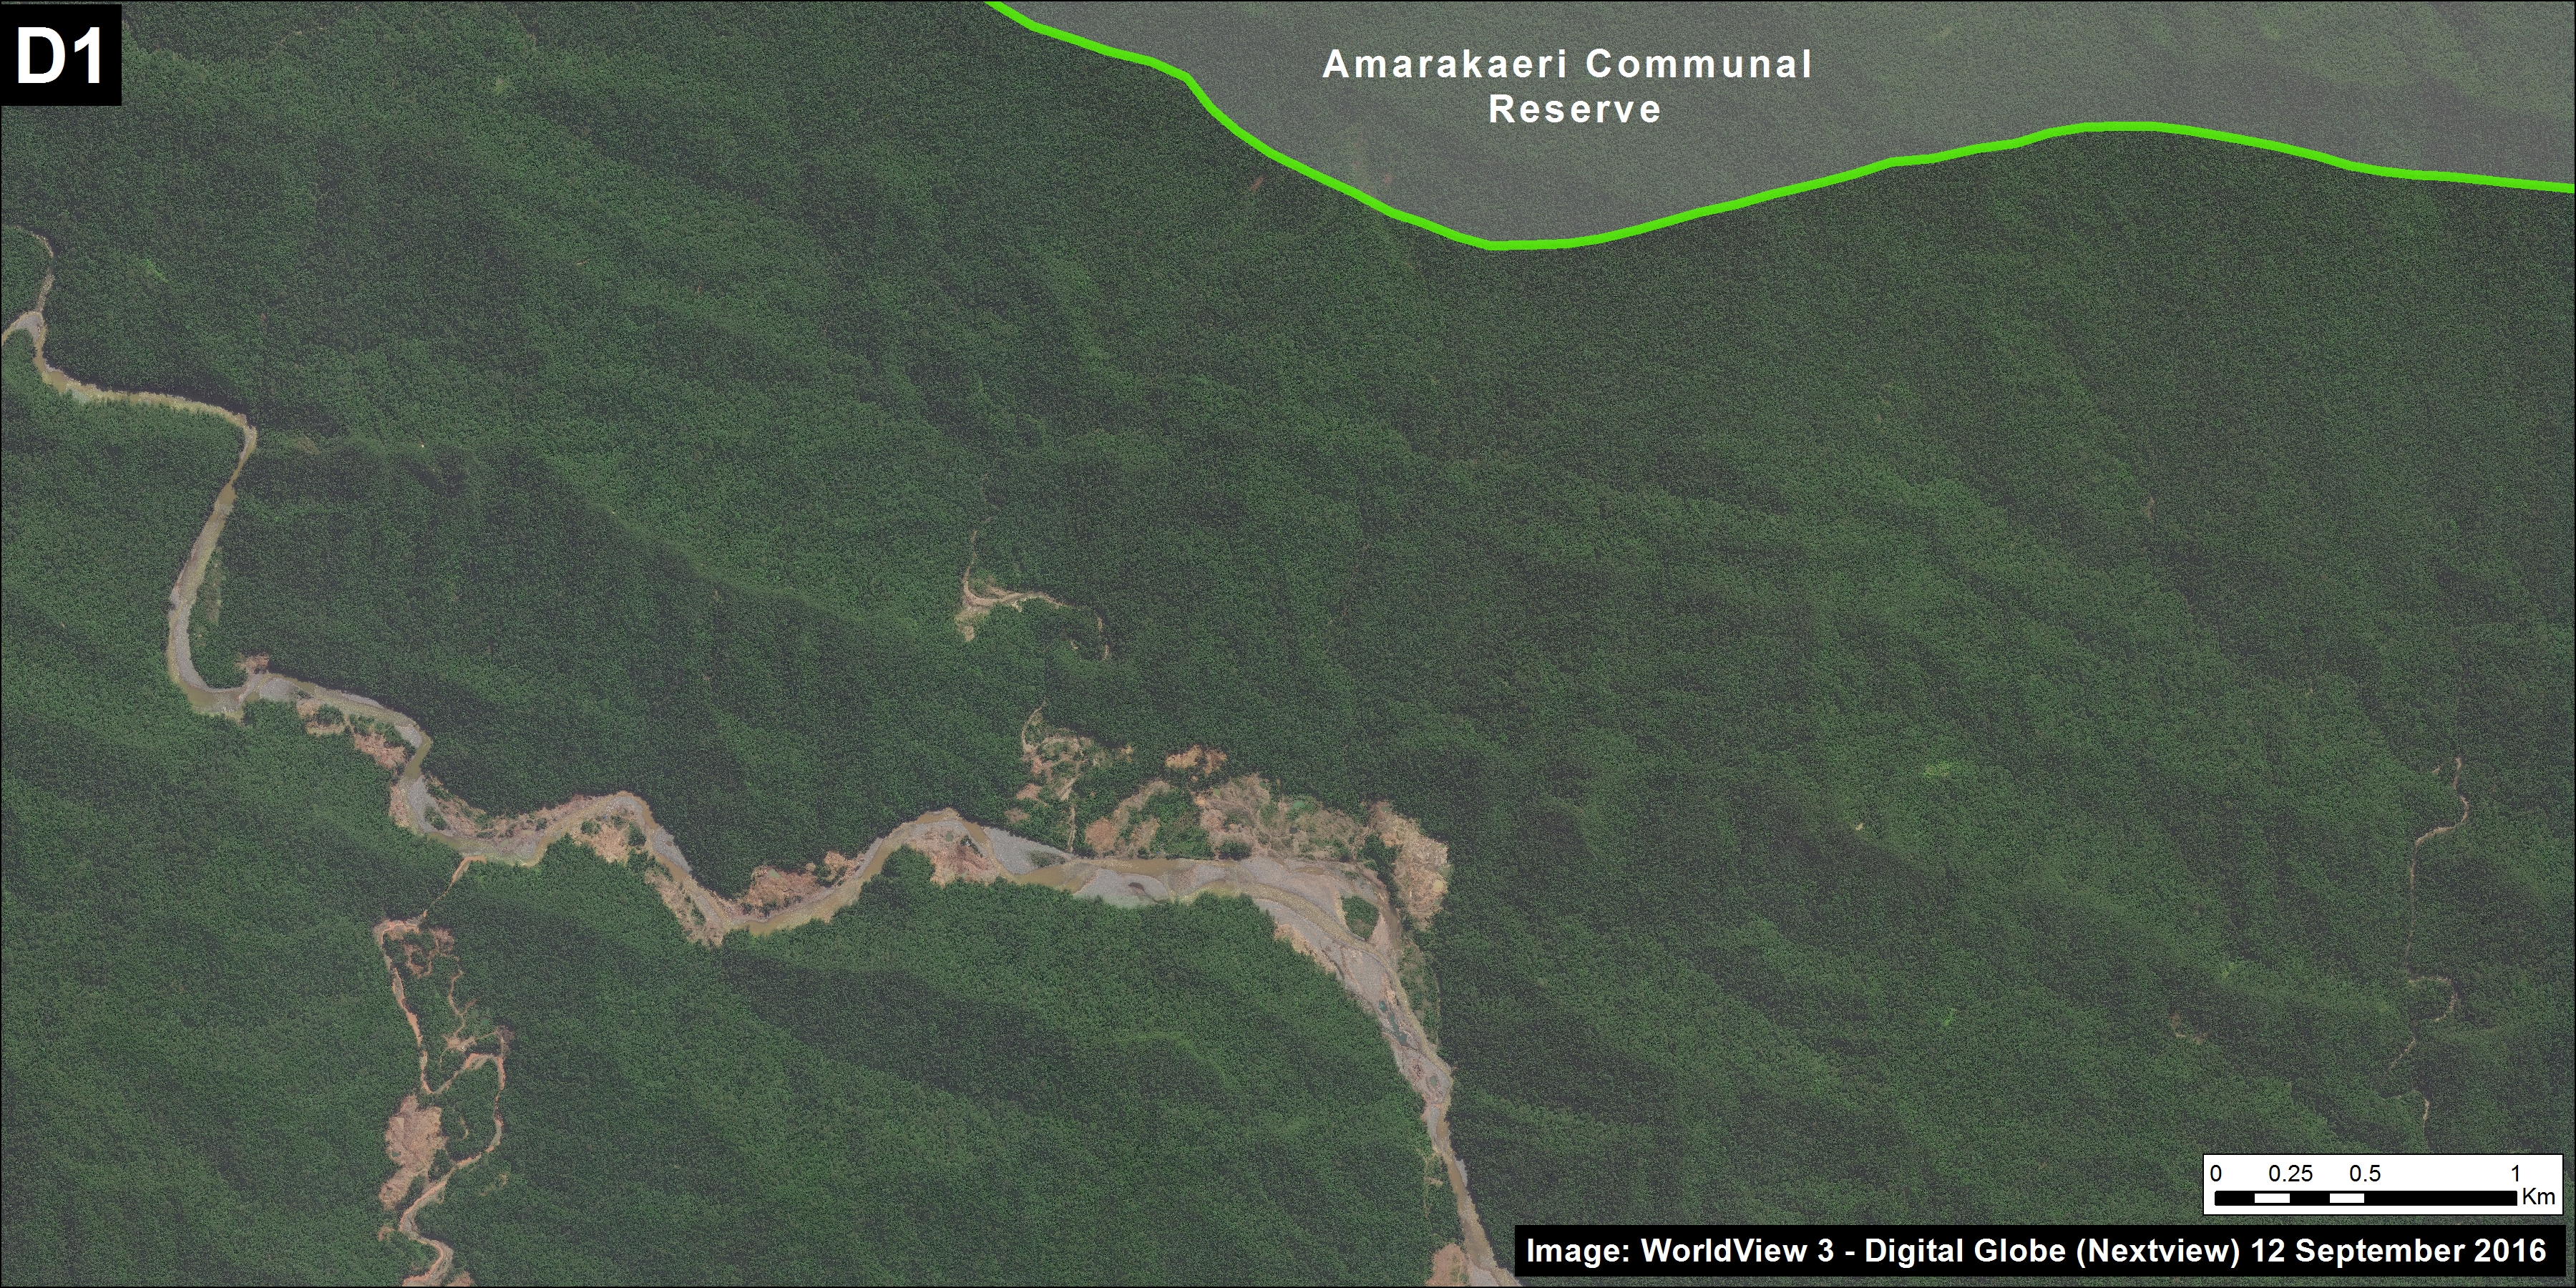
In contrast to the escalating situation in Tambopata, we also documented that gold mining deforestation has been contained in the nearby Amarakaeri Communal Reserve, an important protected area that is co-managed by indigenous communities and Peru’s national protected areas agency. Following an initial invasion of 27 acres in 2014 and early 2015, satellite imagery shows that management efforts have prevented any subsequent expansion within the protected area (MAAP #6, MAAP #44).

In addition to the above cases in Madre de Dios, gold mining deforestation is also increasingly an issue in the adjacent regions of Cusco and Puno (MAAP #14).

There are several small, but potentially emerging, gold mining frontiers in the central and northern Peruvian Amazon (MAAP #49). The Peruvian government has been working to contain the illegal gold mining in the El Sira Communal Reserve (MAAP #45). Further north in Amazonas region, there is gold mining deforestation along the Rio Santiago (MAAP #36, MAAP #49), and in the remote Condor mountain range along the border with Ecuador (MAAP #49).
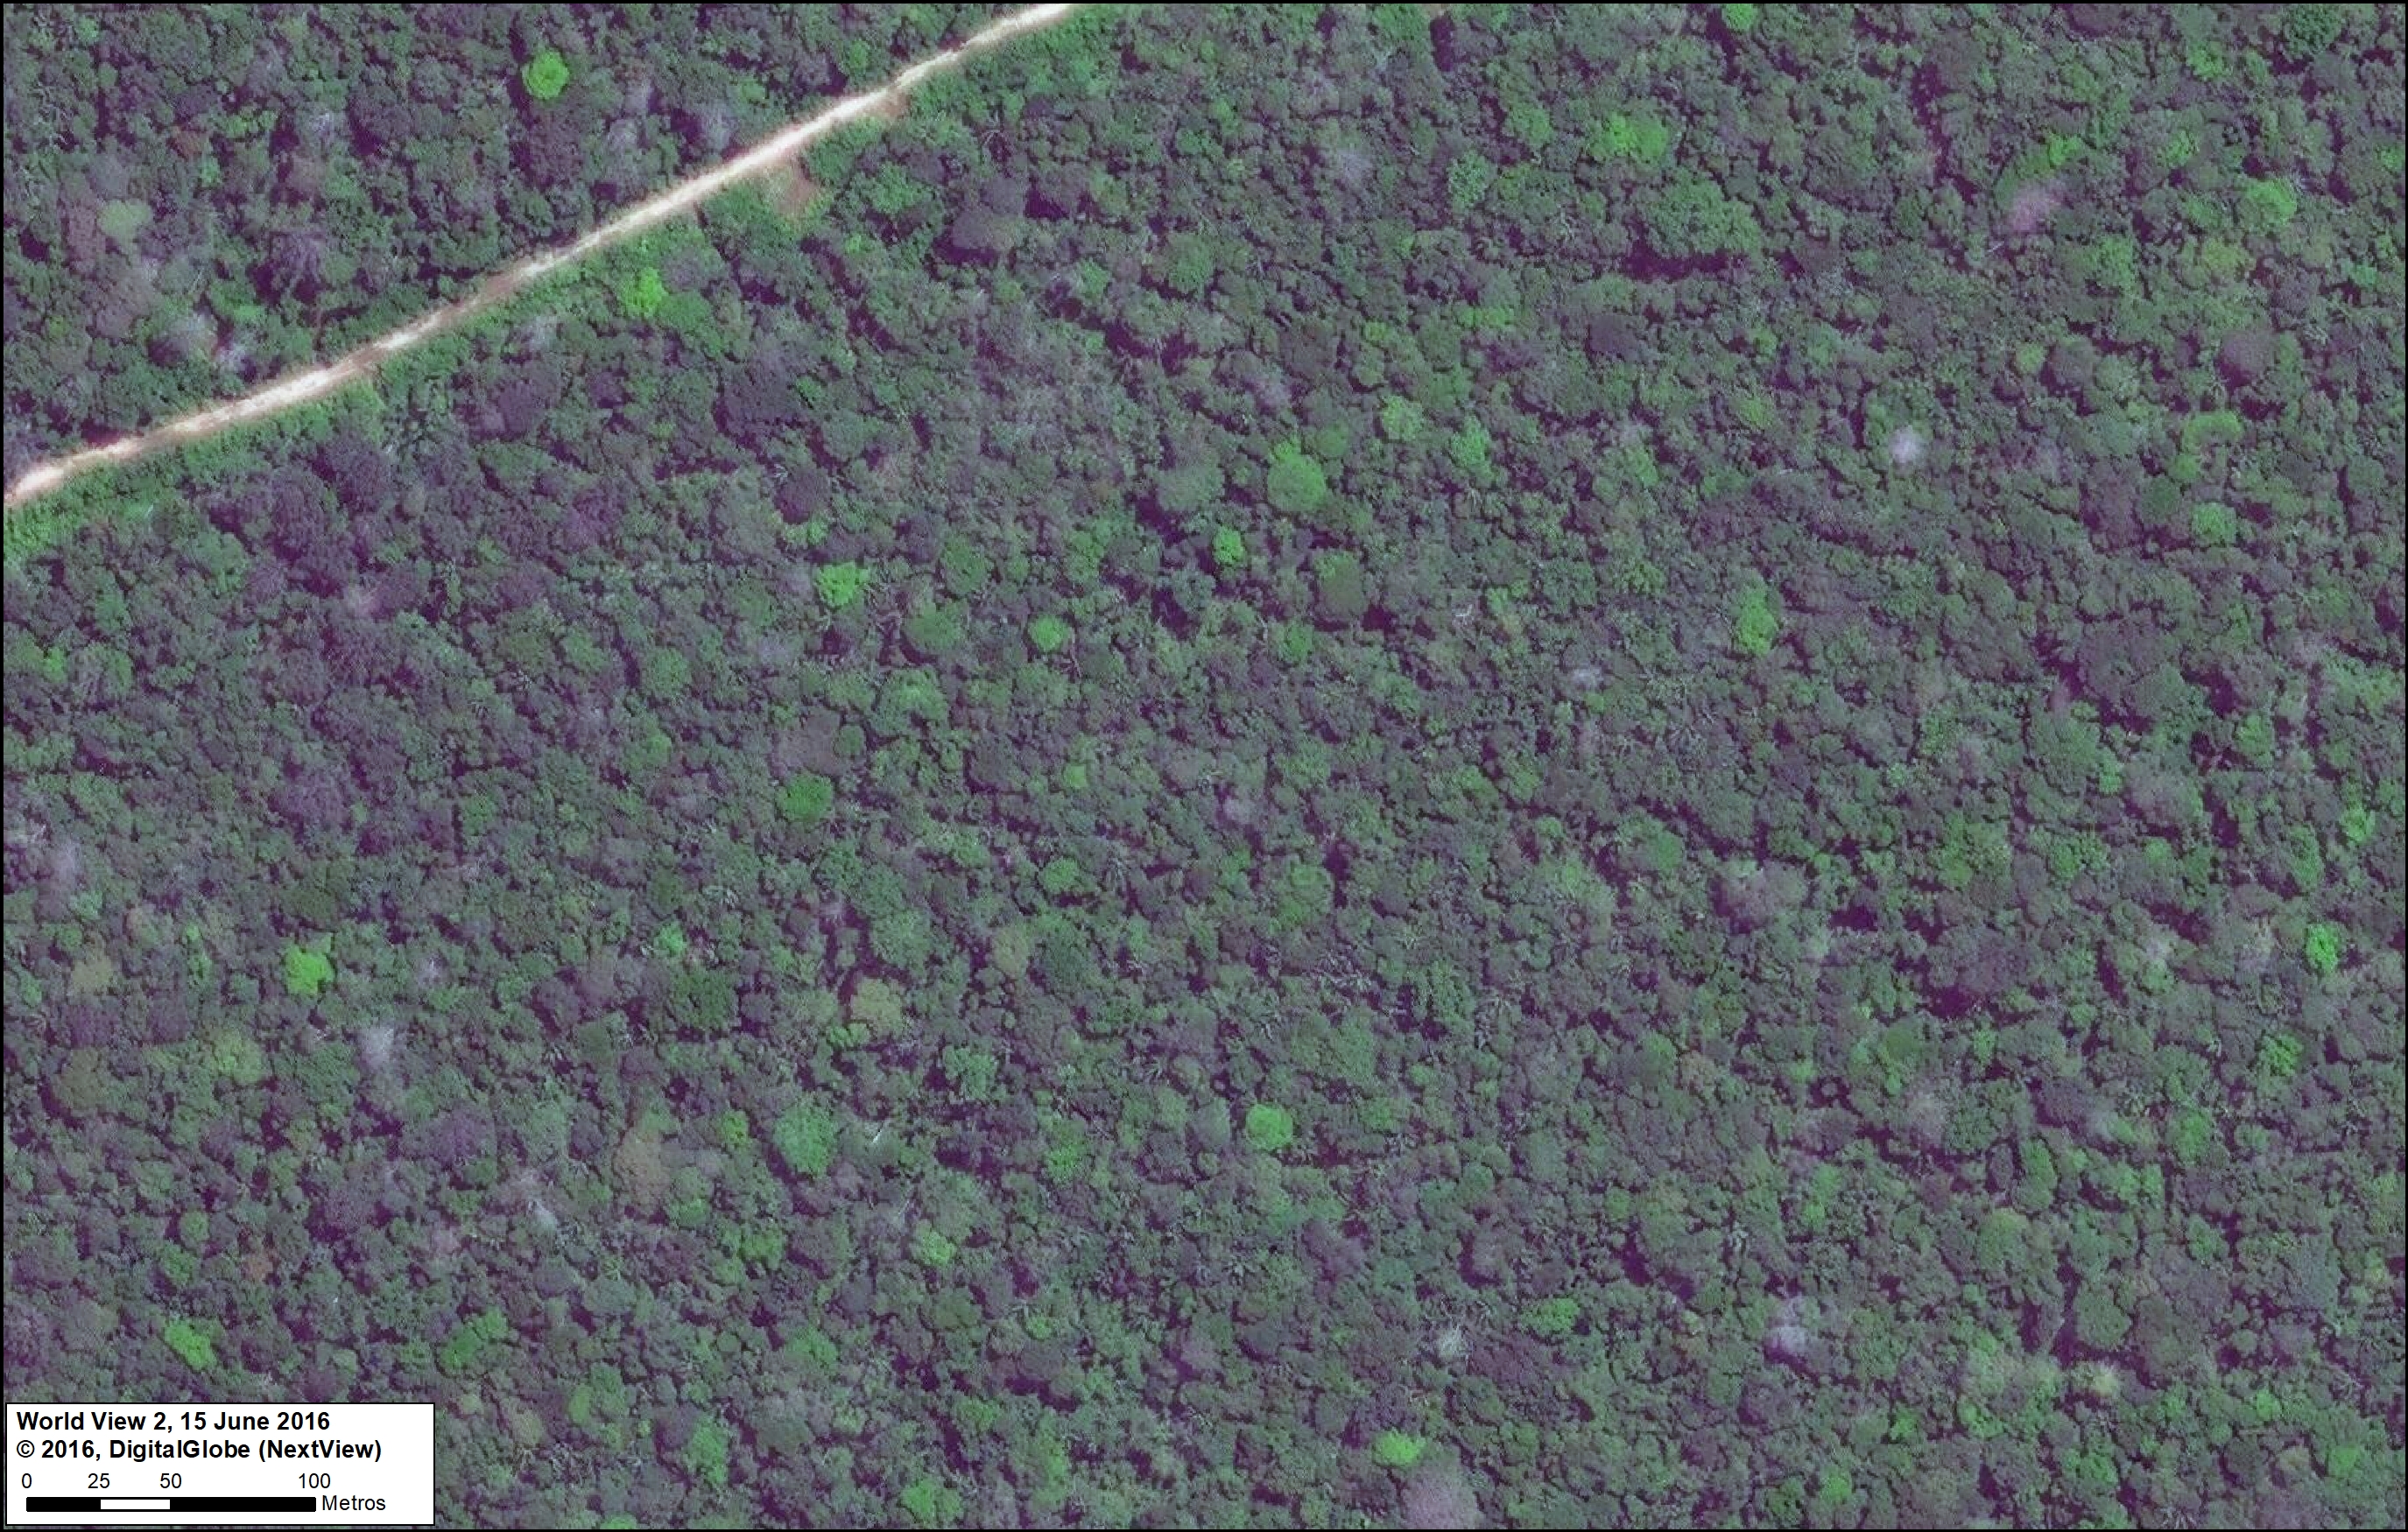
Roads

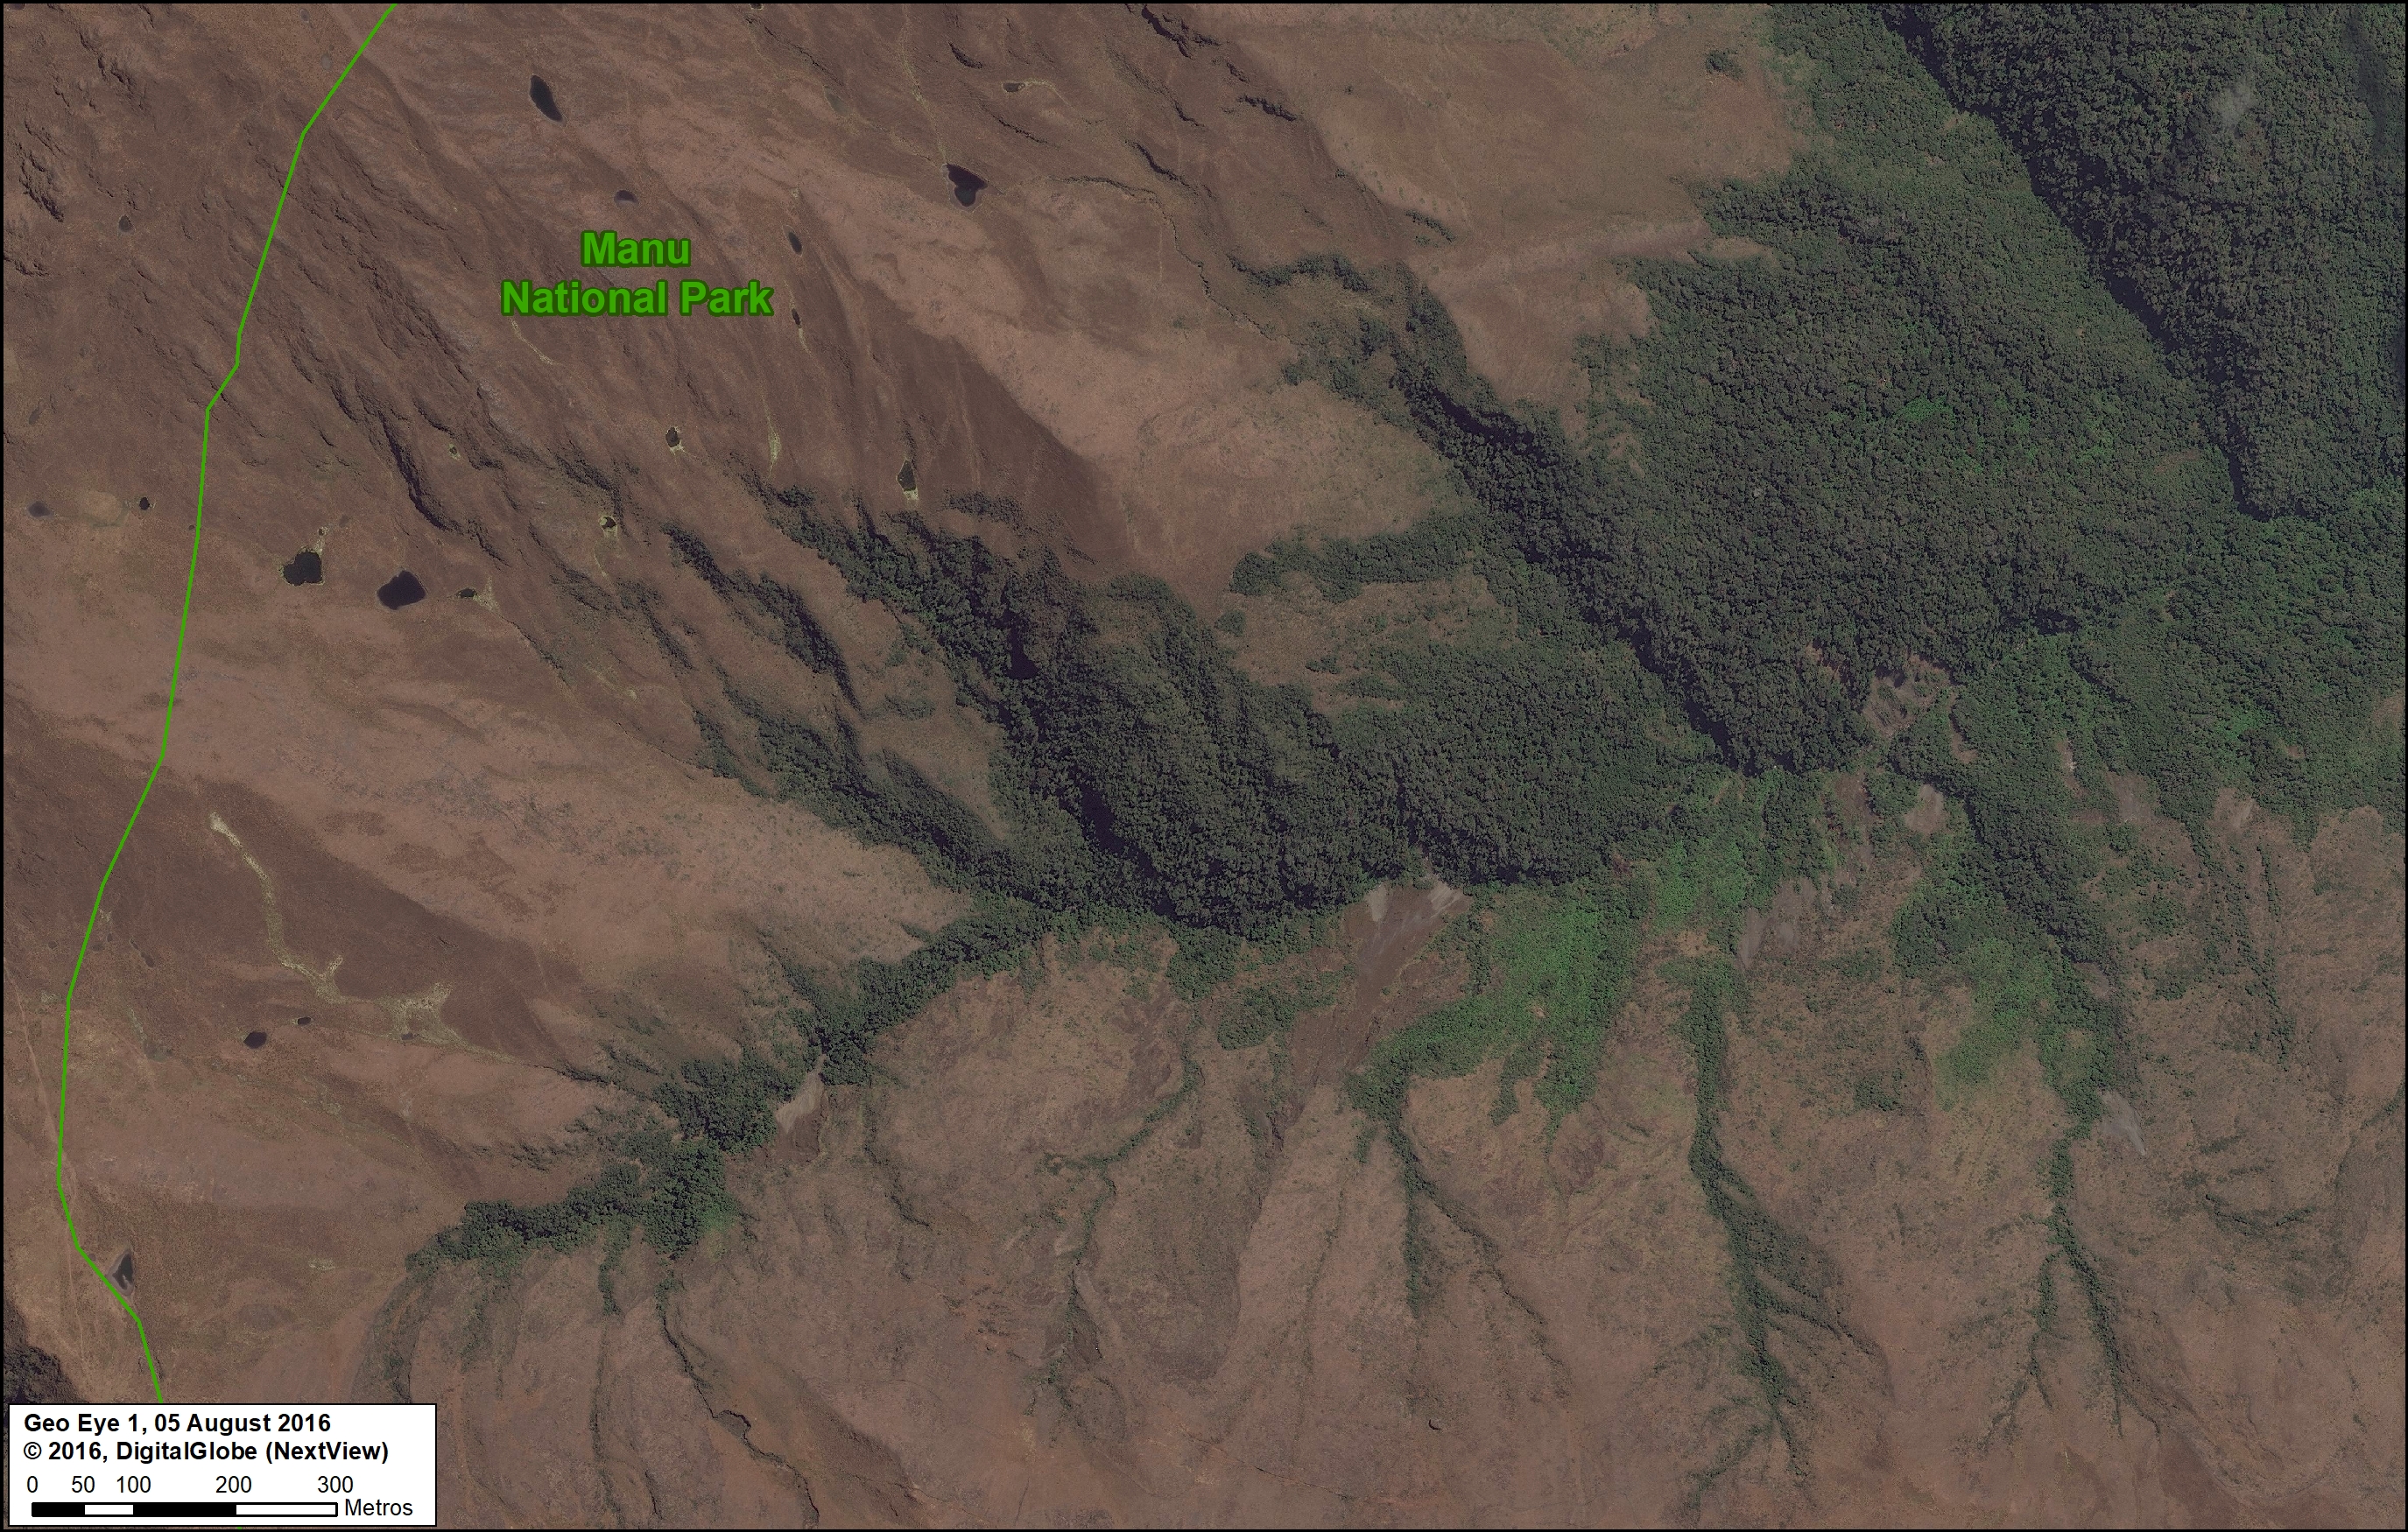
Roads are a well-documented driver of deforestation in the Amazon, particularly due to their ability to facilitate human access to previously remote areas.10 Roads often serve as an indirect driver, as most of the deforestation directly associated with agriculture, cattle pasture, and gold mining is likely greatly facilitated by proximity to roads. We documented the start of a controversial road construction project that would cut through the buffer zones of two important protected areas, Amarakaeri Communal Reserve and Manu National Park (MAAP #29).

Logging Roads

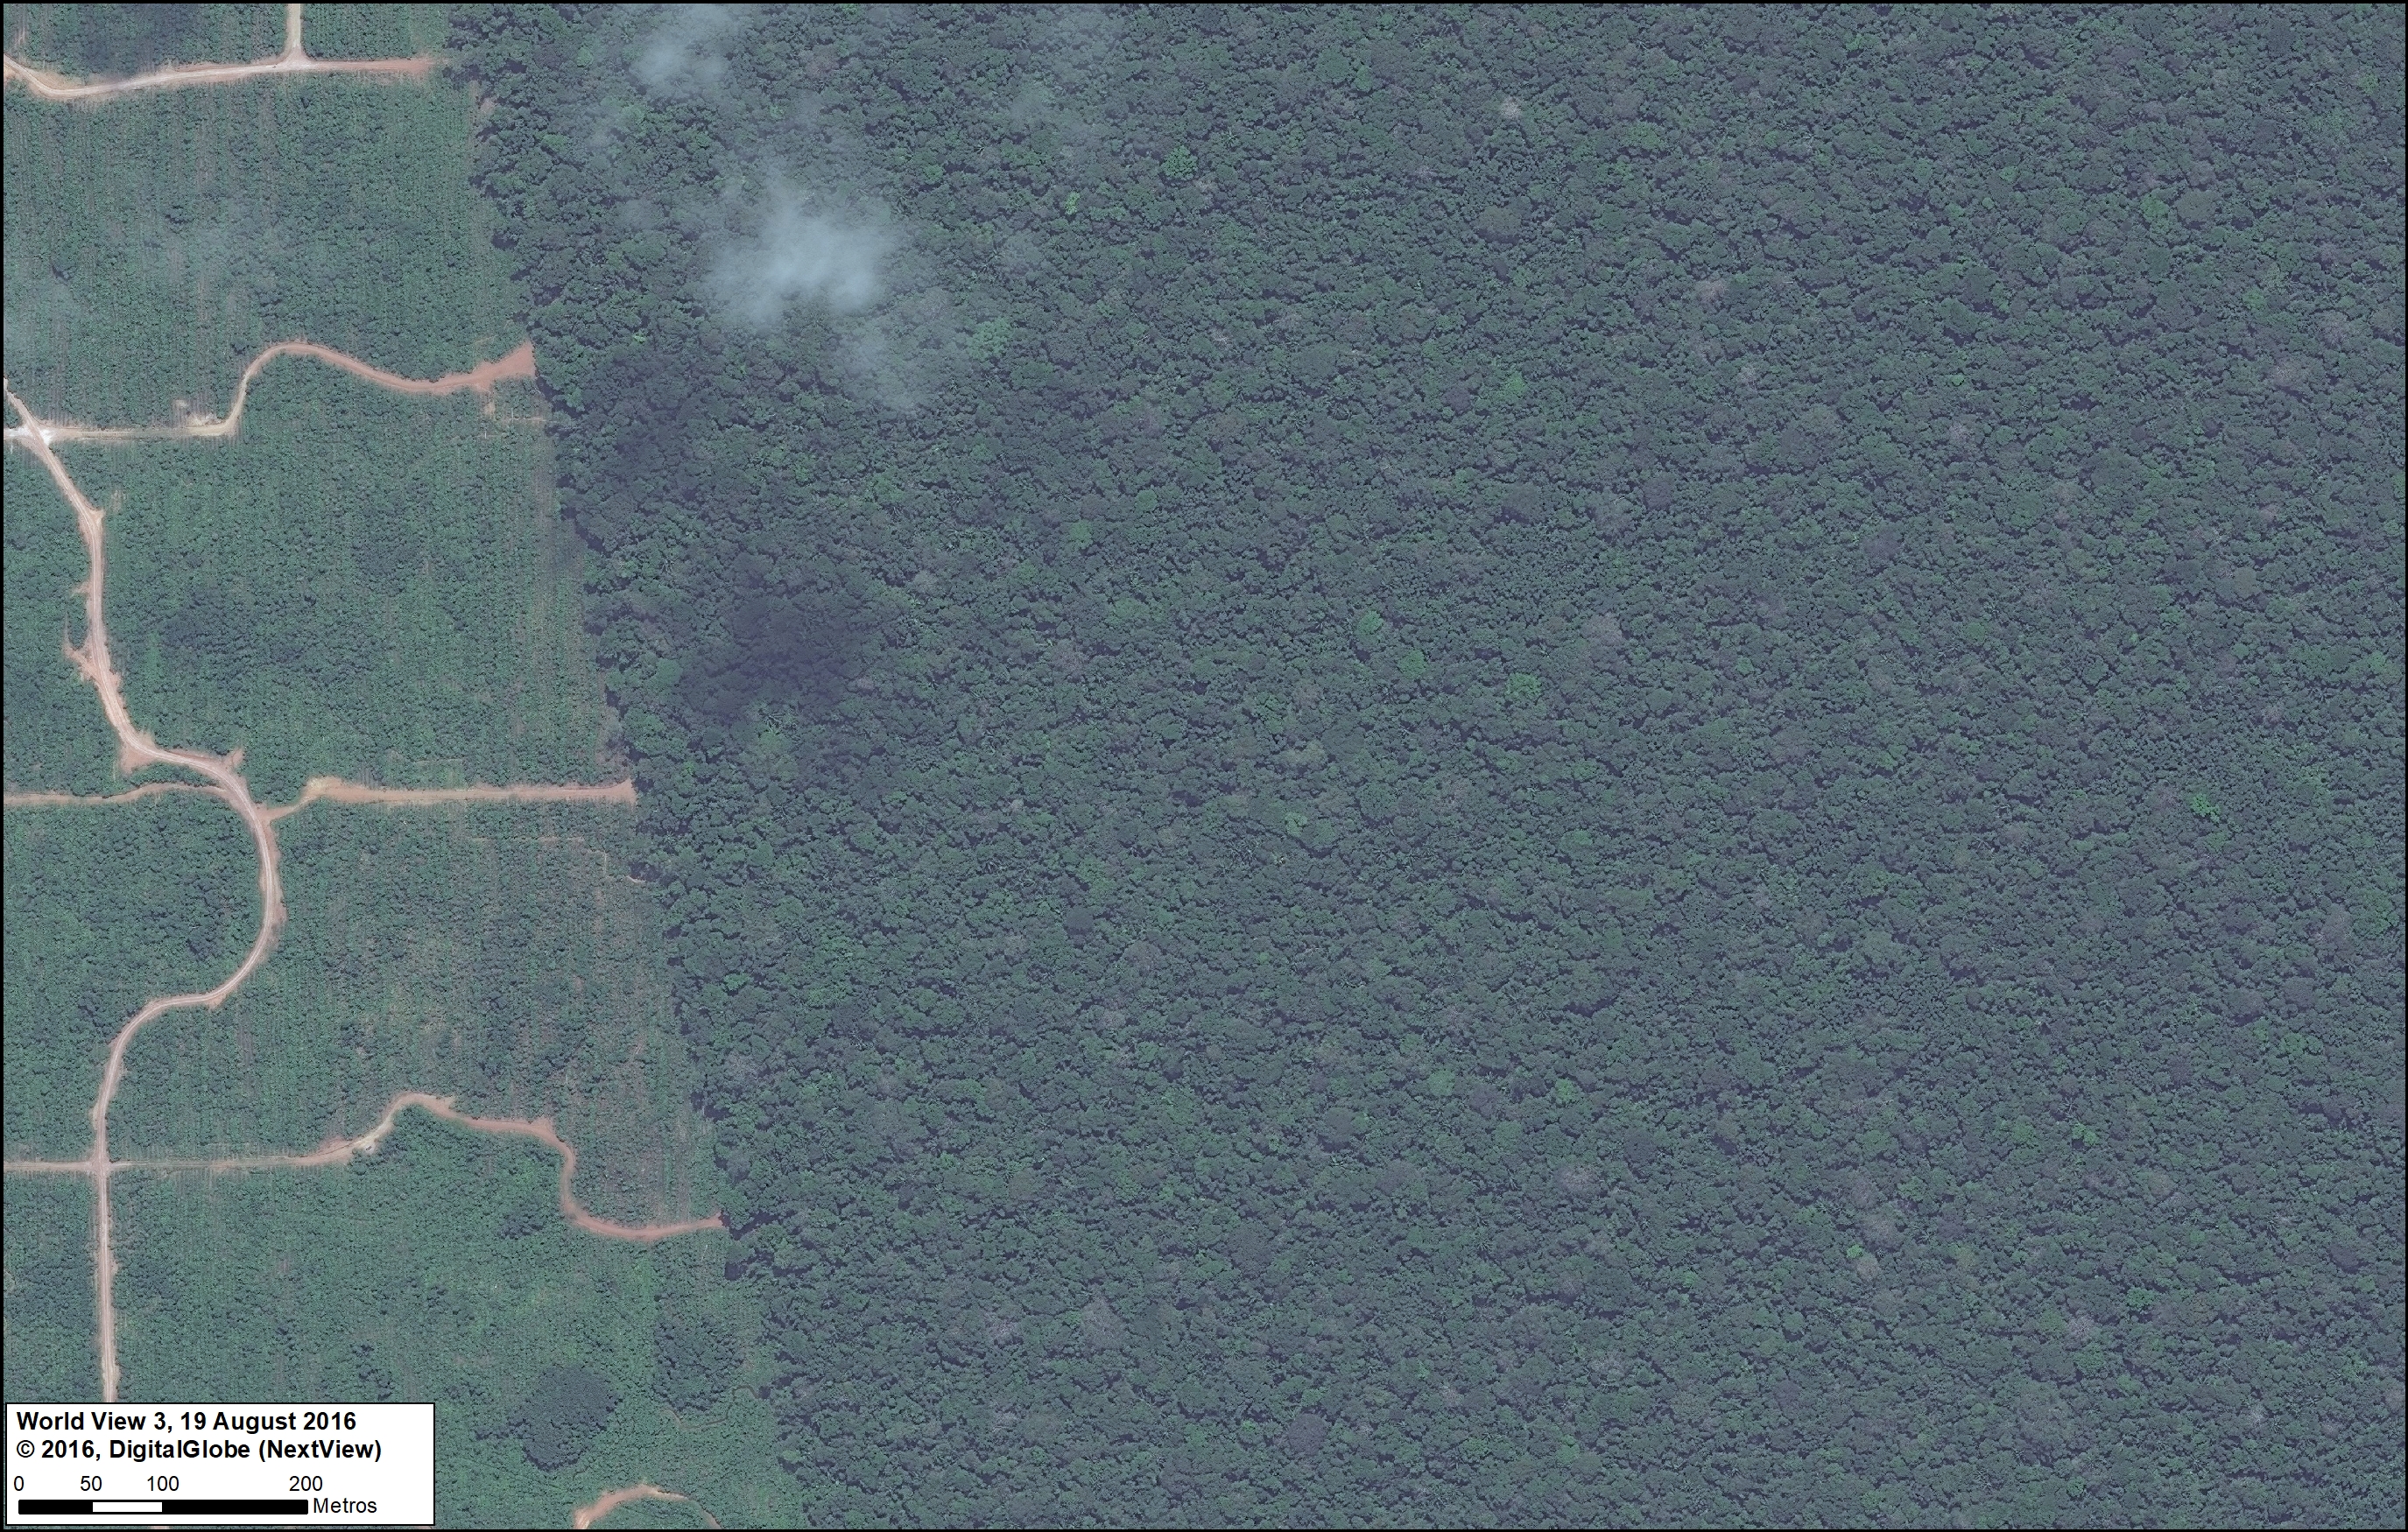
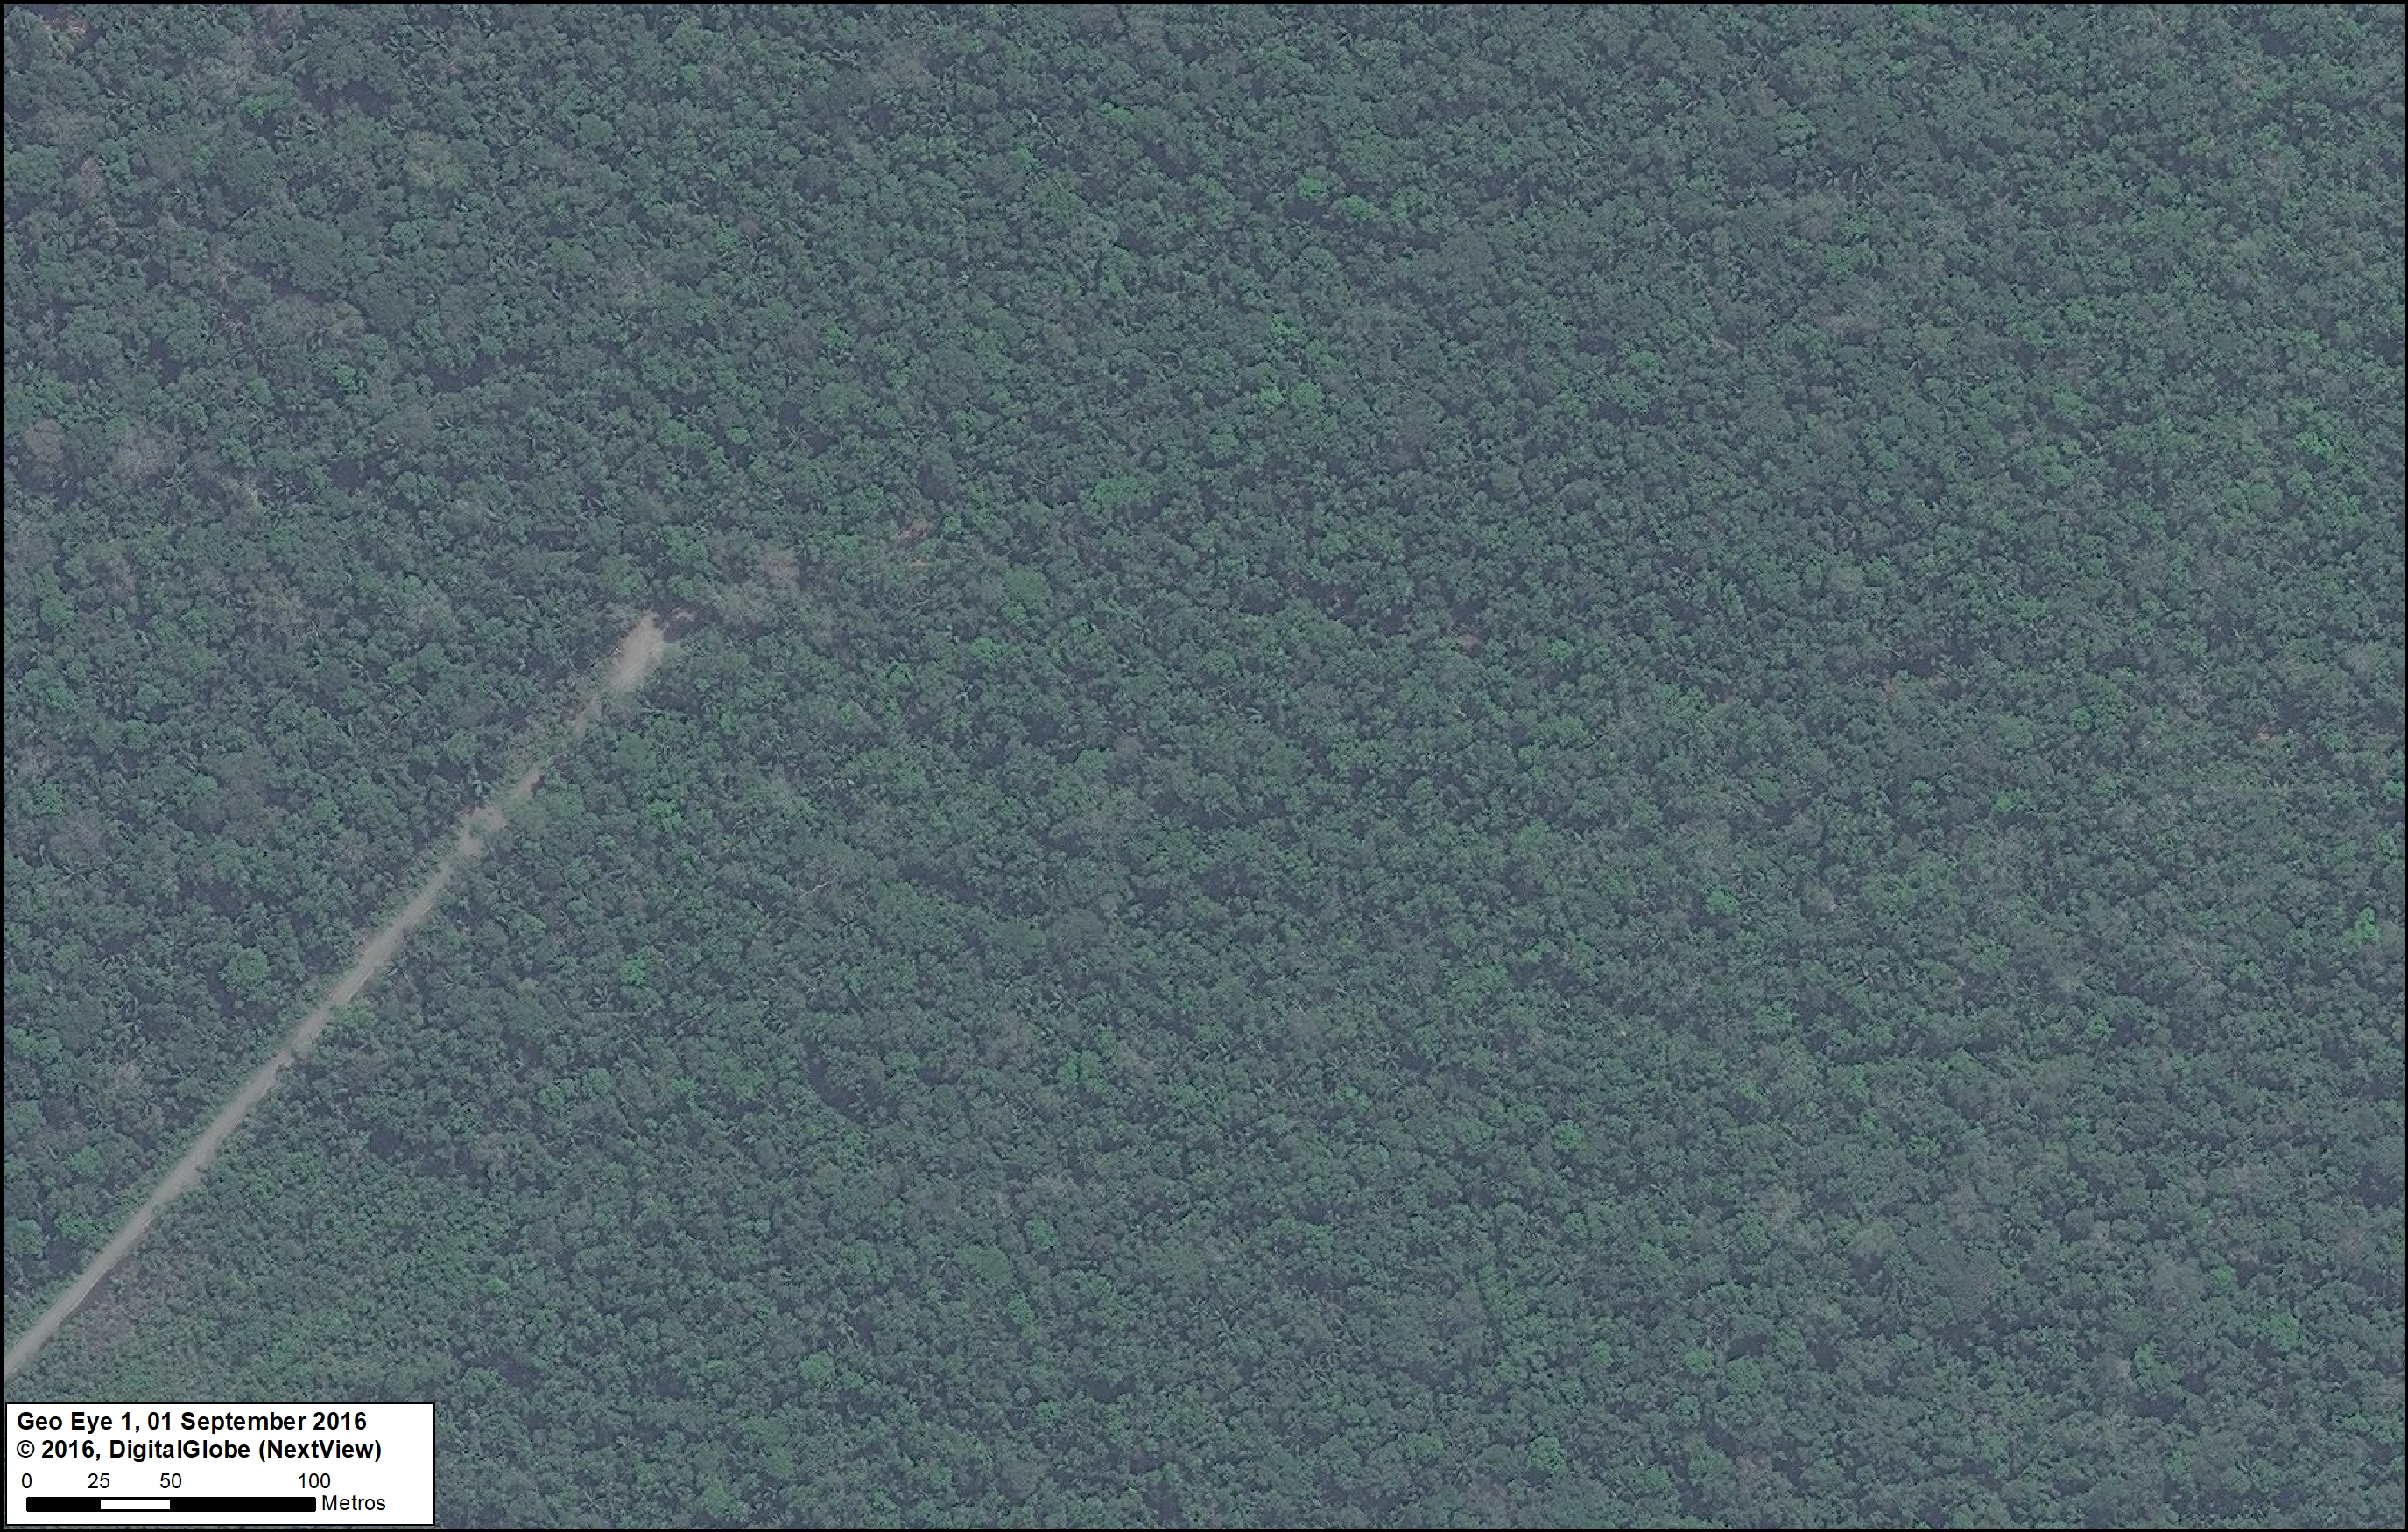
In relation to general roads described above, we distinguish access roads that are constructed to gain entry to a particular project. The most notable type of access roads in Peru are logging roads, which are likely a leading cause of forest degradation as they facilitate selective logging of valuable timber species in remote areas.

One of the major recent advances in forest monitoring is the ability to quickly identify the construction of new logging roads. The unique linear pattern of these roads appears quite clearly in Landsat-based tree cover loss alerts such as GLAD and CLASlite. This advance is important because it is difficult to detect illegal logging in satellite imagery because loggers in the Amazon often selectively cut high value species and do not produce large clearings. But now, although it remains difficult to detect the actual selective logging, we can detect the roads that indicate that selective logging is taking place in that area.

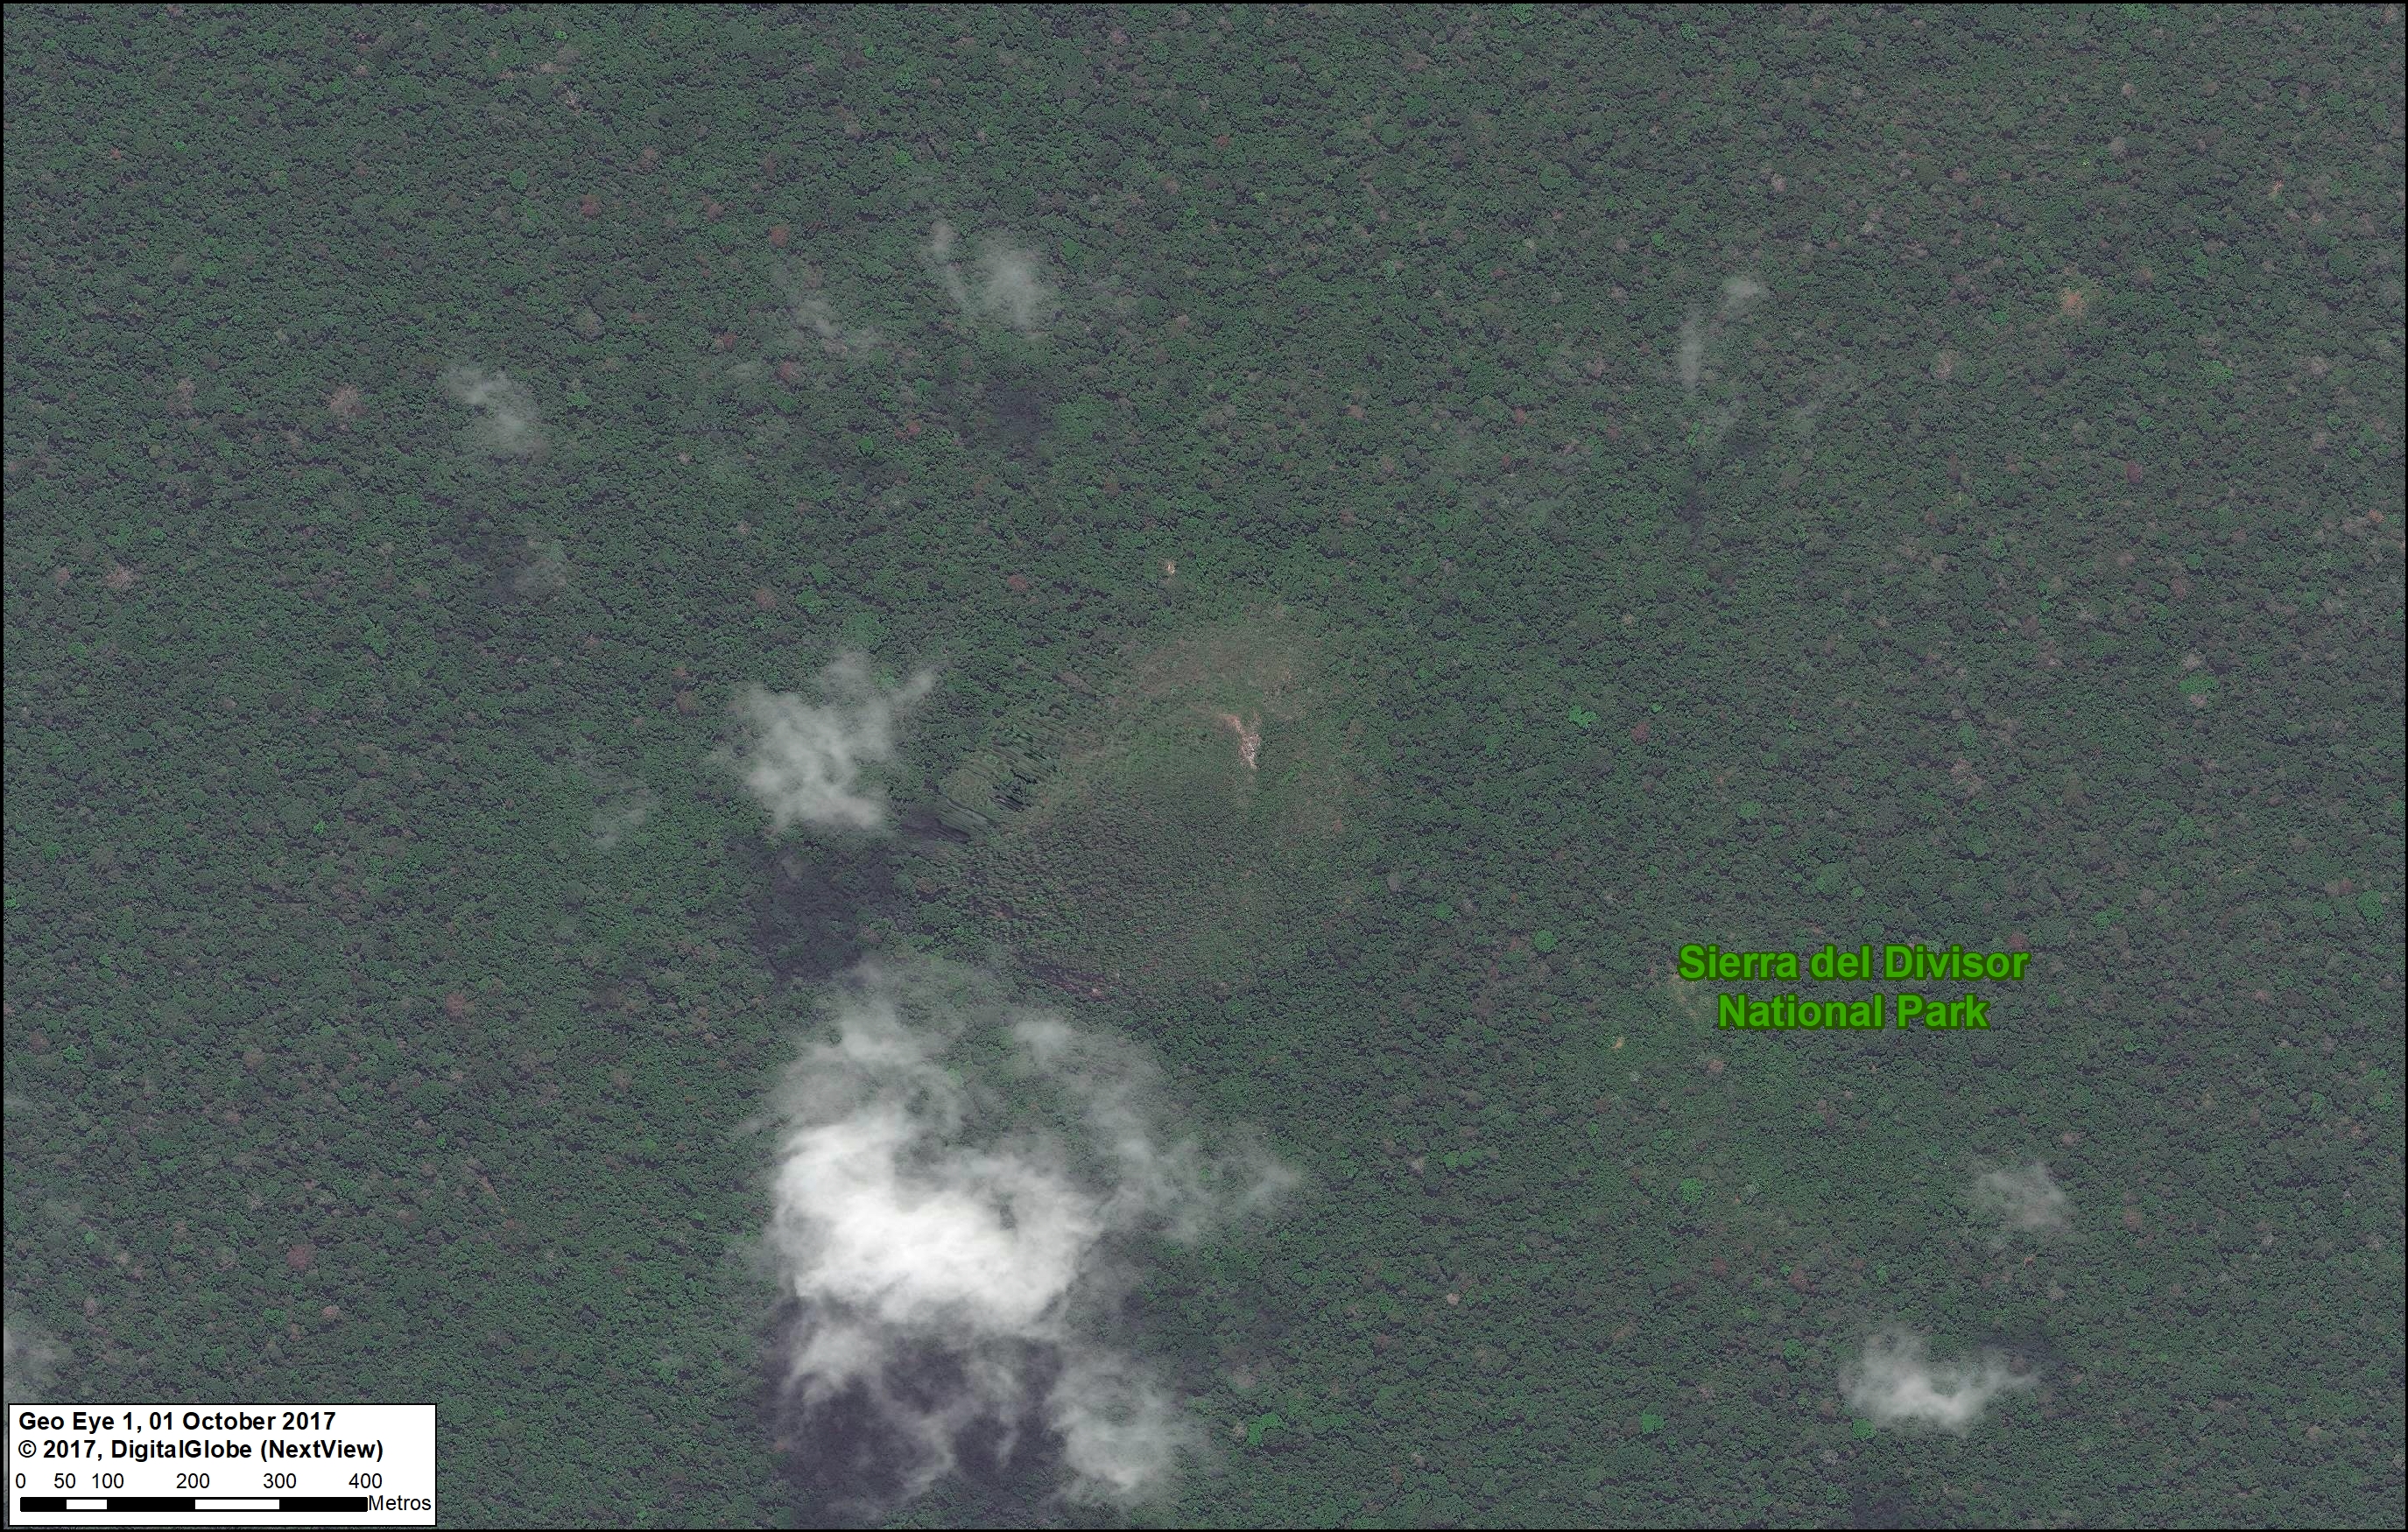
In a series of articles, we highlighted the recent expansion of logging roads, including the construction of 1,134 km between 2013 and 2015 in the central Peruvian Amazon (MAAP #3, MAAP #18). Approximately one-third of these roads were within the buffer zones of Cordillera Azul and Sierra del Divisor National Parks (MAAP #15).

We documented the construction of an additional 83 km of logging roads during 2016,  (MAAP #40, MAAP #43) including deeper into the buffer zone of Cordillera Azul National Park.

Another major finding is the rapid construction of the logging roads. In several cases, we documented the construction rate of nearly five kilometers per week (MAAP #18, MAAP #40, MAAP #43).

Determining the legality of these logging roads is complex, partly because of the numerous national and local government agencies involved in the authorization process. Many of these roads are near logging concessions and native communities, whom may have obtained the rights for logging from the relevant forestry authority (in many cases, the regional government).

Coca

According to a recent United Nations report, the Peruvian land area under coca cultivation in 2015 (99,580 acres) was the lowest on record (since 2001) and part of a declining trend since 2011 (154,440 acres).11 There are 13 major coca growing zones in Peru, but it appears that only a few of them are actively causing new deforestation. Most important are two coca zonas in the region of Puno that are causing deforestation within and around Bahuaja Sonene National Park (MAAP #10, MAAP #14). Several coca zones in the regions of Cusco and Loreto may also be causing some new deforestation.

Hydroelectric Dams

Although there is a large portfolio of potential new hydroelectric dam projects in the Peruvian Amazon,12 many of not advanced to implementation phase. Thus, forest loss due to hydroelectric dams is not currently a major issue, but this could quickly change in the future if these projects are revived. For example, in adjacent western Brazil, we documented the forest loss of 89,205 acres associated with the flooding caused by two dams on the upper Madeira River (MAAP #34).

Hydrocarbon (Oil & Gas)

During the course of our monitoring, we have not yet detected major deforestation events linked to hydrocarbon-related activities. As with dams, this could change in the future if oil and gas prices rise and numerous projects in remote corners of the Amazon move forward.

Methodology

MAAP methodology has 4 major components:

  1. Forest Loss Detection. MAAP reports rely heavily on early-warning tree cover loss alerts to help us identify where new deforestation is happening. Currently, our primary tool is GLAD alerts, which are developed by the University of Maryland and Google,13 and presented by WRI’s Global Forest Watch and Peru’s GeoBosques. These alerts, launched in Peru in early 2016, are based on 30-meter resolution Landsat satellite images and updated weekly. We also occasionally incorporate CLASlite, forest loss detection software based on Landsat (and now Sentinel-2) developed by the Carnegie Institution for Science, and the moderate resolution (250 meters) Terra-i alerts. We are also experimenting with Sentinel-1 radar data (freely available from the European Space Agency), which has the advantage of piercing through cloud cover in order to continue monitoring despite persistent cloudy conditions
  2. Prioritize Big Data. The early warning systems noted above yield thousands of alerts, thus a procedure to prioritize the raw data is needed. We employ numerous prioritization methods, such as creation of hotspot maps (see below), focus on key areas (such as protected areas, indigenous territories, and forestry concessions), and identification of striking patterns (such as linear features or large-scale clearings).
  1. Identify Deforestation Drivers. Once priority areas are identified, the next challenge is to understand the cause of the forest loss. Indeed, one of the major advances of MAAP over the past year has been using high-resolution satellite imagery to identify key deforestation drivers. Our ability to identify these deforestation drivers has been greatly enhanced thanks to access to high-resolution satellite imagery provided by Planet 14
    (via their Ambassador Program) and Digital Globe (via the NextView Program, courtesy of an agreement with USAID). We also occasionally purchase imagery from Airbus(viaApollo Mapping).
  2. Publish User-Friendly Reports. The final step is to publish technical, but accessible, articles highlighting novel and important findings on the MAAP web portal. These articles feature concise text and easy-to-understand graphics aimed at a wide audience, including policy makers, civil society, researchers, students, journalists, and the public at large. During preparation of these articles, we consult with Peruvian civil society and relevant government agencies in order to improve the quality of the information.

Endnotes

MINAM-Peru (2016) Estrategia Nacional sobre Bosques y Cambio Climático.

Methodology: Kernel Density tool from Spatial Analyst Tool Box of ArcGis. The 2016 data is based on GLAD alerts, while the 2012-15 data is based on official annual forest loss data

Ravikumar et al (2016) Is small-scale agriculture really the main driver of deforestation in the Peruvian Amazon? Moving beyond the prevailing narrative. Conserv. Lett. doi:10.1111/conl.12264

4 Gutiérrez-Vélez VH et al (2011). High-yield oil palm expansion spares land at the expense of forests in the Peruvian Amazon. Environ. Res. Lett., 6, 044029.

Environmental Investigation Agency EIA (2015) Deforestation by Definition.

NG J (2015) United Cacao replicates Southeast Asia’splantation model in Peru, says CEO Melka. The Edge Singapore, July 13, 2015.

Palmas del Shanusi & Palmas del Oriente; http://www.palmas.com.pe/palmas/el-grupo/empresas

Hill D (2015) Palm oil firms in Peru plan to clear 23,000 hectares of primary forest. The Guardian, March 7, 2015.

Asner GP, Llactayo W, Tupayachi R,  Ráez Luna E (2013) Elevated rates of gold mining in the Amazon revealed through high-resolution monitoring. PNAS 46: 18454. They reported 46,417 hectares confirmed and 3,268 hectares suspected (49,865 ha total).

10 Laurance et al (2014) A global strategy for road building. Nature 513:229; Barber et al (2014) Roads, deforestation, and the mitigating effect of protected areas in the Amazon.  Biol Cons 177:203.

11 UNODC/DEVIDA (2016) Perú – Monitoreo de Cultivos de Coca 2015.

12 Finer M, Jenkins CN (2012) Proliferation of Hydroelectric Dams in the Andean Amazon and Implications for Andes-Amazon Connectivity. PLoS ONE 7(4): e35126.

13 Hansen MC et al (2016) Humid tropical forest disturbance alerts using Landsat data. Environ Res Lett 11: 034008.

14 Planet Team (2017). Planet Application Program Interface: In Space for Life on Earth. San Francisco, CA. https://api.planet.com

Citation

Finer M, Novoa S (2017) Patterns and Drivers of Deforestation in the Peruvian Amazon. MAAP: Synthesis #2.

MAAP #52: Update – Fires Degrade 11 Protected Areas in northern Peru

Image 52a. Data: MODIS/NASA, SERNANP, NCI.

In the previous MAAP #51, we gave an initial impact assesment regarding the recent wave of fires in protected areas in northern Peru. Here, we provide a more comprehensive update.

Our revised estimate is 6,594 acres (2,668 hectares) burned in 11 Protected Areas (see Image 52a) in late 2016. Note that the image is from November and smoke from the fires is clearly seen.

The majority (4,165 acres) occured in 7 national protected areas under national administration (Cutervo National Park, Pagaibamba Protected Forest, Laquipampa Wildlife Refuge, Tumbes National Reserve, Cerros de Amotape National Park, Tabaconas-Namballe National Sanctuary, Udima Wildlife Refuge).*

The estimates refer to areas directly affected by fires (i.e. burned) and come from two sources: our analysis of satellite images and field information from SERNANP, the Peruvian protected areas agency.

It appears that the primary cause of these fires is poor agricultural burning practices during a time of intense drought. These conditions allowed fires to escape into protected areas.

Below, we show a series of new satellite images of some of the burn areas (for images of other areas, see MAAP #51). We also publish a statement from SERNANP.


*The rest occured in 3 national protected areas under private administration (Chicuate-Chinguelas, Huaricancha, and Bosques de Dotor Private Conservation Areas; 1,927 acres) and 1 municipal protected area (ACA Cachiaco-San Pablo; 502 acres).


Cutervo National Park

The following image shows a comparison of the northern sector of Cutervo National Park before (left panel) and after (right panel) the fires. The estimated burn area within the park is 731 acres. The red dots indicate the fire alerts (heat sources) detected by the VIIRS satellite sensor (note the high correlation between the distribution of the alerts and confirmed burn areas).
Image 52b. Data: Planet, VIIRS/NASA, SERNANP. Click to enlarge.

Pagaibamba Protected Forest

The following image shows a comparison of the southern sector of Pagaibamba Protected Forest before (left panel) and after (right panel) the fires. The red dots indicate the fire alerts. SERNANP estimates the burn area within the protected forest at 1,013 acres (see SERNANP statement below).

Image 52c. Data: Planet, Digital Globe (Nextview), VIIRS/NASA, SERNANP. Click to enlarge.

Tumbes National Reserve

The following image shows a comparison of the western sector of Tumbes National Reserve before (left panel) and after (right panel) the fires. It also shows the smaller burn area within Cerros de Amotape National Park. The estimated burn area within the two adjacent protected areas is 1,285 acres. The red dots indicate the fire alerts.

Image 52d. Data: Planet, SERNANP, VIIRS/NASA. Click to enlarge.

Tabaconas-Namballe National Sanctuary

The following image shows a comparison of the western sector of Tabaconas-Namballe National Sanctuary before (left panel) and after (right panel) the fires. The estimated burn area within the national sanctuary is 35 acres. The red dots indicate the fire alerts.

Image 52e. Data: Planet, USGS/NASA, SERNANP, VIIRS/NASA. Click to enlarge.

Dotor Private Conservation Area

The following image shows a comparison of the northern sector of the private conservation area before (left panel) and after (right panel) the fires. The estimated burn area within the national sanctuary is 395 acres. The red dots indicate the fire alerts.

Image 52f. Data: Planet, VIIRS/NASA, SERNANP. Click to enlarge.


Statement from SERNANP

Note: This statement refers to the data in MAAP #51. In the current MAAP #52 report we have made the necessary corrections.

In regards to the effect of forest fires in 6 natural protected areas (Refugio de Vida Silvestre Laquipampa, Refugio de Vida Silvestre Bosques Nublados de Udima, Parque Nacional de Cutervo, Parque Nacional Cerros de Amotape, Reserva Nacional de Tumbes y Bosque de Protección Pagaibamba), located in the departments of Lambayeque and Cajamarca, we clarify that although the ACA and ACCA report refers to 1,400 hectares of heat sources in the particular case of the Pagaibamba Protected Forest, it should be noted that according to the verification carried out in-situ by the SERNANP personnel, the burned habitat amounts to only 410 hectares. The remaining 990 hectares were affected, but indirectly, by presence of smoke and ash.

In addition, SERNANP led a multisectoral action along with our park guards who hare specialized in forest fires, as part of immediate attention to the emergency regarding the forest fires in the affected protected areas, obtaining positive results in a short time.

Finally, SERNANP personnel are assessing the ecological damage and developing a recovery plan.

Citation

Novoa S, Finer M (2017) Update – Fires Degrade 11 Protected Areas in northern Peru. MAAP: 52.

MAAP #51: Fires degrade 7 Protected Areas in northern Peru

analisis_focos_2_v1_b_v1_en
Image 51a. Data: VIIRS/INPE, SERNANP.

Peru’s intense 2016 fire season continues, most recently hitting the northern part of the country.

As seen in this map on the left, during November 2016 the highest concentration of fire alerts (as detected by the VIIRS satellite sensor) were concentrated in the headwaters of the northern Amazon basin (departments of Cajamarca, Piura, and Lambayeque).

It appears that the primary cause of these fires is poor agricultural burning practices during a time of intense drought. These conditions allowed fires to escape into protected areas, including 6 national-level protected areas and 1 municipal protected area.

Until additional cloud-free satellite images are available it is difficult to quantify the total burned area. However, by analyzing the currently available imagery, we estimate 1,980 acres burned in 3 of the protected areas (Laquipampa Wildlife Refuge, Chicuate-Chinguelas PCA, and Cachiaco-San Pablo PCA). The Peruvian protected areas agency, SERNANP, estimates an additional 1,000 acres burned in the Pagaibamba Protected Forest. In addition, by analyzing fire alert data, we estimate that an additional 890 acres affected in the other 3 protected areas (Cutervo National Park, Tabaconas Namballe National Sanctuary, and Huaricancha PCA. See below for details.

Moreover, the Peruvian civil society organization SPDA is highlighting that one of the main problems is the lack of fire-related planning by the Peruvian government, which since 2001 has not fulfilled its mandate to create a National System of Fire Prevention and Control.


Protected Natural Areas

Imagen 51b. Datos: MODIS/NASA, SERNANP, NCI. Click para agrandar.
Image 51b. Data: MODIS/NASA. Click to enlarge.

The image to the left shows a zoom of the area of interest with the high concentration of fire alerts, and highlights the 7 protected areas affected by the fires.

Note in the image (from November 21), the smoke columns inside and surrounding the protected areas. Below, we show a series of high resolution satellite images of these fires.


National Sanctuary Tabaconas Namballe
Private Conservation Area Chicuate-Chinguela
Private Conservation Area Huaricancha
Environmental Conservation Area Cachiaco

La Imagen 51c. Datos: SERNANP, USGS/NASA
Image 51c. Data: SERNANP, USGS/NASA. Click to enlarge.

These 4 adjacent areas protect highland (paramo and montane forest) ecosystems important for regulating water resources in the Amazon headwaters.

In the image to the left, the dashed yellow lines indicate where the fires were concentrated.

We estimate that approximately 2,125 acres have burned in these 4 areas.

The following images zoom in on the burn areas, showing them both before (left panel) and after (right panel) the fires. Note that in the right panels, the dark areas correspond to the burned areas. Also note that the paramo ecosystem was most affected.

La Imagen 51d. Datos: Planet, USGS/NASA
Image 51d. Data: Planet, USGS/NASA
La Imagen 51e. Datos: SERNANP, Planet, Digital Globe (Nextview). Click para agrandar.
Image 51e. Data: SERNANP, Planet, Digital Globe (Nextview). Click to enlarge.
La Imagen 51f. Datos: SERNANP, Planet, Digital Globe (Nextview). Click para agrandar.
Image 51f. Data: SERNANP, Planet, Digital Globe (Nextview). Click to enlarge.

Laquipampa Wildlife Refuge

La Imagen 51f. Datos: SERNANP, USGS/NASA. Click para agrandar.
Image 51g. Data: SERNANP, USGS/NASA. Click to enlarge.

The Laquipampa Wildlife Refuge is an important protected area that conserves one of the most threatened ecosystems in Peru, the Seasonally Dry Northwest Forests.

In the image to the left, the dashed yellow lines indicate where the fires were concentrated.

We estimate that approximately 250 acres have burned in the refuge.

The following images zoom in on the burn areas, showing them both before (left panel) and after (right panel) the fires. Note that in the right panels, the dark areas correspond to the burned areas.


La Imagen 51h. Datos: SERNANP, Digital Globe (Nextview). Click para agrandar.
Image 51h. Data: SERNANP, Digital Globe (Nextview). Click to enlarge.
La Imagen 51i. Datos: SERNANP, Digital Globe (Nextview). Click para agrandar.
Image 51i. Data: SERNANP, Digital Globe (Nextview). Click to enlarge.

Pagaibamba Protected Forest

La Imagen 51j. Datos: SERNANP, USGS/NASA. Click para agrandar.
Image 51j. Data: SERNANP, USGS/NASA. Click to enlarge.

The Pagaibamba Protected Forest, home to an important ecosystem of paramo and montane forest that helps regulate local water supply, was another important protected area affected by the fires.

The Peruvian protected areas agency, SERNANP, estimates that 1,000 acres burned in the Pagaibamba Protected Forest.

The image to the left shows the extensive smoke columns from 7 fire outbreaks during the peak burning in November.


Cutervo National Park

La Imagen 51k. Datos: SERNANP, Airbus. Click para agrandar.
Image 51k. Data: SERNANP, Airbus. Click to enlarge.

Cutervo National Park, created in 1979, was the first protected area established in Peru. It too has also been degraded by the intense season.

The fire alerts indicate that around 494 acres burned within the national park.

The image to the left shows the extensive smoke during the peak burning in November. The yellow circle indicates where the fire alerts were concentrated.


Citation

Novoa S, Finer M (2016) Fires degrade 6 Protected Areas in northern Peru. MAAP: 51.


MAAP #50: Gold Mining Deforests 31,000 Acres in southern Peruvian Amazon during last 4 years

We analyzed hundreds of high-resolution satellite images to calculate the amount of recent (October 2012 – October 2016) gold mining deforestation in the southern Peruvian Amazon: 30,895 acres. Combining this finding with previous studies, we estimate the total gold mining deforestation of around 154,440 acres in the region. Image 50a shows the recent gold mining deforestation in red, and all previous gold mining deforestation in yellow.

Key findings include:

  • The vast majority of the deforestation has occurred in the Madre de Dios region, but also has extended to the adjacent regions of Cusco and Puno.
  • The rate of recent gold mining deforestation was much lower (42%) than during its peak, which occurred between 2010 and 2012 (6,640 vs. 15,650 acres/year).
  • However, half of the recent gold mining deforestation (15,830 acres) occurred within the buffer zones of three protected areas (Tambopata National Reserve, Bahuaja Sonene National Park, and Amarakeari Communal Reserve).
  • Moreover, recent gold mining deforestation invaded two protected areas (Tambopata and Amarakaeri).
Image 50a. Data: MAAP, Asner et al (2013) PNAS, SERNANP. Click to enlarge.

Previously, Dr. Greg Asner and colleagues documented the deforestation of approximately 123,200 acres (50,000 hectares) by gold mining activities in the southern Peruvian Amazon through September 2012 (Asner et al 2013). We have updated this information by analyzing hundreds of recent (2016) high-resolution satellite images (see Methodology section below). We documented an additional 30,895 acres (12,503 hectares) of gold mining deforestation between October 2012 and October 2016. Thus, combining both studies, we estimate the total gold mining deforestation of around 154,440 acres (62,500 hectares).

Areas of Interest

We have identified at least 7 areas of interest, characterized by high levels of gold mining deforestation between 2013 and 2016 (see Insets A-G in Image 50b). Below, for each of these areas, we briefly describe its situation and show a recent image from 2016 (right panel) in relation to an older image from between 2011 and 2013 (left panel). The yellow circles indicate the primary areas of gold mining deforestation between those dates. Also, we show a high resolution image that represents each area.

Image 50b. Data: MAAP, Asner et al (2013) PNAS, SERNANP

A. Tambopata National Reserve and Buffer Zone (La Pampa sector)

Image 50c. Data: USGS/NASA, SERNANP. Click to enlarge.

This area is the most serious in terms of the advance of deforestation in a protected area. As documented in MAAP #46, after the initial invasion in November 2015, illegal mining within the Tambopata National Reserve has now exceeded 450 hectares. Recently, the Peruvian Government has carried out a series of major raids against the illegal miners in this area (see MINAM 2016).

Image 50d. Data: Digital Globe (Nextview), SERNANP. Click to enlarge.

In regards to the buffer zone, there has been a sharp increase in the deforestation in the area known as La Pampa. In total, we estimate 9,720 acres of gold mining deforestation within the buffer zone of Tambopata National Reserve over the past four years.

Image 50e. Data: Digital Globe (Nextview), SERNANP. Click to enlarge.

B. Upper Malinowski River (Bahuaja Sonene National Park buffer zone)

Image 50f. Data: USGS/NASA, SERNANP. Click to enlarge.

Upstream of the Tambopata National Reserve, illegal gold mining is also advancing along the upper Malinowski River. This area is located in the buffer zone of Bahuaja Sonene National Park. We estimate 2,256 acres of gold mining deforestation has occurred within this buffer zone over the past four years.

Image 50g. Data: Digital Globe (Nextview), SERNANP. Click to enlarge.

C. Delta-1/Amarakaeri Communal Reserve

Image 50h. Data: USGS/NASA, SERNANP. Click to enlarge.

An area known as Delta-1 has also experienced a recent increase in gold mining deforestation. This area is partially located within the buffer zone of the Amarakaeri Communal Reserve. As we reported in MAAP #6, illegal gold mining entered the Reserve between 2014 and 2015. The joint patrol and monitoring actions between the national government and indigneous representatives of the Reserve (ECA Amarakaeri) managed to stop the advance of mining deforestation within the Reserve in 2016 (MAAP #44). However, gold mining deforestation continues in the buffer zone of the Reserve, clearing 3,857 acres over the past four years.

Image 50i. Data: Digital Globe (Nextview), SERNANP. Click to enlarge.

D. Cusco: Camanti/Quince Mil

Image 50j. Data: USGS/NASA, SERNANP. Click to enlarge.

The advance of gold mining is not limited to Madre de Dios, as it has also expanded in the Cusco region. Most mining activity in Cusco occurs along the Araza and Nuciniscato Rivers in an area known as Camanti/Quince Mil (located between the southeastern sector of the Amarakaeri Communal Reserve and the Interoceanic Highway). We estimate that gold mining deforestation in Cusco reached 1,006 acres over the past four years.

Image 50k. Data: Digital Globe (Nextview), SERNANP. Click to enlarge.

E. Madre de Dios River (i)

Gold mining deforestation also continues to advance along the Madre de Dios River, between the city of Puerto Maldonado and the area of Boca Colorado. Mining in this area is characterized by many small and scattered mining operations.

Image 50l. Data: USGS/NASA, MINAGRI. Click to enlarge.
Image 50m. Data: Digital Globe (Nextview), MINAGRI. Click to enlarge.

F. Madre de Dios River (ii)

Image 50m. Data: USGS/NASA. Click to enlarge.
Image 50n. Data: USGS/NASA. Click to enlarge.

G. Pariamanu River

Image 50o. Data: USGS/NASA. Click to enlarge.

Finally, we documented the start of mining in a new area: along the Pariamanu river. We estimate that, so far, gold mining deforestation along this river has reached 170 acres.

Image 50p. Data: Digital Globe (Nextview). Click to enlarge.

Methodology

We used gold mining deforestation data from Asner et al 2013 as a pre-2013 base. We then added 2013-2014 forest loss data (Hansen et al 2013) and 2015-2016 GLAD alerts (Hansen et al 2016), both datasets generated by the University of Maryland and Google. The 2013-2016 data was filtered to only include forest loss directly caused by gold mining as determined by visual analysis of 2016 high-resolution satellite imagery. This included 0.5 m resolution imagery from Digital Globe and 3-5 m resolution imagery from Planet. In total, we analyzed 135 images from Digital Globe and 34 from Planet. Gold mining deforestation is suitable for this type of visual analysis because it leaves a unique footprint, quite distinct from other possible causes such as agriculture, cattle pasture, and natural river movement. As described in Asner et al 2013, “gold mining operations result in a unique combination of bare substrate and standing water[…]” Finally, we erased any overlapping mining deforestation data to avoid duplicating information between data sets. Displayed Landsat images are bands 753, made transparent over bands 432.

References

Asner GP, Llactayo W, Tupayachi R,  Ráez Luna E (2013) Elevated rates of gold mining in the Amazon revealed through high-resolution monitoring. PNAS 46: 18454. They reported 46,417 hectares confirmed and 3,268 hectares suspected (49,865 ha total).

Hansen MC et al (2013) High-Resolution Global Maps of 21st-Century Forest Cover Change. Science 342: 850–53.

Hansen MC et al (2016) Humid tropical forest disturbance alerts using Landsat data. Environ Res Lett 11: 034008.

Citation

Finer M, Olexy T, Novoa S (2016) Gold Mining Deforests 32,000 Acres in southern Peruvian Amazon from 2013 to 2016. MAAP: 50.

MAAP #33: Illegal Gold Mining Alters Course of Malinowski River (border of Tambopata National Reserve)

In MAAP #30, we described the illegal gold mining invasion of Tambopata National Reserve, an important protected area in the southern Peruvian Amazon (department of Madre de Dios). Here in MAAP #33, we show that illegal gold mining is also altering the course of the Malinowski River, which forms the natural boundary of the Reserve. Image 33a shows the two areas where we have documented a total artificial deviation (cutting) of 4.4 km (2.7 miles) of the river (see details below).

Image 33a. Data: Planet Labs, SERNANP

Zoom A: A Recent Deviation of the Malinowski River

Image 33b shows the final stage of the deviation of the Malinowski River between March 31 (left panel) and May 3 (right panel) of this year in the area indicated by Inset A in Image 33a. The new flow of the river is clearly seen in the right panel, cutting a 1.7 km stretch of the previous course.

Image 33b. Data: Planet Labs, Digital Globe (Nextview)

Image 33c shows with greater precision how the Malinowski river was diverted in this area between April and May 2016. The red arrow indicates the exact same place across time in the three images.

Image 33c. Data: Digital Globe (Nextview)

Zoom B: An Earlier Deviation of the Malinowski River

In February 2016, Peruvian specialists presented how mining activity had recently changed the natural course of the Malinowski river in the area indicated in Inset B*. Image 33d shows the progressive change: from the increase in mining activity along the normal course of the river in June 2013 (left panel), to the new stretch of riverbed in June 2015 (center panel), and finally to the expansion of mining activity along the previous course (right panel). The red dot indicates the same place over time in the three images. A total of 2.7 km was cut from the previous river course.

Image 33d. Data: Digital Globe (Nextview), Planet Labs

Ecological Impacts

According to Dr. Carlos Cañas**, coordinator of the Amazon Waters Initiative for Wildlife Conservation Society in Peru, the deviation of the natural course of the Malinowski River will have significant ecological impacts, including:

  • Although the Malinowski River’s course has natural movement, the changes documented in MAAP #33 definitely represent an artificial alteration caused by mining activity.
  • These artificial changes are altering the course of the Malinowski from one that is “narrow and defined” to one that is “wide and scattered.” This change impacts the river’s flood patterns by changing the intensity, timing, and frequency of flooding along the river’s banks. This implies an effect on the migratory behavior of many species of fish downstream, which receive and interpret signals from the river to guide vital functions like feeding and reproduction.
  • The river’s new wider course also causes the velocity of water downstream to decrease, which will lead to increased levels of sediment in the discharge zone of the largest tributary, the Tambopata. Given the nature of the Tambopata, this could provide the almost-permanent damming of the Malinowski, as greater volume of the Tambopata means more sedimentation at the mouth of the river. Among other things, this could hinder the entry of fish to their feeding zones.
  • As seen in Image 33d, fish access to certain areas will be interrupted by the blockade and closure of channels. Also, the connection between the floodable forest and the river channel is completely altered, if not interrupted, in this section of the river. Many fish species that eat fruit or vegetation from the adjacent forest depend on this seasonal connection for food.
  • The Malinowski River, since it is a tributary of the Tambopata River, has natural áreas that are crucial to the reproduction of many local species. Its tributary streams represent habitats that differ from the main river and harbor an incredible variety of fish and invertebrates that contribute to the biodiversity of the river basin. These streams have little sediment, and are thus highly transparent. Mining will destroy or drastically alter these environments, severely impacting this biodiversity.

Referencias

*Villa L., Campos L. G., Pino I. M. (01 de febrero de 2016). Primer Sistema de Alerta Temprana de Geoinformación (SAT-GI) para Áreas Naturales Protegidas del Perú: Reserva Nacional Tambopata y el Ámbito de Madre de Dios del Parque Nacional Bahuaja Sonene. Reporte Nº 001-2016.

** Cañas CM, Waylen PR (2011) Modelling production of migratory catfish larvae (Pimelodidae) on the basis of regional hydroclimatology features of the Madre de Dios Basin in southeastern Peru. Hydrol. Process. DOI: 10.1002/hyp.8192.

**Cañas CM, Pine WE (2011) DOCUMENTATION OF THE TEMPORAL AND SPATIAL PATTERNS OF PIMELODIDAE CATFISH SPAWNING AND LARVAE DISPERSION IN THE MADRE DE DIOS RIVER
(PERU): INSIGHTS FOR CONSERVATION IN THE ANDEAN-AMAZON HEADWATERS. River Res. Applic. 27: 602–611.

Citation

Finer M, Novoa S (2016)  Illegal Gold Mining Alters the Course of the Malinowski River (border of Tambopata National Reserve). MAAP: 33.

MAAP #29: Construction of New Road between Manu National Park and Amarakaeri Communal Reserve (Madre de Dios)

Here in MAAP #29, we describe the Nuevo Eden-Boca Manu-Boca Colorado road project in the southern Peruvian Amazon (Madre de Dios region). The objective of this article is to show the current state of construction and quantify the direct and indirect deforestation caused thus far by the road. This is a controversial road project because it cuts through the buffer zones of two important protected areas, the Amarakaeri Communal Reserve and Manu National Park*.

MAAP_Manu_a_m_v1_en
Image 29a. Data: SERNANP, USGS, MINAGRI, IBC, CLASlite, PNCB/MINAM, Hansen/UMD/Google/USGS/NASA, SPOT

Image 29a shows the general context of the area between Amarakaeri  and Manu where the road is being constructed. The yellow line indicates the section of road built in 2015 (11.6 km) between the towns of New Eden and Shipetiari (see right panel for high-resolution image of this construction). The red line indicates the new section under construction thus far in 2016 (21.8 km). Thus, in total, we have documented the construction of 33.4 km of road within the Amarakaeri Communal Reserve buffer zone. Finally, the pink line indicates the future road section planned to Boca Manu and then to Boca Colorado.

Road Construction in 2015

Image 29b shows a series of satellite images (Landsat) that illustrate the rapid road construction during 2015. The first two panels show the construction of 11.6 km between February (left panel) and October (central panel) 2015. The yellow arrows in the central panel indicate the direct deforestation (20 hectares) associated with construction of the route. The yellow circles in the right panel indicate the indirect (secondary) deforestation associated with the road (12 hectares). Thus, in total, we have documented the deforestation of 32 hectares (or 79 acres) associated with the road as of mid-March 2016.

MAAP_Manu_c_m_v1_en
Image 29b. Data: NASA/USGS.

New Road Construction in 2016

Image 29c shows the continued road construction (2.9 km) between January and mid-March 2016 (see orange arrows in the left panel). Moreover, using high-resolution imagery provided by Planet Labs, the right panel shows a new path (see red arrows) that is likely the leading edge of the current road construction. This path now extends an additional 19 km in the direction of Boca Manu (see Image 29d).

MAAP_Manu_e_m_v1_en
Image 29c. Data: NASA/USGS, Planet Labs
Imagen Xd. Datos: USGS
Image 29d. Data: NASA/USGS

References

*MINAM (2016) MINAM está en contra de predictamen que permitiría la construcción de la carretera en zona de amortiguamiento del Manu y de Amarakaeri. http://www.minam.gob.pe/perucrecimiento/2016/02/29/minam-esta-en-contra-de-predictamen-que-permitiria-la-construccion-de-la-carretera-en-zona-de-amortiguamiento-del-manu-y-de-amarakaeri/

MINAM (2015) MINAM y SERNANP manifiestan preocupación por aprobación de ley que declara de interés nacional carretera en zona de amortiguamiento del Manu y Amarakaeri. http://www.minam.gob.pe/notas-de-prensa/minam-y-sernanp-manifiestan-preocupacion-por-aprobacion-de-ley-que-declara-de-interes-nacional-carretera-en-zona-de-amortiguamiento-del-manu-y-amarakaeri/

Citation

Finer M, Novoa S, Olexy T (2016) Construction of a New Highway between Manu National Park and Amarakaeri Communal Reserve (Madre de Dios), 2016. MAAP: 29.

MAAP #24: Illegal Gold Mining Penetrates Deeper into Tambopata National Reserve

*NoteDuring the preparation of this analysis, the Peruvian government conducted an operation against the illegal gold mining activity in the area described below (see this news article in Spanish for more information).

In MAAP #21, we revealed, using high-resolution images, the first sign of an invasion into the Tambopata National Reserve (an important natural protected area in the southern Peruvian Amazon) by illegal gold mining activities. Here in MAAP #24, we show two additional types of satellites imagery (due to lack of new high-resolution image) indicating that the illegal gold mining deforestation continues to penetrate deeper into the Reserve.

Image 24a. Landsat images showing the expansion of deforestation inside the Tambopata National Reserve between December 2015 (left panel) and January 2016 (right panel). Data: USGS, SERNANP.

Image 24a shows a comparison between two Landsat images (30 m resolution) indicating that the deforestation continued to increase within the Reserve between December 2015 (left panel) and January 2016 (right panel). The red circles indicate the general location of the newly deforested areas, which appear pink (soil without forest cover) and blue (wastewater pools) in contrast to the green (standing forest). The deforestation inside the Tambopata National Reserve between December 2015 and January 2016 is approximately 20 hectares (49 acres).

Image 24b is the base map showing the area described above in a larger context. The red inset box indicates the area shown in Image 24a.

Image 24b. Reference Map of mining area. Data: SERNANP, WorldView-2 of Digital Globe (NextView).

Radar: Powerful New Tool

Image 24c. Radar images showing the expansion of deforestation inside the Tambopata National Reserve between November 2015 (left panel) and January 2016 (right panel) Data: SERNANP, Sentinel-1

Image 24c shows, for the first time in MAAP, information from a radar satellite (Sentinel-1 from the European Space Agency). Unlike multi-spectral Landsat imagery that is vulnerable to clouds blocking the view, radar imagery is useful year-round (even the Amazon rainy season) because it can penetrate through cloud cover. In the displayed images, the shades of gray are related to the topography and the height of the forest. Lower areas, such as recently deforested lands and bodies of water, appear darker (almost black) in color, while higher areas such as standing forests appear lighter in color. Image 24c confirms the increase in deforestation between November 2015 (left panel) and January 2016 (right panel) within the area indicated above (see the red boxes).

Citation

Finer M, Novoa S, Olexy T (2016) Illegal Gold Mining Penetrates Deeper into Tambopata National Reserve. MAAP: 24.

MAAP #22: Yaguas – Another Big Conservation Opportunity for Peru

Peru recently celebrated a major conservation victory for 2015 with the creation of Sierra del Divisor National Park. Prior to this announcement, Sierra del Divisor was classified as a Reserved Zone, which is a temporary measure to protect an area of biological importance until the government is able to determine a final designation. In these cases, national park status represents the strongest possible final designation.

Now in 2016, there is the opportunity for another major conservation victory in Peru: creation of Yaguas National Park. Yaguas received Reserved Zone status in 2011 and is now awaiting its final designation. Yaguas Reserved Zone is both big (868,928 hectares or 2,147,168 acres) and remote, located in extreme northeast Peru within the department of Loreto (see Image 22a).

1. MAAP_Yaguas_2x_a_v4
Image 22a. Yaguas Reserved Zone. Data: USGS, SERNANP, PNCB/MINAM, Hansen/UMD/Google/USGS/NASA

Note that Yaguas is a critical part of a series of protected areas that provide landscape level biological connectivity in northeast Peru. In addition, Yaguas borders and complements a large protected Colombian landscape, forming one of the largest assemblies of protected areas and indigenous lands in the Amazon.

Deforestation Analysis

Yaguas Reserved Zone is the rare example of an area in extremely good conservation condition. As seen In Image 22b, we detected virtually no deforestation within or surrounding the reserve. Note that the background in Image 22b is a Landsat image (30 m resolution) from December 2015 showing the reserve is completely covered with intact forest.

2. MAAP_Yaguas_a_v2_es
Image 22b. Yaguas Deforestation analysis. Data: USGS, PNCB/MINAM, Hansen/UMD/Google/USGS/NASA, MINAGRI, SERNANP

Carbon Analysis

Dr. Greg Asner (Carnegie Institution for Science) and the Peruvian Ministry of the Environment recently produced a high-resolution carbon map of Peru (Asner et al. 2014 a,b). As seen in Image 22c, much of the reserve contains very high carbon levels. Using this data, we calculated that Yaguas Reserved Zone contains approximately 102 million metric tons of above-ground carbon, one of the highest totals for a protected area in all of Peru.

3. MAAP_Yaguas_carbono
Image 22c. High-resolution carbon geography of the Yaguas Reserved Zone. Data: Asner et al. 2014 a,b.

Asner GP, Knapp DE, Martin RE, Tupayachi R, Anderson CB, et al. (2014 a) Targeted carbon conservation at national scales with high-resolution monitoring. Proceedings of the National Academy of Sciences111(47), E5016-E5022.

Asner GP, Knapp DE, Martin RE, Tupayachi R, Anderson CB, et al. (2014 b) The high-resolution carbon geography of Peru. Berkeley, CA: Minuteman Press.

Biodiversity

The Yaguas Reserved Zone also contains extremely high levels of biodiversity, particularly for fish. In fact, according to a rapid biological inventory by the Field Museum in 2010, Yaguas may be home to the highest fish diversity in Peru. During the inventory, scientists recorded 337 fish species in three weeks, far more than any other rapid inventory in Peru (see Image 22d). Biologists estimate that Yaguas is home to around 550 fish species, making it one of South America’s most diverse aquatic ecosystems.

The Reserved Zone (and proposed national park) was specifically designed to protect this extraordinary aquatic diversity. It contains a complete gradient of lowland river aquatic habitats, from headwaters (first order and intermediate) and springs to lowland areas encompasing habitats such as floodplains, lakes, swamps, bogs, and a meandering main river (see Images 22e and 22f). Importantly, unlike most of the major rivers protected by Peruvian national parks, the Yaguas River is born in the Amazon lowlands, not in the Andes. Thus, it contains hydrological processes and riparian habitats that are not yet strictly protected by the Peruvian system of protected areas.

Image Xd. Number of fish species recorded in rapid inventories of the Yaguas Reserved Zone and 10 other sites in Loreto, Peru. Data: http://fm2.fieldmuseum.org/rbi/results.asp
Image 22d. Number of fish species recorded in rapid inventories of the Yaguas Reserved Zone and 10 other sites in Loreto, Peru. Data: http://fm2.fieldmuseum.org/rbi/results.asp


Image Xe. Aerial view of Yaguas River. Photo Credit: Alvaro del Campo (Field Museum)
Image 22e. Aerial view of Yaguas River. Photo Credit: Alvaro del Campo (Field Museum)
Quebrada_Cachimbo_1_ADC
Image 22f. Aerial view of Yaguas River and the Cachimbo tributary. Photo Credit: Alvaro del Campo (Field Museum)

References:

Hidalgo, M. H., y A. Ortega-Lara. 2011. Peces. Pp. 98–108 y 308–329 en N. Pitman, C. Vriesendorp, D. K. Moskovits, R. von May, D. Alvira, T. Wachter, D. F. Stotz y Á. del Campo, eds. Perú: Yaguas-Cotuhé. Rapid Biological and Social Inventories Report 23. The Field Museum, Chicago. http://fm2.fieldmuseum.org/rbi/results_23.asp

Pitman, N., C. Vriesendorp, D. K. Moskovits, R. von May, D. Alvira, T. Wachter, D. F. Stotz y Á. del Campo, eds. 2011. Perú: Yaguas-Cotuhé. Rapid Biological and Social Inventories Report 23. The Field Museum, Chicago. http://fm2.fieldmuseum.org/rbi/results_23.asp

Acknowledgments

We thank the Field Museum and Instituto del Bien Común for helpful comments and information.

Citation

Finer M, Novoa S (2015) Another Big Conservation Opportunity for Peru: Yaguas.


MAAP #21: Illegal Gold Mining Deforestation Enters Tambopata National Reserve (Madre de Dios, Peru) [High-Resolution View]

*Note: During the review process for this article, a major operation against illegal mining activities was carried out by the Peruvian government in the area described below.

Image 21a illustrates a recent illegal gold mining invasion of the Tambopata National Reserve. Tambopata is an important protected area in the southern Peruvian Amazon (department of Madre de Dios). Image 21a compares two high-resolution (0.5 m) images taken two months apart over the same area along the northern border of the reserve. One can clearly see the beginning of the illegal gold mining activity and deforestation within the reserve between September (left panel) and November (right panel) 2015. For more context regarding the area in question, see the yellow box in Image 21b.

Image 20a. Recent invasion of Tambopata National Reserve. Data: SERNANP, WorldView-2 and WorldView-3 of Digital Globe (NextView).
Image 21a. Recent invasion of Tambopata National Reserve. Data: SERNANP, WorldView-2 and WorldView-3 of Digital Globe (NextView).

Reference Map

Image 21b is a reference map showing the above detailed area in the larger context between the northern border of the Tambopata National Reserve and the illegal gold mining zone known as La Pampa. The yellow box corresponds to the area detailed in Image 21a. Note that the original boundary of the reserve created in 2000 no longer coincides with the route of the Malinowski River due to its natural movement over time.

Image 20b. Reference Map. Data: SERNANP, WorldView-2 of Digital Globe (NextView).
Image 21b. Reference Map. Data: SERNANP, WorldView-2 of Digital Globe (NextView).

Deforestation Data

Image 21c presents an updated analysis of the deforestation in the area between La Pampa and the Tambopata National Reserve. In this specific area, we documented the deforestation of 2,518 hectares (6,222 acres) between 2013 and 2015, the vast majority of which is clearly linked to illegal gold mining activities. The majority of this recent deforestation has occurred in La Pampa, a bit north of the reserve (but within its buffer zone). However, recent deforestation has also occurred along the Malinowski river, which forms the northern boundary of the reserve in this area.

Imagen 3. Análisis de deforestacion. Fuentes: SERNANP, USGS, WorldView-2 de Digital Globe (NextView).
Image 21c. Analysis of deforestation. Data: CLASlite, Hansen/UMD/Google/USGS/NASA, SERNANP, USGS, WorldView-2 of Digital Globe (NextView).

In Image 21c, the data from 2000-2014 came from Hansen/UMD/Google/USGS/NASA, while the data from 2015 came from our own analysis using CLASlite.

Citation

Finer M, Novoa S, Snelgrove C, Peña N (2015) Confirming an Illegal Gold Mining Invasion of the Tambopata National Reserve (Madre de Dios, Peru) [High-Resolution View]. MAAP #21.