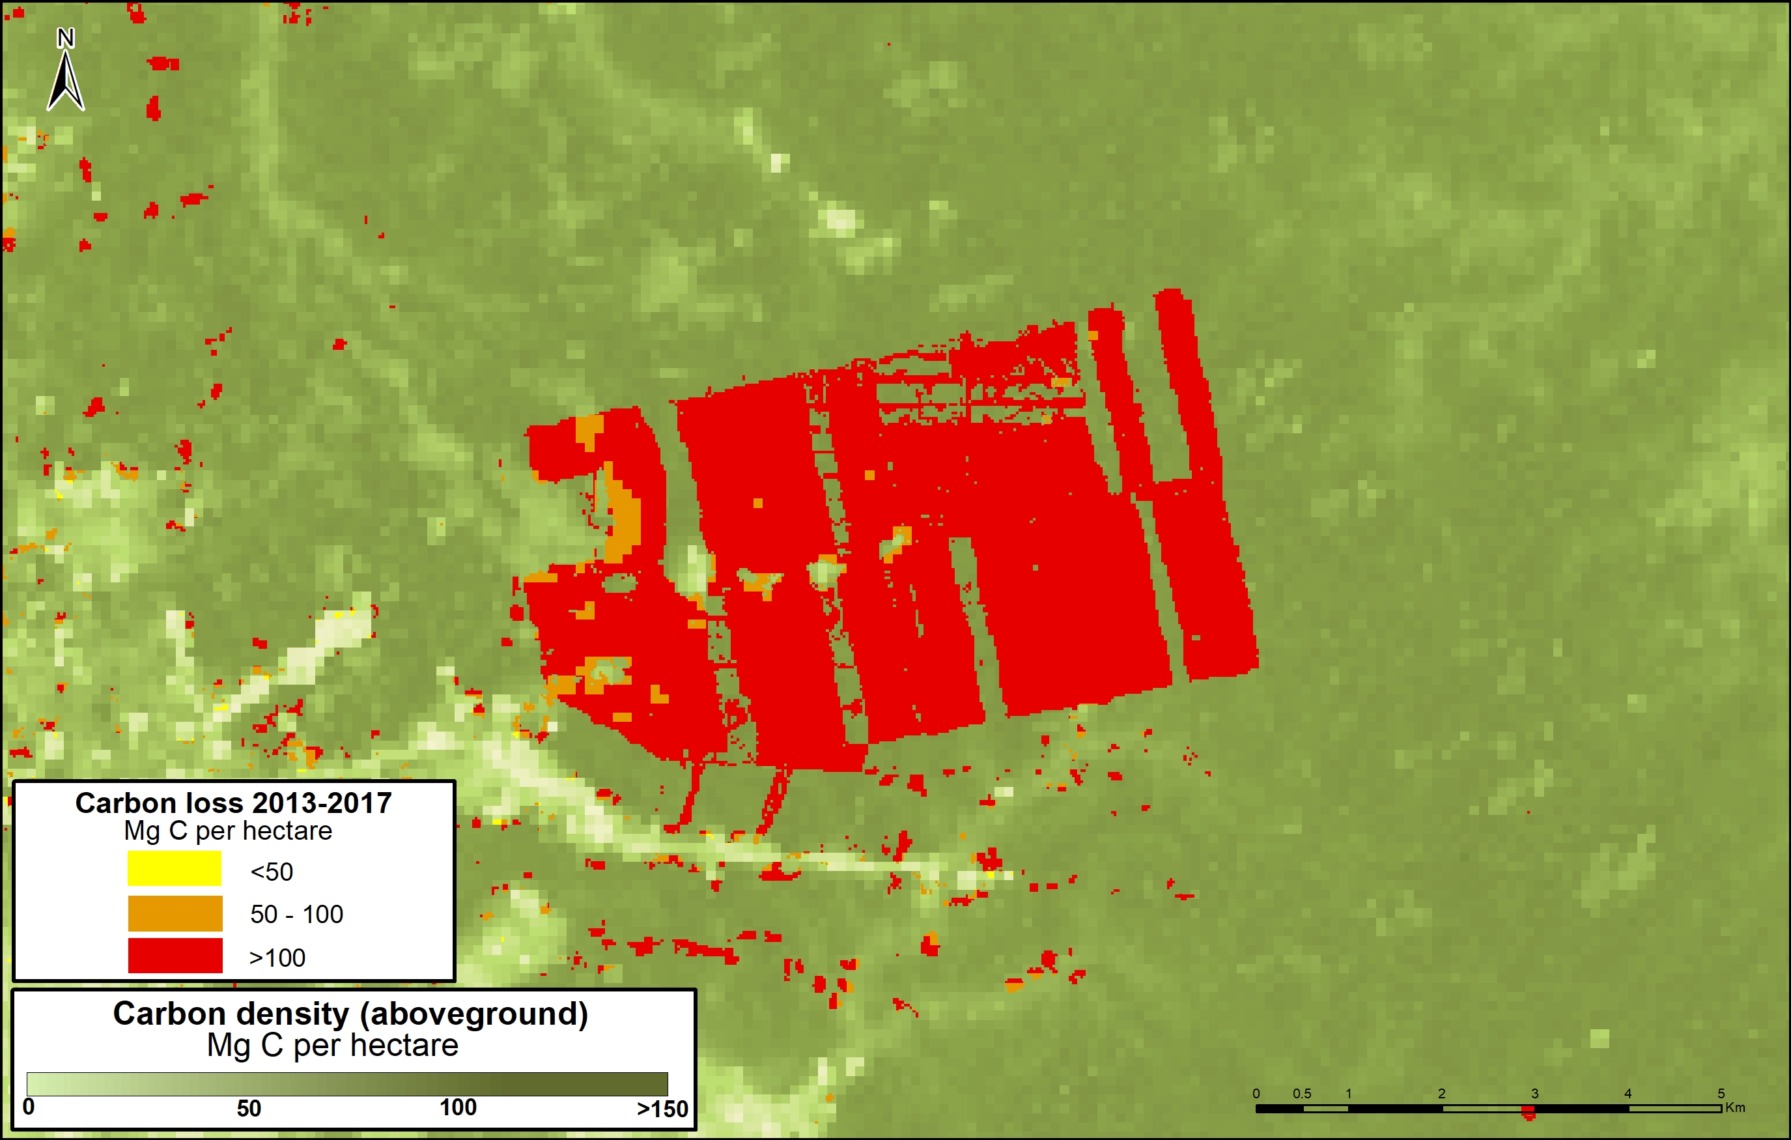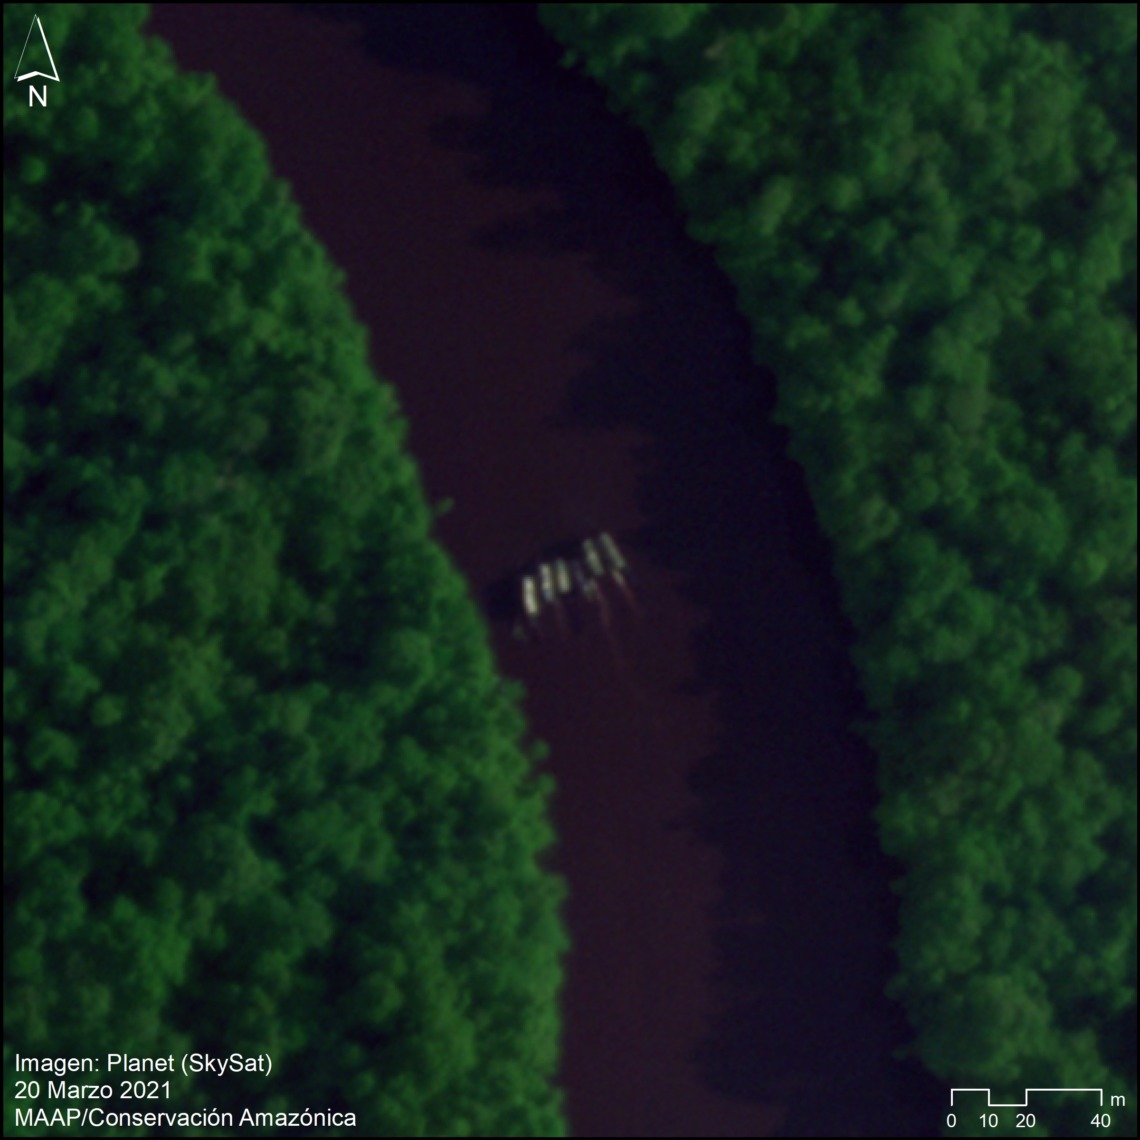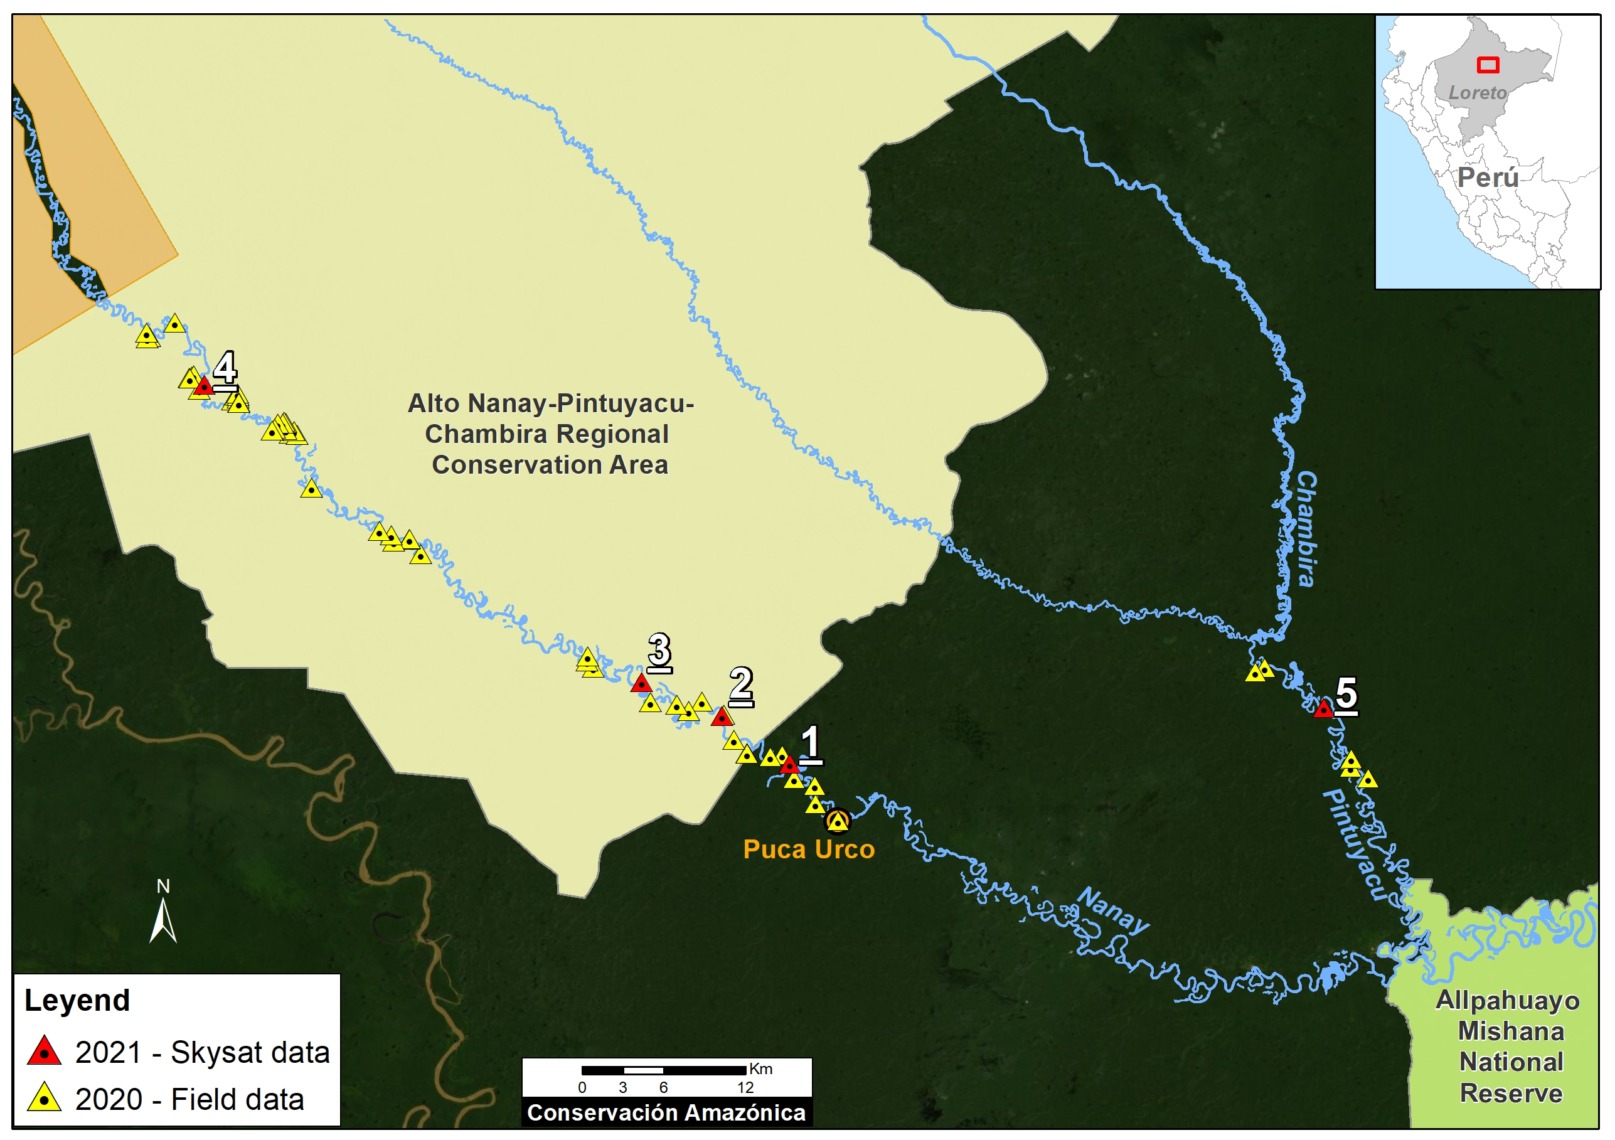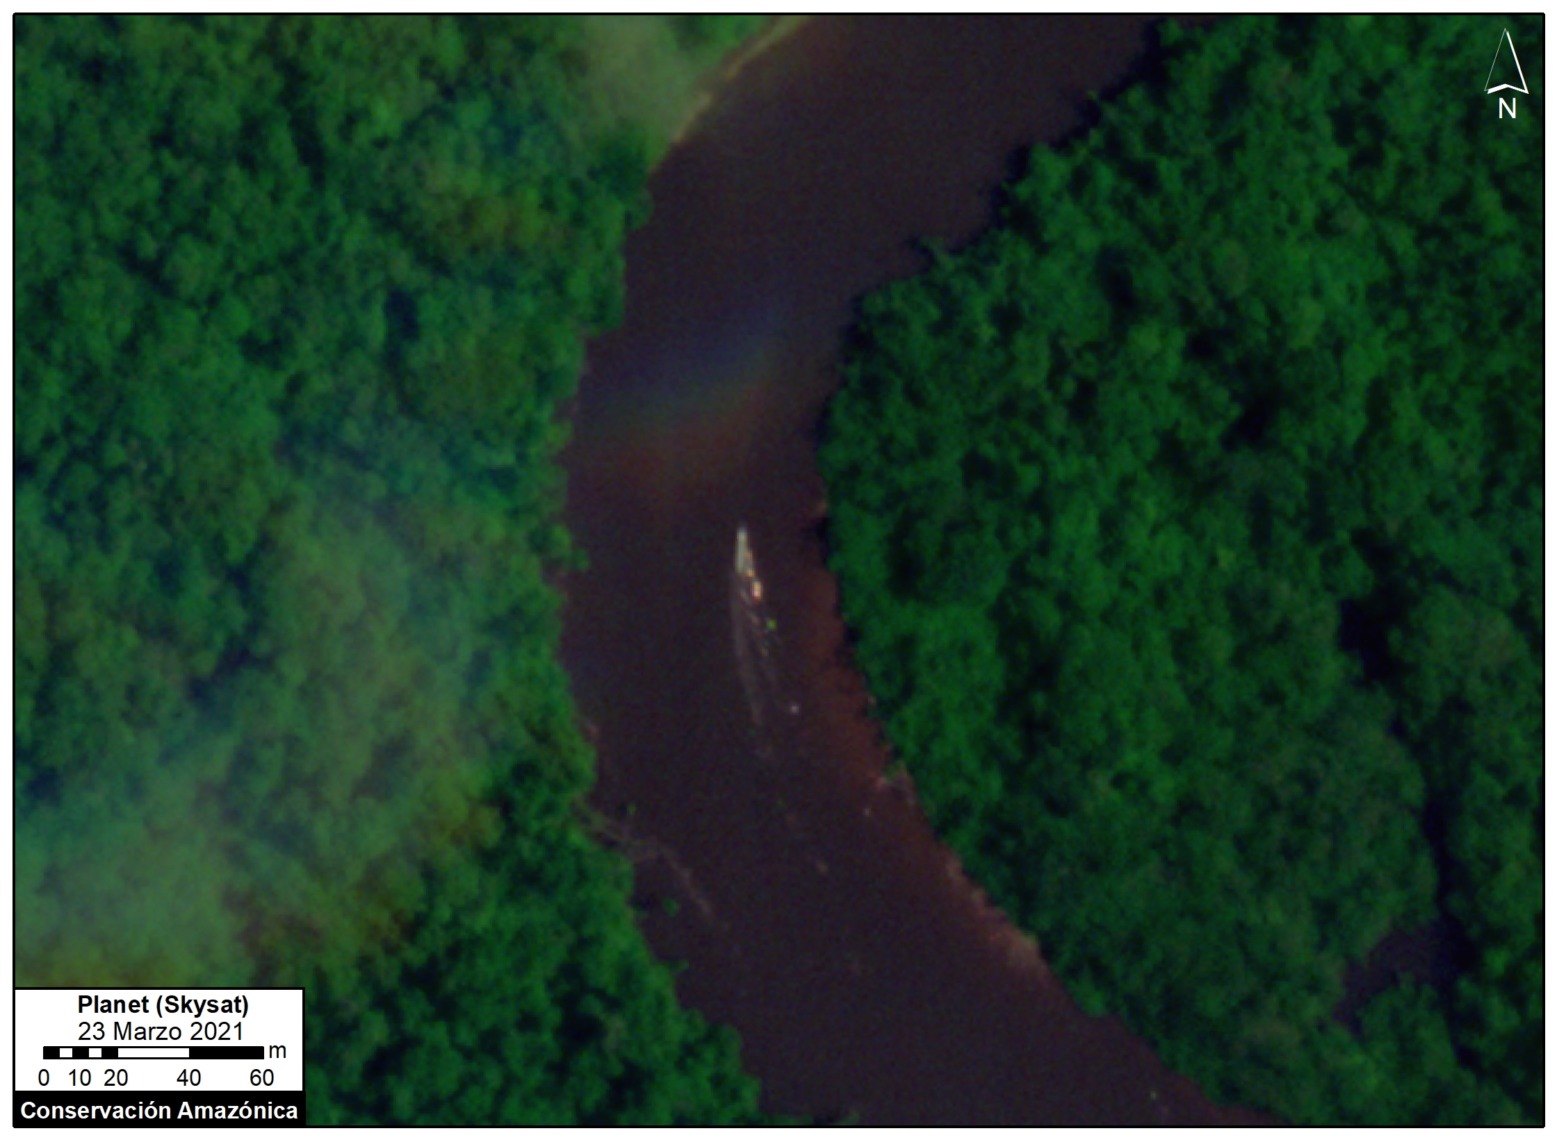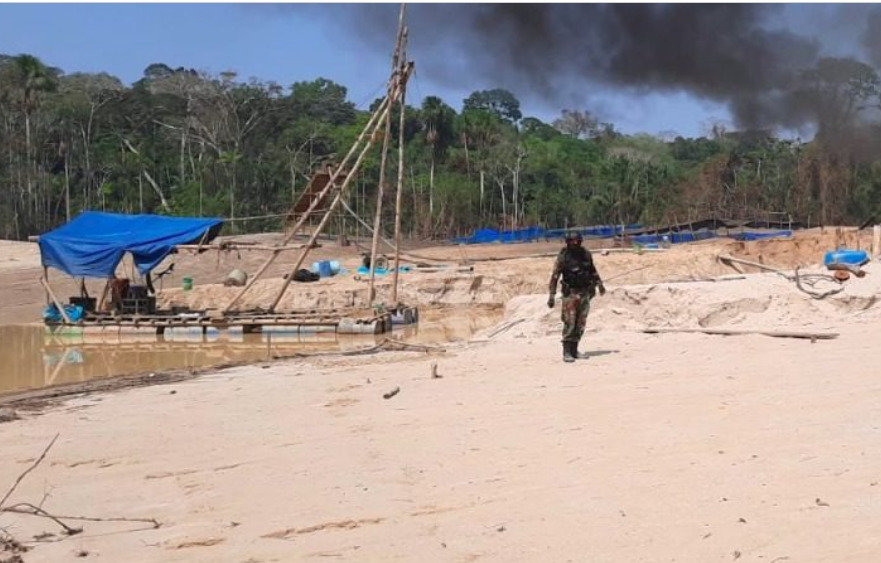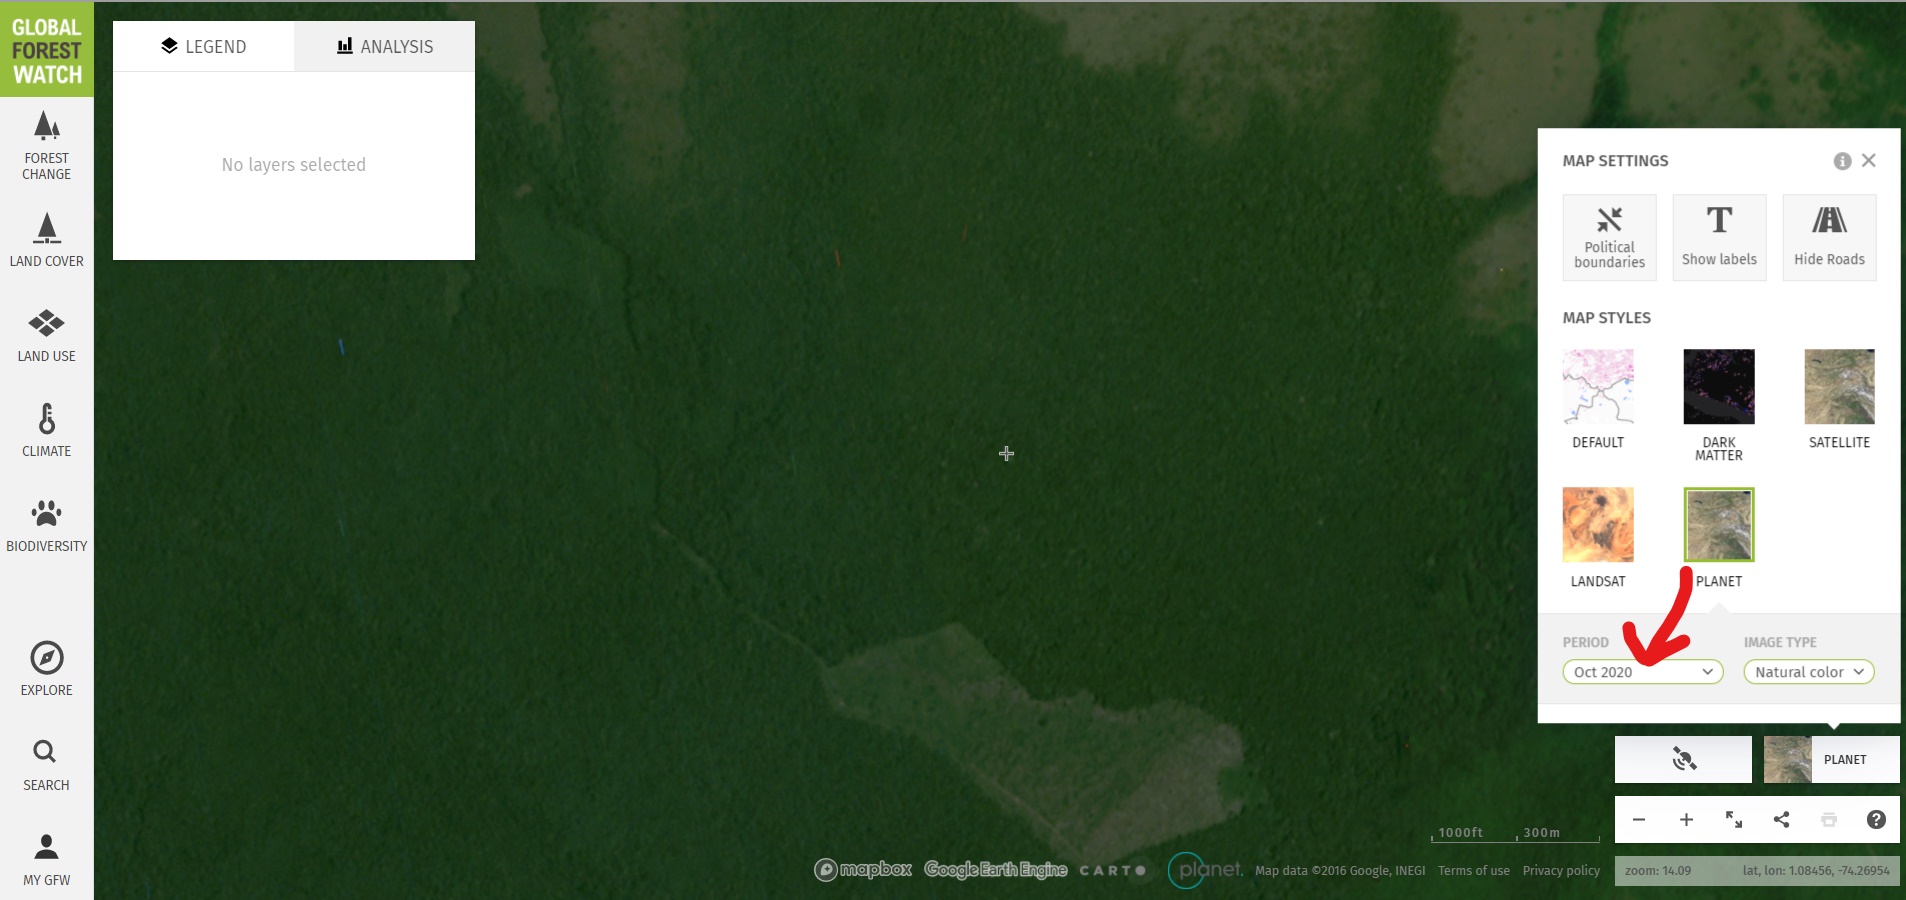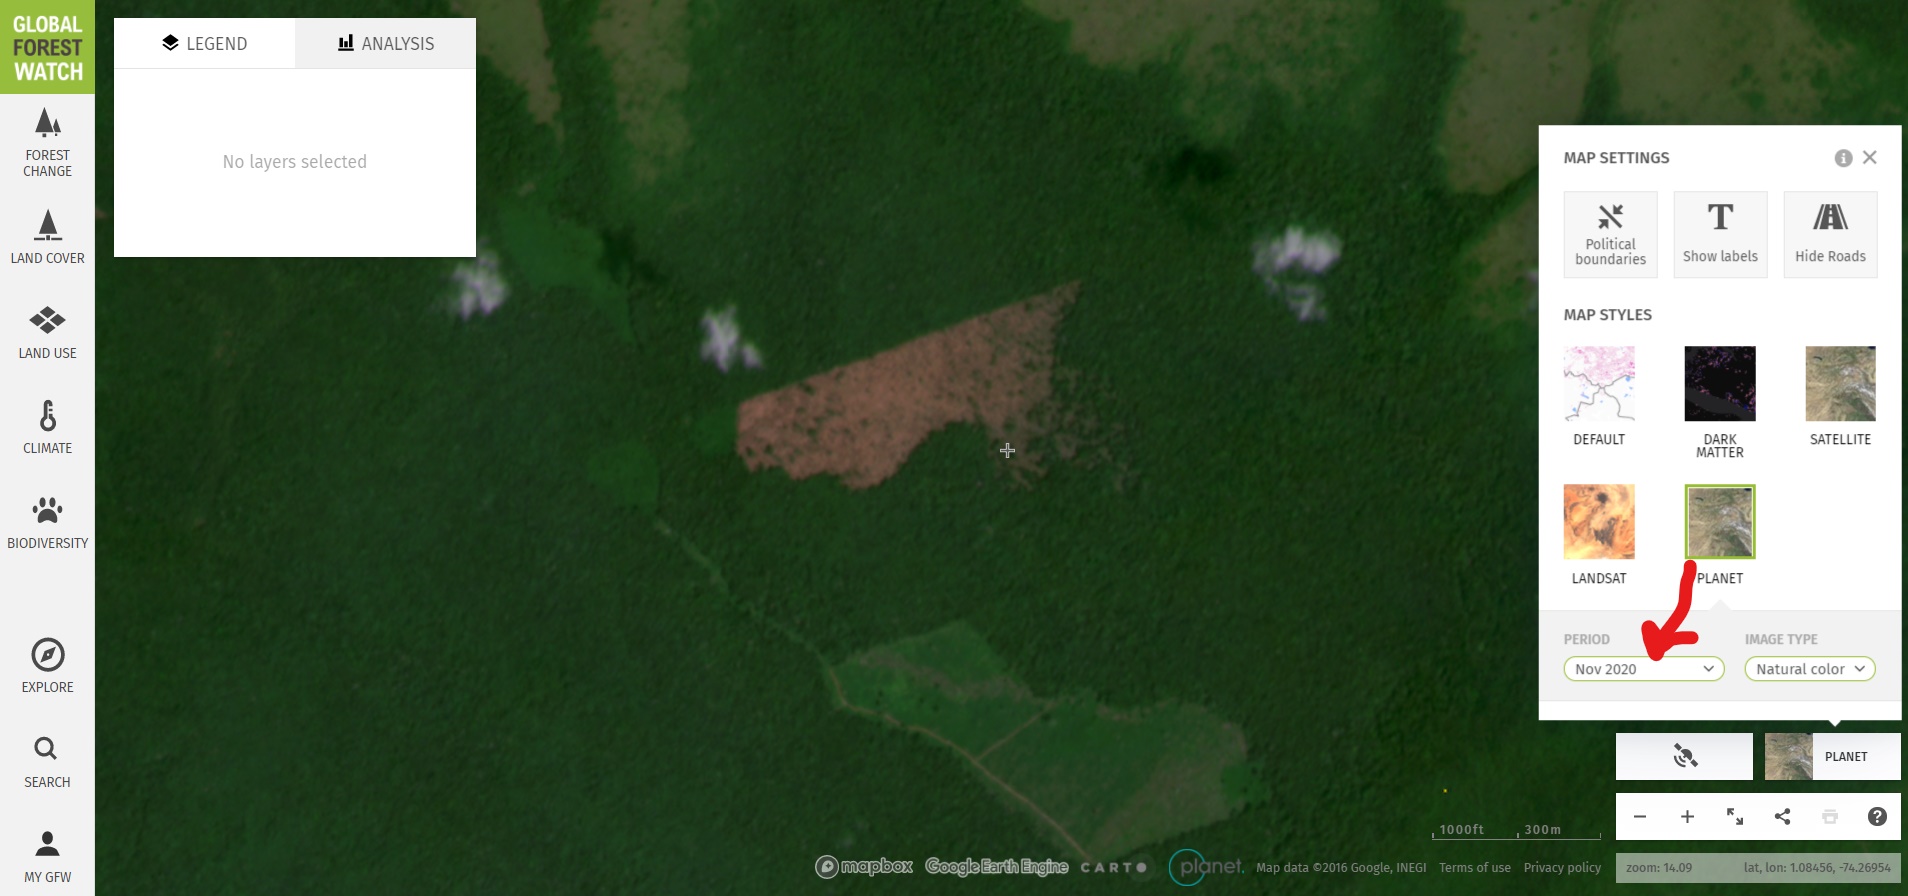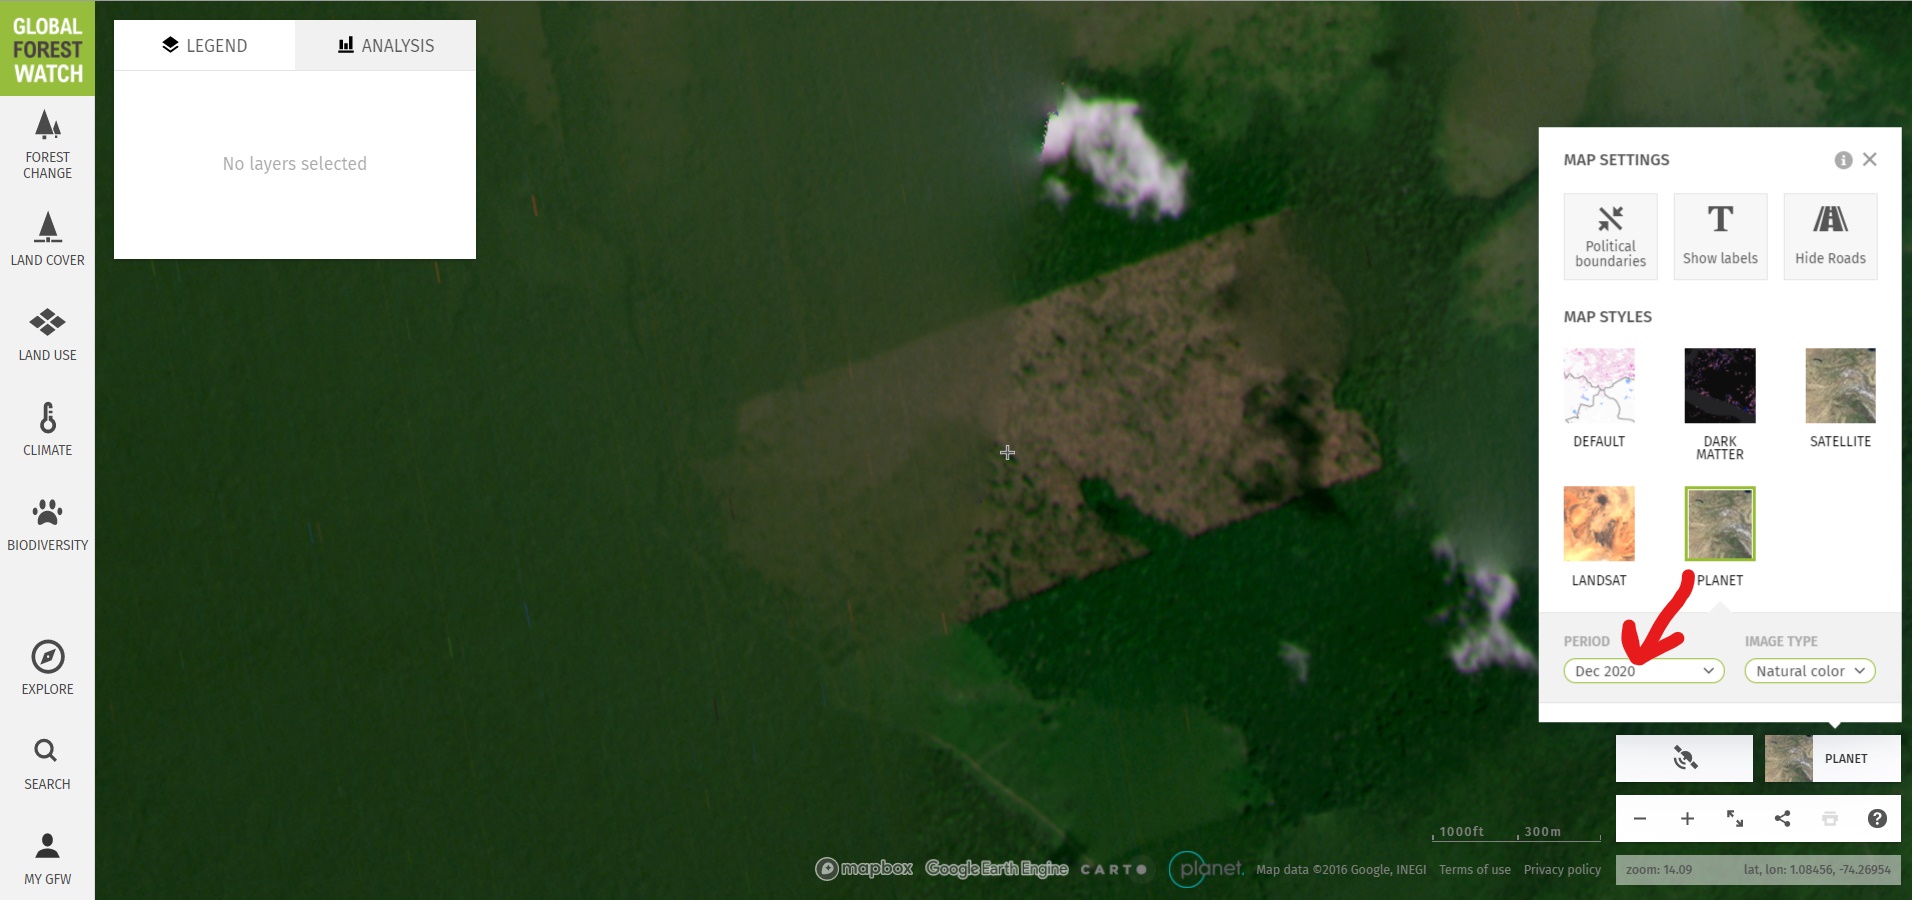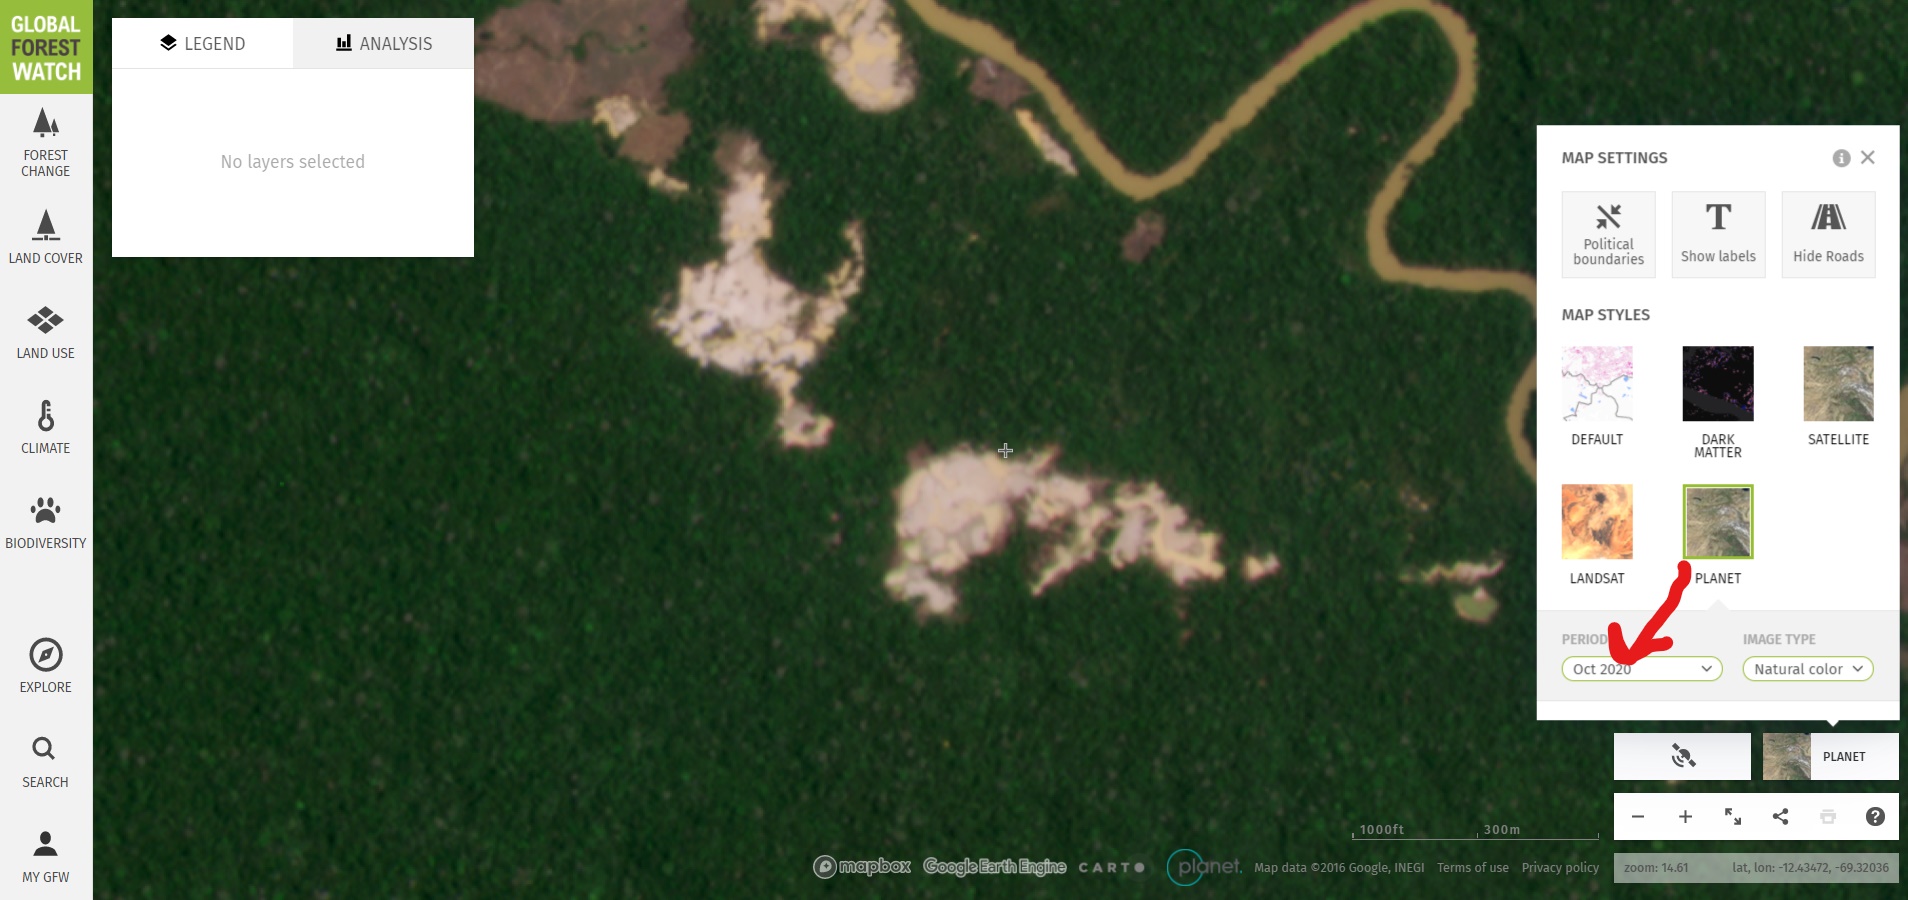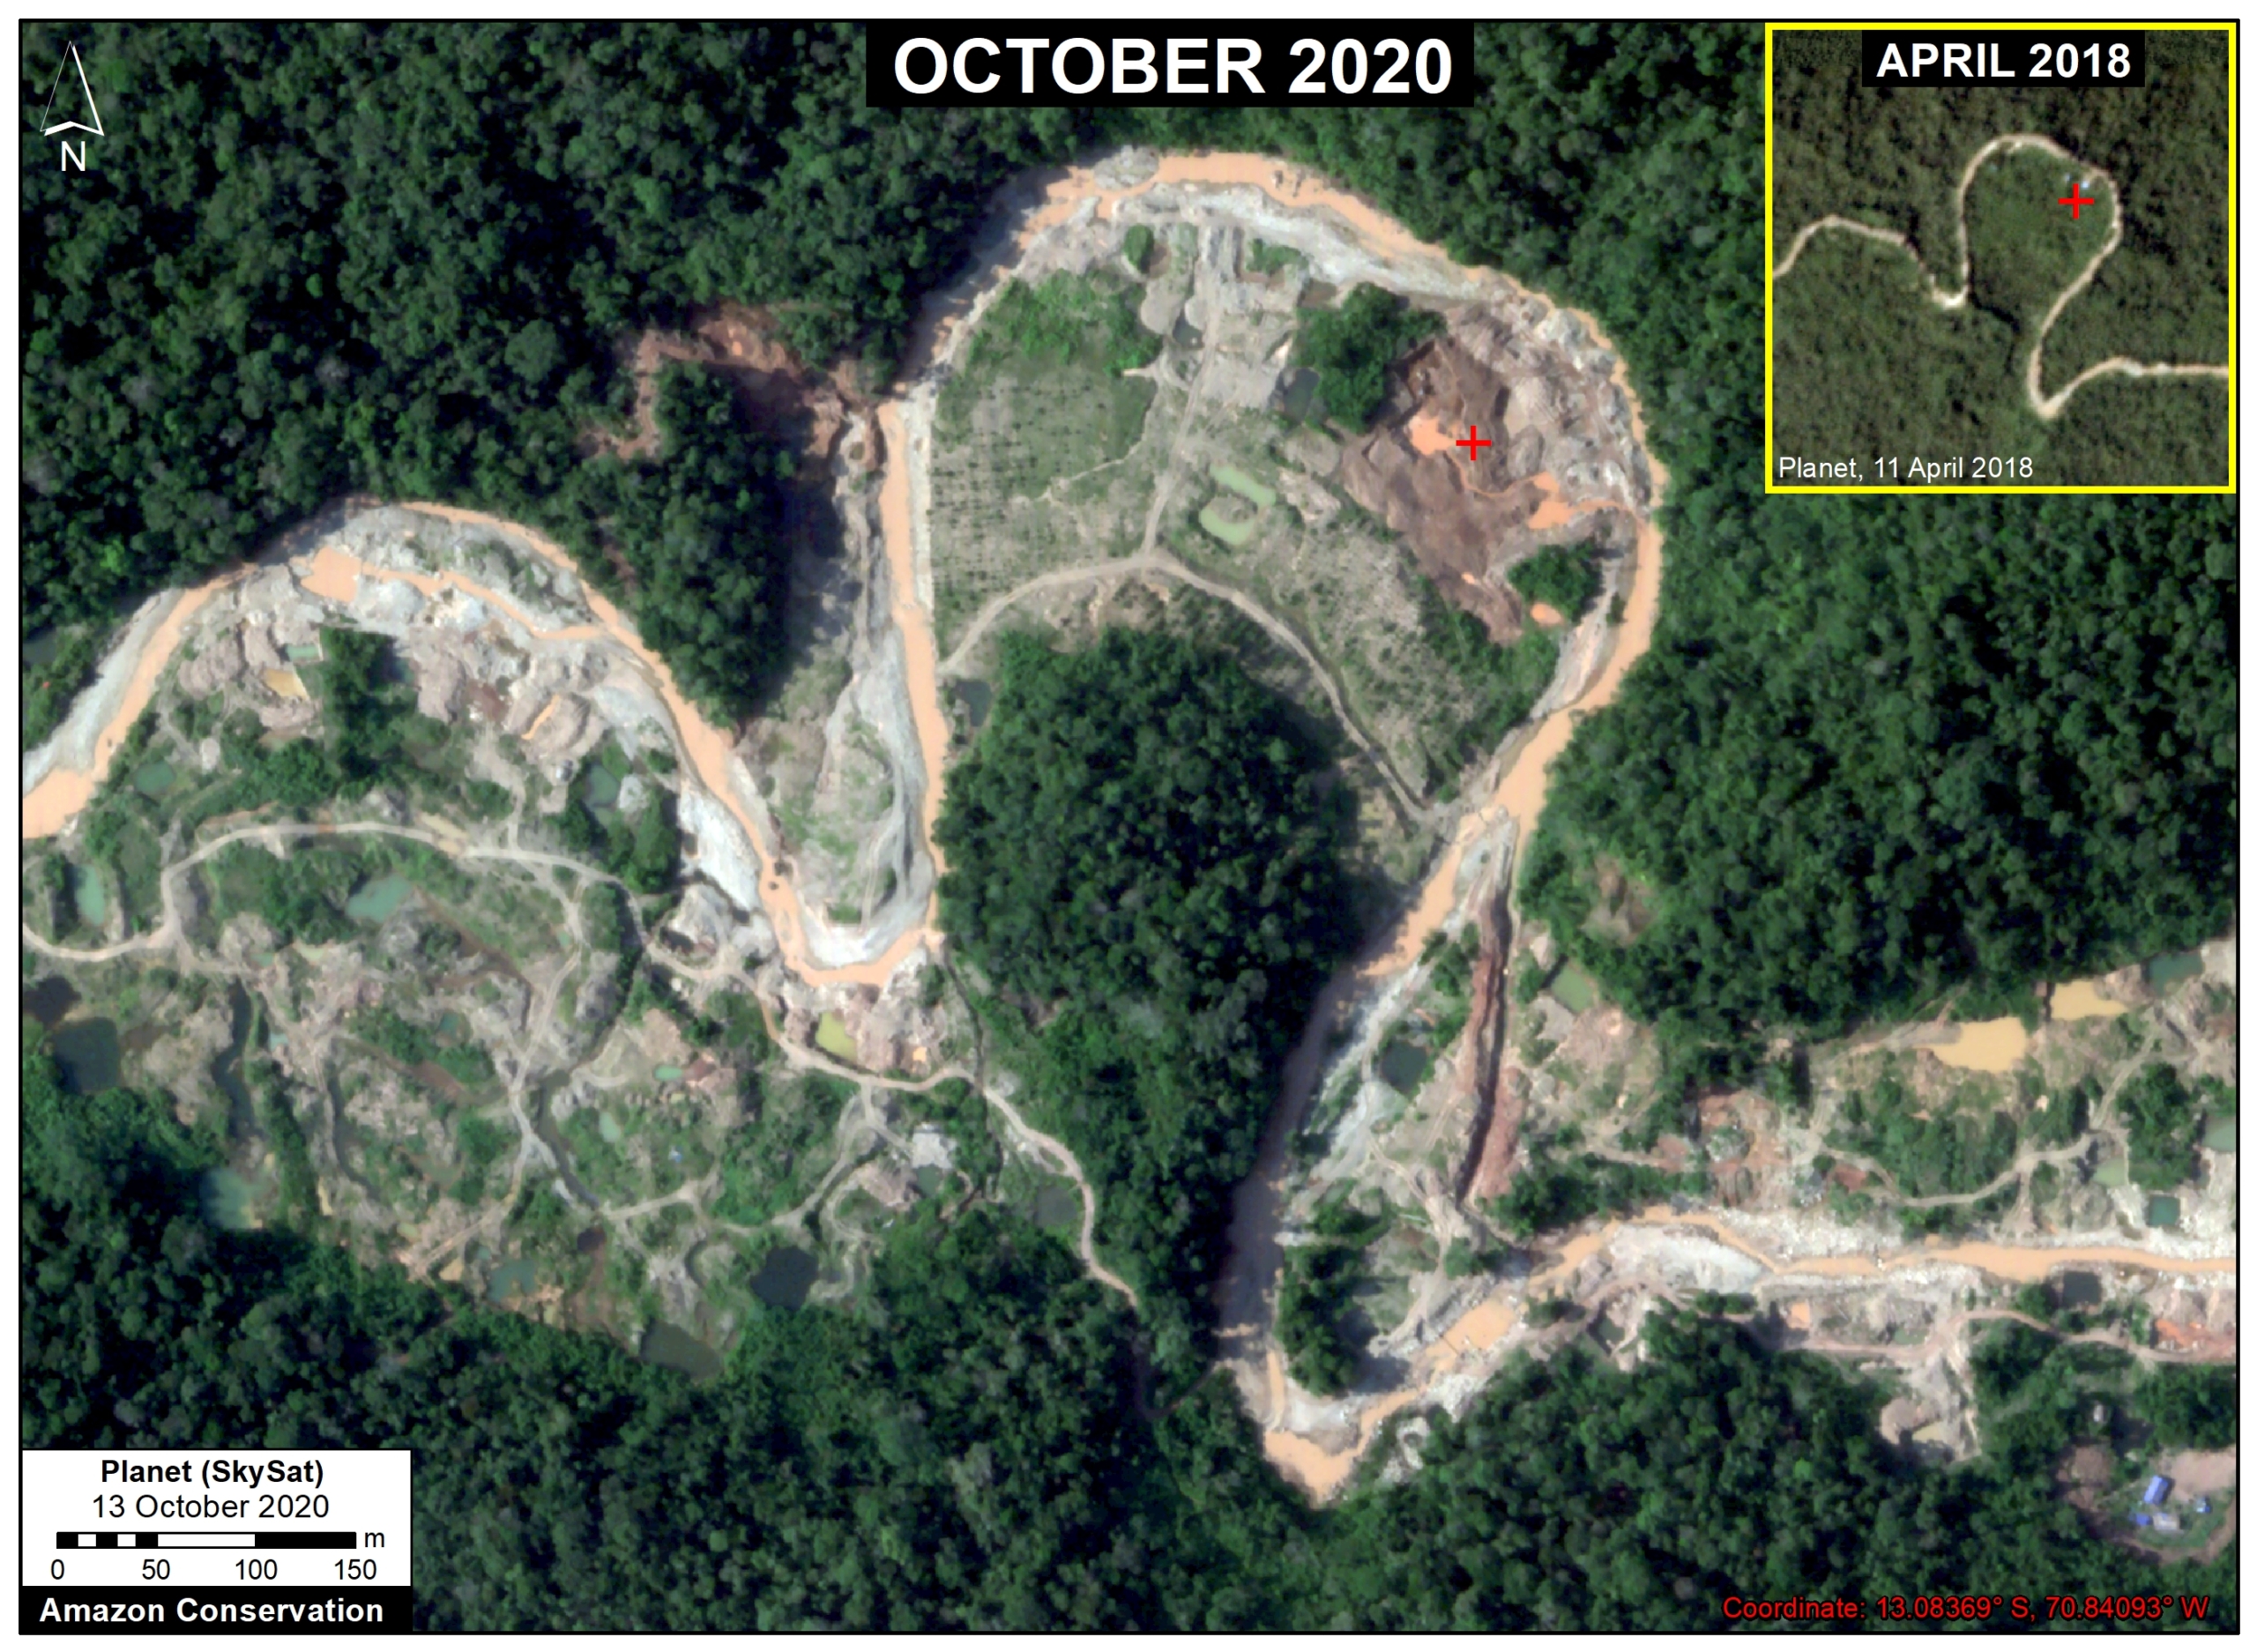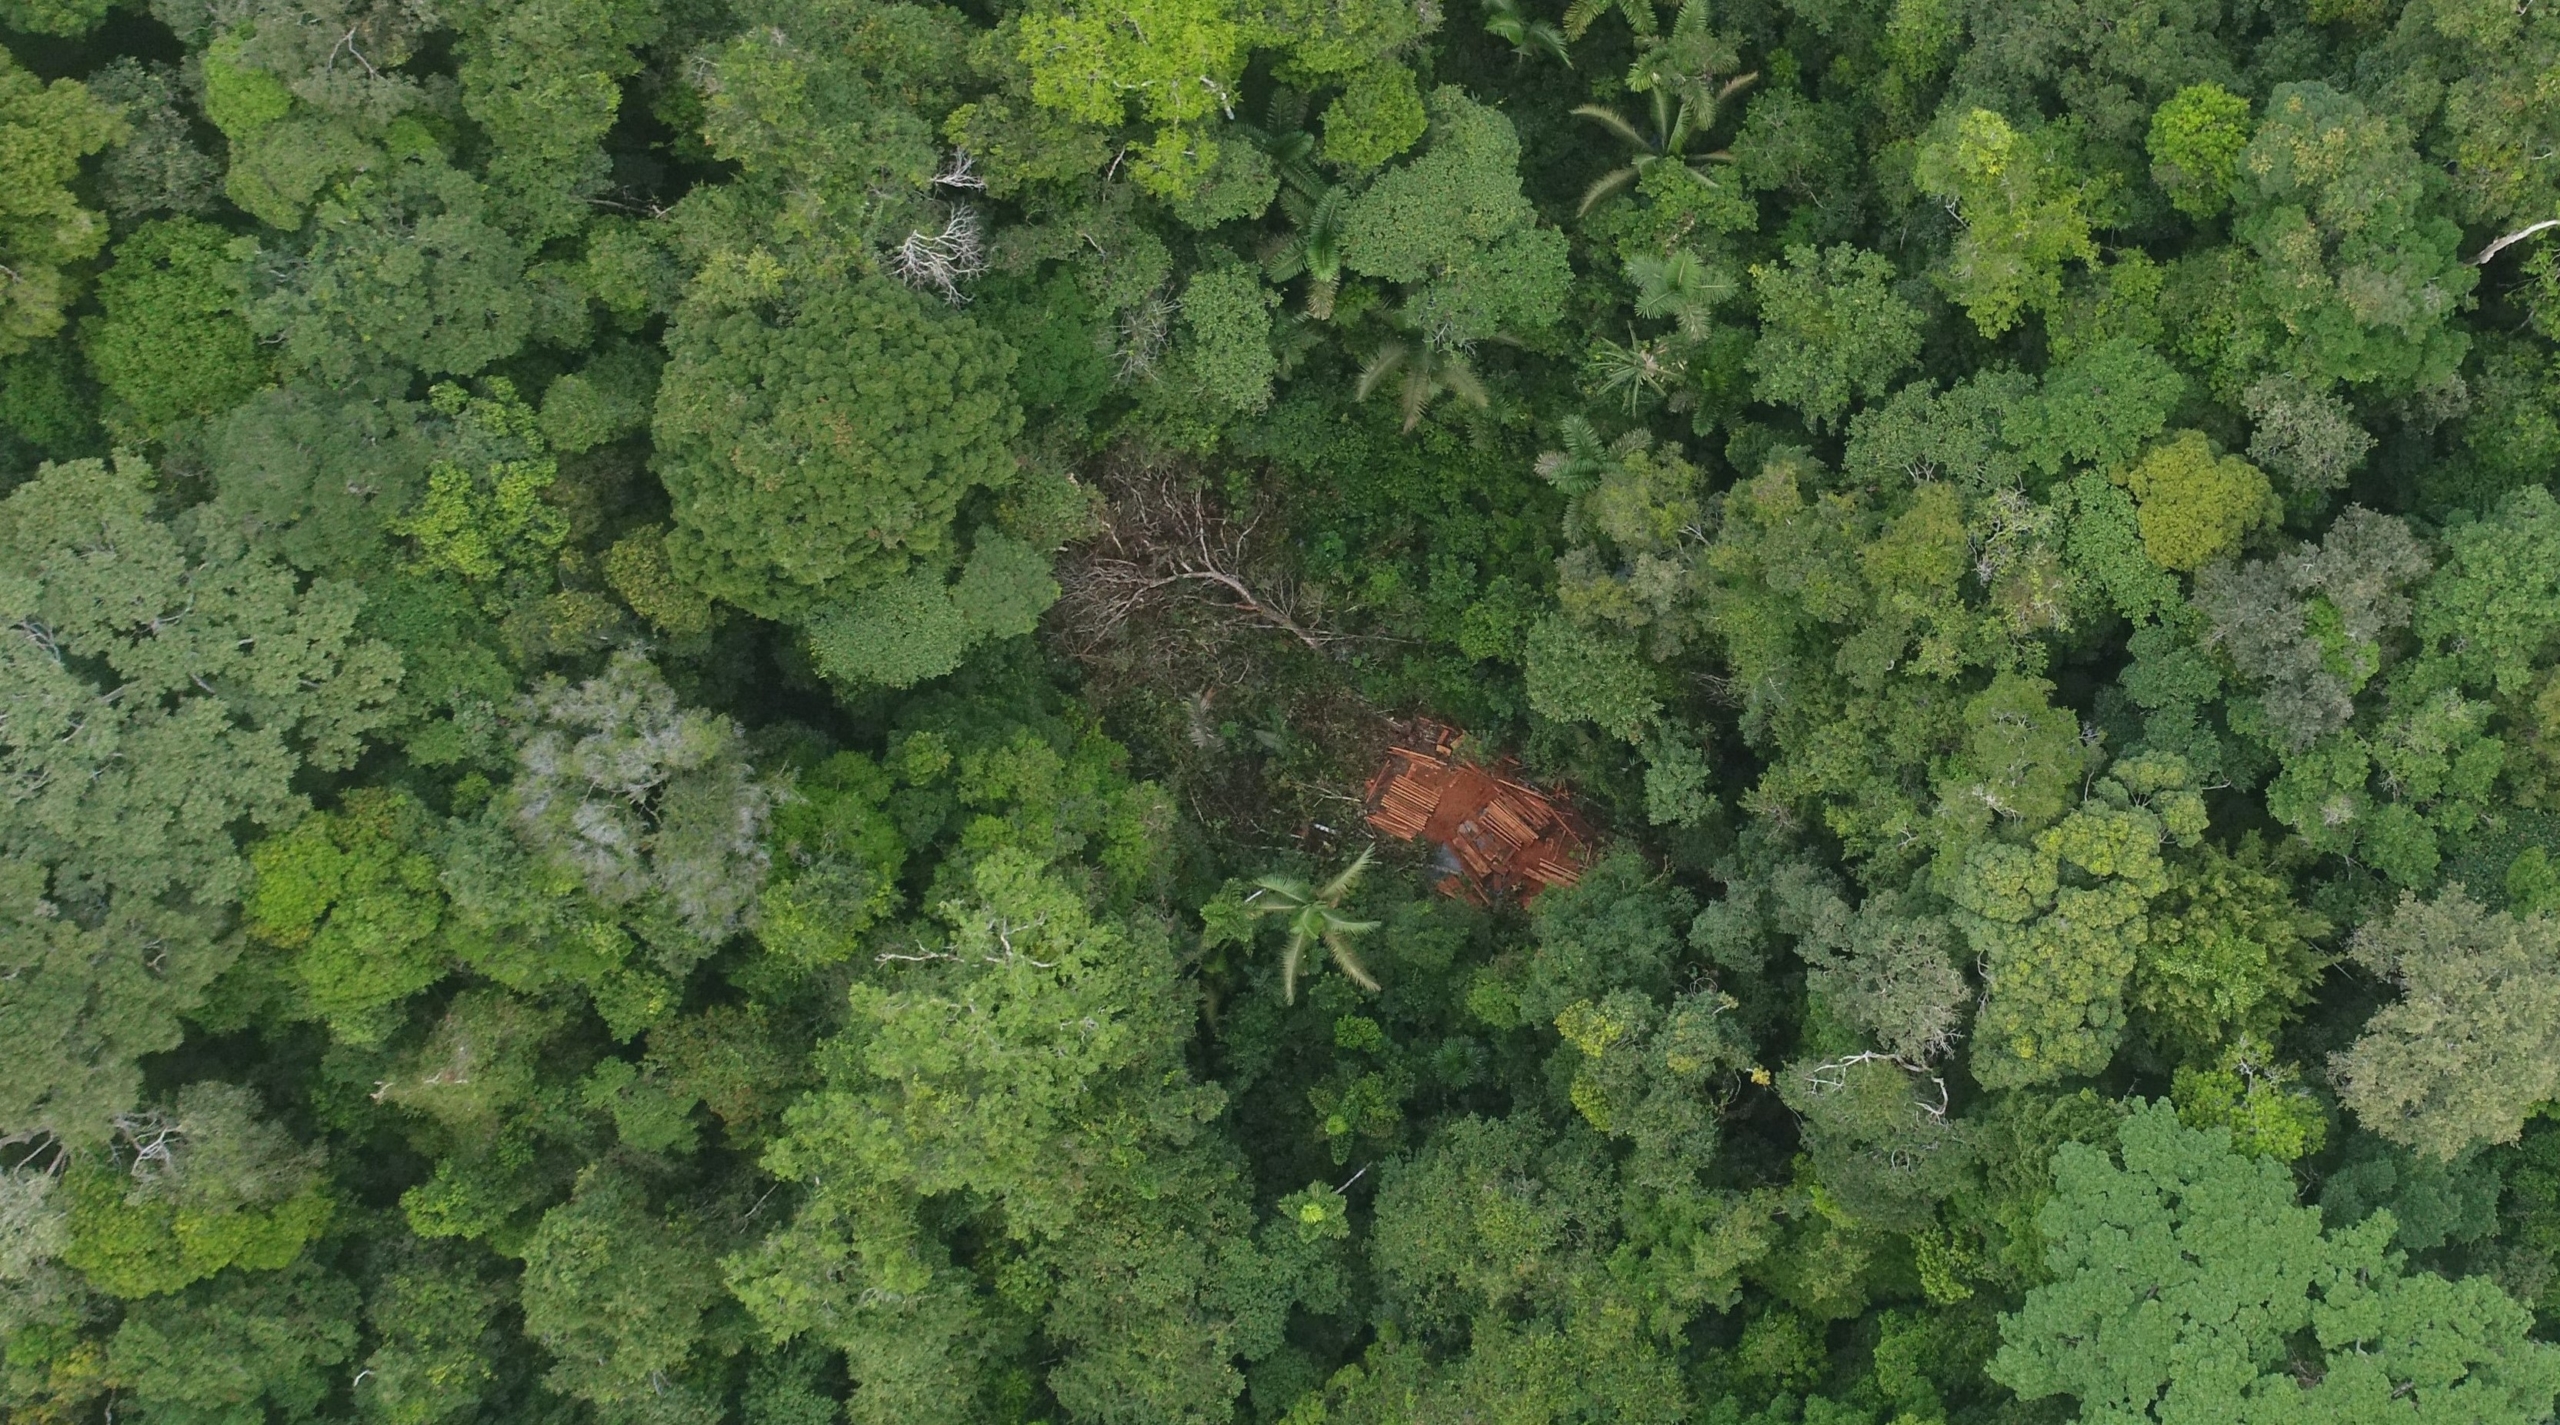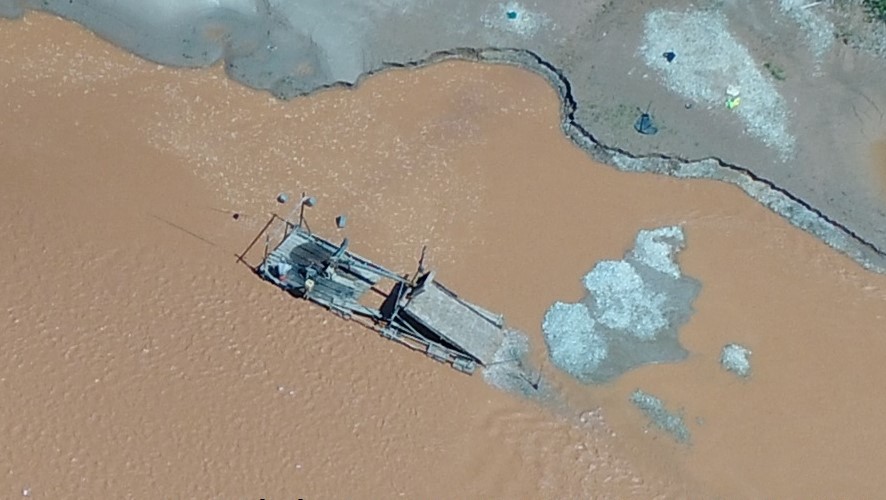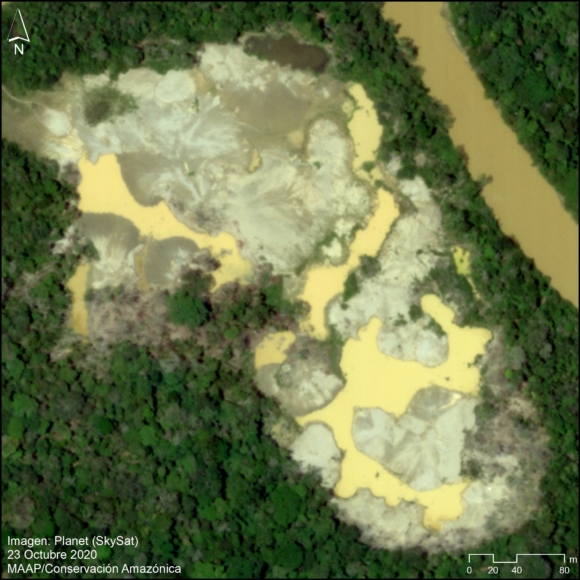
Image 1. Very high resolution image of recent gold mining deforestation along the Pariamanu River. Data: Planet (Skysat).
As part of USAID’s Prevent Project (dedicated to combating environmental crimes in the Amazon), we conducted an updated analysis of illegal gold mining deforestation in the southern Peruvian Amazon.
In early 2019, the Peruvian government launched Operation Mercury, an unprecedented crackdown on the rampant illegal gold mining in the region.
The Operation initially targeted an area known as La Pampa, the epicenter of the illegal mining. In 2020, it expanded to surrounding critical areas.
In this report, we compare rates of gold mining deforestation before vs after Operation Mercury at six key sites (see Base Map and Methodology below).
We report four major results:
1) Gold mining deforestation decreased 90% in La Pampa (the most critical mining area) following Operation Mercury.
2) Gold mining deforestation increased in three key areas –Apaylon, Pariamanu, and Chaspa – indicating that some miners expelled from La Pampa moved to surrounding areas. The Peruvian government, however, has recently carried out major interventions in all three of these areas.
3) Overall, gold mining deforestation decreased 78% across all six sites following Operation Mercury.
4) Illegal mining does persist, however. We documented 1,115 hectares of gold mining deforestation across all six sites since Operation Mercury (but, compared to 6,490 hectares before the Operation).
Below, we provide a more detailed breakdown of the major results across all six sites. We also present a series of very high resolution satellite images (Skysat) of the recent gold mining deforestation.
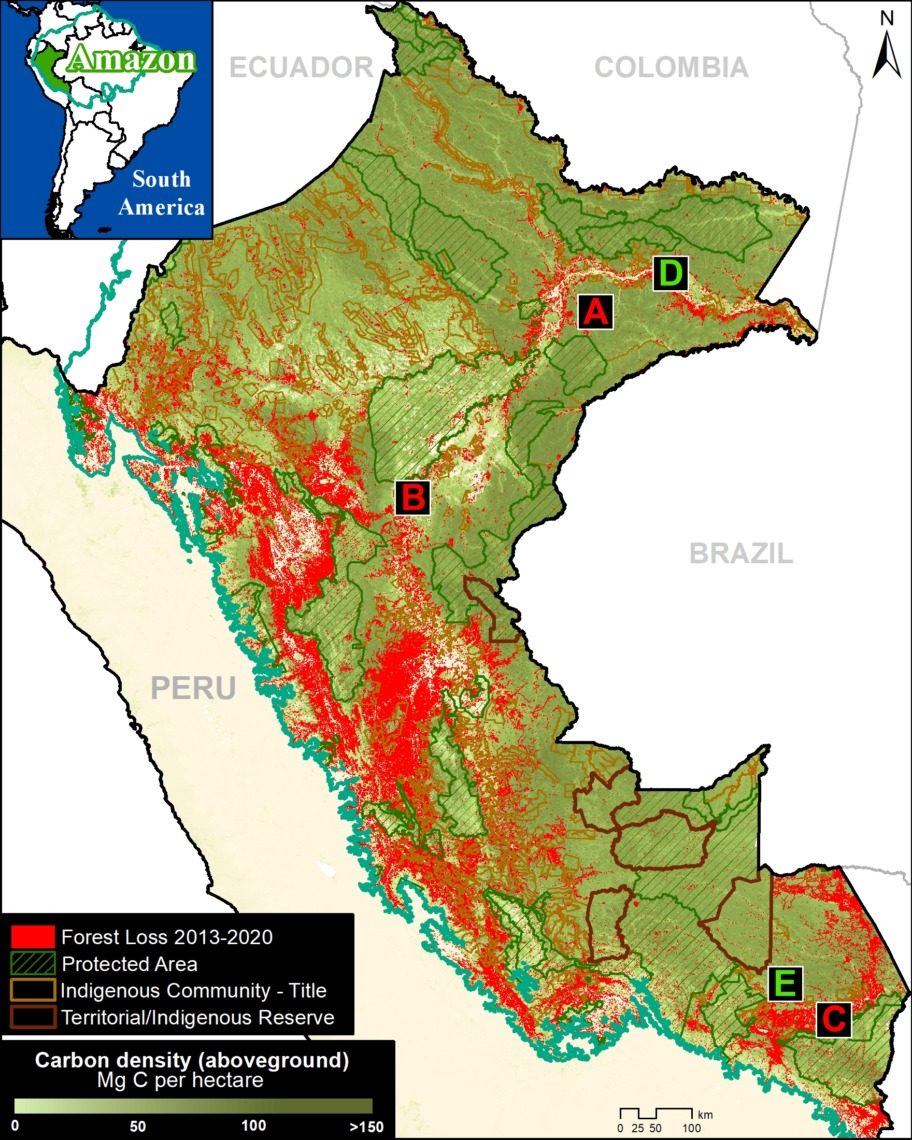
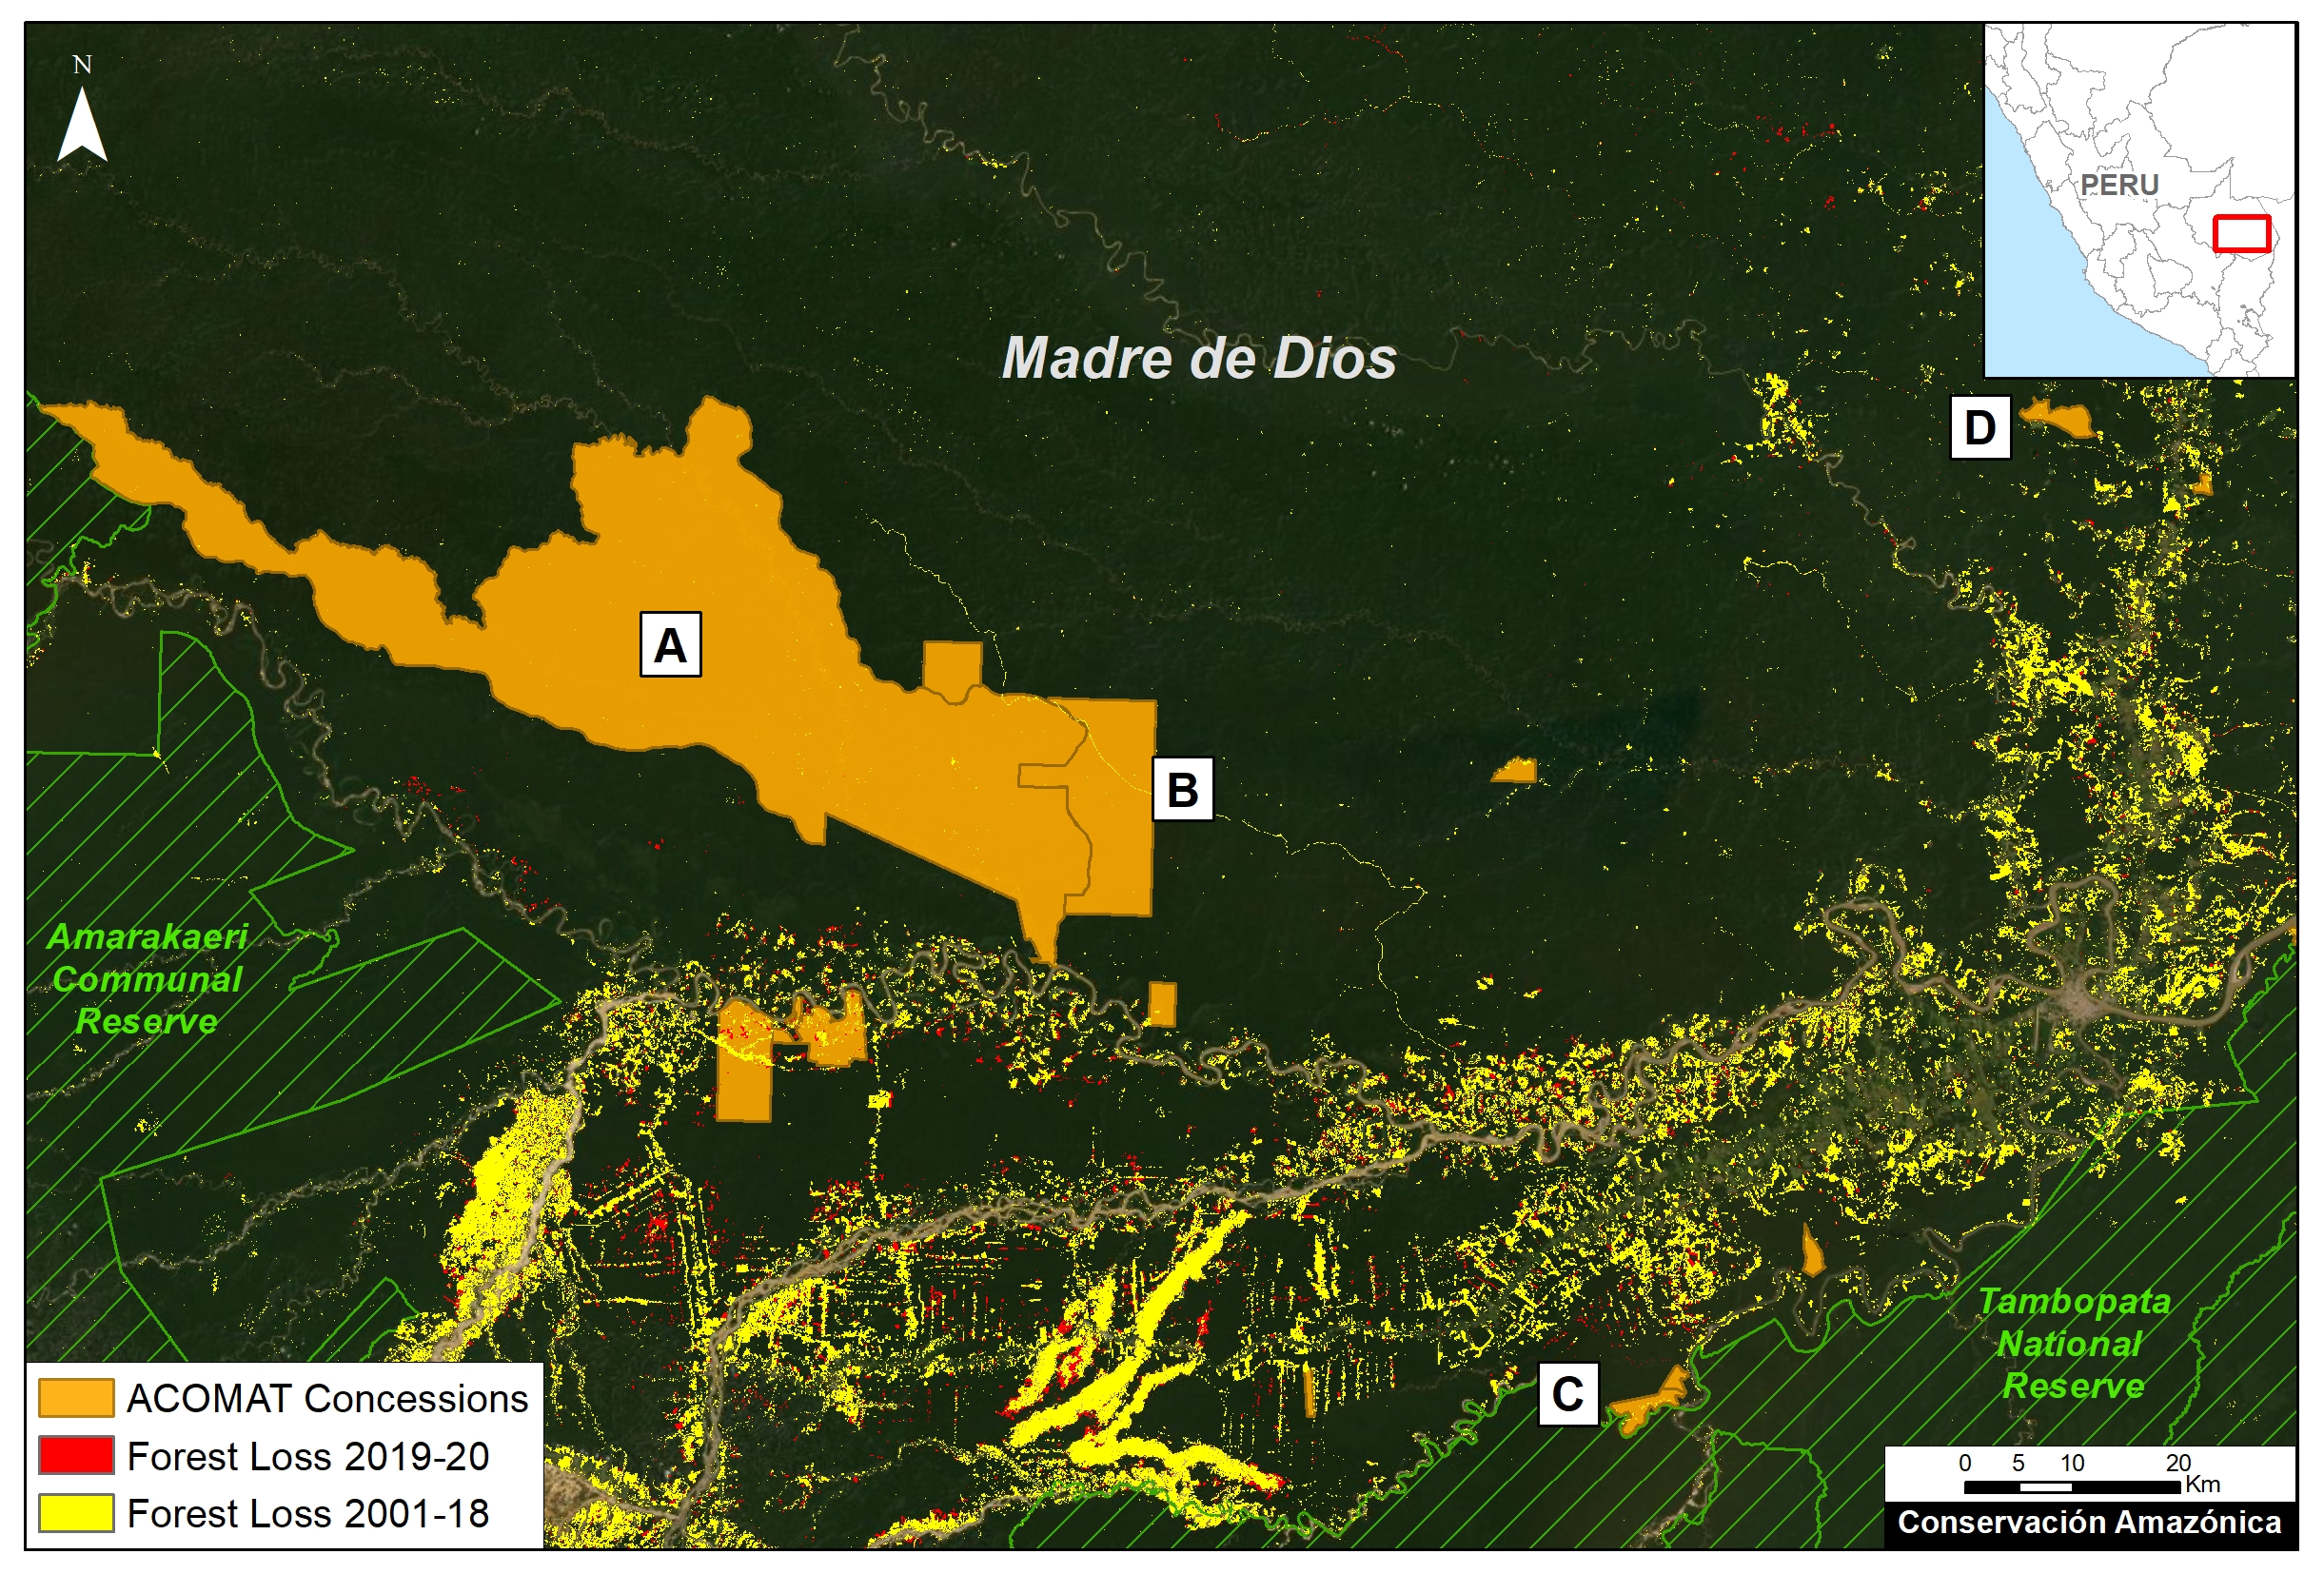
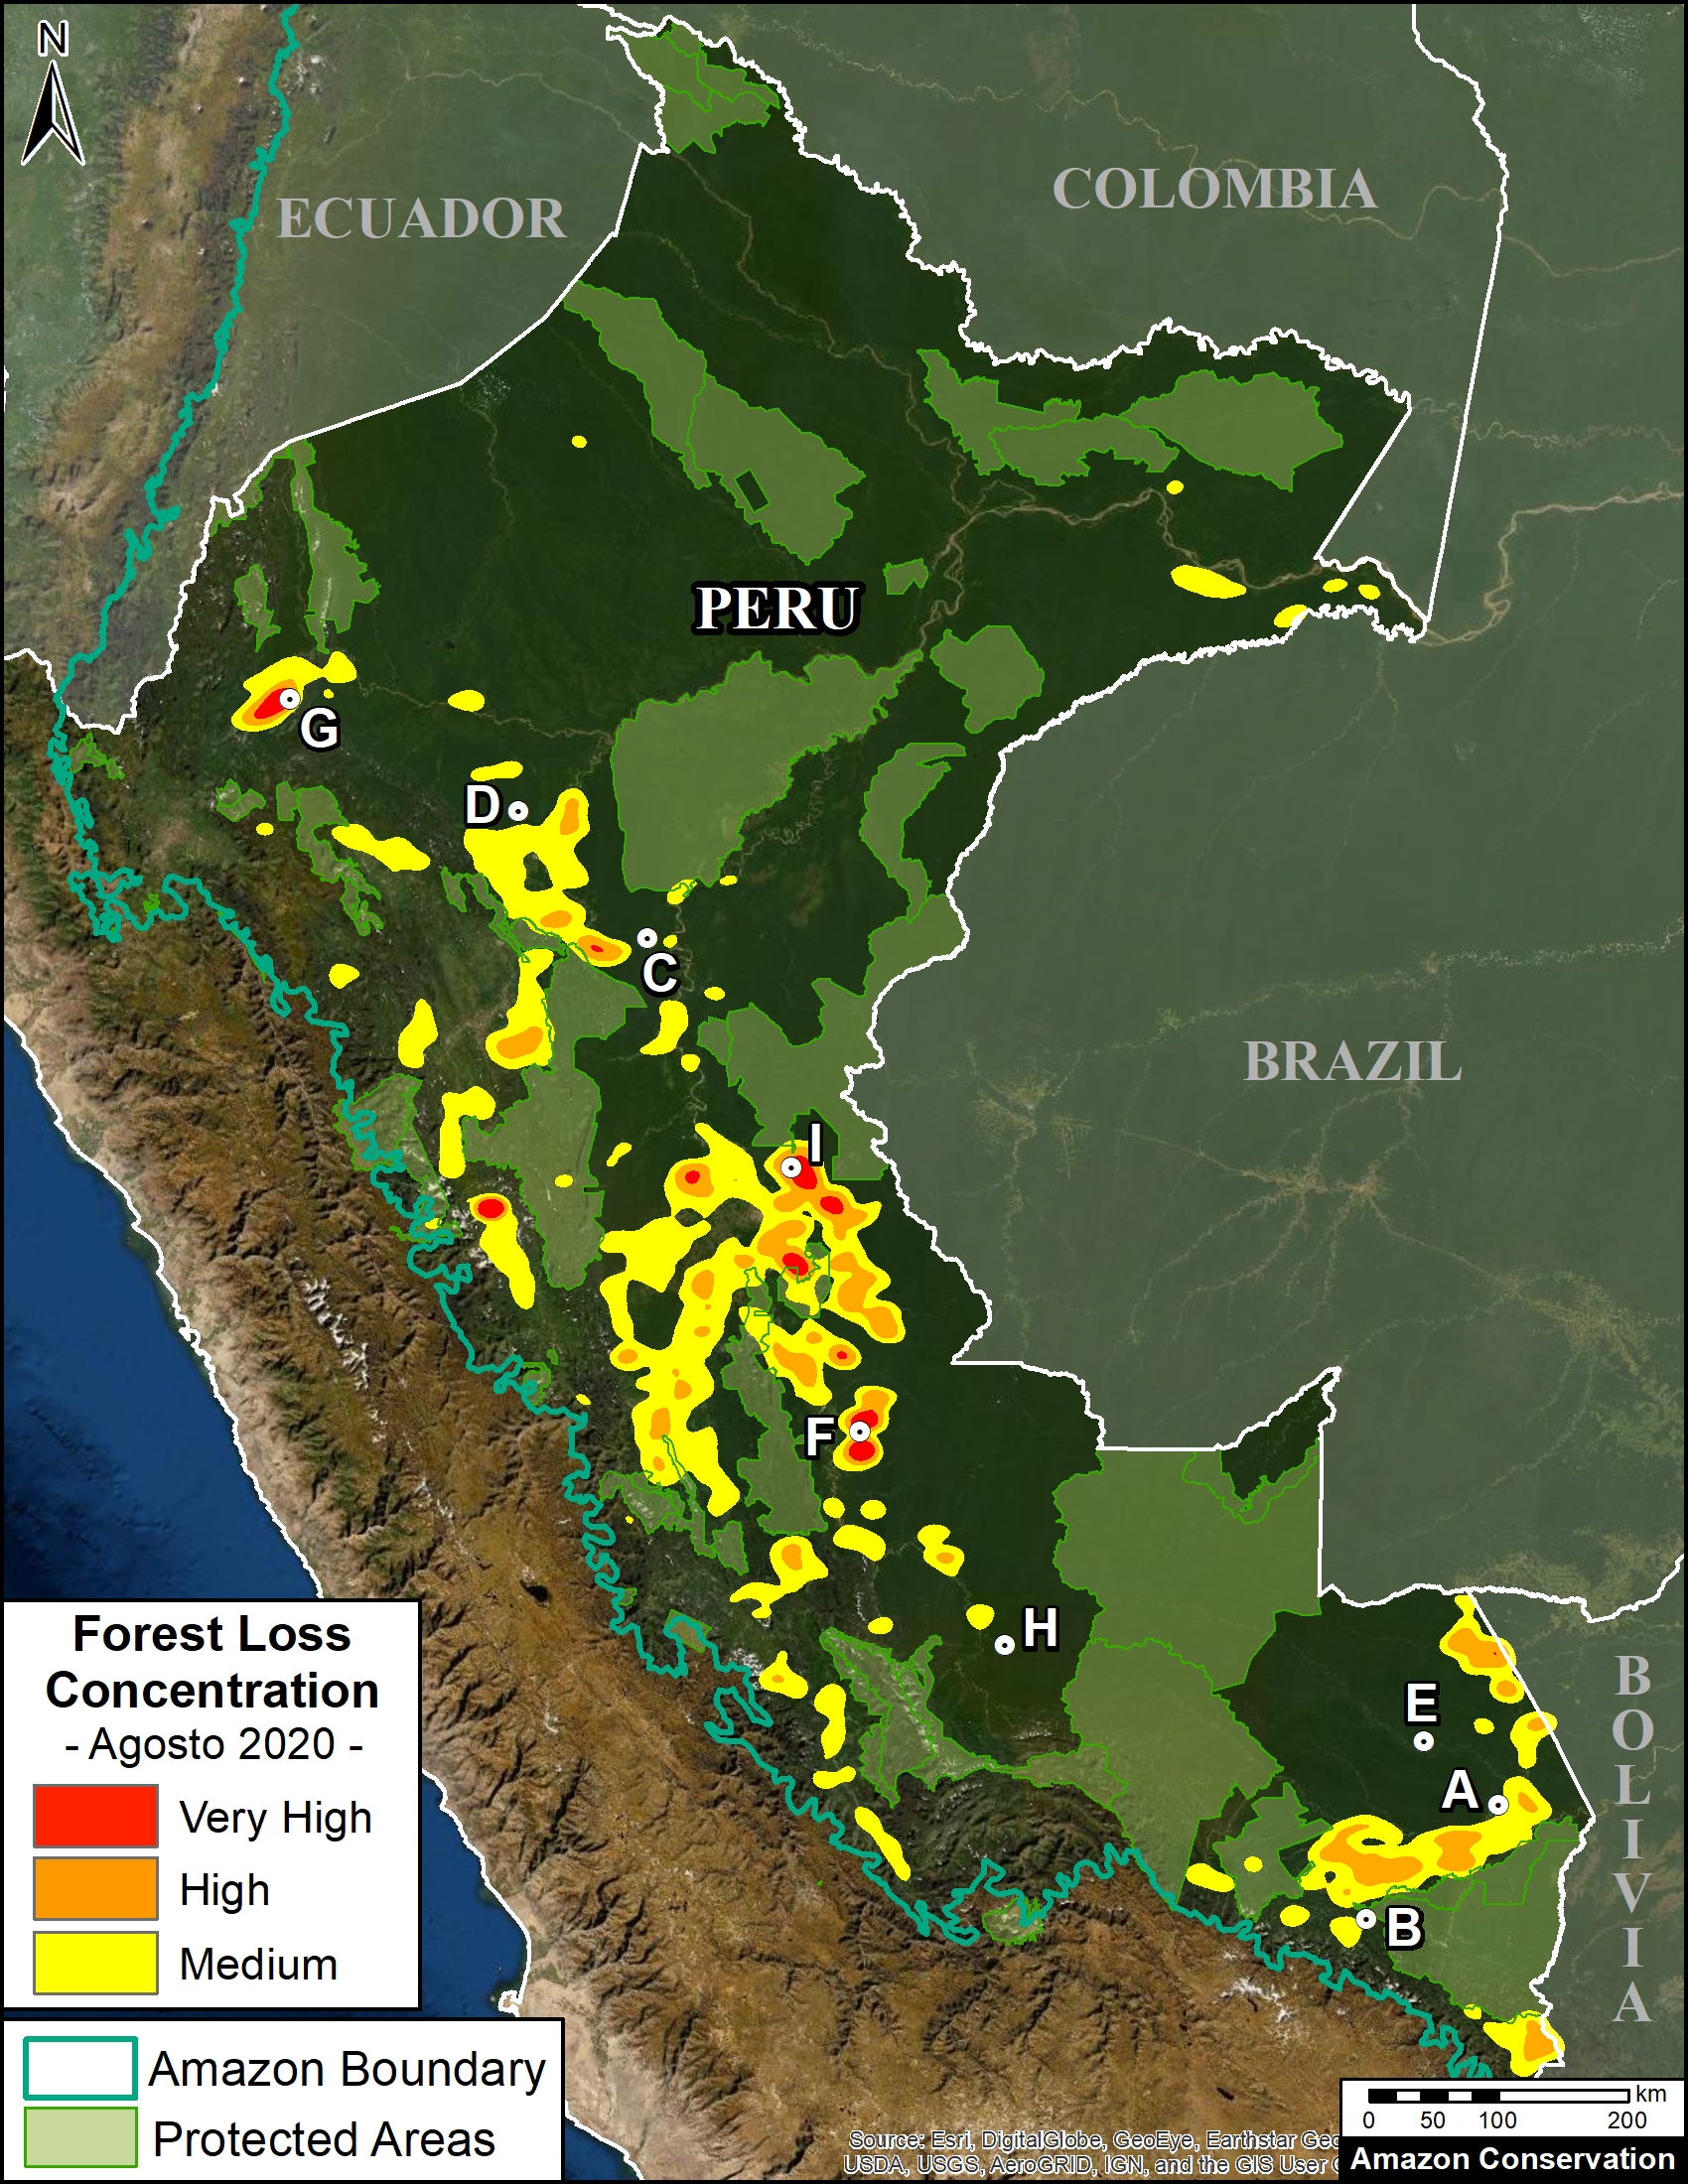
Base Map – 6 Major Illegal Gold Mining Sites
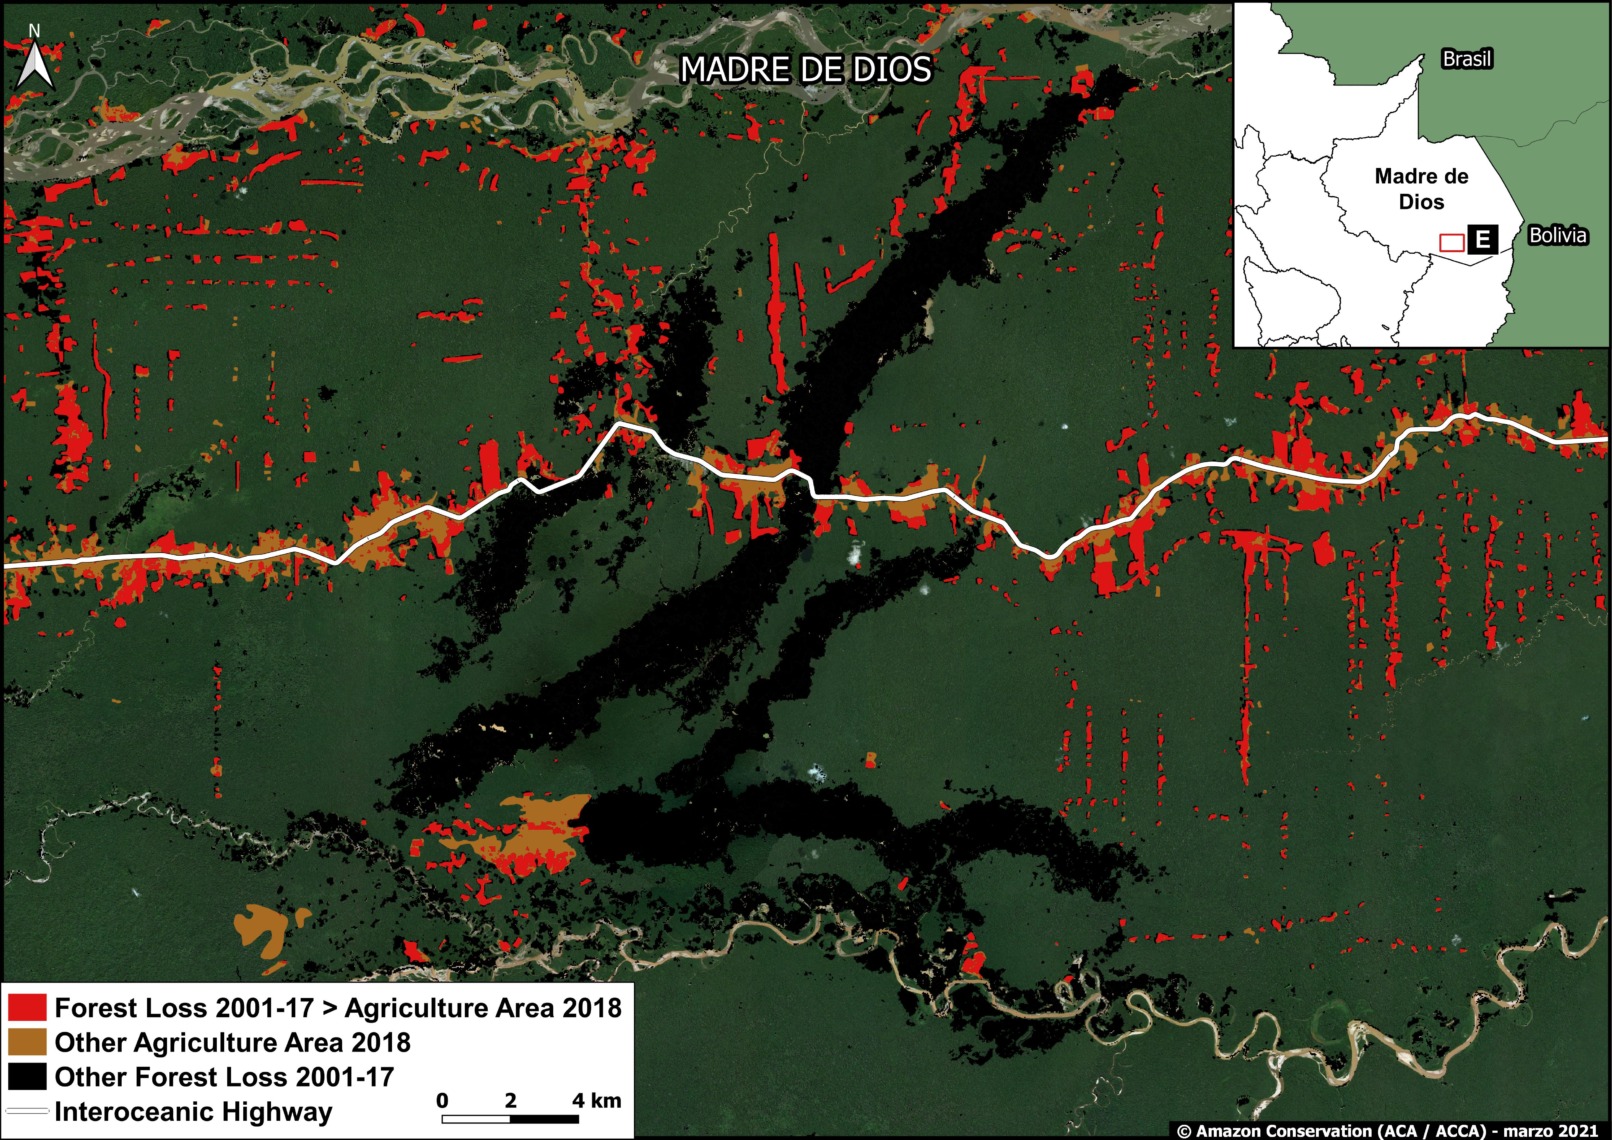
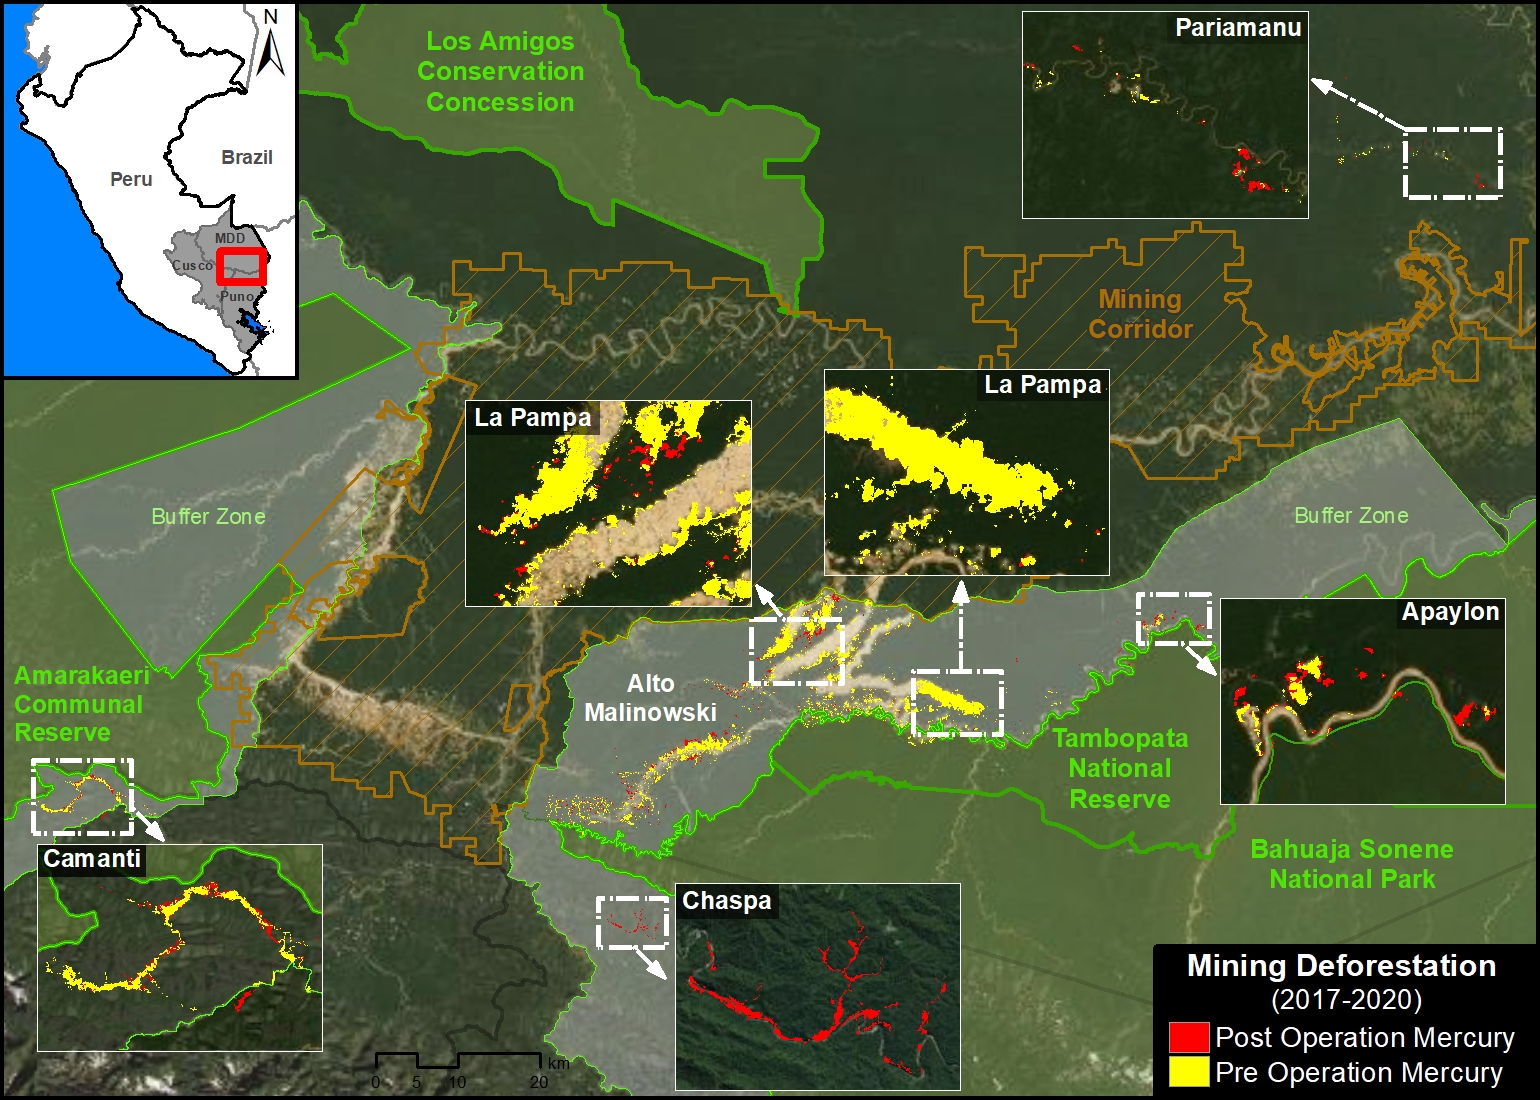
The Base Map illustrates the results across the six major gold mining fronts in the southern Peruvian Amazon. Red indicates gold mining deforestation post Operation Mercury (March 2019 – October 2020), while yellow indicates the pre Operation baseline (January 2017 – February 2019).

Base Map. Major gold mining fronts in the southern Peruvian Amazon before (yellow) and after (red) Operation Mercury. Data: MAAP.
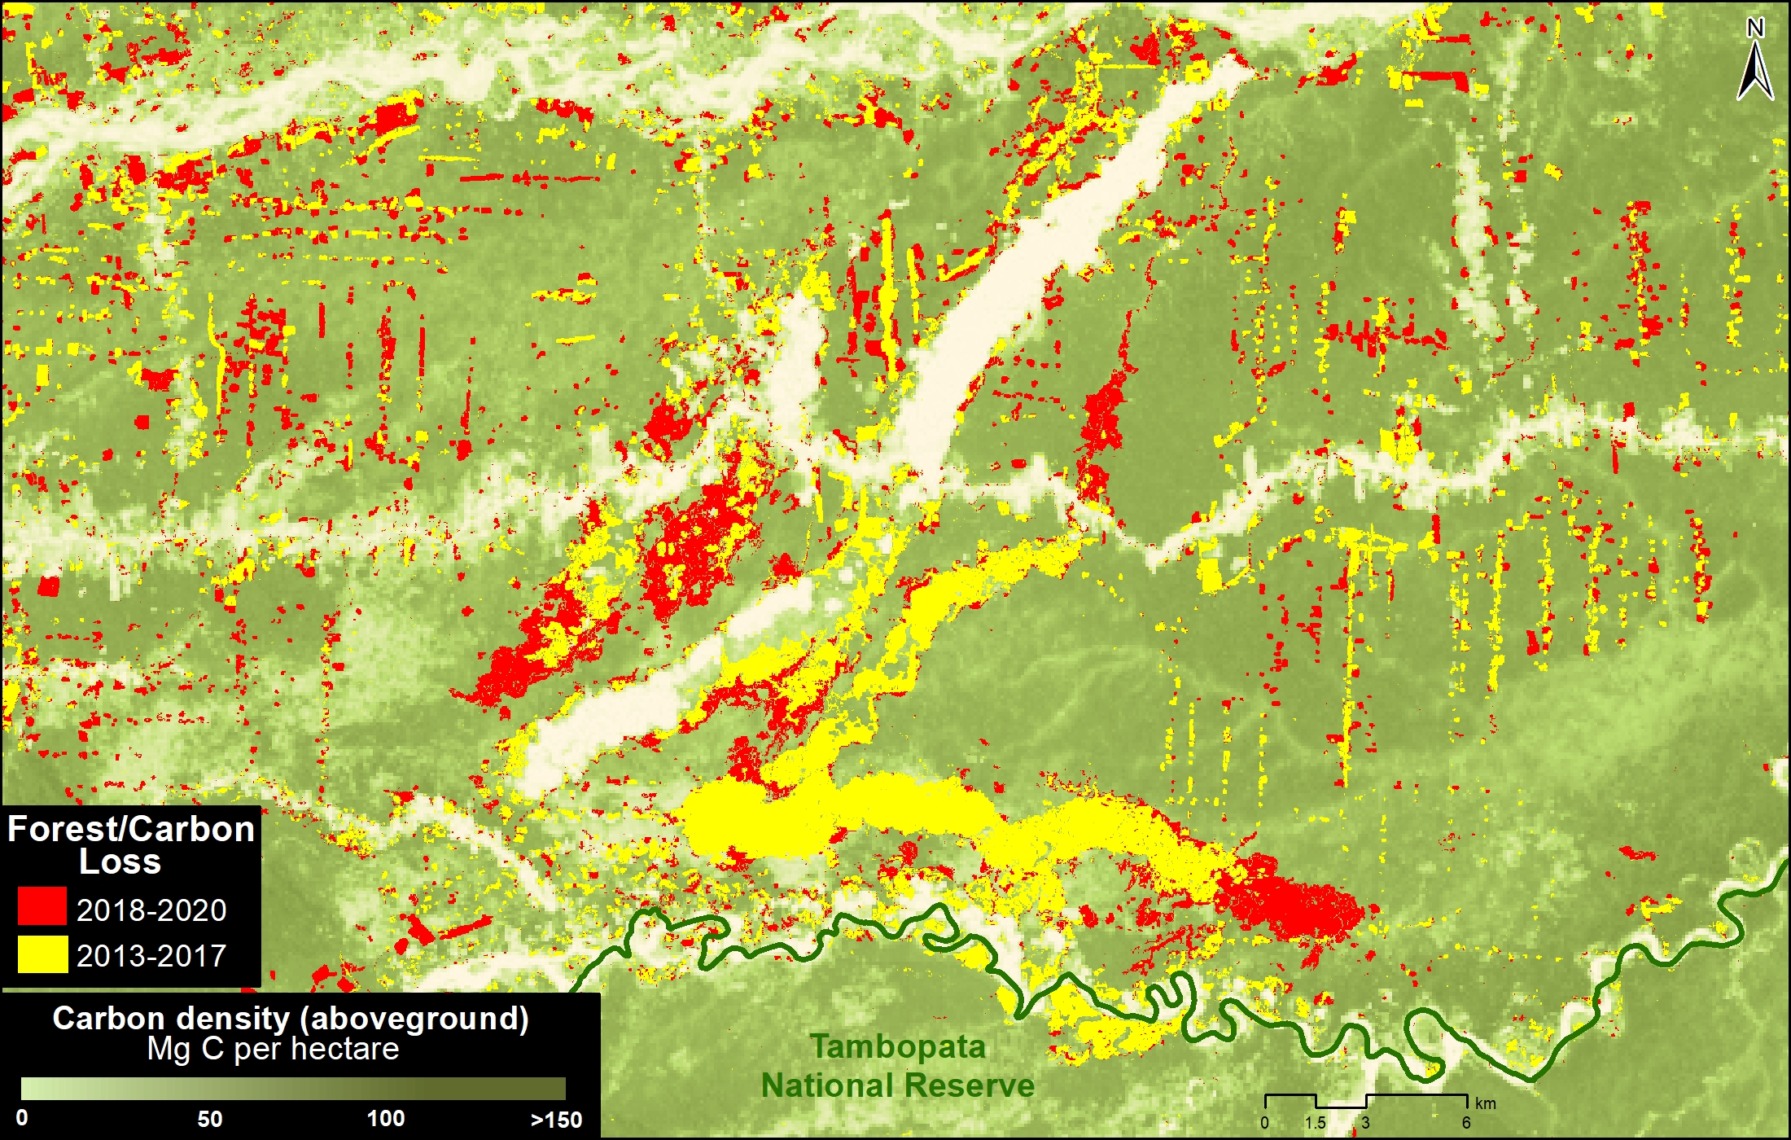
In La Pampa, we documented the dramatic loss of 4,450 hectares within the buffer zone of Tambopata National Reserve (Madre de Dios region) prior to Operation Mercury. Following the Operation, we confirmed the loss of 300 hectares. Note the main mining front in the core of the buffer zone has essentially been stopped, with most recent activity further north near the Interoceanic Highway.
In neighboring Alto Malinowski, located in the buffer zone of Bahuaja Sonene National Park (Madre de Dios region), we documented the loss of 1,558 hectares prior to Operation Mercury. Following the Operation, we confirmed the loss of 419 hectares.
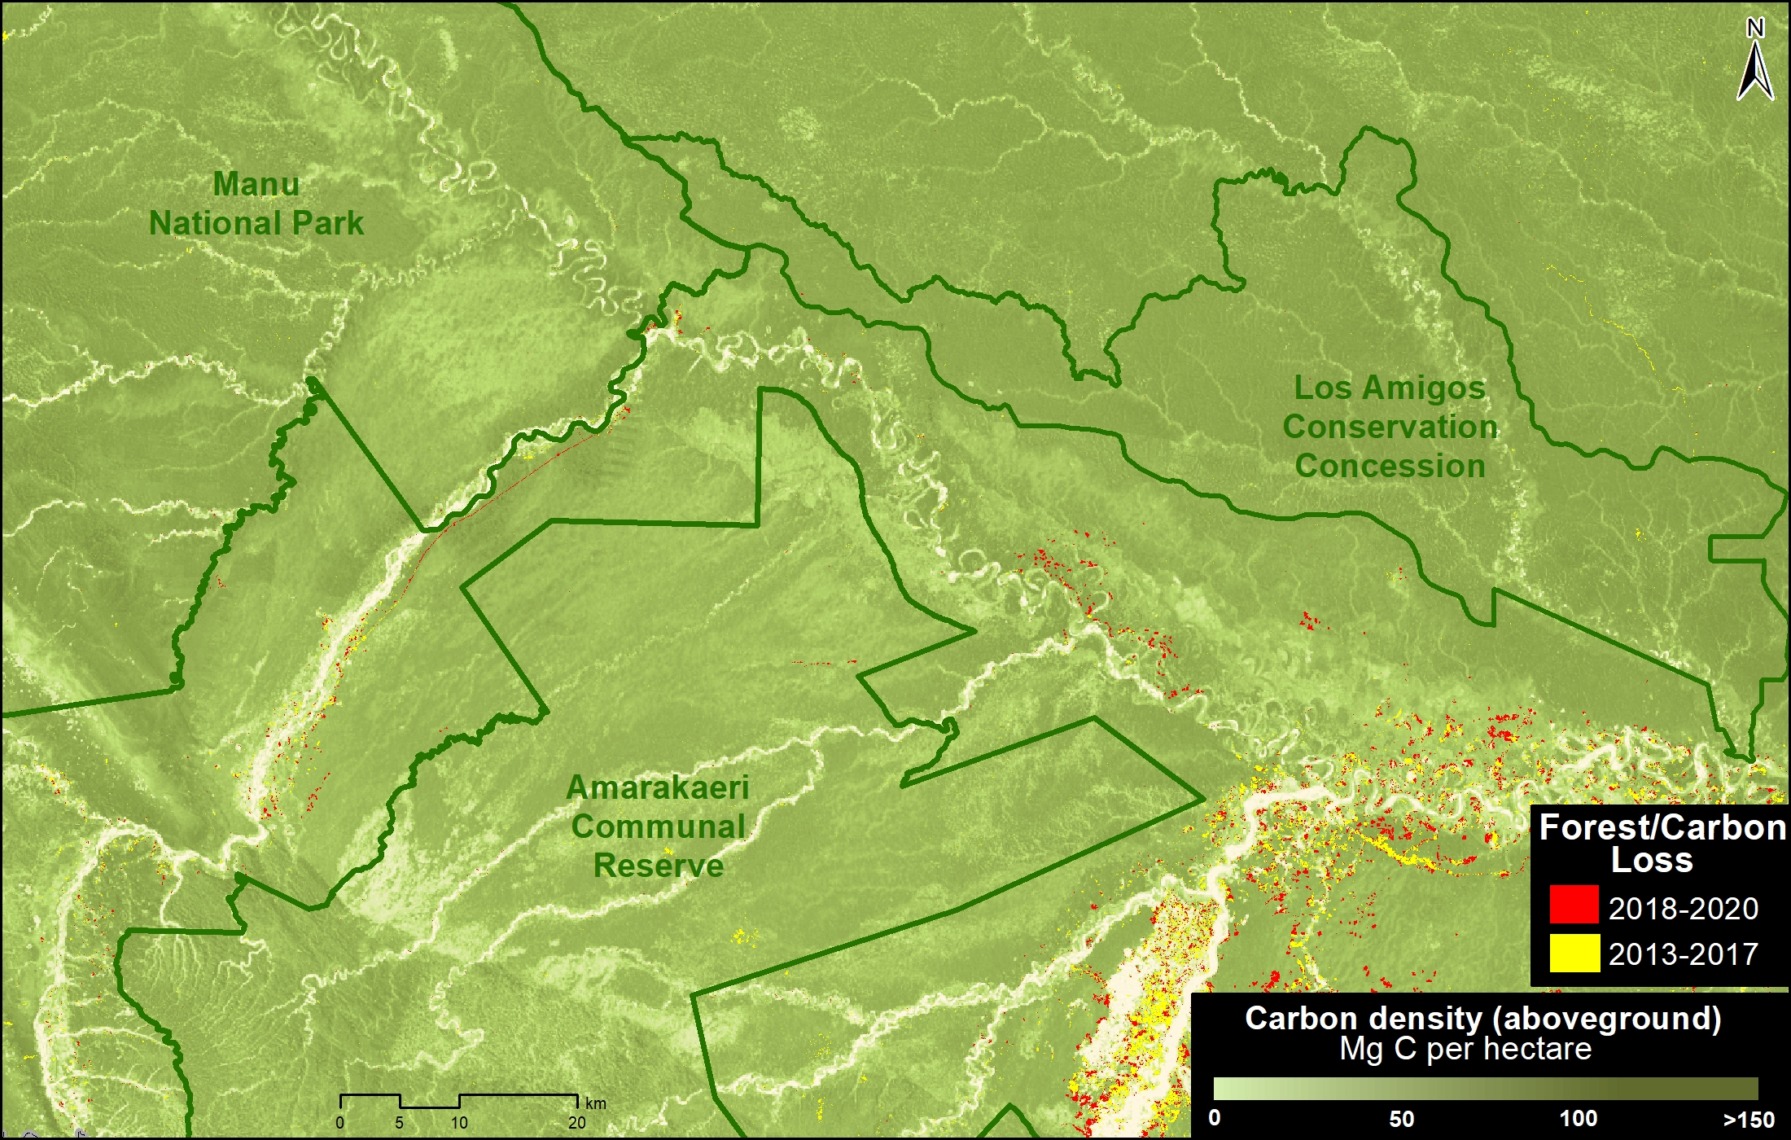
In Camanti, located in the buffer zone of Amarakaeri Commuanl Reserve, we documented the loss of 336 hectares prior to Operation Mercury. Following the Operation, we confirmed the loss of 105 hectares.
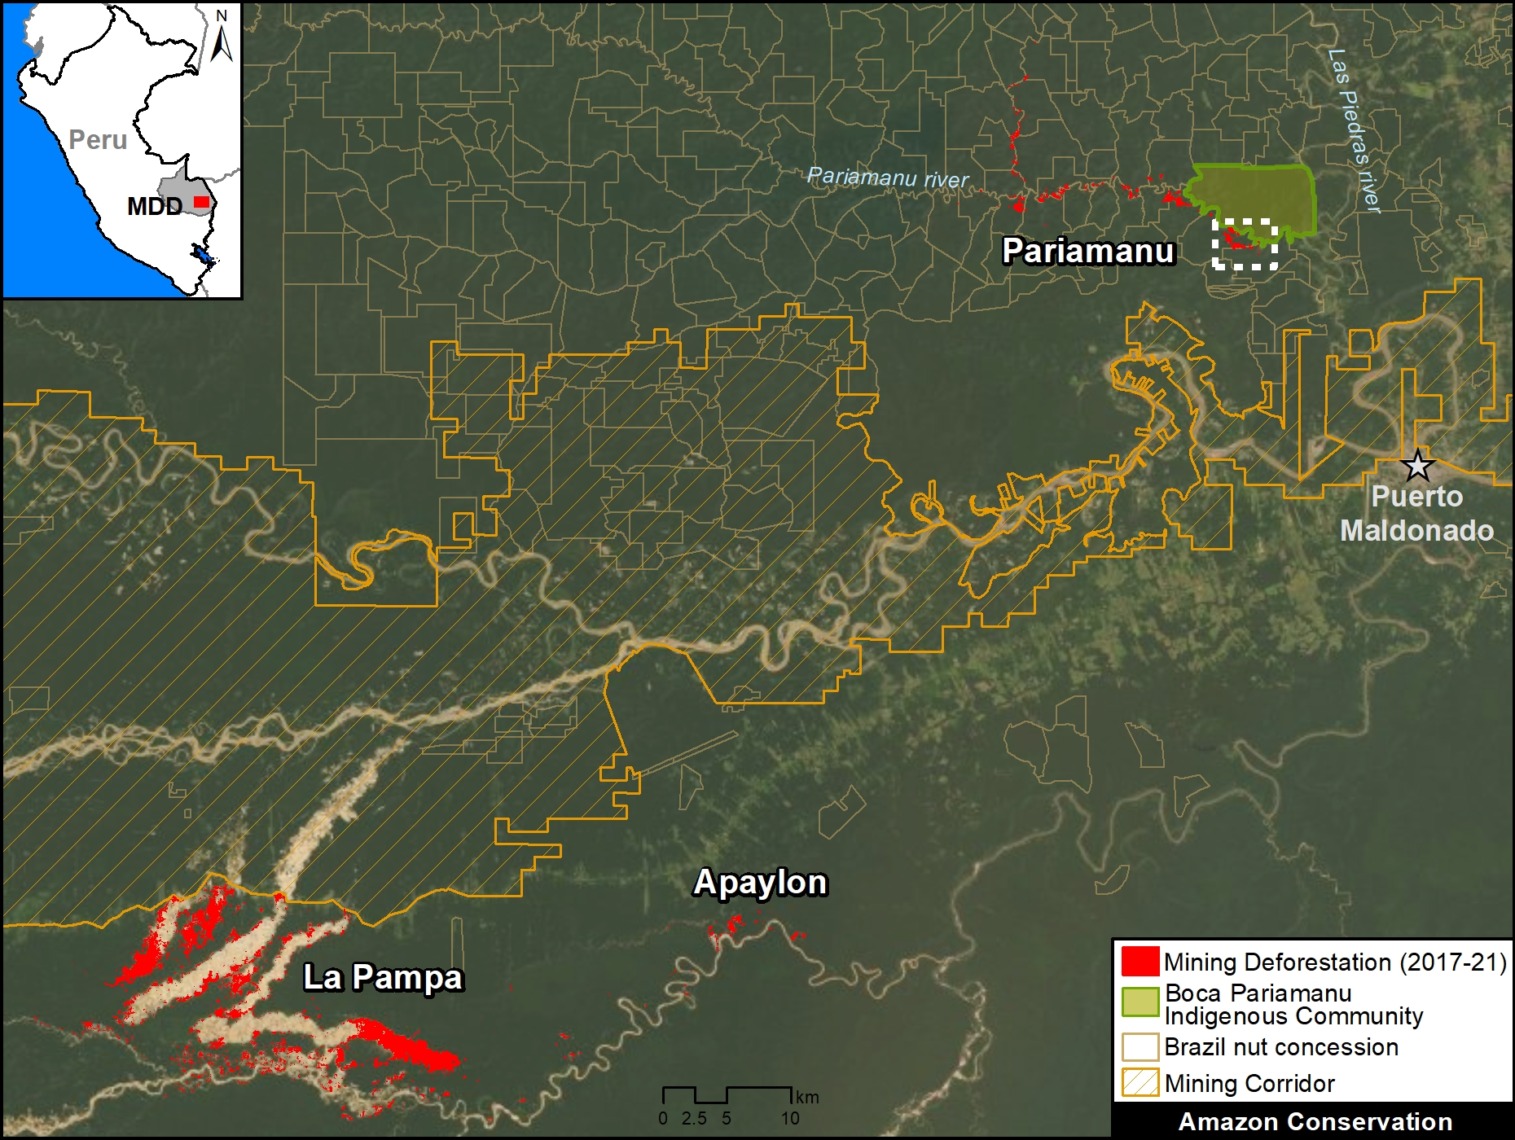
In Pariamanu, located in the primary forests along the Pariamanu River (Madre de Dios region), we documented the loss of 72 hectares prior to Operation Mercury. Following the Operation, we confirmed the loss of 98 hectares. In response, the government conducted a major intervention in August 2020.
In Apaylon, located in the buffer zone Tambopata National Reserve (Madre de Dios region), we documented the loss of 73 hectares prior to Operation Mercury. Following the Operation, we confirmed the loss of 78 hectares. In response, the government has conducted a series of interventions in the area during 2020.
Chaspa, located in the buffer zone of Bahuaja Sonene National Park (Puno region), represents a unique case of a new gold mining front that appeared following Operation Mercury. Starting in September 2019, we documented the deforestation of 113 hectares impacting the Chaspa River watershed. In response, the government conducted a major intervention in October 2020.
Gold Mining Deforestation Trends
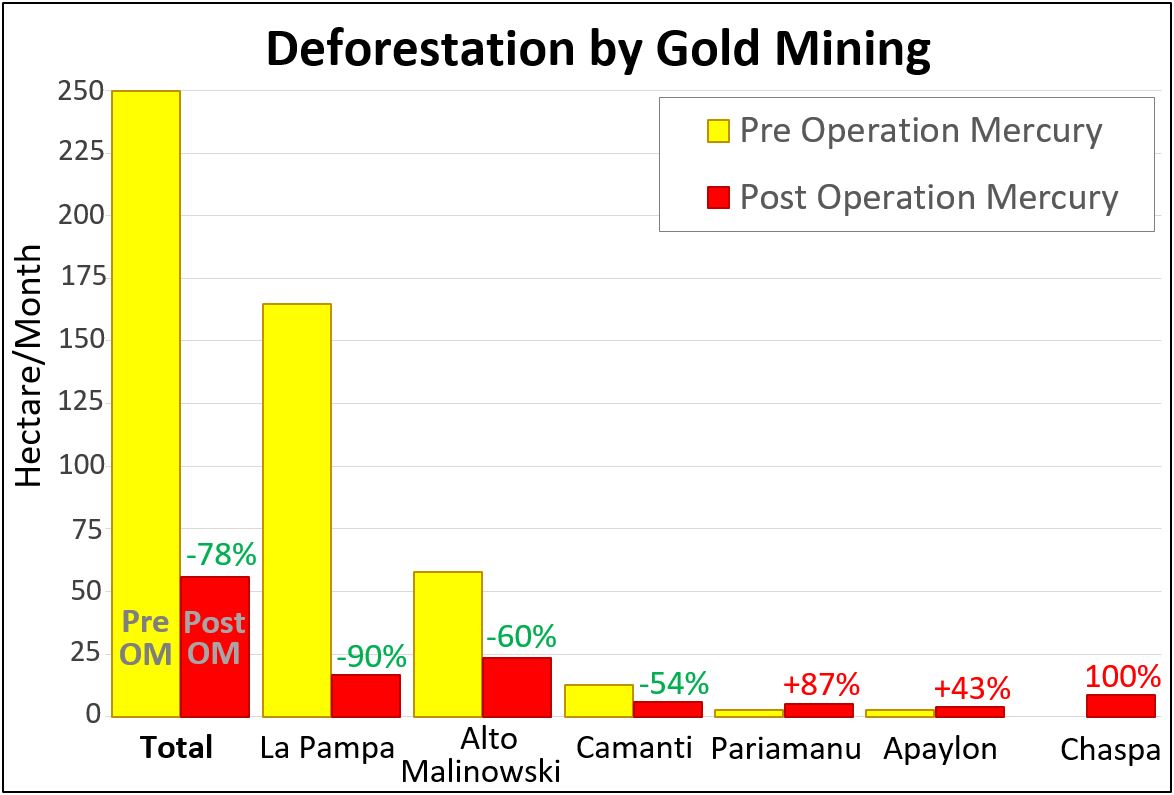
The following chart illustrates that gold mining deforestation fronts decreased following Operation Mercury in the three largest fronts (La Pampa, Alto Malinowski, and Camanti), and increased in three smaller areas (Pariamanu, Apaylon, and Chaspa). Thus, overall gold mining deforestation decreased 78% across all six major sites following Operation Mercury.

Table 1. Rates of gold mining deforestation before (orange) and after (red) Operation Mercury. Data: MAAP.
In La Pampa, the gold mining deforestation averaged 165 hectares per month prior to Operation Mercury. Following the Operation, the deforestation dropped to 17 hectares per month, an overall 90% decrease.
In Alto Malinowski, the gold mining deforestation dropped from 58 hectares per month to 23 hectares per month following Operation Mercury, an overall 60% decrease.
In Camanti, the gold mining deforestation dropped from 12.5 hectares per month to 6 hectares per month following Operation Mercury, an overall 54% decrease.
In Pariamanu, the gold mining deforestation increased from 2.8 hectares per month to 5 hectares per month following Operation Mercury, an overall 87% increase.
In Apaylon, the gold mining deforestation increased from 2.8 hectares per month to 4 hectares per month following Operation Mercury, an overall 43% increase.
Chaspa, located in the buffer zone of Bahuaja Sonene National Park, represents the unique case of a new gold mining front that appeared following Operation Mercury (8.5 hectares per month).
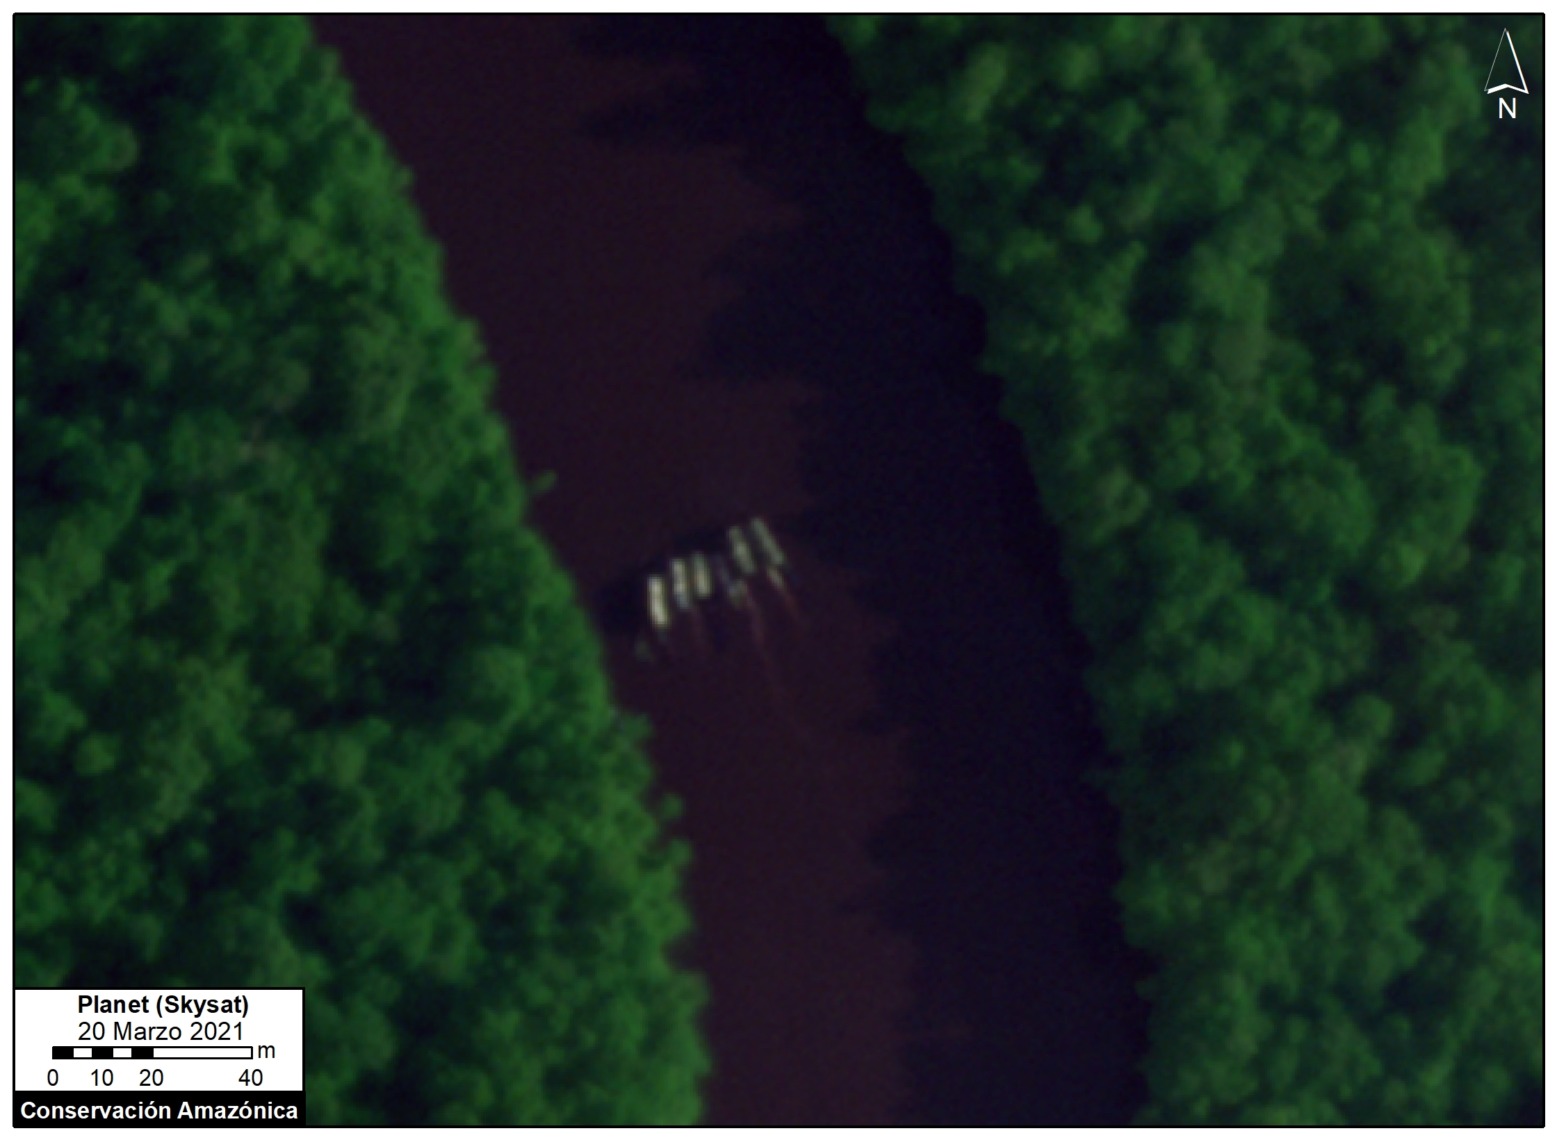
Very High Resolution Satellite Imagery (Skysat)
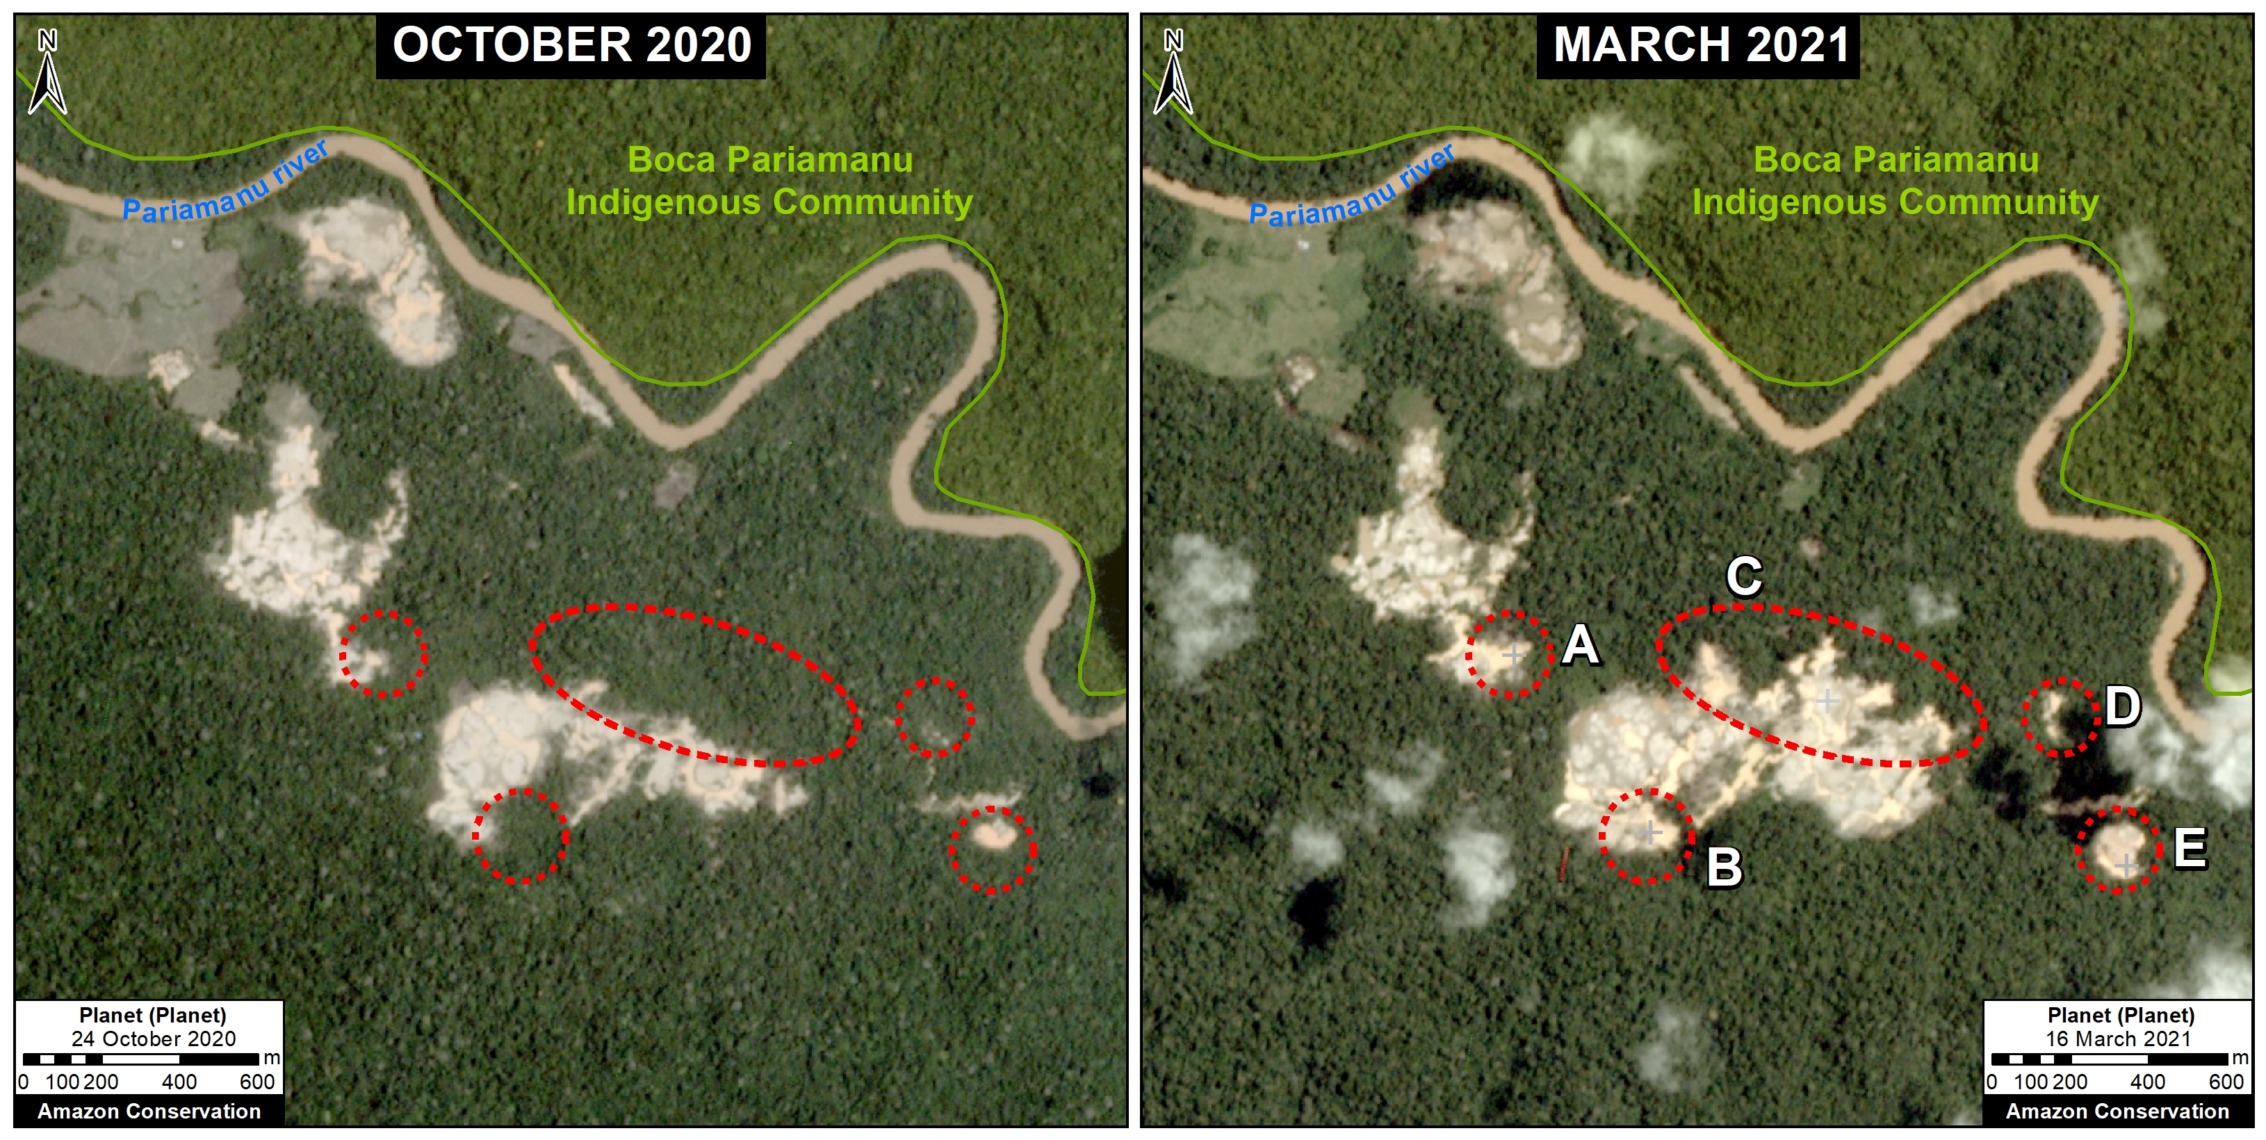
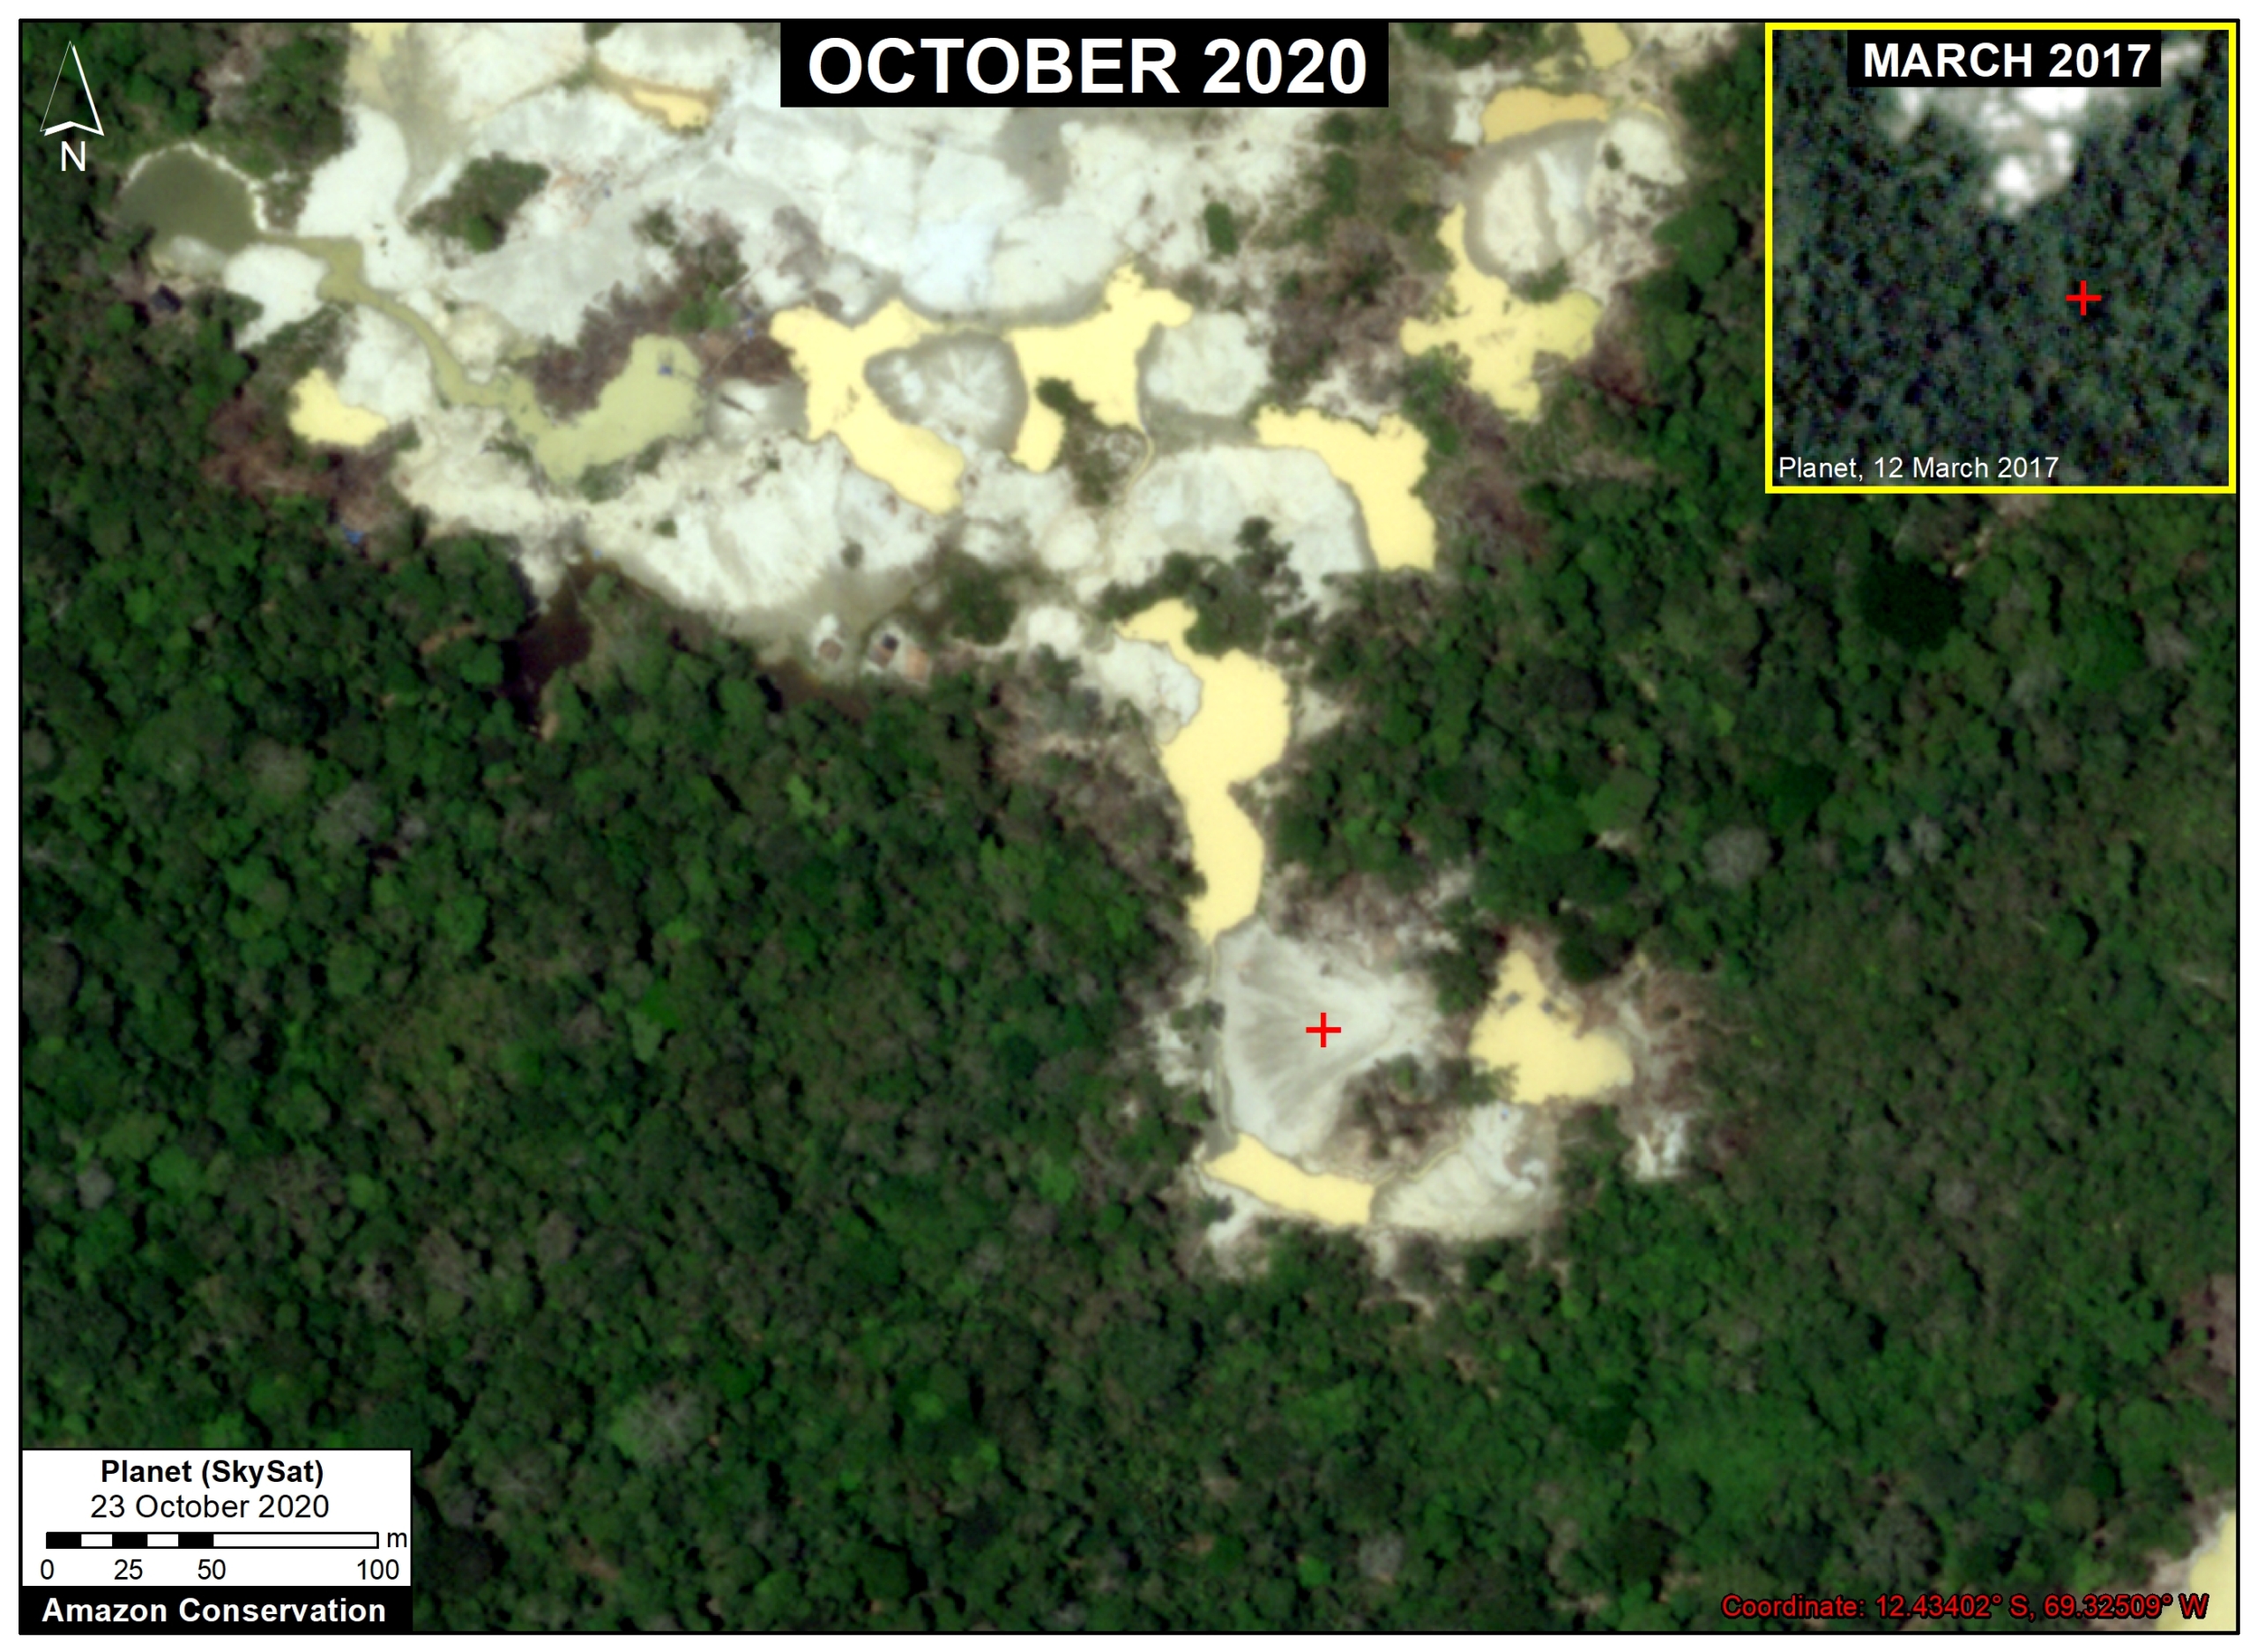
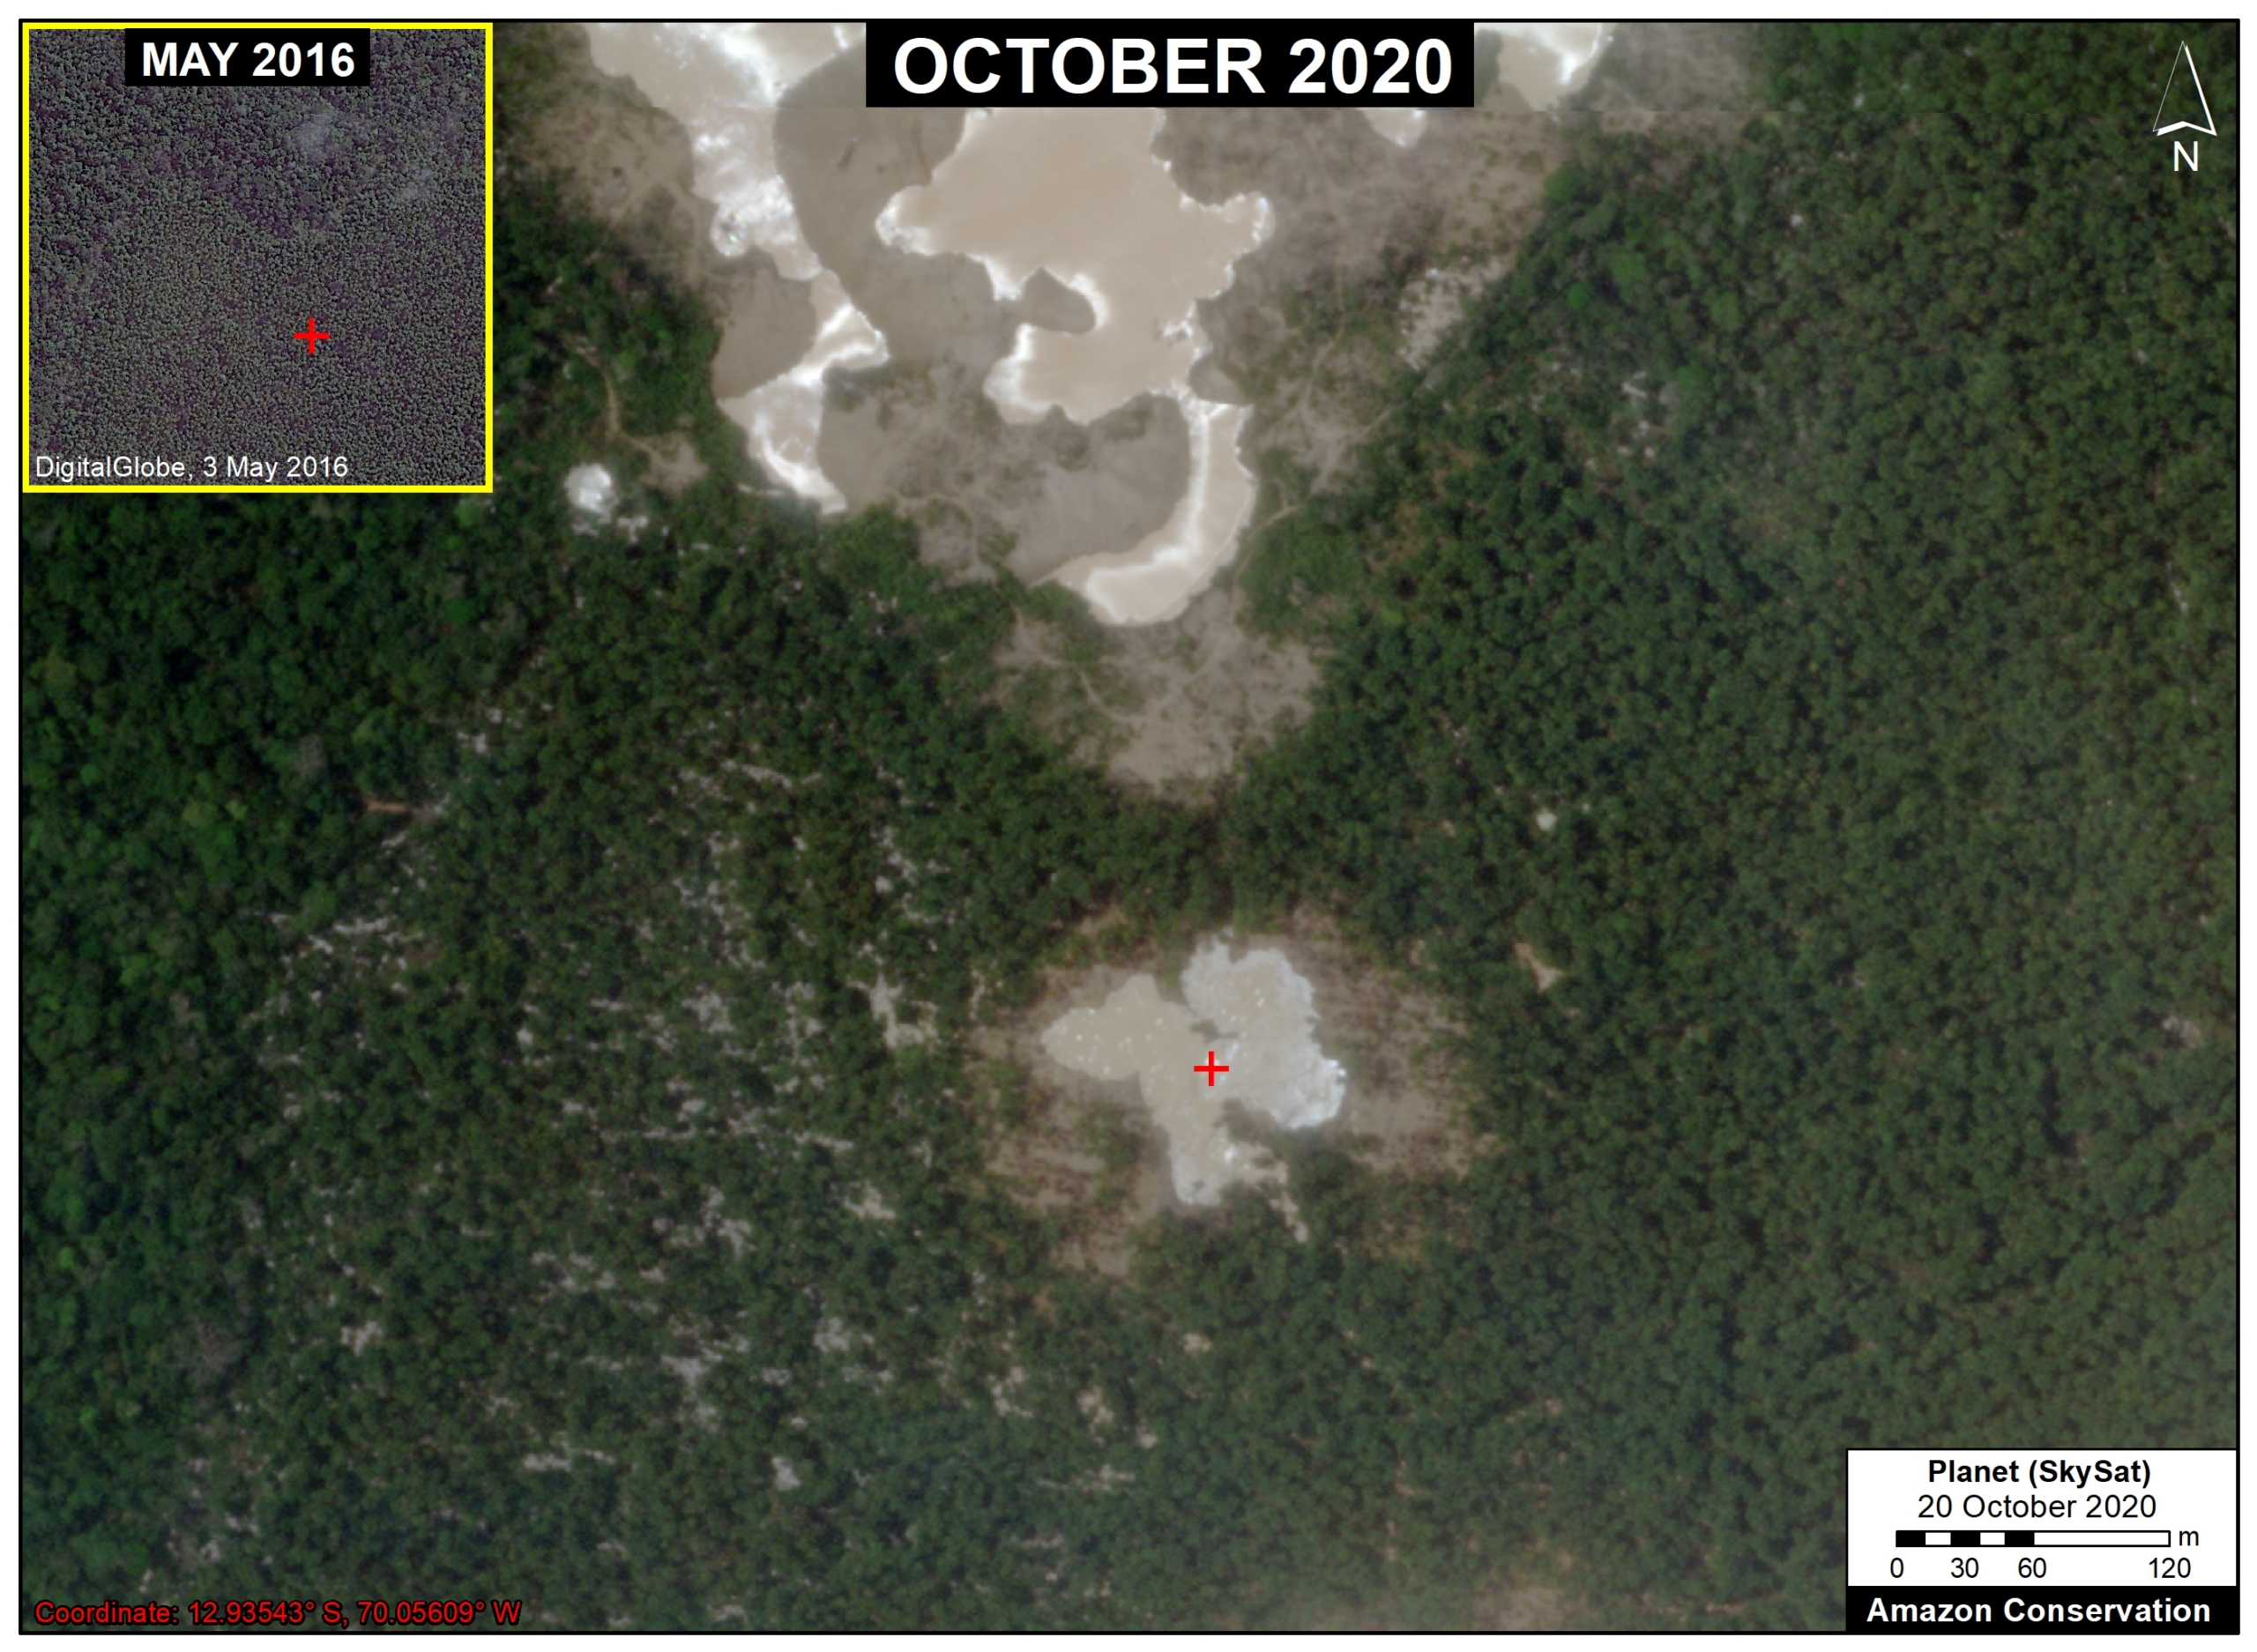
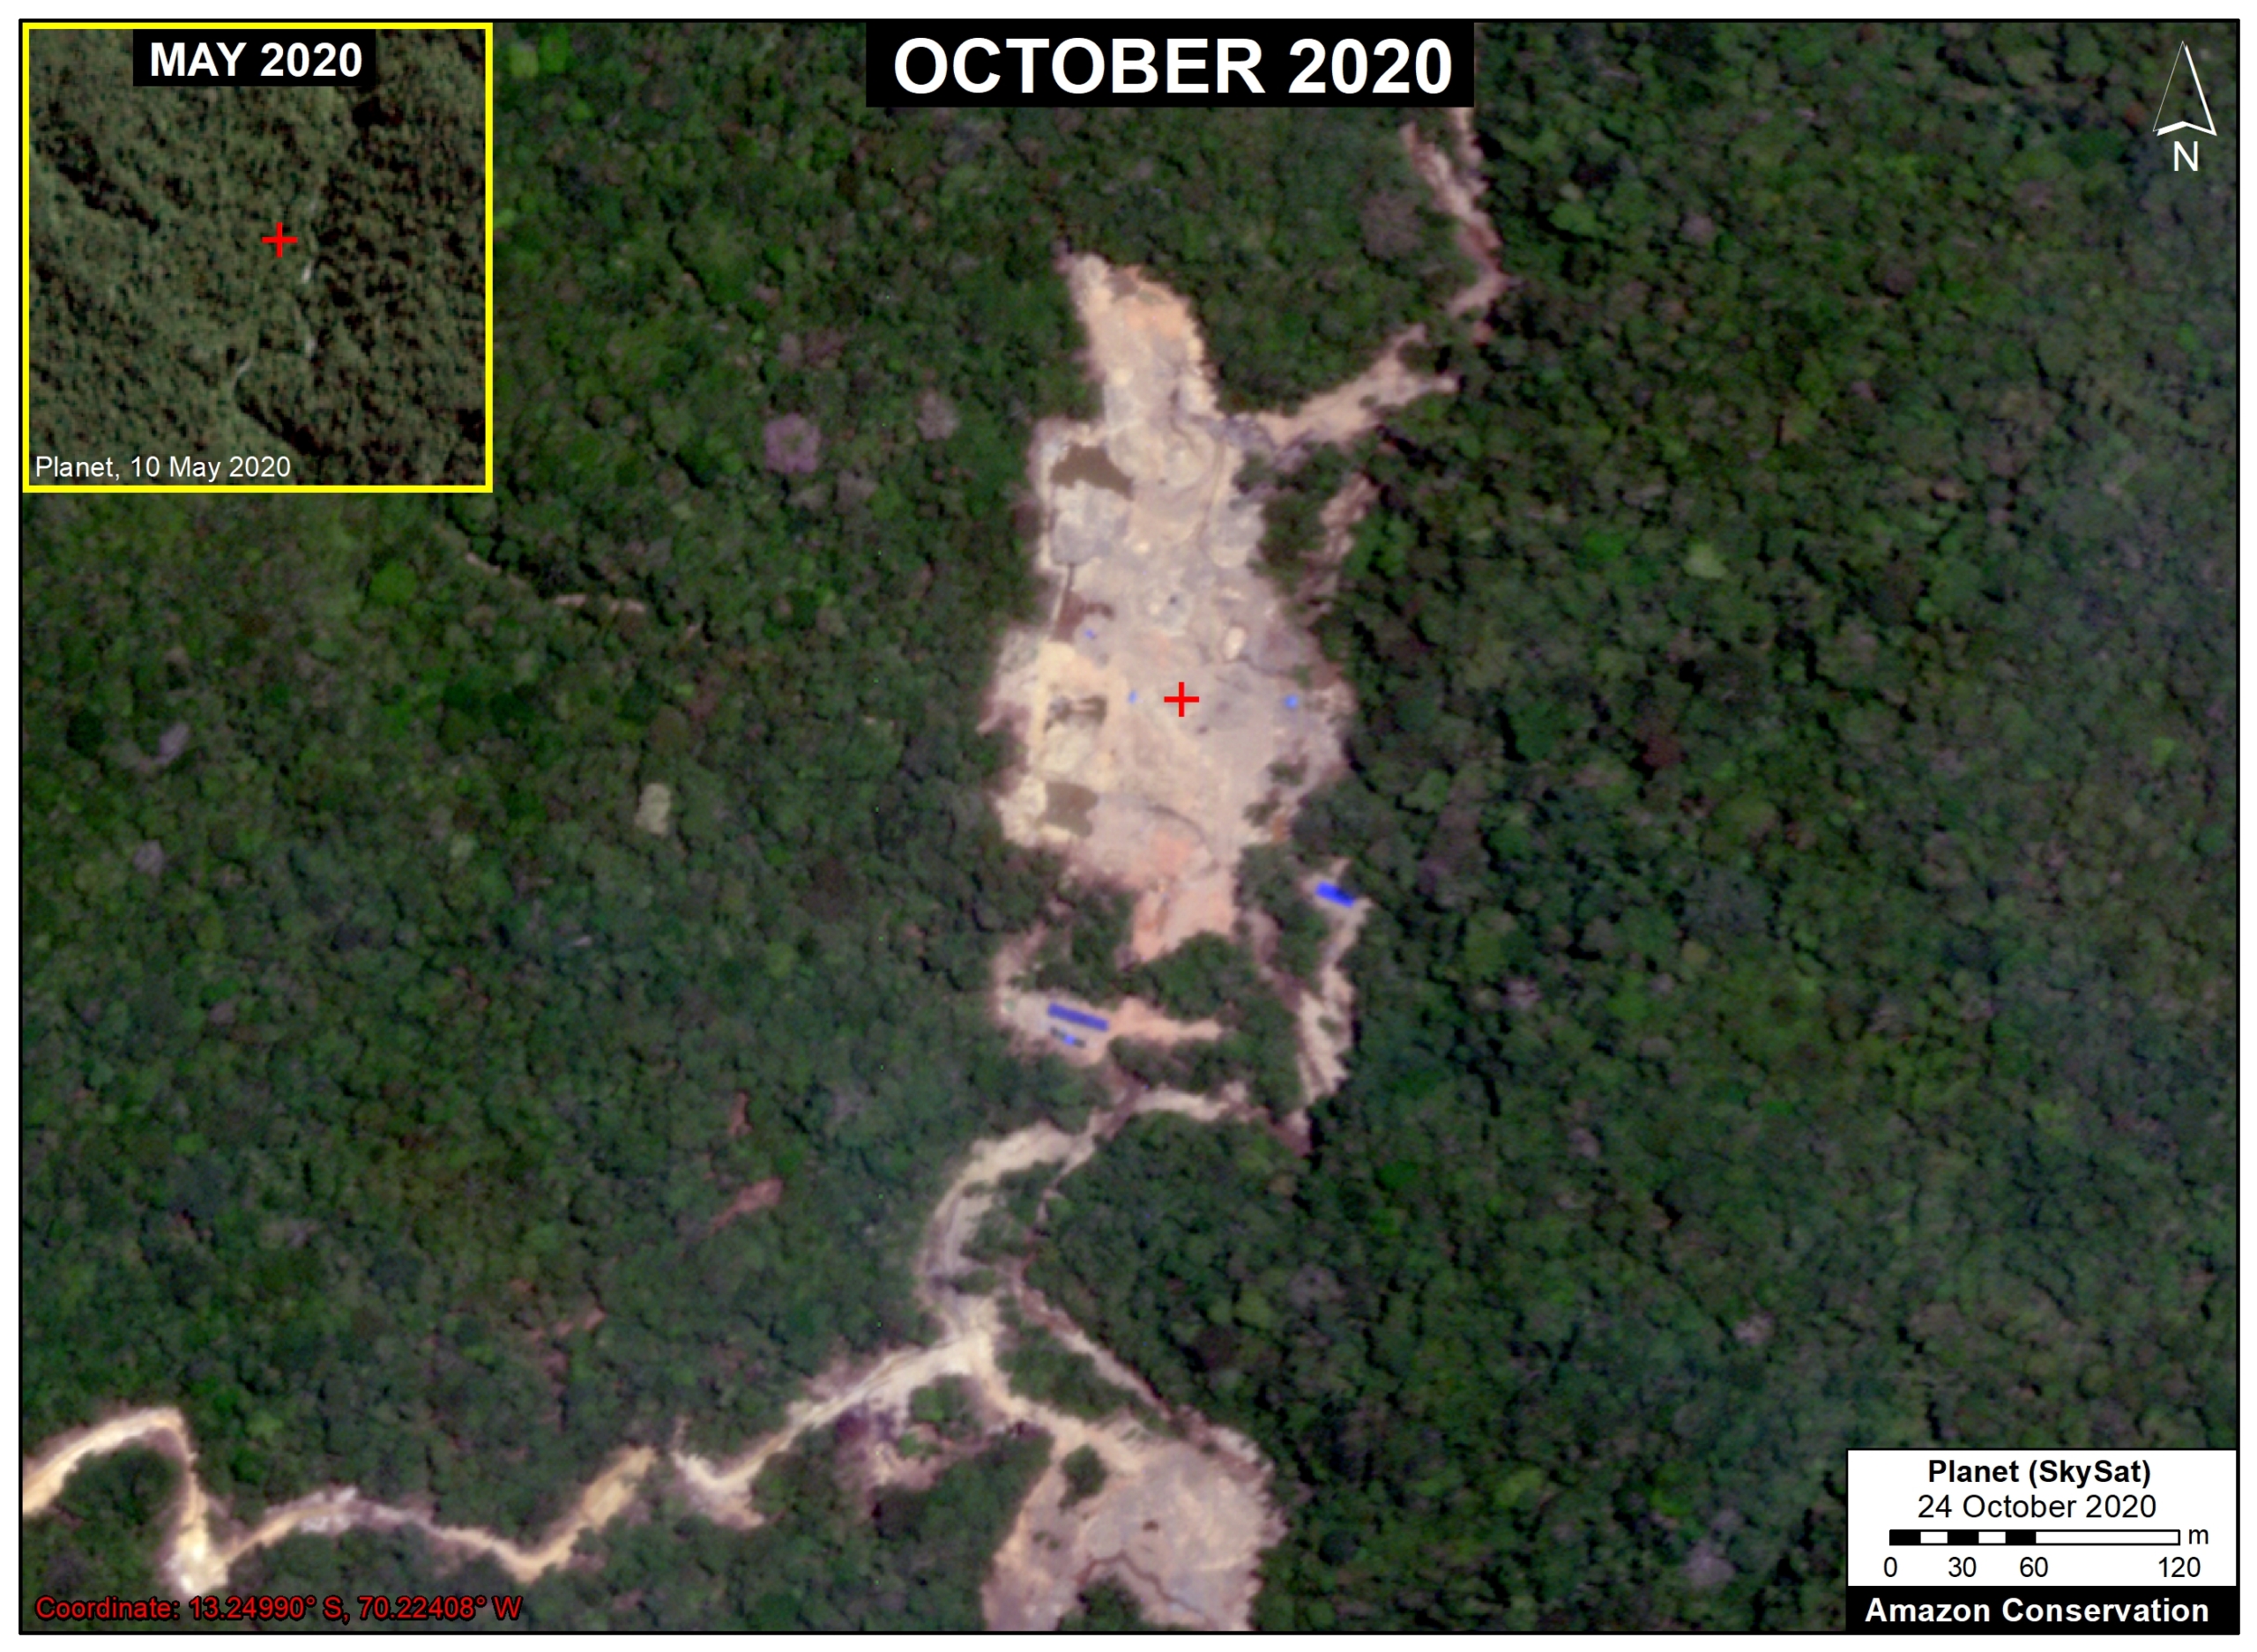
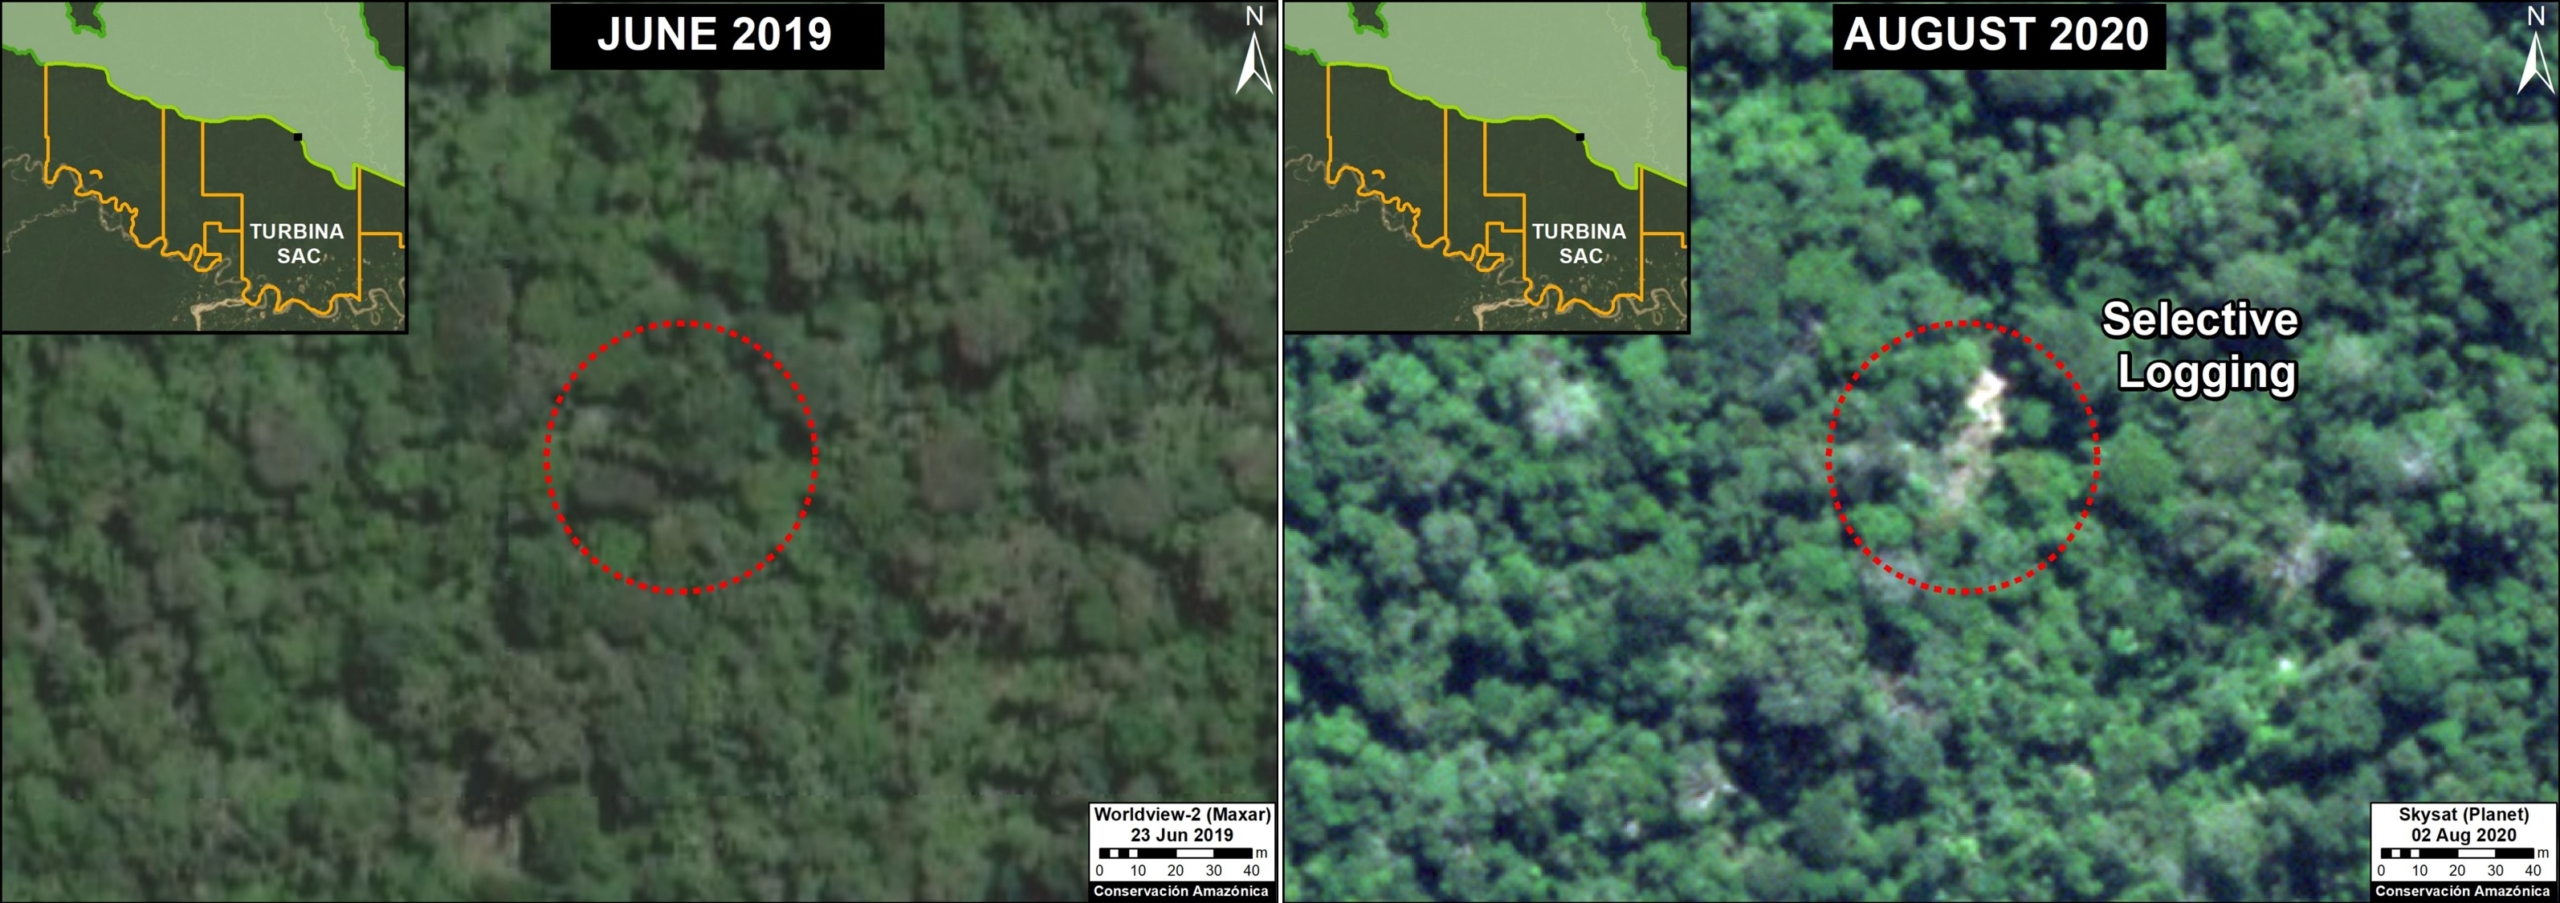
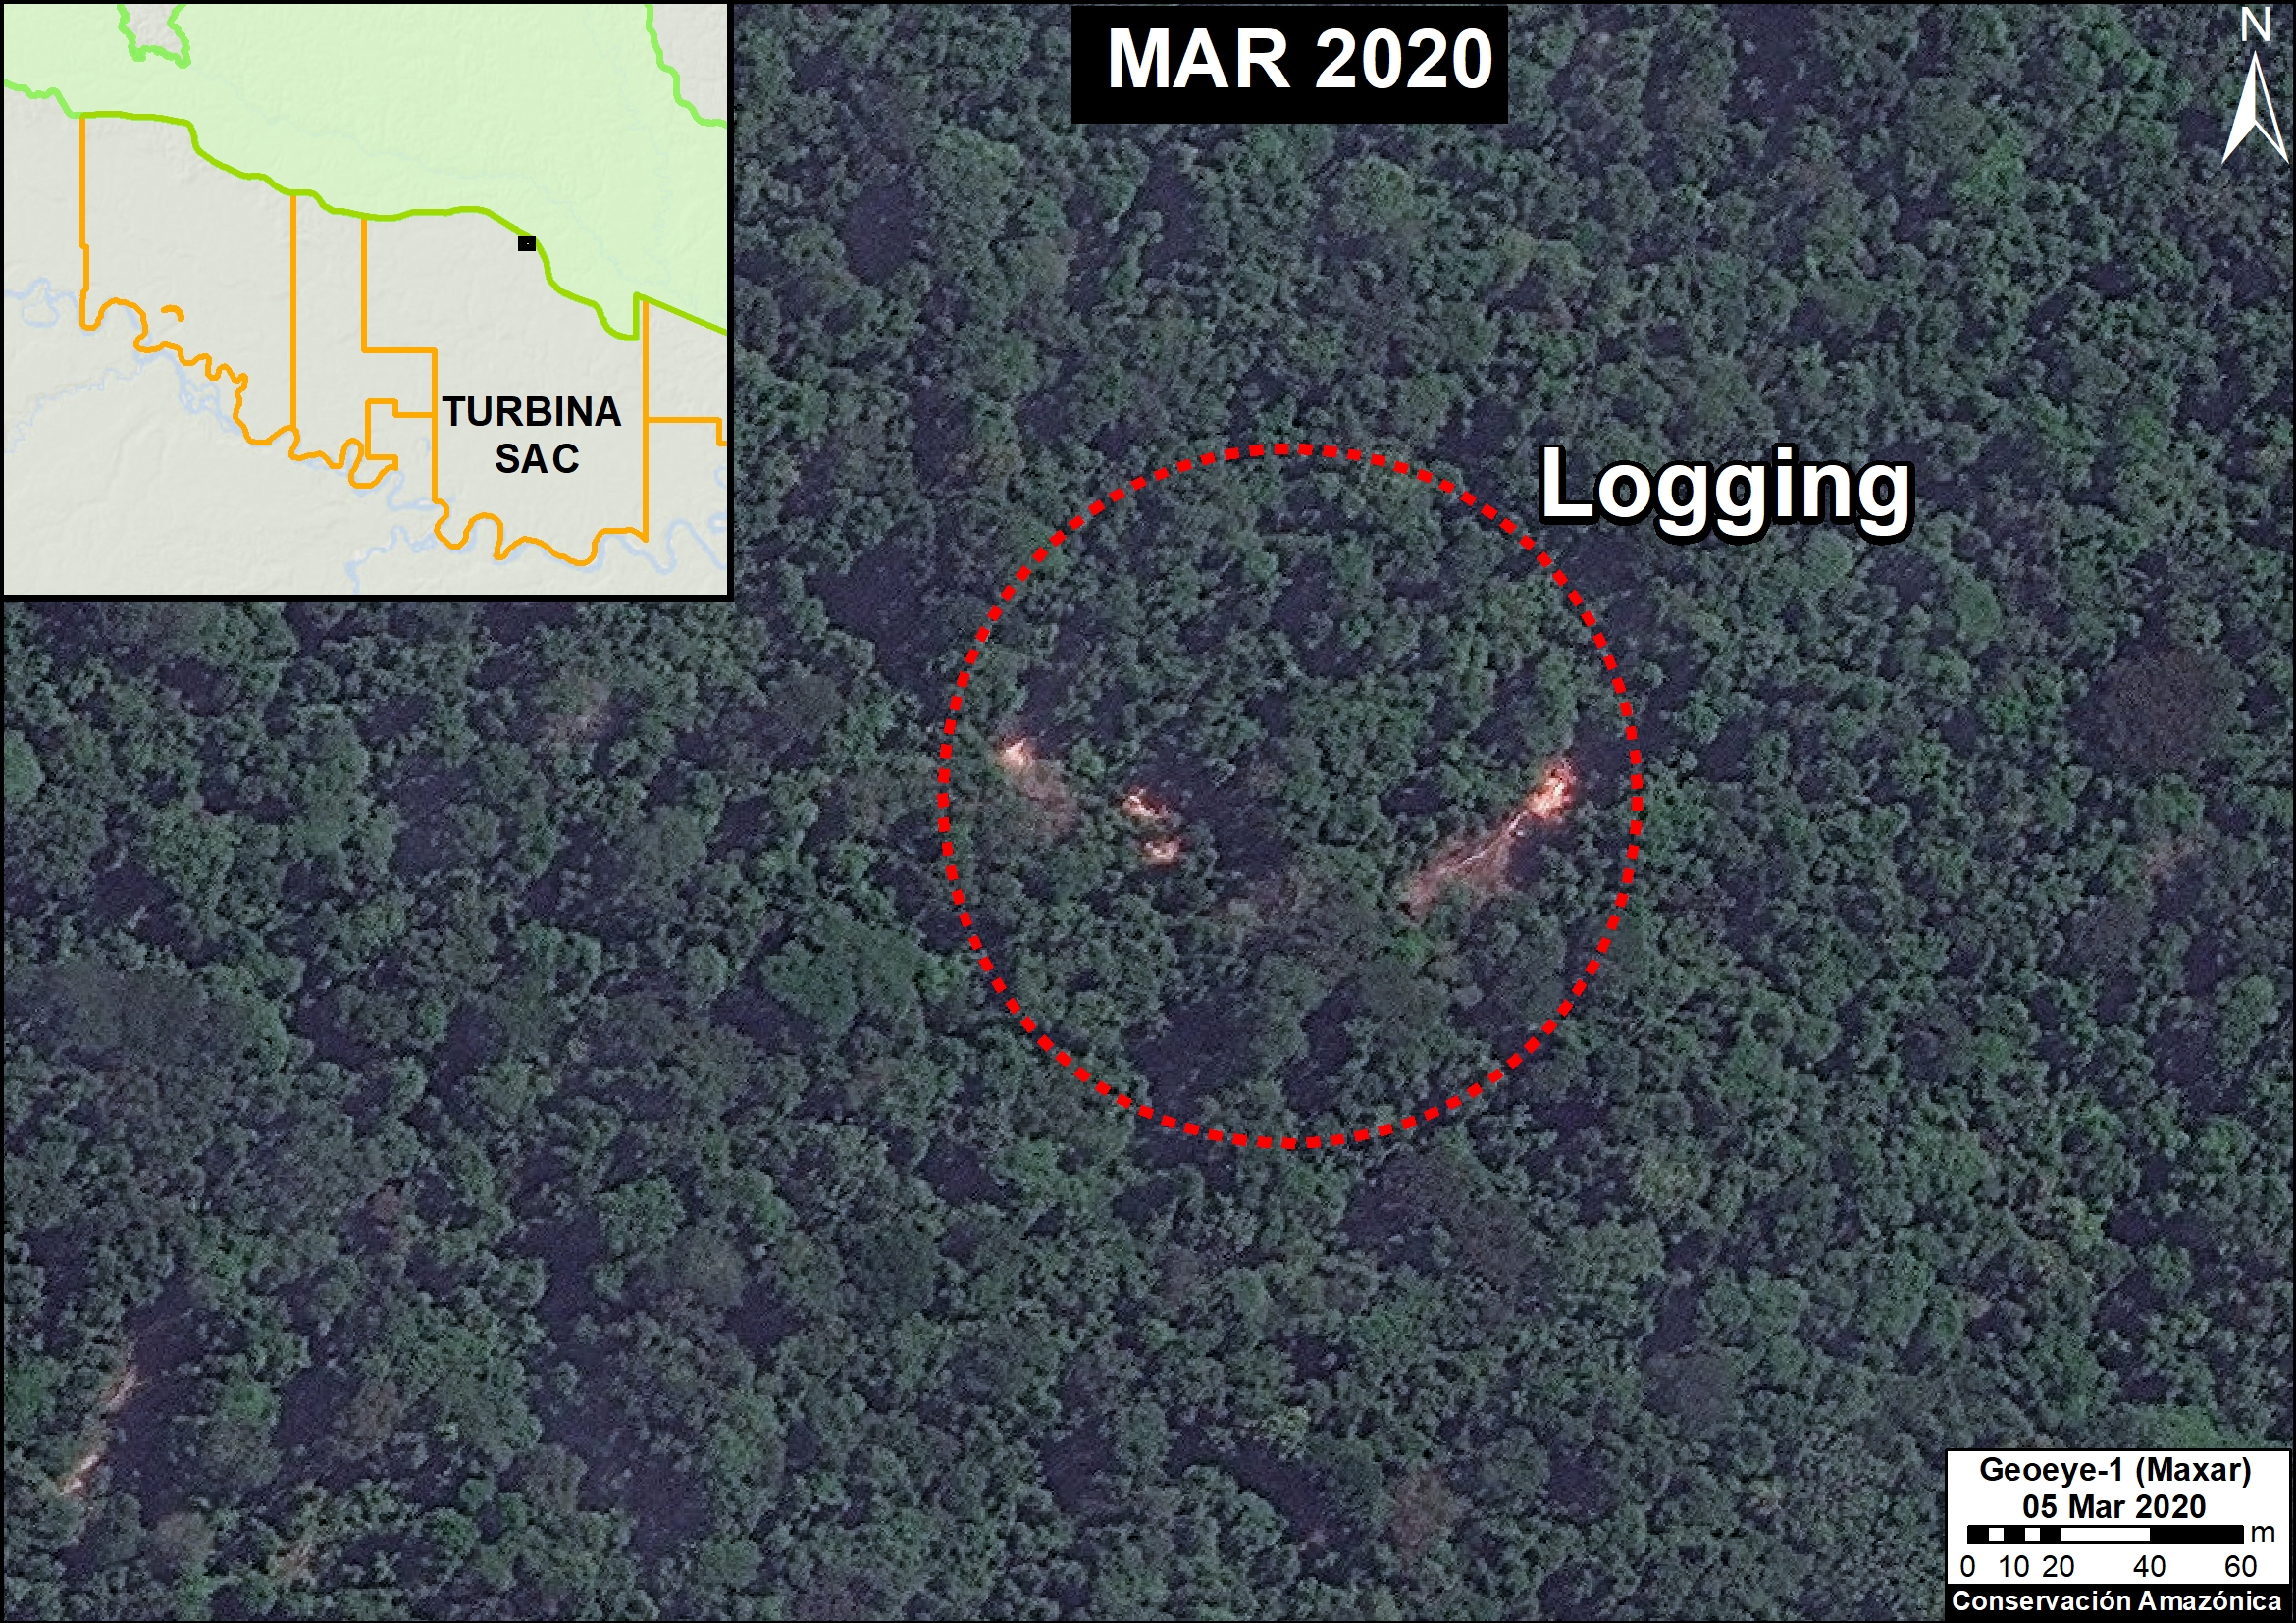
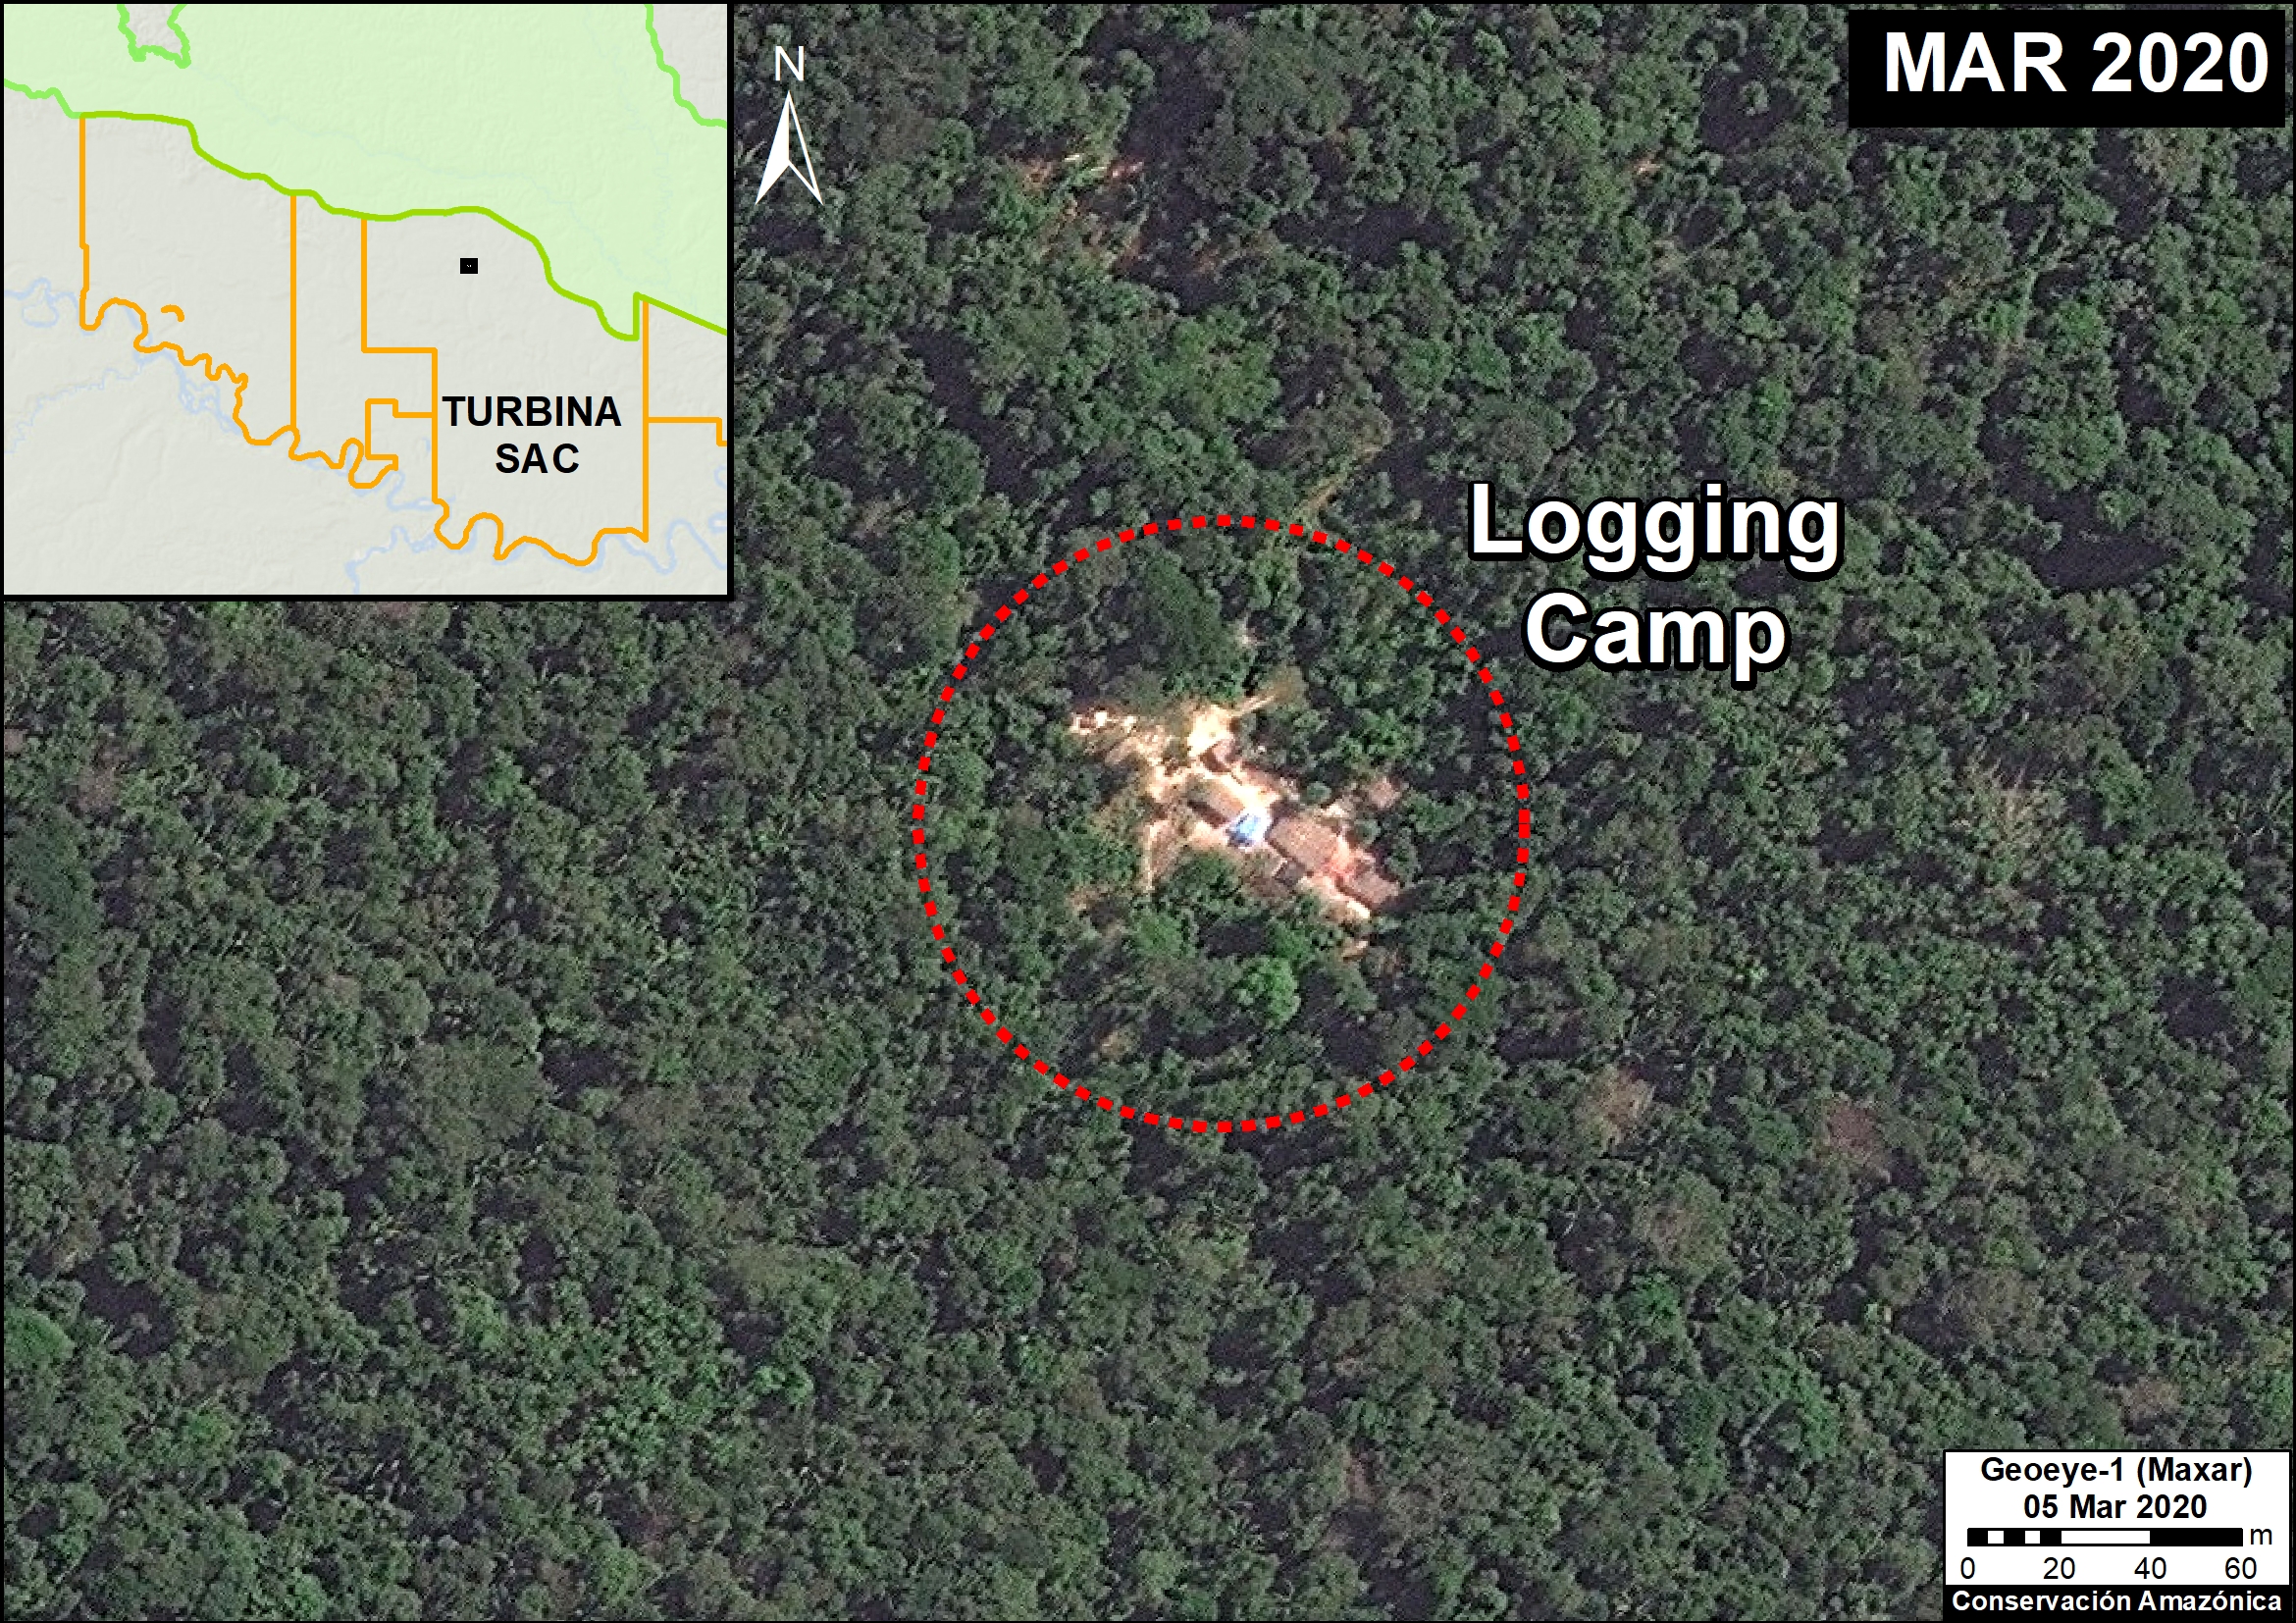
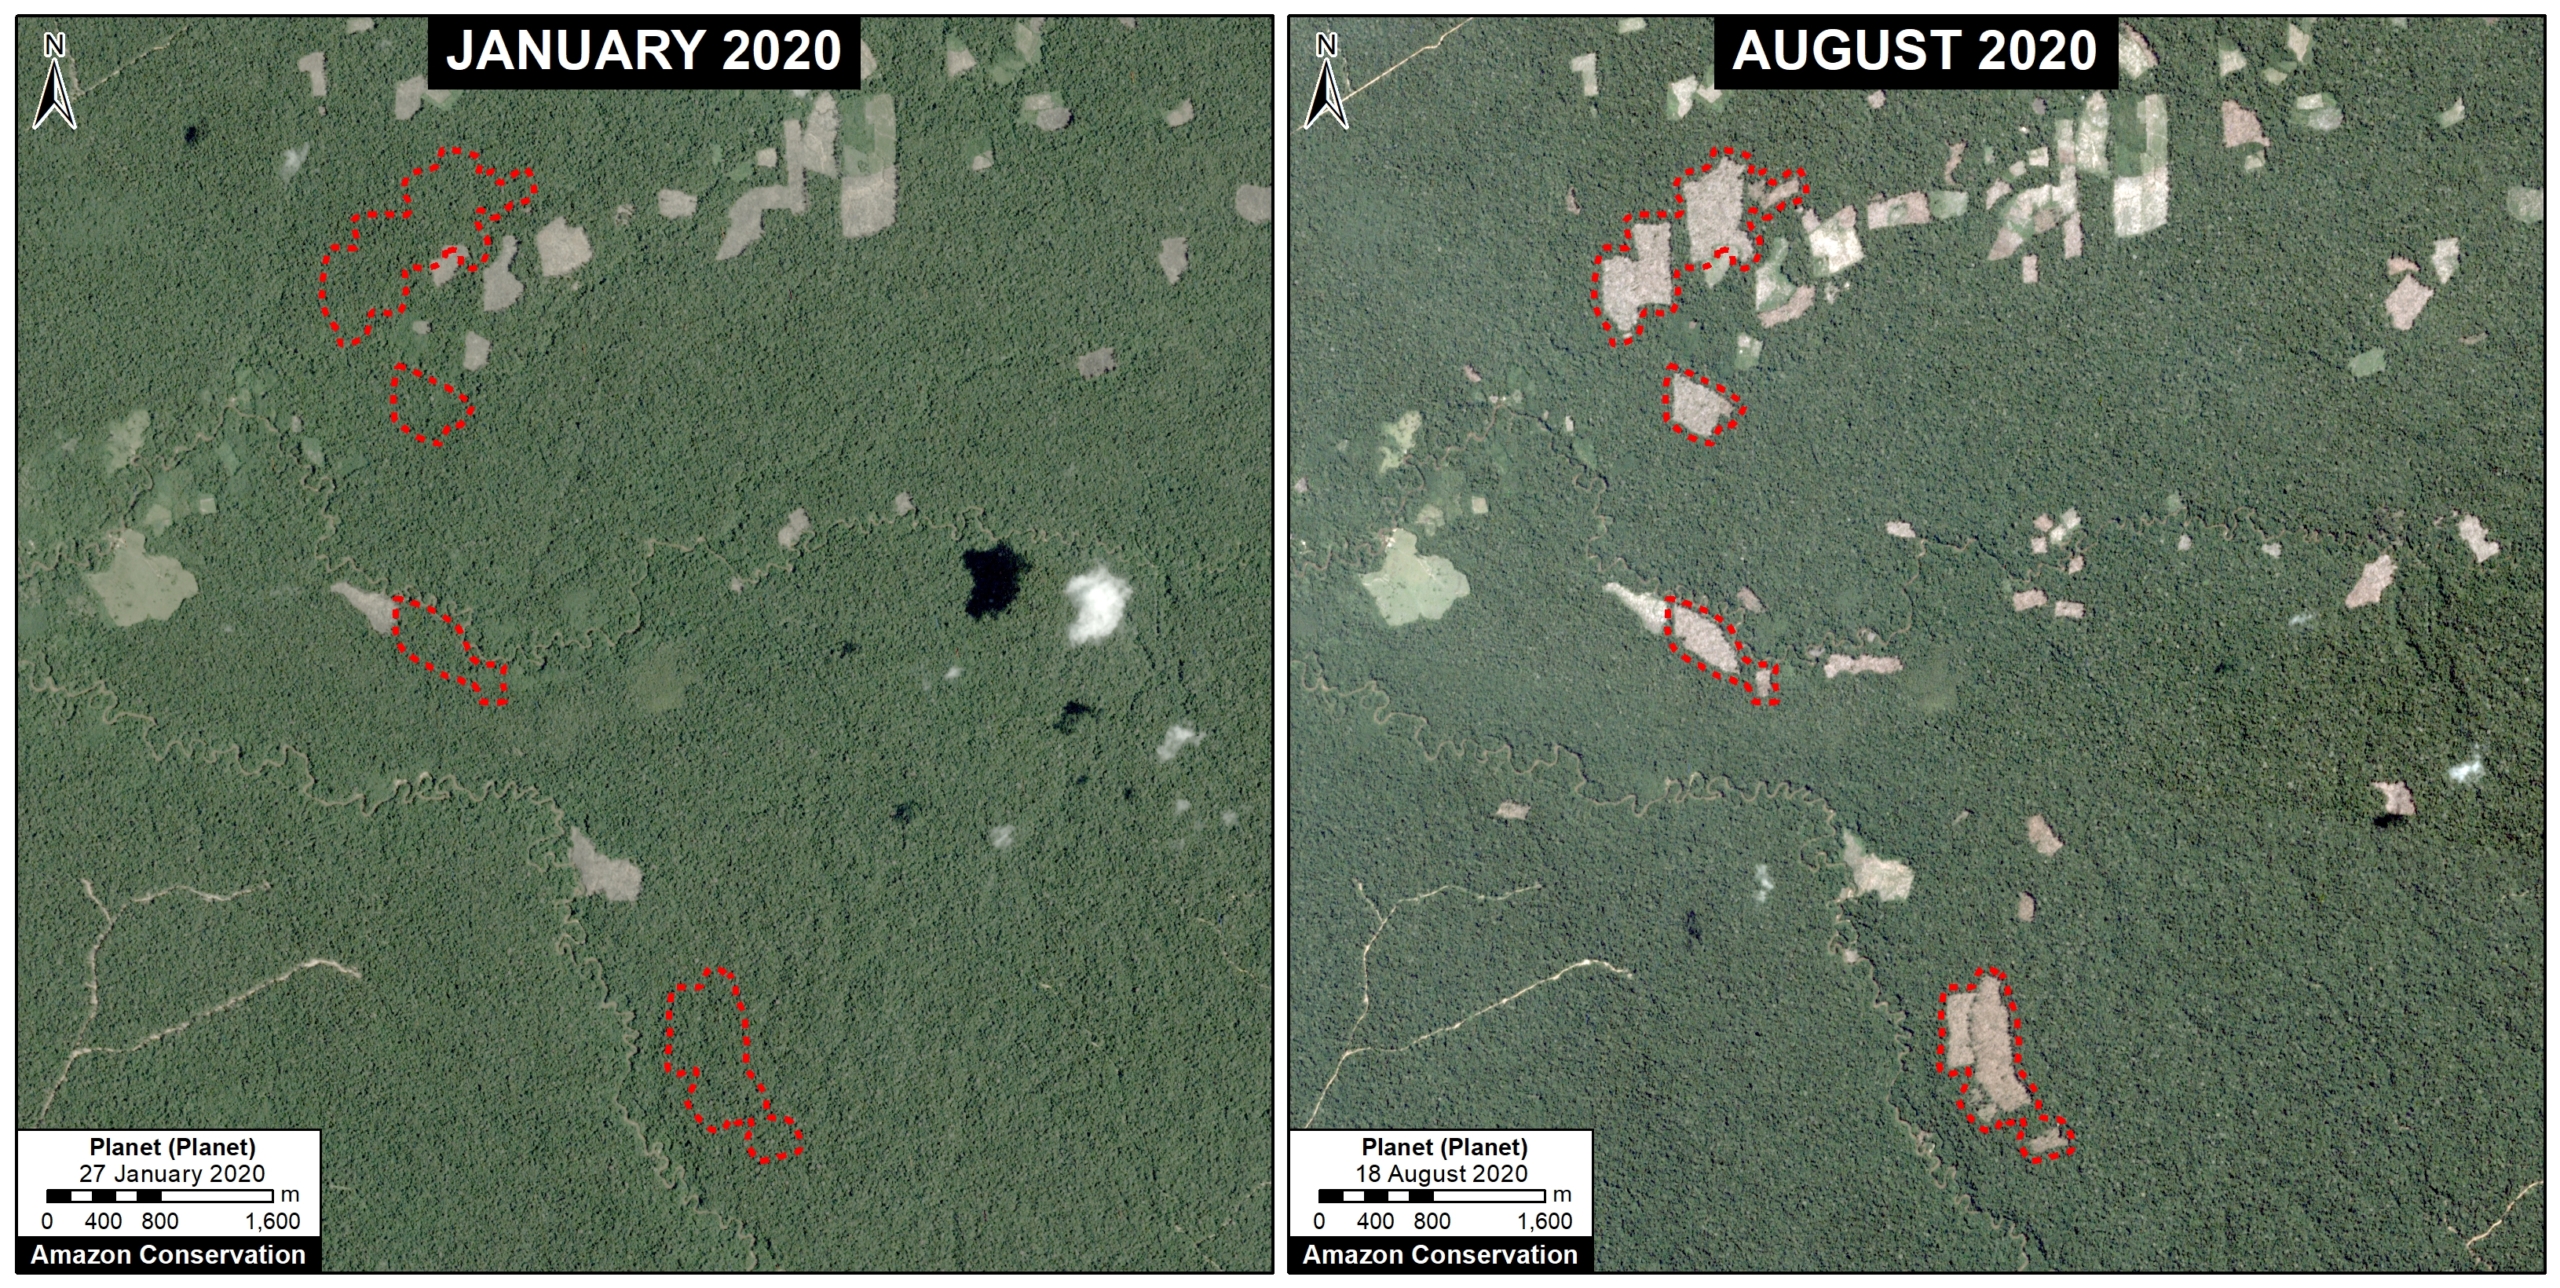
We recently tasked very high resolution satellite imagery (Skysat, 0.5 meter) for the major illegal gold mining areas. Below, we present a series showing some of the highlights from these images. Note that insets (in the upper corner of each image) show the same area before the mining activity (see red points as a reference).
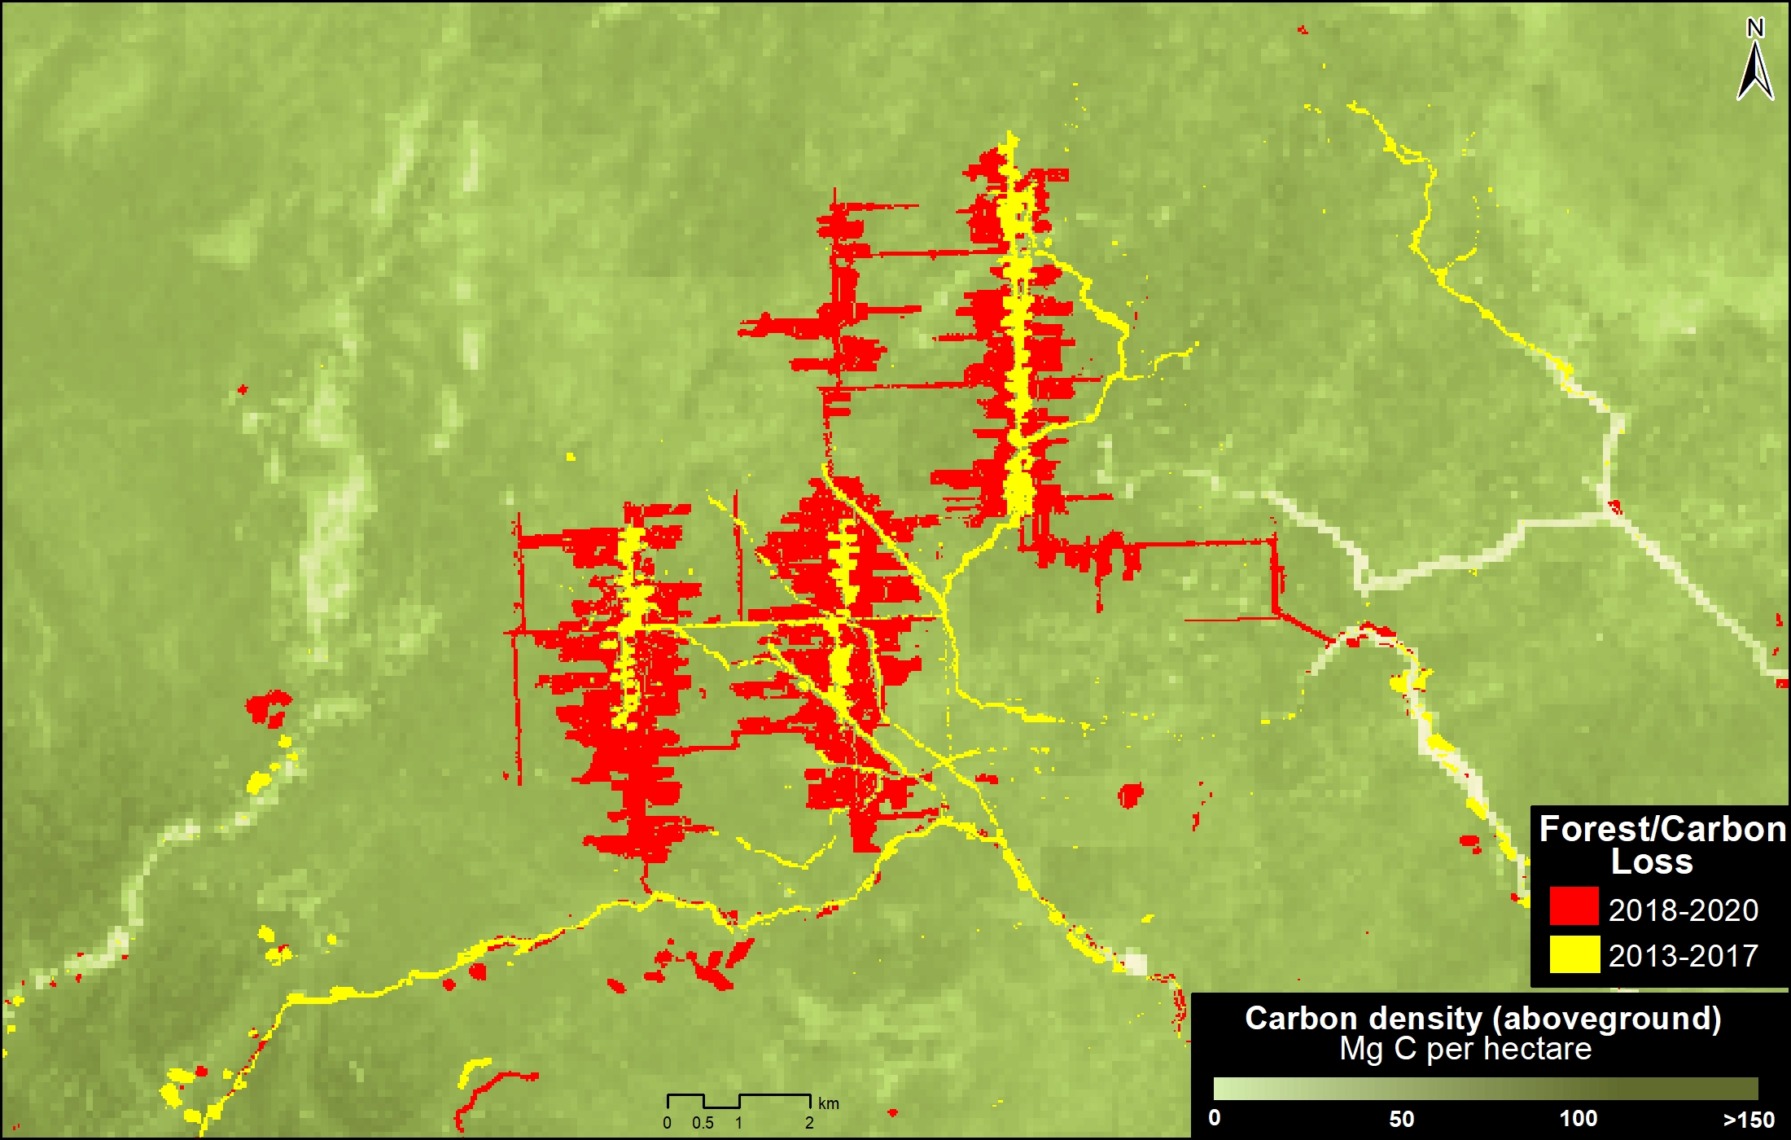
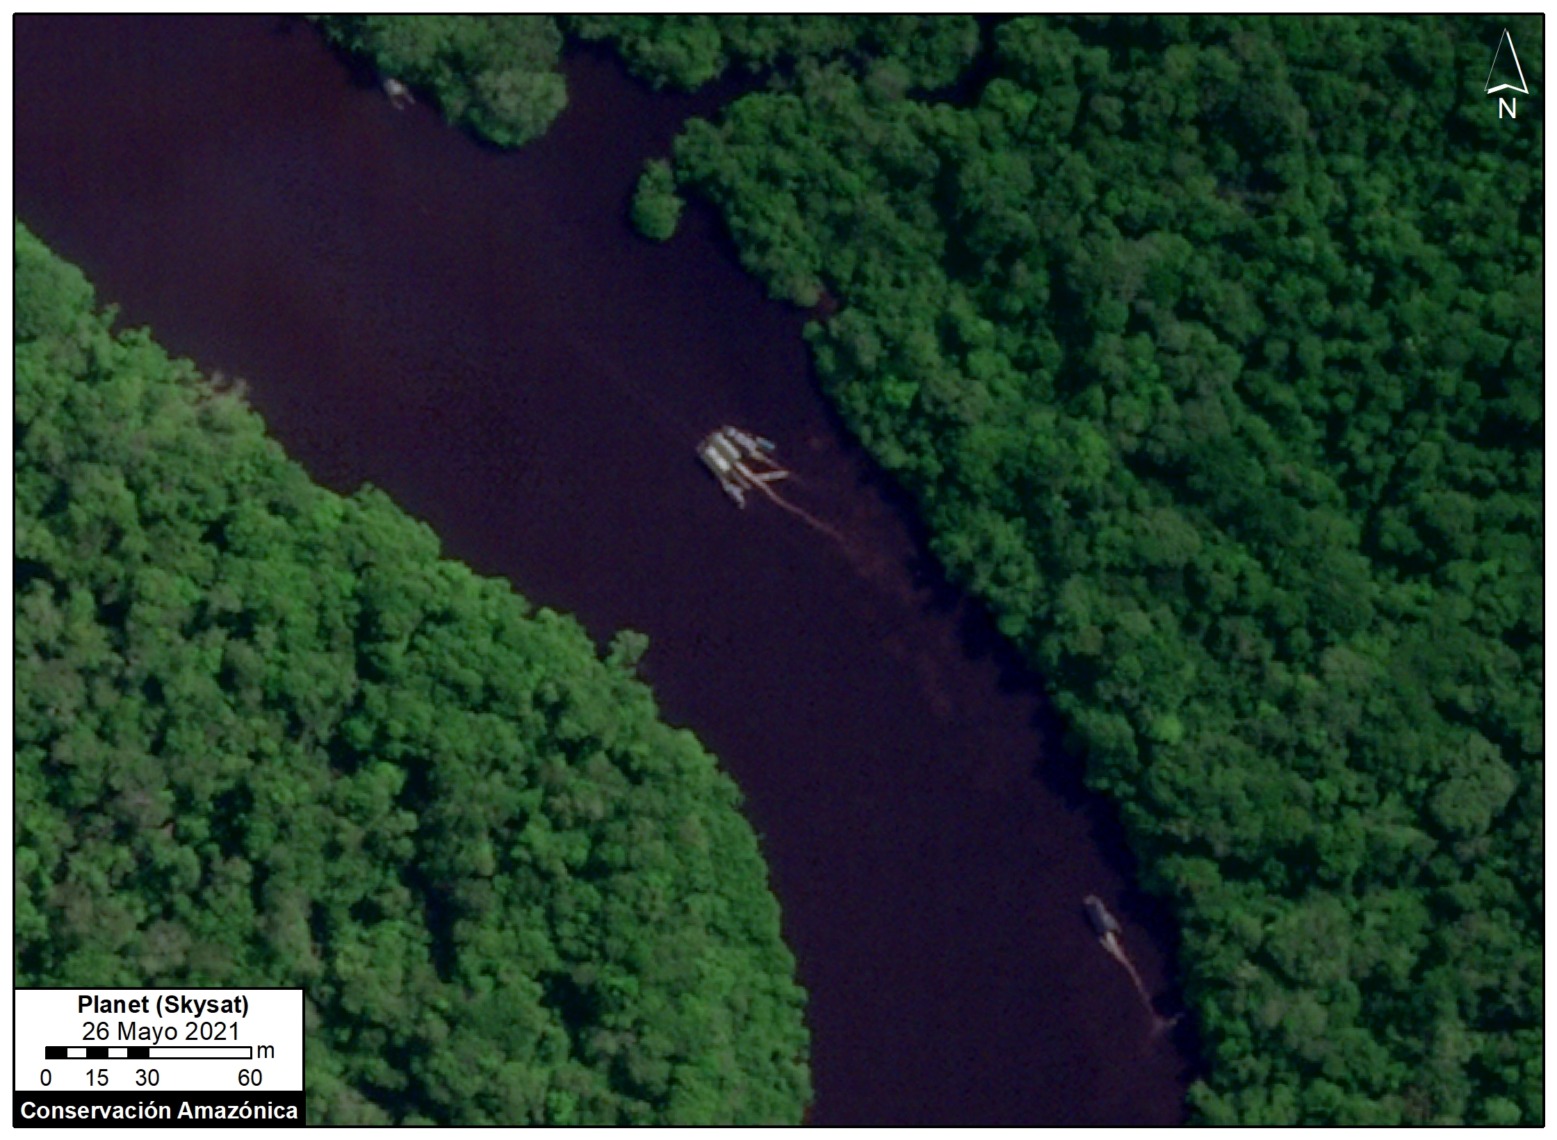
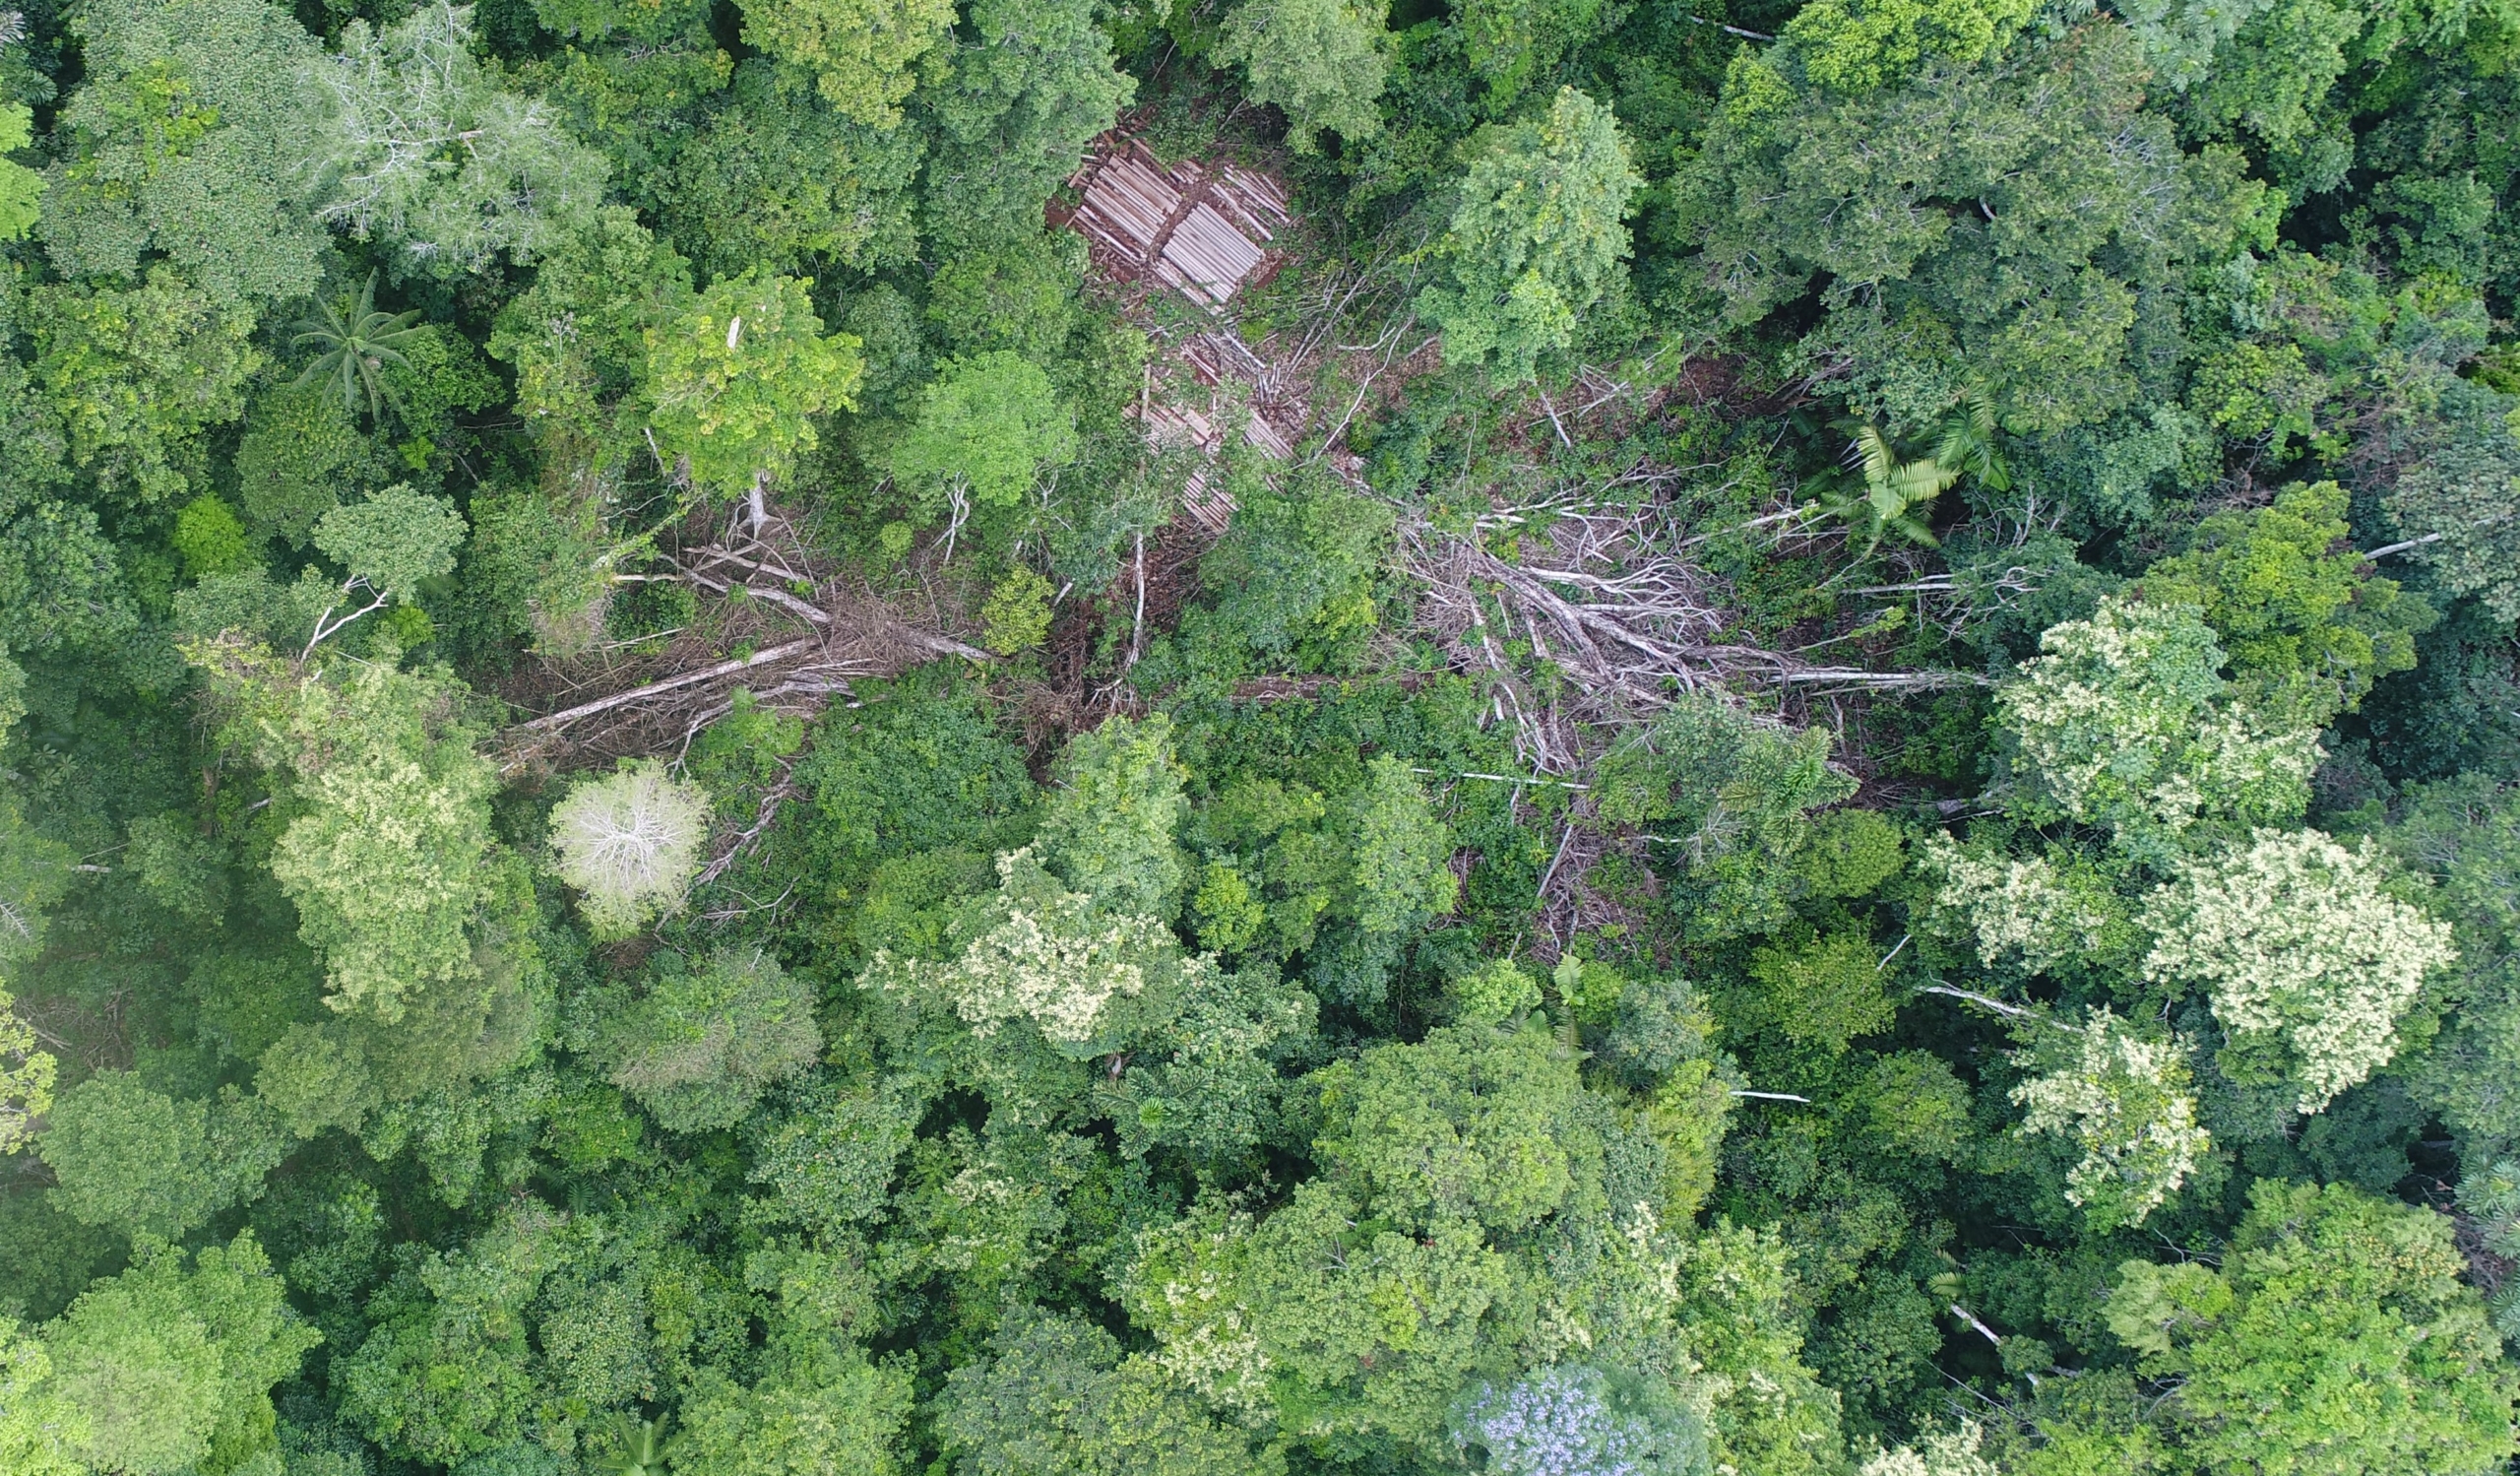
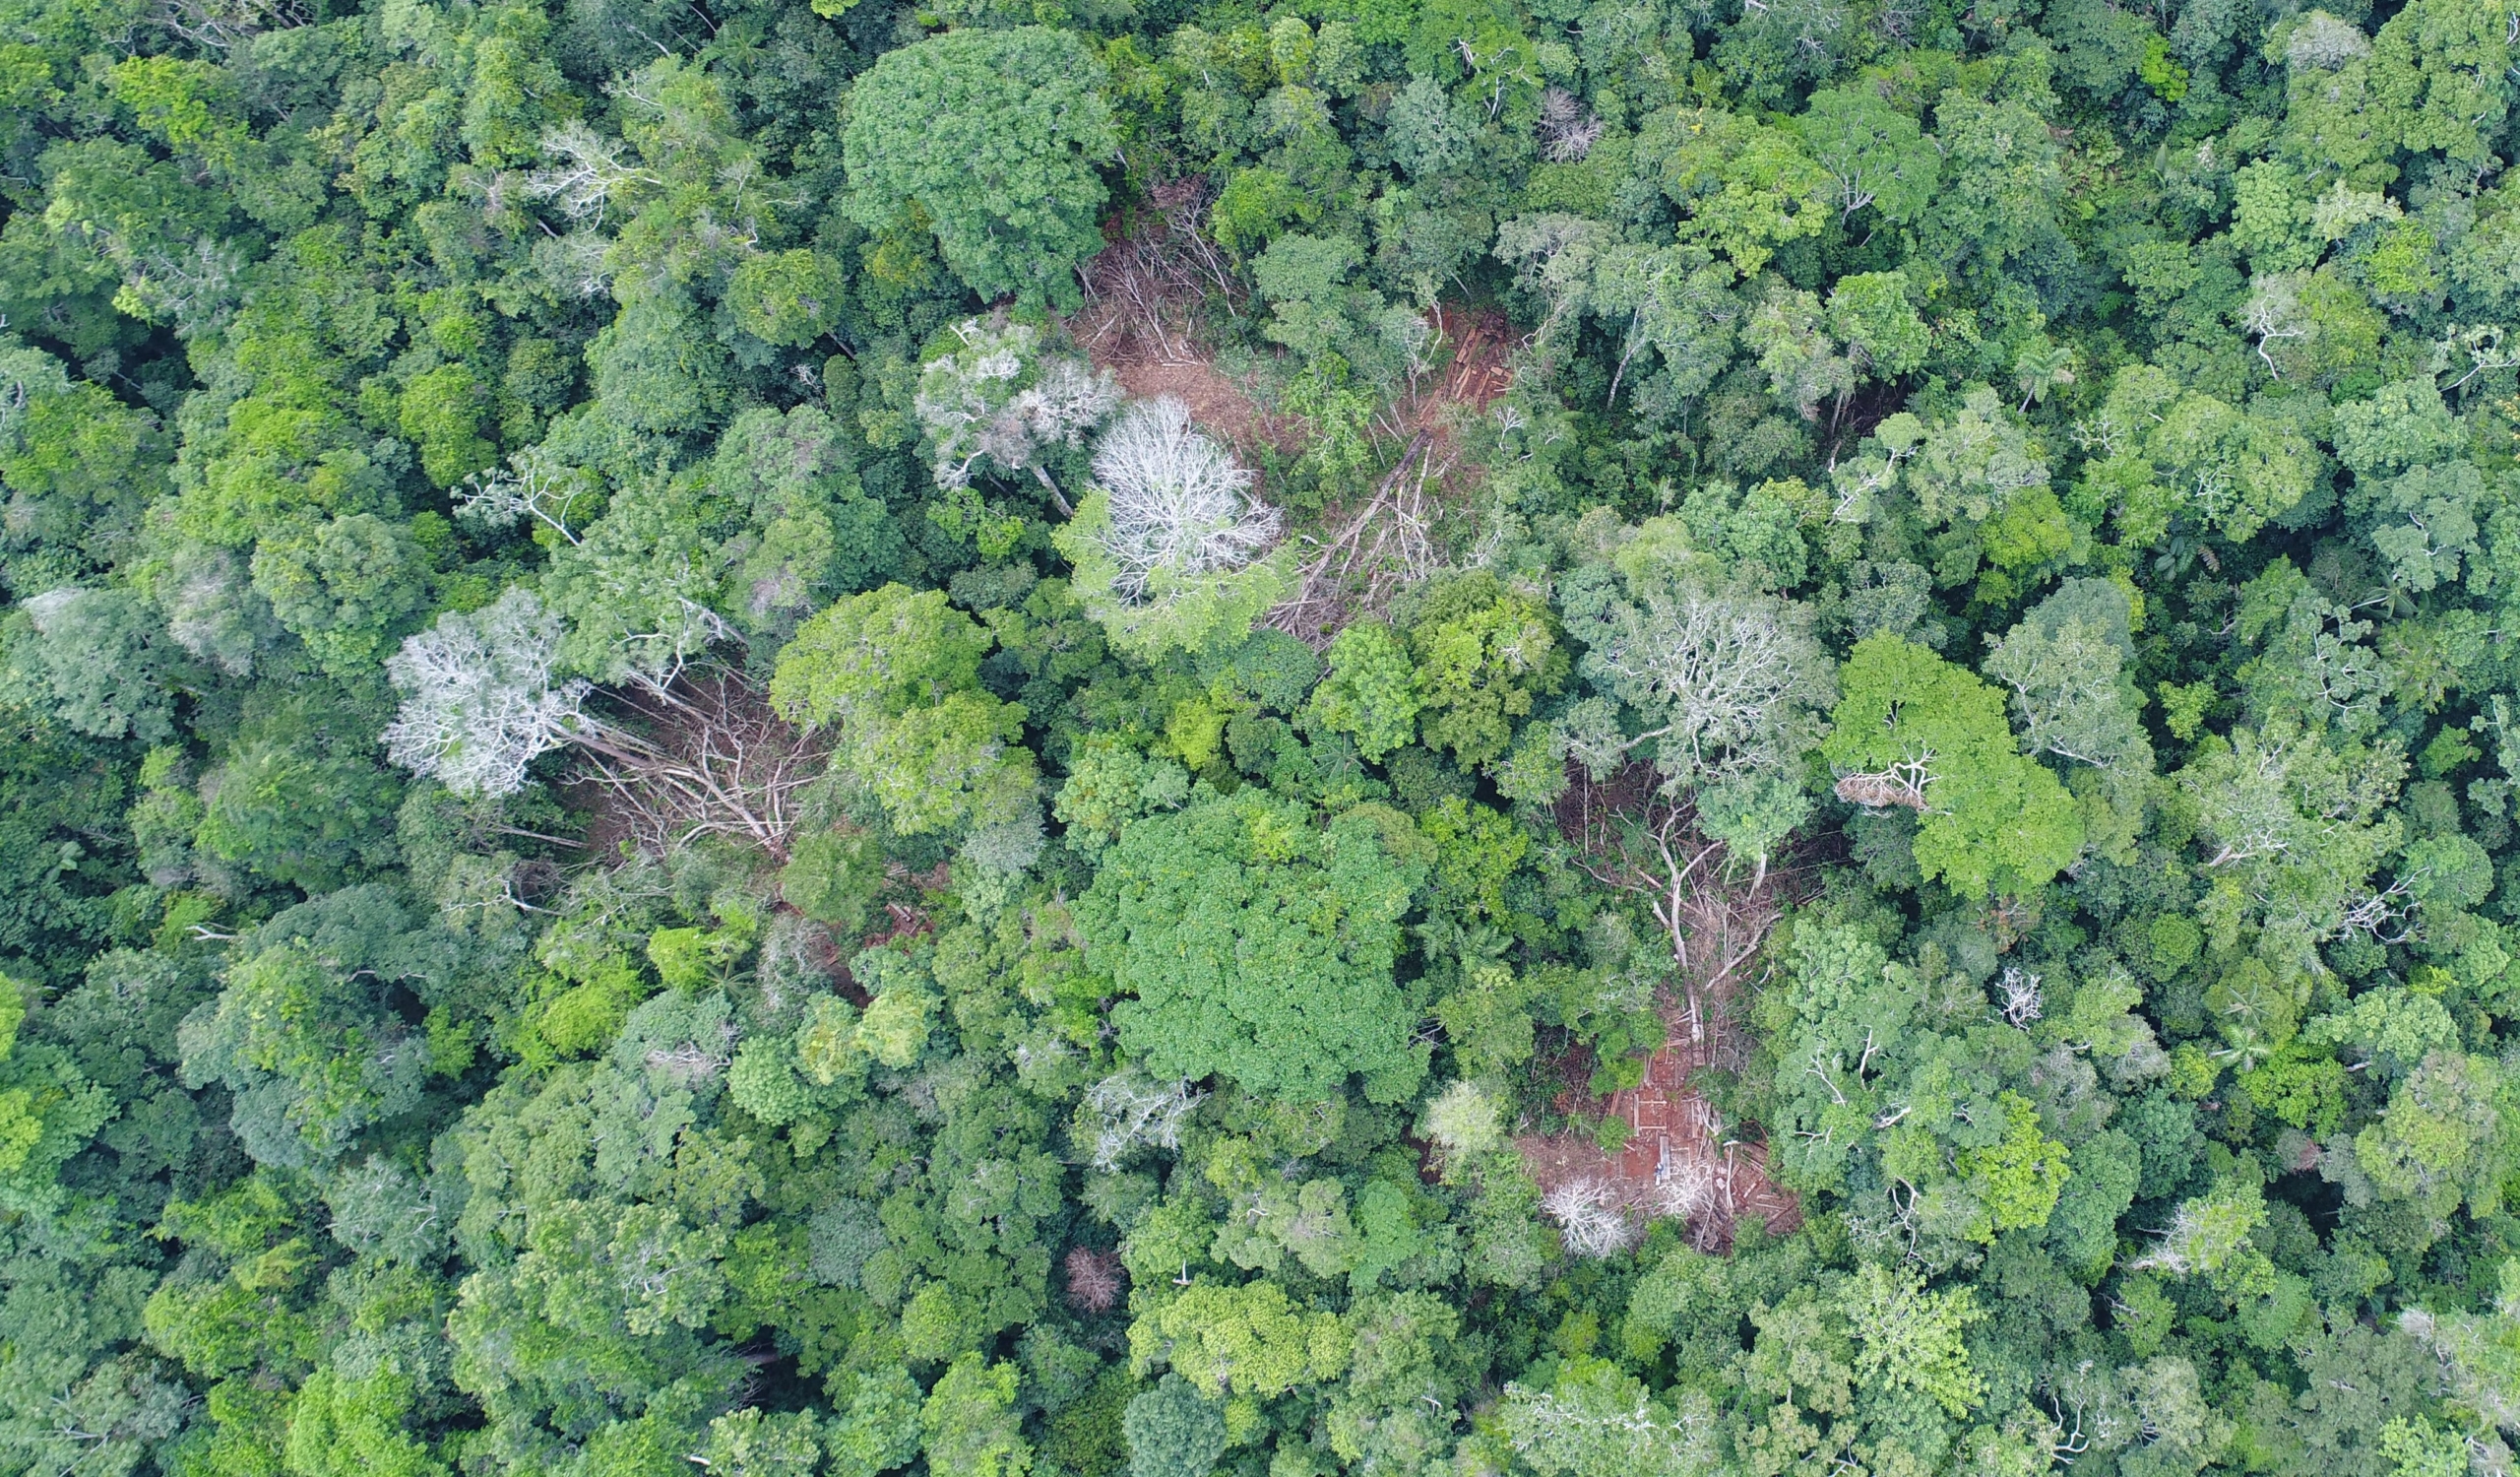
Pariamanu
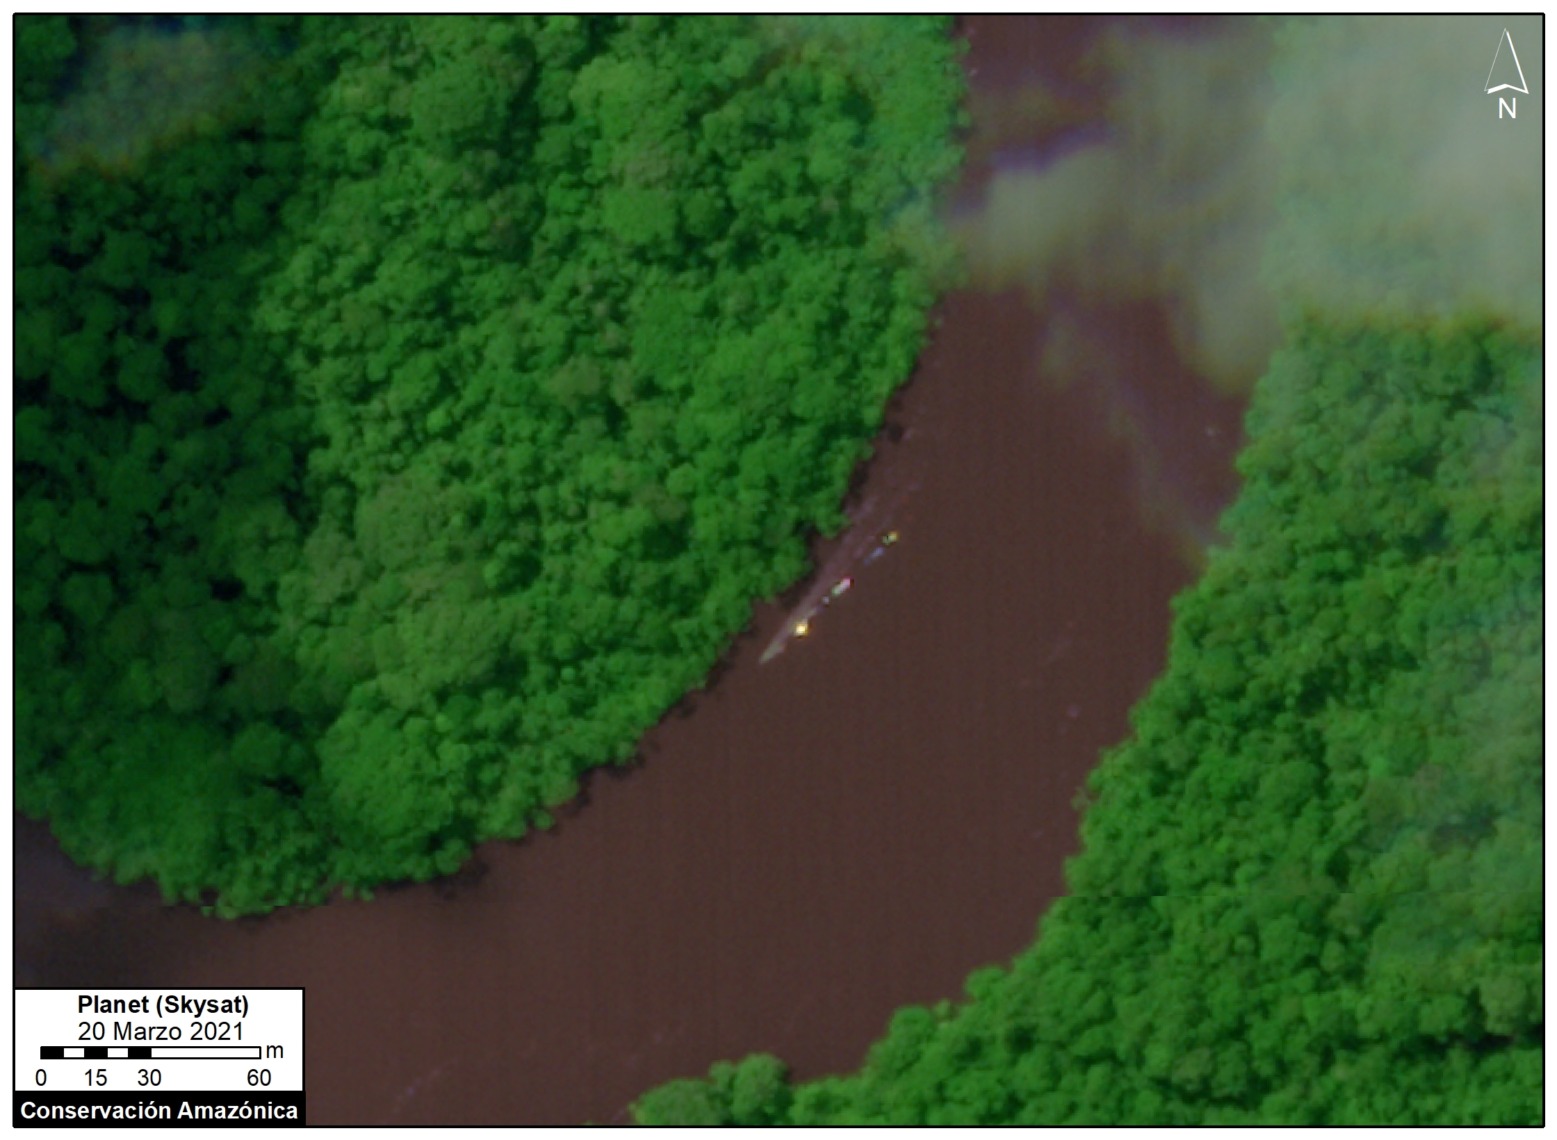
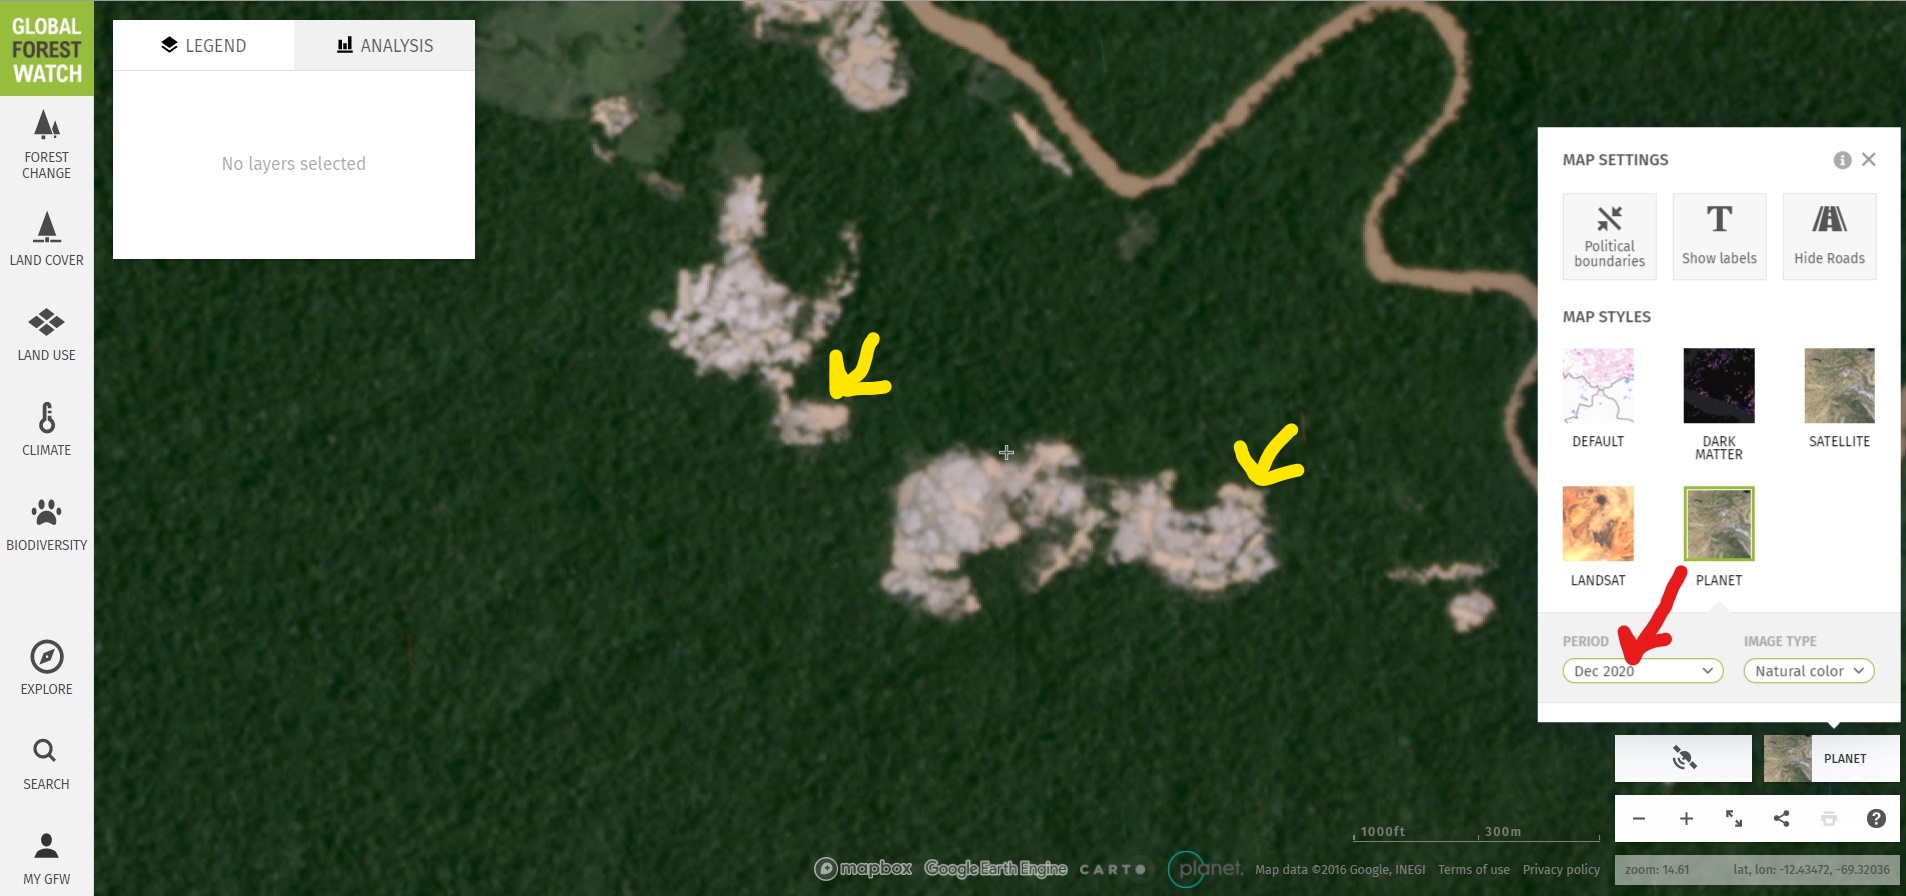
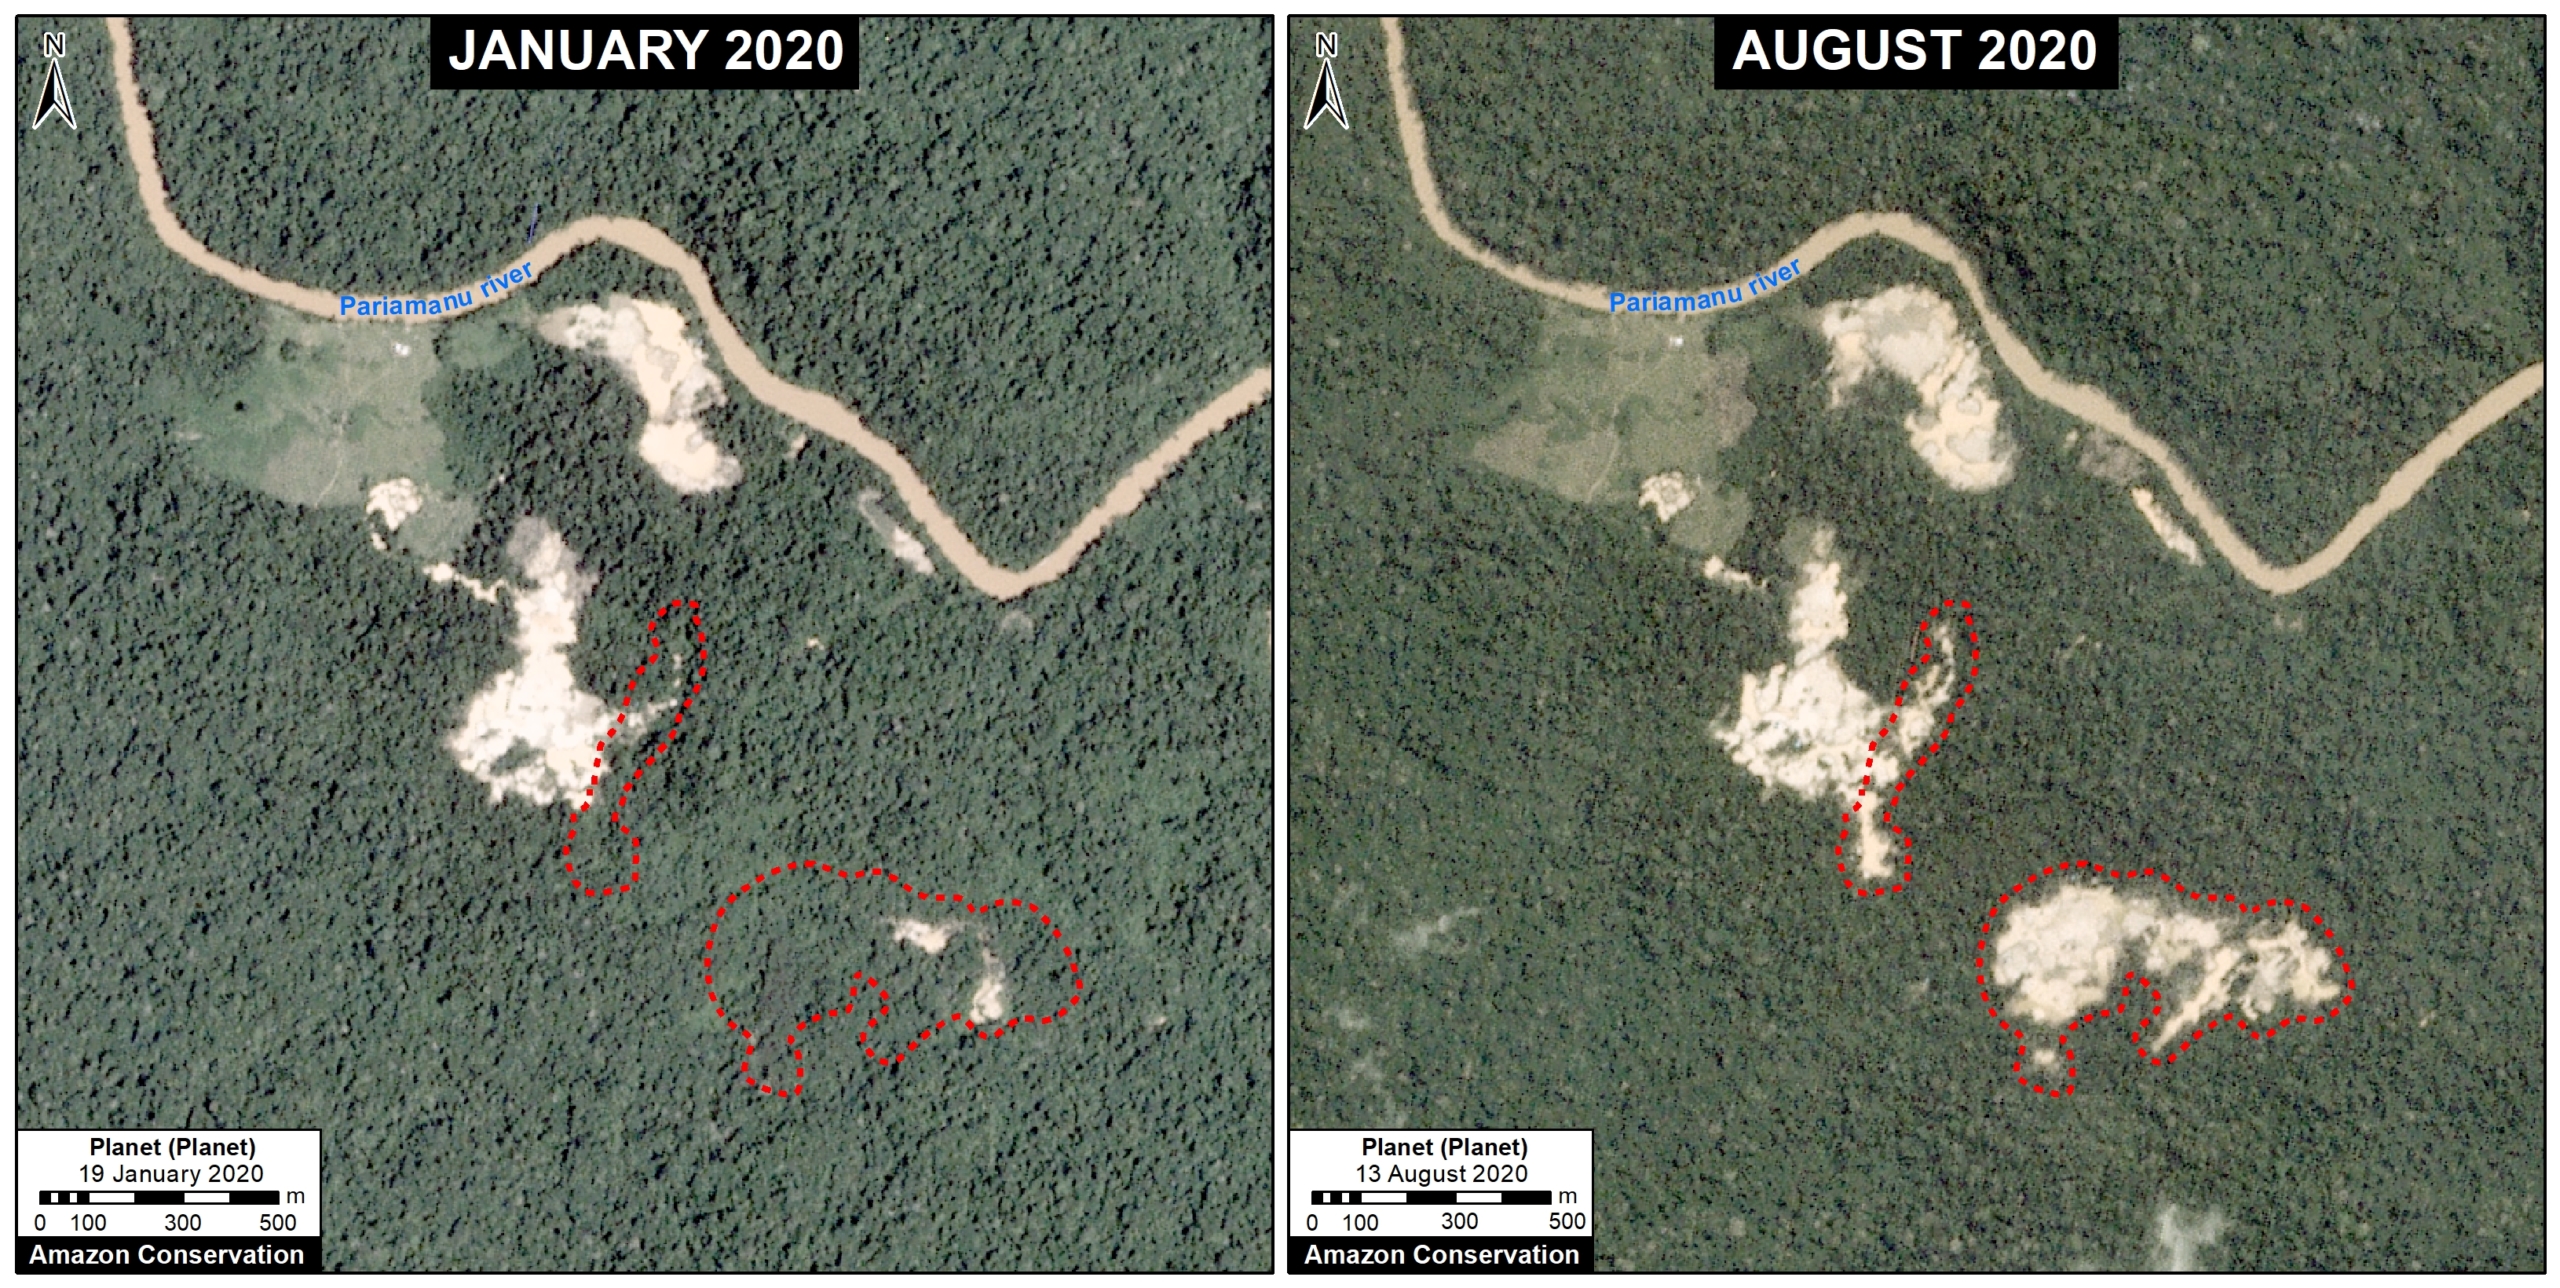
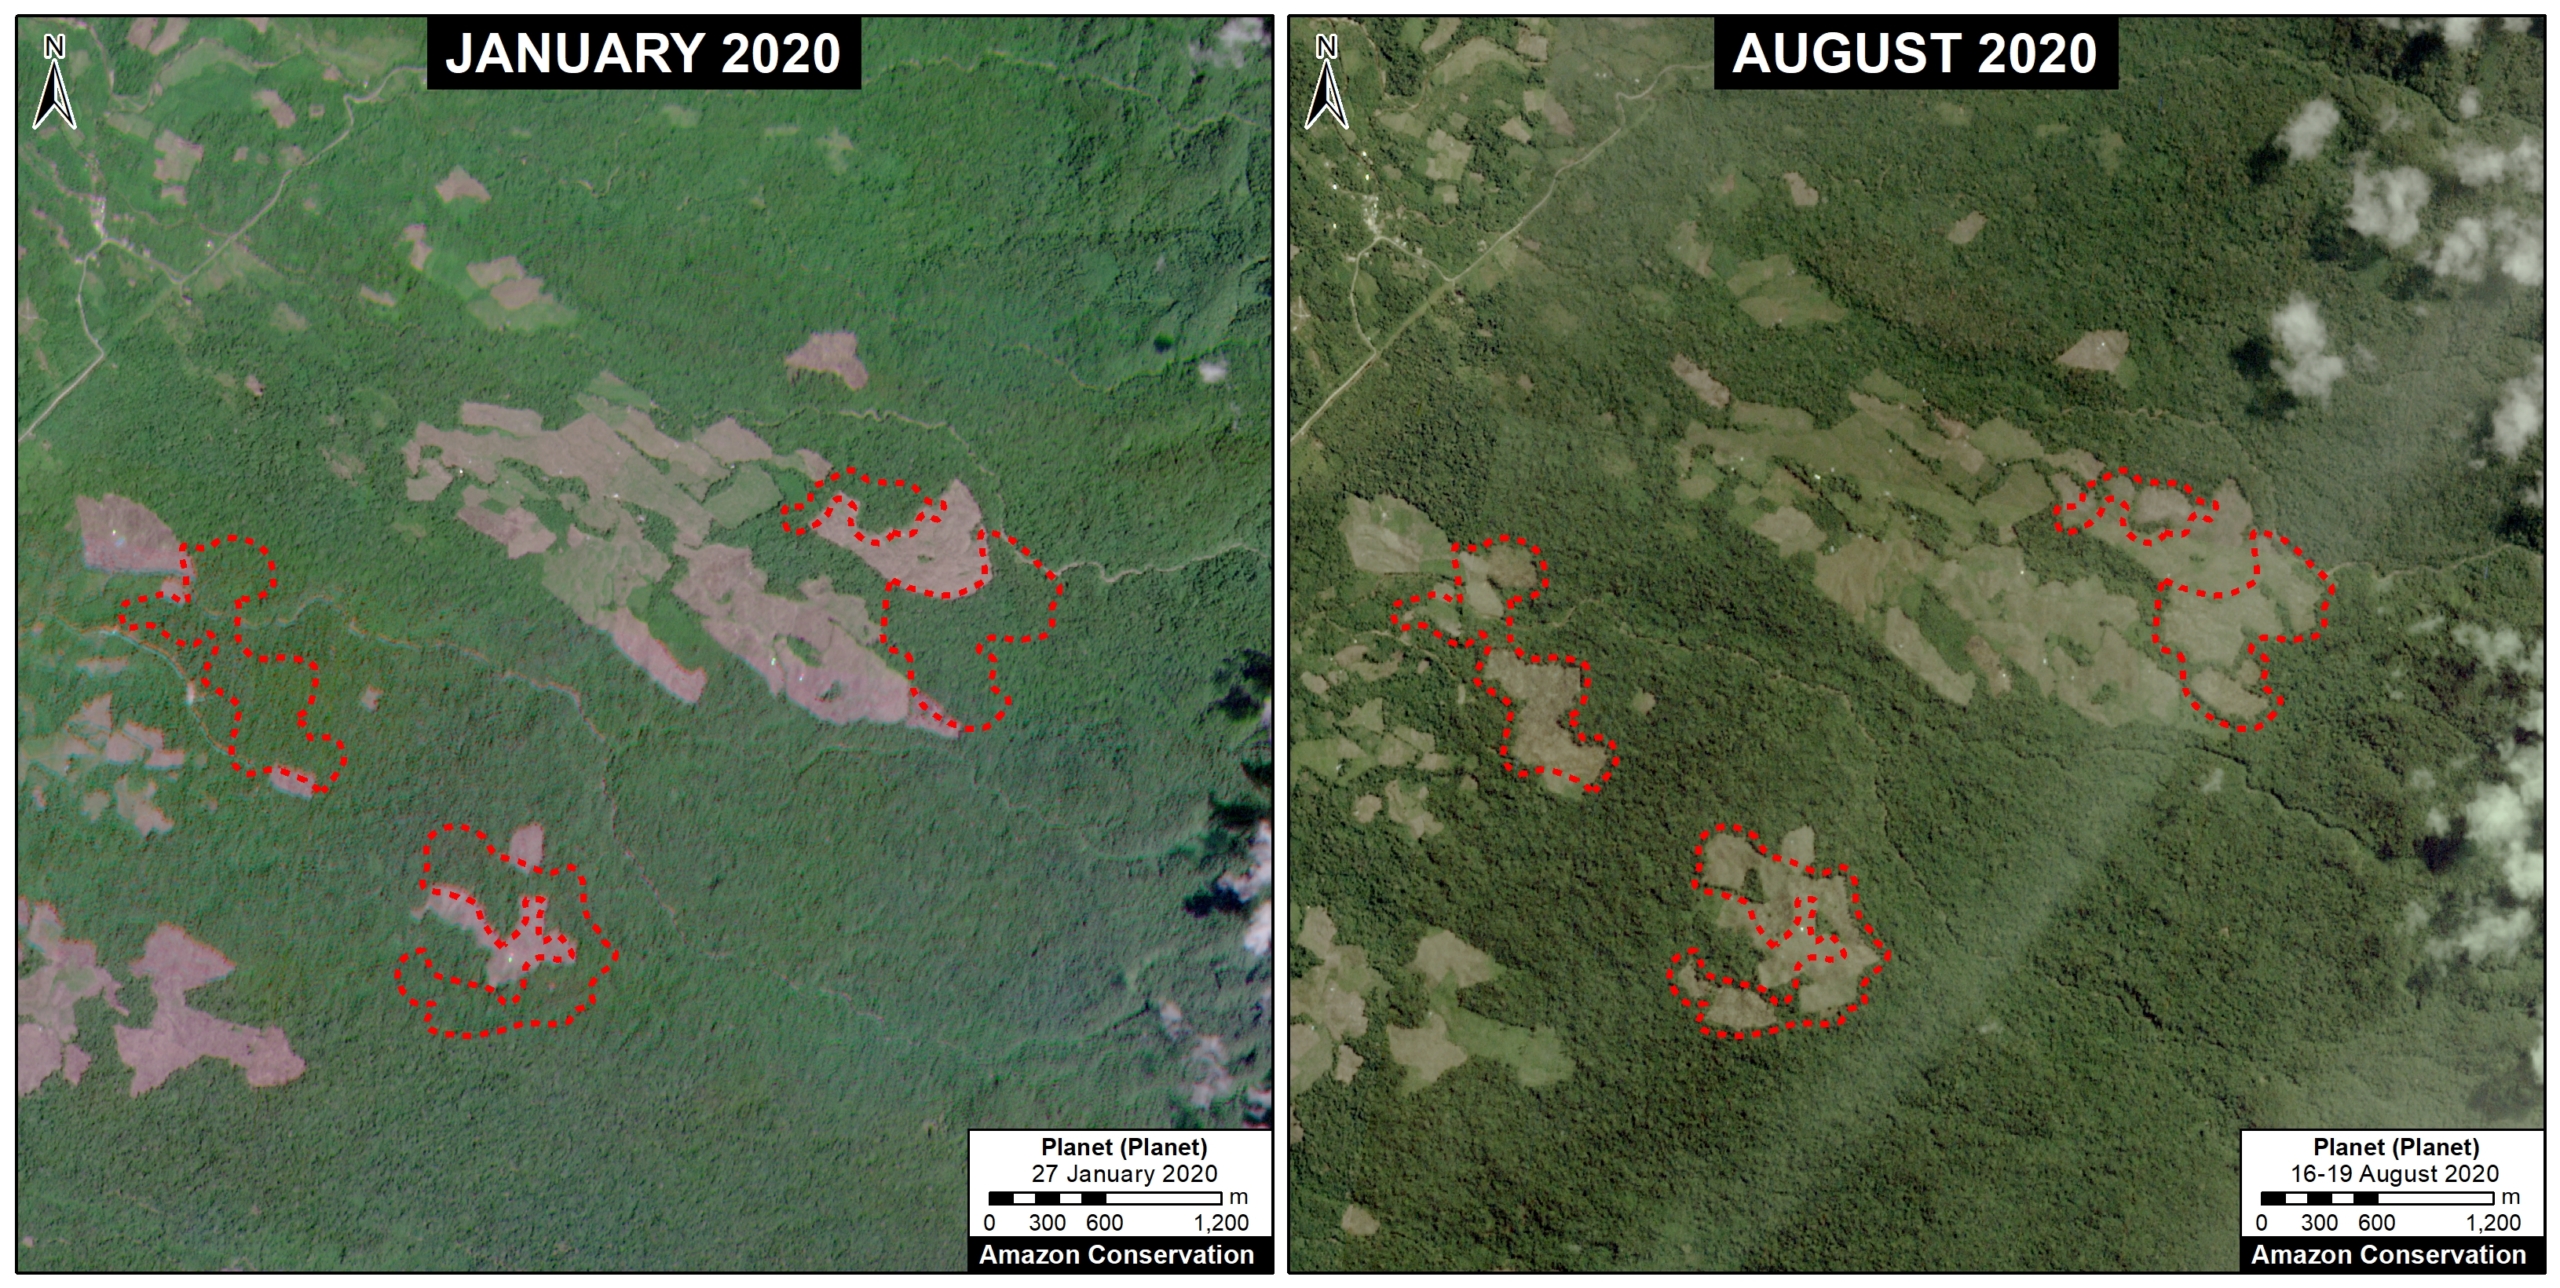
The following two images show the expansion of new gold mining areas into the primary rainforests near the Pariamanu River (Madre de Dios region).
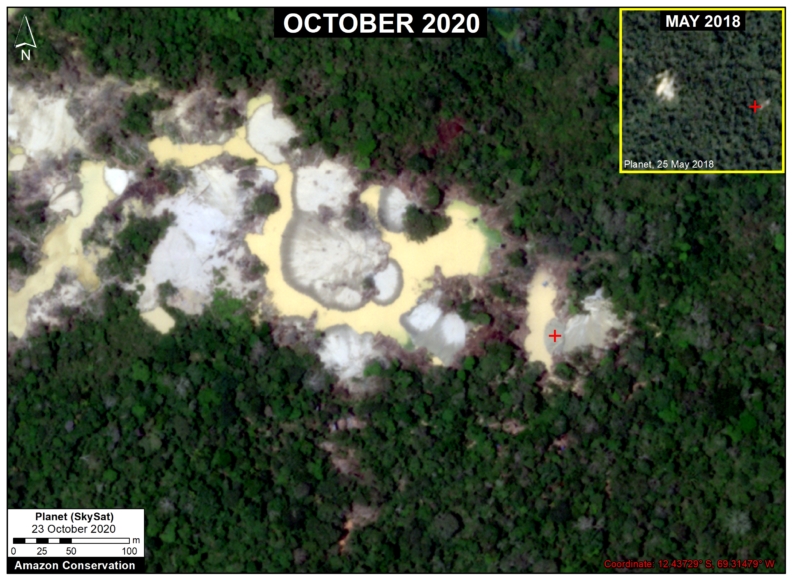
Image 2. Expansion of new gold mining areas into the primary rainforests near the Pariamanu River (Madre de Dios region). Data: Planet.
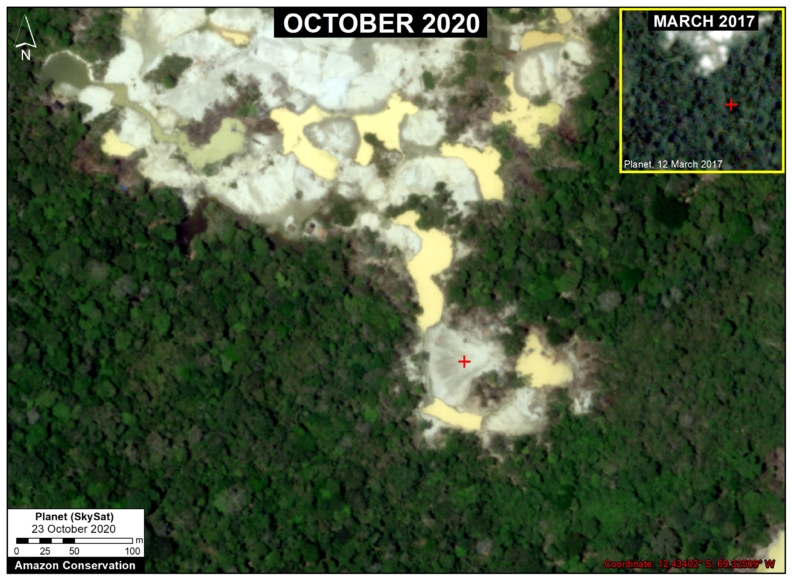
Image 3. Expansion of new gold mining areas into the primary rainforests near the Pariamanu River (Madre de Dios region). Data: Planet.
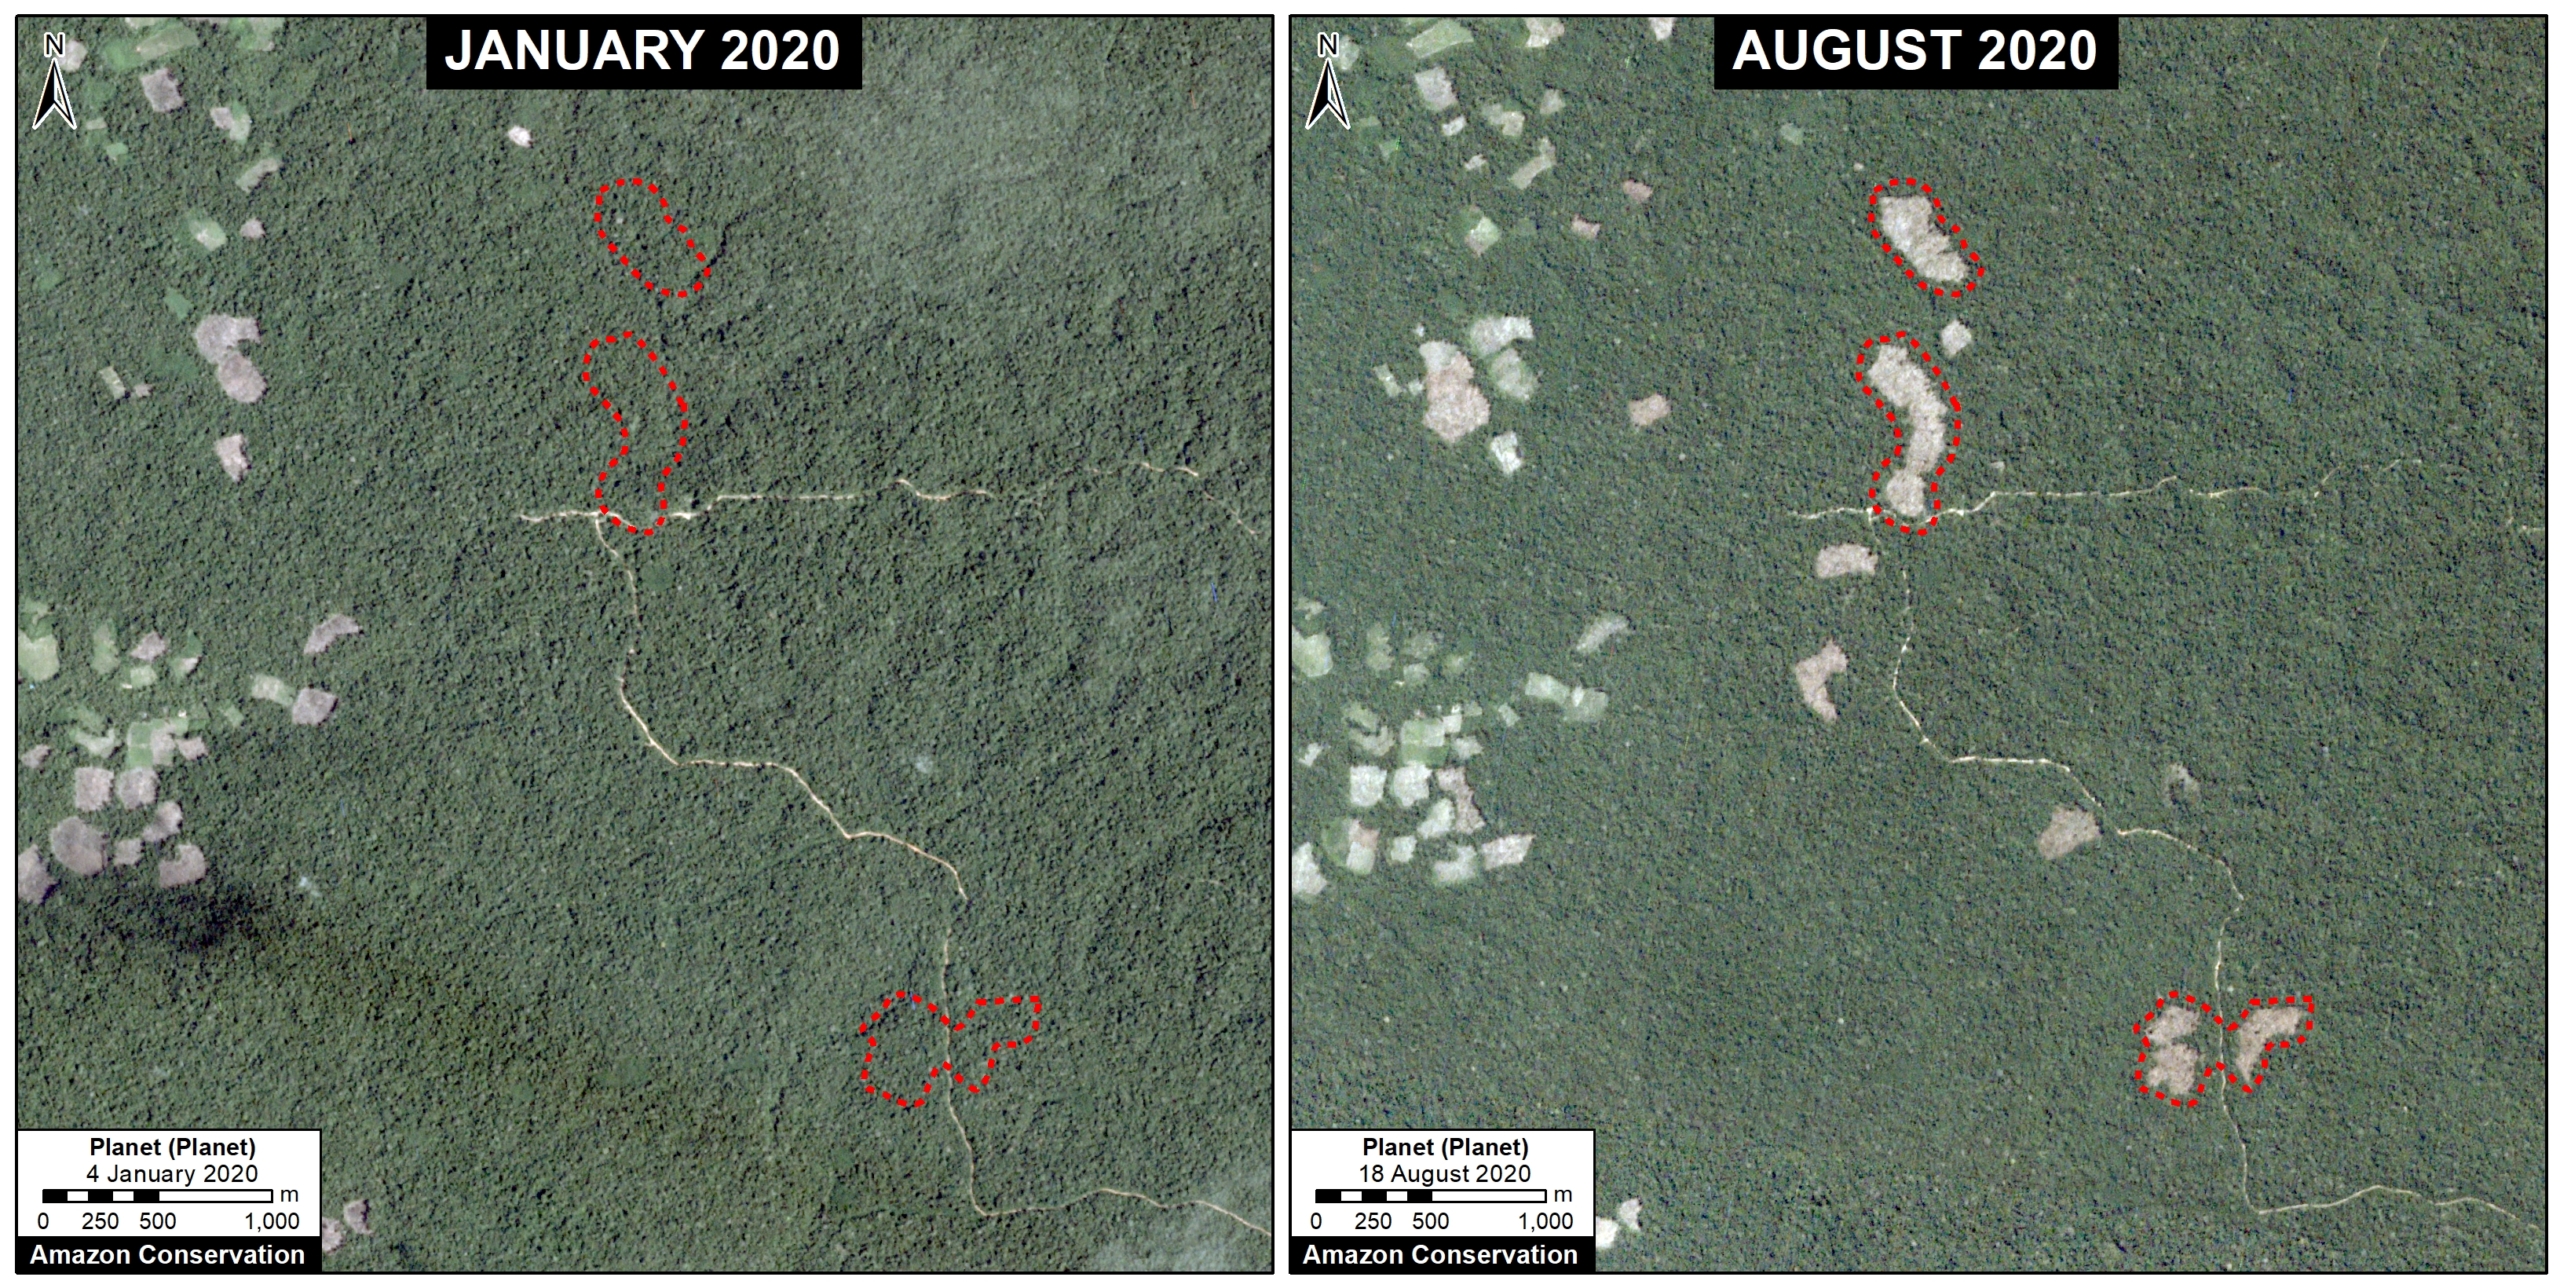
La Pampa
The following image shows the expansion of a new gold mining area in the northern part of La Pampa.
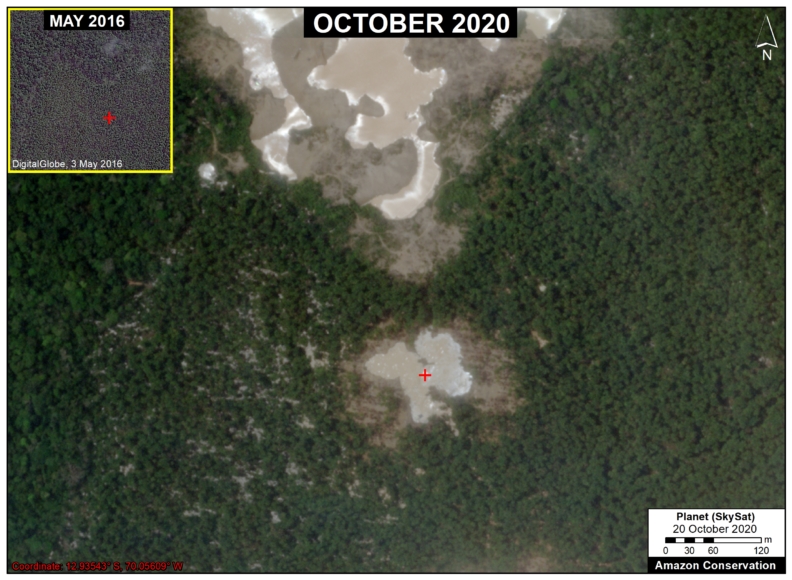
Image 4. Expansion of a new mining area in the northern part of La Pampa (Madre de Dios region). Data: Planet, Maxar.
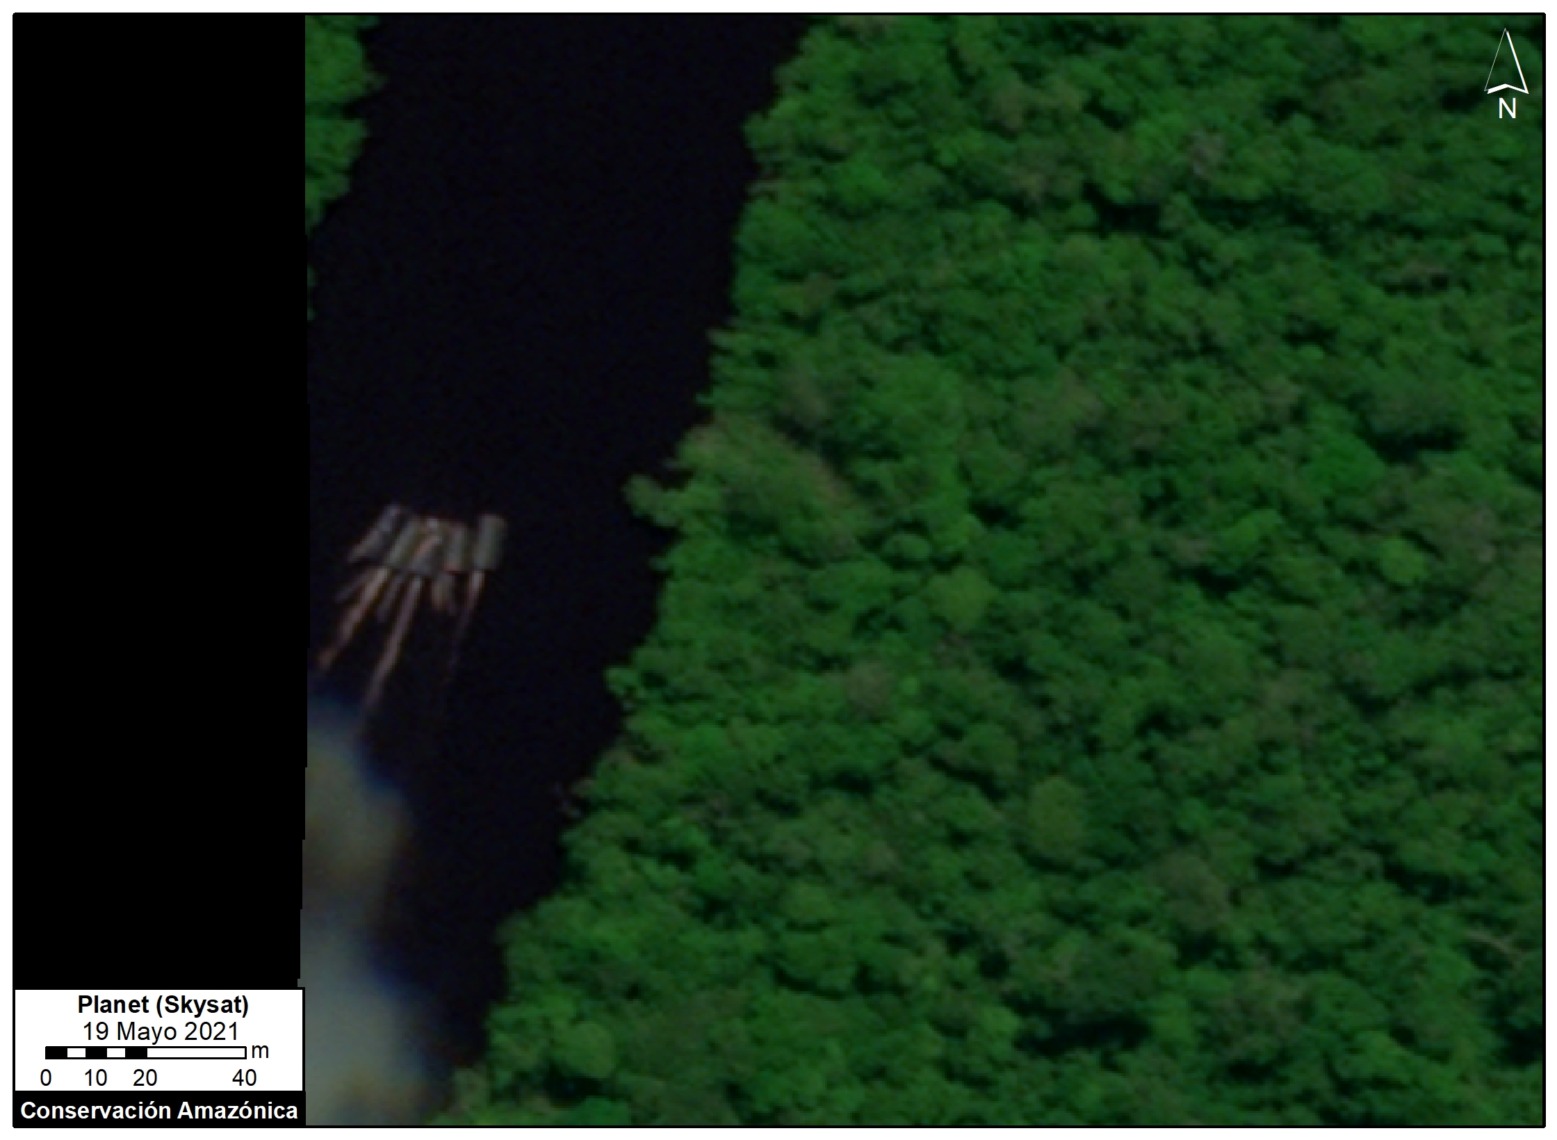
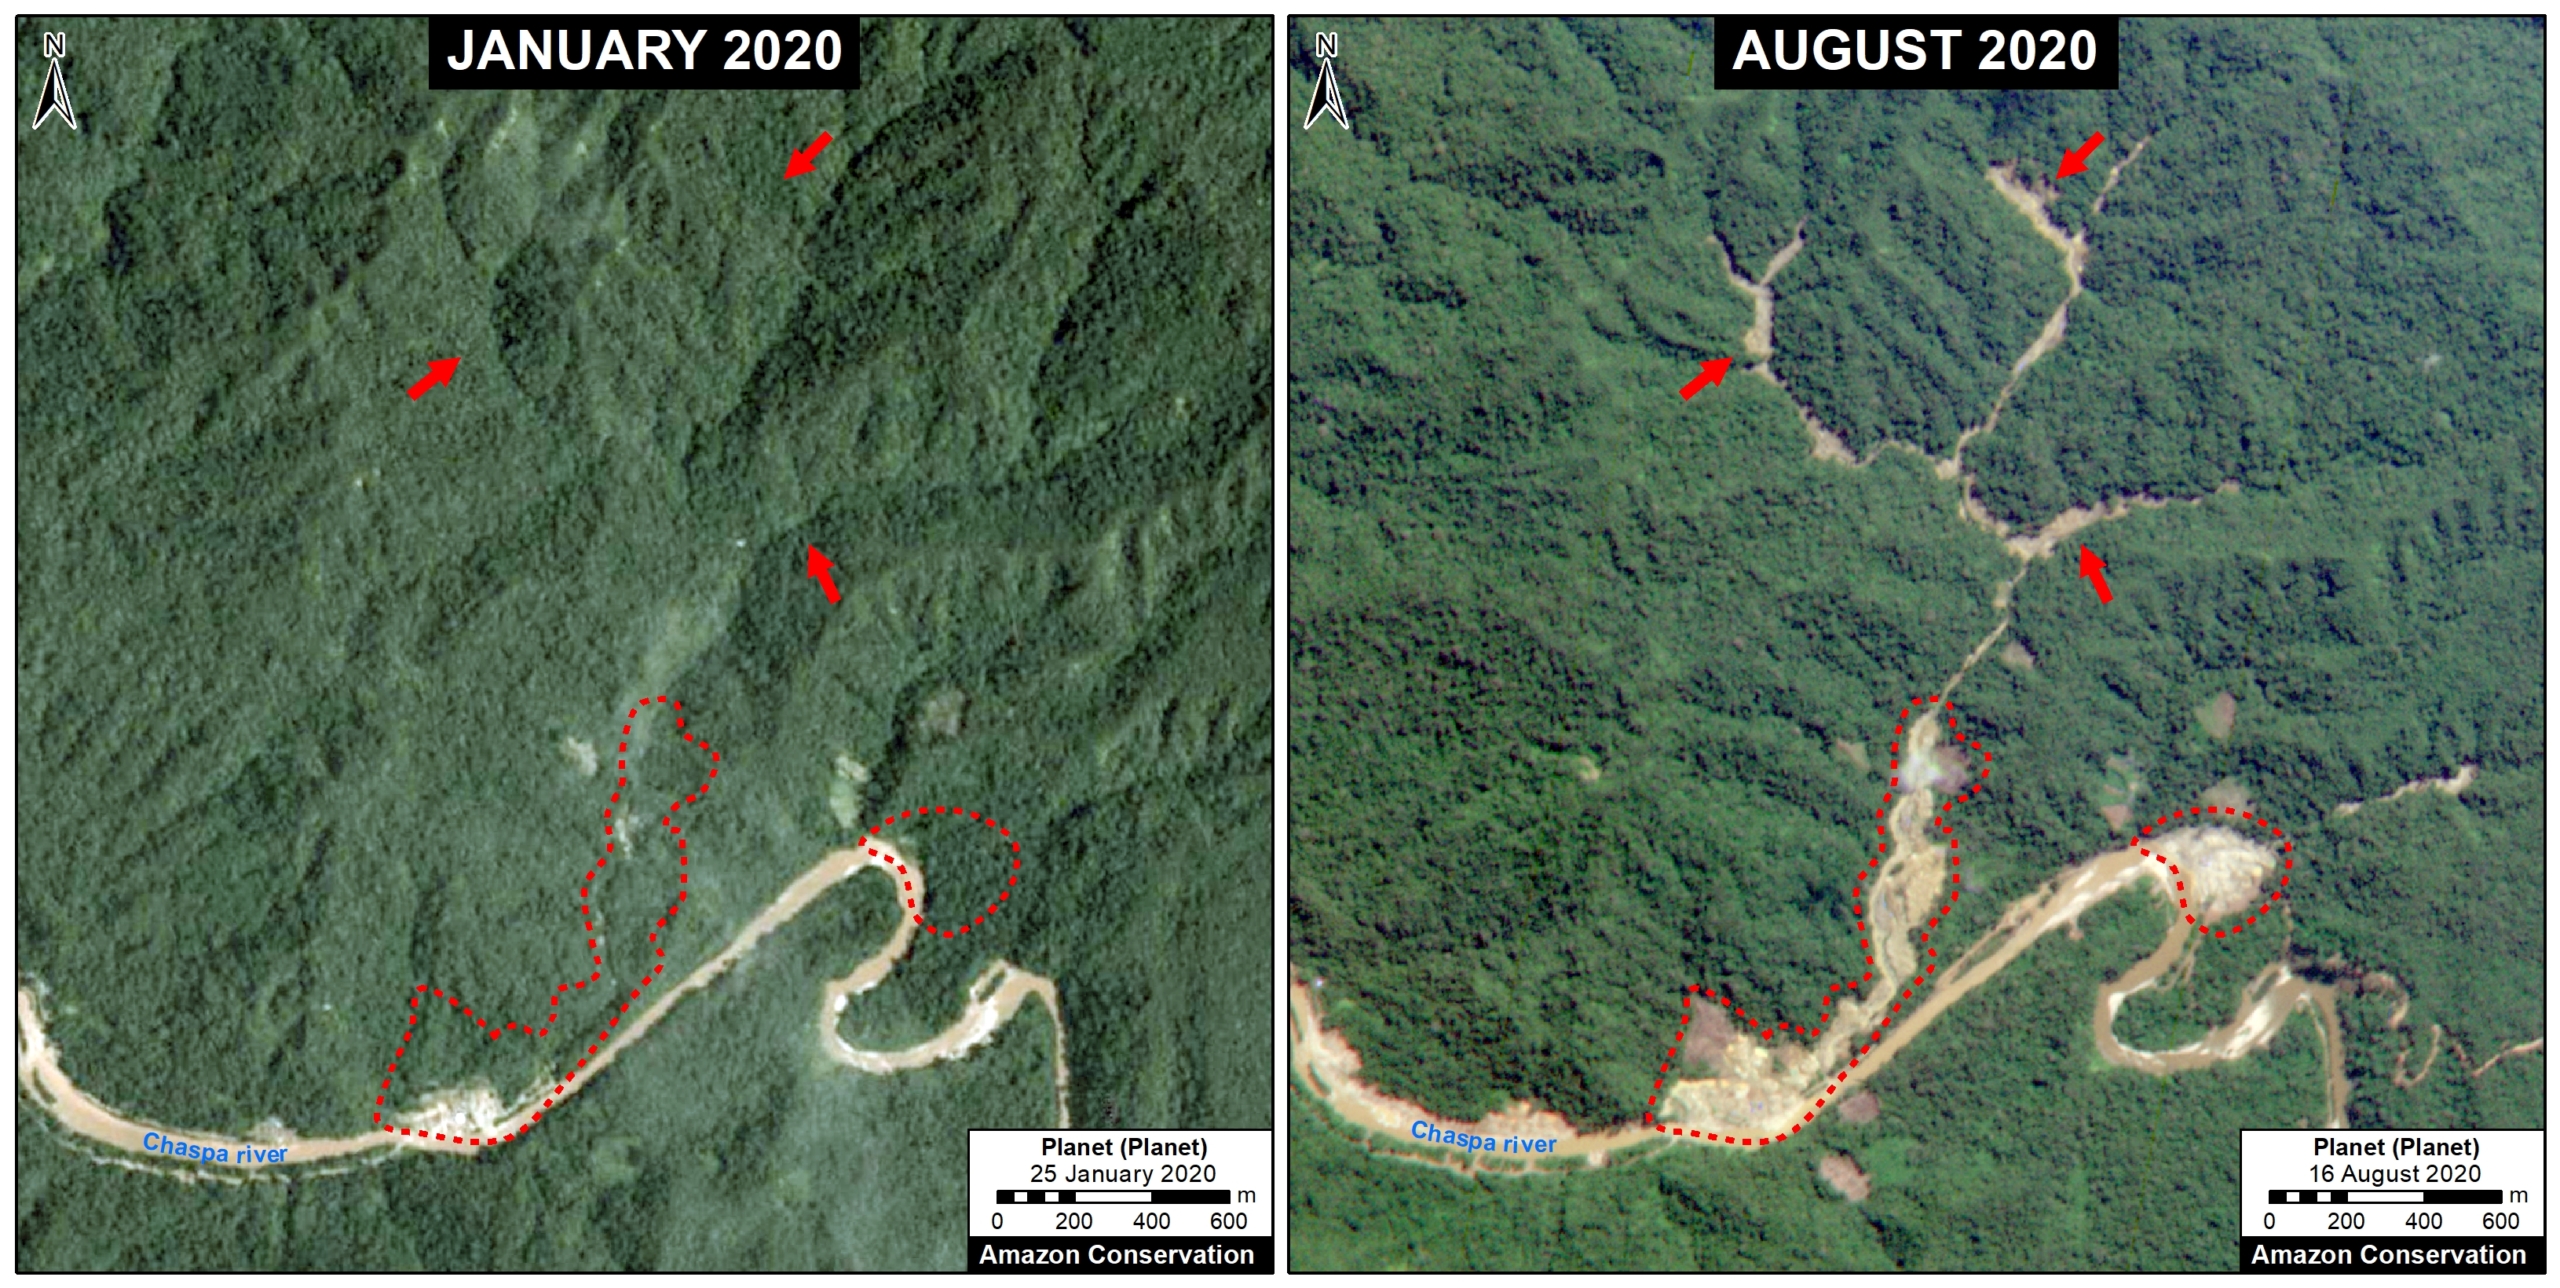
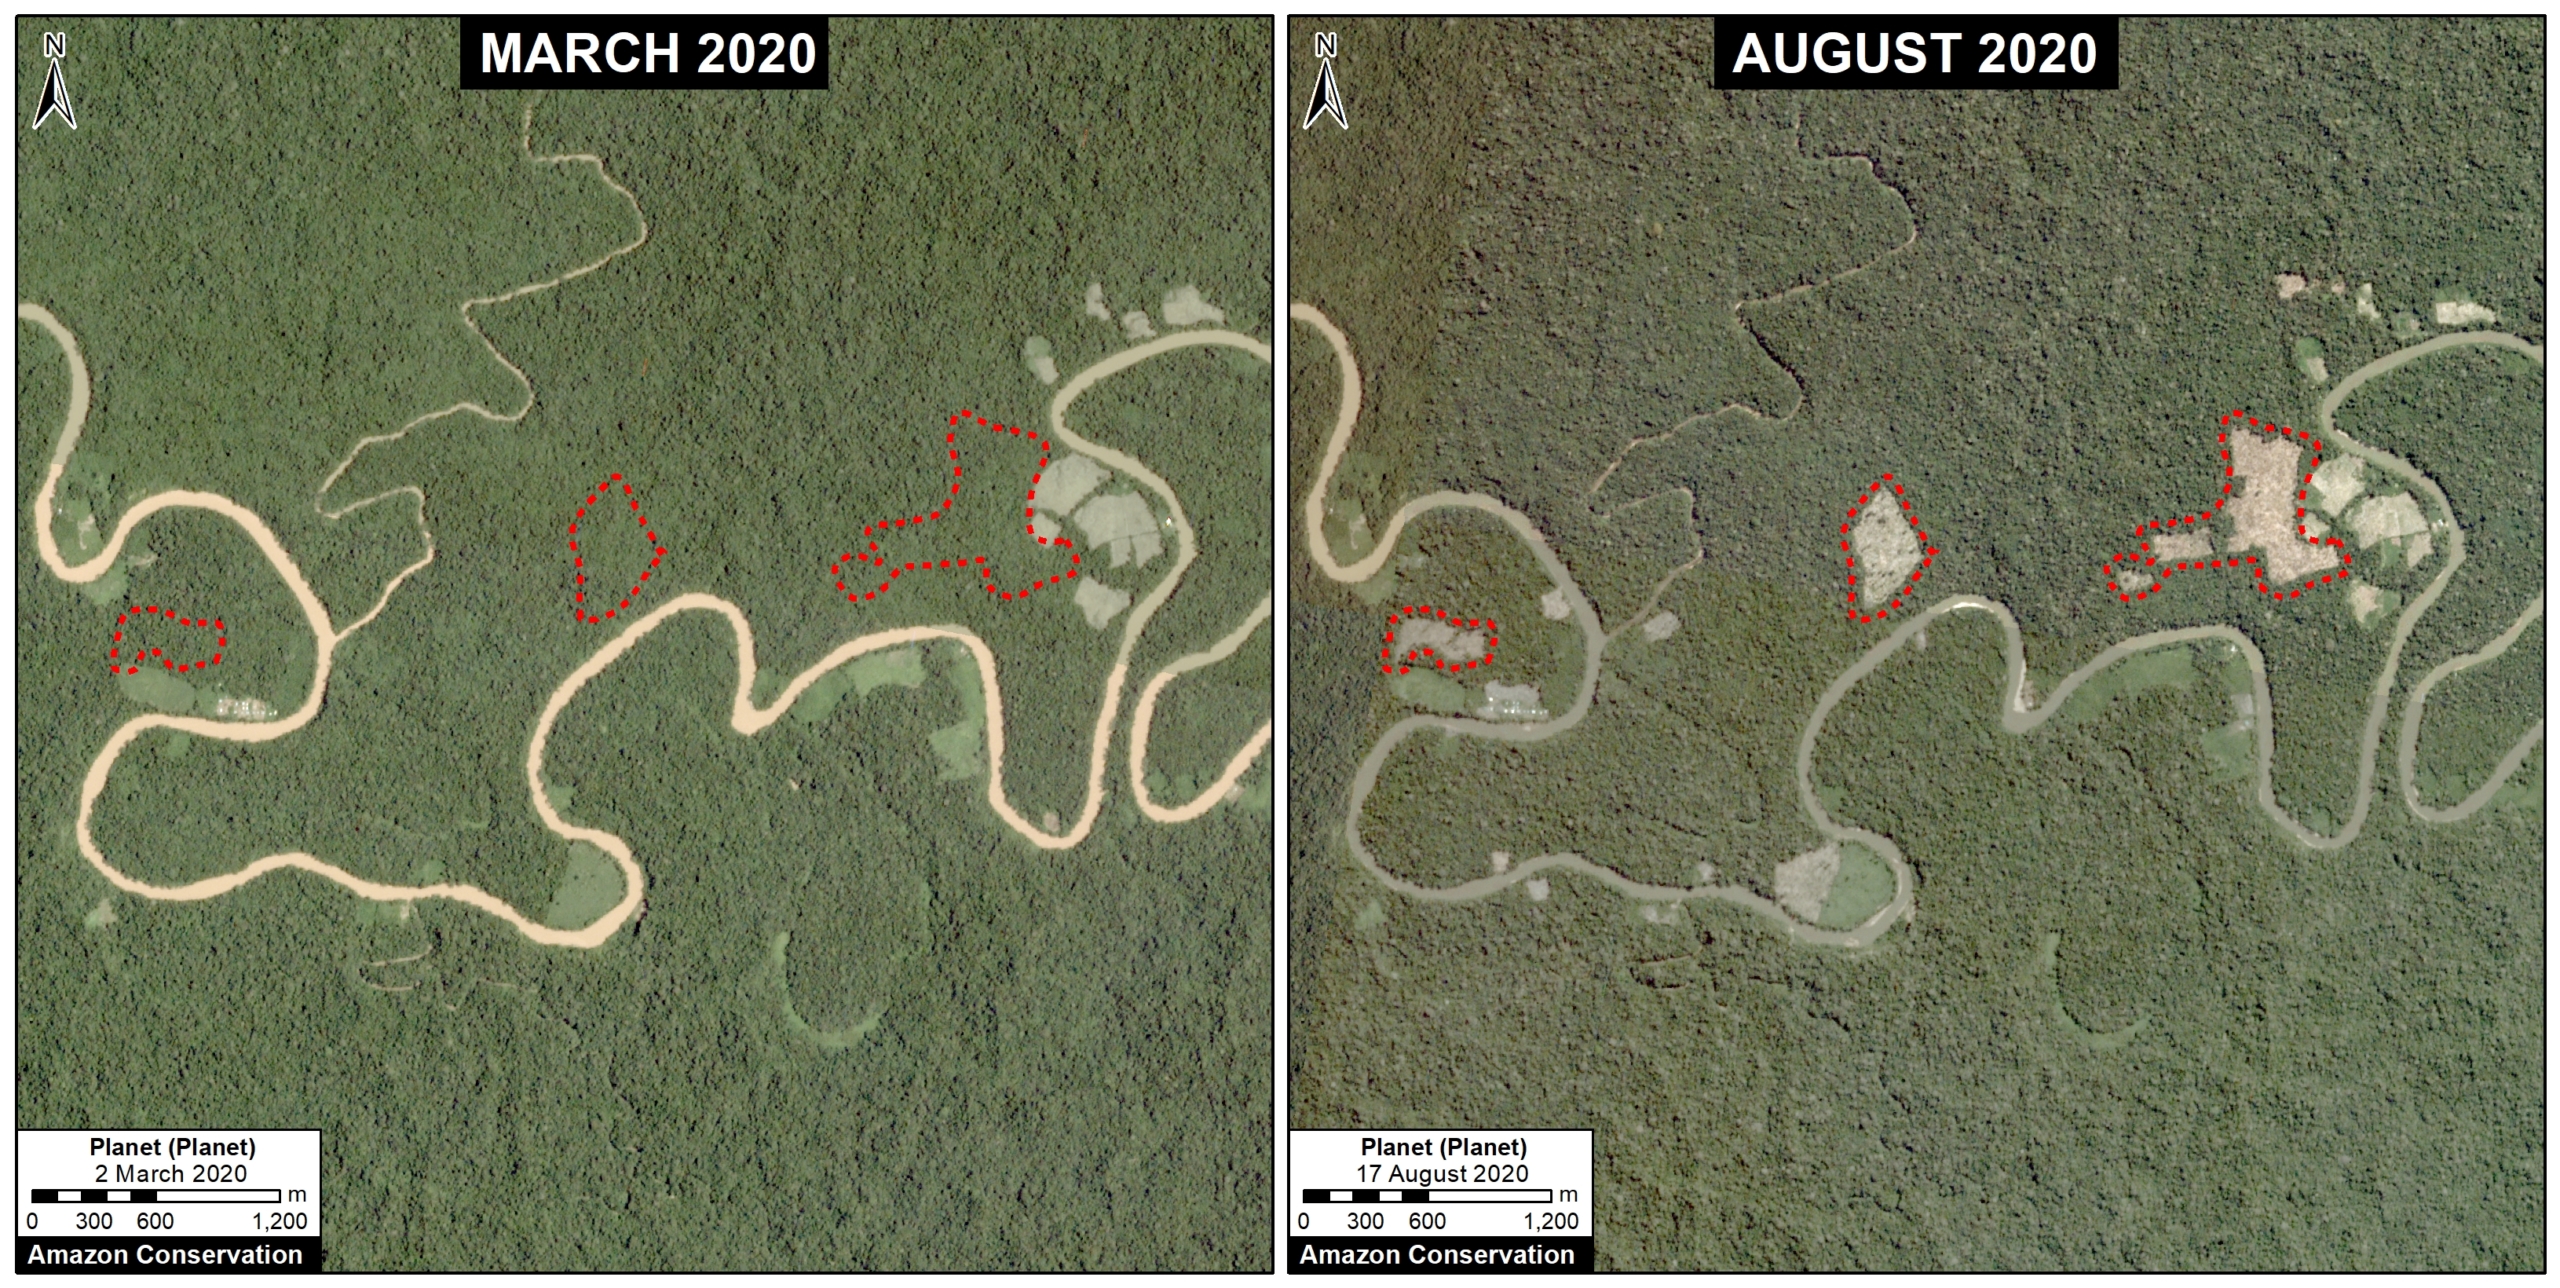
Chaspa
The following image shows the sudden appearance of a new gold mining front along the Chaspa River (Puno region).
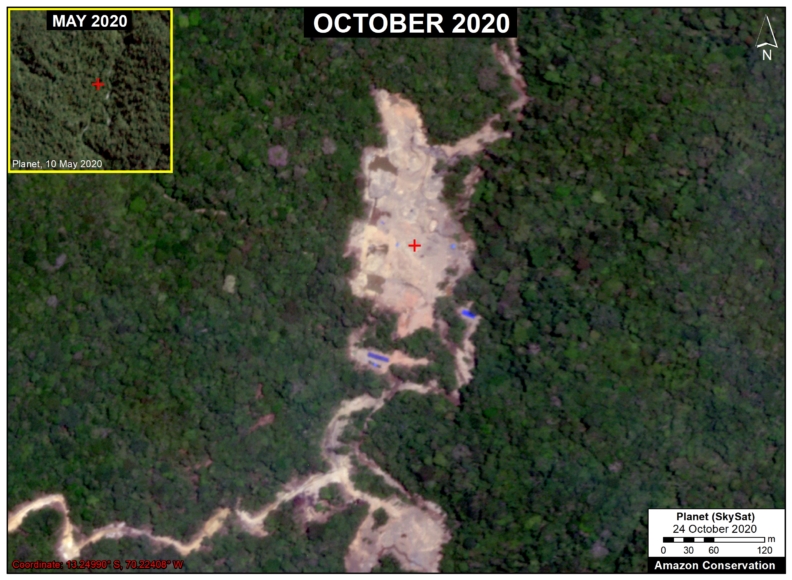
Image 5. New gold mining front along the Chaspa River (Puno region). Data: Planet (Skysat).
Camanti
The following image shows the recent expansion of gold mining deforestation in the buffer zone of Amarakaeri Communal Reserve (Cusco region).
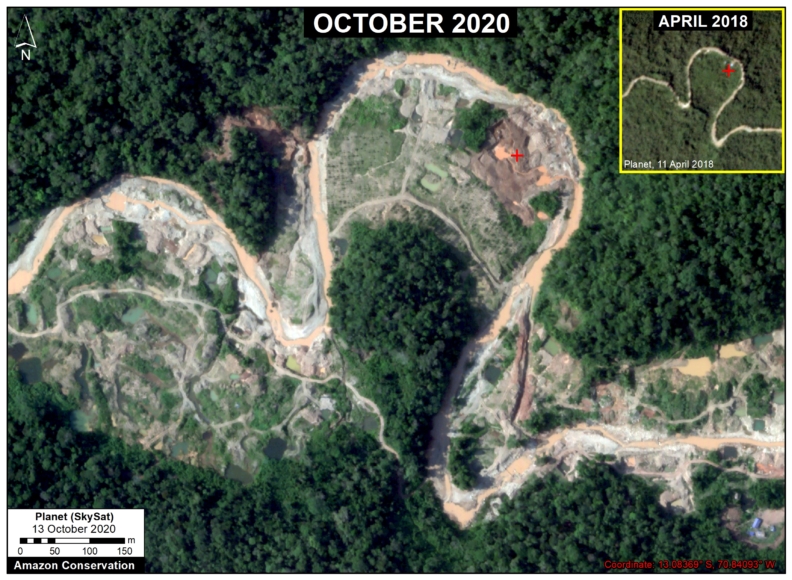
Image 6. Recent expansion of gold mining deforestation in the buffer zone of Amarakaeri Communal Reserve (Cusco region). Data: Planet (Skysat).
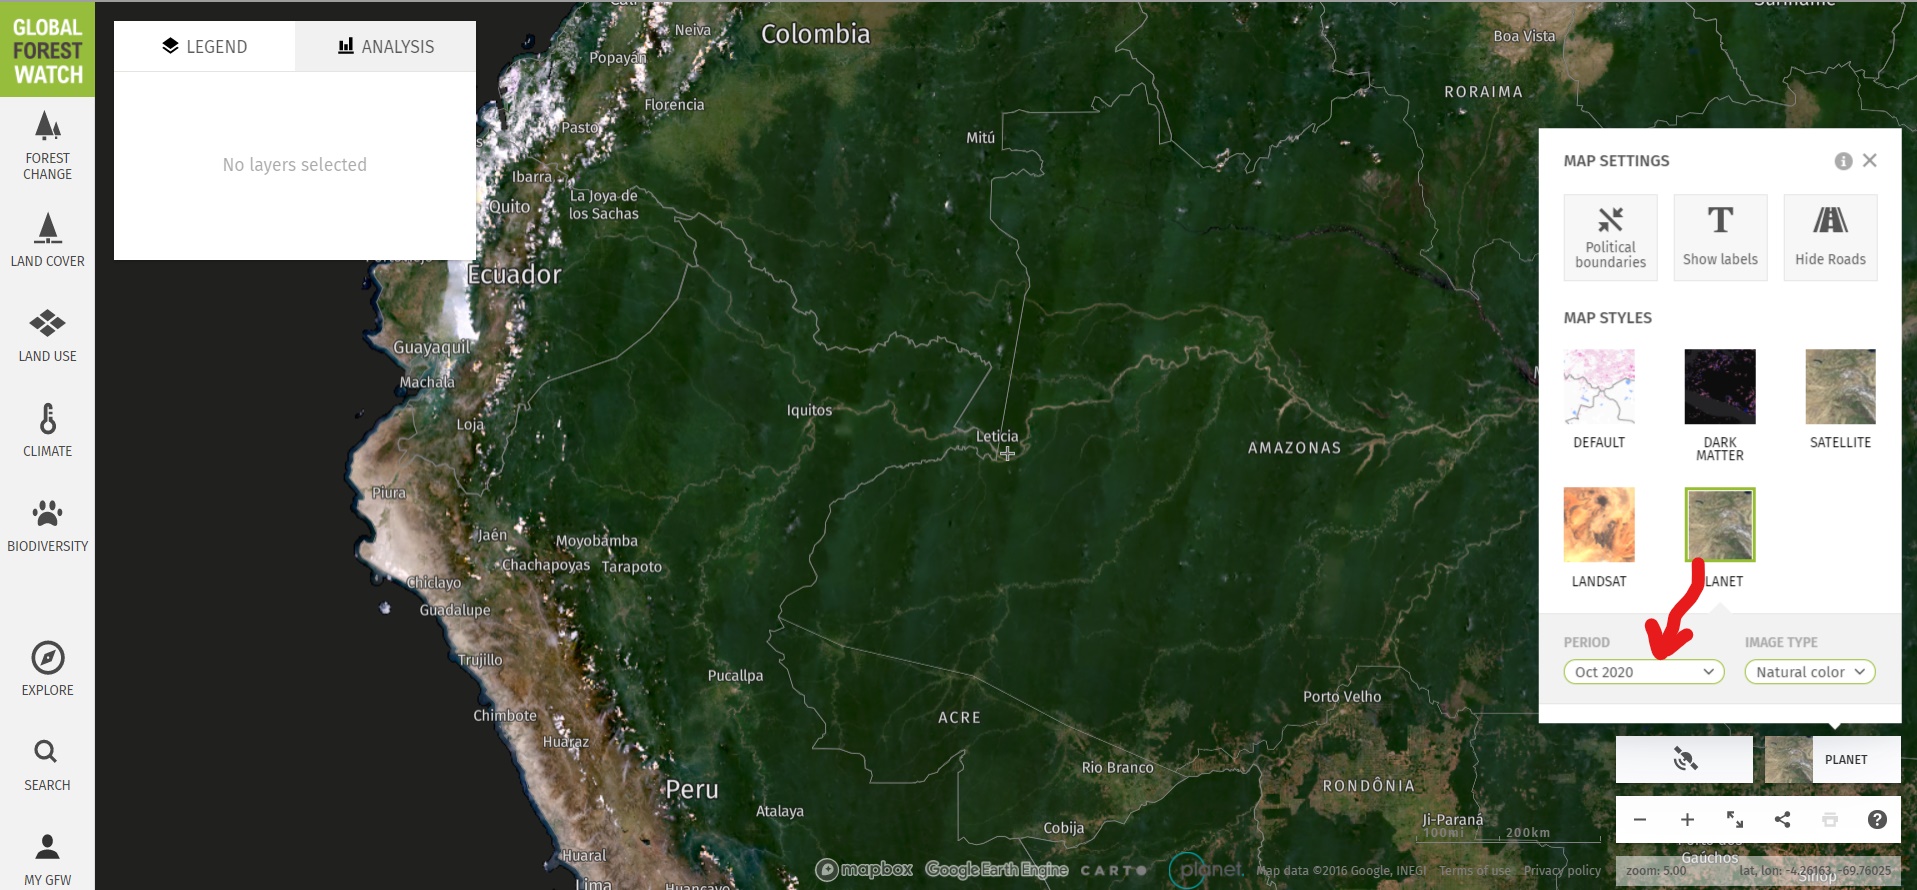
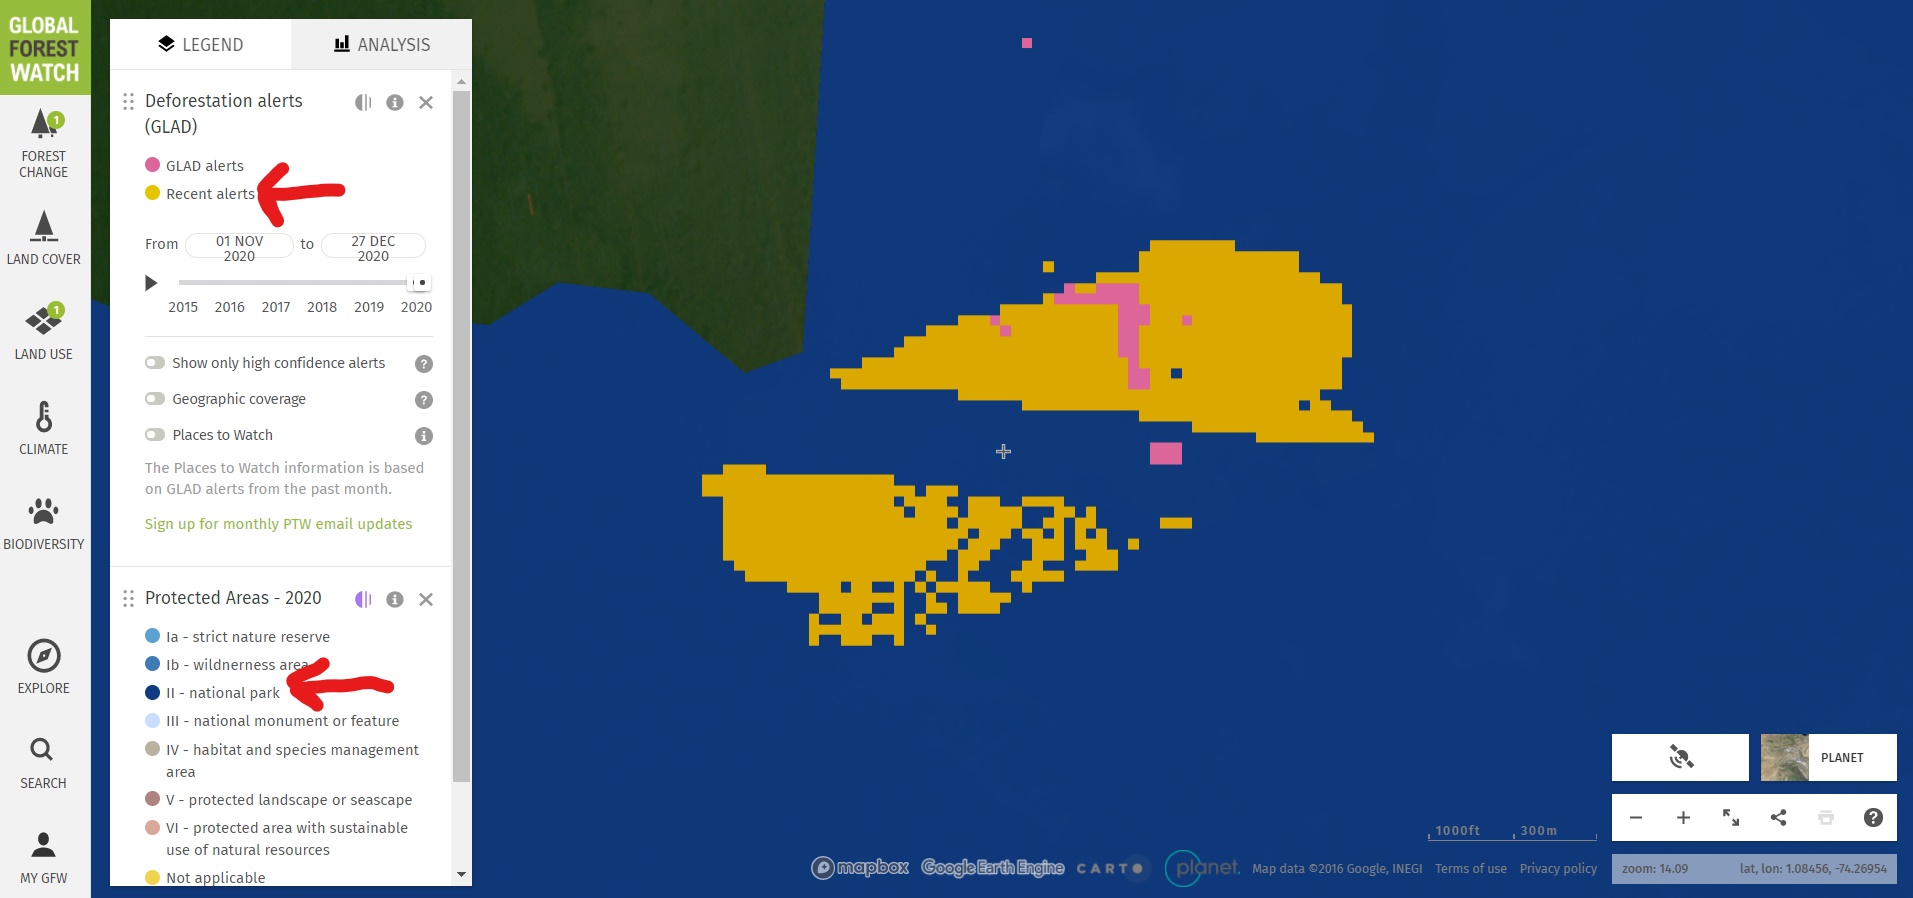
Methodology
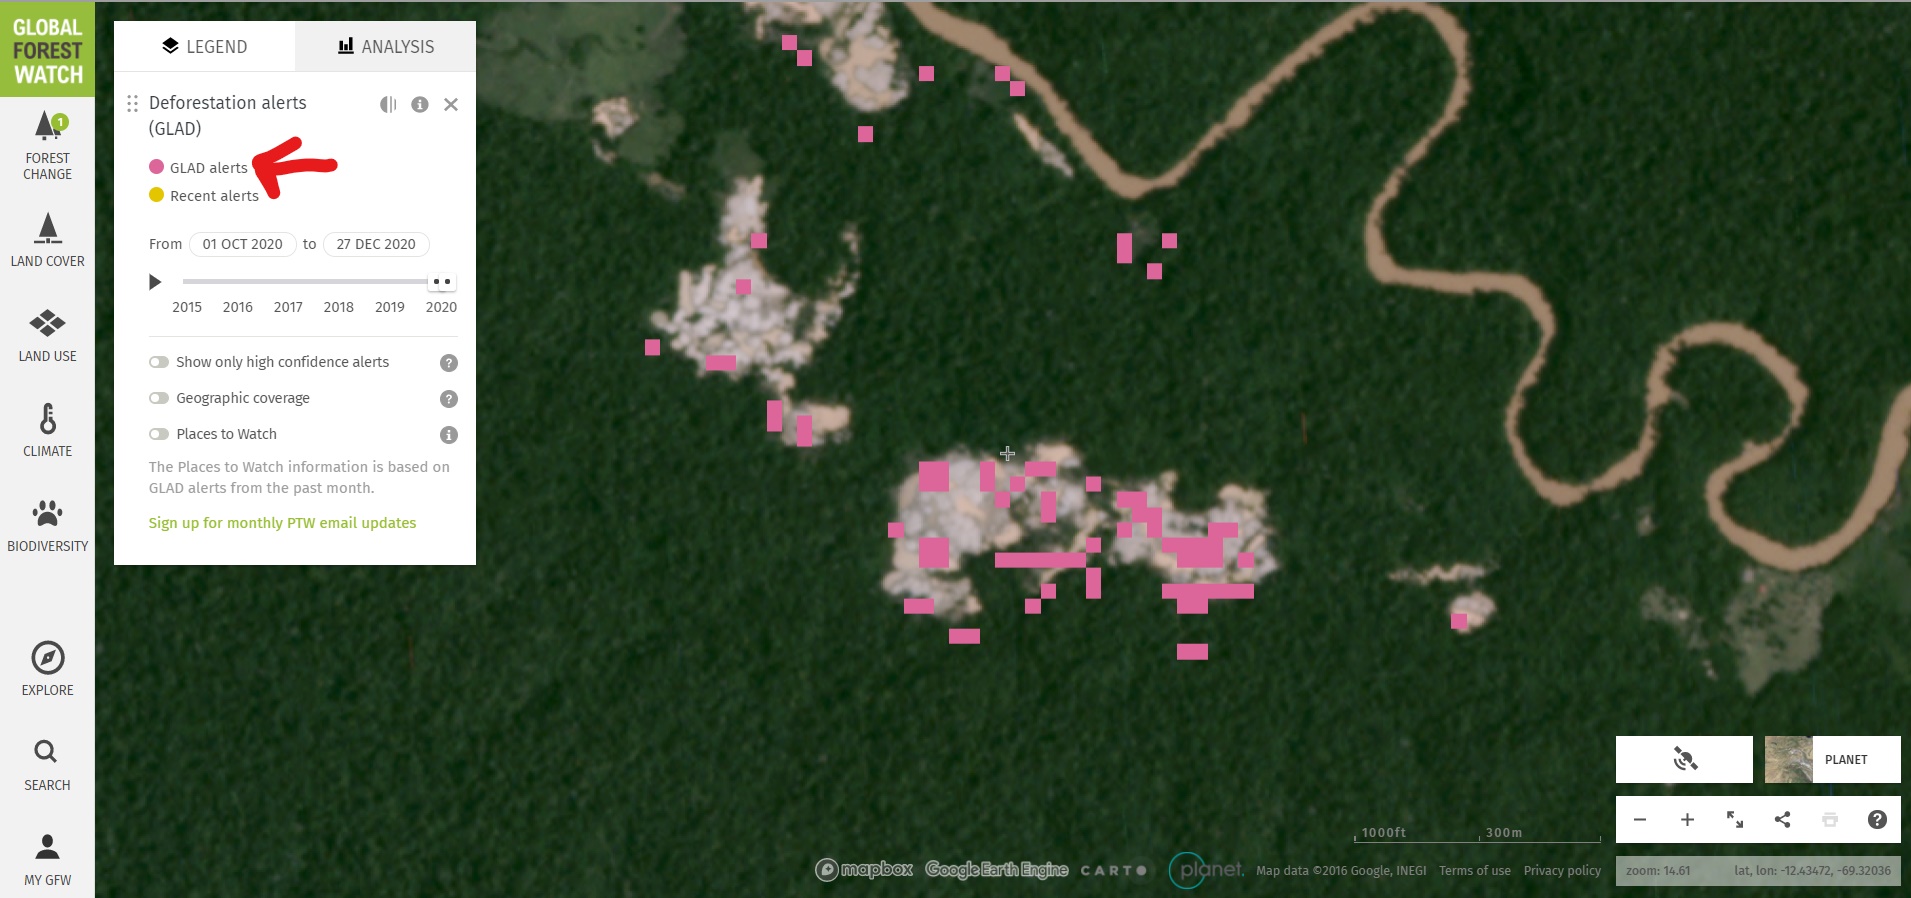
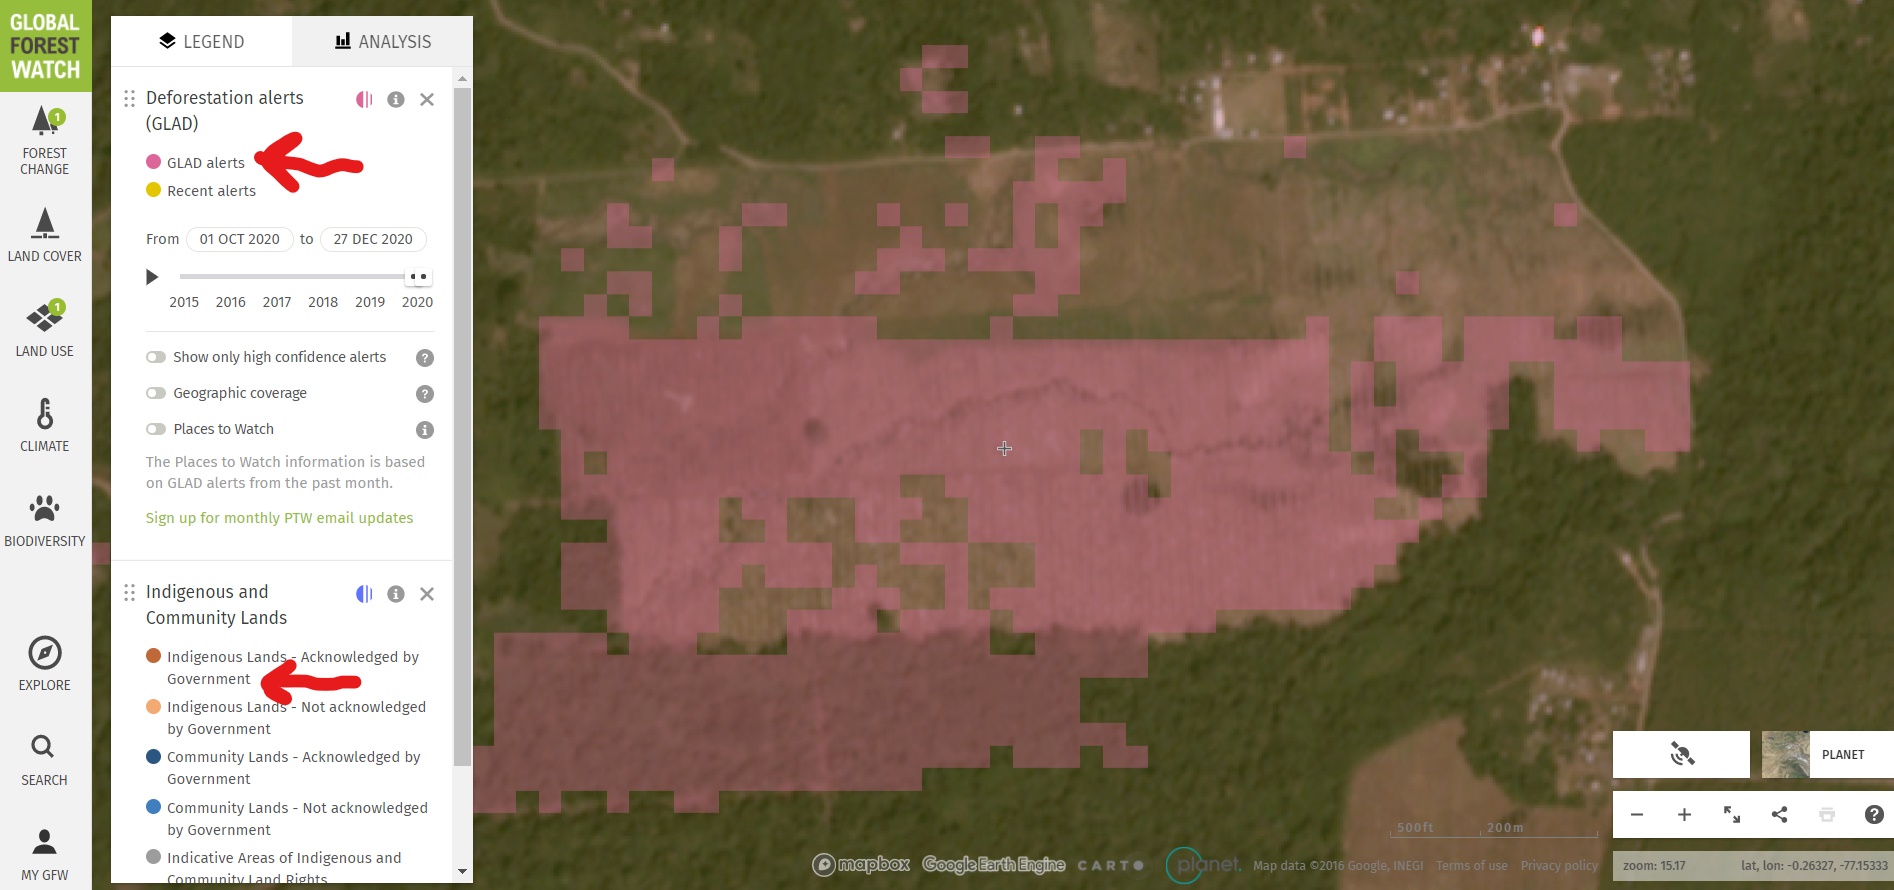
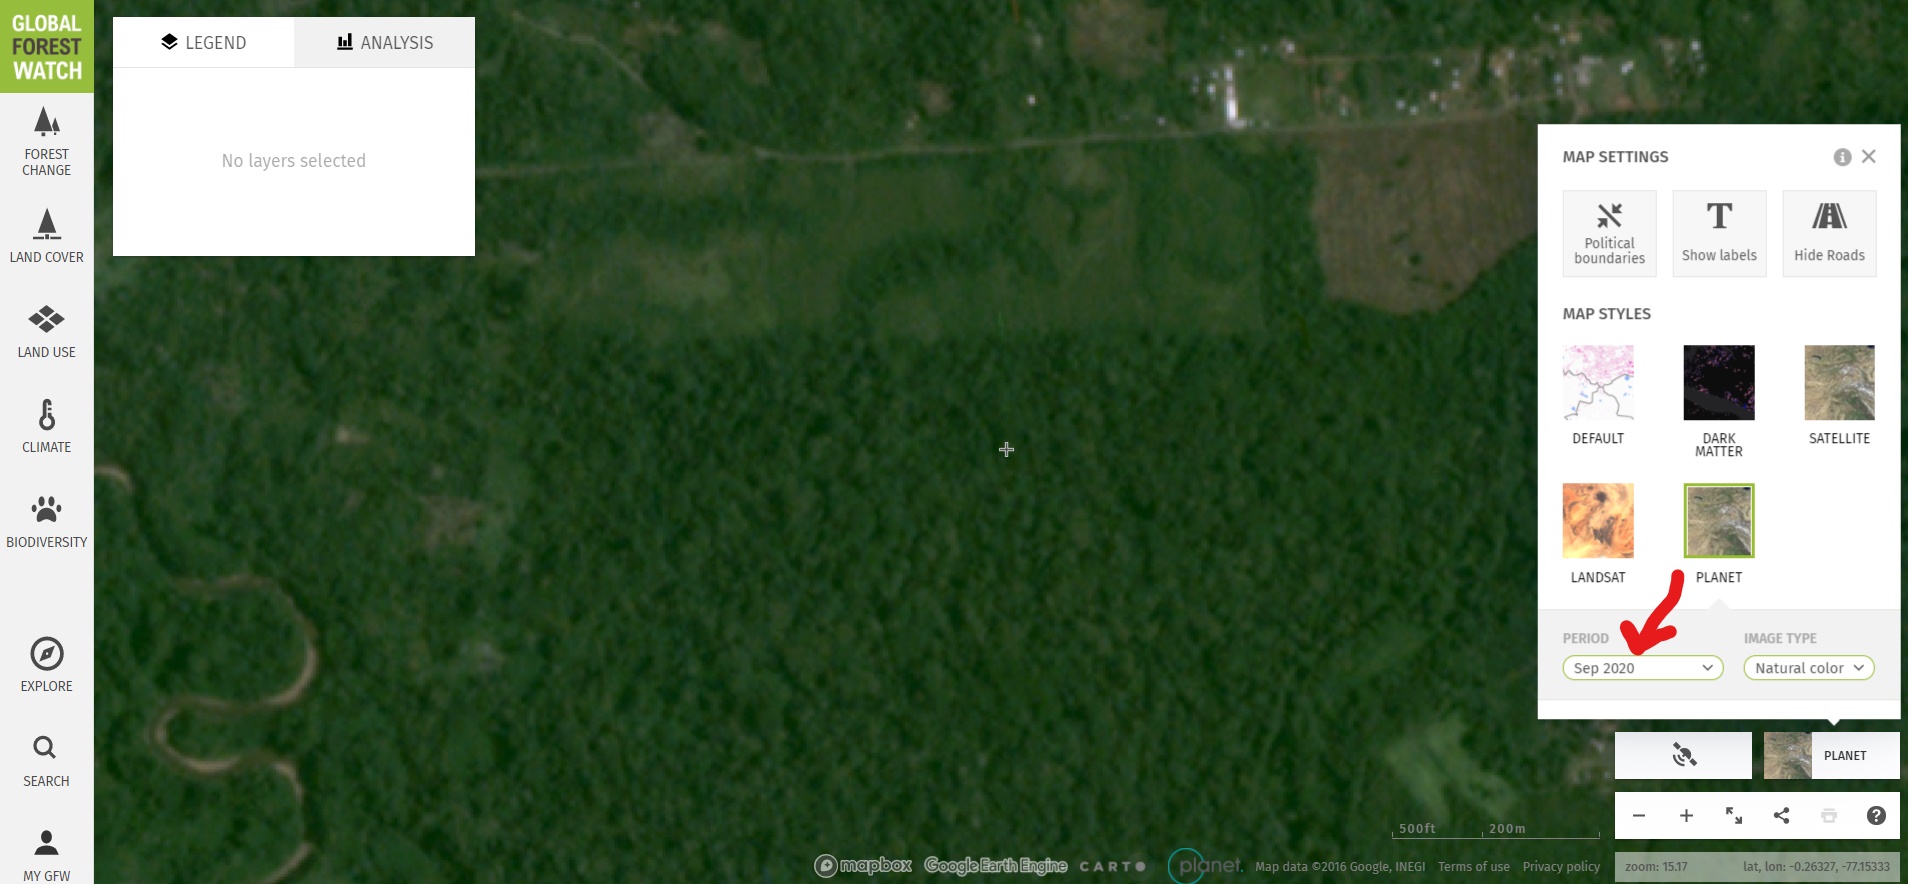
We analyzed high-resolution imagery (3 meters) from the satellite company Planet obtained from their interface Planet Explorer. Based on this imagery, we digitized gold mining deforestation across six major sites: La Pampa, Alto Malinowski, Camanti, Pariamanu, Apaylon, and Chaspa. These were identified as the major active illegal gold mining deforestation fronts based on analysis of automated forest loss alerts generated by University of Maryland (GLAD alerts) and the Peruvian government (Geobosques) and additional land use layers. The area referred to as the “mining corridor” is not included in the analysis because the issue of legality is more complex.
Across these six sites, we identified, digitized, and analyzed all visible gold mining deforestation between January 2017 and the present (October 2020). We defined before Operation Mercury as data from January 2017 to February 2019, and after Operation Mercury as data from March 2019 to the present. Given that the former was 26 months and the latter 20 months, during the analysis the data was standardized as gold mining deforestation per month.
The data is updated through October 2020.
Acknowledgments
We thank A. Felix (DAI), S. Novoa (ACCA), and G. Palacios for their helpful comments on this report.
This report was conducted with technical assistance from USAID, via the Prevent project. Prevent is an initiative that is working with the Government of Peru, civil society, and the private sector to prevent and combat environmental crimes in Loreto, Ucayali and Madre de Dios, in order to conserve the Peruvian Amazon.
This publication is made possible with the support of the American people through USAID. Its content is the sole responsibility of the authors and does not necessarily reflect the views of USAID or the US government.

Citation
Finer M, Mamani N (2020) Illegal Gold Mining Down 79% in Peruvian Amazon, But Still Threatens Key Areas. MAAP: 130.