MAAP #183: Protected Areas & Indigenous Territories Effective Against Deforestation Across Amazon

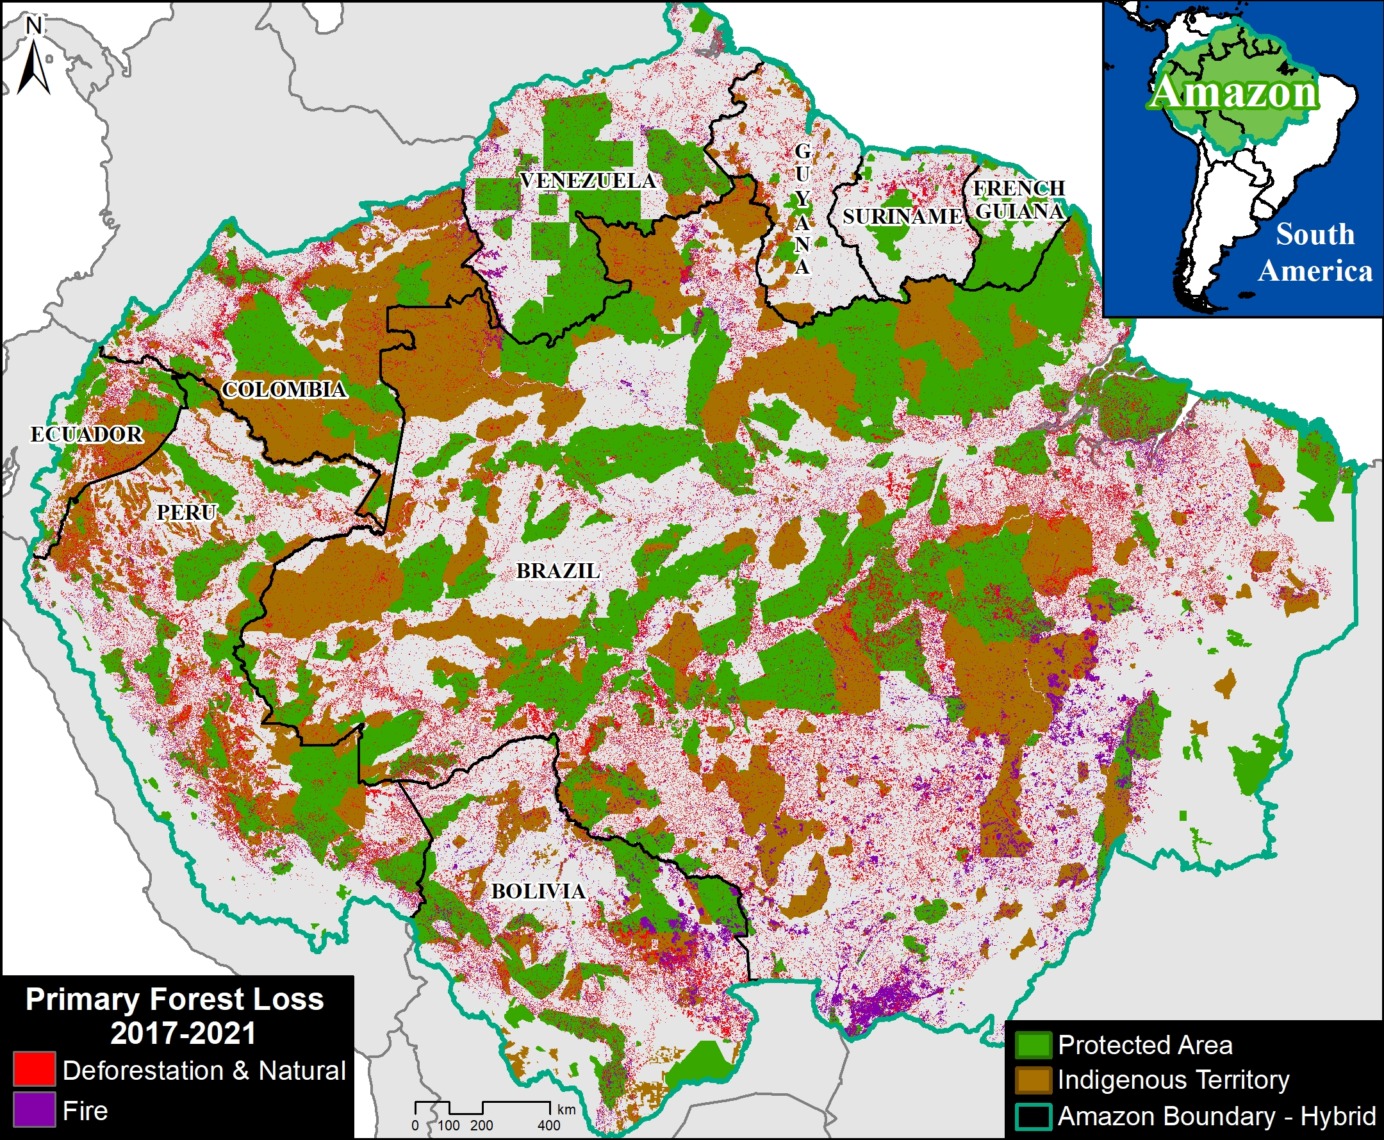
Base Map. Primary forest loss (2017-21) across the Amazon, in relation to protected areas and indigenous territories.

As deforestation continues to threaten primary forest across the Amazon, key land use designations are one of the best hopes for the long-term conservation of critical remaining intact forests.

Here, we evaluate the impact of two of the most important: protected areas & indigenous territories.

Our study looked across all nine countries of the Amazon biome, a vast area of 883.7 million hectares (see Base Map).

We calculated primary forest loss over the past 5 years (2017-2021).

For the first time, we were able to distinguish fire vs non-fire forest loss. For non-fire, while this does include natural events (such as landslides and wind storms), we consider this our best proxy for human-caused deforestation.

We analyzed the results across three major land use categories:

1) Protected Areas (national and state/department levels), which cover 197 million hectares (23.6% of Amazon).

2) Indigenous Territories (official), which cover 163.8 million hectares (19.6% of Amazon).

3) Other (all remaining areas outside protected areas and indigenous territories), which cover 473 million hectares (56.7% of Amazon).

In summary, we found that deforestation was the primary driver of forest loss, with fire always being a smaller subset. Averaged across all 5 years, protected areas and indigenous territories had similar levels of effectiveness, reducing primary forest loss rate by 3x compared to areas outside of these designations.

Below, we show the key results across the Amazon in greater detail, including a breakdown for the western Amazon (Bolivia, Colombia, Ecuador, and Peru) and the Brazilian Amazon.

Key Findings

Amazon Biome

We documented the loss of 11 million hectares of primary forests across all nine countries of the Amazon biome between 2017 and 2021. Of this total, 71% was non-fire (deforestation and natural) and 29% was fire.

For the major land use categories, 11% of the forest loss occurred in both protected areas and indigenous territories, respectively, while the remaining 78% occurred outside these designations.

To standardize these results for the varying area coverages, we calculated annual primary forest loss rates (loss/total area of each category). Figure 1 displays the results for these rates across all nine countries of the Amazon biome.
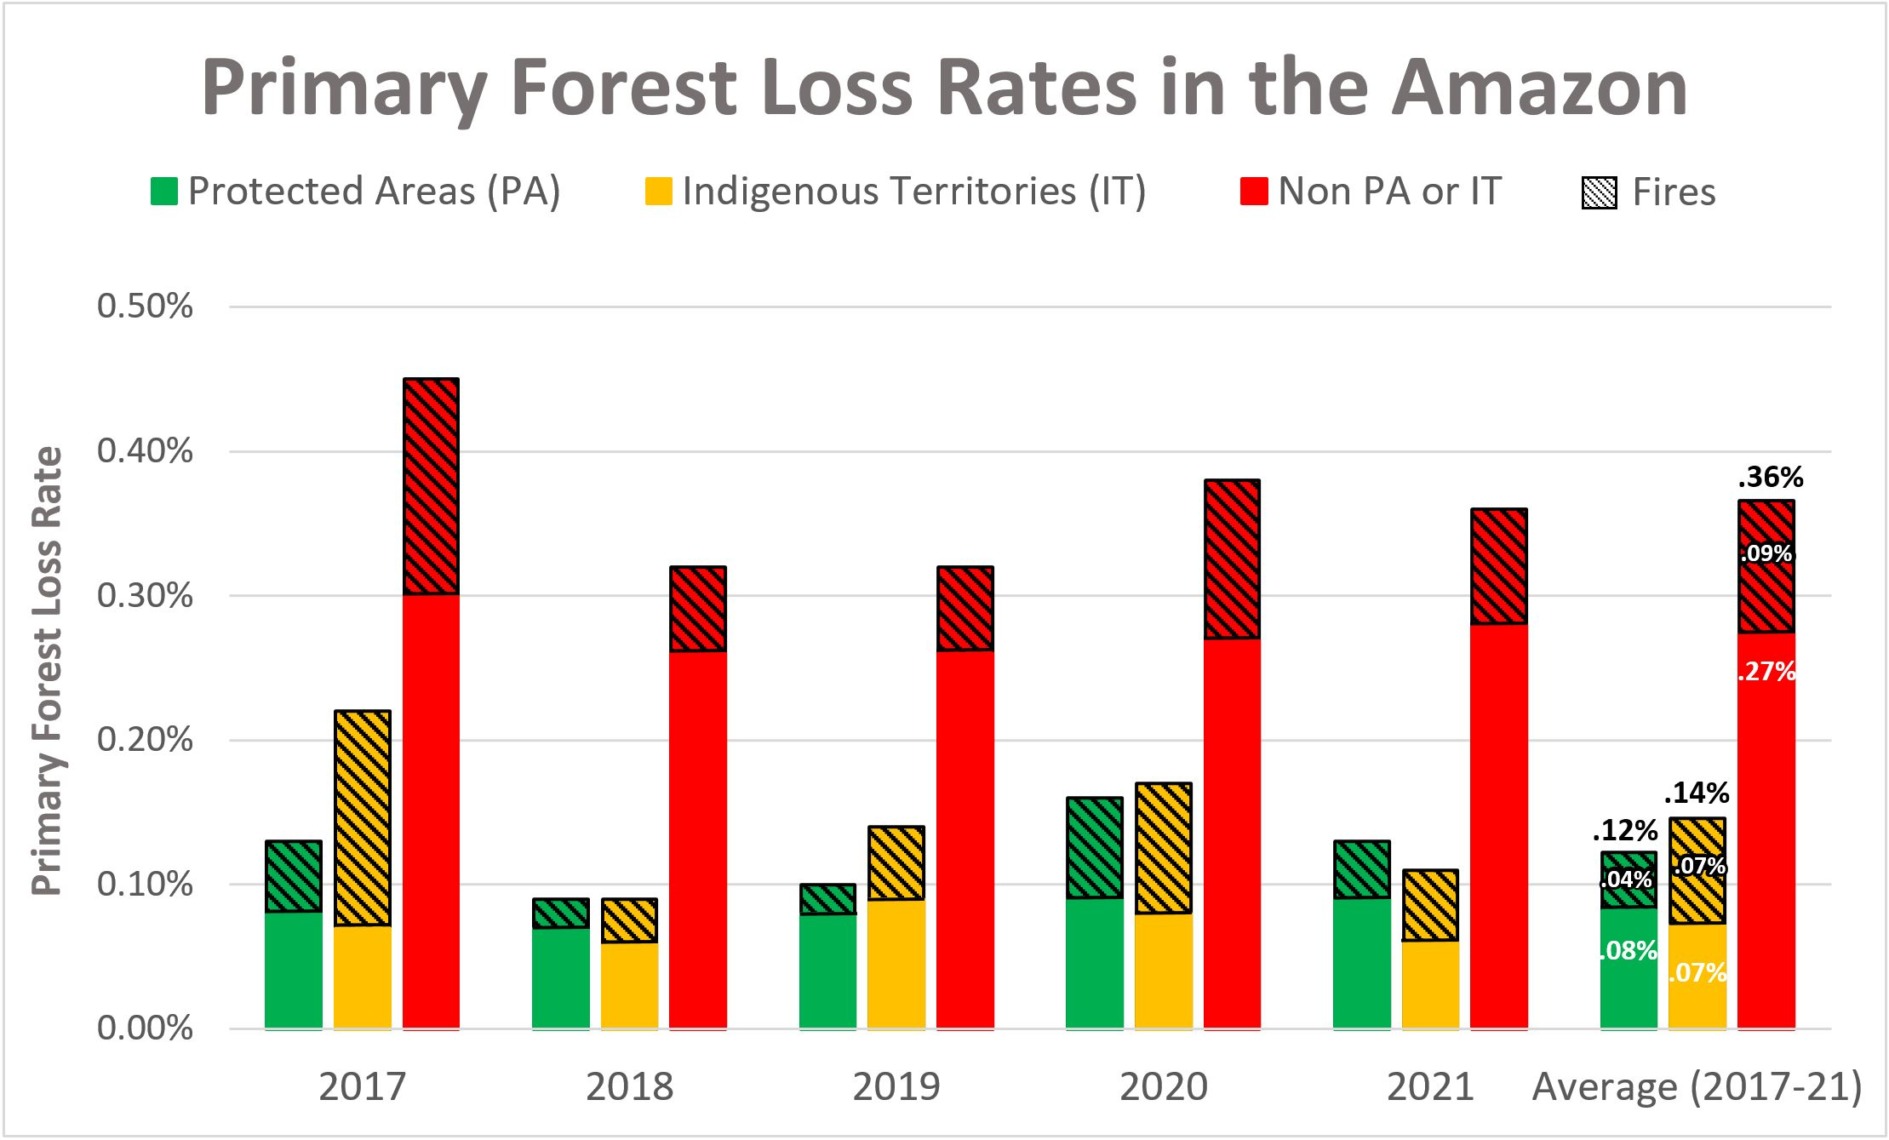
Figure 1. Primary forest loss rates across the Amazon, 2017-21.

Broken down by year, 2017 had the highest forest loss rates, with both a severe deforestation and fire season. In addition, 2021 had the second highest deforestation rate, while 2020 had the second highest fire loss rate.

Averaged across all five years, protected areas (green) had the lowest overall primary forest loss rate (0.12%), closely followed by indigenous territories (0.14%).

Interestingly, indigenous territories (orange) actually had a slightly lower deforestation rate compared to protected areas (0.7 vs 0.8%), but higher fire loss rate (o.7 vs .04%), resulting in the overall higher forest loss rate noted above.

Outside of these designations (red), the primary forest loss rate was triple (.36%), especially due to much higher deforestation.

Western Amazon

Breaking the results down specifically for the western Amazon (Bolivia, Colombia, Ecuador, and Peru), we documented the loss of 2.6 million hectares of primary forests between 2017 and 2021. Of this total, 80% was non-fire (deforestation and natural) and 20% was fire.

For the major land use categories, 9.6% occurred in protected areas, 15.6% in indigenous territories, and the remaining 74.8% occurred outside these designations.

Figure 2 displays the standardized primary forest loss rates across the western Amazon.

Figure 2. Primary forest loss rates across the Western Amazon, 2017-21.

Broken down by year, 2017 had the highest deforestation rate and overall forest loss rates. But 2020 had the highest fire loss rate, mainly due to extensive fires in Bolivia. 2021 also had a relatively high deforestation rate. Also, note the high level of fires in protected areas in 2020 and 2021, and indigenous territories in 2019.

Averaged across all five years, protected areas had the lowest overall primary forest loss rate (0.11%), followed by indigenous territories (0.16%).

Outside of these designations, the primary forest loss rate was .30%. That is, triple the protected areas rate and double the indigenous territories rate.

Brazilian Amazon

Breaking the results down specifically for the Brazilian Amazon, we documented the loss of 8.1 million hectares of primary forests between 2017 and 2021. Of this total, 68% was non-fire (deforestation and natural) and 32% was fire.

For the major land use categories, 9.4% occurred in indigenous territories, 11.2% occurred in protected areas, and the remaining 79.4% occurred outside these designations.

Figure 3 displays the standardized primary forest loss rates across the Brazilian Amazon.
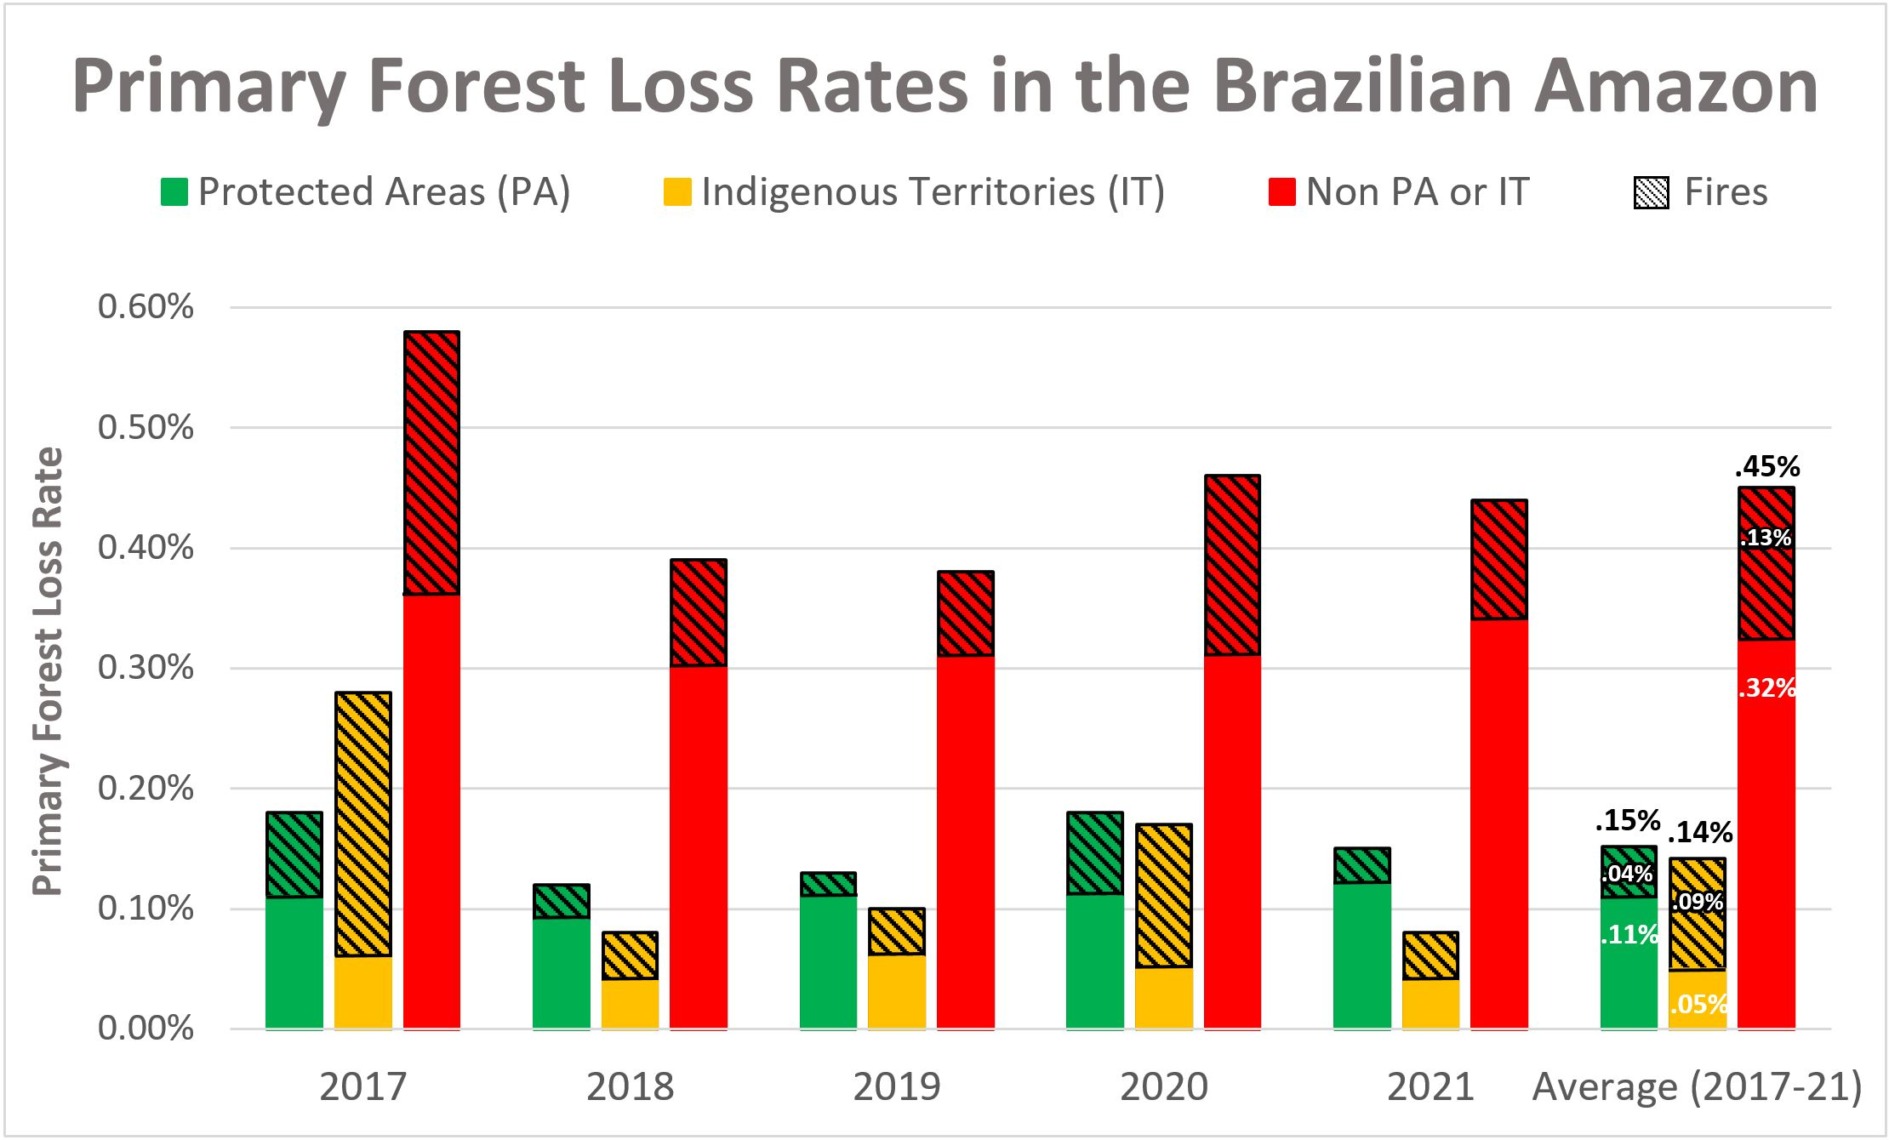
Figure 3. Primary forest loss rates in the Brazilian Amazon, 2017-21.

Broken down by year, 2017 had the highest forest loss rate recorded in the entire study (.58%), due to both elevated deforestation and fire. Note that indigenous territories were particularly impacted by fire in 2017.

2020 had the next highest forest loss rate, also driven by an intense fire season. Fires were not as severe the following year in 2021, but deforestation increased.

Averaged across all five years, indigenous territories had the lowest overall primary forest loss rate (0.14%), closely followed by protected areas (0.15%).

Interestingly, indigenous territories had a lower deforestation rate compared to protected areas (0.5 vs 0.11%), but higher fire impact (0.09 vs 0.04%).

Outside of these designations (red), the primary forest loss rate was triple (.45%).

Methodology

To estimate deforestation across all three categories (protected areas, indigenous territories, and other), we used annual forest loss data (2017-21) from the University of Maryland (Global Land Analysis and Discovery GLAD laboratory) to have a consistent source across all countries (Hansen et al 2013).

We obtained this data, which has a 30-meter spatial resolution, from the “Global Forest Loss due to Fires 2000–2021” data download page. It is also possible to visualize and interact with the data on the main Global Forest Change portal.

The annual data is disaggregated into forest loss due to fire vs. non-fire (other disturbance drivers). It is important to note that the non-fire drivers include both human-caused deforestation and forest loss caused by natural forces (landslides, wind storms, etc.).

We also filtered this data for only primary forest loss, following the established methodology of Global Forest Watch. Primary forest is generally defined as intact forest that has not been previously cleared (as opposed to previously cleared secondary forest, for example). We applied this filter by intersecting the forest cover loss data with the additional dataset “primary humid tropical forests” as of 2001 (Turubanova et al 2018). Thus, we often use the term “primary forest loss” to describe this filtered data.

Data presented as primary forest loss rate is standardized per the total area covered of each respective category per year (annual). For example, to properly compare raw forest loss data in areas that are 100 hectares vs 1,000 hectares total size respectively, we divide by the area to standardize the result.

Our geographic range extends from the Andes to the Amazon plain and reaching the transitions with the Cerrado and the Pantanal. This range includes nine countries of the Amazon (or Pan-Amazon region as defined by RAISG) and consists of a combination of the Amazon watershed limit, the Amazon biogeographic limit and the Legal Amazon limit in Brazil. See Base Map above for delineation of this hybrid Amazon limit, designed for maximum inclusion.

Additional data sources include:

  • National and state/department level protected areas: RUNAP 2020 (Colombia), SNAP 2022 (Ecuador), SERNAP & ACEAA 2020 (Bolivia), SERNANP 2022 (Peru), INPE/Terrabrasilis 2022 (Brazil), SOS Orinoco 2021 (Venezuela), and RAISG 2020 (Guyana, Suriname, and French Guiana.)
  • Indigenous Territories: RAISG & Ecociencia 2022 (Ecuador), INPE/Terrabrasilis 2022 (Brazil), RAISG 2020 (Colombia, Bolivia, Venezuela, Guyana, Suriname, and French Guiana), and MINCU & ACCA 2021 (Peru). For Peru, this includes titled native communities and Indigenous/Territorial Reserves for indigenous groups in voluntary isolation.

For analysis, we categorized Protected Areas first, then Indigenous Territories to avoid overlapping areas. Each category was disaggregated by year created/recognized to match the annual report of forest loss, for example. If a Protected area was created in December 2018, it would be considered within the analysis for the year 2019.

Acknowledgements

This work was supported by the Andes Amazon Fund (AAF), Norwegian Agency for Development Cooperation (NORAD), and International Conservation Fund of Canada (ICFC).

We thank M. MacDowell and M. Cohen for helpful comments on this report.

Citation

Finer M, Mamani N (2023) Protected Areas & Indigenous Territories Effective Against Deforestation Across Amazon. MAAP: 176.
MAAP #178: Gold Mining Deforestation Across the Amazon

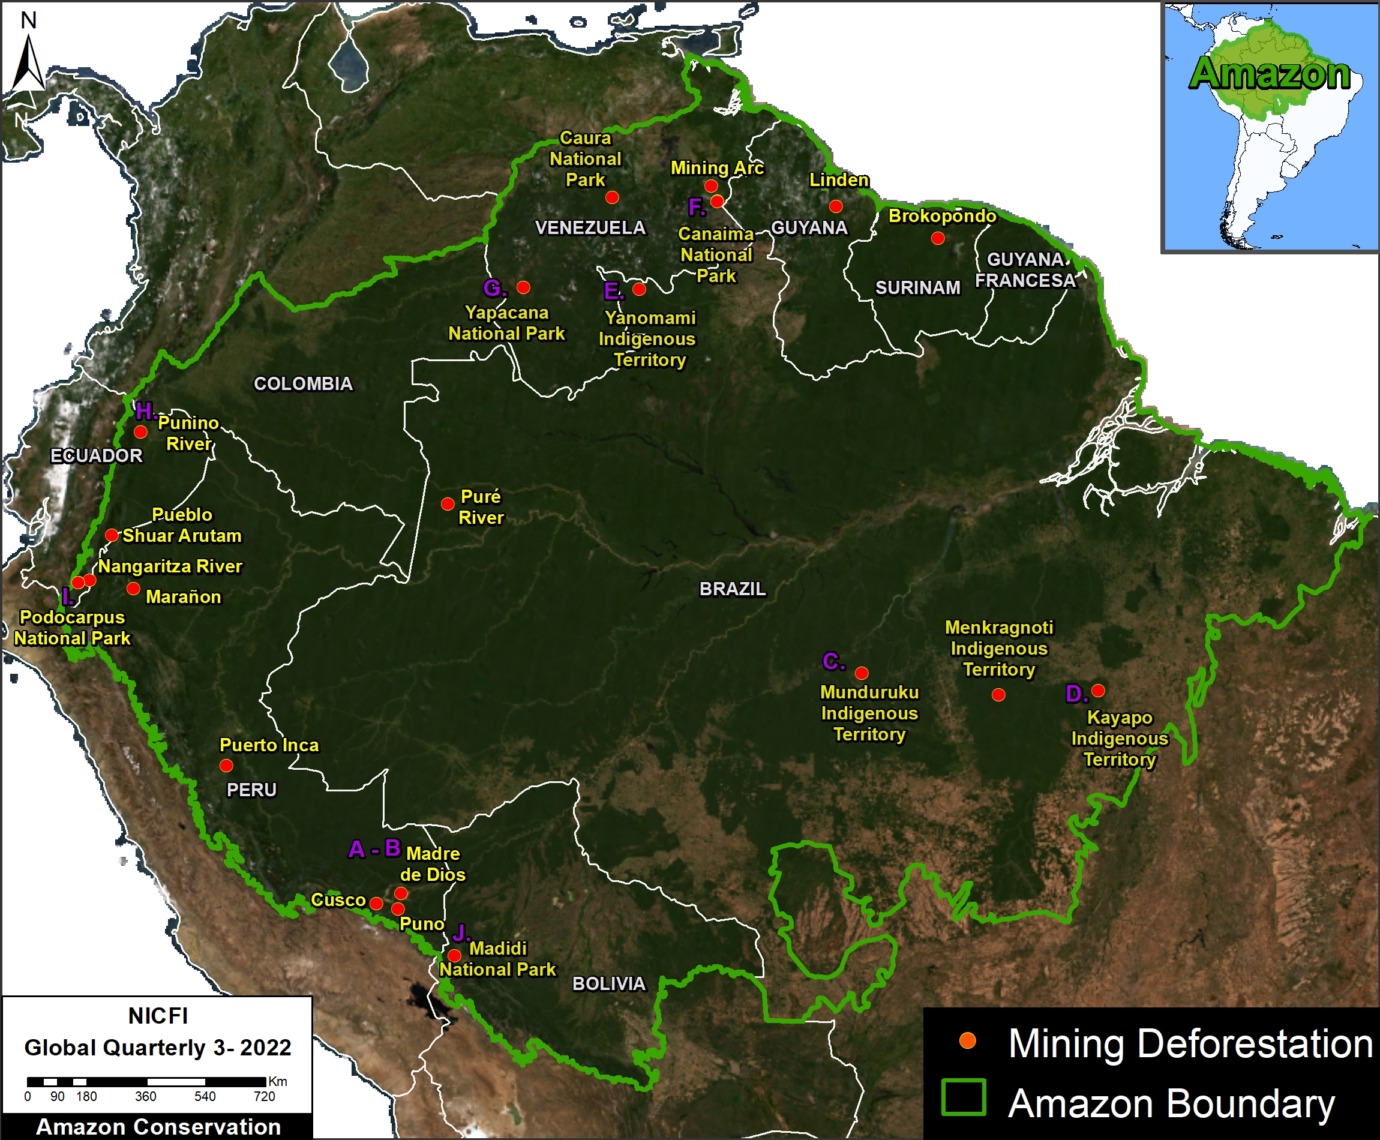
Base Map. Mining deforestation hotspots across the Amazon. Letters A-J indicate locations of case studies below. Click image to enlarge.

Gold Mining is one of the major deforestation drivers across the Amazon.

Although not typically at the scale of agricultural deforestation, gold mining has the potential to severely impact critical areas such as protected areas & indigenous territories.

Relatedly, gold mining often targets remote areas, thus impacting largely intact and carbon-rich primary forests.

Here, for the first time, we present a large-scale overview of the major gold mining deforestation hotspots across the entire Amazon biome.

We found that gold mining is actively causing deforestation in nearly all nine countries of the Amazon (see Base Map).

In  this report, we focus on five countries: Peru, Brazil, Venezuela, Ecuador, and Bolivia, featuring case studies of the most severe active gold mining fronts.

In most cases, this mining is likely illegal given that it is occurring in protected areas and indigenous territories.

Note that we focus on mining activity that is causing deforestation of primary forests. There are additional critical gold mining areas that are occurring in rivers, such as in northern Peru and southern Colombia, that are not included in this report.

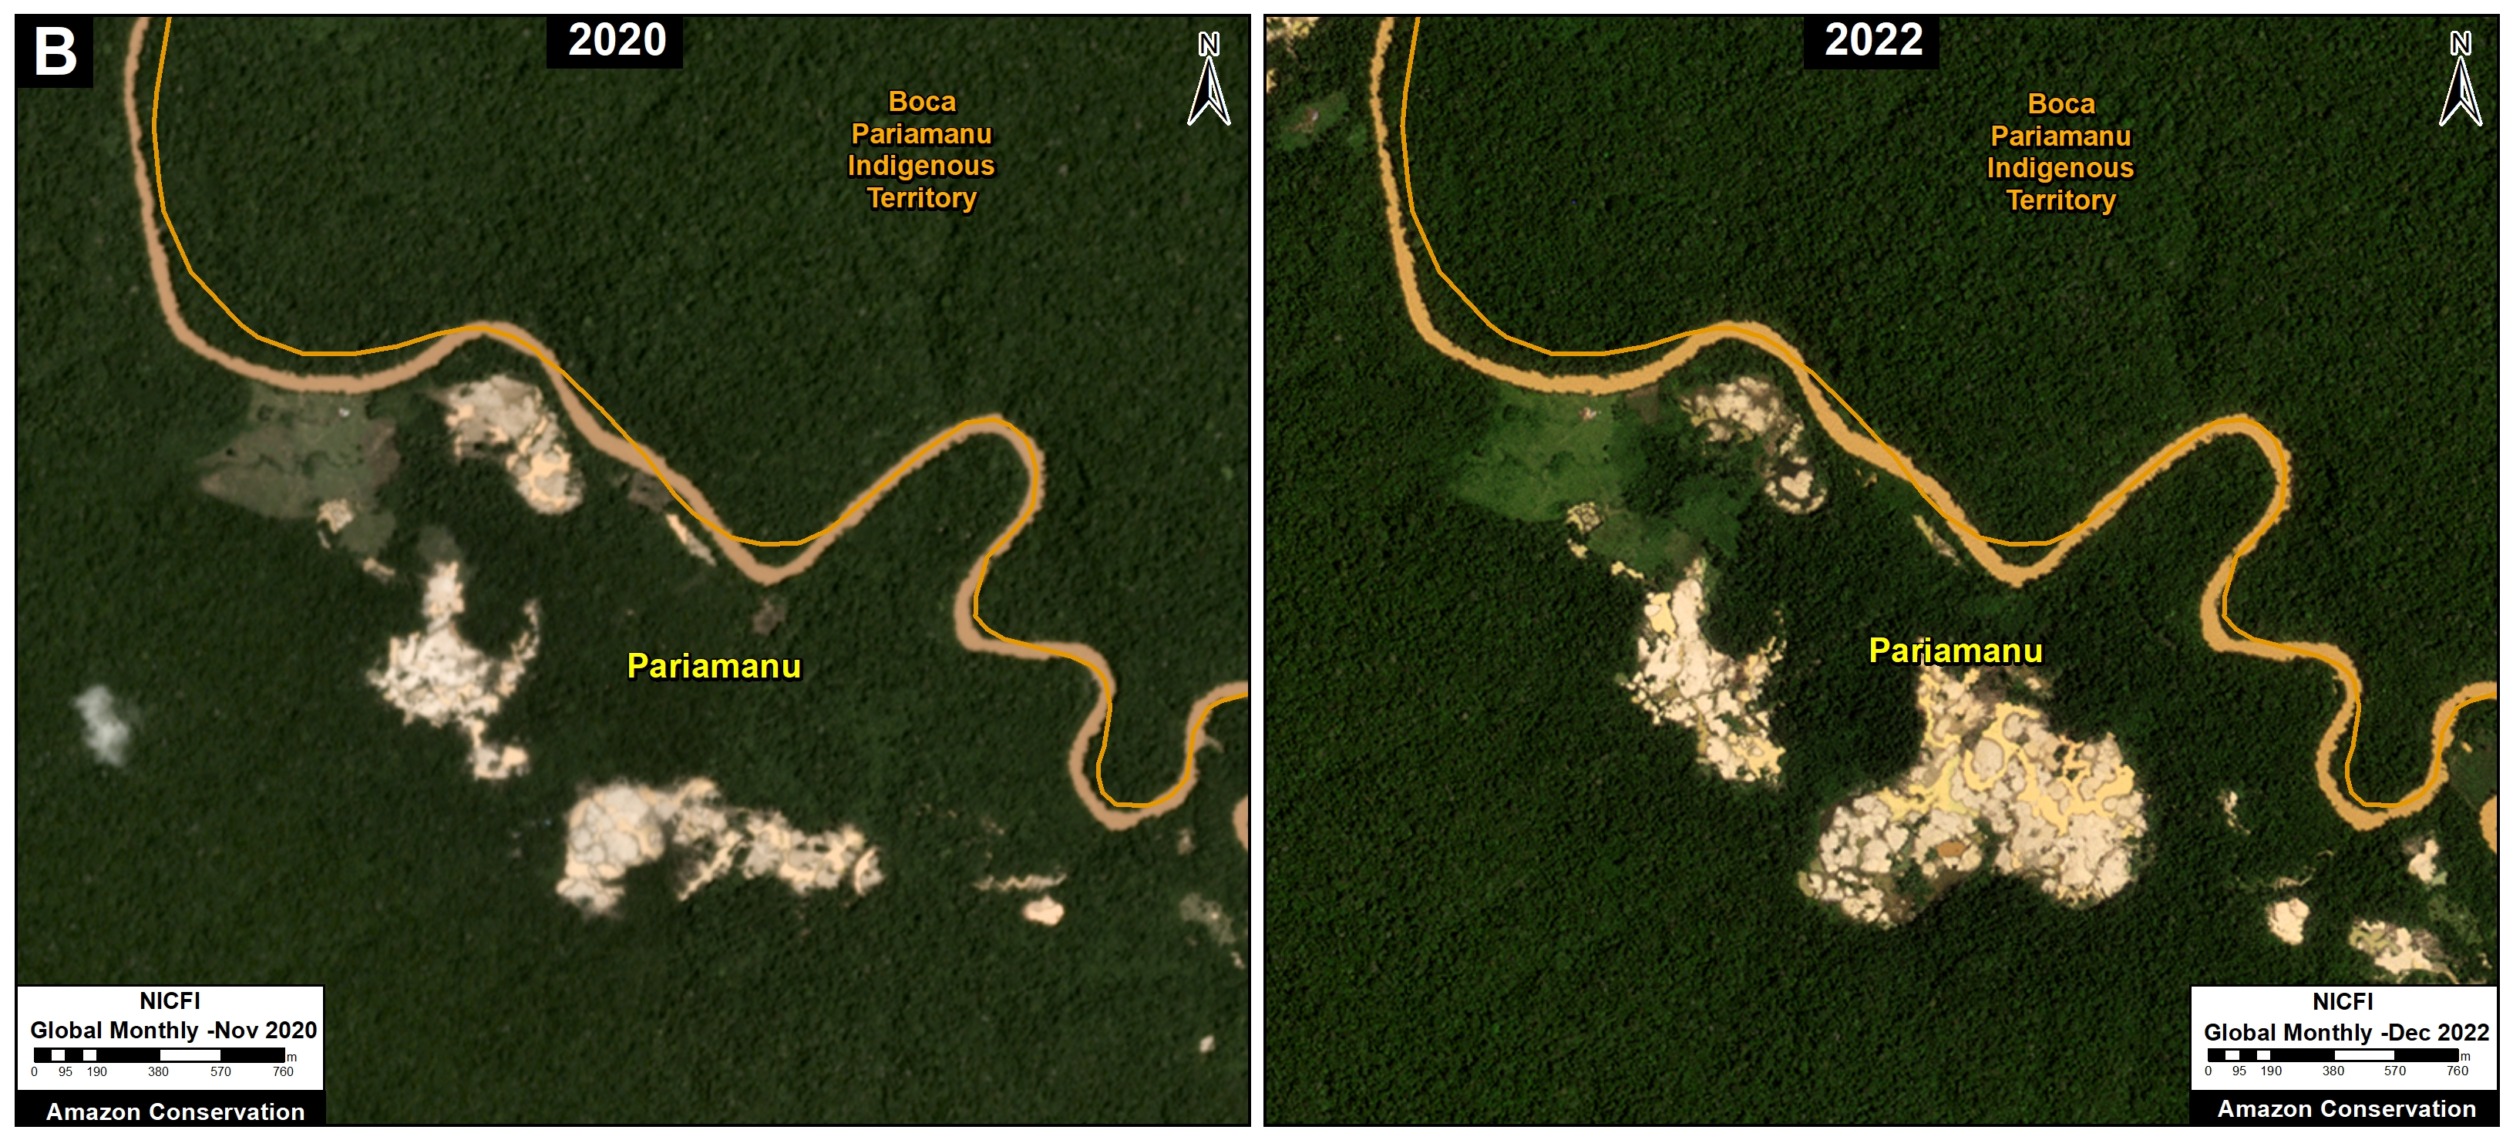
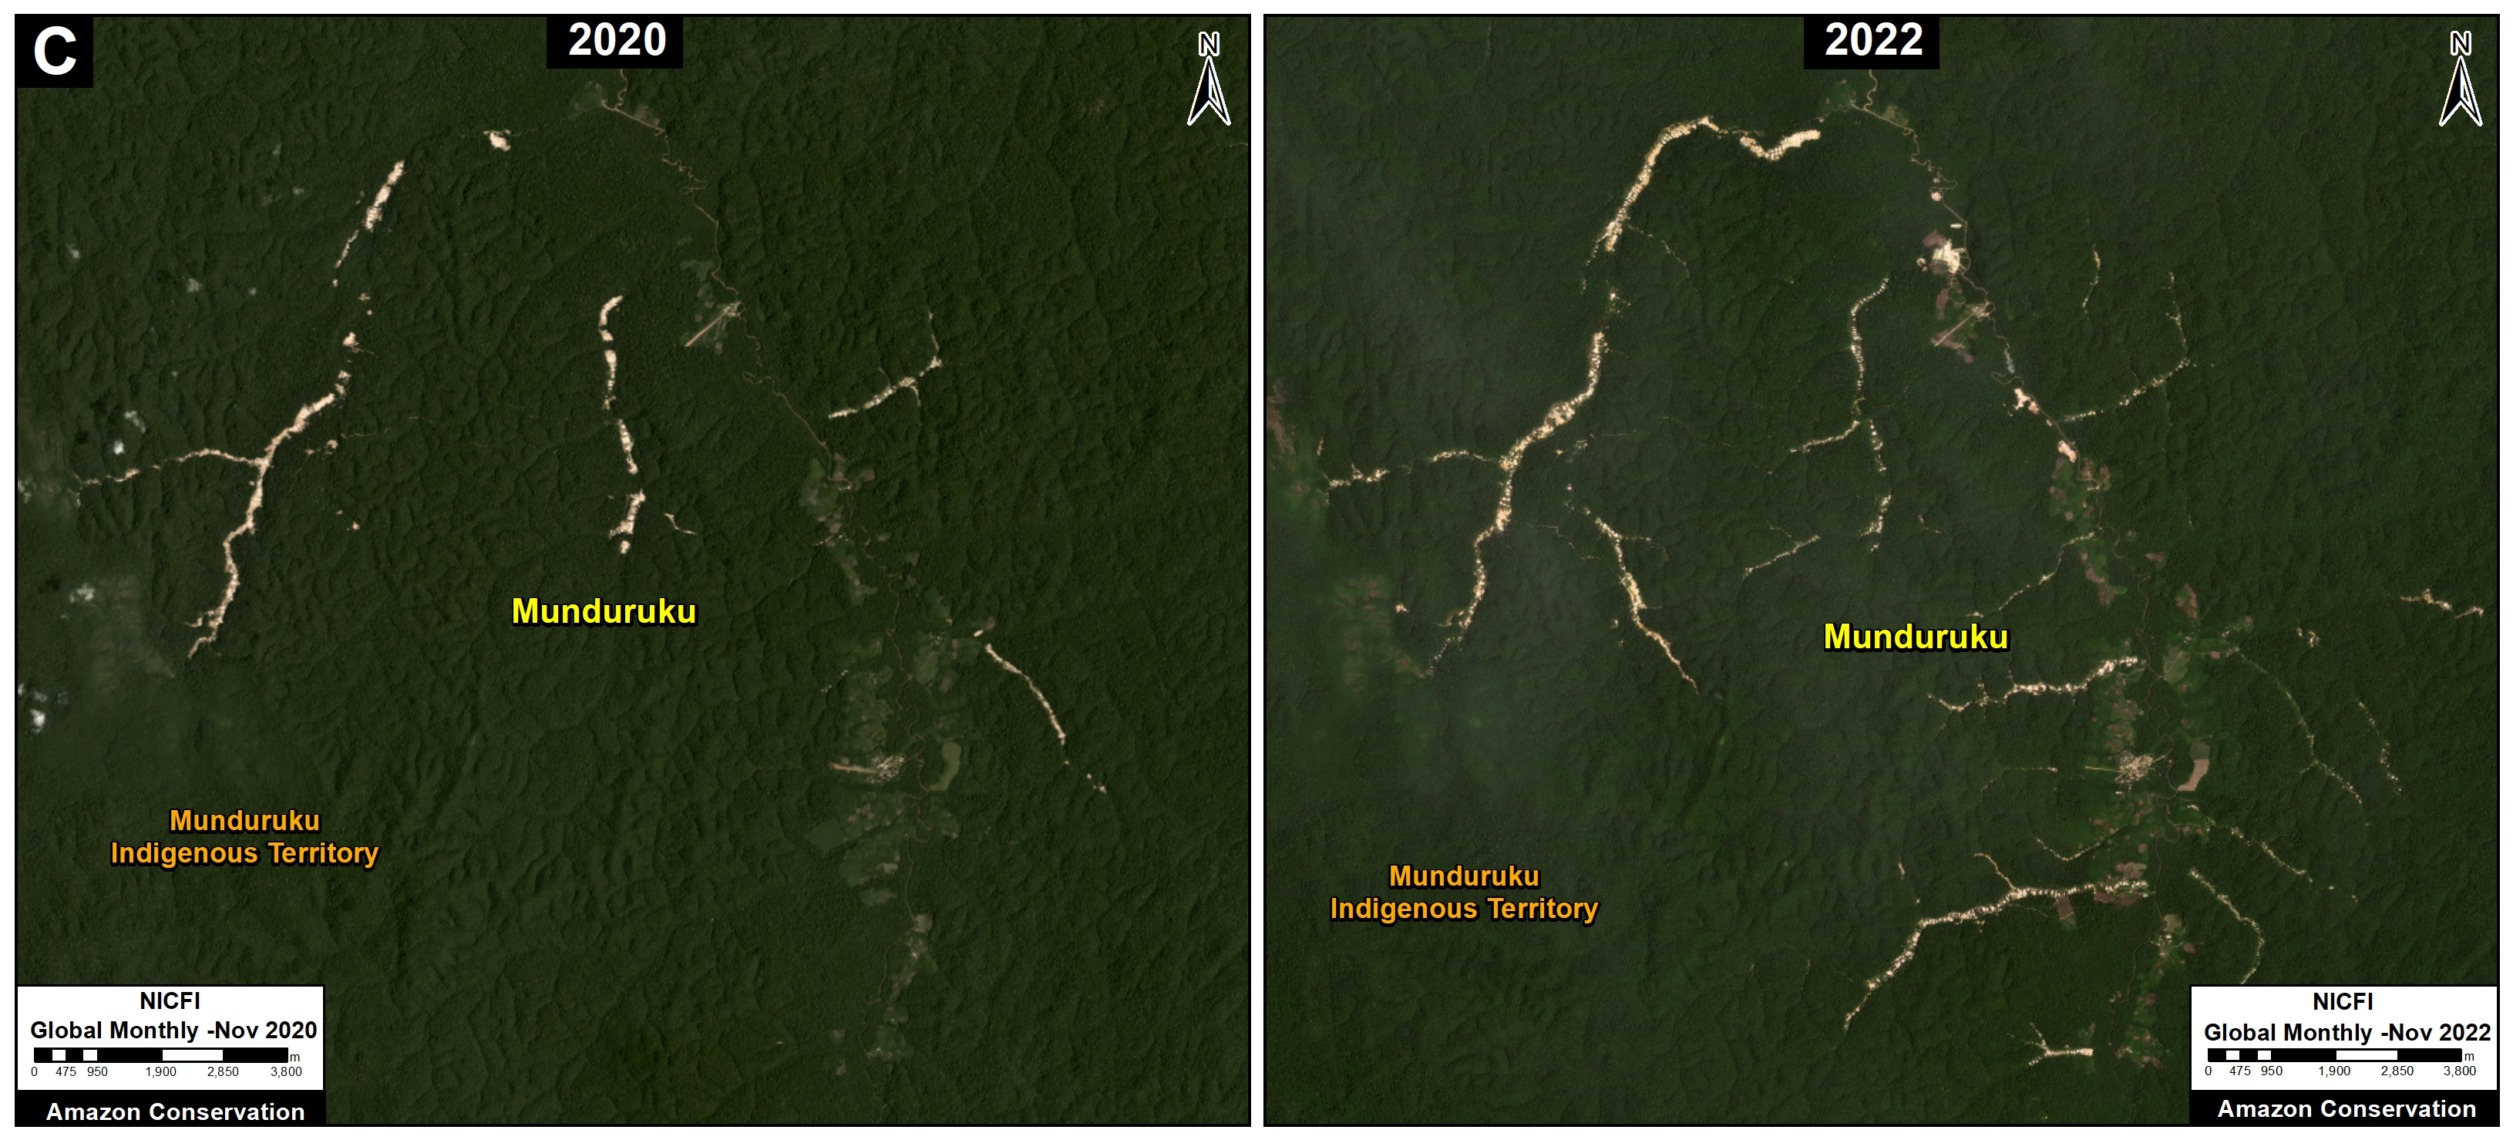
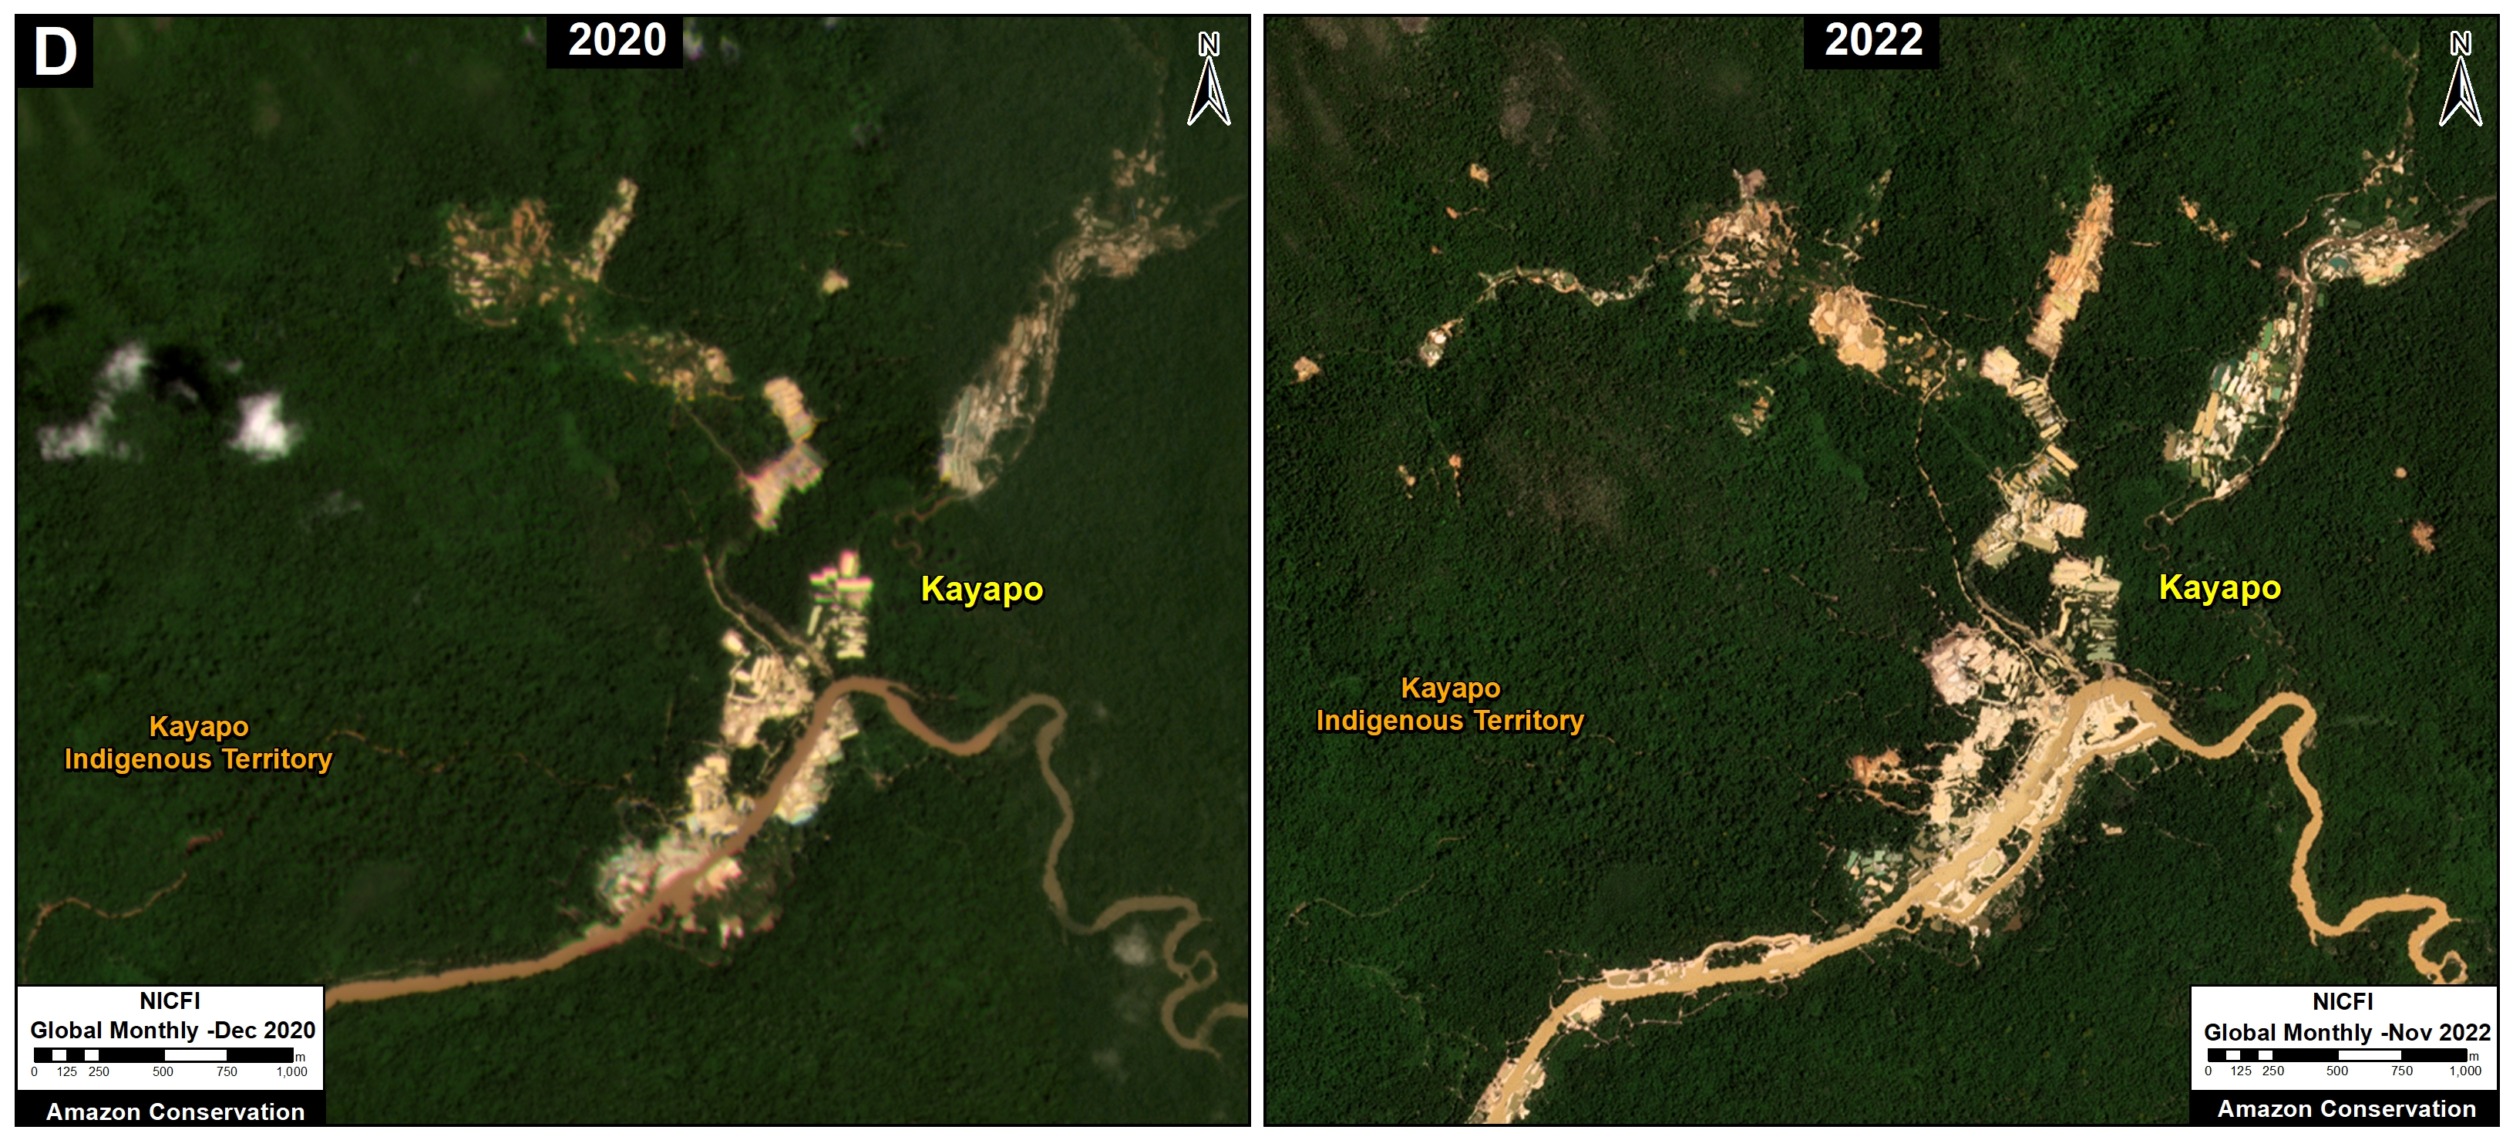
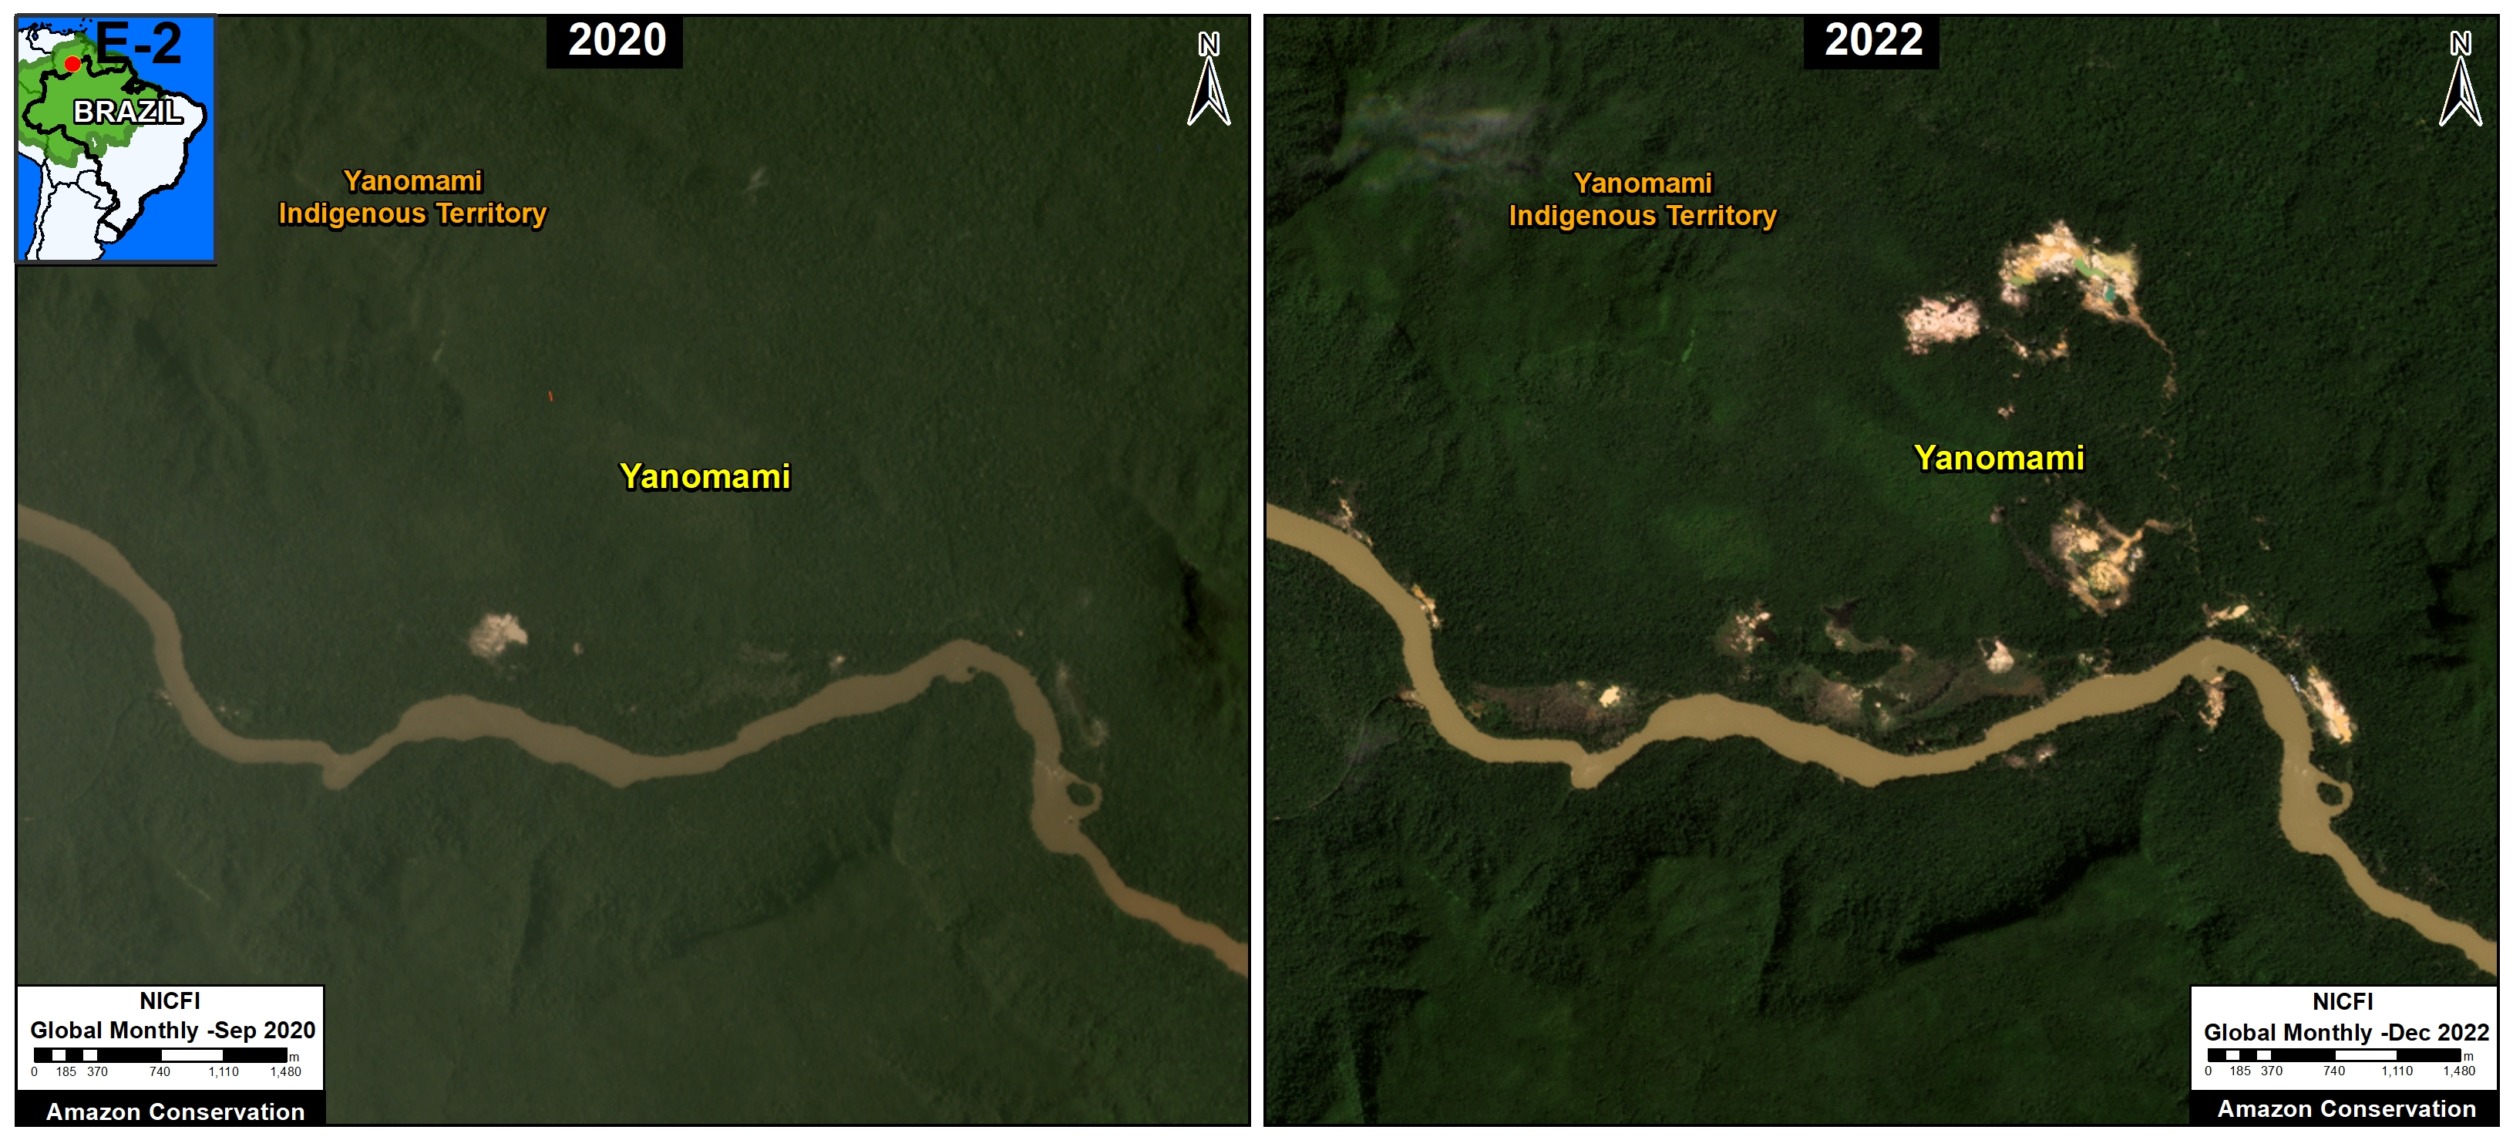
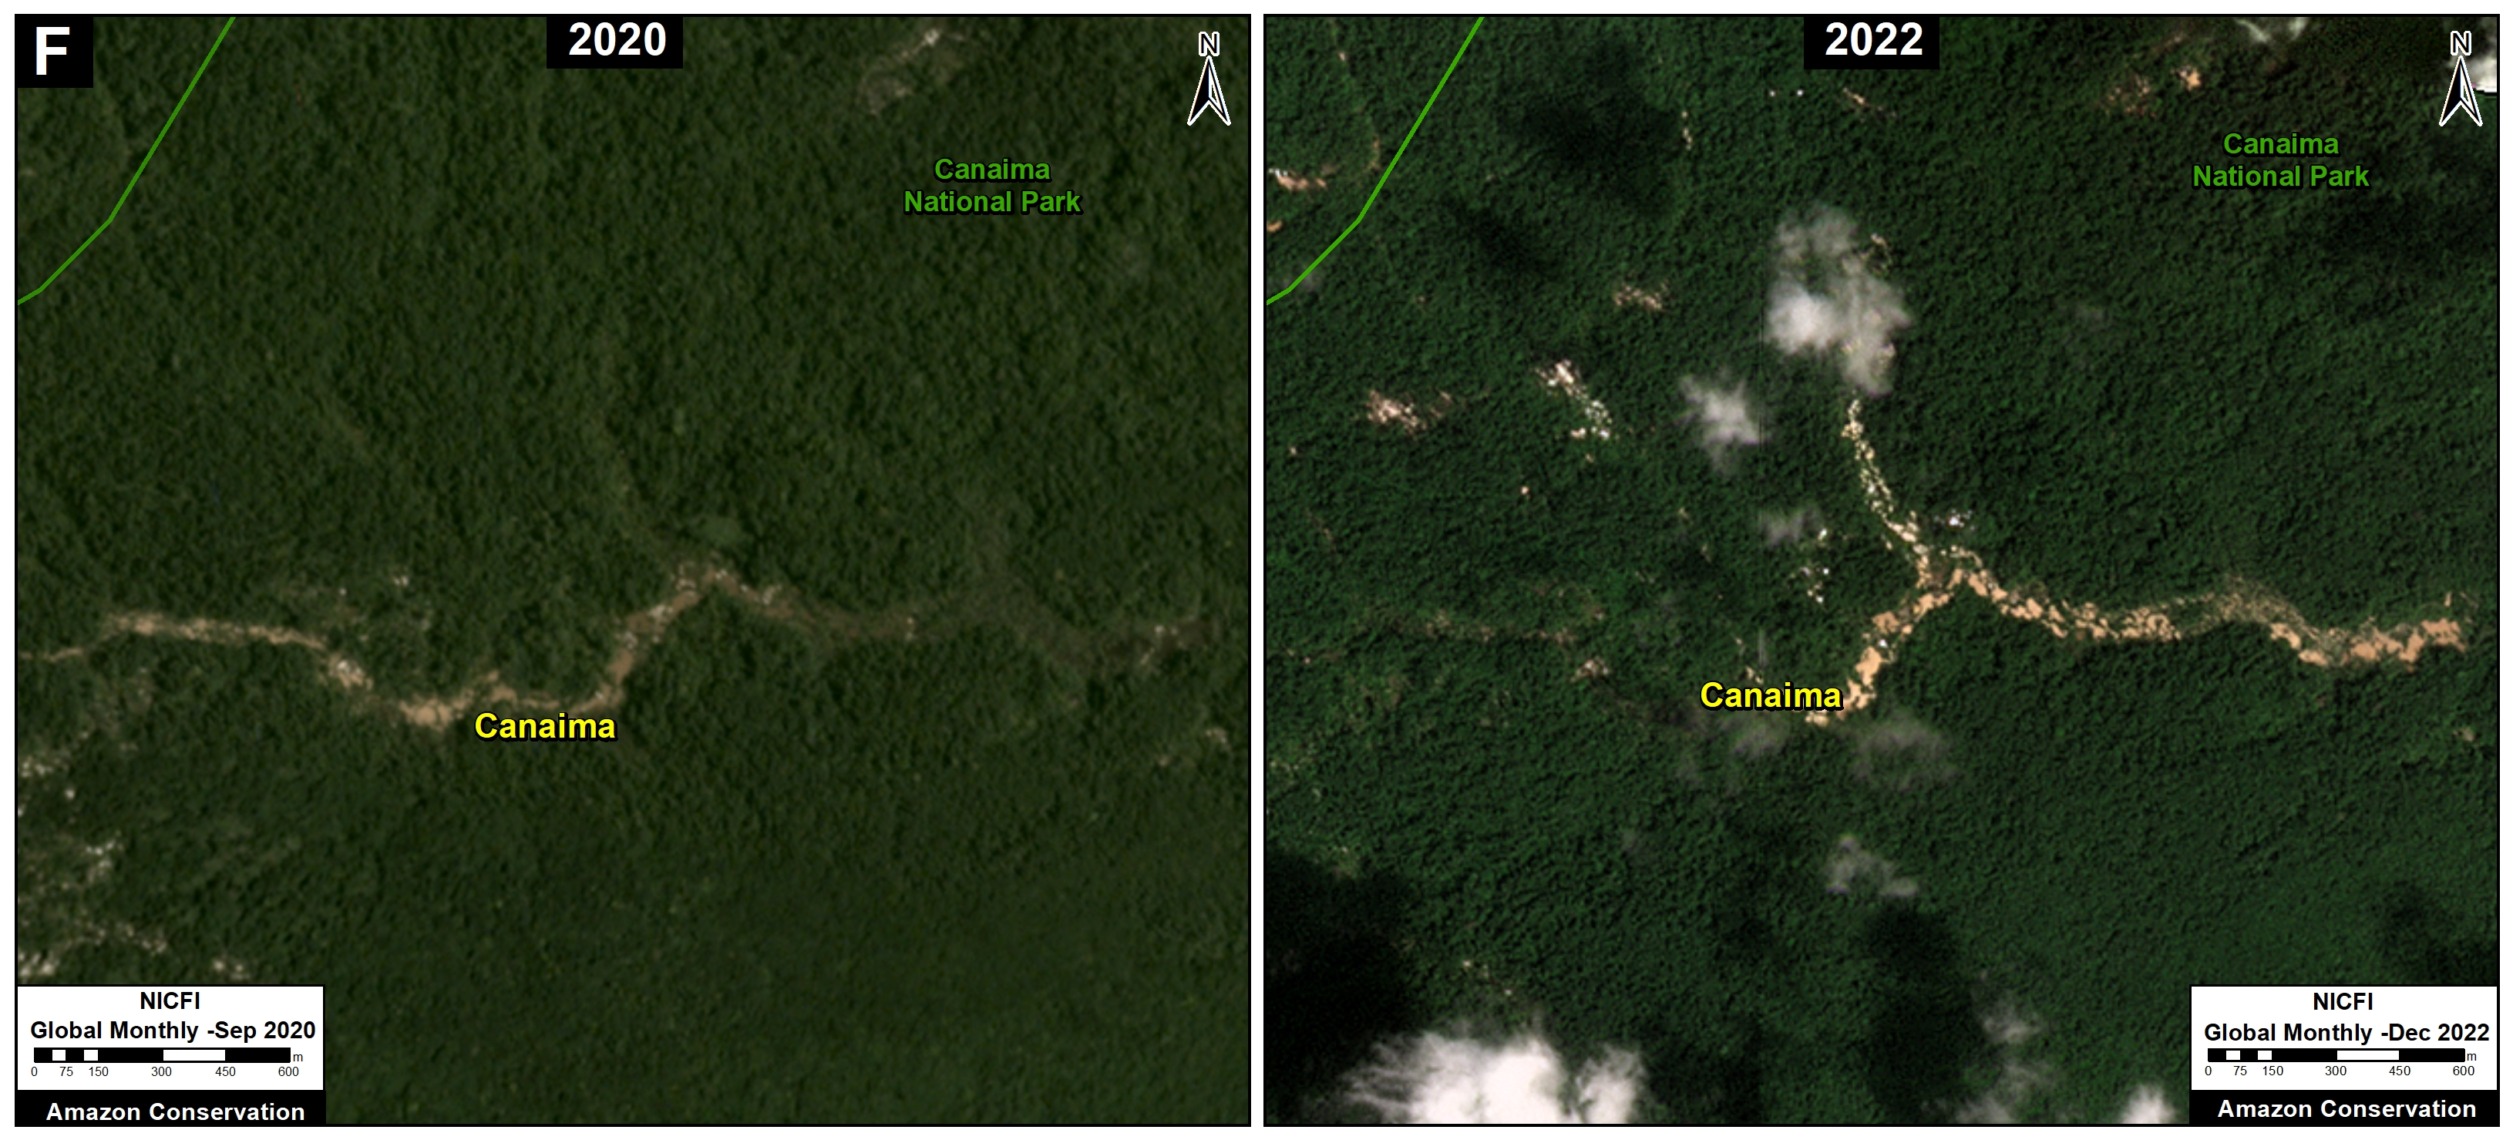
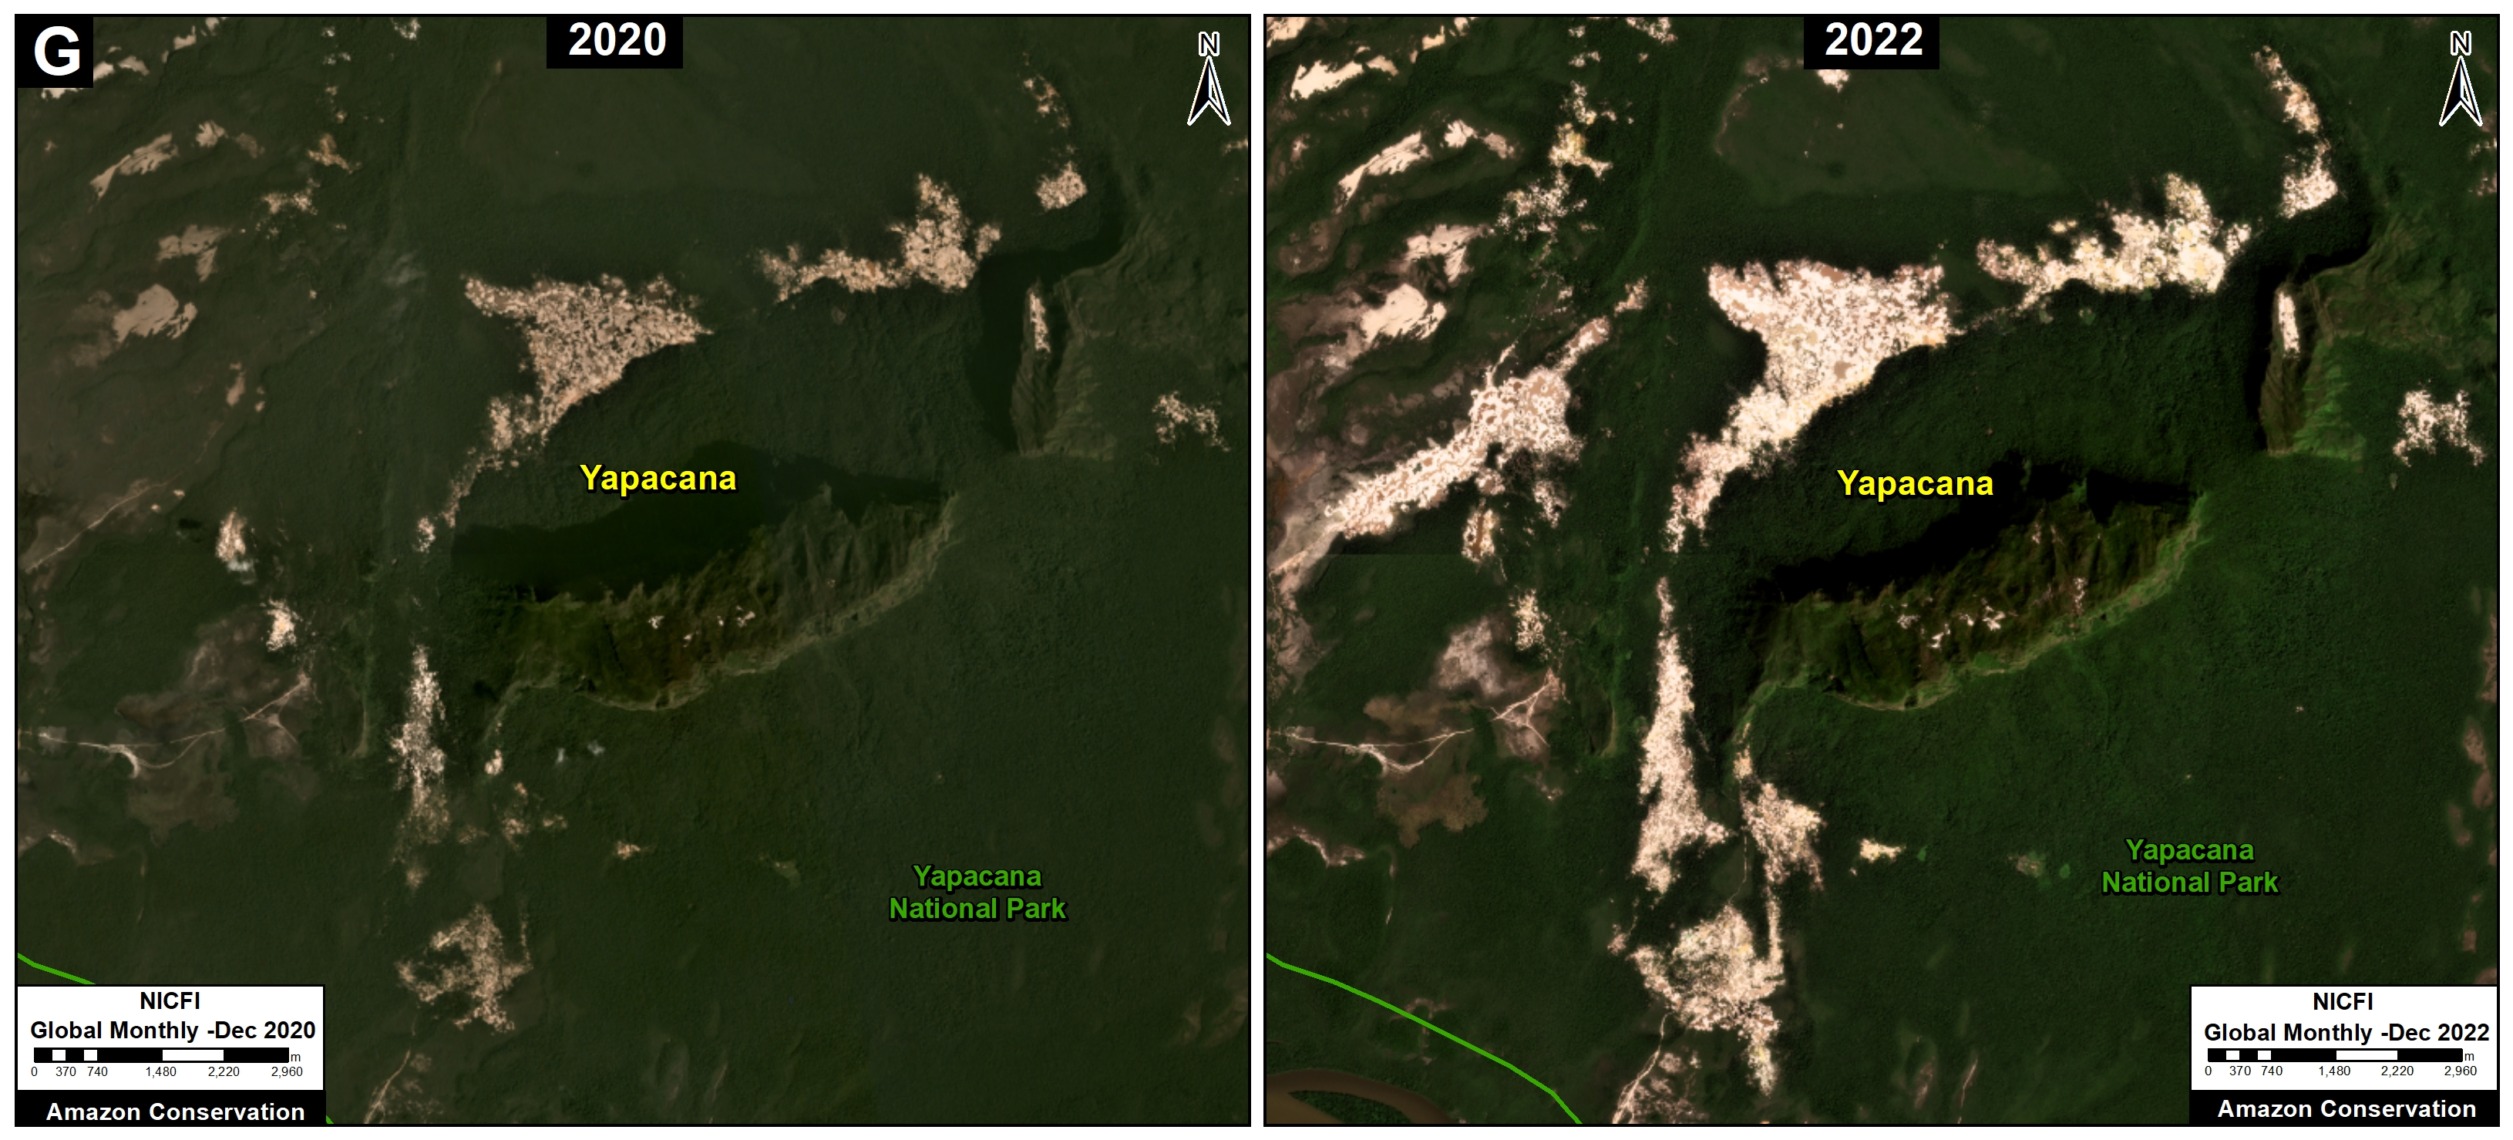
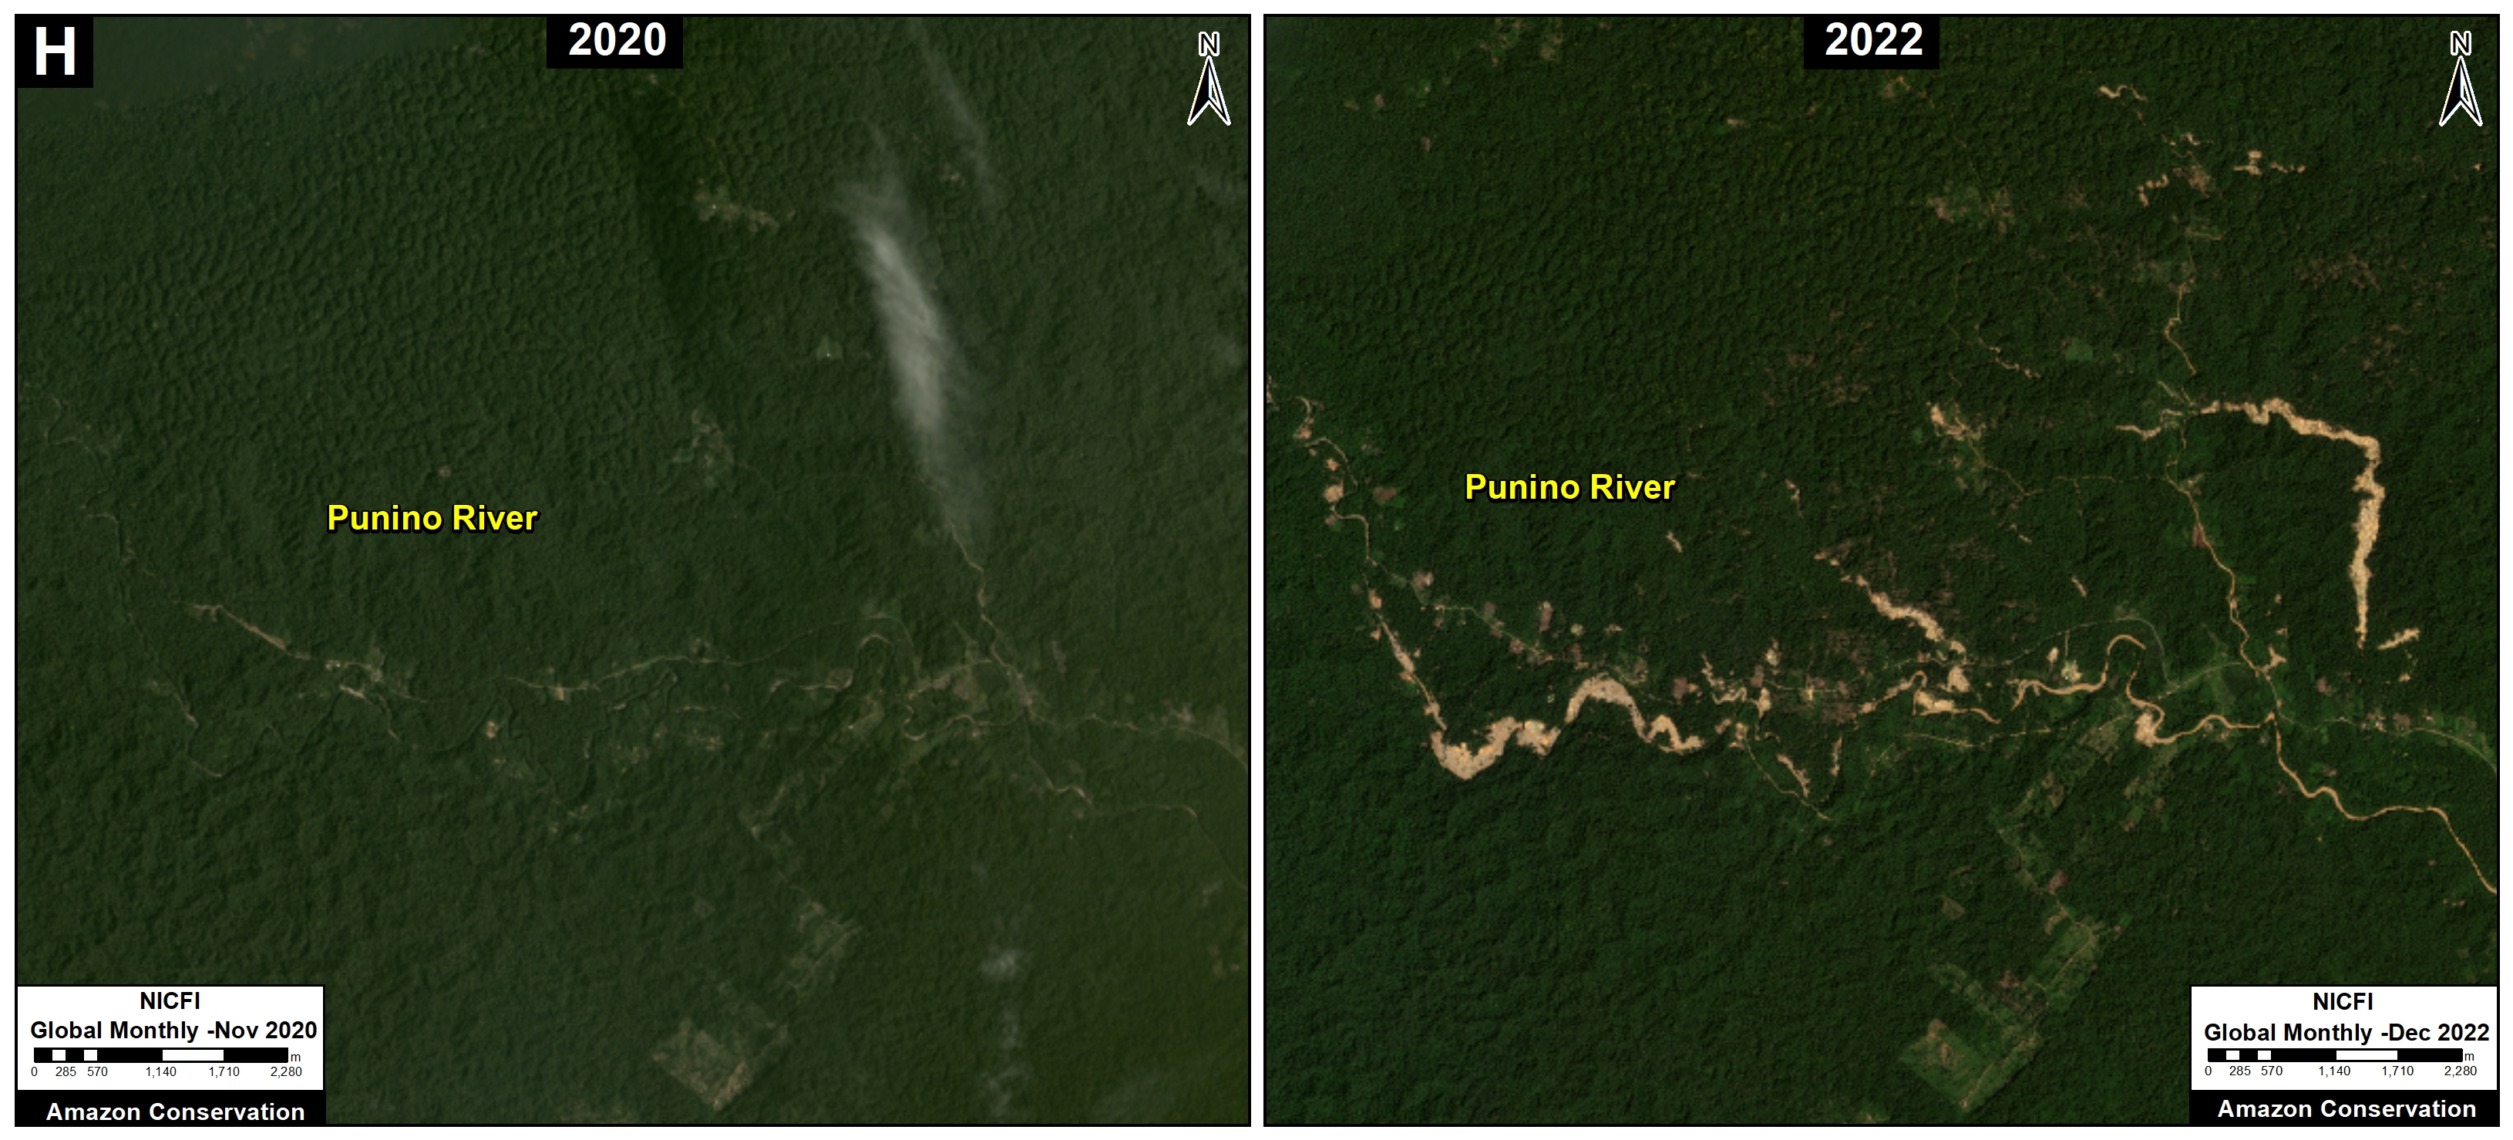
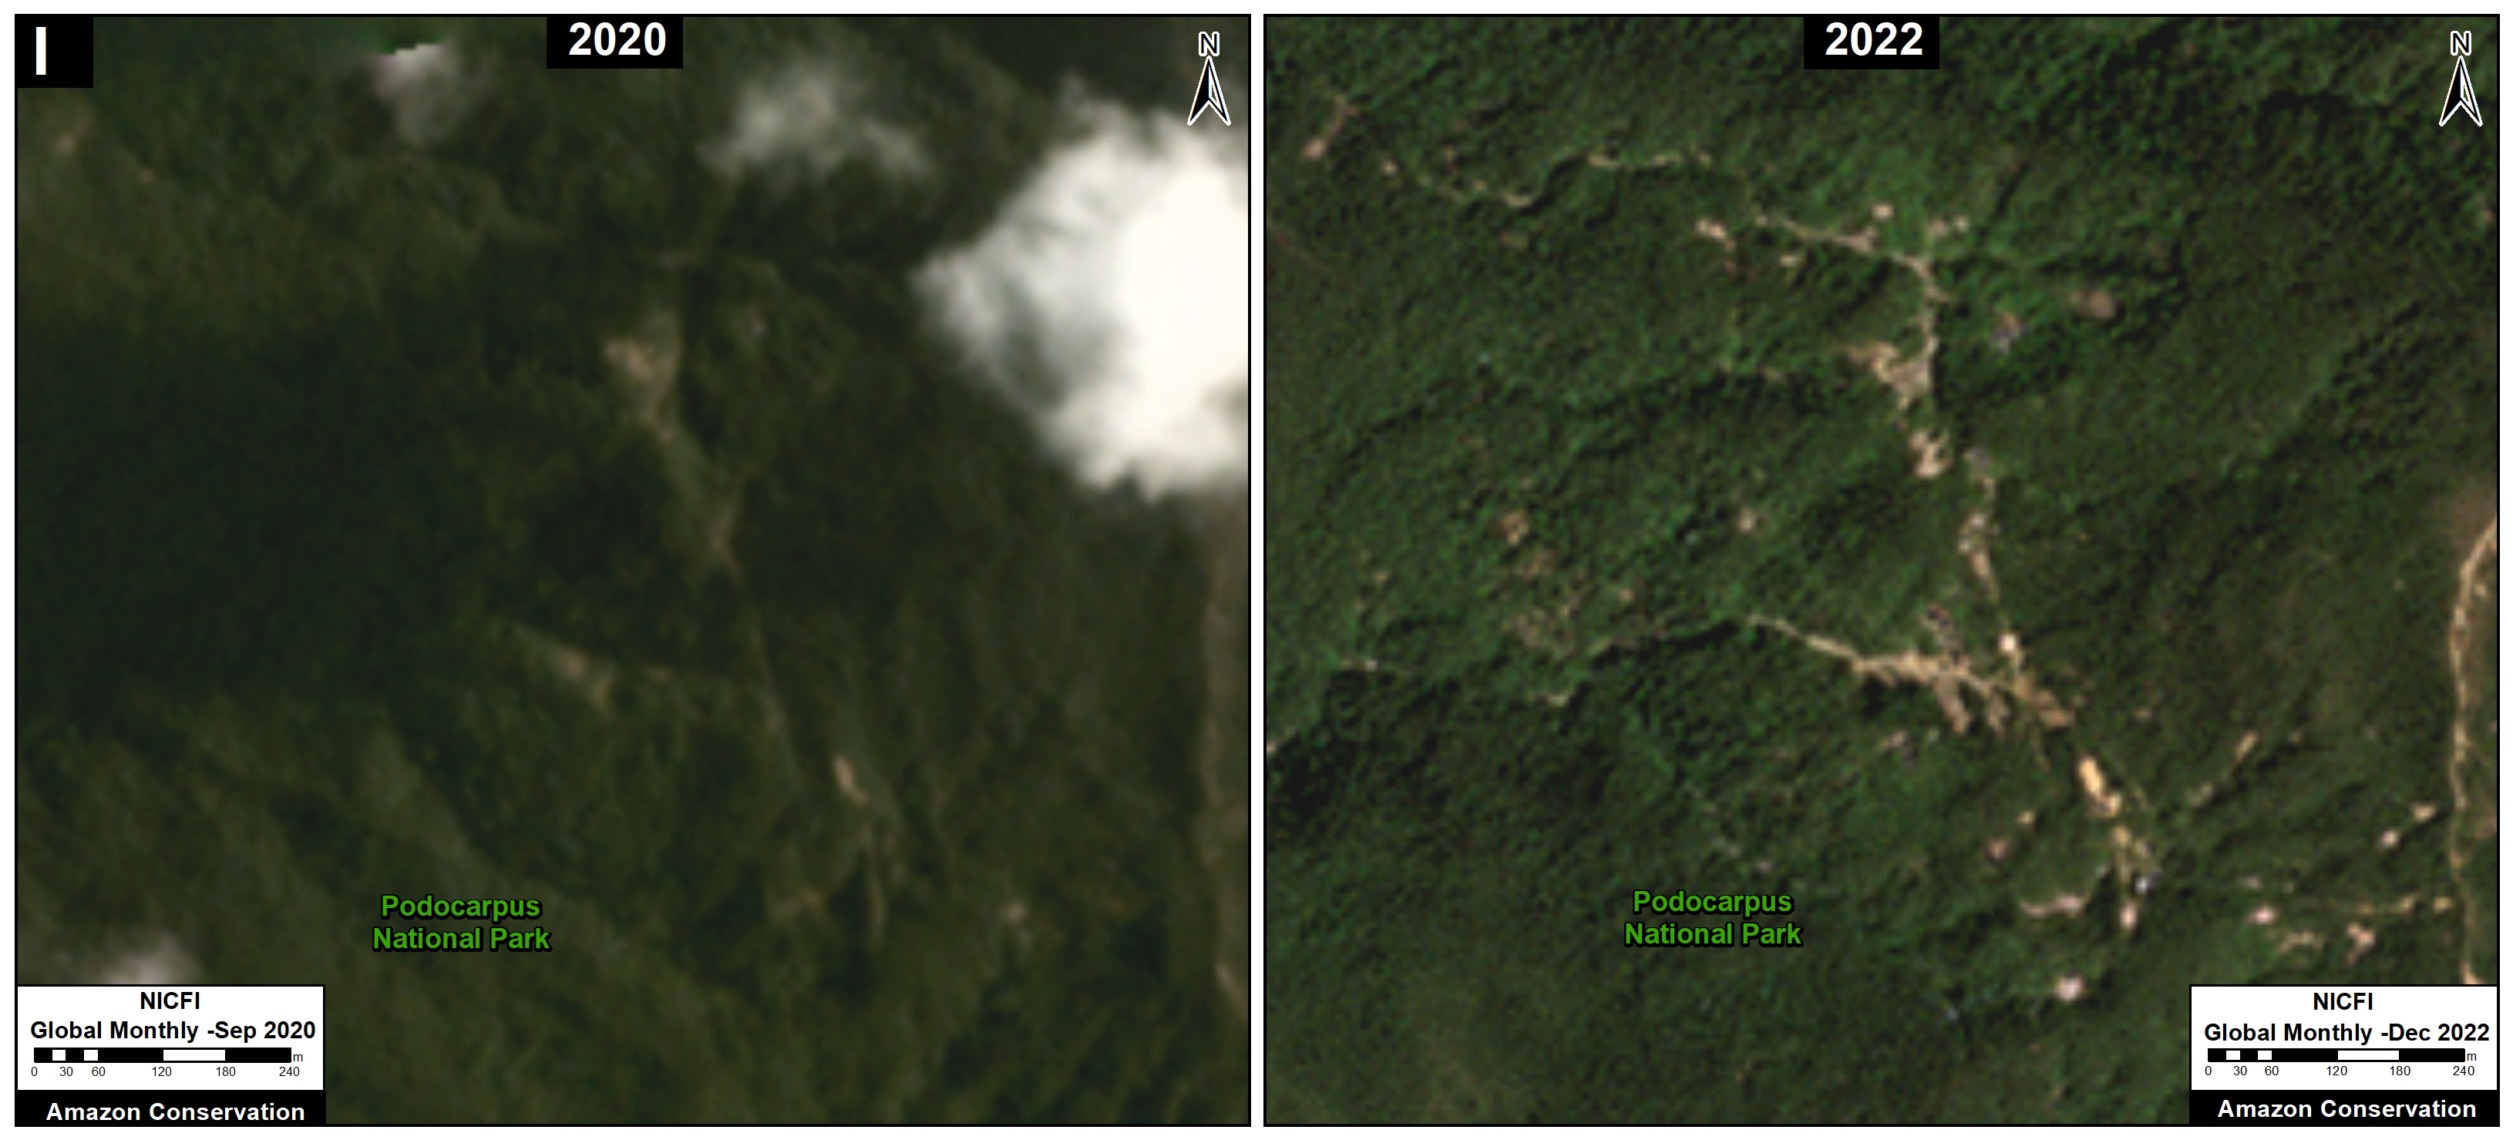
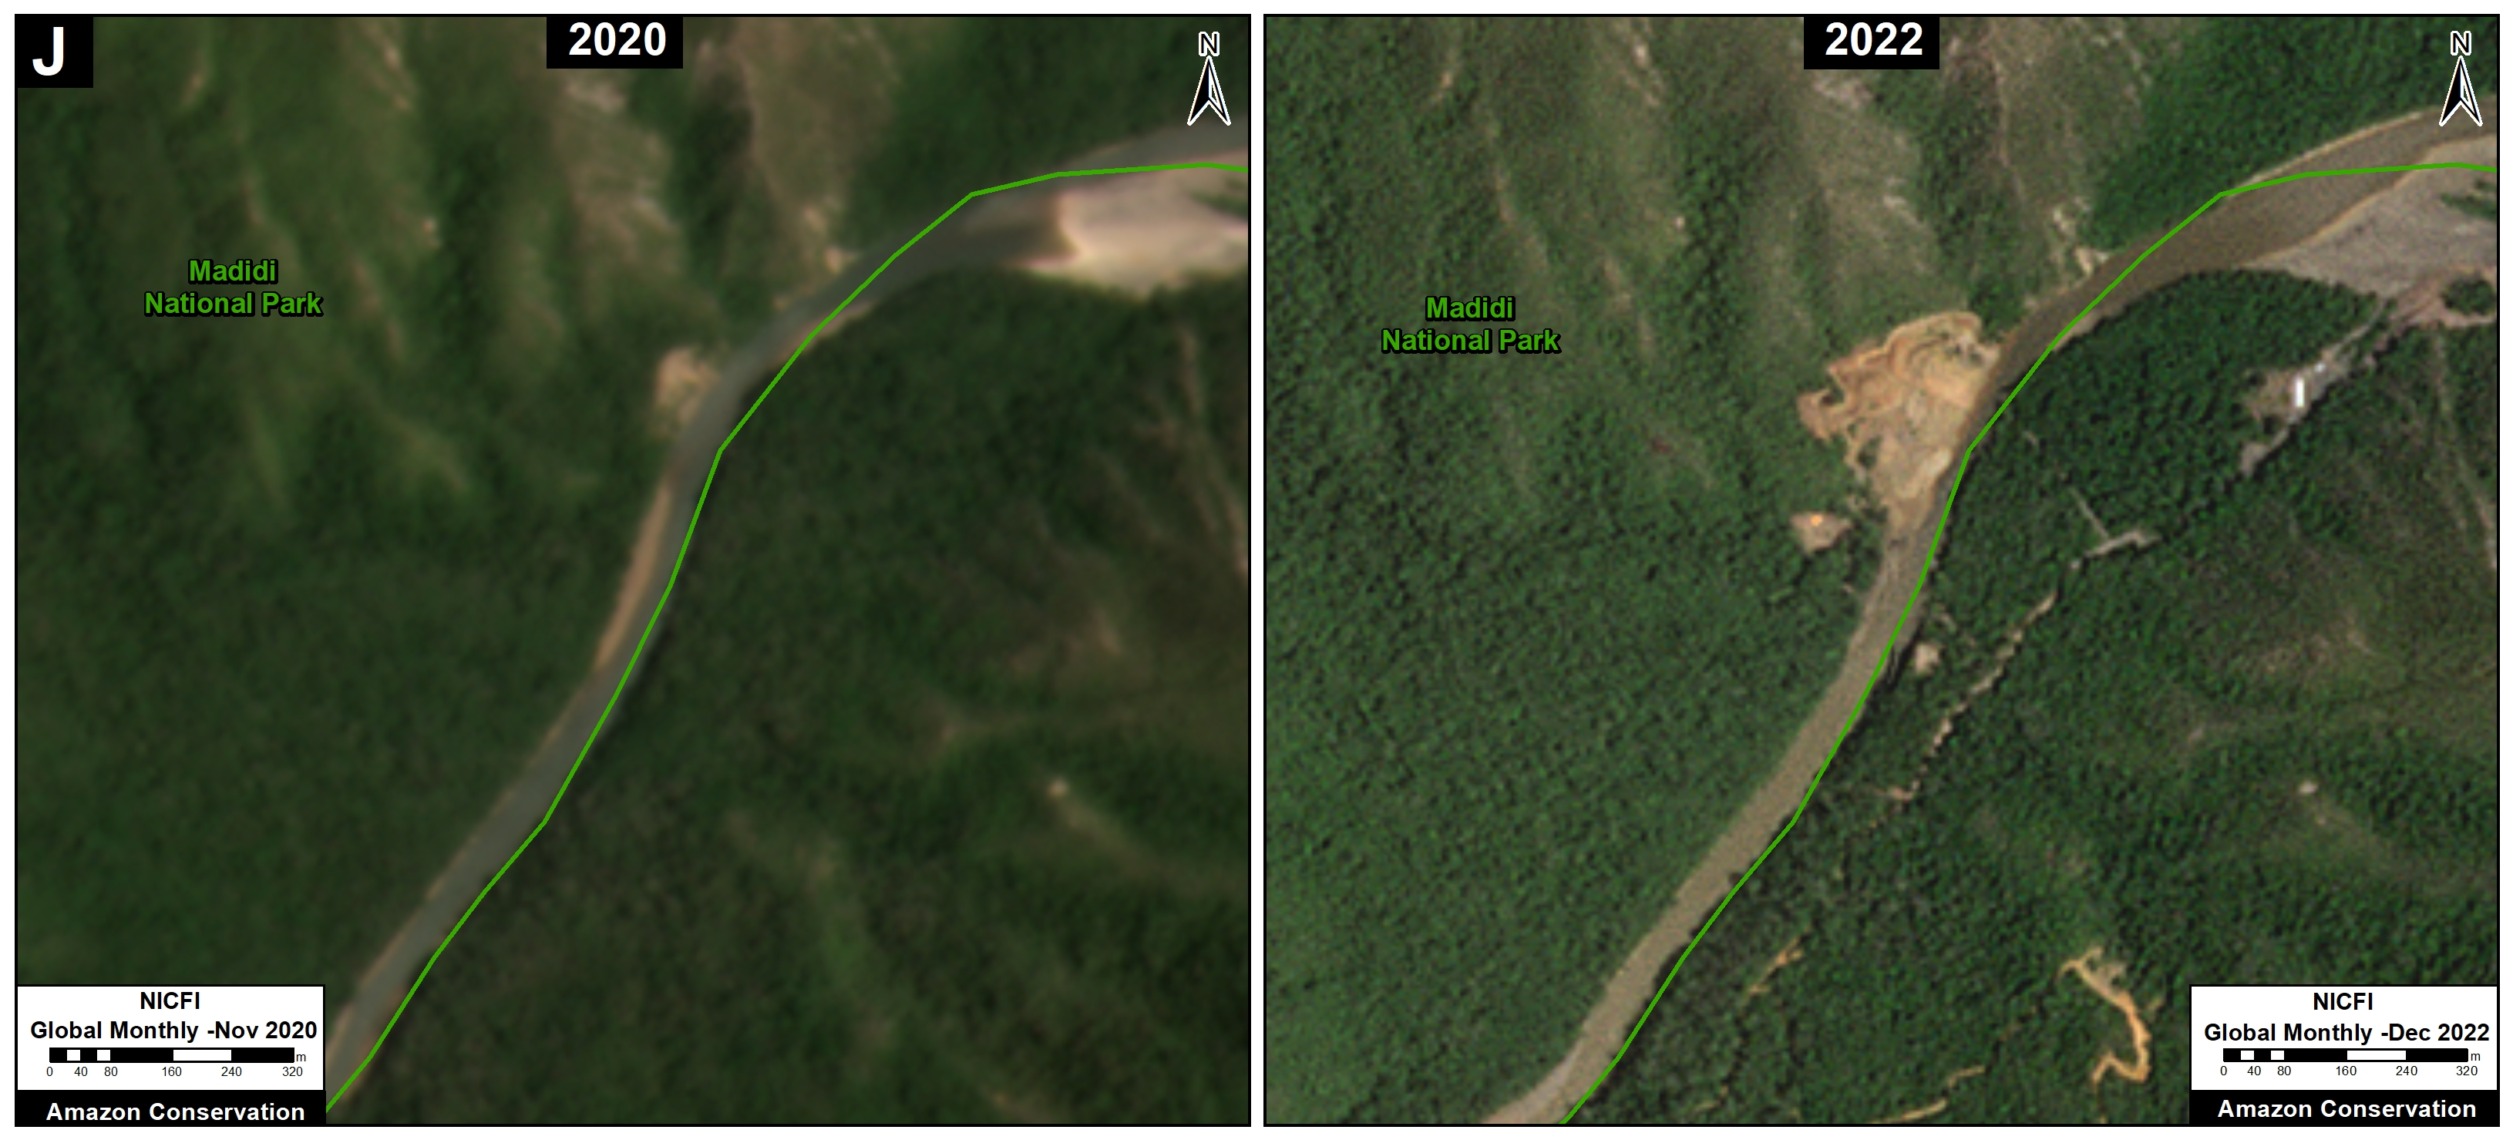
Below, we show a series high-resolution satellite images of the Amazon case studies. Each example highlights recent gold mining deforestation; that is comparing 2020 (left panel) with 2022 (right panel).

Case Studies, in High-resolution

Peruvian Amazon

Southern Peru (specifically, the region of Madre de Dios) is one of the most severe and emblematic examples of gold mining deforestation in the Amazon, clearing thousands of hectares of primary forest (see MAAP #154). The active mining fronts have evolved substantially over the past 20+ years. Most recently, gold mining has impacted areas such as Mangote and Pariamanu.

A. Mangote

B. Pariamanu

Brazilian Amazon

In the vast Brazilian Amazon, illegal gold mining deforestation is most severe across a number of indigenous territories, most notably: Munduruku (Pará state), Kayapó (Pará), and Yanomami (Roraima).

C. Munduruku Indigenous Territory


D. Kayapó Indigenous Territory


E. Yanomami Indigenous Territory

Venezuelan Amazon

Mining is one of the major deforestation drivers in the Venezuelan Amazon (MAAP #155). This mining impact is occurring in the designated Orinoco Mining Arc, but also key protected areas such as Caura, Canaima, and Yapacana National Parks.

F. Canaima National Park


G. Yapacana National Park

Ecuadorian Amazon

We have been documenting the numerous mining deforestation hotspots in the Ecuadorian Amazon that appear to be intensifying in recent years. Two key examples are along the Punino River (Napo and Orellana provinces) and further south in Podocarpus National Park.

H. Punino River

I. Podocarpus National Park

Bolivian Amazon

One of the newest gold mining deforestation hotspots is along the Tuichi River in Madidi National Park.

J. Madidi National Park

Methodology

Mining deforestation hotspots were identified based on MAAP’s ongoing monitoring efforts, and assisted by Amazon Mining Watch.

Acknowledgements

We thank A. Folhadella, S. Novoa, D. Larrea, C. De Ugarte, and M. Teran for helpful comments on this report, and Conservación Amazónica – ACCA for data on mining sites in northern Peru.

This work was supported by Norad (Norwegian Agency for Development Cooperation) and ICFC (International Conservation Fund of Canada).

Citation

Finer M, Ariñez A, Mamani N (2023) Mining Deforestation Across the Amazon. MAAP: 178.

MAAP #182: Gold Mining Deforestation in the Ecuadorian Amazon

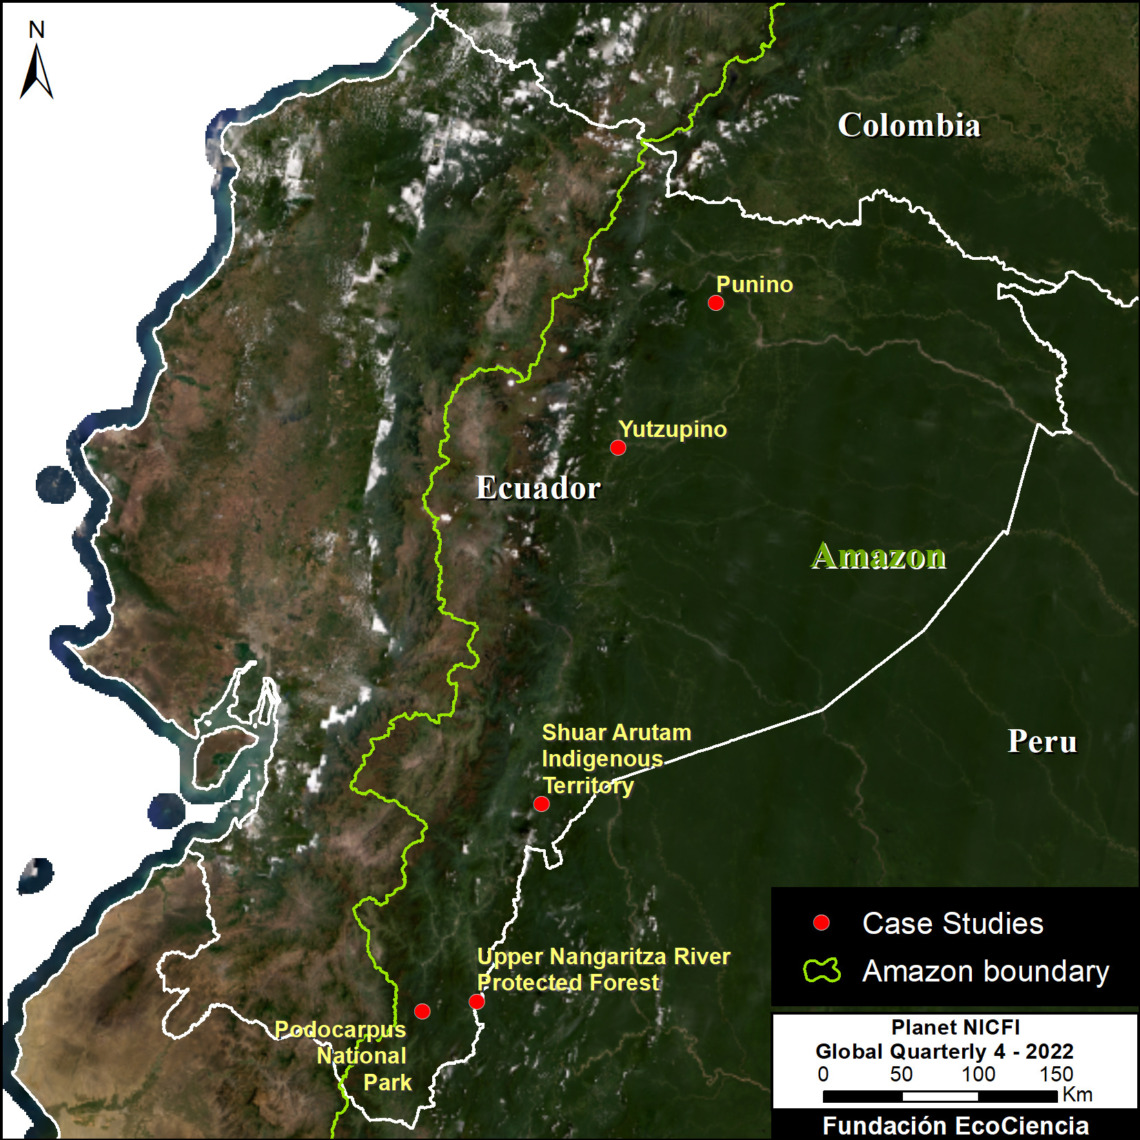
Base Map. Major cases of recent gold mining deforestation in Ecuadorian Amazon.

Gold mining is one of the major deforestation drivers across the Amazon, with well-known cases in Peru, Brazil, and Venezuela.

In a recent series of technical articles*, in collaboration with the Ecuadorian organization Foundation EcoCiencia, we have also shown that gold mining is escalating in the Ecuadorian Amazon.

Here, we summarize the results from the series and present 5 major cases of recent gold mining deforestation in Ecuador (see Base Map).

These cases, which include gold mining expansion in protected areas, indigenous territories, and primary forests, are:

  • Punino River, located between Napo and Orellana provinces, has experienced the rapid mining deforestation expansion of 217 hectares since 2019.
    l
  • Yutzupino, located in Napo province, has experienced mining deforestation of 125 hectares since 2021. Surrounding sites in Napo have added 490 hectares since 2017.
    l
  • Shuar Arutam Indigenous Territory, located in Morona Santiago province, has experienced 257 hectares of mining deforestation since 2021.
    l
  • Podocarpus National Park, located in Zamora Chinchipe province, has experienced 25 hectares of mining deforestation within the park since 2019.
    k
  • Upper Nangaritza River Protected Forest, also located in Zamora Chinchipe has experienced 545 hectares of mining deforestation since 2018.

In total, we have documented the recent gold mining deforestation of 1,660 hectares (4,102 acres) in the Ecuadorian Amazon. This is equivalent to 2,325 soccer fields.

For each case, we show high-resolution satellite images of the recent gold mining deforestation.

Case Studies – Recent Gold Mining Deforestation in the Ecuadorian Amazon

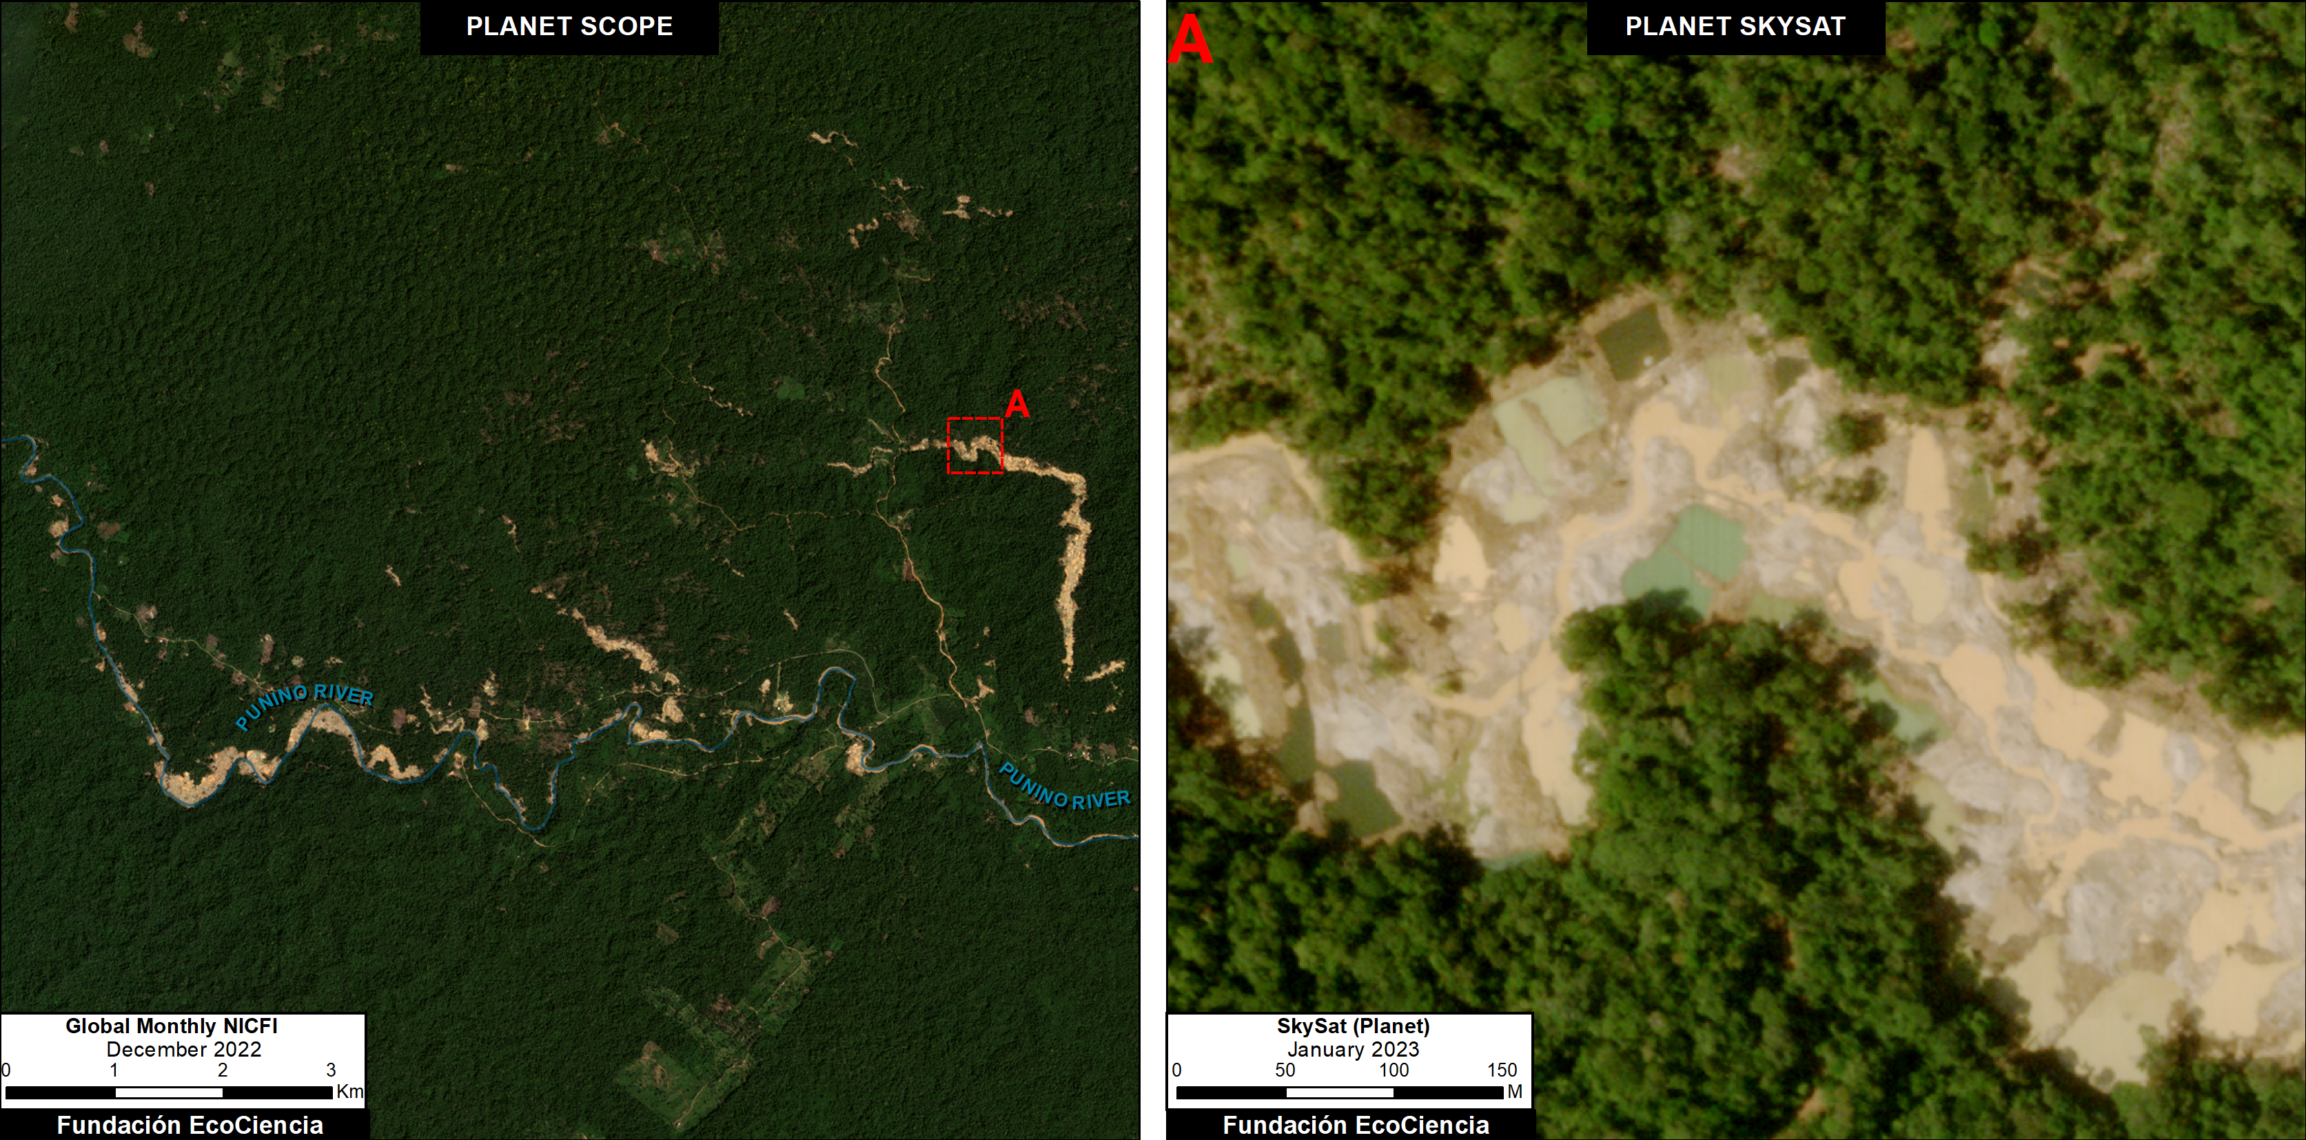
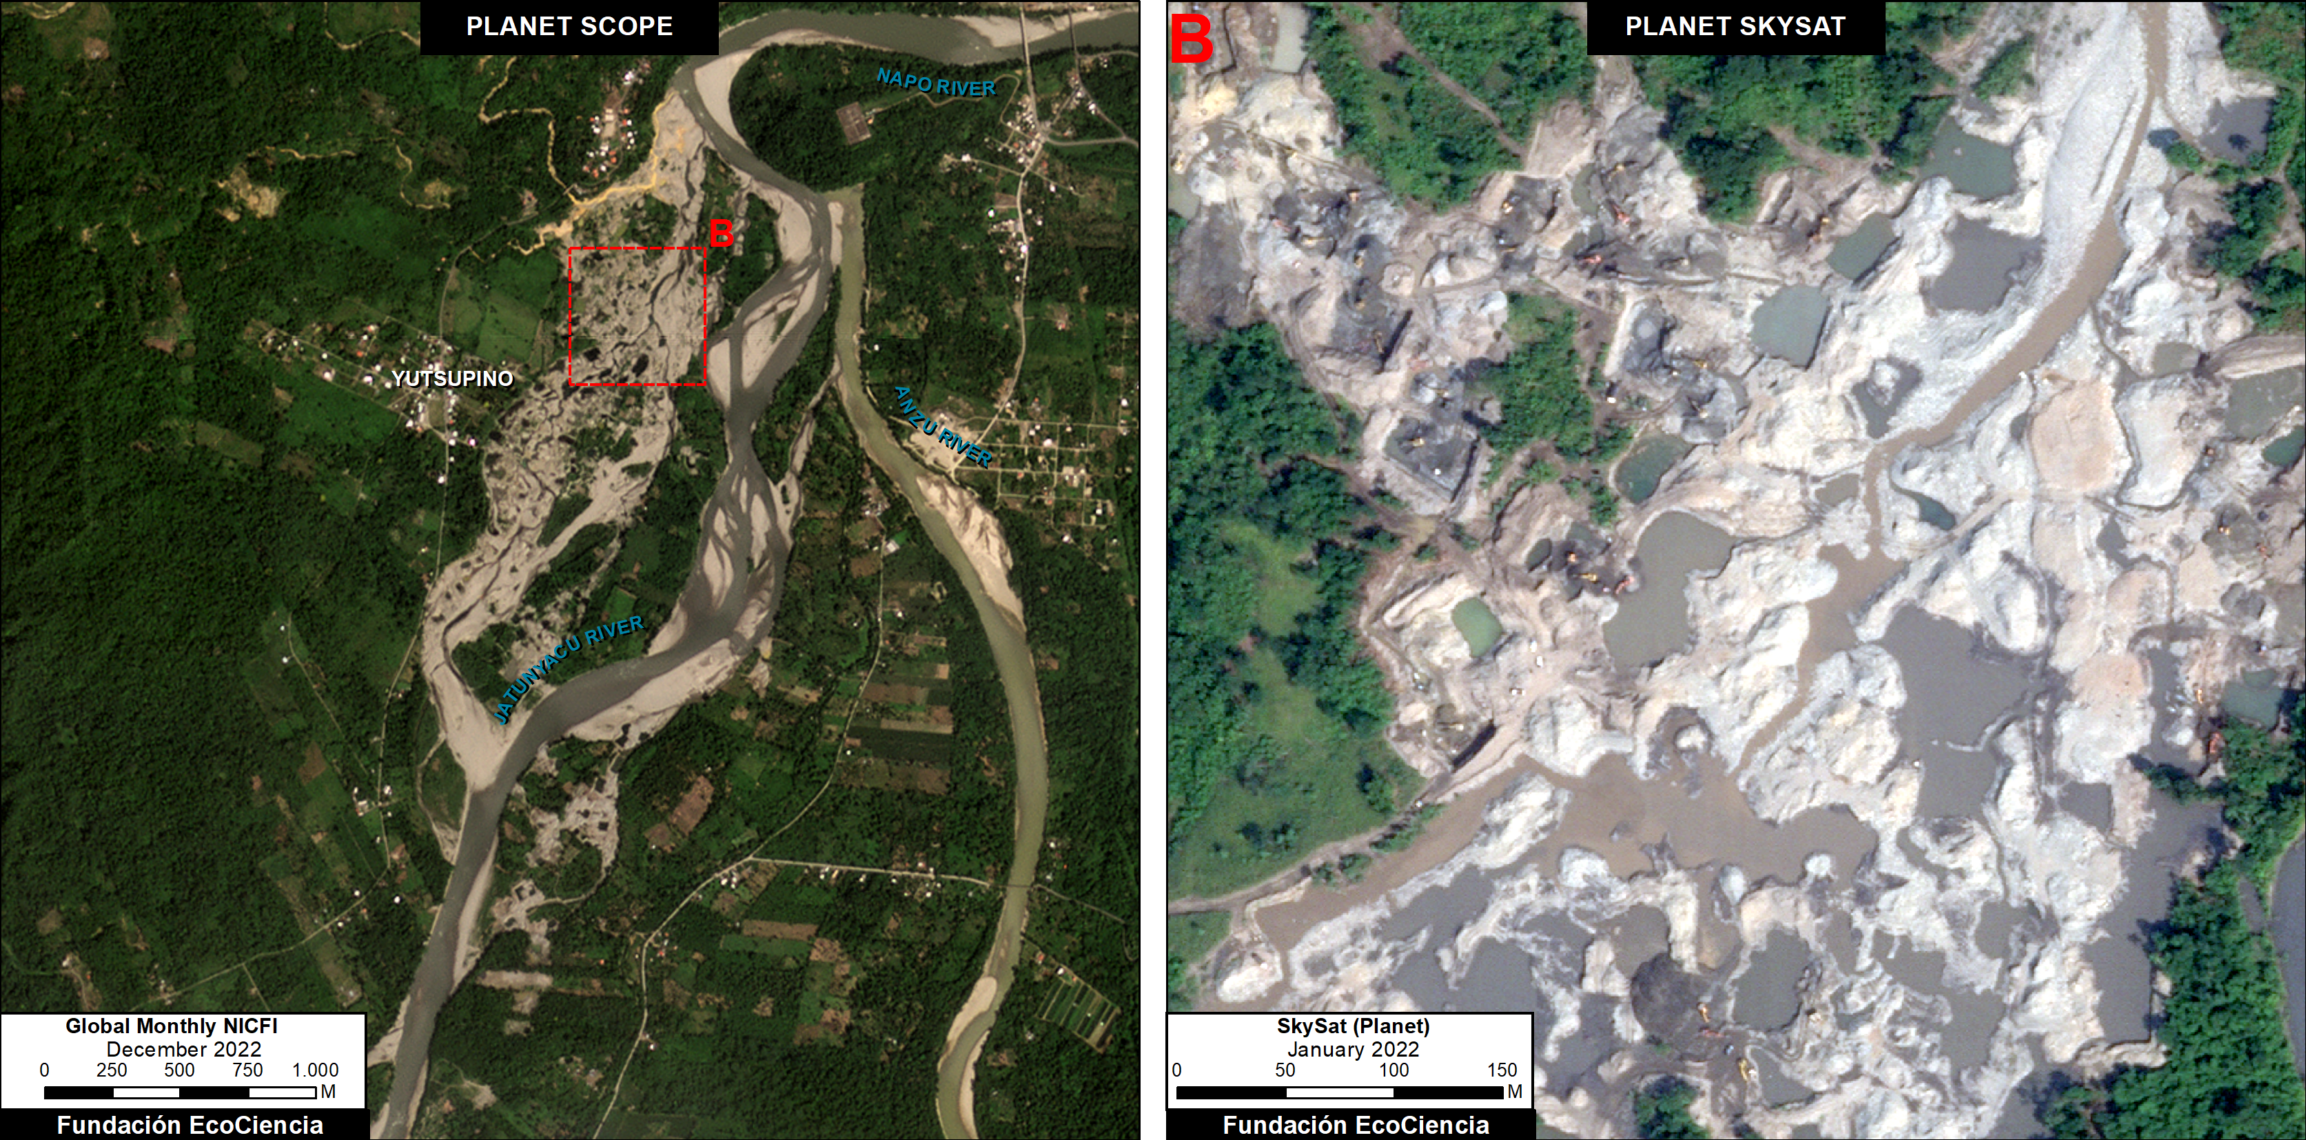
For each of the five cases presented below, we show both a high-resolution (3 meters) example of the recent mining deforestation (left panel) and very-high resolution (0.5 meters) zoom of the mining activity (right panel).

Punino River

Along the Punino River, located between Napo and Orellana provinces, we have documented the rapid mining deforestation expansion of 217 hectares since November 2019. Alarmingly, much of this activity (85%) occurred most recently in 2022. See MAAP #176 for more details.

Case 1. Punino River.

Yutzupino/Napo

In this area, located in Napo province, we have documented the mining deforestation of 125 hectares since October 2021, including major impacts along the Jatunyacu River. Surrounding sites in Napo have added 490 hectares since 2017. See MAAP #151 and MAAP #162 for more details.

Case 2. Yutzupino/Napo.

Upper Nangaritza River Protected Forest

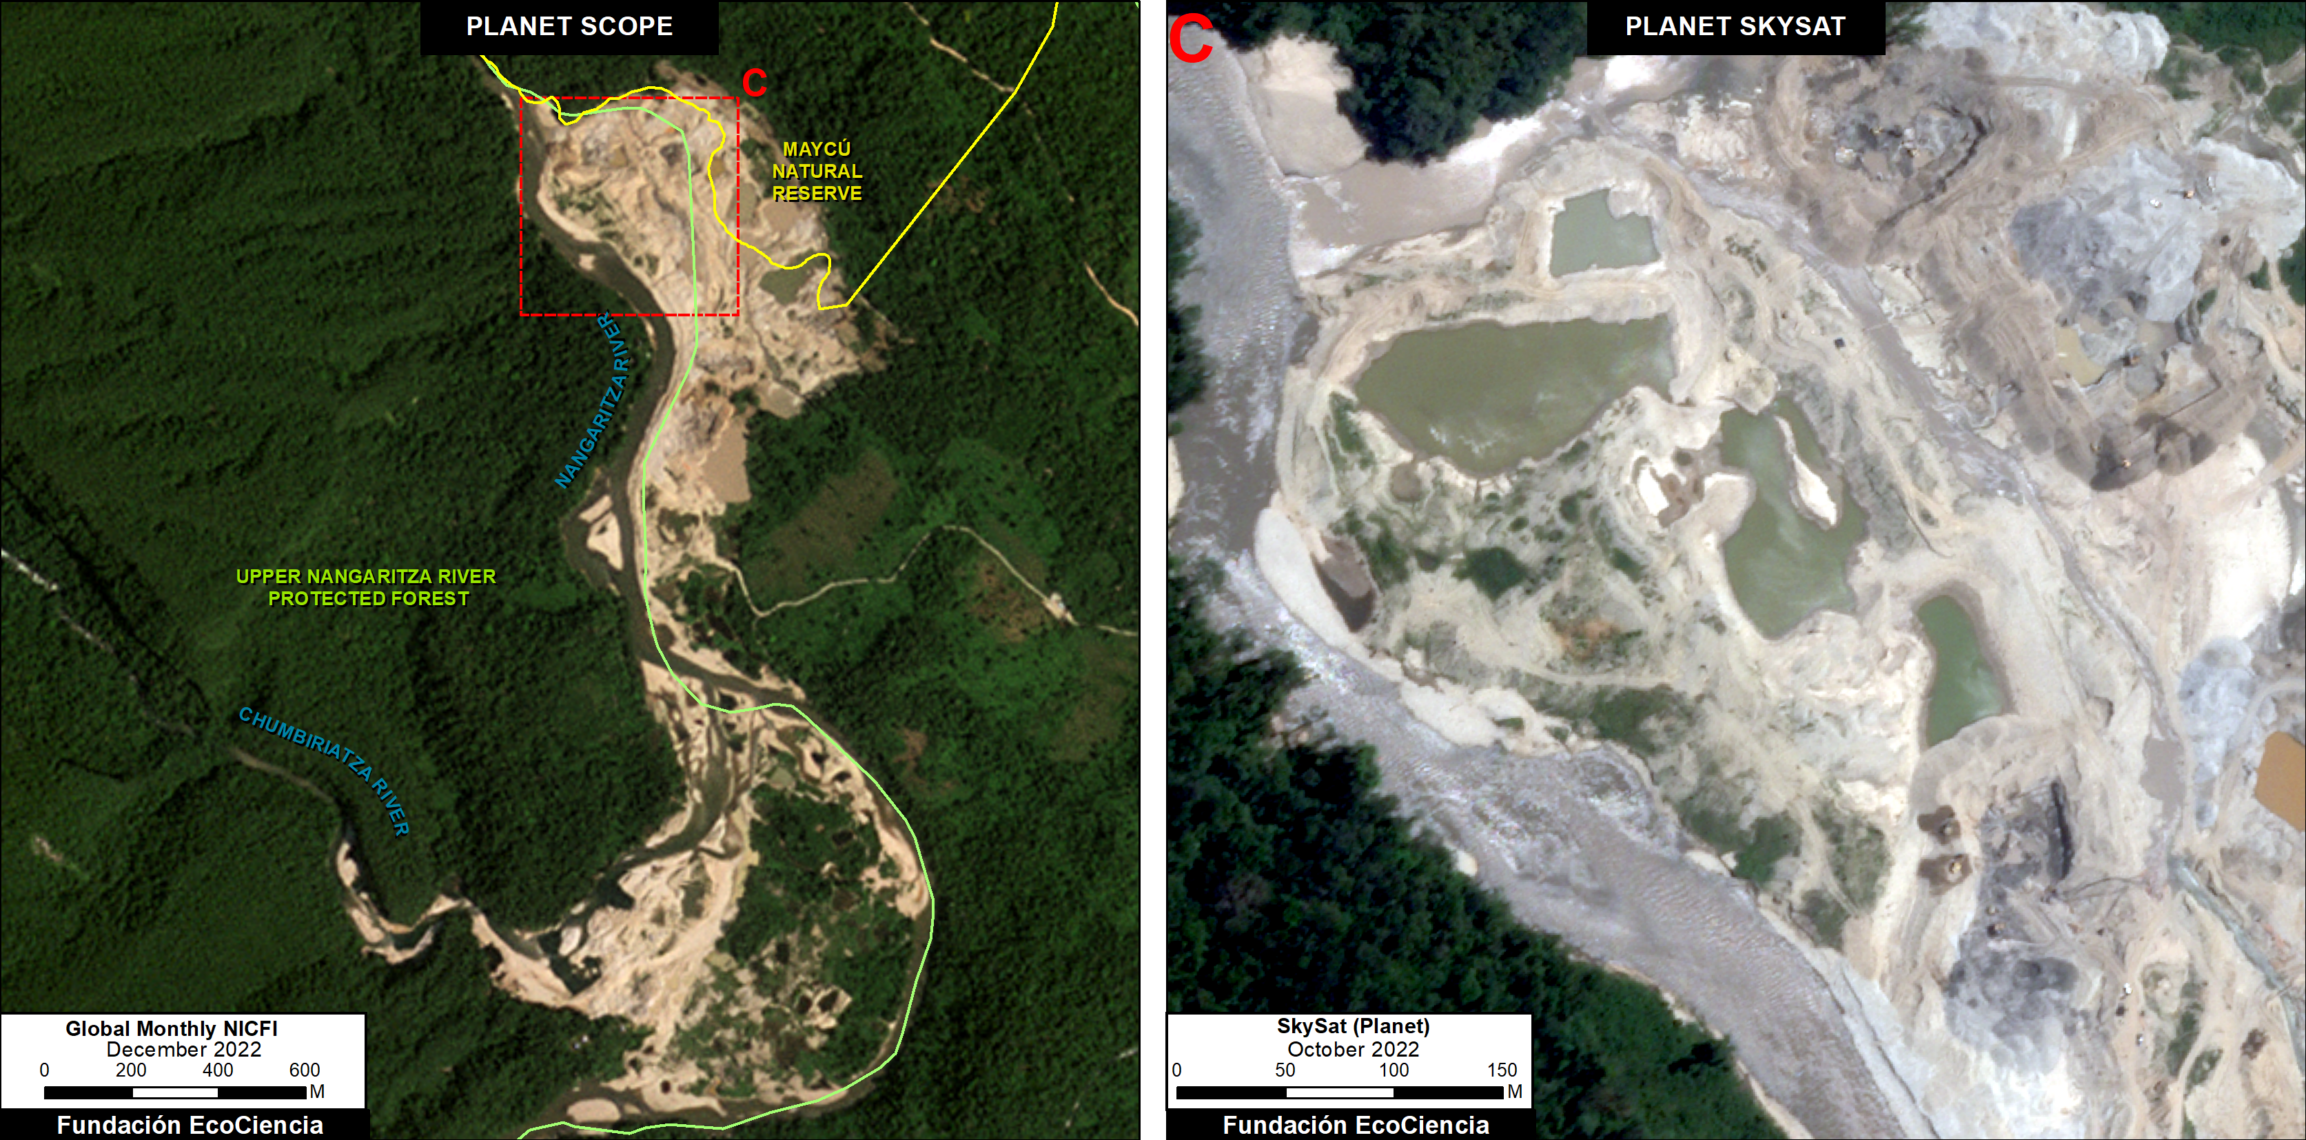
In Upper Nangaritza River Protected Forest, also located in Zamora Chinchipe province, we have documented the mining deforestation of 545 hectares since 2018 along the Nangaritza River. See MAAP #167 for more details.

Case 3. Upper Nangaritza River Protected Forest.

Shuar Arutam Indigenous Territory

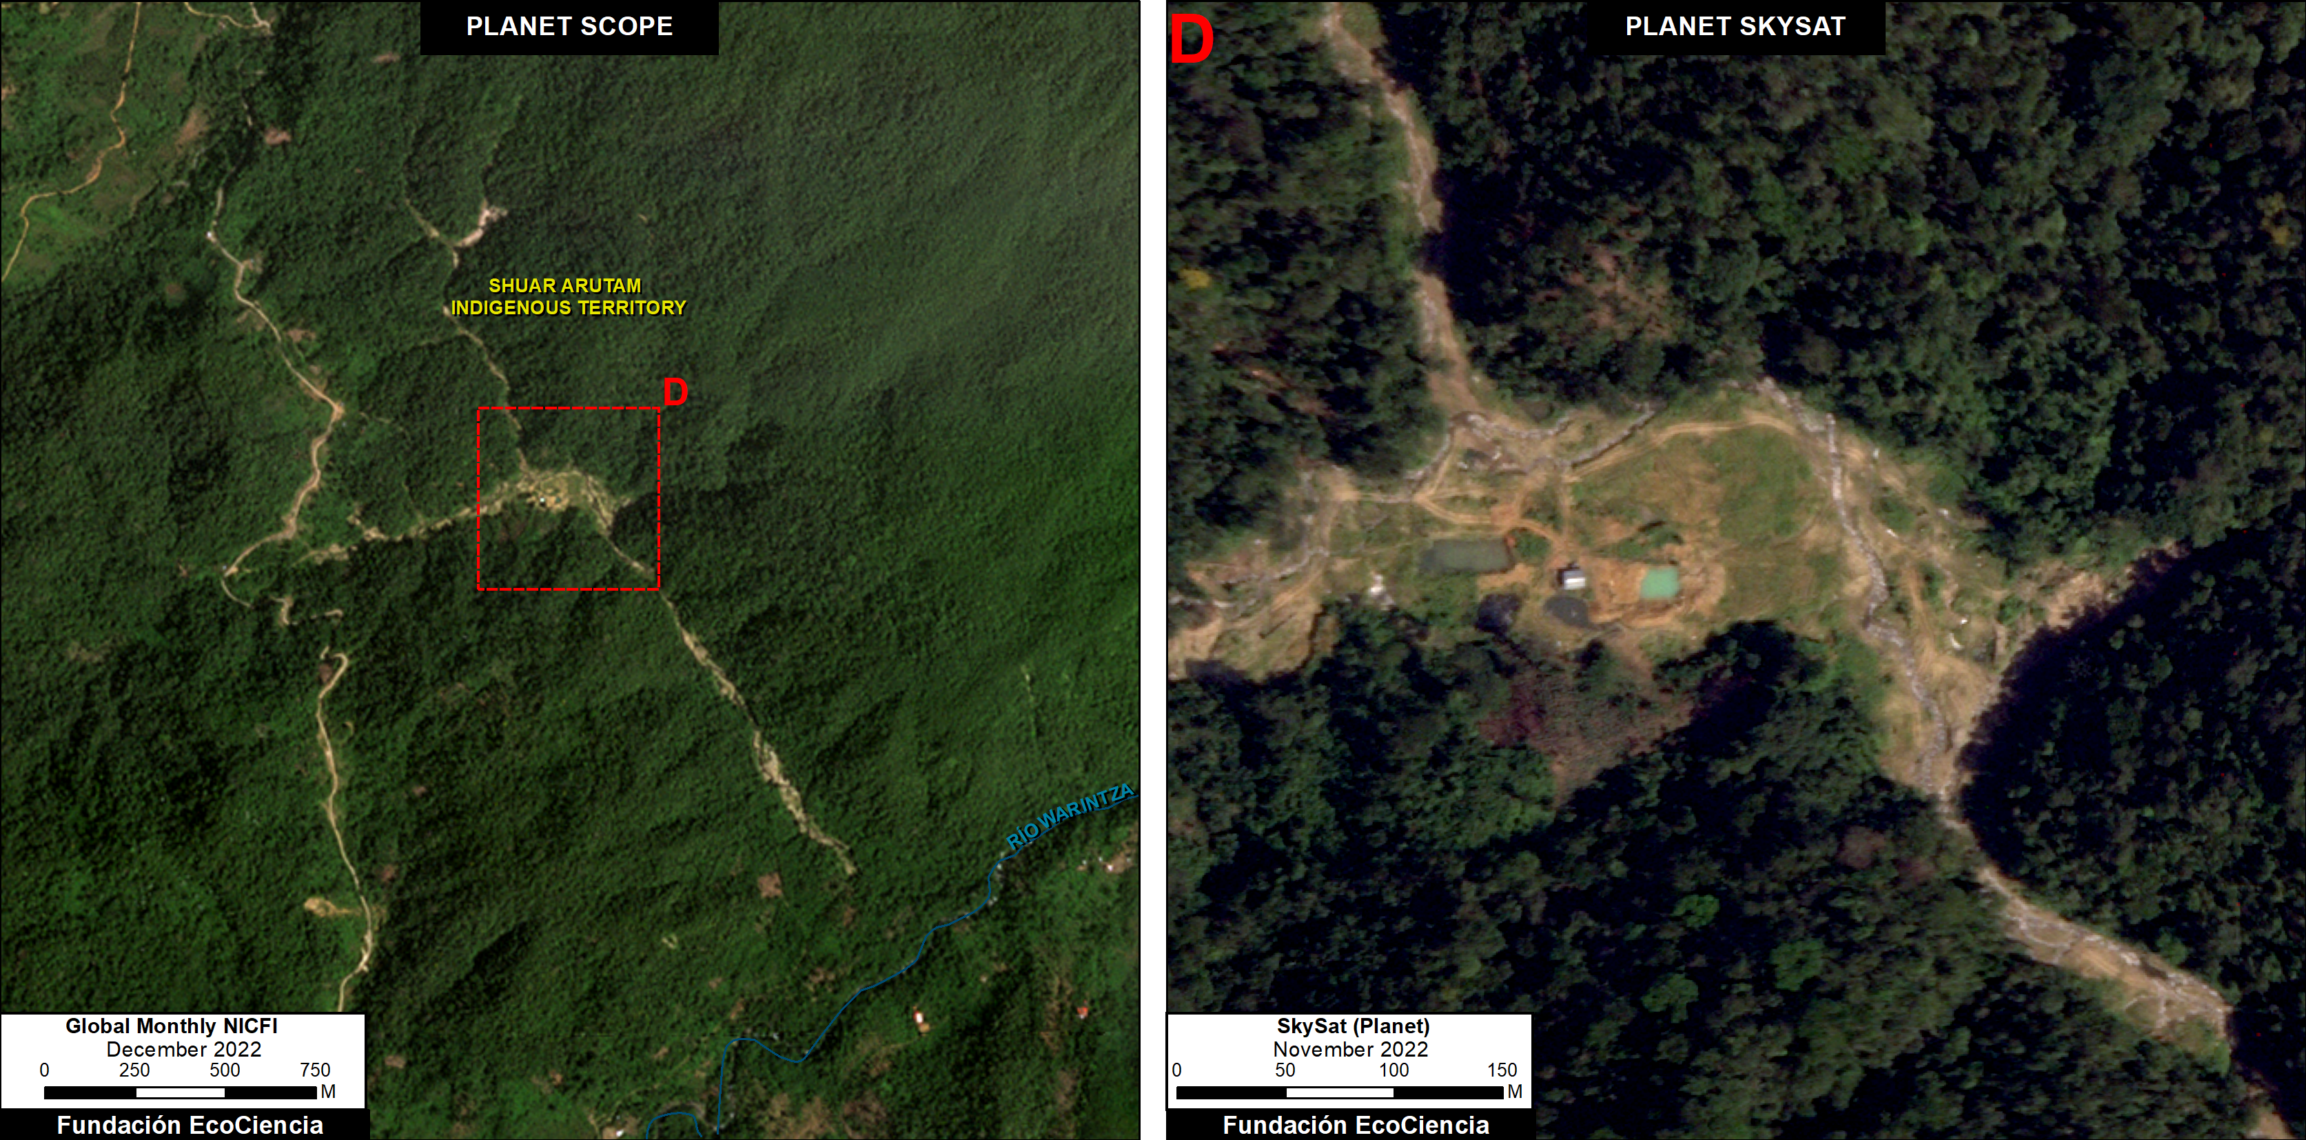
In the Shuar Arutam Indigenous Territory, located in Morona Santiago province, we have documented the mining deforestation of 257 hectares since 2021. See MAAP #170 for more details.

Case 4. Shuar Arutam Indigenous Territory.

Podocarpus National Park

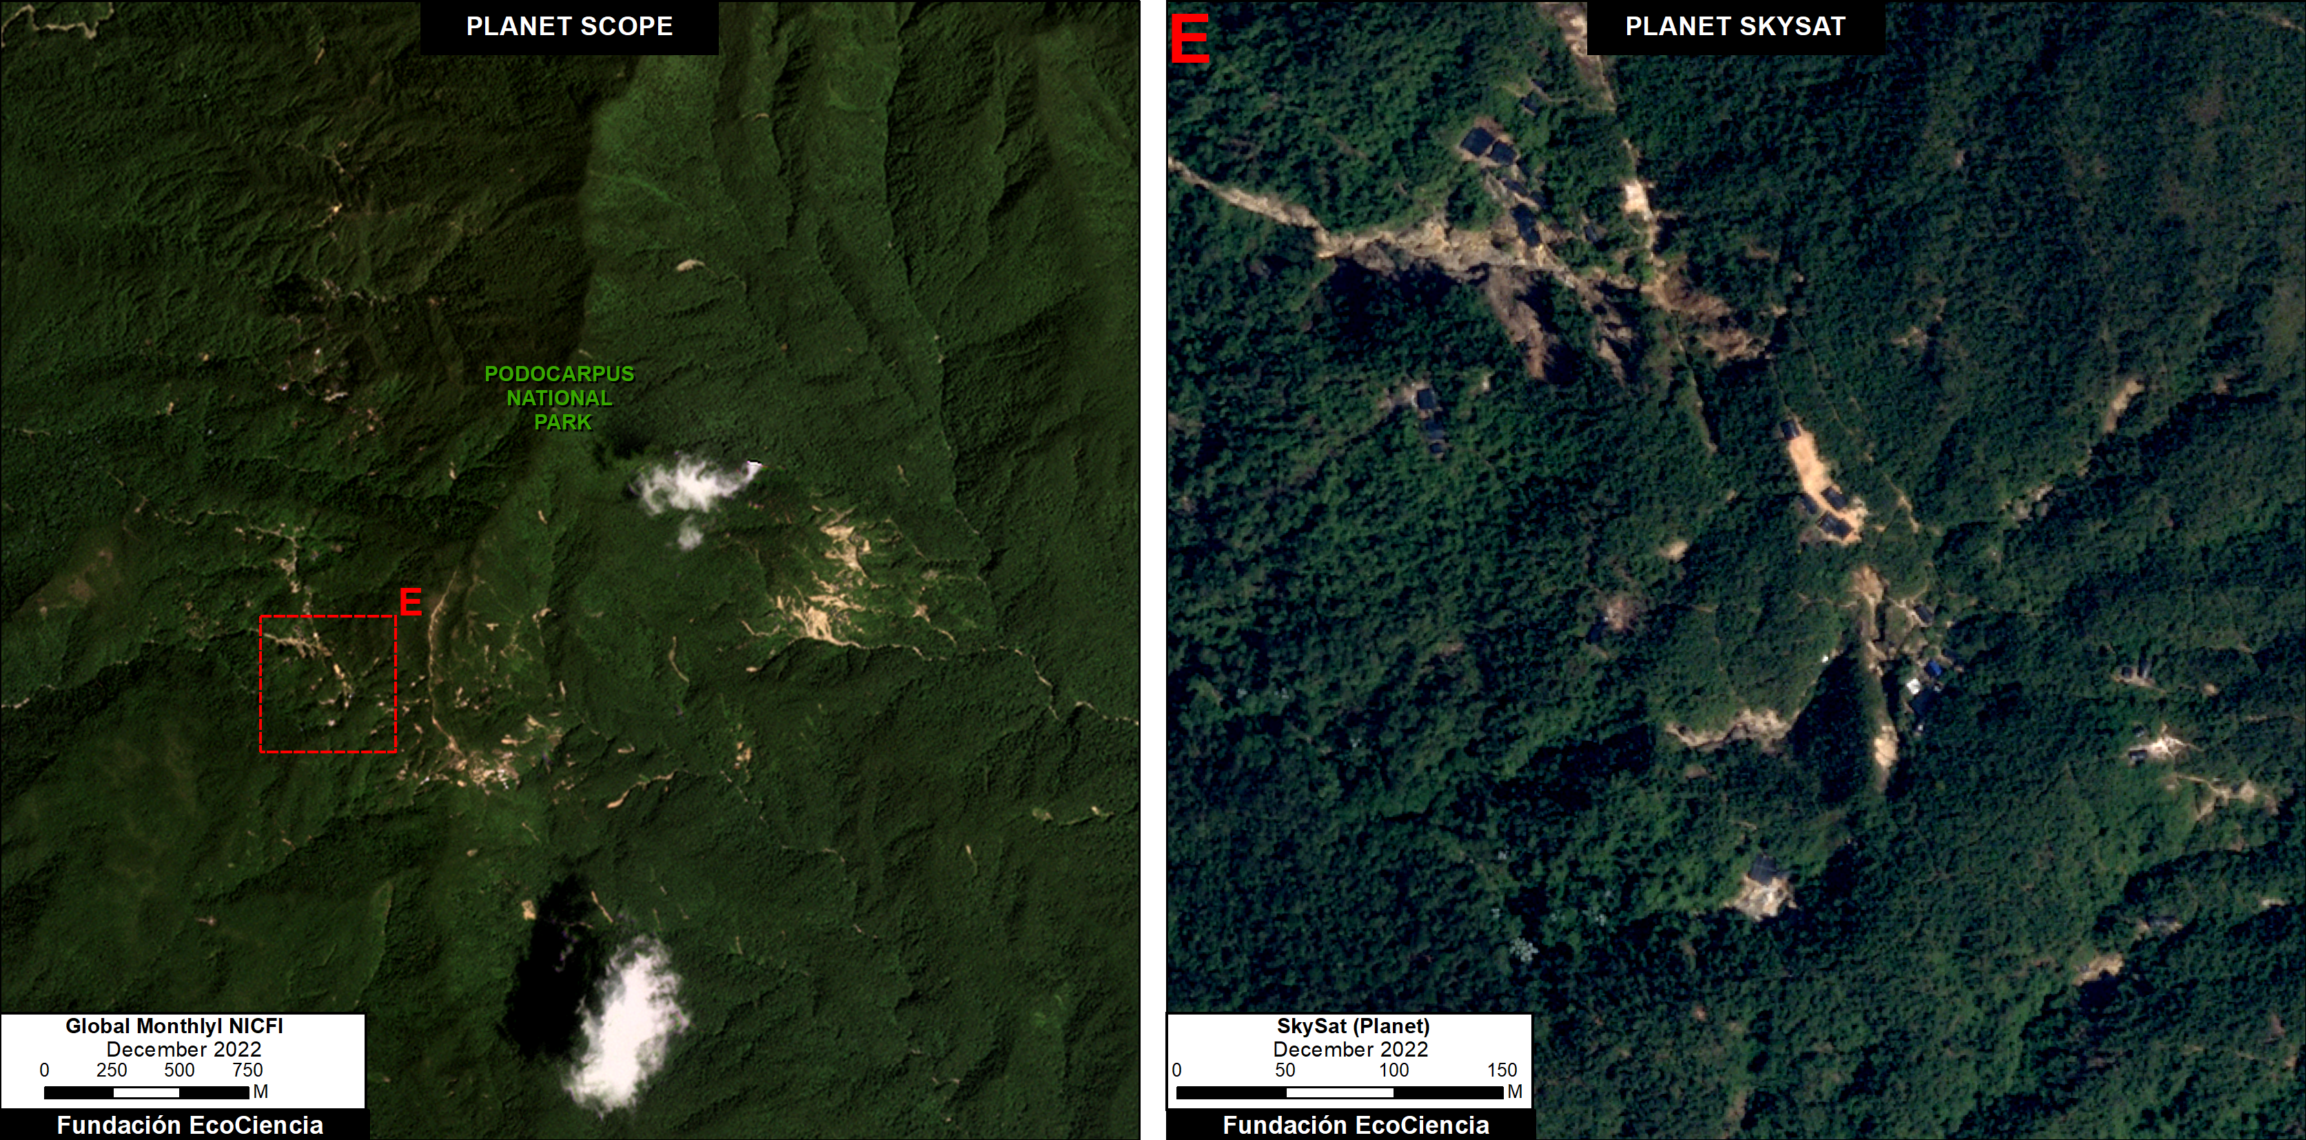
In Podocarpus National Park, located in Zamora Chinchipe province, we have documented the mining deforestation of 25 hectares since 2019 within the park, including the presence of over 200 mining camps. See MAAP #172 for more details.

Case 5. Podocarpus National Park.

*MAAP Technical Reports

MAAP #176: Expansión Alarmante de Minería en la Amazonía Ecuatoriana (Caso Punino)
https://www.maapprogram.org/2023/mineria-ecuador-punino/

MAAP #172: Minería ilegal de oro en el Parque Nacional Podocarpus, Ecuador
https://www.maapprogram.org/2023/mineria-podocarpus-ecuador/

MAAP #170: Actividad Minera en Territorio Shuar Arutam (Amazonia Ecuatoriana)
https://www.maapprogram.org/2022/mineria-shuar-arutam-ecuador/

MAAP #167: Actividad Minera en el Bosque Protector Cuenca Alta del Río Nangaritza (Ecuador)
https://www.maapprogram.org/2022/minera-nangaritza-ecuador/

MAAP #162: Dinámica de la actividad minera en la  provincia de Napo (Ecuador)
https://www.maapprogram.org/2022/mineria-napo-ecuador/

MAAP #151: Minería Ilegal en la Amazonía Ecuatoriana
https://www.maapprogram.org/2022/mineria-ecuador/

Acknowledgments

This report is part of a series focused on the Ecuadorian Amazon through a strategic collaboration between the organizations Fundación EcoCiencia and Amazon Conservation, with the support of the Norwegian Agency for Development Cooperation (Norad).

MAAP #181: Illegal Gold Mining in Yanomami Indigenous Territory (Brazil)

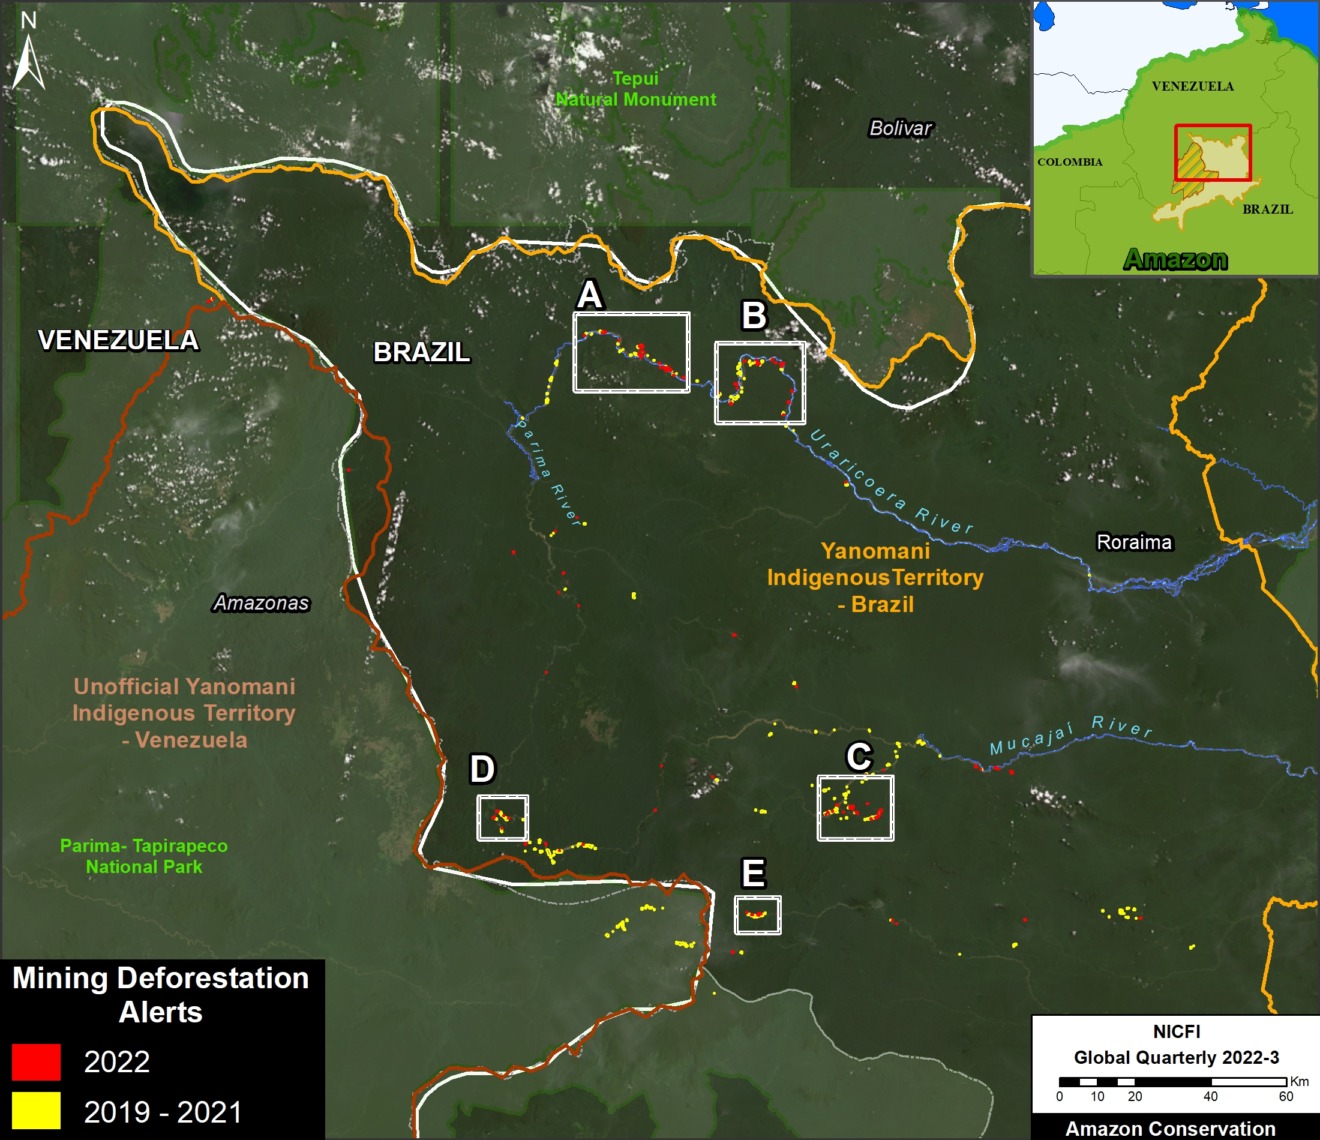
Base Map. Illegal mining deforestation alerts in Yanomami Indigenous Territory (northern Brazilian Amazon).

The Brazilian government recently launched a series of raids against illegal gold mining in Yanomami Indigenous Territory, located in the northern Brazilian Amazon (see inset of Base Map).

These raids highlight the severe consequences brought by illegal mining activity, particularly deforestation, contamination, malnutrition, and disease.

Here we present the results of a new machine learning algorithm that analyzes satellite imagery archives across large areas to quickly and precisely detect new gold mining deforestation fronts.

The resolution of these mining deforestation alerts is 10 meters, based on the European Space Agency’s freely available Sentinel-2 satellite imagery data.

These alerts reveal the extent of the gold mining deforestation in Yanomami Indigenous Territory is much greater than realized (see Base Map).

In the Base Map, the red dots indicate the most recent gold mining deforestation alerts, occurring in 2022.

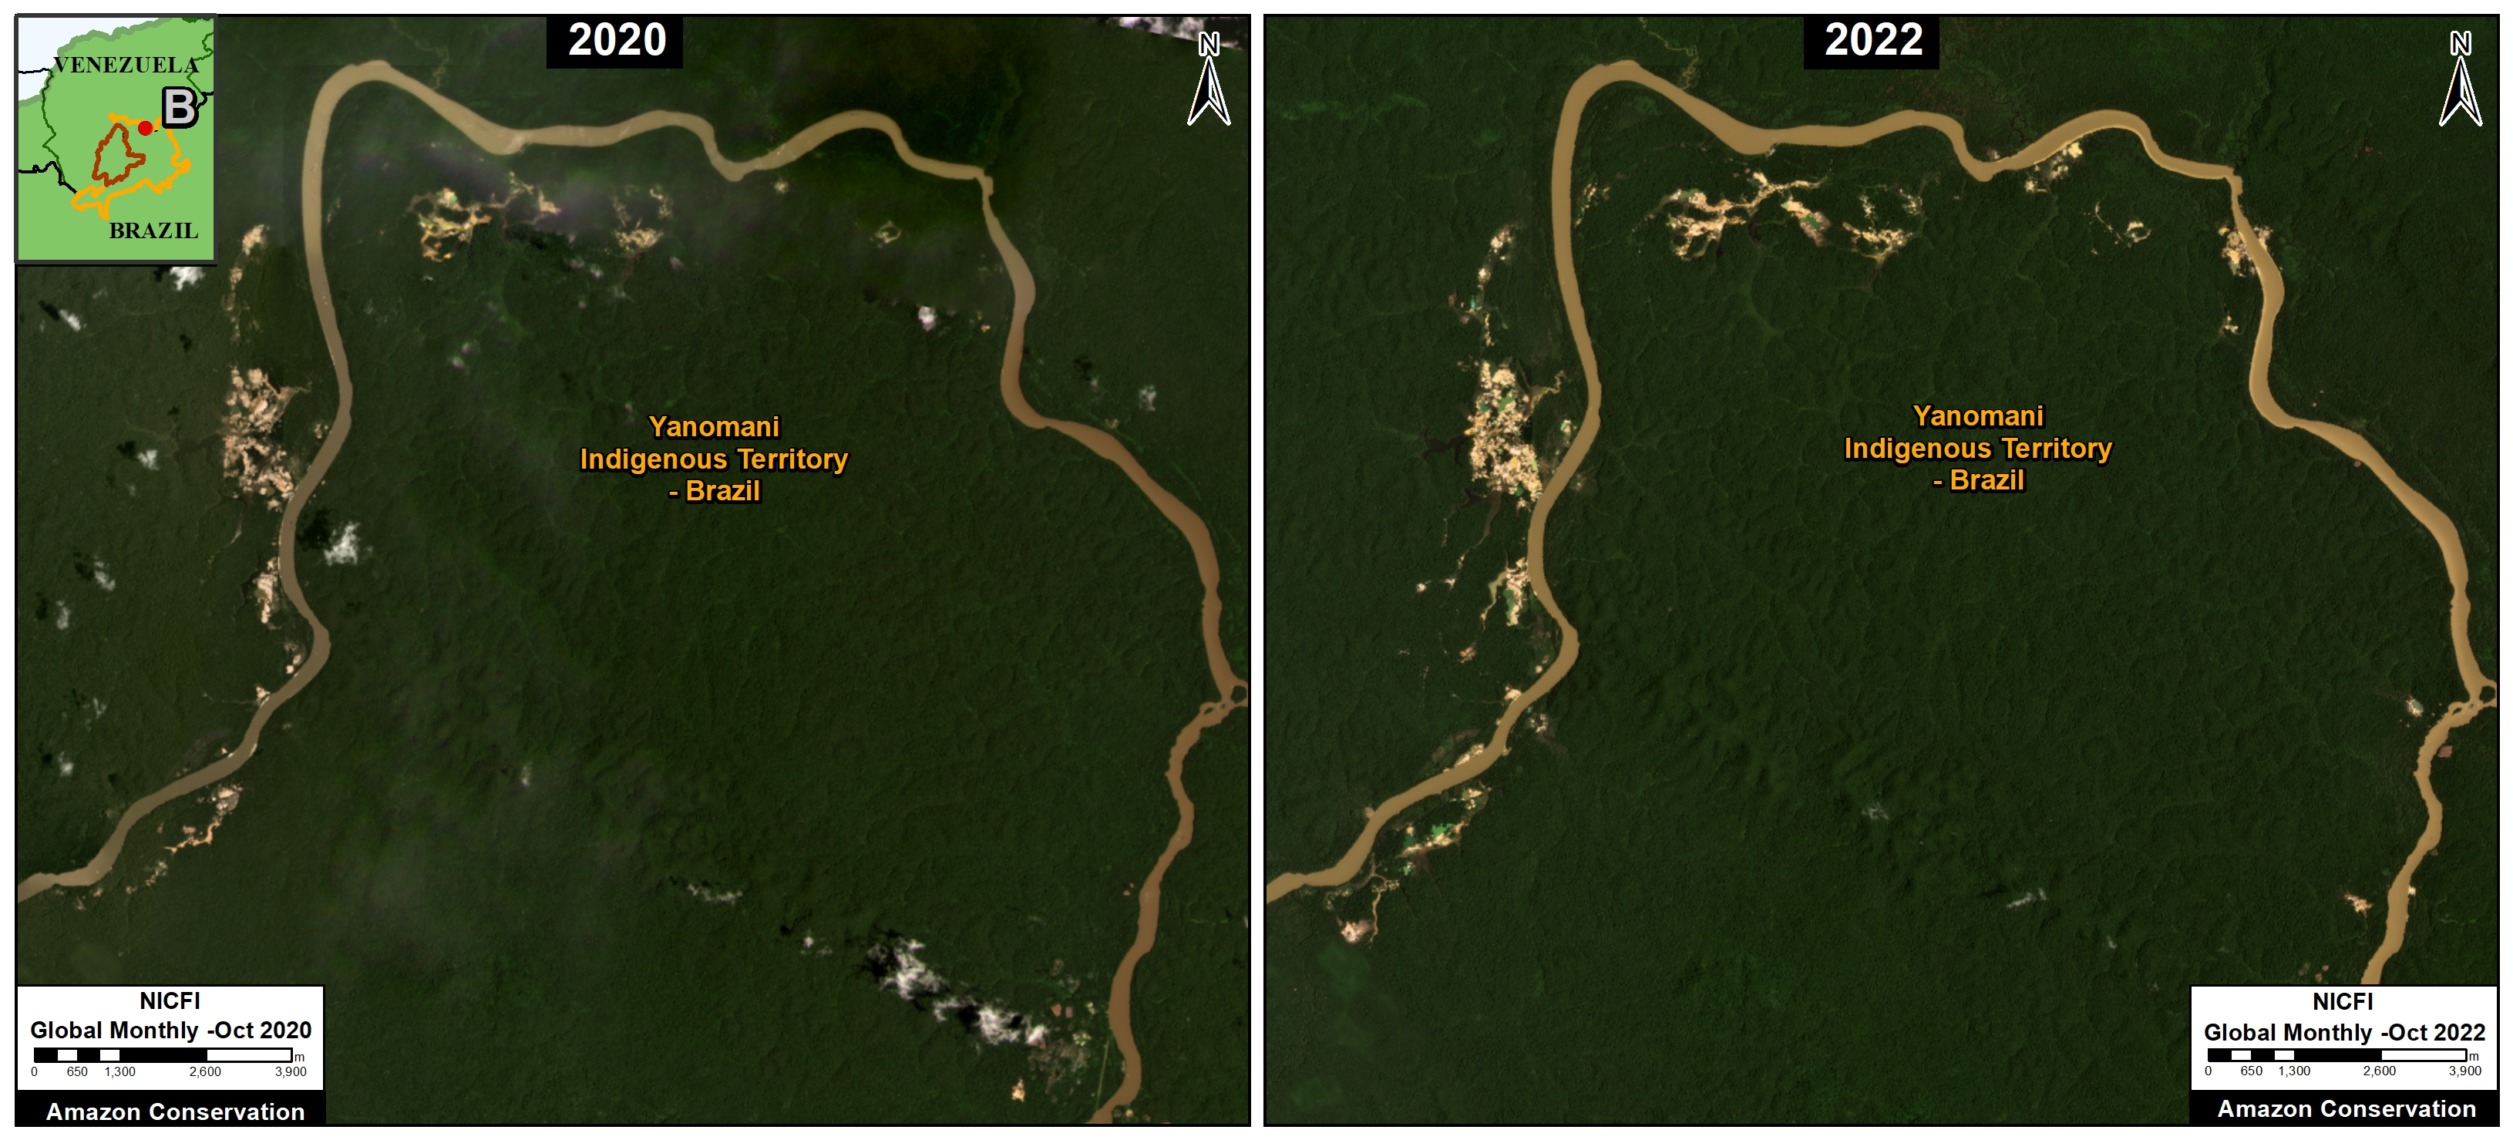
Note that while the raids appear to be concentrated along the Uraricoera River, active gold mining deforestation is actually occurring all throughout the vast northern section of the territory, including the Parima and Mucajai Rivers as well.

We estimate the new gold mining deforestation of over 2,000 hectares since 2019. Much of this deforestation (67%, or 1,350 hectares) occurred most recently in 2022.

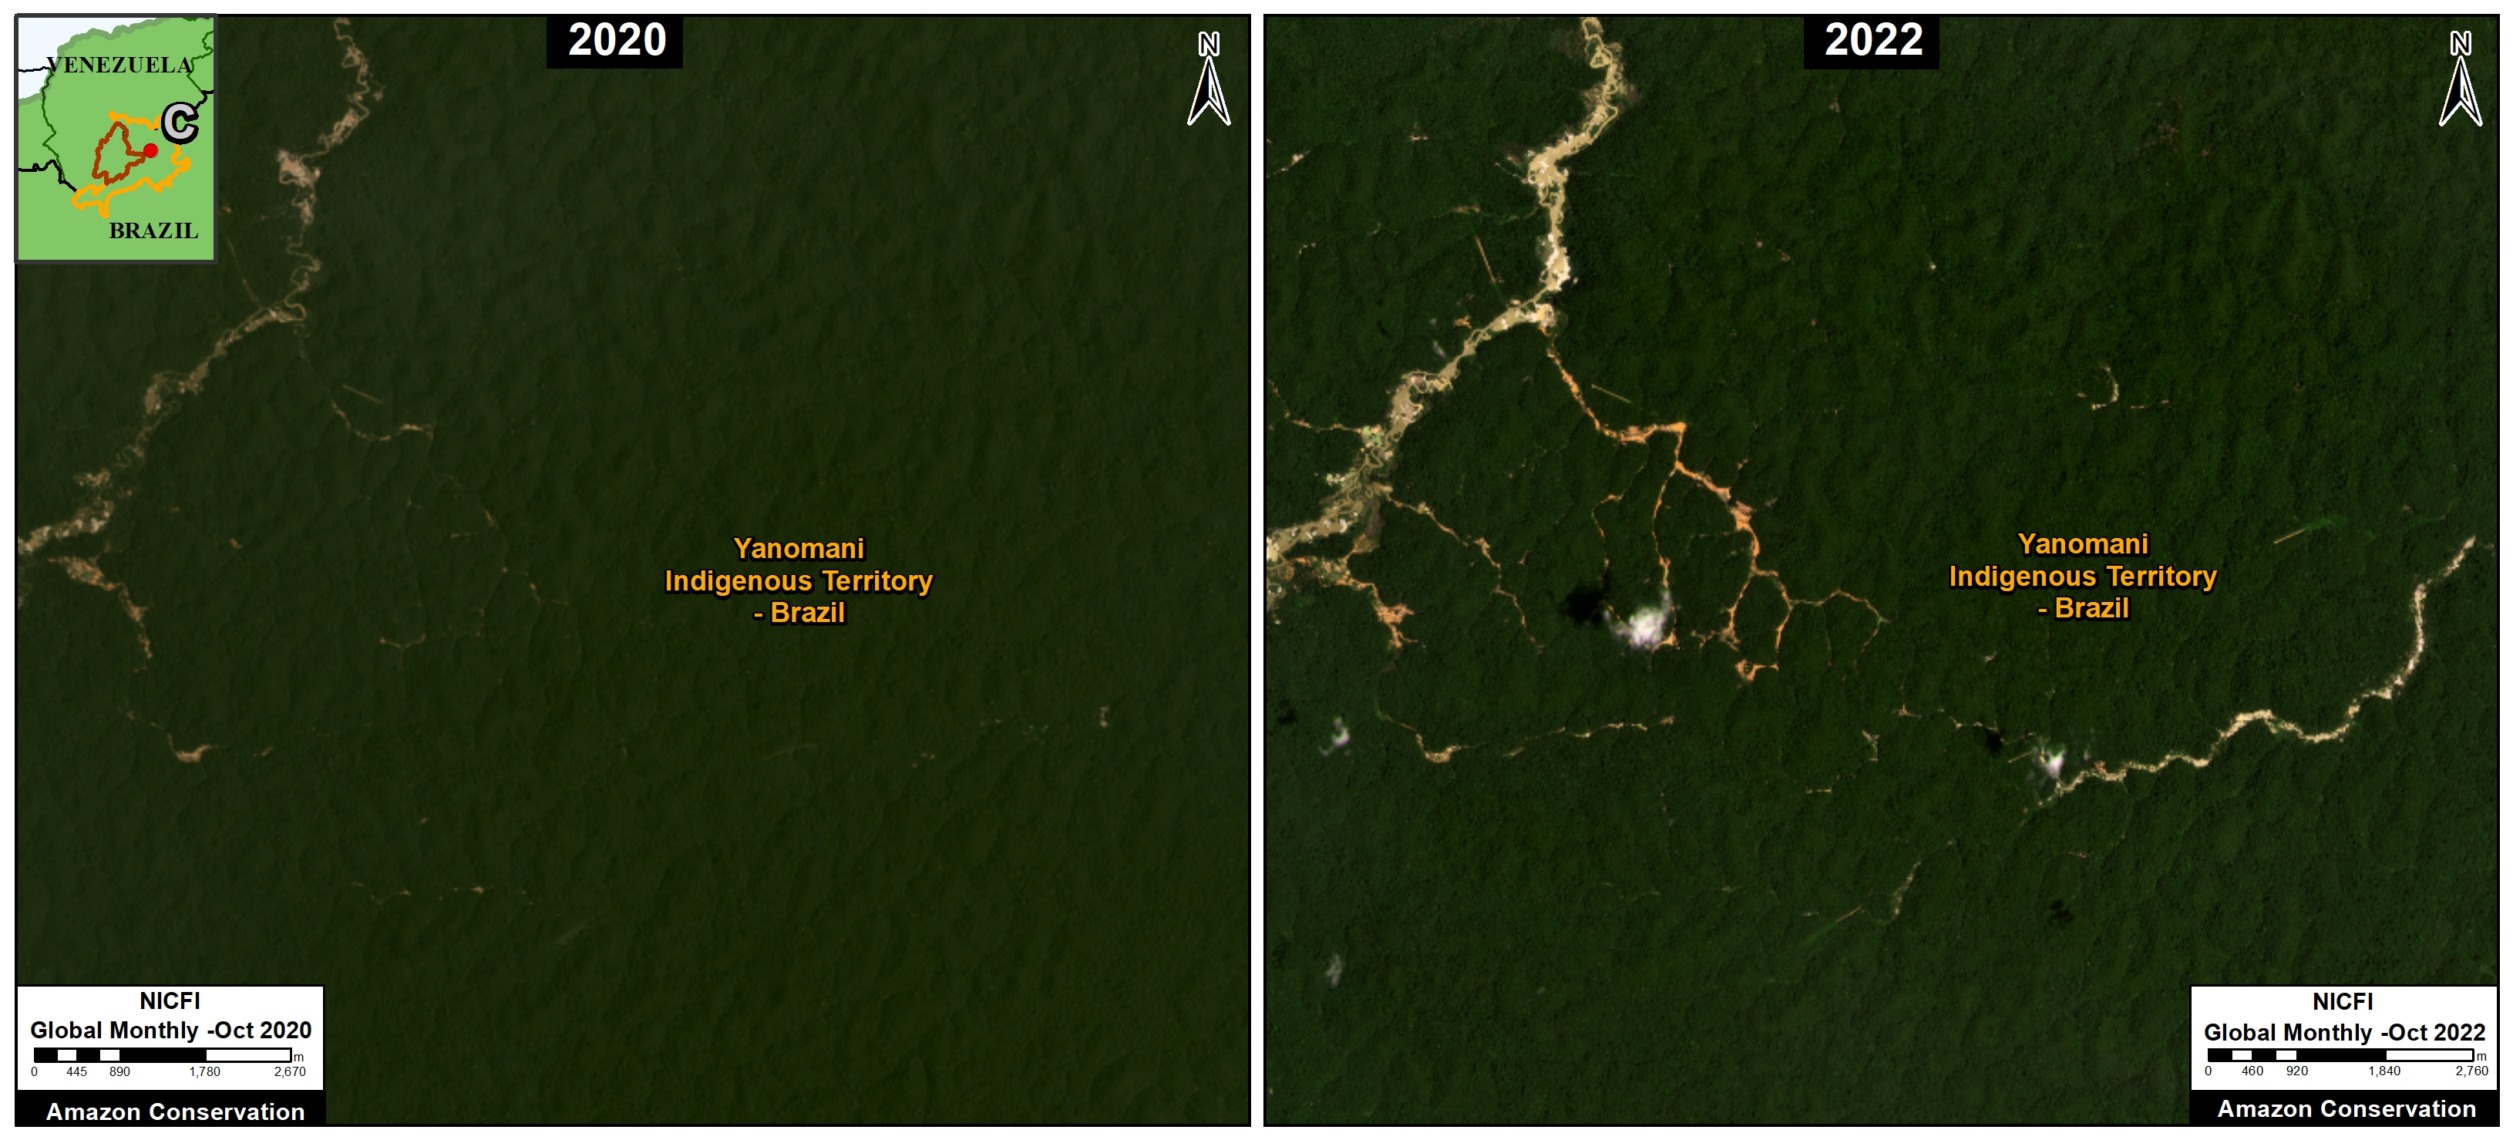
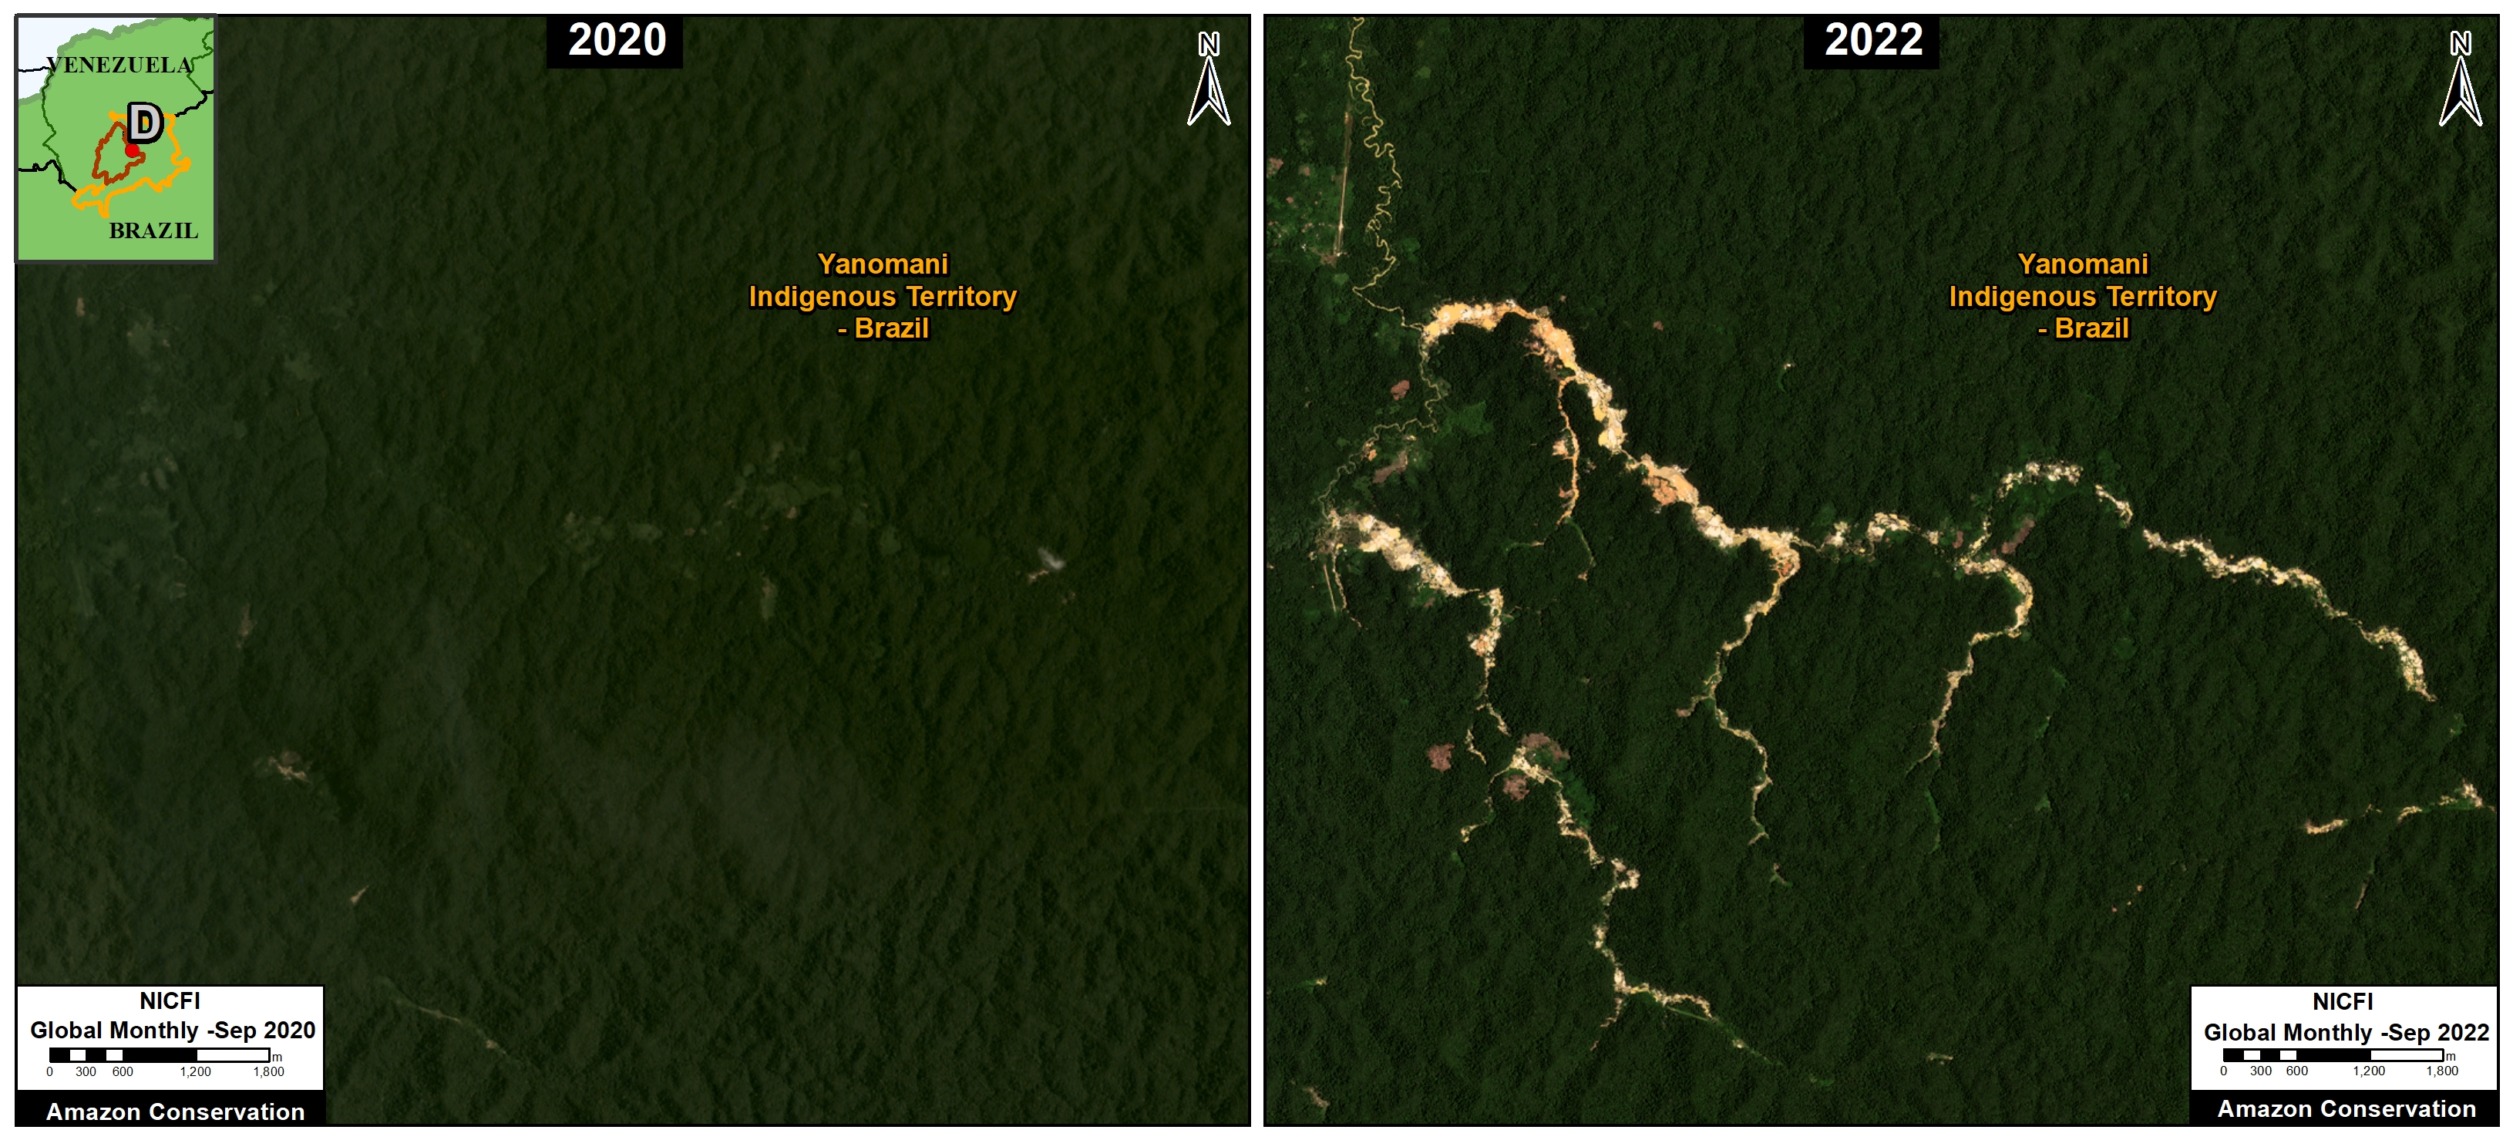
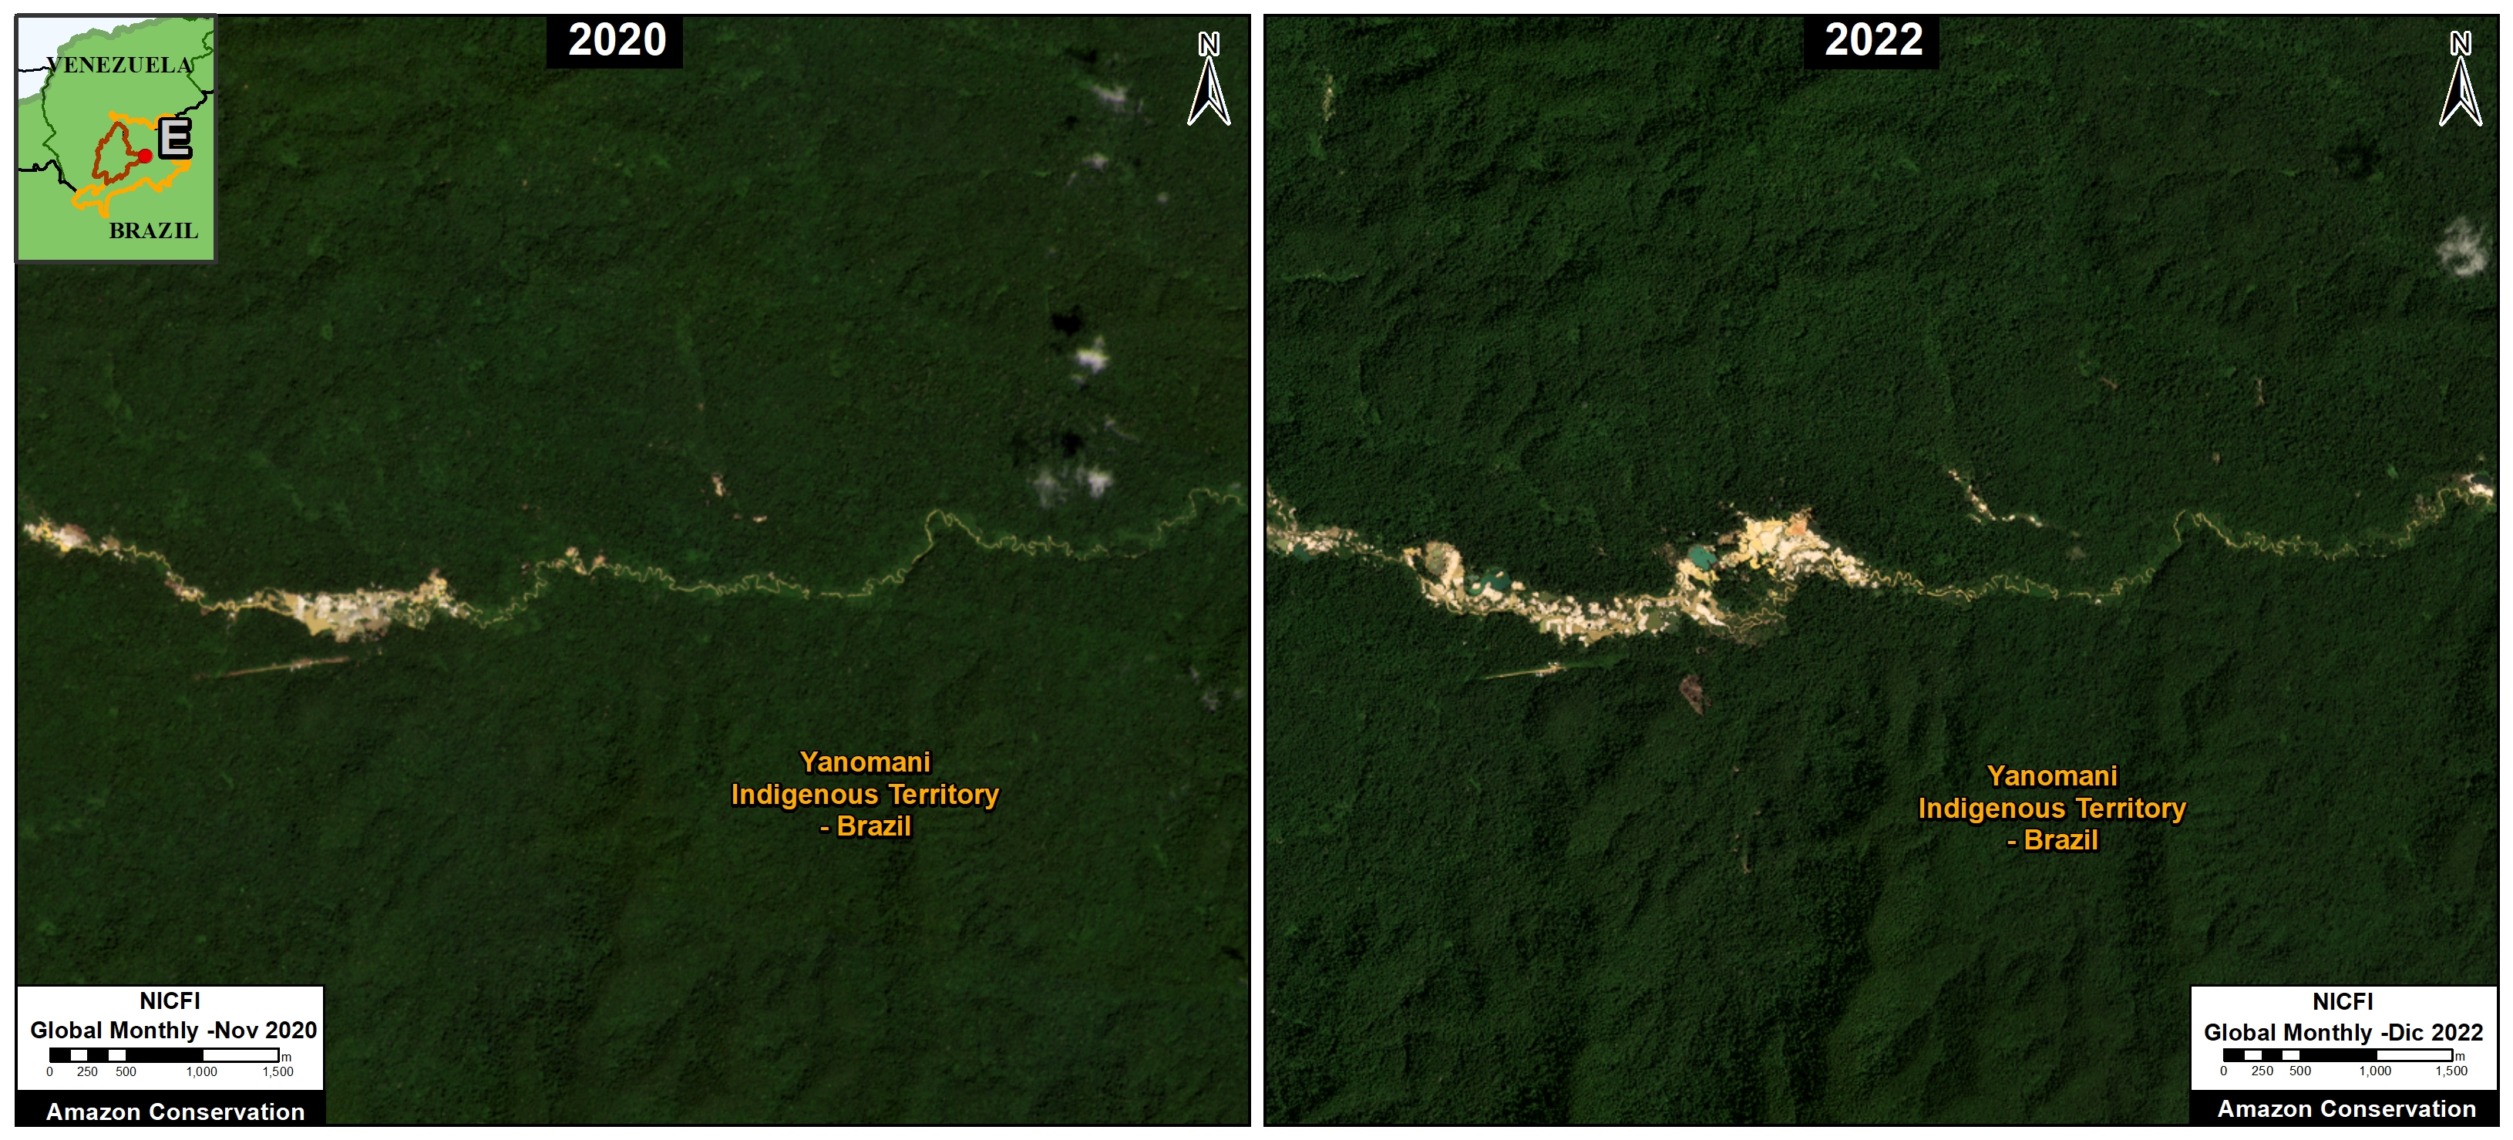
Below, we show five examples of this recent gold mining deforestation with high-resolution satellite imagery (3 meters) that confirm the alert detections.

Zooms of Illegal Gold Mining Deforestation, 2020 – 2022

Below, we show five examples of this recent gold mining deforestation with high-resolution (3 meter) satellite imagery that confirm the alert detections (see insets A-E in the Base Map). Note that two of the examples are on the the Uraricoera River, while the other three examples are from other parts of the territory.

Zoom A

Zoom B

Zoom C

Zoom D

Zoom E

Methodology

Gold mining deforestation alerts were generated by Amazon Mining Watch’s updated machine learning algorithim based on Sentinel-2 satellite imagery data.

The Amazon Mining Watch is a partnership between the Pulitzer Center´s Rainforest Investigations Network and Earthrise Media. These two nonprofit organizations have joined forces to bring together the power of machine learning and investigative journalism to shed light on large-scale environmental problems in the Amazon.


MAAP #180: Mennonites & Soy Deforestation in the Bolivian Amazon

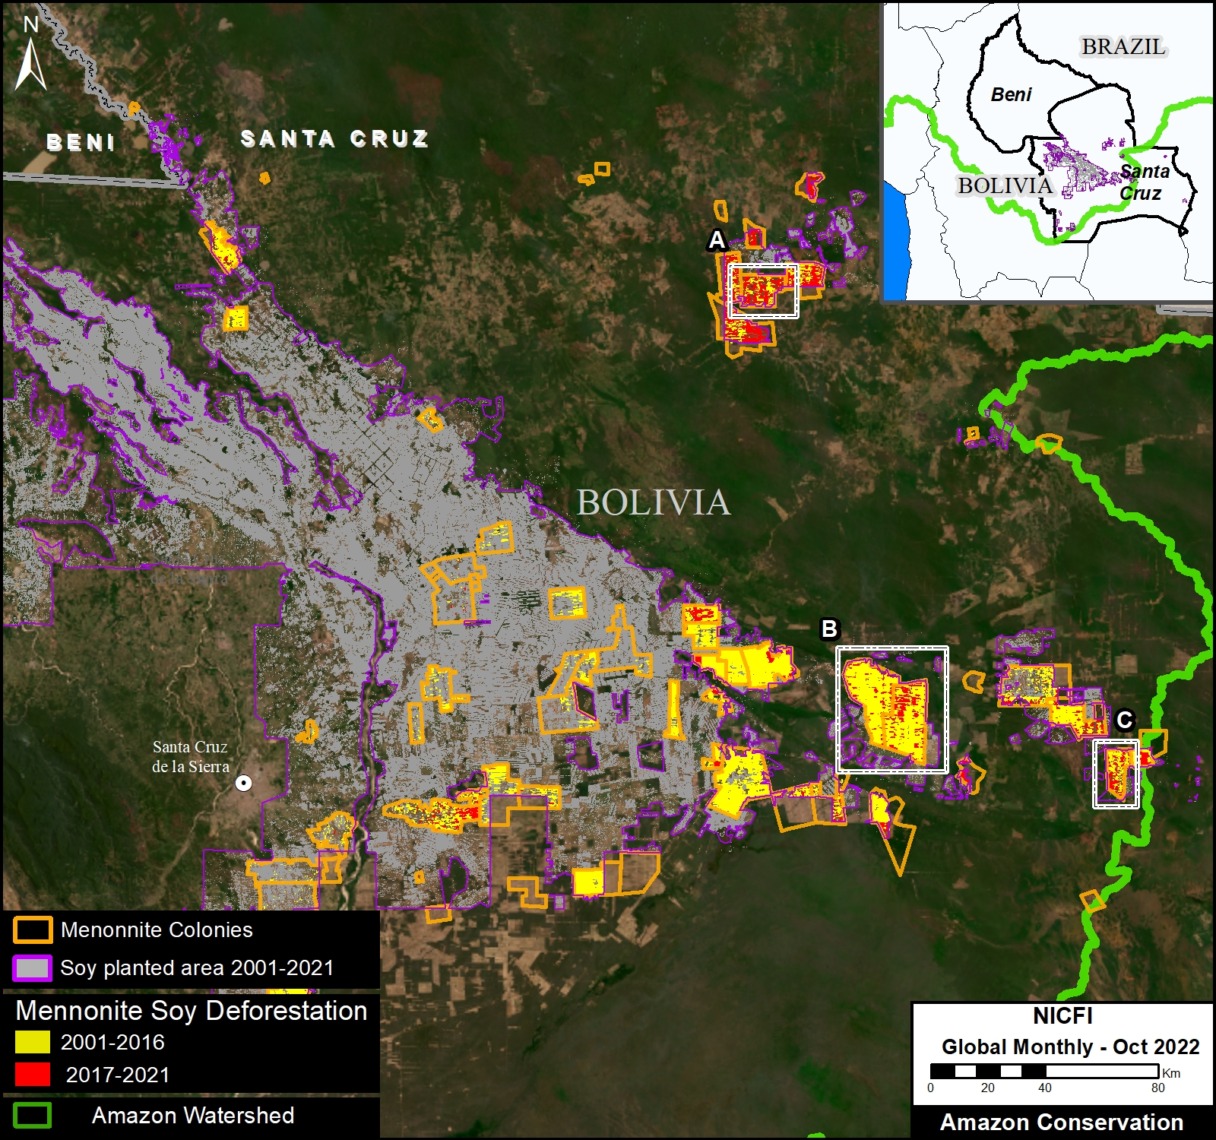
Base Map. Soy deforestation by Mennonite colonies in the Bolivian Amazon.

We continue with the second part in our series on soy deforestation in the Bolivian Amazon.

In the first part, see MAAP #179, we documented the massive soy-driven deforestation of 904,518 hectares (2.2 million acres) between 2001 and 2021 in the Bolivian Amazon.

During this time period, a large number of farming-based Mennonite colonies have been established in the southern Bolivian Amazon, helping drive the increase in soybean expansion in the region.1,2

Here, we incorporate colony location data to estimate the role of Mennonite colonies in this soy deforestation.

In summary, we find that Mennonites have caused a third (33%) of the soy deforestation in the Bolivian Amazon over the past 5 years (see Base Map).

Overall, Mennonites caused nearly a quarter (23%) of the total soy deforestation over the past 20 years (210,980 hectares, or 521,344 acres).


Mennonites & Soy Deforestation in the Bolivian Amazon

We estimate that Mennonite colonies have caused the deforestation of 210,980 hectares (521,344 acres) for soy expansion in the Bolivian Amazon between 2001 and 2021 (see Base Map). This accounts for 23% of the total soybean deforestation in Bolivia over the past 20 years.

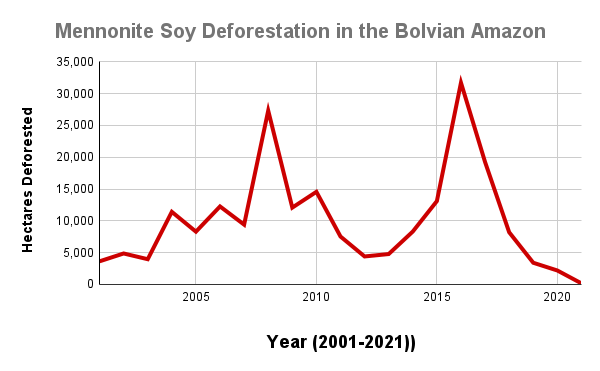
This Mennonite-driven soy deforestation peaked in 2016 (31,728 hectares), following a previous peak in 2008 (see Graph 1). In general, note that Mennonite soy deforestation has been relatively high (>2,000 hectares) every year from 2001 to 2020.

Focusing on just the past five years (2017-21), Mennonites have cleared 33,234 hectares (82,123 acres). This represents an increase to 33% of the total soybean deforestation during this time period.

Graph 1. Soy deforestation caused by Mennonites in the Bolivian Amazon, 2001-2021.

Satellite Images of Mennonite Colonies in the Bolivian Amazon

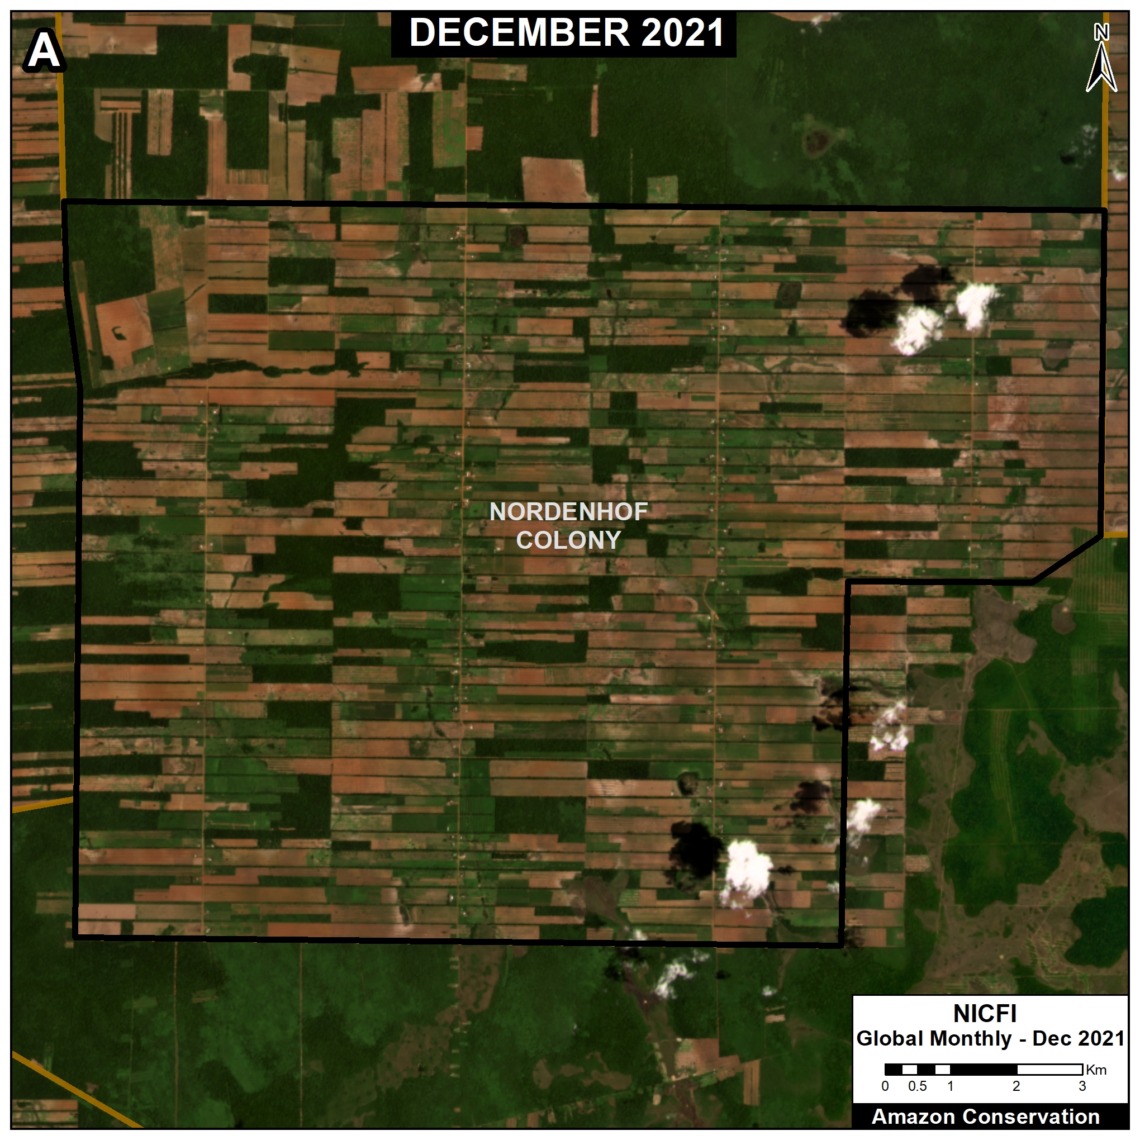
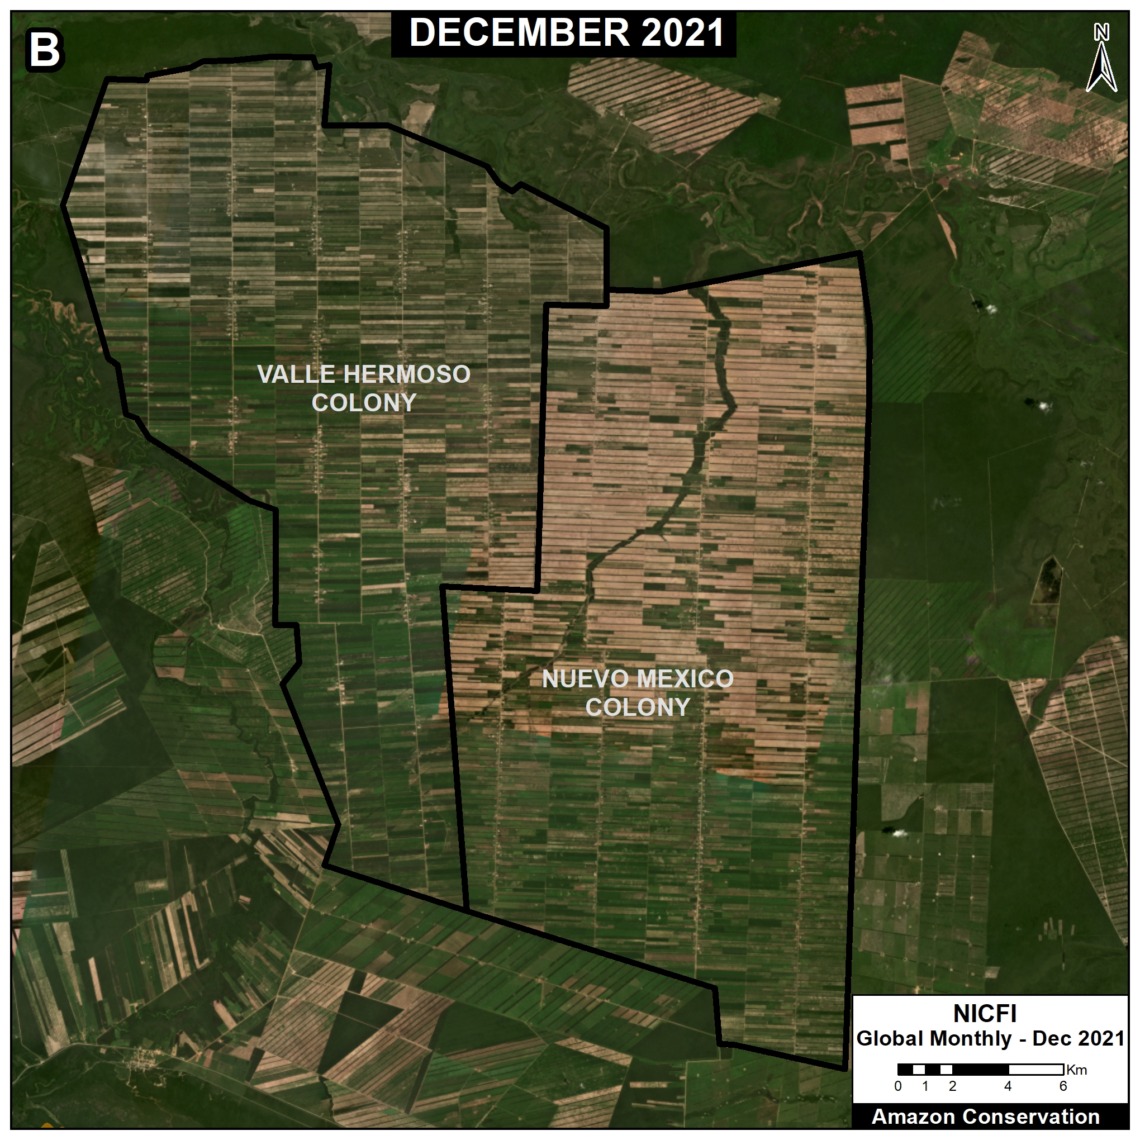
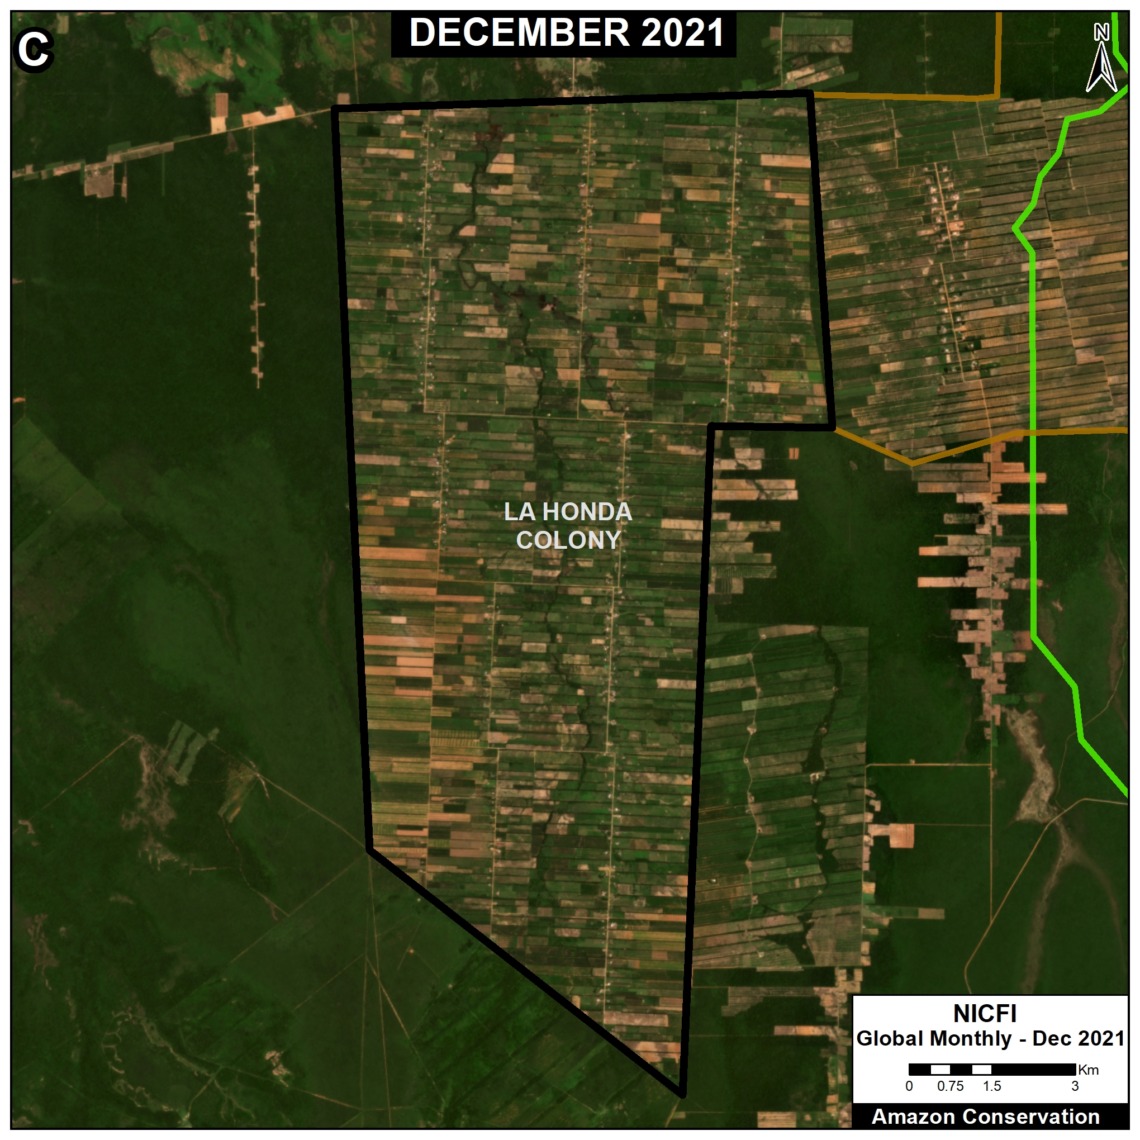
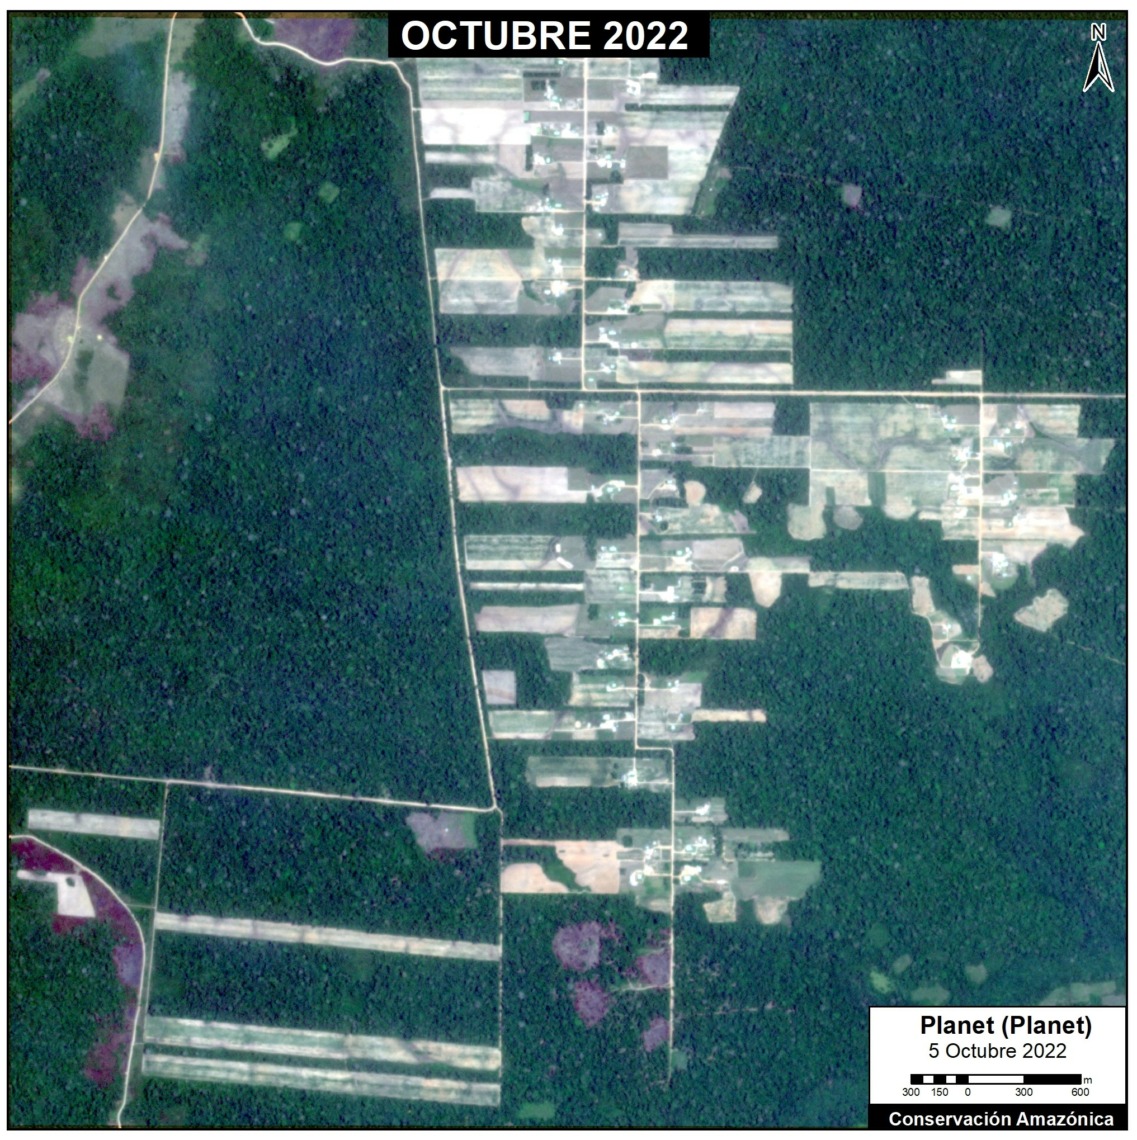
We present a series of recent satellite images showing examples of Mennonite colonies in the Bolivian Amazon. See the Base Map above for the location of the three zooms (A-C). Note that they are made up of highly-organized and connected agricultural plots that have been created following deforestation events over the past 20 years.

Methodology

For this series of reports, we employed a three-part methodology.

First, we mapped out “soy planted area” for 2001 to 2021 based on the data from Song et al 2021. This data is available on the University of Maryland’s GLAD site “Commodity Crop Mapping and Monitoring in South America.”3

Second, on top of the soy planted area noted above, we mapped out forest loss for 2001 to 2021, also based on data from the University of Maryland.4 This served as our estimate of soy-driven deforestation.

Third, on top of the soy planted area noted above, we incorporated an additional dataset from a recent study on the expansion of Mennonite colonies in Latin America.1 Spatial data from this study available here. We then estimated forest loss for these select Mennonite soy areas.

References

1Yann le Polain de Waroux, Janice Neumann, Anna O’Driscoll & Kerstin Schreiber (2021) Pious pioneers: the expansion of Mennonite colonies in Latin America, Journal of Land Use Science, 16:1, 1-17, DOI: 10.1080/1747423X.2020.1855266

2Nobbs-Thiessen, B. (2020). Landscape of Migration. The University of North Carolina Press.

3Song, X.P., M.C. Hansen, P. Potopov, B. Adusei, J. Pickering, M. Adami, A. Lima, V. Zalles, S.V. Stehman, D.M. Di Bella, C.M. Cecilia, E.J. Copati, L.B. Fernandes, A. Hernandez-Serna, S.M. Jantz, A.H. Pickens, S. Turubanova, and A. Tyukavina. 2021. Massive soybean expansion in South America since 2000 and implications for conservation.

4Hansen, M. C., P. V. Potapov, R. Moore, M. Hancher, S. A. Turubanova, A. Tyukavina, D. Thau, S. V. Stehman, S. J. Goetz, T. R. Loveland, A. Kommareddy, A. Egorov, L. Chini, C. O. Justice, and J. R. G. Townshend. 2013. “High-Resolution Global Maps of 21st-Century Forest Cover Change.” Science 342 (15 November): 850–53. Data available from: earthenginepartners.appspot.com/science-2013-global-forest.

Acknowledgements

These reports are part of a series focused on the Bolivian Amazon through a strategic collaboration between the sister organizations Amazon Conservation in Bolivia (ACEAA) and Amazon Conservation in the U.S.

Citation 

Finer M, Ariñez A (2023) Mennonites & Soy Deforestation in the Bolivian Amazon. MAAP #179.

MAAP #179: Soy Deforestation in the Bolivian Amazon

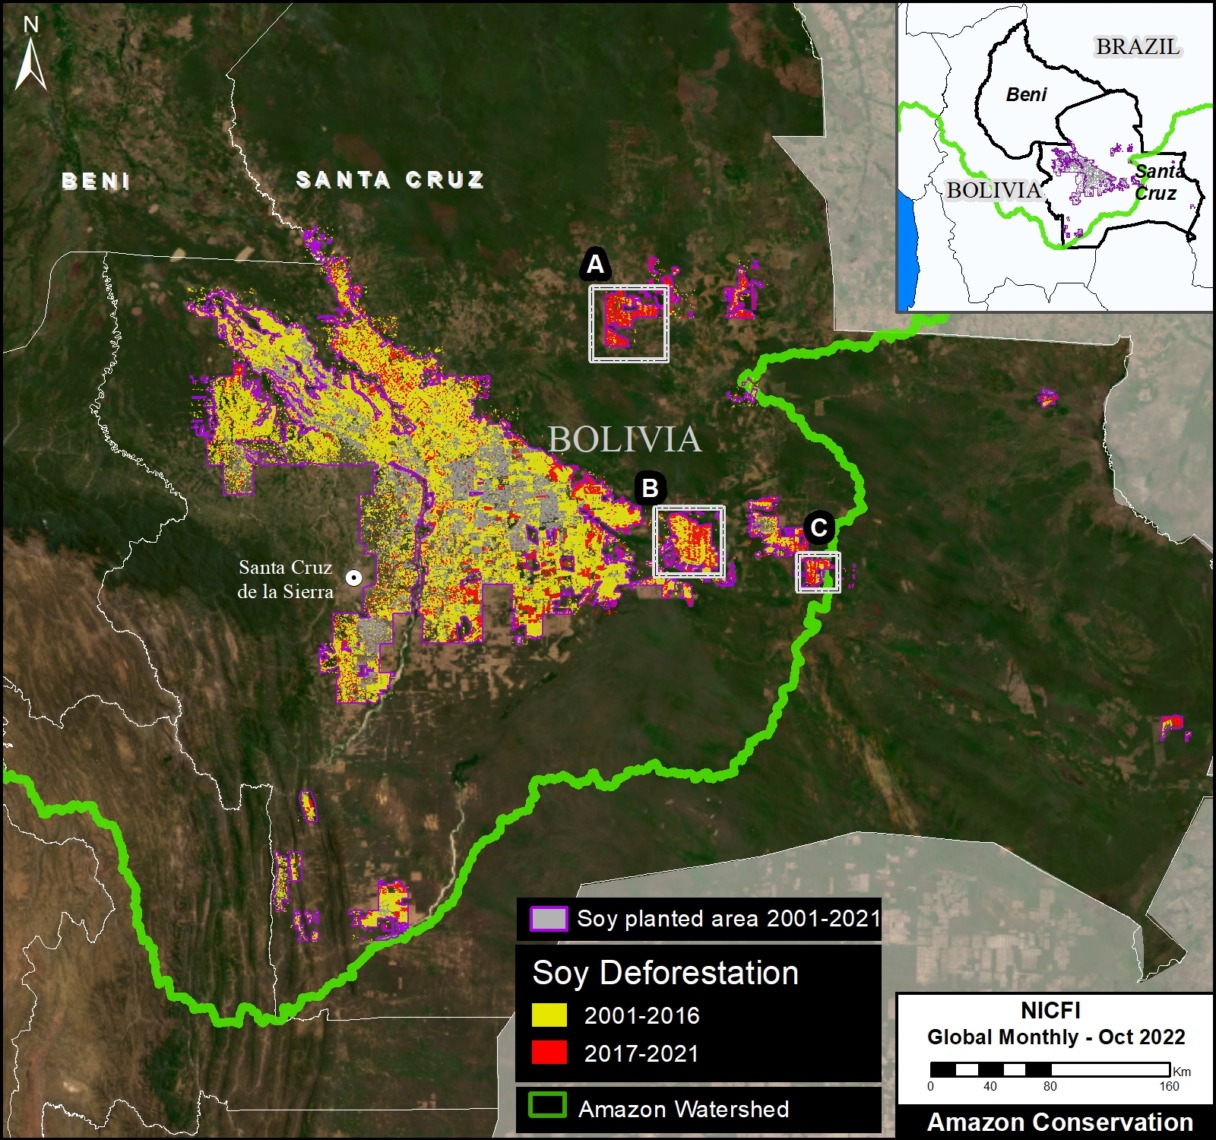
Base Map. Soy-driven deforestation in the Bolivian Amazon, 2001-2021. Click on map to enlarge.

It is generally known that commodities such as oil palm, soy, and cattle are major tropical deforestation drivers, but concise estimates are often difficult.

New satellite-based datasets are improving this situation. Notably, researchers recently published the first overview of soybean plantations for South America.1

Here, we use this data to estimate recent soy-driven deforestation in the Bolivian Amazon.

In the second part of this series, see MAAP #180, we incorporate additional data to estimate the role of Mennonite colonies in this soy deforestation.

In summary, we document the massive soy-driven deforestation of 904,518 hectares (2.2 million acres) between 2001 and 2021 in the Bolivian Amazon (see Base Map).

Of this total, Mennonites have caused 23% (210,980 hectares, or 521,344 acres).


Soy Deforestation in the Bolivian Amazon, 2001 – 2021

Soy has covered 2.1 million hectares of the southern Bolivian Amazon over the past 20 years, with current coverage around 1.2 million hectares.

We documented an extremely high level of soy-driven deforestation in the Bolivian Amazon: 904,518 hectares (2.2 million acres) between 2001 and 2021 (see Base Map above). This is a massive area, similar to the size of the U.S. state of Vermont.

This soy deforestation peaked in 2008 (92,000 hectares), but has been high (>18,000 hectares) every year between 2001 and 2019, meaning this is a long-running and persistent issue.

The vast majority of the total deforestation occurred in the Santa Cruz department, plus a small corner of adjacent Beni department.

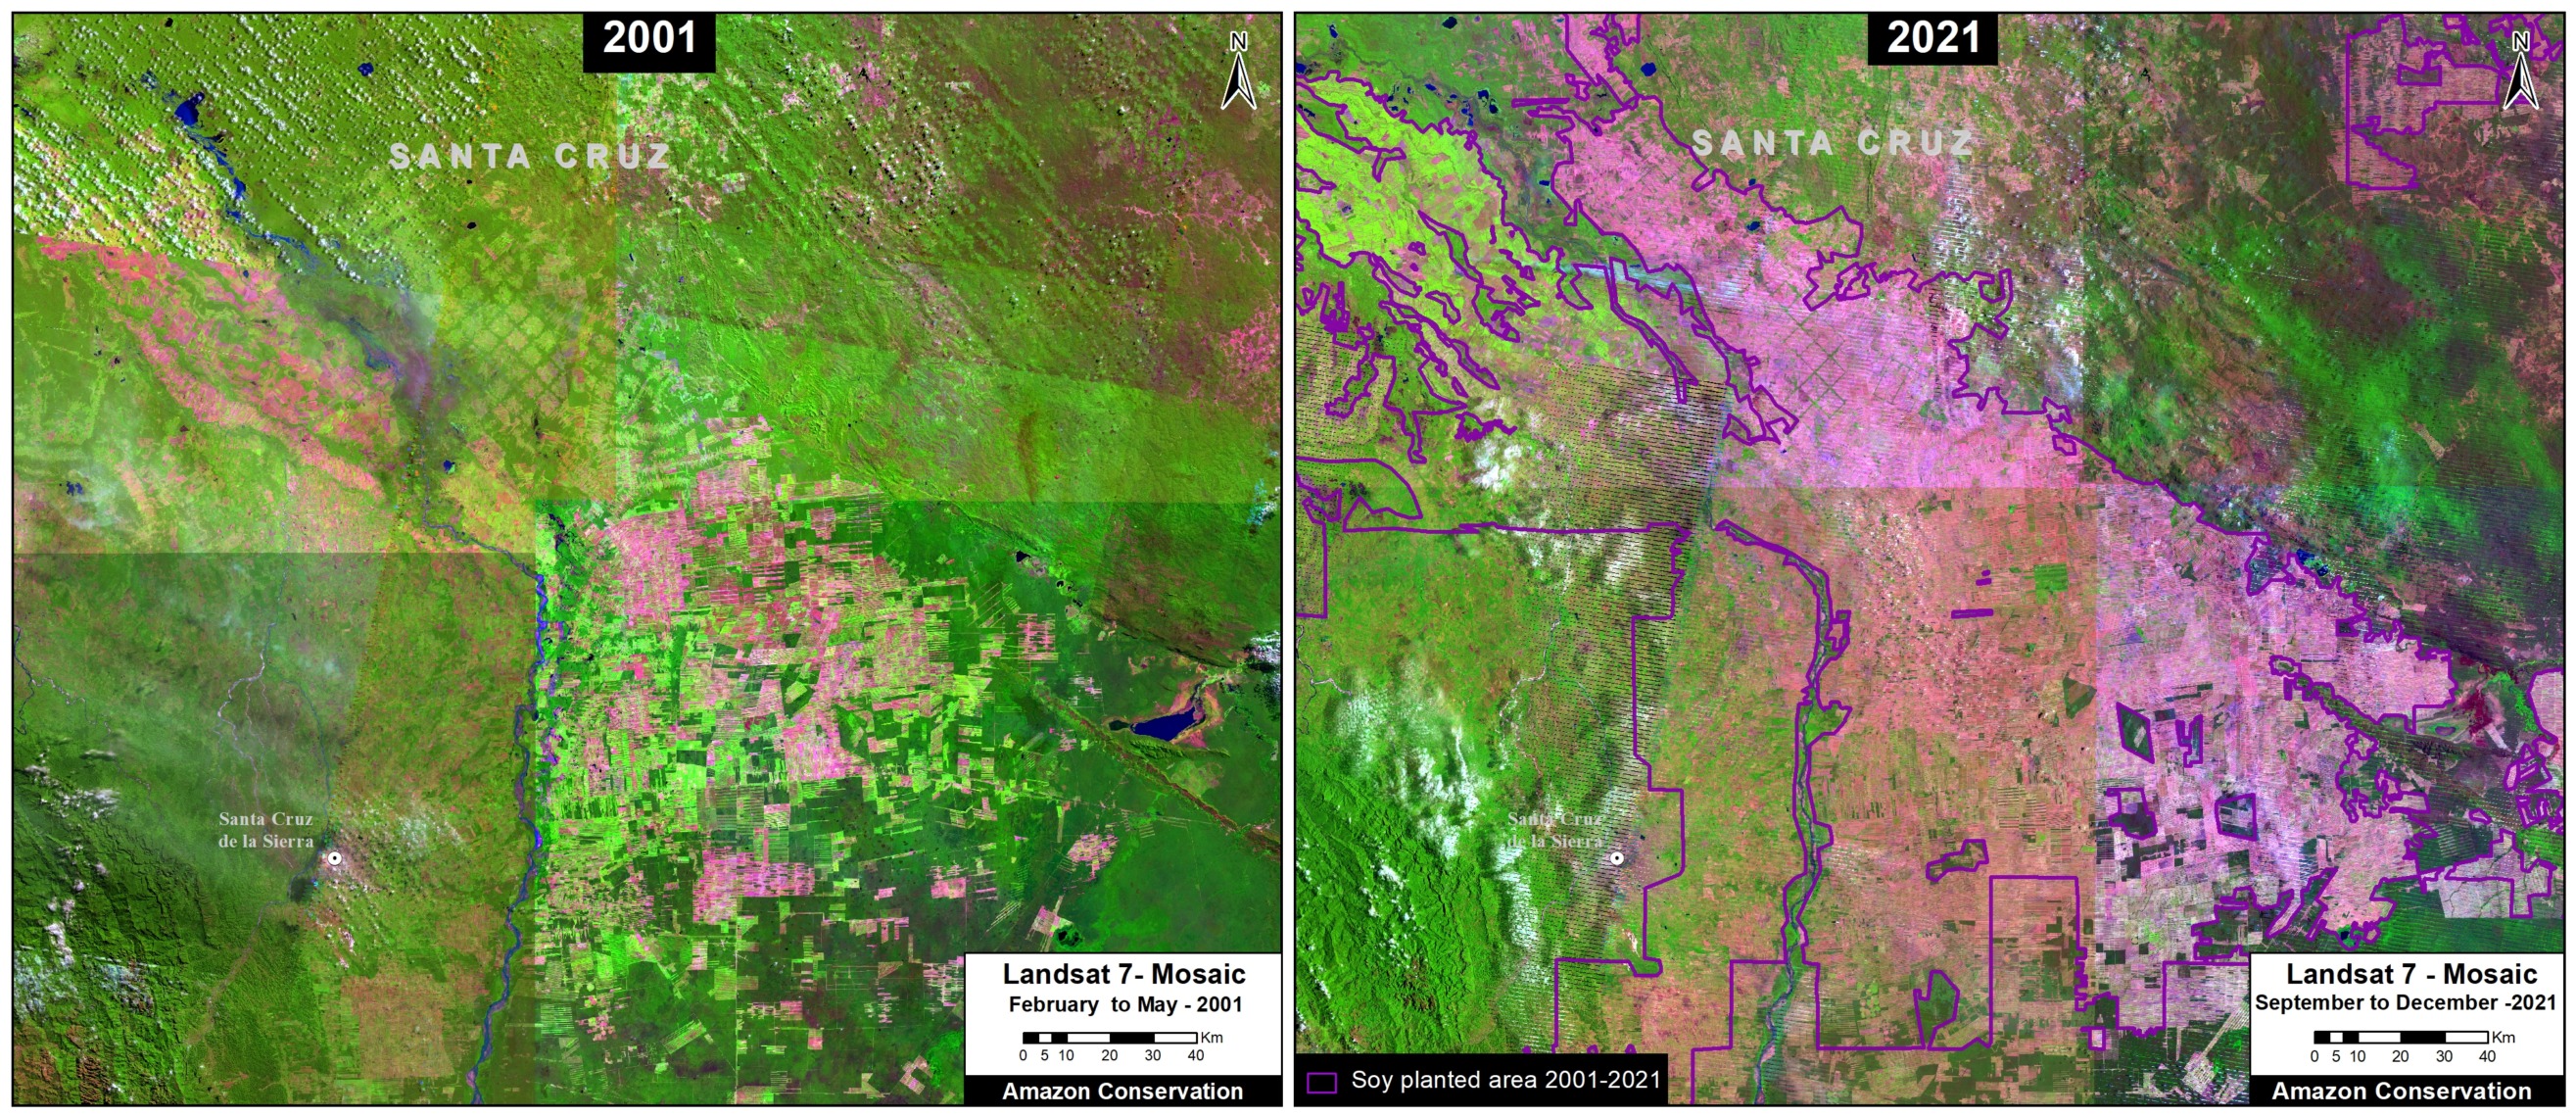
Below, Figure 1 shows the overall massive soy deforestation over the past 20 years in the Bolivian Amazon, comparing 2001 (left panel) with 2021 (right panel).

Figure 1. Soy deforestation in the Bolivian Amazon, 2001 vs 2021.

Soy Deforestation in the Bolivian Amazon, 2017 – 2021

Of the total soy deforestation noted above, 11% (101,188 hectares, or 250,000 acres) occurred in just the past 5 years (2017-21).

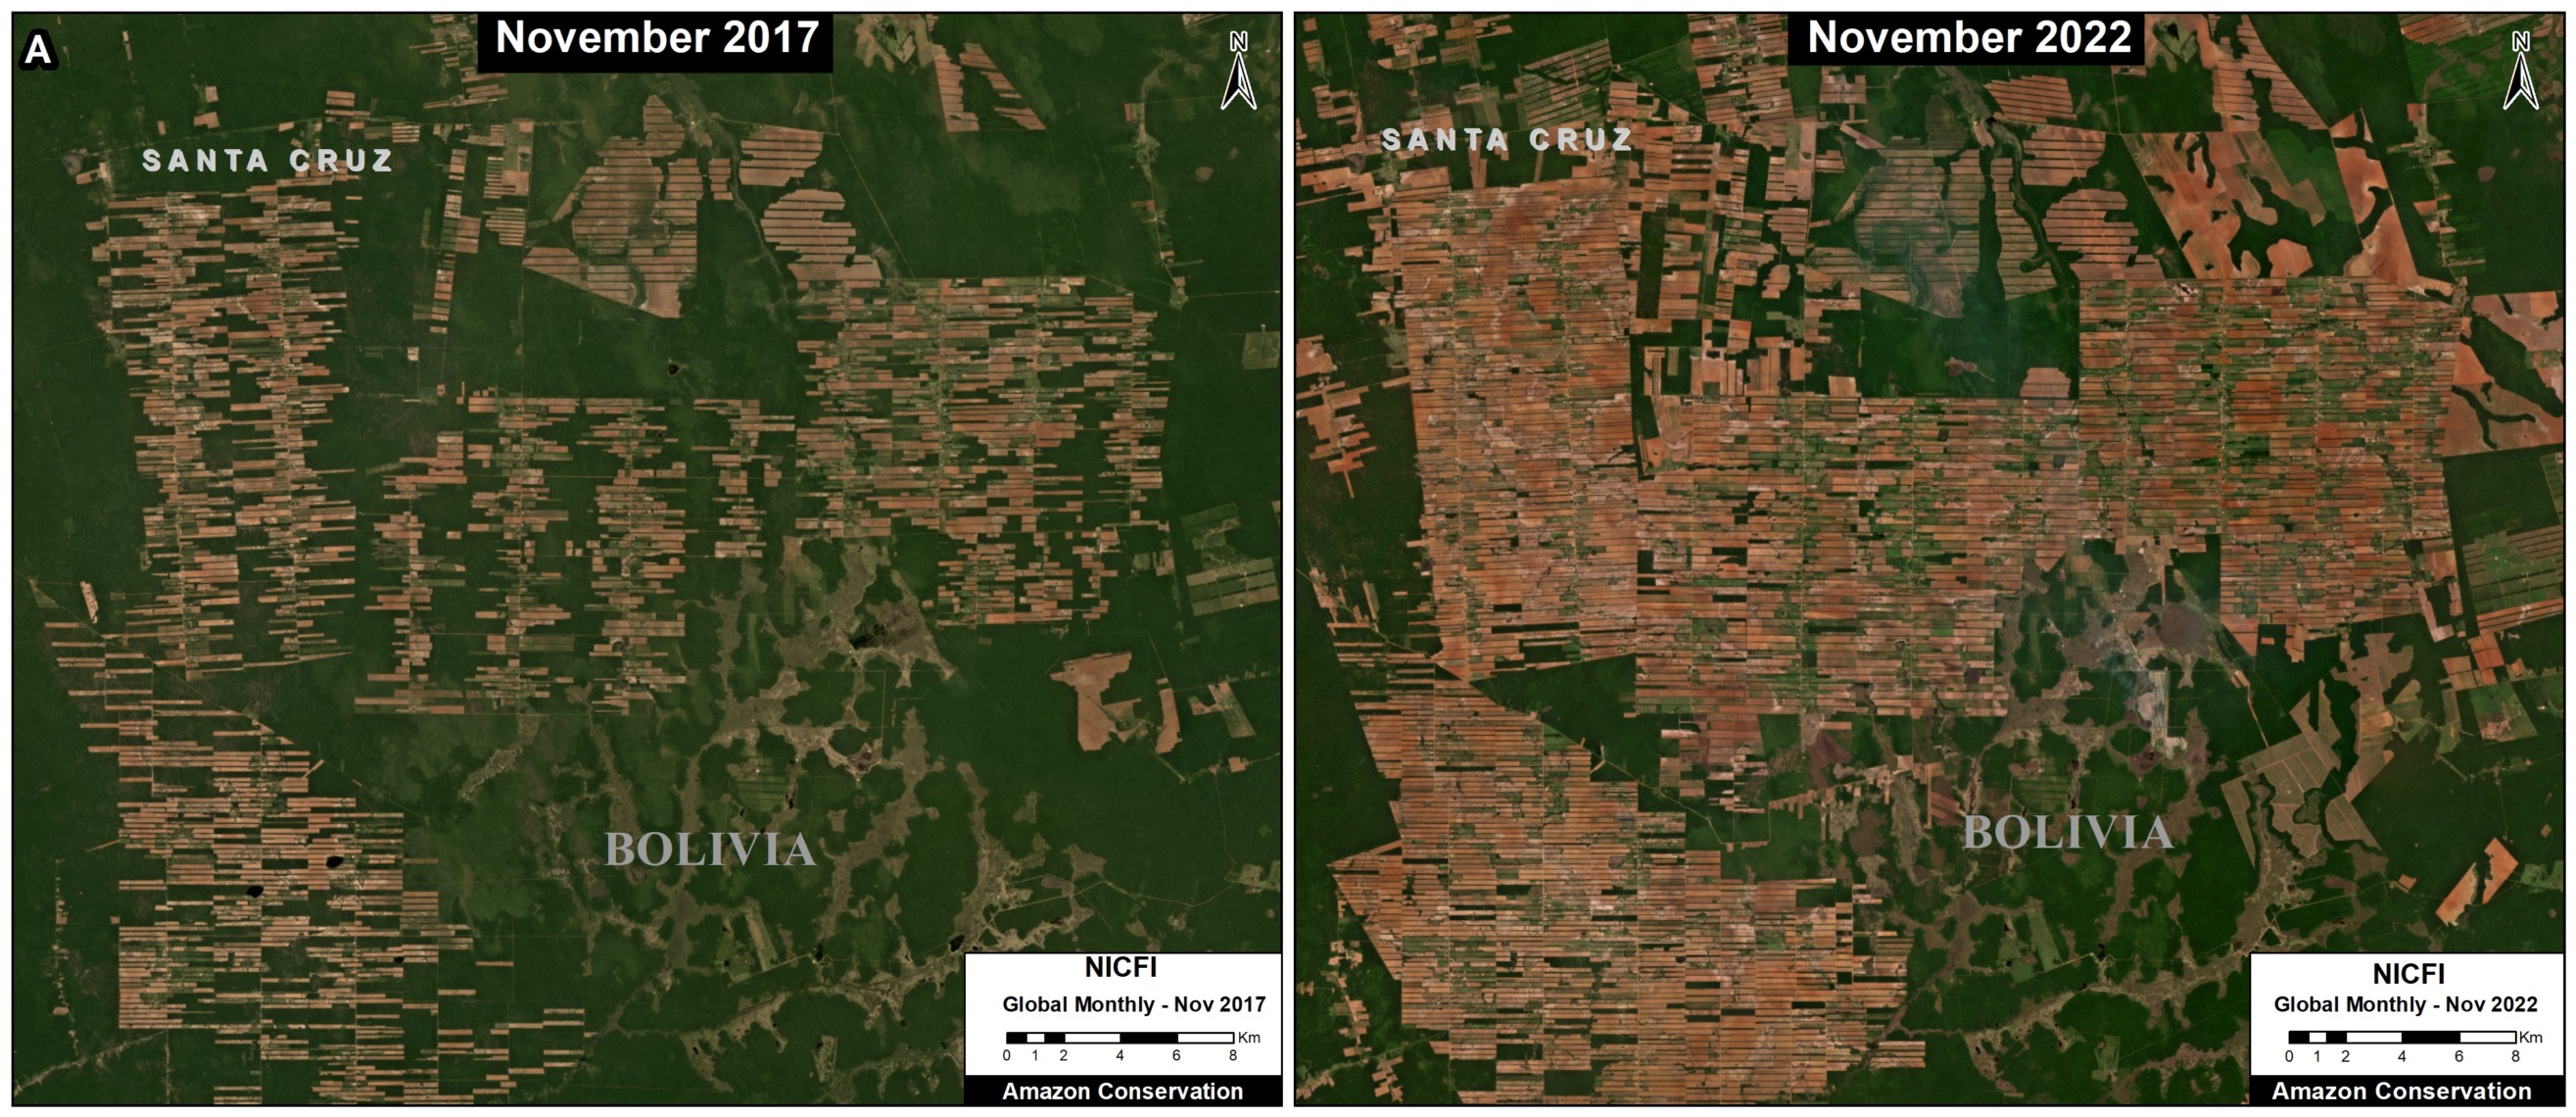
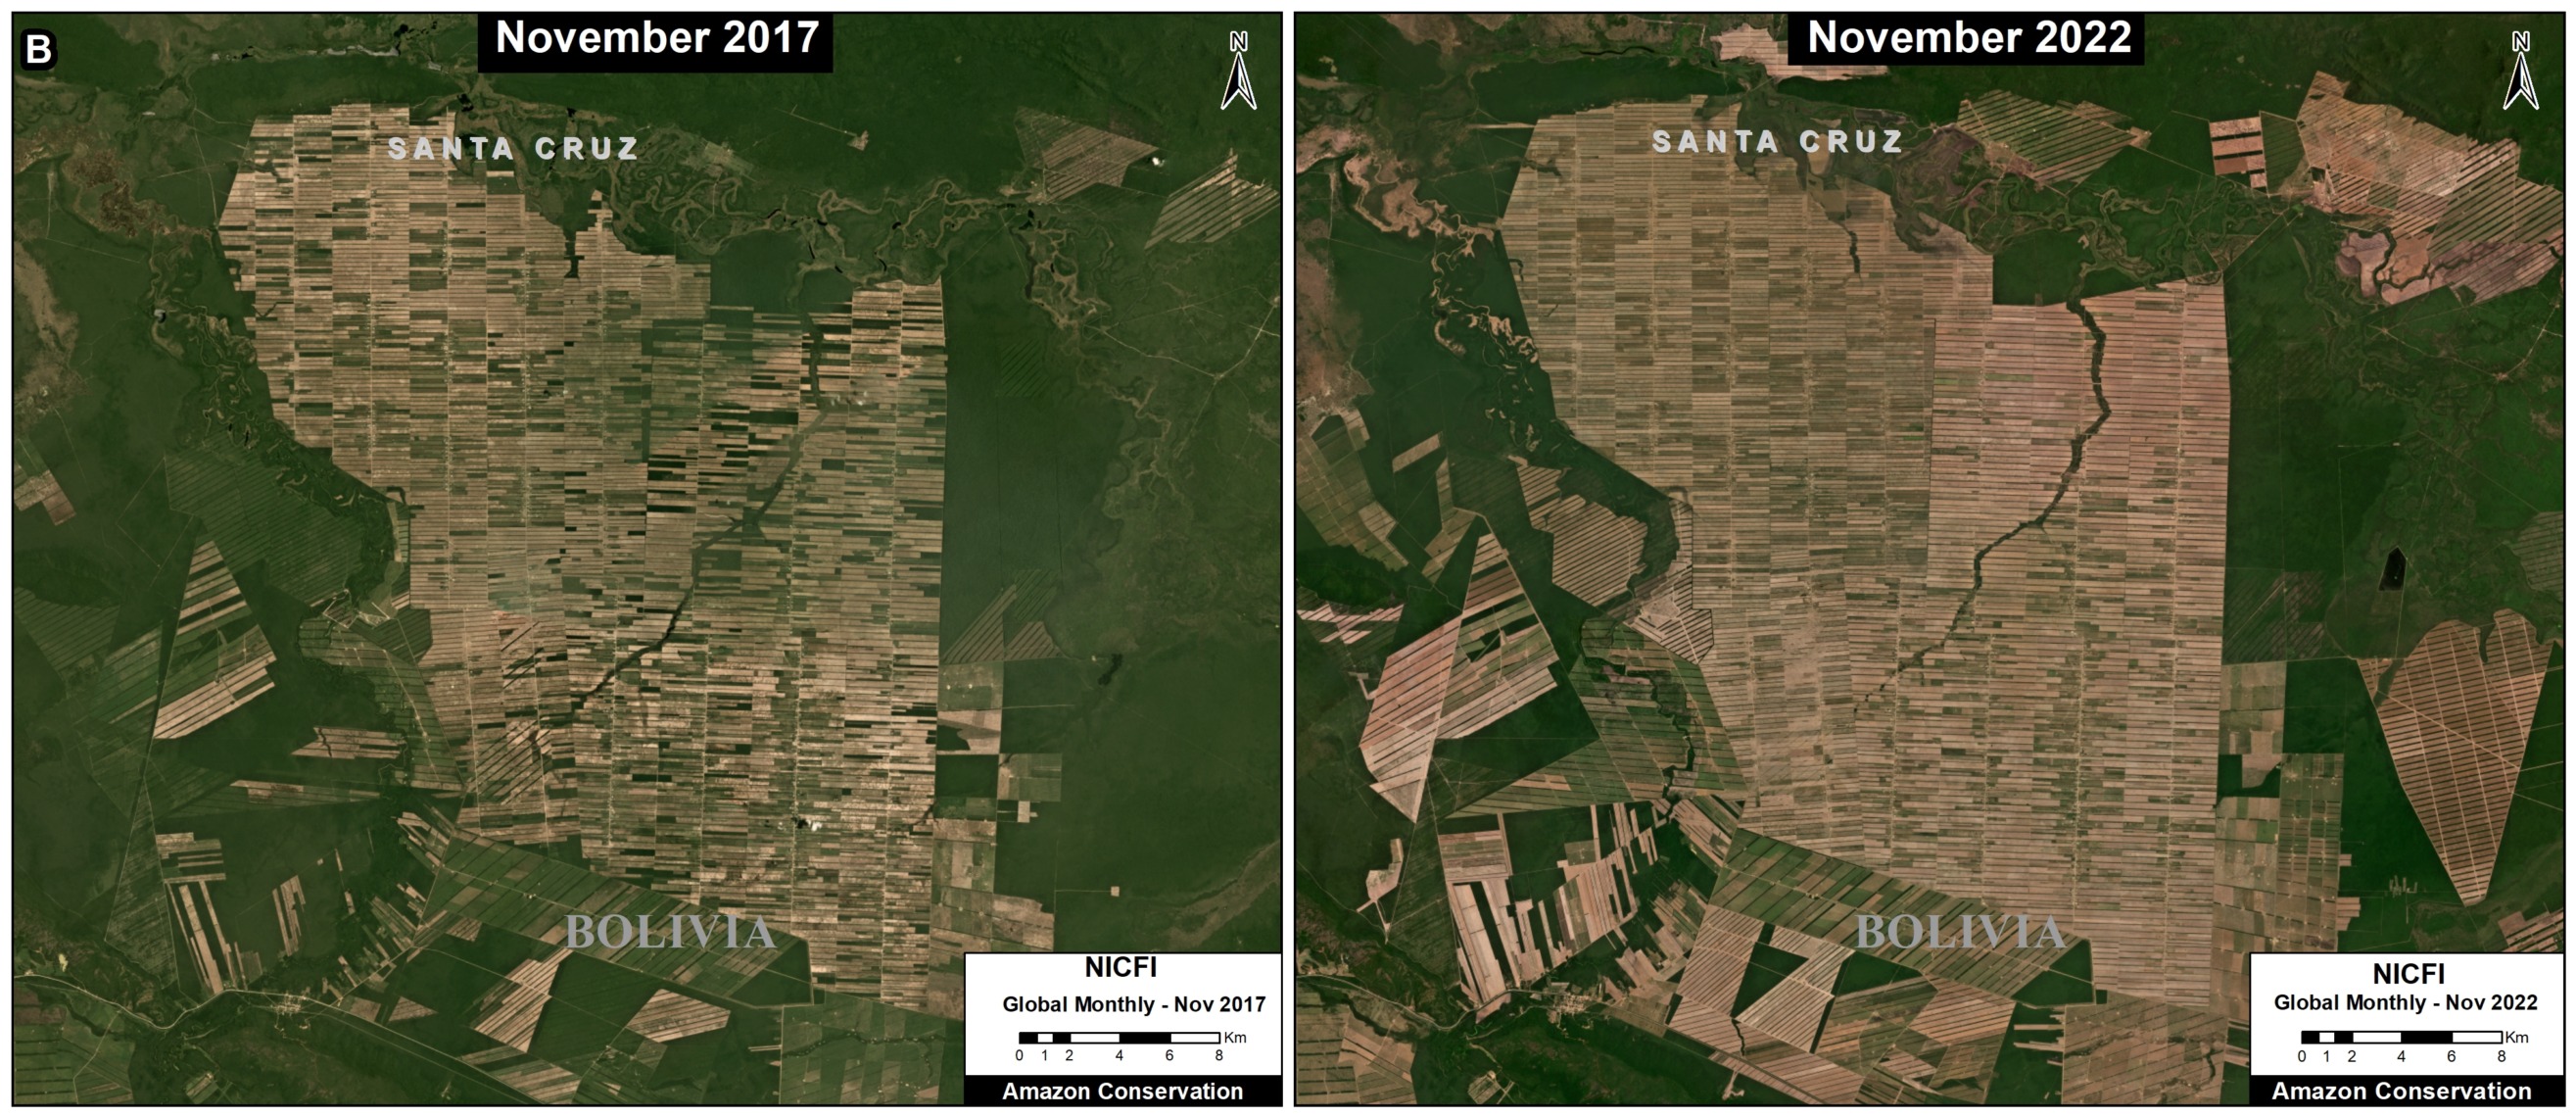
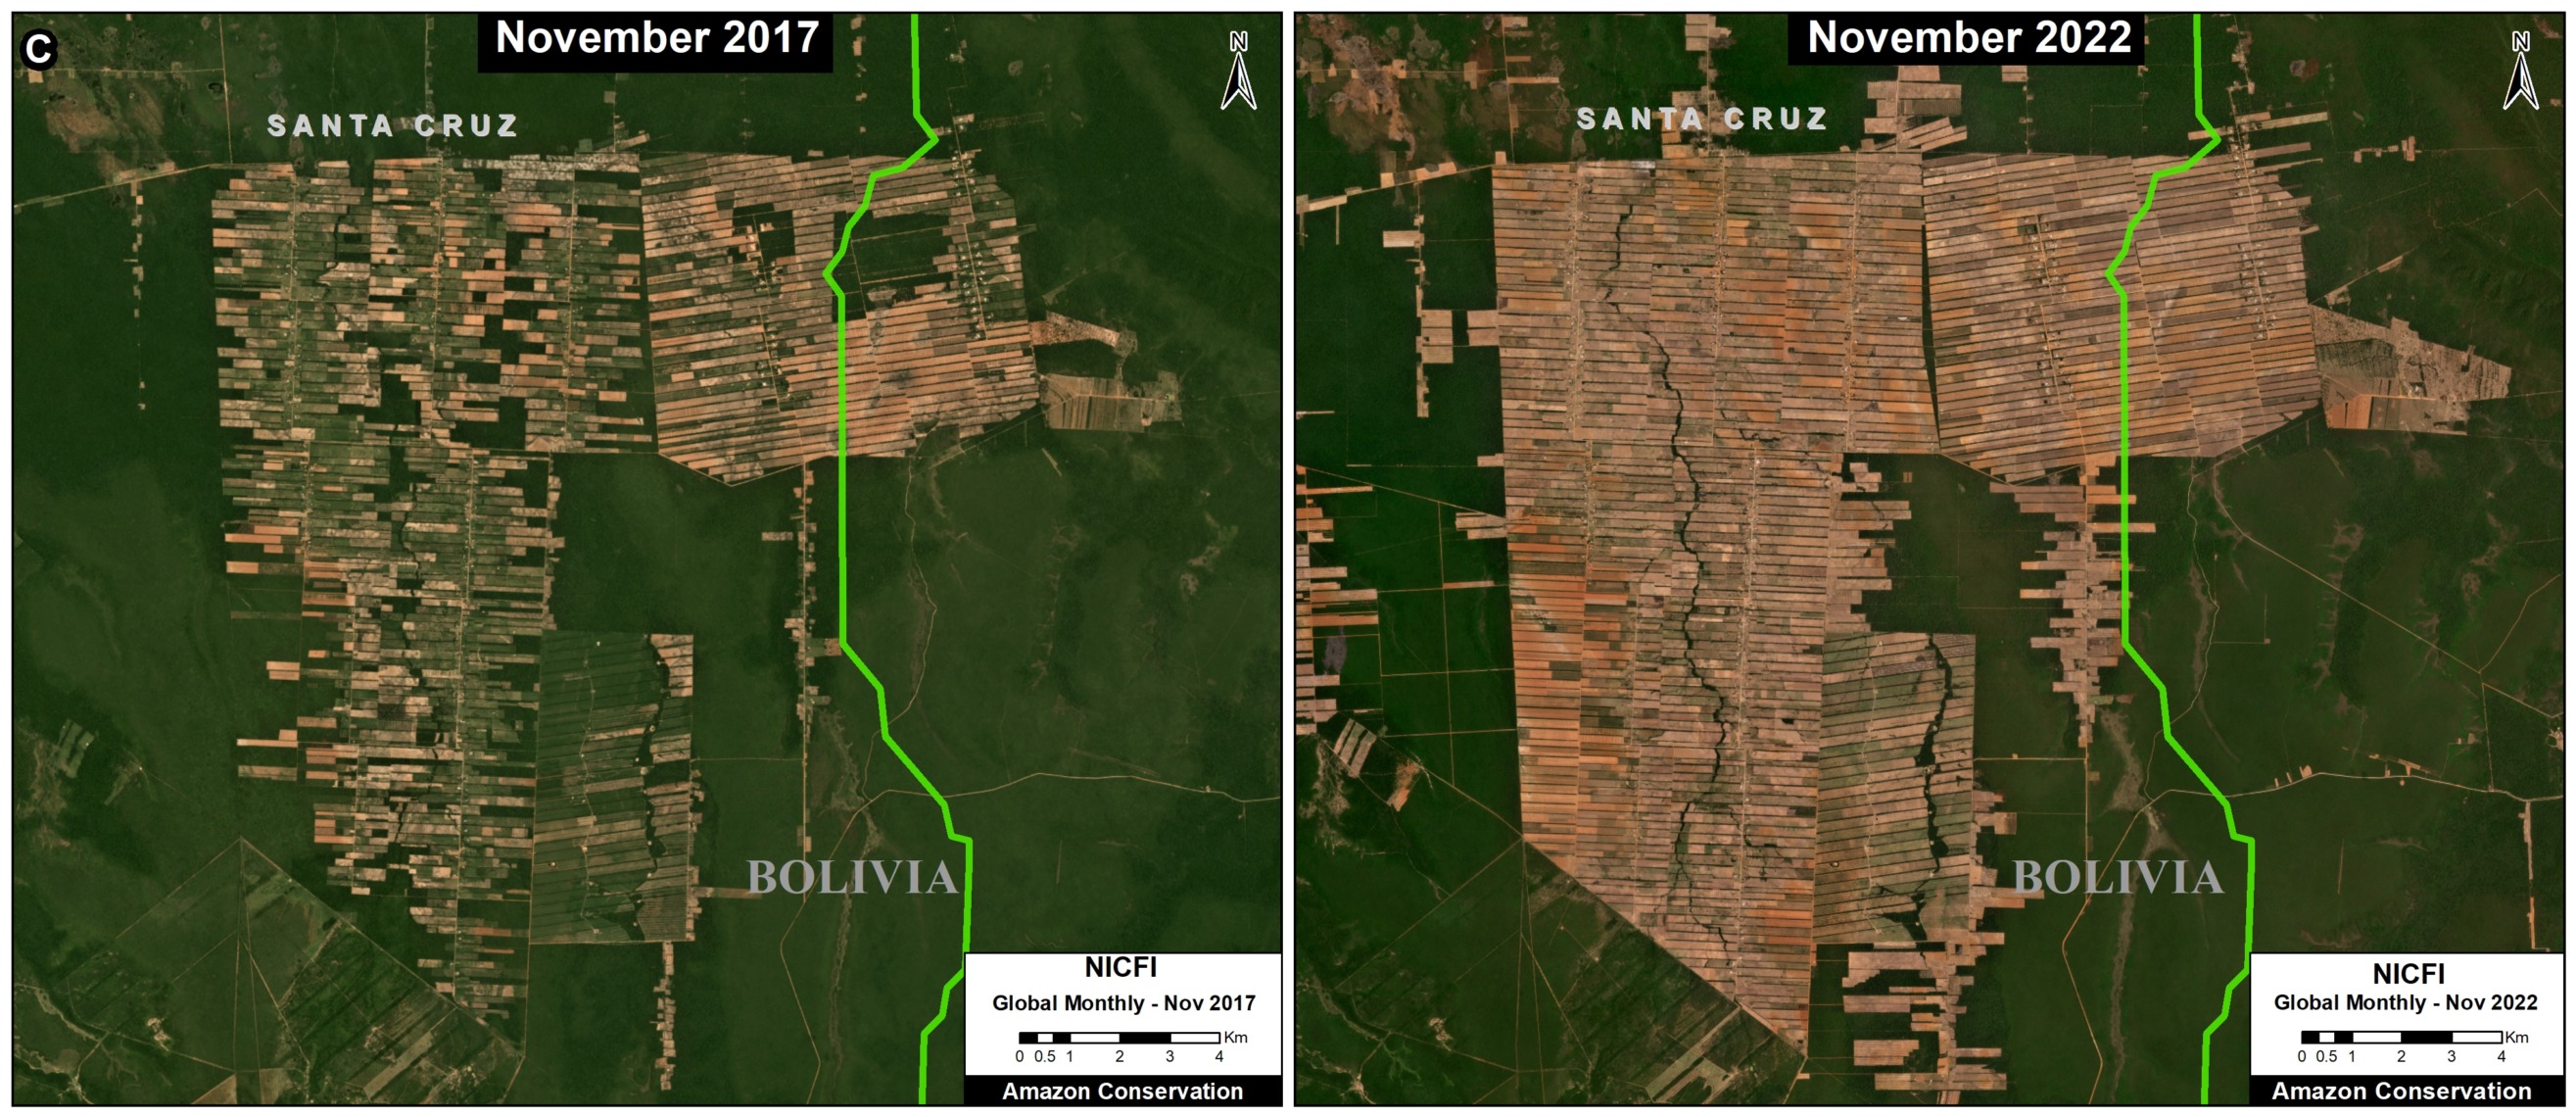
Below, Figures 2-4 show examples of this recent soy deforestation, comparing 2017 (left panel) with 2021 (right panel). See the Base Map above for locations of insets A-C.

Figure 2. Soy deforestation in the Bolivian Amazon, 2017 vs 2021.
Figure 3. Soy deforestation in the Bolivian Amazon, 2017 vs 2021.
Figure 4. Soy deforestation in the Bolivian Amazon, 2017 vs 2021.

Methodology

For this series of reports, we employed a three-part methodology.

First, we mapped out “soy planted area” for 2001 to 2021 based on the data from Song et al 2021.1 This data is available on the University of Maryland’s GLAD site “Commodity Crop Mapping and Monitoring in South America.”

Second, on top of the soy planted area noted above, we mapped out forest loss for 2001 to 2021, also based on data from the University of Maryland.2 This served as our estimate of soy-driven deforestation.

Third, on top of the soy planted area noted above, we incorporated an additional dataset from a recent study on the expansion of Mennonite colonies in Latin America. 3 Spatial data from this study available here. We then estimated forest loss for these select Mennonite soy areas. See MAAP #180.

References

1Song, X.P., M.C. Hansen, P. Potopov, B. Adusei, J. Pickering, M. Adami, A. Lima, V. Zalles, S.V. Stehman, D.M. Di Bella, C.M. Cecilia, E.J. Copati, L.B. Fernandes, A. Hernandez-Serna, S.M. Jantz, A.H. Pickens, S. Turubanova, and A. Tyukavina. 2021. Massive soybean expansion in South America since 2000 and implications for conservation.

2Hansen, M. C., P. V. Potapov, R. Moore, M. Hancher, S. A. Turubanova, A. Tyukavina, D. Thau, S. V. Stehman, S. J. Goetz, T. R. Loveland, A. Kommareddy, A. Egorov, L. Chini, C. O. Justice, and J. R. G. Townshend. 2013. “High-Resolution Global Maps of 21st-Century Forest Cover Change.” Science 342 (15 November): 850–53. Data available from: earthenginepartners.appspot.com/science-2013-global-forest.

3Yann le Polain de Waroux, Janice Neumann, Anna O’Driscoll & Kerstin Schreiber (2021) Pious pioneers: the expansion of Mennonite colonies in Latin America, Journal of Land Use Science, 16:1, 1-17, DOI: 10.1080/1747423X.2020.1855266

Acknowledgements

These reports are part of a series focused on the Bolivian Amazon through a strategic collaboration between the sister organizations Amazon Conservation in Bolivia (ACEAA) and Amazon Conservation in the U.S.

Citation

Finer M, Ariñez A (2023) Soy Deforestation in the Bolivian Amazon. MAAP #179.

MAAP #173: Rapid Increase of Mining Deforestation in Yapacana National Park (Venezuelan Amazon)

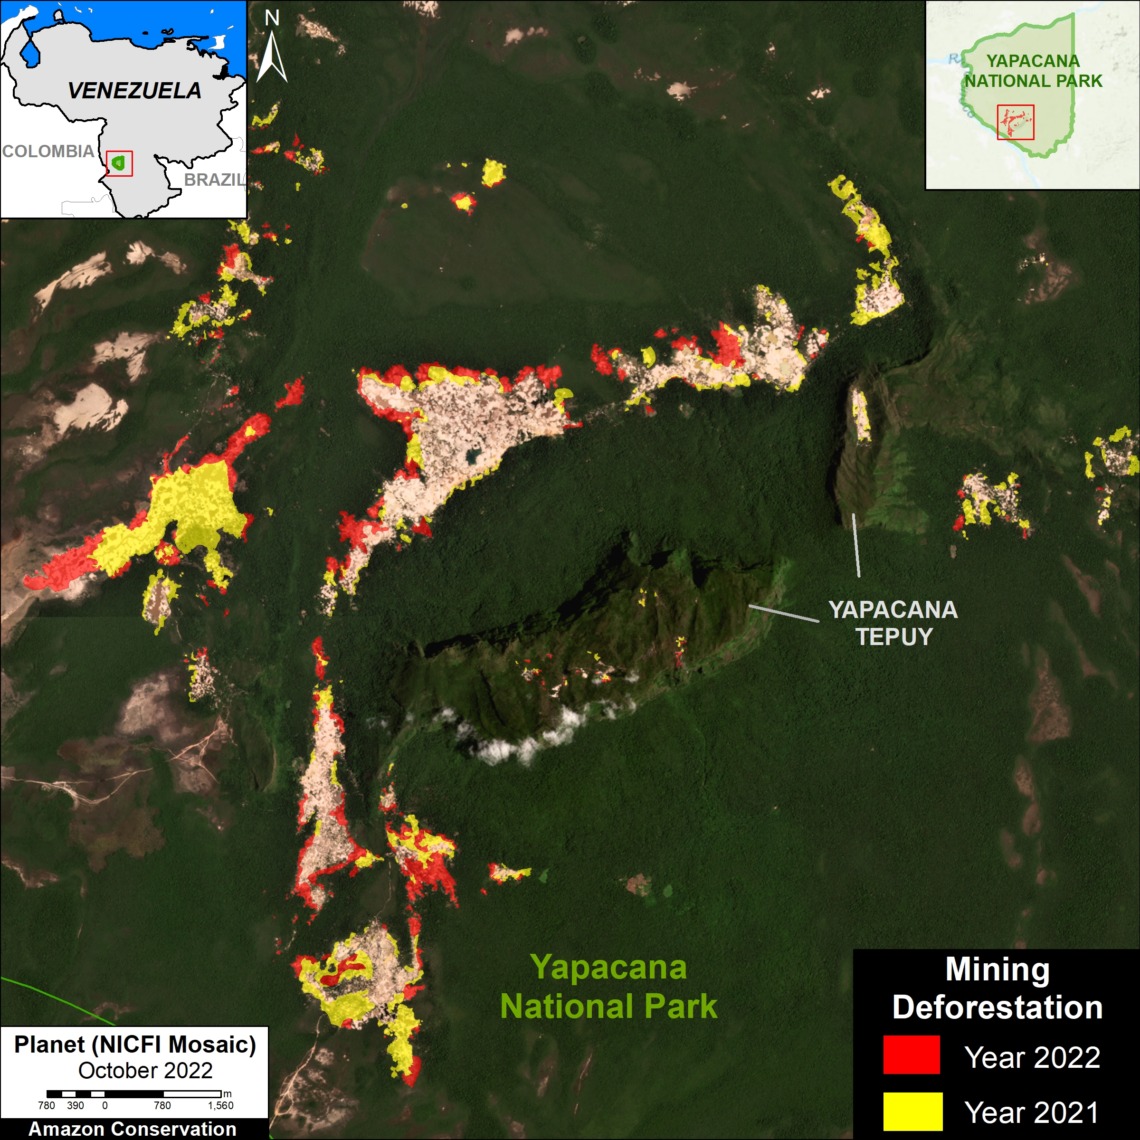
Base Map. Recent (2021-22) mining deforestation in Yapacana National Park, Venezuelan Amazon. Data: ACA/MAAP, Planet, NICFI.

We continue our series on the Venezuelan Amazon (see MAAP #155), with a special focus on the key protected area of Yapacana National Park.

In recent reports, we showed that Yapacana is currently experiencing intense illegal mining activity with likely thousands of miners (see MAAP #156), including on top of the sacred Yapacana Tepui (see MAAP #169).

Here, we focus on the most active mining zone, located in the southwestern part of the park surrounding the tepui, where mining deforestation has escalated rapidly over the past two years.

We found the new deforestation of over 750 hectares (1,870 acres) within this sector of Yapacana National Park between 2021 and 2022.

The Base Map illustrates this result, with red and yellow showing 2022 and 2021 deforestation, respectively.

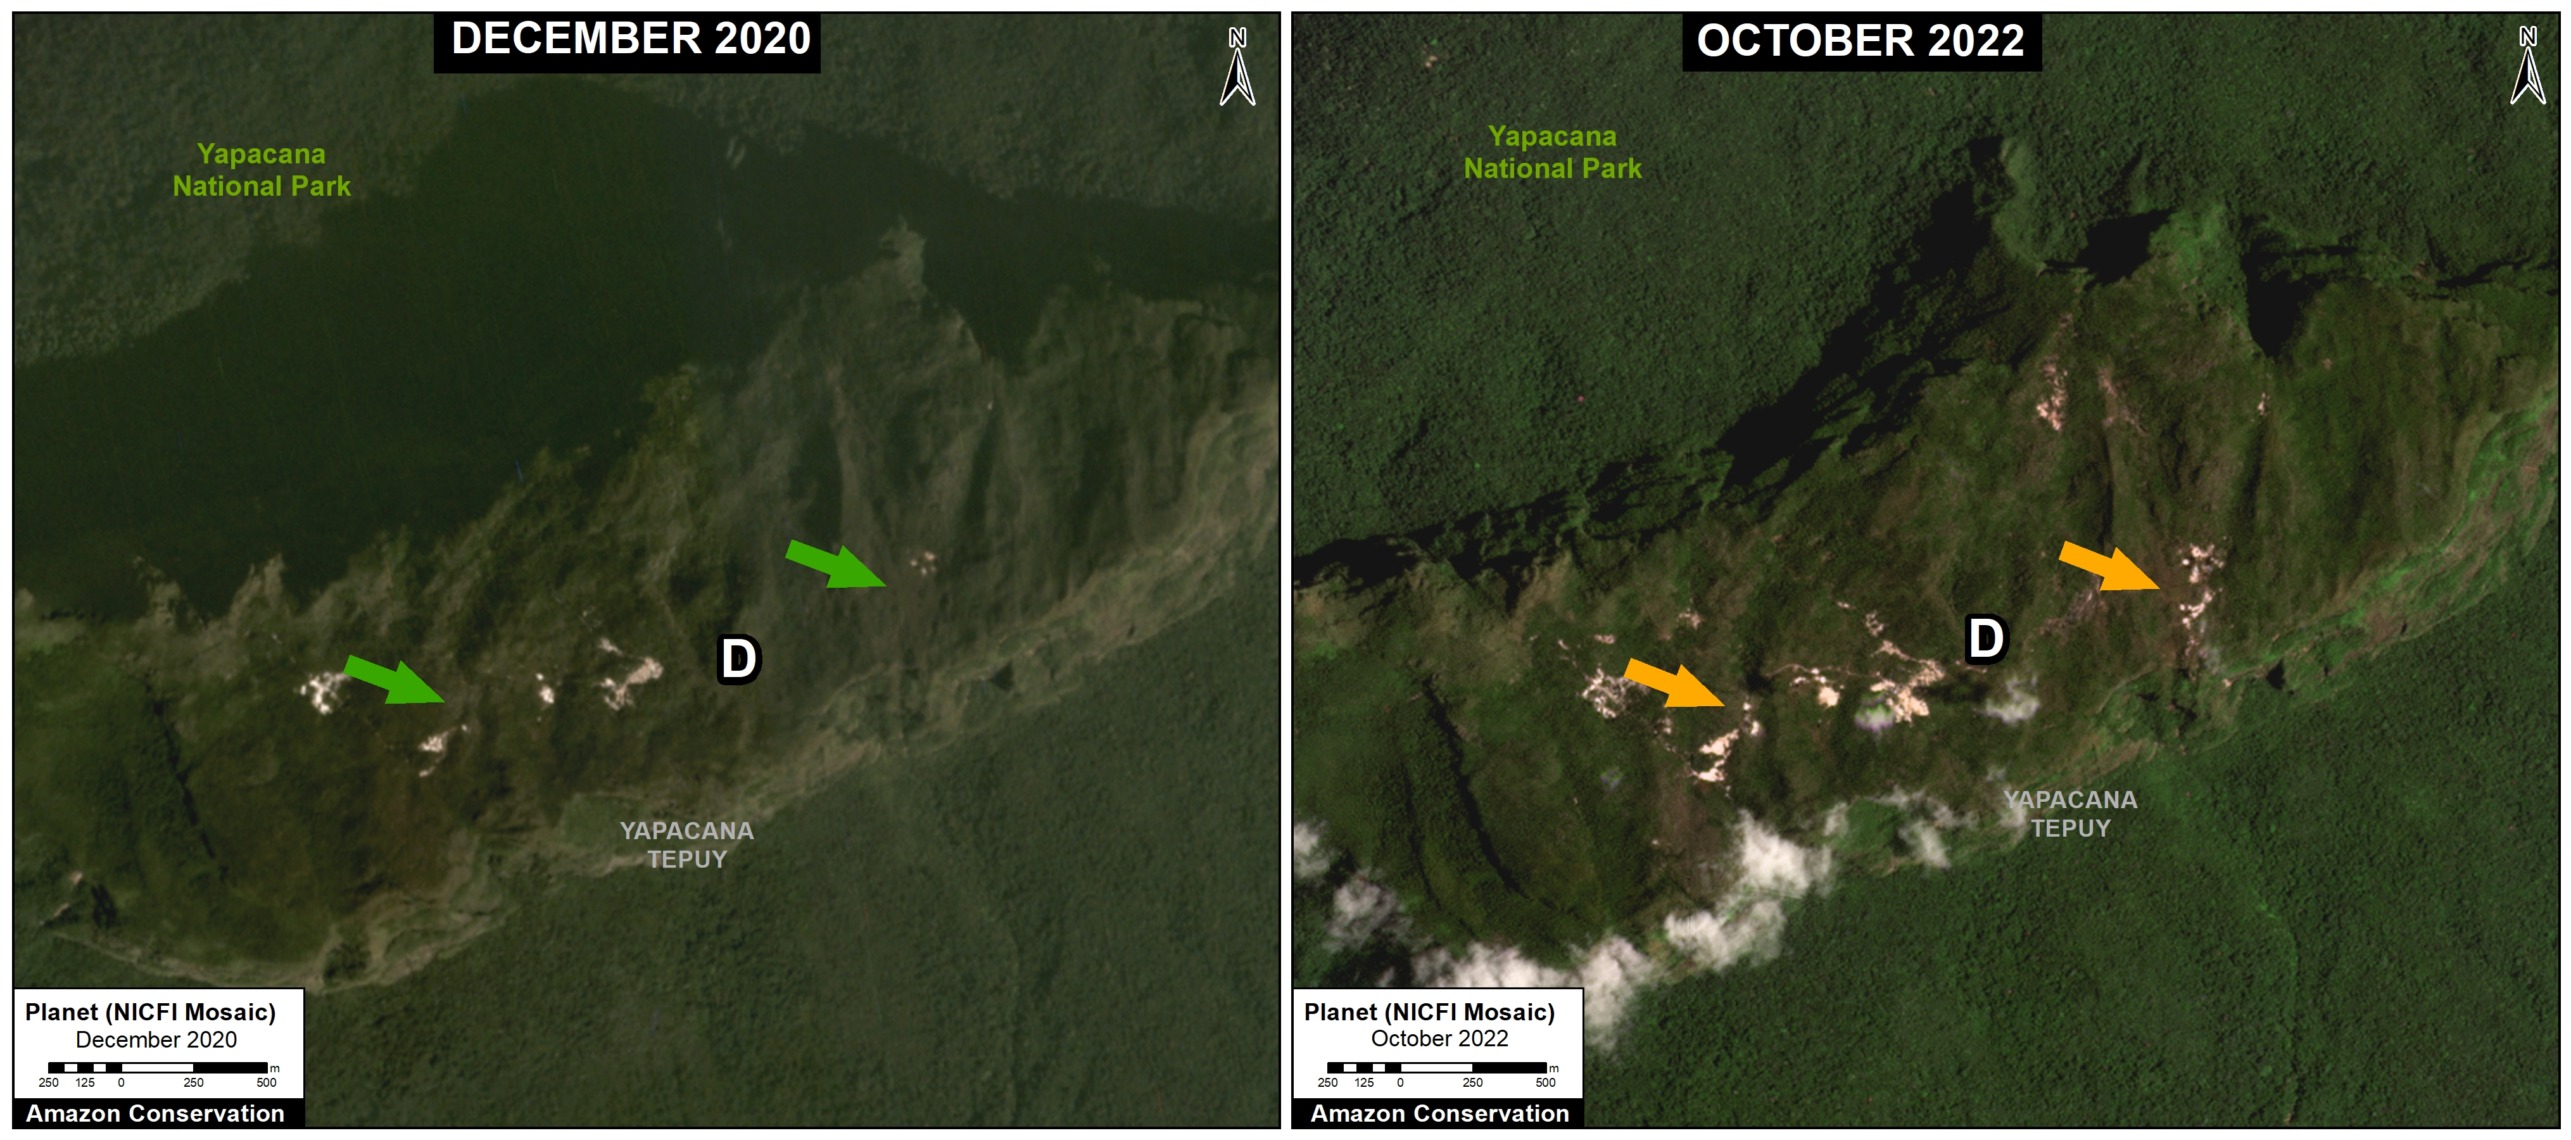
Note that some of the recent deforestation (6 hectares) has occurred on top of the tepui.

Below, we zoom in and show this recent deforestation with high-resolution satellite imagery.


Deforestation 2021-22 in Yapacana National Park

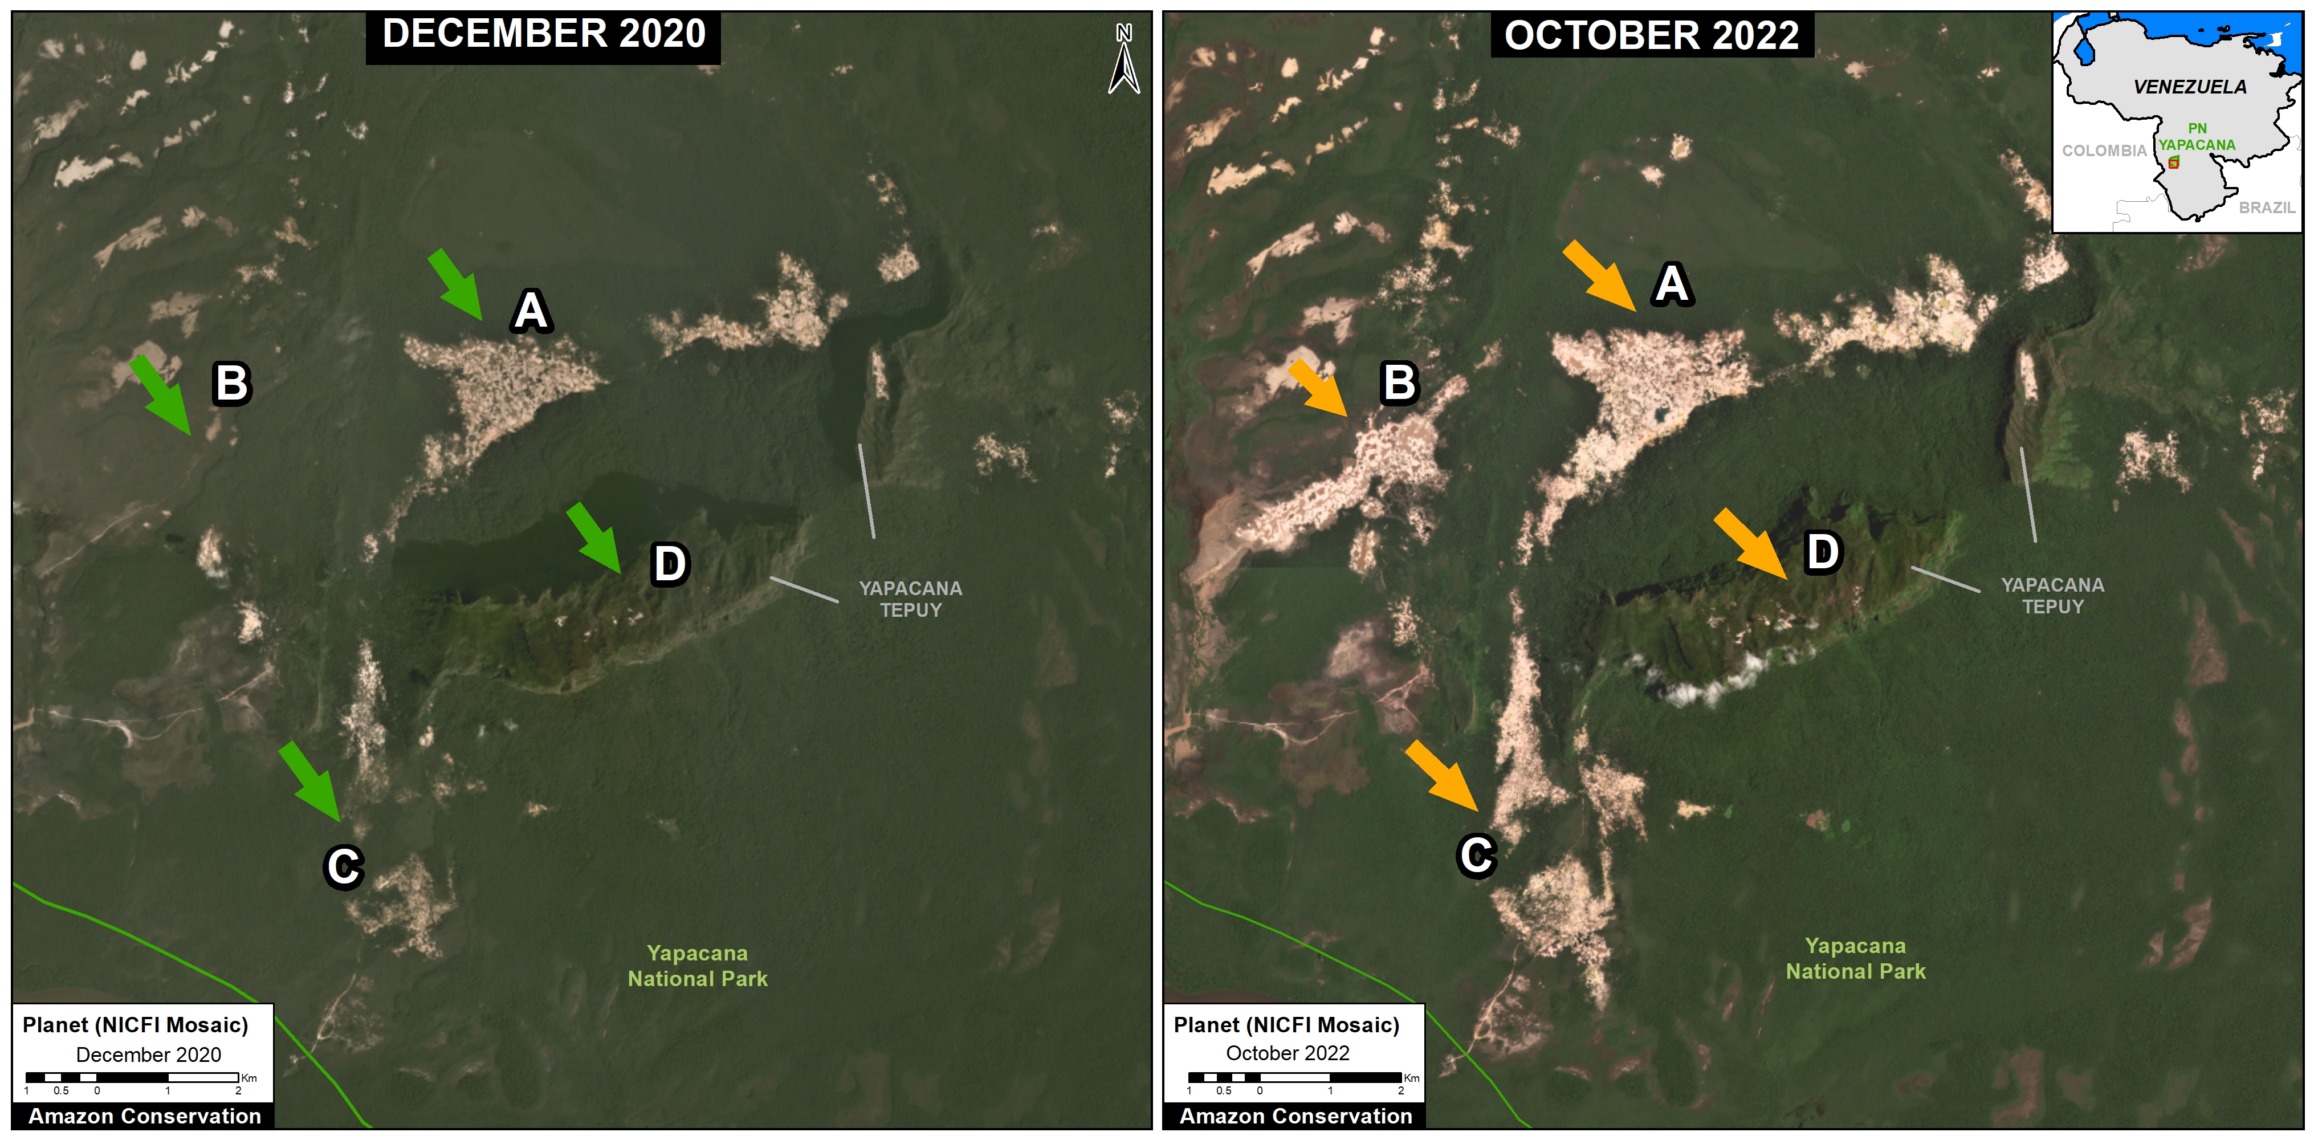
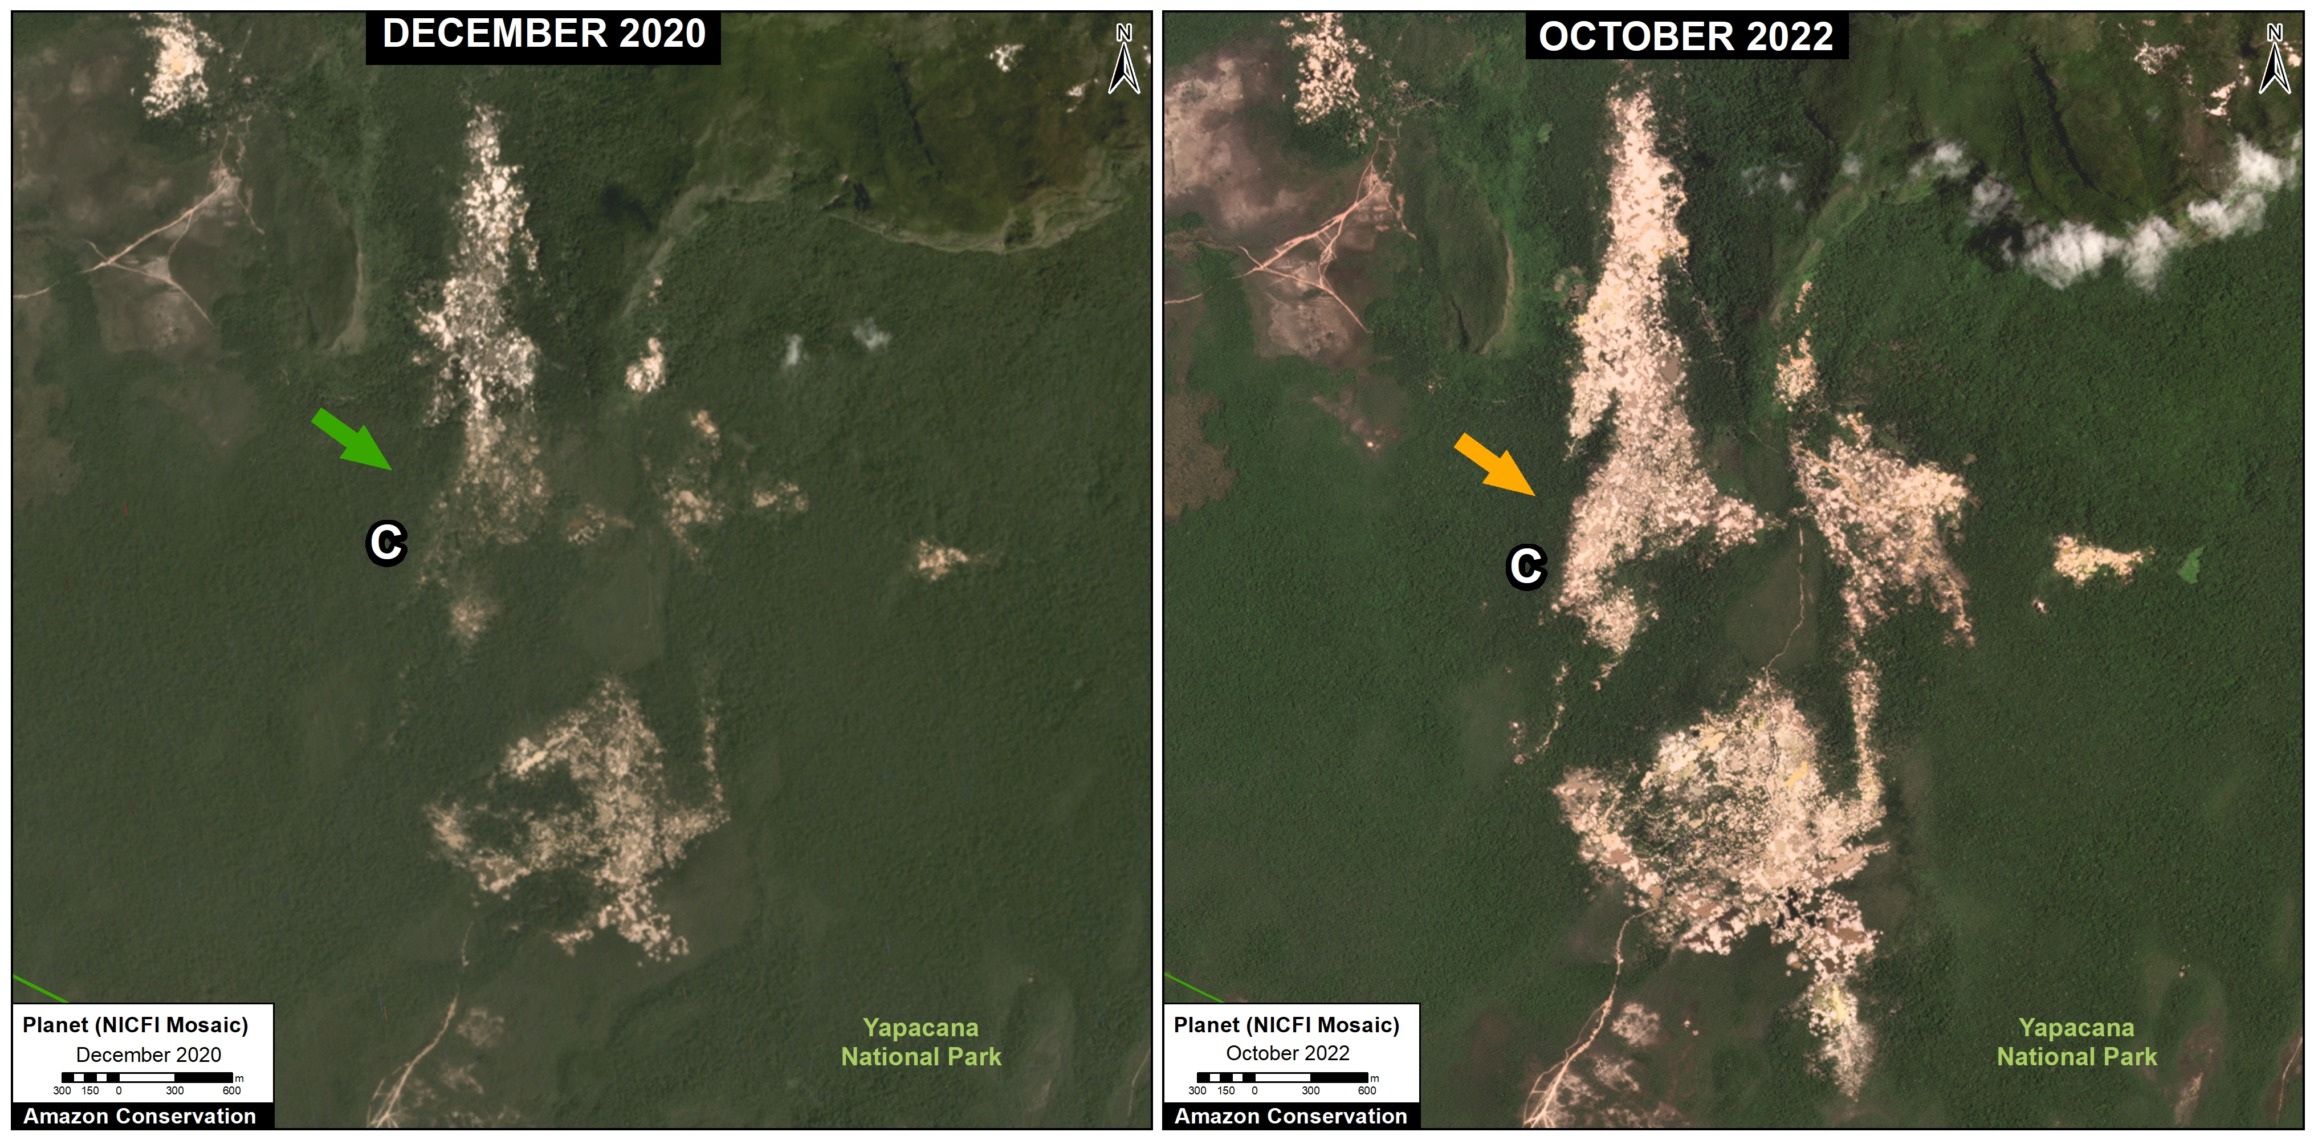
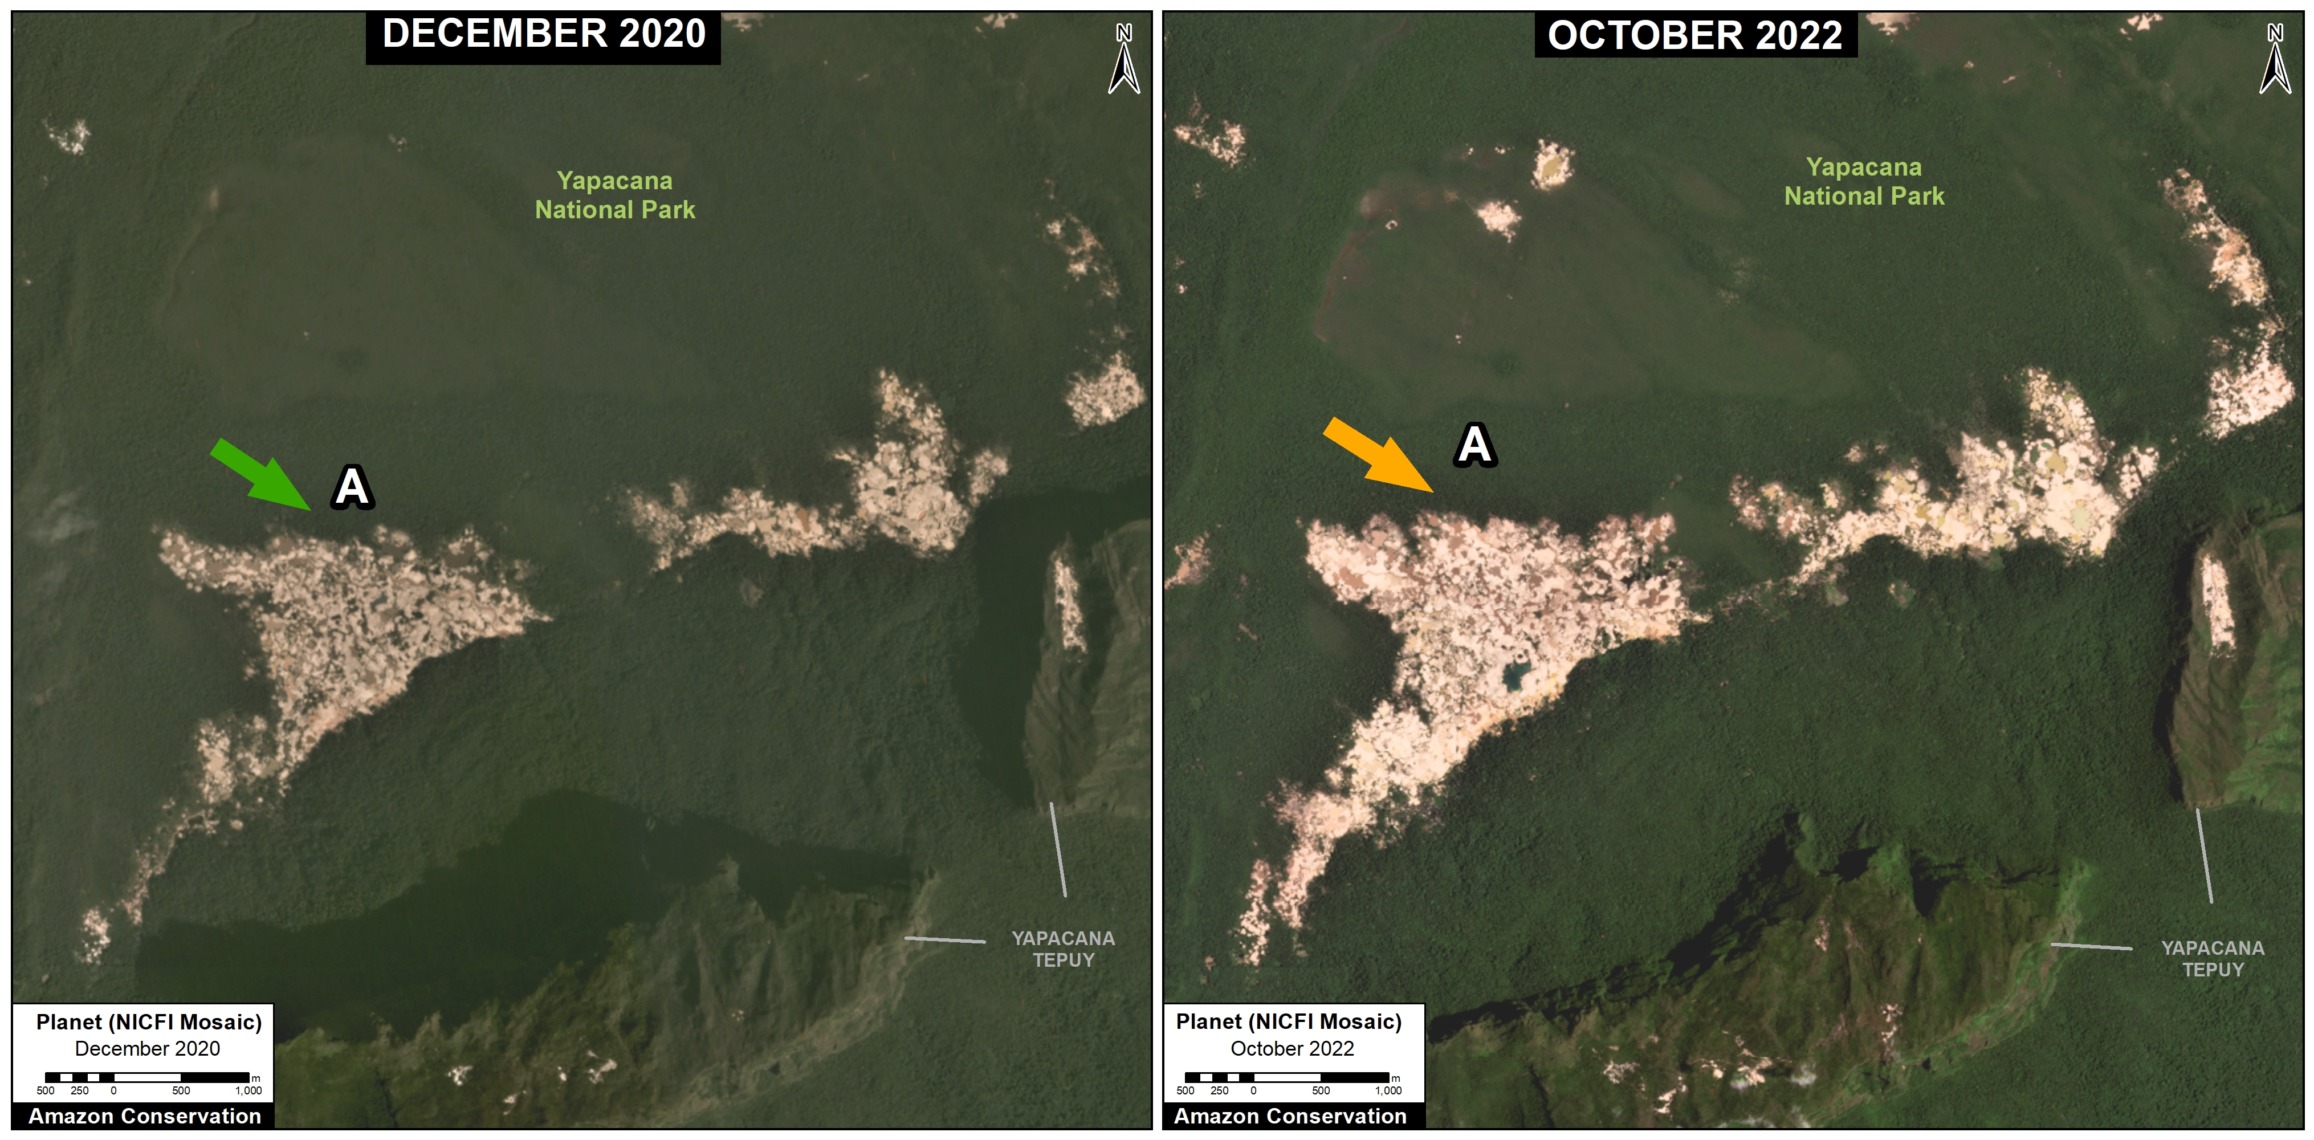
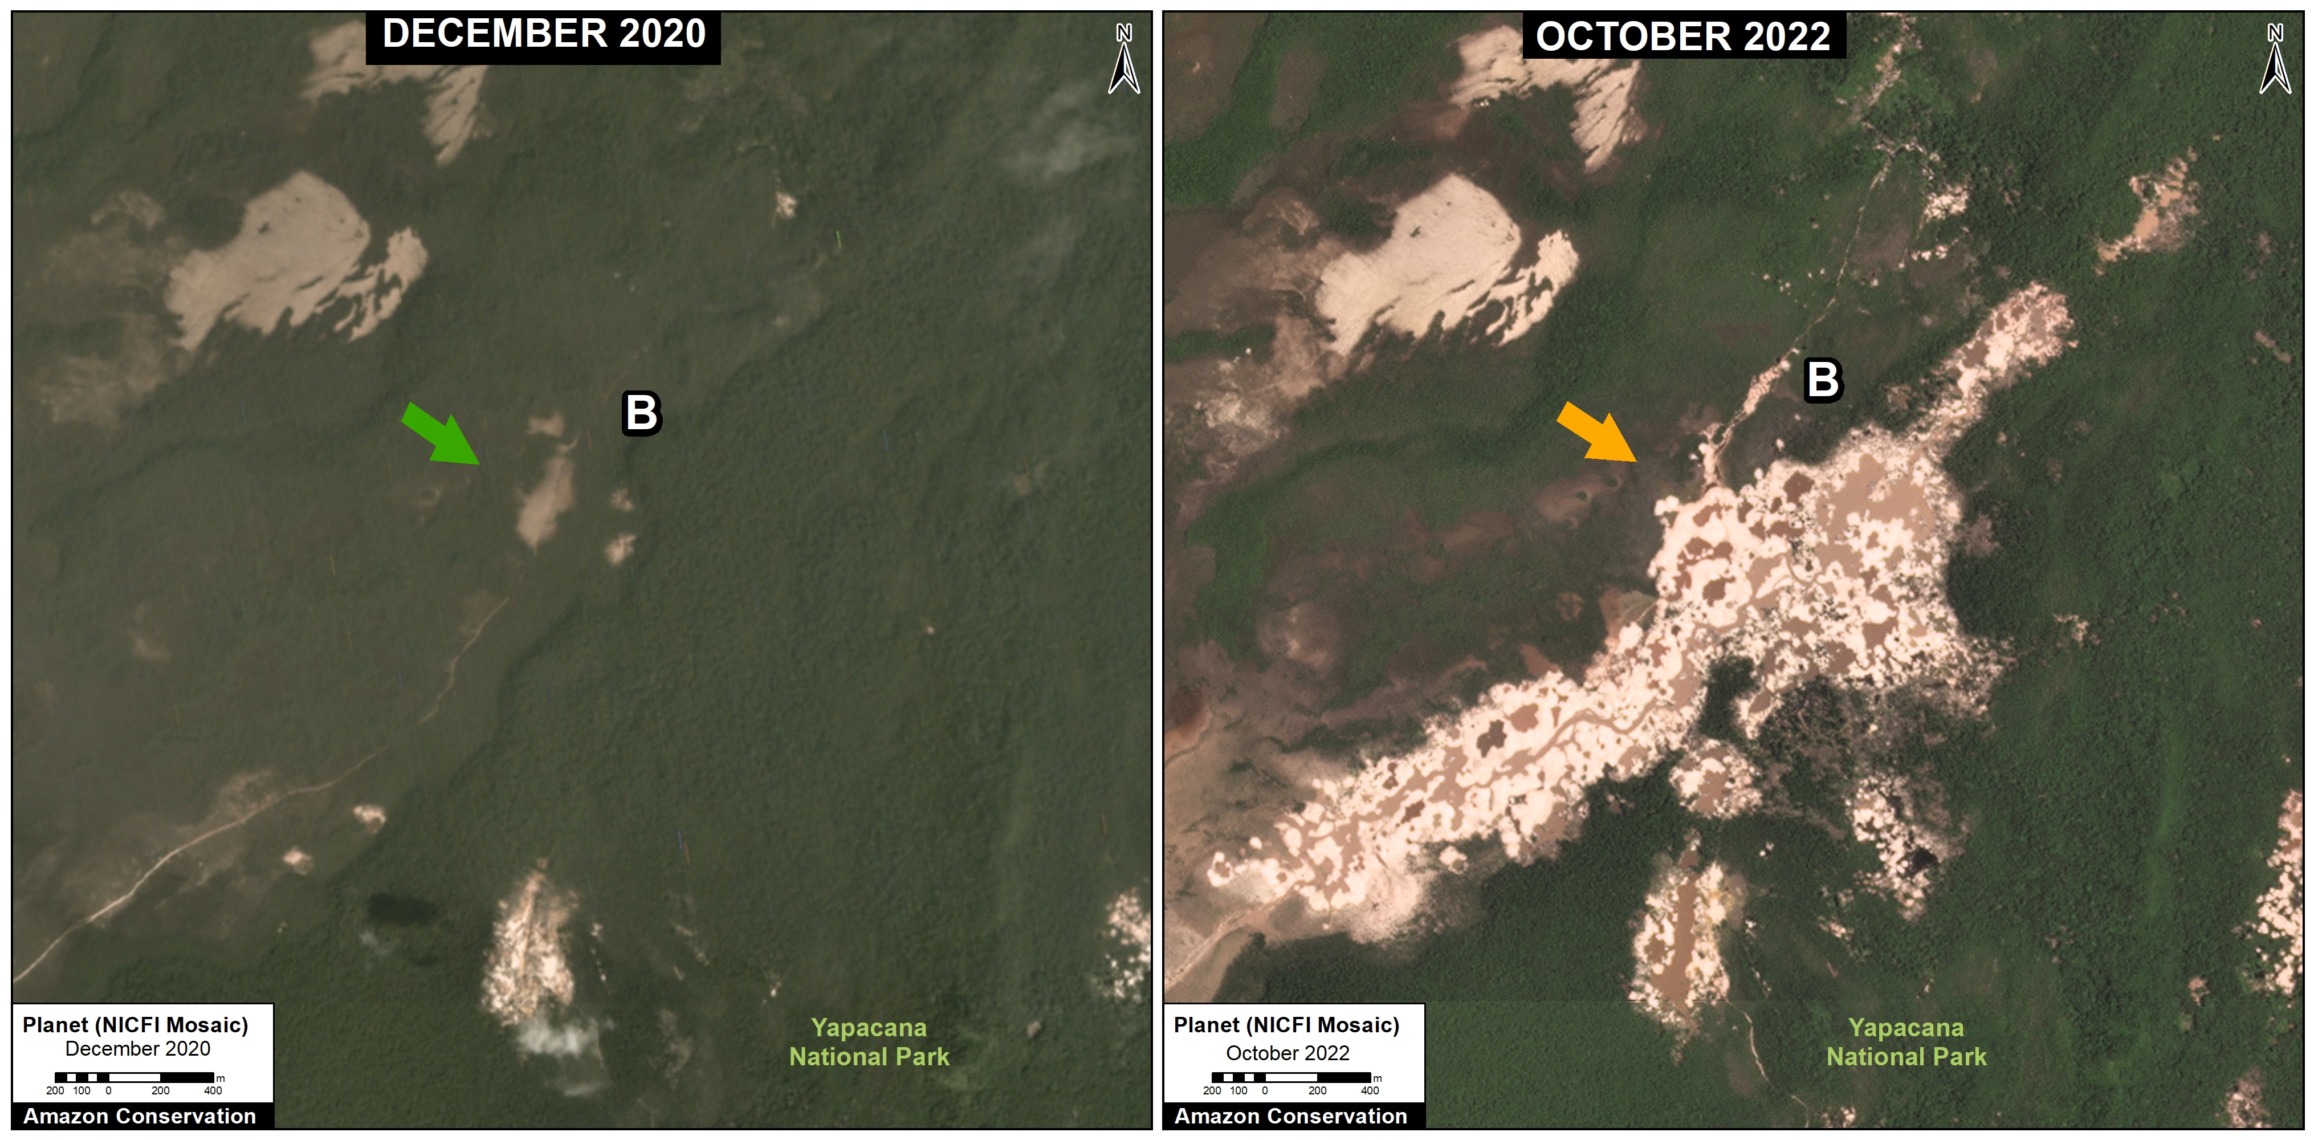
Figure 1 shows the deforestation of 757 hectares between December 2020 (left panel) and October 2022 (right panel) in the southern part of Yapacana National Park surrounding Yapacana Tepui. The arrows point to the major zones before (green) and after (orange) deforestation. The Letters A-D correspond the four zooms below.

Figure 1. Recent deforestation in Yapacana National Park. The arrows point to the major zones before (green) and after (orange) deforestation. The Letters A-D correspond the four zooms below. Data: ACA/MAAP, Planet, NICFI.

Zoom A

Zoom A. Data: ACA/MAAP, Planet, NICFI

Zoom B

Zoom B. Data: ACA/MAAP, Planet, NICFI

Zoom C

Zoom C. Data: ACA/MAAP, Planet, NICFI

Zoom D

Zoom D shows the deforestation of 4 hectares between December 2020 (left panel) and October 2022 (right panel) on top of Yapacana Tepui within the national park.

Zoom D. Data: ACA/MAAP, Planet, NICFI


Accumulated Deforestation

We estimate the accumulated mining deforestation of 1,537 hectares within this southwestern sector of Yapacana National Park. Thus, nearly half (49%) has occurred most recently in 2021-22.

Of the total accumulated deforestation, 17 hectares has occurred on top of the sacred tepui. Over a third (35%) has has occurred most recently in 2021-22.

Acknowledgements

We thank SOS Orinoco for helpful comments on this report.

Citation

Finer M, Ariñez A (2023) Rapid Increase of Mining Deforestation in Yapacana National Park (Venezuelan Amazon). MAAP: 173.


MAAP #171: Deforestation in Mining Corridor of Peruvian Amazon (2021-2022)

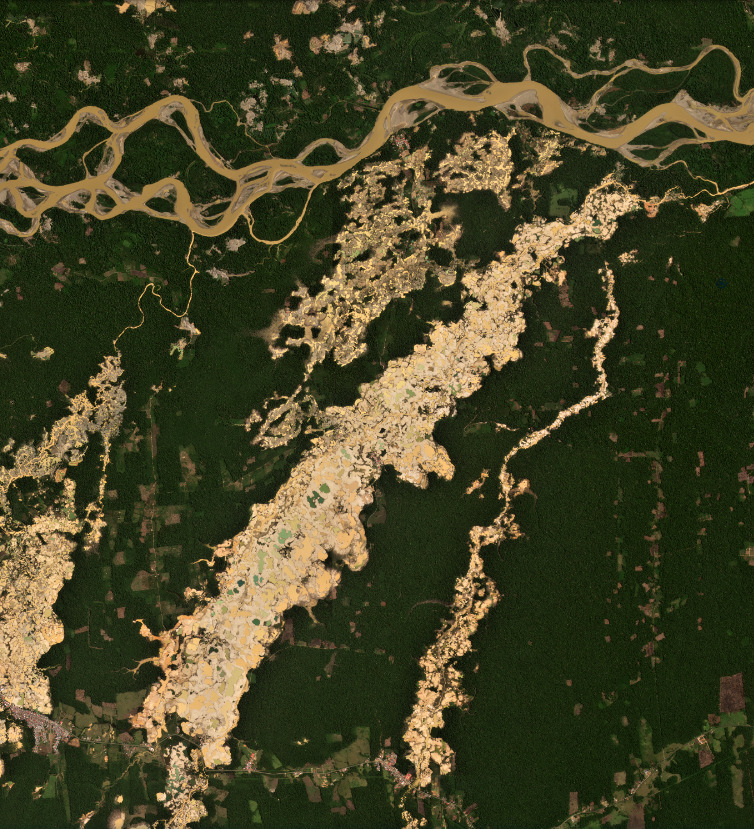
Figure 1. Recent mining deforestation in the Guacamayo zone of the Mining Corridor (Madre de Dios region of the southern Peruvian Amazon). Data: Planet.

Gold mining continues to be one of the main deforestation drivers in the southern Peruvian Amazon (Madre de Dios region).

In a recent report (MAAP #154), we highlighted the key cases of illegal mining in this area.

In an attempt to organize mining activities and promote a formalization process,* the Peruvian government has delimited a large Mining Corridor in Madre de Dios (see Base Map below).

Here, we analyze recent (2021 – 2022) deforestation in the Mining Corridor, using a novel methodology.

Deforestation within its limits is important because, although it may not be illegal, can be considerable due to the large area covered by the Mining Corridor (498,296 hectares, or 1.2 million acres).

The key part of this analysis is the novel ability to distinguish mining deforestation from agriculture deforestation, which is also common in the area.

In summary, we estimate the direct mining deforestation of 11,200 hectares (27,675 acres) in the Mining Corridor over the last two years (2021-22).

Deforestation in the Mining Corridor

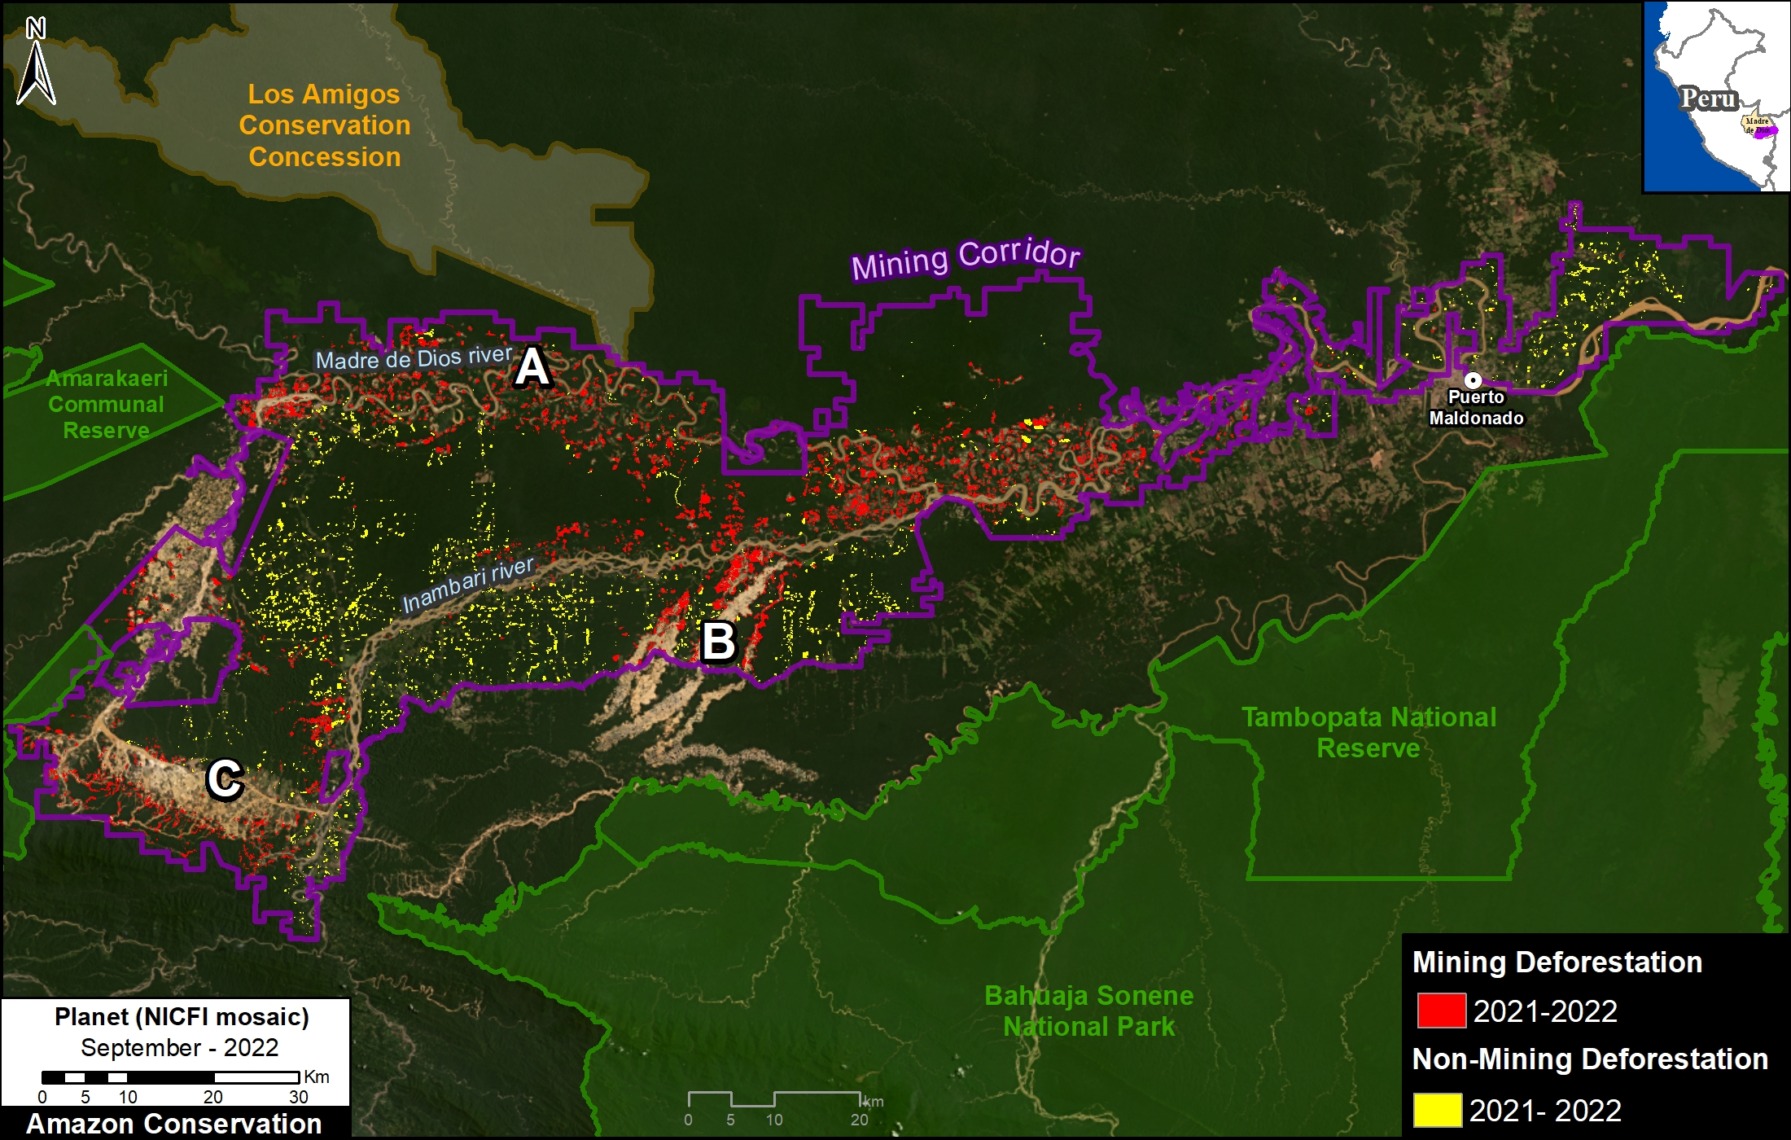
Base Map. Mining (red) vs Agriculture (yellow) deforestation within the Mining Corridor in the southern Amazon of Peru (Madre de Dios region), during the years 2021 and 2022. Data: ACCA/MAAP.

We found a total deforestation of 16,000 hectares (39,500 acres) within the Mining Corridor over the past two years (2021 and 2022).

Of this deforestation total, 70% is directly linked to gold mining (11,200 hectares; indicated by red on the Base Map), while the remaining 30%  loss is agricultural expansion (4,800 hectares; indicated by yellow).

In the Base Map, note that mining deforestation is largely concentrated in three general areas:
(A) along the Madre Dios River, (B) the Guacamayo mining zone (also see Figure 1, above), and (C) around the perimeter of the Huepetuhe mining zone.

*Note on the mining formalization process in Peru

In the Mining Corridor, officially called the “Zona de pequeña minería y minería artesanal en el departamento de
Madre de Dios,” declared by Legislative Decree No. 1100, mining activities can be classified into one of three scenarios:

1) Formal: Formalization process completed, with approved environmental and operational permits.
2) Informal: In the process of being formalized, operating in spaces where extraction is allowed and using permitted machinery. This type is considered an administrative offense, not a crime.
3) Illegal: Operating in prohibited areas such as bodies of water (for example, a river or a lake) and/or using prohibited machinery. This type is considered a crime and is punishable by jail.

Methodology

We used LandTrendr, a temporal segmentation algorithm that identifies changes in pixel values through time, to detect forest loss within the mining corridor in 2021 (September 2020 – September 2021) and 2022 (September 2021 – July 2022). It is important to emphasize this method was originally designed for moderate-resolution (30 meters) Landsat imagery,1 but we adapted it for higher-resolution (4.7 meters) NICFI-Planet monthly mosaics.2

Additionally, we created a baseline for the period 2016- 2020 to eliminate old agriculture and mining areas (pre-2021) due to rapid changes in the natural re-vegetation process.

Finally, we manually separated the mining and non-mining forest loss for 2021 and 2022, in order to report specifically on direct mining-related impacts. For this part of the analysis, we used various resources to aid the manual process, such as radar-based alerts (RAMI), CINCIA historical data from 1985 to 2020, and forest loss data from the Peruvian government (PNCB) and the University of Maryland.

1. Kennedy, R.E., Yang, Z., Gorelick, N., Braaten, J., Cavalcante, L., Cohen, W.B., Healey, S. (2018). Implementation of the LandTrendr Algorithm on Google Earth Engine. Remote Sensing. 10, 691.
2.  Erik Lindquist, FAO, 2021

Acknowledgments

We thank S. Otoya for helpful comments on this report.

This report was conducted with technical assistance from USAID, via the Prevent project. Prevent works with the Government of Peru, civil society and the private sector to prevent and combat environmental crimes for the sake of the conservation of the Peruvian Amazon, particularly in the regions of Loreto, Madre de Dios and Ucayali.

This publication is made possible with the support of the American people through USAID. Its content is the sole responsibility of the authors and does not necessarily reflect the views of USAID or the US government.


Citation

Mamani N, Finer M (2022) Deforestation in Mining Corridor of Peruvian Amazon (2021-2022). MAAP: 171.

MAAP #166: Mennonites have deforested 4,800 hectares (11,900 acres) in the Peruvian Amazon

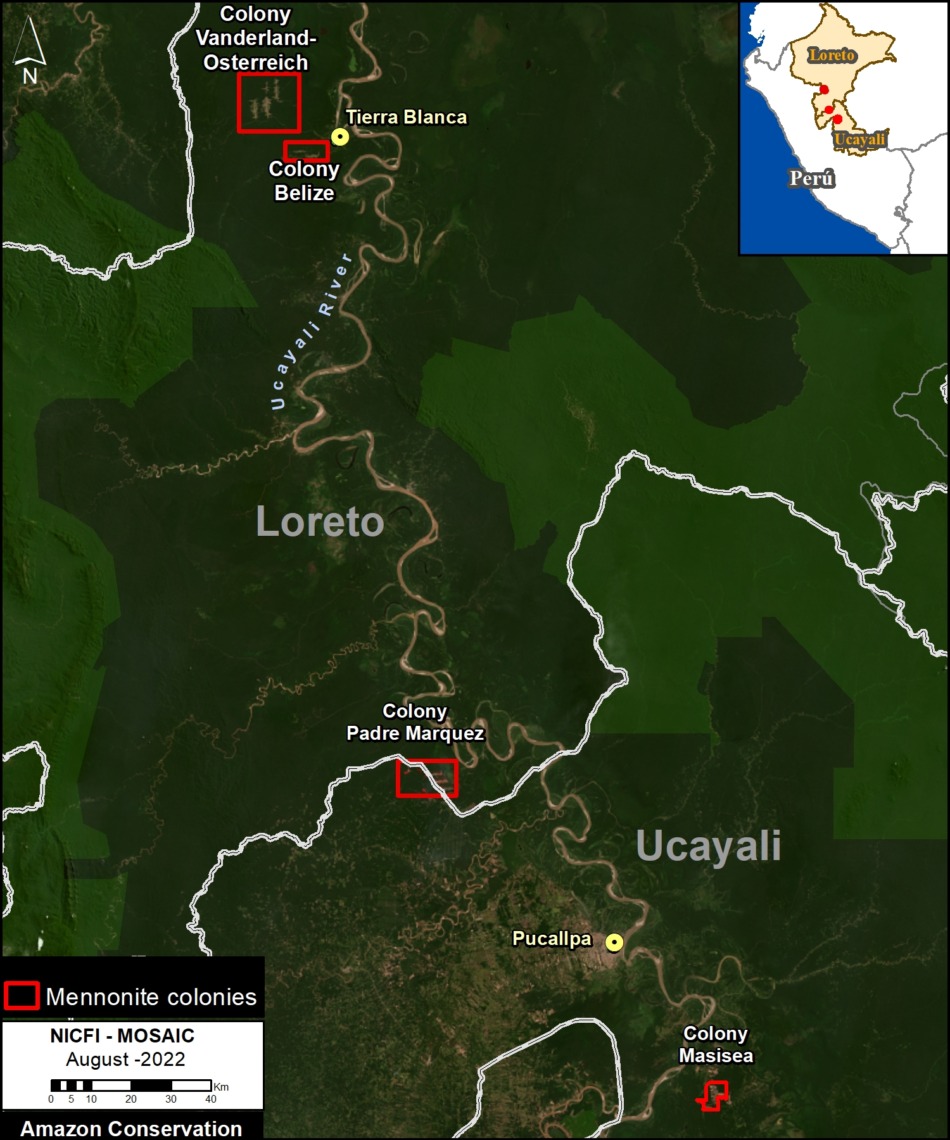
Base Map. Mennonite colonies in the Peruvian Amazon. Data: ACA/MAAP.

Since 2017, the Mennonites have arrived in the Peruvian Amazon and created 5 new colonies.

Here, we show that these colonies have caused the deforestation of more than 4,800 hectares (11,860 acres) of tropical forest, including 650 hectares (1,600 acres) in 2022.

The Base Map shows the current situation regarding the Mennonites in Peru. Note that the 5 colonies are indicated in red.

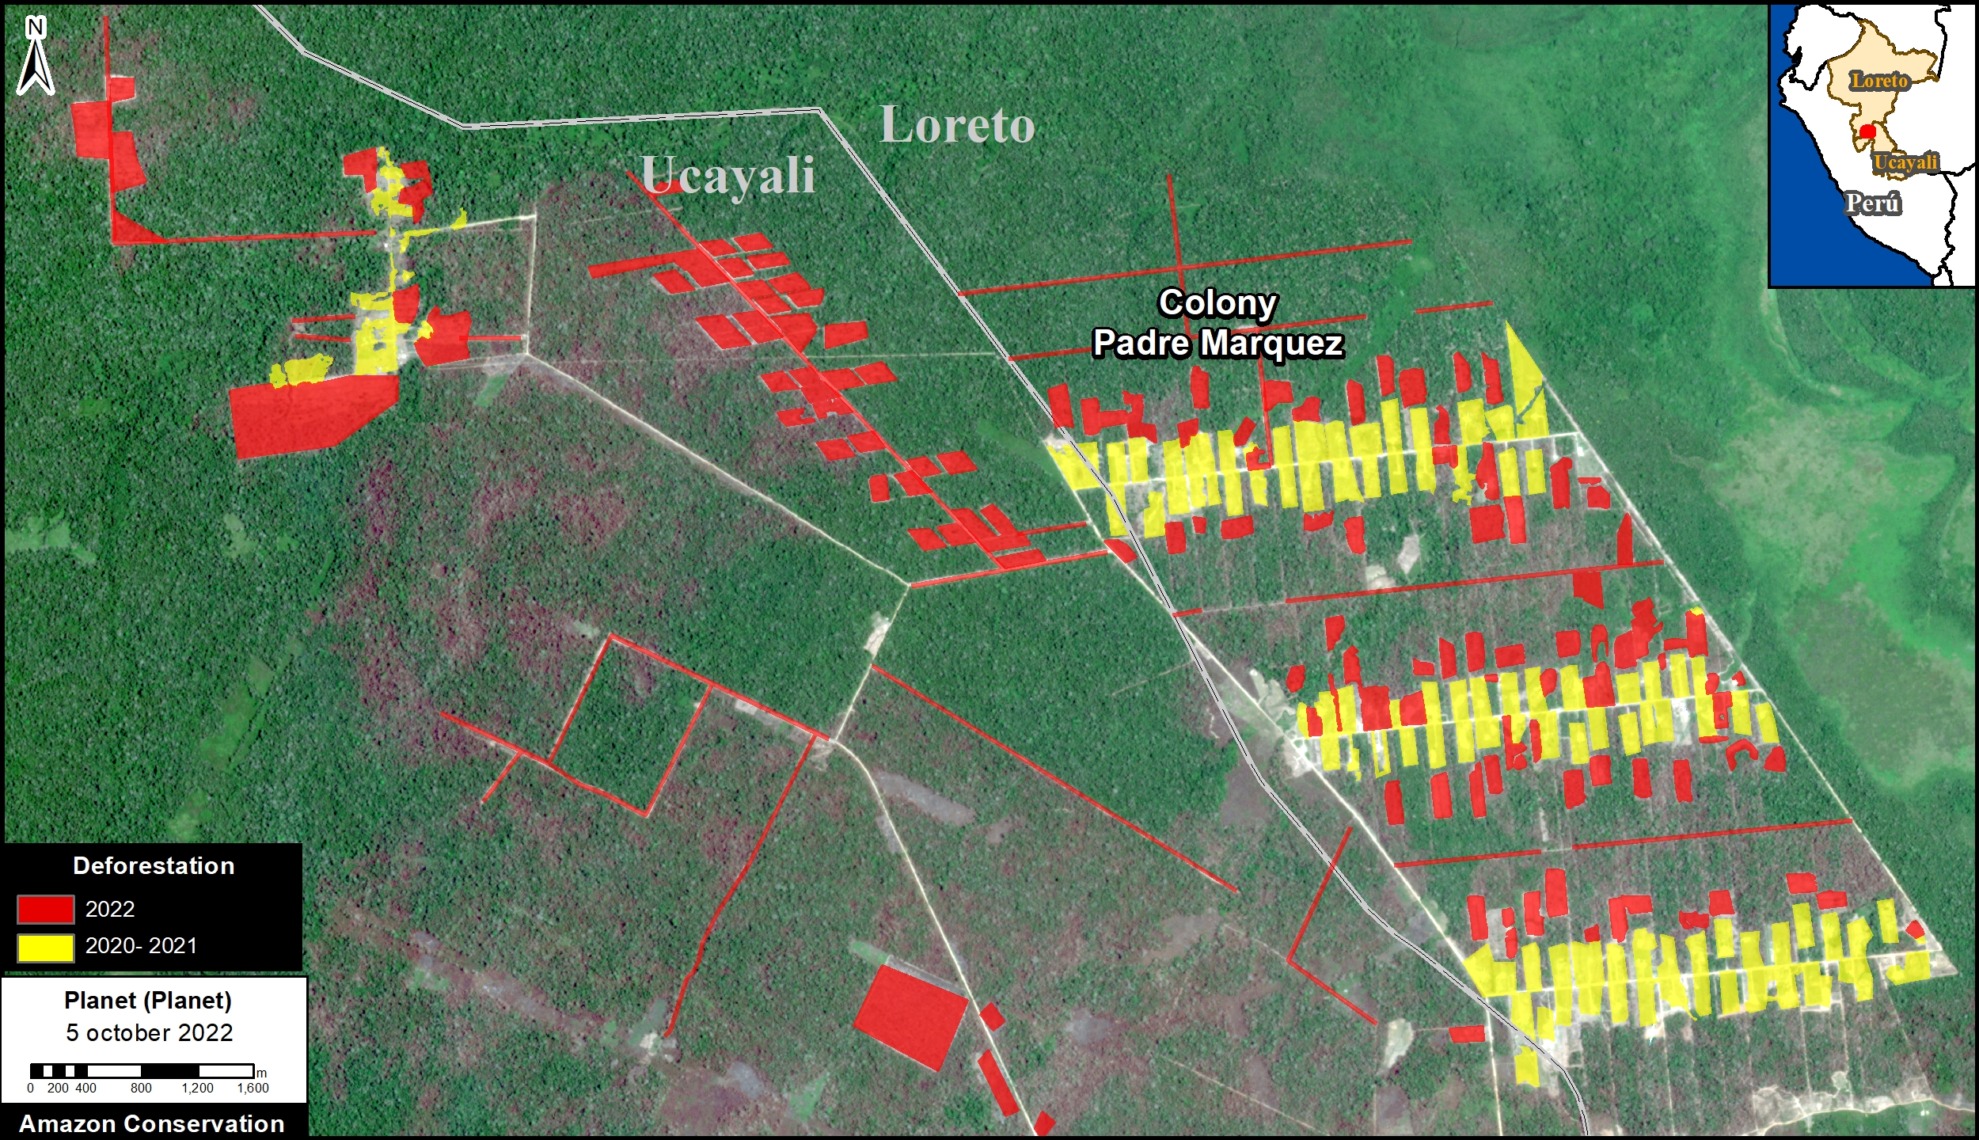
The Padre Marquez colony, located on both sides of the border between the regions of Ucayali and Loreto, has caused the deforestation of 976 hectares (2,412 acres). It is the newest colony (and represents the most urgent current situation), created in 2021 and with a great expansion in the current year 2022.

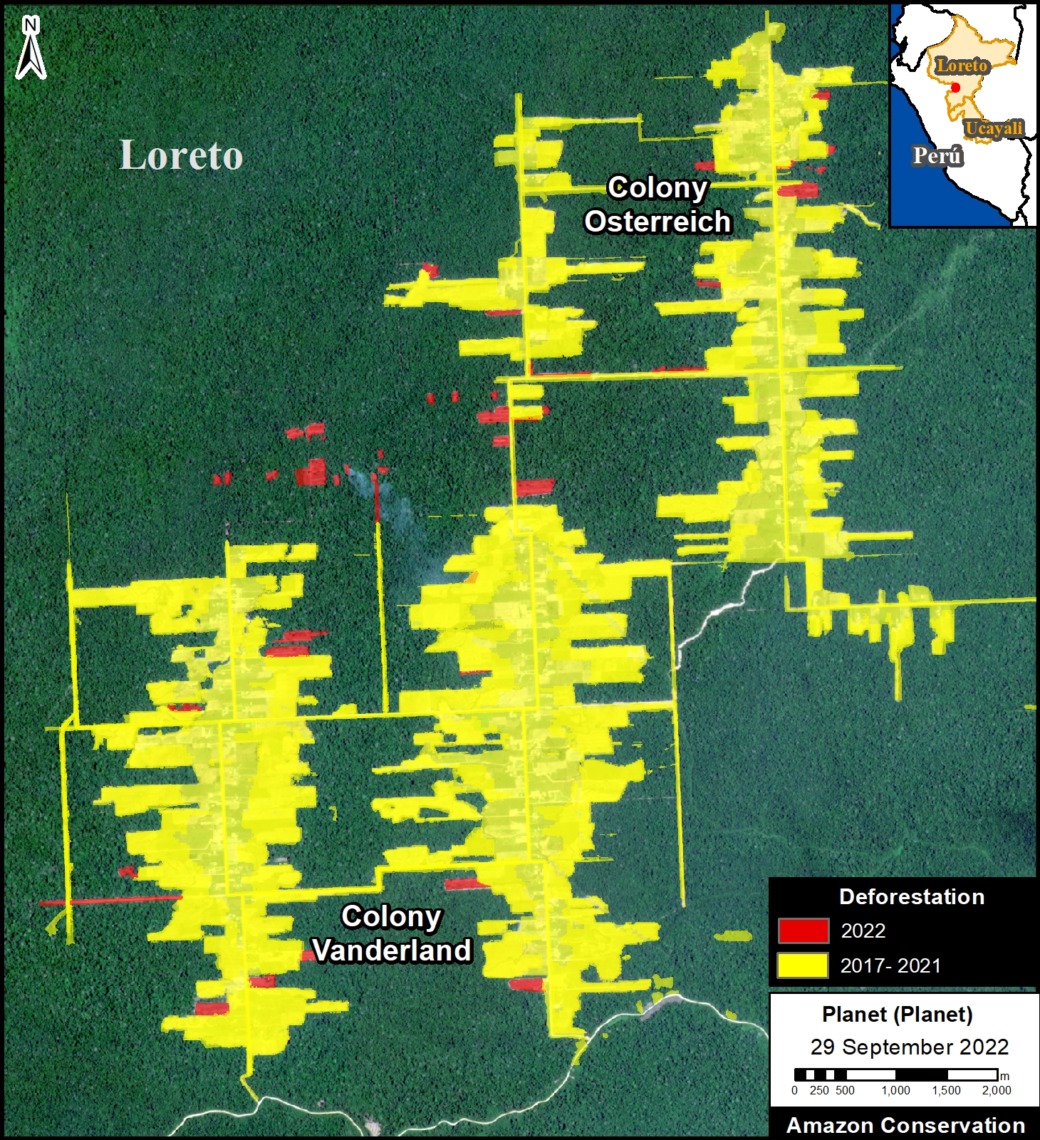
The Vanderland, Osterreich and Belize colonies, located near the town of Tierra Blanca (Loreto region), have caused the deforestation of 2,884 hectares (7,126 acres) since 2017. These colonies are also expanding in 2022.

The Masisea colony, located south of the city of Pucallpa (Ucayali region), has caused the deforestation of 960 hectares (2,372 acres) since 2017.

In total, we have documented the deforestation of 4,819 hectares (11,908 acres) in the five new Mennonite colonies in the Peruvian Amazon.

Below, we detail the deforestation history in each colony since 2017, with an emphasis on the most recent loss in 2022.

Deforestation in Mennonite Colonies (Peruvian Amazon)

Padre Marquez Colony

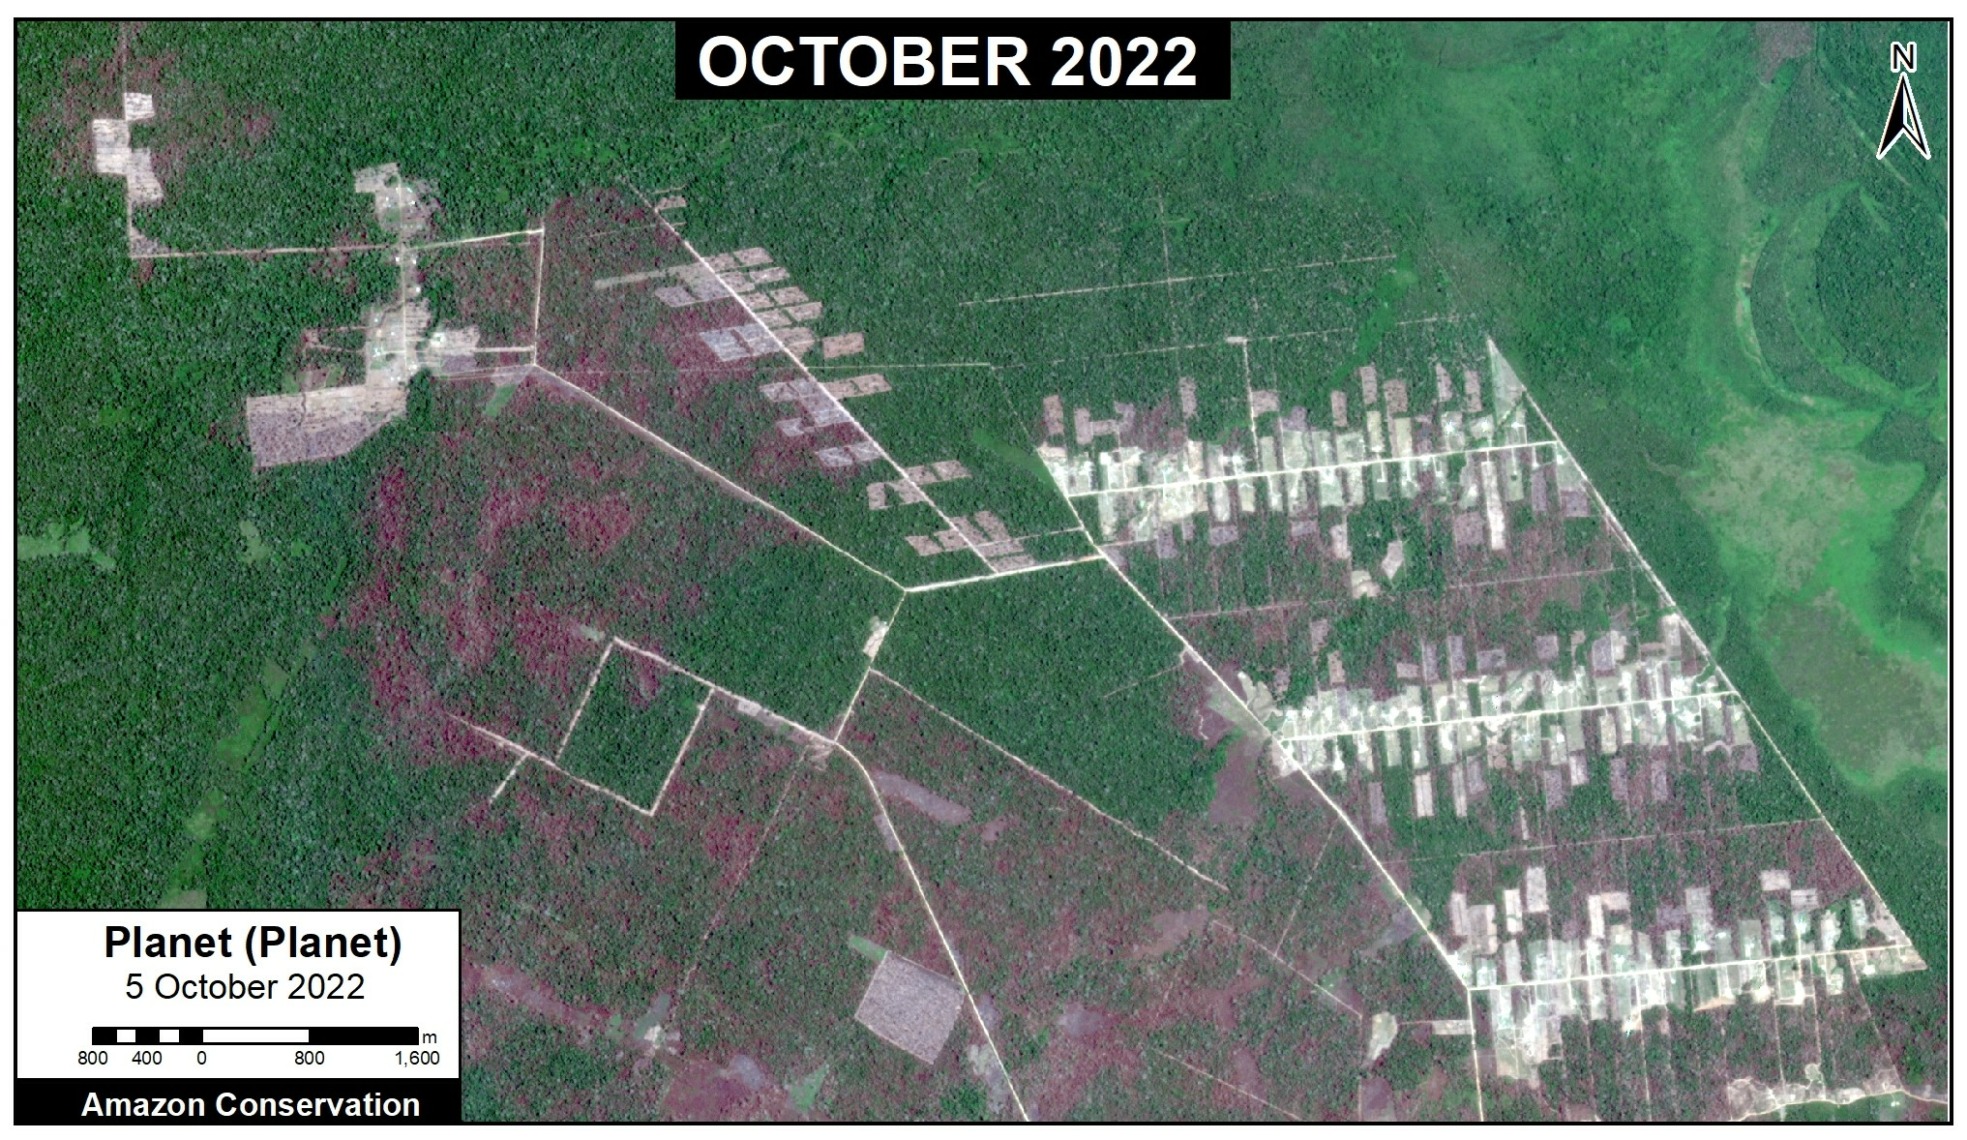
This colony is located on both sides of the border between the departments of Ucayali and Loreto, and has received its name since it originated in the district of Padre Marquez (Loreto). It is the newest colony, created in 2021 with the deforestation of 466 hectares (1,150 acres). This colony had a large expansion in 2022 (perhaps forming a new colony?), with additional deforestation of 491 hectares (1,213 acres). In total, we documented the deforestation of 976 hectares (2,412 acres) in the Padre Marquez colony, between the two years 2021 and 2022 (see yellow and red, respectively, in the image below). It should be emphasized that we estimate the additional degradation of 1,600 hectares (3,954 acrres) by fires that have escaped from the Mennonite plantations into the surrounding forests.

Deforestation in the Padre Marquez Mennonite colony. Data: ACA/MAAP, Planet.
Recent image of deforestation in the Padre Marquez Mennonite colony. Data: Planet.

Vanderland & Osterreich Colonies

These two colonies are located near the town of Tierra Blanca, in the Loreto region. Deforestation was highest between the years 2017 and 2020, with the loss of 2,300 hectares (5,683 acres) (see yellow in the image, below). In 2022, we have detected the new deforestation of 71 hectares (175 acres) (see red).

Deforestation in the Vanderland & Osterreich Mennonite colonies. Data: ACA/MAAP, Planet.
Recent image of deforestation in the Vanderland & Osterreich Mennonite colonies. Data: Planet.

Belize Colony

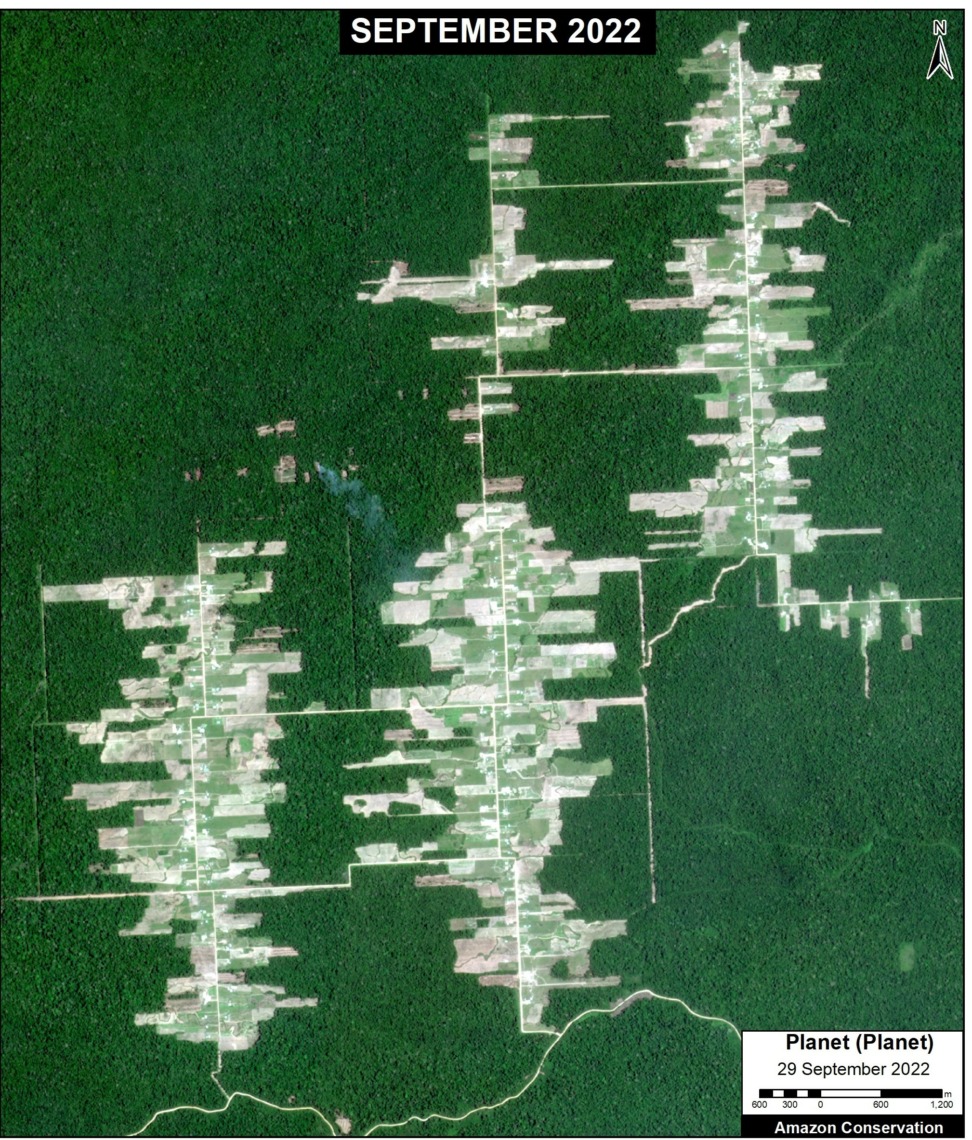
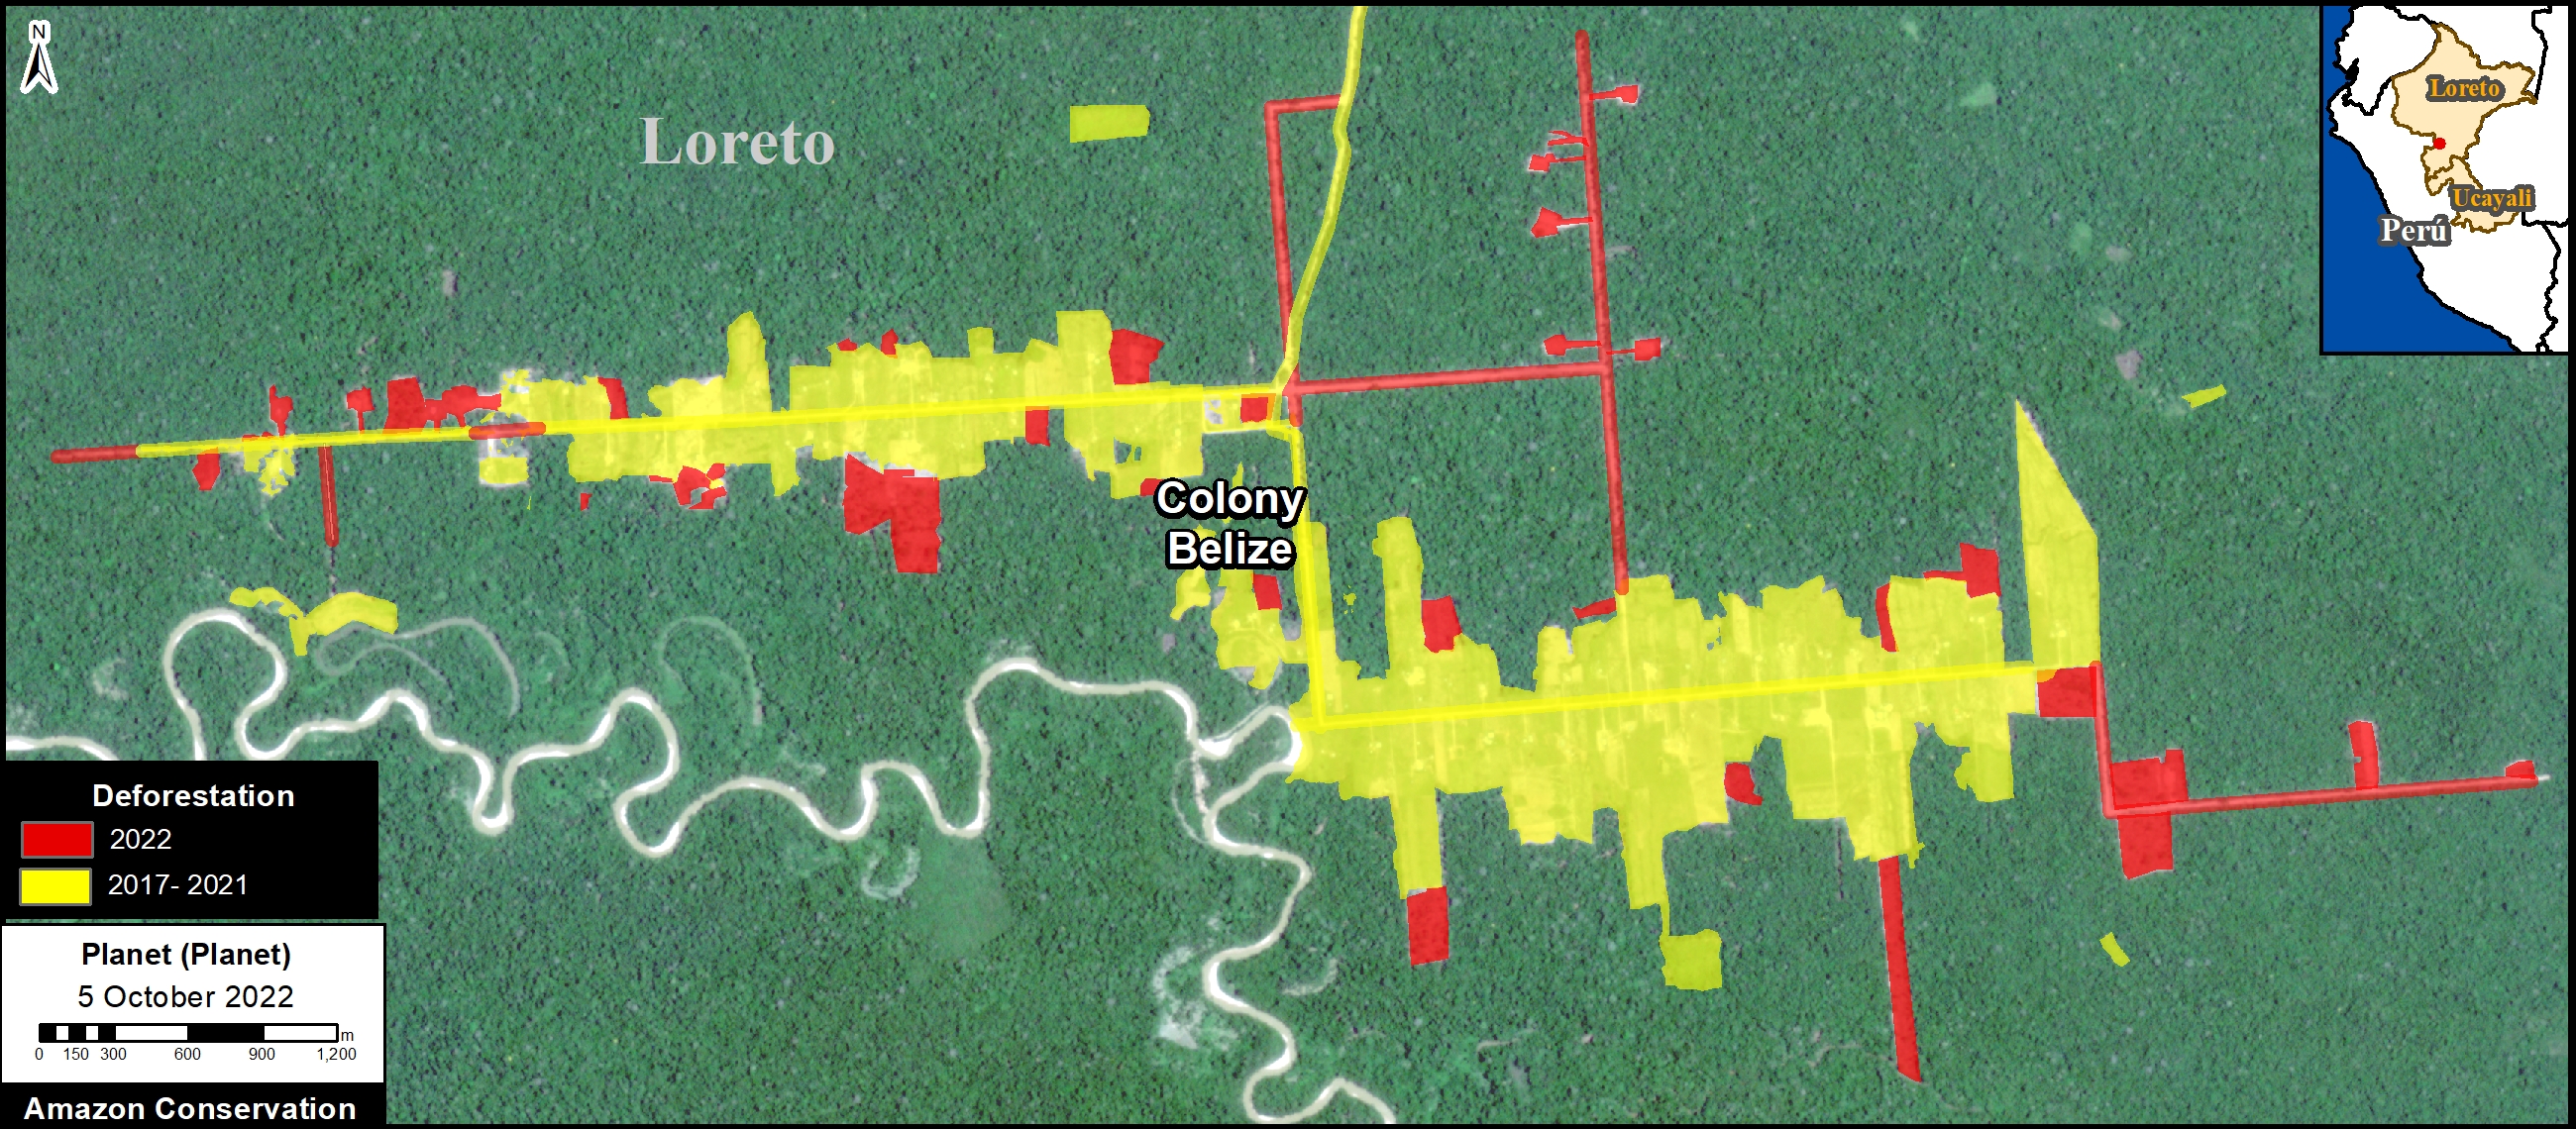
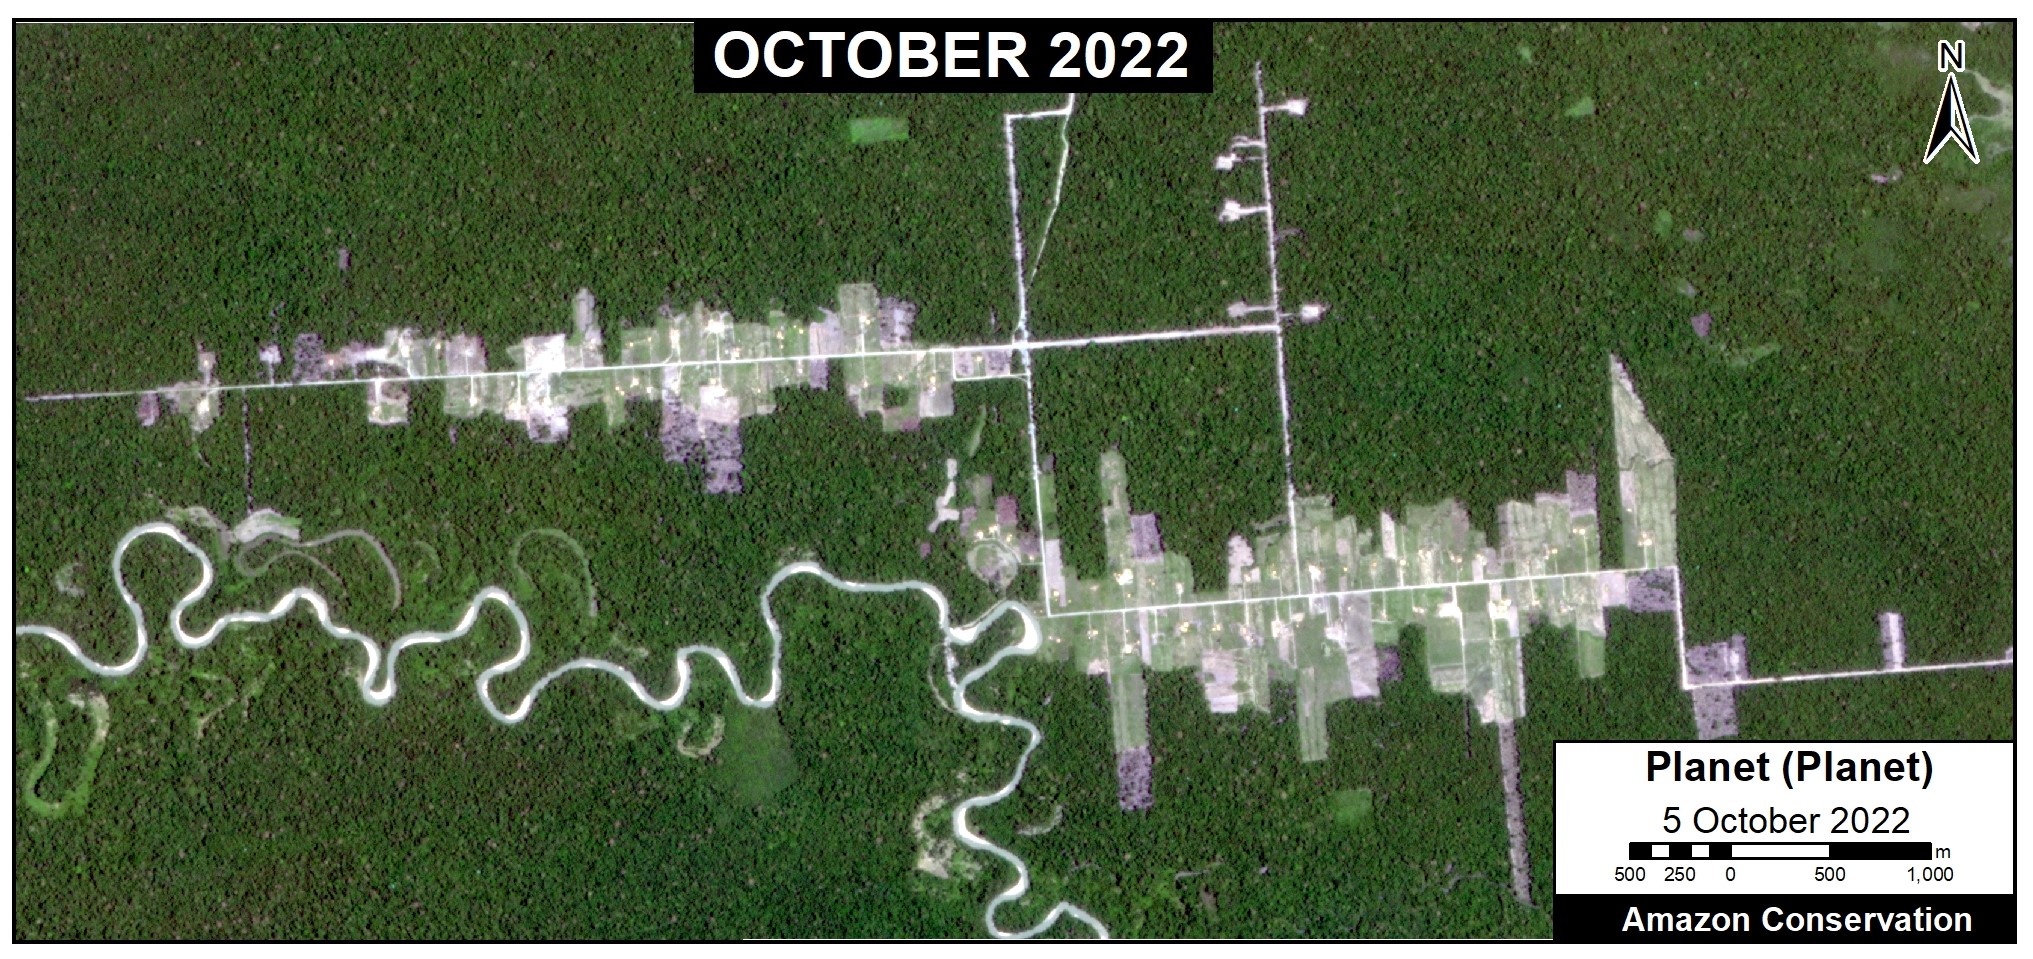
This colony is also located near the town of Tierra Blanca (Loreto region) and also registered the highest deforestation between 2017 and 2020, with the loss of 438 hectares (1,082 acres). In 2022, we have detected a new deforestation of 74 hectares (182 acres). Note that this most recent 2022 deforestation is expanding deeper into the surrounding forest.

Deforestation in the Belize Mennonite colony. Data: ACA/MAAP, Planet.
Recent image of deforestation in the Belize Mennonite colony. Data: Planet.

Masisea Colony

Esta colonia se ubica en la región Ucayali, y es la única que se ubica al sur de la ciudad de Pucallpa. La deforestación fue más alta entre los años 2017 y 2019, con la pérdida de 944 hectáreas. Al este, hubo una expansión en el 2021 de 47 hectáreas adicionales. No hemos detectado expansión notable en el 2022.

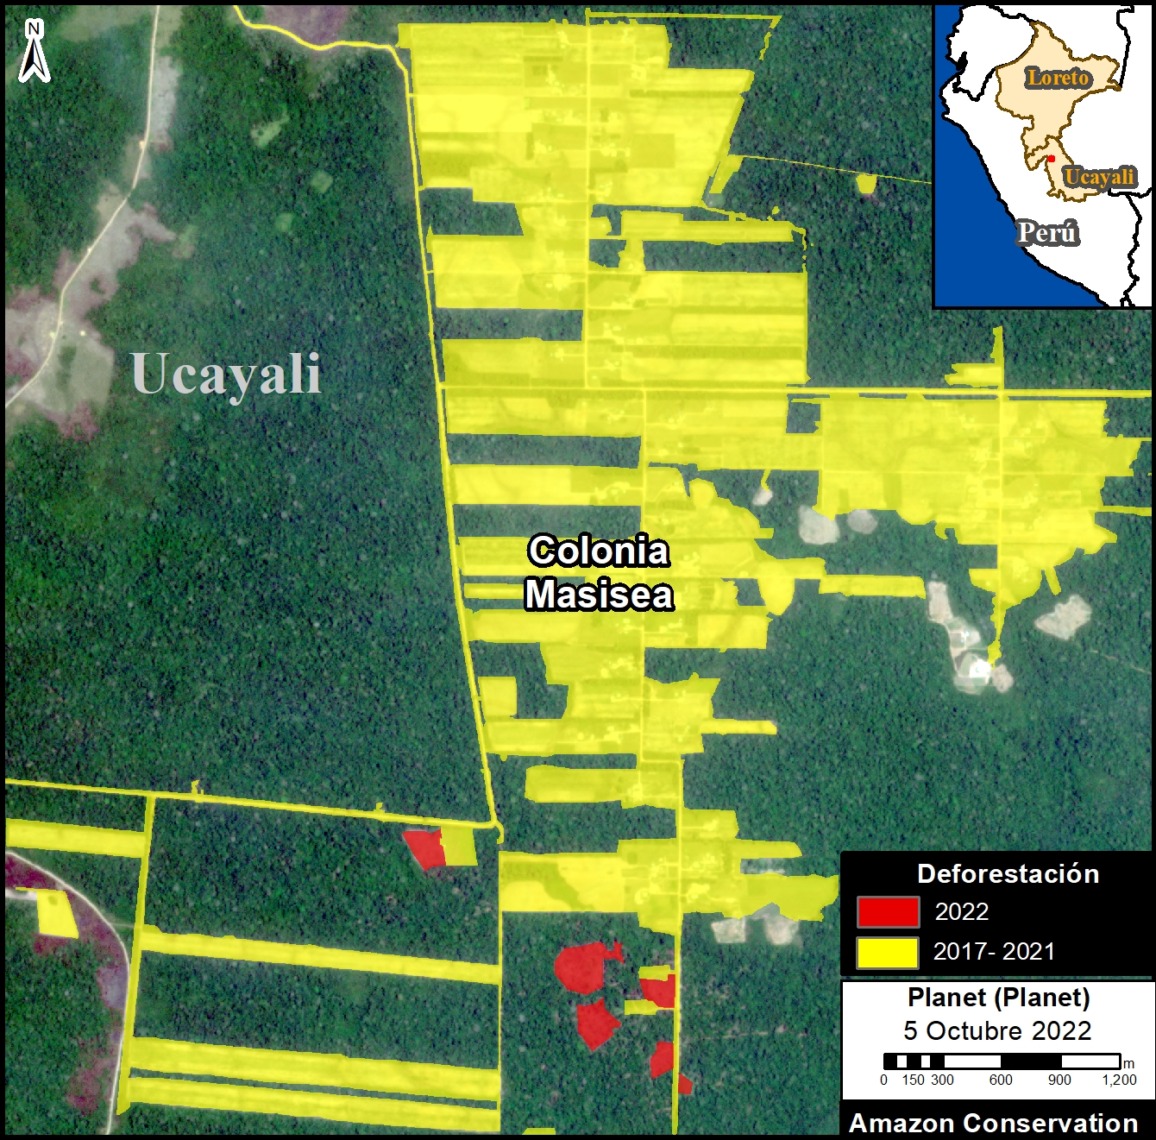
This colony is located in the Ucayali region, and is the only one located south of the city of Pucallpa. Deforestation was highest between 2017 and 2019, with the loss of 944 hectares (2,332 acres). To the east, there was an expansion in 2021 of an additional 47 hectares (117 acres). We have not detected notable expansion in 2022.

Deforestation in the Masisea Mennonite colony. Data: ACA/MAAP, Planet.
Recent image of deforestation in the Masisea Mennonite colony. Data: Planet.

Citation

Finer M, Ariñez A (2022) Mennonites have deforested 4,800 hectares (11,900 acres) in the Peruvian Amazon. MAAP: 166.
MAAP #164: Amazon Tipping Point – Where Are We?

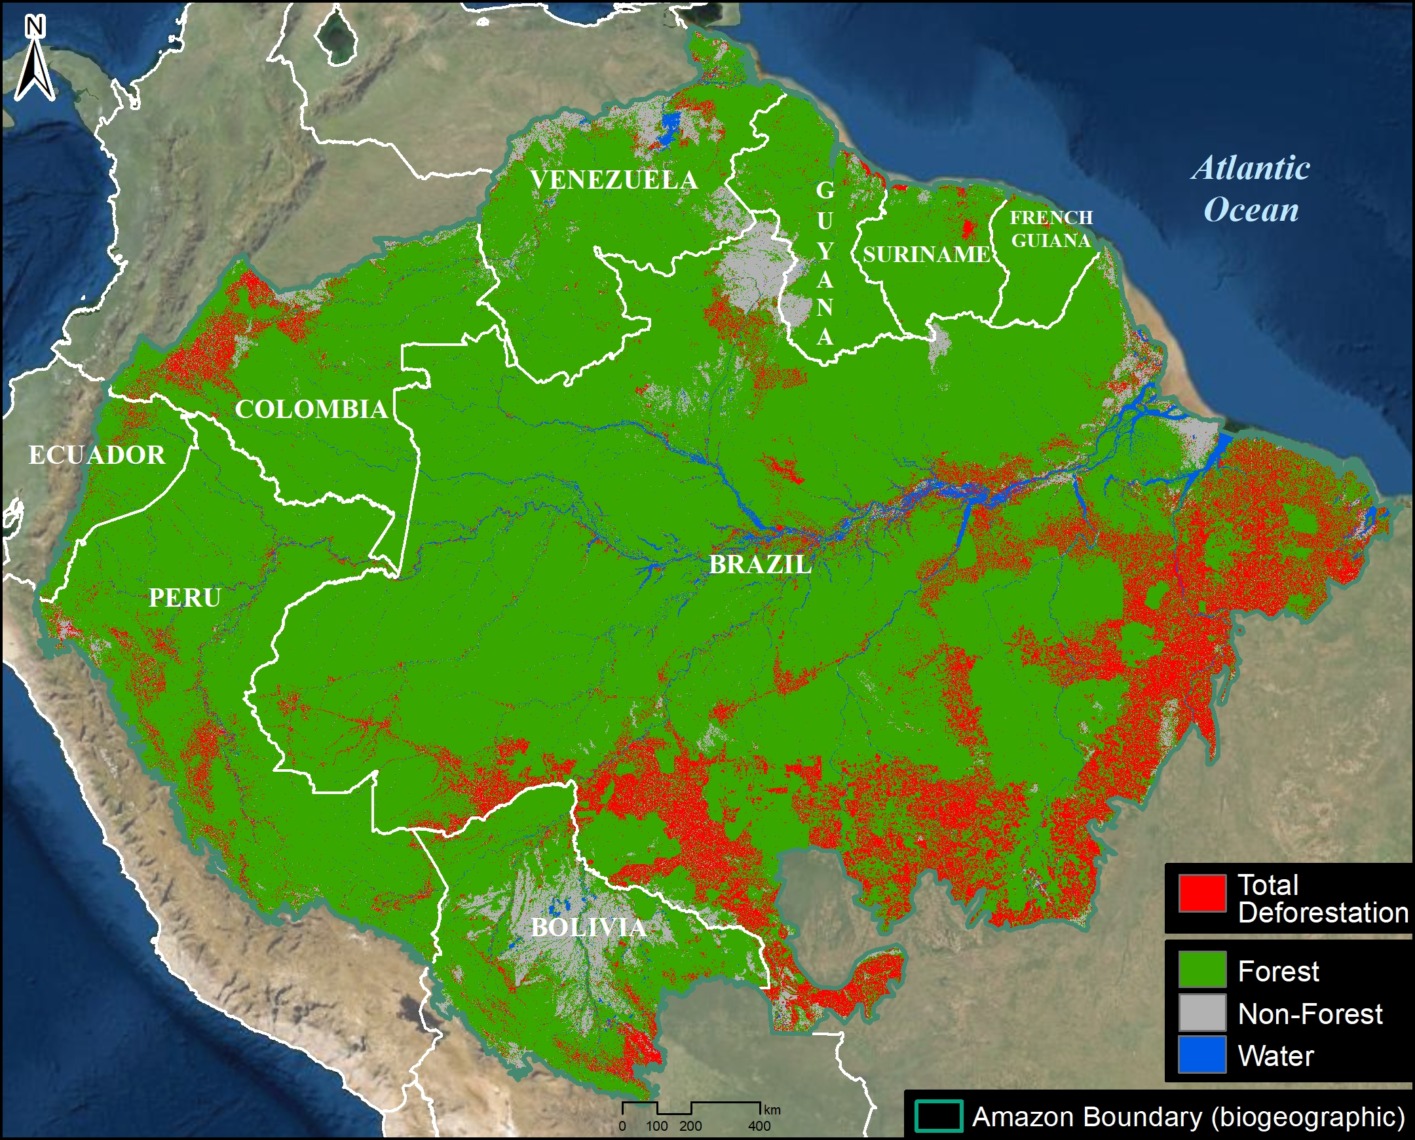
Base Map. Total Amazon forest loss. Data: ACA/MAAP.
It is increasingly reported that the largest rainforest in the world, the Amazon, is rapidly approaching a tipping point.

As repeatedly highlighted by the late Tom Lovejoy (see Acknowledgements), this tipping point is where parts of the rainforest will convert into drier ecosystems due to disrupted precipitation patterns and more intense dry seasons, both exacerbated by deforestation.

The Amazon generates much of its own rainfall by recycling water as air passes from its major source in the Atlantic Ocean. Thus, high deforestation in the eastern Amazon may lead to downwind impacts in the central and western Amazon (see Background section below).

The scientific literature indicates this tipping point could be triggered at 25% Amazon forest loss, in conjunction with climate change impacts.

The literature, however, is less clear on the critical first part of the tipping point equation: how much of the Amazon has already been lost?

There are numerous estimates, including 14% forest loss cited in the recent Science Panel for the Amazon report, but we did not find any actual definitive studies specifically addressing this question.

Here, we directly tackle this key question of how much of the original Amazon has been lost to date.

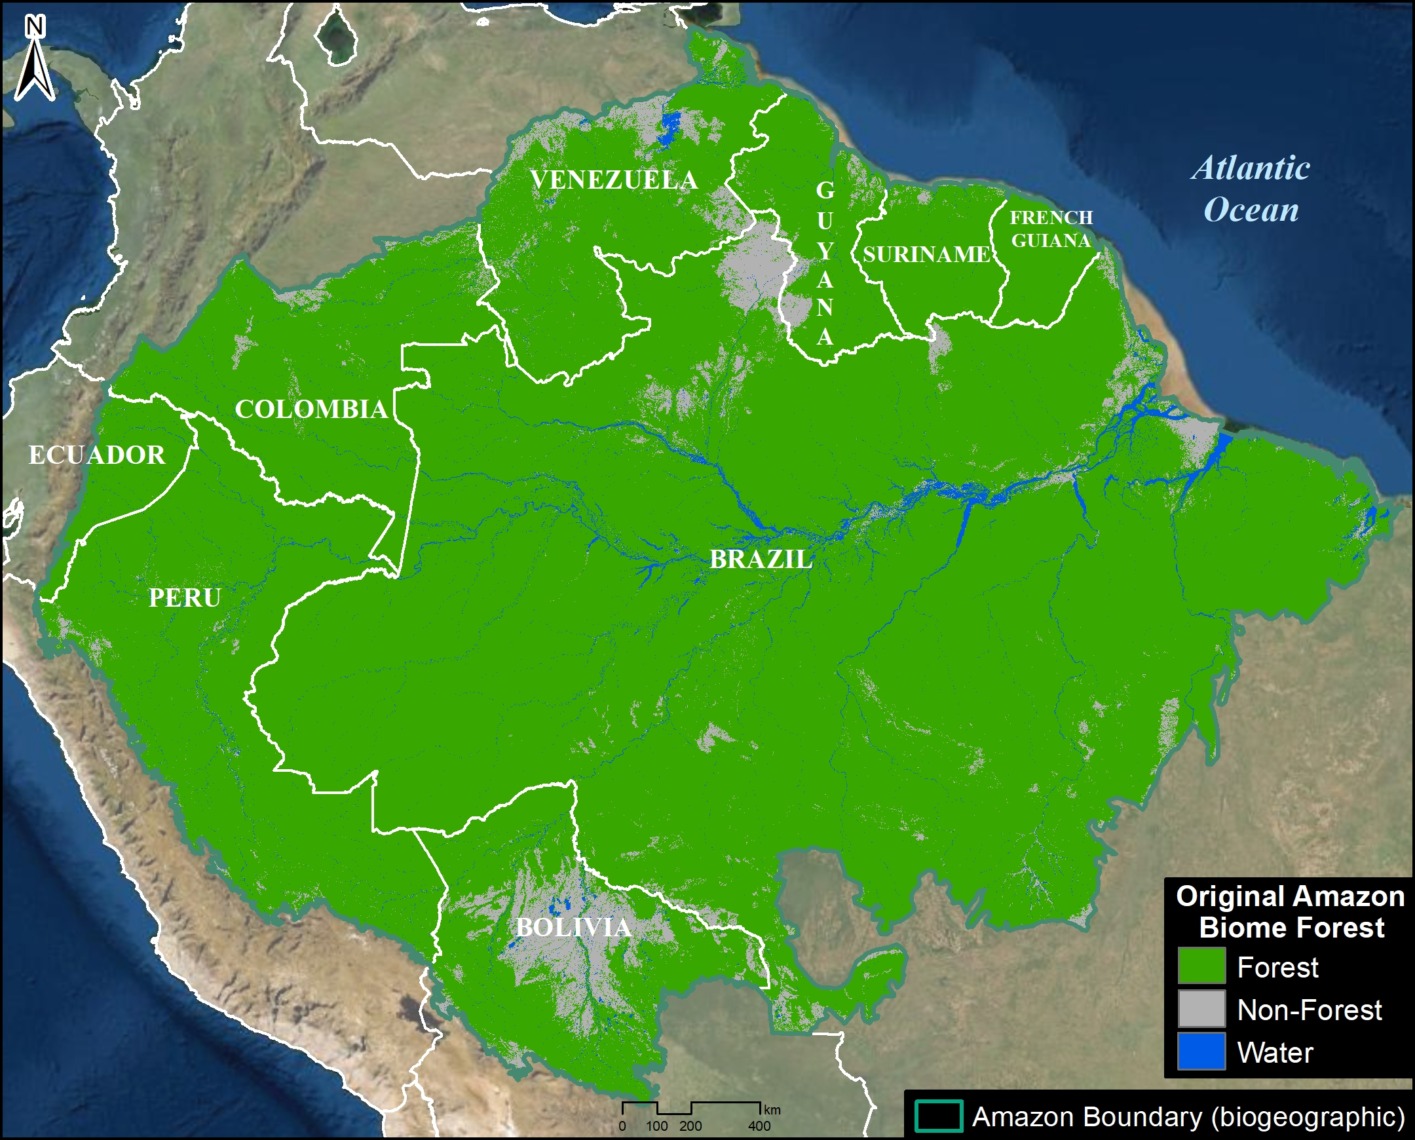
First, we present the first known rigorous estimate of original Amazon biome forest prior to European colonization: over 647 million hectares (1.6 billion acres; see Image 1 below).

Second, we estimate the accumulated total Amazon forest loss, from the original estimate to the present: over 85 million hectares (211 million acres; see Base Map).

Combining these two results, we estimate that 13% of the original Amazon biome forest has been lost.

More importantly, however, focusing on just the eastern third of the Amazon biome (see Image 2 below), we estimate that 31% of the original forest has been lost, above the speculated tipping point threshold. This finding is critical because the tipping point will likely be triggered in the eastern Amazon, as it is closest to the oceanic source of the water that then flows to the central and western Amazon.

Original Amazon Forest

Image 1 shows the first known estimate of original Amazon forest prior to European colonization. Note that we use a broader biogeographical definition of the Amazon that covers nine countries (Amazon biome) rather than the strict Amazon watershed (see Methodology).

Image 1. Original Amazon biome forest. Data: ACA/MAAP.

This represents the most rigorous effort to date to recreate the original Amazon. For example, we attempted to recreate original forest lost to historic dam reservoirs.

The map has just three classes: Original Amazon forest, Original non-forest (such as natural savannah), and Water.

We found that the original Amazon forest covered over 647 million hectares (647,607,020 ha). This is equivalent to 1.6 billion acres.

Of this total, 61.4% occurred in Brazil, followed by Peru (12%), Colombia (7%), Venezuela (6%), and Bolivia (5%). The remaining four countries (Ecuador, Guyana, Suriname, and French Guiana) make up the final 8%.

Amazon Forest Loss

Image 2 shows the accumulated total Amazon forest loss, from the original estimate to the present (2022).

Image 2. Total Amazon forest loss. Vertical lines indicate the Amazon broken down into thirds. Data: ACA/MAAP.

Of the original forest noted above, we documented the historic loss of over 85 million hectares (85,499,157 ha). This is equivalent to 211 million acres.

The largest loss occurred in Brazil (69.5 million ha), followed by Peru (4.7 million ha), Colombia (4 million ha), Bolivia (3.8 million ha), and Venezuela (1.4 million ha). The remaining four countries (Ecuador, Guyana, Suriname, and French Guiana) make up the final 1.9 million ha.

By comparing the original Amazon biome, we calculated the historic loss of 13.2% of the original Amazon forest due to deforestation and other causes.

More importantly, however, we find that 30.8% of the original Amazon has been lost in the eastern third of the Amazon biome (see vertical dashed lines Image 2), above the speculated tipping point threshold. This finding is critical because as noted above, the tipping point will likely be triggered in the east as it is the source of the water flowing to the central and western Amazon.

In contrast, we find that 10.8% of the original Amazon has been lost in the central third of the Amazon biome and 6.3% has been lost in the western third, both of which are below the speculated tipping point threshold.

Background

The Amazon generates around half of its own rainfall by recycling moisture up to 6 times as air masses move from the Atlantic Ocean in the east across the basin to the west. Thus, the rainforest plays a major part in keeping itself alive, by recycling water through its trees to generate rainfall from east to west.

This unique hydrological cycle has historically supported rainforest ecosystems for vast areas far from the main ocean source.

But it also raises the question of how much deforestation would be required to cause the cycle to degrade to the point of being unable to support these forests, thus the Amazon tipping point hypothesis.

In this scenario, rainforests would transform into drier ecosystems, such as open canopy scrubland and savannah.

The tipping point concept originally referred to an abrupt ecosystem change, but it is now believed that the shift could happen gradually (30-50 years).

It is worth noting that the western Amazon near the Andes mountains would likely maintain its rainforests, as air currents flowing over the mountains would continue causing water vapor to condense and fall as rain.

Methodology

At the core of this work, we generated two major estimates: original Amazon forest and total historical Amazon forest loss.

For both of these estimates, we used the biogeographical boundary of the Amazon (as determined by RAISG 2020), which encompasses nine countries. Thus, we used a broader definition of the Amazon (Amazon biome) rather than the strict Amazon watershed, which omits part of the northeastern Amazon biome.

For original Amazon forest, we defined three major classes: Forest, Non-Forest, and Water. This analysis was based on data from MapBiomas Brazil (collection 2 from 1990) with some additional modifications. Original Forest was made up of these MapBiomas categories: Forest Formation, Mangrove, Flooded Forest, Mosaic of Agriculture and Pasture. Non-Forest was made up of these MapBiomas categories: Savanna Formation, Natural Non-Forest Flood Formation, Grassland, and Other non-Forest Formations. Water was made up of these MapBiomas categories: River, Lake, Ocean and Glacier.

We then made a number of modifications with manual edits based on data from the University of Maryland, INPE (Terrabrasilis), ArcGis satellite images, Planet mosaics, Google Earth Engine Landsat images from 1984-1990, and official government data for several countries (Ministry of the Environment of Ecuador (MAE) and Peru (GeoBosques/MINAM), Forest and Carbon Monitoring System/IDEAM of Colombia, National Institute for Space Research of Brazil (INPE/Terrabrasilis), General Directorate of Forest Management and Development of Bolivia (DGGDF), and the National Service of Protected Areas of Bolivia (SERNAP). As an example of a major modification, deforested areas and historic dam reservoirs were changed to Original Forest based on an analysis of the oldest available satellite image for the area (1984-1990). We also corrected some misclassifications, such as forest patches in clearly non-forest areas were changed to Non-Forest (and vice versa) and mountain forest areas found as water were changed to Forest. Also, agriculture and urban areas in likely savannah areas were changed to Non-Forest. Additional Water data from MapBiomas based on 1985 was incorporated. Overall, our focus was defining Original Forest as best as possible; data confusions between Non-Forest and Water categories were not worked on as thoroughly.

For total historical Amazon forest loss, we used data from the University of Maryland. Specifically, we first used their data layer ‘Tree Cover 2000″ (>30% canopy density) to estimate historical (pre-2000) forest loss. We then added annual forest loss data from 2001 to 2021.

Finally, we divided the original Amazon forest by the total historical loss to estimate how much of the original Amazon has been lost. In addition, we delimited the Amazon in thirds according to distance east to west at the widest point. We then estimated how much of the original Amazon has been lost in each of these three sections.

References

(in chronological order)

Sampaio, G., Nobre, C., Costa, M. H., Satyamurty, P., Soares‐Filho, B. S., & Cardoso, M. (2007). Regional climate change over eastern Amazonia caused by pasture and soybean cropland expansion. Geophysical Research Letters, 34(17).

Hansen, M. C. et. al. (2013) High-Resolution Global Maps of 21st-Century Forest Cover Change. Science 342.

Nobre et al. (2016) Land-use and climate change risks in the Amazon and the need of a novel sustainable development paradigm. PNAS, 113 (39).

Turubanova S., Potapov P., Tyukavina, A., and Hansen M. (2018) Ongoing primary forest loss in Brazil, Democratic Republic of the Congo, and Indonesia. Environmental Research Letters.

Lovejoy, T. E., & Nobre, C. (2018). Amazon Tipping Point. Science Advances, 4(2).

Lovejoy, T. E., & Nobre, C. (2019). Amazon tipping point: Last chance for action. Science Advances, 5 (12).

Bullock et. al. (2019) Satellite-based estimates reveal widespread forest degradation in the Amazon. Glob Change Biol., 26.

Amigo, I. (2020) The Amazon’s fragile future. Nature, 578.

MapBiomas. 2020. MapBiomas Amazonia v2.0. https://amazonia.mapbiomas.org/.

Killeen (2021) A Perfect Storm in the Amazon Wilderness

Berenguer E. et. al. (2021) Ch 19. Drivers and ecological impacts of deforestation and forest degradation. In: Nobre C, Encalada et al. (Eds). Amazon Assessment Report 2021. United Nations Sustainable Development Solutions Network, New York, USA. Available from https://www.theamazonwewant.org/spa-reports

Hirota M et. al (2021) Science Panel for the Amazon, Ch 24. Resilience of the Amazon Forest to Global Changes: Assessing the Risk of Tipping Points. In: Nobre C, Encalada et al. (Eds). Amazon Assessment Report 2021. United Nations Sustainable Development Solutions Network, New York, USA. Available from https://www.theamazonwewant.org/spa-reports/

Wunderling et al (2022) Recurrent droughts increase risk of cascading tipping events by outpacing adaptive capacities in the Amazon rainforest. PNAS 119 (32) e2120777119.

Acknowledgements

This report is in memory of Tom Lovejoy, who helped launch the critical concept of an Amazon tipping point. Starting in 2019, we collaborated with Tom on the need assessment and background research behind this report.

We thank Carmen Thorndike for helping with the initial literature review, and Carlos Nobre for review of the final report. We also thank J. Beavers (ACA), A. Folhadella (ACA), M.E. Gutierrez (ACCA), and C. Josse (EcoCiencia) for additional comments.

This work was supported by NORAD (Norwegian Agency for Development Cooperation) and ICFC (International Conservation Fund of Canada).

Citation

Finer M, Mamani N (2022) Amazon Tipping Point – Where Are We?. MAAP: 164.